federal tax compliance research - internal revenue service
TRANSCRIPT

Federal TaxComplianceResearchIndividual Income Tax Gap Estimates for 1985, 1988, and 1992
Internal Revenue ServicePublication 1415 (Rev. 4-96)Catalog Number 10263H
Department of the Treasury


Departmentof theTreasuryInternalRevenueService
Federal TaxComplianceResearchIndividual Income Tax Gap Estimatesfor 1985, 1988, and 1992
April 1996
Wayne ThomasNational Director,Compliance Research
Elinor ConveryChief, Applied ResearchBranch
Dennis CoxChief, Economic Analysisand Modeling Group
Chih-Chin HoProject Economist
This report contains the Internal Revenue Service’s newestimates of the gross and net individual income tax gap.Earlier estimates were revised to reflect tax law changesand recent compliance data.
Suggested CitationInternal Revenue ServiceFederal Tax Compliance Research:Individual Income Tax Gap Estimatesfor 1985, 1988, and 1992Publication 1415 (Rev. 4-96)Washington, DC: 1996


Individual Income Tax Gap Estimates for 1985, 1988, and 1992
i
Table of Contents
List of Tables iii
Executive Summary v
I. Noncompliance Concepts 1
A. Tax Gap Measures 1
B. Tax Gap Components 2
C. Related Noncompliance Measures 2
II. The Estimates 4
A. Gross Tax Gap 5
B. Underreporting 7
C. IRS Enforcement Revenue 10
D. Net Tax Gap 11
E. Tax Gap Trends 12
III. Comparison with Prior IRS Estimates 17
IV. Sources and Methods 20
A. Gross Tax Gap 20
B. Net Tax Gap 23
Appendix A: Nonfiling Gap Estimation and Projection 25
Appendix B: Underreporting Gap Estimation and Projection 41
Appendix C: Underpayment Gap Estimation and Projection 57
References 61


Individual Income Tax Gap Estimates for 1985, 1988, and 1992
iii
List of Tables
1 Range of Gross Tax Gap Estimates, Individual Income Tax,Tax Years 1985, 1988, and 1992
5
2 Range of Noncompliance Estimates as Percentages of “True”Tax Liability, Individual Income Tax, Tax Years 1985, 1988, and 1992
6
3 Range of Estimates of the Underreporting Gross Tax Gap by Specific Items(Net Misreported Amounts and Net Misreporting Percentages),Tax Year 1992
8
4 Enforcement Revenue Estimates, Individual Income Tax,Tax Years 1985, 1988, and 1992
11
5 Estimates of Gross Tax Gap, Enforcement Revenue, and Net Tax Gap,Individual Income Tax, Tax Years 1985, 1988, and 1992
12
6 Higher Gross Tax Gap Estimates And Percentages of “True” Tax Liability,Individual Income Tax, Tax Years 1985, 1988, and 1992
13
7 Net Misreporting Percentage (NMP) and Higher Gross Tax Gap Estimatesby Underreporting Gap Component, Tax Years 1985 and 1988
15
8 Current and 1988/90 IRS Higher Estimates of the Gross Individual IncomeTax Gap and Percentages of “True” Tax Liability, Tax Year 1987
18


Individual Income Tax Gap Estimates for 1985, 1988, and 1992
v
EXECUTIVE SUMMARY
This report presents current Internal Revenue Service estimates of the individual incometax gap. Both gross and net tax gap estimates are presented. The gross tax gap is the amount of"true" tax liability for a particular tax year that is not paid voluntarily and timely. The net taxgap is the gross tax gap minus the amount of tax remitted late or collected by IRS through itsenforcement activities. The estimates relate only to payment of tax on income earned in legalactivities. For example, the income tax due but not paid on income from distribution of narcoticsis not included.
Both gross and net tax gaps consist of three main components: nonfiling, underreporting,and underpayment. The nonfiling gap is the amount of tax liability owed by taxpayers who donot voluntarily and timely file returns. The underreporting gap is the amount of tax liability notvoluntarily reported by taxpayers who do file returns. The underpayment gap is the amount oftax liability that individuals report on their tax returns, but do not pay voluntarily and timely.
Our estimates of the gross individual income tax gap for tax year (TY) 1992 range from$93.2 to $95.3 billion. Of this amount, the nonfiling gap accounts for an estimated $13.5 to$13.8 billion. The underreporting gap is estimated to account for another $71.3 to $73.1 billion,while our estimate of the underpayment gap is $8.4 billion. We estimate total "true" individualincome tax liability to be $550.2 to $552.3 billion for TY 1992. Therefore, our estimates of theoverall individual noncompliance rate (the gross tax gap as a percentage of the "true" tax liability)for TY 1992 range from 16.9 to 17.3 percent.
The net tax gap is the gross tax gap less amounts remitted late or collected as the result ofenforcement. We estimate that IRS enforcement actions will eventually bring in $14.9 billion ofTY 1992 revenue. Of this amount, an estimated $3.2 billion relates to the nonfiling gap, $6.9billion to the underreporting gap, and $4.8 billion to the underpayment gap. Hence our estimatesof the net tax gap for TY 1992 range from $78.3 to $80.4 billion. Of this amount, the netnonfiling gap accounts for an estimated $10.3 to $10.6 billion. The net underreporting gap isestimated to account for another $64.4 to $66.2 billion, while our estimate of the netunderpayment gap is $3.6 billion.
Previously published IRS individual income tax gap estimates were based primarily oncompliance data for TY 1982 and earlier years. The estimates presented in this report are derivedfrom more recent compliance data, particularly Taxpayer Compliance Measurement Program(TCMP) examinations of individual income returns filed for TY 1985 and TY 1988, and theTCMP survey of nonfilers for TY 1988. The current estimates also reflect changes in tax lawincluding changes from the Tax Reform Act of 1986 and the Omnibus Budget Reconciliation Actof 1990.


Individual Income Tax Gap Estimates for 1985, 1988, and 1992 page 1
I. NONCOMPLIANCE CONCEPTS
A. Tax Gap Measures
Both the gross and net tax gaps are defined with respect to particular tax years. Gross andnet tax gap estimates involve tax liabilities due and tax payments made for a given tax year,regardless of the tax year in which the payments are actually made.1 "Timely" means within thetime required by law.
1. Gross Tax Gap
The gross tax gap is defined as the amount of tax liability for a given tax year that is not paidvoluntarily and timely. The words "voluntarily and timely" mean that payment is made prior toany IRS enforcement efforts and on or before the date on which payment was legally due.
2. Net Tax Gap
The net tax gap is defined as the gross tax gap minus the amount of tax collected for the taxyear in question through enforcement.2 It is the amount of "true" tax liability for a given tax yearthat is not eventually paid.
IRS enforcement activities include programs such as examination of tax returns, collection ofoverdue taxes, information document matching, correction of math errors, return delinquencyinvestigations, and criminal investigation of fraudulent tax returns.
1 Typically, voluntary payments of year n tax liabilities are made in year n (through withholding and estimated taxpayments) or in year n+1 (estimated tax payments, payments with timely-filed returns for year n, and paymentsmade with requests for extension of time to file). However, payments of year n liabilities made as a result of IRSenforcement efforts could take place many years after year n.
2 Enforcement includes “self enforcement” by taxpayers. For example, taxpayers sometimes fail to pay their taxestimely but remit some or all of the delinquent amounts before IRS issues collection notices.

page 2 Individual Income Tax Gap Estimates for 1985, 1988, and 1992
B. Tax Gap Components
Both the gross and net tax gaps can be divided into three main components: the nonfilinggap, the underreporting gap, and the underpayment gap.
1. Nonfiling Gap
The nonfiling gap is defined as the amount of tax liability owed by taxpayers who do notvoluntarily and timely file required returns. It is net of amounts prepaid through withholding,estimated payments, and other credits. The nonfiler population does not include legitimatenonfilers (those who are not required to file).
2. Underreporting Gap
The underreporting gap is defined as the amount of tax liability not voluntarily reportedby taxpayers who do file returns. It is net of amounts overreported (by, for example, failing toitemize deductions when those deductions would exceed the standard deduction). Theunderreporting gap consists of three components: underreported income, overstated offsets, andnet math errors. Underreported income involves such taxable income items as wages andsalaries, rents and royalties, and net business income. Overstated offsets include offsets to taxliability such as itemized deductions and tax credits. Net math errors involve arithmeticmistakes or transcription errors made by taxpayers.
3. Underpayment Gap
The underpayment gap is the amount of tax liability that taxpayers report, but do notpay voluntarily and timely. That is, the underpayment gap is the total of insufficientremittances from taxpayers who do not pay in full when they report their tax liabilities on theirreturns. (In our 1983 and 1990 tax gap reports, the underpayment gap was referred to as the"remittance gap." It included, in addition to the insufficient remittances of individuals, estimatedamounts of income tax withheld by employers from employees' wages but not paid to theGovernment. Payment of these amounts is the responsibility of the employers, not of theemployees; therefore, we do not include them in this report as part of the individual income taxgap.)
C. Related Noncompliance Measures
This report substitutes new noncompliance measures for the voluntary compliancemeasures used in previous IRS tax gap publications. Since the tax gap is a measure ofnoncompliance, these new measures are consistent with the tax gap concept in that they too arenoncompliance measures.3 3 Another advantage of replacing voluntary compliance measures with noncompliance measures is that differences intax gap estimates and in corresponding noncompliance estimates are positively, rather than inversely, related.

Individual Income Tax Gap Estimates for 1985, 1988, and 1992 page 3
The noncompliance rate (NCR) is defined as the ratio of the gross tax gap to the total"true" tax liability, expressed in percentage terms. The NCR is an overall measure of relativenoncompliance. As one of the new measures in this report, NCR replaces the voluntarycompliance rate (VCR), which was the amount of tax voluntarily paid, expressed as a percentageof the "true" tax liability. The NCR is, therefore, the noncompliance counterpart of the VCR,and it is equivalent to 100 percent minus the VCR.
The net misreporting percentage (NMP) is a measure of reporting noncompliance for aparticular return line item. It is another of the new measures in this report, replacing thevoluntary reporting percentage (VRP). The VRP was the amount reported for a given line item,expressed as a percentage of the amount that should have been reported. The NMP is, therefore,the noncompliance counterpart of the VRP; however, it is not always equivalent to 100 percentminus the VRP.
The NMP for a given tax return line item is defined as the ratio of the net misreportedamount (NMA) in the taxpayer's favor to the sum of the absolute values of what should havebeen reported, expressed in percentage terms. For an income item, the NMA is defined as thesum of all amounts underreported minus the sum of all amounts overreported on the item. For anoffset item (such as deductions or credits), the NMA is defined the sum of all amountsoverstated minus the sum of all amounts understated on the item.
The NMP is not always equivalent to 100 percent minus the VRP because thedenominators of the two measures are defined differently. To eliminate distortions where there isa combination of positive and negative amounts of income, the NMP denominator is the sum ofthe absolute values of the amounts that should have been reported. The VRP denominator,however, is the sum of the algebraic values of the amounts that should have been reported.Thus, the two denominators will be equal only for line items where the amounts that should havebeen reported are either all positive or all negative.
For all business income line items except estate and trust income, the NMP denominatordiffers from the VRP denominator in that the latter is net of losses. While the NMP and VRP forthese line items have complementary numerators, the differences in the denominators mean thatfor this category of income the NMP is not equivalent to 100 minus the VRP. On the other hand,for all non-business income line items (except capital gains, Form 4797 income, and otherincome), the NMP is equivalent to 100 minus the VRP. For these line items, the NMP and VRPhave complementary numerators and identical denominators.4
4 For more detailed discussion on the NMP measure, see Ho (1994).

page 4 Individual Income Tax Gap Estimates for 1985, 1988, and 1992
II. THE ESTIMATES
The gross and net tax gap estimates in this report are presented in the form of a range of"higher" and "lower" estimates. These ranges of estimates illustrate the degree of uncertaintyinherent in estimating the "true" tax liability. “True” tax liability is the sum of the gross tax gapand the amount of tax voluntarily and timely paid; therefore, our "higher" and "lower" tax gapestimates correspond to "higher" and "lower" estimates of "true" tax liability.
The tax gap estimates are based in part on IRS audits of tax returns. The differencebetween the higher and lower estimates arises from alternative uses of the results of the audits.Our "higher" estimates of tax liability are based on tax adjustments initially recommended byexaminers, while our "lower" estimates reflect tax deficiencies ultimately assessed after allappeals and litigation have been completed. The difference between these estimates representsrecommended adjustments that are conceded in the appeals process or lost in litigation.5 The"true" tax liability value is probably somewhere within this range of estimates.6
5 Examination recommendations are conceded or lost for a variety of reasons including the following: the facts orlegal interpretation relied on by the examiner are judged to be incorrect; the facts or legal interpretation relied on bythe Appeals Officer or court are incorrect; the recommendation is judged by the Appeals Officer to be subject to"hazards of litigation;" in examinations of the returns of two or more taxpayers who engaged in a transaction whichgave rise to a tax deficiency proposed against all of them, the Appeals Officer or a court determines which taxpayerowes the tax and concedes the issue against the others.
6 The "true" tax liability could be greater than our "higher" estimate if our estimation methodology does not fullyaccount for undetectable tax deficiencies. Conversely, the "true" tax liability could be less than our "lower" estimateif taxpayer appeals and litigation do not, on balance, fully offset any unjustified tax examiner recommendations inIRS's favor.

Individual Income Tax Gap Estimates for 1985, 1988, and 1992 page 5
A. Gross Tax Gap
Table 1 presents our estimates of the gross individual income tax gap by main gapcomponents for tax years 1985, 1988, and 1992. The estimated gross gap ranges from $68.9 to$70.4 billion for TY 1985, from $79.3 to $80.9 billion for TY 1988, and from $93.2 to $95.3billion for TY 1992.
Table 1Range of Gross Tax Gap Estimates
Individual Income TaxTax Years 1985, 1988, and 1992
($ billions)
Tax Gap Component TY 1985 TY 1988 TY 1992
Low High Low High Low High
Nonfiling Gap
Total 9.6 9.8 11.0 11.2 13.5 13.8
Underreporting Gap
Underreported Income 43.6 44.6 46.0 47.1 57.2 58.6
Overstated Offsets 8.8 9.1 10.9 11.3 14.0 14.4
Net Math Error -0.2 -0.2 0.2 0.2 0.1 0.1
Total 52.2 53.5 57.1 58.5 71.3 73.1
Underpayment Gap
Total 7.1 7.1 11.2 11.2 8.4 8.4
Gross Tax Gap 68.9 70.4 79.3 80.9 93.2 95.3
Voluntarily and Timely Paid 303.3 303.3 381.4 381.4 457.0 457.0
"True" Tax Liability 372.2 373.7 460.7 462.3 550.2 552.3
Table 2 puts the relative importance of the components of the tax gap in perspective bypresenting them as percentages of the estimated "true" tax liability for tax years 1985, 1988, and1992. The ranges of our estimates of the overall gross noncompliance rate (the gross tax gap as

page 6 Individual Income Tax Gap Estimates for 1985, 1988, and 1992
a percentage of the "true" tax liability) are 18.5 to 18.8 percent for TY 1985, 17.2 to 17.5 percentfor TY 1988, and 16.9 to 17.3 percent for TY 1992. The estimated improvement in overallcompliance from 1985 to 1988 is due primarily to estimated improvements in the underreportinggap portion of the total. The 1992 figures are projections based on 1988 compliance rates. Thesmall improvement from 1988 to 1992 is due to a change in the composition of income reportedbetween types with relatively low compliance rates and types with relatively high compliancerates.
TABLE 2Range of Noncompliance Estimates as Percentages of “True” Tax Liability
Individual Income TaxTax Years 1985, 1988, and 1992
(percent)
Tax Gap Component TY 1985 TY 1988 TY 1992
Low High Low High Low High
Nonfiling Gap
Total 2.6 2.6 2.4 2.4 2.5 2.5
Underreporting Gap
Underreported Income 11.7 11.9 10.0 10.2 10.4 10.6
Overstated Offsets and Credits 2.6 2.4 2.4 2.4 2.6 2.6
Net Math Errors -0.1 -0.1 <0.05 <0.05 <0.05 <0.05
Total 14.0 14.3 12.4 12.7 13.0 13.2
Underpayment Gap
Total 1.9 1.9 2.4 2.4 1.5 1.5
Gross Tax Gap 18.5 18.8 17.2 17.5 16.9 17.3
Voluntarily and Timely Paid 81.5 81.2 82.8 82.5 83.1 82.7
"True" Tax Liability 100.0 100.0 100.0 100.0 100.0 100.0
Note: detail may not add to total due to rounding.

Individual Income Tax Gap Estimates for 1985, 1988, and 1992 page 7
1. Nonfiling Gap
For TY 1992, estimates of the nonfiling gap range from $13.5 to $13.8 billion; theseestimates are about 2.5 percent of the estimated true tax liability.
2. Underreporting Gap
The underreporting gap is by far the largest of the three gross tax gap components. ForTY 1992, it accounts for an estimated $71.3 to $73.1 billion of the $93.2 to $95.3 billionestimated gross gap; these estimates are 13.0 percent and 13.2 percent of true tax liability,respectively. Underreported income accounts for about four-fifths of the underreporting gap,amounting to an estimated $57.2 to $58.6 billion for TY 1992. Overstated income offsets and taxcredits are about one-fifth of the gap, with TY 1992 estimated values ranging from $14.0 to $14.4billion. Finally, estimated net math errors account for only $0.1 billion of the TY 1992underreporting gap.7 For additional detail on the underreporting gap, see the next section entitled"Misreporting."
3. Underpayment Gap
We estimate that the underpayment gap for TY 1992 was $8.4—1.5 percent8 of true taxliability, and less than 10 percent of the total gross tax gap.
B. Underreporting
As described in the preceding section, the underreporting gap accounts for approximately75 percent of the estimated TY 1992 gross tax gap. The purpose of this section is to look moreclosely of the components of the underreporting gap. For the underreporting portion of the grosstax gap, Table 3 shows the TY 1992 estimates of the net misreported amounts (NMA) and thenet misreporting percentage (NMP) for specific income and offset items. (Similar tables for 1985and 1988 are in Appendix B.)
7 Net math errors are not subject to change in the appeals process or in litigation. As a result, the estimate isexpressed as a single number, rather than a range.
8 Because the underpayment gap involves only taxes that have been reported but not paid and does not involve theamount of "true" tax liability, our underpayment gap estimates are expressed as single numbers rather than as rangeestimates.

page 8 Individual Income Tax Gap Estimates for 1985, 1988, and 1992
TABLE 3Range of Estimates of the Underreporting Gross Tax Gap by Specific Items
(Net Misreported Amounts and Net Misreporting Percentages)Tax Year 1992
Tax Gap Component UnderreportingTax Gap
($ billions)
Net MisreportedAmount
($billions)
Net MisreportingPercentage(percent)
Low High Low High Low HighTOTAL UNDERREPORTINGGAP 71.3 73.1 323.7 331.9 n.a. n.a.
UNDERREPORTED INCOME 57.2 58.6 277.0 283.7 n.a. n.a. Non-Business Income 18.1 18.7 92.3 95.2 2.5 2.6 Wage Income 3.1 3.2 23.3 24.0 0.9 0.9 Interest Income 0.9 0.9 3.5 3.6 2.2 2.3 Dividends 1.3 1.3 5.9 6.1 7.6 7.8 State Tax Refunds <0.05 <0.05 0.1 0.1 0.8 0.8 Alimony Income 0.1 0.1 0.3 0.3 13.0 13.3 Pensions & Annuities 1.7 1.8 8.3 8.6 3.9 4.0 Unemployment Compensation 0.3 0.3 2.2 2.3 6.7 6.9 Social Security Benefits 0.2 0.2 1.0 1.0 4.1 4.2 Capital Gains 2.4 2.5 9.1 9.4 6.9 7.2 Form 4797 Income 0.7 0.7 3.8 3.9 27.1 28.0 Other Income 7.4 7.6 34.8 35.9 24.1 24.9 Business Income 39.1 39.9 184.7 188.5 29.4 30.0 Nonfarm Proprietor Income 16.4 16.9 72.2 74.4 31.3 32.3 Informal Supplier Income 12.3 12.3 59.6 59.6 81.4 81.4 Farm Income 3.3 3.4 17.4 17.9 31.3 32.2 Rents & Royalties 3.6 3.7 18.8 19.4 16.6 17.2 Partnership & SBC Income 3.5 3.6 16.7 17.2 7.2 7.5OFFSETS TO INCOME 8.0 8.2 40.7 42.0 4.3 4.4 Adjustments 0.2 0.2 0.7 0.7 1.9 2.0 Deductions 5.0 5.1 19.3 19.9 4.3 4.4 Exemptions 2.8 2.9 20.7 21.4 4.4 4.5TAX CREDITS 6.0 6.2 6.0 6.2 38.9 40.2NET MATH ERRORS 0.1 0.1 n.a. n.a. n.a. n.a.

Individual Income Tax Gap Estimates for 1985, 1988, and 1992 page 9
1. Underreported Income
Estimated overall underreported income for TY 1992 ranges from $277.0 to $283.7billion, generating an estimated gross tax gap of $57.2 to $58.6 billion. Underreported netbusiness income ranges from $184.7 to $188.5 billion for TY 1992, or two-thirds of the total,while estimates of underreported non-business income range from $92.3 to $95.2 billion.
Among various types of business income, misreporting of nonfarm sole proprietorincome comprises 40 percent of the total, with estimates ranging from $72.2 to $74.4 billion.Informal suppliers are estimated to account for another $59.6 billion of underreported netbusiness income, or about one-third of the total. Underreported informal supplier incomeaccounts for just over one-fourth of the total tax gap attributable to business income, but theNMP for informal supplier income is by far the highest of any business income category. Farmincome accounts for a much smaller portion of the tax gap than does nonfarm proprietor income,but its noncompliance rate, as measured by NMP, is virtually identical.
Misreported "other income," with estimates ranging from $34.8 to $35.9 billion, accountsfor more underreported income than any other type of non-business income. It is about one-third of the total, and its noncompliance rate (NMP) is among the highest for non-businessincome categories. The three types of non-business income with the next largest estimatedmisreported income amounts are wages and salaries ($23.3 to $24.0 billion), capital gains ($9.1 to$9.4 billion), and pensions and annuities ($8.3 to $8.6 billion). The three largest NMPs are forother income, Form 4797 income, and alimony income.
The types of income with the best reporting compliance (lowest NMPs) are state andlocal income tax refunds at 0.8 percent and wages and salaries at 0.9 percent.
2. Overstated Offsets and Credits
As shown in Table 3, our estimates of overstated income offsets account for $8.0 to $8.2billion of gross tax gap. Tax credits account for $6.0 to $6.2 billion, but the estimated netmisreporting percentage for tax credits (38.9 to 40.2 percent) is considerably higher than theestimated NMPs for offsets to income (ranging from about two percent for adjustments to about4.5 percent for deductions and exemptions).

page 10 Individual Income Tax Gap Estimates for 1985, 1988, and 1992
C. IRS Enforcement Revenue
The enforcement revenue estimates in this report relate to the particular tax years forwhich we have estimated the gross income tax gap. This is not completely straightforwardbecause enforcement activities for those tax years have not yet been completed. For example, forTY 1992, audits of some 1 million returns began as early as October of 1993 and as late asSeptember of 1994; the more complex of those audits may take more than one year to complete;some of the results will be appealed by the taxpayers, and the appeals and litigation processescan take several years in some cases. Therefore, we project the enforcement results to estimatethe total amount of tax deficiencies which eventually will be collected for each tax year. Theseestimates do not include the penalties and interest which will also eventually be collected. Ourestimating methods implicitly include amounts of tax remitted by the taxpayers after the due datefor payment but without direct IRS enforcement action.
1. Nonfiling Gap
There are two main sources of enforcement revenue related to the nonfiling gap:information document matching (information returns program, or “IRP”) and investigations oftaxpayers who stop filing returns. The former detects nonfilers with substantial amounts ofincome by matching third-party reports (“IRP documents” such as Forms 1099 and Forms W-2)of income paid against IRS masterfile records of tax returns filed. We estimate that these effortswill generate $1.4 billion of enforcement revenue for TY 1992. We estimate that using IRSmasterfile records to detect taxpayers who stop filing returns will generate $1.8 billion ofenforcement revenues for TY 1992. We estimate that total nonfiler-related enforcement revenueswill be $2.1 billion for TY 1985, $3.7 billion for TY 1988, and $3.2 billion for TY 1992.
2. Underreporting Gap
The largest source of enforcement revenue with respect to the underreporting gap is theexamination of returns filed by taxpayers. We estimate that for TY 1992 such examinations willgenerate $5.2 billion. The other important source of underreporting gap enforcement revenue isthe matching of income data on IRP documents against income data reported by taxpayers ontheir returns. Our estimate of IRP document matching enforcement revenue for TY 1992 is $1.7billion. Overall, our estimates of underreporting gap enforcement revenue are $5.9 billion for TY1985, $6.6 billion for TY 1988, and $6.9 billion for TY 1992.
3. Underpayment Gap
We estimate that individual underpayment enforcement revenues for TY 1992 will be$4.8 billion. Most of this amount will result from taxpayer responses to IRS notices concerningtheir underpayments. Some will pay in full, others partially or in installments. Some taxpayers

Individual Income Tax Gap Estimates for 1985, 1988, and 1992 page 11
who do not pay in response to notices will pay in response to IRS telephone contacts, liens,levies and other enforcement measures. We estimate this revenue to be $4.1 billion for TY 1985and $6.4 billion for TY 1988.
Table 4 presents estimates of the total, and the components of, revenue attributable toIRS enforcement actions for tax years 1985, 1988, and 1992. The sources of enforcement revenueare also shown for the major components of the tax gap.
TABLE 4Enforcement Revenue Estimates
Individual Income Tax Tax Years 1985, 1988, and 1992
($ billions)Component 1985 1988 1992
Nonfiling
Document Matching 1.1 1.9 1.4
Stopfiler 1.0 1.8 1.8
Total 2.1 3.7 3.2
Underreporting
Examination of Returns 4.0 4.7 5.2
Document Matching 1.9 1.9 1.7
Total 5.9 6.6 6.9
Underpayment
Total 4.1 6.4 4.8
Enforcement Revenue 12.1 16.7 14.9
D. Net Tax Gap
The net tax gaps are equal to the gross tax gaps minus the enforcement revenues. Ourestimates of the overall net individual income tax gap, shown in Table 5, range from $56.8 to$58.3 billion for TY 1985, from $62.6 to $64.2 billion for TY 1988, and from $78.3 to $80.4billion for TY 1992. These net tax gap estimates correspond to enforcement revenue estimates of$12.1 billion for TY 1985, $16.7 billion for TY 1988, and $14.9 billion for TY 1992, as shown inTable 4.

page 12 Individual Income Tax Gap Estimates for 1985, 1988, and 1992
TABLE 5Estimates of Gross Tax Gap, Enforcement Revenue, and Net Tax Gap
Individual Income TaxTax Years 1985, 1988, and 1992
($ billions)
Tax Gap Component TY 1985 TY 1988 TY 1992
Low High Low High Low High
NONFILING
Gross Tax Gap 9.6 9.8 11.0 11.2 13.5 13.8
Enforcement Revenue 2.1 2.1 3.7 3.7 3.2 3.2
Net Tax Gap 7.5 7.9 7.3 7.5 10.3 10.6
UNDERREPORTING
Gross Tax Gap 52.2 53.5 57.1 58.5 71.3 73.1
Enforcement Revenue 5.9 5.9 6.6 6.6 6.9 6.9
Net Tax Gap 46.3 47.6 50.5 51.9 64.4 66.2
UNDERPAYMENT
Gross Tax Gap 7.1 7.1 11.2 11.2 8.4 8.4
Enforcement Revenue 4.1 4.1 6.4 6.4 4.8 4.8
Net Tax Gap 3.0 3.0 4.8 4.8 3.6 3.6
TOTAL
Gross Tax Gap 68.9 70.4 79.3 80.9 93.2 95.3
Enforcement Revenue 12.1 12.1 16.7 16.7 14.9 14.9
Net Tax Gap 56.8 58.3 62.6 64.2 78.3 80.4
E. Tax Gap Trends
Table 6 presents, for 1985, 1988, and 1992, our higher estimates of the total individualincome tax gap, the three major components, and the ten largest elements of the underreportinggap. The ten underreporting elements are ranked by the sizes of our estimates for TY 1992.(The lower estimates are derived as simple percentages of the higher estimates; since thesepercentages are the same for each year, the lower estimates reveal nothing additional about trends.See Tables B6, B7, and B8 in Appendix B for the lower estimates.) The estimates for the firsttwo of these years are based on TCMP data for those years. The 1992 estimates are based onthe assumption that, line-by-line, 1992 compliance rates were the same as for 1988.

Individual Income Tax Gap Estimates for 1985, 1988, and 1992 page 13
TABLE 6Higher Gross Tax Gap Estimates And Percentages of “True” Tax Liability
Individual Income TaxTax Years 1985, 1988, and 1992
Tax Gap Component Gross Tax Gap($ billions)
Noncompliance asPercentage of “True” Tax
Liability1985 1988 1992 1985 1988 1992
NONFILING 9.8 11.2 13.8 2.6 2.4 2.5
UNDERPAYMENT 7.1 11.2 8.4 1.9 2.4 1.5
UNDERREPORTING* 53.5 58.5 73.1 14.3 12.7 13.2 Nonfarm ProprietorIncome 13.4 14.4 16.9 3.6 3.1 3.1
Informal Supplier Income 10.6 10.8 12.3 2.8 2.3 2.2
Other Income 5.9 5.0 7.6 1.6 1.1 1.4
Tax Credits 2.3 4.1 6.2 0.6 0.9 1.1
Deductions 4.4 4.3 5.1 1.2 0.9 0.9
Rents & Royalties 2.0 2.0 3.7 0.5 0.4 0.7
Partnership & SBC Income 0.8 2.4 3.6 0.2 0.5 0.7
Farm Income 1.9 1.7 3.4 0.5 0.4 0.6
Exemptions 1.6 2.7 2.9 0.4 0.6 0.5
Capital Gains 3.6 3.3 2.5 1.0 0.7 0.5
All Other Items 7.0 7.8 8.9 1.9 1.4 1.6
TOTAL 70.4 80.9 95.3 18.8 17.5 17.3
* Ranked by the size of the 1992 estimate.
The total gross tax gap grew, according to these estimates, by about $10 billion between1985 and 1988, and by about $14 billion from 1988 to 1992. However, as a percentage of trueliability overall compliance improved by more than one percentage point from 1985 to 1988.That is, the tax gap grew more slowly than tax liability so that the overall compliance rate rose.This reflects the TCMP results, which showed an improvement in compliance between theseyears. The estimates of the noncompliance rates for 1988 and 1992 are almost identical. Thisreflects the assumption of line-by-line constancy of compliance over these years. The change inthe gross tax gap’s percentage of true liability of one-tenth of one point is the net result of achange in the mix of types of income/deductions/credits and a reduction in the underpayment gap.

page 14 Individual Income Tax Gap Estimates for 1985, 1988, and 1992
The nonfiling gap grew over the three years, but its percentage of true liability is almostconstant. This pattern may be due to the fact that the estimates for all three years are based onthe 1988 nonfiler TCMP data.
Table 6 shows the underpayment gap rising and then falling over this period. Theavailable data indicate that nonremittance, as a percentage of the aggregate balances due on taxreturns, peaked in 1987 and then declined in 1988 and again in 1989. The estimates for 1992 arebased on the average percentage estimated for the period 1982-1989.
The improvements in overall compliance indicated by the 1988 TCMP are reflected in thedecline in the estimated underreporting percentage from 14.3 percent to 12.7 percent from 1985to 1988. Our projections indicate that constant compliance in each underreporting category from1988 to 1992 would cause the underreporting’s percentage of true liability to rise to 13.2 becauseof the changing composition of income and the changing frequency of various deductions andcredits.
Of the components of the underreporting gap, the top two in 1992 are nonfarmproprietor income and informal supplier income. Together they comprise 5.3 percent of totalliability in 1992, down from 6.4 percent in 1985. The fourth-place item—tax credits—rankedeighth for 1985. Tax credits overreporting, as a percentage of total tax liability, roughly doubledbetween 1985 and 1992. (The growth in overreported credits' percentage of true liability from1988 to 1992 is due to the rapid growth of reported credits, especially EITC, during this period.)Underreported capital gains declined in relative importance between 1985 and 1992, from 1.0percent of total true liability in 1985 to 0.5 percent in 1992.
The net misreporting percentages for the components of the underreporting gap areshown in Table 7 for Tax Years 1985 and 1988--the years of the last two TCMP surveys forindividual income tax. For each income and offset item, the contribution to the grossunderreporting gap is also shown.

Individual Income Tax Gap Estimates for 1985, 1988, and 1992 page 15
Table 7Net Misreporting Percentage (NMP) and Higher Gross Tax Gap Estimates
by Underreporting Gap ComponentTax Years 1985 and 1988
Underreporting Gap Component TY 1985 TY 1988
NMP(percent)
Gap($ billions)
NMP(percent)
Gap($ billions)
Non-Business Income
Wage Income 0.6 2.2 0.9 2.7
Interest Income 2.5 1.1 2.3 1.1
Dividends 9.9 1.6 7.8 1.3
State Income Tax Refunds 4.6 0.1 0.8 <0.05
Alimony Income 6.1 0.1 13.3 0.1
Pensions & Annuities 2.3 0.5 4.0 1.4
Unemployment Compensation 16.9 0.2 6.9 0.1
Social Security Benefits 5.0 0.1 4.2 0.1
Capital Gains 13.8 3.6 7.2 3.2
Form 4797 Income 22.5 0.5 28.0 0.6
Other Income 37.2 5.9 24.9 5.1
Business Income
Nonfarm Proprietor Income 35.0 13.4 32.3 14.4
Informal Supplier Income 72.8 10.6 81.4 10.8
Farm Income 31.3 1.9 32.2 1.7
Rents & Royalties 17.0 2.0 17.2 2.0
Partnership & SBC Income 2.6 0.8 7.5 2.4
Offsets to Income
Adjustments 4.0 0.7 2.0 0.2
Deductions 4.2 4.4 4.4 4.3
Exemptions 4.8 1.6 4.5 2.7
Tax Credits 26.2 2.3 40.2 4.1

page 16 Individual Income Tax Gap Estimates for 1985, 1988, and 1992
Among the categories of non-business income noncompliance rates (NMPs) increasedappreciably for alimony income, pension income, and gains on sales of business property (Form4797 income). However, none of these were among the top ten items shown in Table 6. TheNMP for wages increased by three tenths of one percentage point. The lower tax rates of 1988counteracted the decline in compliance, so that the tax gap associated with wages rose onlymoderately.
There were marked improvements in compliance for state income tax refunds and taxableunemployment compensation--two very small contributors to the total tax gap. Substantialimprovements also occurred for capital gains and other income--two more significant sources oftax gap. The large improvement in compliance for capital gains resulted in a very small reductionin the contribution to the tax gap. This is due to the elimination of the 60-percent exclusion ofcapital gains income by the 1986 Act.
Among the categories of business income, we estimate that informal supplier reportingcompliance deteriorated substantially. However, note that, unlike the other NMPs in Table 7,the 1988 NMP for this category is based not on new basic data but on extrapolation of surveydata from the mid-1980s. Reporting compliance for the other categories of business income didnot change appreciably.
For offsets to income, compliance in reporting adjustments improved significantly.Compliance in reporting credits declined markedly, due mainly to the elimination of theinvestment tax credit (which was underreported in 1985) by the 1986 Act, and to increasedoverreporting of EITC in 1988.

Individual Income Tax Gap Estimates for 1985, 1988, and 1992 page 17
III. COMPARISON WITH PRIOR IRS ESTIMATES
IRS's last estimates of the gross income tax gap were published in 1988 and 19909. Theywere based on the 1982 and earlier TCMP surveys and other compliance data. The 1988/90reports presented detailed estimates for TY 1987. While this report focuses on 1985, 1988, and1992, the tax model used for those years also generates estimates for other years byinterpolation. We can, therefore, compare the 1988/90 reports’ estimates for 1987 withestimates for that year, which are consistent with more current data. (We are unable to comparecompliance rates for our previous and current estimates for 1987 because we did not use theconcept of net misreporting percentage in the 1988/90 report. In that report, we showed netmisreporting percentages, but only for line items that do not include loss amounts.)
Table 8 presents the higher gross tax gap estimates from the 1988/90 reports, andpercentages of true liability calculated from those estimates, together with comparable currentestimates. Estimates are shown for the three major components of the tax gap and for tenelements of the underreporting gap. The 1988/90 underpayment gap estimate shown in Table 8is the estimate for insufficient remittance by individuals from the 1990 report. That report alsoincluded estimates of employer underdeposit of withheld income tax. Since the latter is not partof the individual income tax gap, we exclude it from this comparison.10 (We do not include lowerestimates in Table 8 because the method and the data used to derive our current lower estimatesfrom the higher estimates are exactly the same as those used for the 1988/90 estimates;differences between the current and prior lower estimates are, therefore, due altogether todifferences in the higher estimates shown in Table 8. Our 1988/90 report did not contain lowerestimates for the components of the underreporting gap.)
9 See Internal Revenue Service (1988a, 1990a)
10 The estimate of employer underdeposits of withheld income tax in the 1990 report was $2.9 billion for TY 1987.Our current estimate for that year is $5.7 billion. Our current estimates of employer underdeposits of withheldincome tax for 1985, 1988, and 1992 are $4.0, $4.9, and $6.4 billion respectively.

page 18 Individual Income Tax Gap Estimates for 1985, 1988, and 1992
TABLE 8Current and 1988/90 IRS Higher Estimates of the
Gross Individual Income Tax Gap and Percentages of “True” Tax LiabilityTax Year 1987
Tax Gap Component Gross Tax Gap($ billions)
Percentage of “True”Tax Liability
1988/90Estimate
CurrentEstimate
1988/90Estimate
CurrentEstimate
NONFILING 7.2 10.2 1.9 2.4
UNDERPAYMENT 5.0 10.1 1.3 2.4
UNDERREPORTING* 56.3 52.1 14.6 12.5
Nonfarm Proprietor Income 16.6 13.2 4.4 3.2
Informal Supplier Income 7.7 10.2 2.0 2.4
Capital Gains & Form 4797 Income 6.7 3.8 1.7 0.9
Other Income 3.6 4.6 0.9 1.1
Deductions 3.5 4.2 0.9 1.0
Interest & Dividends 3.2 2.2 0.8 0.5
Partnership & SBC Income 3.2 1.9 0.8 0.5
Rents & Royalties 3.1 2 0.8 0.5
Exemptions 2.0 2.6 0.5 0.6
Tax Credits 0.9 1.9 0.2 0.5
All Other Items 5.8 5.5 1.6 1.3
TOTAL TAX GAP 68.5 72.4 17.8 17.3
“True” Liability 384.9 417.5 100.0 100.0
* Ranked by the size of 1988 estimates
Based on our current data and estimating techniques, we are revising our estimate of thegross individual income tax gap for TY 1987 upward by $3.9 billion, from $68.5 billion to $72.4billion. However, we are revising our estimate of the total percentage of noncompliance in trueliability (also known as the noncompliance rate) downward from 17.8 to 17.3. This apparentanomaly arises because the underlying estimates of tax voluntarily paid and of the true liabilityfor 1987 have also been revised. When we prepared the March 1988 publication, data on actualindividual income tax payments were not available. The compliance rates shown there werebased on elaborate projections of 1987 personal income by type of income and on estimates ofthe impact that the Tax Reform Act of 1986 would have on true and reported liabilities.

Individual Income Tax Gap Estimates for 1985, 1988, and 1992 page 19
The increase of $3.9 billion in the total gross gap is the net result of increases in thenonfiling and underpayment components (by $3.0 and $5.1 billion respectively) and a decrease inthe underreporting component (by $4.2 billion). The current estimates of the percentages ofthese gaps in true tax liability have changed correspondingly; the percentages for nonfiling andunderpayment are higher in the current estimates, while the percentage for underreporting islower.
The increase in the nonfiling tax gap estimate for TY 1987 is due to major changes in themethods used to estimate this component. In our 1988 report, we relied on the Bureau of theCensus's 1972 and 1977 studies in which the Bureau's Current Population Survey data werematched with the identities of the individuals who had filed tax returns for those years. In thisreport, we rely on a TCMP study of individuals who were known or thought to exist but whodid not file tax returns for TY 1988. The analysis of these data is described in Appendix A. Theresults were extrapolated back to 1987 to obtain the current nonfiling estimate.
When the previous estimates were made, the latest available figures on individuals' failureto pay taxes reported on their returns were for TY 1983. Our previous estimate of theinsufficient remittance portion of the underpayment gap (then called the "remittance gap") wasbased on that information. Our current estimate is based on an actual tabulation of insufficientremittances for TY 1987. The actual amount for 1987 was more than twice as large as ourprevious estimate.
Table 8 displays the current and 1988 estimates of the ten largest components of theunderreporting gap (ranked in descending order of the previous estimates). The percentage oftrue liability for the largest component—underreported nonfarm proprietor income—is smallerby 1.2 points than it was in the previous estimates. But, it is still comfortably larger than thesecond-place component—underreported informal supplier income—even though our estimate ofthe percentage of true liability for the latter is larger by four-tenths of a point in our currentestimates. These underreported amounts together account for 5.6 percent of the total trueindividual income tax liability for TY 1987.
The third-place component in our previous estimates for TY 1987—underreportedcapital gains income—ranks only sixth in our current estimates. This reflects a substantialincrease in reporting compliance for this type of income between the 1982 TCMP results, thebasis of our 1988 estimates, and those of the 1985 and 1988 TCMP surveys, the basis of ourcurrent estimates. The tenth-place item in the previous estimates was tax credits. This itemranks sixth in the current estimates for TY 1987. This change reflects a change in reportingcompliance revealed by the 1985 and 1988 TCMP surveys, as compared to the 1982 survey.The decline in compliance is largely accounted for by the growth of improper or excessive claimsof earned income tax credit (EITC).

page 20 Individual Income Tax Gap Estimates for 1985, 1988, and 1992
IV. SOURCES AND METHODS
The tax gap estimates in this report were developed from data from a variety of sourcesand different estimation techniques for the various gap components. In estimating both the grossand net tax gaps, separate estimates were developed for each component: the underreporting gap,the nonfiling gap, and the underpayment gap.
A. Gross Tax Gap
1. Underreporting Gap
Our "higher" estimates of the underreporting gap are generated using an IRS tax gap modelto develop estimates for most types of income and offsets to income. Estimates ofunderreporting for some income types, however, are based on data from special consumersurveys. Our "lower" underreporting gap estimates are developed from the "higher" estimates.The methods are explained in Appendix B to this report and in detail in Appendices A, C, and Eto our 1988 report.11
IRS Tax Gap Model
The IRS tax gap model is largely based upon data from Taxpayer ComplianceMeasurement Program (TCMP) examinations of tax returns.12 These data show what taxpayersreported on their returns and what TCMP examiners determined they should have reported. Themodel uses these data to estimate the extent to which filers underreport income and overstateoffsets.
TCMP data, however, understate reporting noncompliance to the extent that TCMPexaminations do not detect all underreported income. The model therefore augments the TCMPdata with estimates of underreported income not detected by TCMP. (Estimates of misreportingof offsets is not adjusted because, in the audits, taxpayers can be required to support reportedoffsets.) These estimates of additional undetected income are based on an IRS study of a sub-sample of the TY 1976 TCMP survey of individual filers. That study found that, on average, forevery dollar of underreported income detected by TCMP examiners without the aid of IRP
11 Internal Revenue Service (1988b)
12 TCMP is a special examination program designed to make possible sample-based population estimates ofvoluntary compliance. Under this program, tax returns are randomly selected for thorough, intensive examinations.Until recently, TCMP surveys of individual returns have generally been conducted every three years, with results ofthe 1988 survey being the most recent available.

Individual Income Tax Gap Estimates for 1985, 1988, and 1992 page 21
information documents,13 another $2.28 went undetected. As a result, the model uses a"multiplier" of 3.28 to expand amounts of unreported income detected in TCMP without the aidof information documents.
For years between TCMP years, the model interpolates, for each income and offset item,between the compliance rates (after multiplier expansion where appropriate) for the TCMPyears; the resulting compliance rate is then applied to adjusted SOI estimates of the amountreported for the item to generate estimates of misreporting. Appropriate marginal tax rates arethen applied to produce tax gap estimates. For years after the last TCMP year, the modelassumes for each item that the compliance rate is the same as that for the last TCMP year, andapplies that rate to actual or projected amounts reported. Thus, the 1987 estimates in ourprevious report were based on 1982 reporting rates, while the estimates of this report are basedon a blend of 1985 and 1988 reporting rates.
IRS-sponsored Survey Data
Data from special IRS-sponsored surveys were used to develop underreporting estimatesfor tip income and informal supplier income. The special survey data were extrapolated to taxyears for which TCMP surveys were conducted and then imputed to individual records by theIRS tax gap model in order to generate underreporting gap estimates for tip and informal supplierincome.
The underreported tip income estimates are based upon consumer surveys conducted forIRS by the Survey Research Laboratory of the University of Illinois.14 These surveys askedrestaurant patrons about their restaurant tipping behavior during 1982 and 1984.
Our underreported informal supplier income estimates are based upon results of IRS-sponsored research on informal supplier incomes conducted by the Survey Research Center ofthe University of Michigan.15 This research surveyed consumers and asked them to estimate theamounts of money they paid to informal suppliers during 1981 and 1985-1986.
13 IRS's Information Returns Program (IRP) matches information reported on tax returns against taxpayer incomeand expense information sent to IRS by third parties such as employers (Form W-2), banks (Form 1099-INT), andmortgage holders (Form 1098).
14 See Pearl (1988a,b).
15 See Adams and Smith (1987).

page 22 Individual Income Tax Gap Estimates for 1985, 1988, and 1992
Range of Estimates
The estimation methodology described above, utilizing TCMP and special survey data,was used to develop our "higher" estimates of the underreporting gap, which are based on taxadjustments initially recommended by IRS examiners. Our "lower" estimates, however, reflecttax changes ultimately assessed after all appeals and litigation have been completed. Thedifferences between these estimates represent recommended adjustments that are conceded in theappeals process or lost in litigation.
Our "lower" estimates are 97 percent of the higher estimates. The factor was derivedfrom analysis of appeal rates and sustention rates for adjustments to tax liability in examinationcases in various classifications. The same factor is used for every year. We have no informationto support separate factors for the various types of misreporting; therefore, we apply the figurebased on tax adjustment information.
2. Nonfiling Gap
Our estimate of the nonfiling gap is derived from the results of two segments of theTCMP nonfiler survey for TY 1988 (TCMP Phase IX, Cycle 2): a Collection-based segment tolocate the potential nonfilers and to secure the delinquent returns that should have been filed, anda subsequent Examination-based segment to determine the reporting accuracy of those secureddelinquent returns.
The Collection-based segment consisted of a stratified random sample of 23,286 nonfilerleads from the 88 million "potential nonfilers" - individuals who did not timely file an income taxreturn for tax year 1988. These leads were used by IRS agents to locate the individuals. Once theindividuals were successfully located, IRS officers used information documents and past filingrecords to determine whether a return should have been filed and, if possible, to secure tax returnsin cases from taxpayers determined to be delinquent.
The Examination-based segment consists of a random subsample of 2,198 returns drawnfrom 3,546 secured delinquent returns contained in the Collection-based segment. They representthe delinquent nonfilers from whom secured delinquent returns would be forthcoming in the eventof routine IRS contacts. These 2,198 secured delinquent returns were subjected to the sameintensive line-by-line audit as the 54,000 timely filed returns contained in the TCMP filer surveyfor TY 1988.
We estimated a regression model to assess the probability that an individual withparticular observed characteristics would be located, based on the Collection-based segment datafor all potential nonfilers. We then used the regression results to adjust the sample weights of2,198 secured delinquent returns in the Examination-based segment so that these returnsrepresent all delinquent nonfilers, located or unlocated. The Examination-based segment with theadjusted sample weights constitutes the main data source for estimating the nonfiling gap.

Individual Income Tax Gap Estimates for 1985, 1988, and 1992 page 23
Since the TCMP survey-based estimates are only available for TY 1988, we developed amethod to predict the nonfiling gap estimates for TYs 1989-1992. Based on the relationshipbetween the nonfiling and underreporting tax gaps for TY 1988, and using estimates of theunderreporting gap for timely filed returns generated from the IRS tax model for tax years 1989-1992 and 1984-1987, we developed nonfiling gap estimates for these years.
3. Underpayment Gap
The underpayment gap relates to voluntarily and timely filed tax returns on which abalance due is reported but not paid. It is the sum of the balance due amounts for all suchreturns, less the sum of the amounts remitted with the returns. Our estimates are based on IRSmasterfile tabulations of balance due after remittance for individual returns. These tabulationswere available for TYs 1982-1983 and 1987-1989. We interpolated to obtain figures for theyears between TY 1983 and TY 1987. Masterfile data on balances due at time of filing fromStatistics of Income for TYs 1982-1989 were used to calculate ratios of balance due afterremittance to taxes due at time of filing for TYs 1982-1989. The average of these ratios for 1982-1989 was multiplied by the taxes due at time of filing for TYs 1990-1992, to obtain our estimatesof insufficient remittance by individuals.
B. Net Tax Gap
The net tax gap is defined as the gross tax gap minus the amount of tax IRS collects forthe tax year in question through its enforcement activities. Therefore, once the gross tax gap hasbeen estimated, estimating the net tax gap is essentially a matter of estimating IRS enforcementrevenues. Our enforcement revenue estimates are based primarily on IRS masterfile andmanagement information systems data.
IRS management information systems, however, generally report enforcement results(proposed adjustments, actual assessments, and eventual collections) according to the IRS fiscalyear during which the result occurs, not according to the tax year of the tax liability in question.A given fiscal year's enforcement results typically involve tax liabilities associated with manyprevious tax years. It was, therefore, necessary to translate the available fiscal year enforcementdata into equivalent data classified by tax year of liability. The methodologies and data sourcesused to estimate tax year enforcement revenues for the various components of the tax gap arereviewed below.
1. Underreporting Gap
We estimated enforcement revenues from the examination of individual income tax returnswith the help of data from the IRS Audit Information Management System (AIMS). The return-level AIMS data base was used to develop distributions for converting fiscal year AIMS data onrecommendations of additional tax into tax year recommendations. Estimated collections of tax,

page 24 Individual Income Tax Gap Estimates for 1985, 1988, and 1992
interest, and penalties were generated from the data on recommendations of additional tax.16
Finally, we used IRS Direct Enforcement Revenue Report (DERR) data to separate estimated taxcollections from estimated interest and penalty collections.17
2. Nonfiling Gap
We estimated nonfiling gap enforcement revenues using yield assessments from variousindividual income tax nonfiler investigation programs. Yield assessments on a fiscal year basiswere estimated using Stopfiler Reminder Program (SRP) and Return Delinquency Investigation(RDI) data. These fiscal year assessment estimates were converted to a tax year basis using taxyear distributions developed from Collection Research File (CRF) data. Finally, CRF data werealso used in converting the tax year assessment estimates into collection estimates.
3. Underpayment Gap
We estimated enforcement revenues from the collection of tax underpayment using IRSmasterfile account balance data. From data obtained by tracking the debit balances of a sample ofdebit-balance Individual Masterfile accounts, we found that an estimated 57 percent ofinsufficient remittances on the part of individuals was eventually collected.
16 The estimates are generated using the "interim method" described in Chapter III of Internal Revenue Service(1990b).
17 Since interest and penalties are not included in our gross tax gap estimates, including them in our enforcementyield estimates would understate the resulting net tax gap estimates.

Individual Income Tax Gap Estimates for 1985, 1988, and 1992: Appendix A page 25
APPENDIX A
Nonfiling Gap Estimation And Projection
This Appendix presents the data and methods used for estimating and projecting theindividual income tax nonfiling gap. Section 1 summarizes the data structure. Section 2 presentsthe econometric analysis of the probability of locating potential nonfilers. Section 3 presentssample weight adjustments to account for unlocatable delinquent nonfilers. Section 4 discussesthe estimation method for the TY 1988 nonfiling gap. Finally, Section 5 discusses the projectionmethod for the TY 1992 nonfiling gap.
1. Data Structure
Through an intensive match of Social Security, tax, and information return documents,IRS was able to identify a group of "potential nonfilers"—individuals who did not timely file anincome tax return for tax year (TY) 1988.18 A stratified sample of 23,286 was selected from the88 million potential nonfiler leads. In a TCMP project (Phase IX, Cycle 2), IRS employeesinvestigated the sample leads. The results of the investigations constitute our main data sourcefor estimating the nonfiling gap.
The TCMP project had two components: a Collection-based segment to locate eachpotential nonfiler in the sample and to secure the delinquent returns if they should have beenfiled; and a subsequent Examination-based segment to determine the accuracy of a sample ofthose secured delinquent returns.
In the Collection segment, Revenue Officers attempted to locate each of the 23,286sample nonfilers. For each individual who was located, revenue officers used informationdocuments, past filing records, and information supplied by the individual to determine whether areturn should have been filed, to estimate the amount of tax liability, and, if possible, to secure atax return if a non-filing violation had occurred; checksheets were completed at the conclusion ofthe investigations. In the Examination segment, the sampled returns were intensively audited; theresults were recorded on checksheets.
Potential Nonfilers
The 23,286 potential nonfilers in the collection-based segment represent a population of88 million individuals for whom there was no record that a 1988 individual income tax return hadbeen filed. These individuals were identified through a match of IRS tax records with the Social
18 IRS's Nonfiler Correlation Process (NCP) generated nonfiler leads by matching all social security numbers everissued to individuals not recorded as having died against those of individuals who filed an income tax return for taxyear 1988. The NCP also matched data from the Individual Master File (IMF), the Returns Transaction File (RTF),and the Information Reporting Master File (IRMF) against TY 1988 filers.

page 26 Individual Income Tax Gap Estimates for 1985, 1988, and 1992: Appendix A
Security Administration Date of Birth/Date of Death Master File.19 The potential nonfilersidentified through this match include delinquent nonfilers as well as individuals who were notrequired to file returns.
Located Nonfilers
An intensive effort was made by IRS agents to locate each of the individuals in thesample. Information that was known about each individual prior to the investigation is availablefor analysis, including the individual's age, whether a return had been filed for the previous year,whether a return had ever been filed, and whether information return documents had been filed forTY 1988. A total of 18,689 of the 23,286 potential nonfilers in the sample were located.20
Delinquent Nonfilers
Information for the located individuals was reviewed to determine whether a return shouldhave been filed. The IRS Revenue Officers used the information return documents21 andtaxpayers' previous filing information and conducted interviews or field visits to determine ifthese located individuals had sufficient income to require filing. A total of 4,760 of the 18,689located individuals were determined to have been in violation of federal income tax filingrequirements.
Secured Delinquent Returns Individual income tax returns were secured in 3,546 of the 4,760 delinquent nonfiler cases.
The remaining 1,214 located nonfilers were judged as having a filing requirement but that furtherIRS enforcement action would be required to resolve the issues.22
19 Non-residents and individuals without valid social security numbers were excluded.
20 The collection-based sample weights for these 18,689 individuals sum to approximately 57 percent of thepotential nonfiler population. Unlocated individuals in the sample tended to have much larger sample weights as aconsequence of the way the sample was stratified.
21 The information reporting documents include those reporting incomes, such as wages and interest; and thosereporting transactions, such as real estate and stock sales.
22 These enforcement actions include referrals to Examination or Criminal Investigation, as well as IRS preparationof “substitutes for returns.”

Individual Income Tax Gap Estimates for 1985, 1988, and 1992: Appendix A page 27
Examined Returns
The sample for the Examination-based segment of the TCMP nonfiler project consists of
2,198 returns drawn at random from the 3,546 delinquent returns secured in the Collection-based
segment. These returns were subjected to the same intensive line-by-line audit as the 54,000
timely filed returns contained in TCMP III-10 survey.
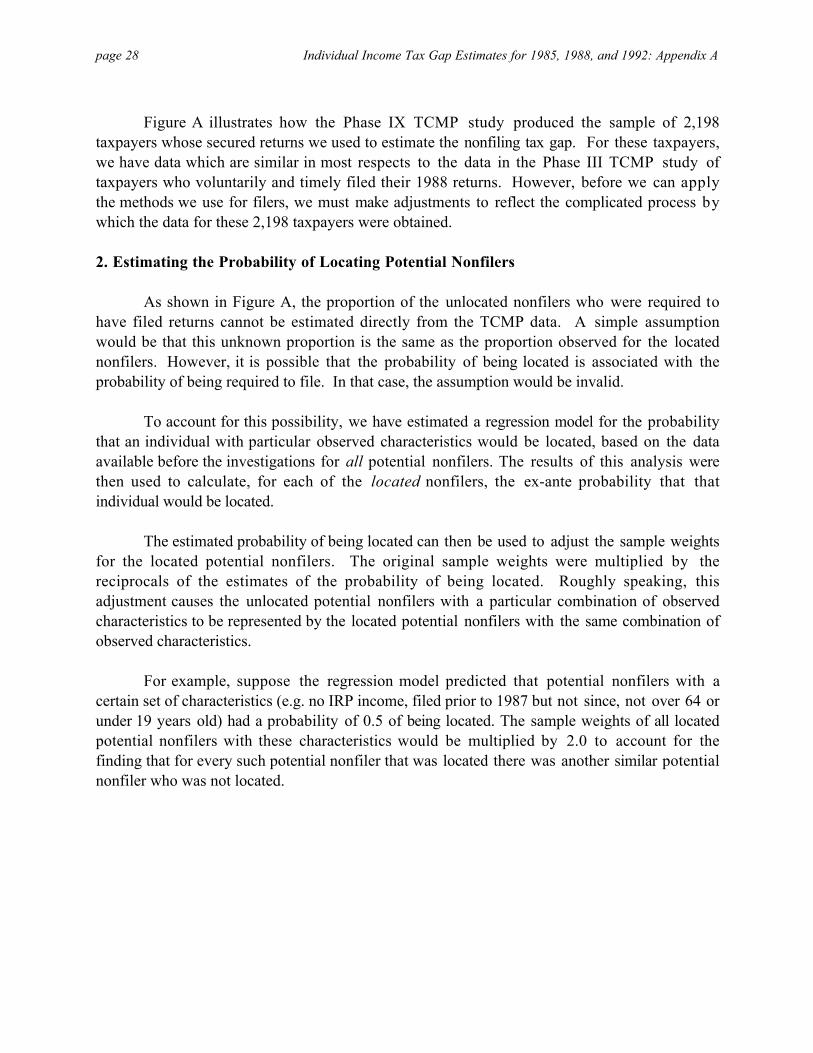
Figure A summarizes the data structure for our nonfiler tax gap estimates.
FIGURE ATCMP Nonfiler Survey Data Summary
Tax Year 1988Examined(probabilitysample of
2,198)
Data:Results of
Examinations
Secured
(3,546)
Data:Contentsof Returns
Not Examined(1,348)
Delinquent
(4,760)To Estimate:
Number,Tax Liability,
andPrepayments
NotSecured(1,214)
Located
(18,689)Data:results
ofinvestig-ationsshown
onTCMPCheck-sheets
NotRequired To
File(13,929)
Delinquent
To Estimate:Number,
Tax Liability,Prepayments
Potential Nonfiler(probability sample of
23,286)
Data:For each case,
information known toIRS before
investigations, including:age,
prior filing history, andIRP information
Notlocated(4,597)
NotRequired To
File
page 28 Individual Income Tax Gap Estimates for 1985, 1988, and 1992: Appendix A
Figure A illustrates how the Phase IX TCMP study produced the sample of 2,198taxpayers whose secured returns we used to estimate the nonfiling tax gap. For these taxpayers,we have data which are similar in most respects to the data in the Phase III TCMP study oftaxpayers who voluntarily and timely filed their 1988 returns. However, before we can applythe methods we use for filers, we must make adjustments to reflect the complicated process bywhich the data for these 2,198 taxpayers were obtained.
2. Estimating the Probability of Locating Potential Nonfilers
As shown in Figure A, the proportion of the unlocated nonfilers who were required tohave filed returns cannot be estimated directly from the TCMP data. A simple assumptionwould be that this unknown proportion is the same as the proportion observed for the locatednonfilers. However, it is possible that the probability of being located is associated with theprobability of being required to file. In that case, the assumption would be invalid.
To account for this possibility, we have estimated a regression model for the probabilitythat an individual with particular observed characteristics would be located, based on the dataavailable before the investigations for all potential nonfilers. The results of this analysis werethen used to calculate, for each of the located nonfilers, the ex-ante probability that thatindividual would be located.
The estimated probability of being located can then be used to adjust the sample weightsfor the located potential nonfilers. The original sample weights were multiplied by thereciprocals of the estimates of the probability of being located. Roughly speaking, thisadjustment causes the unlocated potential nonfilers with a particular combination of observedcharacteristics to be represented by the located potential nonfilers with the same combination ofobserved characteristics.
For example, suppose the regression model predicted that potential nonfilers with acertain set of characteristics (e.g. no IRP income, filed prior to 1987 but not since, not over 64 orunder 19 years old) had a probability of 0.5 of being located. The sample weights of all locatedpotential nonfilers with these characteristics would be multiplied by 2.0 to account for thefinding that for every such potential nonfiler that was located there was another similar potentialnonfiler who was not located.

Individual Income Tax Gap Estimates for 1985, 1988, and 1992: Appendix A page 29
Probit Model Specification
The model-based assessment of the probability of being located involves probitestimation of whether an individual from the potential nonfiler population can be located as afunction of observed characteristics.
Using appropriately defined “dummy” variables as regressors in the probit model, weseparated all of the potential nonfiler individuals into six mutually exclusive and exhaustivecategories, based on returns filed by them and information returns filed concerning them, asshown in the outlined boxes below.
Was a 1987 Return Filed?
Yes No
Was a Pre-1987Return Filed?
Was a Pre-1987Return Filed?
Yes No Yes No
Were 1988Information
Returns Filed?
Were 1988Information
Returns Filed?
Were 1988Information
Returns Filed?
Were 1988Information
Returns Filed?Yes Yes Yes Yes
No No No No
We also defined dummy variables which separated the potential nonfilers into four categoriesbased on age:
sixty-five or older;older than 18 and younger than 65;18 or younger;and unknown.
Finally, we separated the potential nonfilers into the following two categories: record of aspouse on a prior filed return; and no such record. Using these three sets of categoriessimultaneously, we have forty-eight distinct and exhaustive groups of individuals in our sample.
The dependent variable in the probit model was a dummy variable that had the value onefor cases in which the subject individual was located, and the value zero for cases in which thesubject individual was not located. Estimation was by maximum likelihood.

page 30 Individual Income Tax Gap Estimates for 1985, 1988, and 1992: Appendix A
Econometric Results
The results are consistent with our prior expectations. Each of the parameter estimates isof expected sign and they all are statistically significant.23
Using the coefficients from the probit estimation, we can calculate the probability of anindividual’s being located for each of the forty-eight groups in our sample. The potential 1988nonfilers who were most difficult to located had the following characteristics: they had not filed a1987 return or a return for a prior year; no information documents had been filed for them for TaxYear 1988; their age was unknown; and there was no record of a spouse on a prior return. Theestimated probability of locating such individuals was .06.
The most readily located individuals had the following characteristics: they had filed a1987 return; Tax Year 1988 information documents had been filed concerning them; they weresixty-five years old or older; and IRS had a record of a spouse on a prior return. We estimate theprobability of locating such individuals as .97.
Other groups had probabilities of being located between these extremes. For example,individuals who had not filed with a spouse in a prior year, between the ages of 18 and 65, whofiled for 1987, but for whom no 1988 information documents were available, had a probability ofbeing located of .68.
The probability of locating single individuals 18 years old or younger, who had not filedin 1987, but had filed in a prior year, and for whom no 1988 information documents wereavailable was .58.
3. Accounting for Unlocatable Delinquent Nonfilers
Using the results from the previous section, we make a series of adjustments to each ofthe 2,198 examined secured returns' original sample weights. These adjustments make thissample representative of all delinquent returns, whether located or unlocated, secured orunsecured, examined or unexamined.
23 For more detailed discussions on model specification and econometric results, see Erard and Ho (1995).

Individual Income Tax Gap Estimates for 1985, 1988, and 1992: Appendix A page 31
Located Delinquent Nonfilers Representative of All Delinquent Nonfilers
The original collection-based sample weight (WTC) for each of 4,760 located delinquentnonfilers was multiplied by the inverse of the probit model estimated probability of being located(1/PROB) to account for additional unlocated delinquent nonfilers.
WT1i = WTCi * (1/PROBi) i = 1,....4,760 (located delinquent nonfilers)
whereWT1 = probability adjusted weightWTC = original collection weightPROB = probit model estimated probability of being located
The sum of the WT1 weights is our estimate of the number of delinquent nonfilerindividuals in the population.
Accounting for Joint Returns
We divided the sample weights for the secured delinquent returns of married jointnonfilers by 2.0. All else being equal, a delinquent married couple's return has approximatelytwice the chance of being included in our sample as a delinquent single individual's return. Theoriginal sample of potential nonfilers is a sample of individuals. If either member of a couplewere included in the sample of located potential nonfilers, their joint return would be included inthe resulting sample of delinquent returns.
WT2j = WT1j /2, for joint returns
= WT1j for all other returns
The sum of WT2 is our estimate of the number of tax returns owed by the delinquent
nonfiler individuals in the population.
Examined Secured Returns Representative of All Delinquent Returns
The WT2i for each of the 2,198 examined secured delinquent returns, was then adjustedso that they sum to the same total as do the weights for the 4,760 located delinquent nonfilers.This was done in two steps. First, to account for the sampling rates for the examination sub-sample of secured returns, we multiplied the WT2 weight for each examined return by thereciprocal of the probability with which it was selected. For secured returns with reportedpositive tax liabilities less than $2,000, this figure was 2.35; for secured returns reporting taxliability of $0 or more than $1,999, the figure was 1.17. Call these adjusted weights WTE. We

page 32 Individual Income Tax Gap Estimates for 1985, 1988, and 1992: Appendix A
then proportionally adjusted each WTE so that their sum would be equal to the sum of the WT2for all delinquent returns, as follows.
WT3j = WTEj * S j = 1...2,198 (examined secured delinquent returns)
where
S = (WT2_4760)/(WTE_2198)
WTE_2198 = Sum of WTEi for 2,198 examined secured delinquent cases
WT2_4760 = Sum of WT2i for 4,760 located delinquent cases
The sum of the WT3 weights for the 2,198 examined secured returns is our estimate ofthe number of delinquent 1988 tax returns in the population. It is identical to the estimate we getfrom summing the WT2 weights for all located delinquent returns. Figure B summarizes ourestimates of the numbers of nonfiling individuals and delinquent returns. (Note that in Figure Bwe use the words “locatable” and “securable” in place of the words “located” and “secured” usedin Figure A. The focus of Figure A is the TCMP data; so, for example, the figure reports that ofthe 23,286 individuals investigated, 18,689 were located. The focus of Figure B is on ourestimates of the number of nonfilers in the population; so, for example, the figure reports that weestimate that of 88.5 million individuals who could have been investigated, about 50.4 millioncould have been found with the kinds of techniques that were used in the TCMP, i.e. they werelocatable; only 18,689 were actually located in the study.)

Individual Income Tax Gap Estimates for 1985, 1988, and 1992: Appendix A page 33
FIGURE BEstimates of Number of Nonfilers
Tax Year 1988
n = number of individuals in TCMP sampleN = estimated number of individuals in population (millions)
n = estimated number of tax returns (millions)
IndividualNonfilers
n = 23,286N = 88.5
Locatable
n = 18,689 (80%)N = 50.4 (57%)
Delinquent
n = 4,760 (25%)N = 7.7 (15%)
n = 6.6
Securable
n = 3,546 (74%)N = 3.7 (48%)n = 2.9 (44%)
Not Securable
n = 1,214 (26%)N = 4.0 (52%)n = 3.7 (56%)
NotRequired To File
n = 13,929 (75%)N = 42.7 (85%)
Not Locatable
n = 4,597 (20%)N = 38.1 (43%)
Delinquent
N = 2.1 (6%)n = 1.8
NotRequired To File
N = 36.0 (94%)

page 34 Individual Income Tax Gap Estimates for 1985, 1988, and 1992: Appendix A
4. TY 1988 Nonfiling Gap Estimation
The higher estimate of the nonfiling gap is calculated, in millions of dollars, as follows:
NFGAP = RTAX + UTAX - PREPAY 11,164 = 16,937 + 6,433 - 12,206
where RTAX is the amount of income tax liability reported on the 2,198 examined securedreturns, weighted up to the population of delinquent nonfilers using the WT3 weights describedabove; UTAX is the underreporting of tax liability on those returns, as estimated by our tax gapmodel, similarly weighted; and PREPAY is the aggregate amount of prepayments of tax, asdetermined by the examiners of the returns, similarly weighted. (The model’s lower estimate ofUTAX is $6,240 million; the lower estimate of NFGAP is, therefore, $10,971 million.)
RTAX and PREPAY are estimated by straightforward weighted summation and requireno further elaboration. Estimation of UTAX is described below. (Our estimation methodassumes that the examined secured returns fairly represent the net balances due of not only theunexamined secured returns--which is justified because the examined returns were a probabilitysample of all secured returns--but also of the unsecured delinquent returns. In principle, wecould adjust for possible differences between the amounts owed by the taxpayers whose returnswere secured and those whose returns were not secured, using the Collection estimates ofbalances due based on IRP documents for the secured and unsecured cases. However, the linearcorrelation between these estimates and the Examination-corrected balances due for the examinedcases was only .18. We concluded that the Collection estimates were not accurate enough tojustify using them for an adjustment.)
To estimate UTAX we used the net misreported amounts (NMAs) for income and offsetitems.24 The estimates were developed using the IRS tax model based on the Examination-baseddata.
The tax model augments the TCMP-detected net misreported amounts for income itemsby a set of multipliers25. For offset items, TCMP-detected NMAs are considered accuratebecause the TCMP examiners can require the taxpayers to provide support for the claimedoffsets. Since the TCMP examiners were provided with IRP documents for TY 1988 secured
24 For an income item, the NMA is defined as the sum of all amounts underreported minus the sum of all amountsoverreported on the item. For an offset item, the NMA is defined as the sum of all amounts overstated minus thesum of all amounts understated on the item. For more detailed discussions on the NMA, see Ho (1994).
25 These multipliers are based on an IRS study of a sub-sample of the 1976 TCMP filer survey. The study foundthat, on average, for every dollar of underreported income detected by TCMP examiners without the aid of the IRPdocuments, another $2.28 went undetected.

Individual Income Tax Gap Estimates for 1985, 1988, and 1992: Appendix A page 35
delinquent returns, only the non-IRP portion of TCMP detected income was expanded by themultiplier.26
The model summarized all multiplier-augmented NMAs for income items and imputedthe total to all returns through a statistical matching procedure.27 For each income item, themodel executed the matching process separately and calibrated the total imputed NMAs toreplicate the estimated multiplier-augmented NMA total.28 The model assigned the detected taxdue to all misreported line items on a return in proportion to their multiplier-augmented NMAsand summarized all multiplier-augmented NMAs and model-imputed tax due for each line item tocalculate its marginal tax rate. The results are displayed in Tables A1, A2, and A3.
TABLE A1Multiplier-Expanded Underreported Income Estimates
Positive Income ItemsTY 1988 Nonfilers
Income Item IRPDetected
($millions)
Non-IRPDetected
($millions)
EffectiveMultiplier
UnderreportedAmount
($millions)Wage Income 171 428 3.28 1,575
Interest Income 257 62 3.28 460
Dividends 175 39 3.28 303
State Income Tax Refunds 2 18 1.00 20
Alimony Income 0 2 3.28 7
Pensions & Annuities 0 511 3.28 1,676
UnemploymentCompensation
3 55 3.28 183
Social Security Benefits 0 11 3.28 36
26 The IRP-detected portions of the underreported income for all income sources were not available in TCMP IX-2nonfiler survey data. We used a nearest neighbor hot deck method to impute these IRP-detected portions fromTCMP III-10 filer survey data. For more detailed discussions, see Ho and Wong (1994).
27 Statistical matching is a variation on the data allocation procedures called "hot decking" used by the Bureau ofthe Census and other survey research organizations. For more detailed discussions, see Ho and Wong (1995).
28 The imputation algorithm divides those with TCMP non-IRP detected wages, for example, into 480homogenous groups using 5 types of matching variables: reported total positive income, primary income source,age of taxpayer, itemization, and filing status. These variables were selected because they are likely to be correlatedwith the likelihood of having a particular form of non-reported wage income.

page 36 Individual Income Tax Gap Estimates for 1985, 1988, and 1992: Appendix A
TABLE A2Multiplier-Expanded Underreported Income Estimates
Loss-Included Income ItemsTY 1988 Nonfilers
Income Item IRPDetected
($millions)
Non-IRPDetected
($millions)
EffectiveMultiplier
UnderreportedIncome
($millions)Capital Gains 2,711 Overstated Basis 0 813 1.00 813 Other 55 562 3.28 1,898Form 4797 Income 200 Understated Receipts 4 36 3.28 122 Overstated Basis 0 78 1.00 78Farm Income 2,232 Understated Income 0 885 2.40 2,124 Overstated Expenses 0 108 1.00 108Informal Supplier Income
29 1,262
Nonfarm Proprietor Income 17,617 Understated Income 251 4,189 2.40 10,305
Overstated Expenses 0 7,312 1.00 7,312
Partnership & SBC Income 803 Understated Income 0 219 3.28 718 Overstated Expenses 0 85 1.00 85Rents & Royalties 741 Understated Income 4 43 2.27 102 Overstated Expenses 0 639 1.00 639Other Income 4,226 Non Tax Shelter 31 1,072 3.28 3,547
Tax Shelter 19 660 1.00 679
29 We estimate that in 1988 nonfarm informal suppliers earned about $62 billion net income, of which about $6.8billion was earned by nonfilers. (See Appendix B for greater detail.) Our model estimates that about $5.6 billionwas associated with securable “returns.” The income tax on this amount is therefore included in RTAX. Tax on theremaining $1.262 billion of nonfiler nonfarm informal supplier income is calculated by the model for inclusion inUTAX.

Individual Income Tax Gap Estimates for 1985, 1988, and 1992: Appendix A page 37
TABLE A3TY 1988 Nonfiler UTAX Estimates
Tax Gap Component NetMisreported
Amount($millions)
Marginal Tax
Rate
UTAXEstimate
($millions)
Wage Income 1,575 0.20444 322
Interest Income 460 0.14977 69
Dividends 303 0.14481 44
State Income Tax Refunds 20 0.13325 3
Alimony Income 7 0.14654 1
Capital Gains 2,711 0.25446 690
Form 4797 Income 200 0.15724 31
Pensions & Annuities 1,676 0.20003 335
Farm Income 2,232 0.10017 224
Informal Supplier Income 1,262 0.18018 227
Nonfarm Proprietor Income 17,617 0.11987 2,112
Partnership & SBC Income 803 0.22074 177
Rents & Royalties 1,179 0.24725 292
Other Income 4,226 0.24440 1,033
Unemployment Compensation 183 0.14241 26
Social Security Benefits 36 0.16546 6
Adjustments 67 0.16403 11
Deductions 1,347 0.23137 312
Exemptions 1,366 0.20034 274
Tax Credits 244 1.00000 244
TOTAL UTAX n.a. n.a. 6,433

page 38 Individual Income Tax Gap Estimates for 1985, 1988, and 1992: Appendix A
5. TY 1992 Nonfiling Gap Projection
Since the TCMP nonfiler survey data are available only for TY 198830, we requiremethods to project the nonfiling gap estimates for the years beyond TY 1988.
Reported taxes after credit for filers (RTF) was selected as a projection basis for nonfilerRTAX and PREPAY. The estimated underreporting gap for filers (UGF) was selected as aprojection basis for nonfiler UTAX. For each income/offset item, holding filers' noncompliancerate constant over time, the growth factor of the underreporting gap for filers is likely to beidentical for each income item to the growth factor of the UTAX for nonfilers.
The TY 1988 RTF and UGF estimates are generated from the IRS tax model based on theTCMP III-10 survey data. The TY 1992 RTF and UGF projections are obtained from the IRScompliance projection model based on the Statistics of Income (SOI) data on reported incomes.
Table A4 presents RTAX and PREPAY projections for TY 1992.
Table A4TY 1992 Nonfiler RTAX And PREPAY Projections
Reported Taxes AfterCredits For Filers
($ millions)
ProjectionFactor
RTAX($ millions)
PREPAY($ millions)
TY 1988 TY 1992 TY 1988 TY 1992 TY 1988 TY 1992
392,576 465,417 1.1855 16,937 20,079 12,206 14,470
30 TCMP Phase IX, Cycle 1 nonfiler survey was conducted using TY 1979 data. But it was limited to projectionsof nonfilers based on IRP documents received by IRS and could not be used, therefore, for comprehensive nonfilertax gap estimates.

Individual Income Tax Gap Estimates for 1985, 1988, and 1992: Appendix A page 39
Table A5 presents nonfiler UTAX projections for TY 1992.
Table A5TY 1992 Nonfiler UTAX Projections
Tax Gap Component FilerUnderreporting Gap
($millions)
ProjectionFactor
NonfilerUTAX
($millions)TY 1988 TY 1992 TY 1988 TY 1992
Wage Income 2,685 3,174 1.18212 322 381
Interest Income 1,107 938 0.84734 69 58
Dividends 1,318 1,299 0.98558 44 43
State Income Tax Refunds 15 15 1.00000 3 3
Alimony Income 88 84 0.95455 1 1
Capital Gains 3,296 2,512 0.76214 690 526
Form 4797 Income 572 718 1.25524 31 39
Pensions & Annuities 1,422 1,842 1.29536 335 434
Farm Income 1,721 3,405 1.96281 224 443
Informal Supplier Income 10,762 12,282 1.14124 227 259
Nonfarm Proprietor Income 14,378 16,862 1.17276 2,112 2,477
Partnership & SBC Income 2,427 3,606 1.48578 177 263
Rents & Royalties 1,981 3,737 1.88642 292 551
Other Income 5,049 7,587 1.50267 1,033 1,552
Unemployment Compensation 138 343 2.48551 26 65
Social Security Benefits 122 179 1.46721 6 9
Adjustments 162 202 1.24691 11 14
Deductions 4,312 5,109 1.18483 312 370
Exemptions 2,686 2,923 1.08824 274 298
Tax Credits 4,117 6,213 1.50911 244 368
TOTAL n.a. n.a. n.a. 6,433 8,154

page 40 Individual Income Tax Gap Estimates for 1985, 1988, and 1992: Appendix A
The higher nonfiling gap projections for tax year 1992 are calculated, in millions of dollars,as follows:
NFGAP = RTAX + UTAX - PREPAY 13,763 = 20,079 + 8,154 - 14,470
Applying the ratio of the lower estimate to the higher estimate for TY 1988 to the TY 1992projection of UTAX, gives us a lower projection of $7,909 million; the lower projection ofNFGAP is, therefore, $13,518 million.

Individual Income Tax Gap Estimates for 1985, 1988, and 1992: Appendix B page 41
APPENDIX B
Underreporting Gap Estimation And Projection
This Appendix presents the data and methods used for estimating and projecting the individualincome tax underreporting gap. Section 1 outlines the general framework. Section 2 discusses theestimation method for the TY 1988 underreporting gap. Section 3 describes the method forprojecting the TY 1992 underreporting gap.
1. General Framework
The methods for generating the underreporting tax gap estimates of this report areidentical to those used for IRS's last income tax gap report [IRS 1988a]. The computer modelsdeveloped for the previous estimates were used without modification for the current estimates. These methods and models were described in detail in our 1988 report and supportingdocuments.31 Accordingly, this appendix contains only brief summaries of the methods.
The underreporting tax gap estimates published in 1988 were derived by applying themethods described in the 1988 appendices to TY 1979 and TY 1982 TCMP data. For thisreport, we applied our methods to 1985 and 1988 TCMP data, the latest available. (Theestimates for TY 1987 were made by linear interpolation of voluntary reporting percentagesbetween 1985 and 1988, for each income item and for deductions, adjustments, credits, andexemptions separately.) The projections for TY 1992 were made by assuming that the voluntaryreporting percentages for each tax return line item remain constant at the TY 1988 levels; thesepercentages are applied to the actual Statistics of Income (SOI) amounts reported for each item in1992. The marginal tax rates applied to projections of understated income and overstated offsetswere calculated by the models. The tax rate calculation reflects the Omnibus BudgetReconciliation Act of 1990.
A. TCMP Survey Data
The TCMP Phase III, Cycle 10 survey gathered data on a national stratified sample ofapproximately 54,000 individual income tax returns randomly drawn from a population ofapproximately 104 million timely filed returns for TY 1988. The 1985 TCMP (Phase III,Cycle-9) gathered data on about 49,000 returns, representing 99 million timely filed returns.
TCMP examiners review all entries on the returns in light of the taxpayers' records andother available information. These intensive line-by-line examinations reveal misreporting ofincome and offsets. Using weights equal to the reciprocals of the probabilities of selection for thereturns in the sample, estimates of aggregate misreporting by the entire population of tax returnfilers can be obtained. 31 The primary sources of information are IRS income tax compliance research publications (IRS [1988a,b]) andICF Incorporated’s IRS tax model user guides (ICF [1988a,b]).

page 42 Individual Income Tax Gap Estimates for 1985, 1988, and 1992:Appendix B
B. Special Survey Data
Data from special IRS-sponsored surveys were used to develop underreporting gapestimates for tip income and informal supplier income. The special survey data wereextrapolated to tax years for which TCMP surveys were conducted and then imputed toindividual records by the IRS tax gap model in order to generate underreporting gap estimates fortip income and informal supplier income.32
C. IRS Tax Gap Model
The IRS tax gap model consists of two components. The tax imputation model providesestimates for reported amounts, net misreported amounts, and marginal tax rates for all incomeand offset line items on individual returns for TCMP years. The tax compliance model providesunderreporting gap estimates and voluntary reporting percentages for tax years 1976-1988.
Multiplier-Augmented Underreported Income
Since TCMP data understate reporting noncompliance to the extent TCMP examinationsdo not detect all underreported income, the tax model augments the TCMP data with estimates ofunderreported income not detected by TCMP.
These estimates of additional undetected income are based on an IRS study of a sub-sample of the TY 1976 TCMP survey of individual timely filed returns. The study found that,on average, for every dollar of underreported income detected by TCMP examiners without theaid of the Information Reporting Program (IRP) documents, another $2.28 went undetected. As aresult, the model uses a "multiplier" of 3.28 to expand the aggregate amounts of underreportedincome detected in TCMP without the aid of IRP documents. (There are several modifications tothis procedure for particular income items, especially business income.)
32 The underreported tip income estimates are based on consumer surveys conducted by the Survey ResearchLaboratory of the University of Illinois (see Pearl [1985a,b]). The underreported informal supplier income estimatesare based on consumer surveys conducted by the Survey Research Center of the University of Michigan (see Smithand Adams [1987]).

Individual Income Tax Gap Estimates for 1985, 1988, and 1992: Appendix B page 43
The tax model calculates multiplier-augmented underreported amounts for each incometype and imputes unreported income of each type to particular returns through a "hot-deck"statistical matching procedure. For each income type, the model calibrates the total imputedunderreported amounts so that the weighted sum over all returns is exactly equal to the estimatedaggregate multiplier-augmented underreported amount.33
TCMP-Detected Overstated Offsets
For all offset items, TCMP-detected overstated amounts are considered accurate becausein a TCMP audit the examiner can request substantiation for claimed offsets.
Average Marginal Tax Rate
For each tax return, the tax model recalculates the total tax liability including the additionaltax due on the imputed underreported income. The difference between the tax liability reportedon the return as filed and this augmented tax liability (tax deficiency) is assigned to themisreported line items on the return in proportion to their multiplier-augmented net misreportedamounts. For each line item, the model aggregates (across all returns) all multiplier-augmented netmisreported amounts and tax deficiencies. The ratio of aggregate tax deficiency to aggregatemisreporting is the estimate of the average marginal tax rate for the item.
2. TY 1988 Underreporting Gap Estimation
For this report, we prepared new estimates of the underreporting gap for TY 1985 and1988, based on new TCMP data for those years and on projections of our 1981 and 1985informal supplier survey data. Since the methods are identical for the 1985 and 1988 estimates,we show details of the intermediate results only for 1988 in this section. However, the detailedfinal results are shown for both 1985 and 1988, as well as the projections for 1992, in Section 4of this appendix.
A. Underreported Informal Supplier Income
Informal suppliers (IS) are individuals who provide products or services through informalarrangements which frequently involve cash-related transactions or "off the books" accountingpractice. Child-care providers, street-side vendors, and moonlighting professionals are among thistype of nonfarm sole proprietor.
33 The methodology described above corresponds to the procedures used to develop the “higher” estimates presentedin the tax gap report. These “higher” estimates do not reflect that some of the adjustments made in theexaminations are conceded after all appeals and litigation have been completed.

page 44 Individual Income Tax Gap Estimates for 1985, 1988, and 1992:Appendix B
The underreported IS income estimates are based on two sources. The Michigan surveyprovides the estimates for what should have been reported for TY 1988 by informal suppliers.34
The IRS tax model estimated the amount of reported Schedule C income for TY 1988 filers in theTCMP data who were likely to have been informal suppliers.
Michigan Survey Estimated Income
The primary approach taken in the Michigan survey was to measure the value ofpurchases households made from informal suppliers. The survey estimated the amount of incomepaid to informal suppliers by consumers during 1981 and 1985. These estimates represent totalgross receipts received by informal suppliers.35
Based on the Michigan survey results, the model estimated the gross income of informalsuppliers by subtracting the earnings of domestic employees from, and adding the sales tobusinesses to, total gross receipts.36 Based on a previous IRS study [IRS 1988b], the net incomeof informal suppliers accounts for 51 percent of their gross income. The model then estimatedinformal supplier income by adding barter income to net income.37
34 The Michigan survey provides informal supplier income estimates for 1981 and 1985. These estimates wereextrapolated to three TCMP years: 1982; 1985; and 1988.
35 Total informal supplier gross receipts were estimated to be $56.7 billion in 1981 and $72.4 billion in 1985.
36 Total informal supplier gross income was estimated to be $76.7 billion in 1981 and $93.1 billion in 1985.
37 IRS estimated that informal supplier barter income in 1985 was $6.3 billion. The TY 1988 barter income wasestimated to be the same proportion of gross informal supplier income as it was in 1985.

Individual Income Tax Gap Estimates for 1985, 1988, and 1992: Appendix B page 45
Table B1 presents informal supplier income estimates for tax year 1988 based on theMichigan survey results and the IRS adjustment process described above.
TABLE B1Survey-Based Informal Supplier Income Estimates
Tax Year 1988($ millions)
Income Formulation Amount
Gross Income (GI) 107,551
Net Income (NI) 54,851
Barter Income (BI) 7,298
Informal Supplier Income (SI = NI + BI) 62,149
TCMP Survey Reported Amount
Through a correlation of occupation code, industry code, income, and business expenses,certain Schedule C filers within the TCMP data were classified as likely to have been informalsuppliers.38 Reported informal supplier income includes amounts originally reported on thereturn that meet the selection criteria, plus, any reported income reclassified by the examinerswhich also meets these criteria.39
Double-Counting Adjustments
The underreported business income identified in the TCMP cases described above,weighted up to a population estimate, is "backed out" of our estimate of unreported nonfarmproprietor income, to avoid double counting informal supplier unreported income. The estimatefor TY 1988 is $2.3 billion: $1 billion of understated gross receipts and $1.3 billion of overstatedbusiness expenses.
38 A TCMP taxpayer was considered to be an informal supplier if he/she had income which appeared to be from anoccupation covered by the Michigan survey, and did not report any of the business expenses which formal businessactivities typically incur, such as taxes, rent, insurance, pension or employee benefit plan contributions, legal feesand bad debts.
39 Filers may report the proper amount of nonfarm business income, but on the wrong line of the return. Forexample, some taxpayers reported self-employment income as wages. In this instance, the TCMP examinersreclassified the income to Schedule C to reflect gross receipts properly.

page 46 Individual Income Tax Gap Estimates for 1985, 1988, and 1992:Appendix B
Some informal suppliers do not file required income tax returns. Since the University ofMichigan data do not differentiate between purchases from nonfiler informal suppliers and otherinformal suppliers, our estimates of informal supplier underreporting must be reduced by anestimate of the business income of informal supplier nonfilers. We assume that nonfiler informalsupplier income is 10.98 percent of total informal supplier income.40 (This assumption, whichwas based on very weak information, was quite critical in IRS’s 1988 estimates. The nonfilerportion of the tax gap estimate was based on the Bureau of the Census’s “exact match” publicuse files. In this report, the nonfiler and filer estimates are obtained from similar methods appliedto similar data. And, it turns out that the marginal tax rates for informal supplier income derivedfrom these methods are very similar for filers and nonfilers. Therefore, the assumed division ofinformal supplier net income between filers and nonfilers does not dramatically affect theestimate of the total tax gap associated with this type of income.)
Underreported Amount
Table B2 presents the estimates of survey-based income, the nonfiler portion of ISincome, the TCMP based reported income, and the underreported income for TY 1988. Theestimate of underreported income appears in Table B4.
TABLE B2Underreported Informal Supplier Income Estimates
Tax Year 1988($ millions)
Income Formulation Amount
Survey Based Income (SI) 62,149
Nonfiler Portion Income (NF) 6,824
TCMP Reported Income (RI) 6,392
Underreported Income (UI= SI-NF-RI) 48,933
40 This is the percentage used for this purpose in our 1988 report for tax years 1985 and 1982. See InternalRevenue Service (1988b), p. A51.

Individual Income Tax Gap Estimates for 1985, 1988, and 1992: Appendix B page 47
B. Multiplier-Expanded Underreported Income
Table B3 presents the multiplier-expanded underreported income estimates for all incomeitems except nonfarm informal supplier income, whose estimates were presented in Table B2.
C. Underreporting Gap
Table B4 presents the net misreported amount, marginal tax rate, and underreporting gapestimates for each income and offset item. Note that the misreported amounts of offset itemsrepresent the TCMP-detected overstated offsets. It also presents TY 1988 math error estimates.

page 48 Individual Income Tax Gap Estimates for 1985, 1988, and 1992:Appendix B
TABLE B3TY 1988 Multiplier-Expanded Underreported Income Estimates
Income Item IRPDetected
($millions)
Non-IRPDetected
($millions)
EffectiveMultiplier
UnderreportedIncome
($millions)Wage Income 19,880
Wages & Salaries 1,801 1,970 3.28 8,263
Tips n.a. n.a. n.a. 11,617
Interest Income 1,963 663 3.28 4,138
Dividends 4,218 565 3.28 6,071
State Income Tax Refunds 91 0 1.00 91
Alimony Income 46 93 3.28 350
Capital Gains 12,215
Overstated Basis 0 6,920 1.00 6,920
Other 5,188 33 3.28 5,295
Form 4797 Income 1,371 478 3.28 2,938
Pensions & Annuities 1,236 1,564 3.28 6,366
Farm Income 8,698
Understated Income 254 1,936 2.40 4,899
Overstated Expenses 0 3,799 1.00 3,799
Nonfarm Proprietor Income 61,024
Understated Income 1,234 17,735 2.40 43,800
Overstated Expenses 0 17,224 1.00 17,224
Partnership & SBC Income 11,596
Understated Income 48 3,104 3.28 10,230
Overstated Expenses 0 1,366 1.00 1,366
Rents & Royalties 9,433
Understated Income 345 1,433 2.27 3,597
Overstated Expenses 0 5,836 1.00 5,836
Other Income 23,545
Non Tax Shelter 4,337 4,246 3.28 18,263
Tax Shelter 2,669 2,613 1.00 5,282UnemploymentCompensation
809 14 3.28 855
Social Security Benefits 403 204 1.00 607

Individual Income Tax Gap Estimates for 1985, 1988, and 1992: Appendix B page 49
TABLE B4TY 1988 Underreporting Gap Estimates
Tax Gap Component Net MisreportedAmount
($ millions)
MarginalTax Rate
UnderreportingGap
($ millions)
Wage Income 19,880 0.13508 2,685Interest Income 4,138 0.26746 1,107Dividends 6,071 0.21710 1,318State Income Tax Refunds 91 0.16761 15Alimony Income 350 0.24982 88Capital Gains 12,215 0.26983 3,296Form 4797 Income 2,938 0.19483 572Pensions & Annuities 6,366 0.22337 1,422Farm Income 8,698 0.19784 1,721Informal Supplier Income 48,933 0.21994 10,762Nonfarm Proprietor Income 61,024 0.23562 14,378Partnership & SBC Income 11,596 0.20932 2,427Rents & Royalties 9,433 0.21004 1,981Estates & Trusts 0 n.a. 0Other Income 23,545 0.21443 5,049Unemployment Compensation 855 0.16099 138Social Security Benefits 607 0.20078 122Adjustments 522 0.31033 162Deductions 16,352 0.26371 4,312Exemptions 17,660 0.15208 2,686Tax Credits 4,117 1.00000 4,117Net Math Errors n.a. n.a. 167TOTAL n.a. n.a. 58,517

page 50 Individual Income Tax Gap Estimates for 1985, 1988, and 1992:Appendix B
3. TY 1992 Underreporting Gap Projections
The model calculates reported amounts for years after the last available TCMP based onthe Statistics of Income (SOI) data on reported incomes and offsets for those years for whichSOI data are available.41 Assuming that compliance rates for every line item have remained at thelevels estimated for the last TCMP year, the model provides projections of net misreportedamounts.
To reflect the changes in income tax rates enacted in the Omnibus Budget ReconciliationAct of 1990, we estimated marginal tax rates using 1991 individual income tax tables and 1988TCMP filer data.
Underreporting gap estimates by line item are derived by multiplication of the marginaltax rates and the projected misreported amounts. Table B5 presents the TY 1992 projections fornet misreported amounts, marginal tax rates, and underreporting gap estimates. It also presentsTY 1992 projected math errors.
41 In general, SOI estimates differ from those reported in TCMP for years where TCMP data are available. Theprimary reason for this is that SOI is based on a different sample of returns than is TCMP. In addition, the SOI datainclude certain adjustments which are not included in TCMP. In order to make these data comparable, the taxcompliance model adjusts the SOI data to reflect TCMP estimates of reported incomes and offsets.

Individual Income Tax Gap Estimates for 1985, 1988, and 1992: Appendix B page 51
TABLE B5TY 1992 Underreporting Gap Projections
Tax Gap Component NetMisreported
Amount($ millions)
MarginalTax Rate
UnderreportingGap
($ millions)
Wage Income 23,993 0.13230 3,174Interest Income 3,592 0.26104 938Dividends 6,071 0.21394 1,299State Income Tax Refunds 91 0.16761 15Alimony Income 350 0.24126 84Capital Gains 9,399 0.26735 2,512Form 4797 Income 3,877 0.18512 718Pensions & Annuities 8,566 0.21502 1,842Farm Income 17,961 0.18960 3,405Informal Supplier Income 59,620 0.20604 12,282Nonfarm Proprietor Income 74,415 0.22667 16,862Partnership & SBC Income 17,239 0.20923 3,606Rents & Royalties 19,441 0.19229 3,737Other Income 35,938 0.21112 7,587Unemployment Compensation 2,310 0.14873 343Social Security Benefits 979 0.18245 179Adjustments 655 0.30856 202Deductions 19,910 0.25669 5,109Exemptions 21,443 0.13632 2,923Tax Credits 6,213 1.00000 6,213
Net Math Errors n.a. n.a. 59TOTAL n.a. n.a. 73,089

page 52 Individual Income Tax Gap Estimates for 1985, 1988, and 1992:Appendix B
4. Lower Underreporting Gap Estimates
The previous sections describe the methods by which our “higher” estimates of theunderreporting gap were made. To a major extent, these estimates are based on the findings ofthe IRS examiners who reviewed the TCMP tax returns. Our “lower” estimates are intended toreflect the likely amounts by which the examiners’ recommended tax deficiencies would havebeen reduced after all appeals and litigation concerning the cases were concluded. The concept ofthe lower estimates is discussed in IRS [1990a], pp. 13-15.
The lower estimates are derived by multiplying the higher estimates of the components ofthe underreporting gap by .97 and summing the results. The derivation of this factor is alsodiscussed in IRS [1990a]. This is done for every component except those for which theestimates are made without the use of examination results--informal suppliers, tip income(included in wages and salaries), and math errors. The same factor is used for every year.
Tables B6, B7, and B8 display the final higher and lower estimates of the underreportinggap and the components for TYs 1985, 1988, and 1992 respectively.

Individual Income Tax Gap Estimates for 1985, 1988, and 1992: Appendix B page 53
TABLE B6Range of Estimates of the Underreporting Tax Gap by Specific Items
(Net Misreporting Amounts and Net Misreporting Percentages)Tax Year 1985
Tax Gap Component UnderreportingTax Gap
($ billions)
Net MisreportedAmount
($ billions)
Net MisreportingPercentage
Low High Low High Low High
TOTAL UNDERREPORTING GAP 52.2 53.5 194.8 199.3 n.a. n.a.
UNDERREPORTED INCOME 43.6 44.6 163.2 166.7 n.a. n.a.
Non-Business Income 15.6 15.9 53.6 55.0 2.2 2.4
Wage Income 2.2 2.2 11.0 11.1 0.6 0.6
Interest Income 1.1 1.1 4.3 4.4 2.4 2.5
Dividends 1.6 1.6 5.0 5.1 9.6 9.9
State Tax Refunds 0.1 0.1 0.4 0.4 4.5 4.6
Alimony Income 0.1 0.1 0.2 0.2 5.9 6.1
Pensions & Annuities 0.5 0.5 2.3 2.4 2.2 2.3
Unemployment Compensation 0.2 0.2 1.3 1.4 16.4 16.9
Social Security Benefits 0.1 0.1 0.5 0.5 4.9 5.0
Capital Gains 3.5 3.6 9.8 10.1 13.4 13.8
Form 4797 Income 0.5 0.5 1.7 1.8 21.8 22.5
Other Income 5.7 5.9 17.0 17.4 36.1 37.2
Business Income 28.0 28.7 109.6 111.7 29.8 30.4
Nonfarm Proprietor Income 13.0 13.4 48.6 50.1 33.9 35.0
Informal Supplier income 10.6 10.6 40.5 40.5 72.8 72.8
Farm Income 1.8 1.9 8.2 8.4 30.4 31.3
Rents & Royalties 1.9 2.0 8.7 9.0 16.5 17.0
Estate and Trust Income <0.05 <0.05 0.1 0.1 1.7 1.8
Partnership & SBC Income 0.8 0.8 3.5 3.6 2.5 2.6
OFFSETS TO INCOME 6.6 6.7 29.4 30.3 4.3 4.4
Adjustments 0.7 0.7 3.5 3.6 3.9 4.0
Deductions 4.3 4.4 15.1 15.5 4.1 4.2
Exemptions 1.6 1.6 10.8 11.2 4.7 4.8
TAX CREDITS 2.2 2.3 2.2 2.3 25.4 26.2
NET MATH ERRORS -0.2 -0.2 n.a. n.a. n.a. n.a.

page 54 Individual Income Tax Gap Estimates for 1985, 1988, and 1992:Appendix B
TABLE B7Range of Estimates of the Underreporting Tax Gap by Specific Items
(Net Misreporting Amounts and Net Misreporting Percentages)Tax Year 1988
Tax Gap Component UnderreportingTax Gap
($ billions)
Net MisreportedAmount
($ billions)
Net MisreportingPercentage
Low High Low High Low High
TOTAL UNDERREPORTING GAP 57.1 58.5 249.5 255.4 n.a. n.a.
UNDERREPORTED INCOME 46.0 47.1 212.0 216.7 n.a. n.a.
Non-Business Income 15.4 15.8 75.0 77.1 2.5 2.6
Wage Income 2.6 2.7 19.6 19.9 0.9 0.9
Interest Income 1.1 1.1 4.0 4.1 2.2 2.3
Dividends 1.3 1.3 5.9 6.1 7.6 7.8
State Tax Refunds <0.05 <0.05 0.1 0.1 0.8 0.8
Alimony Income 0.1 0.1 0.3 0.4 13.0 13.3
Pensions & Annuities 1.4 1.4 6.2 6.4 3.9 4.0
Unemployment Compensation 0.1 0.1 0.8 0.9 6.7 6.9
Social Security Benefits 0.1 0.1 0.6 0.6 4.1 4.2
Capital Gains 3.1 3.2 11.8 12.2 6.9 7.2
Form 4797 Income 0.6 0.6 2.8 2.9 27.1 28.0
Other Income 4.9 5.1 22.8 23.5 24.2 24.9
Business Income 30.6 31.3 137.0 139.6 29.4 30.0
Nonfarm Proprietor Income 13.9 14.4 59.2 61.0 31.3 32.3
Informal Supplier Income 10.8 10.8 48.9 48.9 81.4 81.4
Farm Income 1.7 1.7 8.4 8.7 31.3 32.2
Rents & Royalties 1.9 2.0 9.2 9.4 16.6 17.2
Estate and Trust Income <0.05 <0.05 <0.05 <0.05 <0.05 <0.05
Partnership & SBC Income 2.3 2.4 11.3 11.6 7.2 7.5
OFFSETS TO INCOME 6.9 7.2 33.5 34.6 4.3 4.4
Adjustments 0.2 0.2 0.5 0.5 1.9 2.0
Deductions 4.2 4.3 15.9 16.4 4.3 4.4
Exemptions 2.6 2.7 17.1 17.7 4.4 4.5
TAX CREDITS 4.0 4.1 4.0 4.1 38.9 40.2
NET MATH ERRORS 0.2 0.2 n.a. n.a. n.a. n.a.

Individual Income Tax Gap Estimates for 1985, 1988, and 1992: Appendix B page 55
TABLE B8Range of Estimates of the Underreporting Gross Tax Gap by Specific Items
(Net Misreported Amounts and Net Misreporting Percentages)Tax Year 1992
Tax Gap Component UnderreportingTax Gap
($ billions)
Net MisreportedAmount
($billions)
Net MisreportingPercentage
Low High Low High Low High
TOTAL UNDERREPORTING GAP 71.3 73.1 323.7 331.9 n.a. n.a.
UNDERREPORTED INCOME 57.2 58.6 277.0 283.7 n.a. n.a.
Non-Business Income 18.1 18.7 92.3 95.2 2.5 2.6
Wage Income 3.1 3.2 23.3 24.0 0.9 0.9
Interest Income 0.9 0.9 3.5 3.6 2.2 2.3
Dividends 1.3 1.3 5.9 6.1 7.6 7.8
State Tax Refunds <0.05 <0.05 0.1 0.1 0.8 0.8
Alimony Income 0.1 0.1 0.3 0.3 13.0 13.3
Pensions & Annuities 1.7 1.8 8.3 8.6 3.9 4.0
Unemployment Compensation 0.3 0.3 2.2 2.3 6.7 6.9
Social Security Benefits 0.2 0.2 1.0 1.0 4.1 4.2
Capital Gains 2.4 2.5 9.1 9.4 6.9 7.2
Form 4797 Income 0.7 0.7 3.8 3.9 27.1 28.0
Other Income 7.4 7.6 34.8 35.9 24.1 24.9
Business Income 39.1 39.9 184.7 188.5 29.4 30.0
Nonfarm Proprietor Income 16.4 16.9 72.2 74.4 31.3 32.3
Informal Supplier Income 12.3 12.3 59.6 59.6 81.4 81.4
Farm Income 3.3 3.4 17.4 17.9 31.3 32.2
Rents & Royalties 3.6 3.7 18.8 19.4 16.6 17.2
Estate and Trust Income <0.05 <0.05 <0.05 <0.05 <0.05 <0.05
Partnership & SBC Income 3.5 3.6 16.7 17.2 7.2 7.5
OFFSETS TO INCOME 8.0 8.2 40.7 42.0 4.3 4.4
Adjustments 0.2 0.2 0.7 0.7 1.9 2.0
Deductions 5.0 5.1 19.3 19.9 4.3 4.4
Exemptions 2.8 2.9 20.7 21.4 4.4 4.5
TAX CREDITS 6.0 6.2 6.0 6.2 38.9 40.2
NET MATH ERRORS 0.1 0.1 n.a. n.a. n.a. n.a.


Individual Income Tax Gap Estimates for 1985, 1988, and 1992: Appendix C page 57
APPENDIX C
Underpayment Gap Estimation And Projection
This Appendix presents the data and methods used for estimating and projecting theindividual income tax underpayment gap. Section 1 outlines the general framework. Section 2discusses the estimating method for the TY 1988 underpayment gap. Section 3 describes themethod by which we projected the TY 1992 underpayment gap.
1. General Framework
The underpayment gap component includes reported tax balances due that are notremitted when individuals file their income tax returns. It applies only to individual income taxfilers (Form 1040) and reflects situations in which taxpayers file income tax returns with abalance due, but fail to remit the full amount due.
Our estimates of underpayment by individuals are based on extracts from the IndividualMaster File (IMF) of balances due after remittance for Forms 1040. The extracts show thebalances due reported on returns and remittances made at the time of filing.
2. Underpayment Gap Estimation
The balance due after remittance (BDAR) is the aggregate of the insufficient remittancesby individuals shown in the IMF extracts. The BDAR estimates based on the IMF extractstudies are available for tax years 1982, 1983, 1987, 1988, and 1989. The BDAR estimates forTYs 1984-1986 in Table C1 are based on the interpolation of TYs 1982-1983 and 1987-1989.
TABLE C1Balance Due After Remittance Estimates
Tax Years 1982-1989
Tax YearAmount
($ millions)1982 4,179
1983 4,444
1984 6,069
1985 7,046
1986 8,024
1987 10,088
1988 11,243
1989 9,187

Page 58 Individual Income Tax Gap Estimates for 1985, 1988, and 1992: Appendix C
3. Underpayment Gap Projection
STEP 1: Balance Due Underpayment Ratio
The ratio of balance due after remittance (BDAR) to balance due (BD) represents thebalance due underpayment ratio (BDUR). The BDUR is calculated by the following formula:
[1] BDURt = BDARt /BDt t = 1982,....1989
Table C2 presents the BDUR estimates for Tax years 1982-1989. The balance dueamounts are Statistics of Income estimates. The Balance Due After Remittance figures are fromTable C1.
TABLE C2Balance Due Underpayment Ratio
Tax Years 1982-1989
Tax YearBalance Due
($ millions)
Balance DueAfter Remittance
($ millions)
Balance DueUnderpayment
Ratio
1982 29,053 4,179 0.1438
1983 28,436 4,444 0.1563
1984 36,737 6,069 0.1652
1985 39,091 7,046 0.1802
1986 53,819 8,024 0.1491
1987 49,921 10,088 0.2021
1988 61,508 11,243 0.1828
1989 60,157 9,187 0.1527
AVERAGE n.a. n.a. 0.1665

Individual Income Tax Gap Estimates for 1985, 1988, and 1992: Appendix C page 59
STEP 2: Projected Balance Due After Remittance
The projected balance due after remittance (BDAR^) for tax years 1990-1992 can beobtained by the following formula:
[2] BDAR^t = BDt * AVGBDUR t= 1990,...1992
AVGBDUR = average BDUR for tax years 1982-1989
Table C3 presents these BDAR projections for tax years 1990-1992. The Balance Duefigures are Statistics of Income estimates. The Average Balance Due Underpayment Ratio isfrom Table C2.
TABLE C3Balance Due After Remittance Projections
Tax Years 1990-1992
Tax YearBalance Due
($ millions)
AverageBalance Due
Underpayment Ratio
Balance DueAfter Remittance
($ millions)
1990 56,561 0.1665 9,417
1991 53,046 0.1665 8,832
1992 50,411 0.1665 8,393
Table C4 presents the underpayment gap estimates for tax years 1985, 1988, and 1992.
TABLE C4Underpayment Gap EstimatesTax Years 1985, 1988, and 1992
Tax YearAmount
($ millions)1985 7,046
1988 11,243
1992 8,393


Individual Income Tax Gap Estimates for 1985, 1988, and 1992 page 61
REFERENCES
Erard, B. and Ho C., (1995), " Searching for Ghosts: Who Are the Nonfilers and How Much TaxDo They Owe? " Unpublished paper presented at the Allied Social Science AssociationsMeetings (Washington, D.C.), at the University of Michigan Tax Policy Research Symposium(Ann Arbor, Michigan), and at the IRS Quantitative Analyst Symposium (San Jose, California).
Ho, C. and Wong W., (1994), "Alternative Imputation Techniques for the Proportions of IncomeVariables for IRS Compliance Modeling," 1994 American Statistical Association Proceedings onSurvey Research Methods, (Toronto, Canada), American Statistical Association (8-94).
Ho, C. and Wong W., (1995), "Measuring Modeling Error and Variances for IRS IncomeProportions Using Balanced Bootstrap and Multiple Imputation," 1995 Proceedings of theInternational Conference on Survey Measurement and Process Quality, (Bristol, England), RoyalStatistical Society (4-95).
Ho, C., (1994),"Reporting Noncompliance Evidence from Timely Filed and Secured DelinquentReturns," The IRS Research Bulletin 1993/1994, IRS Publication 1500 (9-94).
Internal Revenue Service, (1988a), Income Tax Compliance Research: Gross Tax Gap EstimatesAnd Projections for 1973-1992, IRS Publication 7285 (3-88).
Internal Revenue Service, (1988b), Income Tax Compliance Research: Supporting Appendices toPublication 7285, IRS Publication 1415 (7-88).
Internal Revenue Service, (1990a), Income Tax Compliance Research: Net Tax Gap andRemittance Gap Estimates (Supplement to Publication 7285), IRS Publication 1415 (4-90).
Internal Revenue Service, (1990b), Evaluation of the IRS System of Projecting EnforcementRevenue (1990 Update), IRS Publication 1415 (4-90).
ICF, (1988a), The IRS TCMP Tax Model Users Guide, ICF Incorporated (7-88).
ICF, (1988b), The IRS Taxpayer Compliance Model Users Guide, ICF Incorporated (7-88).
Pearl, R., (1985a), Tipping in Restaurants and Other Eating Places: 1984, Survey ResearchLaboratory, the University of Illinois (6-85).
Pearl, R., (1985b), Tipping for Services Other Than Those in Restaurants and Other EatingPlaces: 1984, Survey Research Laboratory, the University of Illinois (9-85).
Smith, J. and Adams, T., (1987), The Measurement of Selected Income Flows in InformalMarkets, 1981 and 1985-1986, Survey Research Center, the University of Michigan (4-87).