femise research programme
TRANSCRIPT

Estimates of Total Factor Productivity and Capital
Stock for 3-digit ISIC Manufacturing Sectors in Iran
and Egypt
F E M I S E R E S E A R C H P R O G R A M M E
This text has been drafted with financial assistance from the Commission of the European Communities. The viewsexpressed herein are those of the authors and therefore in no way reflect the offical opinion of the Commission
H a m i d M o h t a d iU n i v e r s i t y o f M i n n e s o t a a n d Wi s c o n s i n - M i l w a u k e e
January 2001

E stimate s of Capital Stoc k for 3-digit ISIC Manufac turing Se c tor inE gypt: 1964-1995*.
H amid M ohtadi**
U nive rs ity of M inne s ota and W is c onsin-M ilwa uke e
Lobna A bdel-La tif***
C airo U nivers ity, Egypt
Pei-C hie n Lin&
U nive rs ity of M inne s ota
June 2000R evis ed January 2001
*Ea rlie r vers ions of this paper we re pres ented a t the Fe brua ry 2000 me etingsof FEMISE confe re nc e in Marse ille, France a nd Oc tober 2000 me etings of theERF c onferenc e in A mma n, Jordan. Tha nks are e xte nded to the pa rtic ipa nts of both confe re nc es for helpful c omme nts w hic h ha ve be en incorpora te d inthe pre s ent version. This res ea rch is one pa rt of a s tw o-s ta ged res e arch projec ton the “Cons truction of Databank on Capital Stoc k a nd Tota l Fac torProductivity” a t 3-D igit Industry Le vel for Se le c t numbe r of MENA C ountrie s. The work ha s benefite d from a financia l grant from the C ommiss ion of the Europe a n Communitie s within the c onte xt of the FEM ISEprogram, a s well as from Ec onomic Re s ea rc h Forum for the A ra b C ountrie s, Ira n and Turkey. The view s expre ss e d are those of the be ne fic ia rie s andthe re fore in no w ay re fle ct the view s of the C ommis sion or the Ec onomicR es ea rc h Forum.
**Proje c t Coordinator, A s sociate Profes sor of Ec onomics , ERF Re se arc hFellow. ***Proje ct C ollabora tor, As sista nt Profes sor.& Proje c t As s is ta nt

1
Est imat es of Ca pi ta l S to ck fo r 3-d ig i t IS ICM an uf act urin g S ecto r i n Egy pt : 19 64 - 19 95
1. Background
This pa per, which is the firs t part of a tw o-s ta ge proje ct, dea ls with
developing a da ta ba nk for capita l stock at 3-digit ISIC le ve ls for the
manufac turing indus tries in sele ct countrie s of the Middle Ea st and North
A fric a (MENA ), nota bly Egypt and Ira n covering the pe riod 1964-95 for
Egypt and 1983-97 for Ira n. Ca lcula tions are ba s ed both upon the UN ID O
c ountry da ta as well as loc al (in-country) data. The se cond stage involves
utilizing this da ta bank to cons truct systema tic estimate s of Tota l Fac tor
Productivity (TFP) in the se c ountrie s a nd industrie s.
C re ation of suc h a databa nk will ena ble both countrie s to addre ss ke y
polic y iss ue s tha t cannot be ade quate ly ans w ered now and is the re fore
beyond the sc ope of this pa pe r. For exa mple , capita l stock da ta are ne ede d
for estima tion purpose s in EU -M ENA trade polic y (e. g. , role of trade in
fac tor intens ity and ide ntifying sec tors with compa ra tive advanta ge ), or the
impac t of EU expa ns ion on the M EN A’s indus trial and la bor policies (e .g.,
s kill and ca pital subs titutability) and its ma cro polic ies (e .g., ec onomic
growth and converge nce hypothes is). Simila rly, TFP is key to
understa nding sourc e s of ec onomic growth and is espec ia lly re le va nt to
tec hnology and know ledge -ba se d polic ies , suc h as the impac t of
tec hnology on economic grow th, educa tion and tra ining of the workforce ,
role of trade with EU on te chnology diffusion to the MEN A re gion, export
promotion polic ie s and their s ec tora l produc tivity impac t, and the

2
productivity effe cts of Intelle c tual Property in differe nt se ctors, to me ntion
a few .
G rowth in the MEN A region has be en se ns itive to tre nds in TFP. A sha rp
dec line in the ra te of grow th of tota l fa ctor productivity (TFP) and low e r ra te s
of phys ica l capital ac cumulation are the mos t importa nt fa ctors explaining a
marke d slow-dow n of GD P growth rate in the MEN A region after mid-1980s
(Se nhadji, 1999). Both ca pita l acc umula tion and inc re a se d employme nt ha ve
c ontribute d signific antly to ec onomic growth in MEN A. For the 1960-94
period as a whole , capita l ac cumulation is estima te d to be the most significa nt
s ourc e of growth, follow e d by increa s ed employme nt and human ca pita l
forma tion, re spec tively. Even though M EN A’s rate of TFP growth dec lined
pre cipitously after 1974, and its growth ra te during 1987-1994 wa s estima te d
to be ne ga tive, TFP ha s contribute d c om parativ ely more to economic grow th
in MENA than in Africa and La tin Ame ric a, but le s s than that in South and
Eas t As ia. Compared to La tin Ame rica , Sub-Sa ha ra n Afric a , and to a les se r
e xtent South As ia , human ca pita l has be en a re la tively more importa nt sourc e
of grow th in MENA . Growth polic ies should se arch for the type of ec onomic
a nd ins titutional re forms c apable of inducing a highe r rate of incre as e in TFP.
This pa per be gins w ith a de ta ile d de s cription of the me thodology se c tion 2),
followe d by a des cription of ca pital stoc k estima tion (s ec tion 3), additional
obs erva tions (s ec tion 4), a nd c oncuding re marks (s ec tion 5). The a c tual
res ults are pre se nte d in the da ta ta ble s in the end.

3
2. Methodology
U NIDO and in-country are us ed to convert capita l stoc k data from gross
inves tme nt da ta . The me thod us e d is the PIM (Pe rpe tual Inve ntory
M ethod), outlined in OEC D (1992) with dis tribution func tion for life of
mac hina ry from Ba ll and W itzke (1993). B ec a us e more informa tion from
in-country source s are ne eded to suppla nt the UN IDO data , the pre se nt
proje ct de als with an initial se t of tw o countrie s, Ira n and Egypt for whic h
the UNID O da ta exis ts and contac ts with re giona l ERF fellow s have be e n
made. In Ira n, Dr. Ahmad J alali-N aini and in Egypt, Drs. Lobna A bdel-
Latif a nd Elia El-M ahdi a re contributing to the c a lc ula tion of c apita l stock.
T he PIM Me thod: PIM is know n as the Pe rpe tual Inve ntory Me thod
(PIM) and is thoroughly des cribe d by OECD (1992) as well as detaile d in
Sta tistics Ca na da (1979). The firs t ste p involve s adding up w eighte d s ums
of inve s tments (G ros s Ca pital Formation) ove r time, a s follow s:
Kt
i
Lwt iIt i=
= − −∑0
(L≤t)
where Kt is the real Gross stock of capital, L is service life of capital
(discussed below), It is the real Gross Capital Formation in time t, and wi
is the weight associated with the contribution of investments during the
period t-L to t.

4
Measuring wi: This weight is estimated differently by different OECD
countries, based on varying assumptions regarding the survival of
machinery after initial installation. One common assumption made by
some OECD members is that the machinery of the same kind are
withdrawn from service simultaneously when their service life L is
reaches. This approach, known as “Simultaneous Exit”, assumes a
mortality function that is in the form of step function:
w i =1 for i<L, and w i =0 for i≥ L.
Y et, the a ss umption of s imultane ously dis ca rding ma chine s se e ms
unrea lis tic. Thus , some OEC D me mbe rs assume a “Delayed Linear”
function where discarding begins sometime after initial installation but
occurs at a constant rate. Then wi will be uniformly distributed around L.
Still, other OECD countries assume a normal distribution of w i over time.
Comparing the resulting figures for Gross Capital Stock from these
varying assumptions, Statistics Canada (Koumanakos, 1980) and the
Norwegian Bureau of Statistics (Biorn, et. al., 1985) find the results to be
sensitive to the choice of mortality functions. Still, OECD analysts
conclude, “…the bell-shaped function is really the only plausible
candidate,” (OECD, 1992) and most OECD members use this function.
Given the prevalence of the bell shaped distribution, we adopt this
approach as well. However, since capital’s life is finite, we modify this
by estimating a truncated normal distribution, following Ball and Witzke
(1993) around some mean value of L, as discussed below.

5
Measuring L: This measure has two aspects, the mean value of L and the
distribution around this mean value. Methods to estimate the mean value
of L has ranged from estimates based on capital assets’ lives from tax
authorities, with many inconsistencies (see OECD, 1992) to estimates
based on company accounts (e.g., estimates used for France by Atkinson
and Mairesse (1978) and Cette and Szpiro (1978), for Italy by Barca &
Magnani (1989) and for Canada by Tarasofsky et. al. (1982)), to estimates
based on survey methods (e.g, Japan). However, many OECD countries
use other countries estimates for this purpose. For this reason, OECD
(1992) provides a rather detailed table providing for estimates of mean
value of L across a large number of detailed sectors. There are in general
three broad sectors of capital stock; machinery and equipment, buildings
and construction, and transportation equipment. Although there appears
to be some variance in the estimates for the mean life of capital stock in
each of these three categories,1 a common practice is to use single value
for this estimate and then to assume a distribution around that mean. In
section 3-C we discuss the specific mean values used for the case of
Egypt.
For the distribution of L around a given mean value (discussed in 3-C) we
use a truncated normal density function, truncated at 2 SD of the mean.
For example for a mean value of say µ=20 years, representing L and
standard deviation of σ=8 years representing one SD around L , the
distribution is truncated at points of two standard deviations before and
1 For example the OECD (1992) estimates for machinery and equipment is 12-20 years in themanufacturing sector and somewhat longer in the non-manufacturing sector, for transport and vehicles isabout 8-35 years, and for building and construction is about 15-60 years.

6
after the mean. The area under the truncated normal curve is then adjusted
upward within the allowed range of asset lives as shown below.
This density function then assigns weights πi to each value of Li where πi is
the probability of occurrence of a machine with life of Li obtained from the
truncated normal distribution. The index i runs from 1 to 199, indicating the
number of segments that are used to calculate the truncated normal
distribution. A SAS program was written to generate this distribution.

7
We then calculate the efficiency function for that service life by assuming a
value for the decay rate of capital stock (see Ball 1993 for details). For this
purpose β=.5, the decay rate of capital, repeating the process for all possible
service lives. This decay rate of capital was chosen by comparing these rates
for several different countries, and also by local expert interviews. This
efficiency function is given by:
wL t
L tt L d if t Lit
i
it=
−−
≤ ≤ = >β
, ,0 0
An aggregate efficiency index was then constructed as a weighted sum of
the individual efficiency functions using the frequency of occurrence as
weights.
w wt i i
i
==∑π τ. ,
1
199
M ea suring Initial Ca pita l Stock: The re are severa l approac he s to the mea s ure
of initial ca pita l stock, inc luding the ICO R (inc re me nta l ca pital-output ra tio).
H ow ever, for the purpose s of pa rsimony and consis te nc y we extend the PIM
method bac kw a rds following Ba ll and W itzke (1993) and Be hrens (1981)
until the inves tments flow le ve ls of to zero. (For Ball this point is re ac he d in
the yea r 1850 in the cas e of Fra nc e. For our ana lysis this level is rea c he d in
the yea r 1914, implying tha t inves tme nts gre w from ze ro in 1914 to the initia l
yea r of obse rva tion in our sa mple, 1982. This approa ch ha s a dis tinct

8
a dvanta ge in that it make s any ass umptions regarding the initia l choic e of
c apital stoc k unnec e ss ary.
The diagram below illustrates this point. Although the diagram starts from
1850 we have actually chosen 1914 as our initial year of I=0, as mentioned.
(Note that since the service lives of assets are deviated two standard errors
from their mean, if age t exceeds the maximum expected service lives L ,
then the efficiency index would be wit=0.
The procedure involves the following steps: The first step involves
forecasting backward, as discussed above, to expand the real investment
data. This involves first running the following regressions
log(y) = a+b(year)

9
log(I/y)=c+d(year)
where y=real sectoral output, I=real sectoral investment and year=1914-
1995. We then calculate the real investment series, for 1914-1982, predicted
from above equations, by:
$ exp[log $ ( )]I y c d year= + +
Capital Stock Calculation: Finally, the capital stock of period t was
constructed as the weighted sum of all past real investment, with the weights
(w) obtained from above:
Kt
i
Lwt iIt i=
= − −∑0
(L≤t)
3. Data Collection Issues on Egyptian Data
Due to the paucity of data at 4-digit, an initial goal of this project, only 3-
digit data is reported here. For Egypt, that data are reported for the 1964
to 1995. Data were extracted primarily from the local Egyptian
(CAPMAS) sources and well as from UNIDO. Since a relatively large
discrepancy was observed between the two data sets, a decision had to be
made on which data set to use for the construction of capital stock and
total factor productivity. Due to their greater consistency over the UNIDO
data, the CAPMAS data set was chosen for further calculations. Below,
we describe the procedure involved in each of the two cases.

10
A. The CAPAMS data:
Calculation of the data based on CAPMAS sources involved several steps:
1. Figures on “Additions to Capital” (which is investments, net of
inventories) were extracted from the Egyptian Industrial Survey. Since this
includes investments in both construction and buildings as well as
machinery and transport equipment, the total figure had to be distributed
between the two categories. For this purpose the ratio of these two
components of overall investments were determined from the Egyptian
Economic Indicators Report at the 2-digit ISIC and then applied to the 3-
digit ISIC data.
2. Each category is deflated, using separate price indices, one for building
and construction, and the other for machinery and transport equipment.
Deflated components of Fixed Capital formation are compiled from
CAPMAS publication (Whole Price Prices Indices) on monthly basis, from
which annual price deflators are constructed for equipment and machinery,
transportation, construction. Inventory is deflated by the general investment
price deflators. A weighted price deflators is then formed from these annual
series. Relative weights are the share of each component in the fixed capital
formation. They are taken from 2-digit ISIC CAPMAS publication
(Statistical Industrial Survey – Annual issues). No information is available
of the 3-digit ISIC, therefore the prices of 2-digit were applied to the 3-digit
ISIC series. These weighted prices are adjusted to year 1981=100 as a base
year. Additional details are given in Appendix 1.

11
B . U NI D O Data:
To compa re the da ta from the Egyptia n loc al sourc es w ith the UN ID O data
the two da ta se ts ha d to be c ompatible firs t. The following steps were
followe d to achie ve this compatibility.
1. Since UNIDO’s provides investment data only on the basis of “fixed
capital formation” (which is inclusive of inventories) while CAPMAS
provides data both on fixed capital formation as well as “additions to capital
stock,” we used the CAPMAS to construct the ratio of “addition to capital”
to “capital formation” and applied the results to UNIDO data. We thus
obtained the UNIDO’s equivalent of the CAPMAS-based data on “addition
to capital.”
2. We then calculated the ratio of two categories of (a) buildings and
construction and (b) machinery and transport equipments, obtained in the
previous section from the CAPMAS sources, applying it to the “modified”
UNIDO data, constructed in step 1.
3. The data were then deflated using the compound price indices as
discussed in the last section. Additional notes on this measurement issues
in this section are given in appendix 2.
As mentioned earlier, because of greater consistency in the CAPMAS
data, this data was used for the calculation of capital stock and TFP in the
subsequent analysis.

12
C . T he life of mac hiner y:
According to some interviews made with engineers in the GOFI (General
Organization of Industries), the life service of machinery and transport
equipment seems to range from 15-17 years for new capital and about 7-10
years for the imported old. The ratio of this latter component to investments
in machinery and transport equipment in Egypt is about 50% (CAPMAS,
Economic Indicators). Therefore, for one set of calculations, we applied a
13-year mean life service ( L ) for machinery and equipment on average.
However, according to OECD tables (e.g. , OECD, 1992, p. 13), a large
number of advanced countries report mean life of machinery (excluding
vehicles) far exceeding the value of 13 (e.g, 13-30 years in Canada and 12-
25 year in the US, depending on specific manufacturing sub-sectors.) Since
developing countries often face slower rates of technological change and
also import constraints, plant obsolescence in such countries is likely to be
delayed. Thus, it is rather more likely therefore that the figure of L =13
years may be an underestimate for a developing economy such as Egypt.
For this reason we also report our calculations for a value L = 20-years.
Finally, for buildings and construction, we used a mean life figure ( L ) of 40
years, consistent with the estimates of the OECD (1992). The standard
deviation around these values (to be used in the truncated normal
distribution discussed in section 2) are assumed to be as follows: In the case
of machinery and transport equipment, for mean life value of L =13 we use
a standard deviation of σ=6 and for mean life of L =20, we use a standard
deviation of σ=8. In the case of buildings and construction (L =40), we use
a standard deviation of σ=10.

13
D . C apital stoc k c alculations:
Capital stock figure are reported in three forms. The first two forms
reflect capital stock in the form of machinery and transport equipment
with L =13 and L =20 years, respectively. In the third form, we add
capital stock figures for buildings and construction (L =40) to values of
machinery and equipment with the lower L values (L =13). This
reporting of capital stock under various forms has the advantage that it
offers future researchers a choice of different measures under different
assumptions. In calculating the capital stock, the procedure outlined
earlier is followed. Following the procedure outlined earlier, table 2
gives the sector definitions while tables 3a, 3b and 3c provide three
measure of capital stock from a SAS output based on the above forms.2
4. Additional Observations
To as se s s the relative ca pita l dee pe ning of se ctors , and the ir re spe ctive
a djus tme nts in ca pital us e over time , we exa mine the s ec tora l dis tribution of
c apital ac cumulation ove r time. W e choos e the da ta from Figure 3c for this
purpose . We do bec a us e we think tha t des pite the ir produc tive va lue ,
e xc lusion of buildings and cons truction and a more focus ed approa ch on the
mac hine ry and tra ns port equipme nt re pre se nts the grow th of the ca pital stoc k
in ma nufac turing more ac c urately. M ore over we choose the ave ra ge ma chine
life of 20 ye ars, ra ther than 13, for the sa me re as ons as dis cuss ed in Se ction
3C. Figure 1 gra phica lly pre se nts this res ult in his togra m form. The
2 It should be noted that with each of the three measures the calculations vary slightly. This leads to theresult that some sectors are dropped because under the given procedure they yield no data or unreliableestimates. A more detailed discussion of these points is available from the authors.

14
interes ting point he re is the exis te nce of an outlier in the 1980-84 period,
pointing to a muc h fas te r tha n ave ra ge grow th ra te. This se c tor which also
s hows up as an outlier, in the 1970-74 and 1975-79 pe riod (not show n here ),
is se ctor 372, or “non-fe rrous metals .” The sec tor is not an outlie r in the early
period (1965-69), and the late period (1994-95) of the study. One pos sibility
is a muc h prote ction tha t the se ctors enjoye d during pe riods with above-
a ve ra ge ra te of capita l acc umula tion, but not during the period of ope nne ss
tha t Egypt ha s expe rie nc e d in 1994-95 period. A nothe r interes ting se ctor,
s ec tor 390 whic h re pre se nts “other ma nufa cture d products ,” show s a
generally be low ave rage and ofte n ne gative rate of ca pital ac cumula tion,
s howing up a s a rela tive outlie r in the nega tive ra nge.
5. Conclusion
Detailed sectoral data at 3-digit level are constructed for the Egyptian
manufacturing sector for 32 years (1964-1995) for the first time to the
knowledge of the authors. The data is represented by the different measures
based on different assumptions that may be used in their calculation.
The data has been calculated based on modern methods and should provide
future researchers with a valuable tool for analysis.

15
R eferenc es
A tkinson, M. and J. M aire ss e , 1978. “ Le ngth of Life of Equipment inFre nc h Ma nufac turing Indus trie s .” Annales de l’INSEE. N o. 30-31/1978. INSEE, Paris .
B all, E. a nd H . W itzke 1993 “The Stock of C apita l in Europe a nC ommunity Agric ulture. ” Eur opean Rev iew of Agr ic ultur al Ec onomics . pp. 437-450.
B arca F. a nd M. M agna ni, 1989. L’indus trie fra C apitale e Lavoro. IlM ulino, B ologna.
B iorn, E., E. H olmoy and O .O ls en, 1985. “G ros s and N et C a pita lProductivity and the Form of the Surviva l Function – Some N orw egianEvide nc e .” D is cuss ion Paper no. 11. C entral Bure a u of s tatis tic s, O s lo.
C ette G . a nd D. Szpiro, 1978. “ La D uree de V ie de s Equipme nts Indus trielss ur la Periode 1972-1984. ” C ahie rs Economique s e t M onetaires . No. 28. Paris .
K ouma na kos , P., 1980. Alter nativ e Estim ate s of Non-re s idential Capital inC anada, 1926-1980. Sta tistics C a na da , Ottaw a .
O EC D, 1992. Methods Us ed by O EC D C ountr ie s to Me asure Stoc ks ofFix ed C apital. Paris .
Senha dji, A . 1999. “ Sourc es of Ec onomic Grow th: A n Extens ive GrowthA cc ounting Exercise . ” IMF Wor k ing Paper s, W P/99/77.
Sta tistics C a na da , 1979. Fix ed C apital Flows and Stock s. O ttaw a.
Taras ofs ky, A. T. R os eman and H. W as la nde r, 1982. “Ex Pos t A ggre gateR ea l Ra tes of R eturn in C anada , 1947-76.” A Study for the Econom ic C ounc il of C anada. O ttaw a.
U NIDO , 1981-96. U NIDO Industr ial Statistics D atabase 3-Digit Lev e l ofISIC Code. (Availa ble on dis ke tte ).

Table 1: Sector Definitions
Series CodeSeries Name311 FOOD PRODUCTS313 BEVERAGES314 TOBACCO321 TEXTILES322 WEARING APPAREL,EXCEPT FOOTWEAR323 LEATHER PRODUCTS324 FOOTWEAR,EXCEPT RUBBER OR PLASTIC331 WOOD PRODUCTS,EXCEPT FURNITURE332 FURNITURE,EXCEPT METAL341 PAPER AND PRODUCTS342 PRINTING AND PUBLISHING351 INDUSTRIAL CHEMICALS352 OTHER CHEMICALS353 PETROLEUM REFINERIES354 MISC. PETROLEUM AND COAL PRODUCTS355 RUBBER PRODUCTS356 PLASTIC PRODUCTS361 POTTERY,CHINA,EARTHENWARE362 GLASS AND PRODUCTS369 OTHER NON-METALLIC MINERAL PROD.371 IRON AND STEEL372 NON-FERROUS METALS381 FABRICATED METAL PRODUCTS382 MACHINERY,EXCEPT ELECTRICAL383 MACHINERY ELECTRIC384 TRANSPORT EQUIPMENT385 PROFESSIONAL & SCIENTIFIC EQUIPM.390 OTHER MANUFACTURED PRODUCTS
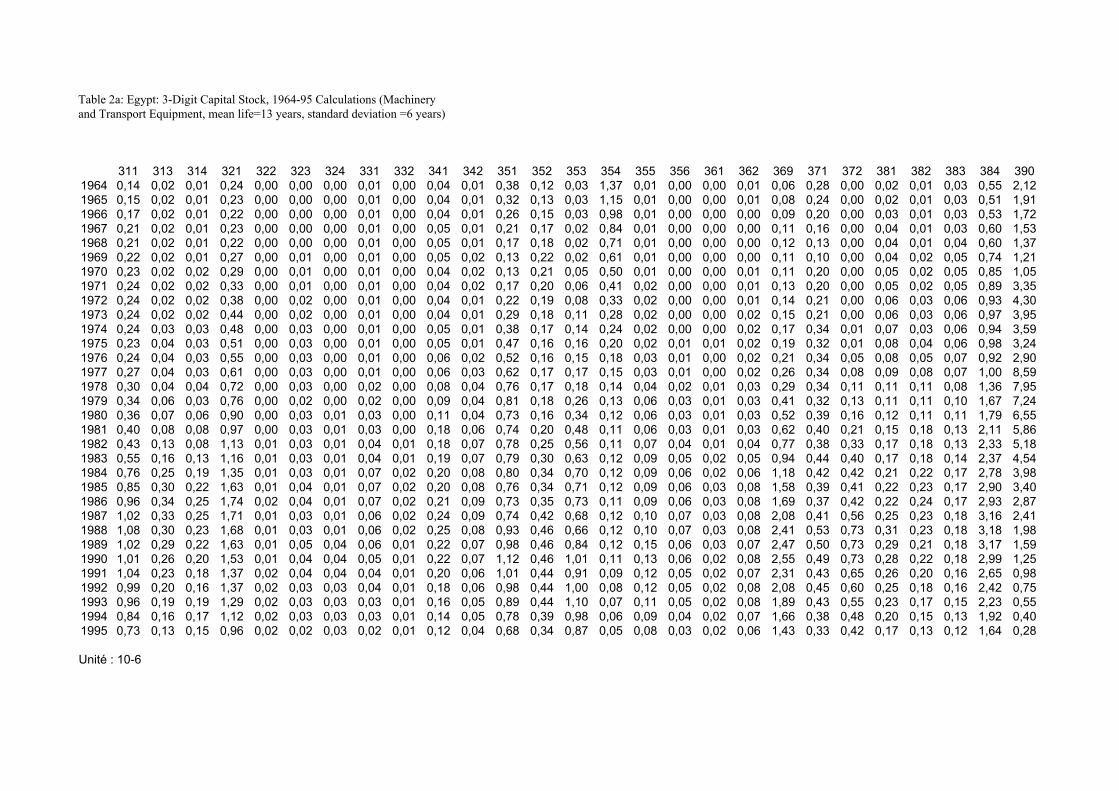
Table 2a: Egypt: 3-Digit Capital Stock, 1964-95 Calculations (Machineryand Transport Equipment, mean life=13 years, standard deviation =6 years)
311 313 314 321 322 323 324 331 332 341 342 351 352 353 354 355 356 361 362 369 371 372 381 382 383 384 3901964 0,14 0,02 0,01 0,24 0,00 0,00 0,00 0,01 0,00 0,04 0,01 0,38 0,12 0,03 1,37 0,01 0,00 0,00 0,01 0,06 0,28 0,00 0,02 0,01 0,03 0,55 2,121965 0,15 0,02 0,01 0,23 0,00 0,00 0,00 0,01 0,00 0,04 0,01 0,32 0,13 0,03 1,15 0,01 0,00 0,00 0,01 0,08 0,24 0,00 0,02 0,01 0,03 0,51 1,911966 0,17 0,02 0,01 0,22 0,00 0,00 0,00 0,01 0,00 0,04 0,01 0,26 0,15 0,03 0,98 0,01 0,00 0,00 0,00 0,09 0,20 0,00 0,03 0,01 0,03 0,53 1,721967 0,21 0,02 0,01 0,23 0,00 0,00 0,00 0,01 0,00 0,05 0,01 0,21 0,17 0,02 0,84 0,01 0,00 0,00 0,00 0,11 0,16 0,00 0,04 0,01 0,03 0,60 1,531968 0,21 0,02 0,01 0,22 0,00 0,00 0,00 0,01 0,00 0,05 0,01 0,17 0,18 0,02 0,71 0,01 0,00 0,00 0,00 0,12 0,13 0,00 0,04 0,01 0,04 0,60 1,371969 0,22 0,02 0,01 0,27 0,00 0,01 0,00 0,01 0,00 0,05 0,02 0,13 0,22 0,02 0,61 0,01 0,00 0,00 0,00 0,11 0,10 0,00 0,04 0,02 0,05 0,74 1,211970 0,23 0,02 0,02 0,29 0,00 0,01 0,00 0,01 0,00 0,04 0,02 0,13 0,21 0,05 0,50 0,01 0,00 0,00 0,01 0,11 0,20 0,00 0,05 0,02 0,05 0,85 1,051971 0,24 0,02 0,02 0,33 0,00 0,01 0,00 0,01 0,00 0,04 0,02 0,17 0,20 0,06 0,41 0,02 0,00 0,00 0,01 0,13 0,20 0,00 0,05 0,02 0,05 0,89 3,351972 0,24 0,02 0,02 0,38 0,00 0,02 0,00 0,01 0,00 0,04 0,01 0,22 0,19 0,08 0,33 0,02 0,00 0,00 0,01 0,14 0,21 0,00 0,06 0,03 0,06 0,93 4,301973 0,24 0,02 0,02 0,44 0,00 0,02 0,00 0,01 0,00 0,04 0,01 0,29 0,18 0,11 0,28 0,02 0,00 0,00 0,02 0,15 0,21 0,00 0,06 0,03 0,06 0,97 3,951974 0,24 0,03 0,03 0,48 0,00 0,03 0,00 0,01 0,00 0,05 0,01 0,38 0,17 0,14 0,24 0,02 0,00 0,00 0,02 0,17 0,34 0,01 0,07 0,03 0,06 0,94 3,591975 0,23 0,04 0,03 0,51 0,00 0,03 0,00 0,01 0,00 0,05 0,01 0,47 0,16 0,16 0,20 0,02 0,01 0,01 0,02 0,19 0,32 0,01 0,08 0,04 0,06 0,98 3,241976 0,24 0,04 0,03 0,55 0,00 0,03 0,00 0,01 0,00 0,06 0,02 0,52 0,16 0,15 0,18 0,03 0,01 0,00 0,02 0,21 0,34 0,05 0,08 0,05 0,07 0,92 2,901977 0,27 0,04 0,03 0,61 0,00 0,03 0,00 0,01 0,00 0,06 0,03 0,62 0,17 0,17 0,15 0,03 0,01 0,00 0,02 0,26 0,34 0,08 0,09 0,08 0,07 1,00 8,591978 0,30 0,04 0,04 0,72 0,00 0,03 0,00 0,02 0,00 0,08 0,04 0,76 0,17 0,18 0,14 0,04 0,02 0,01 0,03 0,29 0,34 0,11 0,11 0,11 0,08 1,36 7,951979 0,34 0,06 0,03 0,76 0,00 0,02 0,00 0,02 0,00 0,09 0,04 0,81 0,18 0,26 0,13 0,06 0,03 0,01 0,03 0,41 0,32 0,13 0,11 0,11 0,10 1,67 7,241980 0,36 0,07 0,06 0,90 0,00 0,03 0,01 0,03 0,00 0,11 0,04 0,73 0,16 0,34 0,12 0,06 0,03 0,01 0,03 0,52 0,39 0,16 0,12 0,11 0,11 1,79 6,551981 0,40 0,08 0,08 0,97 0,00 0,03 0,01 0,03 0,00 0,18 0,06 0,74 0,20 0,48 0,11 0,06 0,03 0,01 0,03 0,62 0,40 0,21 0,15 0,18 0,13 2,11 5,861982 0,43 0,13 0,08 1,13 0,01 0,03 0,01 0,04 0,01 0,18 0,07 0,78 0,25 0,56 0,11 0,07 0,04 0,01 0,04 0,77 0,38 0,33 0,17 0,18 0,13 2,33 5,181983 0,55 0,16 0,13 1,16 0,01 0,03 0,01 0,04 0,01 0,19 0,07 0,79 0,30 0,63 0,12 0,09 0,05 0,02 0,05 0,94 0,44 0,40 0,17 0,18 0,14 2,37 4,541984 0,76 0,25 0,19 1,35 0,01 0,03 0,01 0,07 0,02 0,20 0,08 0,80 0,34 0,70 0,12 0,09 0,06 0,02 0,06 1,18 0,42 0,42 0,21 0,22 0,17 2,78 3,981985 0,85 0,30 0,22 1,63 0,01 0,04 0,01 0,07 0,02 0,20 0,08 0,76 0,34 0,71 0,12 0,09 0,06 0,03 0,08 1,58 0,39 0,41 0,22 0,23 0,17 2,90 3,401986 0,96 0,34 0,25 1,74 0,02 0,04 0,01 0,07 0,02 0,21 0,09 0,73 0,35 0,73 0,11 0,09 0,06 0,03 0,08 1,69 0,37 0,42 0,22 0,24 0,17 2,93 2,871987 1,02 0,33 0,25 1,71 0,01 0,03 0,01 0,06 0,02 0,24 0,09 0,74 0,42 0,68 0,12 0,10 0,07 0,03 0,08 2,08 0,41 0,56 0,25 0,23 0,18 3,16 2,411988 1,08 0,30 0,23 1,68 0,01 0,03 0,01 0,06 0,02 0,25 0,08 0,93 0,46 0,66 0,12 0,10 0,07 0,03 0,08 2,41 0,53 0,73 0,31 0,23 0,18 3,18 1,981989 1,02 0,29 0,22 1,63 0,01 0,05 0,04 0,06 0,01 0,22 0,07 0,98 0,46 0,84 0,12 0,15 0,06 0,03 0,07 2,47 0,50 0,73 0,29 0,21 0,18 3,17 1,591990 1,01 0,26 0,20 1,53 0,01 0,04 0,04 0,05 0,01 0,22 0,07 1,12 0,46 1,01 0,11 0,13 0,06 0,02 0,08 2,55 0,49 0,73 0,28 0,22 0,18 2,99 1,251991 1,04 0,23 0,18 1,37 0,02 0,04 0,04 0,04 0,01 0,20 0,06 1,01 0,44 0,91 0,09 0,12 0,05 0,02 0,07 2,31 0,43 0,65 0,26 0,20 0,16 2,65 0,981992 0,99 0,20 0,16 1,37 0,02 0,03 0,03 0,04 0,01 0,18 0,06 0,98 0,44 1,00 0,08 0,12 0,05 0,02 0,08 2,08 0,45 0,60 0,25 0,18 0,16 2,42 0,751993 0,96 0,19 0,19 1,29 0,02 0,03 0,03 0,03 0,01 0,16 0,05 0,89 0,44 1,10 0,07 0,11 0,05 0,02 0,08 1,89 0,43 0,55 0,23 0,17 0,15 2,23 0,551994 0,84 0,16 0,17 1,12 0,02 0,03 0,03 0,03 0,01 0,14 0,05 0,78 0,39 0,98 0,06 0,09 0,04 0,02 0,07 1,66 0,38 0,48 0,20 0,15 0,13 1,92 0,401995 0,73 0,13 0,15 0,96 0,02 0,02 0,03 0,02 0,01 0,12 0,04 0,68 0,34 0,87 0,05 0,08 0,03 0,02 0,06 1,43 0,33 0,42 0,17 0,13 0,12 1,64 0,28
Unité : 10-6

Table 2b: Egypt: 3-Digit Capital Stock, 1964-95 Calculations (Machinery and Transport Equipment, mean life=20 years, standard deviation =8 years)
311 313 314 321 324 331 332 341 342 352 361 371 372 381 382 383 384 3901964 1,84 0,24 0,17 3,25 0,03 0,25 0,02 0,56 0,16 1,56 0,05 5,94 0,01 0,35 0,17 0,43 0,84 3,391965 1,96 0,24 0,17 3,17 0,03 0,25 0,02 0,58 0,17 1,72 0,04 5,31 0,01 0,36 0,18 0,44 0,81 3,081966 2,23 0,24 0,17 3,17 0,03 0,24 0,02 0,61 0,18 1,91 0,04 4,72 0,01 0,41 0,18 0,45 0,82 2,801967 2,69 0,24 0,17 3,28 0,03 0,23 0,02 0,64 0,18 2,13 0,04 4,17 0,01 0,53 0,18 0,46 0,89 2,551968 2,67 0,24 0,17 3,25 0,03 0,24 0,02 0,69 0,19 2,29 0,03 3,67 0,01 0,53 0,20 0,51 0,89 2,321969 2,85 0,24 0,20 3,75 0,03 0,23 0,02 0,67 0,23 2,76 0,03 3,20 0,01 0,58 0,25 0,66 1,04 2,111970 2,99 0,26 0,21 4,00 0,03 0,23 0,02 0,65 0,22 2,68 0,04 4,03 0,02 0,63 0,29 0,67 1,15 1,901971 3,08 0,26 0,26 4,40 0,04 0,22 0,02 0,64 0,21 2,62 0,04 3,87 0,02 0,68 0,31 0,70 1,19 4,151972 3,15 0,28 0,29 4,95 0,05 0,22 0,02 0,64 0,20 2,55 0,05 3,76 0,03 0,74 0,32 0,74 1,24 5,121973 3,20 0,29 0,31 5,67 0,04 0,21 0,02 0,66 0,20 2,48 0,06 3,69 0,04 0,81 0,35 0,78 1,29 4,841974 3,24 0,35 0,35 6,15 0,04 0,22 0,02 0,70 0,19 2,42 0,06 4,80 0,09 0,91 0,40 0,79 1,28 4,561975 3,24 0,48 0,33 6,53 0,05 0,21 0,02 0,73 0,21 2,38 0,07 4,54 0,11 0,97 0,49 0,82 1,33 4,281976 3,33 0,53 0,39 6,98 0,04 0,20 0,02 0,83 0,25 2,41 0,06 4,75 0,47 1,06 0,58 0,87 1,29 4,011977 3,68 0,51 0,41 7,78 0,05 0,21 0,02 0,83 0,35 2,48 0,06 4,62 0,86 1,14 0,87 0,98 1,38 9,751978 4,03 0,51 0,45 8,93 0,06 0,23 0,03 1,05 0,44 2,59 0,07 4,65 1,16 1,32 1,25 1,09 1,75 9,301979 4,51 0,70 0,43 9,49 0,06 0,27 0,03 1,12 0,50 2,70 0,12 4,45 1,39 1,38 1,29 1,22 2,09 8,831980 4,74 0,85 0,68 11,09 0,08 0,32 0,03 1,40 0,48 2,51 0,11 5,15 1,76 1,52 1,30 1,39 2,25 8,361981 5,21 0,95 0,95 12,07 0,08 0,41 0,03 2,10 0,66 2,90 0,14 5,36 2,23 1,85 2,00 1,56 2,61 7,861982 5,58 1,46 0,90 13,91 0,09 0,45 0,06 2,13 0,80 3,41 0,17 5,19 3,51 2,06 2,08 1,64 2,88 7,341983 6,91 1,82 1,50 14,49 0,08 0,49 0,09 2,23 0,81 3,92 0,19 5,84 4,40 2,16 2,18 1,79 2,97 6,831984 9,05 2,76 2,11 16,67 0,08 0,77 0,18 2,45 0,93 4,34 0,24 5,71 4,65 2,56 2,61 2,06 3,44 6,371985 10,17 3,28 2,45 19,82 0,09 0,77 0,18 2,46 0,95 4,45 0,32 5,50 4,74 2,72 2,80 2,16 3,62 5,871986 11,44 3,86 2,83 21,34 0,09 0,78 0,19 2,66 1,06 4,59 0,35 5,42 5,03 2,83 2,92 2,22 3,74 5,371987 12,36 3,84 2,90 21,56 0,10 0,79 0,18 2,95 1,11 5,34 0,35 5,86 6,56 3,14 2,91 2,29 4,04 4,911988 13,24 3,68 2,80 21,71 0,11 0,79 0,18 3,11 1,08 5,82 0,36 7,10 8,40 3,83 2,96 2,37 4,14 4,451989 12,95 3,62 2,73 21,71 0,47 0,75 0,18 2,93 1,02 5,88 0,35 6,83 8,68 3,71 2,86 2,41 4,21 3,991990 13,12 3,45 2,63 21,11 0,45 0,70 0,17 2,98 0,96 6,01 0,33 6,84 8,86 3,70 2,97 2,42 4,10 3,551991 13,70 3,24 2,46 19,85 0,43 0,65 0,16 2,80 0,92 5,88 0,32 6,38 8,38 3,50 2,83 2,30 3,84 3,141992 13,42 3,05 2,37 20,12 0,41 0,61 0,15 2,67 0,88 5,96 0,32 6,63 8,04 3,47 2,74 2,29 3,66 2,751993 13,37 2,92 2,73 19,56 0,40 0,57 0,15 2,56 0,86 6,14 0,32 6,46 7,76 3,33 2,67 2,28 3,51 2,391994 13,05 2,75 2,68 18,54 0,38 0,52 0,14 2,48 0,82 6,28 0,32 6,68 8,95 3,41 2,62 2,32 3,36 2,071995 13,75 2,54 2,87 17,44 0,36 0,48 0,13 2,45 0,81 6,45 0,30 6,48 8,66 3,50 2,68 2,39 3,16 1,76
Unité : 10-5

Table 2c: Egypt: 3-Digit Total Capital Stock Calculations, 1964-95(Machinery &Transport Equipment, mean life=13 standard deviation =6; Plus Construction & Buildings, mean life=40, standard deviation =10)
311 313 314 321 322 323 324 331 332 341 342 351 352 353 354 355 356 361 362 369 371 372 381 382 383 384 390
1964 0,25 0,03 0,02 0,53 0,00 0,01 0,01 0,09 0,00 0,66 0,18 1,36 0,18 0,05 126,09 0,02 0,01 0,00 0,01 0,10 0,83 0,00 0,04 0,02 0,04 0,09 48,58
1965 0,26 0,03 0,02 0,50 0,00 0,01 0,01 0,08 0,00 0,61 0,17 1,22 0,19 0,04 106,87 0,02 0,01 0,00 0,01 0,11 0,75 0,00 0,04 0,02 0,04 0,08 41,55
1966 0,29 0,03 0,02 0,49 0,00 0,01 0,01 0,08 0,00 0,56 0,16 1,09 0,21 0,04 89,95 0,02 0,00 0,00 0,01 0,14 0,67 0,00 0,04 0,02 0,05 0,09 35,32
1967 0,34 0,03 0,02 0,49 0,00 0,01 0,01 0,07 0,00 0,52 0,14 0,97 0,22 0,03 75,15 0,02 0,00 0,00 0,01 0,16 0,60 0,00 0,05 0,02 0,05 0,09 29,84
1968 0,34 0,03 0,02 0,48 0,00 0,01 0,01 0,07 0,00 0,49 0,13 0,86 0,24 0,03 62,31 0,02 0,00 0,00 0,01 0,17 0,53 0,00 0,05 0,02 0,05 0,09 25,05
1969 0,36 0,03 0,02 0,52 0,00 0,01 0,00 0,07 0,00 0,45 0,13 0,77 0,29 0,03 51,29 0,02 0,00 0,00 0,01 0,17 0,48 0,00 0,06 0,03 0,07 0,11 20,90
1970 0,37 0,03 0,02 0,54 0,00 0,01 0,01 0,07 0,00 0,41 0,12 0,71 0,27 0,06 41,88 0,02 0,00 0,00 0,01 0,17 0,56 0,00 0,06 0,03 0,07 0,12 17,34
1971 0,37 0,03 0,03 0,57 0,00 0,02 0,01 0,06 0,00 0,38 0,11 0,70 0,26 0,08 33,95 0,02 0,00 0,00 0,01 0,18 0,54 0,00 0,07 0,03 0,07 0,12 14,65
1972 0,37 0,03 0,03 0,62 0,00 0,02 0,01 0,06 0,00 0,35 0,10 0,71 0,25 0,10 27,37 0,02 0,01 0,00 0,02 0,19 0,52 0,00 0,07 0,03 0,07 0,12 12,25
1973 0,37 0,03 0,03 0,69 0,00 0,03 0,01 0,06 0,00 0,33 0,09 0,73 0,23 0,13 21,99 0,02 0,01 0,01 0,03 0,21 0,50 0,00 0,08 0,03 0,08 0,13 10,11
1974 0,37 0,04 0,04 0,73 0,00 0,03 0,01 0,05 0,00 0,31 0,08 0,80 0,22 0,15 17,67 0,02 0,01 0,01 0,03 0,22 0,62 0,01 0,09 0,04 0,08 0,12 8,36
1975 0,36 0,05 0,04 0,76 0,00 0,04 0,01 0,05 0,00 0,30 0,08 0,85 0,21 0,17 14,20 0,03 0,01 0,01 0,03 0,25 0,58 0,01 0,09 0,05 0,08 0,13 6,92
1976 0,36 0,06 0,04 0,80 0,00 0,04 0,01 0,05 0,00 0,29 0,08 0,88 0,21 0,17 11,41 0,03 0,01 0,01 0,03 0,26 0,59 0,05 0,10 0,06 0,08 0,12 5,73
1977 0,40 0,06 0,04 0,87 0,00 0,04 0,01 0,05 0,00 0,27 0,09 0,95 0,22 0,19 9,17 0,04 0,02 0,01 0,03 0,33 0,57 0,10 0,11 0,08 0,09 0,13 5,49
1978 0,43 0,05 0,05 0,98 0,00 0,03 0,01 0,05 0,00 0,28 0,09 1,07 0,22 0,20 7,37 0,05 0,02 0,01 0,03 0,35 0,56 0,14 0,12 0,12 0,10 0,16 4,65
1979 0,48 0,07 0,04 1,01 0,00 0,03 0,01 0,05 0,00 0,27 0,10 1,10 0,23 0,28 5,94 0,07 0,03 0,01 0,03 0,48 0,53 0,16 0,13 0,12 0,11 0,19 3,95
1980 0,50 0,09 0,07 1,16 0,00 0,03 0,01 0,06 0,00 0,28 0,09 1,00 0,21 0,37 4,78 0,07 0,03 0,01 0,03 0,60 0,59 0,19 0,14 0,12 0,13 0,21 3,36
1981 0,55 0,10 0,10 1,24 0,00 0,03 0,01 0,07 0,00 0,34 0,10 0,98 0,25 0,52 3,85 0,07 0,04 0,01 0,04 0,72 0,59 0,24 0,17 0,19 0,14 0,24 2,87
1982 0,58 0,15 0,10 1,40 0,01 0,03 0,01 0,07 0,01 0,33 0,11 1,01 0,30 0,60 3,10 0,08 0,05 0,02 0,04 0,88 0,56 0,38 0,19 0,19 0,15 0,26 2,45
1983 0,71 0,19 0,16 1,43 0,01 0,04 0,01 0,07 0,01 0,33 0,11 1,00 0,35 0,66 2,52 0,09 0,05 0,02 0,05 1,06 0,62 0,47 0,19 0,20 0,16 0,27 2,10
1984 0,92 0,28 0,22 1,62 0,01 0,04 0,01 0,10 0,02 0,33 0,12 0,99 0,38 0,74 2,05 0,10 0,06 0,02 0,07 1,32 0,59 0,49 0,23 0,24 0,18 0,31 1,80
1985 1,02 0,33 0,25 1,89 0,02 0,04 0,01 0,10 0,02 0,32 0,12 0,94 0,39 0,76 1,66 0,10 0,06 0,03 0,09 1,74 0,55 0,48 0,24 0,25 0,19 0,32 1,55
1986 1,13 0,38 0,28 2,00 0,02 0,04 0,01 0,09 0,02 0,33 0,12 0,90 0,40 0,77 1,35 0,10 0,06 0,03 0,09 1,86 0,52 0,50 0,25 0,25 0,19 0,32 1,33
1987 1,20 0,37 0,28 1,97 0,02 0,04 0,01 0,09 0,02 0,34 0,12 0,90 0,47 0,73 1,10 0,11 0,07 0,03 0,09 2,27 0,56 0,64 0,27 0,25 0,19 0,35 1,15
1988 1,27 0,34 0,26 1,93 0,01 0,04 0,01 0,09 0,02 0,34 0,11 1,08 0,51 0,70 0,91 0,11 0,07 0,03 0,09 2,62 0,67 0,82 0,34 0,24 0,20 0,35 0,99
1989 1,21 0,33 0,25 1,90 0,01 0,06 0,05 0,08 0,02 0,31 0,10 1,12 0,50 0,89 0,75 0,16 0,06 0,03 0,08 2,69 0,63 0,82 0,32 0,23 0,20 0,35 0,86
1990 1,20 0,30 0,23 1,79 0,01 0,05 0,05 0,07 0,02 0,30 0,09 1,26 0,50 1,06 0,61 0,14 0,06 0,03 0,09 2,79 0,62 0,82 0,31 0,23 0,20 0,33 0,74
1991 1,23 0,27 0,21 1,62 0,02 0,05 0,05 0,07 0,01 0,28 0,09 1,14 0,48 0,96 0,50 0,13 0,06 0,03 0,08 2,54 0,56 0,75 0,28 0,21 0,18 0,30 0,65
1992 1,18 0,24 0,19 1,61 0,02 0,04 0,04 0,06 0,01 0,25 0,08 1,10 0,48 1,06 0,41 0,12 0,05 0,03 0,09 2,31 0,57 0,69 0,27 0,20 0,17 0,27 0,57
1993 1,14 0,22 0,22 1,53 0,02 0,04 0,04 0,05 0,01 0,23 0,08 1,00 0,49 1,16 0,33 0,12 0,05 0,03 0,09 2,12 0,55 0,65 0,25 0,19 0,17 0,25 0,50
1994 1,02 0,19 0,20 1,35 0,02 0,04 0,04 0,05 0,01 0,20 0,07 0,89 0,43 1,04 0,27 0,10 0,04 0,02 0,08 1,87 0,49 0,58 0,22 0,17 0,15 0,22 0,44
1995 0,91 0,17 0,18 1,18 0,02 0,03 0,03 0,04 0,01 0,18 0,06 0,78 0,38 0,93 0,22 0,09 0,04 0,02 0,07 1,64 0,43 0,51 0,19 0,14 0,13 0,19 0,38
Unité : 10-6

Figure 1: Sectoral Distribution of Capital Stock for Egypt
Egypt: Secotral Distribution of Capital Stock Growth: 1965-69
0
1
2
3
4
5
6
-0,2 -0,2 -0,1 -0,1 0 0,05 0,1 0,15 0,2 0,25 0,3 0,35 0,4
Egypt: Sectoral Distribution of Capital Stock Growth: 1980-84
0
1
2
3
4
5
6
7
-0,2 -0,2 -0,1 -0,1 0 0,05 0,1 0,15 0,2 0,25 0,3 0,35 0,4
Egypt: Sectoral Distribution of Capital Stock Growth: 1994-95
0
1
2
3
4
5
6
7
8
-0,2 -0,2 -0,1 -0,1 0 0,05 0,1 0,15 0,2 0,25 0,3 0,35 0,4
Egypt: Sectoral Distribution of Capital Stock Growth: 1965-95
0
2
4
6
8
10
12
-0,2 -0,2 -0,1 -0,1 0 0,05 0,1 0,15 0,2 0,25 0,3 0,35 0,4

Appendix 1: Notes on the calculation of CAPMAS (local) data
1- Owing to some difficulties in collecting the data of 1960-1969 from
Industrial Survey (addition to capital) and due differences in sector codes
definitions we used sector to match sector data on different variables.
2- In collecting the data, a number of sectors had missing observations.
These sectors have been removed from analysis (351, 353, 355, 362, 371
and 385.)
3- There was some missing data on year 1966 and 1972. For these years,
we averaged the data from the two neighboring years.
4- The years 1984, 1985, and 1986 were totally missing from the
publications of the Industrial Survey. For these year, we used the data on
“addition of capital” in the economic indicators report (2-digit ISIC). To
distribute the addition of each 2-digit ISIC sector on the 3-digit ISIC sectors
we used this ratio from the prior 3 years (1981,1982 and 1983), and then
applied the results to the values of economic indicators Report (2-digit
ISIC).
5- In the years from 1960-1969 both the sectors 322 and 324 were combined
into one sector according to the old classification that was in use at the time.
We addressed this problem by finding the breakdown of the two sectors
from data on the subsequent years in the 70s from the total 2 ISIC sector and
then applied the result to these sectors (322 and 324).
6- In calculating the ratios of the components to construct the price index
for machinery equipment from Economic Indicators Survey, the years
1960-1964, 1967, 1970-1975, 1976, 1978-1979, 1983, and 1992 were
missing. The solution was to take the average of these ratios for the missing

years. It was found that the differences in the ratios through the time were
very slight.
7- B as e ye a r for price indic es use d in calcula ting the components of
“ additions to c apita l, ” were adjus te d to a unifie d ba se ye ar for entire period.

E stimate s of Capital Stoc k for 3-digit ISIC Manufac turing Se c tor inI ran: 1982-1997*
H amid M ohtadi**
U nive rs ity of M inne s ota and W is c onsin-M ilwa uke e
A hmad R . J ala li-N aini***
Ins titute for Re se a rc h on De ve lopme nt and Pla nning, Ira n
Pei-C hie n Lin#
U nive rs ity of M inne s ota
June 2000R evis ed: January 2001
*This is one pa rt of a s two-s ta ged re se arch proje ct s ponsore d by ER F a ndFEM ISE on “C ons truc tion of Da ta bank on Ca pital Stoc k and Tota l Fa ctorProductibvity” at 3-Digit Indus try Le ve l for Sele ct number of M EN AC ountrie s. The fina nc ia l s upport of ER F and FEM ISE is acknow le dged. The vie ws e xpres s ed a re thos e of the bene ficiaries a nd do not re fle ct the vie ws ofthe C ommis sion or the Ec onomic Res ea rch Forum.
**Proje c t Coordinator, A s sociate Profes sor of Ec onomics , ERF Re se arc hFellow. ***Proje ct C ollabora tor, As socia te Profes sor, A c ting C hair. # Proje ct A s sistant

1
Est imat es of Ca pi ta l S to ck fo r 3-d ig i t IS ICM an uf act urin g S ecto r i n Ira n: 198 2- 1 99 7
1 . Back grou n d
This pa per, which is the firs t part of a tw o-s ta ge proje ct, dea ls with
developing a da ta ba nk for capita l stock at 3-digit ISIC le ve ls for the
manufac turing indus tries in sele ct countrie s of the Middle Ea st and North
A fric a (MENA ), nota bly Egypt and Ira n covering the pe riod 1964-95 for
Egypt and 1983-97 for Ira n. Ca lcula tions are ba s ed both upon the UN ID O
c ountry da ta as well as loc al (in-country) data. The se cond stage involves
utilizing this da ta bank to cons truct systema tic estimate s of Tota l Fac tor
Productivity (TFP) in the se c ountrie s a nd industrie s.
C re ation of suc h a databa nk will ena ble both countrie s to addre ss ke y
polic y iss ue s tha t cannot be ade quate ly ans w ered now and is the re fore
beyond the sc ope of this pa pe r. For exa mple , capita l stock da ta are ne ede d
for estima tion purpose s in EU -M ENA trade polic y (e. g. , role of trade in
fac tor intens ity and ide ntifying sec tors with compa ra tive advanta ge ), or the
impac t of EU expa ns ion on the MENA ’s industria l and labor polic ie s (e. g. ,
s kill and ca pital subs titutability) and its ma cro polic ies (e .g., ec onomic
growth and converge nce hypothes is). Simila rly, TFP is key to
understa nding sourc e s of ec onomic growth and is espec ia lly re le va nt to
tec hnology and know ledge -ba se d polic ies , suc h as the impac t of
tec hnology on economic grow th, educa tion and tra ining of the workforce ,
role of trade with EU on te chnology diffusion to the MEN A re gion, export
promotion polic ie s and their se c tora l produc tivity impa c t, and the

2
productivity effe cts of Intelle c tual Property in differe nt se ctors, to me ntion
a few .
G rowth in the MEN A region has be en se ns itive to tre nds in TFP. A sha rp
dec line in the ra te of grow th of tota l fa ctor productivity (TFP) and low e r ra te s
of phys ica l capital ac cumulation are the mos t importa nt fa ctors explaining a
marke d slow-dow n of GD P growth rate in the MEN A region after mid-1980s
(Se nhadji, 1999). B oth ca pital ac cumulation and increa s ed employme nt ha ve
c ontribute d signific antly to ec onomic growth in MEN A. For the 1960-94
period as a whole , capita l ac cumulation is estima te d to be the most significa nt
s ourc e of growth, follow e d by increa s ed employme nt and human ca pita l
forma tion, re spec tively. Even though MENA ’s ra te of TFP grow th de cline d
pre cipitously after 1974, and its growth ra te during 1987-1994 wa s estima te d
to be ne ga tive, TFP ha s contribute d c om parativ ely more to economic grow th
in MENA than in Africa and La tin Ame ric a, but le s s than that in South and
Eas t As ia. Compared to La tin Ame rica , Sub-Sa ha ra n Afric a , and to a les se r
e xtent South As ia , human ca pita l has be en a re la tively more importa nt sourc e
of grow th in MENA . Growth polic ies should se arch for the type of ec onomic
a nd ins titutional re forms c apable of inducing a highe r rate of incre as e in TFP.
This pa per be gins w ith a de ta ile d de s cription of the me thodology, follow e d by
a des cription of ca pital stoc k estima tion. The a c tual re sults a re pres ented in
the e nd.

3
2 . M et h od ol o gy
U NIDO and in-country are us ed to convert ca pital stoc k data from gross
inves tme nt da ta . The me thod us e d is the PIM (Pe rpe tual Inve ntory
M ethod), outlined in OEC D (1992) with dis tribution func tion for life of
mac hina ry from Ba ll and Witzke (1993). B ec a us e more informa tion from
in-country source s are ne eded to suppla nt the UN IDO data , the pre se nt
proje ct de als with an initial se t of tw o countrie s, Ira n and Egypt for whic h
the UNID O da ta exis ts and contac ts with re giona l ERF fellow s have be e n
made. In Ira n, Dr. Ahmad Ja la li-Na ini and in Egypt, Drs . Lobna Abde l-
Latif a nd Elia El-M a hdi are c ontributing to the calcula tion of ca pital s toc k.
T he PIM Me thod: PIM is know n as the Pe rpe tual Inve ntory Me thod
(PIM) and is thoroughly des cribe d by OECD (1992) as well as detaile d in
Sta tistics Ca na da (1979). The firs t ste p involve s adding up w eighte d s ums
of inve s tments (G ros s Ca pital Formation) ove r time, a s follow s:
Kt
i
Lwt iIt i=
= − −∑0
(L≤ t)
w he re Kt is the re al Gros s stock of capita l, L is se rvic e life of ca pital
(disc us s ed be low), It is the re al Gros s Capita l Forma tion in time t, and wi is
the weight as sociate d with the contribution of inve stme nts during the
period t-L to t.
M easuring wi: This we ight is es timated differe ntly by different OEC D
c ountrie s, ba se d on va rying ass umptions rega rding the surviva l of

4
mac hine ry after initia l ins ta lla tion. O ne c ommon as sumption made by some
O EC D me mbe rs is tha t the ma chine ry of the s a me kind a re withdra wn from
s ervice s im ultaneous ly w he n the ir se rvic e life L is re a ches . This approa ch,
known as “Simulta ne ous Exit”, as sume s a mortality function that is in the
form of step func tion:
w i =1 for i< L, and wi =0 for i≥ L.
Y et, the ass umption of simultane ously dis ca rding ma chine s se e ms
unrea lis tic. Thus , some OEC D me mbe rs assume a “Delayed Linear”
function where discarding begins sometime after initial installation but
occurs at a constant rate. Then wi will be uniformly distributed around L.
Still, other OECD countries assume a normal distribution of w i over time.
Comparing the resulting figures for Gross Capital Stock from these
varying assumptions, Statistics Canada (Koumanakos, 1980) and the
Norwegian Bureau of Statistics (Biorn, et. al., 1985) find the results to be
sensitive to the choice of mortality functions. Still, OECD analysts
conclude, “…the bell-shaped function is really the only plausible
candidate,” (OECD, 1992) and most OECD members use this function.
Given the prevalence of the bell shaped distribution, we adopt this
approach as well. However, since capital’s life is finite, we modify this
by estimating a truncated normal distribution, following Ball and Witzke
(1993) around some mean value of L, as discussed below.
Measuring L: This measure has two aspects, the mean value of L and the
distribution around this mean value. Methods to estimate the mean value
of L has ranged from estimates based on capital assets’ lives from tax

5
authorities, with many inconsistencies (see OECD, 1992) to estimates
based on company accounts (e.g., estimates used for France by Atkinson
and Mairesse (1978) and Cette and Szpiro (1978), for Italy by Barca &
Magnani (1989) and for Canada by Tarasofsky et. al. (1982)), to estimates
based on survey methods (e.g, Japan). However, many OECD countries
use other countries estimates for this purpose. For this reason, OECD
(1992) provides a rather detailed table providing for estimates of mean
value of L across a large number of detailed sectors. Yet it is not
uncommon to see researchers use a single value for this number, ranging
from 15 to 20 years, since most values do fall in this range. For the
purpose of this work, we have assumed an average service life of 20
years.
For the distribution of L around this mean value we use a truncated
normal density function, truncated at 2 SD of the mean with mean of
µ=20 years, representing L for mean life of machinery and standard
deviation of σ=8 years representing one SD around L . The distribution
was truncated at points of two standard deviations before and after the
mean. The area under the truncated normal curve was then adjusted
upward within the allowed range of asset lives as shown below.

6
This density function then assigns weights πi to each value of Li where
πi is the probability of occurrence of a machine with life of Li obtained
from the truncated normal distribution. The index i runs from 1 to 199,
indicating the number of segments used to calculate the truncated normal
distribution. A SAS program was written to generate this distribution.
We then calculate the efficiency function for that service life by using
assuming a value for the decay rate of capital stock (see Ball 1993 for
details). For this purpose β=.5, the decay rate of capital, repeating the

7
process for all possible service lives. This decay rate of capital was
chosen by comparing these rates for several different countries, and also
by local expert interviews. This efficiency function is given by:
wL t
L tt L d if t Lit
i
it=
−−
≤ ≤ = >β
, ,0 0
An aggregate efficiency index was then constructed as a weighted sum
of the individual efficiency functions using the frequency of occurrence
as weights.
w wt i i
i
==∑π τ. ,
1
199
Measuring Initial Capital Stock: There are several approaches to the
measure of initial capital stock, including the ICOR (incremental capital-
output ratio). However, for the purposes of parsimony and consistency we
extend the PIM method backwards following Ball and Witzke (1993) and
Behrens (1981) until the investments flow levels of to zero. (For Ball this
point is reached in the year 1850 in the case of France. For our analysis
this level is reached in the year 1914, implying that investments grew
from zero in 1914 to the initial year of observation in our sample, 1982.
This approach has a distinct advantage in that it makes any assumptions
regarding the initial choice of capital stock unnecessary.

8
The diagram below illustrates this point. Although the diagram starts
from 1850 we have actually chosen 1914 as our initial year of I=0, as
mentioned. Further, note that since the service lives of assets are
deviated two standard errors from their mean (20 years), if age t exceeds
the maximum expected service lives L , then the efficiency index would
be wit=0.
The procedure involves the following steps: The first step involves
forecasting backward, as discussed above, to expand the real investment
data. This involves first running the following regressions
log(y) = a+b(year)
log(I/y)=c+d(year)

9
where y=real sectoral output, I=real sectoral investment and year=1914-
1997. We then calculate the real investment series, for 1914-1982,
predicted from above equations, by:
$ exp[log $ ( )]I y c d year= + +
Capital Stock Calculations: Finally, the capital stock of period t was
constructed as the weighted sum of all past real investment, with the
weights (w) obtained from above:
Kt
i
Lwt iIt i=
= − −∑0
(L≤ t)
Table 1 gives the sector desafinitions while table 2 provides the SAS
output of the 3-digit capital stock for Iran based on the above procedure.
3. Data Collection Issues
Due to the paucity of data at 4-digit, an initial goal of this project, only
3-digit data is reported here. Data are reported for the 1983 to 1997
period. Data on manufacturing value-added, output, intermediate
purchases, investment, wages, employment, gender composition of the
work force, … are obtained through annual surveys for “large

10
establishments”—defined as manufacturing units with ten or more
employees. Manufacturing units receive a detailed questioner for the
survey year and they are all obligated to fill them. The relevant data is
extracted from questioners and is aggregated according to ISIC codes.
Firms surveyed are identified by information available from operation
permits, and through local search by the staff of the Statistical Center of
Iran--the official body responsible for collection and publication of 2, 3,
and 4 digit ISIC data for manufacturing industry. Since the raw data on
fixed investment are in nominal terms we had to choose an appropriate
deflator. We began with several deflators and a weighted-average of
several indices, to reflect the weighted- average cost of the bundle of
investment goods. For each industry (e.g. food, textiles, glass) annual
fixed investment is the sum of expenditures on machinery, tools,
transportation vehicles, construction, electrical generators, etc.
Therefore, a wholesale price deflator for each of the above items had to
be obtained and weighted with their share in total investment
expenditures to calculate a deflator for each ISIC number. For a number
of years and a number of industries the breakdown of total investment
expenditures were not available, and therefore we had to find an
alternative deflator. Since fixed investments (capital goods, electric
generators, and construction) are considerably less heterogeneous than
industrial output, the manufacturing sector’s fixed investment deflator
was found to be a good representative index for deflating nominal
investment when data on the components of investment expenditures
were not available. The deflated investment series, or real investment
flows, was used to estimate real capital stock series.

11
Real investment flows were initially estimated for 3 and 4-digit ISIC
code. For comparative purposes, and due to the fact that time series 4-
digit data are much more limited, three digit data were finally chosen.
Capital stock data according to “machinery” and “construction”
classification were available, hence we used these two components as
the raw data for further calculations. Different rates of depreciation were
calculated for construction and machinery. For depreciation, or more
technically, decay rate of machinery both international data and a small
survey of local expert opinion was considered. The decay rate for
construction is usually lower than that for machinery. A use-life of
between 16 to 20 is usually considered for machinery. After applying the
decay rate specific for “machinery” and “construction,” a series for each
component was calculated. The aggregate capital stock for industry
reported in this study is the sum of depreciation adjusted “machinery”
and “construction” series for each year.
Factors such as the availability of exchange rate and the black market
exchange rate premium influence the decision to buy and install new
machinery in those countries that import capital goods. Usually when
foreign currency becomes significantly more expensive and/or its
availability is limited new capital equipment purchases are delayed and
older machinery stay in use for a longer period of time. In the case of
Iran, official exchange rate depreciated very massively in the early
1990s, and black market premia was very high during the 1985-1991
period. Considering all these factors, an average use-life of about twenty
years was assumed.

12
4. Additional Observations
Estimated capital stock series for a number of ISIC codes exhibit a bump
during the mid-1980s (mostly 1986-1987). This is due to a sharp decline
in fixed investment during this period. Gross fixed domestic investment
in constant prices in Iran fell by –15.9, -23.56, and –17.33 per cent
during 1985 to 1987, respectively. The price of crude oil fell sharply
from a high of about 34 dollars in 1984 to a low of about six dollars per
barrel causing a significant decline in foreign exchange receipts from the
oil sector, a sever foreign exchange shortage, and a large cut in
government’s development expenditures. Private fixed investments also
fell significantly. The impact of the balance of payment crisis was
carried through 1987. The adverse impact of lower oil prices on
investment and output was exacerbated by the Iran-Iraq war. Aside from
negatively affecting economic activity, the war damaged oil-export
facilities, hampered sea-transportation, thus exacerbating the impact of a
sharp fall in the price of oil.
To assess the relative capital deepening of sectors, and their respective
adjustments in capital use over time, it is insightful to examine the sectoral
distribution of capital accumulation over time.
In Figure 1 which graphically presents this result with respect to Iran, we
observe the existence of one sector that remains an outlier at the low end of
the distribution spectrum in both 1983-90 and 1981-97 period, reflecting a
significant decapitalization (negative growth rate of capital stock). This

13
sector turns out to be sector 354, which is “miscellaneous petroleum and
coal products”. The Iran-Iraq War (1981-87) can explain much of this
negative growth rate in the first of the two periods under study. The war
was responsible for much destruction of capital stock, especially in the oil
sector and related petrochemical industries. The factor that can explain the
negative growth rate of capital stock during the second part of this period is
the US-led embargo on foreign investments in the Iranian Oil industry.
Though this embargo has not been entirely successful, due to the lack of
support from the European Union, it has nonetheless led to a substantial
slow down in investments in this sector. It is also interesting to note that
between the first and the second period of observation, the entire
histogram experiences a shift to the right of the spectrum, suggesting an
improvement in the growth environment in the second period, probably
thanks to the end of the war and an environment of construction as the
revolution entered its more pragmatic pro-reform phase.

14
References
A tkinson, M. and J. Ma ire ss e, 1978. “Le ngth of Life of Equipment inFre nc h Ma nufac turing Indus trie s .” Annales de l’IN SEE. N o. 30-31/1978. INSEE, Paris .
B all, E. and H . Witzke 1993 “The Stock of Capita l in Europe a nC ommunity Agric ulture. ” Eur opean Rev iew of Agr ic ultur al Ec onomics . pp. 437-450.
B arca F. a nd M. M agnani, 1989. L’industrie fra C a pita le e La voro. IlM ulino, Bologna .
B iorn, E., E. H olmoy a nd O. Olse n, 1985. “ Gross a nd Ne t Capita lProductivity and the Form of the Surviva l Function – Some N orw egia nEvide nc e .” D is cuss ion Pape r no. 11. C entra l Burea u of statistic s, Os lo.
C ette G . a nd D. Szpiro, 1978. “ La Duree de Vie de s Equipme nts Indus triels sur la Periode 1972-1984.” C ahiers Economique s etM onetaires . No. 28. Pa ris .
K ouma na kos , P., 1980. Alter nativ e Estim ate s of Non-re s idential Capitalin Canada, 1926-1980. Sta tis tics Ca na da , O tta wa .
O EC D, 1992. Methods Us ed by O EC D C ountr ie s to Me asure Stoc ks ofFix ed C apital. Paris .
Senha dji, A. 1999. “Sourc es of Economic G row th: An Exte nsive Grow thA cc ounting Exercise . ” IMF Wor k ing Paper s, W P/99/77.
Sta tistics C a na da , 1979. Fix ed C apital Flows and Stock s. O ttaw a.
Taras ofs ky, A. T. R ose ma n a nd H . W as lande r, 1982. “ Ex Post A ggregate R ea l Ra tes of Re turn in Ca na da , 1947-76. ” A Study for the Econom ic C ounc il of C anada. O ttaw a.
U NIDO , 1981-96. U NIDO Industr ial Statistics D atabase 3-Digit Lev e l ofISIC Code. (A va ila ble on dis ke tte ).

Table 1: Sector Definitions
Series CodeSeries Name311 FOOD PRODUCTS313 BEVERAGES314 TOBACCO321 TEXTILES322 WEARING APPAREL,EXCEPT FOOTWEAR323 LEATHER PRODUCTS324 FOOTWEAR,EXCEPT RUBBER OR PLASTIC331 WOOD PRODUCTS,EXCEPT FURNITURE332 FURNITURE,EXCEPT METAL341 PAPER AND PRODUCTS342 PRINTING AND PUBLISHING351 INDUSTRIAL CHEMICALS352 OTHER CHEMICALS353 PETROLEUM REFINERIES354 MISC. PETROLEUM AND COAL PRODUCTS355 RUBBER PRODUCTS356 PLASTIC PRODUCTS361 POTTERY,CHINA,EARTHENWARE362 GLASS AND PRODUCTS369 OTHER NON-METALLIC MINERAL PROD.371 IRON AND STEEL372 NON-FERROUS METALS381 FABRICATED METAL PRODUCTS382 MACHINERY,EXCEPT ELECTRICAL383 MACHINERY ELECTRIC384 TRANSPORT EQUIPMENT385 PROFESSIONAL & SCIENTIFIC EQUIPM.390 OTHER MANUFACTURED PRODUCTS

Table 2: 3-digit ISIC Sector-Wide Capital Stock Estimates for Iran: 1982-97
year 1982 1983 1984 1985 1986 1987 1988 1989 1990 1991 1992 1993 1994 1995 1996 1997311 1,03 1,03 1,09 1,12 1,15 1,17 1,27 1,27 1,25 1,23 1,24 1,27 1,28 1,34 1,40 1,45314 0,10 0,10 0,10 0,10 0,10 0,10 0,10 0,09 0,08 0,08 0,07 0,09 0,12 0,11 0,11 0,11321 1,25 1,30 1,38 1,41 1,46 1,50 1,54 1,53 1,53 1,56 1,62 1,71 1,77 1,93 1,95 1,96322 0,03 0,03 0,03 0,03 0,03 0,03 0,10 0,10 0,10 0,10 0,10 0,10 0,10 0,10 0,10 0,10323 0,12 0,11 0,11 0,11 0,10 0,10 0,10 0,10 0,09 0,09 0,09 0,09 0,08 0,08 0,08 0,07324 0,11 0,10 0,10 0,10 0,10 0,09 0,10 0,09 0,09 0,08 0,08 0,08 0,08 0,07 0,06 0,06331 0,17 0,17 0,17 0,17 0,16 0,16 0,17 0,17 0,17 0,17 0,17 0,17 0,17 0,17 0,17 0,17332 0,05 0,05 0,05 0,05 0,05 0,06 0,07 0,08 0,08 0,07 0,08 0,08 0,08 0,07 0,07 0,06341 0,09 0,10 0,11 0,13 0,14 0,14 0,15 0,15 0,17 0,17 0,18 0,18 0,20 0,24 0,26 0,27342 0,03 0,03 0,04 0,04 0,05 0,05 0,06 0,07 0,08 0,09 0,10 0,11 0,12 0,14 0,15 0,15351 0,04 0,06 0,07 0,08 0,09 0,10 0,13 0,16 0,18 0,22 0,24 0,25 0,26 1,15 1,25 1,35352 0,31 0,32 0,33 0,35 0,38 0,39 0,43 0,46 0,47 0,49 0,51 0,53 0,54 0,59 0,62 0,64353 0,02 0,03 0,03 0,04 0,04 0,04 0,04 0,04 0,04 0,04 0,04 0,04 0,04 0,10 0,14 0,26354 1,65 1,34 1,09 0,89 0,72 0,59 0,48 0,39 0,32 0,27 0,22 0,18 0,15 0,13 0,10 0,09355 0,08 0,08 0,09 0,11 0,13 0,14 0,15 0,15 0,17 0,16 0,16 0,18 0,19 0,20 0,31 0,66356 0,47 0,45 0,45 0,45 0,45 0,44 0,44 0,44 0,44 0,42 0,41 0,42 0,41 0,41 0,40 0,40361 0,02 0,02 0,02 0,03 0,03 0,03 0,03 0,04 0,04 0,04 0,04 0,05 0,05 0,07 0,07 0,08362 0,24 0,23 0,23 0,23 0,23 0,23 0,23 0,23 0,23 0,23 0,23 0,25 0,24 0,23 0,23 0,24369 2,42 2,32 2,30 2,29 2,26 2,24 2,27 2,24 2,19 2,12 2,06 2,06 2,00 1,96 1,94 2,05371 0,07 0,25 0,25 0,26 0,28 0,30 0,31 0,32 0,32 0,33 0,37 0,52 0,71 1,36 1,55 1,91372 0,07 0,07 0,09 0,10 0,11 0,12 0,21 0,30 0,30 0,31 0,47 0,56 0,58 0,59 0,58 0,58381 0,36 0,37 0,39 0,43 0,45 0,47 0,53 0,53 0,60 0,61 0,63 0,65 0,77 0,81 0,82 0,85382 0,48 0,48 0,51 0,55 0,60 0,60 0,70 0,75 0,77 0,79 0,87 0,94 0,97 1,00 1,00 1,00383 0,54 0,53 0,54 0,53 0,53 0,54 0,55 0,56 0,54 0,52 0,50 0,51 0,50 0,50 0,52 0,53384 0,42 0,42 0,43 0,49 0,60 0,59 0,60 0,61 0,59 0,58 0,62 0,66 0,68 0,71 0,74 0,81385 0,04 0,04 0,05 0,05 0,05 0,05 0,06 0,06 0,05 0,05 0,06 0,06 0,07 0,08 0,08 0,09390 0,01 0,01 0,01 0,01 0,02 0,02 0,03 0,03 0,03 0,03 0,03 0,04 0,04 0,04 0,05 0,05
Les données sont en 10-8

Figure 1: Sectoral Distribution of Capital Stock Growth for Ir
Iran: Sectoral Distribution of Capital Stock Growth, 1983-90
0
2
4
6
8
10
-0,2 -0,2 -0,1 -0,1 0 0,05 0,1 0,15 0,2 0,25 0,3 0,35 0,4
Iran: Sectoral Distribution of Capital Stock, 1991-97
0
2
4
6
8
10
-0,2 -0,2 -0,1 -0,1 0 0,05 0,1 0,15 0,2 0,25 0,3 0,35 0,4
Iran: Sectoral Distribution of Capital Stock Growth, 1983-97
0
2
4
6
8
10
-0,2 -0,2 -0,1 -0,1 0 0,05 0,1 0,15 0,2 0,25 0,3 0,35 0,4

E stimate s of Total Fac tor Produc tivity for 3-digit ISIC Manufac turingSec tors in I r an (1983-97) and E gypt (1964-1993)*
H amid M ohtadi**
U nive rs ity of M inne s ota and W is c onsin-M ilwa uke e
Terry L. R oe ***
U nive rs ity of M inne s ota
June 2000R evis ed Fe br uar y 2001
*This is one pa rt of a s two-s ta ged re se arch proje ct on the “ C onstruc tion ofD atabank on Capital Stoc k a nd Tota l Fac tor Produc tivity” a t 3-D igit Indus tryLevel for Se lec t numbe r of MENA Countries . The w ork has be ne fited from a financia l gra nt from the Commis s ion of the Europe an C ommunities w ithin thec onte xt of the FEMISE program, as we ll as from Ec onomic Re se a rc h Forumfor the Arab Countries , Ira n and Turkey. The view s expre ss e d are those ofthe bene ficia ries a nd the re fore in no w ay re flec t the view s of the Commis sionor the Economic R es e arch Forum.
**Proje c t Coordinator, A s sociate Profes sor of Ec onomics , ERF Re se arc hFellow. ***Proje ct C ollabora tor, Profes s or of A pplie d Ec onomics .

1
E stimate s of Total Fac tor Produc tivity for 3-digit ISIC Manufac turingSec tors in I r an (1983-97) and E gypt (1965-1993)
1. Executive Summary
Among the most important and fundamental components of economicdevelopment is the role of capital accumulation, employment growth andtechnological change. These processes are highly sensitive to market forcesand incentives, to industrial policy, to macro economic policy, and tointernational trade policy. To the extent that these forces provide anenvironment for technological change, capital deepening and employmentgrowth typical follow, all else unchanged. However, all else is seldomunchanged. The economic shocks experienced in the 1970s and 1980s, andother economic contingencies often give rise to “boom and bust” cycles,making difficult the tracing of the fundamental sources of economic growth,or the lack thereof. Given the dynamic and leading role that the industrialsector plays in this process, this project is about understanding theseprocesses for the industrial sector. It has been the principal goal of thisproject to construct a databank that focuses on these processes at asufficiently disaggregate sector-wide level to make the results useful topolicy makers and available to future researchers, emphasizing sub-sectorspecific and economy-wide forces that induce growth.
The project has focused on Iran and Egypt, two of the most populated andarguably most strategically key countries in the Middle East and NorthAfrica region. In view of both countries’ geo-political and strategicimportance, the question of the ability of the countries to prosper and tointegrate into the world trade is fundamentally important both for the region,and for their trading and strategic partners.
The economy of each of the two countries has been subject to a number ofadverse effects. In Egypt, many years of state control of the economy led toan extremely large public sector, relatively low output to capital and outputto labor ratios, and a sluggish response to changes in the externalenvironment. In Iran, decades of turmoil has affected economicperformance in profound ways. The continuing political tensions on thedirection of the economy and the polity affected the private sector and theincentive structure of the economy in many adverse ways. Historically, bothcountries have been relatively closed with emphasis on import-substitutionpolicies, although, in the case of Egypt, starting in the early to mid 1990s,

2
there has been a more serious effort under way to reduce the size of thepublic sector and to open up the economy. In the case of Iran, the mostrecent atmosphere of political openness is a hopeful sign that may containthe seeds of economic openness in the coming years.
The sectoral analysis of both counties confirm the aggregate trends. Thisanalysis is based on our year and half long effort to develop a databank oncapital stock and total factor productivity on 3-digit ISIC sectors. Althoughwe first began our project with a more detailed search for 4-digit ISIC data,we soon learned of enormous and frequent limitations on this data. Wetherefore used 3-digit data instead. The final data includes 18 3-digit sectorsfor Egypt for the 1964-1993 period (1995 for capital stock data) and 26 3-digit sectors for Iran for 1983-1993 period (1997 for capital stock and valueadded).
The detailed methodology of measurement of the data follow this executivesummary. Detailed sectoral data on TFP growth as well as selected chartsfrom our results are presented at the end. However, some results from theaggregation across the industries are reported and discussed presently.
Chart 1 compares the two country’s industrial performance, in terms ofoutput growth for 1983-97 period for Iran and 1965-93 period for Egypt.The smoothed (filtered) line removes idiosyncratic shocks, a meanpreserving procedure common in business cycle analysis, based on what isknown as the Hodrick-Prescott filter. The chart for Egypt reveals the boomand bust periods of the 1970s, the contraction and readjustment of the early1980s, and then an adjustment to what appears a more stable path in theearly 1990s. The case for Iran begins in the 1980s, and reveals a similarpattern to Egypt. Over comparable years, both charts suggest that industrialgrowth in both countries stagnated over the long-run. However, in Iran thereis some evidence of growth beginning 1995; in the case of Egypt, valueadded data stops at 1993, but other evidence (e.g. World Bank Report)suggest some increase in this sector’s activity, since 1993.

3
Chart 1a:
Chart 1b:
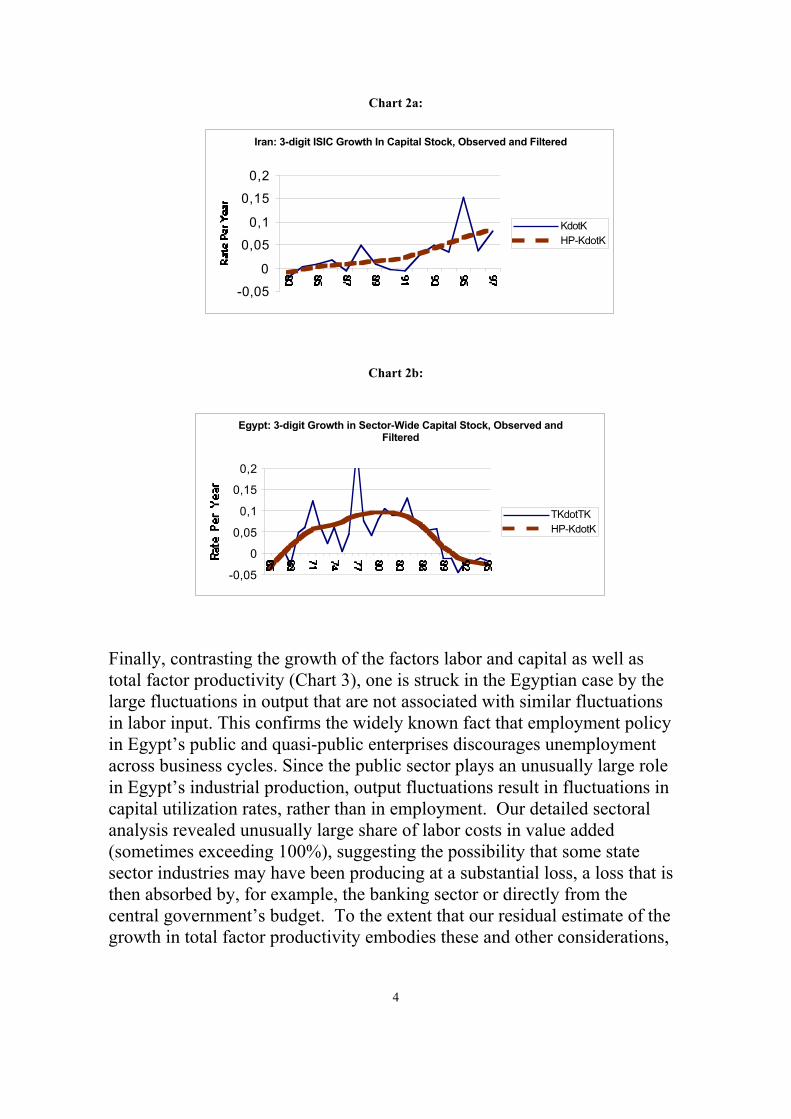
The growth of capital stock (Chart 2) in both countries has seen widefluctuations, with Egypt showing a period of decline in growth during theperiod of 1980s until early 1990s. This evidence is consistent with Egypt’sindustrial and structural adjustments associated with its struggle to liberalizethe economy. Moreover, the turn-around that can be seen at the end of chart2b is also consistent with Egypt’s relative success with open door policies,beginning 1993. In Iran, despite some fluctuations, there has been a steadyincrease in the growth of capital stock. But this may have been due to largepublic sector spending including large state enterprises, rather than increasedopenness.
Iran: 3-digit Growth in Sector-Wide Output, Observed and Filtered
-0,4
-0,2
0
0,2
0,4
YdotYHP-YdotY
Egypt: 3-digit Growth in Sector-Wide Output, Observed and Filtered
-3
-2
-1
0
1
2
3
TYdotTYHP-YdotY
4
Chart 2a:
Chart 2b:
Finally, contrasting the growth of the factors labor and capital as well astotal factor productivity (Chart 3), one is struck in the Egyptian case by thelarge fluctuations in output that are not associated with similar fluctuationsin labor input. This confirms the widely known fact that employment policyin Egypt’s public and quasi-public enterprises discourages unemploymentacross business cycles. Since the public sector plays an unusually large rolein Egypt’s industrial production, output fluctuations result in fluctuations incapital utilization rates, rather than in employment. Our detailed sectoralanalysis revealed unusually large share of labor costs in value added(sometimes exceeding 100%), suggesting the possibility that some statesector industries may have been producing at a substantial loss, a loss that isthen absorbed by, for example, the banking sector or directly from thecentral government’s budget. To the extent that our residual estimate of thegrowth in total factor productivity embodies these and other considerations,
Iran: 3-digit ISIC Growth In Capital Stock, Observed and Filtered
-0,05
0
0,05
0,1
0,15
0,2
KdotKHP-KdotK
Egypt: 3-digit Growth in Sector-Wide Capital Stock, Observed andFiltered
-0,05
0
0,05
0,1
0,15
0,2
TKdotTKHP-KdotK

5
it should not be interpreted as a pure measure of technological progress.Rather, one may seek to assess its determinants, such as in sphere of publicversus private sector ownership.
The forgoing analysis has been done for each of the 3-digit industrial sectorsfor both countries. However, the main objective of this project has been thedevelopment of an extensive databank on capital stock and total factorproductivity in order to answer these and many other policy questions byfuture researchers in the area one may choose to investigate.
Chart 3a:
Chart 3b:
Iran: 3-digit Sector-Wide Growth Rates of Output, Input and TFP (filtered)
-0,3
-0,2
-0,1
00,1
0,20,3
HP-YdotYHP-KdotKLdotLTFPdot
Egypt: 3-digit Sector-Wide Growth in Outputs, Inputs and TFP, Filtered
-0,3
-0,2
-0,1
0
0,1
0,2
0,3
HP-YdotYHP-KdotKHP-LdotLHP-tfpdot

6
2. I ntr oduc tion
This pa per de als with the s ec ond part of a two-s tage proje ct. The first stageinvolve d deve loping me as ure s of ca pital stoc k for 3-digit ISICmanufac turing indus tries for se lec t countrie s of Middle Ea st and NorthA fric a, nota bly Egypt and Ira n, cove ring the period 1964-95 for Egypt and1983-97 for Ira n. The se c ond sta ge , which is the subjec t of this pa per,involve s utiliz ing this databank to construc t sys te ma tic estima te s of TotalFac tor Produc tivity (TFP) in the se countrie s and industrie s for the sa me period, though la ck of availa bility for a fe w other indica tors re duc es thetime spa n of the TFP projec t to a slightly sma lle r ra nge tha n tha t for thec apital stoc k proje c t.
C re ation of suc h a databa nk will ena ble both countrie s to addre ss ke ypolic y iss ue s tha t cannot be ade quate ly ans w ered now and is the re forebeyond the s c ope of this projec t. For exa mple, c a pita l stock da ta are ne e de dfor estima tion purpose s in EU -M ENA trade polic y (e. g. , role of trade infac tor intens ity and ide ntifying sec tors with compa ra tive advanta ge ), or theimpac t of EU expa ns ion on the M EN A’s indus trial and la bor policies (e .g., s kill and ca pital subs titutability) and its ma cro polic ies (e .g., ec onomicgrowth and converge nce hypothes is). Simila rly, TFP is key toundersta nding sourc e s of ec onomic growth and is espec ia lly re le va nt totec hnology and know ledge -ba se d polic ies , suc h as the impac t oftec hnology on economic grow th, educa tion and tra ining of the workforce ,role of trade with EU on te chnology diffusion to the MEN A re gion, exportpromotion polic ie s and their s ec tora l produc tivity impac t, and the productivity effe cts of Intelle c tual Property in differe nt se ctors, to me ntiona few .
Following a detaile d des c ription of the methodology, TFP grow th res ultsa nd s ome s ele cted c harts are pre se nte d at the end of the report.

7
3. Me thodology
Due to the relatively short time series of data at this time, a regressionapproach to the calculation of TFP yields unsatisfactory results. Thus, anon-parametric approach is employed following Alyuwn Young (1995).In aggregate studies of TFP only capital and labor appear as inputs.However, at the industry level, the issue is more complex becauseintermediate inputs must also be considered (such inputs do not appear inmacro studies as aggregation across all industries causes them to “cancelout” at the aggregate level). For this reason, value added data, rather thangross output data, are of key significance. Estimates of industry-level TFPwill be enormously useful to numerous analyses and questions.
The specific steps involve, first, the estimation of a translog value–added production function as follows:
2
220
2
1lnlnlnln
)(ln)(lnlnlnln
ttLtKLK
KLtKLY
ttLtKtKL
KKLLtKL
ββββ
ββαααα
+∗+∗++
+++++=
where Y, K, L and t denote output, capital input, labor input and time. Underthe assumption of constant return to scale, α ’s and β ’s satisfy therestrictions:
α α β β β β β βK L KK KL LL KL Kt Lt+ = + = + = + =1 0
Then the growth of output can be decompose as
1,])1(
)(ln[]
)1()(
ln[))1(
)(ln( −+
−+
−=
− ttLK TFPtL
tLtK
tKtY
tY θθ
where
2/)]1()([ −+= tt iii θθθ
and where the θ ’s denote the elasticity of output with respect to each input,equivalently, under perfect competition assumption, the share of each inputin total factor payments. The share of labor income in each sector is the ratioof corresponding sectoral compensation to value added. Data on wage

8
compensation and employment were used both from UNIDO and localsources for both countries. These data are described at some length in twoseparate papers on the measurement of the capital stock for both countries.Given the CRS assumption the share of capital is therefore also found. Bothwages rates and value added are measured in nominal terms, since they enterin ratio form. This assumes the same price index for both indicators.Appendix 1 provide sector definitions, Appendices 2-4 reports the results forboth countries with each appendix being divided into two subsets (A and B)for Iran and Egypt respectively.
Several important issues arise in the calculation of total factor productivityusing the Solow-Residual approach. First, given the statistical noise in thevarious series that are used in the calculation of the TFP as a residual, theresidual itself embodies such noise. Thus, while we have presented theactual calculated TFP series for detailed sectors, in the presentation of theaggregate results (Charts 1-3 main text), we have chosen the approachdeveloped by Hodrick-Prescott (1997) in their study of the Business Cycles.This approach amounts to filtering the noise in order to produce a smoothmean preserving series.
This method has a long history of use, particularly in the actuarial sciences.Following Hodrick and Prescott, the observed time series, yt, are viewed asthe sum of cyclical components, ct, and growth components, gt, i.e.,
yt = gt + ct, for t = 1, ..., T.
Our prior knowledge, based upon growth theory, is that growth componentsvary “smoothly” over time following their secular evolution. The measureof the smoothness of the {gt} path is the sum of the squares of its seconddifference. By taking differences, the somewhat ill behaved random walknature of the data series become ultimately well behaved series of zero meanwhite noise and makes the series stationary. The variable ct is the deviationfrom gt. The notion is that, over long time periods, the cycles, ct , where ct
=yt –gt , average near zero. This presumption leads to the followingprogramming problem for determining the underlying growth components inthe observed time series yt:
Min y g g g g gg t
t
T
t t t t tt
T
t tT< >
=− − −
==−∑ ∑− + −( ) − −( )[ ]
1 1
21 1 2
2
1
( ) λ
The parameter λ is a positive number that penalizes variability in the growthcomponent of the series. The larger the value of λ, the “smoother” is the

9
underlying growth trend gt. For a sufficiently large λ, at the optimum all thegt+1 - gt must be arbitrarily near some constant β and therefore the gt
arbitrarily near g0 + βt. This implies that in the limit of solution to the aboveequation as λ approaches infinitely is the least squares fit of a linear timetrend model, and for λ = 0, the smoothed data are exactly the same as thesample data.
The selection of the smoothing parameter λ is based on a probability model.If the cyclical components and the second differences of the growthcomponents are identically and independently distributed normal variableswith mean zero and variances σ1
2 and σ22 (which they are not), then the
conditional expectation of the gt, given the observations, would be thesolution of the above equation when √λ = σ1/σ2.
Different values of λ provide different information, e.g., a large value of λapproximates the annual average rate of growth given by an ordinary leastsquares fit to the log of the data. The problem is to choose the value of λ thatbest depicts the underlying growth components in the data, and then toemploy that value for all the cases. The serial correlation of the cyclicalcomponents for different values of λ indicates that the selected smoothingparameter (λ = 20) seems to capture the underlying growth components ofthe data without undue smoothing which appears to result when x reaches itsupper bound. 1
The results of this smoothing exercise are reported in Charts 1-3 in the bodyof this paper (Executive Summary).
A second measurement problem we faced was that in the case of Egypt, theshare of labor costs in value added (that enters into the calculation of TFP)exceeded unity for some specific years and sectors! Further explorationrevealed that for these cases, periods of decline in value added for that sector(s) was not accompanied with corresponding declines in that sector’s(sectors’) employment level. This finding is consistent with the stability ofemployment and employment guarantees that has been historically observedto be associated with the state sector in Egypt (C.f. Holt and Roe, 1993)combined with the relative large share of the state sector in many industries,averaging for example to 69 percent of total sectoral production in the 1 See Also Diao, Roe and Agapi (1999) for an application of this method to the agriculture sector.

10
1980s (ibid, p. 201). When the Egyptian economy began to open andforeign firms entered in the 1980s and 1990s, such heavily protected sectorsfaced increased competition resulting in output declines. Under thesecircumstances the employment guarantees lead to excess capacity and laborshares exceeding unity, as we have found.
Since the labor share enters the TFP calculations, this phenomenon has to becorrected. In order, to correct for this, we ran a regression equation for the1964-1993 (time period of the data) that “filtered out” the cases where thelabor share exceeded unity. This was done a follows (the sector subscript issuppressed for convenience):
tttt cDKLbaKY ε+++= )/ln()/ln(
where Dt is a dummy variable, such that Dt=1, wherever SLt ≥1 where SLt
is the labor share, and Dt=0 wherever SLt <1.
The slope b̂ is then an estimate of the “corrected” labor share, once the“excessively large” values of labor share are controlled for by the dummyvariable. Thus, it is an estimate of the equivalent (competitive) labor sharewhen excess capacity together with employment rigidity causes the value oflabor share to exceed unity.
The resulting estimates of TFP, based on the production function method arereported in Appendices 2A for Iran and 2B for Egypt. In the case ofAppendix 2B, Table 1a reports the calculated TFP growth shares based onobserved shares and table 1b which presents these results based on theestimated labor shares using the above method. For the purposes of TFPestimates in Egypt, of the three alternative estimates of capital stockprovided Mohtadi, Mohtadi, Abdel-Latif and Lin (2001) the more exclusivemeasure (machinery and transport equipment) has been used. Although themore inclusive measure that includes construction and buildings is alsoavailable, the authors felt that for the purposes of measuring the TFP, thismore specific measure of capital stock is more appropriate.
4. Additional Observations

11
Of interest is also a “Growth Accounting” exercise. This amounts tomeasuring the contribution of each factor to the overall growth of net outputfor each sector. This task is illustrated both numerically and graphically inAppendices 3A and 3B for a few select sectors. For example, in the case offood processing (sector 311) the result of this growth accounting exercisesuggests that except for the spike in 1985-87 period, where a rise in thecontribution of labor is associated with a decline in the contribution of TFP,for other years the sector has experienced a relatively stable contribution oflabor and capital (and thus TFP). For the same sector in Egypt greatervariation is observed on the contribution of the three factors. This isespecially so in the period that is comparable with the Iranian data (1983-93). With respect to another common sector, that of transport andequipment (384), both countries experienced periods of relative stability inthe contribution of each factor, though again greater stability is observedwith the Iranian data. In the comparable period of the 1980s, this stability isinterrupted for Egypt by sharp rise in employment form 85 to 89 (and someincreased capital expenditures in 87-89 period), while in Iran, the 91-92period shows a similar rise in this sector’s employment (with anaccompanying decline in capital expenditures).
Whether efforts towards a greater openness of the Egyptian economy duringthe 1980s period, as compared with the increasing isolation of the Iranianeconomy following the Iranian revolution in this period, have producedthese different results remain to be determined by future research.
To assess the relative capital deepening of sectors, and their respectiveadjustments in capital use over time, it is insightful to examine the sectoraldistribution of capital accumulation over time.
In Appendix 4A which graphically presents this result with respect to Iran,we observe the existence of one sector that remains an outlier at the low endof the distribution spectrum in both 1983-90 and 1981-97 period, reflecting asignificant decapitalization (negative growth rate of capital stock). Thissector turns out to be sector 354, which is “miscellaneous petroleum andcoal products”. The Iran-Iraq War (1981-87) can explain much of thisnegative growth rate in the first of the two periods under study. The warwas responsible for much destruction of capital stock, especially in the oilsector and related petrochemical industries. The factor that can explain thenegative growth rate of capital stock during the second part of this period isthe US-led embargo on foreign investments in the Iranian Oil industry.

12
Though this embargo has not been entirely successful, due to the lack ofsupport from the European Union, it has nonetheless led to a substantialslow down in investments in this sector. It is also interesting to note thatbetween the first and the second period of observation, the entire histogramexperiences a shift to the right of the spectrum, suggesting an improvementin the growth environment in the second period, probably thanks to the endof the war and an environment of construction as the revolution entered itsmore pragmatic pro-reform phase.
The corresponding Appendix for Egypt is Appendix 4B. The interestingpoint here is the existence of a positive outlier in the 1980-84 period,pointing to a much faster than average growth rate. This sector which alsoshows up as a positive outlier, in the 1970-74 and 1975-79 period (notshown here), is sector 372, or “non-ferrous metals.” The sector’s was not anoutlier in the very early period of the study (1965-69), and also is no longeran outlier in the very late period of the study (1994-95). One possibleexplanation is that this sector enjoyed much protection during those periodswith above-average rate of capital accumulation, but has now lost thisprotective advantage as Egypt has begun to experience its relative opennesssince the mid-1990s. Another interesting sector, sector 390 which represents“other manufactured products,” shows a generally below average and oftennegative rate of capital accumulation, showing up as a relative outlier in thenegative range.

13
References
Diao X. , T. Roe and A.Somwaru 2000. “What is the Cause of Growth inRegional Trade: Trade Liberalization or RTAS? The Case of Agriculture”The World Economy. Forthcoming.
Diewert, W. 1974. “Applications of Duality Theory.” In Frontiers ofQuantitative Economics by M. Intriligator and D. Kendrick (eds.). Vol. II.Amsterdam, North Holland.
D ie we rt, W . 1980. “ A ggre ga tion Problems in the M ea s ureme nt ofC apital. ” In, The Meas ur em e nt of Capital, Studie s in Incom e and Wealthby Da n Usher (e d. ), Vol. 45, N ew York, N BER.
D ie we rt W. a nd C. M orris on, 1986. “ Adjusting O utput a nd ProductivityIndexes for Cha nges in Terms of Trade. ” Economic J our nal. V ol. 96. Pp.659-679.
Gopinath, M. and T. Roe, 1997. “Sources of Sectoral Growth in anEconomy-Wide Context: The Case of US Agriculture.” Journal ofProductivity Analysis, Vol 8, pp. 293-310.
Gopinath, M. 1995. General Equilibrium Analysis of Growth andCompetitiveness of US Agriculture, 1949-91. Ph. D. thesis. Universityof Minnesota, St. Paul.
Hodrick, R.J., and E.C. Prescott (1997) “Postwar U.S. Business Cycles: AnEmpirical Investigation,” Journal of Money, Credit, and Banking 29(1): 1-16.
H olt, R . a nd T. R oe . 1993. “The Politic a l Ec onomy of R eform: Egypt in, the 1980s. ” In, The Political Econom y of Re form by Ann Kruege r andR obert Bates (e ds .) (K rupp, 1993), pp: 179-224.
Mohtadi, H. , L. Abdel-Latif and P. Lin, “Estimates of Capital Stock for3-Digit ISIC Manufacturing Sector in Egypt: 1964-95.
UNIDO, 1981-96. UNIDO Industrial Statistics Database 4-Digit Levelof ISIC Code. (Available on diskette).
Y oung, A. 1995 “The Tyra nny of Numbe rs: Confronting the Sta tis tica lR ea litie s of the Ea s t As ian G row th Expe rienc e, ” Q uarter ly Journal ofEconomic s, pp. 641-677
W oodland, A. 1982. Inter national Trade and Res ourc e Allocation. A ms te rda m, N orth Holla nd.

Table 1: Sector Definitions
Series CodeSeries Name311 FOOD PRODUCTS313 BEVERAGES314 TOBACCO321 TEXTILES322 WEARING APPAREL,EXCEPT FOOTWEAR323 LEATHER PRODUCTS324 FOOTWEAR,EXCEPT RUBBER OR PLASTIC331 WOOD PRODUCTS,EXCEPT FURNITURE332 FURNITURE,EXCEPT METAL341 PAPER AND PRODUCTS342 PRINTING AND PUBLISHING351 INDUSTRIAL CHEMICALS352 OTHER CHEMICALS353 PETROLEUM REFINERIES354 MISC. PETROLEUM AND COAL PRODUCTS355 RUBBER PRODUCTS356 PLASTIC PRODUCTS361 POTTERY,CHINA,EARTHENWARE362 GLASS AND PRODUCTS369 OTHER NON-METALLIC MINERAL PROD.371 IRON AND STEEL372 NON-FERROUS METALS381 FABRICATED METAL PRODUCTS382 MACHINERY,EXCEPT ELECTRICAL383 MACHINERY ELECTRIC384 TRANSPORT EQUIPMENT385 PROFESSIONAL & SCIENTIFIC EQUIPM.390 OTHER MANUFACTURED PRODUCTS

Appendix 2A: TFP Growth at 3-digit ISIC in Iran
311 314 321 322 323 331 332 341 342 351 352 353 354 355 356 361 362 369 371 372 381 382 383 384 385 390
1983 -0,08 0,17 0,03 0,11 0,02 -0,06 0,10 0,11 -0,05 0,37 0,16 0,02 0,16 0,15 0,24 0,07 0,03 0,13 -0,26 0,36 0,10 0,30 0,13 0,20 0,04 0,39
1984 -0,08 -1,39 0,00 0,25 0,25 0,21 -0,12 0,02 0,09 0,03 0,16 0,10 0,37 -0,05 0,01 -0,25 0,22 0,08 0,34 0,22 0,06 0,18 0,03 0,11 0,23 0,07
1985 0,03 -0,28 -0,04 -0,25 -0,17 -0,07 -0,24 -0,08 -0,06 -0,11 -0,09 -0,07 0,47 -0,15 -0,14 0,27 -0,16 0,01 0,08 -0,15 -0,05 -0,19 -0,04 -0,24 -0,24 -0,12
1986 -0,19 -0,19 -0,38 -0,34 0,12 -0,17 -0,31 -0,42 -0,36 0,03 0,05 -1,14 -0,20 0,01 -0,14 -0,36 -0,41 -0,29 -0,33 -0,40 -0,26 -0,46 -0,27 -0,55 -0,35 -0,49
1987 -0,07 -0,01 -0,42 0,07 -0,16 -0,11 0,11 -0,76 0,05 -0,12 -0,19 0,82 0,90 0,01 -0,13 -0,46 -0,36 -0,05 -0,45 -0,39 -0,31 0,04 -0,59 -0,19 -0,40 -0,08
1988 0,24 1,00 -0,18 -0,97 -0,22 -0,09 -0,45 -0,10 -0,57 -0,58 -0,42 -0,09 -0,16 -0,27 0,38 -0,39 -0,23 -0,67 0,01 -0,48 -0,19 -0,16 0,00 -0,25 -0,28 -0,72
1989 -0,13 -0,59 -0,08 -0,26 -0,25 -0,07 -0,02 -0,09 0,38 0,43 0,31 -0,22 0,56 0,22 0,04 -0,10 -0,14 -0,03 -0,23 -0,33 0,30 0,10 -0,10 0,30 0,25 -0,12
1990 0,26 0,19 0,32 0,32 0,39 0,03 -0,05 0,41 -0,18 0,11 0,06 -0,11 0,36 0,16 0,27 0,40 0,03 0,20 0,82 1,25 -0,07 0,33 0,81 0,61 0,06 0,55
1991 0,26 0,80 -0,22 -0,53 -0,42 -0,44 0,08 -0,04 -0,28 -0,01 -0,22 0,30 -0,21 -0,03 -0,15 -0,54 0,48 -0,12 -0,30 -0,41 0,03 -0,58 0,54 0,76 0,33 -1,07
1992 -0,04 -0,54 -0,02 -0,01 -0,11 0,24 0,08 0,01 0,07 -0,50 0,06 -0,57 0,18 0,40 -0,29 0,29 0,18 0,50 0,65 0,40 -0,16 -0,16 -0,18 -0,79 0,15 0,63
1993 0,31 0,05 -0,19 -0,50 -0,14 -0,13 -0,26 -0,03 -0,31 0,42 -0,37 0,50 -0,18 -0,42 -0,12 -0,07 -0,41 -0,22 -0,33 -0,82 0,00 -0,05 -0,12 0,01 -0,08 0,81

Appendix 2B: TFP Growth at 3-digit ISIC in Egypt
Table 1: Growth in TFP, Based on Actual Labor shares, Egypt
311 313 314 321 324 331 332 341 342 352 361 371 372 381 382 383 384 39019641965 -0,28 -0,17 -0,79 -0,30 -0,47 -0,78 -0,22 -0,45 -0,34 -1,16 0,00 -0,40 -0,28 -0,18 -0,26 -0,22 -0,28 -0,021966 0,42 0,29 0,91 0,36 0,32 0,47 0,15 -0,05 0,14 0,32 0,67 0,65 -0,36 0,41 0,48 0,16 -0,16 0,361967 0,02 -0,02 0,37 0,02 0,09 -0,04 -0,20 0,05 0,24 0,21 0,21 0,40 -1,06 -0,17 0,31 0,18 0,11 -0,091968 -0,21 -0,14 -0,19 -0,19 -0,31 0,31 0,11 -0,11 0,01 -0,08 -0,31 -2,68 -0,03 -0,08 -0,41 -0,06 0,50 0,151969 -0,11 0,05 -0,13 0,02 3,01 0,13 -0,18 0,09 0,07 0,08 0,32 1,66 0,04 0,10 -0,09 -0,05 -0,38 -0,571970 -0,07 -0,03 -0,04 0,05 0,53 0,19 -0,38 0,08 0,17 0,16 -0,03 0,40 -0,36 0,02 0,07 0,17 0,01 -1,261971 0,48 -0,53 -0,01 1,72 -3,41 0,45 0,23 0,33 -0,10 0,06 0,02 -0,18 -0,16 0,03 -0,06 -0,11 -0,05 0,151972 -0,07 -0,10 -0,16 -0,17 -0,07 -0,09 -0,09 -0,08 0,00 -0,01 -0,23 -0,02 -0,17 0,00 -0,16 -0,03 -0,04 -0,501973 0,13 0,11 0,04 -0,01 0,15 0,19 0,16 0,07 0,11 0,13 -0,06 0,11 0,63 0,09 0,15 0,20 0,16 0,441974 -0,45 0,18 -0,10 -2,35 -0,20 -0,19 0,07 0,17 -0,25 -0,29 -0,50 -0,92 -0,62 -0,26 -0,08 -0,24 -0,03 -0,441975 -0,07 -1,98 -0,16 0,48 -0,01 -0,40 -0,14 -0,01 0,30 -0,07 -0,05 -1,16 -0,36 -0,13 -0,15 0,01 -0,25 0,081976* 0,10 2,38 -0,91 0,00 -0,21 0,01 0,01 -0,27 -0,03 0,22 0,31 0,42 -0,10 -0,05 0,28 0,03 0,09 0,481977* -1,33 -3,12 -2,15 -2,92 -1,71 -1,59 -0,47 -2,58 -0,38 -1,35 -3,11 -2,57 -5,22 -1,66 -2,91 -3,80 -4,32 -1,871978 -0,78 3,34 2,04 3,00 1,57 2,01 0,58 1,99 0,21 1,44 3,01 3,44 4,93 1,63 2,41 3,73 4,45 0,391979 2,25 -0,44 0,71 -0,29 -0,19 0,07 0,07 0,01 -0,33 -0,32 -0,06 0,46 -0,21 -0,04 -0,10 -0,05 0,32 0,731980 0,28 -0,16 -0,65 0,25 0,81 -0,57 0,02 0,49 0,29 0,17 -0,10 0,19 0,13 -0,01 0,07 0,00 -0,45 -0,291981 -0,10 0,62 0,50 -0,05 -0,65 0,22 0,14 -0,57 0,50 0,27 0,35 0,13 -0,34 0,46 0,01 0,49 0,33 0,511982 -0,10 -0,08 -0,40 -0,07 -0,08 -0,06 -0,11 -0,06 -0,23 -0,16 -0,21 -0,10 -0,09 -0,09 -0,07 -0,18 -0,09 0,021983 0,27 0,46 1,64 0,25 0,52 0,09 0,17 0,83 0,05 0,43 -0,06 1,95 0,72 0,27 0,56 0,40 0,38 0,511984 -0,09 -0,10 -0,27 -0,04 -0,03 -0,07 -0,15 -0,04 -0,04 -0,10 0,12 0,07 -0,21 -0,05 -0,16 -0,07 -0,07 -0,121985 -0,15 -0,19 -0,21 -0,20 -0,19 -0,07 -0,10 0,30 -0,05 -0,01 -0,30 -0,02 0,05 -0,13 -0,21 -0,15 -0,10 0,121986 -0,11 -0,21 -0,16 -0,03 -0,03 -0,04 -0,12 -0,47 -0,09 -0,11 -0,06 -0,04 -0,02 -0,09 -0,07 -0,11 -0,04 -0,051987 -0,11 -0,05 -0,15 -0,12 -0,11 -0,29 -0,13 -0,14 -0,13 -0,16 -0,19 -0,21 -0,15 -0,13 -0,07 -0,06 -0,12 -0,201988 -0,24 0,35 1,98 0,40 0,47 1,48 0,08 0,29 -1,54 0,19 0,01 -1,99 1,17 0,73 0,34 0,44 0,73 -0,531989 -0,28 -0,31 -0,19 -0,27 -1,23 -0,25 -0,32 -0,20 0,32 -0,26 -0,28 -0,50 -0,45 -0,13 -0,26 -0,19 -0,33 -0,301990 -0,21 -0,20 -0,16 -0,13 -0,19 -0,11 -0,21 0,06 0,47 -0,14 -0,18 -0,27 -0,20 -0,16 -0,20 -0,25 -0,23 -0,131991 -0,19 -0,13 -0,13 -0,11 -0,08 -0,23 -0,16 0,04 -0,52 -0,08 -0,46 -0,06 -0,07 -0,07 -0,05 -0,03 -0,10 -0,231992 -0,14 -0,01 -0,18 -0,24 -0,24 -0,14 -0,17 -0,35 -1,95 -0,25 0,14 -0,14 -0,20 -0,17 -0,22 -0,20 -0,17 -0,261993 -0,10 -0,15 -0,25 -0,08 -0,12 -0,10 -0,14 0,01 0,40 -0,08 0,07 -0,27 -0,12 -0,08 -0,04 -0,06 -0,07 -0,37

Table 2: Growth in TFP, Based on Estimated Labor shares, Egypt
311 313 314 321 324 331 332 341 342 352 361 371 372 381 382 383 384 39019641965 -0,28 -0,26 -0,63 -0,29 -0,52 -0,68 -0,24 -0,48 -0,44 -1,17 -0,02 -0,41 -0,35 -0,18 -0,43 -0,14 -0,28 -0,461966 0,43 0,31 0,91 0,36 0,21 0,44 0,15 -0,05 0,16 0,32 0,64 0,66 -0,44 0,41 0,31 0,28 -0,08 0,431967 0,03 -0,01 0,38 0,02 0,06 -0,05 -0,20 0,05 0,27 0,23 0,15 0,39 -1,07 -0,15 0,28 0,16 0,05 -0,531968 -0,22 -0,16 -0,19 -0,19 -0,32 0,31 0,10 -0,09 -0,02 -0,07 -0,32 -2,12 -0,04 -0,08 -0,32 -0,06 0,51 0,261969 -0,11 0,04 -0,13 0,02 2,99 0,12 -0,07 0,08 0,05 0,11 0,27 1,67 0,02 0,11 -0,12 -0,05 -0,38 -0,851970 -0,07 -0,04 -0,04 0,06 0,70 0,18 -0,39 0,07 0,17 0,14 0,04 0,41 -0,27 0,02 0,16 0,17 0,01 -1,271971 0,49 -0,53 0,00 1,71 -3,14 0,45 0,23 0,32 -0,10 0,05 0,05 -0,19 -0,07 0,05 -0,14 -0,11 -0,06 0,691972 -0,08 -0,11 -0,16 -0,11 -0,06 -0,10 -0,10 -0,07 0,04 -0,04 -0,15 -0,01 -0,14 -0,01 -0,12 -0,03 -0,03 -0,161973 0,13 0,10 0,04 0,05 0,07 0,18 0,16 0,07 0,14 0,12 0,02 0,10 0,51 0,09 0,13 0,20 0,16 0,181974 -0,44 0,22 -0,10 -2,36 -0,19 -0,18 0,11 0,17 -0,31 -0,30 -0,49 -0,92 -0,52 -0,26 -0,10 -0,23 -0,01 -0,111975 -0,07 -2,52 -0,16 0,48 0,12 -0,40 -0,15 -0,01 0,28 -0,07 -0,05 -0,87 -0,36 -0,13 -0,08 0,01 -0,24 0,021976 0,10 2,37 -0,95 0,00 -0,31 0,00 0,00 -0,23 -0,03 0,22 0,28 0,30 0,01 -0,05 0,30 0,03 0,09 0,391977 -1,33 -3,14 -2,16 -2,92 -1,68 -1,56 -0,48 -2,55 -0,43 -1,34 -3,15 -2,66 -5,13 -1,66 -2,83 -3,81 -4,32 -1,511978 -0,78 3,33 2,00 3,01 1,70 2,02 0,63 2,03 0,17 1,43 3,04 3,51 4,93 1,63 2,70 3,73 4,46 0,471979 2,26 -0,42 0,71 -0,29 -0,17 0,08 0,08 0,03 -0,39 -0,32 0,09 0,44 -0,20 -0,04 -0,18 -0,06 0,37 0,661980 0,28 -0,38 -0,98 0,25 0,97 -0,59 0,04 0,50 0,31 0,18 -0,11 0,20 0,15 -0,02 0,13 0,03 -0,46 -0,281981 -0,10 0,62 0,41 -0,06 -0,63 0,16 0,14 -0,55 0,50 0,27 0,33 0,11 -0,48 0,46 0,06 0,49 0,31 0,501982 -0,11 -0,08 -0,61 -0,08 -0,05 -0,09 -0,12 -0,06 -0,28 -0,17 -0,15 -0,20 -0,11 -0,09 -0,07 -0,20 -0,14 -0,041983 0,27 0,48 1,61 0,22 0,43 0,08 0,19 0,84 0,08 0,44 -0,05 1,87 0,75 0,27 0,50 0,40 0,39 0,411984 -0,12 -0,09 -0,26 -0,06 -0,01 -0,10 -0,26 -0,03 -0,17 -0,11 0,09 0,02 -0,24 -0,07 -0,09 -0,09 -0,14 -0,031985 -0,17 -0,17 -0,21 -0,30 -0,16 -0,13 -0,16 0,20 0,04 -0,01 -0,33 -0,06 0,09 -0,14 -0,19 -0,15 -0,07 0,011986 -0,14 -0,22 -0,16 -0,05 -0,04 -0,18 -0,11 -0,41 -0,21 -0,12 0,11 -0,06 -0,01 -0,09 -0,07 -0,12 0,02 -0,091987 -0,09 -0,05 -0,15 -0,13 -0,15 0,01 0,04 -0,14 -0,19 -0,15 -0,22 -0,16 -0,29 -0,10 -0,05 -0,03 -0,10 -0,191988 -0,27 0,34 1,96 0,40 0,52 1,54 0,08 0,30 -1,15 0,19 0,10 -2,31 1,26 0,78 0,32 0,44 0,65 -0,381989 -0,21 -0,30 -0,21 -0,26 0,06 -0,27 -0,38 -0,23 -0,44 -0,27 -0,26 -0,18 -0,34 -0,16 -0,26 -0,18 -0,32 -0,381990 -0,17 -0,20 -0,17 -0,12 -0,09 -0,16 -0,20 0,01 -0,19 -0,13 -0,16 -0,18 -0,20 -0,17 -0,20 -0,26 -0,23 -0,101991 -0,08 -0,29 -0,13 -0,12 -0,12 -0,16 0,02 -0,01 -0,10 -0,06 -0,11 -0,08 -0,07 -0,07 -0,06 0,00 -0,11 -0,111992 -0,32 0,03 -0,19 -0,21 -0,23 -0,17 -0,26 -0,35 0,06 -0,24 -0,37 -0,27 -0,23 -0,17 -0,22 -0,21 -0,14 -0,151993 -0,10 -0,22 -0,21 -0,05 -0,01 -0,09 -0,03 0,01 -0,03 -0,10 -0,05 -0,08 -0,11 -0,08 -0,03 -0,06 -0,12 0,05

Appendix 3A: Select Sector Specific Growth Accounting for Iran
Table 1: Growth Accounting for Food Processing (311), Iran
Contribution of L, K and TFP to the Growth of OutputCL CK CTFP total
83 0,04687 -0,326042 1,279171 184 -0,554288 -0,309891 1,86418 184 0,618422 -1,051453 1,433031 186 -0,091351 -0,210851 1,302202 187 0,613859 6,158051 -5,77191 188 0,205918 -0,40763 1,201712 189 -0,018179 -0,391514 1,409692 190 -0,037916 -0,265975 1,303891 191 -0,041364 0,059562 0,981802 192 -0,043135 -0,236263 1,279397 193 0,055566 -0,012039 0,956473 1
Table 2: Growth Accounting for Petroleum Refineries (353), Iran
Contribution of L, K and TFP to the Growth of OutputCL CK CTFP total
83 0,766946 0,124315 0,108739 184 0,575596 0,009856 0,414548 185 -2,080119 1,443717 1,636402 186 -0,03335 0,032194 1,001156 187 0,007741 0,279533 0,712726 188 0,091809 0,194014 0,714177 189 0,066765 -0,252162 1,185398 190 -0,008532 0,481128 0,527404 191 -0,045803 0,149833 0,89597 192 0,038799 0,186983 0,774219 193 -0,015781 -0,004817 1,020598 1
Table 3: Growth Accounting for Transport Equipment (384), Iran
Contribution of L, K and TFP to the Growth of OutputCL CK CTFP total
83 -0,000305 0,279014 0,721292 184 0,101439 0,295797 0,602765 185 -0,242772 -0,066278 1,30905 186 -0,073631 0,262713 0,810918 187 0,010722 0,460547 0,528731 188 -0,017484 0,183023 0,834461 189 0,01237 0,007593 0,980037 190 -0,019887 0,093658 0,926229 191 -0,022953 0,034379 0,988574 192 -0,074785 -0,055654 1,130438 193 -0,841259 1,993092 -0,151834 1

Chart 1: Growth Accounting for Food Processing (311), Iran
Chart 2: Growth Accounting for Petroleum Refineries (353), Iran
Chart 3: Growth Accounting for Transport Equipment (384), Iran
Food Proc. (311)
-8-6-4-202468
83 84 85 86 87 88 89 90 91 92 93
Co
ntr
ibu
tio
n
CkClCtfp
Petroleum refineries (353)
-3
-2
-1
0
1
2
83 84 85 86 87 88 89 90 91 92 93
CkClCtfp
Transport Equip. (384)
-1-0,5
00,5
11,5
22,5
83 84 85 86 87 88 89 90 91 92 93
CkClCtfp

Appendix 3B: Select Sector Specific Growth Accounting for Egypt
Table 1: Growth Accounting for Food Processing (311), Egypt
Contribution of L, K and TFP to the Growth of OutputCL CK CTFP total
65 -0,0176 -0,1096 1,12713 166 0,03849 0,10479 0,85672 167 0,4221 0,42112 0,15678 168 -0,135 0,01651 1,1185 169 -1,1578 -0,7491 2,90687 170 -3,0726 -1,5548 5,62736 171 0,01671 0,02275 0,96055 172 -0,5385 -0,2121 1,75058 173 0,11198 0,0465 0,84152 174 0,03137 -0,01 0,97864 175 -0,5128 0,01273 1,50007 176 0,13417 0,09051 0,77532 177 -0,0511 -0,0342 1,08536 178 -0,0387 -0,0514 1,09004 179 0,0074 0,01997 0,97263 180 0,06178 0,06395 0,87427 181 -0,0067 -0,6011 1,60773 182 0,108 -0,3113 1,20326 183 0,13783 0,21275 0,64942 184 1,34778 8,06809 -8,4159 185 0,1364 -0,3253 1,18887 186 -0,156 -0,6343 1,79027 187 3,72753 1,45058 -4,1781 188 -0,0281 -0,1189 1,14695 189 -0,244 0,0514 1,1926 190 -0,3973 -0,0466 1,44396 191 2,89215 0,49503 -2,3872 192 0,29239 0,01807 0,68954 193 0,05507 0,01304 0,93189 1

Table 3: Growth Accounting for Transport Equipment (384), Egypt
Contribution of L, K and TFP to the Growth of OutputCL CK CTFP total
65 0,13178 0,05313 0,81509 166 1,78699 0,06896 -0,8559 167 1,4266 -0,1771 -0,2495 168 -0,1033 -0,0023 1,10556 169 5,48102 0,84121 -5,3222 170 0,2577 0,58861 0,15369 171 0,70828 -0,0998 0,39153 172 1,25531 0,21939 -0,4747 173 0,3272 0,06179 0,61101 174 0,82768 0,03626 0,13606 175 -1,4719 -0,1589 2,63085 176 0,02452 -0,1496 1,12511 177 -0,006 -0,006 1,01199 178 0,01464 0,02102 0,96435 179 -0,0925 0,17346 0,91902 180 -0,0624 -0,0709 1,13329 181 -0,051 0,16906 0,88192 182 0,06984 -0,3752 1,3054 183 0,05652 0,03043 0,91306 184 0,57417 -0,3136 0,73942 185 1,90899 0,38663 -1,2956 186 0,84275 0,05972 0,09753 187 6,13527 2,19765 -7,3329 188 0,26539 0,01097 0,72364 189 0,17171 -0,0181 0,84644 190 0,20061 0,03438 0,76501 191 0,38609 0,12238 0,49153 192 -0,6562 0,19147 1,46478 193 0,50242 0,06067 0,43691 1

Table 2: Growth Accounting for Other Chemicals (352), Egypt
Contribution of L, K and TFP to the Growth of Output CL CK CTFP total
65 -0,0079 -0,0371 1,04498 166 0,1389 0,10928 0,75182 167 -0,5742 0,26166 1,31253 168 -1,4802 -1,7948 4,27504 169 0,05577 0,39858 0,54565 170 0,22656 -0,0742 0,84762 171 -0,1071 -0,2419 1,34907 172 -2,7901 0,90927 2,8808 173 0 -0,1197 1,11971 174 -0,0669 0,0371 1,02985 175 0,07012 0,06902 0,86086 176 0,03358 0,01656 0,94985 177 0,01004 -0,0099 0,99987 178 0,02764 0,01235 0,96001 179 0,02365 -0,0591 1,03541 180 0,39064 -0,1336 0,74298 181 0,12222 0,16452 0,71326 182 0,34931 -0,4535 1,10422 183 0,08616 0,10917 0,80467 184 0,45114 -0,3699 0,91874 185 0,95952 0,10723 -0,0667 186 0,11329 -0,1118 0,99848 187 17,1138 11,8375 -27,951 188 -0,0194 0,16947 0,84993 189 0,13526 -0,0141 0,87885 190 -1,0586 -0,1653 2,22391 191 -0,2968 0,16519 1,13158 192 -0,1123 -0,0276 1,13989 193 0,06959 -0,1357 1,0661 1

Chart 1: Growth Accounting for Food Processing (311), Egypt
Chart 2: Growth Accounting for Other Chemicals (352), Egypt
Chart 3: Growth Accounting for Transport Equipment (384), Egypt
Food Proc. (311)
-10
-8
-6
-4
-2
0
2
4
6
8
10
65 67 69 71 73 75 77 79 81 83 85 87 89 91 93
CKCLCTFP
Other Chemicals (352)
-35
-30
-25
-20
-15
-10
-5
0
5
10
15
20
65 67 69 71 73 75 77 79 81 83 85 87 89 91 93 CKCLCTFP
Transport Equip. (384)
-10
-8
-6
-4
-2
0
2
4
6
8
65 67 69 71 73 75 77 79 81 83 85 87 89 91 93
CK
CL
CTFP

Appendix 4A: Sectoral Distribution of Capital Stock Growth f
Iran: Sectoral Distribution of Capital Stock Growth, 1983-90
0
2
4
6
8
10
-0,2 -0,2 -0,1 -0,1 0 0,05 0,1 0,15 0,2 0,25 0,3 0,35 0,4
Iran: Sectoral Distribution of Capital Stock, 1991-97
0
2
4
6
8
10
-0,2 -0,2 -0,1 -0,1 0 0,05 0,1 0,15 0,2 0,25 0,3 0,35 0,4
Iran: Sectoral Distribution of Capital Stock Growth, 1983-97
0
2
4
6
8
10
-0,2 -0,2 -0,1 -0,1 0 0,05 0,1 0,15 0,2 0,25 0,3 0,35 0,4

Appendix 4B: Sectoral Distribution of Capital Stock for Egyp
Egypt: Secotral Distribution of Capital Stock Growth: 1965-69
0
1
2
3
4
5
6
-0,2 -0,2 -0,1 -0,1 0 0,05 0,1 0,15 0,2 0,25 0,3 0,35 0,4
Egypt: Sectoral Distribution of Capital Stock Growth: 1980-84
0
1
2
3
4
5
6
7
-0,2 -0,2 -0,1 -0,1 0 0,05 0,1 0,15 0,2 0,25 0,3 0,35 0,4
Egypt: Sectoral Distribution of Capital Stock Growth: 1994-95
0
1
2
3
4
5
6
7
8
-0,2 -0,2 -0,1 -0,1 0 0,05 0,1 0,15 0,2 0,25 0,3 0,35 0,4
Egypt: Sectoral Distribution of Capital Stock Growth: 1965-95
0
2
4
6
8
10
12
-0,2 -0,2 -0,1 -0,1 0 0,05 0,1 0,15 0,2 0,25 0,3 0,35 0,4