fer: sarah [email protected] prtm: anju [email protected] lar
TRANSCRIPT
Submitting a non-thesis masters paper to the NCSU Digital Repository
Student First Name: __Sae__________________ Last Name:_____Makino_____________________
Date of final exam: ___May 7, 2004___________________________________
Degree and track: __Master of Natural Resources (International Resources Option) _________
Paper title: ___Linking forests to markets: chain of custody certification under the Forest Stewardship
Council _____________________________________________________________________
Keywords (5-10 words that the library can enter as search terms in the NCSU Digital Repository):
_”forest certification”, “chain of custody”,
_____________________________________________________________________________________
____________________________________________________________________________________
The document needs to be submitted as a PDF, using the guide below.
Submit your paper to the following person, depending on your home department:
FER: [email protected]
PRTM: [email protected]
LAR: [email protected]
Soil Science: [email protected]
Other: [email protected]
I give permission for this document to be stored in the NCSU Repository, hosted by the libraries.
___________________________________________________ ________________________
(name) (date)
Linking forests to markets: chain of custody certification under the Forest
Stewardship Council
By
Sae Makino
Submitted to the Graduate Faculty of
North Carolina State University
in partial fulfillment of the
requirements for the Degree of
Master of Natural Resources
International Resources Technical Option
Raleigh, North Carolina
2004
Approved by advisory committee:
Erin Sills, Chair
Fred Cubbage
Susan Moore
May 7, 2004

Abstract
Makino, Sae. Master of Natural Resources – International Resources Technical Option. Linking Forests to
markets: chain of custody certification under the Forest Stewardship Council.

Acknowledgements
While pursuing my master’s degree at the Department of Forestry,
North Carolina State University, I encountered various challenges because the
educational system, academic requirements, and the language are different from what I
was used to in Japan. Most of the time, I enjoyed confronting those challenges and
achieving success, thanks to a lot of support that I was very lucky to have from many
people. Without help from those people, I would not have been able to achieve this
success and I would like to take this opportunity to thank some of them.
I would like to show great gratitude to Michael Siller for his continuous encouragement,
patience, and sacrifices to assist my academic program. His support and collaboration
always kept me moving forward and gave me a sense of being accompanied all the time.
This accomplishment is as much his as it is mine.
I am also very grateful for the immense assistance from the members of my graduate
committee. I was very fortunate to be supported by Dr. Erin Sills, my advisor and chair
committee member. I am very thankful not only for her direction during the project, but
also for her infinite encouragement, counsel, and the generous opportunity she gave in
pursuing my project. I also owe a great deal to Dr. Fred Cubbage and Dr. Susan Moore
for their expertise and ability to direct my project. Their professional assistance
strengthened me in my pursuit of completing my project.
Lastly but by no means last in my mind, I would like to thank my family, who have
always supported my dream and way of life, and looking out for my welfare incessantly.
My sister, Chieko Makino, always inspires me with her brilliant mind and wonderful
attitude. I would not even have been able to start the program without support from my
Mother and Father, Mari and Isao Makino. They raised me to be liberal, challengeable,
and positive in my aspirations. Their love is forever the source of my power to persevere
in my efforts.
iii
Contents
CHAPTER I.................................................................................................... 1
INTRODUCTION TO CHAIN-OF-CUSTODY CERTIFICATION......................1 1.1 Introduction .......................................................................................1 1.2 CoC Certification Systems ................................................................4
1.2.1 Forest certification .....................................................................4 1.2.2 The CoC mechanism...................................................................5
1.3 Forest certification schemes..............................................................8 1.3.1 FSC..............................................................................................9 1.3.2 PEFC.........................................................................................12 1.3.3 CSA ...........................................................................................14 1.3.4 MTCC........................................................................................16
1.4 Overall view of this study ...............................................................20
CHAPTER II ................................................................................................ 21
TRENDS IN PRODUCTS OF CHAIN-OF-CUSTODY CERTIFICATION HOLDERS.......................................................................................................21
2.1 Introduction .....................................................................................21 2.2 Research questions ..........................................................................24 2.3 Objectives.........................................................................................24 2.4 Methods............................................................................................24 2.5 Results .............................................................................................27
2.5.1 Trends in number of companies...............................................27 2.5.2 Trends in diversity across the industry sectors ......................29 2.5.3 Industry Sectors Distribution ..................................................31
2.6 Discussion ........................................................................................34
CHAPTER III .............................................................................................. 37
PROFILE OF CHAIN-OF-CUSTODY CERTIFICATE HOLDERS..................37 3.1 Introduction .....................................................................................37 3.2 Research Questions .........................................................................40 3.3 Objectives.........................................................................................40 3.4 Methods............................................................................................41 3.5 Results .............................................................................................42
3.5.1 Data Availability ......................................................................42 3.5.2 Type of Companies ...................................................................44 3.5.3 Employees and Estimated Sales..............................................45 3.5.4 Incorporated Year and SICs ....................................................48
3.6 Discussion ........................................................................................52
iv
CHAPTER IV .................................................................................................. 56
PERSPECTIVES OF COC CERTIFICATE HOLDERS IN THE USA AND JAPAN ............................................................................................................56
4.1 Introduction .....................................................................................56 4.2 Research Questions .........................................................................58 4.3 Objectives.........................................................................................58 4.4 Methodology.....................................................................................59
4.4.1 Sampling design .......................................................................59 4.4.2 Questionnaire development .....................................................59 4.4.3 Method ......................................................................................60
4.5 Results .............................................................................................61 4.5.1 Response rate............................................................................61 4.5.2 Non-response bias ....................................................................62 4.5.3 Certification status...................................................................66 4.5.4 CFPs and marketplaces ...........................................................68 4.5.5 Decision making processes.......................................................72 4.5.6 Expectations .............................................................................81 4.5.7 Perceived benefits.....................................................................89
4.6 Discussion ........................................................................................94 4.6.1 Certification Status ..................................................................94 4.6.2 CFPs..........................................................................................96 4.6.3 Decision Making Processes ......................................................98 4.6.4 Expectations and Perceived Benefits ....................................101
REFERENCES .............................................................................................. 105
APPENDICES ............................................................................................... 113
1
Chapter I
Introduction to Chain-of-Custody Certification
1.1 Introduction
Forest certification Chain-of-Custody (CoC) is a bottleneck in today’s
Certified Forest Product (CFP) markets, resulting in the large majority of
products produced from certified forests being sold without reference to forest
certification (UN 2002; Rametsteiner 2003). This weakness of the forest
certification system prevents both producers and consumers from receiving
the benefits of forest certification, in which consumers are given the choice to
purchase environmentally sound products, and producers are able to acquire
marketing advantages. As a result of this underemphasis on the certification
system among manufacturers and distributors, development of the market
for CFPs has been generally been limited to niche products and challenges for
the further success of forest certification have not been met.
The impediments to the implementation of CoC certification among
the forest industry sectors are mainly a result of the following characteristics
of forest products (Groves 1996; Vogt 2000):
The fragmented wood-supply system: the nature of wood production
2
requires a large land area. Consequently, a diversity of ownership is
typically involved, posing an obstacle to obtaining large volumes of raw
wood material from any one forest. In other words, producers have to
obtain their wood-supply from diverse forests;
Worldwide supply chain: forest products are one of the most widely
traded products in the world, making the CoC of forest products
complicated to establish and difficult to track;
Production economics: CFPs require an additional handling system,
separating them from non-CFPs or using an inventory method, which
requires modification from existing operating systems, additional costs,
and extra operational processes; and
Product nature: highly processed forest products are manufactured
through very complex processing chains, involving many producers
and traders. Additionally, many forest products are comprised of
multiple species of wood and/or multiple components.
These characteristics of forest products make the promotion of CoC
certification among forest industry manufacturers and distributors more
challenging unless there are enough incentives and benefits flowing from
forest certification. Potential benefits from forest certification can include:
Price premiums: buyers’ willingness to pay for environmentally
friendly products may yield price premiums;
3
Market access: CFPs may provide opportunities to enter new markets
or to maintain current market share; and
Company image: certification may improve companies’ images and
improve their credibility in the eyes of the public.
(Rickenbach 2000)
These benefits will be generated only if a majority of consumers
recognize and appreciate the benefits of forest certification, resulting in a
large and continuously increasing demand for CFPs. Currently, however, the
market for CFPs is very limited in terms of both overall volume and
geographic scope. Although business-to-business markets have shown
increasing interest in CFPs – thanks in large part to environmental NGOs
that create a demand for CFPs by creating buyers’ groups – demand for CFPs
by private end-users is still insignificant (Rametsteiner 1999; Smouts 2002).
While this lack of end-user awareness and interest is one of the fundamental
obstacles to the growth of the market for CFPs worldwide, there is a
movement by certain major forest products retailers to create consumer
demand for CFPs. This retailer-driven demand can be seen most clearly in
Europe and North America (Rametsteiner 2003).
Forest certification, originally initiated in the early 1990’s as a
primarily European response to consumer-driven concerns regarding tropical
4
deforestation, is now becoming an important instrument for communication
on sustainable forest management throughout the forest and trade related
sectors. In short, the role of the supply-side in increasing demand for CFPs
and overcoming environmental shortcomings of forest products CoC is
becoming essential, and will be a critical factor to the success of forest
certification in the future.
1.2 CoC Certification Systems
1.2.1 Forest certification
Forest management certification can be performed in three different
forms, depending on the relationship between the auditor and the party being
audited. First-party certification is an internal assessment by an
organization of its own systems and practices. Second-party certification is
an assessment conducted by an affiliated group, such as customers or an
outside trade association. Lastly, third-party certification is an assessment by
a neutral third-party based on a set of accepted principles and standards.
Another important consideration for the forest certification system is the
difference between systems-based certification and performance-based
schemes.
Systems-based certification requires an organization to have
5
management systems designed to recognize the company’s impact on the
environment, to monitor that impact, and improve performance.
Performance-based certification requires the audited party and the land on
which timber is grown to meet a specific set of previously adopted
performance requirements (Hansen 1998; Vogt 2000).
Most comprehensive forest certification programs consist of two
components: the first is forest management certification, an evaluation of
forest operation systems based on previously-established criteria and
standards. The other is CoC certification, a system to track the origin of raw
materials. While forest management certification aims to achieve
sustainable forest management, the main objective of CoC certification is to
verify for consumers that the products are coming from certified forests.
Therefore, CoC certification provides the definitive link between the producer
and the consumer, making the forest certification system more
comprehensive and effective.
1.2.2 The CoC mechanism
CoC is the process of tracing materials through the supply chain in
order to know where the material in a particular product came from (Dykstra
2002). CoC involves tracking and documenting a product through all phases
of ownership, processing and transportation between the certified forest and
6
the final consumer. Consequently, CoC can contain a series of “processing
stages” or production phases and “between processing stages” or
transportation phases. Although the supply chain for forest products can
often be very long and complex, e.g., from trees in a forest to a cabinet in a
kitchen, each stage can be addressed separately in order to achieve a
comprehensive CoC information system.
There are three ways for firms to approach CoC certification,
depending on the type of products and operation being certified: the physical
separation system, the percentage based system, and the input/output model.
The physical separation system requires each batch of CFPs to be physically
separated from non-CFPs at every stage in the chain. The percentage based
system uses inventory control and the accounting of wood flow to maintain a
minimum percentage of certified material by volume or weight. The
input/output model is based on the premise that when a known percentage of
certified raw material enters into processing, an equal percentage of the
finish product will be CFPs as well (ITTO 2002; Anderson 2004).
All CoCs consist of the same fundamental elements: 1) information on
quantities; 2) management of critical control points; and 3) personnel
training. However, implementation technologies may vary in practice
depending on local circumstances and the point in the processing chain
7
(Dykstra 2002). These elements can be described as follows:
1) Information on quantities: the collection and recording of information
on the quantity (volume, weight, piece, or value) of material
distributed or manufactured is a very important aspect of CoC. In the
processing stages, data on the quantity of raw material purchased
and the quantity of product sold is maintained. In the between
processing stages, data on the quantity sold by the preceding
processor and the quantity purchased by the subsequent processor in
the chain is required.
2) Critical control points: critical control points are points in the
processing chain where unauthorized materials can potentially
become part of a CFP, resulting in the diminished credibility of CoC
among consumers. To minimize the risk of critical control points, the
development of three systems is required: product identification,
segmentation, and documentation and records. Identification is
accomplished by applying one of many labeling technologies, such as
paint and chisel labels, radio-frequently identification, barcode
information, etc.; segmentation is accomplished by handling and
processing CFPs separately from non-CFPs; and documentation and
records are maintained by keeping records of all inputs, processing
and outputs of certified products.
3) Personnel training: the training, control and management of
8
personnel who implement the CoC at each stage of the chain is a
critical factor for the success of the CoC system, in order to prevent
accidentally breaking the CoC, and intentional fraud in the CoC.
1.3 Forest certification schemes
Increasing worldwide interest in forest certification has inspired a
proliferation of certification schemes. Over 50 certification programs are
currently active worldwide (IUCN 2003). However, the world’s share of
certified forests are dominated by a few major certification schemes: the
Programme for the Endorsement of Forest Certification Schemes – formerly
known as Pan-European Forest Certification (covering 38% of all certified
forests), the Forest Stewardship Council (23%), the Sustainable Forest
Initiative (17%), the American Tree Farm System (10%), the Canadian
Standards Association (8%), and others (4%) (Atyi 2002). Although most
certification programs are global schemes or national initiatives in developed
countries, several tropical timber-producing countries have been actively
developing their own national certification schemes. The most advanced of
these programs include the Malaysian Timber Certification Council, The
Lembaga Ekolabeling Institute (Indonesian Eco-label Institute), and
Programa de Certificação de Florestas (The Brazilian Forest Certification
System) (ITTO 2002).
Of the above certification schemes, the Forest Stewardship Council
9
(FSC), the Pan-European Forest Certification (PEFC), the Canadian
Standards Association (CSA), and the Malaysian Timber Certification
Council (MTCC) have CoC certification and require it in order for a product
to be labeled. However, CoC requirements and implementation mechanisms
are different among these forest certification schemes (Brack 2002).
Although the Sustainable Forest Initiative (SFI) developed an ecolabel in
2002, its approach to CoC is different from the other forest certification
schemes. Whereas the other schemes require a formal and physical process
in order to issue a CoC certificate, SFI addresses CoC certification through
third-party audits of a firm’s procurement system, in which a verifiable
monitoring system evaluates the results of reforestation promotion and use of
Best Management Practices within wood supply systems. However, there is
no control requirement for the CoC mechanism in order to use the SFI logo on
products (Anderson 2004).
1.3.1 FSC
FSC is an independent, not-for-profit, non-governmental organization
founded in 1993 to support environmentally appropriate, socially beneficial,
and economically viable management of the world's forests. Three types of
certification are available from the FSC: forest management certificates, CoC
certificates, and joint forest management chain-of-custody certificates.
Inspection and verification of all three types of certification are conducted by
FSC-accredited and endorsed certification bodies. FSC developed forest
10
management standards based on ten Principles and Criteria for responsible
forest management, and CoC standards for manufacturers and processors of
forest products. FSC has newly developed a CoC Standard for Companies
Supplying and Manufacturing FSC-certified Products, combining previous
standards for chip and fiber products, sawed wood products, and assembled
products. The new standard employs a physical separation system and also
introduced a minimum percentage system. This Standard will be effective by
the end of 2004. The standard requires the following aspects (FSC 2004):
1) Companies shall designate a responsible person;
2) Scope of CoC system – companies shall: maintain an FSC product
group line of all product groups in the company’s FSC CoC control
system; categorize each product group as FSC-pure, FSC-mixed, or
FSC-recycled; and have a CoC control system that is sufficient to
ensure that all products meet CoC requirements;
3) Companies shall have written procedures and/or work instruction to
ensure implementation;
4) Companies shall maintain records and reports of products for at
least five years;
5) Companies shall specify the training requirements and provide
training to all staff;
6) Input specification – companies shall: specify all input material as
FSC-pure wood/fiber, FSC-mixed wood/fiber, post-consumer
11
reclaimed wood, or controlled wood; require written specification
from the wood suppliers and for the purchase of all certified and
post-consumer reclaimed material; and control all non-certified
material and other reclaimed wood;
7) Companies generating reclaimed material on-site shall allocate the
wood/fiber to FSC pure, FSC-mixed, post-consumer reclaimed,
controlled, or uncontrolled wood/fiber
8) Companies collecting or trading in post-consumer reclaimed material
shall meet all applicable requirements;
9) Companies shall check all wood/fiber to be identifiable on arrival and
store FSC-pure wood/fiber separately or identifiably if companies
wish to retain its status as FSC-pure;
10) Production control and records – companies shall record the inputs
of certified material on a monthly basis and identify a number for all
product groups;
11) Companies shall comply within the FSC Trademark Policy Manual
to be eligible for on-product FSC trademark use;
12) Minimum requirements for FSC-labeling – companies shall comply
with minimum requirements for labeling: the FSC-pure label
requires 100% certified material; the FSC-mixed label requires, in
addition to 10% annual average FSC credit accounting, that 70% of
the total wood/fiber is at least certified material or is when combined
12
with the post-consumer reclaimed wood/fiber and certified material;
and the FSC-recycled label requires that at least 70% of the total
wood/fiber be post-consumer reclaimed wood;
13) Companies shall calculate the percentage according to FSC
calculation requirements and have written procedures and/or work
instructions;
14) FSC credit account – companies shall: identify the inputs and the
conversion factor for each component; record the FSC credit entered
for each component; calculate monthly the FSC credit based on the
information; and deduct the FSC credit for the amount of products
sold and/or any expired credit after 12 months;
15) Companies shall receive approval of on-product label from its FSC-
accredited certification body and may make claims such as “well-
managed” or “responsibly managed” but may not refer to “the
sustainability” of the production process;
16) Companies shall issue sales invoices including required information;
and
17) Transport documentation shall be issued if the certified products are
transported separately from the sales invoice.
1.3.2 PEFC
The PEFC Council is an independent, not-for profit, non-governmental
organization, founded in 1999 to contribute to the environmentally
13
appropriate, socially beneficial and economically viable management of
forests for present and future generations. PEFC provides forest
management certification and CoC certification schemes, which are carried
out by an independent accredited certification body. PEFC has been revising
the International CoC Standard, which will become effective at the end of
2004. The standard specifies requirements for CoC certification as follows
(PEFC 2004):
1) Minimum management system requirements – companies shall:
define and document their commitment to CoC certification; identify
responsible personnel and establish their responsibilities and
authority; plan procurement of certified raw materials; document all
procedures; establish records on certified products and maintain
them for a minimum period of five years; train and educate all staff;
provide the technical facilities for effective CoC implementation; and
perform inspection to ensure implementation;
2) Requirements for the CoC process (physical separation method) –
companies shall: identify the origin of certified raw material with
associated documents; require certificate documentation from all
suppliers of wood; ensure the certified raw material is separated or
clearly identifiable during the whole process; and provide the
customer with certificate documentation at the point of sale;
3) Requirements for the CoC process (percentage based method) –
14
companies shall: identify the production batch; identify the origin of
certified raw material with associated documents; require certificate
documentation from all suppliers of wood; calculate the certified
percentage based on either the average percentage method or volume
credit method; and provide the customer with certificate
documentation at the point of sale.
1.3.3 CSA
The CSA forest certification scheme is a program of CSA international,
an independent, not-for-profit organization. In 1996, the CSA established
Canada's National Standard for Sustainable Forest Management for their
forest certification. Once a program participant has been certified under
forest management certification, it can also choose to become a CoC
certificate-holder through the CSA Forest Products Marking Program. The
CSA has developed CSA PLUS 1163, which outlines the minimum
requirements for CoC. To be certified under CSA CoC certification, an
organization first has to implement the CoC requirements outlined in CSA
PLUS 1163. Secondly, an independent third party audits the organization’s
CoC, and then it can become licensed to apply the CSA SFM Mark to certified
forest products (CSA). Requirements for CSA CoC are described in CSA
PLUS 1163 as follows (CSA 2001):
1) Management of organizations shall be committed to CoC
certification;
15
2) Document control system – organizations shall identify the
responsible personnel and specify activities, process controls,
information and management systems, and requirements for
controlling these;
3) Organizations shall have a system for verifying the origin of certified
material;
4) The origin of certified material shall be verifiable during transporting,
handing and processing;
5) Optional approaches – three approaches exist to implementing a
CoC: (a) an input/output system for solid wood; (b) a minimum
average percentage system for composite products; and (c) physical
separation; inventory control and accounting of wood flows are
required for the input/output and minimum average percentage
systems; physical separation can be substituted with marking of
certified material;
6) Organizations shall conduct final inspection of certified products at
the end of CoC;
7) Organizations shall establish and maintain procedures for CoC to
keep records for a minimum of five years;
8) A program of periodic internal checking shall be established and
implemented;
9) Organizations shall establish an environmental management system;
16
10) Self-declared product claims shall be accurate and verifiable; and
11) Organizations shall keep a record of all complaints and take
appropriate action, which shall be documented.
1.3.4 MTCC
The MTCC is an independent not-for-profit organization established in
1998 to provide assurance to buyers of Malaysian timber products that the
products have been obtained from sustainably managed forests. The
Malaysian Criteria, Indicators, Activities and Standards of Performance,
published in 1999, were developed for forest management certification based
on the 1998 ITTO Criteria and Indicators for Sustainable Management of
Natural Tropical Forests. MTCC began operation in 2001, providing forest
management certification and CoC certification (MTCC). The requirements
for CoC certification specified in Requirements and Assessment Procedures
for CoC Certification are as follows (MTCC 2000):
1) Companies shall appoint a management representative;
2) Companies shall provide training to all staff and create a written
instructions to guide staff on CoC;
3) Companies shall verify the suppliers’ certification documents;
4) Companies shall establish and maintain written procedures and work
instructions for identifying product flows;
5) For the physical separation system, companies shall store certified
material separately from non-certified material and implement visual
17
identification
6) For the minimum average percentage system, companies shall: conduct
an inventory control and accounting of wood flows; calculate the
percentage of certified material according to the required method;
define the batch period (less than 60 days); and adhere to minimum
percentages for certified material at 70% for solid wood products, 70%
for assembled products made of solid wood parts, 30% for chip and
fiber products, and the representative thresholds for the components
for assembled products made of both solid and chip and fiber parts;
7) Certified products shall be labeled in accordance with the requirements
in MTCC Logo Guide for Certificate Holders;
8) Companies shall provide all related documents at sales; and
9) Companies shall establish and maintain all records for a minimum
period of five years, including purchase, stock, production, and sales
and marketing records.
18
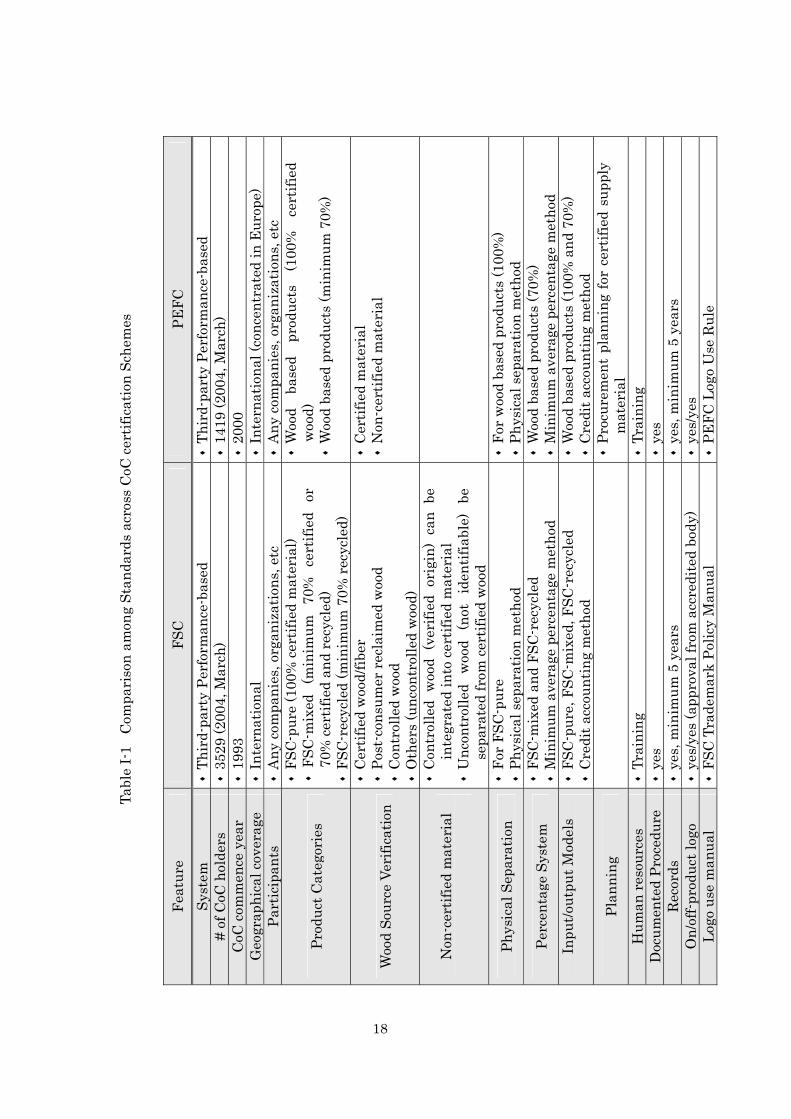
Tabl
e I-
1 C
ompa
riso
n am
ong
Stan
dard
s ac
ross
CoC
cert
ifica
tion
Sche
mes
Feat
ure
FSC
PE
FC
Syst
em
Thi
rd-p
arty
Per
form
ance
-bas
ed
Thi
rd-p
arty
Per
form
ance
-bas
ed
# of
CoC
hol
ders
3
529
(200
4, M
arch
) 1
419
(200
4, M
arch
) C
oC c
omm
ence
yea
r 1
993
200
0 G
eogr
aphi
cal c
over
age
I
nter
natio
nal
Int
erna
tiona
l (co
ncen
trat
ed in
Eur
ope)
Pa
rtic
ipan
ts
Any
com
pani
es, o
rgan
izat
ions
, etc
A
ny c
ompa
nies
, org
aniz
atio
ns, e
tc
Prod
uct C
ateg
orie
s
FSC
-pur
e (1
00%
cert
ified
mat
eria
l) FS
C-m
ixed
(m
inim
um
70%
ce
rtifi
ed
or
70%
cert
ified
and
rec
ycle
d)
FSC
-rec
ycle
d (m
inim
um 7
0% r
ecyc
led)
Woo
d ba
sed
prod
ucts
(1
00%
ce
rtifi
ed
woo
d)
Woo
d ba
sed
prod
ucts
(min
imum
70%
)
Woo
d So
urce
Ver
ifica
tion
Cer
tifie
d w
ood/
fiber
P
ost-
cons
umer
recl
aim
ed w
ood
Con
trol
led
woo
d
Oth
ers
(unc
ontr
olle
d w
ood)
Cer
tifie
d m
ater
ial
Non
-cer
tifie
d m
ater
ial
Non
-cer
tifie
d m
ater
ial
Con
trol
led
woo
d (v
erifi
ed o
rigi
n) c
an b
e in
tegr
ated
into
cert
ified
mat
eria
l U
ncon
trol
led
woo
d (n
ot
iden
tifia
ble)
be
se
para
ted
from
cer
tifie
d w
ood
Phys
ical
Sep
arat
ion
For
FSC
-pur
e
Phy
sica
l sep
arat
ion
met
hod
For
woo
d ba
sed
prod
ucts
(100
%)
Phy
sica
l sep
arat
ion
met
hod
Perc
enta
ge S
yste
m
FSC
-mix
ed a
nd F
SC-r
ecyc
led
M
inim
um a
vera
ge p
erce
ntag
e m
etho
d W
ood
base
d pr
oduc
ts (7
0%)
Min
imum
ave
rage
per
cent
age
met
hod
Inpu
t/out
put M
odel
s
FSC
-pur
e, F
SC-m
ixed
, FSC
-rec
ycle
d C
redi
t acc
ount
ing
met
hod
Woo
d ba
sed
prod
ucts
(100
% a
nd 7
0%)
Cre
dit a
ccou
ntin
g m
etho
d
Plan
ning
Pro
cure
men
t pl
anni
ng fo
r ce
rtifi
ed s
uppl
y m
ater
ial
Hum
an r
esou
rces
T
rain
ing
Tra
inin
g D
ocum
ente
d Pr
oced
ure
yes
y
es
Rec
ords
y
es, m
inim
um 5
yea
rs
yes
, min
imum
5 y
ears
O
n/of
f-pro
duct
logo
y
es/y
es (a
ppro
val f
rom
acc
redi
ted
body
) y
es/y
es
Logo
use
man
ual
FSC
Tra
dem
ark
Polic
y M
anua
l P
EFC
Log
o U
se R
ule
19
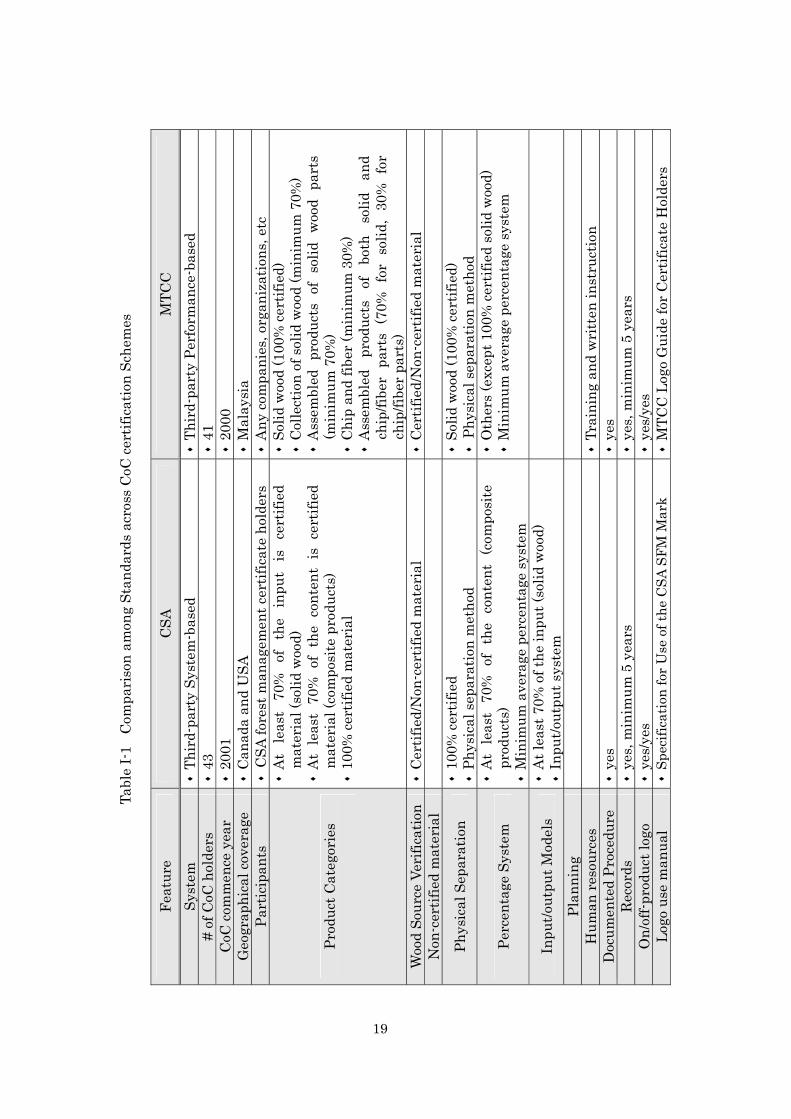
Tabl
e I-
1 C
ompa
riso
n am
ong
Stan
dard
s ac
ross
CoC
cert
ifica
tion
Sche
mes
Feat
ure
CSA
M
TCC
Sy
stem
T
hird
-par
ty S
yste
m-b
ased
T
hird
-par
ty P
erfo
rman
ce-b
ased
#
of C
oC h
olde
rs
43
41
CoC
com
men
ce y
ear
200
1 2
000
Geo
grap
hica
l cov
erag
e
Can
ada
and
USA
M
alay
sia
Part
icip
ants
C
SA fo
rest
man
agem
ent c
ertif
icat
e ho
lder
s A
ny co
mpa
nies
, org
aniz
atio
ns, e
tc
Prod
uct C
ateg
orie
s
At
leas
t 70
%
of
the
inpu
t is
ce
rtifi
ed
mat
eria
l (so
lid w
ood)
A
t le
ast
70%
of
the
cont
ent
is c
ertif
ied
mat
eria
l (co
mpo
site
pro
duct
s)
100
% ce
rtifi
ed m
ater
ial
Sol
id w
ood
(100
% ce
rtifi
ed)
Col
lect
ion
of s
olid
woo
d (m
inim
um 7
0%)
Ass
embl
ed p
rodu
cts
of s
olid
woo
d pa
rts
(min
imum
70%
) C
hip
and
fiber
(min
imum
30%
) A
ssem
bled
pr
oduc
ts
of
both
so
lid
and
chip
/fibe
r pa
rts
(70%
for
sol
id,
30%
for
ch
ip/fi
ber
part
s)
Woo
d So
urce
Ver
ifica
tion
C
ertif
ied/
Non
-cer
tifie
d m
ater
ial
Cer
tifie
d/N
on-c
ertif
ied
mat
eria
l N
on-c
ertif
ied
mat
eria
l
Phys
ical
Sep
arat
ion
100
% ce
rtifi
ed
Phy
sica
l sep
arat
ion
met
hod
Sol
id w
ood
(100
% ce
rtifi
ed)
Ph
ysic
al s
epar
atio
n m
etho
d
Perc
enta
ge S
yste
m
At
leas
t 70
% o
f th
e co
nten
t (c
ompo
site
pr
oduc
ts)
Min
imum
ave
rage
per
cent
age
syst
em
Oth
ers
(exc
ept 1
00%
cer
tifie
d so
lid w
ood)
M
inim
um a
vera
ge p
erce
ntag
e sy
stem
Inpu
t/out
put M
odel
s A
t lea
st 7
0% o
f the
inpu
t (so
lid w
ood)
I
nput
/out
put s
yste
m
Plan
ning
H
uman
res
ourc
es
T
rain
ing
and
wri
tten
inst
ruct
ion
Doc
umen
ted
Proc
edur
e y
es
yes
R
ecor
ds
yes
, min
imum
5 y
ears
y
es, m
inim
um 5
yea
rs
On/
off-p
rodu
ct lo
go
yes
/yes
y
es/y
es
Logo
use
man
ual
Spe
cific
atio
n fo
r U
se o
f the
CSA
SFM
Mar
k M
TCC
Log
o G
uide
for
Cer
tific
ate
Hol
ders
20
1.4 Overall view of this study
The overall objectives of this study are to: 1) assess current CoC
certificate companies from various viewpoints, including industry sectors,
geographical locations, company profile, and company perspectives on forest
certification; 2) discuss trends in the market for CFPs; and 3) discuss ways to
promote CoC certification effectively across countries.
To achieve the above objectives, three different bodies of research were
conducted to analyze current FSC CoC certificate holders. First, as discussed
in Chapter II, forest industry sectors were examined in five countries – Brazil,
Japan, South Africa, the United Kingdom and the United States – with the
aim of developing an understanding of trends in demand for CFPs across
industry sectors and countries. Second, in Chapter III, data gathered on
companies in Japan, the UK and the USA, was assessed for the purpose of
capturing profiles of current CoC certificate holders. Finally, in Chapter IV,
the perspectives of CoC certificate holders in the USA and Japan were
assessed by analyzing the results of surveys conducted of companies in these
two countries.
21
Chapter II
Trends in Products of Chain-of-Custody Certification Holders
2.1 Introduction
One of the challenges facing forest certification is market uncertainty
for certified forest products (CFPs). If demand for CFPs is very small, the
forest industry will have insignificant economic incentive to participate in
forest certification regimes. On the other hand, if demand for CFPs
continuously increases, forest certification will provide foresters and forestry-
related industries with important benefits, such as new market accessibility,
increased sales, enhancement of competitive ability, and so on. However, as
CFPs are not currently recognized in customs classification codes for the
international trade, no official statistical data exist to analyze trends and to
estimate potential development of the market for CFPs.
Although in 2003 the potential annual timber supply from the world’s
certified forests was estimated at approximately 300 million m3, only a small
fraction of the estimated potential wood supply from certified forests is
actually marketed as CFPs, and a large majority of this supply loses its
certification status at some point in the complex CoC of the forest products
22
market (Rametsteiner 2003). This is largely because most certification
schemes have not yet begun issuing CoC certification. Therefore, much of the
forest products produced from forests certified according to certification
programs that have not developed CoC certification systems technically are
unable to move downstream as CFPs. Consequently, the amount of CFPs
sold to end users will not be augmented absent progress in the CoC
certification system.
Since there are no official figures on CFPs, the number of CoC holders
across industry sectors and countries can be used as an indicator of trends in
the demand for CFPs in business-to-business markets. As of March 2004,
nearly 4,500 CoC certifications had been issued worldwide. FSC and PEFC
are the dominant players, having issued roughly 70% and 30% of CoC
certifications, respectively. The number of participants in both certification
schemes has been rapidly growing — the number of FSC CoC holders nearly
tripled from 2000 to 2003, and those holding PEFC CoC tripled from 2001 to
2003 (FSC; PEFC). Companies hold FSC CoC certificates cover a
comparatively wide range of wood-based industries and trade sectors, while
companies holding PEFC CoC certificates are mainly active in more
upstream sectors in the processing chain, such as sawmilling and timber
trade (FSC; PEFC; Rametsteiner 2003). Other major differences between
FSC and PEFC CoC certification programs are: the FSC CoC certification
23
system has been active since 1993 whereas PEFC only began to issue licenses
for trademark use in 2001; and, FSC certifies companies in more than 60
countries worldwide, whereas PEFC’s CoC certifications have been issued to
companies located in just 15 countries, primarily in Europe.
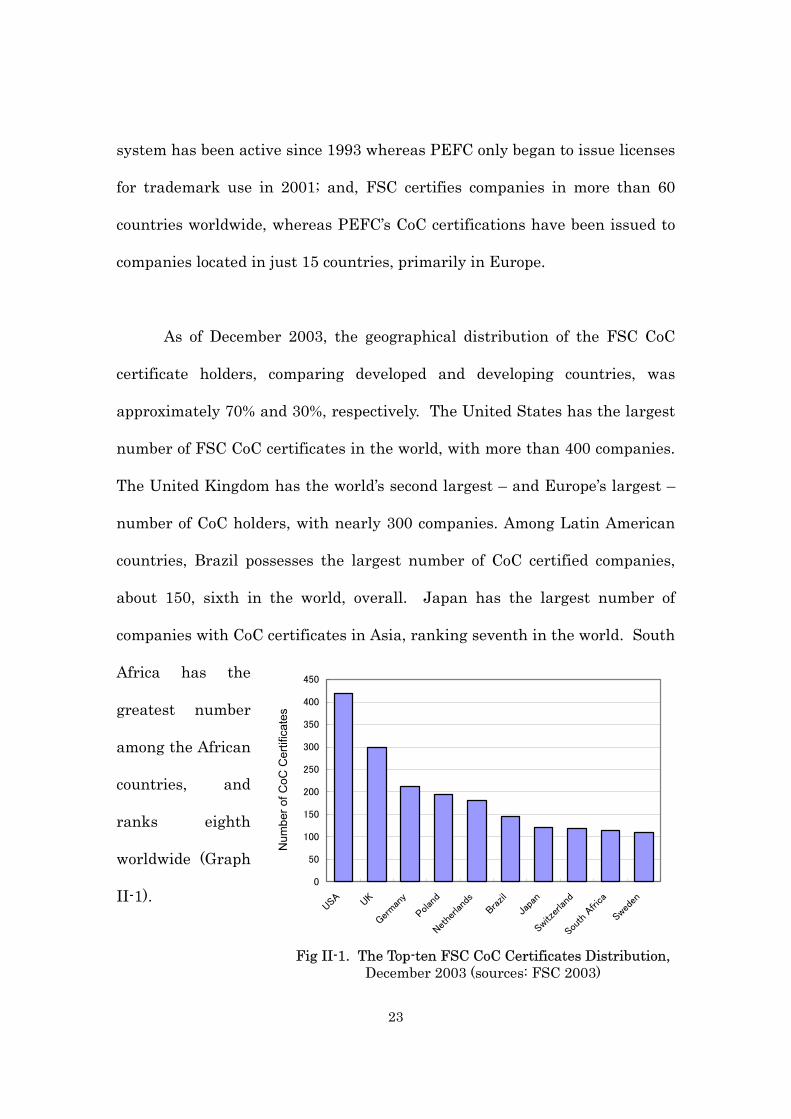
As of December 2003, the geographical distribution of the FSC CoC
certificate holders, comparing developed and developing countries, was
approximately 70% and 30%, respectively. The United States has the largest
number of FSC CoC certificates in the world, with more than 400 companies.
The United Kingdom has the world’s second largest – and Europe’s largest –
number of CoC holders, with nearly 300 companies. Among Latin American
countries, Brazil possesses the largest number of CoC certified companies,
about 150, sixth in the world, overall. Japan has the largest number of
companies with CoC certificates in Asia, ranking seventh in the world. South
Africa has the
greatest number
among the African
countries, and
ranks eighth
worldwide (Graph
II-1).
0
50
100
150
200
250
300
350
400
450
USA UK
German
y
Polan
d
Netherlan
ds
Braz
il
Japa
n
Switz
erlan
d
South Af
rica
Swed
en
Fig II-1. The Top-ten FSC CoC Certificates Distribution, December 2003 (sources: FSC 2003)
Num
ber o
f CoC
Cer
tific
ates
24
2.2 Research questions
The research question for this study is “do trends in demand for CFPs
by countries and/or industry sectors differ?”
2.3 Objectives
The objectives of this research are: 1) to analyze the development of
CFP markets across different industry sectors in the United States, the
United Kingdom, Japan, Brazil, and South Africa; 2) to compare the trends in
demand for CFPs among these five countries; and 3) to discuss reasons for
different trends of the market for CFPs among these five countries.
2.4 Methods
As there are no official figures for trade of CFPs, this research focused
on FSC CoC certification rather than PEFC because: 1) FSC CoC certification
is more well-established, PEFC CoC certification having only been around for
a few years, which does not yet allow for sufficient data to analyze the
relevant market trends, and 2) FSC is available to any company in any
country, regardless of the region, if the company is interested in obtaining
CoC certification. This generates less bias when comparing trends across
countries.
25
The five countries selected – the UK, the USA, Japan, Brazil, and
South Africa, represent the leading holders of CoC certificates in their
respective regions –, North America, Europe, Asia, South America, and Africa.
From the FSC database (FSC 2003), two types of data for all CoC holders in
the five countries were collected: (1) the date that each company was certified
and (2) products that each company offers. From the data, trends in the
number of issued CoC certificates from 1993 to 2003 were first determined for
each country. Secondly, diverse products were categorized into 23 groups
based on observed tendency of goods produced by a company, products’
economic value, phases in the processing chain, and 4-digit standard
industrial classification codes (Appendix 1). These product categories are:
• round wood
• lumber
• plywood / veneer
• MDF / board
• sawmill by-products
• molding
• millwork
• distribution / transportation
• public construction materials
• housing materials
• windows / doors
• flooring
• furniture
• garden products
• household products
• pulp and paper
• wood chips
• firewood / charcoal
• pallets / boxes
• others with high value
26
• others with low value
• non-timber forest product
• non-identified
(other products were divided into higher and lower unit price)
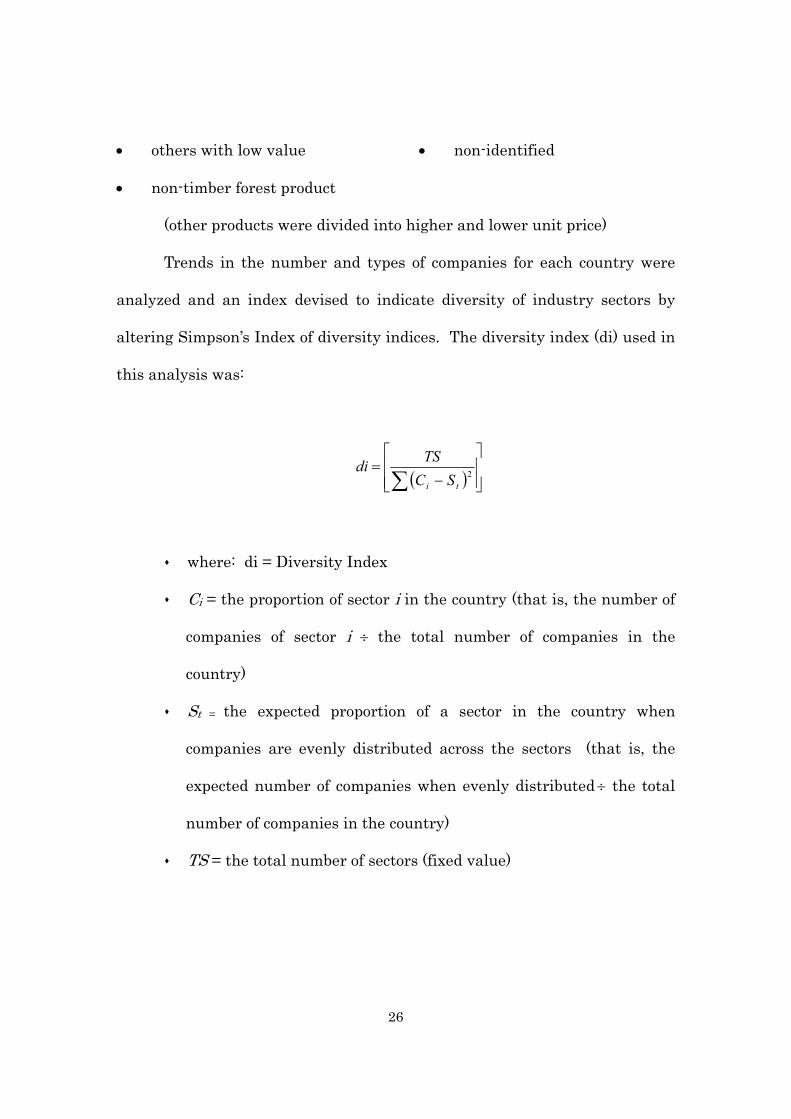
Trends in the number and types of companies for each country were
analyzed and an index devised to indicate diversity of industry sectors by
altering Simpson’s Index of diversity indices. The diversity index (di) used in
this analysis was:
( )
−=
∑ 2ti SC
TSdi
where: di = Diversity Index
Ci = the proportion of sector i in the country (that is, the number of
companies of sector i ÷ the total number of companies in the
country)
St = the expected proportion of a sector in the country when
companies are evenly distributed across the sectors (that is, the
expected number of companies when evenly distributed ÷ the total
number of companies in the country)
TS = the total number of sectors (fixed value)
27
2.5 Results
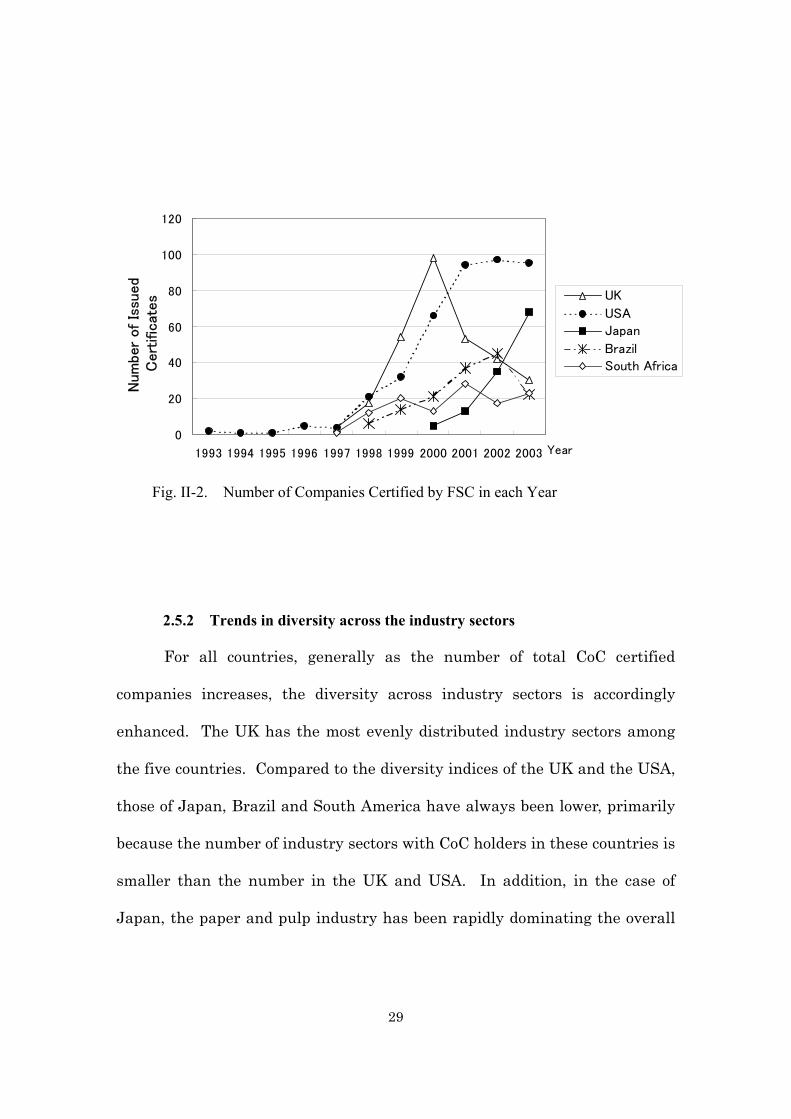
2.5.1 Trends in number of companies
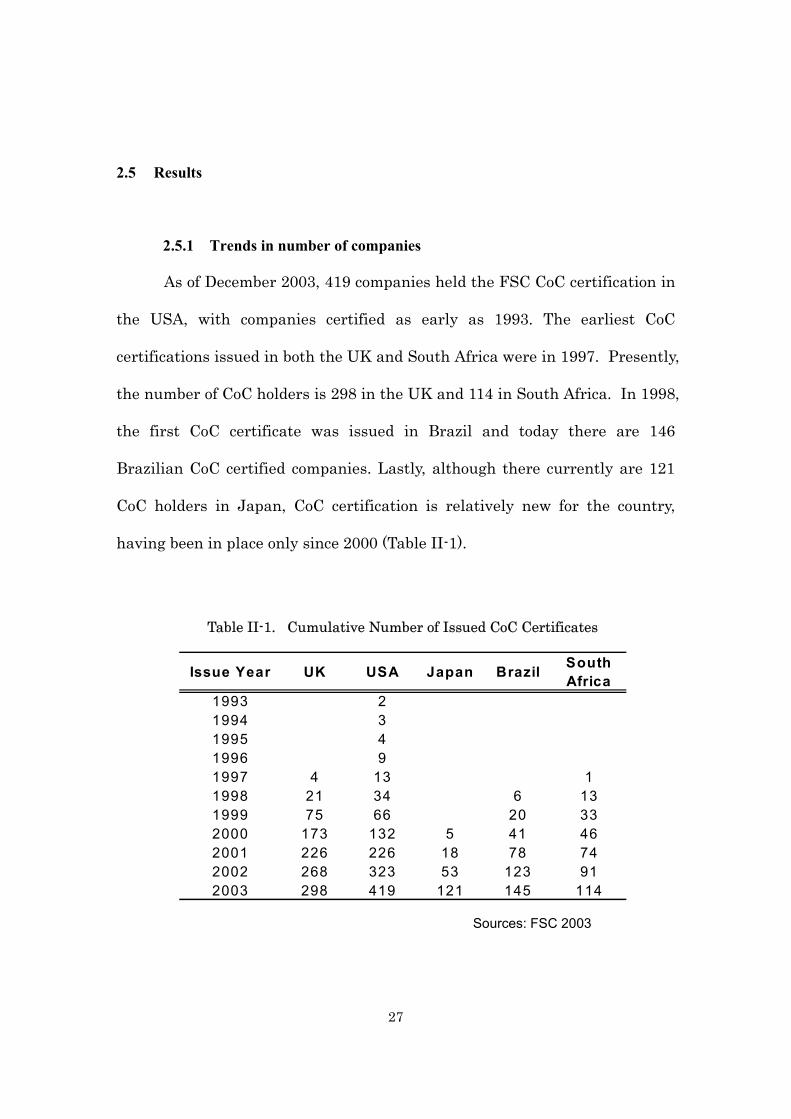
As of December 2003, 419 companies held the FSC CoC certification in
the USA, with companies certified as early as 1993. The earliest CoC
certifications issued in both the UK and South Africa were in 1997. Presently,
the number of CoC holders is 298 in the UK and 114 in South Africa. In 1998,
the first CoC certificate was issued in Brazil and today there are 146
Brazilian CoC certified companies. Lastly, although there currently are 121
CoC holders in Japan, CoC certification is relatively new for the country,
having been in place only since 2000 (Table II-1).
Table II-1. Cumulative Number of Issued CoC Certificates
Sources: FSC 2003
Issue Year UK USA Japan Brazil SouthAfrica
1993 21994 31995 41996 91997 4 13 11998 21 34 6 131999 75 66 20 332000 173 132 5 41 462001 226 226 18 78 742002 268 323 53 123 912003 298 419 121 145 114
28
Although the total number of CoC holders is continuously increasing
across the five countries every year, the growth rate – the number of issued
CoC certificates in each year – differs from country to country, and from year
to year. The number of issued CoC certificates in the UK had multiplied
every year from 1997 to 2000, but after peaking in 2000, the rate of increase
has slowed down. From 1993 to 1997, the number of CoC holders in USA was
rather small and the development of CoC certification was fairly insignificant.
It is also worth noting that during this period the USA was the only country
with CoC certificates among the five. From 1997 to 2001, however, the USA
experienced sharp growth in the number of CoC certificates issued, a
phenomenon similar to that experienced in the UK prior to 2000. Unlike the
UK, however, the rate of increase in the number of certificates issued
annually has remained stable in the USA after peaking in 2001. Japan, the
latest of the five countries to enter the FSC CoC certification arena, has seen
a rapid expansion of the number of certified companies, resembling growth
rates experienced in the UK and the USA during their periods of major
growth. The rate of issuance of Brazilian and South African CoC certificates
has always been slower and unstable compared to the rates experienced in
the other three countries (Graph II-2).
29
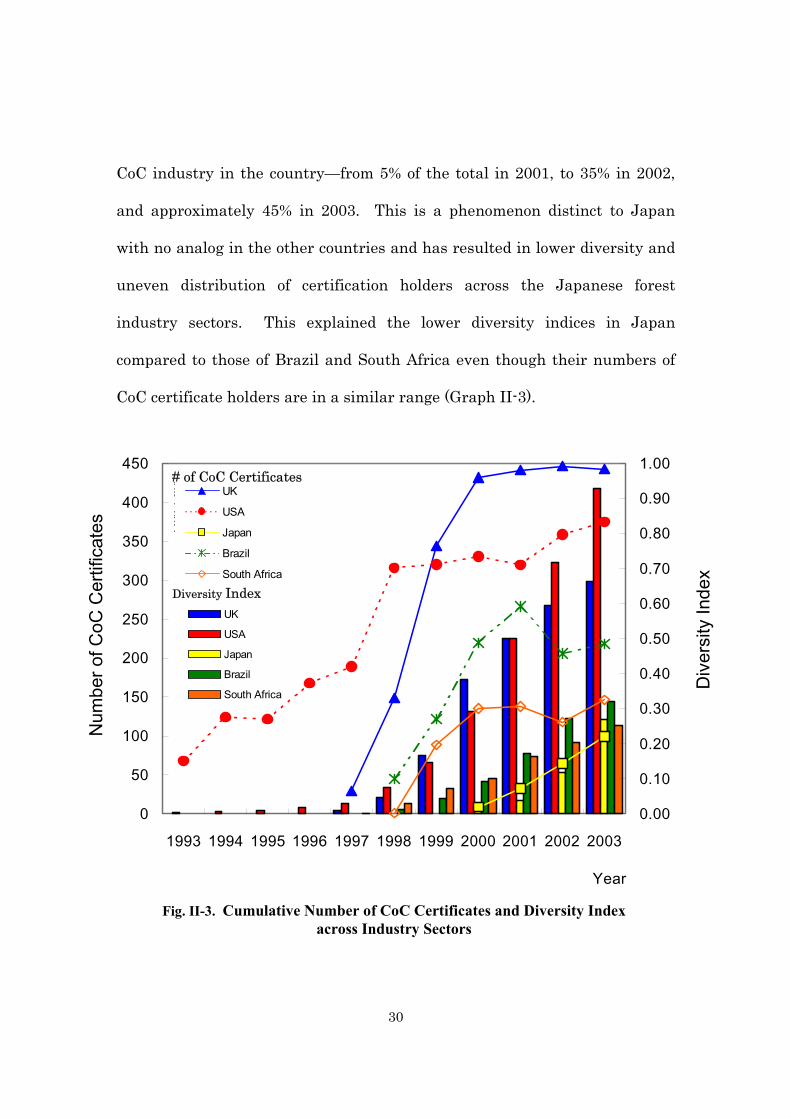
2.5.2 Trends in diversity across the industry sectors
For all countries, generally as the number of total CoC certified
companies increases, the diversity across industry sectors is accordingly
enhanced. The UK has the most evenly distributed industry sectors among
the five countries. Compared to the diversity indices of the UK and the USA,
those of Japan, Brazil and South America have always been lower, primarily
because the number of industry sectors with CoC holders in these countries is
smaller than the number in the UK and USA. In addition, in the case of
Japan, the paper and pulp industry has been rapidly dominating the overall
0
20
40
60
80
100
120
1993 1994 1995 1996 1997 1998 1999 2000 2001 2002 2003 Year
Num
ber
of
Issu
ed
Cert
ific
ates UK
USA
Japan
Brazil
South Africa
Fig. II-2. Number of Companies Certified by FSC in each Year
30
CoC industry in the country—from 5% of the total in 2001, to 35% in 2002,
and approximately 45% in 2003. This is a phenomenon distinct to Japan
with no analog in the other countries and has resulted in lower diversity and
uneven distribution of certification holders across the Japanese forest
industry sectors. This explained the lower diversity indices in Japan
compared to those of Brazil and South Africa even though their numbers of
CoC certificate holders are in a similar range (Graph II-3).
0
50
100
150
200
250
300
350
400
450
1993 1994 1995 1996 1997 1998 1999 2000 2001 2002 2003
Year
Num
ber o
f CoC
Cer
tific
ates
0.00
0.10
0.20
0.30
0.40
0.50
0.60
0.70
0.80
0.90
1.00
Div
ersi
ty In
dex
Fig. II-3. Cumulative Number of CoC Certificates and Diversity Index across Industry Sectors
Inde
x
UK
USA
Japan
Brazil
South Africa
Div
ersi
ty
UK
USA
Japan
Brazil
South Africa
# of CoC Certificates
Diversity Index
31
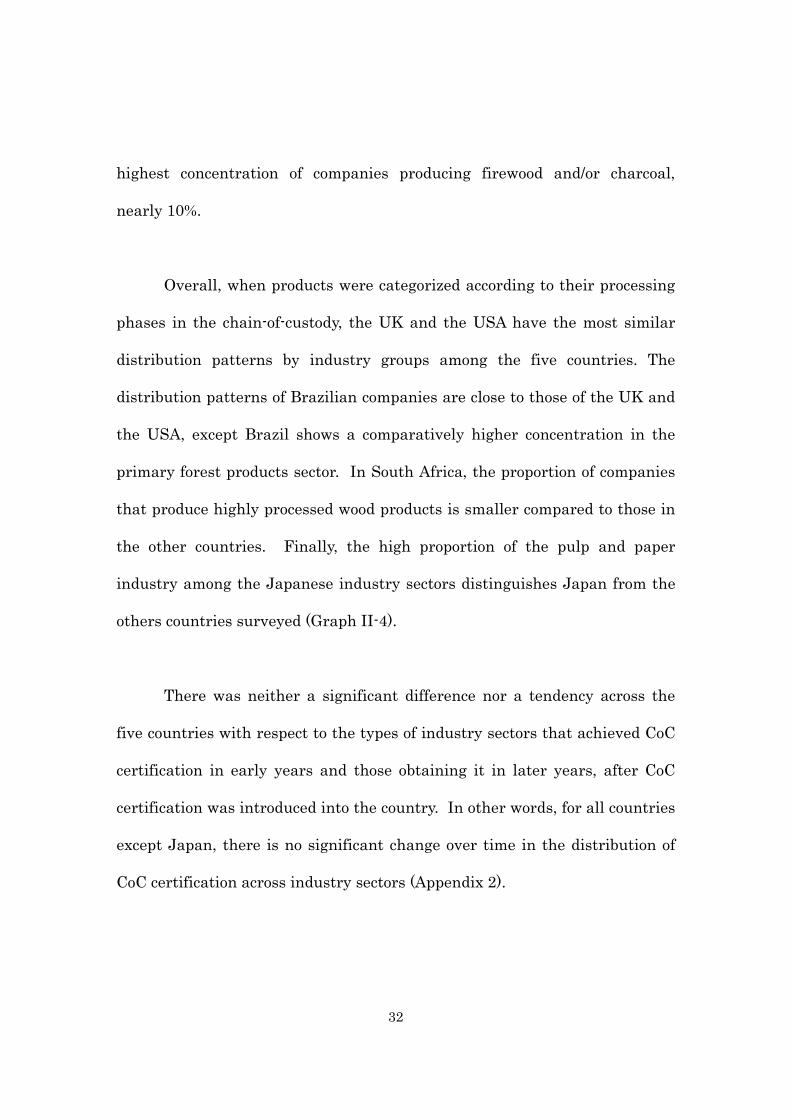
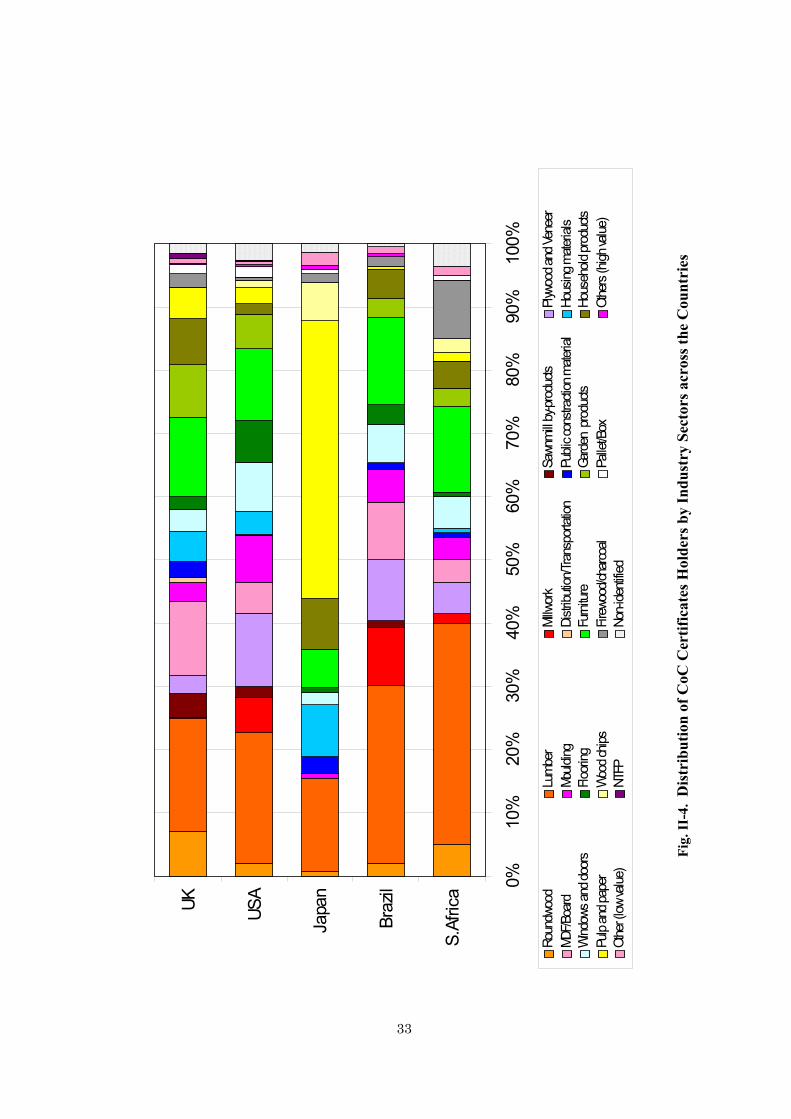
2.5.3 Industry Sectors Distribution
As seen in Graph II-4, distribution of CoC certified companies across
industry sectors industries differ from country to country. Primary wood
products, including round wood, lumber, sawmill, and sawmill by-products,
account for over 40% of the wood-related industry in Brazil and South Africa,
approximately 30% in the UK and the USA, and about 15% in Japan.
Companies producing value added forest products, such as MDF, plywood,
veneer, and particleboards, make up approximately 10% to 20% of all
industry in the UK, the USA and Brazil, and less than 10% in South Africa.
Interestingly, this category is almost insignificant in Japan.
The manufacturers of construction materials, including housing
materials and molding, account for around 10% in the UK, the USA, and
Japan, and around 5% in Brazil and South Africa. About 30% of the British,
American and Brazilian companies are manufacturers of secondary wood
products, such as doors, flooring, furniture, garden products, and household
items, while this group accounts for 25% of companies in South Africa and
15% in Japan. Japan is unique insofar as about 45% of its forest companies
are in the pulp and paper industry. In contrast, less than 5% of CoC
companies in the other four countries surveyed are in the pulp and paper
industry. Also notable is the fact that South Africa is the country with the
32
highest concentration of companies producing firewood and/or charcoal,
nearly 10%.
Overall, when products were categorized according to their processing
phases in the chain-of-custody, the UK and the USA have the most similar
distribution patterns by industry groups among the five countries. The
distribution patterns of Brazilian companies are close to those of the UK and
the USA, except Brazil shows a comparatively higher concentration in the
primary forest products sector. In South Africa, the proportion of companies
that produce highly processed wood products is smaller compared to those in
the other countries. Finally, the high proportion of the pulp and paper
industry among the Japanese industry sectors distinguishes Japan from the
others countries surveyed (Graph II-4).
There was neither a significant difference nor a tendency across the
five countries with respect to the types of industry sectors that achieved CoC
certification in early years and those obtaining it in later years, after CoC
certification was introduced into the country. In other words, for all countries
except Japan, there is no significant change over time in the distribution of
CoC certification across industry sectors (Appendix 2).
33
0%10
%20
%30
%40
%50
%60
%70
%80
%90
%10
0%
S.Af
rica
Braz
il
Japa
n
USAUK
Fig.
II-4
. D
istr
ibut
ion
of C
oC C
ertif
icat
es H
olde
rs b
y In
dust
ry S
ecto
rs a
cros
s the
Cou
ntri
es
Roun
dwoo
dLu
mbe
rMi
llwor
kSa
wnm
ill by
-pro
ducts
Plyw
ood a
nd Ve
neer
MDF/B
oard
Mould
ingDi
stribu
tion/T
rans
porta
tion
Publi
c con
strac
tion m
ateria
lHo
using
mate
rials
Wind
ows a
nd do
ors
Floor
ingFu
rnitu
reGa
rden
pro
ducts
Hous
ehold
prod
ucts
Pulp
and p
aper
Woo
d chip
sFir
ewoo
d/cha
rcoal
Palle
t/Box
Othe
rs (h
igh va
lue)
Othe
r (low
value
)NT
FPNo
n-ide
ntifie
d
34
2.6 Discussion
Although FSC CoC certification has been available since 1993 to
forestry-related industries, the actual movement toward CoC certification
among related industries did not become active until 1997. At that point,
interest in CoC certification increased rapidly in the UK and the USA until
2000 and 2001, respectively, as indicated by the increasing number of CoC
certificates issued every year. However, the number of companies certified
every year started to decline in the UK in 2001 and stopped increasing in the
USA in 2002. It is worth noting that the other major international
certification scheme, PEFC, started to issue CoC certifications in 2001.
Neither of these countries is a major player in PEFC CoC certification. In
fact, no American company has achieved PEFC certification yet. While 26
British companies have obtained PEFC CoC as of March, 2004, this is a very
small number considering that it represents less than 2% of the total number
of PEFC CoC holders; further, other major European countries, such as
France and Germany, have substantially more CoC holders, 425 and 378,
respectively. Therefore, the decline in the number of issued CoC certificates
every year in the UK was not because companies chose another available
program over FSC CoC certification. Factors that may have caused this
slowdown include: less pressure from environmental organizations;
diminished confidence in forest certification among forestry sectors; less
35
public attention on deforestation; fewer benefits from CoC certification than
expected and less demand for CFPs in the wood market.
Although the rate of certified companies per year stopped increasing in
the USA in 2001, the rate at which new companies achieve FSC CoC
certification has been stable since 2000 and every year since then about 100
companies have been added to the FSC CoC regime. This may indicate that,
at least in the USA, interest in CFPs is increasing among the forestry sectors
and supply of and demand for CFPs are expanding. Similarly, Japanese CoC
certification holders are growing at an increasing rate, perhaps
demonstrating increasing interest in forest certification among industries
and demand for CFPs in Japan as well. The numbers of CoC certificates
issued per year in Brazil and South Africa are comparatively lower. The
reasons for this may include the fact that companies in these two countries
have financial and/or technical limitations on achieving CoC certification.
Further, companies operating in the international market are more likely to
be interested in certification considering that the current markets for CFPs
are concentrated in the Northern hemisphere.
The unique distribution of Japanese industry sectors – with a high
concentration on the paper and pulp industry – may be explained by the fact
36
that this industry sector has a reputation among Japanese consumers for
clearing tropical forests and is seeking a means to change this image. Also,
Japanese consumers in general are not particularly environmentally
sensitive compared to consumers in other parts of the world such as Europe,
which may result in less perceived need for certification in the other
Japanese forestry related industry sectors, making pulp and paper standout.
37
Chapter III
Profile of Chain-of-Custody Certificate Holders
3.1 Introduction
Because the increasing movement toward FSC CoC certification in
forest-related industry sectors is still a recent trend, number of CoC certified
firms comprise a very small percentage of the total number of forest-related
companies. For example, while the total number of CoC certified firms in the
USA was 419 in 2003, in 1997 there were 36,735 plants for lumber and wood
products manufacturers, 2,095 plants for furniture and fixtures, and 6,496
plants for paper and allied products (the U.S. Census Bureau 2004). As
another example, in Japan there were 9,256 firms for wood and wood
products manufacture, 10,554 for furniture and fixtures, and 7,471 for pulp
and allied products in 2001, while there were 121 CoC certified firms
throughout all the industry sectors in 2003 (the Statistics Bureau of Japan
2004). Therefore, those CoC companies which decided to achieve CoC
certification probably had a specific interest in achieving forest certification,
which decision may be influenced by a company’s marketing strategies,
38
particular philosophy, market conditions, and social factors.
The concept of environmental marketing appeared in the early 1990s
around the same time that environmental concerns began impacting the
marketplace, particularly in manufacturing industries using natural
resources (Coddington 1993; Polonsky 1995). One of the defining
characteristics of environmental marketing is the use of proactive strategies
that benefit companies and society by redirecting consumer demand to
environmentally preferable products and services (Polonsky 1995).
Companies may adopt environmental marketing for different reasons such as
social responsibility, governmental pressure, competitive pressure and
enhanced profit-making (Polonsky 1994). While concern over the
environment may reduce companies’ operating effectiveness (including cost
performance), it also may provide companies with many opportunities.
Moreover, any firm in today’s competitive marketplace needs to develop
competitive strategies rather than seeking only operating effectiveness.
Fundamental elements of competitive strategies include product
differentiation, selective marketing, and creating a credible company image.
The key element of a product differentiation strategy is to create something
about the product that is perceived industry-wide and among customers as
39
being unique. The principle concept of selective marketing is to target
specifically a group of customers requiring similar products and levels of
service (Sinclair 1992). The core philosophy behind creating a credible
company image is to make consumers view companies’ commitment to the
environment as sincere, so that consumers can trust companies’
environmental claims, which currently tends to be viewed by consumers with
a great deal of skepticism (Hansen 1997). “Green” marketing needs to be
more than just a slogan or an advertising pitch.
Forest management certification and CoC certification are designed to
foster three elements: CFPs are distinguished and differentiated from other
products by being environmentally friendly; environmentally conscious
customers, both individual and industrial, are specifically targeted by
companies as potential consumers of CFPs; and third-party certification,
rather than a company’s own claims about its environmental practices, gives
the company more credibility in the eyes of consumers. In short, CoC
certification is one option for firms in the wood products industry to
implement their environmental marketing strategies. Not all firms adopt
environmental marketing strategies and there may be something particular
about the profiles of firms that have adopted forest certification as their
environmental marketing strategy. Even among companies pursuing forest
40
certification there may be diverse objectives and expectations from forest
certification, as a result of differences in marketing strategies and the needs
of the particular business.
3.2 Research Questions
The research questions for this chapter are the following:
What is the “typical” profile of companies with CoC certification?
Do companies with certain profiles (i.e., their size, sales volume,
type, etc.) adopt forest certification earlier than others?
Do the profiles of the “typical” company seeking CoC
certification differ across countries, reflecting localized social
and cultural factors, and the condition of the markets in which
companies are active?
3.3 Objectives
The objectives of this chapter are to: 1) analyze data on CoC certified
companies in the UK, the USA, and Japan, in order to characterize a
“typical” CoC certification holder in each country; 2) compare the dominant
company profile across the three countries, and 3) discuss potential factors
41
creating differences in company profiles among the three countries.
3.4 Methods
Among the five countries studied in the previous chapter, three, the
UK, the USA and Japan, were focused on for this research due to the fact
that sufficient data are available on a wide range of companies in these three
countries, from “mom-and-pop” businesses to large-scale firms. Data were
collected on FSC CoC certified companies in December 2003. The data fields
– year of incorporation (this information was only available for UK and
Japanese companies); number of employees; estimated or actual sales in year
2002; the type corporate ownership, e.g., public, private or cooperative; and
number of registered 4-digit Standard Industrial Classification Codes (this
information was only available for UK and American companies) – were
gathered from 11 databases in order to maximize the data coverage on the
CoC holders. The ICC Financial Analysis Reports, the ICC Directory of UK
Companies, the ICC Directory of Irish Companies and the Major Companies
Database are source of collecting data on the UK companies. Reference USA,
US Business Directory, Canada Business Directory and Hoover's Company
Capsules are the sources of data regarding the American companies. Teikoku
Databank, Foreign Companies in Emerging Markets Yearbook, and the
42
AMITA database were employed for collecting data on the Japanese
companies. Information from different databases was reasonably consistent
as determined by comparing data on companies appearing in more than two
databases.
The t-test ( 05.0=α ) was used to test significant differences between
means of data across the countries, where applicable. In order to assess
linear association between data field and the issue year for the CoC
certificate, the correlation coefficient was used.
3.5 Results
3.5.1 Data Availability
There was some limitation on data availability. Out of the 298 British
CoC holders listed in the FSC database in December 2003, at least one of the
11 databases contained data on company type, e.g., public or private, for 257
companies (86.2%); data on number of employees were available for 160
companies, or 54%; data regarding estimated sales of the year 2002 were
available for 147 companies, or, 49%; data showing year of incorporation were
found with respect to 248 companies, or 83%; and data showing the Standard
43
Industrial Codes (SIC) of products were available for 235, or 79%, of the
British companies.
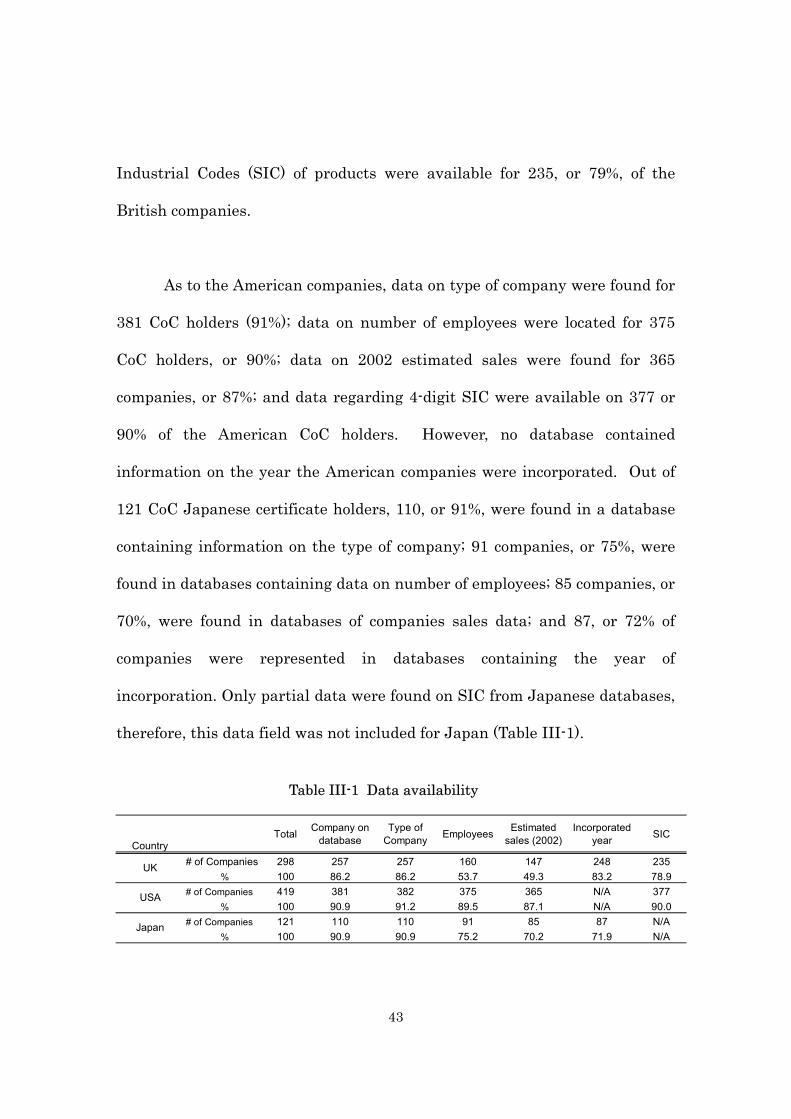
As to the American companies, data on type of company were found for
381 CoC holders (91%); data on number of employees were located for 375
CoC holders, or 90%; data on 2002 estimated sales were found for 365
companies, or 87%; and data regarding 4-digit SIC were available on 377 or
90% of the American CoC holders. However, no database contained
information on the year the American companies were incorporated. Out of
121 CoC Japanese certificate holders, 110, or 91%, were found in a database
containing information on the type of company; 91 companies, or 75%, were
found in databases containing data on number of employees; 85 companies, or
70%, were found in databases of companies sales data; and 87, or 72% of
companies were represented in databases containing the year of
incorporation. Only partial data were found on SIC from Japanese databases,
therefore, this data field was not included for Japan (Table III-1).
Table III-1 Data availability
CountryTotal Company on
databaseType of
Company Employees Estimatedsales (2002)
Incorporatedyear SIC
# of Companies 298 257 257 160 147 248 235% 100 86.2 86.2 53.7 49.3 83.2 78.9
# of Companies 419 381 382 375 365 N/A 377% 100 90.9 91.2 89.5 87.1 N/A 90.0
# of Companies 121 110 110 91 85 87 N/A% 100 90.9 90.9 75.2 70.2 71.9 N/A
UK
USA
Japan
44
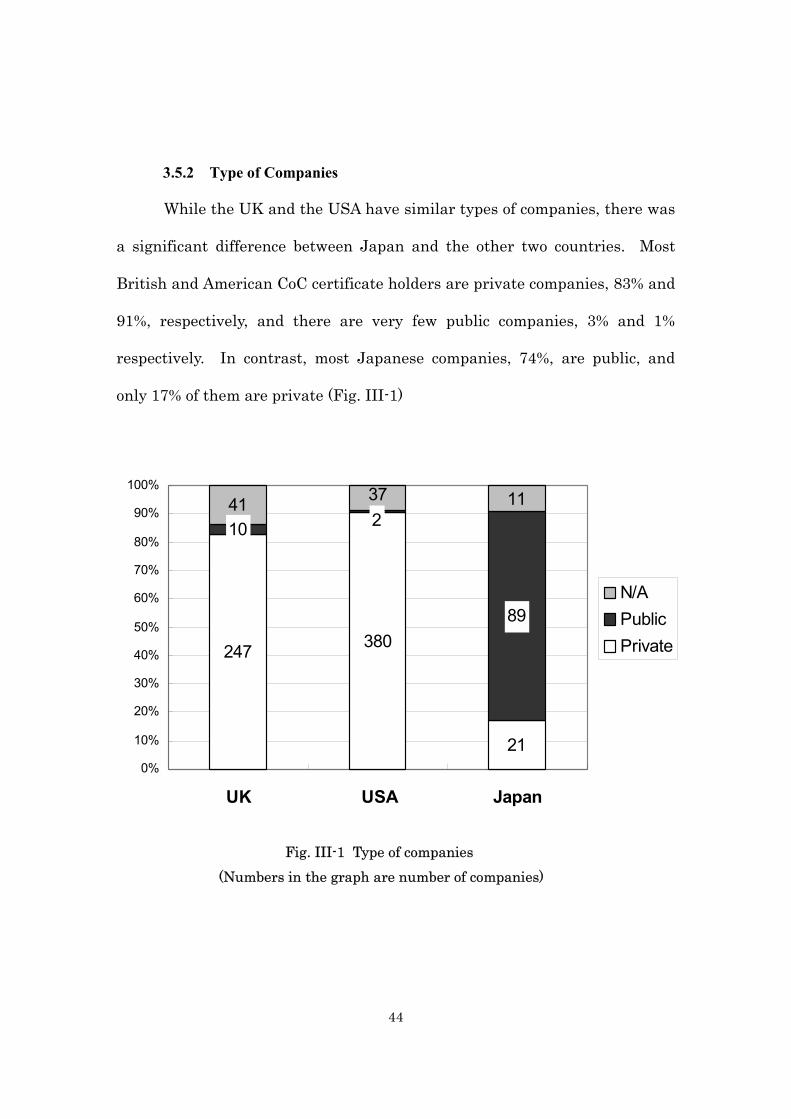
3.5.2 Type of Companies
While the UK and the USA have similar types of companies, there was
a significant difference between Japan and the other two countries. Most
British and American CoC certificate holders are private companies, 83% and
91%, respectively, and there are very few public companies, 3% and 1%
respectively. In contrast, most Japanese companies, 74%, are public, and
only 17% of them are private (Fig. III-1)
247 380
21
10
89
41 11237
0%
10%
20%
30%
40%
50%
60%
70%
80%
90%
100%
UK USA Japan
N/APublicPrivate
Fig. III-1 Type of companies (Numbers in the graph are number of companies)
45
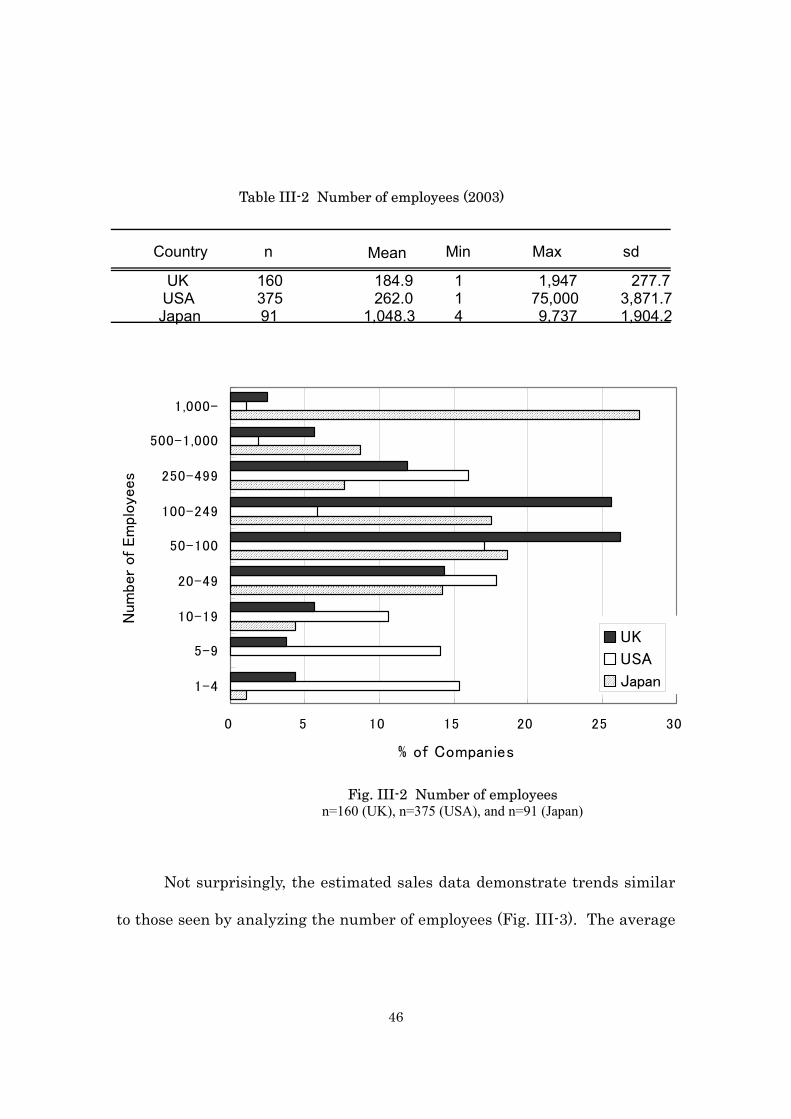
3.5.3 Employees and Estimated Sales
The number of employees per company and estimated sales in 2002
were assessed for each of the three countries as indicators of company size.
On average, the Japanese companies have the largest number of employees,
1,048 per firm, followed by the Americans, with 262 employees per firm. The
British average, 185 employees per firm, was the smallest number among the
three countries (Table II-2). With regard to just private firms, the average, or
mean, number of employees for American companies is 88, while the British
private company average, 183 employees per firm, is similar to the average
for public British companies. One large American public corporation, Georgia
Pacific Corporation, greatly increases the average number of employees per
American company, being an outlier. The median number of employees in
American companies (20) is lower than the median of British (85) and
Japanese (176) companies. Another interesting aspect of the data was the
different patterns of distribution of company sizes among the three countries.
For example, most Japanese companies, which employ the highest average
number of employees per firm among the three countries, fall into two broad
categories: 28% of them have more than 1,000 employees and 50% have 20-
500 employees. While 97% of American companies have fewer than 500
employees, 78% of the British companies have 20-500 employees. (Fig. III-2).
46
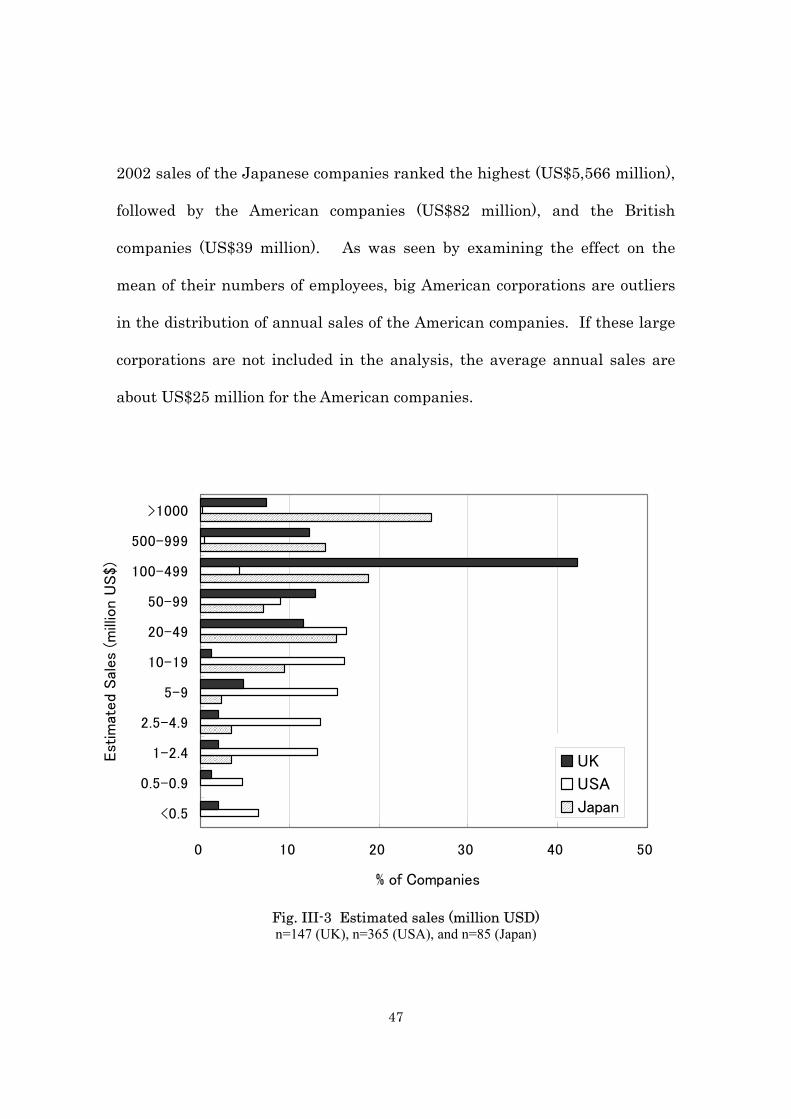
Not surprisingly, the estimated sales data demonstrate trends similar
to those seen by analyzing the number of employees (Fig. III-3). The average
Table III-2 Number of employees (2003)
Country n Mean Min Max sd
UK 160 184.9 1 1,947 277.7 USA 375 262.0 1 75,000 3,871.7 Japan 91 1,048.3 4 9,737 1,904.2
0 5 10 15 20 25 30
1-4
5-9
10-19
20-49
50-100
100-249
250-499
500-1,000
1,000-
Num
ber
of Em
ploye
es
% of Companies
UK
USA
Japan
Fig. III-2 Number of employees n=160 (UK), n=375 (USA), and n=91 (Japan)
47
2002 sales of the Japanese companies ranked the highest (US$5,566 million),
followed by the American companies (US$82 million), and the British
companies (US$39 million). As was seen by examining the effect on the
mean of their numbers of employees, big American corporations are outliers
in the distribution of annual sales of the American companies. If these large
corporations are not included in the analysis, the average annual sales are
about US$25 million for the American companies.
0 10 20 30 40 50
<0.5
0.5-0.9
1-2.4
2.5-4.9
5-9
10-19
20-49
50-99
100-499
500-999
>1000
Est
imat
ed
Sal
es
(mill
ion U
S$)
% of Companies
Fig. III-3 Estimated sales (million USD) n=147 (UK), n=365 (USA), and n=85 (Japan)
UK
USA
Japan
48
A statistically significant difference was found between the Japanese
companies and each of the other two countries in terms of number of
employees and annual sales at 05.0=α (Table III-3)
3.5.4 Incorporated Year and SICs
As noted, the year of incorporation of British and Japanese companies
was collected as an element of the company profile. Due to data limitations,
the American companies were not included in the analysis of this variable.
About 50% of the British companies were incorporated during 1980-2000,
while about 50% of Japanese companies were incorporated during 1940-1960.
Over all, Japanese companies are older than British companies (fig. III-4).
Table III-3 Estimated sales (2002, USD)
Country n Mean (US$million) Min Max sd
UK 147 39.0 0.1 533 50.5 USA 365 81.6 0.1 23,271 1,310.9
Japan 85 5,565.9 1.2 79,680 21,426.0
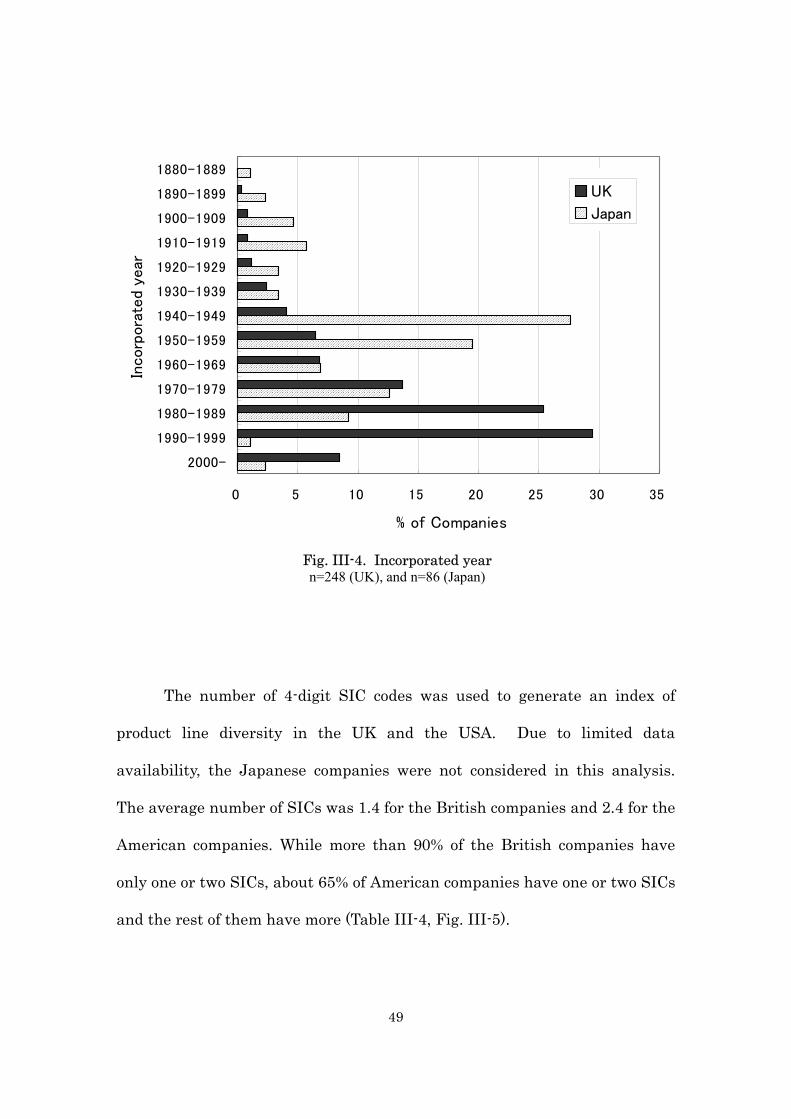
49
The number of 4-digit SIC codes was used to generate an index of
product line diversity in the UK and the USA. Due to limited data
availability, the Japanese companies were not considered in this analysis.
The average number of SICs was 1.4 for the British companies and 2.4 for the
American companies. While more than 90% of the British companies have
only one or two SICs, about 65% of American companies have one or two SICs
and the rest of them have more (Table III-4, Fig. III-5).
0 5 10 15 20 25 30 35
2000-
1990-1999
1980-1989
1970-1979
1960-1969
1950-1959
1940-1949
1930-1939
1920-1929
1910-1919
1900-1909
1890-1899
1880-1889
Incorp
ora
ted
year
% of Companies
UK
Japan
Fig. III-4. Incorporated year n=248 (UK), and n=86 (Japan)
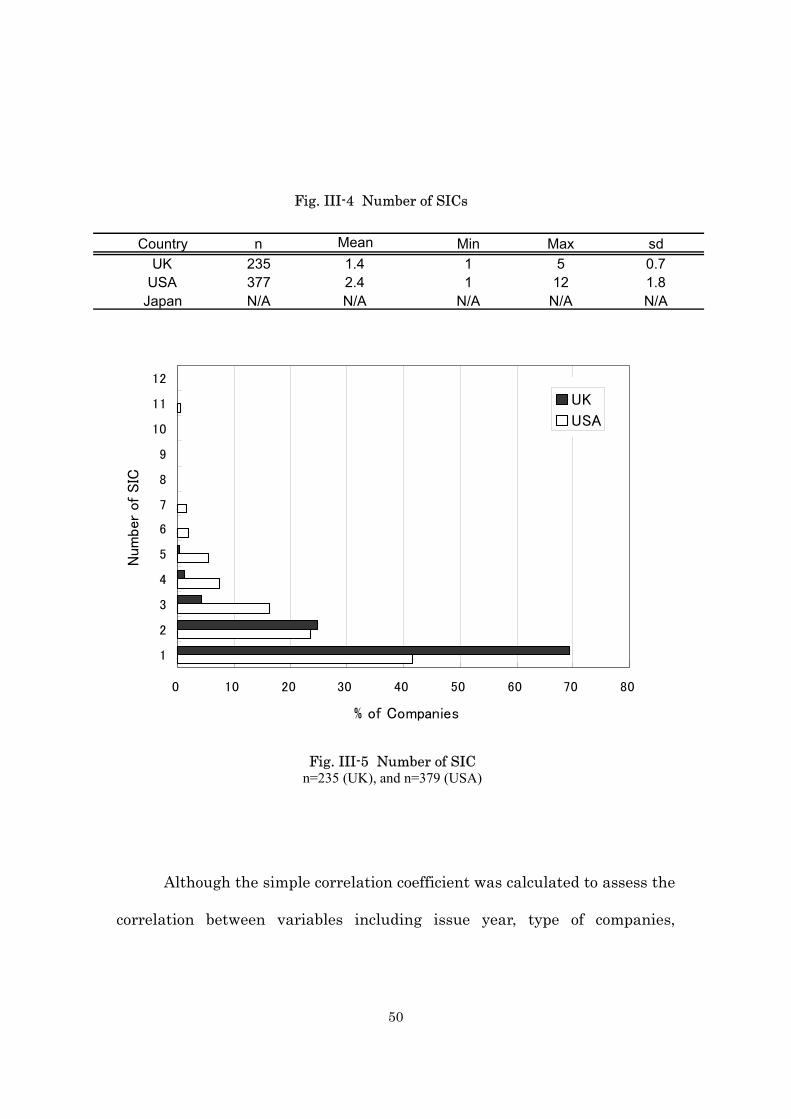
50
Although the simple correlation coefficient was calculated to assess the
correlation between variables including issue year, type of companies,
Fig. III-4 Number of SICs
Country n Mean Min Max sdUK 235 1.4 1 5 0.7
USA 377 2.4 1 12 1.8Japan N/A N/A N/A N/A N/A
Fig. III-5 Number of SIC n=235 (UK), and n=379 (USA)
0 10 20 30 40 50 60 70 80
1
2
3
4
5
6
7
8
9
10
11
12
Num
ber
of SIC
% of Companies
UK
USA
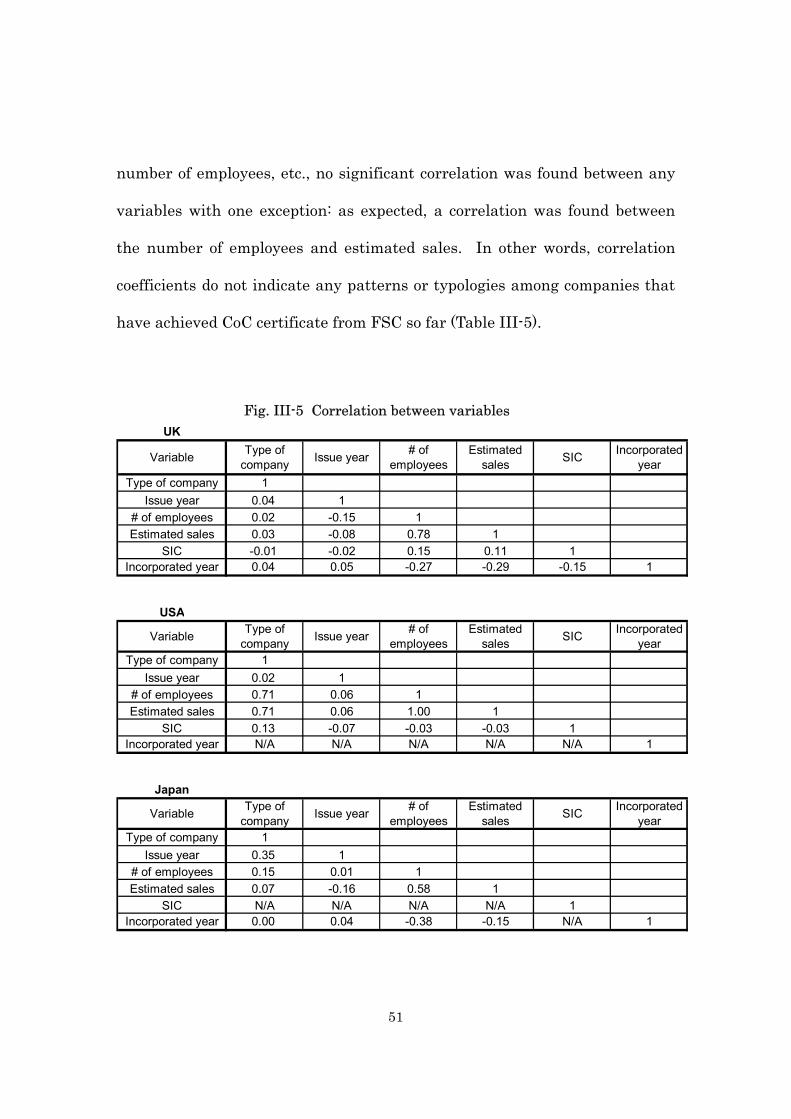
51
number of employees, etc., no significant correlation was found between any
variables with one exception: as expected, a correlation was found between
the number of employees and estimated sales. In other words, correlation
coefficients do not indicate any patterns or typologies among companies that
have achieved CoC certificate from FSC so far (Table III-5).
Fig. III-5 Correlation between variables UK
Variable Type ofcompany Issue year # of
employeesEstimated
sales SIC Incorporatedyear
Type of company 1Issue year 0.04 1
# of employees 0.02 -0.15 1Estimated sales 0.03 -0.08 0.78 1
SIC -0.01 -0.02 0.15 0.11 1Incorporated year 0.04 0.05 -0.27 -0.29 -0.15 1
USA
Variable Type ofcompany Issue year # of
employeesEstimated
sales SIC Incorporatedyear
Type of company 1Issue year 0.02 1
# of employees 0.71 0.06 1Estimated sales 0.71 0.06 1.00 1
SIC 0.13 -0.07 -0.03 -0.03 1Incorporated year N/A N/A N/A N/A N/A 1
Japan
Variable Type ofcompany Issue year # of
employeesEstimated
sales SIC Incorporatedyear
Type of company 1Issue year 0.35 1
# of employees 0.15 0.01 1Estimated sales 0.07 -0.16 0.58 1
SIC N/A N/A N/A N/A 1Incorporated year 0.00 0.04 -0.38 -0.15 N/A 1
52
3.6 Discussion
The most significant finding of this research is that the ‘typical’
companies in each country have distinct national profiles. While the
American and British CoC certificate holders share similarities at certain
levels, the Japanese CoC certificate holders are very different from their
counterparts in the other two countries. The companies seeking FSC CoC
certification in the USA and the UK tend to be smaller, private companies.
On the contrary, in Japan, while many large conglomerates have achieved
FSC CoC certification there is also a significant number of small private
firms with certification. Although firms of different sizes have adopted forest
certification as a tool for implementing their environmental marketing
strategies, their main objectives in doing so may be different, depending on
corporate size. Smaller firms are more likely to use CoC certification to
improve their competitiveness by using certification to achieve product
differentiation and/or to target specific markets. Larger corporations,
however, may value certification as a means of effectively developing
credibility among a wide range of customers.
Interestingly, out of 50 Japanese companies that have over US$100
million annual sales, 48 are in the pulp and paper industry and all of them
53
are public. Unlike Japan, in the USA and the UK, a wide range of industry
sectors are represented among those companies with higher annual sales.
The phenomenon of a large number of multi-million dollar Japanese pulp and
paper corporations seeking forest certification from FSC as a tool for
enhancing their environmental marketing strategies has not been seen
within other industries in any of these three countries.
One of reasons why there are more private and smaller CoC companies
in the UK and the USA compared to Japan may include the fact that there is
higher competition in small businesses in the two countries. However, the
most significant factor resulting in fewer large FSC CoC corporations in the
USA may be the national forest certification scheme, the Sustainable Forest
Initiative, which was developed by forest industry. Most pulp and paper
firms in the USA probably think that SFI certification is compatible with
FSC certification, and avoid FSC CoC certification by signing on with the SFI
program. Moreover, it may be very difficult for large American corporations
to obtain large amounts of certified supply materials at once due to
fragmented forestland ownership in the USA.
On the contrary, many Japanese large CoC corporations with brand names in
the pulp and paper industry want to protect their public image by using FSC
54
CoC certification, as there is no operative national forest certification
program yet in Japan. The highly capital-intensive pulp and paper
companies continuously need to import new materials from overseas because
of limitations on quality of products made from recycled materials and
because sufficient supplies can never be found from domestic sources.
Further, because these corporations are so huge, they are subject to pressure
from various sources, including consumers, government, and environmental
NGOs. Forest certification was has given the firms needed credibility among
customers. This is because FSC is a recognized, international certification
scheme that is supported by many environmental NGOs, something
consumers credit in their purchasing decisions. While the experience of the
Japanese pulp and paper industry should be viewed positively, further
analysis will be required in order to assess the actual percentage of their
production that is certified (CFPs).
In this research, no significant correlation was found between
companies’ decision to adopt forest certification and the length of time they
have been in business. This may be because firms seek forest certification
based on various factors such as corporate philosophy, customers’ desire,
market strategies and so on, which may not always correlate with the age of
their business. Because forest certification is still a new market strategy and
55
a new trend for most forest industries, if CFP markets develop more, more
firms with diverse profiles may become interested in it. Therefore, it is
important to continue analyzing the progress of the market for CFPs in order
to identify trends over time.
56
Chapter IV
Perspectives of CoC Certificate holders in the USA and Japan
4.1 Introduction
CoC certificate holders play essential roles in the development and
promotion of forest certification because forest products from certified forests
have to be processed and distributed under a CoC certification system to
become CFPs and CoC certificate holders have more chances to communicate
with consumers directly and distribute messages from producers. Both the
supply and demand sides of CFPs are key factors for the further success of
forest certification because supply and demand interact intimately. Further,
forest certification is a market instrument, based on the idea that there is a
need to link consumers and producers. Although the demand for products
fundamentally reflects consumers’ interest and willingness to pay, it is also a
fact that demand can be encouraged on the supply side through
environmental market strategies (Hansen, 1997; Sheth, 1995). Therefore, it
is very important to have a better understanding of CoC certificate holders’
perspectives on forest certification in order to insure the further success of
forest certification. Although comparatively more studies have been
57
conducted to assess consumer perspectives, behavior, and willingness to pay
(Ozanne 1996; 1998; Forsyth 1999; Gronroos 1999; Hansen, et al. 2000;
Anderson 2003; Jensen 2003; Ozanne 2003), relatively less attention has
been paid to forest product markets (Schwarzbaue 2001; Auld, et al. 2003).
Previous studies on perspectives of companies in the forest product
processing chain include: attempts to discern environmental perception of
forest industry sectors and their willingness to pay (Vlosky 1997); to assess a
perceived price premium on solid wood products (Stevens 1998); to estimate
solid wood manufacturers’ willingness to pay for CFPs (Vlosky 1998); to
analyze the forest sectors’ views of anticipated advantages/disadvantages of
CoC certification (Auld, et al. 2003); and to assess the solid wood sectors’
perceived benefits and costs of CoC certification (Vidal 2003). In addition,
most surveys on CoC certification are concentrated in North American and
European markets with very little attention given to Asian markets,
including Japanese markets, despite of the fact that Japan is one of the
world’s major wood consuming countries.
Different motivations drive companies to achieve CoC certification,
depending on what they expect and anticipate as its advantages. CoC
certification of forest markets is very complex because various sectors are
involved, many processing stages are included, diverse goods are marketed
58
and many marketplaces are targeted. Therefore, in order to promote CoC
certification successfully, it is important to understand that companies are
very diverse in terms of products they deal with, marketplaces they do
business in, and their perspectives, expectations and anticipated benefits
from CoC certification.
4.2 Research Questions
The research questions for this study are:
What is company’s motivation toward CoC certification?
What are company’s expectations from CoC certification?
What are perceived benefits of CoC certification among current
CoC certified companies?
Do the above factors differ across countries and industry sectors in
accordance with their needs and strategies?
4.3 Objectives
The objectives of this research are to: 1) assess conditions of marketing
CFPs among CoC certificate holders; 2) assess the expectations and
perspectives of CoC certificate holders for forest certification in the USA and

59
Japan; 3) compare companies’ perspectives across these two countries; and 4)
discuss how to promote CoC certification effectively across countries.
4.4 Methodology
4.4.1 Sampling design
American and Japanese FSC CoC certificate holders as of December
2003 were the target population for this survey. First, a list of CoC certificate
holders was obtained from the FSC database, which contains companies’
names, addresses, contact person(s), and email addresses. Second, all of the
companies with email addresses – 377 American companies and 69 Japanese
companies – were contacted by email and asked to participate in the survey.
4.4.2 Questionnaire development
A questionnaire was designed having five main objectives 1) gather
information regarding the respondent companies’ CFPs; 2) assess these
companies’ motivation for obtaining CoC certificate; 3) assess their
expectations regarding CoC certification; 4) assess their perceived benefits
from CoC certification; and 5) examine their perspectives toward the FSC
CoC certification program. To develop appropriate survey questions, several
60
previous consumer surveys (Ozanne 1998; Gronroos 1999) and
producers/manufactures surveys (Karna 1997; Stevens 1998; Vlosky 1998;
Auld, et al. 2003) were referenced. The questions were structured based on
the types of anticipated answers; thus, for example 1) close-ended questions
were used to elicit discrete information such as certificate issue year, current
certificate status, and so on; 2) open-ended questions were used in order for
the respondent companies to name their CFPs; 3) closed-ended questions
with ordered response categories and partially closed-ended question with
ordered response categories (e.g., 1 to 5 scale, from “no impact” to “strong
impact”) were employed for those answers that apply to all companies but on
a different scale, for example, the impact certification has had on pricing; and
4) partially closed-ended questions with unordered response categories were
employed for those questions where companies’ answers were categorized
including open-end option of “others”, for instance, where their CFPs are sold.
A questionnaire in both English and Japanese versions was constructed with
15 questions (Appendix 3).
4.4.3 Method
The questionnaire was implemented electronically, using email and
websites. A pre-test questionnaire was sent out to 10 companies in the USA
and Japan, attached as an MS/Word file to an email with a cover note asking
61
for feedback. Then, for the first round of surveys, the questionnaire was
emailed to all companies with email addresses as an attached MS/Word
attachment file with a cover letter. In this first round, conducted from
February to March 2004, companies were asked to download the attached file
to participate and then to email back the completed survey as an attached file.
Two weeks after the first round, a second round of surveys was conducted.
This time the questionnaire was set up on-line at a website and only an email
with a reminding cover letter was sent to the companies that had not replied
to the first questionnaire. Thus, companies were asked to go to the website in
order to answer the questions and then submit their answers on-line. Non-
response bias was examined by using two-tailed t-tests ( 05.0=α ) and by
comparing the distributions by industry sectors between the target
population (all companies listed in the FSC database) and the sample
population (companies responded to the questionnaire survey) for both
countries.
4.5 Results
4.5.1 Response rate
Out of 377 emails sent to American CoC certificate holders, 317 were
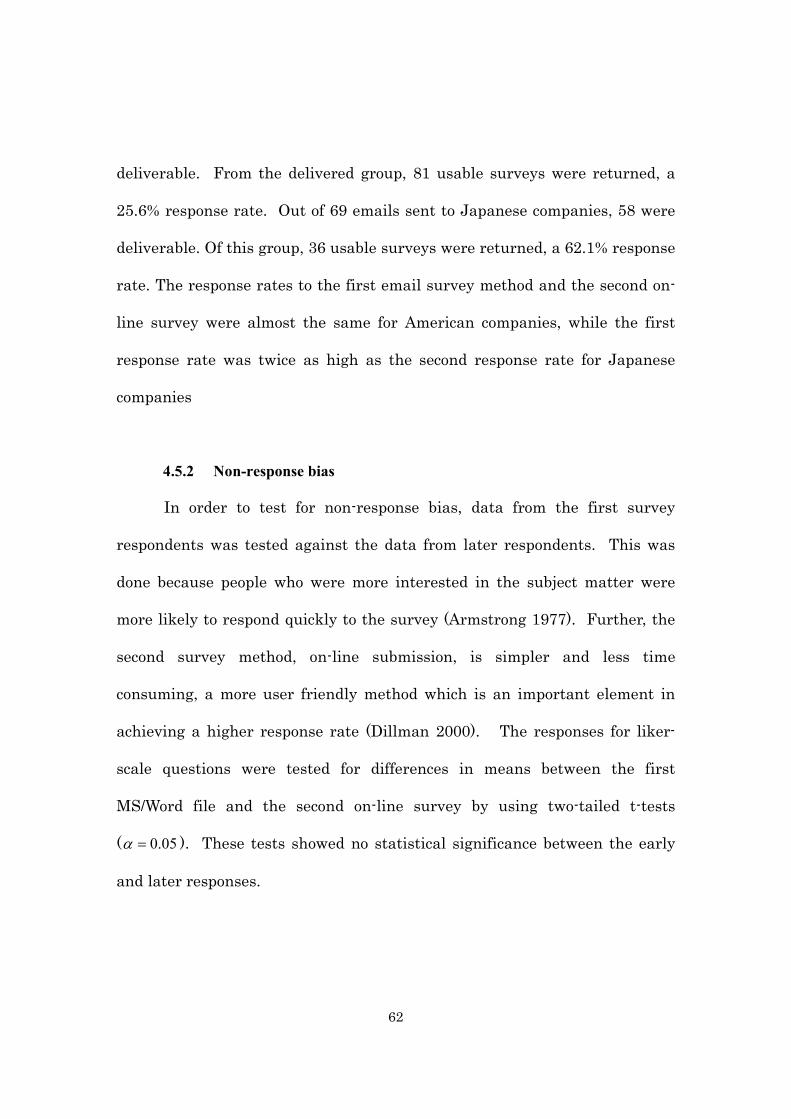
62
deliverable. From the delivered group, 81 usable surveys were returned, a
25.6% response rate. Out of 69 emails sent to Japanese companies, 58 were
deliverable. Of this group, 36 usable surveys were returned, a 62.1% response
rate. The response rates to the first email survey method and the second on-
line survey were almost the same for American companies, while the first
response rate was twice as high as the second response rate for Japanese
companies
4.5.2 Non-response bias
In order to test for non-response bias, data from the first survey
respondents was tested against the data from later respondents. This was
done because people who were more interested in the subject matter were
more likely to respond quickly to the survey (Armstrong 1977). Further, the
second survey method, on-line submission, is simpler and less time
consuming, a more user friendly method which is an important element in
achieving a higher response rate (Dillman 2000). The responses for liker-
scale questions were tested for differences in means between the first
MS/Word file and the second on-line survey by using two-tailed t-tests
( 05.0=α ). These tests showed no statistical significance between the early
and later responses.
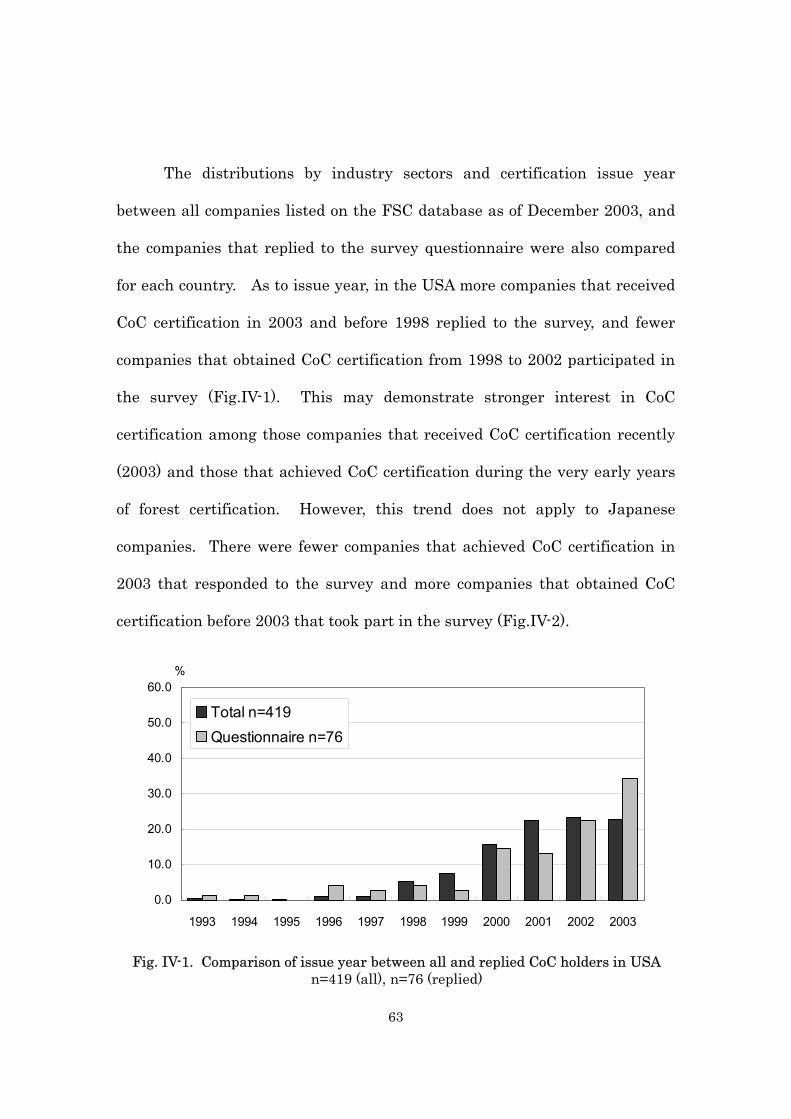
63
The distributions by industry sectors and certification issue year
between all companies listed on the FSC database as of December 2003, and
the companies that replied to the survey questionnaire were also compared
for each country. As to issue year, in the USA more companies that received
CoC certification in 2003 and before 1998 replied to the survey, and fewer
companies that obtained CoC certification from 1998 to 2002 participated in
the survey (Fig.IV-1). This may demonstrate stronger interest in CoC
certification among those companies that received CoC certification recently
(2003) and those that achieved CoC certification during the very early years
of forest certification. However, this trend does not apply to Japanese
companies. There were fewer companies that achieved CoC certification in
2003 that responded to the survey and more companies that obtained CoC
certification before 2003 that took part in the survey (Fig.IV-2).
Fig. IV-1. Comparison of issue year between all and replied CoC holders in USA n=419 (all), n=76 (replied)
0.0
10.0
20.0
30.0
40.0
50.0
60.0
1993 1994 1995 1996 1997 1998 1999 2000 2001 2002 2003
%
Total n=419Questionnaire n=76
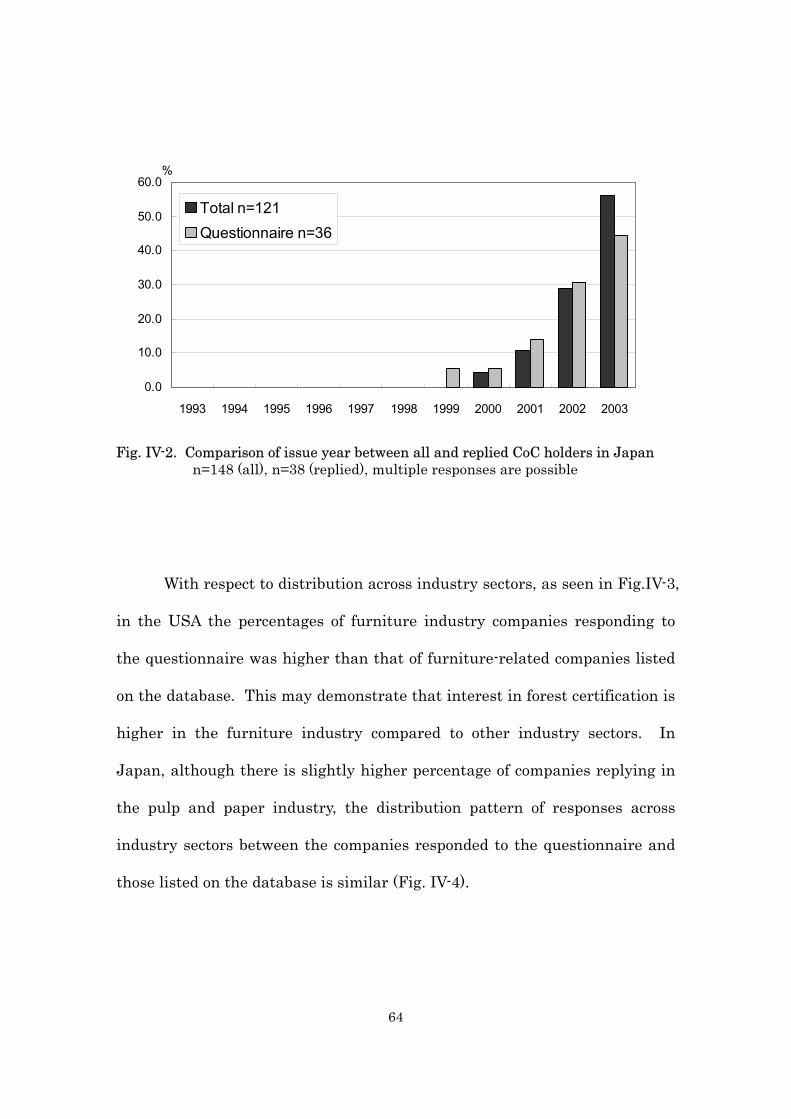
64
With respect to distribution across industry sectors, as seen in Fig.IV-3,
in the USA the percentages of furniture industry companies responding to
the questionnaire was higher than that of furniture-related companies listed
on the database. This may demonstrate that interest in forest certification is
higher in the furniture industry compared to other industry sectors. In
Japan, although there is slightly higher percentage of companies replying in
the pulp and paper industry, the distribution pattern of responses across
industry sectors between the companies responded to the questionnaire and
those listed on the database is similar (Fig. IV-4).
Fig. IV-2. Comparison of issue year between all and replied CoC holders in Japan n=148 (all), n=38 (replied), multiple responses are possible
0.0
10.0
20.0
30.0
40.0
50.0
60.0
1993 1994 1995 1996 1997 1998 1999 2000 2001 2002 2003
%
Total n=121Questionnaire n=36
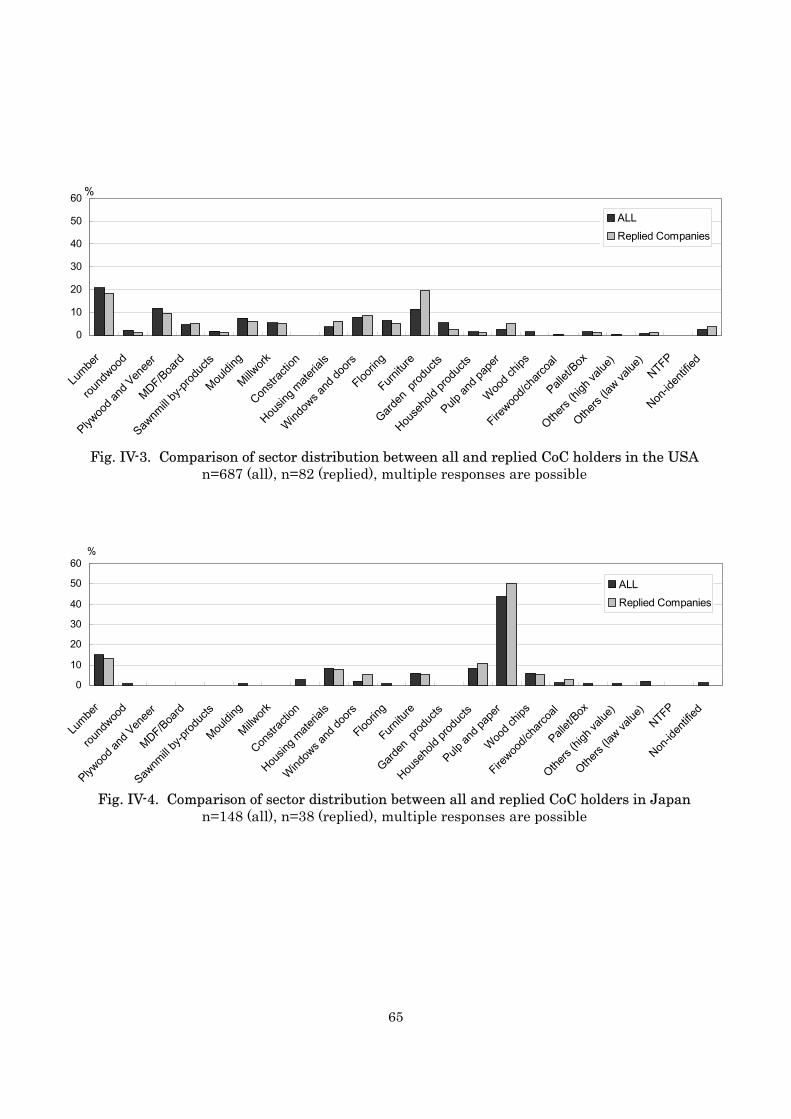
65
Fig. IV-3. Comparison of sector distribution between all and replied CoC holders in the USA n=687 (all), n=82 (replied), multiple responses are possible
0
10
20
30
40
50
60
Lumbe
r
round
wood
Plywoo
d and
Venee
r
MDF/Board
Sawnm
ill by-p
roduc
ts
Mouldi
ng
Millwork
Constr
actio
n
Housin
g mate
rials
Window
s and
doors
Floorin
g
Furnitu
re
Garden
prod
ucts
House
hold
produ
cts
Pulp an
d pap
er
Wood c
hips
Firewoo
d/cha
rcoal
Pallet/
Box
Others
(high
value
)
Others
(law va
lue)
NTFP
Non-id
entifi
ed
%
ALLReplied Companies
0
10
20
30
40
50
60
Lumbe
r
round
wood
Plywoo
d and
Venee
r
MDF/Board
Sawnm
ill by-p
roduc
ts
Mouldi
ng
Millwork
Constr
actio
n
Housin
g mate
rials
Window
s and
doors
Floorin
g
Furnitu
re
Garden
prod
ucts
House
hold
produ
cts
Pulp an
d pap
er
Wood c
hips
Firewoo
d/cha
rcoal
Pallet/
Box
Others
(high
value
)
Others
(law va
lue)
NTFP
Non-id
entifie
d
%
Fig. IV-4. Comparison of sector distribution between all and replied CoC holders in Japan n=148 (all), n=38 (replied), multiple responses are possible
ALLReplied Companies
66
4.5.3 Certification status
In the USA, 94% of the companies responding to the survey (n=81)
have current CoC certification and 6% of the responding companies have
dropped their certification status. Among the CoC certificate holders
surveyed, 12% of companies (n=10) own their forests: 80% of these are in
North America, 20% are in South America, and 10% are in Oceania. (One
company owns forests in both North America and South America) However,
only four of the above forest-owning companies have both forest management
certification and CoC certification. As to other certification programs, 6% of
the American companies have obtained certification from organizations other
than FSC, such as Green Seal and Recycled/Recovered Content of Scientific
Certification Systems.
In Japan, 97% of the respondent companies (n=36) presently maintain
CoC certification and 3% of them have dropped their certification status.
Among the Japanese CoC certificate holders, 28% of the companies (n=10)
own their forests: 70% of these are in Asia, 10% are in South America, and
20% are in Oceania. Out of the 10 forest-owning companies, seven hold both
forest management certification and CoC certification. One Japanese
company has obtained certification from PEFC.
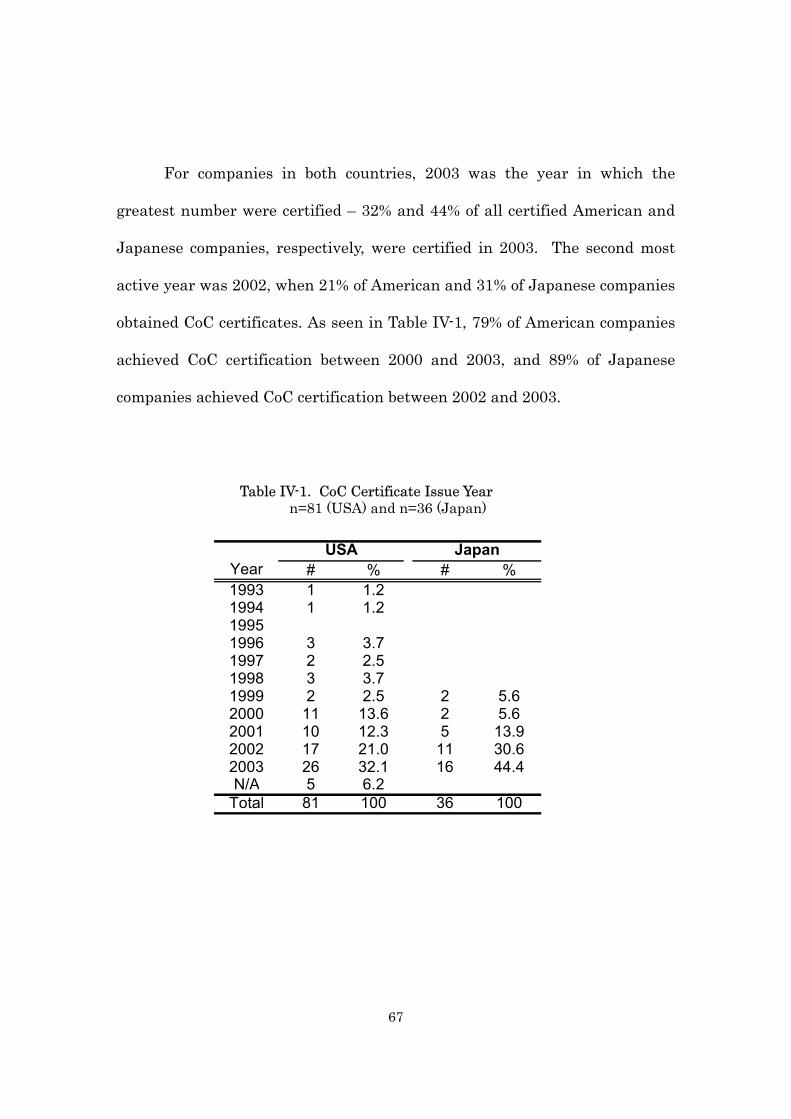
67
For companies in both countries, 2003 was the year in which the
greatest number were certified – 32% and 44% of all certified American and
Japanese companies, respectively, were certified in 2003. The second most
active year was 2002, when 21% of American and 31% of Japanese companies
obtained CoC certificates. As seen in Table IV-1, 79% of American companies
achieved CoC certification between 2000 and 2003, and 89% of Japanese
companies achieved CoC certification between 2002 and 2003.
Table IV-1. CoC Certificate Issue Year n=81 (USA) and n=36 (Japan)
# % # %1993 1 1.21994 1 1.219951996 3 3.71997 2 2.51998 3 3.71999 2 2.5 2 5.62000 11 13.6 2 5.62001 10 12.3 5 13.92002 17 21.0 11 30.62003 26 32.1 16 44.4N/A 5 6.2
Total 81 100 36 100
USA JapanYear
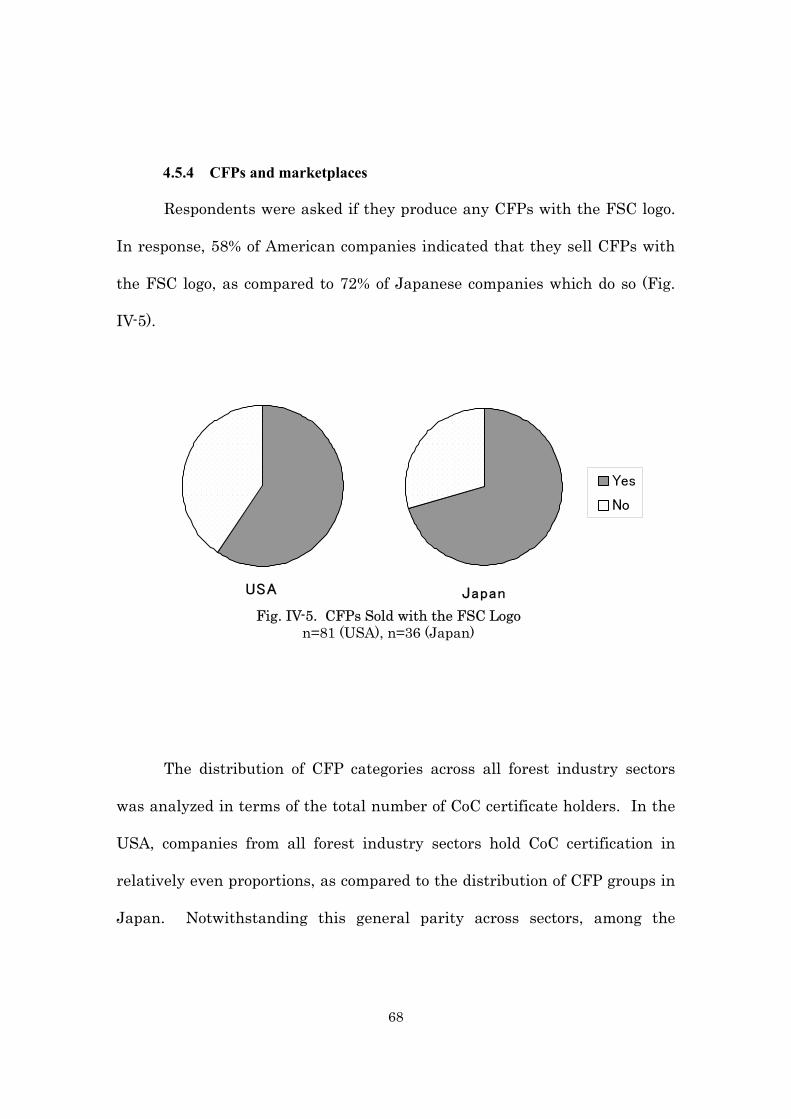
68
4.5.4 CFPs and marketplaces
Respondents were asked if they produce any CFPs with the FSC logo.
In response, 58% of American companies indicated that they sell CFPs with
the FSC logo, as compared to 72% of Japanese companies which do so (Fig.
IV-5).
The distribution of CFP categories across all forest industry sectors
was analyzed in terms of the total number of CoC certificate holders. In the
USA, companies from all forest industry sectors hold CoC certification in
relatively even proportions, as compared to the distribution of CFP groups in
Japan. Notwithstanding this general parity across sectors, among the
USA Japan
Yes
No
Fig. IV-5. CFPs Sold with the FSC Logo n=81 (USA), n=36 (Japan)
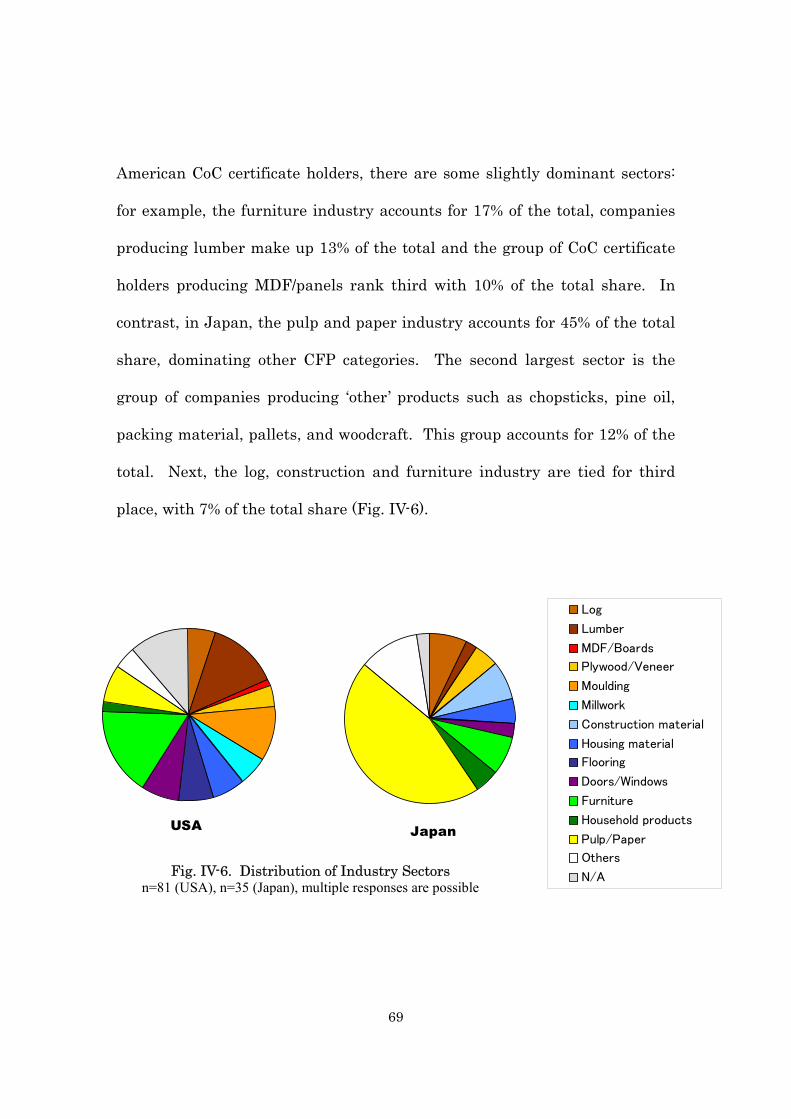
69
American CoC certificate holders, there are some slightly dominant sectors:
for example, the furniture industry accounts for 17% of the total, companies
producing lumber make up 13% of the total and the group of CoC certificate
holders producing MDF/panels rank third with 10% of the total share. In
contrast, in Japan, the pulp and paper industry accounts for 45% of the total
share, dominating other CFP categories. The second largest sector is the
group of companies producing ‘other’ products such as chopsticks, pine oil,
packing material, pallets, and woodcraft. This group accounts for 12% of the
total. Next, the log, construction and furniture industry are tied for third
place, with 7% of the total share (Fig. IV-6).
USA
Log
Lumber
Millwork
MDF/Boards
Plywood/Veneer
Moulding
Construction material
Housing material
Flooring
Doors/Windows
Furniture
Household products
Pulp/Paper
Others
N/A
Japan
Log
Lumber
MDF/Boards
Plywood/Veneer
Moulding
Millwork
Construction material
Housing material
Flooring
Doors/Windows
Furniture
Household products
Pulp/Paper
Others
N/AFig. IV-6. Distribution of Industry Sectors n=81 (USA), n=35 (Japan), multiple responses are possible
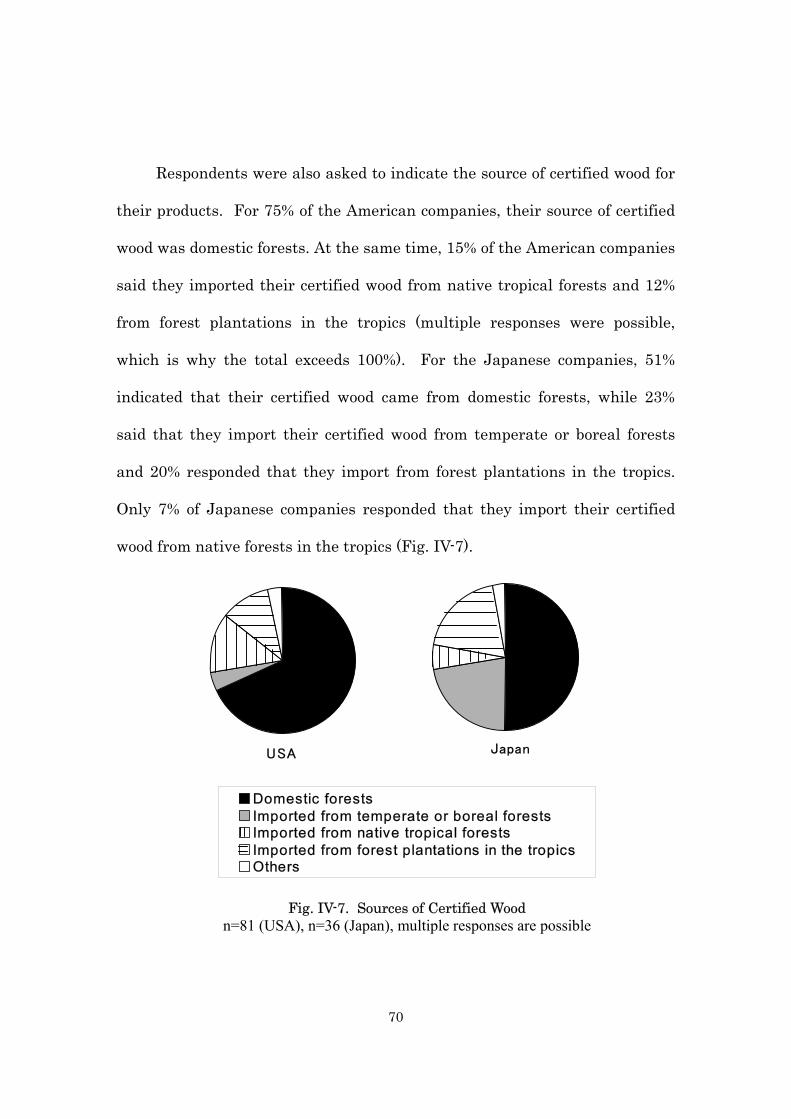
70
Respondents were also asked to indicate the source of certified wood for
their products. For 75% of the American companies, their source of certified
wood was domestic forests. At the same time, 15% of the American companies
said they imported their certified wood from native tropical forests and 12%
from forest plantations in the tropics (multiple responses were possible,
which is why the total exceeds 100%). For the Japanese companies, 51%
indicated that their certified wood came from domestic forests, while 23%
said that they import their certified wood from temperate or boreal forests
and 20% responded that they import from forest plantations in the tropics.
Only 7% of Japanese companies responded that they import their certified
wood from native forests in the tropics (Fig. IV-7).
Domestic forestsImported from temperate or boreal forestsImported from native tropical forestsImported from forest plantations in the tropicsOthers
USA Japan
Fig. IV-7. Sources of Certified Wood n=81 (USA), n=36 (Japan), multiple responses are possible
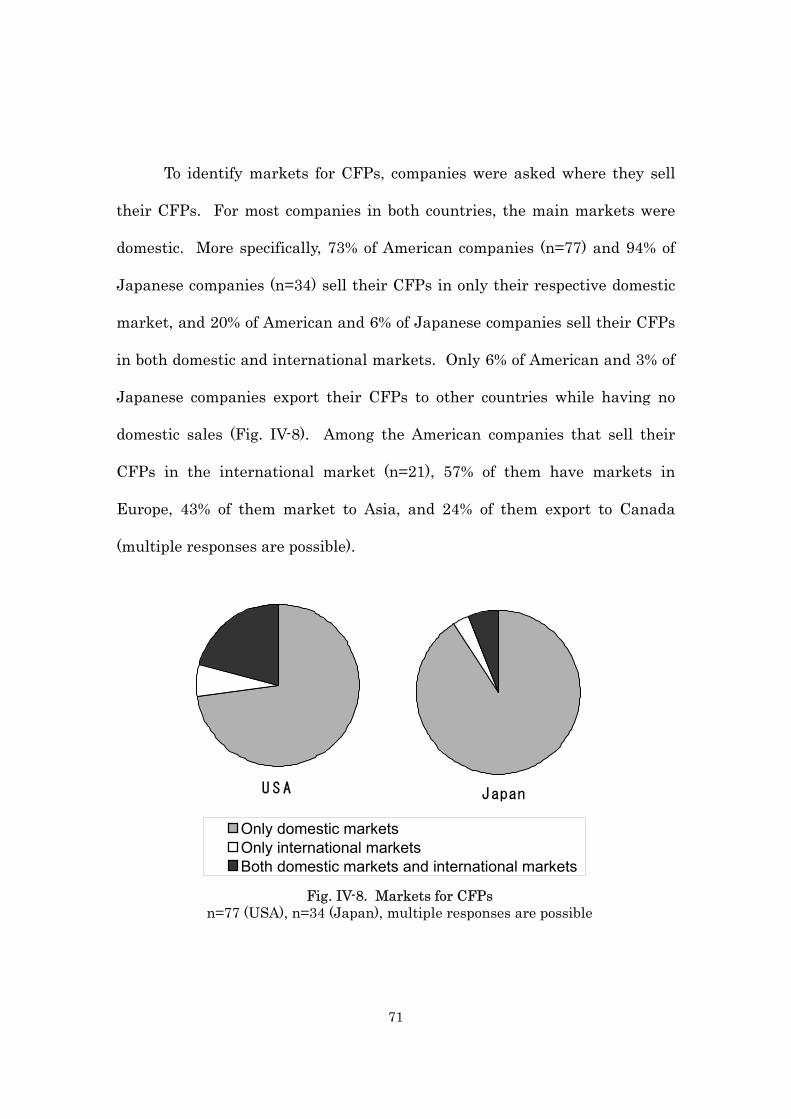
71
To identify markets for CFPs, companies were asked where they sell
their CFPs. For most companies in both countries, the main markets were
domestic. More specifically, 73% of American companies (n=77) and 94% of
Japanese companies (n=34) sell their CFPs in only their respective domestic
market, and 20% of American and 6% of Japanese companies sell their CFPs
in both domestic and international markets. Only 6% of American and 3% of
Japanese companies export their CFPs to other countries while having no
domestic sales (Fig. IV-8). Among the American companies that sell their
CFPs in the international market (n=21), 57% of them have markets in
Europe, 43% of them market to Asia, and 24% of them export to Canada
(multiple responses are possible).
Only domestic markets Only international markets Both domestic markets and international markets
Fig. IV-8. Markets for CFPs n=77 (USA), n=34 (Japan), multiple responses are possible
U S A Japan
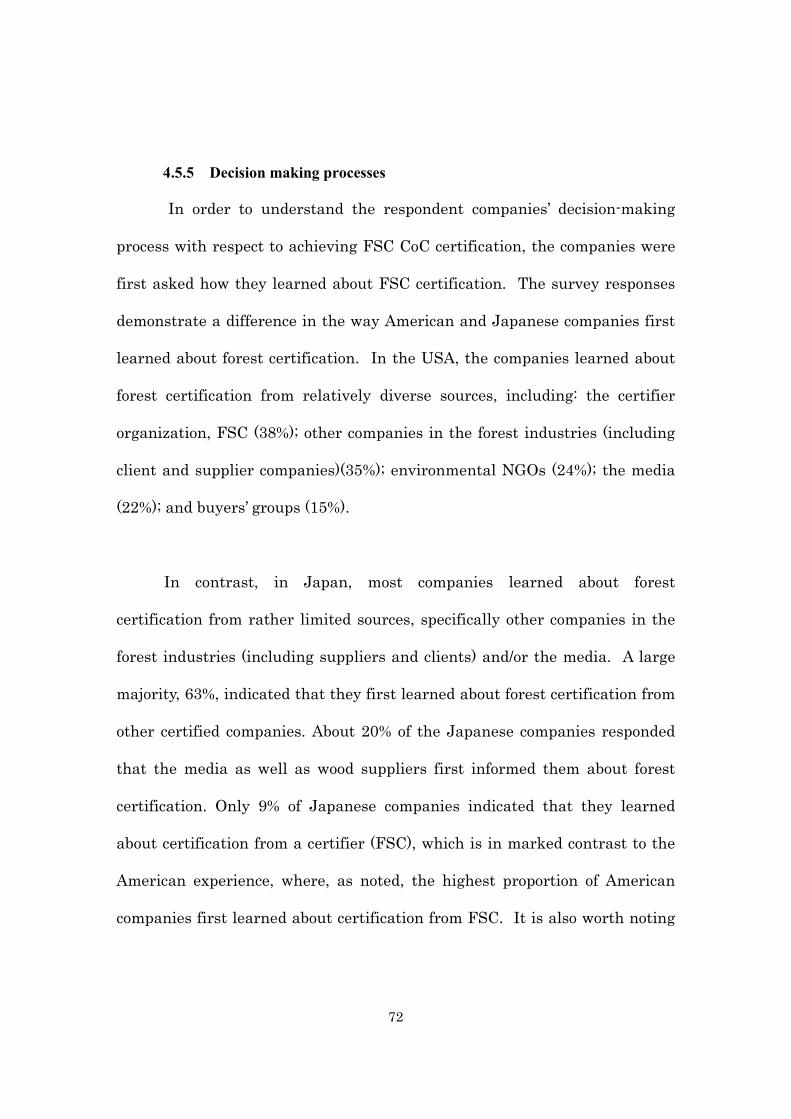
72
4.5.5 Decision making processes
In order to understand the respondent companies’ decision-making
process with respect to achieving FSC CoC certification, the companies were
first asked how they learned about FSC certification. The survey responses
demonstrate a difference in the way American and Japanese companies first
learned about forest certification. In the USA, the companies learned about
forest certification from relatively diverse sources, including: the certifier
organization, FSC (38%); other companies in the forest industries (including
client and supplier companies)(35%); environmental NGOs (24%); the media
(22%); and buyers’ groups (15%).
In contrast, in Japan, most companies learned about forest
certification from rather limited sources, specifically other companies in the
forest industries (including suppliers and clients) and/or the media. A large
majority, 63%, indicated that they first learned about forest certification from
other certified companies. About 20% of the Japanese companies responded
that the media as well as wood suppliers first informed them about forest
certification. Only 9% of Japanese companies indicated that they learned
about certification from a certifier (FSC), which is in marked contrast to the
American experience, where, as noted, the highest proportion of American
companies first learned about certification from FSC. It is also worth noting
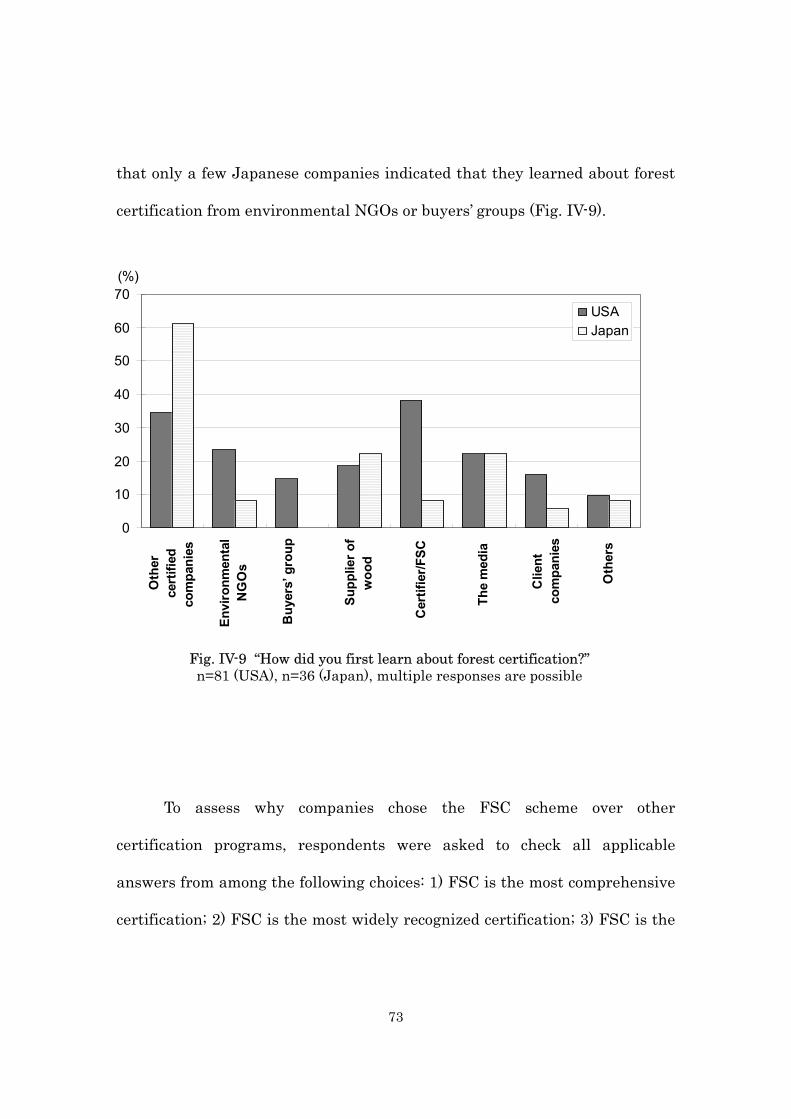
73
that only a few Japanese companies indicated that they learned about forest
certification from environmental NGOs or buyers’ groups (Fig. IV-9).
To assess why companies chose the FSC scheme over other
certification programs, respondents were asked to check all applicable
answers from among the following choices: 1) FSC is the most comprehensive
certification; 2) FSC is the most widely recognized certification; 3) FSC is the
Fig. IV-9 “How did you first learn about forest certification?” n=81 (USA), n=36 (Japan), multiple responses are possible
0
10
20
30
40
50
60
70
Oth
erce
rtifi
edco
mpa
nies
Envi
ronm
enta
lN
GO
s
Buy
ers’
gro
up
Supp
lier o
fw
ood
Cer
tifie
r/FSC
The
med
ia
Clie
ntco
mpa
nies
Oth
ers
(%)
USAJapan
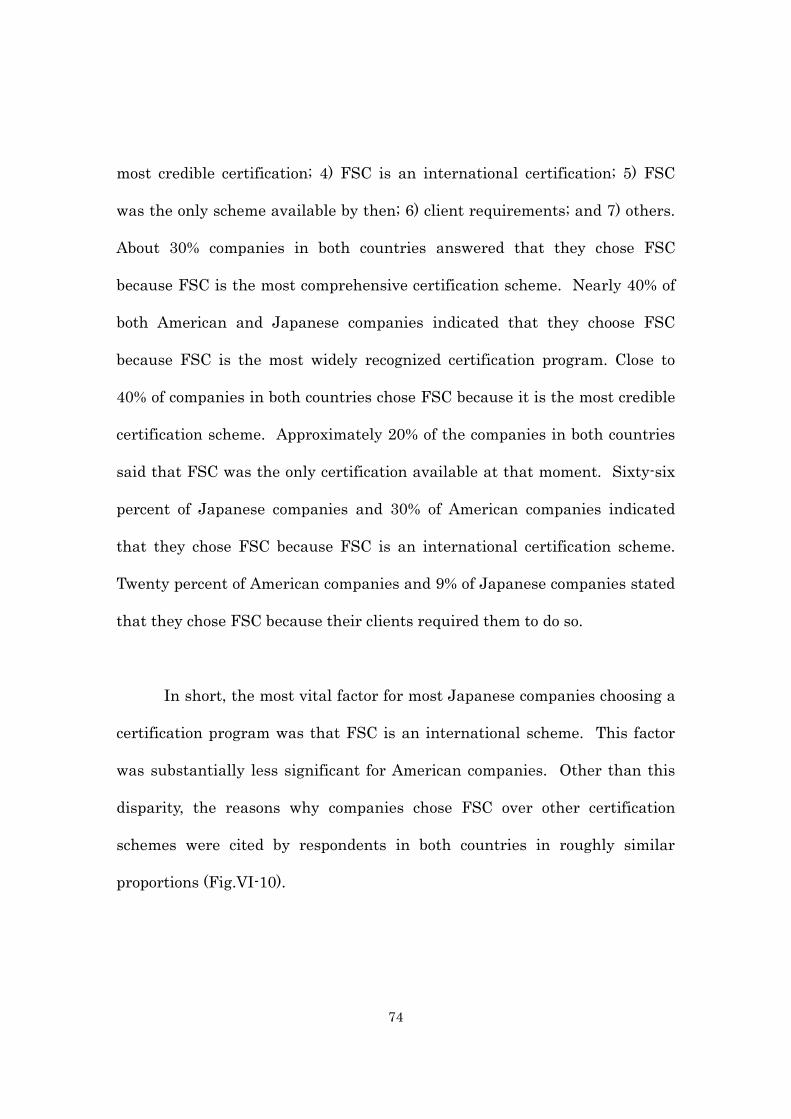
74
most credible certification; 4) FSC is an international certification; 5) FSC
was the only scheme available by then; 6) client requirements; and 7) others.
About 30% companies in both countries answered that they chose FSC
because FSC is the most comprehensive certification scheme. Nearly 40% of
both American and Japanese companies indicated that they choose FSC
because FSC is the most widely recognized certification program. Close to
40% of companies in both countries chose FSC because it is the most credible
certification scheme. Approximately 20% of the companies in both countries
said that FSC was the only certification available at that moment. Sixty-six
percent of Japanese companies and 30% of American companies indicated
that they chose FSC because FSC is an international certification scheme.
Twenty percent of American companies and 9% of Japanese companies stated
that they chose FSC because their clients required them to do so.
In short, the most vital factor for most Japanese companies choosing a
certification program was that FSC is an international scheme. This factor
was substantially less significant for American companies. Other than this
disparity, the reasons why companies chose FSC over other certification
schemes were cited by respondents in both countries in roughly similar
proportions (Fig.VI-10).
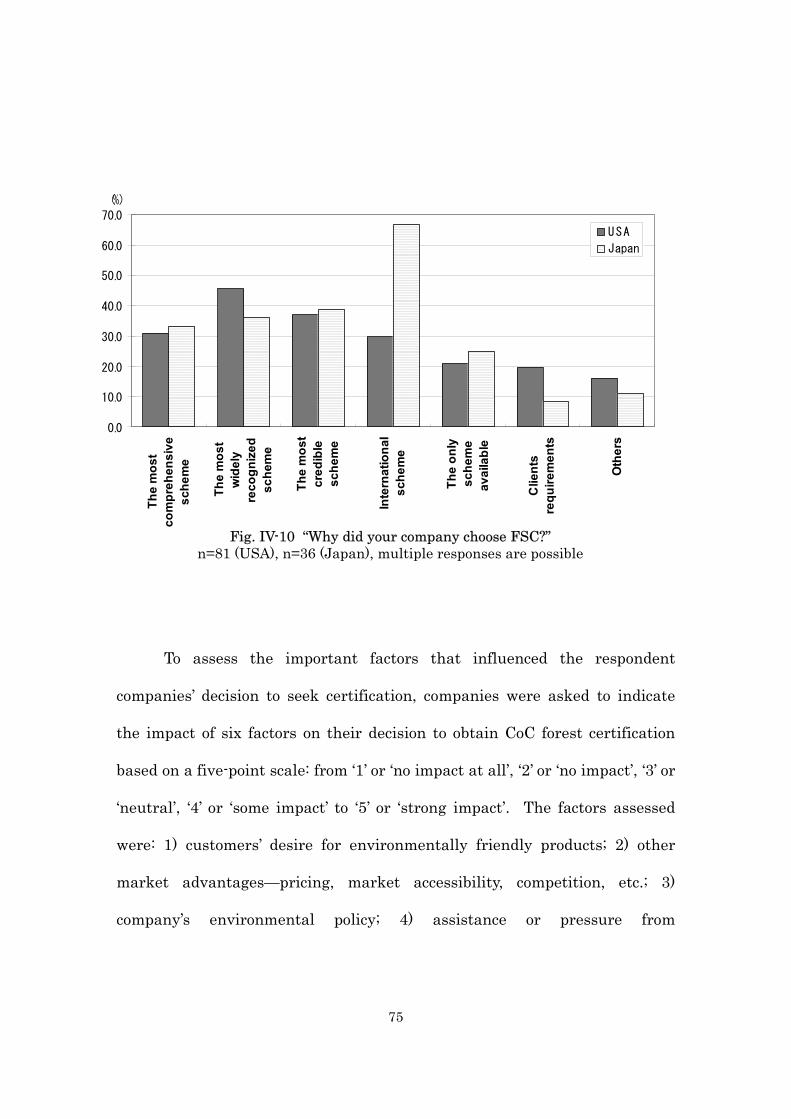
75
To assess the important factors that influenced the respondent
companies’ decision to seek certification, companies were asked to indicate
the impact of six factors on their decision to obtain CoC forest certification
based on a five-point scale: from ‘1’ or ‘no impact at all’, ‘2’ or ‘no impact’, ‘3’ or
‘neutral’, ‘4’ or ‘some impact’ to ‘5’ or ‘strong impact’. The factors assessed
were: 1) customers’ desire for environmentally friendly products; 2) other
market advantages—pricing, market accessibility, competition, etc.; 3)
company’s environmental policy; 4) assistance or pressure from
Fig. IV-10 “Why did your company choose FSC?” n=81 (USA), n=36 (Japan), multiple responses are possible
0.0
10.0
20.0
30.0
40.0
50.0
60.0
70.0
The
mos
tco
mpr
ehen
sive
sche
me
The
mos
tw
idel
yre
cogn
ized
sche
me
The
mos
tcr
edib
lesc
hem
e
Inte
rnat
iona
lsc
hem
e
The
only
sche
me
avai
labl
e
Clie
nts
requ
irem
ents
Oth
ers
(%)
USA
Japan
76
environmental NGOs; 5) assistance or pressure from government; and (6)
avoiding increased regulation.
In the USA, more than 50% of the companies responded that their
customers’ desire for environmentally friendly products had a strong impact
or some impact on their decision to achieve CoC certification. Close to 40% of
American companies said market advantages, and their environmental policy
had a strong impact or some impact on their decision. However, in strong
contrast, very few American companies said that factors such as assistance or
pressure from environmental NGOs, assistance or pressure from the
government and avoiding increased regulation had any impact on their
decisions to obtain CoC certification.
Over 80% of Japanese companies agreed that their environmental
policy had a strong impact or some impact on their decision for CoC
certification. More than 70% of Japanese companies indicated that their
customers’ desire for environmentally friendly products had a strong impact
or some impact on their decision and close to 60% of Japanese companies said
market advantages did so. On the contrary, but similar to the trends in the
American companies’ responses, most Japanese companies thought
assistance or pressure from environmental NGOs, assistance or pressure
77
from the government, and avoiding increased regulation had no impact or no
impact at all. (Fig.IV-11).
Interestingly, correlations among these three factors were high,
indicating that companies that think that environmental NGO pressure or
assistance affects their decisions, also tend to allow pressure or assistance
from government and/or the desire to avoid increased regulations to influence
their decision (Appendix 4).
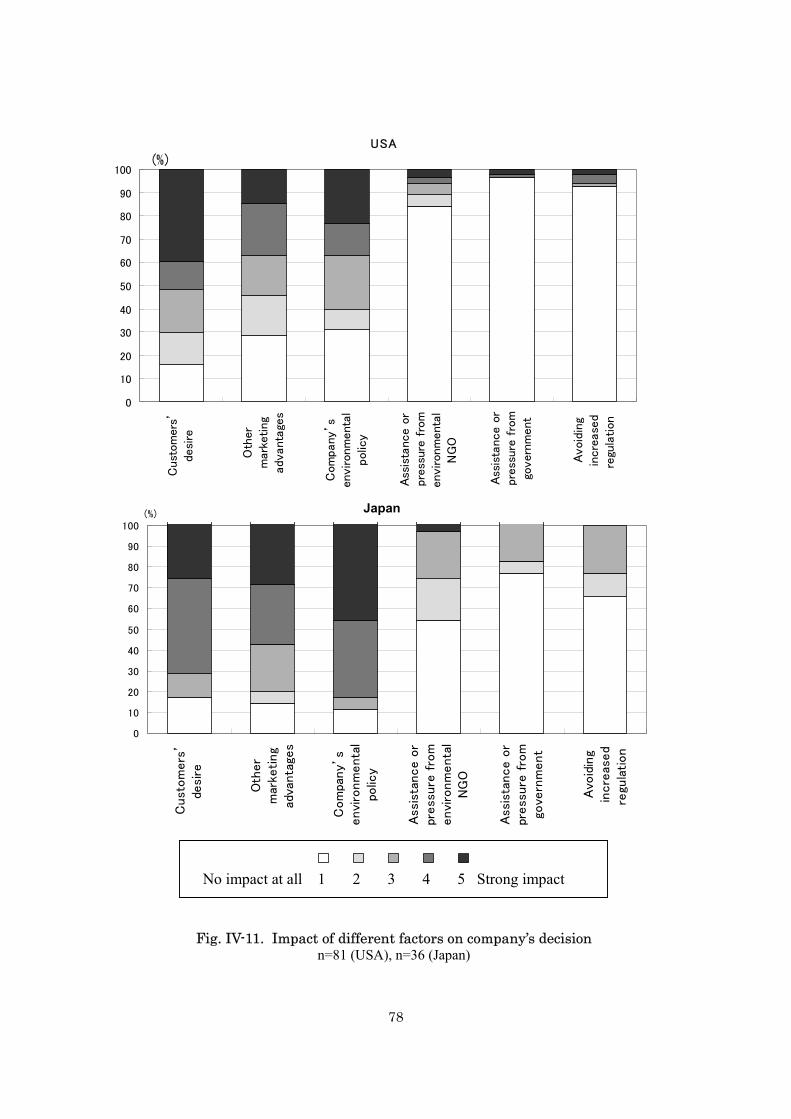
78
0
10
20
30
40
50
60
70
80
90
100C
ust
om
ers
’de
sire
Oth
er
mar
keting
adva
ntage
s
Com
pany
’sen
viro
nm
ent
alpol
icy
Ass
ista
nce
or
pres
sure
fro
men
viro
nm
ent
alN
GO
Ass
ista
nce
orpr
essu
re f
rom
gover
nmen
t
Avoi
din
gin
cre
ase
dre
gula
tion
USA
(%)
Strong impactJapan
0
10
20
30
40
50
60
70
80
90
100
Cust
om
ers
’de
sire
Oth
er
mar
keting
adva
nta
ges
Com
pany’
senvi
ronm
enta
lpo
licy
Ass
ista
nce o
rpr
ess
ure
fro
menvi
ronm
enta
lN
GO
Ass
ista
nce o
rpr
ess
ure
fro
mgo
vern
ment
Avo
idin
gin
cre
ased
regu
lation
(%)
No impact at all 1 2 3 4 5 Strong impact
Fig. IV-11. Impact of different factors on company’s decision n=81 (USA), n=36 (Japan)
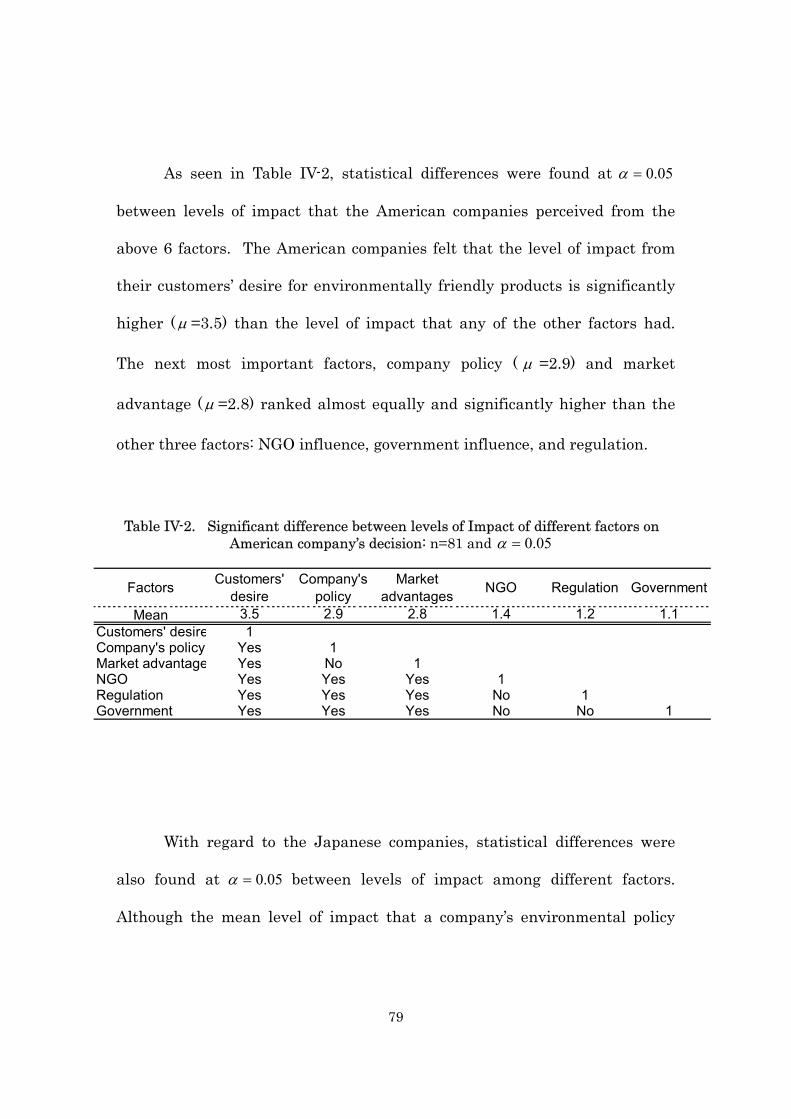
79
As seen in Table IV-2, statistical differences were found at 05.0=α
between levels of impact that the American companies perceived from the
above 6 factors. The American companies felt that the level of impact from
their customers’ desire for environmentally friendly products is significantly
higher ( µ =3.5) than the level of impact that any of the other factors had.
The next most important factors, company policy ( µ =2.9) and market
advantage ( µ =2.8) ranked almost equally and significantly higher than the
other three factors: NGO influence, government influence, and regulation.
With regard to the Japanese companies, statistical differences were
also found at 05.0=α between levels of impact among different factors.
Although the mean level of impact that a company’s environmental policy
Table IV-2. Significant difference between levels of Impact of different factors on American company’s decision: n=81 and 05.0=α
Factors Customers'desire
Company'spolicy
Marketadvantages NGO Regulation Government
Mean 3.5 2.9 2.8 1.4 1.2 1.1Customers' desire 1Company's policy Yes 1Market advantage Yes No 1NGO Yes Yes Yes 1Regulation Yes Yes Yes No 1Government Yes Yes Yes No No 1
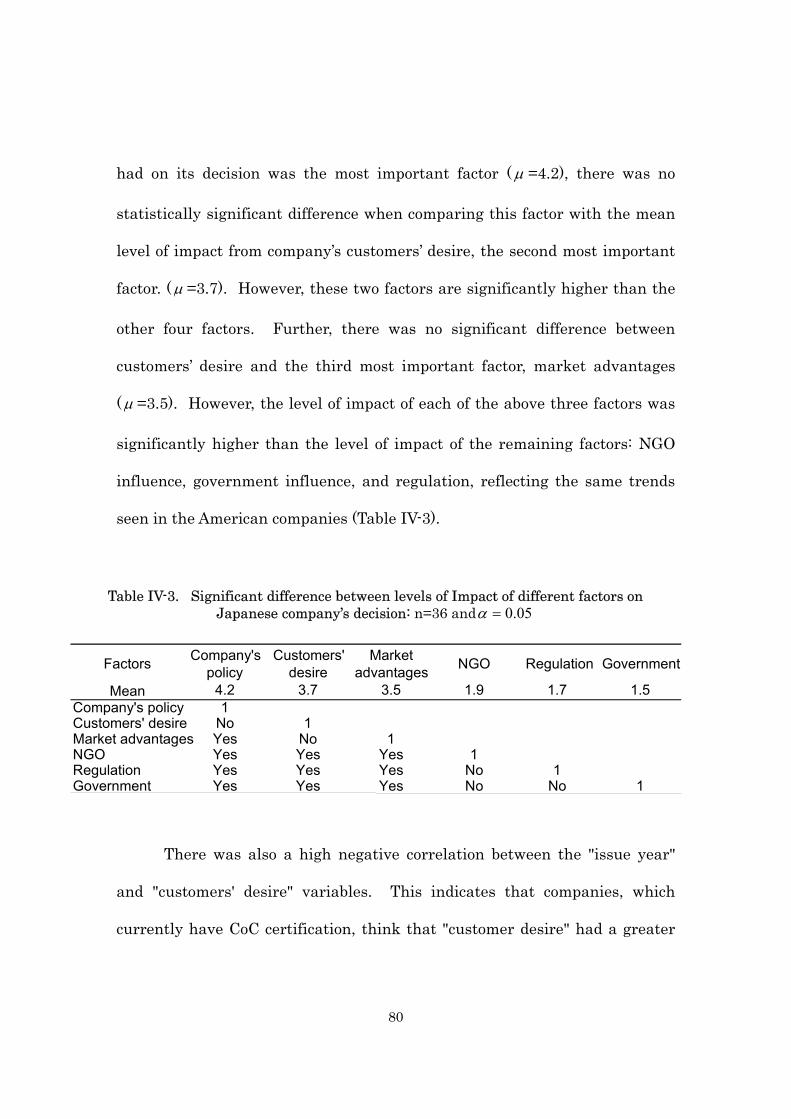
80
had on its decision was the most important factor ( µ =4.2), there was no
statistically significant difference when comparing this factor with the mean
level of impact from company’s customers’ desire, the second most important
factor. ( µ =3.7). However, these two factors are significantly higher than the
other four factors. Further, there was no significant difference between
customers’ desire and the third most important factor, market advantages
( µ =3.5). However, the level of impact of each of the above three factors was
significantly higher than the level of impact of the remaining factors: NGO
influence, government influence, and regulation, reflecting the same trends
seen in the American companies (Table IV-3).
There was also a high negative correlation between the "issue year"
and "customers' desire" variables. This indicates that companies, which
currently have CoC certification, think that "customer desire" had a greater
Table IV-3. Significant difference between levels of Impact of different factors on Japanese company’s decision: n=36 and 05.0=α
Factors Company's policy
Customers'desire
Marketadvantages NGO Regulation Government
Mean 4.2 3.7 3.5 1.9 1.7 1.5 Company's policy 1 Customers' desire No 1 Market advantages Yes No 1NGO Yes Yes Yes 1Regulation Yes Yes Yes No 1 Government Yes Yes Yes No No 1
81
impact on their decision to obtain it (Appendix 4).
4.5.6 Expectations
One of the important objectives of this survey was to assess current
CoC certificate holders’ expectations from forest certification. In order to
make this assessment, companies were asked to indicate their level of
expectation regarding six factors: 1) earning a price premium; 2) maintaining
current market share; 3) expanding access to new markets; 4) improving
company image; 5) conserving forest resources; and 6) others. They were
asked to rank their expectations based on a five-point scale: from ‘1’ or ‘no
expectation at all’, ‘2’ or ‘no expectation’, ‘3’ or ‘neutral’, ‘4’ or ‘some
expectation’ to ‘5’ or ‘strong expectation.’
With regard to earning a price premium from forest certification, only
10% of American companies indicated that they had strong expectation or
some expectation while more than 75% of American companies said they did
not expect to earn any price premium – 57% had no expectation at all and
20% had no expectation. About 30% of American companies responded that
they had a strong expectation or some expectation of maintaining current
market share by holding CoC certification, while 46% of them had no
expectation or no expectation at all of doing so. As to new market
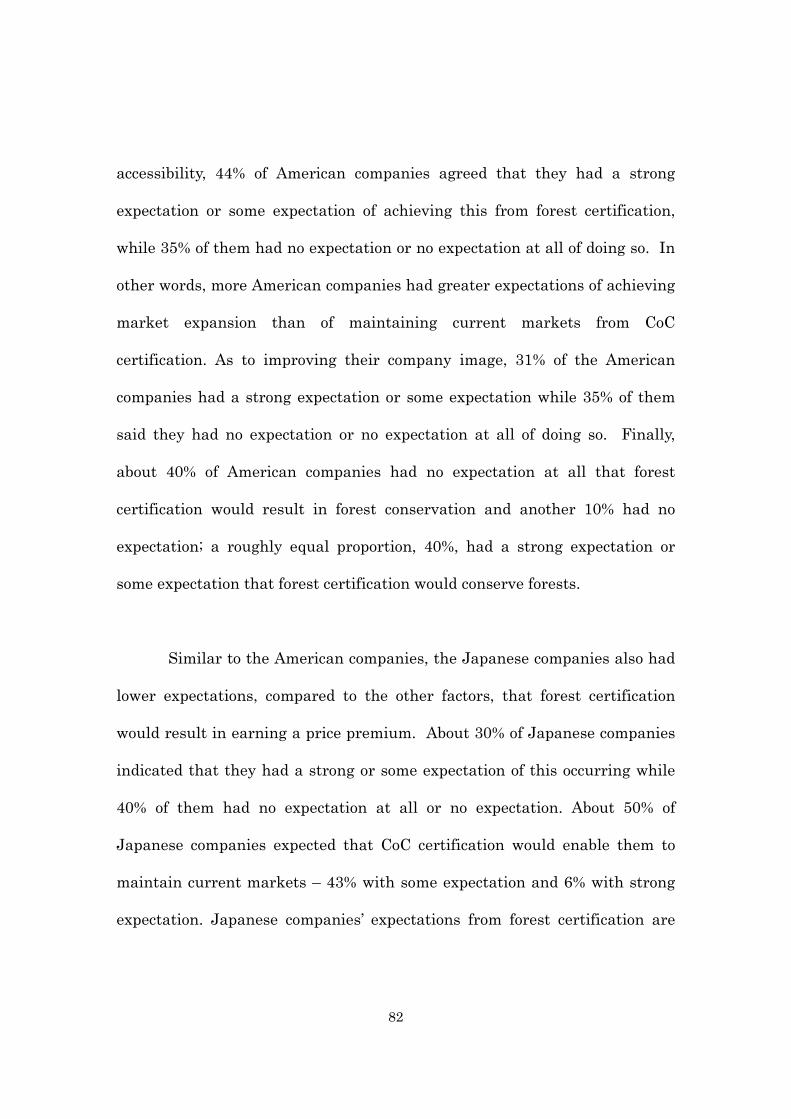
82
accessibility, 44% of American companies agreed that they had a strong
expectation or some expectation of achieving this from forest certification,
while 35% of them had no expectation or no expectation at all of doing so. In
other words, more American companies had greater expectations of achieving
market expansion than of maintaining current markets from CoC
certification. As to improving their company image, 31% of the American
companies had a strong expectation or some expectation while 35% of them
said they had no expectation or no expectation at all of doing so. Finally,
about 40% of American companies had no expectation at all that forest
certification would result in forest conservation and another 10% had no
expectation; a roughly equal proportion, 40%, had a strong expectation or
some expectation that forest certification would conserve forests.
Similar to the American companies, the Japanese companies also had
lower expectations, compared to the other factors, that forest certification
would result in earning a price premium. About 30% of Japanese companies
indicated that they had a strong or some expectation of this occurring while
40% of them had no expectation at all or no expectation. About 50% of
Japanese companies expected that CoC certification would enable them to
maintain current markets – 43% with some expectation and 6% with strong
expectation. Japanese companies’ expectations from forest certification are
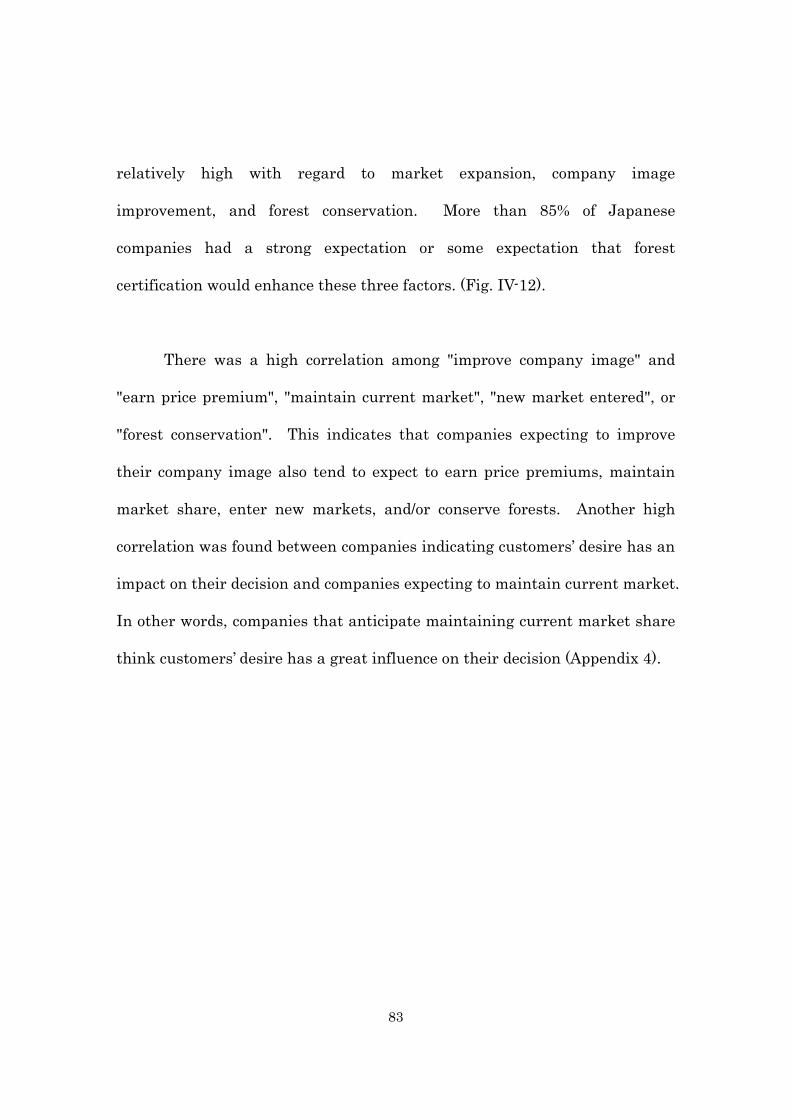
83
relatively high with regard to market expansion, company image
improvement, and forest conservation. More than 85% of Japanese
companies had a strong expectation or some expectation that forest
certification would enhance these three factors. (Fig. IV-12).
There was a high correlation among "improve company image" and
"earn price premium", "maintain current market", "new market entered", or
"forest conservation". This indicates that companies expecting to improve
their company image also tend to expect to earn price premiums, maintain
market share, enter new markets, and/or conserve forests. Another high
correlation was found between companies indicating customers’ desire has an
impact on their decision and companies expecting to maintain current market.
In other words, companies that anticipate maintaining current market share
think customers’ desire has a great influence on their decision (Appendix 4).
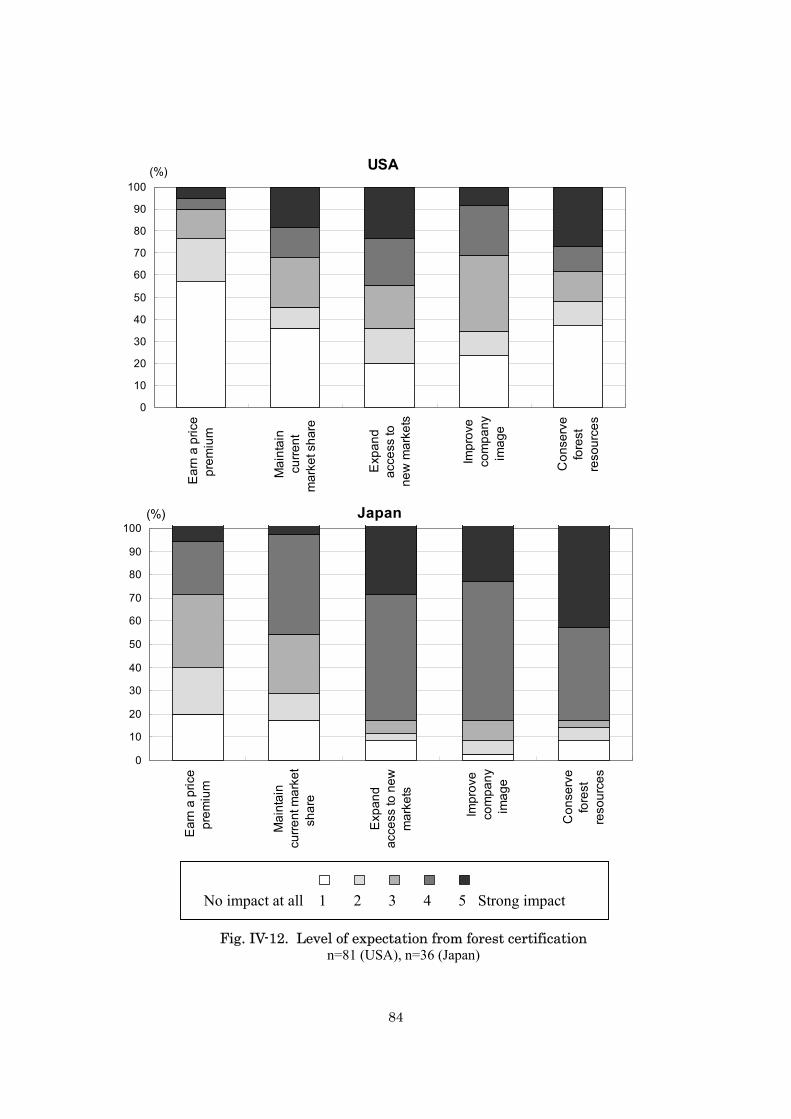
84
USA
0
10
20
30
40
50
60
70
80
90
100E
arn
a pr
ice
prem
ium
Mai
ntai
ncu
rrent
mar
ket s
hare
Exp
and
acce
ss to
new
mar
kets
Impr
ove
com
pany
imag
e
Con
serv
efo
rest
reso
urce
s
(%)
Japan
0
10
20
30
40
50
60
70
80
90
100
Ear
n a
pric
epr
emiu
m
Mai
ntai
ncu
rrent
mar
ket
shar
e
Exp
and
acce
ss to
new
mar
kets
Impr
ove
com
pany
imag
e
Con
serv
efo
rest
reso
urce
s
(%)
No impact at all 1 2 3 4 5 Strong impact
Fig. IV-12. Level of expectation from forest certification n=81 (USA), n=36 (Japan)
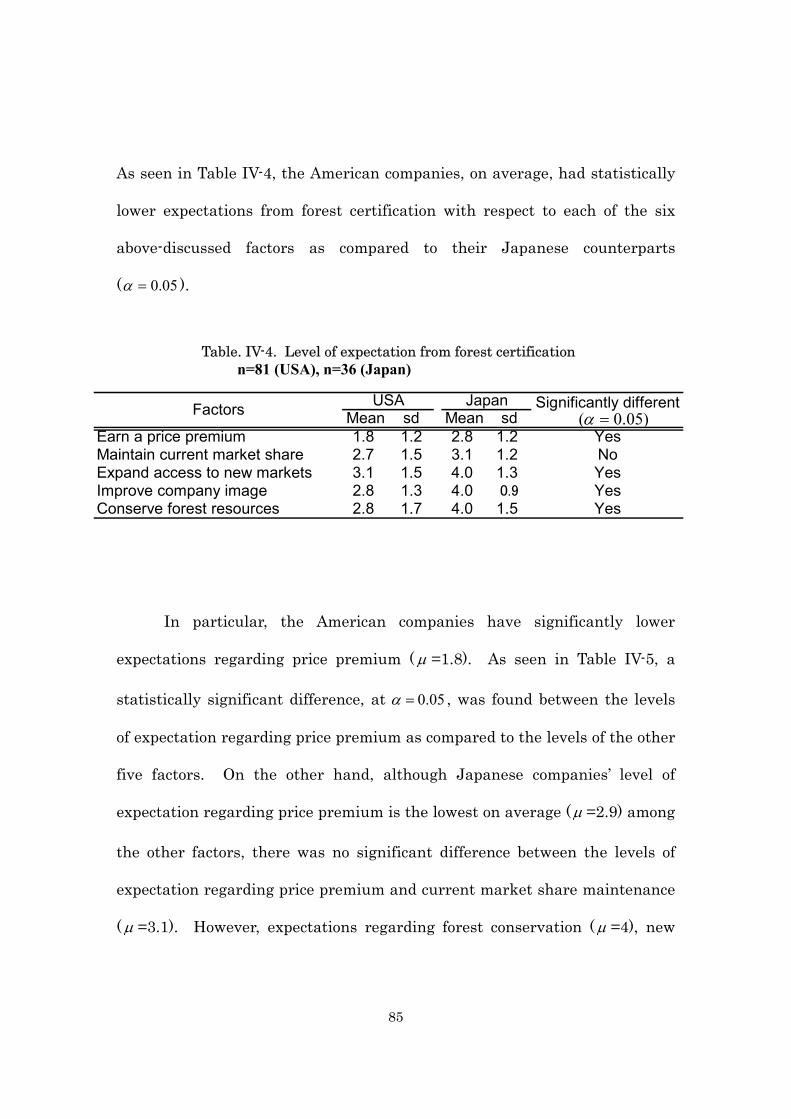
85
As seen in Table IV-4, the American companies, on average, had statistically
lower expectations from forest certification with respect to each of the six
above-discussed factors as compared to their Japanese counterparts
( 05.0=α ).
In particular, the American companies have significantly lower
expectations regarding price premium ( µ =1.8). As seen in Table IV-5, a
statistically significant difference, at 05.0=α , was found between the levels
of expectation regarding price premium as compared to the levels of the other
five factors. On the other hand, although Japanese companies’ level of
expectation regarding price premium is the lowest on average ( µ =2.9) among
the other factors, there was no significant difference between the levels of
expectation regarding price premium and current market share maintenance
( µ =3.1). However, expectations regarding forest conservation ( µ =4), new
Table. IV-4. Level of expectation from forest certification n=81 (USA), n=36 (Japan)
Mean sd Mean sdEarn a price premium 1.8 1.2 2.8 1.2 YesMaintain current market share 2.7 1.5 3.1 1.2 NoExpand access to new markets 3.1 1.5 4.0 1.3 YesImprove company image 2.8 1.3 4.0 0.9 YesConserve forest resources 2.8 1.7 4.0 1.5 Yes
Significantly different USA JapanFactors )05.0( =α
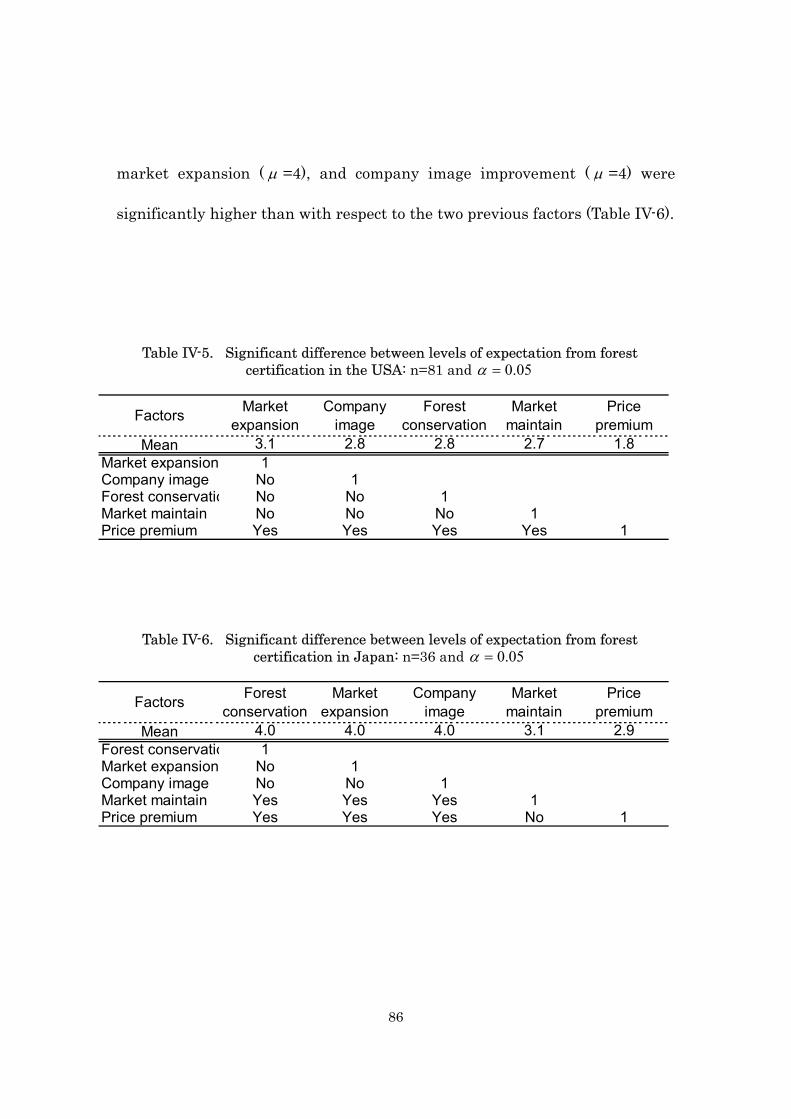
86
market expansion ( µ =4), and company image improvement ( µ =4) were
significantly higher than with respect to the two previous factors (Table IV-6).
Factors Marketexpansion
Companyimage
Forestconservation
Marketmaintain
Pricepremium
Mean 3.1 2.8 2.8 2.7 1.8Market expansion 1Company image No 1Forest conservatio No No 1Market maintain No No No 1Price premium Yes Yes Yes Yes 1
Table IV-5. Significant difference between levels of expectation from forest certification in the USA: n=81 and 05.0=α
Table IV-6. Significant difference between levels of expectation from forest certification in Japan: n=36 and 05.0=α
Factors Forestconservation
Marketexpansion
Companyimage
Marketmaintain
Pricepremium
Mean 4.0 4.0 4.0 3.1 2.9Forest conservatio 1Market expansion No 1Company image No No 1Market maintain Yes Yes Yes 1Price premium Yes Yes Yes No 1
87
To assess factors that might argue against FSC CoC certification,
companies were asked to check any of the following possible reasons that
might cause them to drop FSC CoC certification: 1) no price premium; 2) no
increased demand for CFPs; 3) another more appropriate certification
scheme; 4) no decreased cost of certification; and 5) others.
In the USA, 67% of CoC certificate holders indicated that they might
drop FSC CoC certification if demand for CFPs does not increase. As the
second highest percentage, 38% of American companies think they might
shift forest certification programs if there is another scheme that is more
advantageous to them. Another factor with regard to the certification scheme,
28% of them think that a failure to realize a decrease in the cost of
certification might cause them to drop FSC certification. Another 28% of
current CoC holders anticipate that they might suspend CoC certification if
no price premium is realized, which is much higher than the percentage of
companies (10%) that indicated they expect price premiums from forest
certification. About 20% of American companies stated other possible causes
that may result in discontinuation of their certified status, including: no
increase in certified material supply (n=13); customers no longer requiring
FSC; tracking systems and paper work getting more complicated (n=2); and
so on. It also worth noting that 10% of American companies indicate none of
88
the above reasons would cause them to drop FSC CoC certification.
As to Japanese companies, 44% think they might drop FSC CoC
certification if demand for CFPs does not increase. Both ‘another more
desirable certification program’ and ‘no decrease in costs of certification’ were
each cited by about 30% of Japanese companies as factors that would cause
them to drop FSC CoC certification. Finally, 14% of Japanese companies
think that they would suspend certification if no price premium was realized.
Other factors that Japanese companies mentioned as possible reasons to drop
FSC certification include, if: FSC lost its credibility; NGOs stopped their
assistance; and tracking systems became more complicated.
In summary, ‘no increase in demand for CFPs,’ was chosen by the
highest percentage of companies in both countries as a possible reason why
they might drop certification. Another factor relating to market benefits, no
price premium, was not a widely cited potential cause of dropping
certification, compare to the ‘growth in demand’ factor. It is also worth noting
that about 10% of companies in Japan – the same percentage as in American
companies -- indicated that none of the above factors would cause them drop
FSC CoC certification (Fig. IV-13).
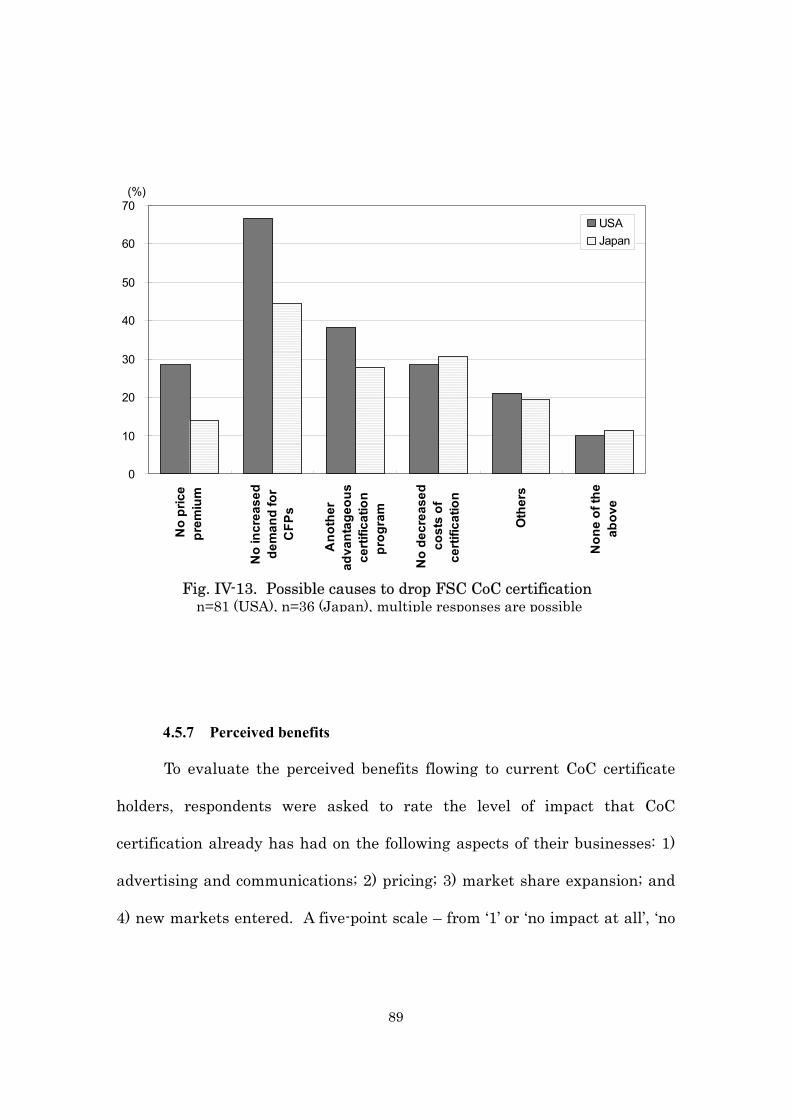
89
4.5.7 Perceived benefits
To evaluate the perceived benefits flowing to current CoC certificate
holders, respondents were asked to rate the level of impact that CoC
certification already has had on the following aspects of their businesses: 1)
advertising and communications; 2) pricing; 3) market share expansion; and
4) new markets entered. A five-point scale – from ‘1’ or ‘no impact at all’, ‘no
Fig. IV-13. Possible causes to drop FSC CoC certification n=81 (USA), n=36 (Japan), multiple responses are possible
0
10
20
30
40
50
60
70
No
pric
epr
emiu
m
No
incr
ease
dde
man
d fo
rC
FPs
Ano
ther
adva
ntag
eous
certi
ficat
ion
prog
ram
No
decr
ease
dco
sts
ofce
rtific
atio
n
Oth
ers
Non
e of
the
abov
e
(%)
USAJapan
90
impact’, ‘3’ or ‘neutral’, ‘4’ or ‘some impact’ to ‘5’ or ‘strong impact’ – was used
to measure the responses in each category.
The results show that American companies have perceived very little
marketing advantage from CoC certification so far. For each of the four
factors, more than 50% of American companies (64% for price premium)
indicated that they have had no impact at all. Further, those companies
indicating ‘no impact at all’ and/or ‘no impact’, covered more than 70% of all
American companies for all four factors. Only 17% of American companies
recognized a positive impact (‘some’ or ‘strong’ impact) of certification on
advertising and communication campaigns, 13% of them indicated positive
impacts on pricing, 9% of them perceived a positive impact on market share
expansion, and 15% of them thought there was a positive impact on new
markets entered. The American companies expected the greatest impact of
CoC certification to be on new market accessibility, but apparently very few
companies have yet to perceive such a benefit.
Japanese companies perceived a slightly higher impact of CoC
certification on market benefits. Surprisingly, 43% of Japanese CoC holders,
including 9% of them recognizing a ‘strong impact,’ indicated that CoC
certification already has had an impact on their advertising and
91
communication campaigns. And 43% of them (37% ‘some impact’ and 6%
‘strong impact’) also thought that certification has had an impact on their
ability to expand their market share. While 60% of Japanese companies
think there has not yet been an impact on market share expansion, 26% of
them believe there has been such an impact. As to pricing, the Japanese
perception was similar to the Americans’. Only 3% of Japanese CoC holders
think that forest certification has had an impact on pricing of CFPs and 77%
of them agreed that they have not yet recognized any pricing impact from
CoC certification (Fig. IV-14).
The correlations among the factors, "advertisement" and "new markets
entered" or "market share expansion", were high. This means that
companies indicated that CoC certification had an impact on their
advertising and communications campaigns also thought there was impact
from certification on new markets entered and/or market share expansion
(Appendix 4).
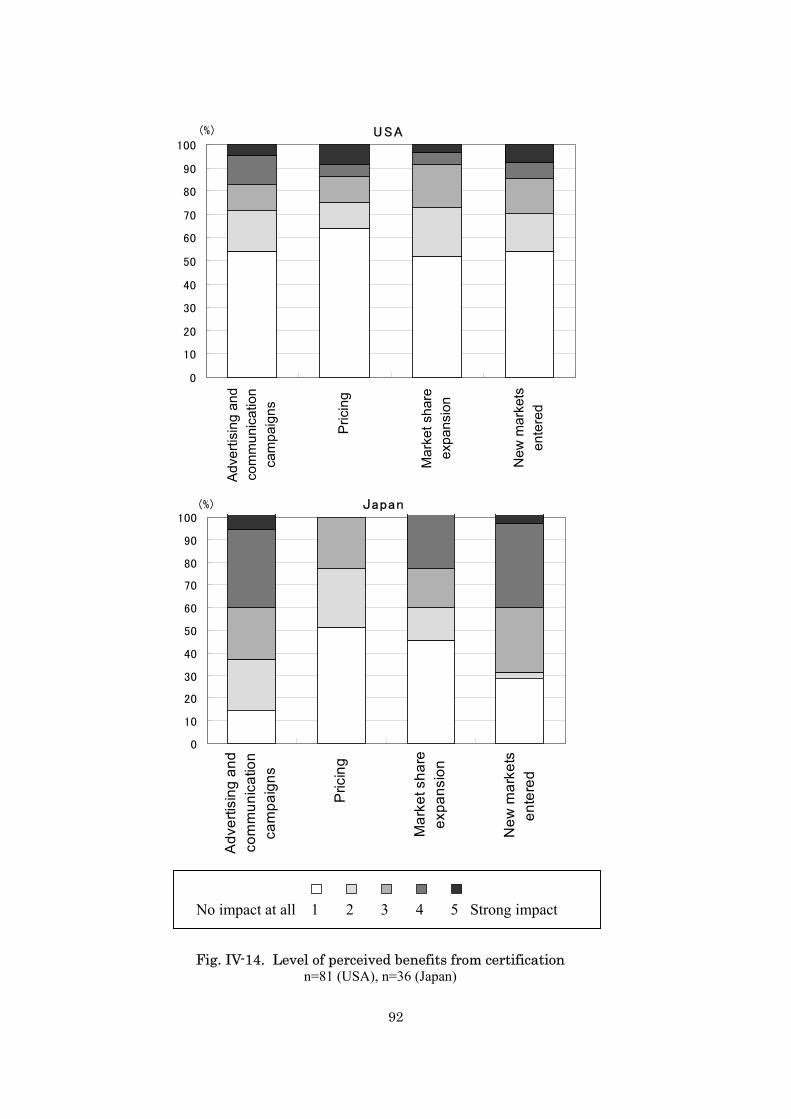
92
USA
0
10
20
30
40
50
60
70
80
90
100
Adv
ertis
ing
and
com
mun
icat
ion
cam
paig
ns
Pric
ing
Mar
ket s
hare
expa
nsio
n
New
mar
kets
ente
red
(%)
Japan
0
10
20
30
40
50
60
70
80
90
100
Adv
ertis
ing
and
com
mun
icat
ion
cam
paig
ns
Pric
ing
Mar
ket s
hare
expa
nsio
n
New
mar
kets
ente
red
(%)
No impact at all 1 2 3 4 5 Strong impact
Fig. IV-14. Level of perceived benefits from certification n=81 (USA), n=36 (Japan)
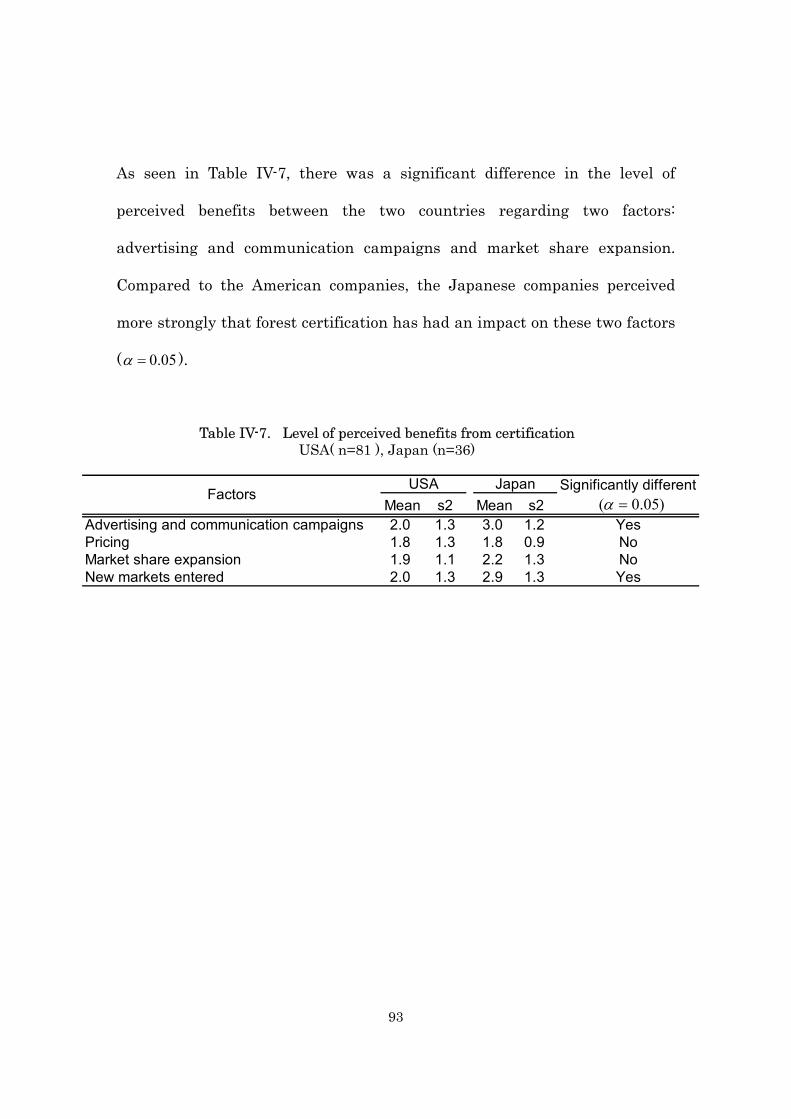
93
As seen in Table IV-7, there was a significant difference in the level of
perceived benefits between the two countries regarding two factors:
advertising and communication campaigns and market share expansion.
Compared to the American companies, the Japanese companies perceived
more strongly that forest certification has had an impact on these two factors
( 05.0=α ).
Mean s2 Mean s2Advertising and communication campaigns 2.0 1.3 3.0 1.2 YesPricing 1.8 1.3 1.8 0.9 NoMarket share expansion 1.9 1.1 2.2 1.3 NoNew markets entered 2.0 1.3 2.9 1.3 Yes
USAFactors Significantly differentJapan
)05.0( =α
Table IV-7. Level of perceived benefits from certification USA( n=81 ), Japan (n=36)
94
4.6 Discussion
4.6.1 Certification Status
Forest management certificate holders who are active as wood
manufacturers or traders may also want to achieve CoC certification so that
they can produce CFPs effectively with a steady supply of certified materials
from their own forests. In this survey, there were 21 CoC certificate holders
that have their own forests, and 11 of them have forest management
certification. Those companies that have both forest management and CoC
certification are in a relatively upstream sector in the processing chain, e.g.,
primary and value added timber products sectors, or big corporations that
have established their own processing systems, e.g., Japanese paper
companies. There was no company producing only downstream products
such as doors/windows, furniture, household products, and flooring holding
both forest management and CoC certification, even though some of those
producers own forests. This may be because of the complexity of the wood
product processing system: many processes and companies are involved until
end products are produced, which may create less incentive to achieve forest
management certification for those companies with forests producing
downstream products.
95
Further, it is interesting to note that all but one of the 11 companies
surveyed that have both forest management and CoC certification maintain
domestic forests. In contrast, half of those CoC certificate holders (5 out of 10
companies) owning forests but not holding forest management certification
maintain their own forests out of their countries. Reasons for this can
include the fact that forest management certification requires more work and
time to obtain than CoC certification and domestic forest owners tend to have
more advantages towards achieving certification than international owners,
such as greater accessibility, stronger community relationships, etc.
However, as credibility is a critical aspect of third party certification, it is
hoped that companies are not seeking CoC certification merely to improve
their images at home, while hiding their overseas forest practices from
domestic consumers’ scrutiny.
There were a few American companies that have dropped their CoC
certifications. The main reasons are that the companies realized no market
advantage and were unsuccessful in obtaining a reliable supply of certified
materials. It is noteworthy that these two factors are almost opposite: one
reflects a need for more demand and the other a need for more supply. This
may reflect a geographical imbalance in certification development (the
certification movement is active in some areas but substantially less active in
96
others), an imbalance among industry sectors (some sectors have more
certificate holders compared to others), or lack of well-established
distribution and communication systems among industry sectors operating in
minor markets. For example, according to Stevens (1998), the proportion of
CoC certified companies in the whole American forest industry was higher on
the West Coast compared to other regions of the USA. Therefore, it may be
important to make additional efforts to promote forest certification in certain
target regions in order to prevent potential future demand-supply imbalances
and to maintain a continuous increase in the number of certificate holders.
4.6.2 CFPs
The pattern of distribution across wood-industry sectors of the
surveyed CoC certificate holders demonstrates the same trends as seen in
Chapter II for both the USA and Japan. That is, CoC certification is
relatively evenly distributed across industry sectors in the USA and highly
concentrated the pulp and paper industry in Japan. This high concentration
within the pulp and paper industry in Japan may reflect more the practices
and perspectives within that sector than trends within the entire spectrum of
Japanese CoC certificate holders. For instance, out of 17 companies
indicating that their sources of certified wood are imported, 16 are in the pulp
and paper industry.
97
In this survey, about 60% of American and 70% of Japanese CoC
certificate holders said that they sell CFPs with the FSC logo. Although it is
not clear why some companies do not market CFPs while holding current
certification status, reasons can include: they are service-type businesses, e.g.,
millwork, transportation, distribution, etc.; they deal with CFPs but use off-
product logos due to being in a business-to-business market; insufficient
demand to produce CFPs; and not enough supply to manufacture CFPs.
For both countries, most CoC certificate holders – about 70% of
American and 85% of Japanese companies – have mainly domestic markets
for their CFPs. At the same time, about 75% of American companies have
domestic sources of certified woods. In other words, most CFPs produced by
current American CoC certificate holders reflect an internal process, from
forests to end-users. On the other hand, about half of Japanese companies –
the majority being in the pulp and paper industry, as mentioned above –
obtain their certified woods from overseas. Moreover, about 50% of those
companies importing their certified wood indicated that their sources are
from either forest plantations in the tropics or native tropical forests.
Therefore, in terms of Japanese markets, the forest certification system may
have a significant impact on improving forest management in the tropics in
the future, which was the principal purpose of forest certification when it
98
appeared in the 1990’s. As seen in Chapter II, Japanese markets for CFPs
are still comparatively small and new compared to the markets available to
companies from other countries. However, considering Japan’s high demand
for forest products in the international markets (FAO 1999; Cohen 2001;
Johnson 2001), promotion of CFPs in Japanese markets will have a
potentially significant impact on encouraging the sustainable management of
the world’s forests.
4.6.3 Decision Making Processes
The American companies indicated more diverse sources of knowledge
about forest certification as compared to their Japanese counterparts. The
main sources of information for American companies included FSC itself,
other forest industry companies, environmental NGOs, the media, and
buyers’ groups. However, sources indicated by Japanese CoC certificate
holders were relatively more focused, i.e., from other companies and/or the
media. Japanese companies received very limited information from
environmental NGOs and FSC. This phenomenon may be explained by the
fact that the NGO community in Japan is very weak (Schreurs 1996).
Moreover, the retailers’ movement for CFPs, such as by Home Depot, Lowes,
IKEA, and the like, has been increasing in the USA but has not yet done so in
Japan (Tissari 2001). This may also explain why more American companies
99
learned about forest certification from their clients and/or buyers’ groups
while almost no Japanese companies were influenced by such groups.
The large majority of Japanese companies indicated that they chose
FSC certification because it is an international certification scheme. This
may be explained by the fact that no national certification scheme has been
operative yet in Japan – the first national scheme, the Sustainable Green
Ecosystem Forest Certification System (SGEC), is now under development,
and FSC and PEFC are practically the only forest certification schemes
currently available for Japan because they are international. Compared to
Japanese companies, more than double the percentage of American
companies indicated that they chose FSC certification because their clients
requested FSC certified material. Many of them stated that their clients are
Home Depot and/or Lowes. This may be indicate that the influences of those
major retailers have a significant impact on the market of CFPs.
On average, companies in both countries thought factors such as
customers’ desire, marketing advantages, and the company’s environmental
policy had a greater impact on their decision to obtain CoC certification
compared to other factors such as assistance or pressure from environmental
NGOs and the government and avoiding increased regulation. This may
100
indicate that, at least in the USA and Japan, current CoC certificate holders
made their decision to achieve CoC certification based on internal or
voluntary reasons, e.g., as a means of obtaining market benefits from
certification or as a reflection of company policy. External factors, such as
NGO and governmental influences, were given relatively small consideration
in their decisions. However, as pointed out by Donovan (1996) and Sasser
(2003), NGO influences on forest certification are not negligible, especially in
the USA. This difference between the perceived and actual role of NGOs may
be explained by the fact that the impact of NGOs is more likely to be seen in
the intelligence and information functions – NGOs promote certification by
providing information not only to companies but also to consumers. While
companies may not fully recognize this influence, it may have an unconscious
or subtle influence on company policy. The role of NGOs is demonstrated by
the fact that 24% of American companies learned about forest certification
from environmental NGOs, which is the third highest percentage among
sources of information. Moreover, close to 40% of American companies
indicated that they first learned about forest certification from FSC, and
some of them even mentioned that FSC’s recruiting team was very effective.
However, it is likely that environmental NGOs such as the World Wide
Fund For Nature are in fact more active than FSC at informing companies
101
about forest certification because FSC does not have engage in many self-
promotional activities whereas WWF is actively engaged in promoting FSC
worldwide (WWF; Tissari 2001; Smouts 2002). It may be possible that
companies, which indicated that they learned about certification from FSC,
mistakenly believed that FSC itself, rather than WWF, was promoting FSC
certification. So again, most companies probably do not clearly recognize the
impact from environmental NGOs but NGOs’ function may be significant,
especially for promotion of forest certification.
4.6.4 Expectations and Perceived Benefits
The average level of expectation of earning price premiums from forest
certification ranked the lowest among factors leading companies to seek
certification. In both countries, expectations regarding price premiums were
significantly lower than most other factors such as new market accessibility,
company image improvement, and forest conservation. This suggests that
most of current CoC certificate holders are not highly expecting to yield price
premiums from forest certification, but rather that other benefits of
certification are more important to them. For American companies,
expanding access to new markets is the factor that, on average, is associated
with the highest expectations. Japanese companies’ levels of expectation
regarding new market access, company’s image, and forest conservation are
102
about equal.
In reality, a challenge exists to increase consumers’ willingness to pay
for CFPs. Moreover, target markets are focused to environmentally sensitive
markets. Therefore, in order to promote CFPs, it may be more effective to
raise consumer awareness of CFPs broadly, resulting in more units being sold
for the same prices as non-CFPs, rather than trying to enhance customers’
willingness to pay premiums for CFPs with the consequence that fewer units
will be sold for higher prices.
Although many previous studies on the CFP market have focused on
both final consumers and business customers’ willingness to pay, it may be
more important to assess how to increase the amount of certified product
units sold without price premiums in order to promote CoC certification.
However, challenges may lie in dealing with different perspectives among
forest management certificate holders, who tend to expect more price
premium (Hayward 1999; Newsom 2003), and CoC certificate holders. This
may be because achieving forest management certification tends to be more
demanding for participants compared to CoC certification – direct and
indirect costs for forest management certification tend to be more expensive,
and criteria and indicators for forest management certification are more
103
complicated and extensive compared to standards for CoC certification.
Moreover, forest owners have more constraints on increasing product
amounts due to limited land area in contrast with manufacturers and
distributors who may be able to augment the amount of products they deal in
with relatively fewer expenses. In short, forest owners expect more price
premiums for CFPs, and the distributors or manufacturers anticipate to
market more product units without price premium. It will be another
challenge for the CFP market how to trade off the difference in expectations
between the two types of certification holders.
While both American and Japanese CoC certificate holders perceived a
similar and relatively low impact from certification with regard to pricing
and market share expansion for their CFPs, the average level of perceived
benefits of two other factors – company image improvement and new market
potential – differed significantly between the two countries. Japanese
companies think that CoC certification has had a higher impact on these two
factors compared to American companies. This difference may be attributed
to the fact that, as seen in Chapter III, Japanese CoC companies are
significantly larger than American companies in terms of their estimated
sales and number of employees; further, larger companies may have more
opportunities to advertise their CoC status on a large scale and utilize that
104
status as a market strategy, as compared to smaller companies with more
limited budgets. However, it is also true that CoC certification has been
around in the USA much longer than in Japan. The average low level of
perceived benefits among American companies with respect to all four factors
may indicate that CoC certification has so far provided fewer benefits to CoC
certificate holders than originally expected.
105
References
Anderson Roy, and Hansen, Eric (2003). Do Forest Certification Ecolabels
Impact Consumer Behavior? Results from an Experiment, Wood
Science and Engineering, Oregon State University
Anderson Roy, and Hansen, Eric (2004). Forest Certification: Understanding
Ecolabel Usage Requirements, Oregon State University
Armstrong J. S. and Overton T. S. (1977). "Estimating Non-Response Bias in
Mail Surveys." Journal of Marketing Research 14: 396-402.
Atyi Richard E. and Simula, Markku (2002). Forest Certification: Pending
Challenges for Tropical Timber. Tropical Forest Update, ITTO
Newsletter. Yokohama, ITTO
Auld G., et al. (2003). Perspectives on Forest Certification: A Survey
Examining Differences among the Us Forest Sectors' Views of Their
Forest Certification Alternatives. Forest Policy for Private Forestry:
Global and Regional Challenges. Wallingford, CAB International:
271-282.
Brack Duncan and Chantal Marijnissen (2002). "Controlling Imports of
Illegal Timber." Royal Institute of International Affairs(RIIA) FERN.
Coddington Walter. (1993). Environmental Marketing : Positive Strategies for
Reaching the Green Consumer. New York, McGraw-Hill
106
Cohen David (2001). Chapter 4: Influences on Japanese Demand for Wood
Products. ECE/FAO Forest Products Annual Market Review, 2000-
2001, United Nations Economic Commission for Europe
CSA Forest Products Marking Program Website, CSA International. 2004.
http://www.csa-
international.org/product_areas/forest_products_marking/Default.asp
?language=english.
CSA (2001). Plus 1163: Chain of Custody for Forest Products Originating
from a Defined Forest Area Registered to CSA, Canadian Standard
Association
Dillman Don A. (2000). Mail and Internet Surveys: Second Edition, John
Wiley & Sons, Inc
Donovan Richard Z. (1996). Role of NGOs. Certification of Forest Products:
Issue and Perspectives. Washington, D.C., Island Press.
Dykstra Dennis P., et al. (2002). Technologies for Wood Tracking: Verifying
and Monitoring the Chain of Custody and Legal Compliance in the
Timber Industry. Washington, D.C., the World Bank and the World
Wildlife Fund --Alliance report
FAO (1999). Chapter 7 Comparison of the European Market for High-Value
Tropical Sawnwood, Veneer and Plywood with Those in North
America and Japan. “Markets for High-Value Tropical Hardwoods in
107
Europe”. Rome, FAO.
Forsyth Keith, Haleey David and Kozak, Robert (1999). "Will Consumers Pay
More for Certified Wood Products?" Journal of Forestry 97(2): 19-23.
FSC Forest Stewardship Council Website. 2003.
http://www.fscoax.org/principal.htm.
FSC (2004). FSC Chain of Custody Standard for Companies Supplying and
Manufacturing FSC-Certified Products,
http://www.fscoax.org/coc/index.htm
Gronroos Johanna C.M. and Bowyer, Jim L. (1999). "Assessment of the
Market Potential for Environmentally Certified Wood Products in
New Homes in Minneapolis/St. Paul and Chicago." Forest Products
Journal 49(6): 28-34.
Groves Michael, Frank Miller, and Richard Z. Donovan (1996). Chain of
Custody. Certification of Forest Products: Issue and Perspectives.
Washington, D.C., Island Press.
Hansen E. and Fletcher R. (2000). "Risk and Opportunity in Relationship to
Environmental Certification." New Zealand Journal of Forestry 45(2):
16-20.
Hansen Eric. (1997). "Forest Certification and Its Role in Marketing
Strategy." Forest Products Journal 47(3): 16-22.
Hayward Jeffrey and Ilan Vertinsky (1999). "High Expectations, Unexpected
108
Benefits: What Managers and Owners Think of Certification" Journal
of Forestry 97(2): 13-17
ITTO (2002). Forest Certification: Pending Challenges for Tropical Timber.
Tropical Forest Update, ITTO Newsletter. 12
IUCN (2003). Certification Schemes, The World Conservation Union. 2004.
http://biodiversityeconomics.org/business/topics-101-04.htm.
Jensen Kim, Jakus, Paul M., English, Burton and Menard Jamey (2003).
"Market Participation and Willingness to Pay for Environmentally
Certified Products." Forest Science 49(4): 632-641.
Johnson E. Steve (2001). Chapter 12: Tropical Timber Market Developments.
ECE/FAO Forest Products Annual Market Review, 2000-2001, United
Nations Economic Commission for Europe
Karna Jari, and Juslin, Heikki (1997). Attitudes Towards Timber
Certification: Framework for Forestry-Wood Chain Analysis.
Preparing for The 21st Century: Value Added Marketing for Value
Added Wood Products, IUFRO.
MTCC, The Malaysian Timber Certification Council Website, The Malaysian
Timber Certification Council. 2004.
http://www.mtcc.com.my/index.html.
MTCC (2000). Requirements and Assessment Procedures for Chain-of-
Custody Certification
109
Newsom Deanna, Benjamin Cashore, Graeme Auld, and James Granskog
(2003). Forest Certification in the Heart of Dixie: a Survey of Alabama
Landowners. Forest Policy for Private Forestry: Global and Regional
Challenges. Wallingford, CAB International: 291-300.
Ozanne Lucie K. and Smith, Paul M. (1996). "Consumer Segments for
Environmentally Marketed Wooden Household Furniture." Wood and
Fiber Science 28(4): 461-477.
Ozanne Lucie K. and Smith, Paul M. (1998). "Segmenting the Market for
Environmentallly Certified Wood Products." Forest Science 44(3): 379-
389.
Ozanne Lucie K. and Vlosky, Richard P. (2003). "Certification from the U.S.
Consumer Perspective: A Comparison from 1995 and 2000." Forest
Products Journal 53(3): 12-21.
PEFC Pan European Forest Certification Website. 2004.
http://www.pefc.org/internet/html/.
PEFC (2004). Chain of Custody of Forest Based Products - Requirements,
http://www.pefc.org/internet/resources/5_1177_950_file.909.doc
Polonsky Michael J., and Alma T. Mintu-Wimsatt, (1995). Environmental
Marketing : Strategies, Practice, Theory, and Research. New York,
Haworth Press
Polonsky Michael.J. (1994). An Introduction to Green Marketing.
110
ELECTRONIC GREEN JOURNAL 1(2).
Rametsteiner Ewald, and Kraxner, Florian (2003). Chapter 9: Markets for
Certified Forest Products, 2002-2003. UNECE/FAO Forest Products
Annual Market Analysis, 2002-2004, United Nations Economic
Commission for Europe
Rametsteiner Ewald, Peter Schwarzbauer, et al. (1999). Potential Markets for
Certified Forest Products in Europe. Joensuu, Finland, European
Forest Institute. Discussion Paper 2
Rickenbach M., Fletcher, R., and Hansen, E. (2000). An Introduction to Forest
Certification, Oregon State University
Sasser Erika N. (2003). Gaining Leverage: Ngo Influence on Certification
Institutions in the Forest Products Sector. Forest Policy for Private
Forestry: Global and Regional Challenges. Wallingford, CAB
International.
Schreurs Miranda A. (1996). International Environmental Negotiations, the
State, and Environmental NGOs in Japan. Occasional Paper # 14:
Harrison Program on the Future Global Agenda, University of
Maryland
Schwarzbaue Peter and Ewald Rametsteiner (2001). "The Impact of SFM-
Certification on Forest Product Markets in Western European
Analysis Using a Forest Sector Simulation Model." Forest Policy and
111
Economics 2(241-256).
SGEC Sustainable Green Ecosystem Forest Certification Website, Midori no
Junkan Ninshyou Kaigi. http://www.sgec-eco.org/.
Sinclair Steven A. (1992). Forest Products Marketing. New York, McGraw-
Hill Inc.
Smouts Marie-Claude (2002). Forest Certification and Timber Labeling: The
Hidden Agenda. ISA Convention.
Statistics Bureau of Japan (2004). Statistics for Enterprises by Industry
http://www.stat.go.jp/data/jigyou/
Stevens James, Ahmad, Mubariq, et al, (1998). "Forest Products Certification:
A Survey of Manufacturers Solid Wood Products." Forest Products
Journal 48(6): 43-49.
Tissari Jukka (2001). Certification: Helping Markets Support the World's
Forests. International Trade Forum.
UN (2002). Forest Products Markets: Prospects for 2003. New York, Timber
Bulletin Volume LV, No. 6
U.S. Census Bureau (2004). 1997 Economic Census: Comparative Statistics
for United States 1987 SIC Basis,
http://www.census.gov/epcd/ec97sic/E97SUS.HTM
Vidal Natalia, Kozak, Robert, and Cohen, David (2003). "Chain of Custody
Certification: An Assessment of the North America Solid Wood
112
Sector." Forest Policy and Economics Article in press.
Vlosky Richard P., and Ozanne Lucie K. (1997). "Forest Products
Certification: The Business Customer Perspective." Wood and Fiber
Science 29(2): 195-208.
Vlosky Richard P., and Ozanne Lucie K. (1998). "Environmental Certification
of Wood Products: The U.S. Manufacturers' Perspective." Forest
Products Journal 48(9): 21-26.
Vogt Kristiina A., Larson, Bruce C., Gordon, John C., and Vogt, Daniel J.
(2000). Forest Certification: Roots, Issues, Challenges, and Benefits,
CRC Press
WWF Forest for Life Program, the World Wide Fund For Nature. 2004.
http://www.panda.org/about_wwf/what_we_do/forests/index.cfm.
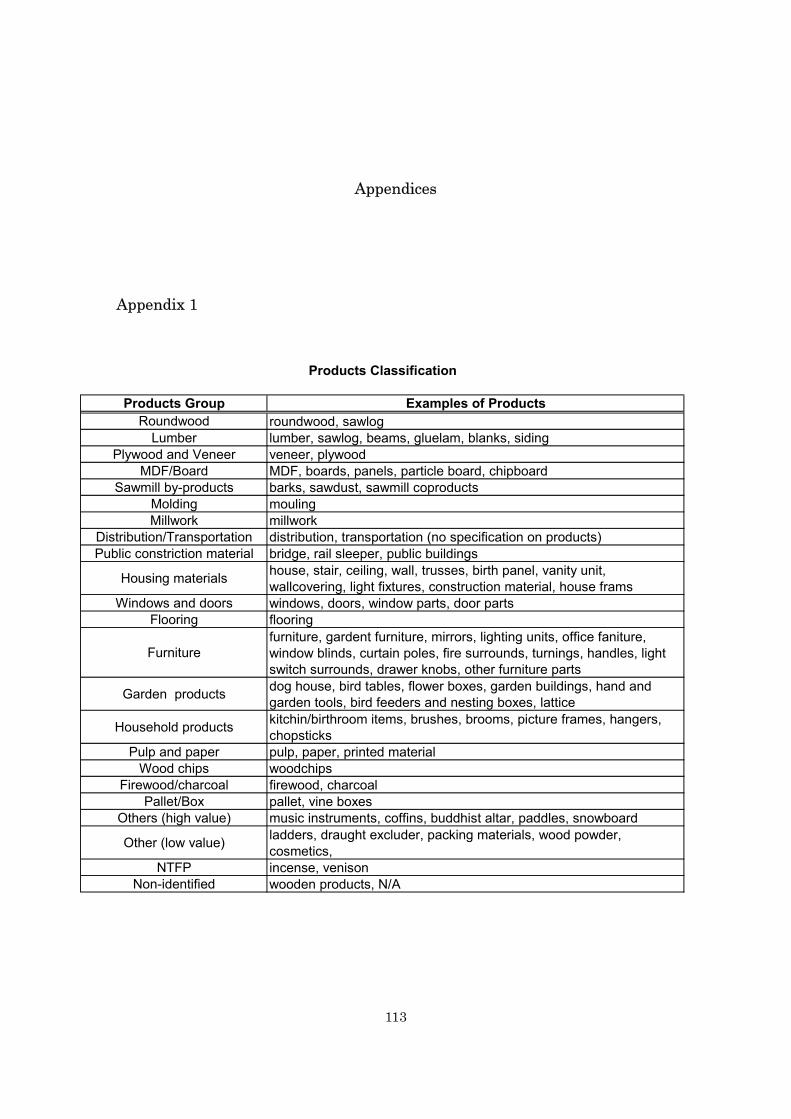
113
Appendices
Appendix 1
Products Group Examples of ProductsRoundwood roundwood, sawlog
Lumber lumber, sawlog, beams, gluelam, blanks, sidingPlywood and Veneer veneer, plywood
MDF/Board MDF, boards, panels, particle board, chipboardSawmill by-products barks, sawdust, sawmill coproducts
Molding moulingMillwork millwork
Distribution/Transportation distribution, transportation (no specification on products)Public constriction material bridge, rail sleeper, public buildings
Housing materials house, stair, ceiling, wall, trusses, birth panel, vanity unit,wallcovering, light fixtures, construction material, house frams
Windows and doors windows, doors, window parts, door partsFlooring flooring
Furniturefurniture, gardent furniture, mirrors, lighting units, office faniture,window blinds, curtain poles, fire surrounds, turnings, handles, lightswitch surrounds, drawer knobs, other furniture parts
Garden products dog house, bird tables, flower boxes, garden buildings, hand andgarden tools, bird feeders and nesting boxes, lattice
Household products kitchin/birthroom items, brushes, brooms, picture frames, hangers,chopsticks
Pulp and paper pulp, paper, printed materialWood chips woodchips
Firewood/charcoal firewood, charcoalPallet/Box pallet, vine boxes
Others (high value) music instruments, coffins, buddhist altar, paddles, snowboard
Other (low value) ladders, draught excluder, packing materials, wood powder,cosmetics,
NTFP incense, venisonNon-identified wooden products, N/A
Products Classification
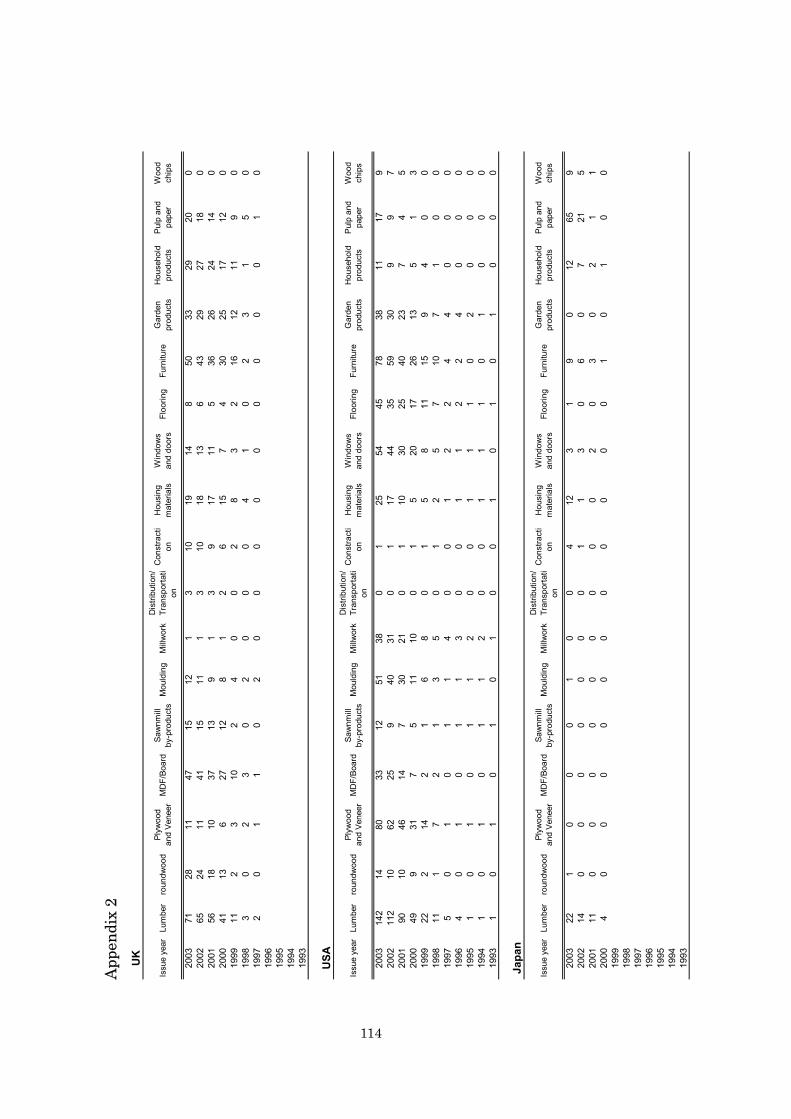
114
App
endi
x 2
UK
Issu
e ye
arLu
mbe
rro
undw
ood
Plyw
ood
and
Vene
erM
DF/
Boar
dSa
wnm
illby
-pro
duct
sM
ould
ing
Mill
wor
kD
istri
butio
n/Tr
ansp
orta
tion
Con
stra
cti
onH
ousi
ngm
ater
ials
Win
dow
san
d do
ors
Floo
ring
Furn
iture
Gar
den
prod
ucts
Hou
seho
ldpr
oduc
tsPu
lp a
ndpa
per
Woo
dch
ips
2003
7128
1147
1512
13
1019
148
5033
2920
020
0265
2411
4115
111
310
1813
643
2927
180
2001
5618
1037
139
13
917
115
3626
2414
020
0041
136
2712
81
26
157
430
2517
120
1999
112
310
24
00
28
32
1612
119
019
983
02
30
20
00
41
02
31
50
1997
20
11
02
00
00
00
00
01
019
9619
9519
9419
93
USA
Issu
e ye
arLu
mbe
rro
undw
ood
Plyw
ood
and
Vene
erM
DF/
Boar
dSa
wnm
illby
-pro
duct
sM
ould
ing
Mill
wor
kD
istri
butio
n/Tr
ansp
orta
tion
Con
stra
cti
onH
ousi
ngm
ater
ials
Win
dow
san
d do
ors
Floo
ring
Furn
iture
Gar
den
prod
ucts
Hou
seho
ldpr
oduc
tsPu
lp a
ndpa
per
Woo
dch
ips
2003
142
1480
3312
5138
01
2554
4578
3811
179
2002
112
1062
259
4031
01
1744
3559
309
97
2001
9010
4614
730
210
110
3025
4023
74
520
0049
931
75
1110
01
520
1726
135
13
1999
222
142
16
80
15
811
159
40
019
9811
17
21
35
01
25
710
71
00
1997
50
10
11
40
01
22
44
00
019
964
01
01
13
00
11
22
40
00
1995
10
10
11
20
01
11
02
00
019
941
01
01
12
00
11
10
10
00
1993
10
10
10
10
01
01
01
00
0
Japa
n
Issu
e ye
arLu
mbe
rro
undw
ood
Plyw
ood
and
Vene
erM
DF/
Boar
dSa
wnm
illby
-pro
duct
sM
ould
ing
Mill
wor
kD
istri
butio
n/Tr
ansp
orta
tion
Con
stra
cti
onH
ousi
ngm
ater
ials
Win
dow
san
d do
ors
Floo
ring
Furn
iture
Gar
den
prod
ucts
Hou
seho
ldpr
oduc
tsPu
lp a
ndpa
per
Woo
dch
ips
2003
221
00
01
00
412
31
90
1265
920
0214
00
00
00
01
13
06
07
215
2001
110
00
00
00
00
20
30
21
120
004
00
00
00
00
00
01
01
00
1999
1998
1997
1996
1995
1994
1993
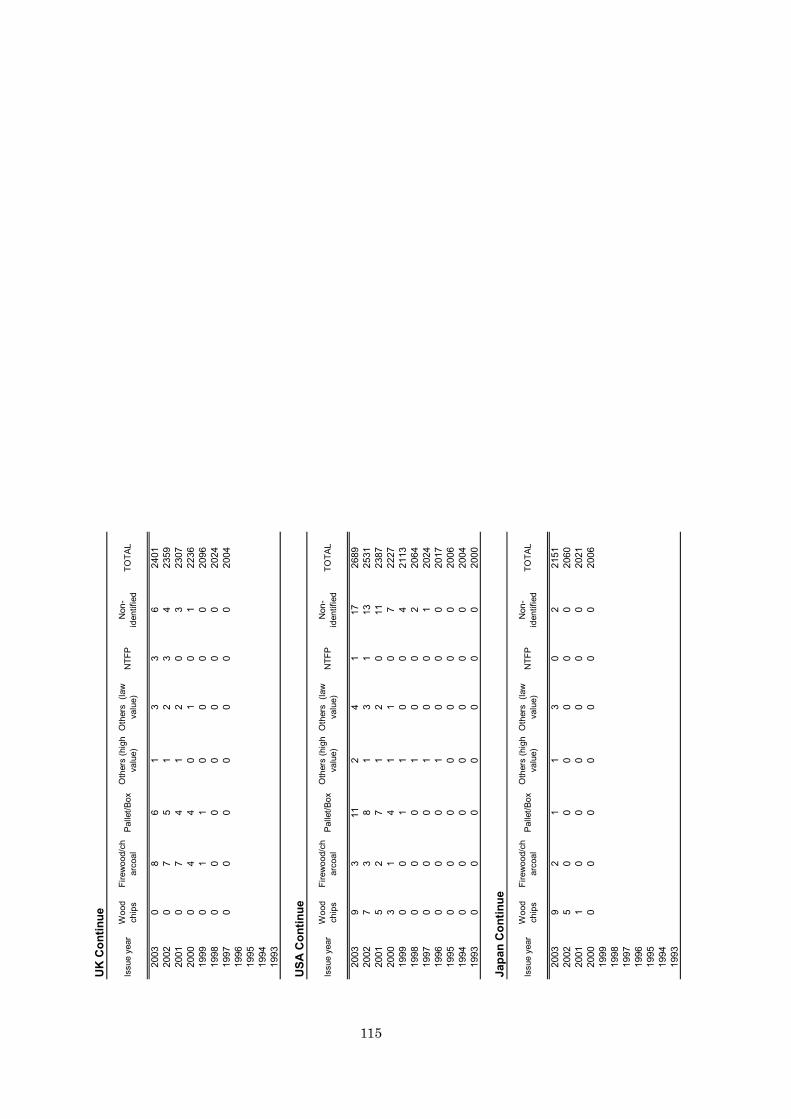
115
UK
Con
tinue
Issu
e ye
arW
ood
chip
sFi
rew
ood/
char
coal
Palle
t/Box
Oth
ers
(hig
hva
lue)
Oth
ers
(law
valu
e)N
TFP
Non
-id
entif
ied
TOTA
L
2003
08
61
33
624
0120
020
75
12
34
2359
2001
07
41
20
323
0720
000
44
01
01
2236
1999
01
10
00
020
9619
980
00
00
00
2024
1997
00
00
00
020
0419
9619
9519
9419
93
USA
Con
tinue
Issu
e ye
arW
ood
chip
sFi
rew
ood/
char
coal
Palle
t/Box
Oth
ers
(hig
hva
lue)
Oth
ers
(law
valu
e)N
TFP
Non
-id
entif
ied
TOTA
L
2003
93
112
41
1726
8920
027
38
13
113
2531
2001
52
71
20
1123
8720
003
14
11
07
2227
1999
00
11
00
421
1319
980
00
10
02
2064
1997
00
01
00
120
2419
960
00
10
00
2017
1995
00
00
00
020
0619
940
00
00
00
2004
1993
00
00
00
020
00
Japa
n C
ontin
ue
Issu
e ye
arW
ood
chip
sFi
rew
ood/
char
coal
Palle
t/Box
Oth
ers
(hig
hva
lue)
Oth
ers
(law
valu
e)N
TFP
Non
-id
entif
ied
TOTA
L
2003
92
11
30
221
5120
025
00
00
00
2060
2001
10
00
00
020
2120
000
00
00
00
2006
1999
1998
1997
1996
1995
1994
1993
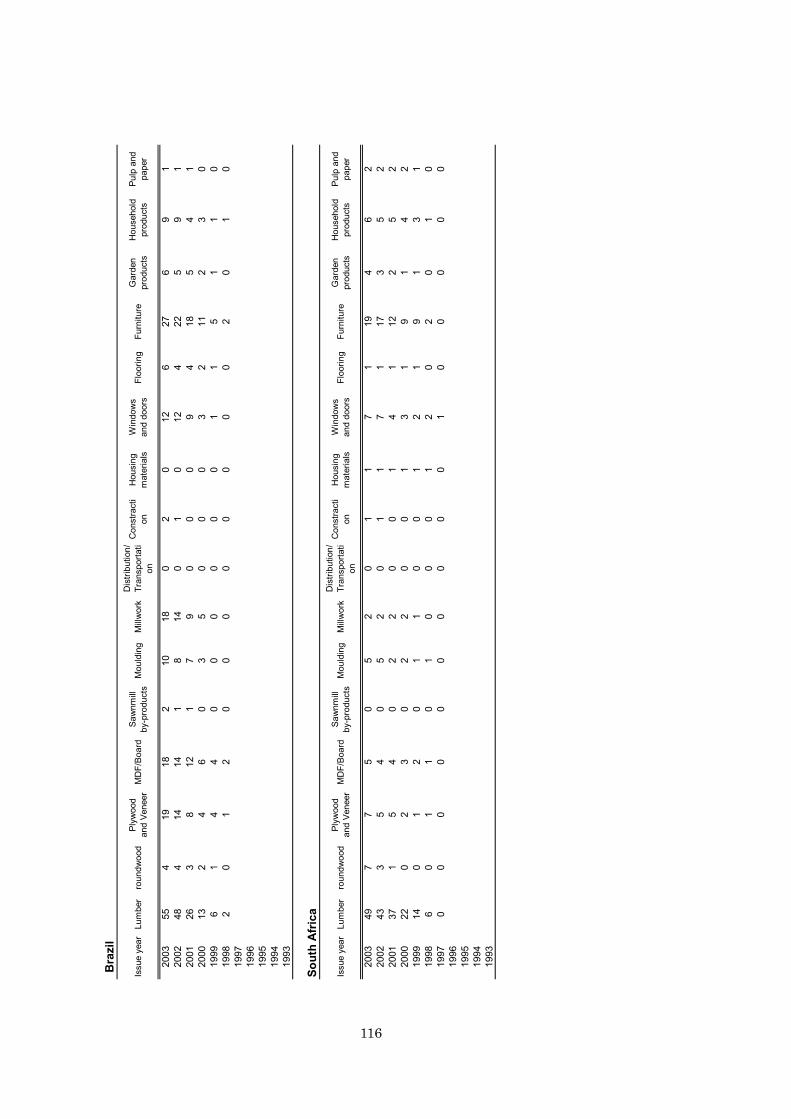
116
Bra
zil
Issu
e ye
arLu
mbe
rro
undw
ood
Plyw
ood
and
Vene
erM
DF/
Boar
dSa
wnm
illby
-pro
duct
sM
ould
ing
Mill
wor
kD
istri
butio
n/Tr
ansp
orta
tion
Con
stra
cti
onH
ousi
ngm
ater
ials
Win
dow
san
d do
ors
Floo
ring
Furn
iture
Gar
den
prod
ucts
Hou
seho
ldpr
oduc
tsPu
lp a
ndpa
per
2003
554
1918
210
180
20
126
276
91
2002
484
1414
18
140
10
124
225
91
2001
263
812
17
90
00
94
185
41
2000
132
46
03
50
00
32
112
30
1999
61
44
00
00
00
11
51
10
1998
20
12
00
00
00
00
20
10
1997
1996
1995
1994
1993
Sout
h A
fric
a
Issu
e ye
arLu
mbe
rro
undw
ood
Plyw
ood
and
Vene
erM
DF/
Boar
dSa
wnm
illby
-pro
duct
sM
ould
ing
Mill
wor
kD
istri
butio
n/Tr
ansp
orta
tion
Con
stra
cti
onH
ousi
ngm
ater
ials
Win
dow
san
d do
ors
Floo
ring
Furn
iture
Gar
den
prod
ucts
Hou
seho
ldpr
oduc
tsPu
lp a
ndpa
per
2003
497
75
05
20
11
71
194
62
2002
433
54
05
20
11
71
173
52
2001
371
54
02
20
01
41
122
52
2000
220
23
02
20
01
31
91
42
1999
140
12
01
10
01
21
91
31
1998
60
11
01
00
01
20
20
10
1997
00
00
00
00
00
10
00
00
1996
1995
1994
1993
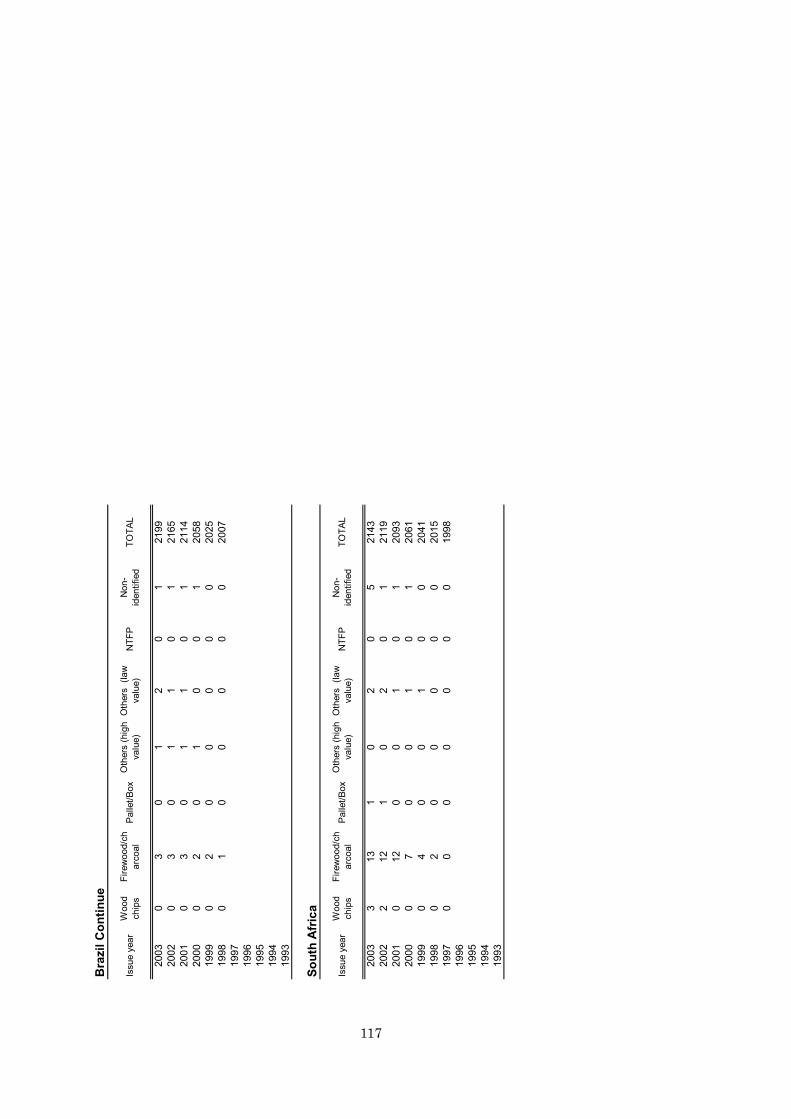
117
Bra
zil C
ontin
ue
Issu
e ye
arW
ood
chip
sFi
rew
ood/
char
coal
Palle
t/Box
Oth
ers
(hig
hva
lue)
Oth
ers
(law
valu
e)N
TFP
Non
-id
entif
ied
TOTA
L
2003
03
01
20
121
9920
020
30
11
01
2165
2001
03
01
10
121
1420
000
20
10
01
2058
1999
02
00
00
020
2519
980
10
00
00
2007
1997
1996
1995
1994
1993
Sout
h A
fric
a
Issu
e ye
arW
ood
chip
sFi
rew
ood/
char
coal
Palle
t/Box
Oth
ers
(hig
hva
lue)
Oth
ers
(law
valu
e)N
TFP
Non
-id
entif
ied
TOTA
L
2003
313
10
20
521
4320
022
121
02
01
2119
2001
012
00
10
120
9320
000
70
01
01
2061
1999
04
00
10
020
4119
980
20
00
00
2015
1997
00
00
00
019
9819
9619
9519
9419
93
118
Appendix 3
1) Cover Letter of 1st Email survey –English version
January 29, 2004 Dear Sir/Madam: My name is Sae Makino. I am a graduate student in the Department of Forestry at North Carolina State University. I obtained your email address from the FSC data base in order to conduct a questionnaire survey on forest certification, focusing on CoC certificate holders. The purposes of this survey are: to assess your motivations, and perspectives towards forest certification and to help promote forest certification among producers, distributors, manufacturers, etc. of forest products, like yourselves. The questionnaire consists of only 15 questions; most of the questions are in check box or drop-down list format. It will take only about 15 minutes or less to complete. I would greatly appreciate if you could take a little time to participate in my survey. Instructions:
1. Download the attached file to this email. 2. Open the file and answer the questions by clicking a box, choosing correct answer
from the drop-down list (the list will show up if you click the box), or typing your answer in the space provided.
3. SAVE the file. 4. Reply to this email or email me at [email protected] with the attached file
that you saved. I thank you in advance for your contribution to my survey. In addition, I would appreciate your comments and feedback on this survey. Sae Makino Email: [email protected] Tel: 919-271-8905/919-512-9431 Department of Forestry, College of Natural Resources, North Carolina State University, Raleigh, NC 27695-8002, USA
119
2) Cover Letter of 1st Email survey – Japanese version 拝啓 貴社ますますご清栄のこととお喜び申し上げます。 突然のメールで大変失礼いたしますが、私は、米国ノース・カロライナ州立大学森林学
部で修士課程を専攻している牧野佐絵子と申します。貴社のメールアドレスを FSC のデ
ータ・ベースから入手して、メールさせて頂きました。 私は、現在、FSC の生産物流認証(CoC 認証)を保持する会社・団体を対象に森林認証
制度に関するアンケート調査を実施しています。この調査の目的は、森林認証制度の取
得に当たり CoC ホルダーの動機や目的、期待などについて実態調査を行い、今後の森
林認証制度の基礎データを収集し、認証制度の推進に寄与することです。この調査は、
日本およびアメリカ合衆国の CoC ホルダーを対象に実施しています。 アンケートは 15 問の質問から構成されており、そのほとんどは選択式です アンケートの回答方法は、以下のとおりです。:
5. 添付ファイル(MS/Word)をダウンロードしてください 6. ファイルを開き、次のように、アンケートに回答してください
チェック・ボックス:当てはまる項目のボックスをクリック ドロップ・ダウン式:右クリックすると表示されるリストの中から当てはま
るものを選択 テキスト:スペースに記述
7. 終了後、ファイルを保存してください 8. 保存されたファイルを添付の上、このメールに返信するか
[email protected] まで、送信してください なお、御意見、御感想、御質問などがございましたら、私の E-mail 等へご連絡いただけ
れば幸いです。 お忙しい中、大変恐縮ですが、ご協力方よろしくお願い致します。
敬具 1月29日、2004 Sae Makino(牧野佐絵子) Email: [email protected] Tel: 919-271-8905/919-512-9431 Department of Forestry, College of Natural Resources, North Carolina State University, Raleigh, NC 27695-8002, USA
120
3) Cover Letter of 2nd on-line survey – English version
February 00, 2004 Dear Sir/Madam: I am a graduate student in the Department of Forestry, North Carolina State University. Recently, I asked you to participate in a survey on FSC CoC holders. I have not yet heard back from you, so I am hoping that you could please take a few minutes from your busy schedule to take part in the ON-LINE survey on the same issue. The survey questionnaire consists of only 15 questions, most of which are in check box or drop-down list format. It should take you no more than 15 minutes to complete. The link to the questionnaire is: http://www4.ncsu.edu/~smakino/ The purposes of this survey are: to assess your motivations and perspectives towards forest certification and to help promote forest certification among producers, distributors, manufacturers, etc. of forest products, like yourselves. This survey is entirely academic in nature and will not be used for commercial purposes. I would greatly appreciate your participating in this project and thank you in advance for doing so. If you received this email by mistake or if you sent me back your answer already, please ignore it. Sae Makino Email: [email protected] Tel: 919-271-8905/919-512-9431 Department of Forestry, College of Natural Resources, North Carolina State University, Raleigh, NC 27695-8002, USA
121
4) Cover Letter of 2nd on-line survey – Japanese version
拝啓
貴社ますますご清栄のこととお喜び申し上げます。
先般、FSC森林認証制度のCoC(生産物流認証)認証に関する調査へのご協力を依頼させ
て頂きましたが、貴社からご返答いただけなかったためオン・ライン上でのアンケート
に変えて再度ご協力をお願いさせて頂きたいと思います。
年度末につき特にご多忙とは存じますが、森林認証制度の推進のためにも是非ご協力を
お願いいたします。ご協力いただけるのでありましたら、上記のホーム・ページをクリ
ックして頂き、その後、日本語を選択してください。アンケートに回答後、送信ボタン
をクリックして頂ければアンケートは終了です。アンケートにかかる所要時間は10~15
分ほどです。
この調査の目的は、森林認証制度の取得に当たりCoCホルダーの動機や目的、期待など
に関する実態調査を実施し基礎データを収集して、今後の森林認証制度の推進に国際的
に寄与することです。また、アンケートの集計結果は学術・研究利用以外の目的には一
切使用致しません。貴社名の御記入においても任意です。
お忙しい中、大変恐縮ですが何卒ご協力の程をよろしくお願い申し上げます。
敬具
2004年2月21日
Sae Makino(牧野佐絵子)
Email: [email protected]
Tel: 919-271-8905/919-512-9431
Department of Forestry,
College of Natural Resources,
North Carolina State University,
Raleigh, NC 27695-8002, USA
122
5) Index page of on-line survey
Thank you for participating in the Survey on FSC Forest Certification
FSC 森林認証制度に関するアンケートにご協力いただきありがとうございます
Please click here for English / 日本語はここをクリックしてください
If you have any questions and suggestions, please contact me at:
御質問・御意見などは、下記までお願いします。
Department of Forestry, College of Natural Resources,
North Carolina State University, Raleigh, NC 27695-8002, USA Sae Makino(牧野 佐絵)
Email: [email protected]
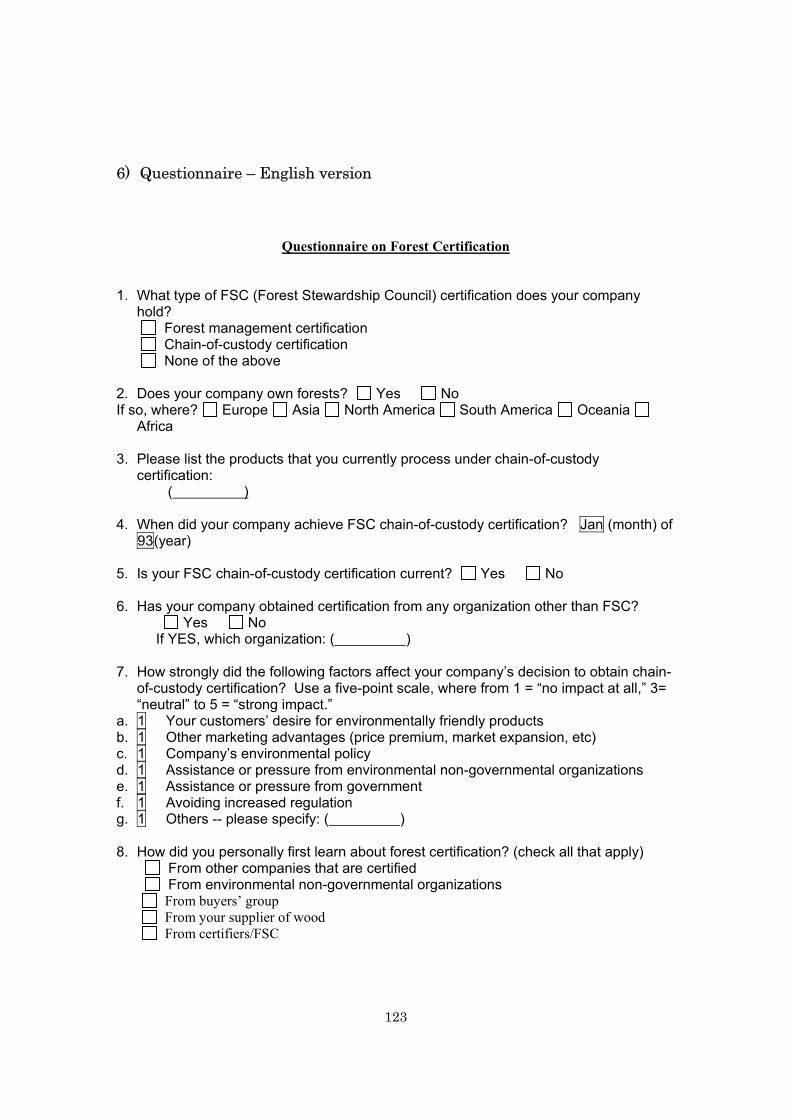
123
6) Questionnaire – English version
Questionnaire on Forest Certification
1. What type of FSC (Forest Stewardship Council) certification does your company hold?
Forest management certification Chain-of-custody certification None of the above 2. Does your company own forests? Yes No If so, where? Europe Asia North America South America Oceania
Africa 3. Please list the products that you currently process under chain-of-custody
certification: ( ) 4. When did your company achieve FSC chain-of-custody certification? Jan (month) of
93(year) 5. Is your FSC chain-of-custody certification current? Yes No 6. Has your company obtained certification from any organization other than FSC?
Yes No If YES, which organization: ( ) 7. How strongly did the following factors affect your company’s decision to obtain chain-
of-custody certification? Use a five-point scale, where from 1 = “no impact at all,” 3= “neutral” to 5 = “strong impact.”
a. 1 Your customers’ desire for environmentally friendly products b. 1 Other marketing advantages (price premium, market expansion, etc) c. 1 Company’s environmental policy d. 1 Assistance or pressure from environmental non-governmental organizations e. 1 Assistance or pressure from government f. 1 Avoiding increased regulation g. 1 Others -- please specify: ( ) 8. How did you personally first learn about forest certification? (check all that apply) From other companies that are certified From environmental non-governmental organizations From buyers’ group From your supplier of wood From certifiers/FSC
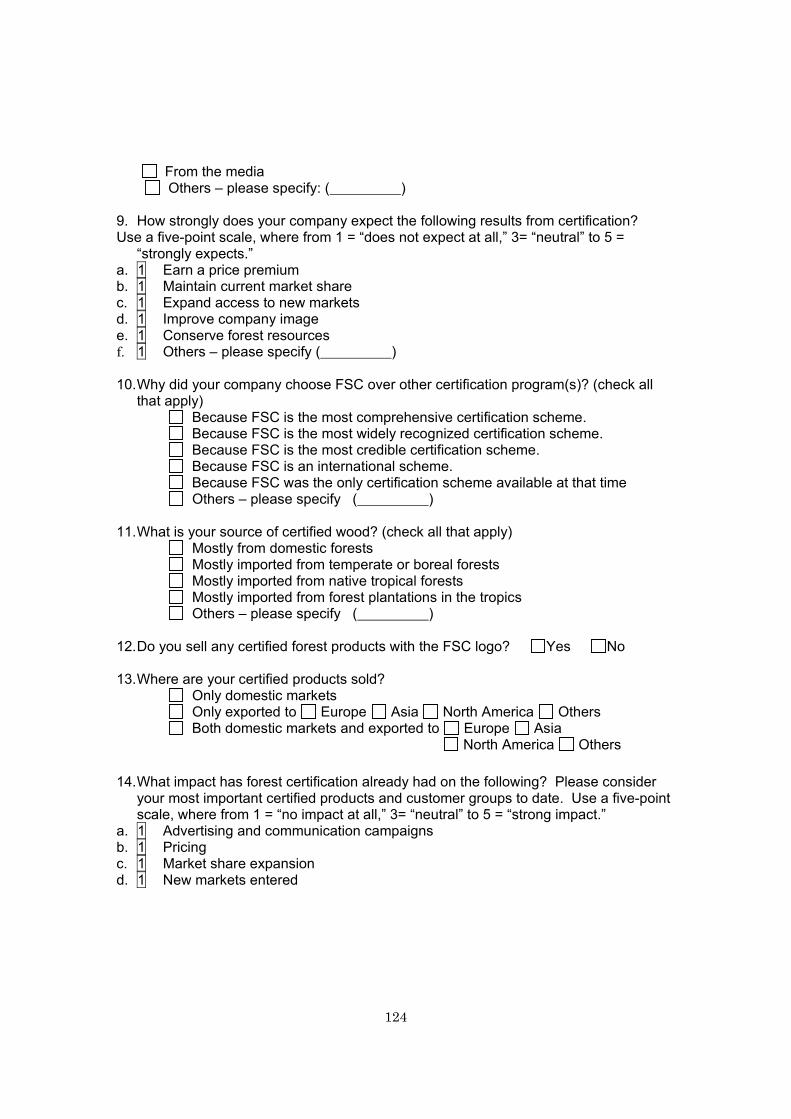
124
From the media Others – please specify: ( ) 9. How strongly does your company expect the following results from certification? Use a five-point scale, where from 1 = “does not expect at all,” 3= “neutral” to 5 =
“strongly expects.” a. 1 Earn a price premium b. 1 Maintain current market share c. 1 Expand access to new markets d. 1 Improve company image e. 1 Conserve forest resources f. 1 Others – please specify ( ) 10. Why did your company choose FSC over other certification program(s)? (check all
that apply) Because FSC is the most comprehensive certification scheme. Because FSC is the most widely recognized certification scheme. Because FSC is the most credible certification scheme. Because FSC is an international scheme. Because FSC was the only certification scheme available at that time Others – please specify ( ) 11. What is your source of certified wood? (check all that apply) Mostly from domestic forests Mostly imported from temperate or boreal forests Mostly imported from native tropical forests Mostly imported from forest plantations in the tropics Others – please specify ( ) 12. Do you sell any certified forest products with the FSC logo? Yes No 13. Where are your certified products sold? Only domestic markets Only exported to Europe Asia North America Others Both domestic markets and exported to Europe Asia North America Others 14. What impact has forest certification already had on the following? Please consider
your most important certified products and customer groups to date. Use a five-point scale, where from 1 = “no impact at all,” 3= “neutral” to 5 = “strong impact.”
a. 1 Advertising and communication campaigns b. 1 Pricing c. 1 Market share expansion d. 1 New markets entered
125
15. Please indicate which of the following would cause your company to drop FSC chain of custody certification. Your company definitely would NOT maintain FSC certification in the future IF: (check all that apply)
No price premium is realized Demand for certified products does not increase There is another forest certification program that is more advantageous to your
company Costs of certification do not decrease Other -- please specify: ( )
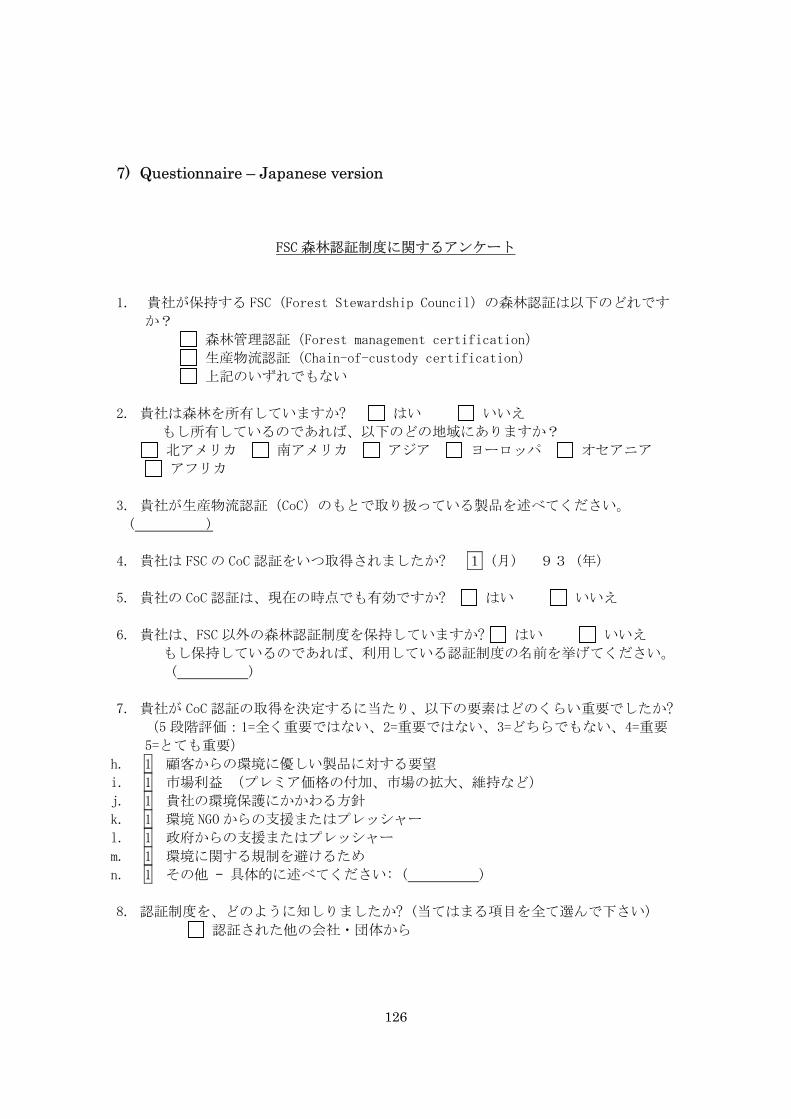
126
7) Questionnaire – Japanese version
FSC 森林認証制度に関するアンケート
1. 貴社が保持する FSC (Forest Stewardship Council) の森林認証は以下のどれです
か?
森林管理認証(Forest management certification)
生産物流認証(Chain-of-custody certification)
上記のいずれでもない
2. 貴社は森林を所有していますか? はい いいえ
もし所有しているのであれば、以下のどの地域にありますか?
北アメリカ 南アメリカ アジア ヨーロッパ オセアニア
アフリカ
3. 貴社が生産物流認証(CoC)のもとで取り扱っている製品を述べてください。
( )
4. 貴社は FSC の CoC 認証をいつ取得されましたか? 1 (月) 93 (年)
5. 貴社の CoC 認証は、現在の時点でも有効ですか? はい いいえ
6. 貴社は、FSC 以外の森林認証制度を保持していますか? はい いいえ
もし保持しているのであれば、利用している認証制度の名前を挙げてください。
( )
7. 貴社が CoC 認証の取得を決定するに当たり、以下の要素はどのくらい重要でしたか?
(5 段階評価:1=全く重要ではない、2=重要ではない、3=どちらでもない、4=重要
5=とても重要)
h. 1 顧客からの環境に優しい製品に対する要望
i. 1 市場利益 (プレミア価格の付加、市場の拡大、維持など)
j. 1 貴社の環境保護にかかわる方針
k. 1 環境 NGO からの支援またはプレッシャー
l. 1 政府からの支援またはプレッシャー
m. 1 環境に関する規制を避けるため
n. 1 その他 – 具体的に述べてください: ( )
8. 認証制度を、どのように知しりましたか? (当てはまる項目を全て選んで下さい)
認証された他の会社・団体から
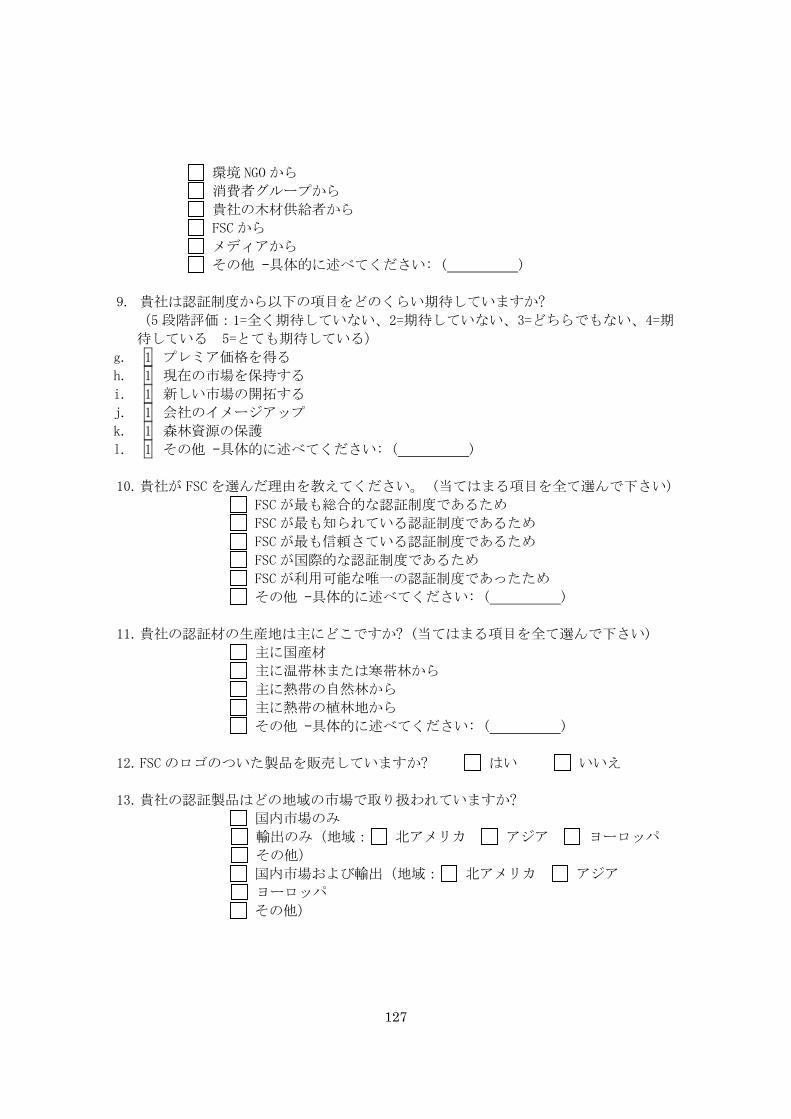
127
環境 NGO から
消費者グループから
貴社の木材供給者から
FSC から
メディアから
その他 –具体的に述べてください: ( )
9. 貴社は認証制度から以下の項目をどのくらい期待していますか?
(5 段階評価:1=全く期待していない、2=期待していない、3=どちらでもない、4=期
待している 5=とても期待している)
g. 1 プレミア価格を得る
h. 1 現在の市場を保持する
i. 1 新しい市場の開拓する
j. 1 会社のイメージアップ
k. 1 森林資源の保護
l. 1 その他 –具体的に述べてください: ( )
10. 貴社が FSC を選んだ理由を教えてください。 (当てはまる項目を全て選んで下さい)
FSC が最も総合的な認証制度であるため
FSC が最も知られている認証制度であるため
FSC が最も信頼さている認証制度であるため
FSC が国際的な認証制度であるため
FSC が利用可能な唯一の認証制度であったため
その他 –具体的に述べてください: ( )
11. 貴社の認証材の生産地は主にどこですか? (当てはまる項目を全て選んで下さい)
主に国産材
主に温帯林または寒帯林から
主に熱帯の自然林から
主に熱帯の植林地から
その他 –具体的に述べてください: ( )
12. FSC のロゴのついた製品を販売していますか? はい いいえ
13. 貴社の認証製品はどの地域の市場で取り扱われていますか?
国内市場のみ 輸出のみ(地域: 北アメリカ アジア ヨーロッパ
その他)
国内市場および輸出(地域: 北アメリカ アジア
ヨーロッパ
その他)
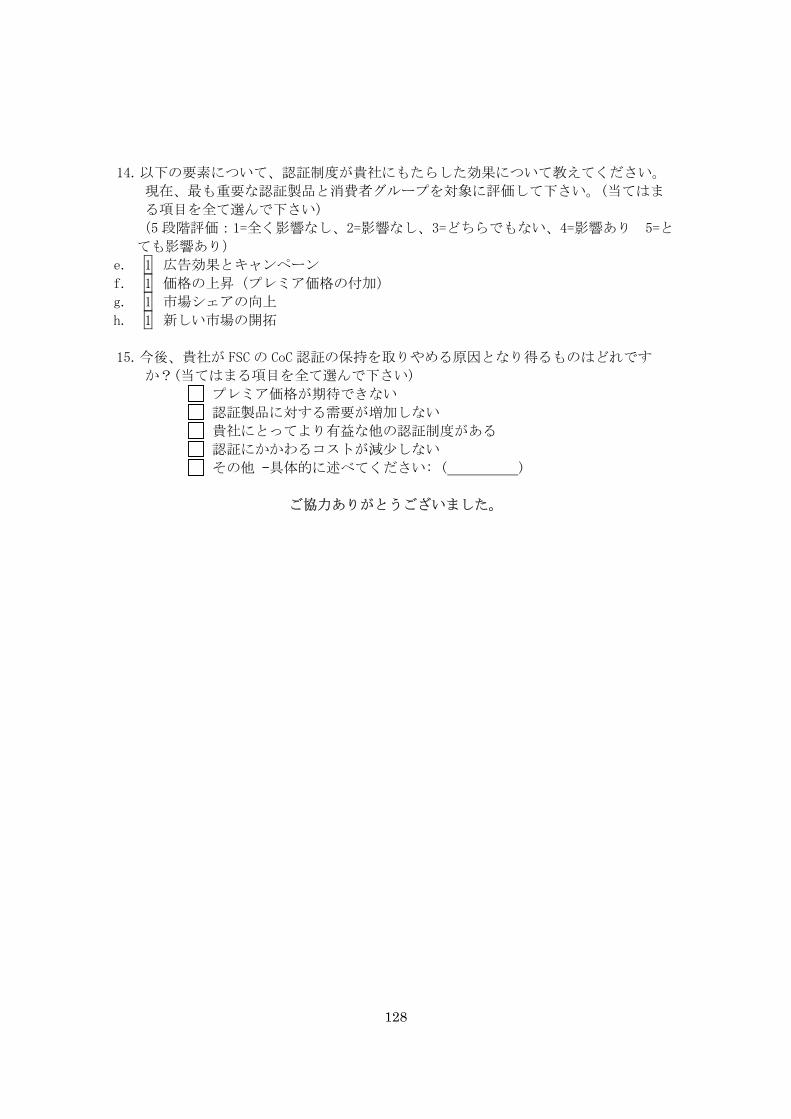
128
14. 以下の要素について、認証制度が貴社にもたらした効果について教えてください。
現在、最も重要な認証製品と消費者グループを対象に評価して下さい。(当てはま
る項目を全て選んで下さい)
(5 段階評価:1=全く影響なし、2=影響なし、3=どちらでもない、4=影響あり 5=と
ても影響あり)
e. 1 広告効果とキャンペーン
f. 1 価格の上昇(プレミア価格の付加)
g. 1 市場シェアの向上
h. 1 新しい市場の開拓
15. 今後、貴社が FSC の CoC 認証の保持を取りやめる原因となり得るものはどれです
か?(当てはまる項目を全て選んで下さい)
プレミア価格が期待できない
認証製品に対する需要が増加しない
貴社にとってより有益な他の認証制度がある
認証にかかわるコストが減少しない
その他 –具体的に述べてください: ( )
ご協力ありがとうございました。
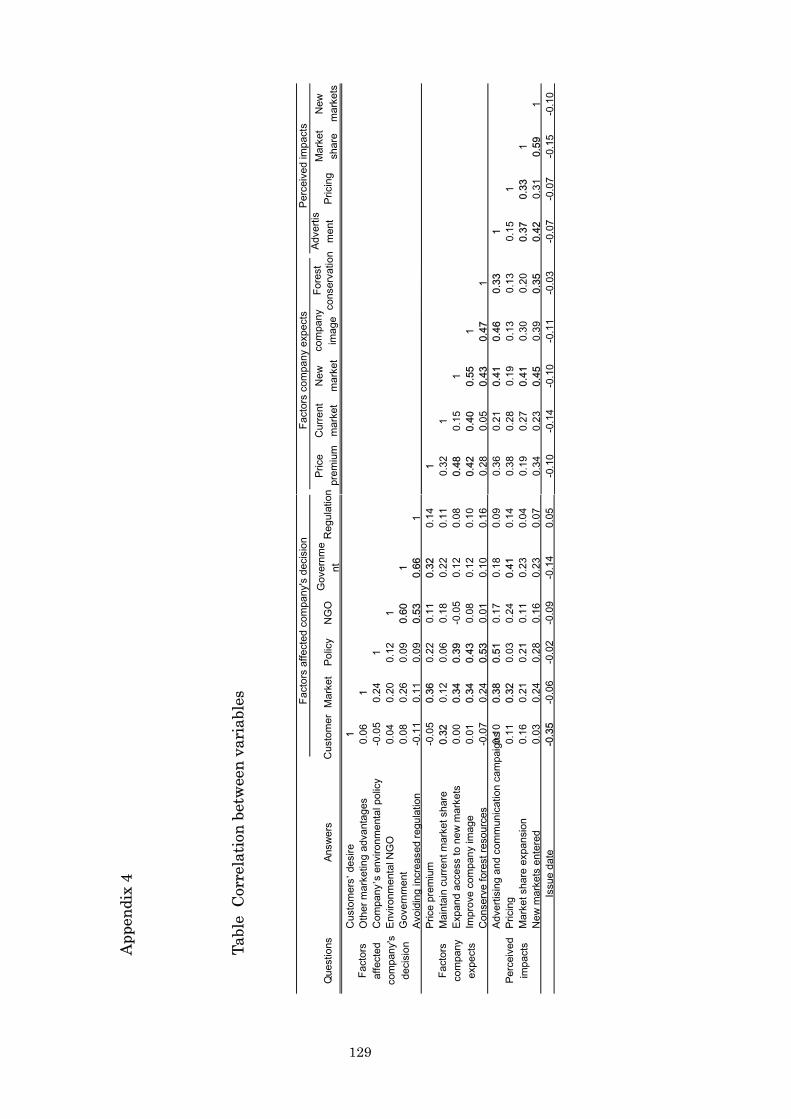
129
App
endi
x 4
Tabl
e C
orre
latio
n be
twee
n va
riab
les
Q ue
stio
nsA
nsw
ers
Cus
tom
erM
arke
tPo
licy
NG
OG
over
nme
ntR
egul
atio
n C
usto
mer
s’ d
esire
1
Oth
er m
arke
ting
adva
ntag
es
0.06
1C
ompa
ny’s
env
ironm
enta
l pol
icy
-0.0
50.
241
Envi
ronm
enta
l NG
O
0.04
0.20
0.12
1G
over
nmen
t 0.
080.
260.
090.
601
Avoi
ding
incr
ease
d re
gula
tion
-0.1
10.
110.
090.
530.
661
Pric
e pr
emiu
m
-0.0
50.
360.
220.
110.
320.
14M
aint
ain
curre
nt m
arke
t sha
re
0.32
0.12
0.06
0.18
0.22
0.11
Expa
nd a
cces
s to
new
mar
kets
0.00
0.34
0.39
-0.0
50.
120.
08Im
prov
e co
mpa
ny im
age
0.
010.
340.
430.
080.
120.
10C
onse
rve
fore
st re
sour
ces
-0.0
70.
240.
530.
010.
100.
16Ad
verti
sing
and
com
mun
icat
ion
cam
paig
ns0.10
0.38
0.51
0.17
0.18
0.09
Pric
ing
0.11
0.32
0.03
0.24
0.41
0.14
Mar
ket s
hare
exp
ansi
on
0.16
0.21
0.21
0.11
0.23
0.04
New
mar
kets
ent
ered
0.
030.
240.
280.
160.
230.
07-0
.35
-0.0
6-0
.02
-0.0
9-0
.14
0.05
Fact
ors
affe
cted
com
pany
's de
cisi
on
Fact
ors
affe
cted
com
pany
'sde
cisi
on
Fact
ors
com
pany
expe
cts
Perc
eive
dim
pact
s
Issu
e da
te
Pric
epr
emiu
mC
urre
ntm
arke
tN
ewm
arke
tco
mpa
nyim
age
Adve
rtis
men
tPr
icin
gM
arke
t sh
are
New
m
arke
ts
1 0.32
10.
480.
151
0.42
0.40
0.55
10.
280.
050.
430.
471
0.36
0.21
0.41
0.46
0.33
10.
380.
280.
190.
130.
130.
151
0.19
0.27
0.41
0.30
0.20
0.37
0.33
10.
340.
230.
450.
390.
350.
420.
310.
59
1 -0
.10
-0.1
4-0
.10
-0.1
1-0
.03
-0.0
7-0
.07
-0.1
5 -0
.10
Fact
ors
com
pany
exp
ects
Perc
eive
d im
pact
s Fo
rest
cons
erva
tion