field and desktop waste rock classification guide for … · field and desktop waste rock...
TRANSCRIPT

Proceedings of the Eighth Australian Workshop on Acid and Metalliferous Drainage (Eds H Miller and L Preuss) pp.159-172
FIELD AND DESKTOP WASTE ROCK CLASSIFICATION GUIDE FOR A METALLIFEROUS MINE IN THE NORTHERN TERRITORY,
AUSTRALIA
M. LandersA, B. UsherA, D. FaulknerA, P. MarianelliB, and K. MastermanB
AKlohn Crippen Berger, Level 5 – 43 Peel Street, South Brisbane Qld, Australia 4101BGlencore Xstrata Zinc, McArthur River Mining Pty Ltd, PO Box 36821, Winnellie, NT
ABSTRACT
A field and laboratory geochemical investigation was conducted to assess the potential for heavy metal leachate release, saline drainage and acid rock drainage (ARD) from the overburden materials generated from a metalliferous mine in the Northern Territory. Theresults from the geochemical investigations were used to derive a field and desktop wasterock classification guide. The guide is needed for mine geologists to classify the materials asbeing potentially acid forming (PAF), non-acid forming (NAF) and saline/ metalliferous NAF while in the field, such that materials of environmental concern can be stored in the appropriate storage facilities. Previously there were discrepancies in waste types classified via the geological block model, laboratory results and in-field observations, which had implications for the accuracy of mine planning, waste handling and waste management. The field classification criteria is based on insitu sampling of materials obtained from blasting charge drill pattern and analysis via handheld X-ray fluorescence (XRF) spectrometer. The verification of the handheld XRF results and the desktop waste classification guide is basedon extensive static and kinetic testing on the materials.
1.0 INTRODUCTION
The McArthur River Mine (MRM) is located in the Northern Territory, approximately half way
between Darwin and Mount Isa (Fig. 1). A geochemical investigation is underway to assess
the potential for metal leachate release and Acid Rock Drainage (ARD) from the overburden material generated from the open pit.
Previously several aspects were identified on site that required further investigation in relation to the classification of mine waste. These include: i) there are discrepancies in the volume of non - acid forming (NAF) material and potentially acid forming (PAF) materialquantified though either the ‘block model’, quantified by static geochemical testing or identified in the pit by the mine’s pit technician classification processes; ii) the existing classification of PAF and NAF is quite broad and did not take into consideration saline NAF, neutral mine drainage (NMD; metalliferous NAF) and acid consuming (AC) materials types.There is also a small proportion of material that spontaneously combusts while in the pit or after placed on the waste rock dump. These combustible materials are referred to as highly reactive PAF materials (or, “smokers”) and involve rapid oxidation of sulphides (mostly pyrite) and the combustion of carbon-rich material in the waste. The classification criteria for smokers is currently being developed and is therefore not discussed in this paper. Amethodology is needed that can be applied by mine geologists to classify waste types in situso that PAF, NMD, SD and particularly reactive PAF materials are restricted to the appropriate storage facilities.
159

Field and Desktop Waste Rock Classification Guide
LANDERS ET AL.
Fig. 1. McArthur River Mine site location.
1.1 Historical Waste Classification: Static testing results
The historical net acid generation (NAG) pH results and Fe assay results are currently used on site to differentiate PAF from NAF. The mineralogical analysis indicated that iron in the samples is mostly in the form of pyrite (FeS2), with the exception of some sphalerite ((Zn, Fe)S2
Fig. 2
)) which has iron-inclusions. Framboidal pyrite in the PAF was also commonly observed in the field. The relationship between Fe and S concentration, due to the presence of pyrite, is highlighted in . The positive linear relationship for the laboratory data (geochemical database) shows how the two elements are discretely related.
Fig. 2. Iron (%) versus Sulphur (%)
The NAG pH versus Fe concentration graph (Fig. 3) provides an indication of the Fe % cutoff for materials that are likely to be PAF based on the NAG pH. The current site Fe % cutoff is > 7.5 % Fe for PAF (or > 7.5 % S), based on the assumption that NAG pH < 4 is PAF.
There are several issues with the historical classification criteria, principally that the 7.5% Fe cutoff misclassifies a number of samples and the classification excludes the samples that are likely to create NMD and Saline drainage (SD).
160

Field and Desktop Waste Rock Classification Guide
LANDERS ET AL.
Fig. 3. NAG pH versus Fe % indicating the site Fe % cutoff for PAF (i.e. > 7.5% Fe)
2.0 METHODS
The geochemical characterisation program is based on a combination of field investigations, static laboratory testing and consideration of previous kinetic testing. The field program entailed field investigations including: pH measurements; hydrogen peroxide oxidised pH measurements (pH fox); and, handheld X-ray fluorescence (XRF) testing (using a Niton XL3t GOLDD+ instrument).
Samples were obtained from the drilling residue which was placed next to the holes drilled as part of the blasting patterns (i.e. “drill mounds”). The drill mounds include the powdered material obtained from the drill hole, which, in the case of this field work, was ~ 4 - 7 meters deep into the base or pit wall. At least 8 drill mounds were sampled and analysed randomly across five different drill patterns. For each drill mound at least four handheld XRF spectra were acquired; the four spectra were taken from different areas of the drill mound along with the collection of four ~ 125g subsamples taken from the zones immediately underneath thezone where the four handheld XRF measurements were made. The subsamples were combined and sent to the MRM laboratory for total elemental analysis (via desktop XRF). Repeat scans were collected for sample statistics and to determine the variability in metal concentration within each drill mound.
The previous laboratory analysis has been conducted on ~1800 samples which were hand-picked from core to characterise the lithological units associated with the mining overburden materials. This analysis included, inter alia, a combination of acid base accounting (ABA), net acid generation (NAG) pH testing, total metal analysis, X-ray diffraction (XRD) and shake flask extractions (SFE).
3.0 RESULTS AND DISCUSSION
3.1 Field Results
The results from the laboratory XRF spectroscopy analysis are summarised in Fig. 4.
Generally, there is a positive linear relationship when the measured metal concentrations from the field (handheld XRF) are graphed with the laboratory measured concentrations
161

Field and Desktop Waste Rock Classification Guide
LANDERS ET AL.
(XRF) (Fig. 4). There is some variability in the results between elements, drill mounds and
drill patterns; however, generally the field and laboratory results are in agreement.
Fig. 4. Handheld XRF results versus laboratory XRF results for drill mound
samples (i.e. for different samples and different elements: Cu, Fe, S As, Pb and Zn).
The weakest and strongest relationships found between handheld and laboratory XRF measurements of Zn concentration are displayed in Fig. 5. There is a high degree of scatter and corresponding poor r2 value for the Zn concentration data for drill pattern 1, while a strong relationship was evident for drill pattern 2 results. The variability in the results for drill pattern 1 may occur due to down hole variability since the samples are obtained from the 4 – 7m interval which may cross lithological boundaries for DP1. Batching of the four samples may create some uncertainty when comparing the laboratory data for the composite sample with the discrete field measured data. Ideally all four samples should be analysed separately by the laboratory to minimise this effect of sample compositing. The second potential source of variation relates to differences in the volume of material that is measured by the field and laboratory instruments. The beam size of the handheld XRF is only small (<1 cm) which results in a very small sample size when compared to the laboratory XRF which uses ~100 g of a well-mixed and representative sample. Thirdly, particular lithological units may be more heterogeneous due to mineralogical differences and particle size variations which can create discrete ‘pockets’ of enrichment (e.g. galena and sphalerite). Finally, the sensitivity and accuracy of the two instruments; the desktop XRF is more accurate than the handheld XRF and certain elements are more susceptible to this accuracy.
Despite these limitations, the results indicate that the handheld XRF is an appropriate tool for rapidly determining metal concentration while in the field based on the strong relationship formetal concentrations in most of the drill mounds. These results may be used for initial resource definition, or, determining whether material is elevated in a particular metal ofenvironmental concern (i.e. low versus medium versus high concentration). The rapid
162

Field and Desktop Waste Rock Classification Guide
LANDERS ET AL.
determination facilitates better assessment and direction of where and how waste material should be stored and handled. Materials that are considered waste and significantly enriched in Zn (amongst other metals) may result in metalliferous drainage at this site, and need to be managed to limit the impact on the receiving environment.
Fig. 5. Lab measured zinc concentration versus field measured zinc concentration for drill pattern 1 (DP1; worst case relationship) and drill pattern 2 (DP2; best case relationship).
The weakest and strongest linear relationships for Fe and S concentration are displayed in Fig. 6 and Fig. 7, respectively. The relationship between the results is generally very good in terms of the trend; however, the laboratory XRF results are substantially higher (~1.8 times) than the handheld XRF results. This may be a reflection of the different sensitivities of the instruments or it may be due to issues with the factory calibration of the handheld XRF instrument. The handheld XRF sulphur values are easily corrected by applying a correction factor. Iron has previously been used as an analogue for the presence of pyrite and thus acid potential. The relationship between sulphur and iron is highlighted in Fig. 8 for the field measured values.
Fig. 6. Laboratory measured XRF iron concentration versus field measured ironconcentration for drill pattern 2 (DP2; best relationship case) and drill pattern 5 (DP1;worst case relationship caused by one outlier).
163

Field and Desktop Waste Rock Classification Guide
LANDERS ET AL.
Fig. 7. Laboratory measured XRF sulphur concentration versus field measured sulphur concentration for drill pattern 2 (DP2; best relationship case)and drill pattern 5 (DP5; worst case relationship caused by one outlier).
Fig. 8. Field measured (handheld XRF) sulphur (S) concentration versus field measured iron (Fe) concentration (no correction factor).
3.2 AMD Site Classification Based On Previous Static and Kinetic Testing Results
Results from overburden static testwork were used to assign an AMD risk classification to the samples and to identify correlations with available ABA data and geochemical drill-core assays. The aim is to use the interpretations of this data to devise a refined AMD classification scheme which encompasses NMD and SD which has previously being excluded.
A good correlation was observed between assigned AMD risk, geology, sulphur and iron content of the samples. These correlations were used to produce a conservative and initial high level AMD classification. The previous Fe% cutoff was shifted from 7.5% to 5% (e.g. Fig. 9; Black Bituminous Shale lithology type). This is also applicable for S % as there is strong correlation between S % and Fe %. This shift in cutoff greatly reduces the possibility of mis-classifying PAF material. In addition, materials classified as NAF based on NAG pH values, but with elevated sulphur concentrations fall within the field of NMD materials due to
their potential for producing higher salinity upon oxidation (e.g. Fig. 10). Samples which
164

Field and Desktop Waste Rock Classification Guide
LANDERS ET AL.
contain sulphur values > 0.5% generally result in the generation of NAG test liquor containing sulphate > in excess of 200 mg/L, which is a water quality trigger value for the site.
Fig. 9. Comparison of AMD classification system proposed for the BbH lithology with the classification assigned to the samples.
Fig. 10. NAG liquor sulphate concentration as a function of the proposedFe cutoff grade for all lithology types.
The high level classification does not entirely take into consideration the potential for neutral metalliferous or saline drainage. The concentration of metals liberated as a result of oxidation (i.e. NAG liquors) was plotted against the corresponding total metal concentration for a particular sample. Zinc is provided as an example in Fig. 10. The site environmental water quality trigger values were compared to the NAG liquor concentrations to determine what the approximate total metal concentration of a particular sample is that may result in a particular metal exceeding leachate threshold values for site. These values are considered conservative as the NAG liquor concentrations may over-estimate oxidation.
For the classification scheme, zinc, iron, lead, silver, copper and sulphur were utilised sincethese parameters are included in the current site assay suite for resource definition. Due to
165

Field and Desktop Waste Rock Classification Guide
LANDERS ET AL.
the variability in mineralogy of different samples, more than one metal needs to be incorporated into the classification coding to specify samples that are likely to result in production of metalliferous leachate. Based on the larger analysis suite, particularly the previous shake flask extraction (SFE), NAG extract analysis and the kinetic leaching results, the following total metal concentrations were considered to best define NAF waste most likely to produce NMD: Zinc > 500 mg/kg or Lead > 400 mg/kg or Copper > 700 mg/kg. Further kinetic testing is necessary, to increase confidence in the metal cutoff concentrations, particularly for NMD.
NAG liquor sulphate values which exceed site water quality threshold limits (i.e. 200 mg/L) are most likely to be associated with samples which contain > 1% total sulphur. Based on this, 1% has been assigned as the saline drainage cutoff value.
Fig. 11. Total zinc (Zn) concentration versus NAG liquor (oxidised leach) Zn concentration.
Based on the saline drainage cutoff value for sulphur and the NMD cutoff values for Zn, Pb and Cu, the following waste classification criteria sufficiently classifies the NAF waste materials into NAF (non metalliferous and non-saline) metalliferous NAF (NMD) and saline NAF producing types for this site:
NAF – S% < 0.5 OR Fe % < 5%. AND zinc copper
Saline NAF - S%
Metalliferous NAF - S% < 0.5 OR Fe % < 5%. AND zinc > 500 mg/kg OR lead > 400 mg/kg OR copper >700 mg/kg
The classification scheme has been applied to a set of drill hole assay data to illustrate the
approach. Initially the waste is classified only using iron and sulphur concentration, to give
the NAF, saline NAF and PAF classes (Fig. 11). Then the metal cutoff values are applied to
the NAF subset of samples (e.g. Fig. 12) to identify those that are potentially metalliferous
NAF (NMD); only one metal may trigger this classification. The results indicate that no
samples would be classified as only NMD since As cutoff values of 200 mg/kg is consistently
exceeded and therefore As will not be used in the proposed waste classification criteria until
further data is available.
166

Field and Desktop Waste Rock Classification Guide
LANDERS ET AL.
Fig. 12. Waste classification according to Fe% and S%: NAF, saline NAF and PAF.
Fig. 13. Waste classification including Zn cutoff concentration (400mg/kg) to illustrate the identification of the NMD field for this metal: NAF, salineNAF and PAF.
3.3 Consideration of Acid Neutralising Capacity
The classification scheme developed above provides the primary method for identifying the different classes of mine drainage that may be produced. However, in order to provide some indication of the intensity (i.e. content of metals and/or acidity) of the drainage, the ratio of neutralising capacity to acid generating potential provides a further level of refinement to guide the management of these various categories of wastes on site.
Some basic equations need to be understood in order to calculate the ANC and maximum potential acidity (MPA) for a sample with the data provided in the assay suite. The S % provides a measure of the MPA by assuming all the sulphur is in the form of pyrite and that these sulphides release acidity when oxidised. Therefore the MPA of a sample is calculated according to the stoichiometry of the below equation (Eqn. [1]). According to Eqn 1, for asample containing 1% S as pyrite, then MPA would be equal to 30.6 kg H2SO4/t; MPA = 30.6*S%.
FeS2 (pyrite) + 15/4 O2 + 7/2 H2O 3 + 2H2SO4 (Sulphuric Acid) [1]
167
Field and Desktop Waste Rock Classification Guide
LANDERS ET AL.
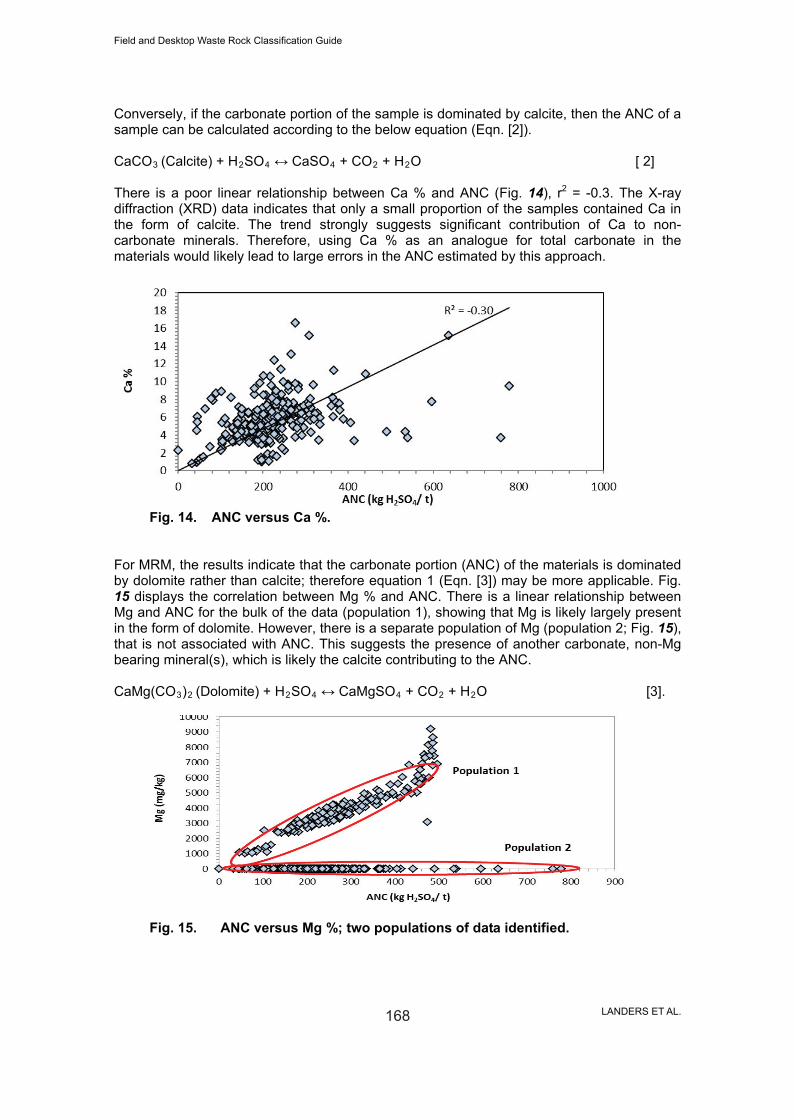
Conversely, if the carbonate portion of the sample is dominated by calcite, then the ANC of a sample can be calculated according to the below equation (Eqn. [2]).
CaCO3 (Calcite) + H2SO4 4 + CO2 + H2O [ 2]
There is a poor linear relationship between Ca % and ANC (Fig. 14), r2 = -0.3. The X-ray diffraction (XRD) data indicates that only a small proportion of the samples contained Ca in the form of calcite. The trend strongly suggests significant contribution of Ca to non-carbonate minerals. Therefore, using Ca % as an analogue for total carbonate in thematerials would likely lead to large errors in the ANC estimated by this approach.
Fig. 14. ANC versus Ca %.
For MRM, the results indicate that the carbonate portion (ANC) of the materials is dominatedby dolomite rather than calcite; therefore equation 1 (Eqn. [3]) may be more applicable. Fig.15 displays the correlation between Mg % and ANC. There is a linear relationship between Mg and ANC for the bulk of the data (population 1), showing that Mg is likely largely present in the form of dolomite. However, there is a separate population of Mg (population 2; Fig. 15), that is not associated with ANC. This suggests the presence of another carbonate, non-Mg bearing mineral(s), which is likely the calcite contributing to the ANC.
CaMg(CO3)2 (Dolomite) + H2SO4 4 + CO2 + H2O [3].
Fig. 15. ANC versus Mg %; two populations of data identified.
168

Field and Desktop Waste Rock Classification Guide
LANDERS ET AL.
Although there is a good linear relationship between Mg content and ANC, the second population (due to calcite) means using Mg content as an analogue for total carbonate in the waste materials may lead to misclassification of the ANC. An alternative to using Ca and Mg concentration for determining ANC is the use of carbon data. This method relies on the assumption that all the inorganic carbon in a particular sample is present as acid neutralising carbonate minerals. For the MRM rock types, this is a reasonable approximation as the organic carbon content in these rocks is expected to be relatively low, and carbonate minerals are likely to represent the bulk of the carbon content.
Fig. 16 shows the strong linear relationship between C % and ANC. There is a small population of data which is an outlier to the general trend (Fig. 16); therefore, for this set of data there may be an overestimation of the available ANC. According to Eqn 2, for a sample containing 1% C as CaCO3, then ANC would be equal to 83.3 kg H2SO4/t; ANC = 83.3*Total C%. Therefore, the Net Potential Ratio (NPR; MPA/ ANC) criterion is calculated as:
NPR criteria = = [4]
A comparison of the laboratory measured ANC to the calculated ANC from Eqn. [4] is shown in Fig. 17. There is a good linear relationship between measured and calculated values; however, further investigations are necessary to differentiate the various carbon species(particularly organic carbon content) so that the classification criteria can be refined.
Fig. 16. ANC versus C%.
R² = 0.75
0
100
200
300
400
500
600
700
800
900
1000
0 200 400 600 800 1000 1200
Ca
lc.
AN
C (
mg
/kg
)
Lab ANC (kg H2SO4/ t)
Fig. 17. Laboratory measured ANC versus calculated ANC.
169

Field and Desktop Waste Rock Classification Guide
LANDERS ET AL.
3.4 Revised Classification Criteria
The revised classification framework takes into consideration the above calculations andresults. The final set of criteria identifying the six categories of waste are summarised below noting that these criteria are applied sequentially (i.e. first identify high capacity NAF, then NAF- S/M etc) to the data in the block model.
Criteria 1: High capacity NAF (acid consuming)
Inferred NPR > 2:1, AND
Sulphur content
Zinc This material is considered environmentally low risk in terms of AMD, NMD and SD.Similarly, the material has the geochemical properties to consume acid and may possibly be used to negate the effects of AMD for certain materials.
Criteria 2: NAF – S/ M: Saline/ metalliferous NAF
NPR > 2:1, AND
Sulphur content > 1% but < 5%, AND/OR
Zinc > 4000 mg/kg OR Lead > 400 mg/kg OR Copper > 700 mg/kg.The material classified under Criteria (2) may provide a small quantity of acid consuming capacity; however, the materials are likely to generate saline or neutral metalliferous drainage over time if measures are not taken to minimise ingress of water into the stockpile waste.
Criteria 3: NAF – LC: Low Capacity NAF
NPR > 2:1, AND
Sulphur content < 5%, AND
Zinc This material is considered environmentally lower risk in terms of AMD, NMD and SD, so would not require any storage considerations or capping requirements.
Criteria 4: PAF – LC: Low capacity PAF
NPR > 1:1, AND
Sulphur content This material has a low to moderate probability of generating acid mine drainage and can be associated with poor drainage water quality in terms of acidity, salinity and elevated metals.
Criteria 5: PAF – HC: High Capacity PAF
NPR < 1:1, AND
Sulphur content This material has a high probability of generating acid mine drainage and can be associated with poor drainage water quality in terms of acidity, salinity and elevated metals.
Criteria 6: PAF – RE: Reactive PAFThe criteria for highly reactive PAF (“smokers”) is currently being developed. The material is characterised by rapid oxidation and generation of SO2 gas either in-pit or shortly after dumping.
170

Field and Desktop Waste Rock Classification Guide
LANDERS ET AL.
4.0 CONCLUSION
A classification guide has been developed that can be applied by mine geologists to classify waste types in situ so that PAF, NMD, SD and particularly reactive PAF materials can be restricted to the appropriate storage facilities. The revised waste classification uses field measurements and the routine assay suite for the mine. The updated scheme also allows for the classification of saline and metalliferous waste types which were not previously included as specific considerations in the waste classification guide. This revised classification guide has been implemented on site and the initial results are showing promise for large improvements compared to the historical classification guide. Inclusion of aspects other than PAF and NAF has raised awareness of the importance of holistic mine waste management and of the environmental considerations for this material at MRM. Ongoing geochemical characterisation and field assessment will allow refinement of the classification criteria if necessary.
171

172