field and online experiments on procrastination and … · field and online experiments on...
TRANSCRIPT

Field and Online Experiments on Procrastination and Willpower*
Nicholas Burger† Rand Corporation
and
Gary Charness‡
Department of Economics University of California at Santa Barbara
and
John Lynham§
Department of Economics University of Hawai’i at Manoa
Working Paper No. 10-12 May 18, 2010
Abstract
Self-control problems have recently received considerable attention from economic theorists. We conducted two studies to test the benefits of externally imposed deadlines and how willpower depletion affects behavior, providing some of the first data in these areas. Each study involved a behavioral intervention designed to affect performance. We find that for a lengthy task, regular deadlines neither reduce procrastination nor increase completion rates. Second, a willpower-depleting task reduces initial effort but increases overall task-completion rates. Our results help to inform ongoing efforts to understand and model procrastination, willpower and commitment mechanisms. Keywords: Experiment, Behavioral Interventions, Procrastination, Willpower JEL Codes: A13, B49, C91, C93, D00
* Acknowledgements: We thank Eric Forte and the UCSB Library for helping us to conduct our first study and John Roberts and Terrence Pae for programming help. We are grateful for comments from Dan Ariely, Roland Bénabou, Rachel Croson, Eddie Dekel, Stefano DellaVigna, Catherine Eckel, Alexander Elbittar, Erik Eyster, Daniel Fessler, Kyle Hyndman, Emir Kamenica, David Laibson, David K. Levine, Alon Nir, Matthew Rabin, Stephen Salant, Jeroen van de Ven, Yechezkel Zilber, and seminar participants at the 2007 ESA meeting in Tucson, the 2008 Santa Barbara Conference on Experimental and Behavioral Economics, the 2008 BDRM Conference in San Diego, the 2008 European ESA meetings in Lyon, the University of Hawai‘i at Manoa, the UCLA Center for Behavior, Evolution, and Culture, ITAM in Mexico City, Harvard University, the 2008 European Workshop on Experimental and Behavioral Economics in Innsbruck, the University of Texas at Dallas, Southern Methodist University, Princeton University, the 2009 Individual Decision-making Conference in Tel Aviv, the Psychology and Economics segment of the 2009 Stanford Institute of Theoretical Economics, the University of Calgary, the University of Zurich, the University of Innsbruck, DIW in Berlin, and the University of Munich. † E-mail: [email protected] ‡ E-mail: charness @econ.ucsb.edu § E-mail: [email protected]

1
1. INTRODUCTION
The issues of self-control, procrastination, commitment, and willpower have important
economic consequences in realms such as productivity, savings behavior, and well-being, and
these have been the focus of a number of recent theoretical models. People experience self-
control problems when their preferences are not consistent across time. One form of self-control
problem concerns persistent bad habits or addictions, such as overeating or cigarette smoking.
An individual knows that he or she will later regret a current self-indulgent choice, but
nevertheless engages in the activity. The other side of the coin is a situation in which an
individual is faced with an activity that will lead to future benefits, but is unappealing at the
moment. This often leads to procrastination, common in everyday life.1 People vow to stop
smoking, stop eating ice cream, or start exercising… tomorrow. An important issue is the
underlying nature of the self-control problem and how one can overcome it; closely related to
this issue is the notion of willpower.
In this paper, we examine aspects of commitment and willpower in two experimental
studies featuring behavioral interventions. As the duration of the tasks made it rather infeasible
to use simple laboratory experiments, we instead conducted field and online experiments. In
Study 1, we investigate how people allocate their time over a task of significant duration (up to
five weeks) and whether an externally-imposed commitment in the form of binding sub-goals
would help them to complete the overall task. I
Having observed possible willpower effects in Study 1, we chose to focus on willpower
in Study 2. Here we consider the effects of willpower depletion on performance; in one
treatment, we implemented a mechanism to deplete willpower—a Stroop test—on the first day of
1 Procrastination has been found to be quite pervasive among students: Ellis and Knaus (1977) find that 95 percent of college students procrastinate, while Solomon and Rothblum (1984) find that 46 percent nearly always or always procrastinate in writing a term paper.

2
a task that could be spread over two days.2 We expected willpower depletion to have a negative
effect on performance.
Extant empirical research on procrastination and self-control is significant (e.g.,
DellaVigna and Malmendier 2004 and Ashraf, Karlan, and Yin 2006 in the economics literature),
but experimental economics has contributed less to this body of work. Given that experiments
offer a way to test interventions in controlled settings, they may offer the best approach to
exploring these behavioral phenomena in detail. As there is little or no experimental evidence in
the economics literature on patterns of effort provision for tasks of significant duration, our
results represent some of the first detailed and daily data regarding procrastination and willpower
under controlled conditions and with financial incentives and tasks of significant duration and
elapsed time.3. One primary purpose of our research is to identify patterns in behavior that will
inform theorists so that more relevant, descriptive models can be developed; at the same time, we
also hope to aid other researchers in designing mechanisms that are effective in overcoming
obstacles to performance and to explore how experimental methods can shed light on a set of
robust but competing theories.4
There have been only a few studies that consider how one might overcome self-control
problems. Aside from exerting willpower in the face of a disagreeable task, one approach is
commitment, or binding one’s own behavior with costly restrictions. Wertenbroch (1998)
2 Psychologists have used the Stroop test (Stroop, 1935) to deplete willpower for many years (see Gailliot et al. 2007 for a recent study and MacLeod 1991 for a history). 3 Two recent studies consider issues of temptation. Houser, Reiley, and Urbancic (2007) look at temptation at the check-out counter in the supermarket, while Houser, Schunk, Winter, and Xiao (2009) conduct a laboratory experiment involving temptation and commitment. 4 There have been at least a handful of behavioral interventions designed to overcome bad habits or to form new good ones. Angrist and Lavy (2009) offer substantial cash incentives in Israel for matriculation; while this is ineffective when individual students are selected for the treatment, matriculation rates do increase when this program is school-wide. Charness and Gneezy (2009) pay students at two American universities to attend a gym during a period of time, finding that attendance rates increase substantially not only during this period, but also after the intervention ends. Angrist, Lang, and Oreopoulos (2009) offer merit scholarships to undergraduates at a Canadian university, with some success in improving performance, but mixed results overall.

3
presents examples of binding behavior, including tactics such as putting savings into a
Christmas-club account that does not pay interest or buying only small packages of goods such
as cigarettes or ice cream. In a similar vein, Burger and Lynham (2009) examine weight-loss
bets in England, where one could bet on achieving a weight goal by a deadline; however, the vast
majority of bettors lost their bets with the agency, suggesting that this self-imposed deadline was
ineffective.
Ariely and Wertenbroch (2002) consider the effectiveness of deadlines in tasks that will
almost certainly be completed.5 They present two studies in which three tasks had to be
completed over a period of time, finding that externally-imposed costly deadlines during this
period are more effective than self-imposed (and binding) costly deadlines, which in turn are
more effective than having no additional deadlines. This suggests that exogenous deadlines
might well be quite effective; however, the commitment level in these experiments was not
extreme, in that the cost for not meeting an interim deadline was rather low. Moreover, the cost
of not completing the “study”—dropping out of class—was quite high.
The results of our behavioral intervention in Study 1 differ considerably from the Ariely
and Wertenbroch (2002) results, suggesting that some deadlines may in fact reduce flexibility
enough to overcome any benefits they provide in reducing procrastination. Completion rates in
our first study were actually 50 percent higher with no interim deadlines, implying that our form
of externally-imposed commitment was ineffective.6 The patterns of effort show a pronounced
weekly cycle, with little difference in behavior from the first week to the fifth week. Overall,
5 The tasks involved turning in term papers for grades in a class for a 14-week period (with a one percent grade penalty for each day of delay) or proofreading three papers totaling about 100 pages over a 3-week period; in the latter task, participants were paid $0.10 to find errors (there were about 100 embedded), but fined $1.00 for each day of delay. 6 Of course, one might argue that our weekly requirements were not well chosen. However, we chose these after considerable discussion with undergraduate students and ex post would choose them again.

4
there is no aggregate support in our data for strongly present-biased preferences, although
behavior seems consistent with a combination of moderate present-biased preferences and
uncertainty over the cost (or feasibility) of future effort. In any case, individual analysis reveals
substantial heterogeneity, with some people exerting most of their effort early on and other
people concentrating their effort into the last weeks.
In our second study, we offered participants a financial reward for completing a task
within two days. On the first day, subjects were assigned either a willpower-depleting or a
willpower-neutral Stroop test. Among the people who completed the task, those who were
assigned the willpower-depleting test exerted significantly less effort on the first day, as
expected. However, those subjects who were assigned the willpower-depleting test were actually
more likely to complete the overall task within the allotted two days than the people in the
willpower-neutral treatment. Thus, while willpower does appear to be depleted by the
intervention on the first day, it appears to come back even stronger on the second day; this is
consistent with the notion that successfully completing a willpower-depleting Stroop test serves
as a signal about one’s willpower.7 We discuss this finding in more detail later. Again, we see
considerable heterogeneity across the population.
There are a number of theoretical approaches that address procrastination, time-
inconsistency, and willpower; these include models of present-biased quasi-hyperbolic
preferences (Laibson, 1997 and O’Donoghue and Rabin, 1999), temptation and commitment
(Gul and Pesendorfer, 2001 and Fudenberg and Levine, 2006), self-signaling of one’s strength of
will (Bénabou and Tirole, 2004), and willpower (Ozdenoren, Salant, and Silverman,
forthcoming). While these models do relate to our experiments, it is not our purpose to conduct
7 An alternative explanation is that participants who completed the Stroop test viewed this as a form of commitment. 9 We thank ORSEE (Greiner 2004) for the free recruiting software, which permitted selective invitations.
5
a systematic test of these theories. Nevertheless, we do highlight where our results are either
broadly consistent with or contradictory in spirit to the relevant theoretical work. Because the
predictions of these models depend on (unknown) parameter values, we also administered a
questionnaire in order to calibrate some of the parameters relating to the quasi-hyperbolic model.
This questionnaire focuses on aspects of the tasks in both of our experiments. In the remainder
of this paper, we provide details of our experimental design in section 2 and describe the results
in section 3. We offer some discussion in section 4, and conclude in section 5.
2. THE EXPERIMENTS
Study 1
This experiment was conducted at the University of California at Santa Barbara. We
obtained permission to have anonymous access to the grade records of students in a large
introductory undergraduate class and then recruited as many as possible from this class. We then
advertised the session to first-year students in the general experimental subject pool.9 All
students were told that they could attend an introductory meeting about an experiment that would
involve a non-trivial amount of money to be earned over time. Interested students were
randomly assigned to one of two introductory meetings.10 Participation was voluntary and
everyone who showed up was guaranteed $5 even if they were not interested in participating in
the study. At these meetings, we explained the nature and rules of the experiment. This process
lead to a total of 74 eventual participants (out of 87 students who showed up to the meetings); 42
were from the class and 32 were from the campus-wide experimental subject pool. As we show
later, there was no appreciable difference in behavior across these two sets of participants.
10 All the students in a particular informational meeting were assigned to the same treatment group. This was done to reduce social interaction threats (Cook and Campbell, 1979).

6
We chose the task of studying because it is a common activity for students, but one that is
susceptible to procrastination. Studying has obvious longer-term benefits, but is costly in the
short-run insofar as other activities have more immediate appeal.11 Nevertheless, there are
already incentives in place for the studier; thus, we did not pay the usual average per-hour rates
for experiments, but chose to pay $95 for 75 hours of monitored studying. Ideally one could
record ‘natural’ studying completed by students, but this was not feasible. Instead, we recorded
the time students spent studying in a popular, easy-to-access location: the central campus library.
We showed participants the studying location, a room in the library that was frequently
(but intermittently) monitored. This study area was available for between 14 and 16.5 hours
each day. Subject to the availability constraint, students were free to log in and out by handing
over an ID card to the monitor who would then log the student in or out on a computer. In
addition, students were each given a large numbered placard, unique to each individual. This
was visible to the monitor at all times. The studying area was monitored hourly at a varying time
each hour to ensure students were present at the studying location when signed in.
We conducted two treatments. In one treatment, there were no requirements other than
logging in the 75 hours of study over the five-week period. In the other treatment, each student
was required to log in a cumulative total of at least 12 hours per week (12 hours by the end of the
first week, 24 hours by the end of the second week, etc.); the idea was that this would prevent
participants from falling too far behind, while still offering some scope for procrastination (one
could log 48 hours by the end of the fourth week, but would still need to log in 27 hours in the
last week). If these requirements were not met, one did not receive any payment. Note that this
‘forfeiture’ penalty is quite different from the ‘soft’ penalties in Ariely and Wertenbroch (2002).
11 Students may therefore wish to do more studying than they actually manage; this is similar to self-control problems such as dieting or smoking.

7
Each student was assigned a web page where he or she could check on the number of
hours logged, and could then contact us in the case of any discrepancy. In addition, students who
satisfied weekly studying requirements ‘banked’ their contingent earnings; their web pages had a
check-like graphic showing the credit already amassed (of course, this credit was only to be paid
if the student completed the overall 75-hour requirement). Students who failed to meet a weekly
requirement were notified at the end of the applicable week that they were no longer eligible to
earn the $95. At the end of the five-week period, those students who had completed the
requirement(s) received their earnings and filled out a short questionnaire.
We would like to immediately address two possible concerns. First, students had access
to both computers and wireless Internet, so we cannot be certain how much of their time in the
library was devoted to studying. However, the anecdotal evidence from the monitors is that,
although students occasionally just checked e-mail or Facebook, etc., apparent studying was by
far the most common activity observed. Moreover, our results indicate some improvement in
grades among those students who completed the studying task, so there is also an inference that
significant studying occurred. Second, one might also be concerned about contamination, since
people from both treatments studied in the same area. Again, we have only anecdotal evidence
against this: 1) Exit interviews of the people who completed the study task indicate that students
who spent over 75 hours in each other’s company weren’t aware of the other treatment group,
and 2) Monitors did not observe students in conversation with one another.
Study 2
Where our first study collected detailed data on long-term procrastination in a quasi-
realistic setting, our second study focuses more closely on procrastination over a shorter time
period; Study 2 also adds the element of willpower depletion, as some of the patterns observed in

8
Study 1 were suggestive of willpower effects. This approach allows us to define procrastination
more clearly and examine whether the days of the week for the study affects outcomes.
Study 2 was conducted online with multiple-choice economics questions.12 We recruited
participants from a micro principles class and two intermediate micro classes at UCSB; we
supplemented the 135 participants from these classes with 23 economics or business economics
majors who were not in these classes, but who were in the campus-wide subject pool. In all
cases, we described the task (in general terms) and the payment scheme. The task consisted of
answering, over a two-day period, 20 multiple-choice questions taken from microeconomics
exams. The participant could answer all 20 of these on the first day or spread them over the two
days.13 We paid each person $7.50 for completing the Stroop exercise and the 20 multiple-
choice questions, with each correct answer earning an additional $0.75 for the student.
Each participant was randomly assigned to either a Tuesday-Wednesday group or a
Friday-Saturday group; these different two-day periods presumably reflect either different
opportunity costs or different stocks and/or flows of willpower. We also required people to do
250 rounds of a Stroop test on the first day before proceeding to answer the multiple-choice
questions.14 Discordant Stroop tests are used in psychology experiments to deplete willpower
and consist of showing words that are the names of colors, although the actual words are printed
in a color of ink different from the color name they represent. For example, the word “blue”
might be printed in red ink. One is asked to respond by typing the color seen and ignoring the
word itself. Resisting the urge to read the word and instead focus on the color of the ink requires 12 We also conducted a study involving tasks of varying length to be completed online over seven consecutive days. However, the overall completion rate was only 15% and there was evidence of substantial confusion on the part of the participants. We observe smaller day-of-the-week effects and a slight tendency to delay the longer tasks until later. Details of this study are reported in Burger, Charness, and Lynham (2008). 13 It was made clear to each participant that being inactive for 15 minutes after logging on would result in one being logged off for that day; thus, people could not return to the task on the same day after taking a long break. 14 To control for possible differences in the time spent on the two Stroop tasks, we required an elapsed time of 15 minutes to complete the concordant Stroop; this was roughly the time it took to complete the discordant Stroop.

9
considerable use of the brain’s executive functions. We randomly assigned each participant to
process either discordant Stroop exercises or concordant ones (where the word color matches the
ink color and the task is trivial). Thus, one treatment group had its willpower depleted before
beginning work on the multiple-choice questions and the other group did not.
Questionnaire
The predictions of some of the leading theoretical models within the context of our
experiments depend on parameter values. Since these cannot be divined from our experimental
results, we conducted an anonymous survey of 69 undergraduate students in an economics class
in an attempt to gain some insight into some of the actual parameter values. The full
questionnaire is presented in Appendix D. While there was no way to make these questions
incentive compatible, we did pay each student $2 for completing the questionnaire, as anecdotal
evidence suggests that such payment induces more serious thinking about the questions and
responses.
The questions focus on aspects of the tasks in both of our studies. One question concerns
how people would allocate 75 hours of library study time over each week of a 5-week period. In
one version, people were asked how they would prefer to allocate their time during this period,
while another version asked how they thought they would end up allocating their time during this
period. The first version can be used as a benchmark against which procrastination can be
measured; if people would ideally have a sharply-increasing profile over time, the presence of
such a profile would not indicate that they are in fact procrastinating. Comparing the second
version to the first provides some evidence of whether students are aware of any tendency to
delay relative to their optimal path, i.e. are they “sophisticated” or “naïve” about their tendency
to procrastinate? Other questions asked students how they would allocate 15 hours of library

10
study over the days of the week, how likely it was they would not be able to complete a project
that required periodic work over a 5-week period, how much they would have to be compensated
for various amounts of studying, and whether they would rather do 90 minutes of homework all
at once or do more homework spread out over two days.
3. EXPERIMENTAL RESULTS
Study 1
One of our goals was to test whether providing interim targets or requirements would
help people to achieve the overall task. In this regard, Figure 1 shows the proportion of students
who completed the studying project:
0%
25%
50%
75%
100%
Weekly No Weekly
Figure 1 - Success rates, by treatment
In the weekly-requirements treatment, 15 of 38 students (39.5%) were successful. When there
were no weekly requirements, 22 of 36 students (61.1%) completed the mandated 75 hours.
Clearly, there is no support for the view that externally-imposed restrictions helped students to
achieve the goal. In fact, the test of the difference of proportions (see Glasnapp and Poggio
1985) gives Z = 1.86, so that there is a marginally-significant difference in success rates across
treatments (p = 0.062, two-tailed test).15
15 Recall that some participants were from an introductory class and others were first-year students from the general subject pool. Thirteen of 20 students from the class succeeded in the no-weekly treatment, compared to 9 of 16

11
We also find that the completion rate for the 45 female participants was more than 50
percent higher than for the 29 male participants.16 However, this difference is only marginally
significant; the test of the difference of proportions gives Z = 1.67 (p = 0.095 with a two-tailed
test). This result is similar in flavor to the finding in Angrist, Lang, and Oreopoulos (2009) that
providing incentives for good grades is much more effective for female students.
One might speculate as to what the completion rate for the students with no weekly
requirements would have been if they had faced the requirements. While it is impossible to
construct the appropriate counterfactual, by simply imposing ex post the weekly requirements on
the no-requirements treatment, we find that the completion rates are quite similar. The
completion rate for the no-requirements treatment would now be 14 of 36 (38.9 percent),
compared to 15 of 38 (39.5 percent) for the weekly-requirements treatment. In fact, the nearly
identical ‘counterfactual’ rates suggest the difference in success rates is driven by the presence of
the restrictions and the corresponding reduction in flexibility, implying that procrastination per
se was unaffected by imposing weekly restrictions.17
One interesting aspect of our data is the cyclical weekly patterns in the number of study
hours logged. Figure 2 shows these patterns for those students who completed the project
(referred to as “winners”). While it may not be surprising to see a weekly, cyclical pattern when
students face weekly study requirements, the pattern is actually slightly stronger for the group
students from the subject pool (Z = 0.54), while eight of 22 students from the class succeeded in the weekly-requirements treatment, compared to 7 of 16 students from the subject pool (Z = 0.46). Neither difference (nor the overall comparison of 21 of 42 versus 16 of 32) is close to statistical significance. 16 Twenty-six of the 45 females (57.8%) completed the requirement(s), compared to 11 of the 29 males (37.9%). 17 On the other hand, a portion of the difference in completion rates across treatments is driven by the difference in the proportions of participants who never log any study hours after signing up for the experiment. This applies to nine of the 38 people (23.7%) in the weekly treatment, compared to two of the 36 people (5.6%) in the no-weekly treatment; this difference in rates is significant (Z = 2.19, p = 0.028, two-tailed test). This suggests that the realization that there were multiple hurdles may have deterred people from even starting the task. 19 This is reflected in the fact that both the weekly and no weekly requirements lines intersect with the 15-hour target line on Sundays – the last day of each week in the experiment.

12
without weekly requirements. Cumulatively, the study hours logged for winners were very close
to a ‘target’ line of 15 hours per week.19 The average number of study hours (75.35) for the
winners was very close to the minimum of 75, ranging from 75.02 to 76.74. This suggests that
students did not find this studying task to be innately pleasurable.
Figure 2 0
12
34
Avg
Da
ily H
ou
rs S
tud
ied
0 Sunday Sunday Sunday Sunday Sunday
Day (1-35)
No Weekly Req. Weekly Req.
15 hr/wk 'target'
Average daily hours studied by group (winners only)
Is there a difference in study hours across weeks for those who completed the 75 hours of
study? Table 1 presents the average number of hours for the winners by week and by group:
Table 1: Average weekly study hours (winners), by group
Week Weekly requirements No weekly requirements 1 16.92 (0.41) 13.91 (0.50) 2 14.53 (0.43) 16.08 (0.39) 3 11.38 (0.50) 13.78 (0.44) 4 15.75 (0.62) 16.27 (0.61) 5 16.78 (0.69) 15.31 (0.71)
Note: Standard errors are in parentheses
There is no clear trend over time for either treatment. Regressions of hours against weeks
yield insignificant coefficients for the time trends (0.09 and 0.30, respectively, with
corresponding t-statistics of 0.11 and 0.76). This does not appear to be evidence of
procrastination. However, if we look at the study patterns for each individual, there is evidence
13
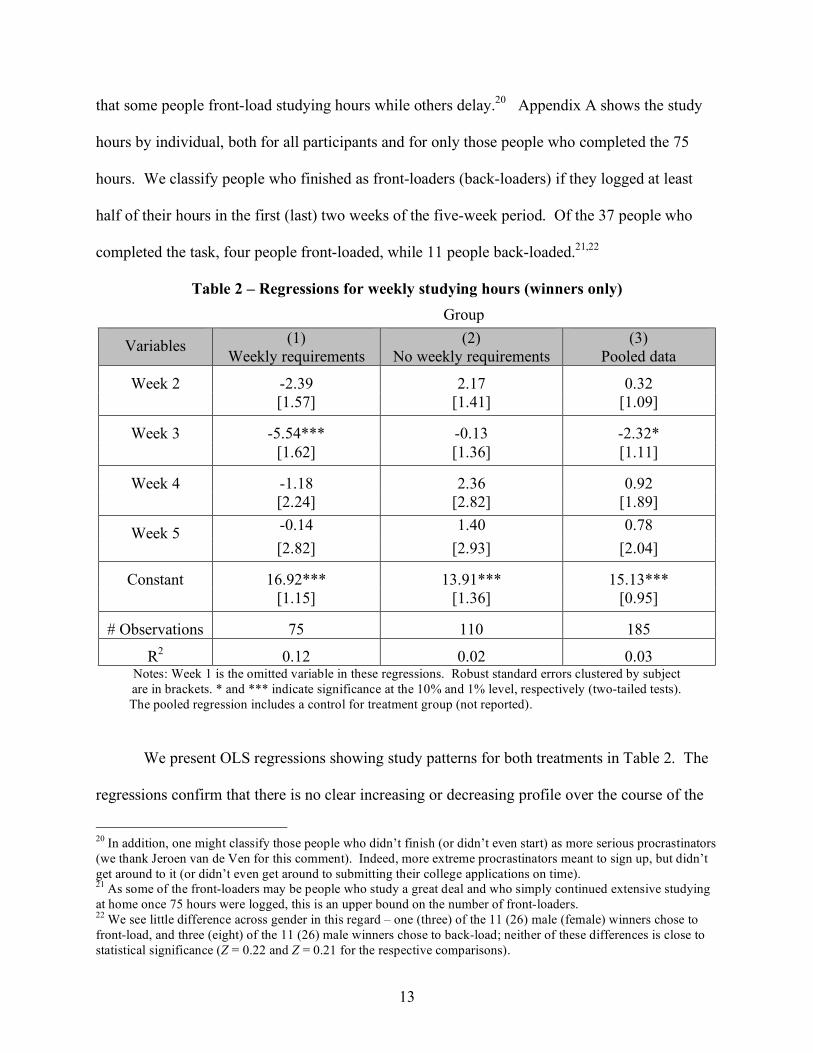
that some people front-load studying hours while others delay.20 Appendix A shows the study
hours by individual, both for all participants and for only those people who completed the 75
hours. We classify people who finished as front-loaders (back-loaders) if they logged at least
half of their hours in the first (last) two weeks of the five-week period. Of the 37 people who
completed the task, four people front-loaded, while 11 people back-loaded.21,22
Table 2 – Regressions for weekly studying hours (winners only) Group
Variables (1) Weekly requirements
(2) No weekly requirements
(3) Pooled data
-2.39 2.17 0.32 Week 2 [1.57] [1.41] [1.09]
-5.54*** -0.13 -2.32* Week 3 [1.62] [1.36] [1.11]
-1.18 2.36 0.92 Week 4 [2.24] [2.82] [1.89] -0.14 1.40 0.78 Week 5 [2.82] [2.93] [2.04]
16.92*** 13.91*** 15.13*** Constant [1.15] [1.36] [0.95]
# Observations 75 110 185
R2 0.12 0.02 0.03 Notes: Week 1 is the omitted variable in these regressions. Robust standard errors clustered by subject are in brackets. * and *** indicate significance at the 10% and 1% level, respectively (two-tailed tests).
The pooled regression includes a control for treatment group (not reported).
We present OLS regressions showing study patterns for both treatments in Table 2. The
regressions confirm that there is no clear increasing or decreasing profile over the course of the
20 In addition, one might classify those people who didn’t finish (or didn’t even start) as more serious procrastinators (we thank Jeroen van de Ven for this comment). Indeed, more extreme procrastinators meant to sign up, but didn’t get around to it (or didn’t even get around to submitting their college applications on time). 21 As some of the front-loaders may be people who study a great deal and who simply continued extensive studying at home once 75 hours were logged, this is an upper bound on the number of front-loaders. 22 We see little difference across gender in this regard – one (three) of the 11 (26) male (female) winners chose to front-load, and three (eight) of the 11 (26) male winners chose to back-load; neither of these differences is close to statistical significance (Z = 0.22 and Z = 0.21 for the respective comparisons).

14
experiment. Only the coefficient for the dummy for Week 3 has any statistical significance, and
this would appear to reflect the effect of a closure of the library during evening peak study time
due to a power outage (see the dip around day 16 in Figure 2).
Table 3 shows the average hours of studying logged by winners on each day of the week.
The number of study hours shows a tendency to decrease over the course of the week (from
Monday to Thursday), with a dramatic drop on Friday and Saturday, and some recovery
beginning Sunday afternoon. The patterns are essentially similar across the two treatments.
Students appear to start the week fairly fresh and run out of steam as it progresses. The weekend
appears to be the time when students ‘re-charge’ (perhaps their willpower); alternatively,
students might have a higher opportunity cost of studying on the weekend.
Table 3: Average study hours (winners), by day and group
Day Weekly requirements No weekly requirements Pooled data Monday 3.14 (0.23) 3.25 (0.20) 3.21 (0.15) Tuesday 2.69 (0.24) 2.94 (0.20) 2.84 (0.15)
Wednesday 3.04 (0.23) 2.87 (0.19) 2.94 (0.15) Thursday 2.57 (0.30) 2.21 (0.22) 2.35 (0.18)
Friday 1.01 (0.17) 1.05 (0.15) 1.03 (0.11) Saturday 1.06 (0.21) 0.90 (0.16) 0.97 (0.13) Sunday 1.56 (0.24) 1.84 (0.24) 1.73 (0.17)
Note: Standard errors are in parentheses
We see a strong and significant cyclical pattern, common to both treatments.23 There is
virtually no difference between the estimated coefficients for the two groups (when a dummy
variable for group is added, its coefficient is 0.00; when we include week*group interaction
23 Since the winners only represent 50 percent of the participants (37 of 74), it is natural to wonder whether there is more back-loading among those students who did not manage to complete the task. Naturally, the data for this group is far less complete, as most people who did not complete the studying task stopped logging hours early on. Appendix B shows a pattern somewhat similar to Figure 2 for the first two weeks of the study (70 percent of the people who did not complete the task logged no hours after the second week) for people who did not attain the studying target.
15
dummies, none of these has a coefficient that is close to statistical significance – the lowest p-
value is 0.47).
Although the regression results find no significant differences from Monday to
Wednesday, analysis of each individual’s logged study hours does suggest that people tend to log
the most hours on Monday, with a steadily declining rate until it increases on Sunday. We can
examine how many people logged the most and second-most study hours by day of the week (see
Appendix C). For the full participant population, 22 of the 63 people (34.9%) who logged any
study hours logged the highest number of study hours on Monday.24 The pattern is even stronger
if we only include the winners, with 15 of 37 people (40.5%) logging the highest number of
study hours on Monday.25 On the other hand, the non-winners have a higher proportion of study
hours later in the week, with this being particularly true for the group with weekly restrictions; it
seems plausible that these people tried to catch up late in the week, but did not succeed.
A final question of importance is whether completing (or even attempting) the study task
was helpful in terms of performance. As mentioned earlier, 42 of our participants originated in
an introductory class and we were given permission to access the (anonymous) grade records for
the course, matching student ID numbers for the participants. There were quizzes, a midterm,
and a final exam in the course. Our study commenced in the fourth week of the quarter, with
two quizzes preceding our study. There is more variability in the quiz grades, with a number of
people missing them, particularly after the midterm.26 We therefore trust the midterm (taken
after the first week of the five-week experiment) and final-exam (taken a week after the
24 This compares to 15 on Tuesday, 13 on Wednesday, six on Thursday, one on Friday, one on Saturday, and five on Sunday; the pattern is similar if we consider highest and second-highest days of the week. 25 This compares to six on Tuesday, eight on Wednesday, five on Thursday, and five on Sunday; again, the pattern is similar if we consider highest and second-highest days of the week. 26 The absentee rate on the quizzes after the midterm was more than double the rate before the midterm.

16
experiment ended) scores more, but nevertheless include an average for the first two quizzes.
Table 4 shows the mean scores by group:
Table 4: Mean scores on tests, by group
Group N Quiz Midterm Final Non-participants 403 3.13 (0.05) 8.78 (0.13) 7.56 (0.15)
Participants, non-winners 21 3.21 (0.16) 9.57 (0.51) 7.71 (0.4) Participants, winners 21 3.67 (0.15) 10.71 (0.49) 9.24 (0.5)
Note: Standard errors are in parentheses
We see that the differences between the non-participants and the non-winners are
generally small, although slightly larger for the midterm.27,28 In fact, Wilcoxon-Mann-Whitney
(two-tailed) ranksum tests confirm that none of these differences are significant (for the midterm
comparison, we find that Z = 1.37, p = 0.171). On the final exam, there was no difference
between non-participants and non-winners (Z = 0.10). There is also no significant difference
between non-winners and winners on the midterm scores (Z = 1.58, p = 0.115); however, the
difference between final scores is in fact significant (Z = 2.38, p = 0.017). Thus, the difference
in test scores across participants increased over the course of the quarter, suggesting that people
who logged in 75 hours of library study improved their grades relative to those who signed up
and did not complete the task.29
27 We note that the midterm took place before many non-winners had stopped logging study hours. 28 Given that only 42 of 445 students in these classes chose to participate, it may well be the case that there was a higher degree of procrastination amongst those students who did not participate. While we are primarily interested in treatment effects (and use random assignment to these treatments), we caution that the levels of the behavior observed may potentially not be representative of the overall student population. 29 One issue is whether the study hours in the monitored location were simply a substitute for study hours elsewhere. The data suggest that perhaps this is not completely the case. In addition, the results from our pre- and post-experiment questionnaires reveal that only 24% of the eventual winners studied more than 15 hours per week before the experiment started and 64% of winners reported reducing their weekly study hours once the experiment ended. This provides some evidence that the experiment increased total hours studied over the five-week period.

17
Study 2
Of the 158 people who signed up online, 100 (63 percent) completed the task
successfully. In a departure from our earlier results, 60 of 85 males (71 percent) completed this
shorter task, compared to 40 of 73 females (55 percent); this difference is statistically significant
(Z = 2.05, p = 0.040, two-tailed test). As might be expected, success rates were significantly
higher for the Tuesday-Wednesday group, as 57 of 79 people (72 percent) in this group finished
and 43 of the 79 people (54 percent) in the Friday-Saturday group finished (Z = 2.31, p = 0.021,
two-tailed test).
Thirty-nine people answered all 20 questions on the first day, 15 people answered all 20
questions on the second day, and the other 46 people who completed the task answered questions
on both days. Ninety-two people answered some questions on the first day, while 64 people
answered questions on the second day. Forty-nine people never answered any questions, while
the remaining nine people answered between four and 15 questions. Sixty-one of the 64 people
(95 percent) who answered some questions on the second day completed the task successfully.
With respect to the people who completed the task, the average number of questions
answered on the first (second) day was 11.53 (8.47); similarly, for the nine people who answered
more than zero, but less than 20, questions in total, the average number of questions answered on
the first (second) day was 5.56 (3.33).30 We see some tendency for males to procrastinate more
than females, as the number of questions answered on the first day for people who finished was
9.97 for males and 13.88 for females (Z = -2.25, p = 0.025, two-tailed test).
We observe differences in behavior according to the type of Stroop test that was
assigned. Twenty-two of the 45 people (49 percent) who were assigned the concordant Stroop
30 Since more questions are answered on the first day, at first glance there is no evidence of procrastination in the aggregate. However, one must keep in mind that each participant was required to answer the Stroop tests on the first day, so that coming back on a second day involved an additional transaction cost.

18
and succeeded at the task answered all 20 questions on the first day, compared to 17 of the 55
people (31 percent) who completed the task and were assigned the discordant Stroop (Z = 1.83, p
= 0.034, one-tailed test). This implies some degree of willpower depletion.31 These results are
combined in the regressions in Table 5 and the success rates by Stroop type and start day are
displayed visually in Figure 3.
Table 5 – Determinants of success rate and number of questions answered
Independent variable
Dependent Variables
(1) Success rate
(2) Questions, 1st Day
.539** 1.59 Tuesday (.212) (3.34)
.406* -6.92** Discordant Stroop (.212) (3.42)
.515** -8.04** Male (.213) (3.45)
-.384* 22.11*** Constant (.222) (4.17)
Observations 158 100
Pseudo R2 0.068 0.018 Notes: Standard errors in parentheses. Specification (1) is a Probit regression and (2) is a two-sided Tobit regression, including only those people who answered all 20 questions. *, **, and *** indicate significance at the 10%, 5%, and 1% level, respectively (two-tailed tests). We omit interaction terms, as these are not significant and do not qualitatively change the main results.
31 We are not wedded to the term “willpower”, as this could be seen as, for example, depletion of cognitive resources. We use this term simply to reflect the standard terminology in the psychology literature.

19
0%
25%
50%
75%
100%
Concord/Tues Discord/Tues Concord/Fri Discord/Fri
Figure 3 - Success rates, by Stroop type and start day
A rather surprising result is that people who were assigned the discordant Stroop were actually
slightly more likely to eventually finish the task. Fifty-five of the 79 people (70 percent)
assigned the discordant Stroop finished, while 45 of the 79 people (57 percent) assigned the
concordant Stroop finished; the test of proportions gives Z = 1.65, p = 0.099, two-tailed test.
Specification (2) confirms that people who completed the task after performing the discordant
Stroop answered significantly fewer questions on the first day, and that males who completed the
task delayed more than did females.
Another measure that may reflect willpower depletion, but in any case certainly reflects
the quality of work, is the percentage of questions answered correctly. There is no significant
difference in the percentage correct across gender (62 percent for males vs. 60 percent for
females) or type of Stroop test (60 percent in both cases). In addition, the percentage of correct
answers on the first day does not predict success rates (the t-statistic on the coefficient for
number of questions is 0.21). However we do find that the percentage of correct answers on the

20
first day is significantly higher than on the second day.32 This is robust to whether we consider
the whole sample of 158 people, the 100 people who finished, or the 47 people who answered
questions on both days.33 The percentage of correct answers is also higher for the Tuesday-
Wednesday group (0.63 vs. 0.56, Z = 1.78, p = 0.038, one-tailed test).
One of the features of our data is the pronounced weekly studying cycles in Study 1 and
the day-of-the-week effects in Study 2. Although Study 2 (and a number of studies in the
psychology literature) provides evidence that willpower is a resource that can be depleted, it is
not clear whether the weekly cycles in Study 1 reflect the depletion of willpower, changes in the
opportunity cost of studying or some other influence. Nevertheless, some data from Study 1
offer some insight into this question. The opportunity-cost story would be most consistent with a
difference in behavior during the workweek and during the weekend, rather than a daily
difference (at least during the workweek). On this basis, we should expect similar behavior for
the period from Monday through Thursday. The individual data suggest that Monday is the
favorite day for logging study hours, although we do not find significant differences for Monday-
Wednesday. In addition, we see a significant decline in study hours on Thursday.34
Questionnaire
32 The order of questions was randomized, so there should be no difference in difficulty levels across days. One possible explanation for the lower success rate on the second day is that students may have “sprinted to the finish” once the finish was within sight. 33 The respective comparisons are 0.66 vs. 0.49 (Z = 4.35, p = 0.000), 0.66 vs. 0.50 (Z = 4.10, p = 0.001), and 0.67 vs. 0.47 (Z = 3.43, p = 0.001). All of these tests are two-tailed. 34 While some might argue that the weekend starts on Thursday evening, time-of-day data (shown in Appendix E) show more of a decrease (relative to Wednesday) for Thursday morning and afternoon, rather than Thursday evening; the percentage decrease in logged study hours for the morning and afternoon combined is 36.4%, while this percentage decrease is only 14.2% for the evening. While this suggests that willpower is being depleted through the workweek, it is hardly conclusive. 36 While both sets of numbers reflect the prevailing wage and are much higher than students in Study 1 were paid per hour, we are primarily interested in the relative costs. We report medians rather than means to avoid distortions from outliers.

21
The main question in the survey concerns how people would allocate 75 hours of library
study time over each week of a 5-week period. In one version, people were asked how they
would prefer to allocate their time during this period, while another version asked how they
thought they would end up allocating their time during this period. The results are shown in
Table 6:
Table 6: Optimal and expected weekly study hours, questionnaire
Week Optimal Expected 1 13.85 (1.37) 13.56 (1.20) 2 15.45 (1.07) 12.88 (1.00) 3 16.30 (1.08) 14.15 (0.91) 4 13.67 (1.07) 15.85 (1.04) 5 15.24 (2.17) 18.85 (1.92)
Note: Standard errors are in parentheses.
The aggregate optimal studying profile is essentially flat, with the hours for each week never
significantly different from 15. The aggregate expected studying profile does show evidence that
people expect to delay somewhat in the task. A second question asked how people would
allocate 15 hours of library study over the days of the week. Here the pattern resembles that seen
in Table 3, with 2.82, 2.59, 2.87, 1.81, 0.91, 1.08, and 2.90 hours projected respectively for
Monday – Sunday. Thus, people do appear to be aware of their actual intra-week preferences, as
only the expected hours for Sunday study differ much from the actual numbers in Table 3.
We also asked students about how likely it was that they would not be able to complete a
project requiring periodic work over a 5-week period; this is a proxy for the degree of
uncertainty in the students’ lives. Overall, there is only a modest degree of uncertainty, with a
median response of 10%. Two additional questions examined the convexity of effort costs. In
one question, students were asked for the minimum amount of money they would require to
study in the library for one, two, or four hours in a day; the median responses were $8, $18, and
$40, respectively, indicating a slight degree of convexity. A second question asked students for

22
the minimum amount of money they would require to study in the library for 10, 20, or 30 hours
during a one-week period; the median responses were $55, $120, and $300. Both sets of
responses indicate at least a moderate degree of convexity in effort cost.36
Finally, we asked a question bearing on Study 2, in which the total amount of time
required for the task was about 90 minutes. Students were asked whether they would rather
spend 90 minutes on a task in one sitting at home or to spread the task out over two sittings (one
on each of two consecutive days) at home, with a total time of either 90, 105, or 120 minutes.
Forty-six people always preferred to have only one sitting, while 10 people always preferred two
sittings.37 Thus, for a high percentage of the students (67%) the convexity of effort cost was not
sufficient to overcome the additional transactions cost of the additional sitting.
4. DISCUSSION
4.1. Related behavioral models
A recent theoretical literature in economics has explored issues of procrastination,
willpower and time-inconsistency. We briefly summarize several models and explore their
broad predictions in our design and how consistent these are with our data. Although our
research objective was to test if (i) interim deadlines help task completion, (ii) willpower
depletion hurts task completion, and not to prove/disprove various theoretical explanations for
time-inconsistency, our results do shed empirical light on the different modeling approaches.
One notion is that people have present-biased preferences. A person puts more weight on
37 Only three of the other sets of responses made sense to us, with students preferring two sittings except when this would take 120 minutes. The other 10 people appear to have been confused, as six of these preferred one sitting except when two sittings would take 105 or 120 minutes, and four of these preferred one sitting except when two sittings would take 120 minutes.

23
the present than on the future, leading to dynamic inconsistency.38 Strotz (1955), Ainslie (1992),
Laibson (1997) and O’Donoghue and Rabin (1999) discuss present-biased (quasi-hyperbolic)
preferences as an explanation for persistent bad habits and addictions.39 In Study 1, the model
predicts that with weekly requirements, study hours should be logged near the end of each week;
without weekly requirements, there should be a surge in hours logged late in the five-week
period. However, since uncertainty could potentially overwhelm the tendency to procrastinate,
the predictions for the studying profile in Study 1 will depend on assumptions about parameter
values; we perform a calibration exercise using the data from our questionnaire. There are no
particular predictions in Study 2; certainly the model does not predict the higher overall success
rate after exposure to the discordant Stroop test.
Another notion relates to temptation and commitment. The Gul and Pesendorfer (2001)
model suggests that commitments may be helpful for overcoming the temptation to avoid an
unattractive task in the future. While the predictions depend on parameter values, if we view
weekly restrictions as reducing the choice set of the agent, so that there is effectively less
temptation, one might expect a positive impact on performance. The predictions in Study 2 are
less clear; however, if an agent who completes the discordant Stroop views this accomplishment
as a commitment to complete the task eventually, the model would predict less temptation on the
second day and so a higher completion rate overall.
38 Overall, one of the causes for apparent reversals in preferences over time seems to be the change in the saliency of the costs and benefits of the activity in question (Akerlof 1991). 39 Frederick, Loewenstein, and O’Donoghue (2002) provide a comprehensive review of empirical research on intertemporal choice, as well as an overview of related theoretical models. We would also like to mention two very new papers. Bisin and Hyndman (2008) investigate stopping-time problems and characterize behavior for exponential, naïve-hyperbolic and sophisticated-hyperbolic discounters. They show that an agent with standard time preferences who suffers from “temptation and self-control” would never be willing to self-impose a deadline. Suvorov and van de Ven (2008) develop a theory of self-regulation based on goal setting. They derive a condition under which proximal short-term goals are better than distal long-term goals.

24
Fudenberg and Levine (2006) propose a dual-self model in which a long-run self
effectively ties the hands of a series of myopic short-run selves, serving as a form of
commitment.40 In the first phase, the sophisticated long-run self chooses a commitment action
that affects any short-run self’s utility; in the second phase, the short-run self then chooses the
action (e.g., how much to spend). In a similar spirit to the Gul and Pesendorfer (2001) model, if
the restrictions in Study 1 serve to reduce the self-control problem by reducing the set of options,
restrictions could be beneficial. Since “increased cognitive load makes temptations harder to
resist” in this model, it predicts that students who are assigned the discordant Stroop in Study 2
should procrastinate and presumably be less successful.
Two other models instead consider self-control problems in the context of strength of will
or willpower.41 Bénabou and Tirole (2004) consider a model in which self-signaling leads to
self-regulation; the key is that people have imperfect knowledge of their strength of will, learning
it only through experience and having difficulty later remembering it. If one decides to attempt a
willpower activity in the first sub-period, he or she is faced with a (stronger) temptation in the
second sub-period and experiences a craving cost. Since people have only imperfect knowledge
of their own willpower, their choices serve as ‘signals’ about their types; a negative signal
(precedent) undermines self-confidence and willpower. While the predictions depend on
parameter values, one aspect of the model is that “the degree of self-control an individual can
achieve is shown to … decrease with prior external constraints.” A natural interpretation of this
result in our context is that a participant with weekly requirements in Study 1 will tend to be less
likely to complete the studying task. In Study 2, if the discordant Stroop test enhances a
40 Thaler and Shefrin (1981) present an early agency model of self-control, involving a farsighted planner and a myopic doer. 41 These models relate closely to the experimental work by Baumeister, Heatherton, and Tice (1994) and Baumeister and Vohs (2003), which finds that people who have just been required to exercise self-restraint tend to exhibit a lower degree of self-control.

25
student’s recall of their own strength of will, then students subjected to this test will tend to be
more successful on the second day.42
Ozdenoren, Salant, and Silverman (forthcoming) provide an explanatory model based on
willpower as a depletable (but renewable) resource. A willpower-constrained individual will
regard seemingly unrelated activities as linked because he or she uses the same cognitive
resources to exercise self-control in different activities. If willpower is depleted during one part
of the week and replenished during another, we could see weekly studying cycles in Study 1.
Weekly requirements will tend to induce better performance, since requirments substitute for
using willpower. In Study 2, students subjected to the discordant Stroop should tend to postpone
answering questions until the second day. We would expect more success for the weekday
group, as their willpower is presumably higher than the weekend group. However, this model
does not predict a higher success rate for those people who experienced the discordant Stroop.
To summarize our discussion, the predictions of the behavioral models often depend on
parameter values, many of which cannot be readily determined. In any case, none of the models
as currently constituted can explain all of our data. While we observe some people back-loading
in Study 1, the aggregate weekly profile over time of logged library study hours is fairly flat,
providing little evidence of procrastination. While this profile might imply that these students do
not have present-biased preferences, the profile is entirely consistent with a mild degree of
present bias if we incorporate the modest degree of uncertainty we find in our questionnaire.
Although Study 2 (and a number of studies in the psychology literature) provides
evidence that willpower is a resource that can be depleted, it is not clear whether the weekly
42 Of course, alternative explanations also exist; for example, one could see having experienced the discordant Stroop as a psychological ‘sunk cost’.

26
cycles in Study 1 reflect the depletion of willpower, changes in the opportunity cost of studying
or some other influence. Nevertheless, the opportunity-cost story would be most consistent with
a difference in behavior during the workweek and during the weekend, rather than a daily
difference during the workweek. The individual data suggest that Monday is the favorite day for
logging study hours, even though we do not find significant differences for Monday-Wednesday
in our regression analysis. In addition, we see a significant decline in study hours on Thursday.
Regarding our behavioral interventions, we expected that students would procrastinate
and that weekly requirements would mitigate this tendency. If the weekly restrictions in Study 1
do not help much with self-control problems, the additional hurdles imposed should make
success less likely in this case. Study 2 provides evidence of the importance of willpower in
self-control problems. Finally, the effect in Study 2 of the discordant Stroop on performance on
the first day is consistent with all models that permit self-control to be linked with willpower or
cognitive load, with these data most in keeping with willpower models.
4.2 A calibration exercise
We use the results on uncertainty and the cost of studying from the questionnaire to
simulate the expected behavior for agents with different values of
!
" (either 1.0, 0.9, or 0.7) with
and without uncertainty over the cost of future studying.43 Appendix F shows how we calibrate
the cost function for study hours in a week; we describe how we estimate the weekly profile for
various parameter combinations and present the simulations in Appendix G.
43 The quasi-hyperbolic formulation from Laibson (1997) and O’Donoghue and Rabin (1999) for preferences across a stream of utilities, where ut is a person’s instantaneous utility in period t, is:
!
"t,Ut(u
t,u
t+1,...,uT ) # $tut+ % $&u&
&= t+1
T
' , where
!
0 < " and
!
" #1.
Here δ is the standard, time-consistent, exponential discount rate and β < 1 indicates a “bias for the present”.

27
We see that the calibrated cost function predicts a weekly profile that is essentially flat
for an exponential discounter (
!
" =1) without uncertainty. This pattern (which we observe in the
aggregate) is also predicted for an agent with mild time-inconsistency (
!
" = 0.9, as suggested by
Shapiro, 2005 and Meier and Sprenger, 2010) and uncertainty. However, when we instead use
the value of
!
" = 0.7, as suggested by McClure et al. (2007) and Laibson et al. (2007), the model
predicts that even with uncertainty, studying hours increase sharply over time. Thus, while the
aggregate pattern that we observe is not fundamentally inconsistent with the quasi-hyperbolic
models, it appears to rule out population values for
!
" that are substantially less than 1.
4.3. Penalties and behavior
We now wish to discuss the differences between the results in Study1 and those found in
Ariely and Wertenbroch (2002). Some critical differences include the likelihood of completion
without any deadlines, the threshold nature of the interim deadlines, and the ‘soft’ penalties in
their study. For those people who are in a class at MIT, not turning in a term paper will result in
an extremely bad outcome; thus, everyone completes the overall task, with performance (but not
completion) affected by the characteristics of the various deadlines. In their proofreading study,
one can turn in the project at any point, regardless of whether one has finished the task; payment
only depends on the amount and quality of the work done, with a small penalty for being late.
By comparison, in Study 1 the consequence of failure is simply not receiving $95, but there are
no shades of gray involved. We had expected that this strict penalty would serve as a stronger
incentive for people to avoid procrastination. While Ariely and Wertenbroch (2002) provide an
‘existence proof’ that deadlines can be beneficial,44 our findings suggest that this is not always
44 However, Amir and Ariely (2008) find that discrete progress markers may “generate complacency, sway motivation away from the end goal, and decrease performance in the task” when the distance to the goal is certain, as is the case in Study 1.

28
the case.
Of course, these are entirely different environments. An open question is which pertains more
to the field. In many environments where procrastination may matter a lot, there is a more
continuous relationship between effort and performance. For example, a student’s grade on an
exam will typically not be either 0 or 100 depending on the degree of procrastination; however, it
may well determine whether the student passes or fails a course. Similarly, contracts may
contain performance penalties for being late. On the other hand, whether or not one misses one’s
flight is a binary outcome, as is (in most cases) a submission deadline for a conference or a
special issue. This is even true in sports, as a professional golfer who misses a tee time will be
disqualified. Our view is that both the Ariely and Wertenbroch (2002) framework and our own
are representative of important economic settings, so that it is important to delineate effects in
each case, as well as in others.45 While the Ariely and Wertenbroch study is fine to establish the
existence of benefits from interim deadlines, but it may not help much when it comes to
identifying parameters; while we could re-run our study with a $80 (or $150) payoff, but it seems
difficult to exogenously adjust their approach.
To summarize our discussion, the predictions of the behavioral models often depend on
parameter values, many of which cannot be readily determined. In any case, none of the models
as currently constituted can explain all of our data. First, there is no explicit explanation in these
models for the strong day-of-the-week effect found in both Study 1 and Study 2, although to the
extent that this reflects differences in opportunity costs, enhanced versions of the models could
incorporate this feature. Second, while we observe some people back-loading in Study 1, the
45 While the Ariely and Wertenbroch study is fine to establish the existence of benefits from interim deadlines, but it may not help much when it comes to identifying parameters; while we could re-run our study with a $80 (or $150) payoff, but it seems difficult to exogenously adjust their approach.
29
aggregate weekly profile over time of logged library study hours is fairly flat, providing little
evidence of procrastination. While this profile might imply that these students do not have
present-biased preferences, the profile is entirely consistent with a mild degree of present bias if
we incorporate the modest degree of uncertainty we find in our questionnaire. Third, Study 2
provides evidence of the importance of willpower in self-control problems.
The behavioral interventions that we attempted led to results that surprised us to some
degree. In Study 1, we thought that well-chosen deadlines would help people to overcome their
tendency to procrastinate and be more likely to complete the studying task than people not facing
restrictions; however, we find the opposite result. In Study 2, while we do find that the
discordant Stroop tends to induce people to delay more of the task until the second day, the
overall success rate is actually higher for the people who faced the willpower-depleting Stroop
on the first day.
5. CONCLUSION
Our study is one of the first to provide empirical evidence concerning procrastination,
willpower, and monetary incentives in tasks involving duration. Since it is exploratory work, we
did not expect to fully resolve all of the issues present in this regard. Nevertheless, we identify a
number of interesting patterns, provide data and feedback in relation to the relevant theoretical
models, and suggest follow-up studies to other researchers. We find evidence of willpower
depletion, as well as behavior suggestive of self-reputation considerations. The limited evidence
of back-loading suggests that the overall degree of present bias in our sample is not severe. Our
sense is that procrastination is not a simple phenomenon and none of the current models fully
capture the mechanisms through which procrastination occurs.

30
A number of puzzles remain. For example, while the discordant Stroop exercise did
deplete willpower on the first day, a natural prediction would seem to be that this depletion
would reduce overall success rates. Yet, overall success rates were higher for the willpower-
depleted group. Is exerting willpower self-signaling or does this result represent some sort of
commitment due to having suffered through this exercise, inducing the determination to
complete the task? How much domain specificity or crossover from cognitive load is there, in
the sense of Ozdenoren, Salant, and Silverman (forthcoming) or Fudenberg and Levine (2006)?
Have we identified differences in procrastination and willpower across gender, particularly in
terms of differences according to whether a task is long or short in duration?
The fact that the behavioral interventions in both studies were ineffective points out the
lack of existing data on how incentives affect behavior on tasks involving significant duration.
Our Study 1 results suggest that commitment devices (at least externally-imposed ones) may in
fact be counter-productive if they involve imposing additional hurdles to overcome. That our
studying task and the tasks considered by Ariely and Wertenbroch (2002) produce decidedly
different results suggests that the tendency to procrastinate varies significantly with incentives
and context. Further, in relation to the effectiveness of commitment devices, we strongly suspect
that details matter. In some cases, there may be a preference for flexibility while in other cases
there may be a preference for commitment. The issue of how to overcome self-control problems
has important economic consequences and it seems that there is not a simple answer.
It is quite clear that our results are only a beginning. We consider the area of time
structuring, procrastination, and incentives to be just coming into its first full flowering. We
hope that researchers in this area can build upon our results in conducting both more empirical
research and more theoretical work. Our studies could provide motivation for the design of other

31
studies aimed at mapping out the boundaries of effective deadlines, and could form the starting
point for designing a series of studies to test the various behavioral theories mentioned, as well
as others yet to be formulated.
REFERENCES
Ainslie, G. (1992), Picoeconomics: The Interaction of Successive Motivational States within the Individual, Cambridge: Cambridge University Press.
Akerlof, G., (1991), “Procrastination and Obedience,” American Economic Review, 81, 1-19. Amir O. and D. Ariely (2008), “Resting on Laurels: The Effects of Discrete Progress Markers as
SubGoals on Task Performance and Preferences,” Journal of Experimental Psychology: Learning, Memory, and Cognition, 34, 1158-1171.
Angrist, J. and V. Lavy (2009), "The Effects of High Stakes High School Achievement Awards: Evidence from a Randomized Trial," American Economic Review, 99, 1384–1414.
Angrist, J., D. Lang, and P. Oreopoulos (2009), “Incentives and Services for College Achievement: Evidence from a Randomized Trial,” American Economic Journal: Applied Economics, 1, 136-163.
Ariely, D. and K. Wertenbroch (2002), “Procrastination, Deadlines, and Performance: Self-Control by Precommitment,” Psychological Science, 13, 219-224.
Ashraf, N., D. Karlan, and W. Yin. "Tying Odysseus to the Mast: Evidence from a Commitment Savings Product in the Philippines,” Quarterly Journal of Economics 121, 635-672.
Baumeister, R., T. Heatherton, and D. Tice (1994), Losing control: How and why people fail at self-regulation, San Diego: Academic Press.
Baumeister, R. and K. Vohs (2003), “Willpower, choice, and self-control, in Time and decision, G. Loewenstein, D. Read, and R. Baumeister, eds., New York: Russell Sage Foundation
Bénabou, R. and J. Tirole (2004) “Willpower and personal rules,” Journal of Political Economy, 112, 848-886.
Bisin, A. and K. Hyndman (2008), “Procrastination, Self-imposed Deadlines and Other Commitment Devices: Theory and Experiment,” mimeo.
Burger, N. and J. Lynham (forthcoming), “Betting on Weight Loss… and Losing: Personal Gambles as Commitment Mechanisms,” Applied Economics Letters.
Burger, N., G. Charness, and J. Lynham (2008), “Three Field Experiments on Procrastination and Willpower,” mimeo.
Charness, G. and U. Gneezy (2009), “Incentives to Exercise,” Econometrica, 77, 392-406. Cook, T. and D. Campbell (1979), Quasi-experimentation: design & analysis issues for field
settings, Boston: Houghton Mifflin. DellaVigna, S. and U. Malmendier (2004), “Contract Design and Self-Control,” Quarterly
Journal of Economics, 119, pp.353-402. Ellis, A. and W. Knaus (1977), Overcoming Procrastination, Institute for Rational Living: New
York. Frederick, S., G. Loewenstein, and T. O’Donoghue (2002), “Time Discounting and Time
Preference: A Critical Review,” Journal of Economic Literature, 40, 351-401.

32
Fudenberg, D. and D. Levine (2006), “A Dual-Self Model of Impulse Control,” American Economic Review, 96, 1449-1476.
Gailliot, M., Baumeister, R., DeWall, C., Maner, J., Plant, E., Tice, D., Brewer, L., and B. Schmeichel (2007), “Self-control relies on glucose as a limited energy source: Willpower is more than a metaphor” Journal of Personality and Social Psychology, 92, 325-336.
Glasnapp, D. and J. Poggio (1985), Essentials of Statistical Analysis for the Behavioral Sciences, Columbus: Merrill.
Greiner, B. (2004), “An Online Recruitment System for Economic Experiments,” in Kurt Kremer, Volker Macho (Hrsg.): Forschung und wissenschaftliches Rechnen, GWDG Bericht 63, Ges. Für Wiss. Datenverarbeitung: Göttingen, 79-93.
Gul, F. and W. Pesendorfer (2001), “Temptation and Self-Control,” Econometrica, 69, 1403–35. Houser, D. D. Reiley, and M. Urbancic (2007), “Checking out temptation,” mimeo. Houser, D., D. Schunk, J. Winter, and E. Xiao (2009), “Temptation, commitment, and self-
control in he laboratory,” mimeo. Laibson, D. (1997), “Golden Eggs and Hyperbolic Discounting,” Quarterly Journal of
Economics, 112, 443-477. Laibson, D., A. Repetto, and J. Tobacman (2007), “Estimating Discount Functions with
Consumption Choices over the Lifecycle,” mimeo. MacLeod, C. (1991), “Half a century of research on the Stroop effect: An integrative review,”
Psychological Bulletin, 109, 163-203. McClure, S., K. Ericson, D. Laibson, G. Loewenstein, and J. Cohen (2007), “Time Discounting
for Primary Rewards,” Journal of Neuroscience, 27, 5796–5804. Meier, S. and C. Sprenger (2010), “Present-Biased Preferences and Credit Card Borrowing,”
American Economic Journal: Applied Economics, 2, 193-210. O’Donoghue, T. and Rabin, M. (1999), “Doing It Now or Later,” American Economic Review,
89, 103-124. Ozdenoren, E., S. Salant, and D. Silverman (forthcoming), “Willpower and the Optimal Control
of Visceral Urges,” Journal of the European Economic Association. Shapiro, J. (2005), “Is there a daily discount rate? Evidence from the food stamp nutrition cycle,”
Journal of Public Economics, 89, 303–325. Solomon, L. and Rothblum, E. (1984), “Academic Procrastination: Frequency and Cognitive-
behavioral Correlates,” Journal of Counseling Psychology, 31, 503-509. Stroop, J. (1935), “Studies of interference in serial verbal reactions,” Journal of Experimental
Psychology,18, 643-662. Strotz, R. (1955), “Myopia and Inconsistency in Dynamic Utility Maximization,” Review of
Economic Studies, 23, 165-180. Suvorov, A. and J. van de Ven (2008), “Goal-setting as a Self-regulation Mechanism,” mimeo. Thaler, R. and H. Shefrin, “An Economic Theory of Self-control,” Journal of Political Economy,
89, 392-406. Wertenbroch, K. (1998), “Consumption Self-control by Rationing Purchase Quantities of
Virtue and Vice,” Marketing Science, 17, 317-337.

1
APPENDIX A – INDIVIDUAL STUDY HOURS IN STUDY 1
WEEKLY STUDY HOURS IN NO-WEEKLY GROUP, BY INDIVIDUAL
ID Female Week 1 Week 2 Week 3 Week 4 Week 5 Total 1 1 0 0 0 0 0 0.00 2 1 12.31 20.15 13.82 14.44 14.40 75.12 3 0 9.18 14.78 4.12 1.53 0 29.61 4 0 11.16 15.16 16.89 17.92 14.30 75.42 5 1 8.17 9.97 2.46 9.26 0 29.85 6 0 16.70 13.52 6.66 17.47 20.90 75.25 7 1 1.83 0 0 0 0 1.83 8 1 2.15 18.75 4.35 31.19 18.63 75.07 9 1 9.34 6.77 0 2.74 14.31 33.17 10 1 10.27 0.67 3.43 0 0 14.36 11 1 17.72 17.74 20.98 10.01 8.74 75.18 12 1 8.69 18.11 17.43 10.24 20.64 75.11 13 1 12.13 12.43 5.62 5.03 39.93 75.13 14 1 2.82 0 0 0 0 2.82 15 0 18.11 11.99 12.42 18.20 14.49 75.21 16 1 12.54 13.74 10.16 19.61 19.26 75.30 17 0 14.14 22.03 18.05 14.30 7.27 75.80 18 1 0 12.87 13.76 2.74 0 29.38 19 0 16.37 6.58 27.47 8.33 16.63 75.37 44 1 13.69 9.77 13.50 13.05 25.07 75.08 45 1 14.98 12.14 16.97 22.90 8.21 75.19 46 1 24.56 28.81 16.97 5.46 0 75.80 47 1 17.68 13.94 11.94 15.77 16.56 75.89 48 1 1.33 0 0 0 0 1.33 49 1 3.81 14.67 12.08 27.67 17.48 75.72 50 1 16.32 15.49 9.53 14.44 19.38 75.16 51 1 15.19 17.00 11.51 14.79 16.79 75.27 52 1 6.20 11.79 13.74 23.09 20.56 75.38 53 1 5.71 15.80 6.40 29.69 17.58 75.17 54 1 28.93 24.16 19.03 3.33 0 75.46 55 0 1.07 3.79 0 0 0 4.87 56 1 0 0 0 0 0 0.00 57 0 12.93 0.99 0 0 0 13.92 58 0 10.64 0 3.53 0 0 14.17 59 0 7.60 0 0 0 0 7.60 60 1 16.93 19.94 17.73 20.99 0 75.60

2
WEEKLY STUDY HOURS IN WEEKLY GROUP, BY INDIVIDUAL
ID Female Week 1 Week 2 Week 3 Week 4 Week 5 Total 20 0 0 0 0 0 0 0.00 21 0 0 0 0 0 0 0.00 22 0 12.34 11.62 0.02 0 0 23.98 23 0 19.07 15.41 15.86 13.10 13.29 76.74 24 0 14.97 17.59 8.66 12.72 21.11 75.05 25 0 0 1.52 0 0 0 1.52 26 1 19.70 14.12 12.74 7.08 21.47 75.11 27 1 13.84 11.67 11.12 7.40 0 44.03 28 0 14.70 13.85 8.35 27.88 11.19 75.97 29 0 12.22 3.21 0 0 0 15.42 30 0 0 0 0 0 0 0.00 31 1 18.02 8.23 6.65 15.43 23.89 72.21 32 1 0 0 0 0 0 0.00 33 0 30.06 16.99 12.86 15.11 0 75.02 34 0 12.02 12.07 12.21 22.59 16.24 75.13 35 1 0 0 0 0 0 0.00 36 1 13.53 13.85 19.62 10.30 17.79 75.09 37 0 0 0 0 0 0 0.00 38 1 0 0 0 0 0 0.00 39 0 0 0 0 0 0 1.73 40 0 0 0 0 0 0 0.00 41 0 11.81 4.52 0 0 0 16.33 42 1 5.31 0 0 0 0 5.31 43 1 15.55 13.10 10.23 16.69 20.50 76.06 61 0 12.43 3.82 0 0 0 16.25 62 1 13.02 15.41 10.49 12.42 23.80 75.14 63 1 15.44 28.28 4.82 9.00 17.59 75.13 64 1 14.81 13.60 9.98 13.20 23.67 75.26 65 1 0 0 0 0 0 0.00 66 0 1.41 0 0 0 0 1.41 67 1 0.95 0 0 0 0 0.95 68 1 12.53 12.32 11.93 16.05 2.34 55.18 69 0 14.40 1.61 0 0 0 16.01 70 1 15.60 12.30 7.70 16.07 6.28 57.95 71 0 17.40 7.24 20.59 24.37 5.44 75.04 72 1 19.58 15.91 6.25 21.57 12.07 75.37 73 1 18.36 11.05 16.21 7.83 21.57 75.02 74 1 13.22 11.87 1.77 22.24 26.02 75.11

3
WEEKLY STUDY HOURS IN NO-WEEKLY GROUP, BY INDIVIDUAL (WINNERS)
ID Female Week 1 Week 2 Week 3 Week 4 Week 5 Total 2 1 12.31 20.15 13.82 14.44 14.40 75.12 4 0 11.16 15.16 16.89 17.92 14.30 75.42 6 0 16.70 13.52 6.66 17.47 20.90 75.25 8 1 2.15 18.75 4.35 31.19 18.63 75.07 11 1 17.72 17.74 20.98 10.01 8.74 75.18 12 1 8.69 18.11 17.43 10.24 20.64 75.11 13 1 12.13 12.43 5.62 5.03 39.93 75.13 15 0 18.11 11.99 12.42 18.20 14.49 75.21 16 1 12.54 13.74 10.16 19.61 19.26 75.30 17 0 14.14 22.03 18.05 14.30 7.27 75.80 19 0 16.37 6.58 27.47 8.33 16.63 75.37 44 1 13.69 9.77 13.50 13.05 25.07 75.08 45 1 14.98 12.14 16.97 22.90 8.21 75.19 46 1 24.56 28.81 16.97 5.46 0 75.80 47 1 17.68 13.94 11.94 15.77 16.56 75.89 49 1 3.81 14.67 12.08 27.67 17.48 75.72 50 1 16.32 15.49 9.53 14.44 19.38 75.16 51 1 15.19 17.00 11.51 14.79 16.79 75.27 52 1 6.20 11.79 13.74 23.09 20.56 75.38 53 1 5.71 15.80 6.40 29.69 17.58 75.17 54 1 28.93 24.16 19.03 3.33 0 75.46 60 1 16.93 19.94 17.73 20.99 0 75.60
WEEKLY STUDY HOURS IN WEEKLY GROUP, BY INDIVIDUAL (WINNERS)
ID Female Week 1 Week 2 Week 3 Week 4 Week 5 Total 23 0 19.07 15.41 15.86 13.10 13.29 76.74 24 0 14.97 17.59 8.66 12.72 21.11 75.05 26 1 19.70 14.12 12.74 7.08 21.47 75.11 28 0 14.70 13.85 8.35 27.88 11.19 75.97 33 0 30.06 16.99 12.86 15.11 0 75.02 34 0 12.02 12.07 12.21 22.59 16.24 75.13 36 1 13.53 13.85 19.62 10.30 17.79 75.09 43 1 15.55 13.10 10.23 16.69 20.50 76.06 62 1 13.02 15.41 10.49 12.42 23.80 75.14 63 1 15.44 28.28 4.82 9.00 17.59 75.13 64 1 14.81 13.60 9.98 13.20 23.67 75.26 71 0 17.40 7.24 20.59 24.37 5.44 75.04 72 1 19.58 15.91 6.25 21.57 12.07 75.37 73 1 18.36 11.05 16.21 7.83 21.57 75.02 74 1 13.22 11.87 1.77 22.24 26.02 75.11

4
APPENDIX B - Patterns In Study Hours, Study 1 Non-Winners

5
APPENDIX C – Individual Day of Week Data
No-weekly group, all
Day of week # of times most # of times second # of times 1st or 2nd Monday 11 (32.4%) 9 (29.0%) 20 (58.8%) Tuesday 9 (26.5%) 9 (29.0%) 18 (52.9%)
Wednesday 9 (26.5%) 5 (16.1%) 14 (41.2%) Thursday 3 (8.8%) 4 (12.9%) 7 (20.6%)
Friday 0 (0.0%) 0 (0.0%) 0 (0.0%) Saturday 0 (0.0%) 1 (3.2%) 1 (2.9%) Sunday 2 (5.9%) 3 (9.7%) 5 (14.7%)
36 people in this group; 2 people logged no hours, 3 others only logged hours on 1 day
Weekly group, all
Day of week # of times most # of times second # of times 1st or 2nd Monday 11 (37.9%) 4 (16.0%) 15 (51.7%) Tuesday 6 (20.7%) 4 (16.0%) 10 (34.5%)
Wednesday 4 (13.8%) 7 (28.0%) 11 (37.9%) Thursday 3 (10.3%) 1 (4.0%) 4 (13.8%)
Friday 1 (3.4%) 2 (8.0%) 3 (10.3%) Saturday 1 (3.4%) 3 (12.0%) 4 (13.8%) Sunday 3 (10.3%) 4 (16.0%) 7 (24.1%)
38 people in this group; 9 people logged no hours, 4 others only logged hours on 1 day
Combined, all
Day of week # of times most # of times second # of times 1st or 2nd Monday 22 (34.9%) 14 (25.0%) 36 (57.1%) Tuesday 15 (23.8%) 13 (23.2%) 28 (44.4%)
Wednesday 13 (20.6%) 12 (21.4%) 25 (39.7%) Thursday 6 (9.5%) 4 (7.1%) 10 (15.9%)
Friday 1 (1.6%) 2 (3.6%) 3 (4.8%) Saturday 1 (1.6%) 4 (7.1%) 5 (7.9%) Sunday 5 (7.9%) 7 (12.5%) 7 (11.1%) 74 people in total; 11 people logged no hours, 7 others only logged hours on 1 day

6
No-weekly group, winners
Day of week # of times most # of times second # of times 1st or 2nd Monday 7 (31.8%) 8 (36.4%) 15 (68.2%) Tuesday 4 (18.2%) 8 (36.4%) 12 (54.5%)
Wednesday 6 (27.3%) 3 (13.6%) 9 (40.9%) Thursday 3 (13.6%) 1 (4.5%) 4 (18.2%)
Friday 0 (0.0%) 0 (0.0%) 0 (0.0%) Saturday 0 (0.0%) 0 (0.0%) 0 (0.0%) Sunday 2 (9.1%) 2 (9.1%) 4 (18.2%)
22 people in this group
Weekly group, winners
Day of week # of times most # of times second # of times 1st or 2nd Monday 8 (53.3%) 2 (13.3%) 10 (66.7%) Tuesday 2 (13.3%) 4 (26.7%) 6 (40.0%)
Wednesday 2 (13.3%) 5 (33.3%) 7 (46.7%) Thursday 2 (13.3%) 1 (6.7%) 3 (20.0%)
Friday 0 (0.0%) 0 (0.0%) 0 (0.0%) Saturday 0 (0.0%) 2 (13.3%) 2 (13.3%) Sunday 1 (6.7%) 1 (6.7%) 2 (13.3%)
15 people in this group
Combined, winners
Day of week # of times most # of times second # of times 1st or 2nd Monday 15 (40.5%) 10 (27.0%) 25 (67.6%) Tuesday 6 (16.2%) 12 (32.4%) 18 (48.6%)
Wednesday 8 (21.6%) 8 (21.6%) 16 (43.2%) Thursday 5 (13.5%) 2 (5.4%) 7 (18.9%)
Friday 0 (0.0%) 0 (0.0%) 0 (0.0%) Saturday 0 (0.0%) 2 (5.4%) 2 (5.4%) Sunday 3 (8.1%) 3 (8.1%) 6 (16.2%)
37 people in total
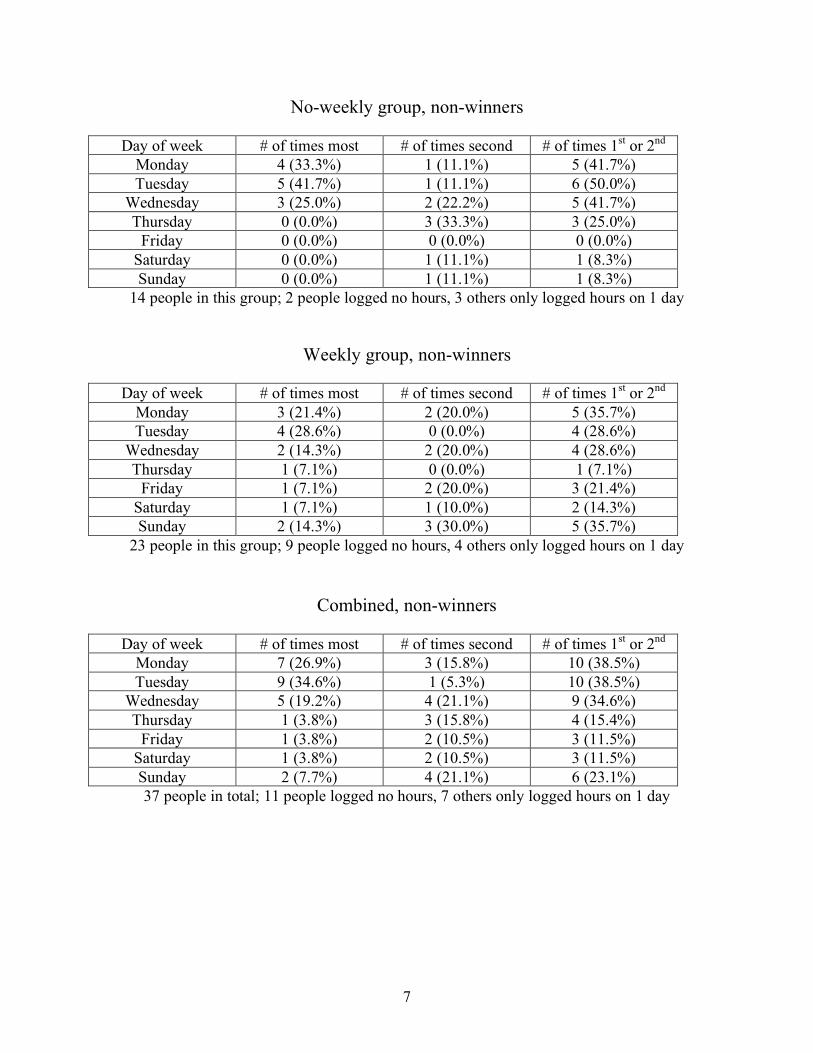
7
No-weekly group, non-winners
Day of week # of times most # of times second # of times 1st or 2nd Monday 4 (33.3%) 1 (11.1%) 5 (41.7%) Tuesday 5 (41.7%) 1 (11.1%) 6 (50.0%)
Wednesday 3 (25.0%) 2 (22.2%) 5 (41.7%) Thursday 0 (0.0%) 3 (33.3%) 3 (25.0%)
Friday 0 (0.0%) 0 (0.0%) 0 (0.0%) Saturday 0 (0.0%) 1 (11.1%) 1 (8.3%) Sunday 0 (0.0%) 1 (11.1%) 1 (8.3%)
14 people in this group; 2 people logged no hours, 3 others only logged hours on 1 day
Weekly group, non-winners
Day of week # of times most # of times second # of times 1st or 2nd Monday 3 (21.4%) 2 (20.0%) 5 (35.7%) Tuesday 4 (28.6%) 0 (0.0%) 4 (28.6%)
Wednesday 2 (14.3%) 2 (20.0%) 4 (28.6%) Thursday 1 (7.1%) 0 (0.0%) 1 (7.1%)
Friday 1 (7.1%) 2 (20.0%) 3 (21.4%) Saturday 1 (7.1%) 1 (10.0%) 2 (14.3%) Sunday 2 (14.3%) 3 (30.0%) 5 (35.7%)
23 people in this group; 9 people logged no hours, 4 others only logged hours on 1 day
Combined, non-winners
Day of week # of times most # of times second # of times 1st or 2nd Monday 7 (26.9%) 3 (15.8%) 10 (38.5%) Tuesday 9 (34.6%) 1 (5.3%) 10 (38.5%)
Wednesday 5 (19.2%) 4 (21.1%) 9 (34.6%) Thursday 1 (3.8%) 3 (15.8%) 4 (15.4%)
Friday 1 (3.8%) 2 (10.5%) 3 (11.5%) Saturday 1 (3.8%) 2 (10.5%) 3 (11.5%) Sunday 2 (7.7%) 4 (21.1%) 6 (23.1%) 37 people in total; 11 people logged no hours, 7 others only logged hours on 1 day

8
APPENDIX D: Questionnaire
1) Suppose that you are getting paid to study a total of 75 hours (in a room in the library) over a five-week period, but you will receive no payment if you don’t complete the 75 hours. Assuming that you plan to complete this study, how would you prefer to allocate your time during this period [in version 2: how do you think you would end up allocating your time during this period] in terms of hours per week? Take into account your studying preferences and your other activities during an average quarter.
Week Hours you would study 1 2 3 4 5
2) If you committed to complete a class project that required periodic work each week for
five weeks, how likely do you think it is that you wouldn’t complete it due to unexpected events in your life? 0% 10% 20% 30% 40% 50% 60% 70% 80% 90% 100%
Definitely Complete Definitely not Complete
3) For this question, assume that you are doing homework at home.
Would you rather do 1 hour and 30 minutes of homework at one sitting at home (with short breaks permitted), or instead spread out 1 hour and 30 minutes of homework over two sittings, one on each of two days?
Do 1 hour and 30 minutes in one sitting Spread 1 hour and 30 minutes over two sittings
Would you rather do 1 hour and 30 minutes of homework at one sitting at home (with short breaks permitted), or spread out 1 hour and 45 minutes of homework over two sittings, one on each of two days?
Do 1 hour and 30 minutes in one sitting Spread 1 hour and 45 minutes over two sittings
Would you rather do 1 hour and 30 minutes of homework at one sitting at home (with short breaks permitted), or spread out 2 hours of homework over two sittings, one on each of two days?
Do 1 hour and 30 minutes in one sitting Spread 2 hours over two sittings

9
4) Suppose that you planned to study 15 hours in a particular week. How would you allocate this time over the week, in terms of hours on each of Monday, Tuesday, Wednesday, Thursday, Friday, Saturday, and Sunday? Take into account your studying preferences and your other activities in an average week during the quarter.
Day of the Week Hours you would study
Monday Tuesday
Wednesday Thursday
Friday Saturday Sunday
5) Suppose you were offered a cash payment to sit in the library and study for a certain
amount of time. You can study whatever you want (as long as it is relevant to classes you are taking) and can choose the day of the week and the time of the day when you study. Your studying can be divided up however you want but it must all take place in one day between 8am and 10pm.
What is the minimum amount of cash you would be willing to accept in exchange for studying in the library for 1 hour? $___________
What is the minimum amount of cash you would be willing to accept in exchange for studying in the library for 2 hours? $___________
What is the minimum amount of cash you would be willing to accept in exchange for studying in the library for 4 hours? $___________
6) Now suppose you were offered a cash payment to sit in the library and study but instead
of completing the required studying in one day, you have a week to complete the studying. The library is open every day between 8am and 10pm.
What is the minimum amount of cash you would be willing to accept in exchange for studying in the library for 10 hours in one week? $___________
What is the minimum amount of cash you would be willing to accept in exchange for studying in the library for 20 hours in one week? $___________
What is the minimum amount of cash you would be willing to accept in exchange for studying in the library for 30 hours in one week? $___________

10
APPENDIX E – Time-of-day studying data
Density plots of number of subjects studying by time of day
Density plots of number of subjects studying by time of day

11
Table E1: Logged minutes of study, by portion of day and day of week
Day of week Morning Afternoon Evening Total Monday 3637 (8.9%) 19056 (46.8%) 18062 (44.3%) 40755 Tuesday 2047 (5.4%) 20343 (54.2%) 15171 (40.4%) 37561
Wednesday 4368 (10.8%) 20908 (51.9%) 14989 (37.2%) 40265 Thursday 1551 (5.4%) 14535 (50.2%) 12867 (44.4%) 28953
Friday 4395 (29.9%) 8368 (57.0%) 1928 (13.1%) 14691 Saturday 507 (4.2%) 9331 (77.3%) 2230 (18.5%) 12068 Sunday 619 (2.6%) 11752 (49.4%) 11416 (48.0%) 23787
The percentage of each day’s study minutes is shown in parentheses. Morning was from 8:00-12:00 on weekdays, 9:30-12:00 on Saturday, and 10:20 on Sunday, afternoon was from 12:00-6:00, and evening was from 6:00-12:00
except on Saturday, when the library closed at 11:00. On occasion, the library opened at 7:30 during the week.

12
APPENDIX F – Estimating the cost of studying
To calibrate the studying cost function, we surveyed students about how much they would need to be compensated in order to study in the library for 10, 20 or 30 hours in a week (Appendix D). Using a series of likelihood ratio tests to compare specifications of the cost function, we concluded that a simple convex cost function of the form
!
c h( ) =" # h2is preferred. We estimated
!
" to be approximately 0.547 based on the regression results presented below.
Table F1 – Cost Function Estimation and Comparison Independent variable = Cost
Dependent Variables
(1) (2)
(3)
7.383 5.01 . Hours (34.909) (11.732) .
0.128 0.359 0.547*** Hours Squared (3.356) (0.443) (0.104)
0.005 . . Hours Cubed (0.075) . .
p-value on Likelihood Ratio test
. 0.944 0.662
Observations 204 204 204
Adjusted R2 0.11 0.11 0.12 Standard errors in parentheses. *, **, and *** indicate significance at the 10%, 5%, and 1% level, respectively (two-tailed tests). We omit interaction terms, as these are not significant and do not qualitatively change the main results.
The figure below shows the mean cost estimates from the questionnaire for 10, 20 and 30 hours plotted alongside the costs predicted by the chosen cost function:
!
c h( ) = 0.547h2 .

13

14
APPENDIX G – Estimating weekly study-hour profiles in Study 1
Take the following quasi-hyperbolic objective function:
!
minht
c St,h
t( ) + " #$% tc S$ ,h$( )$= t+1
T
&
where c(.) is the cost of studying for h hours in week t. δ is the standard, time-consistent, exponential discount rate and β < 1 indicates a bias for the present. We assume that agents are “sophisticated” (“naïve” behavior is not that different for the parameters we are using). S is the stock of remaining hours:
!
St+1 = S
t" h
t
The student tries to minimize the cost of studying subject to the following constraint:
!
s.t. ht
t=1
T
" = S0
= 75
In other words, the student must “deplete” the stock of 75 studying hours (i.e. achieve the target). We can solve this problem numerically using the following dynamic programming equation (Harris and Laibson, 2001):
!
W St( ) =min
h
c St,h( ) + " W S
t+1( ) #C St+1( ) 1#$( )[ ]{ }
where
!
C St( ) " c St , # S
t( )( ) and
!
ht
= " St( ) is the optimal amount of studying in week t with stock
St of hours remaining given that the student knows that his future selves will choose to study
!
ht+" = # S
t+"( ) in all future periods. To add in uncertainty, we assume that all future time periods are subject to a random i.i.d. shock zt:
!
zt =
1+ " with probability p1# p(1+ ")
1- p with probability 1- p
$
% &
' &
Based on the questionnaires handed out to students, we estimate that Δ=1 and p=0.1 (i.e. there is a 10% chance that studying in the future will be twice as difficult compared to the expected cost of studying). The objective function is now:
!
minht
c St,h
t( ) + " #$% tc S$ ,z$h$( )$= t+1
T
&
The future uncertainty will cause the student to frontload on studying, similar to a precautionary savings model in macroeconomics (Leland, 1968). To solve the two problems, we use the

15
following cost function:
!
c ht( ) = 0.547h
t
2 . This cost function is derived from questionnaires handed out to students (see Appendix F).
Simulation of study hours for different parameter values
APPENDIX REFERENCES
Harris, C. and D. Laibson (2001), “Dynamic choices of hyperbolic consumers,” Econometrica,
69, 935-957. Leland, H. (1968), “Saving and Uncertainty: The Precautionary Demand for Saving,” Quarterly
Journal of Economics, 82, 465-473.