field evaluation of a portable gyratory compactor …€¦ · · 2016-12-08field evaluation of a...
TRANSCRIPT

FIELD EVALUATION OF A PORTABLE GYRATORY COMPACTOR
Final Report
SPR 375
by
Rita B. Leahy, PhD, PE, Associate ProfessorWilliam D. Gilchrist, Graduate Research Assistant
Oregon State University
for
Oregon Department of TransportationResearch Group
200 Hawthorne Ave. SE, Suite B-240Salem, OR 97301-5192
and
Federal Highway AdministrationWashington, D.C. 20590
June 2002


Technical Report Documentation Page
1. Report No. FHWA-OR-RD-02-18
2. Government Accession No. 3. Recipient’s Catalog No.
4. Title and Subtitle
FIELD EVALUATION OF A PORTABLE GYRATORY COMPACTOR
5. Report Date June 2002
6. Performing Organization Code
7. Author(s) Rita B. Leahy, PhD, PE, Associate Professor and William D. Gilchrist, Graduate Research Assistant, Oregon State University
8. Performing Organization Report No.
9. Performing Organization Name and Address
Oregon Department of Transportation Research Group 200 Hawthorne Ave. SE, Suite B-240 Salem, Oregon 97301-5192
10. Work Unit No. (TRAIS)
11. Contract or Grant No.
SPR 375
12. Sponsoring Agency Name and Address
Oregon Department of Transportation Research Group and Federal Highway Administration 200 Hawthorne Ave. SE, Suite B-240 400 Seventh Street SW Salem, Oregon 97301-5192 Washington, D.C. 20590
13. Type of Report and Period Covered
Final Report
14. Sponsoring Agency Code
15. Supplementary Notes 16. Abstract
Application of quality management concepts to asphalt paving evolved because recipe specifications frequently proved inadequate for ensuring pavement performance. Quality management of asphalt concrete is founded on the premise that the producer controls the end-quality of the product, including the in-place void content on which pavement performance is highly dependent. In its quality management program the Oregon Department of Transportation (ODOT) originally used the Marshall hammer, since neither the Hveem (kneading) nor Superpave prototype compactor was suitable for field quality control/assurance (QC/QA). Post-SHRP research led to the development of truly portable gyratory compactors, ie, those of 70 kg to 140 kg mass. Although selecting and proportioning materials as well as compaction are integral parts of the Superpave technology, there is some apprehension given the fact that no strength test is required at low traffic levels.
Given ODOT’s long and successful use of the Hveem method of mix design, the primary objective of this research was to assess the effectiveness of a portable gyratory compactor for field quality control purposes. A secondary objective was to determine the quality of Superpave mixes as measured by Hveem stability. To achieve these objectives plant-produced material was sampled during construction and compacted with both portable and prototype gyratory compactors. Shortly after construction, cores were extracted. All samples (gyratory compacted and field cores) were subsequently tested in the Hveem stabilometer.
The following conclusions are noteworthy: Overall, the operational characteristics of the portable gyratory, including calibration and maintenance, were satisfactory. There was essentially no difference between the portable and prototype gyratory compactors as measured by air void content of 150 mm samples. In no case was the difference in air void content greater than 0.5 percent. Comparison of 100 mm and 150 mm samples compacted in the prototype gyratory was instructive in that the latter were consistently lower in air void content, typically by 0.5 to 1.5 percent. The air void content of plant mix samples compacted to Ndesign gyrations was consistently lower than that of the field cores, generally by at least 2 percent. The range in air void content of plant mix samples compacted to Ndesign gyrations was 3.0 to 8.8 percent, whereas the range in air void content of the field cores was 6.8 to 9.1 percent. The data indicate that there is virtually no difference in air void content between 100 mm and 150 mm field cores. Field cores generally had lower stabilities than did gyratory- or kneading-compacted samples. However, there was virtually no difference in the stability of lab compacted samples, regardless of gyratory type or specimen diameter. None of the field cores, regardless of project, met ODOT’s minimum Hveem stability criterion of 35.
The data gathered in this research indicate that there is virtually no difference between the prototype (Pine) and portable (Test Quip) gyratory compactors as measured by air void content and Hveem stability. Accordingly, it is recommended that ODOT consider the use of the portable gyratory for QC/QA purposes, assuming that the more fundamental issues of Superpave mix design are resolved. Since Hveem stability of field cores did not meet ODOT’s minimum criterion of 35, early and continuous monitoring of the field performance is imperative. As part of the performance monitoring, it is recommended that wheel-path air void content be periodically measured to confirm/refute the Ndesign concept.
17. Key Words Superpave, Ndesign, gyratory compactor/compaction, kneading compactor/compaction, Hveem stability, air void content, quality control/ assurance
18. Distribution Statement
Copies available from NTIS, and online at http://www.odot.state.or.us/tddresearch
19. Security Classification (of this report) Unclassified
20. Security Classification (of this page) Unclassified
21. No. of Pages 64
22. Price
Technical Report Form DOT F 1700.7 (8-72) Reproduction of completed page authorized � Printed on recycled paper
i

ii
SI* (MODERN METRIC) CONVERSION FACTORS APPROXIMATE CONVERSIONS TO SI UNITS APPROXIMATE CONVERSIONS FROM SI UNITS
Symbol When You Know Multiply By To Find Symbol Symbol When You Know Multiply By To Find Symbol
LENGTH LENGTH In Inches 25.4 Millimeters Mm mm Millimeters 0.039 inches in Ft Feet 0.305 Meters M m Meters 3.28 feet ft Yd Yards 0.914 Meters M m Meters 1.09 yards yd Mi Miles 1.61 Kilometers Km km Kilometers 0.621 miles mi
AREA AREA in2 Square inches 645.2 Millimeters mm2 mm2 millimeters squared 0.0016 square inches in2
ft2 Square feet 0.093 meters squared M2 m2 meters squared 10.764 square feet ft2
yd2 Square yards 0.836 meters squared M2 ha Hectares 2.47 acres ac Ac Acres 0.405 Hectares Ha km2 kilometers squared 0.386 square miles mi2
mi2 Square miles 2.59 Kilometers Km2 VOLUME VOLUME mL Milliliters 0.034 fluid ounces fl oz
fl oz Fluid ounces 29.57 Milliliters ML L Liters 0.264 gallons gal Gal Gallons 3.785 Liters L m3 meters cubed 35.315 cubic feet ft3
ft3 Cubic feet 0.028 meters cubed m3 m3 meters cubed 1.308 cubic yards yd3
yd3 Cubic yards 0.765 meters cubed m3 MASS NOTE: Volumes greater than 1000 L shall be shown in m3 . g Grams 0.035 ounces oz
MASS kg Kilograms 2.205 pounds lb Oz Ounces 28.35 Grams G Mg Megagrams 1.102 short tons (2000 lb) T Lb Pounds 0.454 Kilograms Kg TEMPERATURE (exact) T Short tons (2000 lb) 0.907 Megagrams Mg �C Celsius temperature 1.8C + 32 Fahrenheit �F
TEMPERATURE (exact)
�F Fahrenheit temperature
5(F-32)/9 Celsius temperature
�C
* SI is the symbol for the International System of Measurement (4-7-94 jbp)

ACKNOWLEDGEMENTS
The authors would like to thank the members of the ODOT Research Staff (Liz Hunt) and Pavement Quality Staff (Mike Remily and Dick Dominick) for their invaluable assistance in the conduct of this research and in the preparation of this report. Also, the authors would like to express their appreciation to the paving contractors (Bracelm-Yaeger of Coos Bay, JC Compton of Portland, Morse Brothers of Corvallis, and Morrill Asphalt Paving of Wenatchee, Washington), without whose cooperation and facilities this work could not have been done.
DISCLAIMER
This document is disseminated under the sponsorship of the Oregon Department of Transportation and the United States Department of Transportation in the interest of information exchange. The State of Oregon and the United States Government assume no liability of its contents or use thereof.
The contents of this report reflect the view of the authors who are solely responsible for the facts and accuracy of the material presented. The contents do not necessarily reflect the official views of the Oregon Department of Transportation or the United States Department of Transportation.
The State of Oregon and the United States Government do not endorse products of manufacturers. Trademarks or manufacturers’ names appear herein only because they are considered essential to the object of this document.
This report does not constitute a standard, specification, or regulation.
iii

iv

FIELD EVALUATION OF A PORTABLE GYRATORY COMPACTOR
TABLE OF CONTENTS
1.0 INTRODUCTION..................................................................................................................1
1.1 BACKGROUND .................................................................................................................11.2 OBJECTIVES......................................................................................................................21.3 MIX DESIGN OVERVIEW................................................................................................4
1.3.1 Superpave.....................................................................................................................41.3.2 Hveem..........................................................................................................................5
2.0 EXPERIMENTAL DESIGN.................................................................................................7
2.1 FIELD PROJECTS ..............................................................................................................72.2 SAMPLING AND TESTING..............................................................................................7
3.0 PROPERTIES OF PLANT-PRODUCED HMAC .............................................................9
3.1 GARDINER PROJECT.......................................................................................................93.1.1 Air Void Content..........................................................................................................93.1.2 Hveem Stability ...........................................................................................................9
3.2 OR 58/U.S. 97 PROJECT..................................................................................................153.2.1 Air Void Content........................................................................................................153.2.2 Hveem Stability .........................................................................................................15
3.3 CORVALLIS PROJECT ...................................................................................................223.3.1 Air Void Content........................................................................................................223.3.2 Hveem Stability .........................................................................................................22
3.4 HERMISTON PROJECT ..................................................................................................293.4.1 Air Void Content........................................................................................................293.4.2 Hveem Stability .........................................................................................................29
4.0 ANALYSIS AND DISCUSSION ........................................................................................37
4.1 AIR VOID CONTENT......................................................................................................394.2 HVEEM STABILITY........................................................................................................42
5.0 CONCLUSIONS AND RECOMMENDATIONS.............................................................49
5.1 CONCLUSIONS................................................................................................................495.2 RECOMMENDATIONS...................................................................................................51
6.0 REFERENCES.....................................................................................................................53
v

LIST OF FIGURES
Figure 1.1: Overview of experiment design ..................................................................................................................3Figure 1.2: Assessment of plant produced HMAC........................................................................................................3Figure 1.3: Assessment of laboratory produced HMAC................................................................................................4Figure 2.1: Evaluation of Plant-Produced HMAC.........................................................................................................8Figure 3.1a: Percent Gmm vs gyrations for Gardiner samples (Ndesign gyrations) .........................................................11Figure 3.1b: Percent air voids vs gyrations for Gardiner samples (Ndesign gyrations) ..................................................11Figure 3.2a: Percent Gmm vs gyrations for Gardiner samples (as-constructed air void content)..................................12Figure 3.2b: Percent air voids vs gyrations for Gardiner samples (as-constructed air void content)...........................12Figure 3.3a: Hveem stability of Gardiner samples (Ndesign gyrations) .........................................................................14Figure 3.3b: Hveem stability of Gardiner samples (as-constructed air void content).................................................14Figure 3.4a: Percent Gmm vs gyrations for OR 58/U.S. 97 samples (Ndesign gyrations)................................................17Figure 3.4b: Percent air voids vs gyrations for OR 58/U.S. 97 samples (Ndesign gyrations).........................................17Figure 3.5a: Percent Gmm vs gyrations for OR 58/U.S. 97 samples (as-constructed air void content) ........................18Figure 3.5b: Percent air voids vs gyrations for OR 58/U.S. 97 samples (as-constructed air void content) ................18Figure 3.6a: Hveem stability of OR 58/U.S. 97 samples (Ndesign gyrations) ................................................................21Figure 3.6b: Hveem stability of OR 58/U.S. 97 samples (as-constructed air void content) ........................................21Figure 3.7a: Percent Gmm vs gyrations for Corvallis samples (Ndesign gyrations).........................................................24Figure 3.7b: Percent air voids vs gyrations for Corvallis samples (Ndesign gyrations)..................................................24Figure 3.8a: Percent Gmm vs gyrations for Corvallis samples (as-constructed air void content) ...............................25Figure 3.8b: Percent air voids vs gyrations for Corvallis samples (as-constructed air void content) .........................25Figure 3.9a: Hveem stability of Corvallis samples (Ndesign gyrations) .........................................................................28Figure 3.9b: Hveem stability of Corvallis samples (as-constructed air void content) .................................................28Figure 3.10a: Percent Gmm vs gyrations for Hermiston stamples (Ndesign gyrations)....................................................31Figure 3.10b: Percent air voids vs gyrations for Hermiston samples (Ndesign gyrations)..............................................31Figure 3.11a: Percent Gmm vs gyrations for Hermiston samples (as-constructed air void content) .............................32Figure 3.11b: Percent air voids vs gyrations for Hermiston samples (as-constructed air void content) ......................32Figure 3.12a: Hveem stability of Hermiston samples (Ndesign gyrations).....................................................................35Figure 3.12b: Hveem stability of Hermiston samples (as-constructed air void content) .............................................35Figure 4.1: Evaluation of Plant-Produced HMAC.......................................................................................................37Figure 4.2: Air void content of field cores...................................................................................................................39Figure 4.3: Air void content of field cores and specimens compacted to Ndesign gyrations..........................................40Figure 4.4: Air void content of gyratory compacted specimens (100 mm vs. 150 mm)..............................................41Figure 4.5: Air void content of gyratory compacted specimens (Pine vs. Test Quip) .................................................41Figure 4.6: Air void content of field and lab compacted samples ...............................................................................42Figure 4.7a: Regression of Hveem stability vs air void content (Gardiner) ................................................................43Figure 4.7b: Regression of Hveem stability vs air void content (OR 58/U.S. 97).......................................................43Figure 4.7c: Regression of Hveem stability vs air void content (Corvallis) ................................................................44Figure 4.7d: Regression of Hveem stability vs air void content (Hermiston)..............................................................44Figure 4.8: Hveem stability of specimens compacted to as-constructed air void content ...........................................46Figure 4.9: Hveem stability of specimens compacted to Ndesign gyrations...................................................................47
vi

LIST OF TABLES
Table 3.1: Air Void Content of Gardiner Samples (Average Asphalt Content = 5.6%) .....................................10Table 3.2: Hveem Stability of Gardiner Samples....................................................................................................13Table 3.3: Air Void Content of OR 58/U.S. 97 Samples (Average Asphalt Content = 6.0%) .............................16Table 3.4: Hveem Stability of OR 58/U.S. 97 Samples ...........................................................................................19Table 3.5: Air Void Content of Corvallis Samples (Average Asphalt Content = 5.6%)......................................23Table 3.6: Hveem Stability of Corvallis Samples ....................................................................................................26Table 3.7: Air Void Content of Hermiston Samples (Average Asphalt Content = 5.5%) ...................................30Table 3.8: Hveem Stability of Hermiston Samples ................................................................................................33Table 4.1: Summary of Air Void Content and Hveem Stability............................................................................38Table 4.2: Average Percent Air Voids .....................................................................................................................38Table 4.3: Average Hveem Stability.........................................................................................................................45
vii

viii

1.0 INTRODUCTION
Application of quality management concepts to asphalt paving evolved because recipe specifications frequently proved inadequate for ensuring pavement performance. Quality management of asphalt concrete is founded on the premise that the producer controls the end-quality of the product, including the in-place void content on which pavement performance is highly dependent. Traditional compaction devices (Marshall or Hveem) have proved cumbersome, expensive and/or ineffective for field control of air voids. Since ODOT’s primary objective is to produce a quality product, a system/procedure is necessary which allows the contractor to measure void properties during production and adjust the job mix formula (JMF) as needed. Though based on experimental work with dense graded mixes, the Superpave concepts and technology can be readily extended, with some modifications, to the heavy-duty and standard wearing course mixes routinely used by ODOT, perhaps even open-graded friction courses.
1.1 BACKGROUND
An important aspect of the Superpave technology is the method of laboratory compaction. Though not new in concept, gyratory compaction is likely to be the industry standard as evidenced by an article in Asphalt Contractor (Bukowski 1995). Forty-seven states have acquired the Superpave gyratory. In its quality management program Oregon DOT uses the Marshall Hammer for field control for a variety of reasons: the Hveem compactor (kneading) was not suitable for field operations and the Superpave gyratory compactor was not available at the time this research began. However, ODOT’s earlier work on field control of asphalt concrete mixes using the Texas gyratory compactor was encouraging. It concluded that “… measured stability values on gyratory compacted specimens are equal to or better than those for kneading compacted specimens; the results appear to be more consistent than with kneading or Marshall compacted specimens” (Terrel, et al. 1994). Other studies suggest that the Superpave gyratory compactor may be a useful tool for field management (Harmon, et al. 1995; Anderson, et al. 1995).
As originally configured, the mass of Superpave gyratory compactors was approximately 360 to 540 kg, not ideally suited for field quality control. In research sponsored by the Transportation Research Board, NCHRP 9-7, Field Procedures and Equipment to Implement SHRP Asphalt Specifications, indicated that the Finnish gyratory compactor produced specimens comparable to the Superpave gyratory compactors (i.e., those manufactured by Pine and Troxler). The Finnish compactor mass and cost are considerably less, approximately 90 to 140 kg, and $15,000, respectively. All three compactors (Pine, Troxler and Finnish) have proved successful for field quality control on a number of FHWA-funded projects, including SPS-9 and WesTrack (Accelerated Field Test of Performance Related Specifications for Hot Mix Asphalt Construction). Furthermore, Pine Instruments, Industrial Process Controls (IPC), an Australian Firm, and Test Quip exhibited portable gyratory compactors at the January 1997 meeting of the
1
Transportation Research Board. The mass of the IPC and Test Quip compactors is about 70 to 140 kg. Also, both manufacturers indicated that the retail price is likely to be $15,000 - $20,000. Portability and cost of the gyratory compactor are, understandably, key concerns. Perhaps more important, however, is the suitability of the Superpave technology to the wide variety of mix types used as alternatives to the standard dense-graded mixes. Research conducted under the auspices of the National Cooperative Highway Research Program, in NCHRP Project 9-9, Refinement of Superpave Gyratory Compaction Procedure, addressed this issue.
Although selecting and proportioning materials as well as compaction are integral parts of the Superpave technology, there is some apprehension given the fact that no strength test is required at low traffic levels. Already, numerous state DOTs have indicated that some sort of “proof testing” will be used to supplement the Superpave volumetric design. Elsewhere, some state DOTs have purchased (or plan to purchase) a scaled down version of the Superpave Shear Tester (SST) for mechanical testing and performance prediction as a function of material properties, time/traffic, environment and pavement geometry. Finally, field performance data from WesTrack indicate that some Superpave mixes are not performing as anticipated, suggesting that volumetric mix design should be supplemented with mechanical testing in some cases. Given ODOT’s long and successful use with Hveem mix design, Hveem stability was used in this research as a relative measure of the strength of Superpave mixes.
1.2 OBJECTIVES
The success of the quality management initiative is related not only to field voids management, but also to mix design and performance testing, all of which now include some elements of the Superpave technology. Embracing the new technology, Oregon DOT has already developed an implementation strategy and schedule for the binder component of the Superpave system. Similarly, since 1996 it has started to evaluate Hveem mix designs used on construction projects with the Superpave technology. To fully realize the benefits of the Superpave technology it is imperative that it be implemented as a system. Accordingly, this work was intended to extend that already completed on the binder evaluation. The primary objective of this research was to assess the effectiveness of a portable gyratory compactor for field quality control purposes. A secondary objective was to determine the quality of Superpave mixes as measured by Hveem stability.
The objectives may be formulated in terms of the following hypothesis: gyratory compaction is an effective tool for field quality control/quality assurance (QC/QA) purposes. To test this hypothesis, the experiment outlined in Figure 1.1 was proposed. More details of the experiment are shown in Figures 1.2 and 1.3. Due to budget constraints, however, only the evaluation of plant-produced material shown in Figure 1.2 was undertaken; i.e., the research did not include construction of “control” sections based on Hveem mix design, as originally envisioned.
2

Establish JMF
(Hveem & Superpave)
Plant Produced Material
(control and test sections)
Conduct condition survey of control and test sections to determine field performance.
Compact specimens in lab,determine volumetric properties and Hveem stability.
Schematic of Evaluation Plan
Compact specimens in field,determine volumetric properties and Hveem stability.
Return plant produced material to lab for compaction. Determine volumetric properties and Hveem stability.
Extract field cores and determine volumetric properties and Hveem stability.
Compare volumetric properties and
Hveem stability with field performance.
Figure 1.1: Overview of experiment design
Plant Produced Material
Superpave JMF
Portable Gyratory • eld
N-design • lab
N-design in-place air voids
• Extract Field Cores
Volumetric Properties and Hveem Stability
Pine Gyratory • b
N-design in-place air voids
Hveem (kneading) • ab
in-place air voids
fi
la
l
Figure 1.2: Assessment of plant produced HMAC
3
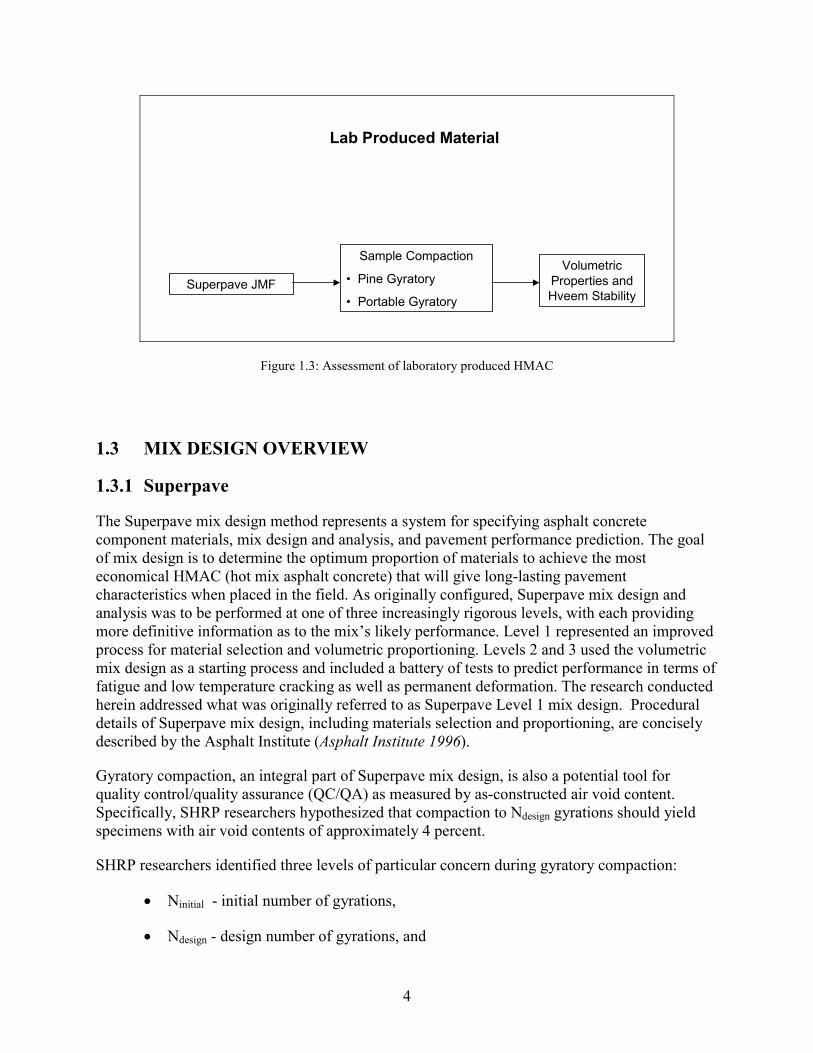
Lab Produced Material
Sample Compaction
• Pine Gyratory
• Portable Gyratory Superpave JMF
Volumetric Properties and Hveem Stability
Figure 1.3: Assessment of laboratory produced HMAC
1.3 MIX DESIGN OVERVIEW
1.3.1 Superpave
The Superpave mix design method represents a system for specifying asphalt concrete component materials, mix design and analysis, and pavement performance prediction. The goal of mix design is to determine the optimum proportion of materials to achieve the most economical HMAC (hot mix asphalt concrete) that will give long-lasting pavement characteristics when placed in the field. As originally configured, Superpave mix design and analysis was to be performed at one of three increasingly rigorous levels, with each providing more definitive information as to the mix’s likely performance. Level 1 represented an improved process for material selection and volumetric proportioning. Levels 2 and 3 used the volumetric mix design as a starting process and included a battery of tests to predict performance in terms of fatigue and low temperature cracking as well as permanent deformation. The research conducted herein addressed what was originally referred to as Superpave Level 1 mix design. Procedural details of Superpave mix design, including materials selection and proportioning, are concisely described by the Asphalt Institute (Asphalt Institute 1996).
Gyratory compaction, an integral part of Superpave mix design, is also a potential tool for quality control/quality assurance (QC/QA) as measured by as-constructed air void content. Specifically, SHRP researchers hypothesized that compaction to Ndesign gyrations should yield specimens with air void contents of approximately 4 percent.
SHRP researchers identified three levels of particular concern during gyratory compaction:
� Ninitial - initial number of gyrations,
� Ndesign - design number of gyrations, and
4

� Nmaximum - maximum number of gyrations.
Ninitial reflects the hot mix asphalt concrete (HMAC) behavior during breakdown rolling; Ndesign reflects the mix at the design traffic, i.e., design ESALs; and Nmaximum reflects a mix that has sustained significantly more traffic than anticipated.
1.3.2 Hveem
Widely used by state DOTs on the West Coast, the Hveem method of mix design includes a non-destructive test that provides an empirical measure of the HMAC’s strength or stability, computed as shown in Equation 1-1. As noted previously, Hveem stability testing was conducted to provide a relative measure of the strength of the Superpave mixes. All Hveem stabilometer values were “corrected” to the effective specimen height of 64 mm as outlined by the Asphalt Institute (Asphalt Institute 1993).
22.2S � Ph � D
� 0.222 (1-1)
Pv � Ph
where S = stabilometer value
D = specimen displacement
Pv = vertical pressure
Ph = horizontal pressure
5

6

2.0 EXPERIMENTAL DESIGN
2.1 FIELD PROJECTS
In this research, materials from four ODOT projects were considered. The “Gardiner Project” was located on U.S. 101 (Hwy 9) northbound between mileposts 205.60 and 204.90 approximately 8 km north of the coastal town of Gardiner. The “OR 58/US 97 Project” was located near U.S. 97 on Oregon Hwy 58 eastbound between mileposts 64.00 and 65.70. The “Corvallis Project” was located on northbound Oregon Hwy 99W (Hwy 1W) between mileposts 84.00 and 84.40. The “Hermiston Project” was located on southbound Oregon Hwy 395 (Hwy 54) between mileposts 5.55 and 5.61. All projects were constructed between July and September of 1998.
For comparison purposes, both ODOT and OSU staff conducted Superpave mix designs. However, production mix for all projects was based on the job mix formula (JMF) established by the ODOT Materials Laboratory. Since these mix design data are not a critical component of this study they are not included herein.
2.2 SAMPLING AND TESTING
In addition to the raw materials used for mix design, HMAC was sampled during construction for subsequent compaction. Hot mix for all four projects was produced with a drum mixer. HMAC from the Corvallis and OR 58/US 97 projects was sampled from the conveyor belt immediately after it was discharged from the drum and stored in 5-gallon buckets. Because of timing and/or equipment limitations, HMAC from the Gardiner and Hermiston projects was sampled from the haul trucks. For all projects, sampling at the plant was completed within one day’s production.
Plant-produced HMAC was compacted with three devices: a portable gyratory, the Test Quip BGC-1; a full-size, standard lab model manufactured by Pine Instruments; and the standard Hveem kneading compactor. Compaction in the field was accomplished with the portable gyratory. Lab compaction was accomplished with the portable and standard gyratories as well as with the standard kneading device. Field cores were extracted (between the wheel path) within 24 hours of placement, returned to the lab and trimmed to a thickness of approximately 50 mm. Also, field cores of 150 mm diameter were cored to 100 mm diameter for testing in the Hveem stabilometer. Close coordination between plant sampling and paving operations ensured that HMAC used for lab compaction was representative of HMAC from which field cores were extracted. Shown in Figure 2.1 are the materials evaluated for each project. It was envisioned that 53 specimens from each project would be tested: 14 portable gyratory; 12 standard gyratory; 3 standard kneading; and 24 field cores.
7

Portable Gyratory (14)
[field and lab compaction]
•150 mm (Ndesign)
•150 mm (in-place air void content)
Standard Gyratory (12)
[lab compaction]
•100 mm (Ndesign)
•150 mm (Ndesign)
•100 mm (in-place air void content)
•150 mm (in-place air void content)
Field Cores (24)
•100 mm
•150 mm
Standard Kneading (3)
[lab compaction]
•100 mm (in-place air void content)
Hveem Stability
Note: Number in parenthesesindicates number of samples per field project
Figure 2.1: Evaluation of Plant-Produced HMAC
8

3.0 PROPERTIES OF PLANT-PRODUCED HMAC
3.1 GARDINER PROJECT
3.1.1 Air Void Content
The air void content of all plant-produced HMAC samples is shown in Table 3.1. Gyratory compaction summaries for Ndesign and “in-place or as-constructed air void content” are shown in Figures 3.1 and 3.2, respectively. Note that the compaction summaries are expressed in two formats: percent of theoretical maximum specific gravity (% Gmm) and percent air voids. The number of gyrations required to achieve the “as-constructed air void content” was 19 and 22 for the 150-mm and 100-mm samples, respectively. With the kneading compactor the number of tamps required to achieve the “as-constructed air void content” was 35.
3.1.2 Hveem Stability
Individual sample and average Hveem stability numbers are shown in Table 3.2. Average Hveem stabilities for samples compacted to Ndesign gyrations and as-constructed air void contents are shown in Figures 3.3a and 3.3b, respectively.
9
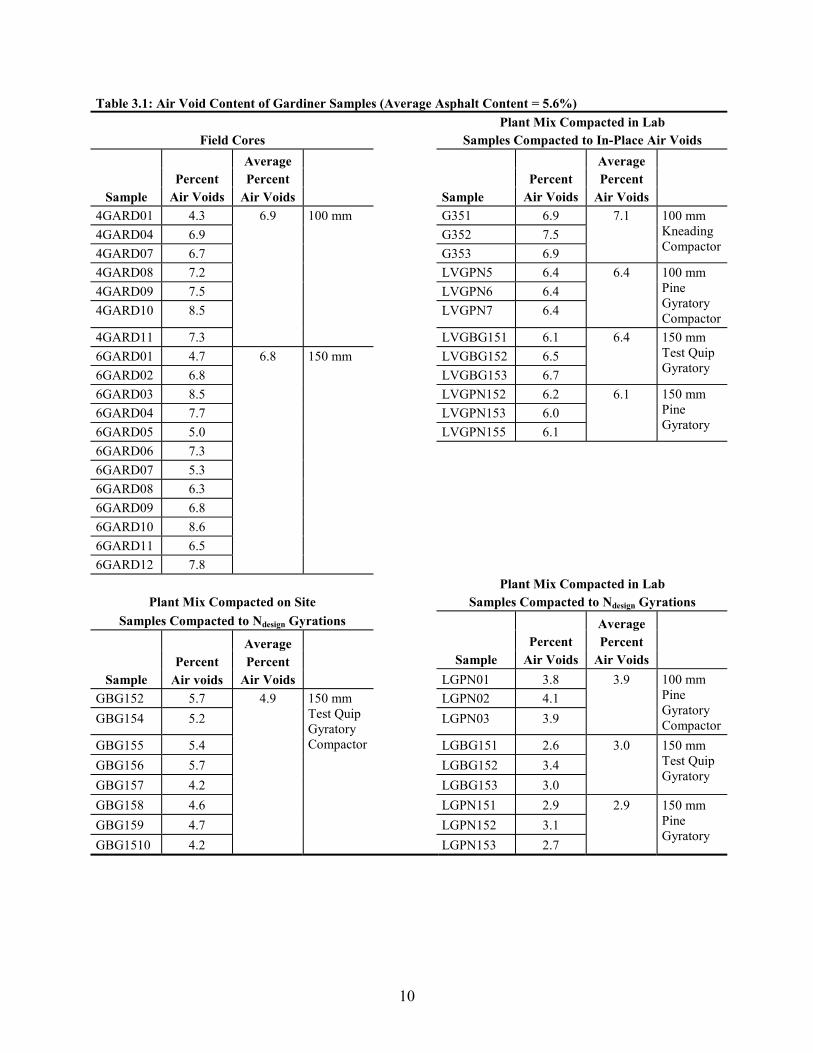
Table 3.1: Air Void Content of Gardiner Samples (Average Asphalt Content = 5.6%) Plant Mix Compacted in Lab
Field Cores Samples Compacted to In-Place Air Voids
Sample Percent
Air Voids
Average Percent
Air Voids 4GARD01 4.3 4GARD04 6.9 4GARD07 6.7 4GARD08 7.2 4GARD09 7.5 4GARD10 8.5
4GARD11 7.3
6.9 100 mm
6GARD01 4.7 6GARD02 6.8 6GARD03 8.5 6GARD04 7.7 6GARD05 5.0 6GARD06 7.3 6GARD07 5.3 6GARD08 6.3 6GARD09 6.8 6GARD10 8.6 6GARD11 6.5 6GARD12 7.8
6.8 150 mm
Sample Percent
Air Voids
Average Percent
Air Voids G351 6.9 G352 7.5 G353 6.9
7.1 100 mm Kneading Compactor
LVGPN5 6.4 LVGPN6 6.4 LVGPN7 6.4
6.4 100 mm Pine Gyratory Compactor
LVGBG151 6.1 LVGBG152 6.5 LVGBG153 6.7
6.4 150 mm Test Quip Gyratory
LVGPN152 6.2 LVGPN153 6.0 LVGPN155 6.1
6.1 150 mm Pine Gyratory
Plant Mix Compacted in Lab Plant Mix Compacted on Site Samples Compacted to Ndesign Gyrations
Samples Compacted to Ndesign Gyrations
Sample Percent
Air voids
Average Percent
Air Voids GBG152 5.7 GBG154 5.2
GBG155 5.4 GBG156 5.7 GBG157 4.2 GBG158 4.6 GBG159 4.7 GBG1510 4.2
4.9 150 mm Test Quip Gyratory Compactor
Sample Percent
Air Voids
Average Percent
Air Voids LGPN01 3.8 LGPN02 4.1 LGPN03 3.9
3.9 100 mm Pine Gyratory Compactor
LGBG151 2.6 LGBG152 3.4 LGBG153 3.0
3.0 150 mm Test Quip Gyratory
LGPN151 2.9 LGPN152 3.1 LGPN153 2.7
2.9 150 mm Pine Gyratory
10
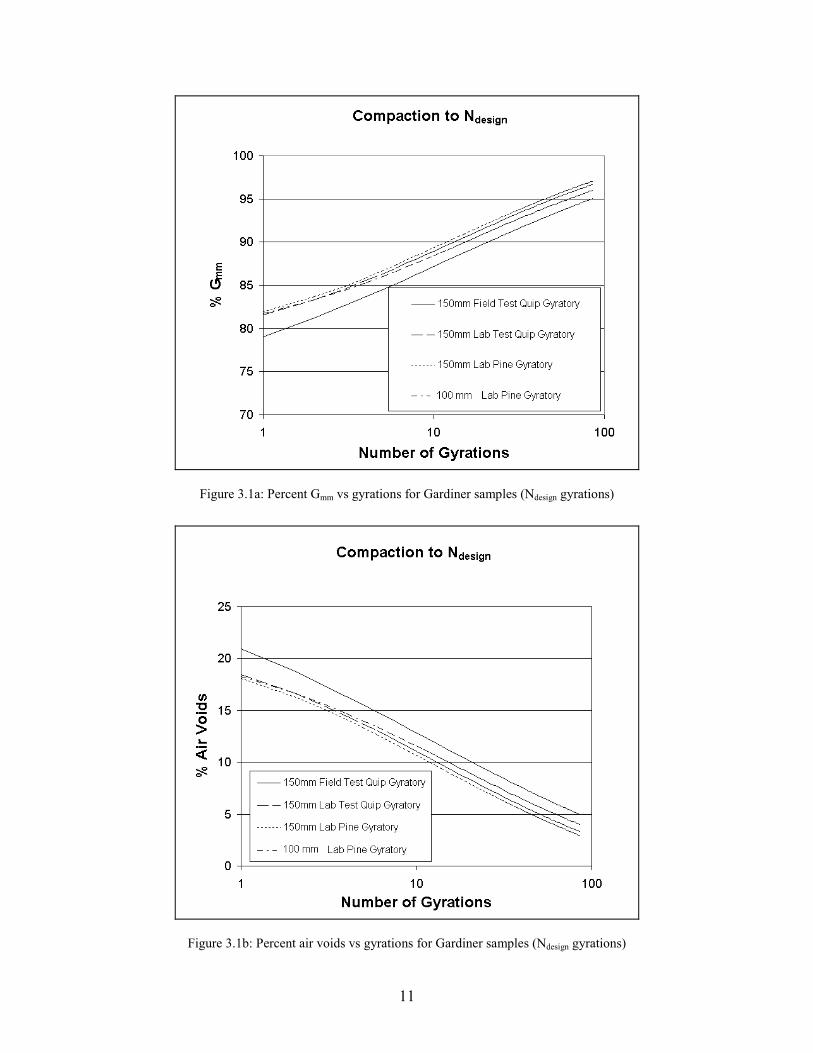
Figure 3.1a: Percent Gmm vs gyrations for Gardiner samples (Ndesign gyrations)
Figure 3.1b: Percent air voids vs gyrations for Gardiner samples (Ndesign gyrations)
11

Figure 3.2a: Percent Gmm vs gyrations for Gardiner samples (as-constructed air void content)
Figure 3.2b: Percent air voids vs gyrations for Gardiner samples (as-constructed air void content)
12

Table 3.2: Hveem Stability of Gardiner Samples Samples Compacted to In-Place Air Voids
Corrected Sample Stability Number
4GARD01 25 4GARD04 23 4GARD07 23 4GARD08 19 4GARD09 23
Average Corrected
Stability Number 22 100 mm Core Samples Field Cores
4GARD10 19 4GARD11 21 G351 21 25 G352 32 G353 22
100 mm Kneading Plant Mix Compacted in Lab Compactor
LVGPN5 32 LVGPN6 31 LVGPN7 24
29 100 mm Pine Gyratory Compactor
LVGBG151 30 LVGBG152 20
26 150 mm Test Quip Gyratory Compactor
LVGBG153 25 LVGBG154 29 LVGPN152 25 26 LVGPN153 26 LVGPN155 26
150 mm Pine Gyratory Compactor
Samples Compacted to Ndesign Gyrations
Sample Corrected
Stability Number
Average Corrected
Stability Number GBG152 29 30 150 mm Test Quip Plant Mix Compacted on Site GBG154 34 GBG155 29
Gyratory Compactor
GBG156 32 GBG157 29 GBG158 31 GBG159 28 GBG1510 27 LGPN01 28 LGPN02 33 LGPN03 38
33 100 mm Pine Gyratory Compactor
LGBG151 33 LGBG152 28 LGBG153 35
32 150 mm Test Quip Gyratory
LGPN151 31 LGPN152 31 LGPN153 32
32 150 mm Pine Gyratory Compactor
Plant Mix Compacted in Lab
13

14
28
29
30
31
32
33
34
Compaction to Ndesign
150mm Test Quip Gyratory Compactor
100mm Pine Gyratory Compactor
150mm Test Quip Gyratory Compactor
150mm Pine Gyratory Compactor
Field Samples
Lab Compacted Samples
Figure 3.3a: Hveem stability of Gardiner samples (Ndesign gyrations)
0
5
10
15
20
25
30
35
Compaction to As-Constructed Air Void Content100mm Core Samples
100mm Kneading Compactor
100mm Pine Gyratory Compactor
150mm Test Quip Gyratory Compactor
150mm Pine Gyratory Compactor
FieldCores
Lab Compacted Samples
Figure 3.3b: Hveem stability of Gardiner samples (as-constructed air void content)
3.2 OR 58/U.S. 97 PROJECT
3.2.1 Air Void Content
The air void content of all plant-produced HMAC samples is shown in Table 3.3. Gyratory compaction summaries for Ndesign and as-constructed air void content are shown in Figures 3.4 and 3.5, respectively. The number of gyrations required to achieve the as-constructed air void content was 23 and 32 for the 150-mm and 100-mm samples, respectively. With the kneading compactor the number of tamps required to achieve the as-constructed air void content was 35.
3.2.2 Hveem Stability
Individual sample and average Hveem stability numbers are shown in Table 3.4. Average Hveem stabilities for samples compacted to Ndesign gyrations and as-constructed air void contents are shown in Figures 3.6a and 3.6b, respectively.
15

Table 3.3: Air Void Content of OR 58/U.S. 97 Samples (Average Asphalt Content = 6.0%) Plant Mix Compacted in Lab
Field Cores Samples Compacted to In-Place Air Voids
Sample Percent
Air Voids
Average Percent
Air Voids 4US9701 9.2 4US9702 6.0 4US9703 8.2 4US9704 7.2 4US9705 6.1 4US9706 8.7
4US9707 7.4 4US9708 7.1 4US9709 6.0 4US9710 7.0 4US9711 7.5 4US9712 5.5
7.2 100 mm
6US9701 8.6 6US9703 9.1 6US9704 7.0 6US9705 6.1 6US9706 8.4 6US9707 7.5 6US9708 6.8 6US9709 6.1 6US9710 7.3 6US9711 7.0 6US9712 6.2
7.3 150 mm
Sample Percent
Air Voids
Average Percent
Air Voids 97351 7.6 97352 8.0 97353 7.9
7.8 100 mm Kneading Compactor
LV97PN01 7.3 LV97PN02 7.3 LV97PN03 7.8
7.5 100 mm Pine Gyratory Compactor
LVBG97151 6.9 LVBG97152 7.2 LVBG97153 7.5
7.2 150 mm Test Quip Gyratory
LV97PN151 7.3 LV97PN152 7.4 LV97PN153 7.2
7.3 150 mm Pine Gyratory
Plant Mix Compacted in Lab Plant Mix Compacted on Site Samples Compacted to Ndesign Gyrations
Samples Compacted to Ndesign Gyrations
Sample Percent
Air Voids
Average Percent
Air Voids 97BG151 3.2 97BG152 3.7
97BG153 2.4 97BG154 3.0 97BG155 2.5 97BG156 2.6 97BG157 3.1 97BG158 2.5
2.9 150 mm Test Quip Gyratory Compactor
Sample Percent
Air Voids
Average Percent
Air Voids 4L97PN01 3.7 4L97PN02 4.9 4L97PN03 4.9
4.5 100 mm Pine Gyratory Compactor
LBG97151 2.1 LBG97152 2.3 LBG97153 2.1
2.2 150 mm Test Quip Gyrator
L97PN151 2.9 L97PN152 2.9 L97PN153 2.2
2.7 150 mm Pine Gyratory
16

Figure 3.4a: Percent Gmm vs gyrations for OR 58/U.S. 97 samples (Ndesign gyrations)
Figure 3.4b: Percent air voids vs gyrations for OR 58/U.S. 97 samples (Ndesign gyrations)
17
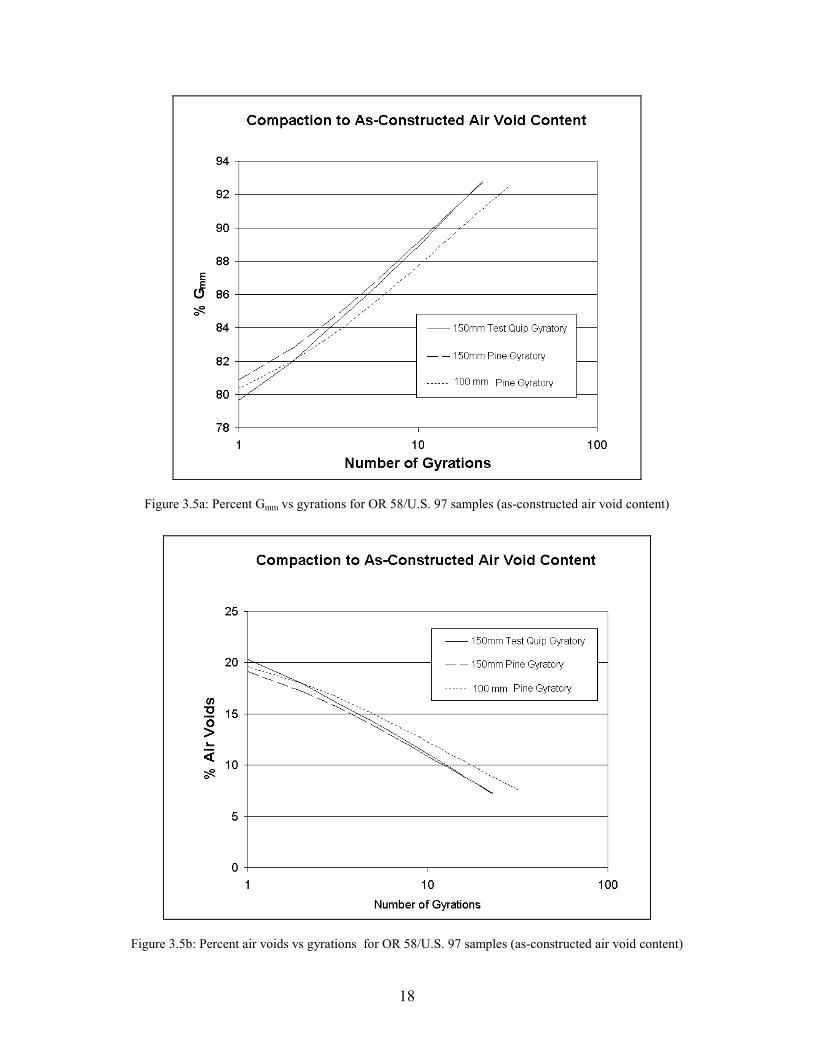
Figure 3.5a: Percent Gmm vs gyrations for OR 58/U.S. 97 samples (as-constructed air void content)
Figure 3.5b: Percent air voids vs gyrations for OR 58/U.S. 97 samples (as-constructed air void content)
18
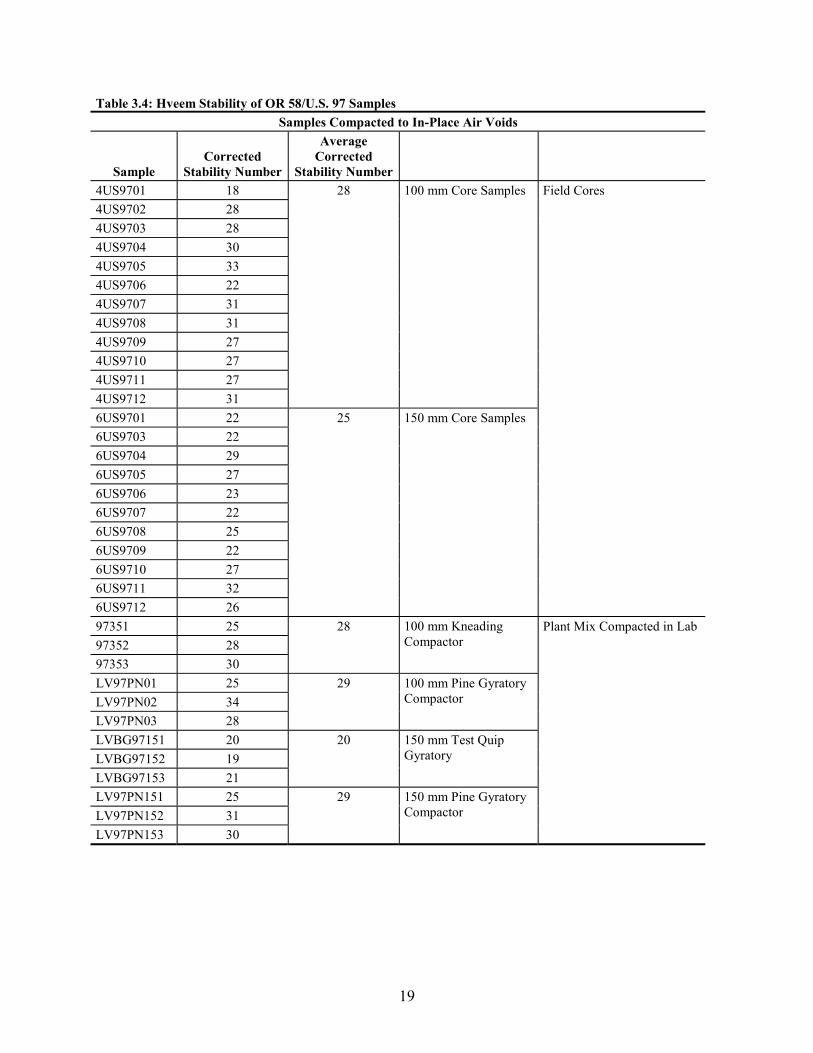
Table 3.4: Hveem Stability of OR 58/U.S. 97 Samples Samples Compacted to In-Place Air Voids
Sample Corrected
Stability Number
Average Corrected
Stability Number 4US9701 18 4US9702 28 4US9703 28 4US9704 30 4US9705 33 4US9706 22 4US9707 31 4US9708 31 4US9709 27 4US9710 27 4US9711 27 4US9712 31
28 100 mm Core Samples
6US9701 22 6US9703 22 6US9704 29 6US9705 27 6US9706 23 6US9707 22 6US9708 25 6US9709 22 6US9710 27 6US9711 32 6US9712 26
25 150 mm Core Samples
Field Cores
97351 25 97352 28 97353 30
28 100 mm Kneading Compactor
LV97PN01 25 LV97PN02 34 LV97PN03 28
29 100 mm Pine Gyratory Compactor
LVBG97151 20 LVBG97152 19 LVBG97153 21
20 150 mm Test Quip Gyratory
LV97PN151 25 LV97PN152 31 LV97PN153 30
29 150 mm Pine Gyratory Compactor
Plant Mix Compacted in Lab
19

Table 3.4 (Continued): Hveem Stability of OR 58/U.S. 97 Samples Samples Compacted to Ndesign Gyrations
Sample Corrected
Stability Number
Average Corrected
Stability Number 97BG151 37 97BG152 33 97BG153 34 97BG154 37 97BG155 37 97BG156 37 97BG157 42 97BG158 39
37 150 mm Test Quip Gyratory Compactor
Plant Mix Compacted on Site
4L97PN01 41 4L97PN02 40 4L97PN03 40
40 100 mm Pine Gyratory Compactor
L97PN151 39 L97PN152 42 L97PN153 39
40 150 mm Test Quip Gyratory
LBG97151 44 LBG97152 39 LBG97153 44
42 150 mm Pine Gyratory Compactor
Plant Mix Compacted in Lab
20

21
34
35
36
37
38
39
40
41
42
43
150mm Test Quip Gyratory Compactor100mm Pine Gyratory Compactor150mm Test Quip Gyratory Compactor150mm Pine Gyratory Compactor
FieldSamples
Lab Compacted Samples
Compaction to Ndesign
Figure 3.6a: Hveem stability of OR 58/U.S. 97 samples (Ndesign gyrations)
0
5
10
15
20
25
30
35
100mm Core Samples150mm Core Samples100mm Kneading Compactor100mm Pine Gyratory Compactor150mm Test Quip Gyratory Compactor150mm Pine Gyratory Compactor
Field Cores Lab Compacted Samples
Compaction to As-Constructed Air Void Content
Figure 3.6b: Hveem stability of OR 58/U.S. 97 samples (as-constructed air void content)

3.3 CORVALLIS PROJECT
3.3.1 Air Void Content
The air void content of all plant-produced HMAC samples is shown in Table 3.5. Gyratory compaction summaries for Ndesign and “in-place or as-constructed air void content” are shown in Figures 3.7 and 3.8, respectively. The number of gyrations required to achieve the “as-constructed air void content” was 49 and 55 for the 150-mm and 100-mm samples, respectively. With the kneading compactor the number of tamps required to achieve the “as-constructed air void content” was 110.
3.3.2 Hveem Stability
Individual sample and average Hveem stability numbers are shown in Table 3.6. Average Hveem stabilities for samples compacted to Ndesign gyrations and as-constructed air void contents are shown in Figures 3.9a and 3.9b, respectively.
22
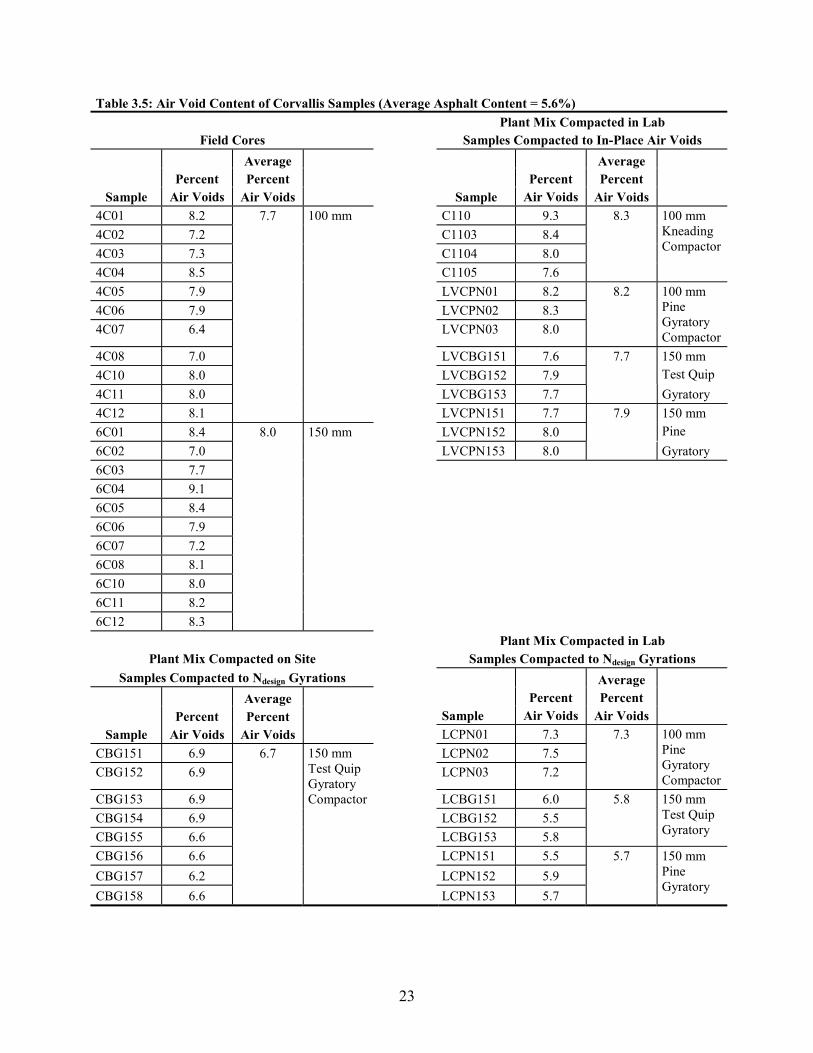
Table 3.5: Air Void Content of Corvallis Samples (Average Asphalt Content = 5.6%) Plant Mix Compacted in Lab
Field Cores Samples Compacted to In-Place Air Voids
Sample Percent
Air Voids
Average Percent
Air Voids 4C01 8.2 4C02 7.2 4C03 7.3 4C04 8.5 4C05 7.9 4C06 7.9 4C07 6.4
4C08 7.0 4C10 8.0 4C11 8.0 4C12 8.1
7.7 100 mm
6C01 8.4 6C02 7.0 6C03 7.7 6C04 9.1 6C05 8.4 6C06 7.9 6C07 7.2 6C08 8.1 6C10 8.0 6C11 8.2 6C12 8.3
8.0 150 mm
Sample Percent
Air Voids
Average Percent
Air Voids C110 9.3 C1103 8.4 C1104 8.0 C1105 7.6
8.3 100 mm Kneading Compactor
LVCPN01 8.2 LVCPN02 8.3 LVCPN03 8.0
8.2 100 mm Pine Gyratory Compactor
LVCBG151 7.6 LVCBG152 7.9
150 mm Test Quip
LVCBG153 7.7
7.7
Gyratory LVCPN151 7.7 LVCPN152 8.0
150 mm Pine
LVCPN153 8.0
7.9
Gyratory
Plant Mix Compacted in Lab Plant Mix Compacted on Site Samples Compacted to Ndesign Gyrations
Samples Compacted to Ndesign Gyrations
Sample Percent
Air Voids
Average Percent
Air Voids CBG151 6.9 CBG152 6.9
CBG153 6.9 CBG154 6.9 CBG155 6.6 CBG156 6.6 CBG157 6.2 CBG158 6.6
6.7 150 mm Test Quip Gyratory Compactor
Sample Percent
Air Voids
Average Percent
Air Voids LCPN01 7.3 LCPN02 7.5 LCPN03 7.2
7.3 100 mm Pine Gyratory Compactor
LCBG151 6.0 LCBG152 5.5 LCBG153 5.8
5.8 150 mm Test Quip Gyratory
LCPN151 5.5 LCPN152 5.9 LCPN153 5.7
5.7 150 mm Pine Gyratory
23
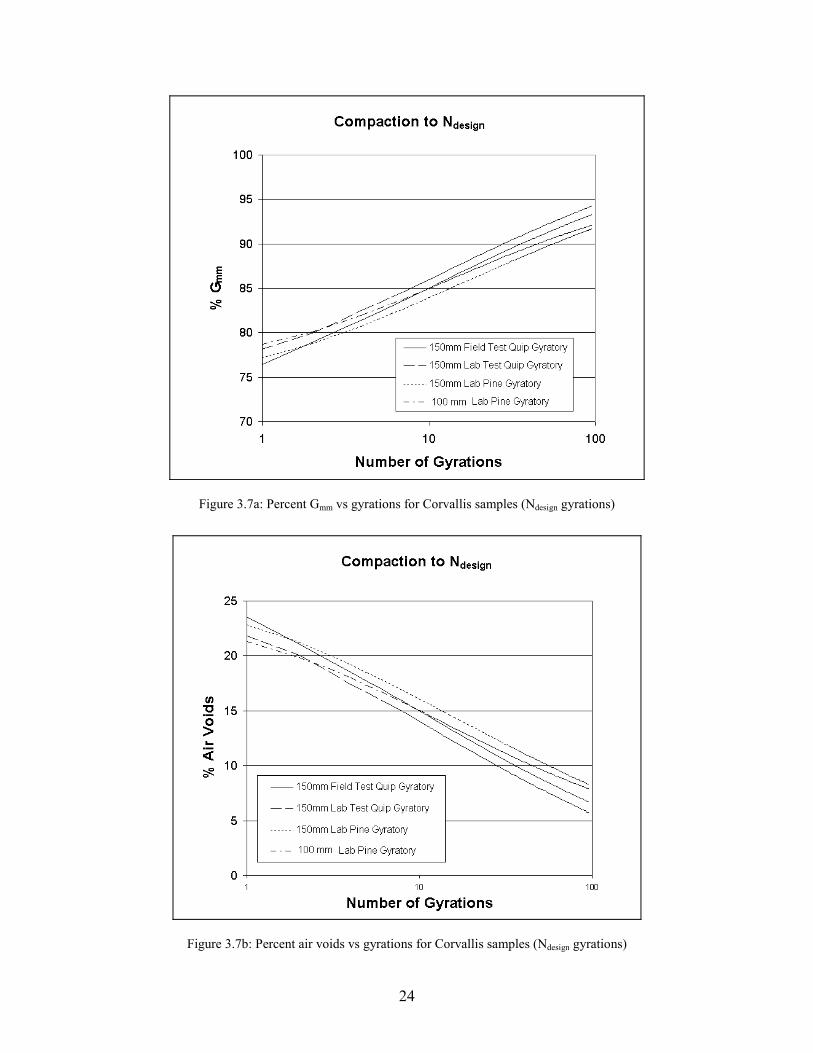
Figure 3.7a: Percent Gmm vs gyrations for Corvallis samples (Ndesign gyrations)
Figure 3.7b: Percent air voids vs gyrations for Corvallis samples (Ndesign gyrations)
24

Figure 3.8a: Percent Gmm vs gyrations for Corvallis samples (as-constructed air void content)
Figure 3.8b: Percent air voids vs gyrations for Corvallis samples (as-constructed air void content)
25
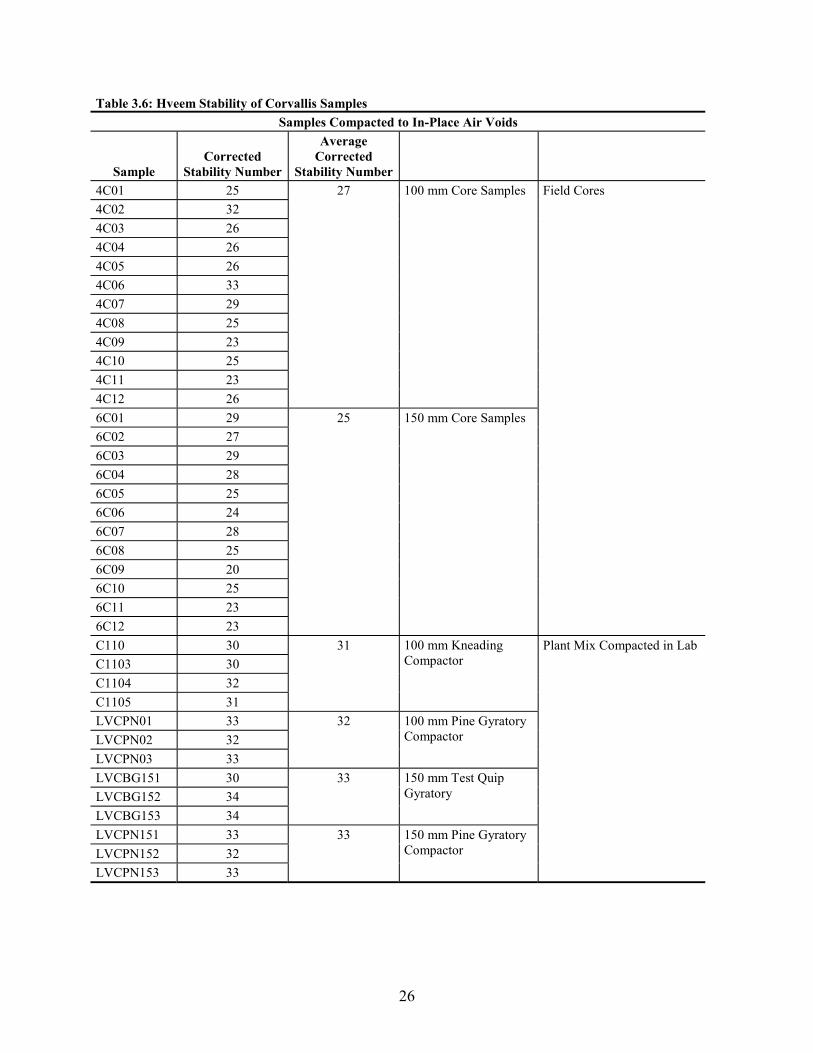
Table 3.6: Hveem Stability of Corvallis Samples Samples Compacted to In-Place Air Voids
Sample Corrected
Stability Number
Average Corrected
Stability Number 4C01 25 4C02 32 4C03 26 4C04 26 4C05 26 4C06 33 4C07 29 4C08 25 4C09 23 4C10 25 4C11 23 4C12 26
27 100 mm Core Samples
6C01 29 6C02 27 6C03 29 6C04 28 6C05 25 6C06 24 6C07 28 6C08 25 6C09 20 6C10 25 6C11 23 6C12 23
25 150 mm Core Samples
Field Cores
C110 30 C1103 30 C1104 32 C1105 31
31 100 mm Kneading Compactor
LVCPN01 33 LVCPN02 32 LVCPN03 33
32 100 mm Pine Gyratory Compactor
LVCBG151 30 LVCBG152 34 LVCBG153 34
33 150 mm Test Quip Gyratory
LVCPN151 33 LVCPN152 32 LVCPN153 33
33 150 mm Pine Gyratory Compactor
Plant Mix Compacted in Lab
26
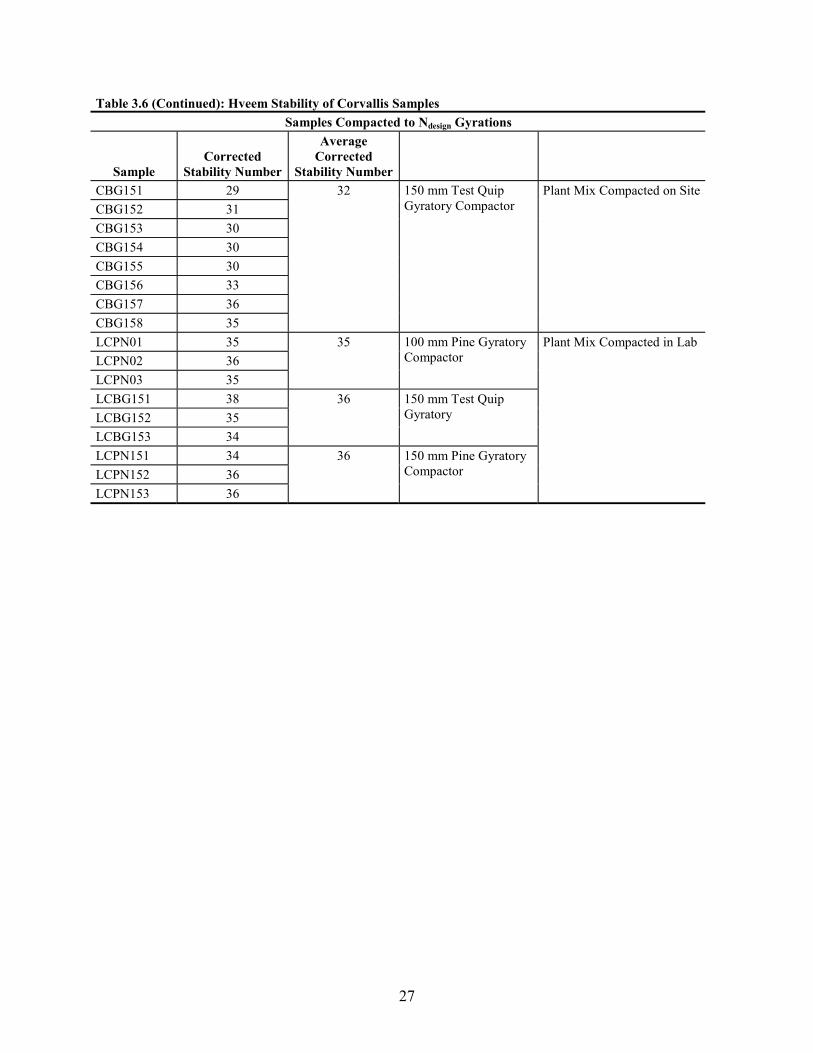
Table 3.6 (Continued): Hveem Stability of Corvallis Samples Samples Compacted to Ndesign Gyrations
Sample Corrected
Stability Number
Average Corrected
Stability Number CBG151 29 CBG152 31 CBG153 30 CBG154 30 CBG155 30 CBG156 33 CBG157 36 CBG158 35
32 150 mm Test Quip Gyratory Compactor
Plant Mix Compacted on Site
LCPN01 35 LCPN02 36 LCPN03 35
35 100 mm Pine Gyratory Compactor
LCBG151 38 LCBG152 35 LCBG153 34
36 150 mm Test Quip Gyratory
LCPN151 34 LCPN152 36 LCPN153 36
36 150 mm Pine Gyratory Compactor
Plant Mix Compacted in Lab
27

28
29
30
31
32
33
34
35
36
150mm Test Quip Gyratory Compactor
100mm Pine Gyratory Compactor
150mm Test Quip Gyratory Compactor
150mm Pine Gyratory Compactor
FieldSamples
Lab Compacted Samples
Compaction to N design
Figure 3.9a: Hveem stability of Corvallis samples (Ndesign gyrations)
0
5
10
15
20
25
30
35
100mm Core Samples
150mm Core Samples
100m m Kneading Com pactor
100m m Pine Gyratory Com pactor
150m m Test Quip Gyratory Com pactor
150m m Pine Gyratory Com pactor
Field Cores Lab Com pacted Sam ples
Compaction to As-Constructed Air Void Content
Figure 3.9b: Hveem stability of Corvallis samples (as-constructed air void content)

3.4 HERMISTON PROJECT
3.4.1 Air Void Content
The air void content of all plant-produced HMAC samples is shown in Table 3.7. Gyratory compaction summaries for Ndesign and “in-place or as-constructed air void content” are shown in Figures 3.10 and 3.11, respectively. The number of gyrations required to achieve the “as-constructed air void content” was 96 and 100 for the 150-mm and 100-mm samples, respectively. With the kneading compactor the number of tamps required to achieve the “as-constructed air void content” was 100.
3.4.2 Hveem Stability
Individual sample and average Hveem stability numbers are shown in Table 3.8. Average Hveem stabilities for samples compacted to Ndesign gyrations and as-constructed air void contents are shown in Figures 3.12a and 3.12b, respectively.
29

Table 3.7: Air Void Content of Hermiston Samples (Average Asphalt Content = 5.5%) Plant Mix Compacted in Lab
Field Cores Samples Compacted to In-Place Air Voids
Sample Percent Air Voids
Average Percent Air Voids
4H01 10.3 4H02 10.1 4H03 9.3 4H04 9.6 4H05 9.8 4H06 8.1
4H07 9.4 4H08 9.5 4H09 9.8 4H10 9.0 4H11 8.3 4H12 7.5
9.2 100 mm
6H01 10.4 6H02 8.8 6H03 8.6 6H04 9.2 6H05 8.7 6H06 9.0 6H07 9.6 6H08 9.3 6H09 9.8 6H10 8.4 6H11 9.0 6H12 7.9
9.1 150 mm
Sample Percent Air Voids
Average Percent Air Voids
H1001 9.1 H1002 9.1 H1004 9.7
9.3 100 mm Kneading Compactor
LVPNH01 9.4 LVPNH02 9.6 LVPNH03 9.7
9.6 100 mm Pine Gyratory Compactor
LVBGH151 9.1 LVBGH152 9.0 LVBGH153 9.0
9.0 150 mm Test Quip Gyratory
LVHPN154 8.8 LVHPN155 9.3 LVHPN156 8.5
8.9 150 mm Pine Gyratory
Plant Mix Compacted in Lab Samples Compacted to Ndesign Gyrations
Plant Mix Compacted on Site Samples Compacted to Ndesign Gyrations
Sample Percent
Air Voids
Average Percent
Air Voids HBG152 7.9
HBG153 7.5 HBG154 7.9 HBG155 7.6 HBG156 8.5 HBG157 8.8 HBG158 8.9
8.2 150 mm Test Quip Gyrator Compactor
Sample Percent
Air Voids
Average Percent
Air Voids LPNH01 9.4 LPNH02 9.6 LPNH03 10.0
9.7 100 mm Pine Gyratory Compactor
LBGH151 9.1 LBGH152 8.7 LBGH153 8.9
8.9 150 mm Test Quip Gyratory
LPNH151 9.9 LPNH152 9.1 LPNH153 8.7
9.2 150 mm Pine Gyratory
30

Figure 3.10a: Percent Gmm vs gyrations for Hermiston stamples (Ndesign gyrations)
Figure 3.10b: Percent air voids vs gyrations for Hermiston samples (Ndesign gyrations)
31

Figure 3.11a: Percent Gmm vs gyrations for Hermiston samples (as-constructed air void content)
Figure 3.11b: Percent air voids vs gyrations for Hermiston samples (as-constructed air void content)
32

010203040506070809101112010203040506070809101112
Table 3.8: Hveem Stability of Hermiston Samples Samples Compacted to In-Place Air Voids
Sample Corrected
Stability Number
Average Corrected
Stability Number 4H 25 4H 28 4H 23 4H 25 4H 25 4H 28 4H 26 4H 27 4H 20 4H 27 4H 26 4H 31
26 100 mm Core Samples
6H 25 6H 24 6H 23 6H 27 6H 24 6H 28 6H 25 6H 29 6H 24 6H 30 6H 26 6H 29
26 150 mm Core Samples
Field Cores
H1001 22 H1002 28 H1004 26
25 100 mm Kneading Compactor
LVH01 27 LVH02 27 LVH03 25
27 100 mm Pine Gyratory Compactor
LVBGH151 28 LVBGH152 27 LVBGH153 26
27 150 mm Test Quip Gyratory
LVHPN154 31 LVHPN155 28 LVHPN156 28
29 150 mm Pine Gyratory Compactor
Plant Mix Compacted in Lab
33

Table 3.8 (Continued): Hveem Stability of Hermiston Samples Samples Compacted to Ndesign Gyrations
Sample Corrected
Stability Number
Average Corrected
Stability Number HBG151 29 HBG152 29 HBG153 26 HBG154 29 HBG155 30 HBG156 25 HBG157 28 HBG158 26
28 150 mm Test Quip Gyratory Compactor
Plant Mix Compacted on Site
LH01 27 LH02 34 LH03 30
31 100 mm Pine Gyratory Compactor
LBGH151 30 LBGH152 31 LBGH153 32
31 150 mm Test Quip Gyratory
LPNH151 24 LPNH152 29 LPNH153 29
27 150 mm Pine Gyratory Compactor
Plant Mix Compacted in Lab
34

35
25
26
27
28
29
30
31
150mm Test Quip Gyratory Compactor
100mm Pine Gyratory Com pactor
150mm Test Quip Gyratory Compactor
150mm Pine Gyratory Com pactor
FieldSamples
Lab Compacted Samples
Compaction to N design
Figure 3.12a: Hveem stability of Hermiston samples (Ndesign gyrations)
23
24
25
26
27
28
29
30
100mm Core Samples
150mm Core Samples
100mm Kneading Compactor
100mm Pine Gyratory Compactor
150mm Test Quip Gyratory Compactor
150mm Pine Gyratory Compactor
Field Cores Lab Compacted Samples
Compaction to As-Constructed Air Void Content
Figure 3.12b: Hveem stability of Hermiston samples (as-constructed air void content)

36

4.0 ANALYSIS AND DISCUSSION
To determine the effectiveness of a portable gyratory compactor for field quality control, plant-produced HMAC was compacted and tested as shown in Figure 4.1. Since air void content is the most commonly used criterion for HMAC “acceptance,” and Hveem stability is widely used as an indicator of quality, a summary of these data is shown in Table 4.1 for ready reference. Note that the air void content data in Table 4.2 and Hveem stability data in Table 4.3 reflect the mean values across sample size.
Portable Gyratory (14)
[field and lab compaction]
•150 mm (Ndesign)
•150 mm (in-place air void content)
Standard Gyratory (12)
[lab compaction]
•100 mm (Ndesign)
•150 mm (Ndesign)
•100 mm (in-place air void content)
•150 mm (in-place air void content)
Field Cores (24)
•100 mm
•150 mm
Standard Kneading (3)
[lab compaction]
•100 mm (in-place air void content)
Hveem Stability
Figure 4.1: Evaluation of Plant-Produced HMAC
37
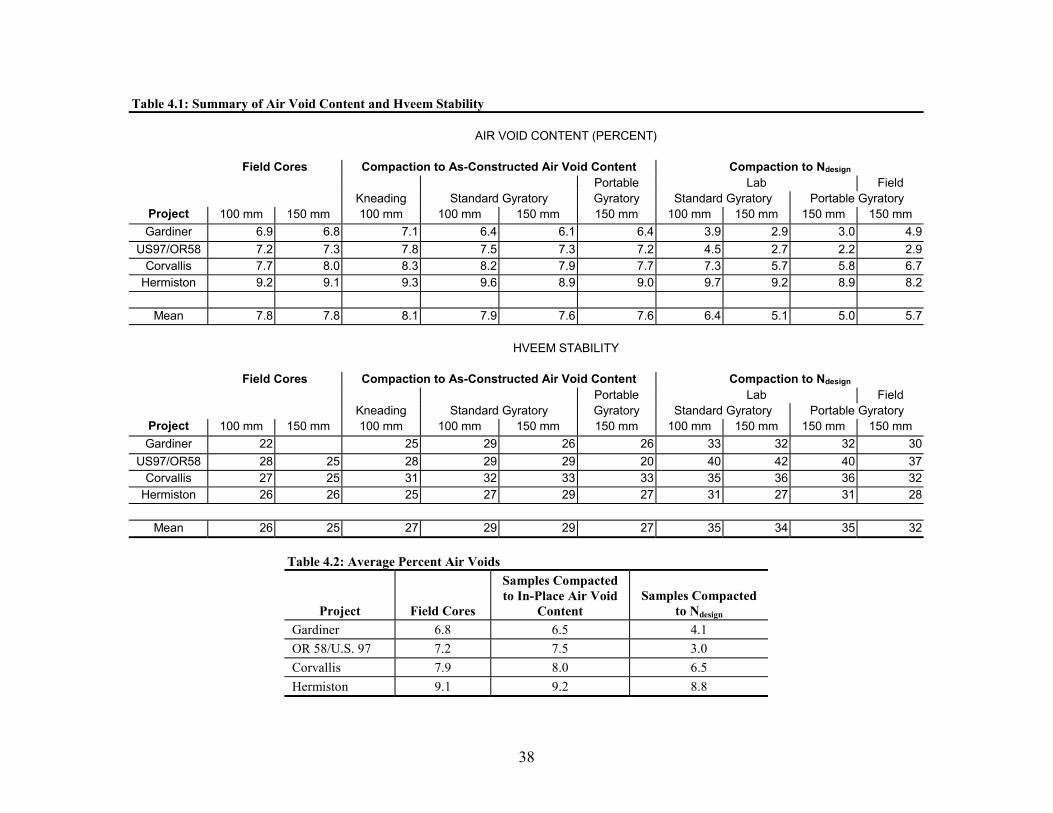
Table 4.1: Summary of Air Void Content and Hveem Stability
AIR VOID CONTENT (PERCENT)
Field Cores Compaction to As-Constructed Air Void Content Compaction to Ndesign
Portable Lab Field Kneading Standard Gyratory Gyratory Standard Gyratory Portable Gyratory
Project 100 mm 150 mm 100 mm 100 mm 150 mm 150 mm 100 mm 150 mm 150 mm 150 mm Gardiner 6.9 6.8 7.1 6.4 6.1 6.4 3.9 2.9 3.0 4.9
US97/OR58 7.2 7.3 7.8 7.5 7.3 7.2 4.5 2.7 2.2 2.9 Corvallis 7.7 8.0 8.3 8.2 7.9 7.7 7.3 5.7 5.8 6.7
Hermiston 9.2 9.1 9.3 9.6 8.9 9.0 9.7 9.2 8.9 8.2
Mean 7.8 7.8 8.1 7.9 7.6 7.6 6.4 5.1 5.0 5.7
HVEEM STABILITY
Field Cores Compaction to As-Constructed Air Void Content Compaction to Ndesign
Portable Lab Field Kneading Standard Gyratory Gyratory Standard Gyratory Portable Gyratory
Project 100 mm 150 mm 100 mm 100 mm 150 mm 150 mm 100 mm 150 mm 150 mm 150 mm Gardiner 22 25 29 26 26 33 32 32 30
US97/OR58 28 25 28 29 29 20 40 42 40 37 Corvallis 27 25 31 32 33 33 35 36 36 32
Hermiston 26 26 5 7 29 7 31 27 31 28 2 2 2
Mean 26 25 27 29 29 27 35 34 35
Table 4.2: Average Percent Air Voids
Project Field Cores
Samples Compacted to In-Place Air Void
Content Samples Compacted
to Ndesign
Gardiner 6.8 6.5 4.1 OR 58/U.S. 97 7.2 7.5 3.0 Corvallis 7.9 8.0 6.5 Hermiston 9.1 9.2 8.8
38
32

4.1 AIR VOID CONTENT
Table 4.2 and Figures 4.2 to 4.6 include comparisons of air void content among various samples. As shown in Figure 4.2, there is virtually no difference between the 100 mm and 150 mm diameter field cores. Since air void content appears to be independent of core diameter, there may be both logistical and economic benefits: less effort for handling; less storage space needed; and reduced drilling costs. However, the benefit of performance testing, which is likely to require 150 mm diameter cores, may offset the logistical and economic benefits previously noted.
Field Core Comparison
0
2
4
6
8
10
Gardiner OR58/US97 Corvallis Hermiston
Perc
ent A
ir Vo
ids
100 mm 150 mm
Figure 4.2: Air void content of field cores
There was, as expected, a difference in air void content between field cores and samples compacted to Ndesign gyrations, as shown in Figure 4.3. Generally, the as-constructed air void content was higher than that of samples compacted to Ndesign gyrations. The range in as-constructed air void content was 6.8 to 9.1 percent, whereas the range in air void content for samples compacted to Ndesign was 3.0 to 8.8 percent. The as-constructed air void content was typically about 2 percent higher than the Ndesign air void content. It was only for the Hermiston project that the as-constructed and Ndesign air void contents were approximately equal – 9.1 and 8.8 percent, respectively.
Recalling that SHRP researchers hypothesized that Ndesign gyrations should yield an equilibrium or ultimate air void content, i.e., after the pavement had sustained the design traffic, one might have expected an even greater difference between the as-constructed air void content and that of
39
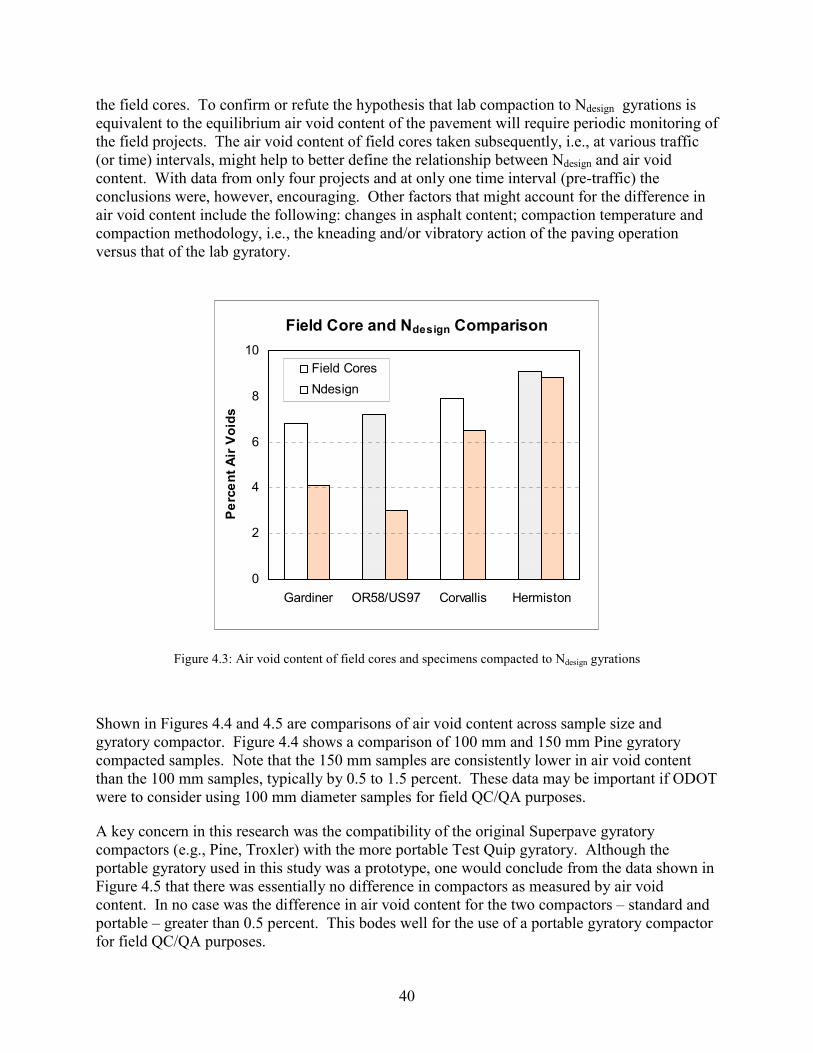
the field cores. To confirm or refute the hypothesis that lab compaction to Ndesign gyrations is equivalent to the equilibrium air void content of the pavement will require periodic monitoring of the field projects. The air void content of field cores taken subsequently, i.e., at various traffic (or time) intervals, might help to better define the relationship between Ndesign and air void content. With data from only four projects and at only one time interval (pre-traffic) the conclusions were, however, encouraging. Other factors that might account for the difference in air void content include the following: changes in asphalt content; compaction temperature and compaction methodology, i.e., the kneading and/or vibratory action of the paving operation versus that of the lab gyratory.
Field Core and Ndesign Comparison
0
2
4
6
8
10
Gardiner OR58/US97 Corvallis Hermiston
Perc
ent A
ir V
oids
Field Cores Ndesign
Figure 4.3: Air void content of field cores and specimens compacted to Ndesign gyrations
Shown in Figures 4.4 and 4.5 are comparisons of air void content across sample size and gyratory compactor. Figure 4.4 shows a comparison of 100 mm and 150 mm Pine gyratory compacted samples. Note that the 150 mm samples are consistently lower in air void content than the 100 mm samples, typically by 0.5 to 1.5 percent. These data may be important if ODOT were to consider using 100 mm diameter samples for field QC/QA purposes.
A key concern in this research was the compatibility of the original Superpave gyratory compactors (e.g., Pine, Troxler) with the more portable Test Quip gyratory. Although the portable gyratory used in this study was a prototype, one would conclude from the data shown in Figure 4.5 that there was essentially no difference in compactors as measured by air void content. In no case was the difference in air void content for the two compactors – standard and portable – greater than 0.5 percent. This bodes well for the use of a portable gyratory compactor for field QC/QA purposes.
40

100 mm and 150 mm Pine Comparison
0
2
4
6
8
10
12
Gardiner OR58/US97 Corvallis Hermiston
Perc
ent A
ir Vo
ids
100 mm Pine 150 mm Pine
Figure 4.4: Air void content of gyratory compacted specimens (100 mm vs. 150 mm)
Gyratory Compactor Comparison
0
2
4
6
8
10
Gardiner OR58/US97 Corvallis Hermiston
Perc
ent A
ir Vo
ids
150 mm Pine
150 mm Test Quip
Figure 4.5: Air void content of gyratory compacted specimens (Pine vs. Test Quip)
41
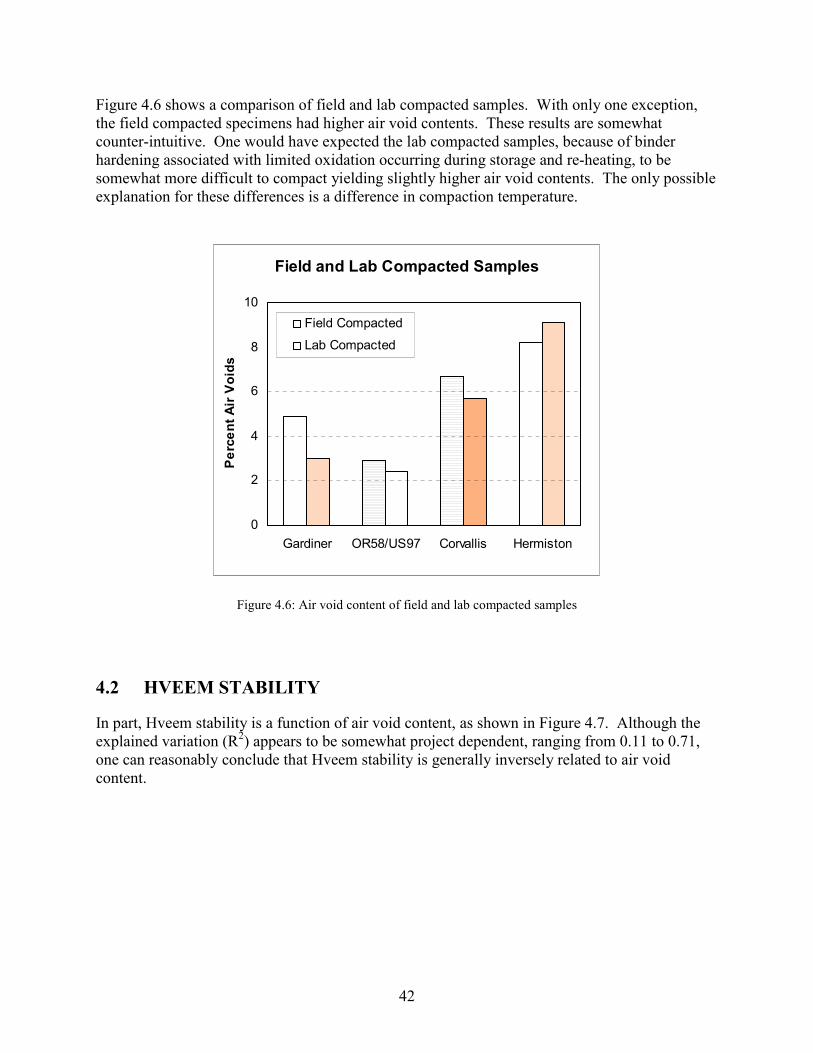
Figure 4.6 shows a comparison of field and lab compacted samples. With only one exception, the field compacted specimens had higher air void contents. These results are somewhat counter-intuitive. One would have expected the lab compacted samples, because of binder hardening associated with limited oxidation occurring during storage and re-heating, to be somewhat more difficult to compact yielding slightly higher air void contents. The only possible explanation for these differences is a difference in compaction temperature.
Field and Lab Compacted Samples
0
2
4
6
8
10
Gardiner OR58/US97 Corvallis Hermiston
Perc
ent A
ir Vo
ids
Field Compacted Lab Compacted
Figure 4.6: Air void content of field and lab compacted samples
4.2 HVEEM STABILITY
In part, Hveem stability is a function of air void content, as shown in Figure 4.7. Although the explained variation (R2) appears to be somewhat project dependent, ranging from 0.11 to 0.71, one can reasonably conclude that Hveem stability is generally inversely related to air void content.
42

Hveem Stability vs Air Void Content
15
20
25
30
35
40
2 6 10
% Air Voids
Hvee
m S
tabi
lity
Hveem Stability
Linear Regression
R2 = 0.47
4 8
Figure 4.7a: Regression of Hveem stability vs air void content (Gardiner)
Hveem Stability vs Air Void Content
15
20
25
30
35
40
45
2 6 10
% Air Voids
Hvee
m S
tabi
lity
Hveem Stability
Linear Regression
R2 = 0.71
4 8
Figure 4.7b: Regression of Hveem stability vs air void content (OR 58/U.S. 97)
43

Hveem Stability vs Air Void Content
20
25
30
35
40
4 8 10
% Air Voids
Hvee
m S
tabi
lity
Hveem Stability Linear Regression
R2 = 0.30
6
Figure 4.7c: Regression of Hveem stability vs air void content (Corvallis)
Hveem Stability vs Air Void Content
20
25
30
35
6 8 10 12
% Air Voids
Hvee
m S
tabi
lity
Hveem Stability
Linear Regression
R2 = 0.11
Figure 4.7d: Regression of Hveem stability vs air void content (Hermiston)
44

Table 4.3 and Figures 4.8 and 4.9 include comparisons of Hveem stability among various samples. The data in Table 4.3 indicate that the field cores generally had lower stabilities than the samples compacted to the as-constructed air void content or to Ndesign gyrations. From Figure 4.8 one observes that the gyratory compacted specimens yielded slightly higher stability numbers than did the field cores. There appears to be only one exception, that of the 150 mm Test Quip samples from the OR 58/US 97 project. Also, the kneading compacted specimens tended to yield slightly higher stability numbers than did the field cores. Finally, there were but minor differences in stability between 100 mm specimens and 150 mm specimens from which 100 mm specimens were cored.
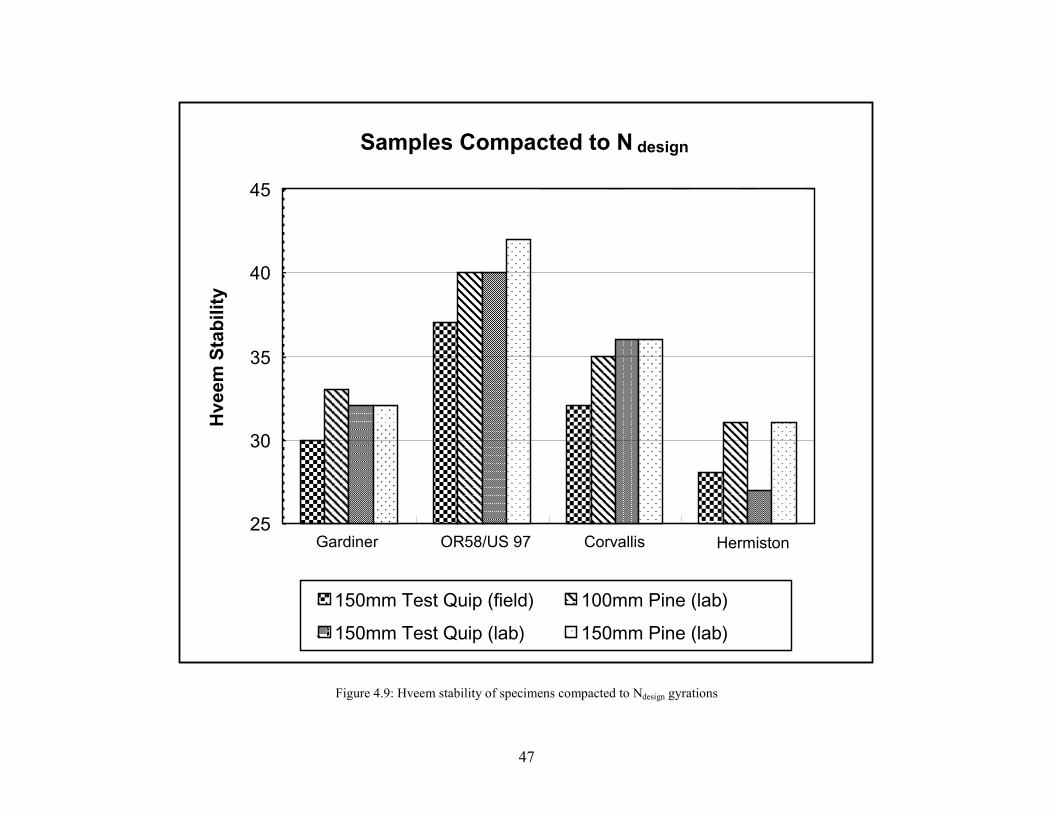
Shown in Figure 4.9 is a comparison of Hveem stability for samples compacted to Ndesign. Note that there were samples compacted in the field during construction and in the lab at a later date. Generally, the samples compacted in the field (150 mm Test Quip gyratory) had lower stability numbers than did the samples compacted in the lab. Data from the Hermiston project was the only exception. The consistent difference in stability, though small (3 to 5), was between field and lab compacted samples. There was very little difference in the stability of lab compacted samples, regardless of gyratory type or specimen diameter. The slight difference in stability between field and lab compacted samples may be attributed to the fact that lab compacted samples have aged somewhat during storage and re-heating making the binder a bit stiffer and, in turn, increasing the stiffness of the mix.
Table 4.3: Average Hveem Stability Samples Compacted
Project Field Cores To In-Place Air Voids To Ndesign
150 mm Test Quip to Ndesign
150 mm Pine
to Ndesign
Gardiner 22 26 31 32 32 OR 58/U.S. 97 27 26 39 40 42 Corvallis 26 32 4 6 6 Hermiston 26 27 9 1 7
3 3 32 3 2
It is noteworthy that none of the field cores, regardless of field project, met ODOT’s minimum Hveem stability criterion of 35. Possible reasons for low stability include a low percentage of fractured aggregate faces, binder content that exceeds “optimum,” and segregation. Although the aggregate met the Superpave criterion for percent fractured faces, it was near the lower limit. Unfortunately, the aggregate consensus criteria included in the Superpave methodology were not validated with any strength or performance tests. Inadequate fractured faces of aggregate would obviously limit internal friction and thus yield a low Hveem stability. Though these data are anecdotal at best, it appears that the Superpave mix design tended to yield a design binder content slightly higher than ODOT’s traditional Hveem methodology, and hence, a lower stability. Mix segregation, perhaps due to the sampling technique, might also have contributed to the low stability.
45

46
Samples Compacted toAs-Constructed Air Void Content
15
20
25
30
35
Hve
em S
tabi
lity
100mm Field Cores 150mm Field Cores100mm Kneading 100mm Pine150mm Test Quip 150mm Pine
Figure 4.8: Hveem stability of specimens compacted to as-constructed air void content
Gardiner Corvallis HermistonOR58/US 97
47
Samples Compacted to N design
25
30
35
40
45H
veem
Sta
bilit
y
150mm Test Quip (field) 100mm Pine (lab)
150mm Test Quip (lab) 150mm Pine (lab)
Figure 4.9: Hveem stability of specimens compacted to Ndesign gyrations
Gardiner Corvallis HermistonOR58/US 97

48

5.0 CONCLUSIONS AND RECOMMENDATIONS
5.1 CONCLUSIONS
Application of quality management concepts to asphalt paving evolved because recipe specifications frequently proved inadequate for ensuring pavement performance. Quality management of asphalt concrete is founded on the premise that the producer controls the end-quality of the product, including the in-place void content on which pavement performance is highly dependent.
In its quality management program Oregon DOT initially used the Marshall hammer for field control for a variety of reasons: the Hveem compactor (kneading) was not suitable for field operations and the Superpave gyratory compactor was not available at the time this research began. However, ODOT’s earlier work on field control of asphalt concrete mixes using the Texas gyratory compactor was encouraging. The gyratory compactor, an integral part of the Superpave system, is also a potential tool for quality control/assurance (QC/QA) as measured by as-constructed air void content. However, as originally configured the mass of the prototype Superpave gyratory compactors was approximately 360 kg to 540 kg, not ideally suited for field operations. Post-SHRP research led to the development of truly portable gyratory compactors, ie, those of 70 kg to 140 kg mass.
Like the conventional Hveem method of mix design, selecting and proportioning materials as well as laboratory compaction are integral parts of the Superpave technology. There is, however, some concern as no strength test is required at low traffic levels. Numerous state DOTs have indicated that some sort of “proof testing” will be used to supplement the Superpave mix design. Given ODOT’s long use of and success with Hveem mix design, Hveem stability was used in this research as a relative measure of the strength of Superpave mixes.
In view of the preceding, the primary objective of this research was to assess the effectiveness of a portable gyratory compactor for field quality control purposes. A secondary objective was to determine the quality of Superpave mixes as measured by Hveem stability. To that end the following conclusions are noteworthy:
� With regard to the operational characteristics of the Test Quip gyratory, its mass of approximately 140 kg requires at least two people to maneuver or lift it. An opening at the top of the hydraulic fluid reservoir allows the fluid to spill when the machine is tilted, making loading and transport somewhat tentative. Calibration, however, is straightforward, simple and completely automated. Similarly, charging the mold, compaction, and sample extrusion are accomplished with relative ease but are a bit more time consuming than with the prototype gyratory, i.e., Pine or Troxler. Using a torque wrench was found to be helpful when securing the gyratory head to the loading frame. Finally, maintenance of the device was quite easy.
49

� There was essentially no difference between the portable and prototype gyratory compactors as measured by air void content of 150 mm samples. In no case was the difference in air void content greater than 0.5 percent.
� Comparison of 100 mm and 150 mm samples compacted in the prototype gyratory was instructive in that the latter were consistently lower in air void content, typically by 0.5 to 1.5 percent. This certainly must be considered should ODOT opt to use 100 mm samples for mix design and/or QC/QA purposes.
� The air void content of plant mix samples compacted to Ndesign gyrations was consistently lower than that of the field cores, generally by at least 2 percent. The range in air void content of plant mix samples compacted to Ndesign gyrations was 3.0 to 8.8 percent, whereas the range in air void content of the field cores was 6.8 to 9.1 percent. It is the range in air void content � 3.0 to 8.8 percent � that is of primary concern as it indicates an unexpected degree of variability in the process. The most likely sources of this variability are project-specific materials and/or construction operations. Post-SHRP research has led to a dramatic consolidation of the Ndesign compaction matrix (Brown, et al. 1998). Instead of the original 28 Ndesign alternatives there are now only 4. Still, this revision to the compaction matrix is not believed to be a contributing factor to the variability previously noted. The original Ndesign gyrations for the ODOT projects were 86 (Gardiner) and 96 (OR 58/US 97, Corvallis and Hermiston). In the revised compaction matrix Ndesign gyrations for all ODOT projects is 100. To confirm or refute the SHRP researchers’ hypothesis � that Ndesign represents the air void content of the pavement at the design traffic level � requires periodic measurement of wheel-path air void content. An assumption made in the mix design phase � that the correction factor for the computation of bulk specific gravity (Gmb) is linear � might be a contributing factor to the difference between the as-measured and Ndesign air void contents. Recall that in mix design specimens are compacted to Nmaximum gyrations. At Nmaximum the height of the compacted specimen is used to compute a bulk specific gravity, an estimated Gmb. This estimated Gmb is used with the measured Gmb to determine a correction factor that is used with the height of the specimen to compute the bulk specific gravity at each gyration. This issue was recently addressed in research funded by the National Cooperative Highway Research Program. During mix design specimens are now compacted to Ndesign rather than Nmaximum and bulk specific gravity is measured rather than estimated (Brown, et al. 1998).
� On a more positive note, the data indicate that there is virtually no difference in air void content between 100 mm and 150 mm field cores.
� Although the explained variation (R2) appears to be somewhat project dependent, ranging from 0.11 to 0.71, one can reasonably conclude that Hveem stability is generally inversely related to air void content.
� Field cores generally have lower stabilities than do gyratory- or kneading-compacted samples.
50
� There is very little difference in the stability of lab compacted samples, regardless of gyratory type or specimen diameter.
� There was a consistent but small difference in stability (3 to 5 percent) between field and lab compacted samples. The slight difference is attributed to the fact that lab compacted samples have aged somewhat during storage, and re-heating makes the binder a bit more viscous and, in turn, increases the stiffness of the mix.
� None of the field cores, regardless of project, met ODOT’s minimum Hveem stability criterion of 35. Possible reasons for low stability include the following: a low percentage of fractured aggregate faces; binder content that exceeds optimum; and segregation. Although the aggregate met the Superpave criterion for percent fractured faces, it was near the lower limit. Recall, however, the aggregate consensus criteria included in the Superpave methodology were not validated with any strength or performance tests. Inadequate fractured faces of aggregate would obviously limit internal friction and thus yield a low Hveem stability. Though these data are anecdotal at best, it appears that the Superpave mix design tends to yield a design binder content slightly higher than ODOT’s traditional Hveem methodology, and hence, a lower stability. Given the unusually low Hveem stability numbers associated with these Superpave mix designs, careful monitoring of the field performance is imperative.
5.2 RECOMMENDATIONS
The data gathered in this research indicate that there is virtually no difference between the prototype (Pine) and portable (Test Quip) gyratory compactors as measured by air void content and Hveem stability. Accordingly, it is recommended that ODOT consider the use of the portable gyratory for QC/QA purposes, assuming that the more fundamental issues of Superpave mix design are resolved.
Since Hveem stability of field cores did not meet ODOT’s minimum criterion of 35, early and continuous monitoring of the field performance is imperative. As part of the performance monitoring, it is recommended that wheel-path air void content be periodically measured to confirm/refute the Ndesign concept.
51

52

6.0 REFERENCES
Anderson, R., R. Bosley and P. Creamer. Quality Management of HMA Construction Using Superpave Equipment: A Case Study, Transportation Research Record 1513, 1995.
Asphalt Institute. Mix Design Methods for Asphalt Concrete and Other Hot-Mix Types: MS-2. Sixth Edition, October 1993.
Asphalt Institute. Superpave Series No. 2 (Sp-2). Lexington, Kentucky, 1996.
Brown, E.R. and M.S. Buckman. Superpave Gyratory Compaction Guidelines. Transportation Research Board, National Cooperative Highway Research Program, Washington, DC, 1998.
Bukowski, J. Asphalt Contractor. pp. 30-34, October 1995.
Harmon, T., J. D’Angelo and J. Bukowski. Evaluation of Superpave Gyratory Compactor in the Field Management of Asphalt Mixes: Four Simulation Studies. Transportation Research Record 1513, 1995.
McGennis, R.B., R.M. Andersen, T.W. Kennedy and M. Solaimanian. Background of Superpave Asphalt Mixture Design and Analysis. FHWA-SA-95-003, February 1995.
Terrel, R. and A. George. Field Control of Asphalt Paving Mixtures. FHWA-OR-95-04, January 1994.
Vallerga, B.A. and W.R. Lovering. Evolution of the Hveem Stabilometer Method of Designing Asphalt Paving Mixtures. Proceedings of the Association of Asphalt Paving Technologists Technical Sessions, v. 54, pp. 243-265, February 1985.
53

54