field report: utah equipment loan #9
TRANSCRIPT

EL09-2016Implementation Assistance Program
Tools to Improve PCC Pavement Smoothness During Construction (R06E)
Seeking widespread adoption of the real-
time smoothness (RTS) technology by
contractors and agencies who routinely
construct PCC pavements will be achieved
through:
1. Equipment Loan Program
2. Showcases
3. Workshops
4. Case studies/results Documentation
5. Specification Refinement
6. Marketing & Outreach
FIELD REPORT: UTAH EQUIPMENT LOAN #9

2
INTRODUCTION The Federal Highway Administration (FHWA) has contracted with the National Center for Concrete
Pavement Technology (CP Tech Center) for Implementation Support for Strategic Highway Research
Program II (SHRP2) Renewal R06E Real-time Smoothness Measurements on Portland Cement
Concrete Pavements During Construction. One of the tasks included in this contract is equipment
loans to contractors. This task involves facilitating the loan of real-time smoothness equipment for
field trial use on 11 designated PCC pavement construction projects. The scope of this task includes
the following activities:
• Provide equipment (GOMACO GSI or Ames RTP) and labor for a field trial of 10 to 30 paving
days
• Provide technical assistance for equipment installation start-up and operation
• On-call technical support throughout the duration of the field trial
• Planning, coordination and execution of the field trials
• Contact the recipient within 5 days of notice to proceed from the COR
• On-site support for at least 2 weeks
• Maintain a master list of field trial participants and update the list quarterly
This report summarizes the activities and findings of an equipment loan conducted in Utah.
PROJECT DETAILS The equipment loan was performed in July and August of 2016 on a project in Salt Lake County,
Utah. Table 1 summarizes the pertinent project details.
Table 1. Salt Lake County, UT, I-15 Project Information
Item Details
Project Location Mainline paving of I-15 in Weber and Box Elder Counties, UT.
Route I-15
Agency Utah Department of Transportation (UDOT)
3
Item Details
Paving Contractor Geneva Rock Products, Inc.
Paving Equipment Gomaco 2800 paver with DBI and Trimble stringless machine control
Real-Time System Ames RTP
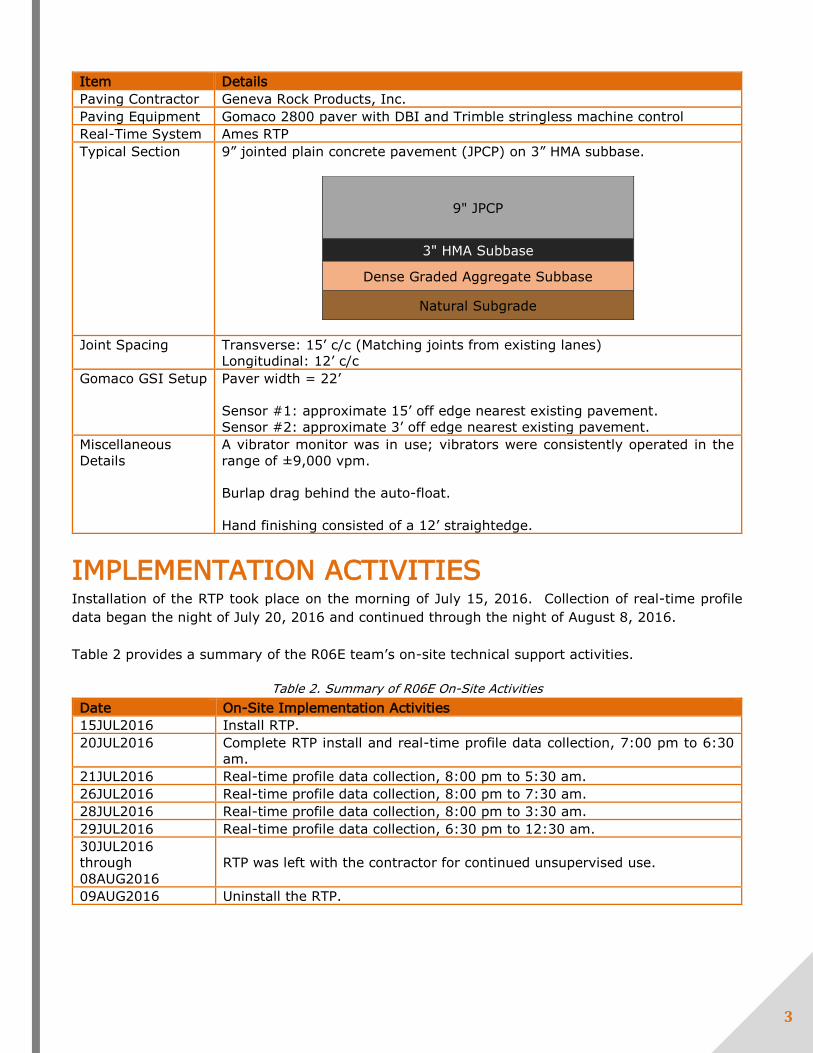
Typical Section 9” jointed plain concrete pavement (JPCP) on 3” HMA subbase.
9" JPCP
3" HMA Subbase
Dense Graded Aggregate Subbase
Natural Subgrade
Joint Spacing Transverse: 15’ c/c (Matching joints from existing lanes)
Longitudinal: 12’ c/c
Gomaco GSI Setup Paver width = 22’
Sensor #1: approximate 15’ off edge nearest existing pavement.
Sensor #2: approximate 3’ off edge nearest existing pavement.
Miscellaneous
Details
A vibrator monitor was in use; vibrators were consistently operated in the
range of ±9,000 vpm.
Burlap drag behind the auto-float.
Hand finishing consisted of a 12’ straightedge.
IMPLEMENTATION ACTIVITIES Installation of the RTP took place on the morning of July 15, 2016. Collection of real-time profile
data began the night of July 20, 2016 and continued through the night of August 8, 2016.
Table 2 provides a summary of the R06E team’s on-site technical support activities.
Table 2. Summary of R06E On-Site Activities
Date On-Site Implementation Activities
15JUL2016 Install RTP.
20JUL2016 Complete RTP install and real-time profile data collection, 7:00 pm to 6:30
am.
21JUL2016 Real-time profile data collection, 8:00 pm to 5:30 am.
26JUL2016 Real-time profile data collection, 8:00 pm to 7:30 am.
28JUL2016 Real-time profile data collection, 8:00 pm to 3:30 am.
29JUL2016 Real-time profile data collection, 6:30 pm to 12:30 am.
30JUL2016
through
08AUG2016
RTP was left with the contractor for continued unsupervised use.
09AUG2016 Uninstall the RTP.

4
OBSERVATIONS, DATA and ANALYSES This equipment loan was initiated through discussions with the local concrete pavement association
representative. It was planned to coincide with the Real-Time Smoothness Technology National
Showcase held in Salt Lake City, UT on August 9th, 2016. Both the contractor and UDOT were
interested in utilizing the RTS equipment because UDOT had just recently transitioned from a
profilograph index (PI) to an international roughness index (IRI) for pavement smoothness
acceptance.
The paving observed by the SHRP2 team was rural mainline paving. I-15 was widened to the inside
median. The primary challenge to achieving smoothness for this project was the influence of
matching the existing I-15 mainline pavement which can introduce roughness which wouldn’t
otherwise be present for pilot lane paving. Geneva’s crews demonstrated quality workmanship and
a clear understanding of slipform paving materials and processes. No major issues were observed
during our tenure on the project.
Figures 1 through 4 illustrate different aspects of the project and RLW’s paving processes.
Figure 1. RTP (yellow ovals) Installed Behind the
Dowel-Bar-Inserter (with OCB).
Figure 3. Typical Finishing Hand Finishing Behind
the Paver
Figure 2. Concrete Dumped Directly in Front of the
Paver and Right Side of Paver Matching Existing
Slab.
Figure 4. Trimble Stringless Robotic Lasers Setup on
Median Barrier

5
CONCRETE MIXTURE Initial smoothness is sensitive to the workability and uniformity of the concrete mixture. The mixture
proportions used by Geneva are shown in Table 3.
Table 3. Concrete Mixture Proportions

6
Combined gradation data is provided in Table 4 and Figures 5 and 6.
Table 4. Tabular Sieve Analysis Data
Project:
Mix ID:
Test Date: SUPPLIER AVERAGES (coarse JUN thru AUG 2015; f ine OCT thru NOV 2015)
658 lb/yd3
Agg. Ratios: 61.60% 0.00% 38.40% 0.00% 100.00%
Sieve Coarse Intermediate Fine #1 Fine #2
Combined %
Retained
Combined %
Retained On
Each Sieve
Combined %
Passing
2 ½" 100% 100% 0% 0% 100%
2" 100% 100% 0% 0% 100%
1 ½" 100% 100% 0% 0% 100%
1" 100% 100% 0% 0% 100%
¾" 84% 100% 10% 10% 90%
½" 42% 100% 36% 26% 64%
⅜" 22% 100% 48% 12% 52%
#4 1% 99% 61% 13% 39%
#8 1% 85% 67% 5% 33%
#16 1% 67% 74% 7% 26%
#30 1% 46% 82% 8% 18%
#50 0.4% 19% 92% 11% 8%
#100 0.3% 3% 99% 6% 1%
#200 0.2% 1.2% 99.4% 0.8% 0.6%
Workability Factor: 35.8 20% Coarse Sand
Coarseness Factor: 72.0 26% Fine Sand
REAL-TIME SMOOTHNESS IMPLEMENTATION
Combined Gradation Test Data
Total Cementitious Material:
Sample Comments: MIX DESIGN FROM GENEVA
I-15 FARR WEST TO BRIGHAM CITY
n/a

7
Figure 5. I-15 Combined Percent Retained (Tarantula Curve)
0%
4%
8%
12%
16%
20%
24%
28%
32%
36%
40%
44%
48%
52%
2 ½
" 2"
1 ½
" 1" ¾"
½"
⅜"
#4 #8 #16
#30
#50
#10
0
#20
0
Per
cen
t R
etai
ned
Sieve Size
I-15 FARR WEST to BRIGHAM CITYTarantula Curve
SUPPLIER AVERAGES (coarse JUN thru AUG 2015; fine OCT thru NOV 2015)
Coarse sand: Sum of combined retained on the #8, #16 and #30 ≥ 15%
Fine sand: Sum of combined retained on the #30, #50, #100 and #200 ≥ 24% and ≤ 34%

8
Figure 6. I-15 Combined Gradation Coarseness and Workability Factors
20
25
30
35
40
45
50
0102030405060708090100
Wo
rkab
ilit
y(p
erce
nt)
Coarseness Factor(percent)
I-15 FARR WEST to BRIGHANM CITY
SUPPLIER AVERAGES (coarse JUN thru AUG 2015; fine OCT thru NOV 2015)
Well Graded1 1/2" - 3/4"
Control Line
Sandy
Gap Graded
Well GradedMinus 3/4"
Rocky

9
PROFILE CHARCTERISTICS The following information is provided to illustrate how real-time smoothness systems can be used as
a tool to improve the initial smoothness of concrete pavements.
Real-Time Smoothness (RTS) vs. Hardened QC Profile
There was an approximate two-week delay in receiving hardened profile data files from Geneva. This
made matching the station limits between hardened and real-time profiles difficult. In general, the
real-time profiles were approximately 100 in/mi and the hardened profiles were approximately
65 in/mi. This is a larger difference than we are accustomed to seeing. Based upon our observations
during the equipment loan, we attribute this larger than normal difference to vibration of the RTP
sensors from operation of the dowel-bar inserter and short wavelength surface irregularities imparted
by the oscillating correcting beam. The short wavelength surface irregularities were picked up by the
RTP but subsequently removed by the auto-float and hand finishing, thus did not influence the
hardened profiles.
Stringless Control System Influence on Real-Time Smoothness
During the equipment loan, it was observed that the IRI values fluctuated regularly. On the night of
July 27, a pattern of increasing and then decreasing IRI was apparent at intervals of approximately
350’ (Figure 7), and particularly on the right side of the paver. This matched the spacing between
the stringless robotic total stations controlling the paver’s elevation and steering, with the right side
of the paver being further from the stringless total stations than the left side.
Figure 7. Real-Time Profile Data Illustrating Fluctuation of IRI Corresponding to Stringless Gun Swaps (IRI based
on 150’ base length matches real-time settings as viewed on the screen 27JUL2016)
Once this relationship was observed, the contractor reduced the distance between robotic total
stations to improve IRI results.
Repeating Profile Features
The power spectral density analysis (PSD) from ProVAL shows the 15’ joint spacing and 13’ from
concrete load spacing as the dominant wavelengths contributing to roughness in the hardened profile
(Figure 8). The PSD for hardened profile was run with a butterworth band pass at 1’ to 30’ to remove
the influence of long wavelength roughness from the operation of the stringless system.
350’ 350’ 375’ 350’

10
Figure 8. PSD Analysis Showing Joint Spacing at 15’ and Concrete Loads at 13’ with Associated Harmonic
Wavelengths Contributing to Pavement Roughness
CONCLUSIONS and LESSONS LEARNED The following points summarize the preliminary conclusions made from profile analyses and on-site
documentation, as well lessons learned from the equipment loan.
Profile Analyses: • Real-time IRI measurements for the right side of the paver which was matching the existing
pavement was consistently rougher than the left side.
• Besides the long wavelength roughness influenced by the spacing of the stringless total station
swaps, the joints (inserted dowels) and concrete load spacing had the largest influence on
real-time IRI measurements.
SHRP2 Implementation Team and Contractor Observations • An exit interview was conducted with the paving superintendent. His observations regarding
real-time smoothness measurements included:
o The RTP was useful in identifying the impact of spacing on the stringless gun swaps.
o Real-time profile information is useful for identifying impacts on smoothness and then
verifying the effectiveness of changes to the paving process.
• Soon after the SHRP2 equipment loan, the paving superintendent expressed interest in
purchasing an RTP pending budget approval from management.