field validation of polyethylene passive air samplers for ... · field validation of polyethylene...
TRANSCRIPT

Field Validation of Polyethylene Passive Air Samplers for Parent andAlkylated PAHs in Alexandria, EgyptMohammed A. Khairy*,†,‡ and Rainer Lohmann†
†Graduate School of Oceanography, University of Rhode Island, 215 South Ferry Road, Narragansett, Rhode Island 02882, UnitedStates‡Department of Environmental Sciences, Faculty of Science, Alexandria University, 21511 Moharam Bek, Alexandria, Egypt
*S Supporting Information
ABSTRACT: Polyethylene samplers (PEs) were deployed at 11 locations inAlexandria, Egypt during summer and winter to test and characterize them aspassive samplers for concentrations, sources, and seasonal variations of atmosphericconcentrations of polycyclic aromatic hydrocarbons (PAHs). PE−air equilibriumwas attained faster for a wider range of PAHs during the winter season possibly dueto increased wind speeds. Calculated PE−air partitioning constants, KPE‑A, in ourstudy [Log KPE‑A = 0.9426 × Log KOA − 0.022 (n = 12, R2 = 0.99, Std error =0.053)] agreed with literature values within <46%. For parent (exceptnaphthalene), mono- and dialkylated PAHs, active sampling based concentrationsof PAHs were within an average factor of 1.4 (1.0−5.6) compared to the PE basedvalues. For C3−4 alkylated PAHs, KPE‑A values were lower than predicted, onaverage by ∼0.8 log units per carbon in the alkylation. Enthalpies of vaporization(ΔHvap) accurately corrected KPE‑As for temperature differences between winterand summer sampling. PAH profiles were dominated by naphthalene, phenanthrene, and alkylated phenanthrenes. Calculateddiagnostic ratios indicated that PAHs originated mainly from vehicle emissions.
■ INTRODUCTIONUrban air pollution is of major concern in Egypt as industrialwastes, traffic congestion, and overcrowding in cities releasepollutants that greatly contribute to environmental damage.1
Polycyclic aromatic hydrocarbons (PAHs) are a group oforganic pollutants that are present in the atmosphere due toemissions from gasoline- and diesel-powered vehicles,2
municipal and commercial incinerators,3 residential heatingsystems that combust fuels such as coal, wood, gas, and oil,various industrial processes, and volatilization from pollutedgrounds.4 The main concern of PAHs is that some havecarcinogenic properties that are associated with increasing sizeof the molecule (4−6 rings) and their metabolic transformationto reactive diol epoxides.Despite the importance of the atmospheric pathway for
human exposure, atmospheric monitoring of PAHs is notroutinely performed in Egypt. This is mainly due to therequirements of expensive high-volume sampling equipment,which is reliant on continuous field maintenance and electricityto operate. Thus the availability of data regarding atmosphericPAH concentrations is sparse5,6 or lacking. In Alexandria forexample, eight monitoring stations were established formonitoring the atmospheric quality since the establishment ofthe Egyptian environmental Law (Law No. 4, 1994). Thesemonitoring stations previously were used to continuouslycollect data on the levels of some gases (NOx, SO2, CO, O3)and particulates (TSP and PM10) (see text SI 1, Figures SI 1and SI 2 for more details). To our knowledge, most of these
stations are not operating at the moment. The lack of data hasposed some difficulties for establishing pollution control andmanagement plans. Cheap and easy air sampling techniques aretherefore helpful or sometimes the only choice for surveys.Passive air samplers have proven to be a powerful monitoring
technique for SOCs, and they are cheaper and require less laborcompared to active samplers7−13 (Table SI 1). By using passivesamplers, more measurements can be undertaken to establishspatial and temporal trends at reduced cost. Yet manysubstances measured with passive sampling do not reachequilibrium during the exposure period. This is a drawback tosome extent because it makes the in situ calibration of theuptake process necessary which is associated with a degree ofuncertainty. However, the major advantage is that a time-integrated concentration is obtained that can be used forcompliance checking with time-averaged standards. Because ofthe long exposure periods of passive samplers, the exact sizeand timing of a peak concentration cannot be specified, makingit less suitable for compliance checking with the maximumacceptable concentration. One important drawback of passivesamplers is that if a sample is lost, it is not possible to collect anew sample quickly. This is due to the required exposure time.
Received: January 3, 2012Revised: March 6, 2012Accepted: March 7, 2012Published: March 7, 2012
Article
pubs.acs.org/est
© 2012 American Chemical Society 3990 dx.doi.org/10.1021/es300012u | Environ. Sci. Technol. 2012, 46, 3990−3998

Active sampling has advantages as an established andaccepted method for determining atmospheric concentrationsof pollutants both in the gas and particulate phases. Thepreferential occurrence of a chemical pollutant in the gaseousphase or the particulate phase will greatly depend on theprevailing environmental factors and the physicochemicalproperties of the chemical pollutant. Most of the lowermolecular weight PAHs (2−3 rings PAHs), for example, willoccur in the gaseous phase compared to the higher molecularweight PAHs (5−6 rings PAHs) which are mainly associatedwith the airborne particles. Thus in risk assessment studies,passive sampling of PAHs will be less suitable as most of thePAHs classified as toxic or carcinogenic (5−6 rings PAHs) willoccur in the particulate phase. However, the applications ofactive samplers in monitoring studies also encounter limitationsand disadvantages (Table SI 1). Active samplers are noisy (anissue in residential environments), need electricity (a problemin remote areas where energy supplies may be lacking), and areexpensive since pumps are costly, labor intensive, and time-consuming. These are reasons for low temporal and spatialresolution in many monitoring networks. Moreover, otherpossible artifacts of active samplers are breakthrough ofpollutants and degassing of pollutants from particles on thefilter which both affect the quality of the measurement.14,15
We suggest that passive samplers are the best option fordetermining background concentrations of semivolatile organiccompounds in places were no data exist. Depending on theobtained results, decision makers could decide which placesrequires more detailed investigation (applying the conventionalactive samplers) and which locations can be skipped (whendetected concentrations are below quality standard standards).Once it has been determined several times with passivesampling that concentrations are well below the standard, thesampling frequency may be reduced, thereby saving costs.The basic theory underlying the accumulation of SOCs in
passive air samplers via diffusion and absorption into thesampler matrix has been detailed previously.16 Low-densitypolyethylene (LDPE) has been successfully used as passivesamplers in sediments’ porewater,17−19 the water column,20−22
and atmosphere,23,24 as well as to assess the activity gradientsacross sediment−water25 and water−air interfaces.21The atmospheric pollution problem in Egypt1 caused by
uncontrolled atmospheric emissions not only creates serioushealth hazards but also travels over long distances, causingdeterioration of ambient air quality.26 This encouraged us toinvestigate the possibility of using LDPE as passive air samplersfor PAHs in the atmospheric environment of Alexandria, Egypt.Accordingly, we undertook two major 21-day samplingcampaigns of 15 deployments each during summer (July2010) and winter (January 2011) across 11 sites to (i) test andcharacterize LDPEs as passive samplers for measuring expectedelevated concentrations of gaseous PAHs in the ambient air ofAlexandria; (ii) determine uptake kinetics and equilibrationtimes for PAHs in the LDPE; (iii) evaluate PE-basedconcentrations compared to those from simultaneouslyperformed active high-volume sampling; (iv) establish baselineconcentrations of gaseous PAHs and investigate their spatialand temporal variations; and (v) determine the main sources ofPAHs in Alexandria.
■ MATERIALS AND METHODSSite Description. Alexandria is the second-largest city of
Egypt, with a total surface area of 2300 km2 and a population of
4.1 million, extending about 90 km along the coast of theMediterranean Sea on the northwestern side of the Nile Delta(Figure SI 3).27 It is Egypt’s largest seaport, servingapproximately 80% of Egypt’s imports and exports. Fortypercent of the industrial activities and 60% of the petroleumactivities of Egypt are concentrated in Alexandria.27 As a seasidecity, it is an important tourist and recreational resort receivingabout 2 million tourists every year. Alexandria has an aridclimate, but the prevailing north wind, blowing across theMediterranean, gives the city a climate different from the deserthinterland. The city’s climate shows Mediterranean character-istics, namely mild, variably rainy winters and hot summers that,at times, can be very humid; January and February are thecoolest months, with daily maximum temperatures typicallyranging from 12 to 18 °C and minimum temperatures thatcould reach 5 °C. Alexandria experiences violent storms, rain,and sometimes hail during the cooler months. July and Augustare the hottest and driest months of the year, with an averagedaily maximum temperature of 30 °C.27
High-Volume and PE Samplers Preparation. PEs werecut from commercial sheeting (Carlisle Plastics, Inc.,Minneapolis, MN) with a thickness of 51 μm, yielding a 10× 30 cm strip of ∼1−2 g each. PEs were precleaned twice indichloromethane (DCM) and n-hexane for 24 h respectively.After precleaning, 12−14 PEs were immersed in an 80:20 (v/v)methanol/water solution spiked with performance referencecompounds (PRCs) at a nominal concentration of 5 μg persampler in methanol for 30 days.28 Three deuterated PAHswere selected to serve as PRCs (for more details see Text SI 2).Once spiked, PEs were strung on stainless steel wires, placed inprecleaned aluminum foil packets, numbered, and frozen untilthe time of deployment. Polyurethane foam (PUF, TischEnvironmental, Cleves, OH) plugs for the codeployed activesamplers were Soxhlet extracted with DCM for 48 h. Glass fiberfilters (GFF, Whatman, Piscataway, NJ) were combustedovernight in an oven at 450 °C. All samplers (including fieldblanks) were wrapped in solvent-rinsed aluminum foilimmediately after preparation and stored until the time ofsampling.
Deployment of PEs. PEs were deployed ∼2 m above theground surface in 11 different locations across Alexandria city(Figure SI 3) each inside two inverted bowls providingprotection from direct radiation and rainfall. At each location,PEs were deployed for 21 days in July 2010 (summer season)and January 2011 (winter season). Deployment locations werecarefully selected to represent different activities includingresidential, traffic, industrial, and mixed activities (Site anddeployment details are given in Table SI 2). At one of the sites(St 11), three PEs were deployed simultaneously in separatebowls (during both seasons) and one was retrieved every weekto determine uptake kinetics and equilibration times for PAHs.
Active Air Sampling. Twenty-two atmospheric sampleswere collected using a high-volume sampler at the 11 sites inJuly 2010 and January 2011 (for meteorological details andsampling volumes, see Text SI 3 and Table SI 3). Air was firstdrawn through a GFF to collect the particulate-boundcompounds followed by a PUF to retain the vapor-phasecompounds. Particulate-bound PAH data are not presented inthe current study.
Extraction of PEs and PUFs. The method employed forextraction of PEs has been described elsewhere.29 Briefly, PEswere cleaned and cold extracted twice in DCM for 24 h afterspiking with 10 μL of a surrogate standard mixture composed
Environmental Science & Technology Article
dx.doi.org/10.1021/es300012u | Environ. Sci. Technol. 2012, 46, 3990−39983991

of deuterated PAHs (d10-acenaphthene, d10-phenanthrene, d12-chrysene, and d12-perylene; 5 ng/μL in nonane). Extracts werecombined at the end of the extraction period and concentratedto ∼1 mL on a rotary evaporator, solvent-exchanged to hexane,and concentrated to ∼50 μL. Ten μL of d14-terphenyl (10 ng/μL) was added as an injection standard before analysis.PUF samples were extracted using a Dionex ASE 350
(Dionex Corporation, Sunnyvale, CA) accelerated solventextraction device after spiking with the surrogate standardmixture. n-Hexane/acetone (3:1) was used as the extractionsolvent mixture. Extracts were concentrated to a final volume of∼1 mL using a rotary evaporator (after solvent exchange intohexane) and passed on a glass chromatographic cleanupcolumn packed with silica gel/alumina in order to removethe interfering compounds. PAHs were eluted with n-hexane/DCM solvent mixture and the collected fraction wasconcentrated to a final volume of ∼50 μL. Finally, d14-terphenylwas added as the injection standard before analysis (see Text SI4 for more details).Instrumental Analysis and Quality Control. PAHs were
analyzed with an Agilent 6890 Series GC System connected toan Agilent 5973 Network Mass Selective Detector. Separationof PAHs was accomplished with a DB-5 MS fused silicacapillary column (30 m × 0.25 mm i.d., 0.25 μm film thickness,J&W Scientific). Samples (1 μL) were auto injected in splitlessmode with the injection port at 275 °C. The MS was operatedin EI+ mode with selected ion monitoring. Samples wereanalyzed for 42 PAHs (details are given in Text SI 5 and TableSI 4).Overall, the analysis included procedural blanks, field blanks,
matrix spikes, and duplicate samples, which were carriedthroughout the entire analytical procedure in a manneridentical to the samples. Limits of detection (LODs) werederived from the blanks and quantified as three times thestandard deviation of the mean concentration in the blanks.When individual PAHs were not detected in blanks (as the caseof 5−6 rings PAHs in the PUF samples), LODs were calculatedas the mean value of the baseline noise plus three times thestandard deviation of this noise (QA/QC procedures aredetailed in Text SI 6 and Table SI 4).Physico-Chemical Properties and Temperature-Re-
lated Adjustments. To calculate gas-phase concentrationsof PAHs from PE passive samplers, a set of partitioningcoefficients is required including octanol−air partitioningcoefficients (KOA) and sampler−air partitioning coefficient(KPE‑A), which are not available for all the individual PAHsinvestigated in the present study. To derive values for all PAHs,internally consistent KOA coefficients were obtained from Ma etal.30 Available KOA values were correlated against molecularweights to derive KOA values for all PAHs. Results for theindividual PAHs which approached equilibrium at St 11 (seeDeployment of PEs) were used to derive KPE‑As using thefollowing equation:
=−KCCPE A
PE
A (1)
where CPE and CA are the PAH concentrations in the PEsampler (ng/m3) and the corresponding vapor phaseatmospheric concentration of the PAH (ng/m3) obtainedfrom the active sampling. KPE‑As for all PAHs were then derivedbased on a correlation with KOA (Figure SI 4a and b). KPE‑As
derived here were also compared to those reported by Bartkowet al.23 (see Table SI 5).KPE‑A were T-corrected according to a modified form of the
Van’t Hoff equation29
= ×−Δ
−− −⎛⎝⎜
⎞⎠⎟K T K T
H
R T T( ) ( ) e
1 1PE A 2 PE A 1
vap
2 1 (2)
where T2 and T1 are the mean temperatures of the deploymentand at which the partitioning properties were determined (K),R is the ideal gas constant (J mol−1 K−1), and ΔHvap is theenthalpy of vaporization (kJ mol−1). Available ΔHvap for PAHs(from ref 31) were correlated against the subcooled liquidvapor pressure (PL/Pa) (Figure SI 5) obtained from Ma et al.30
to temperature-adjust KPE‑A values for all investigated PAHs(Table SI 5).
■ RESULTS AND DISCUSSIONAccumulation of PAHs in the PE Samplers. Accumu-
lated amounts of PAHs in the PE samplers are summarized inTables SI 6 and 7. ∑PAHs ranged from 23 × 103 to 77 × 103
ng/g PE in the summer season and from 5.7 × 10³ to 60 × 103
ng/g PE in the winter season. Concentrations of PAHsaccumulated by the PEs were typically higher in the summerseason by a factor of ∼2. PAH profiles were generallydominated by 2−3 rings PAHs (Figure 1A and B) which
represented 74−97% of the total quantified PAHs followed by4-ring PAHs, indicating that PEs sampled PAHs in the gaseousphase. The most abundant PAHs quantified in both seasonswere alkylated phenanthrenes and alkylated dibenzothiopenescomprising 42−72% and 11−41%, respectively, of the totalquantified amounts of PAHs, followed by fluoranthene (1.2−13%) and pyrene (0.65−9.1%). Phenanthrene was thedominant PAH quantified in passive samplers (PEs, PUFdisks, and ethylene vinyl acetate) deployed in Australia,32,33
Europe,34 and Canada.35 All of these studies concentratedmainly on the parent PAHs and alkylated PAHs were notanalyzed.
Figure 1. Ring-based amounts of PAHs (µg/g PE) in the PE samplersdeployed in summer 2010 (A) and winter 2011 (B). 6D: duplicate PEsampler deployed at location 6; W1, W2, W3 indicate the deploymentperiod in weeks.
Environmental Science & Technology Article
dx.doi.org/10.1021/es300012u | Environ. Sci. Technol. 2012, 46, 3990−39983992

Characterization of Uptake Kinetics and PAH Equili-brations. The addition of performance reference compounds(PRCs) to the samplers before deployment is useful to infer theexchange rate kinetics, assuming that the elimination rates (ofPRCs) and uptake rates (of native compounds) are equivalent.Exchange kinetics are quantified by the elimination or clearancerate constant (ke) (for details, see Text SI 7 and Table SI 8).
The least dissipated PRC was d12-benzo(a)pyrene with a higherelimination rate during the winter (52−82%) compared to thesummer (25−51%). Calculated clearance rate constants (TableSI 8) of the PRCs were used to determine the % equilibrium ofall the accumulated PAHs in the samplers (Tables SI 9 and 10).Based on the PRC loss rates, PAHs up to pyrene (Log KPE‑A =8.3) were at or close to equilibrium during the winter season. In
Figure 2. Predicted % equilibrium based on calculated ke values as a function of time (weeks) for PAHs during the summer (A) and winter (B)seasons at site 11 compared to the accumulated amounts of PAHs in the PE samplers (ng/g PE) at each week (A1−3, B1−3).
Environmental Science & Technology Article
dx.doi.org/10.1021/es300012u | Environ. Sci. Technol. 2012, 46, 3990−39983993

the summer season, only PAHs up to fluorene reachedequilibrium (Log KPE‑A = 6.4). The lower dissipation rates ofd12-benz(a)anthracene and d12-benzo(a)pyrene in PEs de-ployed during July 2010 (summer) are probably related tothe lower wind speed during the summer season.Chemical exchange between the surrounding air and the
passive sampler is limited by the mass transfer through the air-side boundary layer and/or the sampler membrane. If thechemical exchange is limited by the sampler membrane, thenchemicals with widely different KPE‑A values will show similarclearance rate constants, whereas if the chemical exchange islimited by the air-side resistance, then the clearance rateconstants of chemicals should decrease with increasingsampler−air partitioning coefficients (ke α 1/KPE‑A based onthe following relation: ke = (ka·As)/(Vs·KPE‑A), where ka is themass transfer coefficient through the air-side boundary layerand As and Vs are the sampler surface area and volume,respectively).33 Overall, PAH loss rate constants measured inPEs decreased with increasing log KPE‑A and increased withincreasing wind speeds (loss rate constants during winter >summer). There was a statistically significant difference (lossrate constants significantly decrease with increasing KPE‑A)between kes of the three PRCs in each season (1-way ANOVA,Fsummer = 135.5, Fwinter = 127.5 at α = 0.05, p < 0.001).Moreover, the loss rate constant of BaP-d12 was significantlyhigher in the winter season (tcalc = −5.485, df = 20, α = 0.05, P< 0.001). These relationships confirm air-side resistancedominating loss from the PE samplers.Comparison of Predicted and Observed % Equilibra-
tion during Field Deployments. In the present study, threePEs were deployed simultaneously for 1, 2, and 3 weeks each atsite 11 during each season. This was done to better understandthe equilibration of PAHs in the PEs over time and validatePRC-based equilibration times. Results indicated that %equilibrium between samplers and the surrounding air generallydecreased with increasing log KPE‑A (Figure 2A and B). Lowermolecular weight PAHs attained equilibrium faster than highermolecular weight PAHs. Three different regimes could beobserved for the accumulated PAHs in the codeployed PEs. Inthe first regime, PAHs in PEs were close to or reached
equilibrium with the ambient concentration within one week ofdeployment. This pattern was typical for the lower molecularweight PAHs (Log KPE‑A < 8.1), but a slight seasonal variationwas observed in this group. During the summer season (Figure2A1), this pattern was observed for PAHs up to C2-naphthalene(Log KPE‑A = 6.1), whereas in the winter season (Figure 2B1),this pattern extended up to C2-fluorene (Log KPE‑A = 8.0). Inthe second regime, PAHs were in the curvelinear phase after adeployment period of three weeks. This pattern was character-istic for PAHs up to C2-phenanthrene/anthracene (Log KPE‑A =8.6) in the summer season (Figure 2A2) and perylene (LogKPE‑A = 10.7) in the winter season (Figure 2B2). In the finalregime, PAHs were still in the linear uptake phase after thewhole deployment period. This pattern was observed for PAHswith KPE‑A > 8.6 in the summer season and KPE‑A > 10.7 in thewinter season (Figure 2A3 and 2B3). Overall, there was goodagreement between PRC-based equilibration predictions andthose observed from the 1-, 2-, and 3-week uptake experiments.
Deriving KPE‑A and Their Temperature Adjustment.After characterizing the stage of uptake for each of the targetcompounds, atmospheric concentrations measured with thecodeployed high-volume air sampler were used to estimateKPE‑A values for compounds that reached equilibrium. We usedconcentrations of PAHs that attained equilibrium after 1 weekdeployment period (Figure 2A1 and 2B1). Calculated LogKPE‑A values (Table SI 5) were correlated against Log KOA andthe following equations were obtained (Figure SI 4A, B):
= × +−K KLog (summer) 0.9142 Log 0.1097PE A OA(3)
(R2 = 0.993, n = 7, SE = 0.043, SE of intercept = 0.163, SE ofslope = 0.024)
= × −−KLog (winter) 0.9711 Log K 0.1536PE A OA (4)
(R2 = 0.975, n = 12, SE = 0.088, SE of intercept = 0.334, SE ofslope = 0.049)
Figure 3. Comparison between predicted and directly measured concentrations of PAHs using ΔHvap and ΔUOA for temperature corrections.
Environmental Science & Technology Article
dx.doi.org/10.1021/es300012u | Environ. Sci. Technol. 2012, 46, 3990−39983994
Results from both deployments were averaged to calculateKPE‑As for all the other investigated PAHs according to thefollowing equation:
= × −−K KLog 0.9426 Log 0.022PE A OA (5)
(R2 = 0.991, n = 12, SE = 0.052, SE of intercept = 0.197, SE ofslope = 0.029)Calculated KPE‑A values based on eq 5 were compared with
those calculated according to Bartkow et al.,23 Kennedy et al.,33
and Lohmann36 (Figure SI 6). Our KPE‑A values were in verygood agreement with those obtained according to the equationproposed by Bartkow et al.23 with factor different less than 46%in all the investigated individual PAHs (Table SI 5), and similarto the prediction by Lohmann36 based on the partitioning ofPAHs between PE and water.Calculated KPE‑A values in our study were temperature
corrected using ΔHvap. The excellent agreement between eqs 3and 4 (no statistical significant difference between theregression coefficients at p = 0.001) indicated that the use ofΔHvap accurately corrected KPE‑A for PAHs. In other words theenthalpy of PE−air partitioning (ΔHPE‑A) was dominated bychanges in the PAH’s vapor pressure, not by changes in the PEuptake. As an alternative, we also temperature adjusted KPE‑Awith the energy of octanol−air exchange (ΔUOA, kJ/mol) fromBeyer et al.37 and compared it to the correction using ΔHvap.Good match (Figure SI 7) between calculated KPE‑As correctedusing both enthalpies was observed with a factor difference<55%. For further comparison, we used both enthalpies tocorrect for temperature differences at one of the samplinglocations (St 11) and predicted the vapor-phase concentrationof PAHs. As shown in Figure 3, better match (based on the bestfit equation) between predicted and directly measuredatmospheric concentrations of PAHs was achieved whenΔHvap was used for temperature corrections.Evaluation of the Predictive Ability of PE Samplers.
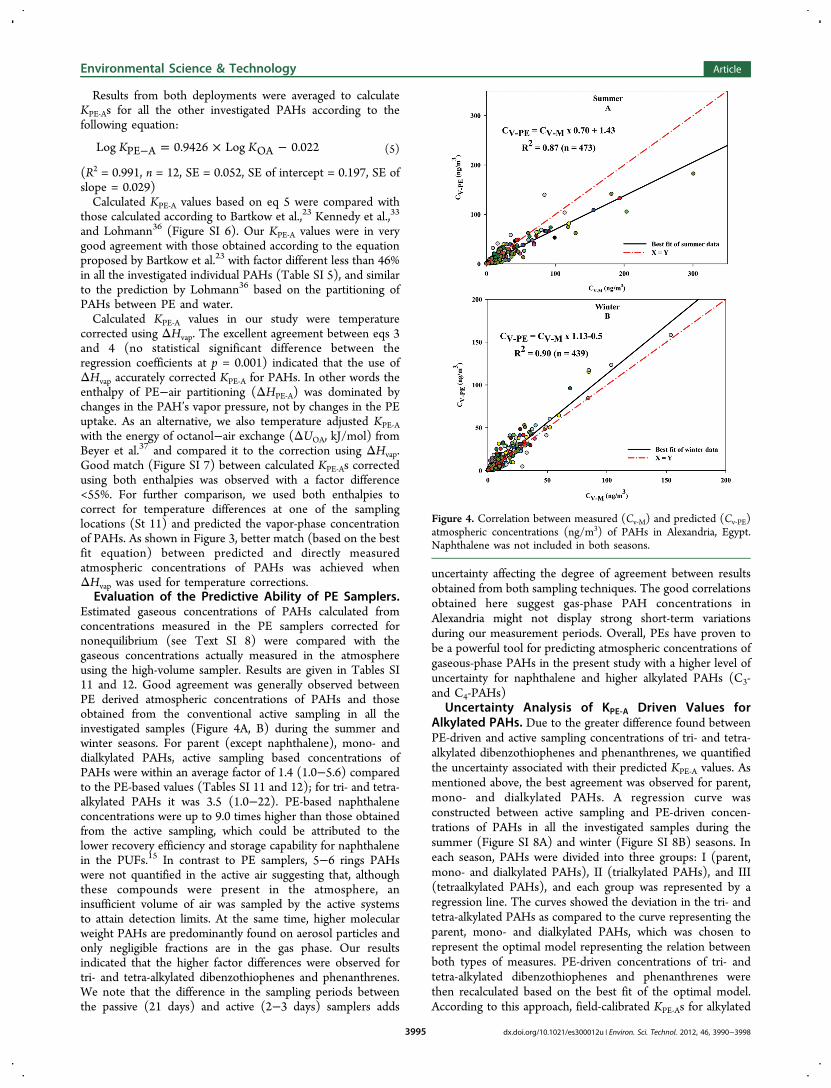
Estimated gaseous concentrations of PAHs calculated fromconcentrations measured in the PE samplers corrected fornonequilibrium (see Text SI 8) were compared with thegaseous concentrations actually measured in the atmosphereusing the high-volume sampler. Results are given in Tables SI11 and 12. Good agreement was generally observed betweenPE derived atmospheric concentrations of PAHs and thoseobtained from the conventional active sampling in all theinvestigated samples (Figure 4A, B) during the summer andwinter seasons. For parent (except naphthalene), mono- anddialkylated PAHs, active sampling based concentrations ofPAHs were within an average factor of 1.4 (1.0−5.6) comparedto the PE-based values (Tables SI 11 and 12); for tri- and tetra-alkylated PAHs it was 3.5 (1.0−22). PE-based naphthaleneconcentrations were up to 9.0 times higher than those obtainedfrom the active sampling, which could be attributed to thelower recovery efficiency and storage capability for naphthalenein the PUFs.15 In contrast to PE samplers, 5−6 rings PAHswere not quantified in the active air suggesting that, althoughthese compounds were present in the atmosphere, aninsufficient volume of air was sampled by the active systemsto attain detection limits. At the same time, higher molecularweight PAHs are predominantly found on aerosol particles andonly negligible fractions are in the gas phase. Our resultsindicated that the higher factor differences were observed fortri- and tetra-alkylated dibenzothiophenes and phenanthrenes.We note that the difference in the sampling periods betweenthe passive (21 days) and active (2−3 days) samplers adds
uncertainty affecting the degree of agreement between resultsobtained from both sampling techniques. The good correlationsobtained here suggest gas-phase PAH concentrations inAlexandria might not display strong short-term variationsduring our measurement periods. Overall, PEs have proven tobe a powerful tool for predicting atmospheric concentrations ofgaseous-phase PAHs in the present study with a higher level ofuncertainty for naphthalene and higher alkylated PAHs (C3-and C4-PAHs)
Uncertainty Analysis of KPE‑A Driven Values forAlkylated PAHs. Due to the greater difference found betweenPE-driven and active sampling concentrations of tri- and tetra-alkylated dibenzothiophenes and phenanthrenes, we quantifiedthe uncertainty associated with their predicted KPE‑A values. Asmentioned above, the best agreement was observed for parent,mono- and dialkylated PAHs. A regression curve wasconstructed between active sampling and PE-driven concen-trations of PAHs in all the investigated samples during thesummer (Figure SI 8A) and winter (Figure SI 8B) seasons. Ineach season, PAHs were divided into three groups: I (parent,mono- and dialkylated PAHs), II (trialkylated PAHs), and III(tetraalkylated PAHs), and each group was represented by aregression line. The curves showed the deviation in the tri- andtetra-alkylated PAHs as compared to the curve representing theparent, mono- and dialkylated PAHs, which was chosen torepresent the optimal model representing the relation betweenboth types of measures. PE-driven concentrations of tri- andtetra-alkylated dibenzothiophenes and phenanthrenes werethen recalculated based on the best fit of the optimal model.According to this approach, field-calibrated KPE‑As for alkylated
Figure 4. Correlation between measured (Cv‑M) and predicted (Cv‑PE)atmospheric concentrations (ng/m3) of PAHs in Alexandria, Egypt.Naphthalene was not included in both seasons.
Environmental Science & Technology Article
dx.doi.org/10.1021/es300012u | Environ. Sci. Technol. 2012, 46, 3990−39983995

PAHs were derived. Field-calibrated KPE‑As showed a decreasethat ranged from 0.3 to 1.7 log units from the predicted ones(eq 5) resulting in an uncertainty ranging from 31 to 96% inthe PE-based concentrations of C3- and C4-dibenzothiophenesand phenanthrenes. Another way to express our data is that foreach additional alkylated carbon beyond C2, the KPE‑A decreasesby ∼0.8 log units. It is also possible that the faster reactivity ofalkylated PAHs in the atmosphere38 relative to their respectiveparent PAHs affected active and passive sampling differently.39
Comparison of PAH Concentrations to Other UrbanMeasurements. Concentrations of ∑42PAHs in Alexandriaranged from 390 (St 7) to 990 ng/m3 (St 11) during thesummer season and from 240 (St 6) to 1100 ng/m3 (St 8)during the winter season. Detected PAH concentrations werehigher than those measured for urban sites worldwide. InChicago and Lake Michigan, USA, Simick et al.40 reportedvapor-phase PAH concentrations (∑26PAHs) of 43−200 and4.0−50 ng/m3, respectively. In Paris, Ollivon et al.41 reportedconcentrations from 3.0 to 15 ng/m3 (∑8 PAHs). In ametropolitan area in Australia, Bartkow et al.32 estimated aconcentration of 4.0 ng/m3 of ∑11PAHs from deploying PEsamplers. PAH concentrations in the present study were alsohigher than those detected in Toronto, Canada (∑17PAHs:35−61 ng/m3),35 Belgium (∑16PAHs: 9.6−42 ng/m3),42
Athens, Greece (∑14PAHs: 6.9−120 ng/m3),43 Harbin,China (∑16PAHs: 6.3−340 ng/m3),44 and in Eskisehir, Turkeyduring the nonheating season (∑13PAHs: 41−290 ng/m3),45
but lower than those detected in Cairo, Egypt (∑15PAHs:1900−3900 ng/m3).6 Detected PAH concentrations weremuch higher than the background level of PAHs in theambient air of urban areas (0.15−19 ng/m3).42 Accordingly,chronic adverse health effects could possibly arise in the localresidents from the exposure to PAHs in the atmosphericenvironment of Alexandria. Previous studies have indicated thatthere is a relation between the exposure to atmospheric PAHsand the possibility of development of chronic health effects(such as lung cancer).46−48 Nevertheless, a direct comparisonof PAHs between various sites should be done with cautionbecause PAHs concentration is affected by the location of thesampling site and different sources as well as by the samplingmethodology.Spatial Distribution and Seasonal Variations of PAHs
across Alexandria. Figure SI 9 depicts graphically thequantitative composition of the PAH mixture estimated fromthe PE samplers during both seasons. Similar patterns ofindividual PAHs were observed in all the samples duringsummer and winter indicating a common source ofcontamination with PAHs. In both seasons, samples weredominated by 2−3 rings PAHs (parent and alkylated)comprising >90% of the total detected concentrations. Themost abundant PAHs were naphthalene (22−51%), phenan-threne (2.0−19%), and C1-phenanthrene/anthracene (4.0−18%). Samples were more enriched with naphthalene duringthe winter season (39%) when compared with the summerseason (29%). In the summer season, there was a markedincrease in the enrichment of the samples with phenanthrene(14% compared to 9.0% in the winter samples) and C1-phenanthrene (10%) which could be related to the increases inthe evaporative emissions from petroleum products such asasphalt and coal tar sealant.35
The spatial distribution of PAHs in Alexandria City (FigureSI 10) indicated that higher PAH concentrations were observedat sites characterized by high traffic (St 11, 2, and 3) and
industrial (St 8 and 4) activities during the summer season (seeText SI 9 for more details). During the winter season, higherPAH concentrations were observed at sites characterized byindustrial activities (St 8 and St 4) and heavy traffic composedmainly of heavy trucks. In all the other samples, detected PAHconcentrations were relatively stable with minor variations(410−630 ng/m3). This finding supports the suggestion thatvehicle emissions are the major source of PAHs in theatmospheric environment of Alexandria.No statistically significant difference was observed between
detected concentrations of PAHs in the investigated samplesduring both seasons (t = 0.325; p = 0.748; α = 0.05). Althoughcombustion-derived PAH emissions may be elevated during thecolder months, PAH gas-phase concentrations will be reducedby partitioning to particles which is enhanced at coldtemperature. This effect will be greatest in urban areas whereparticle concentrations are highest. Detected concentrations ofPAHs during both seasons suggest that vehicle emissions arethe major sources of PAHs in Alexandria. Although unleadedpetrol has recently been used, leaded gasoline is still in use,especially in old vehicles. At the same time, catalytic convertershave not yet been extensively introduced to Egypt. Majorcontributors of vehicular pollution are four-cylinder gasolinevehicles (e.g., cars and minibuses), diesel-powered heavyvehicles (e.g., transportation buses and mini-trucks), and two-stroke-engine-powered motor cycles. The latter are poweredwith mixed gasoline-oil fuel to compensate for the lack of wetsump. Traffic intensities are too high for Alexandria’sinadequate road network causing congestion on busy narrowstreets. Other sources of PAHs may include diesel trains,natural gas, open burning of municipal wastes, and vehicle tires.
PAH Source Characteristics. Concentrations and patternsof PAHs quantified in a given environment have been used toreflect their possible sources. Various molecular diagnosticratios of PAH concentrations have been used for qualitative andquantitative characterization of sources in environmentalsamples.42,49,50 However, PAH isomer ratios show substantialintrasource variability and intersource similarity51 and shouldbe interpreted with caution based on previous knowledge aboutpossible sources of PAHs that exist in a given area. Molecularratios used in this study included Ant/Ant+Phn, Phn/Ant,alkylated Phn (sum of all methylated Phns) to Phn (MPhn/Phn), MDBT/MPhn, Phn+Ant/Phn+Ant+C1-Phn/Ant, Flra/Flra+Pyr, BaA/BaA+Chry, InP/InP+BghiP, and BaP/BghiP.Calculated diagnostic ratios are presented in Figure SI 11. Allthe calculated ratios indicated that vehicular emissions are themajor source of PAHs in the atmospheric environment ofAlexandria, Egypt. This is also in-line with the rather uniformconcentrations across wide swaths of this major city (see TextSI 10 for more details).
Implications. The results of this study indicate that low-density polyethylene sheets can be successfully used to assessspatial and temporal trends of PAHs in an arid urban city. Thisis of great significance as it indicated how a simple, accessible,and cost-effective sampling medium can yield valuable data indeveloping countries because of the problems associated withconventional active air sampling techniques. Accordingly,databases regarding PAHs can be acquired to develop pollutioncontrol and management plans on the national scale. Theresults obtained from this study also highlighted the role ofurban cities as sources of PAHs to the regional environment.This is of great importance for cities like Alexandria located onthe Mediterranean coast as substantial loading to the coastal
Environmental Science & Technology Article
dx.doi.org/10.1021/es300012u | Environ. Sci. Technol. 2012, 46, 3990−39983996

waters could occur both through atmospheric deposition andsurface runoff. Results obtained from our investigationhighlighted the need for performing more studies to betterunderstand the partitioning and equilibriation mechanisms ofalkylated PAHs between PEs and the surrounding atmosphereas most studies concentrated on the parent PAHs despite thehigher detectable concentrations of alkylated PAHs in theatmospheric environment of urban cities worldwide.
■ ASSOCIATED CONTENT*S Supporting InformationDetails on deployments, methods, PAH concentrations, andtheir selected physicochemical properties, plus additionalcorrelations. This information is available free of charge viathe Internet at http://pubs.acs.org.
■ AUTHOR INFORMATIONCorresponding Author*E-mail: [email protected]; phone: 401-874-6765; fax 401-874-6811.
NotesThe authors declare no competing financial interest.
■ ACKNOWLEDGMENTSWe thank Mr. Dave Adelman (GSO, URI) for his effort in thepreparation of the PEs. Special thanks are also due to Prof. Dr.Alaa Mostafa for his help in the deployment of the PEs. Dr.Mohammed Khairy acknowledges the Fulbright Foundation foroffering him the opportunity to carry out this research in theUnited States. Dr. Rainer Lohmann acknowledges funding fromEPA’s Great Lakes Restoration Initiative Award GLAS #00E00597-0 and Great Lakes Air Deposition Program Award #GLAD 2010-5 supporting passive sampler research at URI.
■ REFERENCES(1) Egyptian Environmental Quality Report; Egyptian EnvironmentalAffairs Agency: Cairo, 2011; http://www.eeaa.gov.eg/English/r e p o r t s / S o E 2 0 1 1 A R /%D8%AA%D9%82%D8%B1%D9%8A%D8%B1%20%D8%AD%D8%A7%D9%84%D8%A9%20%D8%A7%D9%84%D8%A8%D 9 % 8 A % D 8 % A 6 %D8%A9%20%D9%81%D9%89%20%D9%85%D8%B5%D8%B1%202010.pdf.(2) Simoneit, B. R. T.; Mazurek, M. A. The organic components. Crit.Rev. Environ. Control 1981, 11, 219−276.(3) Voutsa, D.; Terzi, H.; Muller, L.; Samara, C.; Kouimtzis, Th.Profile analysis of organic micropollutants in the environment of a coalburning area, NW Greece. Chemosphere 2004, 55 (4), 595−604.(4) Batterman, S. A.; Chernyak, S. M.; Gounden, Y.; Matooane, M.;Naidoo, R. N. Organochlorine pesticides in ambient air in Durban,South Africa. Sci. Total Environ. 2008, 397 (1−3), 119−130.(5) Nassar, H. F.; Tang, N.; Kameda, T.; Toriba, A.; Khoder, M. I.;Kazuichi, H. Atmospheric concentrations of polycyclic aromatichydrocarbons and selected nitrated derivatives in Greater Cairo,Egypt. Atmos. Environ. 2011, 45 (39), 7352−7359.(6) Hassan, S. K.; Khoder, M. I. Gas-particle concentration,distribution, and health risk assessment of polycyclic aromatichydrocarbons at a traffic area of Giza, Egypt. Environ. Monit. Assess.2012, DOI: 10.1007/s10661-011-2210-8.(7) Ockenden, W. A.; Sweetman, A. J.; Prest, H. F.; Steinnes, E.;Jones, K. C. Toward an understanding of the global atmosphericdistribution of persistent organic pollutants: The use of semipermeablemembrane devices as time-integrated passive samplers. Environ. Sci.Technol. 1998, 32 (18), 2795−2803.
(8) Lohmann, R.; Corrigan, B. P.; Howsam, M.; Jones, K. C.;Ockenden, W. A. Further developments in the use of semipermeablemembrane devices (SPMDs) as passive air samplers for persistentorganic pollutants: Field application in a spatial survey of PCDD/ Fsand PAHs. Environ. Sci. Technol. 2001, 35 (12), 2576−2582.(9) Harner, T.; Farrar, N. J.; Shoeib, M.; Jones, K. C.; Gobas, F. A. P.C Characterization of polymer-coated glass as a passive air sampler forpersistent organic pollutants. Environ. Sci. Technol. 2003, 37 (11),2486−2493.(10) Meijer, S. N.; Ockenden, W. A.; Steinnes, E.; Corrigan, B. P.;Jones, K. C. Spatial and temporal trends of POPs in Norwegian andUK background air: Implications for global cycling. Environ. Sci.Technol. 2003, 37 (3), 454−461.(11) Jaward, F. M.; Farrar, N. J.; Harner, T.; Sweetman, A. J.; Jones,K. C. Passive air sampling of PCBs, PBDEs, and organochlorinepesticides across Europe. Environ. Sci. Technol. 2004, 38 (1), 34−41.(12) Jaward, F. M.; Meijer, S. N.; Steinnes, E.; Thomas, G. O.; Jones,K. C. Further studies of the latitudinal and temporal trends ofpersistent organic pollutants in Norwegian and U.K. background air.Environ. Sci. Technol. 2004, 38 (9), 2523−2530.(13) Shen, L.; Wania, F.; Lei, Y. D.; Teixeira, C.; Muir, D. C. G.;Bidleman, T. F. Hexachlorocyclohexanes in the North Americanatmosphere. Environ. Sci. Technol. 2004, 38 (4), 965−975.(14) Bohlin, P.; Jones, K. C.; Tovalin, H.; Strandberg, B.Observations on persistent organic pollutants in indoor and outdoorair using passive polyurethane foam samplers. Atmos. Environ. 2008, 42(31), 7234−7241.(15) Determination of polycyclic aromatic hydrocarbons (PAHs) inambient air using gas chromatography/mass spectrometry (GC/MS);Compendium Method TO-13A, 2nd ed.; U.S. EnvironmentalProtection Agency: Cincinnati, OH, 1999; http://www.epa.gov/ttnamti1/files/ambient/airtox/to-13arr.pdf.(16) Bartkow, M. E.; Booij, K.; Kennedy, K. E.; Muller, J.; Hawker, D.Passive sampling theory for atmospheric semivolatile organiccompounds. Chemosphere 2005, 60 (2), 170−176.(17) Fernandez, L. A.; MacFarlane, J. K.; Tcaciuc, A. P.; Gschwend,P. M. Measurement of Freely Dissolved PAH Concentrations inSediment Beds Using Passive Sampling with Low-Density Poly-ethylene Strips. Environ. Sci. Technol. 2009, 43 (5), 1430−1436.(18) Friedman, C.; Burgess, R. M.; Perron, M. M.; Cantwell, M. G.;Ho, K. T.; Lohmann, R. Comparing polychaete bioaccumulation andpassive sampler uptake to assess the effects of sediment resuspensionon PCB bioavailability. Environ. Sci. Technol. 2009, 43 (8), 2865−2870.(19) Tomaszewski, J. E.; Luthy, R. G. Field deployment ofpolyethylene devices to measure PCB concentrations in pore waterof contaminated sediment. Environ. Sci. Technol. 2008, 42 (16), 6086−6091.(20) Adams, R. G.; Lohmann, R.; Fernandez, L. A.; Macfarlane, J. K.;Gschwend, P. M. Polyethylene devices: Passive samplers for measuringdissolved hydrophobic organic compounds in aquatic environments.Environ. Sci. Technol. 2007, 41 (4), 1317−1323.(21) Morgan, E.; Lohmann, R. Detecting Air-Water and Surface-Deep Water Gradients of PCBs Using Polyethylene Passive Samplers.Environ. Sci. Technol. 2008, 42 (19), 7248−7253.(22) Sacks, V. P.; Lohmann, R. Development and use of polyethylenepassive samplers to detect triclosans and alkylphenols in an urbanestuary. Environ. Sci. Technol. 2011, 45 (6), 2270−2277.(23) Bartkow, M. E.; Hawker, D. W.; Kennedy, K. E.; Muller, J. F.Characterizing uptake kinetics of PAHs from the air using poly-ethylene-based passive air samplers of multiple surface area-to-volumeratios. Environ. Sci. Technol. 2004, 38 (9), 2701−2706.(24) Bartkow, M. E.; Jones, K. C.; Kennedy, K. E.; Holling, N.;Hawker, D. W.; Muller, J. F. Evaluation of performance referencecompounds in polyethylene-based passive air samplers. Environ. Pollut.2006, 144 (2), 365−370.(25) Lohmann, R.; Burgess, R. M.; Cantwell, M. G.; Ryba, S. A.;MacFarlane, J. K.; Gschwend, P. M. Dependency of polychlorinatedbiphenyl and polycyclic aromatic hydrocarbon bioaccumulation inMya
Environmental Science & Technology Article
dx.doi.org/10.1021/es300012u | Environ. Sci. Technol. 2012, 46, 3990−39983997
arenaria on both water column and sediment bed chemical activities.Environ. Toxicol. Chem. 2004, 23 (11), 2551−2562.(26) Aboul-Kassim, T. A. T.; Simoneit, B. R. T. Aliphatic andaromatic hydrocarbons in particulate fallout of Alexandria, Egypt:Sources and implications. Environ. Sci. Technol. 1995, 29 (10), 2473−2483.(27) Environmental Characterization of Alexandria, Egypt; EgyptianEnvironmental Affairs Agency: Cairo, 2007; www.eeaa.gov.eg/English/reports/GovProfiles/final/Alex%20Des.pdf.(28) Booij, K.; Smedes, F.; van Weerlee, E. M. Spiking ofperformance reference compounds in low density polyethylene andsilicone passive water samplers. Chemosphere 2002, 46 (8), 1157−1161.(29) Lohmann, R.; Dapsis, M.; Morgan, E. J.; Dekany, V.; Luey, P. J.Determining air-water exchange, spatial and temporal trends of freelydissolved PAHs in an urban estuary using passive polyethylenesamplers. Environ. Sci. Technol. 2011, 45 (7), 2655−2662.(30) Ma, Y. G.; Lei, Y. D.; Xiao, H.; Wania, F.; Wang, W. H. Criticalreview and recommended values for the Physical-Chemical PropertyData of 15 Polycyclic aromatic hydrocarbons at 25 °C. J. Chem. Eng.Data 2010, 55 (2), 819−825.(31) Roux, M. V.; Temprado, M.; Chickos, J. S.; Nagano, Y. Criticallyevaluated thermochemical properties of polycyclic aromatic hydro-carbons. J. Phys. Chem. Ref. Data 2008, 37 (4), 1855−1996.(32) Bartkow, M. E.; Mueller, J. F.; Huckins, J. N. Field-basedevaluation of semipermeable membrane devices (SPMDs) as passiveair samplers of polyaromatic hydrocarbons (PAHs). Atmos. Environ.2004, 38 (35), 5983−5990.(33) Kennedy, K. E.; Hawker, D. W.; Muller, J. F.; Bartkow, M. E.;Truss, R. W. A field comparison of ethylene vinyl acetate and low-density polyethylene thin films for equilibrium phase passive airsampling of polycyclic aromatic hydrocarbons. Atmos. Environ. 2007,41 (27), 5778−5787.(34) Soderstrom, H.; Hajslova, J.; Kocourek, V.; Siegmund, B.;Kocan, A.; Obiedzinski, M. W.; Tysklind, M.; Bergqvist, P. A. PAHsand nitrated PAHs in air of five European countries determined usingSPMDs as passive samplers. Atmos. Environ. 2005, 39 (9), 1627−1640.(35) Massei, A.; Harner, T.; Shoeib, M.; Diamond, M.; Stern, G.;Rosenberg, B. Using passive air samplers to assess urban-rural trendsfor persistent organic pollutants and polycyclic aromatic hydrocarbons.2. Seasonal trends for PAHs, PCBs, and organochlorine pesticides.Environ. Sci. Technol. 2005, 39 (15), 5763−5773.(36) Lohmann, H. Critical review of low-density polyethylene’spartitioning and diffusion coefficients for trace organic contaminantsand implications for its use as a passive sampler. Environ. Sci. Technol.2012, 46 (2), 606−618.(37) Beyer, A.; Wania, F.; Gouin, T.; Mackay, D.; Matthies, M.Selecting internally consistent physicochemical properties of organiccompounds. Environ. Toxicol. Chem. 2002, 21 (5), 941−953.(38) Phousongphouang, P. T.; Arey, J. Rate constants for the gas-phase reactions of a series of alkylnaphthalenes with the OH radical.Environ. Sci. Technol. 2002, 36 (9), 1947−1952.(39) Kalberer, M.; Henne, S.; Prevot, A. S. H.; Steinbacher, M.Vertical transport and degradation of polycyclic aromatic hydro-carbons in an Alpine Valley. Atmos. Environ. 2004, 38 (37), 6447−6456.(40) Simcik, M. F.; Eisenreich, S. J.; Lioy, P. J. Source apportionmentand source/sink relationships of PAHs in the coastal atmosphere ofChicago and Lake Michigan. Atmos. Environ. 1999, 33 (30), 5071−5079.(41) Ollivon, D.; Blanchoud, H.; Motelay-Massei, A.; Garban, B.Atmospheric deposition of PAHs to an urban site, Paris, France.Atmos. Environ. 2002, 36 (17), 2881−2890.(42) Ravindra, K.; Bencs, L.; Wauters, E.; de Hoog, J.; Deutsch, F.;Roekens, E.; Bleux, N.; Berghmans, P.; Van Grieken, R. Seasonal andsite-specific variation in vapour and aerosol phase PAHs over Flanders(Belgium) and their relation with anthropogenic activities. Atmos.Environ. 2006, 40 (4), 771−785.
(43) Vasilakos, Ch.; Levi, N.; Maggos, Th.; Hatzianestis, J.;Michopoulos, J.; Helmis, C. Gas-particles concentration and character-ization of sources of PAHs in the atmosphere of a sub-urban area inAthens, Greece. J. Hazard. Mater. 2007, 140 (1−2), 45−51.(44) Ma, W. L.; Li, Y. F.; Sun, D. Z.; Liu, L. Y.; Wang, D. G. Seasonalvariations of sources of polycyclic aromatic hydrocarbons (PAHs) to anortheastern urban city, China. Chemosphere 2010, 79 (4), 441−447.(45) Gaga, E. O.; Ari, A. Gas-particle partitioning of polycyclicaromatic hydrocarbons (PAHs) in an urban traffic site in Eskisehir,Turkey. Atmos. Res. 2011, 99 (2), 207−216.(46) Chen, S. C.; Liao, C. M. Health risk assessment on humanexposure to environmental polycyclic aromatic hydrocarbons pollutionsources. Sci. Total Environ. 2006, 366 (1), 112−123.(47) Chiang, K. C.; Chio, C. P.; Chiang, Y. H.; Liao, C. M. Assessinghazardous risk of human exposure to temple airborne polycyclicaromatic hydrocarbons. J. Hazard. Mater. 2009, 166 (2−3), 676−685.(48) Ramirez, N.; Cuadras, A.; Rovira, E.; Marce, R. M.; Borsull, F.Risk assessment related to atmospheric polycyclic aromatic hydro-carbons in gas and particle phases near industrial sites. Environ. HealthPerspect. 2011, 119 (8), 1110−1116.(49) Yunker, M. B.; Macdonald, R. W.; Vingarzan, E.; Mitchell, R. H.;Goyette, T.; Sylvestre, S. PAHs in the Fraser River basin: A criticalappraisal of PAH ratios as indicators of PAH source and composition.Org. Geochem. 2002, 33 (4), 489−515.(50) Wang, Z.; Fingas, M.; Page, D. S. Oil spill identification. J.Chromatogr. A 1999, 843 (12), 369−411.(51) Galarneau, E. Source specificity and atmospheric processing ofairborne PAHs: Implications for source apportionment. Atmos.Environ. 2008, 42 (35), 8139−8149.
Environmental Science & Technology Article
dx.doi.org/10.1021/es300012u | Environ. Sci. Technol. 2012, 46, 3990−39983998