figure s1. a flow chart shows uc patient selection
TRANSCRIPT

Supplementary materials
Figure S1. A flow chart shows UC patient selection.
Figure S2. FACS gating procedures. Surgically removed colon tissues from a non-UC patient
were used in this experiment to illustrate the FACS gating procedures.

Figure S3. The UC colon tissues of CR patients show high frequency of neutrophils (N).
Surgically removed colon tissues were collected from patients with UC and colon cancer,
including subjects with corticosteroid resistance (CR group; n=34), or corticosteroid
sensitiveness (CS group; n=12). Colon samples from patients with colon cancer without UC were
also collected used as non-UC controls (NC; n=8). A, representative colon histology images
(original magnification: ×200) show profound inflammatory cell infiltration in the tissues. B-E,
lamina propria mononuclear cells (LPMC) were isolated from the colon samples and analyzed
by FACS. The gated FACS plots show cell counts of neutrophils (B) and Eo (D). The violin plots
show summarized cell counts data of N (C) and Eo (E). ***, p<0.001 (Mann Whitney Test)
compared with NC group. ###, p<0.001, compared with CS group. The data of violin plots are
presented as mean (IGR) and data range.
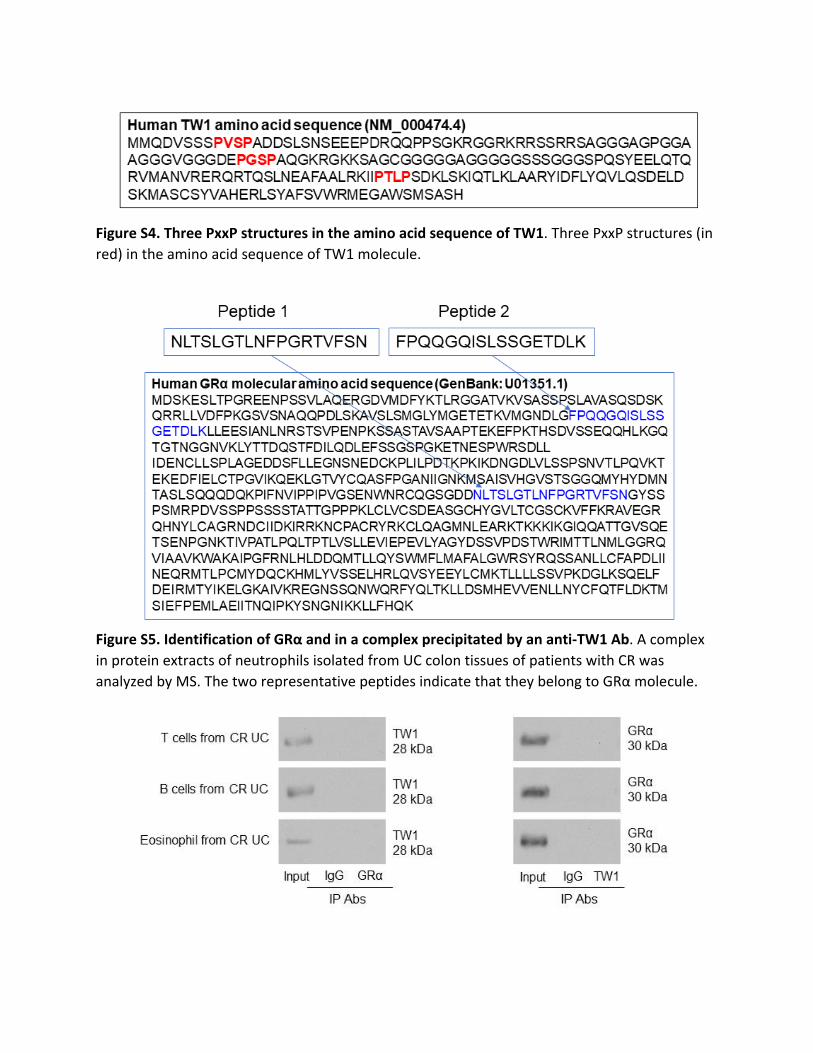
Figure S4. Three PxxP structures in the amino acid sequence of TW1. Three PxxP structures (in
red) in the amino acid sequence of TW1 molecule.
Figure S5. Identification of GRα and in a complex precipitated by an anti-TW1 Ab. A complex
in protein extracts of neutrophils isolated from UC colon tissues of patients with CR was
analyzed by MS. The two representative peptides indicate that they belong to GRα molecule.

Figure S6. Assessment of TW1/GRα complex in immune cells isolated from CR UC colon
tissues. T cells, B cells and eosinophils were isolated from CR UC colon tissues as described and
analyzed by co-IP with anti-TW1 Ab and GRα Ab as precipitating Abs and blotting Abs,
respectively. Immunoblots show co-IP results. The data are from one experiment that represent
6 independent experiments.
Figure S7. Eosinophils isolated from CR and CS colon tissues do not show CR. Isolated colon
eosinophils were treated with the agents listed below the bar graph. CS: Corticosteroid
sensitive UC patients. CR: Corticosteroid resistant UC patients. PMA: PMA in the culture at 50
nM. Dex: Dexamethasone in the culture at 1 µM. The bars show ECP levels in the culture. ***,
p<0.001 (ANOVA followed by Dunnectt’s test), compared with CS alone group.
Figure S8. Assessment of neutrophil apoptosis. Isolated CR neutrophils were cultured in the
presence of PMA (50 ng/ml) or LPS (250 ng/ml) overnight. The cells were stained with Annexin
V reagent and PI, and analyzed by FACS. The gated FACS plots show apoptotic cells. The data
represent 3 independent experiments.

Figure S9. Checking the TW1 expression in neutrophils of mice carrying the TW1-knockout
neutrophils. Neutrophils were isolated from the colon tissues of WT mice, mice carrying
neutrophils have a WT TW1 gene and a Cre gene (cKO), and mice carrying the TW1-knockout
neutrophils (KO) by FACS. A, the gated plots show cell purity of isolated neutrophils. B, the bars
show TW1 mRNA levels in neutrophils. C, the immunoblots show TW1 protein levels in
neutrophils. Tamoxifen: Mice were treated with tamoxifen daily for one week to activate the
TW1-gene-depletion.
Figure S10. Identification of proteins bound to STAT3 in neutrophils. Proteins were extracted
from neutrophils isolated from the colon tissues of UC patients with CR and analyzed by MS.
The two representative peptides (the arrows point the original sites; in blue) indicate the
protein bound STAT3 is RASAL1L.
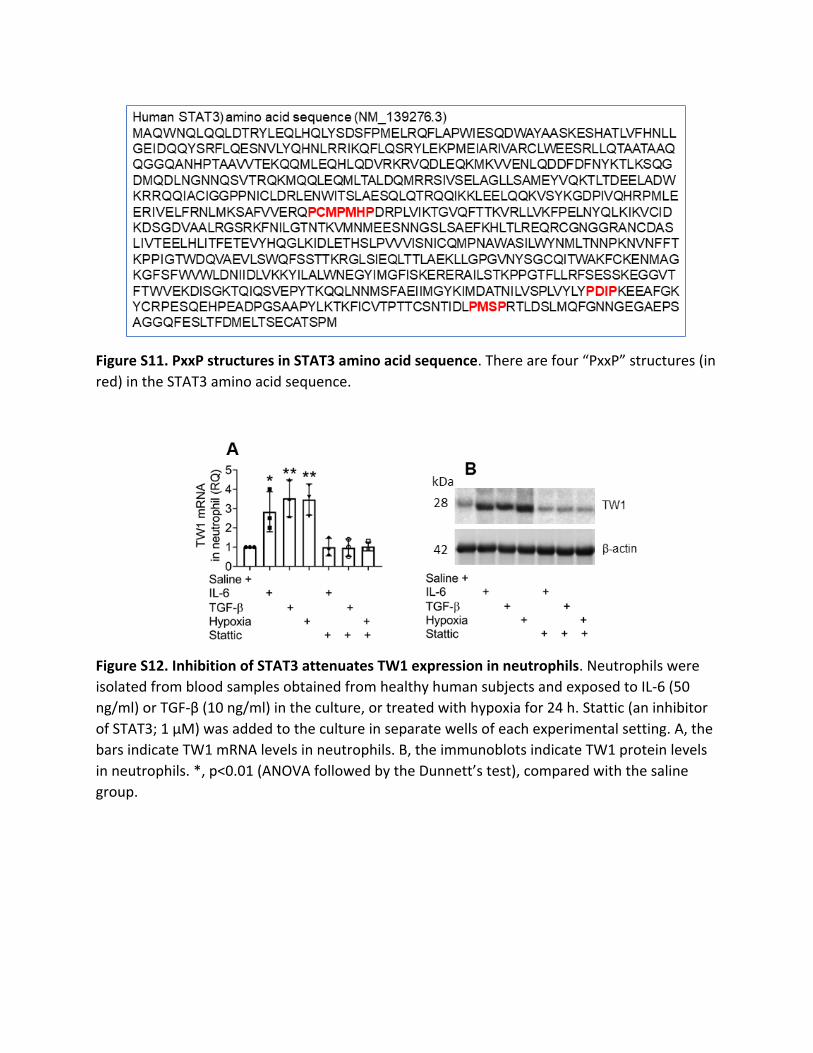
Figure S11. PxxP structures in STAT3 amino acid sequence. There are four “PxxP” structures (in
red) in the STAT3 amino acid sequence.
Figure S12. Inhibition of STAT3 attenuates TW1 expression in neutrophils. Neutrophils were
isolated from blood samples obtained from healthy human subjects and exposed to IL-6 (50
ng/ml) or TGF-β (10 ng/ml) in the culture, or treated with hypoxia for 24 h. Stattic (an inhibitor
of STAT3; 1 µM) was added to the culture in separate wells of each experimental setting. A, the
bars indicate TW1 mRNA levels in neutrophils. B, the immunoblots indicate TW1 protein levels
in neutrophils. *, p<0.01 (ANOVA followed by the Dunnett’s test), compared with the saline
group.

Figure S13. Colon histology of mice treated with normoxia or hypoxia. Used as controls, naïve
BALB/c mice were treated with normoxia alone or hypoxia alone daily for one week. Colon
segments were excised and processed for paraffin section and HE staining. The representative
images show colon tissue structure. Original magnification: ×200.
Figure S14. Colon histology of mice carrying TW1-deficient neutrophils. Mice carrying TW1-
deficient neutrophils were treated with saline or DSS in the same procedures as described in
Fig. 6. Representative images show histology of the colon. Original magnification: ×50. Each
group consists of 6 mice.
Figure S15. Assessment of the role of harmine in regulating TW1 in neutrophils. Neutrophils
were isolated from surgically removed colon tissues of NC (n=6) subjects and CR/UC subjects
(n=6), and cultured with the conditions denoted below the graphs for 48 h. Neutrophils were

harvested at the end of culture and analyzed by RT-qPCR and Western blotting. A, boxplots
show TW1 mRNA levels in neutrophils. B, immunoblots show TW1 protein levels in neutrophils.
C, the PVDF membrane of TW1 blots was processed with the “peel-re-blotting” procedures, and
re-blotted with anti-ubiquitin Ab. Immunoblots show ubiquitin levels. Each bubble in boxplots
presents data obtained from one sample. ***, p<0.001 (ANOVA + Dunnett’s test), compared
with the NC group. The data of panel B and C are from one experiment that represent 6
independent experiments. Harmine = 20 µM.