filing at a glance - california
TRANSCRIPT

PDF Pipeline for SERFF Tracking Number DENT-127302198 Generated 07/14/2011 03:17 PM
SERFF Tracking Number: DENT-127302198 State: California
Filing Company: The Dentists Insurance Company State Tracking Number: 11-5668
Company Tracking Number: PL63011RF
TOI: 11.0 Medical Malpractice - Claims
Made/Occurrence
Sub-TOI: 11.0007 Dentists - Oral Surgeons
Product Name: Professional Liability
Project Name/Number: CA PL Rate Filing/CAPL63011RF
Filing at a Glance
Company: The Dentists Insurance Company
Product Name: Professional Liability SERFF Tr Num: DENT-127302198 State: California
TOI: 11.0 Medical Malpractice - Claims
Made/Occurrence
SERFF Status: Assigned State Tr Num: 11-5668
Sub-TOI: 11.0007 Dentists - Oral Surgeons Co Tr Num: PL63011RF State Status: Accepted
Filing Type: Rate Reviewer(s): Geff Greenfield
Authors: Carolyn Unger, Kara
Cross
Disposition Date:
Date Submitted: 06/30/2011 Disposition Status:
Effective Date Requested (New): 07/01/2012 Effective Date (New):
Effective Date Requested (Renewal): 07/01/2012 Effective Date (Renewal):
General Information
Project Name: CA PL Rate Filing Status of Filing in Domicile: Pending
Project Number: CAPL63011RF Domicile Status Comments: This filing was
requested by the California Department of
Insurance
Reference Organization: Reference Number:
Reference Title: Advisory Org. Circular:
Filing Status Changed: 07/01/2011
State Status Changed: 07/13/2011 Deemer Date: 09/13/2011
Created By: Kara Cross Submitted By: Kara Cross
Corresponding Filing Tracking Number:
Filing Description:
Profesional and Business Liability rate filing.
Company and Contact
Filing Contact Information
Kara Cross, Corporate Counsel [email protected]
1201 K Street, 14 Floor 916-554-5906 [Phone]
Sacramento , CA 95814 916-554-5949 [FAX]

PDF Pipeline for SERFF Tracking Number DENT-127302198 Generated 07/14/2011 03:17 PM
SERFF Tracking Number: DENT-127302198 State: California
Filing Company: The Dentists Insurance Company State Tracking Number: 11-5668
Company Tracking Number: PL63011RF
TOI: 11.0 Medical Malpractice - Claims
Made/Occurrence
Sub-TOI: 11.0007 Dentists - Oral Surgeons
Product Name: Professional Liability
Project Name/Number: CA PL Rate Filing/CAPL63011RF
Filing Company Information
The Dentists Insurance Company CoCode: 40975 State of Domicile: California
1201 K St. 17th Floor Group Code: Company Type: Stock Company
Sacramento, CA 95814 Group Name: State ID Number:
(800) 733-0634 ext. [Phone] FEIN Number: 94-2698799
---------
Filing Fees
Fee Required? No
Retaliatory? No
Fee Explanation:
Per Company: No
COMPANY AMOUNT DATE PROCESSED TRANSACTION #
The Dentists Insurance Company $0.00
State Specific
Variance Requested? (Yes/No): Yes
PDF Pipeline for SERFF Tracking Number DENT-127302198 Generated 07/14/2011 03:17 PM
SERFF Tracking Number: DENT-127302198 State: California
Filing Company: The Dentists Insurance Company State Tracking Number: 11-5668
Company Tracking Number: PL63011RF
TOI: 11.0 Medical Malpractice - Claims
Made/Occurrence
Sub-TOI: 11.0007 Dentists - Oral Surgeons
Product Name: Professional Liability
Project Name/Number: CA PL Rate Filing/CAPL63011RF
Form Schedule
PDF Pipeline for SERFF Tracking Number DENT-127302198 Generated 07/14/2011 03:17 PM
SERFF Tracking Number: DENT-127302198 State: California
Filing Company: The Dentists Insurance Company State Tracking Number: 11-5668
Company Tracking Number: PL63011RF
TOI: 11.0 Medical Malpractice - Claims
Made/Occurrence
Sub-TOI: 11.0007 Dentists - Oral Surgeons
Product Name: Professional Liability
Project Name/Number: CA PL Rate Filing/CAPL63011RF
Rate Information
Rate data does NOT apply to filing.

PDF Pipeline for SERFF Tracking Number DENT-127302198 Generated 07/14/2011 03:17 PM
SERFF Tracking Number: DENT-127302198 State: California
Filing Company: The Dentists Insurance Company State Tracking Number: 11-5668
Company Tracking Number: PL63011RF
TOI: 11.0 Medical Malpractice - Claims
Made/Occurrence
Sub-TOI: 11.0007 Dentists - Oral Surgeons
Product Name: Professional Liability
Project Name/Number: CA PL Rate Filing/CAPL63011RF
Supporting Document Schedules
Item Status: Status
Date:
Bypassed - Item: Prior Approval Rate Application
Bypass Reason: See attached pdf and filing memorandum which will satisfy prior approval rate application. Due
to alternate template inserted, per CCR Section 2644.4(d).
Comments:
Item Status: Status
Date:
Satisfied - Item: Prior Approval Rate Application,
Filing Memorandum, Template and
Exhibits
Comments:
Attachment:
TDIC PriorApprovalRateApplication040411 @ 2011-06-30 (final).pdf


STATE OF CALIFORNIA Company NameDEPARTMENT OF INSURANCE (CDI) Line of Insurance
List each insurance company in alphabetical order.
Company Name
Company Name
Company Name
Company Name
Company Name
Company Name
Company Name
Company Name
Company Name
Company Name
The Dentists Insurance CompanyMEDICAL MALPRACTICE
If yes, please complete (Super Group) Exhibit 19.
Edition Date: 4/4/2011
( Department use only )
( Department use only )
INSURER GROUP MULTI-COMPANY FILING
CDI Filing No.
For private passenger auto insurance only, does CIC, 1861.16(c) apply?
NAIC Company Code
NAIC Company Code
CDI Filing No.
CDI Filing No.
( Department use only )
( Department use only )
NAIC Company Code
NAIC Company Code
CDI Filing No.
CDI Filing No.
( Department use only )
( Department use only )
NAIC Company Code
NAIC Company Code
CDI Filing No.
CDI Filing No.
( Department use only )
( Department use only )
NAIC Company Code
NAIC Company Code
CDI Filing No.
CDI Filing No.
( Department use only )
( Department use only )
NAIC Company Code
NAIC Company Code
CDI Filing No.
No
Prior Approval Rate Application(Insurer Group Information) Page 2

STATE OF CALIFORNIA Company Name: The Dentists Insurance CompanyDEPARTMENT OF INSURANCE (CDI) Line of Insurance: MEDICAL MALPRACTICE
4/4/2011
PROPERTY AND LIABILITY FILING SUBMISSION DATA SHEET
The purpose of this filing is as follows: (More than one may be marked )
TYPE OF FILING PRIOR APPROVAL RATE APPLICATIONPAGES and EXHIBITS REQUIRED
Rates ( Including adoption of advisory organization loss costs. )
Increase rates Pages 1 through 10, 13 & 14, plus exhibits
Decrease rate Pages 1 through 10, 13 & 14, plus exhibits
Zero Overall rate impact Pages 1 through 10, 13 & 14, plus exhibits
Variance
Page 11 and exhibit 13
Filed after the prior approval application to which it applies. Pages 1 through 6, 11, plus exhibit 13
Coverage Forms ( Including adoption of advisory organization forms. )
With rate impact Pages 1 through 10, 12a, 13 & 14 plus exhibits
Without rate impact Pages 1 through 5, 12a
Rules ( Including adoption of advisory organization rules. )
With rate impact Pages 1 through 10, 12b, 13 & 14 plus exhibits
Without rate impact Pages 1 through 5, 12b, Exhibit 20
Edition Date:
Filed together with the prior approval application to which it applies.
All Private Passenger Automobile class plans must be filed separately from the Prior Approval Rate Applications.
Pages 1 through 7, 10, 12, 13 & 14, plus exhibit 17
New Program ( Including adoption of advisory organization loss costs, forms and rules.)
Prior Approval Rate Application(Filing Data) Page 3
STATE OF CALIFORNIA Company Name:DEPARTMENT OF INSURANCE (CDI) Line of Insurance:
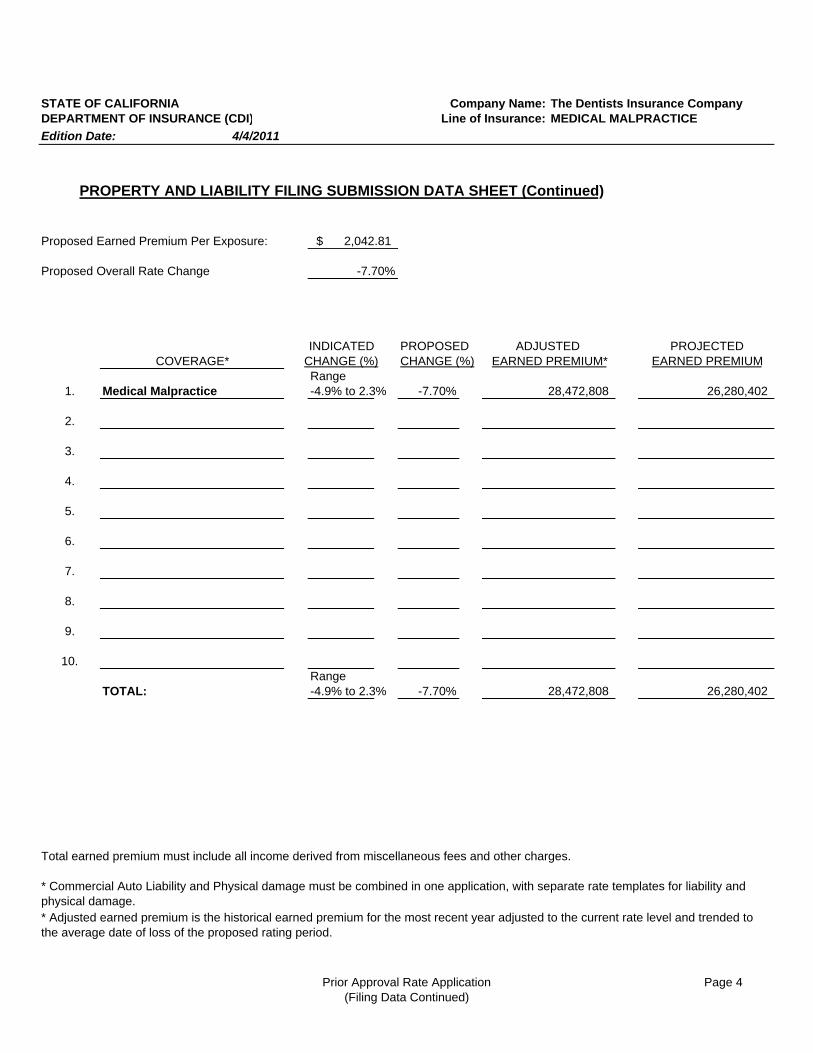
Proposed Earned Premium Per Exposure:
Proposed Overall Rate Change
INDICATED PROPOSEDCHANGE (%) CHANGE (%)Range
1. -4.9% to 2.3% -7.70%
2.
3.
4.
5.
6.
7.
8.
9.
10.Range
TOTAL: -4.9% to 2.3% -7.70%
COVERAGE* EARNED PREMIUM* EARNED PREMIUM
PROPERTY AND LIABILITY FILING SUBMISSION DATA SHEET (Continued)
2,042.81$
-7.70%
ADJUSTED PROJECTED
Medical Malpractice 28,472,808 26,280,402
* Adjusted earned premium is the historical earned premium for the most recent year adjusted to the current rate level and trended to the average date of loss of the proposed rating period.
Total earned premium must include all income derived from miscellaneous fees and other charges.
* Commercial Auto Liability and Physical damage must be combined in one application, with separate rate templates for liability and physical damage.
28,472,808 26,280,402
Edition Date: 4/4/2011
The Dentists Insurance CompanyMEDICAL MALPRACTICE
Prior Approval Rate Application(Filing Data Continued)
Page 4

STATE OF CALIFORNIA Company Name: The Dentists Insurance CompanyDEPARTMENT OF INSURANCE (CDI) Line of Insurance: MEDICAL MALPRACTICE
4/4/2011
Reconciliation of Direct Earned Premium, Page 8*
Miscellaneous Fees and Other Charges, Page 10
Variance Request, Page 11
Excluded Expenses, Page 13
Projected Yield and Federal Income Tax Rate on Investment Income, Page 14
Forms (Attach all independent forms and list all advisory organization forms )
Group Filing, Page 2
Property and Liability Filing SubmissionData Sheet, Page 3
Edition Date:
FILING CHECKLISTUse this checklist to assemble a complete application
Prior Approval Rate Application, Page 1
Property and Liability Filing Submission
Underwriting Rules
Supporting Data Exhibits, Page 6
Filing Checklist, Page 5
Copies of Reinsurance Agreements
Data Sheet, Page 4
Ratemaking Data and Template (s), Page 7*
Additional Data Required by Statute, Page 9
Forms and Rules, Page 12
(Applies only to Medical Malpractice with facultative reinsurance attachment points above one million dollars and Earthquake, where the cost of reinsurance is included in the rate development.)
Filing Memorandum
See the prior approval rate filing instructions regarding the following attachments.
Printed Rate and Rule Manual Pages
Prior Approval Rate Application(Filing Checklist) Page 5

STATE OF CALIFORNIA Company Name: The Dentists Insurance CompanyDEPARTMENT OF INSURANCE (CDI) Line of Insurance: MEDICAL MALPRACTICE
( DCCE ) Development Factors
Exhibit 20:
Exhibit 21:
Edition Date: 4/4/2011
SUPPORTING DATA EXHIBITSUse this document to assemble a complete application
Exhibit 1: Filing History
Exhibit 2: Rate Level History
Exhibit 3: Policy Term Distribution
Exhibit 4: Premium Adjustment Factor
Exhibit 5: Premium Trend Factor
Exhibit 6: Miscellaneous Fees and Other Charges
Exhibit 7: Loss and Defense & Cost Containment Expense
Exhibit 8: Loss and DCCE Trend
Exhibit 9: Catastrophe Adjustment
Exhibit 10: Credibility Adjustment
Exhibit 11: Ancillary Income
Exhibit 12: Reinsurance Premium and Recoverables
Exhibit 13: Variance
Exhibit 14: Insurer's Ratemaking Calculations
Exhibit 15: Rate Distribution
Exhibit 16: Rate Classification Relativities
Exhibit 17: New Program
Rules
Super Group Corporate Structure Verification (PPA only)
Exhibit 18: Group Filing
Exhibit 19:
Prior Approval Rate Application(Supporting Data Exhibits) Page 6

PER FILING MEMORANDUM, SEE SHEETS 1 AND 3 IN ALTERNATE TEMPLATE
RATEMAKING DATA (Click + to expand for more than 3 years; - to contract)
Completed byKara Cross
Date Completed6/30/2011
Company/GroupLine Description
Coverage
%Captive %Direct %Independent (Must add up to 100%)Marketing System: 100.00%
Prior Effective Date (current rates)Proposed Effective Date (new rates)
CDI File Number (Department use only) 0
Does the data provided below reflect a Request for Variance? Variance #:
Data below is:
2nd Prior Year 1st Prior Year Most Recent YearProjected*/ New
Program**2008 2009 2010
1 California Direct Written Premium
2 California Direct Earned Premium
3 Premium Adjustment Factor (Developed in Exhibit 4)
4 Premium Trend Factor * (Developed in Exhibit 5)
5 Miscellaneous Fees and Flat Charges (Not included in Line 2; Developed in Exhibit 6)
6 Earned Exposure Units
7 Historic Losses (Projected for New Programs)
8 Historic Defense and Cost Containment Expense (DCCE)
9 Loss Development Factor (Developed in Exhibit 7)
10 DCCE Development Factor (Developed in Exhibit 7)
11 Loss Trend Factor* (Developed in Exhibit 8)
12 DCCE Trend Factor* (Developed in Exhibit 8)
13 Catastrophe Adjustment Factor (Developed in Exh 9)
14 Credibility Factor for Losses & DCCE (Developed in Exhibit 10)
15 Excluded Expense Factor (From Page 13) 2.62%
16 Ancillary Income (Developed in Exhibit 11)
17 Projected Federal Income Tax Rate on Investment Income (From Page 14)
28.85%
18 Projected Yield (From Page 14) 6.19%
Complete 19, 20 & 21 For Earthquake and certain Medical Malpractice with Reinsurance Only (see instructions
19 Direct Commissions
20 Reinsurance Premium (Developed in Exhibit 12)
21 Reinsurance Recoverables (Developed in Exhibit 12)
Variance Change to Leverage on the basis that the insurer either writes at least 90% of its direct earned premium in one line or writesat least 90% of its direct earned premium in California. (Must be accompanied by Variance Request, subject to CDI approval)
Variance Change to Efficiency Standard (Must be accompanied by Variance Request, subject to CDI approval)
* For all trend factors, the Projected Column should reflect the annual trend expressed as a percentage.
** For New Programs, please see Rate Filing Instructions, Page 4.
MEDICAL MALPRACTICE (claims-made)The Dentists Insurance Company
Report Year Data (Claims Made policies only)
No
No
MEDICAL MALPRACTICE (claims-made)
No
Prior Approval Rate Application(Ratemaking Data) Page 7

PER FILING MEMORANDUM, SEE SHEETS 1 AND 3 IN ALTERNATE TEMPLATESTATE OF CALIFORNIA Company Name
DEPARTMENT OF INSURANCE (CDI Line of Insurance
2nd 1st MostPrior Prior RecentYear Year Year
2008 2009 2010
1.
2.
3.
4.
5.
6.
7.
8.
9.
10.
Statutory
TOTAL
For residual market data, a filing number is not required.
Explain the Differences:
This exhibit requires insurers to itemize each program until all data is reconciled to the corresponding annual statement line
of insurance ( Statutory Page 14 ).
Difference -$ -$ -$
Page 14
-$ -$ -$
ProgramMost Recent CDI File #
STATUTORY PAGE 14 CALENDAR YEAR DATA
RECONCILIATION OF DIRECT EARNED PREMIUM DATA PER PROGRAM
The Dentists Insurance CompanyMEDICAL MALPRACTICE
Edition Date: 4/4/2011
Prior Approval Rate Application(Premium Reconciliation) Page 8

STATE OF CALIFORNIADEPARTMENT OF INSURANCE (CDI)
Year 2010
1. Number of claims outstanding at beginning of year 595
2. 495
3. 571
4. Number of claims outstanding at year's end ( (1) + (2) - (3) ) 519
5. 14,953,681
6. 14,747,175
7. Net loss reserves for outstanding claims excluding claims incurred but not reported 12,592,498
8. 15,480,192
9. Losses incurred as a percentage of premiums earned - including IBNR 53.9%
10. Net investment gain or loss and other income or gain or loss allocated to the line. 1,771,958
11. Net income before federal and foreign income taxes ( line 10 plus line 15 ) 2,009,413
12. Total number of policies in force on the last day of the reporting period 14,888
13. 539
14. Total number of policies non-renewed 148
15. 237,454( =CY earned premiums minus CY incurred loss minus CY incurred expense )
16.
0
0
5,880,364
964,907
4,910,349
0
Edition Date: 4/4/2011
Company Name: The Dentists Insurance CompanyLine of Insurance: MEDICAL MALPRACTICE
ADDITIONAL DATA REQUIRED BY STATUTE*Calendar Year
DATA
Number of claims during the year
Number of claims closed during the year
Unearned Premiums
Dollar amount of claims paid
Net loss reserves for claims incurred but not reported
Total number of policies cancelled
Net underwriting gain or loss
Separate allocations of expenses for:
a) commissions and brokerage expense,
f) other expenses
*CIC 1857.7, CIC 1857.9 and CIC 1864
b) other acquisition costs,
c) general office expenses,
d) taxes, licenses and fees,
e) loss adjustment expense ( DCCE & AOE ), and
Prior Approval Rate Application(Additional Data) Page 9
STATE OF CALIFORNIA Company Name:DEPARTMENT OF INSURANCE (CDI) Line of Insurance:
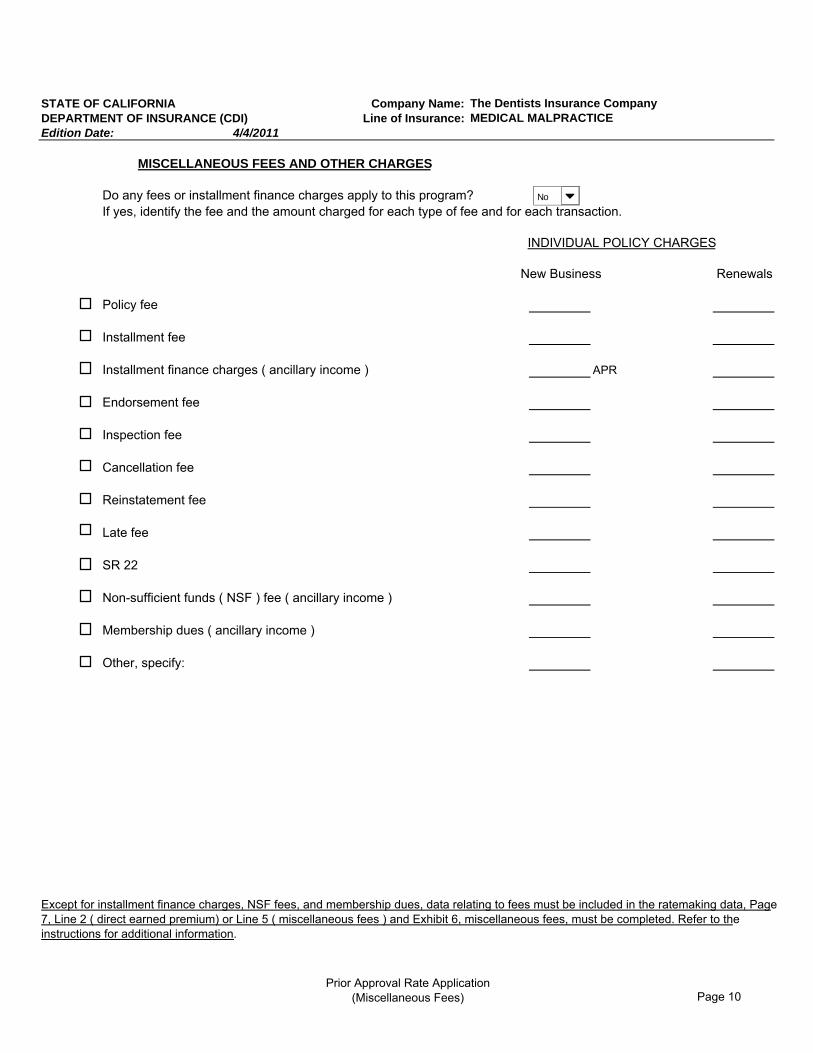
INDIVIDUAL POLICY CHARGES
New Business Renewals
Policy fee
Installment fee
Installment finance charges ( ancillary income ) APR
Endorsement fee
Inspection fee
Cancellation fee
Reinstatement fee
Late fee
SR 22
Non-sufficient funds ( NSF ) fee ( ancillary income )
Membership dues ( ancillary income )
Other, specify:
The Dentists Insurance CompanyMEDICAL MALPRACTICE
Except for installment finance charges, NSF fees, and membership dues, data relating to fees must be included in the ratemaking data, Page 7, Line 2 ( direct earned premium) or Line 5 ( miscellaneous fees ) and Exhibit 6, miscellaneous fees, must be completed. Refer to the instructions for additional information.
Do any fees or installment finance charges apply to this program?If yes, identify the fee and the amount charged for each type of fee and for each transaction.
MISCELLANEOUS FEES AND OTHER CHARGES
Edition Date: 4/4/2011
No
Prior Approval Rate Application(Miscellaneous Fees) Page 10

STATE OF CALIFORNIADEPARTMENT OF INSURANCE (CDI)
1. ((See below (F))
2.
3.
4.
IDENTIFY THE BASES FOR VARIANCE - Refer to CCR 2644.27 (f) for the full regulation text.
-19.83%
(Change At Max Per Template)
1. Relief from the efficiency standard for bona fide loss-prevention and loss reduction activities.
A. Allocated cost for SIU.B. Expenses for loss prevention programs.
Maximum Permitted Rate Change % With Only This Variance
(Change At Max Per Template)
2. Relief from the efficiency standard due to any of the following:
A. Higher quality of service, as demonstrated by objective measures of consumer satisfaction; orB. Demonstrated superior service to underserved communities ( CCR 2646.6 ); orC. Significantly smaller or larger than average California policy premium, including any applicable fees.
Maximum Permitted Rate Change % With Only This Variance -7.71%
(Change At Max Per Template)
3.
Maximum Permitted Rate Change % With Only This Variance
(Change At Max Per Template)
4.
Maximum Permitted Rate Change % With Only This Variance
(Change At Max Per Template)
5.
6.
Maximum Permitted Rate Change % With Only This Variance
(Change At Max Per Template)
7. The loss development formula in CCR 2644.6 does not produce an actuarially sound result because:
A. There is not enough data to be credibleB. There is not enough years of data to fully calculate the development to ultimate;C.
D. There are changes in coverage or other policy terms that significantly affect the data; or,E. There are changes in the law that significantly affect the data.F. There is a significant increase or decrease in the amount of business written or significant changes in the mix of business.
Maximum Permitted Rate Change % With Only This Variance
(Change At Max Per Template)
Edition Date: 4/4/2011
IMPORTANT: Identify the facts and their source justifying the variance request and provide the documentation supporting the amount of the change to the component of the ratemaking formula. (Complete Exhibit 13)
Relief from operation of the efficiency standard for a line of insurance in which the insurer has never written over $1 million in earned premium annually and the insurer is making a substantial investment in order to enter the market.
Maximum Permitted Rate Change % Excluding Variance
REQUEST FOR VARIANCE
Identify each variance requested.
Identify the extent or amount of the variance requested and the applicable component of the ratemaking formula. [ Complete Exhibit 13 ]
Set forth the expected result or impact on the maximum and minimum permitted earned premium that the granting of the variance will have as compared to the expected result if the variance is denied. [ Complete Exhibit 13 ]
Company Name:Line of Insurance:
The Dentists Insurance CompanyMEDICAL MALPRACTICE
The minimum permitted earned premium should be lower on the basis of the insurer's certification that the rate will not cause the insurer's financial condition to present an undue risk to its solvency.
The insurer's financial condition is such that its maximum permitted earned premium should be increased in order to protect solvency.
There are changes in the insurer's reserving or claims closing practices that significantly affect the data; or,
The leverage factor should be different from the leverage factor determined pursuant to section 2644.17 on the basis that the insurer either writes at least 90% of its direct earned premium in one line or writes at least 90% of its direct earned premium in California, and its mix of business presents investment risks different from the risks that are typical of the line as a whole.
Prior Approval Rate Application

8. The trend formula in CCR 2644.7 does not produce the most an actuarially sound result because:
A.
B.C There is a significant change in the law affecting frequency or severity of claims;
D
E.
F. There are changes in coverage or other policy terms that significantly affect the data.
Maximum Permitted Rate Change % With Only This Variance
(Change At Max Per Template)
9. The maximum permitted earned premium would be confiscatory if applied.
Maximum Permitted Rate Change % With Only This Variance
(Change At Max Per Template)
34.06%
There is a significant increase/decrease in the amount of business written or changes in the mix of business:
There are not enough years of data to calculate the trend factor;
Overall Maximum Permitted Rate Change %
Not withstanding any other section of these regulations, the aggregate total adjustment to the efficiency standard for all variances combined shall not exceed the difference between the insurer's most recent year total expense ratio excluding defense and cost containment expenses and the efficiency standard.
Most Recent Year Total Expense Ratio
There are changes in the insurer's claims closing practices that significantly affect the data; or,
It can be shown that a trend calculated over a period of at least 4 quarters other than a period permitted pursuant to section 2644.7(b) is more reliable prospectively.
Prior Approval Rate Application

STATE OF CALIFORNIA Company Name:
DEPARTMENT OF INSURANCE (CDI) Line of Insurance:
Company Organization: 2nd Prior Year 1st Prior Year
2008 2009 2010
Countrywide direct earned premium:42,506,737 44,389,985 45,733,259
42,506,737 44,389,985 45,733,259
2644.10 (b): Executive Compensation
Cash & Salary Bonus Cash & Salary Bonus Cash & Salary Bonus
1st Highest Paid 195,385 25,301 205,769 27,651 261,154 24,000
2nd Highest Paid 180,346 28,445 190,039 18,701 225,385 30,000
3rd Highest Paid 180,040 10,000 181,731 21,101 179,231 22,750
4th Highest Paid 175,000 21,875 143,462 16,301 160,962 26,110
5th Highest Paid 135,615 14,160 129,808 13,851 148,923 21,000
Max Permissible Excessive Max Permissible Excessive Max Permissible Excessive Exc Comp Compensation Exc Comp Compensation Exc Comp Compensation
1st Highest Paid 174,311 46,375 174,311 59,109 174,311 110,843
2nd Highest Paid 123,071 85,720 123,071 85,669 123,071 132,314
3rd Highest Paid 92,906 97,134 92,906 109,926 92,906 109,075
4th Highest Paid 87,048 109,827 87,048 72,715 87,048 100,024
5th Highest Paid 81,141 68,634 81,141 62,518 81,141 88,782
Total Excessive Executive Comp: 407,690 389,937 541,038
Prior Approval Rate Application(Excluded Expense Factor) P13a
2nd Prior Year 1st Prior Year Most Recent Year
2nd Prior Year 1st Prior Year Most Recent Year
The Dentists Insurance CompMEDICAL MALPRACTICE
EXCLUDED EXPENSE FACTOR
Countrywide direct earned premium for lines of business subject to Proposition 103:
Edition Date: 4/4/2011
(Insurer Group Data)
(Enter Year)
Most Recent Year
2008 2009 2010
2008 2009 2010
Stock

STATE OF CALIFORNIA Company Name:
DEPARTMENT OF INSURANCE (CDI) Line of Insurance:
Countrywide Data 2nd Prior Year 1st Prior Year
2008 2009 2010
2644.10 (a): Political contribution and lobbying 213,936 177,546 185,859
2644.10 (b): Excessive Executive Compensation 407,690 389,937 541,038
2644.10 (c): Bad faith judgments and associated DCCE 0 0 0
2644.10 (d): All costs for unsuccessful defense of discrimination claims 0 0 0
2644.10 (e): Fines and penalties 0 0 0
2644.10 (f): Institution advertising expenses 500,790 502,905 560,382
2644.10 (g): Excessive payments to affiliates 0 0 0
Total excluded expenses 1,122,416 1,070,388 1,287,279
Excluded expense factor 2.64% 2.41% 2.81%
3-year average excluded expense factor 2.62%
Prior Approval Rate Application(Excluded Expense Factor) P13b
MEDICAL MALPRACTICE
Excluded Expense Factor
Most Recent Year
The Dentists Insurance Comp

STATE OF CALIFORNIA Company Name: The Dentists Insurance Company
DEPARTMENT OF INSURANCE (CDI) Line of Insurance: MEDICAL MALPRACTICE
PROJECTED YIELD AND FEDERAL INCOME TAX RATE ON INVESTMENT INCOME
AssetsOver 1 yr Over 5 yrs Over 10 yrs
Line number One year or less through 5 yrs through 10 yrs through 20 yrs Over 20 yrs
1.7 US governments 59,812 11,915,239 7,418,158 7,469,704 923,109
2.7 All other governments 0 0 0 1,294,892 0
3.7States, territories and possessions 148,270 2,599,018 2,053,867 0 0
4.7 Political subdivisions 0 1,200,980 9,420,062 0 0
5.7Special revenue and assessment obligations 5,010,893 22,889,543 26,432,125 7,149,010 1,194,533
6.7 Public utilities unaffiliated 7,295,275 11,602,670 17,202,166 633,008 0
7.7 Industrial and miscellaneous 0 0 0 0 0
8.7 Credit tenant loans 0 0 0 0 0
9.7Parent, subsidiaries and affiliates 0 0 0 0 0
One year or less
(1)US government bonds Sum of line 1.7 and 2.7 59,812 19,333,397 9,687,705
(2)
Other taxable bonds Sum of line 6.7, 7.7, 8.7, 9.7 and half of 5.7 9,800,722 53,465,670 4,804,780
(3)
Tax exempt bonds Sum of line 3.7, 4.7, and halfof 5.7 2,653,717 39,934,761 4,171,772
Data on line 1.7 through 9.7 are from the insurer group's most recent consolidated statutory annual statement, schedule D,
part 1A, section 1.
Page 14a
Edition Date: 4/4/2011
Over 1 year through 10 years Over 10 years
Short Term Intermediate Long TermTerm Assets Assets
Prior Approval Rate Application(Yield Tax Worksheet)
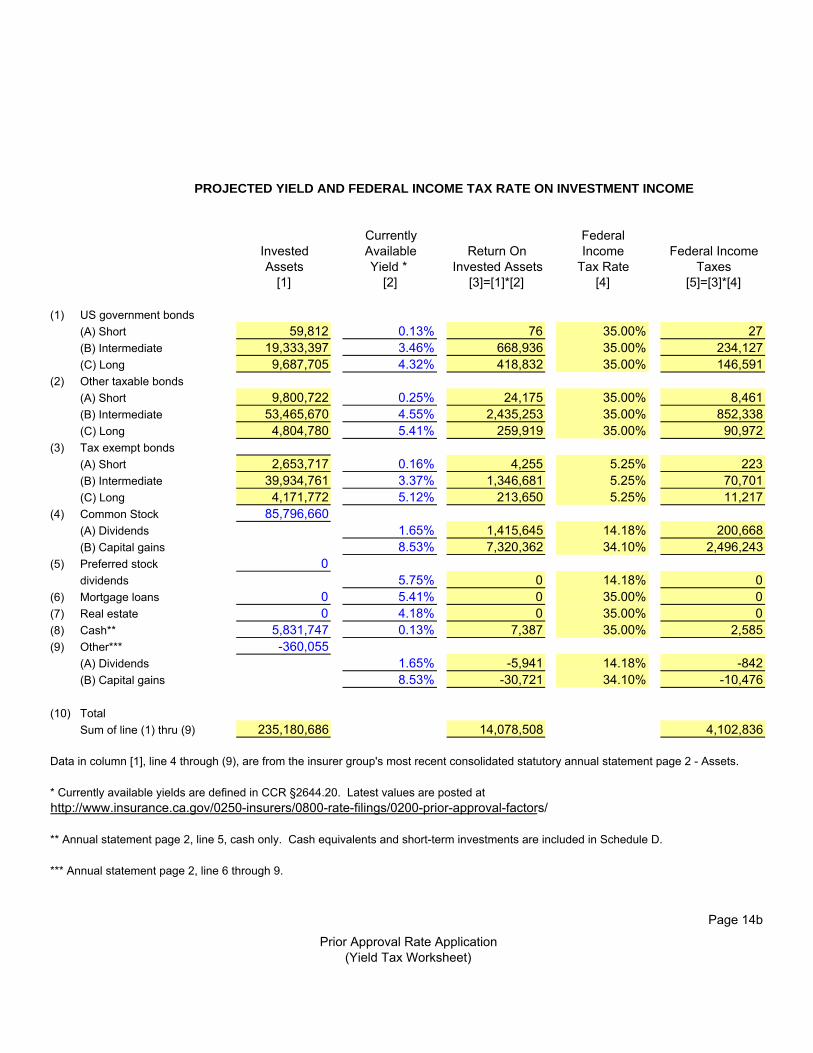
PROJECTED YIELD AND FEDERAL INCOME TAX RATE ON INVESTMENT INCOME
Currently FederalInvested Available Return On Income Federal IncomeAssets Yield * Invested Assets Tax Rate Taxes
[1] [2] [3]=[1]*[2] [4] [5]=[3]*[4]
(1) US government bonds
(A) Short 59,812 0.13% 76 35.00% 27(B) Intermediate 19,333,397 3.46% 668,936 35.00% 234,127(C) Long 9,687,705 4.32% 418,832 35.00% 146,591
(2) Other taxable bonds
(A) Short 9,800,722 0.25% 24,175 35.00% 8,461(B) Intermediate 53,465,670 4.55% 2,435,253 35.00% 852,338(C) Long 4,804,780 5.41% 259,919 35.00% 90,972
(3) Tax exempt bonds
(A) Short 2,653,717 0.16% 4,255 5.25% 223(B) Intermediate 39,934,761 3.37% 1,346,681 5.25% 70,701(C) Long 4,171,772 5.12% 213,650 5.25% 11,217
(4) Common Stock 85,796,660(A) Dividends 1.65% 1,415,645 14.18% 200,668(B) Capital gains 8.53% 7,320,362 34.10% 2,496,243
(5) Preferred stock 0dividends 5.75% 0 14.18% 0
(6) Mortgage loans 0 5.41% 0 35.00% 0(7) Real estate 0 4.18% 0 35.00% 0(8) Cash** 5,831,747 0.13% 7,387 35.00% 2,585(9) Other*** -360,055
(A) Dividends 1.65% -5,941 14.18% -842(B) Capital gains 8.53% -30,721 34.10% -10,476
(10) Total
Sum of line (1) thru (9) 235,180,686 14,078,508 4,102,836
Data in column [1], line 4 through (9), are from the insurer group's most recent consolidated statutory annual statement page 2 - Assets.
* Currently available yields are defined in CCR §2644.20. Latest values are posted athttp://www.insurance.ca.gov/0250-insurers/0800-rate-filings/0200-prior-approval-factors/
** Annual statement page 2, line 5, cash only. Cash equivalents and short-term investments are included in Schedule D.
*** Annual statement page 2, line 6 through 9.
Page 14b
Prior Approval Rate Application(Yield Tax Worksheet)

PROJECTED YIELD AND FEDERAL INCOME TAX RATE ON INVESTMENT INCOME
Currently FederalInvested Available Return On Income Federal IncomeAssets Yield Invested Assets Tax Rate Taxes
[1] [2] [3]=[1]*[2] [4] [5]=[3]*[4]
(10) Total 235,180,686 14,078,508 4,102,836line (10)exhibit 13, page 2
(11) Investment expense 660,748 35.00% 231,262Annual Statement (AS)page 11, line 25
(12) Total 235,180,686 13,417,760 3,871,574after investment expenseline (10) - line (11)
(13) Federal income tax rateline (12)
column [5] / column [3] 28.85%
(14) Projected yield 5.71%on invested assetsline (12)
column [3] / column [1]
Most Recent Year
(15) Loss reserves 24,899,989AS page 3, line 1
(16) Loss adjustment 26,297,596expense reservesAS page 3, line 3
(17) Unearned premium 18,653,059reservesAS page 3, line 9
(18) Surplus as regards 147,036,656to policyholdersAS page 3, line 35
(19) Total reserves and 216,887,300surplusSum of line (15) to (18)
(20) Projected yield adjusted to reserve and surplus base
line (14) * line (12) / line (19) 6.19%Page 14c
Prior Approval Rate Application(Yield Tax Worksheet)

ALTERNATE TEMPLATESheet 1
Variance
The Dentists Insurance Company
Professional Liability and General Liability
Rate Template Calculations
Direct Trended Loss & DCCE AdjustedCoverage Earned Adjusted Current Rate per Loss & DCCE
Year Exposures Premium Losses Level Premium Exposure Ratio(1) (2) (3) (4) (5) (6) (7)
2001 9,207 $15,588,263 $19,257,447 $1,693.15 $2,091.69 123.54%2002 9,636 16,269,704 13,493,227 1,688.48 1,400.33 82.93%2003 10,206 18,591,803 18,962,466 1,821.70 1,858.02 101.99%2004 10,682 21,580,918 20,081,422 2,020.38 1,879.99 93.05%2005 11,039 21,749,393 19,319,650 1,970.23 1,750.12 88.83%2006 11,328 22,336,689 18,584,937 1,971.79 1,640.60 83.20%2007 11,788 23,190,071 17,493,686 1,967.20 1,483.98 75.44%2008 12,236 24,130,100 19,626,342 1,971.99 1,603.93 81.34%2009 12,560 25,469,105 19,339,818 2,027.77 1,539.78 75.93%2010 12,865 25,995,584 17,775,795 2,020.67 1,381.74 68.38%
Total 111,547 $214,901,630 $183,934,789 $1,926.56 $1,648.95 85.59%Last 7 82,499 164,451,860 132,221,650 1,993.39 1,602.71 80.40%
Last 7 ex 2010 69,634 138,456,276 114,445,855 1,988.35 1,643.54 82.66%
CDI Parameters
FIT_UW 35.00%Eff_Standard 30.98%Leverage 0.59Premium_Tax_Rate 2.35%Surplus_Ratio 1.69UEP_Res_Ratio 0.42Loss_Res_Ratio 4.21Risk Free Rate of Return 2.09%Maximum Rate of Return 8.09%Minimum Rate of Return -6.00%
TDIC Data Total Last 7 Last 7 ex 2010
Credibility 100.00% 100.00% 100.00%Expense Exclusion Factor 2.62%Anc_Inc 0FIT_Inv 28.85%Yield 6.19%
CDI Calculations
Trended_Current_Rate_Level_Premium 1,926.56 1,993.39 1,988.35Loss+DCCE_Per_Exp 1,648.95 1,602.71 1,643.54Comp_Loss+DCCE_Per_Exp 2,695.90 2,789.37 2,782.32Cred_Loss_Per_Exp 1,648.95 1,602.71 1,643.54Fixed_Inv_Inc_Factor 28.51%Var_Inv_Inc_Factor 14.29%Annual_Net_Trend 6.20%Comp_Trend 27.20%Max_Profit 21.03%Min_Profit -15.60%Max_Denom 0.623Min_Denom 0.989Max_Premium $1,892.86 $1,839.78 $1,886.65Min_Premium $1,191.80 $1,158.38 $1,187.89Change_At_Min -38.14% -41.89% -40.26%Change_At_Max -1.75% -7.71% -5.11%
V:\The Dentists Insurance Co - 114833\11\RCS\187656 - CA Rates\Exec - Anl\TDIC CA PL GL Rate Study 12312010Template S1 - var6/30/2011 10:49 AM

ALTERNATE TEMPLATESheet 1
No Variance
The Dentists Insurance Company
Professional Liability and General Liability
Rate Template Calculations
Direct Trended Loss & DCCE AdjustedCoverage Earned Adjusted Current Rate per Loss & DCCE
Year Exposures Premium Losses Level Premium Exposure Ratio(1) (2) (3) (4) (5) (6) (7)
2001 9,207 $15,588,263 $19,257,447 $1,693.15 $2,091.69 123.54%2002 9,636 16,269,704 13,493,227 1,688.48 1,400.33 82.93%2003 10,206 18,591,803 18,962,466 1,821.70 1,858.02 101.99%2004 10,682 21,580,918 20,081,422 2,020.38 1,879.99 93.05%2005 11,039 21,749,393 19,319,650 1,970.23 1,750.12 88.83%2006 11,328 22,336,689 18,584,937 1,971.79 1,640.60 83.20%2007 11,788 23,190,071 17,493,686 1,967.20 1,483.98 75.44%2008 12,236 24,130,100 19,626,342 1,971.99 1,603.93 81.34%2009 12,560 25,469,105 19,339,818 2,027.77 1,539.78 75.93%2010 12,865 25,995,584 17,775,795 2,020.67 1,381.74 68.38%
Total 111,547 $214,901,630 $183,934,789 $1,926.56 $1,648.95 85.59%Last 7 82,499 164,451,860 132,221,650 1,993.39 1,602.71 80.40%
Last 7 ex 2010 69,634 138,456,276 114,445,855 1,988.35 1,643.54 82.66%
CDI Parameters
FIT_UW 35.00%Eff_Standard 21.56%Leverage 0.59Premium_Tax_Rate 2.35%Surplus_Ratio 1.69UEP_Res_Ratio 0.42Loss_Res_Ratio 4.21Risk Free Rate of Return 2.09%Maximum Rate of Return 8.09%Minimum Rate of Return -6.00%
TDIC Data Total Last 7 Last 7 ex 2010
Credibility 100.00% 100.00% 100.00%Expense Exclusion Factor 2.62%Anc_Inc 0FIT_Inv 28.85%Yield 6.19%
CDI Calculations
Trended_Current_Rate_Level_Premium 1,926.56 1,993.39 1,988.35Loss+DCCE_Per_Exp 1,648.95 1,602.71 1,643.54Comp_Loss+DCCE_Per_Exp 2,696.06 2,789.54 2,782.49Cred_Loss_Per_Exp 1,648.95 1,602.71 1,643.54Fixed_Inv_Inc_Factor 28.51%Var_Inv_Inc_Factor 14.29%Annual_Net_Trend 6.20%Comp_Trend 27.20%Max_Profit 21.03%Min_Profit -15.60%Max_Denom 0.717Min_Denom 1.083Max_Premium $1,644.17 $1,598.07 $1,638.78Min_Premium $1,088.17 $1,057.66 $1,084.60Change_At_Min -43.52% -46.94% -45.45%Change_At_Max -14.66% -19.83% -17.58%
V:\The Dentists Insurance Co - 114833\11\RCS\187656 - CA Rates\Exec - Anl\TDIC CA PL GL Rate Study 12312010Template S1 - no var6/30/2011 10:49 AM
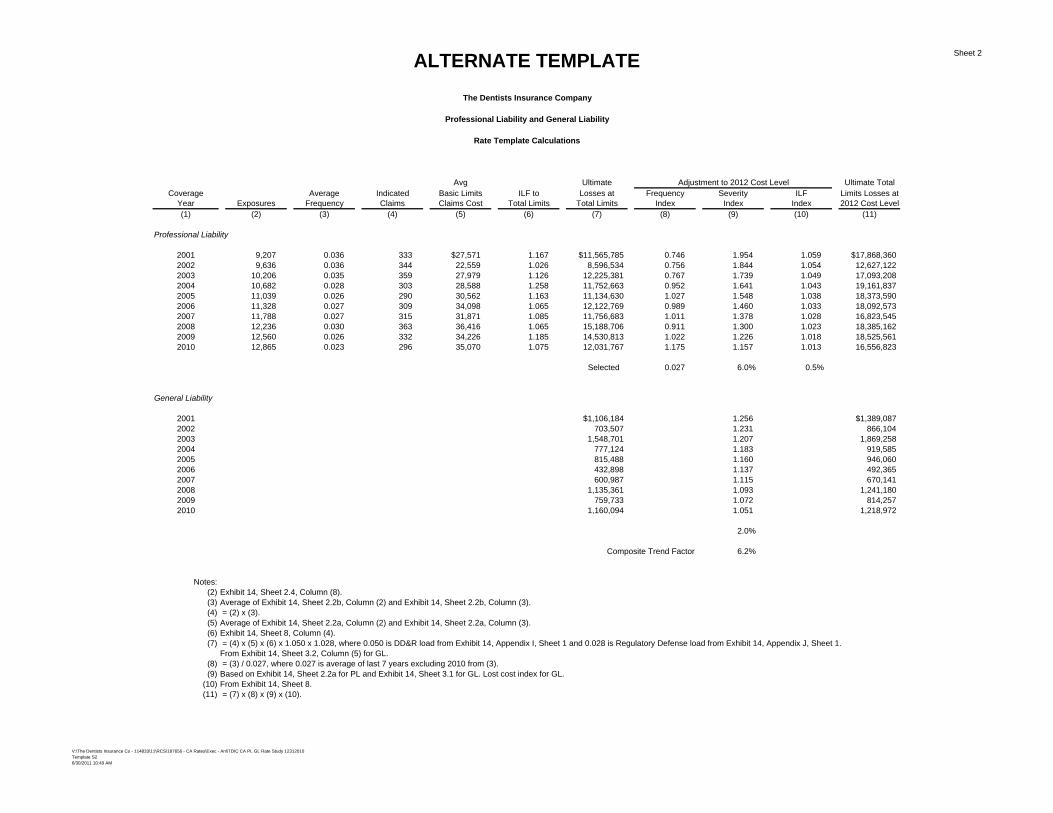
ALTERNATE TEMPLATESheet 2
The Dentists Insurance Company
Professional Liability and General Liability
Rate Template Calculations
Avg Ultimate Adjustment to 2012 Cost Level Ultimate TotalCoverage Average Indicated Basic Limits ILF to Losses at Frequency Severity ILF Limits Losses at
Year Exposures Frequency Claims Claims Cost Total Limits Total Limits Index Index Index 2012 Cost Level(1) (2) (3) (4) (5) (6) (7) (8) (9) (10) (11)
Professional Liability
2001 9,207 0.036 333 $27,571 1.167 $11,565,785 0.746 1.954 1.059 $17,868,3602002 9,636 0.036 344 22,559 1.026 8,596,534 0.756 1.844 1.054 12,627,1222003 10,206 0.035 359 27,979 1.126 12,225,381 0.767 1.739 1.049 17,093,2082004 10,682 0.028 303 28,588 1.258 11,752,663 0.952 1.641 1.043 19,161,8372005 11,039 0.026 290 30,562 1.163 11,134,630 1.027 1.548 1.038 18,373,5902006 11,328 0.027 309 34,098 1.065 12,122,769 0.989 1.460 1.033 18,092,5732007 11,788 0.027 315 31,871 1.085 11,756,683 1.011 1.378 1.028 16,823,5452008 12,236 0.030 363 36,416 1.065 15,188,706 0.911 1.300 1.023 18,385,1622009 12,560 0.026 332 34,226 1.185 14,530,813 1.022 1.226 1.018 18,525,5612010 12,865 0.023 296 35,070 1.075 12,031,767 1.175 1.157 1.013 16,556,823
Selected 0.027 6.0% 0.5%
General Liability
2001 $1,106,184 1.256 $1,389,0872002 703,507 1.231 866,1042003 1,548,701 1.207 1,869,2582004 777,124 1.183 919,5852005 815,488 1.160 946,0602006 432,898 1.137 492,3652007 600,987 1.115 670,1412008 1,135,361 1.093 1,241,1802009 759,733 1.072 814,2572010 1,160,094 1.051 1,218,972
2.0%
Composite Trend Factor 6.2%
Notes:(2) Exhibit 14, Sheet 2.4, Column (8).(3) Average of Exhibit 14, Sheet 2.2b, Column (2) and Exhibit 14, Sheet 2.2b, Column (3).(4) = (2) x (3).(5) Average of Exhibit 14, Sheet 2.2a, Column (2) and Exhibit 14, Sheet 2.2a, Column (3).(6) Exhibit 14, Sheet 8, Column (4).(7) = (4) x (5) x (6) x 1.050 x 1.028, where 0.050 is DD&R load from Exhibit 14, Appendix I, Sheet 1 and 0.028 is Regulatory Defense load from Exhibit 14, Appendix J, Sheet 1.
From Exhibit 14, Sheet 3.2, Column (5) for GL.(8) = (3) / 0.027, where 0.027 is average of last 7 years excluding 2010 from (3).(9) Based on Exhibit 14, Sheet 2.2a for PL and Exhibit 14, Sheet 3.1 for GL. Lost cost index for GL.
(10) From Exhibit 14, Sheet 8.(11) = (7) x (8) x (9) x (10).
V:\The Dentists Insurance Co - 114833\11\RCS\187656 - CA Rates\Exec - Anl\TDIC CA PL GL Rate Study 12312010Template S26/30/2011 10:49 AM

ALTERNATE TEMPLATESheet 3
The Dentists Insurance Company
Professional Liability and General Liability
Determination of Direct Earned Premium
Purchased AdjustedDirect Excluded Reporting Total Direct
Calendar Earned Coverages Endorsements Policyholder Reductions EarnedYear Premium Earned Earned Dividends to DEP Premium(1) (2) (3) (4) (5) (6) (7)
2001 $20,656,253 $185,680 $82,162 $4,800,148 $5,067,990 $15,588,2632002 21,542,795 371,103 102,884 4,799,104 5,273,091 16,269,7042003 22,920,618 447,338 121,174 3,760,303 4,328,815 18,591,8032004 23,965,611 504,942 112,712 1,767,039 2,384,693 21,580,9182005 24,843,988 518,440 143,569 2,432,586 3,094,595 21,749,3932006 25,576,893 571,270 158,655 2,510,279 3,240,204 22,336,6892007 26,490,371 584,041 140,802 2,575,457 3,300,300 23,190,0712008 27,811,584 779,894 190,065 2,711,525 3,681,484 24,130,1002009 28,856,269 950,750 175,510 2,260,904 3,387,164 25,469,1052010 29,509,729 1,036,921 140,385 2,336,839 3,514,145 25,995,584
Notes:(2) From Statutory Page 14 of TDIC Annual Statements for consecutive years.(3) Includes Employment Practices and Identity Recovery coverages.(6) = (3) + (4) + (5).(7) = (2) - (6).
V:\The Dentists Insurance Co - 114833\11\RCS\187656 - CA Rates\Exec - Anl\TDIC CA PL GL Rate Study 12312010Template S36/30/2011 10:49 AM

Blended Captive Direct IndepEFFICIENCY STANDARD TABLE ES: 0.00% 24.18% 25.38% 33.17%SOURCE:2007 - 2009 ROLLING AVGDATE REVISED: 2/10/2011
Line Captive Direct Indep Line Description1.0 39.33% 19.17% 32.04% FIRE2.1 40.67% 20.08% 29.42% ALLIED LINES3.0 33.24% 43.08% 33.53% FARMOWNERS MULTIPLE PERIL4.0 36.21% 27.65% 37.12% HOMEOWNERS MULTIPLE PERIL5.0 34.65% 42.03% 38.18% COMMERCIAL MULTIPLE (5.1 & 5.2 Combined)5.1 35.79% 42.30% 37.12% COMMERCIAL MULTIPLE PERIL(NON-LIABILITY)5.2 31.97% 39.07% 39.69% COMMERCIAL MULTIPLE PERIL(LIABILITY)9.0 39.06% 25.63% 28.76% INLAND MARINE
11.0 24.18% 25.38% 33.17% MEDICAL MALPRACTICE11.1 24.18% 25.38% 33.17% MEDICAL MALPRACTICE(occ)11.2 24.18% 25.38% 33.17% MEDICAL MALPRACTICE (cm)12.0 18.07% 17.08% 22.90% EARTHQUAKE17.0 32.55% 26.99% 30.50% OTHER LIABILITY17.1 32.55% 26.99% 30.50% OTHER LIABILITY (occ)17.2 32.55% 26.99% 30.50% OTHER LIABILITY (cm)18.0 24.58% 22.59% 31.36% PRODUCTS LIABILITY18.1 24.58% 22.59% 31.36% PRODUCTS LIABILITY (occ)18.2 24.58% 22.59% 31.36% PRODUCTS LIABILITY (cm)19.2 34.03% 26.81% 36.40% PRIVATE PASSENGER AUTO LIABILITY19.4 35.77% 31.98% 34.39% COMMERCIAL AUTO LIABILITY21.1 34.42% 27.28% 35.01% PRIVATE PASSENGER AUTO PHYSICAL DAMAGE21.2 34.41% 35.11% 36.30% COMMERCIAL AUTO PHYSICAL DAMAGE22.0 34.10% 34.10% 26.57% AIRCRAFT23.0 33.45% 46.91% 32.18% FIDELITY24.0 43.84% 43.84% 43.84% SURETY26.0 30.37% 30.37% 30.37% BURGLARY & THEFT27.0 36.00% 27.67% 39.23% BOILER & MACHINERY
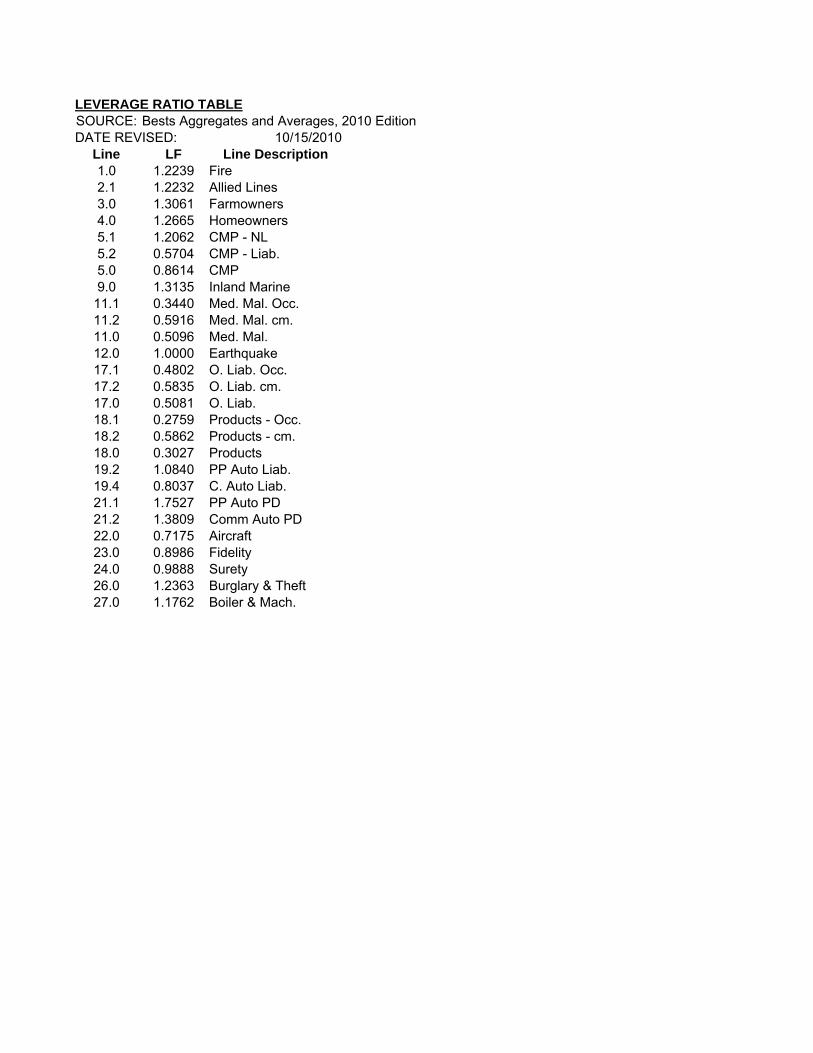
LEVERAGE RATIO TABLESOURCE: Bests Aggregates and Averages, 2010 EditionDATE REVISED: 10/15/2010
Line LF Line Description1.0 1.2239 Fire2.1 1.2232 Allied Lines3.0 1.3061 Farmowners4.0 1.2665 Homeowners5.1 1.2062 CMP - NL5.2 0.5704 CMP - Liab.5.0 0.8614 CMP9.0 1.3135 Inland Marine
11.1 0.3440 Med. Mal. Occ.11.2 0.5916 Med. Mal. cm.11.0 0.5096 Med. Mal.12.0 1.0000 Earthquake17.1 0.4802 O. Liab. Occ.17.2 0.5835 O. Liab. cm.17.0 0.5081 O. Liab.18.1 0.2759 Products - Occ.18.2 0.5862 Products - cm.18.0 0.3027 Products19.2 1.0840 PP Auto Liab.19.4 0.8037 C. Auto Liab.21.1 1.7527 PP Auto PD21.2 1.3809 Comm Auto PD22.0 0.7175 Aircraft23.0 0.8986 Fidelity24.0 0.9888 Surety26.0 1.2363 Burglary & Theft27.0 1.1762 Boiler & Mach.

RESERVES RATIO TABLESOURCE: AM Best's Aggregates & Averages - Property Casualty, 2010 EditionDATE REVISED: 9/21/2010
LINE UEP LOSS Line Description1 0.48 0.98 FIRE
2.1 0.47 1.20 ALLIED LINES3 0.47 1.90 FARMOWNER MP4 0.52 1.14 HOMEOWNER MP5 0.50 2.87 CMP
5.1 0.49 1.12 CMP (N-LIAB)5.2 0.50 5.16 CMP (LIAB)9 0.36 0.68 INLAND MRN
11.0 0.46 4.64 MED MAL11.1 0.58 5.56 MED MAL - occurrence11.2 0.42 4.21 MED MAL - claims-made12.0 0.47 1.00 EARTHQUAKE17.0 0.52 4.41 OTHER LIAB17.1 0.54 5.21 OTHER LIAB - occurrence17.2 0.51 3.28 OTHER LIAB - claims-made18.0 0.52 5.44 PROD LIAB18.1 0.53 5.63 PROD LIAB - occurrence18.2 0.43 3.85 PROD LIAB - claims-made19.2 0.33 1.14 PPA LIAB19.4 0.45 2.66 COMLA LIAB21.1 0.33 0.09 PPA PD21.2 0.51 0.32 COMLA PD22.0 0.40 2.79 AIRCRAFT23.0 0.57 2.62 FIDELITY24.0 0.56 2.52 SURETY26.0 0.59 0.91 BRGLRY THEFT27.0 0.45 1.19 BLR & MCHNRY

Loss Cost Multiplier (LCM) Template Instructions
Complete the following for existing and new program rate filings when AdvisoryOrganization loss costs are being adopted:
Spreadsheet Item #1.1 CDI Filing Number – Please enter the CDI filing number of the Advisory Organization loss cost filing being adopted. If additional loss cost updates are beingcovered, please also identify the CDI filing number(s) of the additional loss cost updates beingcovered.
Spreadsheet Item #1.2 Loss Cost Percent Change Approved for the Line or Coverage – Please enter the CDI percent change approved for the Advisory Organization loss cost filing identified as Item #1.1. If multiple loss cost updates are being covered, identify the cumulative percent change approved.
Spreadsheet Item #1.3 AOE or LAE Load Approved for the Line or Coverage – As identified within the Advisory Organization loss cost filing entered as Item #1.1, please indicate the typeof AOE or LAE expense loading the Advisory Organization used in its loss cost filing and enter the load amount.
Spreadsheet Item #2.1 Current Expense Based LCM – Please enter the current expense based LCM for the filed line/coverage.
Spreadsheet Item #2.2 Current Loss Cost Modification Expressed as a Factor – Please enter the current Loss Cost Modification Factor applicable to the current expense based LCM.
Spreadsheet Items #3 through #7 are calculated fields.
The LCM Template spreadsheet must be completed for those rate filing submissions where the filed line or coverage utilizes a Loss Cost Multiplier. Examples include new or existing program rate filings that involve the adoption of Advisory Organization loss costs, and existing program rate filings where the LCM is being revised.
There are a number of data cells on the LCM Template spreadsheet that automatically populate either by reference to cells on other spreadsheets or by formula calculation. However there are five lines within the LCM Template spreadsheet for which additional data entry is required. The first three data entry items pertain to rate filing submissions that include an adoption of Advisory Organization loss costs. The last two data entry items are required only for existing programs.
Complete the following for existing programs only; do not complete the following for new program filings:
Spreadsheet Item #3 calculates the insurer’s current Final LCM.
Spreadsheet Item #4 calculates the Advisory Organization’s AOE as a percent of loss and DCCE.
Spreadsheet Item #7 calculates the maximum CDI allowable Final LCM for the filed line/coverage. If the Insurer’s current Final LCM (Item #3) and/or proposed Final LCM is greater than the Max Final LCM (Item #7), the Insurer will need to reduce its Final LCM so that it is no greater than the CDI calculated maximum allowable Final LCM. Otherwise, exceeding the CDI calculated maximum allowable Final LCM will require the filing of a Variance.
Spreadsheet Item #5 calculates the maximum CDI allowable expense based LCM for the filedline/coverage.
Spreadsheet Item #6 calculates the maximum CDI allowable loss cost modification factor for the filed line/coverage.
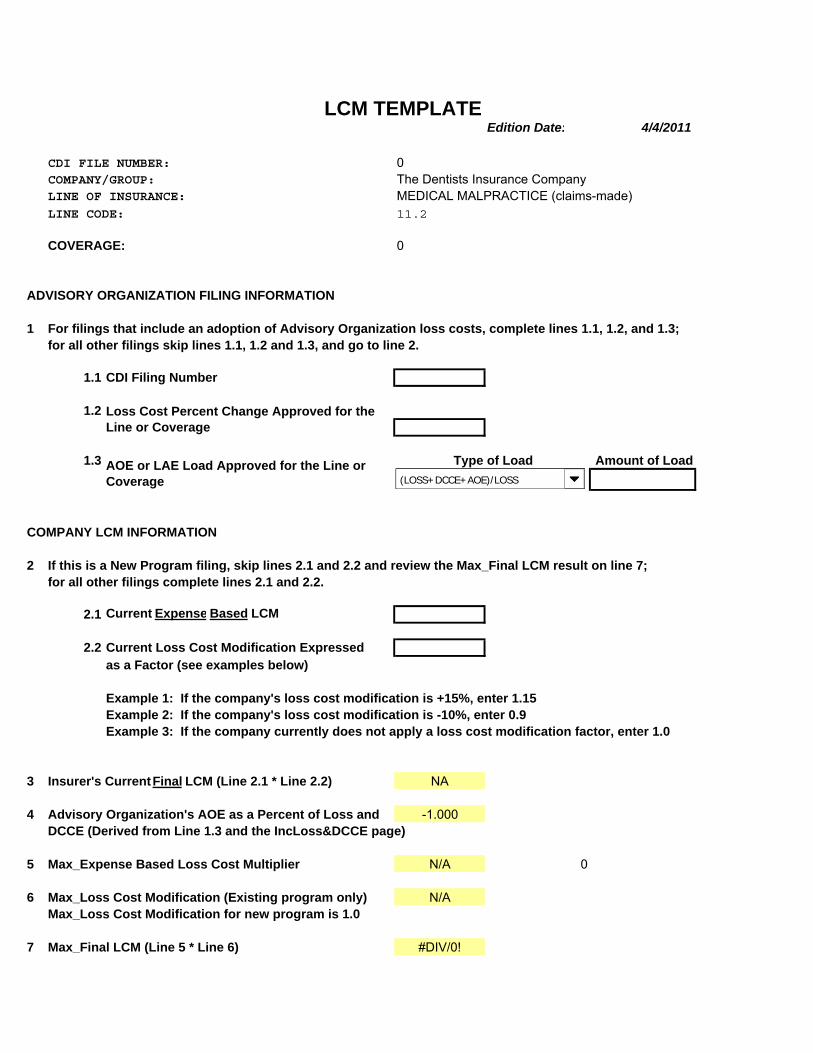
LCM TEMPLATEEdition Date: 4/4/2011
CDI FILE NUMBER: 0COMPANY/GROUP: The Dentists Insurance CompanyLINE OF INSURANCE: MEDICAL MALPRACTICE (claims-made)LINE CODE: 11.2
COVERAGE: 0
ADVISORY ORGANIZATION FILING INFORMATION
1 For filings that include an adoption of Advisory Organization loss costs, complete lines 1.1, 1.2, and 1.3;for all other filings skip lines 1.1, 1.2 and 1.3, and go to line 2.
1.1 CDI Filing Number
1.2
1.3 Amount of Load
COMPANY LCM INFORMATION
2 If this is a New Program filing, skip lines 2.1 and 2.2 and review the Max_Final LCM result on line 7;for all other filings complete lines 2.1 and 2.2.
2.1 Current Expense Based LCM
2.2 Current Loss Cost Modification Expressedas a Factor (see examples below)
Example 1: If the company's loss cost modification is +15%, enter 1.15Example 2: If the company's loss cost modification is -10%, enter 0.9Example 3: If the company currently does not apply a loss cost modification factor, enter 1.0
3 Insurer's Current Final LCM (Line 2.1 * Line 2.2) NA
4 Advisory Organization's AOE as a Percent of Loss and -1.000DCCE (Derived from Line 1.3 and the IncLoss&DCCE page)
5 Max_Expense Based Loss Cost Multiplier N/A 0
6 Max_Loss Cost Modification (Existing program only) N/AMax_Loss Cost Modification for new program is 1.0
7 Max_Final LCM (Line 5 * Line 6) #DIV/0!
Type of Load
Loss Cost Percent Change Approved for the Line or Coverage
AOE or LAE Load Approved for the Line or Coverage (LOSS+DCCE+AOE)/LOSS(LOSS+DCCE+AOE)/LOSS(LOSS+DCCE+AOE)/LOSS
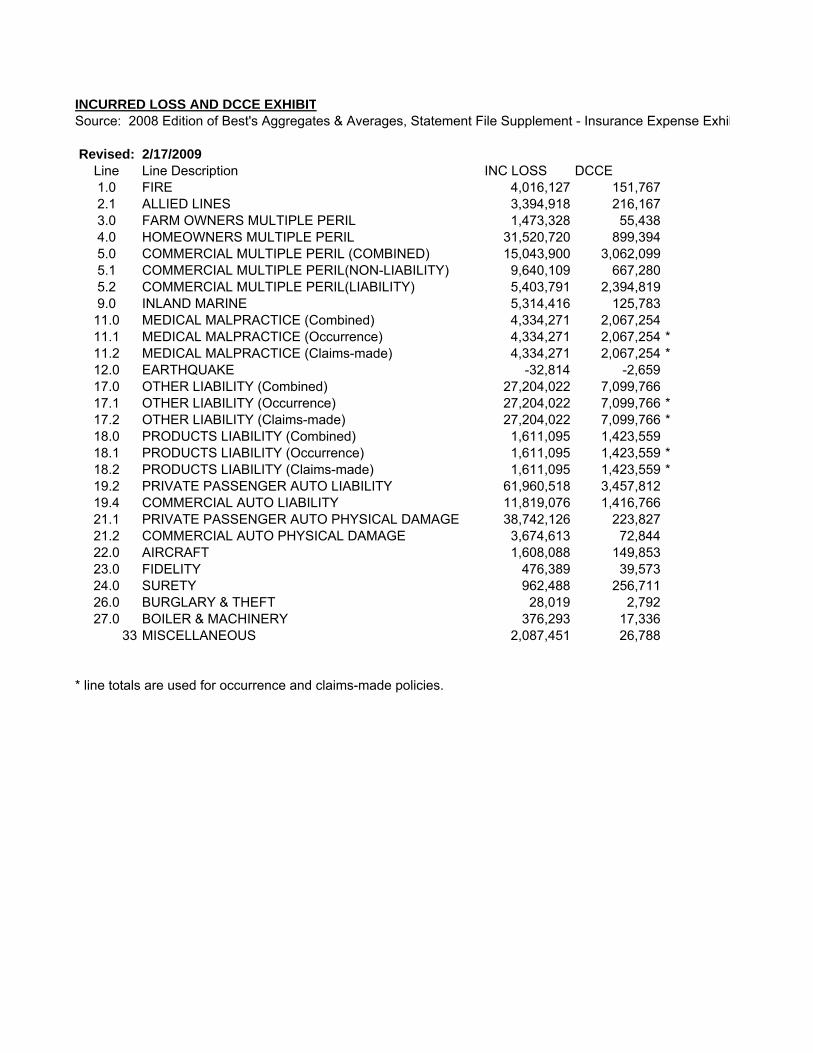
INCURRED LOSS AND DCCE EXHIBITSource: 2008 Edition of Best's Aggregates & Averages, Statement File Supplement - Insurance Expense Exhib
Revised: 2/17/2009Line Line Description INC LOSS DCCE1.0 FIRE 4,016,127 151,7672.1 ALLIED LINES 3,394,918 216,1673.0 FARM OWNERS MULTIPLE PERIL 1,473,328 55,4384.0 HOMEOWNERS MULTIPLE PERIL 31,520,720 899,3945.0 COMMERCIAL MULTIPLE PERIL (COMBINED) 15,043,900 3,062,0995.1 COMMERCIAL MULTIPLE PERIL(NON-LIABILITY) 9,640,109 667,2805.2 COMMERCIAL MULTIPLE PERIL(LIABILITY) 5,403,791 2,394,8199.0 INLAND MARINE 5,314,416 125,783
11.0 MEDICAL MALPRACTICE (Combined) 4,334,271 2,067,25411.1 MEDICAL MALPRACTICE (Occurrence) 4,334,271 2,067,254 *11.2 MEDICAL MALPRACTICE (Claims-made) 4,334,271 2,067,254 *12.0 EARTHQUAKE -32,814 -2,65917.0 OTHER LIABILITY (Combined) 27,204,022 7,099,76617.1 OTHER LIABILITY (Occurrence) 27,204,022 7,099,766 *17.2 OTHER LIABILITY (Claims-made) 27,204,022 7,099,766 *18.0 PRODUCTS LIABILITY (Combined) 1,611,095 1,423,55918.1 PRODUCTS LIABILITY (Occurrence) 1,611,095 1,423,559 *18.2 PRODUCTS LIABILITY (Claims-made) 1,611,095 1,423,559 *19.2 PRIVATE PASSENGER AUTO LIABILITY 61,960,518 3,457,81219.4 COMMERCIAL AUTO LIABILITY 11,819,076 1,416,76621.1 PRIVATE PASSENGER AUTO PHYSICAL DAMAGE 38,742,126 223,82721.2 COMMERCIAL AUTO PHYSICAL DAMAGE 3,674,613 72,84422.0 AIRCRAFT 1,608,088 149,85323.0 FIDELITY 476,389 39,57324.0 SURETY 962,488 256,71126.0 BURGLARY & THEFT 28,019 2,79227.0 BOILER & MACHINERY 376,293 17,336
33 MISCELLANEOUS 2,087,451 26,788
* line totals are used for occurrence and claims-made policies.
V:\The Dentists Insurance Co - 114833\11\RCS\187656 - CA Rates\Exec - Anl\110629 CA Rate Filing exhs - PL GL.doc
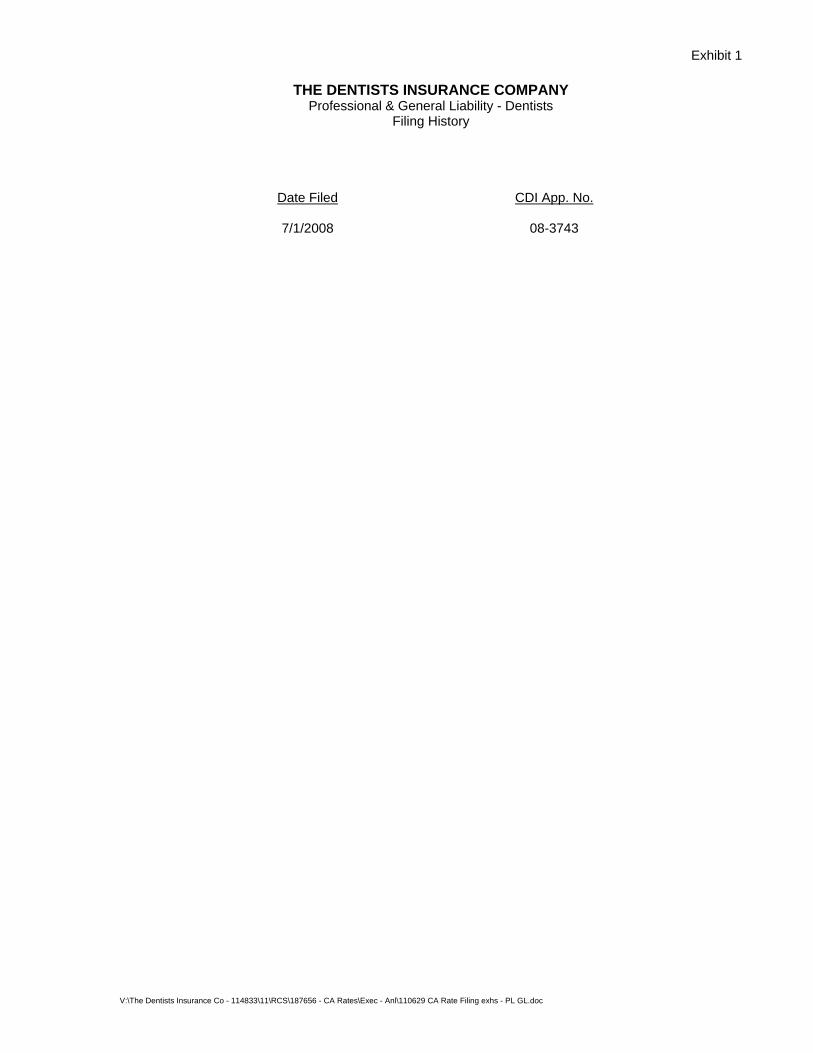
Exhibit 1
THE DENTISTS INSURANCE COMPANY Professional & General Liability - Dentists
Filing History
Date Filed CDI App. No.
7/1/2008 08-3743

V:\The Dentists Insurance Co - 114833\11\RCS\187656 - CA Rates\Exec - Anl\110629 CA Rate Filing exhs - PL GL.doc
Exhibit 2
THE DENTISTS INSURANCE COMPANY Professional & General Liability - Dentists
Rate Level History
The company has not filed for a rate change in the last five years.

V:\The Dentists Insurance Co - 114833\11\RCS\187656 - CA Rates\Exec - Anl\110629 CA Rate Filing exhs - PL GL.doc
Exhibit 3
THE DENTISTS INSURANCE COMPANY Professional & General Liability - Dentists
Policy Term Distribution
All policies are for a twelve-month term with a common effective date of July 1. 100% of business is written for this term.

V:\The Dentists Insurance Co - 114833\11\RCS\187656 - CA Rates\Exec - Anl\110629 CA Rate Filing exhs - PL GL.doc
Exhibit 4
THE DENTISTS INSURANCE COMPANY Professional & General Liability - Dentists
Premium Adjustment Factor
Per Exhibit 2, all premium adjustment factors are 1.000.

V:\The Dentists Insurance Co - 114833\11\RCS\187656 - CA Rates\Exec - Anl\110629 CA Rate Filing exhs - PL GL.doc
Exhibit 5
THE DENTISTS INSURANCE COMPANY Professional & General Liability - Dentists
Premium Trend Factor
The exemption in CCR §2644.4(d) applies to the premium trend methodology in CCR §2644.7. Premium trend is not reflected given a review of the data and expectations that little premium trend would be expected in TDIC dental professional and general liability premium.

V:\The Dentists Insurance Co - 114833\11\RCS\187656 - CA Rates\Exec - Anl\110629 CA Rate Filing exhs - PL GL.doc
Exhibit 6
THE DENTISTS INSURANCE COMPANY Professional & General Liability - Dentists Miscellaneous Fees and Other Charges
Exhibit 6 is not applicable to this program. The company does not collect any miscellaneous fees or other charges.
V:\The Dentists Insurance Co - 114833\11\RCS\187656 - CA Rates\Exec - Anl\110629 CA Rate Filing exhs - PL GL.doc
Exhibit 7
THE DENTISTS INSURANCE COMPANY Professional & General Liability - Dentists
Loss and Defense & Cost Containment Expense (DCCE) Development Factors
CCR §§2644.6 and 2644.8 do not apply under the exemption stated in CCR §§2644.4(d) and 2644.8(c). Support and application of loss development factors are contained in Appendices A through J of the insurer’s ratemaking calculations in Exhibit 14. Loss development triangles and factor selections are shown and applied to TDIC historical data to obtain claim frequency indications (Appendices C and D with results summarized on Exhibit 14, Sheet 2.3), average claim costs at basic limits (Appendices A and B with results summarized on Exhibit 14, Sheet 2.2a), increased limits factors (Appendix G with results summarized on Exhibit 14, Sheet 8) and general liability losses (Appendices E and F with results summarized on Exhibit 14, Sheet 3.1).
V:\The Dentists Insurance Co - 114833\11\RCS\187656 - CA Rates\Exec - Anl\110629 CA Rate Filing exhs - PL GL.doc
Exhibit 8
THE DENTISTS INSURANCE COMPANY Professional & General Liability - Dentists
Loss and DCCE Trend
CCR §2644.7 does not apply under the exemption stated in CCR §2644.4(d). Trend factors are based on analyses in the insurer’s ratemaking calculations in Exhibit 14 and summarized in the table below:
Component Annual Trend
PL Basic Limits Severity 6.0% PL Increased Limits Factor 0.5%
PL Frequency of Claims with Cost 0.0% GL Total Limits Pure Premium 2.0%
Composite 6.2%
For professional liability (PL), three adjustments are applied to historical ultimate losses to adjust them to expected 2012 cost levels. The first is to adjust for the expected frequency level. Based on a review of frequency indications (Exhibit 14, Sheet 2.2b), all coverage years are adjusted to a frequency level of 0.027 per exposure with 0% trend. This determination is based on the average of the 2004 through 2009 historical periods after reviewing the experience and considering the trend fits. The frequency index is shown in column (8) of Sheet 2 of the template. The second adjustment is for the basic limits severity (basic limits is defined as each claim limited to $100,000 of indemnity and unlimited DCCE). Based on a review of the indications (Exhibit 14, Sheet 2.2a) and considering the various trend fits and their respective correlation coefficients, a 6% trend factor is applied to project severity to 2012 cost levels. The severity cost index is shown in column (9) of Sheet 2 of the template. Finally, the historical increased limits factors (ILFs) are adjusted to 2012 cost levels using a 0.5% trend based on a review of the data and judgment that, while the ILF indications are volatile, they are subject to inflationary pressures over time. The ILF cost index is shown in column (10) of Sheet 2 of the template. The resulting PL ultimate losses at the 2012 cost level are shown in column (11) of the PL portion of Sheet 2 of the template. For general liability (GL), the data is too sparse and volatile to perform detailed trend analyses broken down into frequency and severity. Even annual changes in pure premium are volatile and unstable from year to year. However, considering TDIC experience and other broader, more credible sets of GL experience, an annual trend factor of 2% has been applied to the GL loss costs to reflect 2012 cost levels. This is shown in column (9) of the GL portion of Sheet 2 of the template and applied to obtain GL ultimate losses at the 2012 cost level in column (11).
V:\The Dentists Insurance Co - 114833\11\RCS\187656 - CA Rates\Exec - Anl\110629 CA Rate Filing exhs - PL GL.doc
Exhibit 9
THE DENTISTS INSURANCE COMPANY Professional & General Liability - Dentists
Catastrophe Adjustment
No catastrophe adjustment is included in this filing.

V:\The Dentists Insurance Co - 114833\11\RCS\187656 - CA Rates\Exec - Anl\110629 CA Rate Filing exhs - PL GL.doc
Exhibit 10
THE DENTISTS INSURANCE COMPANY Professional & General Liability - Dentists
Credibility Adjustment
The data as used in Exhibit 14 and in the company’s alternate rate template are considered fully credible.

V:\The Dentists Insurance Co - 114833\11\RCS\187656 - CA Rates\Exec - Anl\110629 CA Rate Filing exhs - PL GL.doc
Exhibit 11
THE DENTISTS INSURANCE COMPANY Professional & General Liability - Dentists
Ancillary Income
The company does not have any ancillary income (e.g., premium financing charges or membership dues).

V:\The Dentists Insurance Co - 114833\11\RCS\187656 - CA Rates\Exec - Anl\110629 CA Rate Filing exhs - PL GL.doc
Exhibit 12
THE DENTISTS INSURANCE COMPANY Professional & General Liability - Dentists Reinsurance Premium and Recoverables
Reinsurance premiums and recoverables are not included in the rate development.

V:\The Dentists Insurance Co - 114833\11\RCS\187656 - CA Rates\Exec - Anl\110629 CA Rate Filing exhs - PL GL.doc
Exhibit 13
THE DENTISTS INSURANCE COMPANY Professional & General Liability - Dentists
Variance
1. Variances requested: Variance 2A – Higher quality of service, as demonstrated by objective measures of consumer satisfaction Rationale for variance: TDIC requests a variance from the efficiency standard for superior service as permitted by §2644.27(f)(2)(A). TDIC has a sterling satisfaction rating with its policyholders as demonstrated by: (1) the Department Complaint Study, which shows one justified complaint in 2007 and none in 2008 and 2009 for a 0.00 justified complaint ratio, and (2) an independent survey commissioned by TDIC from Edge Research regarding customer satisfaction. Items (1) and (2) are attached. To the best of TDIC’s knowledge, organizations such as J.D. Power and Associates do not conduct unsolicited customer satisfaction surveys for this line. Variance 2C – Significantly smaller or larger than average California policy premium, including any applicable fees Rationale for variance: The efficiency standard is calculated as the weighted mean (by premium) expense ratio of insurers writing this coverage. This means that the results reflect, significantly, the expense relationships of the large physician and surgeon insurers. However, the average dental premium of approximately $2,200 is substantially smaller than the average physician and surgeon premium. The attached Sheet 1 provides a comparison of the California mature claims-made rates at $1 million / $3 million limits between TDIC and several of the physician and surgeon insurers. This exhibit indicates the dental premium is approximately 10% - 20% of the physician and surgeon premium. Because TDIC provides the same services – e.g., underwrite insureds, issue policies, handle claims – spread over a smaller per policy premium, it implies the efficiency standard is distorted in application to TDIC.
2. The attached Sheet 2 calculates an alternative expense load based on TDIC experience, including reduction for the expense exclusion. The impact on the efficiency standard expense factor is an increase of 9.42 points (= 33.60% - 24.18%).
3. The impact of the variance on the change at the minimum and maximum is an increase of 5.05 and
12.13 points, respectively.


CDA Mind of the Dentist #2Marketing Research Findings
Prepared by Edge Research
November 10, 2009
4
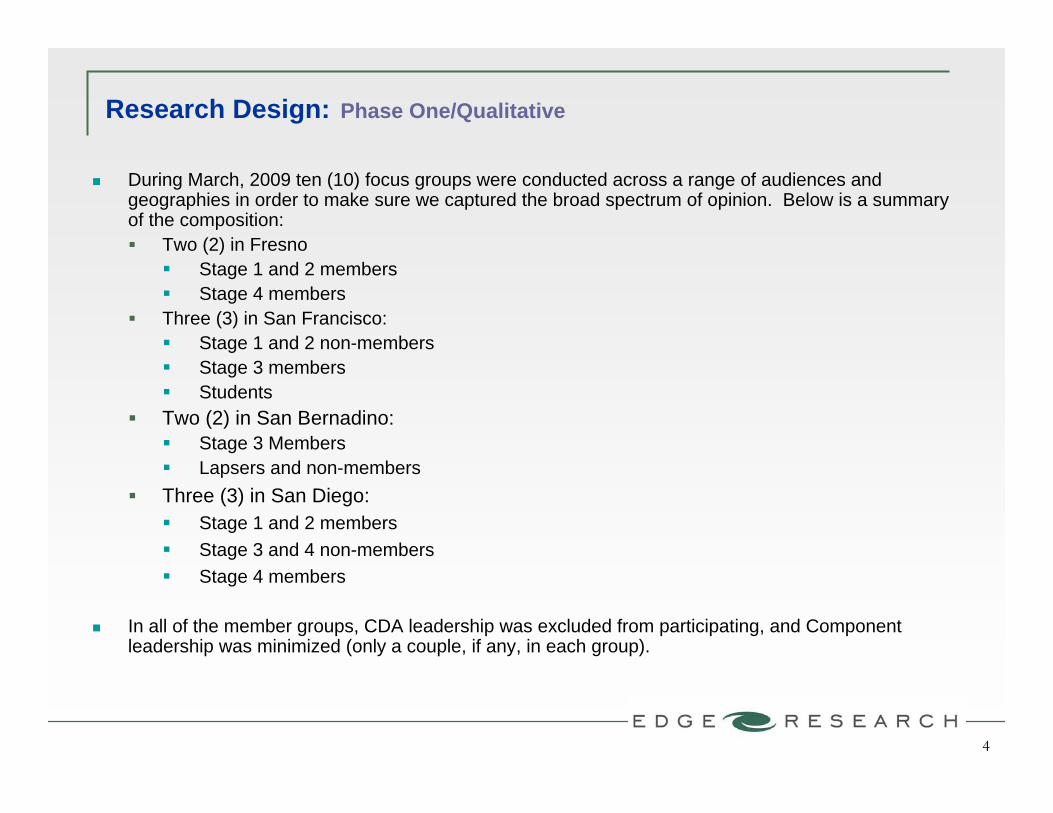
Research Design: Phase One/Qualitative
During March, 2009 ten (10) focus groups were conducted across a range of audiences and geographies in order to make sure we captured the broad spectrum of opinion. Below is a summary of the composition: Two (2) in Fresno
Stage 1 and 2 members Stage 4 members
Three (3) in San Francisco: Stage 1 and 2 non-members Stage 3 members Students
Two (2) in San Bernadino: Stage 3 Members Lapsers and non-members
Three (3) in San Diego: Stage 1 and 2 members Stage 3 and 4 non-members Stage 4 members
In all of the member groups, CDA leadership was excluded from participating, and Component leadership was minimized (only a couple, if any, in each group).

5
Research Design: Phase Two/Quantitative
Mail and online surveys of members and non-members conducted in June, 2009. Sample was pulled to be representative by component and gender An over-sample of Stage I dentists was also included for both members and
non-members, to ensure there would be substantial base size to support analysis of this group
1257 completed member surveys returned
165 non-member surveys returned
For both surveys, data weighted so that total reflects the demographic and component distribution of California dentists Margin of error on the member sample as a whole is +/- 2.8 percentage points
at 95% confidence level Margin of error on the non-member sample as a whole is +/- 7.8 percentage
points at 95% confidence level Margin or error for subgroups is larger and varies.

TDIC Image
“TDIC, all they’re doing is dentists. It just seems like they’re geared for us.” –CA Policyholder

15
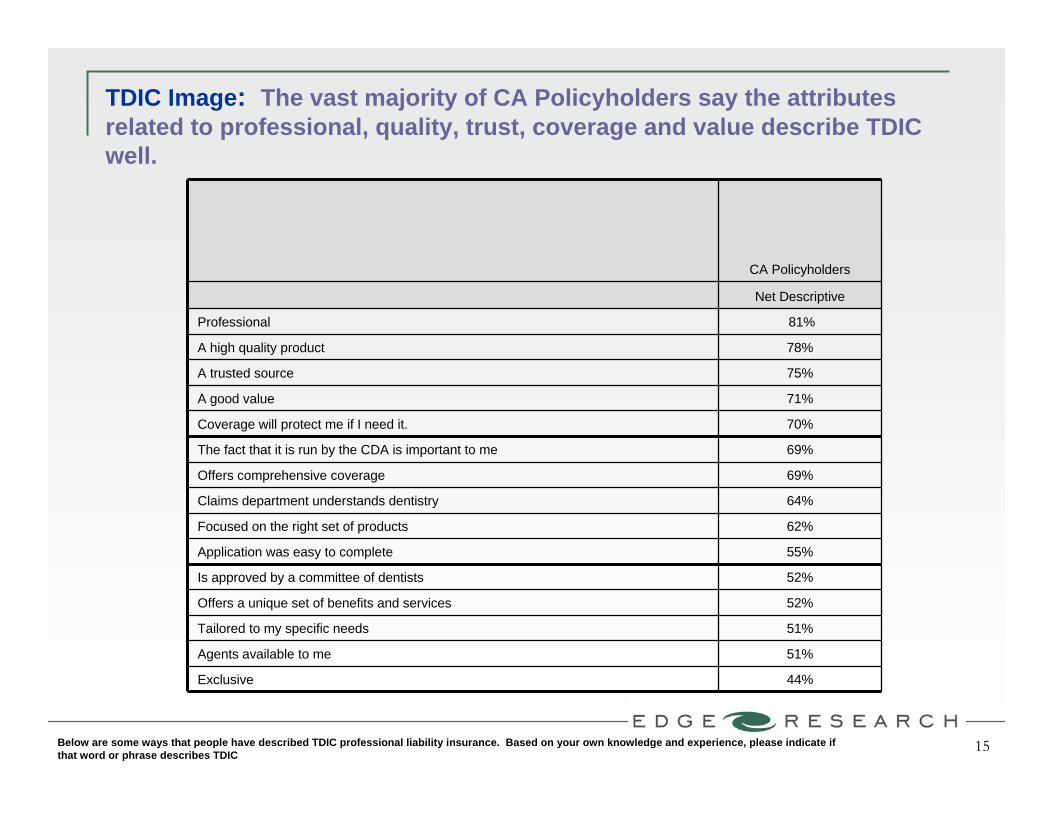
TDIC Image: The vast majority of CA Policyholders say the attributes related to professional, quality, trust, coverage and value describe TDIC well.
CA Policyholders
Net Descriptive
Professional 81%
A high quality product 78%
A trusted source 75%
A good value 71%
Coverage will protect me if I need it. 70%
The fact that it is run by the CDA is important to me 69%
Offers comprehensive coverage 69%
Claims department understands dentistry 64%
Focused on the right set of products 62%
Application was easy to complete 55%
Is approved by a committee of dentists 52%
Offers a unique set of benefits and services 52%
Tailored to my specific needs 51%
Agents available to me 51%
Exclusive 44%
Below are some ways that people have described TDIC professional liability insurance. Based on your own knowledge and experience, please indicate if that word or phrase describes TDIC
16
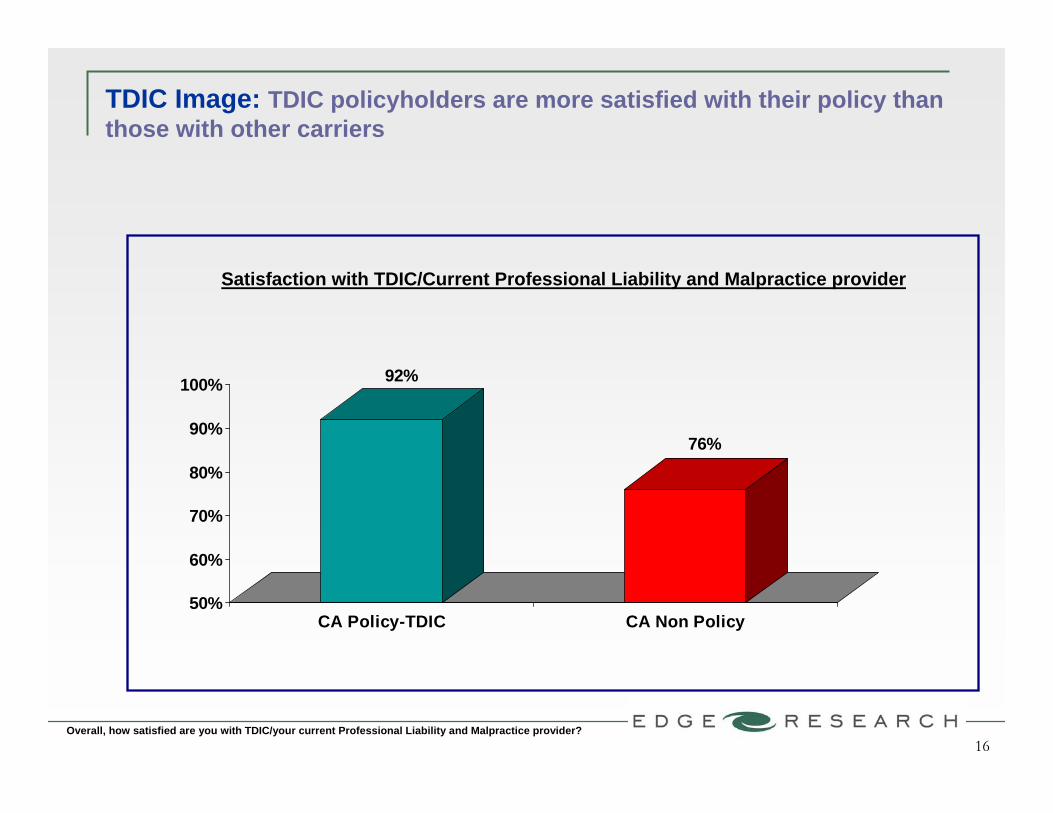
TDIC Image: TDIC policyholders are more satisfied with their policy than those with other carriers
Overall, how satisfied are you with TDIC/your current Professional Liability and Malpractice provider?
92%
76%
50%
60%
70%
80%
90%
100%
CA Policy-TDIC CA Non Policy
Satisfaction with TDIC/Current Professional Liability and Malpractice provider
17
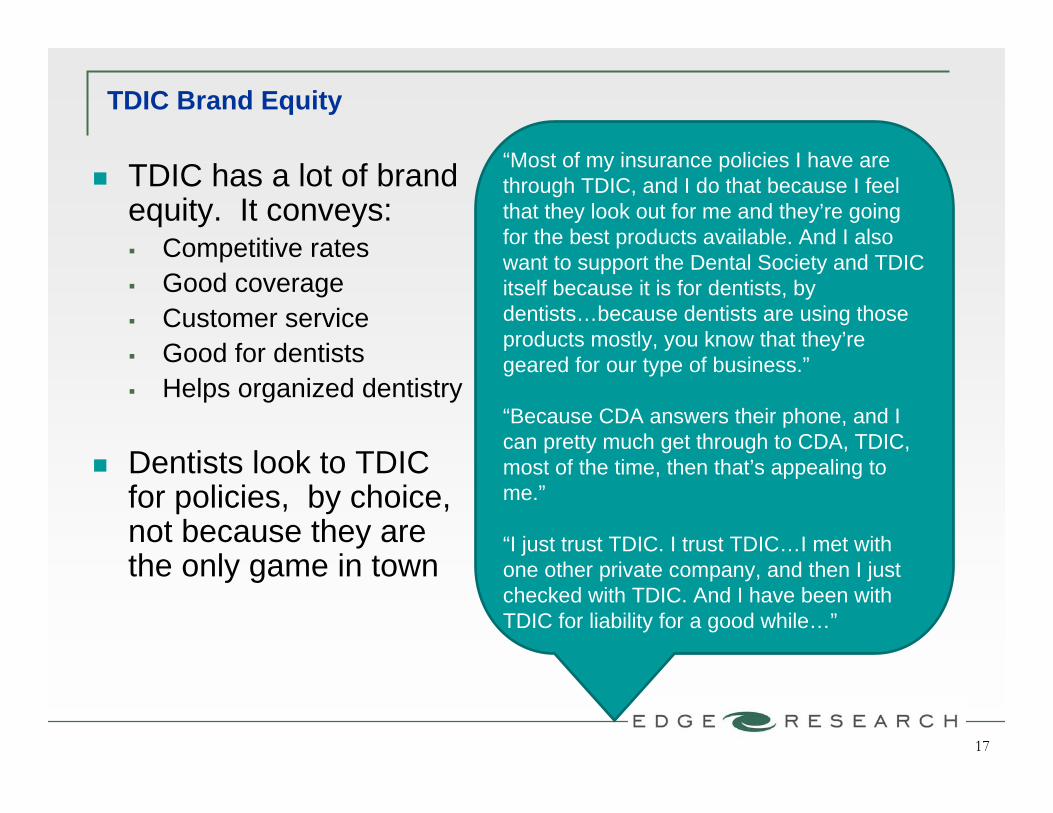
TDIC Brand Equity
“Most of my insurance policies I have are through TDIC, and I do that because I feel that they look out for me and they’re going for the best products available. And I also want to support the Dental Society and TDIC itself because it is for dentists, by dentists…because dentists are using those products mostly, you know that they’re geared for our type of business.”
“Because CDA answers their phone, and I can pretty much get through to CDA, TDIC, most of the time, then that’s appealing to me.”
“I just trust TDIC. I trust TDIC…I met with one other private company, and then I just checked with TDIC. And I have been with TDIC for liability for a good while…”
TDIC has a lot of brand equity. It conveys: Competitive rates Good coverage Customer service Good for dentists Helps organized dentistry
Dentists look to TDIC for policies, by choice, not because they are the only game in town

Exhibit 13Sheet 1
Variance 2C
The Dentists Insurance Company
Comparison of California RatesProfessional Liability Mature Claims-Made
The Doctors Medical Insurance NORCAL Mutual RatioTDIC Company Exchange of California Insurance Company of Avg Dental
TDIC Territory/County Base Class Int Med Gen Surg Int Med Gen Surg Int Med Gen Surg to P&S(1) (2) (3) (4) (5) (6) (7) (8) (9)
Territory A
Contra Costa $2,494 $6,782 $23,365 16.5%Los Angeles 2,494 10,343 41,775 $15,832 $51,812 $20,283 $68,007 7.2%
Orange 2,494 10,343 41,775 20,283 68,007 7.1%San Diego 2,494 9,730 35,273 13,968 45,716 18,115 60,741 8.2%
San Francisco 2,494 6,782 23,365 16.5%San Mateo 2,494 6,782 23,365 6,869 23,031 16.6%
Territory B
Santa Clara 2,254 6,782 23,365 6,869 23,031 15.0%
Territory C
Fresno 1,896 6,869 23,031 12.7%Madera 1,896 6,782 23,365 12.6%
Kern 1,896 10,343 41,775 10,641 35,679 7.7%Monterey Bay 1,896 6,782 23,365 6,869 23,031 12.6%Santa Barbara 1,896 10,641 35,679 8.2%
Ventura 1,896 10,343 41,775 13,968 45,716 18,115 60,741 6.0%
Notes:(1) Provided by TDIC.(2) Provided by TDIC; based on Class 11 rates effective 07/01/2008, and includes general liability.
(3)-(8) From Medical Liability Monitor , October 2010, Vol. 35, No. 10.(9) = (2) / Average [(3) through (8)].
V:\The Dentists Insurance Co - 114833\11\RCS\187656 - CA Rates\Exec - Anl\TDIC Rate Comparison - Var 2C Exh 13 Sh 12010 Rates6/30/2011 4:12 PM

Exhibit 13Sheet 2
Variance
THE DENTISTS INSURANCE COMPANY
Professional and General Liability
Direct Expense RatioCalifornia
CA CountrywideDirect Direct
Premium Premium Commission & Brokerage General Expense Taxes, Licenses & Adjusting and OtherCalendar Earned Earned Expense Incurred Incurred Fees Incurred Expenses Incurred
Year ($000's) ($000's) ($000's) Percent ($000's) Percent ($000's) Percent ($000's) Percent(1) (2) (3) (4) (5) (6) (7) (8) (9) (10) (11)
2006 $25,577 $28,827 $0 0.0% $6,187 21.5% $870 3.4% $2,427 8.4%
2007 26,490 29,981 0 0.0% 5,965 19.9% 694 2.6% 3,224 10.8%
2008 27,812 31,760 0 0.0% 6,590 20.7% 779 2.8% 599 1.9%
2009 28,856 33,046 0 0.0% 7,094 21.5% 910 3.2% 2,833 8.6%
2010 29,510 33,929 0 0.0% 7,042 20.8% 1,005 3.4% 3,358 9.9%
Total/Average $138,245 $157,543 $0 0.0% $32,878 20.9% $4,258 3.1% $12,441 7.9%
6,790(12) Selected 0.0% 21.0% 3.1% 9.5%
(13) Selected Expense Ratio 33.6%
(14) Expense Exclusion 2.6%
(15) Adjusted Expense Load for Variance 31.0%
Notes:(2),(4),(8) Annual Statement, Statutory Page 14; provided by TDIC.
(3),(6),(10) IEE, Part III, Medical Malpractice; provided by TDIC. 2009 for Column (6) reflects revised amounts provided by TDIC.
(5) = (4) / (2).(7) = (6) / (3).(9) = (8) / (2).
(11) = (10) / (3).(13) Total of (12).(14) Per CDI Prior Approval Rate Application, Page 13.(15) = (13) - (14).
V:\The Dentists Insurance Co - 114833\11\RCS\187656 - CA Rates\Exec - Anl\TDIC Expenses - Var Exh 13 Sh 2Adj Exp Load6/30/2011 4:12 PM
V:\The Dentists Insurance Co - 114833\11\RCS\187656 - CA Rates\Exec - Anl\110629 CA Rate Filing exhs - PL GL.doc
Exhibit 14
THE DENTISTS INSURANCE COMPANY Professional & General Liability - Dentists
Insurer’s Ratemaking Calculations
Attached are supporting exhibits providing the insurer’s ratemaking calculations.

1
V:\The Dentists Insurance Co - 114833\11\RCS\187656 - CA Rates\Exec - Anl\110629 CA Rate Filing txt - PL GL.doc
The Dentists Insurance Company
California Rate Filing Memorandum
Dentists Professional and General Liability Rates
This memorandum and the attached exhibits present the development of indicated dentists professional and general liability rates for The Dentists Insurance Company (TDIC) in the state of California. Rates are developed for annual policies to be issued during the July 1, 2012 through June 30, 2013 period with a common renewal date of July 1, 2012. The key components of the rates - pure premium, expense loadings, etc. – are based on TDIC experience. The determination of these components is discussed below. The components are documented and summarized on the attached exhibits. Pure Premium The professional liability claims-made basic limits ($100,000) pure premium is developed on Exhibit 14, Sheet 2.1. Selected frequency and severity components of the pure premium are also shown on Exhibit 14, Sheet 2.1, with supporting detail on Exhibit 14, Sheets 2.2a and 2.2b. Selected frequency and severity are based on reviews of several statistical fits of indicated historical frequencies and severities. The general liability occurrence total limits pure premium is selected on Exhibit 14, Sheet 3.1. This indication is based on loss and allocated loss adjustment expense projections. The selected pure premium considers indications before and after application of 2% annual trend. Claims-Made and Tail Factors No changes to current factors are proposed. Increased Limits Factors The professional liability increased limits factor (ILF) to total limits is based on the analysis of TDIC’s experience. The selected ILF is shown on Exhibit 14, Sheet 8, with supporting detail in Exhibit 14, Appendix G, and considers results before and after application of 0.5% trend. Class Plan and Relativities TDIC plans to maintain the current class plan. Territory Relativities TDIC plans to maintain the current territory alignment and relativities. Other Adjustments to Pure Premium Unallocated loss adjustment expense (ULAE) is included as 16.0% of the pure premium. The ULAE provision is based on the review on Exhibit 14, Sheet 5. The charge for the waiver of extended reporting premium in circumstances of death, disability and qualifying retirement (DD&R) is included as 5.0% of the pure premium based on calculations in Exhibit 14, Appendix I. A provision for regulatory defense (RD) coverage is included as 2.8% of the pure premium based on calculations in Exhibit 14, Appendix J. The adjustments for ULAE, DD&R and RD are incorporated on Exhibit 14, Sheet 1.1.
2
V:\The Dentists Insurance Co - 114833\11\RCS\187656 - CA Rates\Exec - Anl\110629 CA Rate Filing txt - PL GL.doc
Present Value Factors Exhibit 14, Sheets 6.1 and 6.2 present the calculation of the present value (discount) factors for professional liability and general liability, respectively. The present value factors use an interest rate of 6.19% which is determined by the procedure in the California Department of Insurance (CDI) template. Expenses Expense provisions for general expenses and taxes, licenses and fees are incorporated based on a review of TDIC companywide and California-specific medical malpractice expense experience. These items are documented on Exhibit 14, Sheet 7. The expense ratio of 24.0% is selected by TDIC management. The non-premium tax portion of the expense ratio is adjusted on Exhibit 14, Sheet 1.1 to reflect the indicated rate change prior to the adjustment to maintain the current general expense level. There are no expenses incorporated on a fixed basis.
Premium Discount Programs TDIC management projects an impact of 14.1% due to premium adjustment programs as shown on Exhibit 14, Sheet 4 and incorporated on Exhibit 14, Sheet 1.1.

Exhibit 14Sheet 1.1a
Low EndTHE DENTISTS INSURANCE COMPANY
Professional and General Liability
Indicated Rate Change at 07/01/12Territory A, Class 11, Total Limits Rates
California
(1) Pure Premium(a) Professional Liability - Mature Claims-Made ($100,000 Limits) $1,155(b) General Liability - Occurrence (Total Limits) 84(c) Professional Liability & General Liability $1,239
(2) ILF to Total Limits 1.175
(3) Pure Premium Adjustments(a) DD&R 1.050(b) Regulatory Defense 1.028(c) Class Changes 1.000(d) Territory Changes 1.000(e) Total Adjustments 1.079
(4) Discount Factors(a) Professional Liability 0.884(b) General Liability 0.849
(5) ULAE 1.160
(6) Premium Discount Adjustment 1.141
(7) Expenses(a) Fixed Expense $0(b) Variable Expense 24.8%
(8) Indicated Base Rate $2,405
(9) Current Base Rate $2,529
(10) Indicated Change -4.9%
See notes on Exhibit 14, Sheet 1.2.
V:\The Dentists Insurance Co - 114833\11\RCS\187656 - CA Rates\Exec - Anl\TDIC CA PL GL Rate Study 12312010E1.1a6/29/2011 9:42 PM

Exhibit 14Sheet 1.1b
High EndTHE DENTISTS INSURANCE COMPANY
Professional and General Liability
Indicated Rate Change at 07/01/12Territory A, Class 11, Total Limits Rates
California
(1) Pure Premium(a) Professional Liability - Mature Claims-Made ($100,000 Limits) $1,275(b) General Liability - Occurrence (Total Limits) 84(c) Professional Liability & General Liability $1,359
(2) ILF to Total Limits 1.175
(3) Pure Premium Adjustments(a) DD&R 1.050(b) Regulatory Defense 1.028(c) Class Changes 1.000(d) Territory Changes 1.000(e) Total Adjustments 1.079
(4) Discount Factors(a) Professional Liability 0.884(b) General Liability 0.849
(5) ULAE 1.160
(6) Premium Discount Adjustment 1.141
(7) Expenses(a) Fixed Expense $0(b) Variable Expense 23.3%
(8) Indicated Base Rate $2,587
(9) Current Base Rate $2,529
(10) Indicated Change 2.3%
See notes on Exhibit 14, Sheet 1.2.
V:\The Dentists Insurance Co - 114833\11\RCS\187656 - CA Rates\Exec - Anl\TDIC CA PL GL Rate Study 12312010E1.1b6/29/2011 9:42 PM

Exhibit 14Sheet 1.2
THE DENTISTS INSURANCE COMPANY
Professional and General Liability
Indicated Rate Change at 07/01/12California
Notes to Exhibit 1, Sheet 1
(1a) Exhibit 14, Sheet 2.1.(1b) Exhibit 14, Sheet 3.1.(1c) = (1a) + (1b).(2) Exhibit 14, Sheet 8, Item (12).
(3a) Exhibit 14, Appendix I, Sheet 1, Item (8).(3b) Based on Exhibit 14, Appendix J, Sheet 1.(3c) Assumes no changes in classifications.(3d) Assumes no changes in territories.(3e) = (3a) x (3c) x (3d).(4) Exhibit 14, Sheet 6.1 and Exhibit 14, Sheet 6.2, respectively.(5) Based on Exhibit 14, Sheet 5.(6) Exhibit 14, Sheet 4.(7) Based on Exhibit 14, Sheet 7. Non-premium tax portion of expense ratio adjusted to reflect indicated
rate change to maintain the current general expense level. Assumes no fixed expenses.(8) = {[{[(1a) x (2) x (3e) x (4a) + (1b) x (4b)] x (5)} + (7a)] x (6)} / [1.0 - (7b)].(9) Based on information provided by TDIC.
(10) = [(8) / (9)] - 1.0.
V:\The Dentists Insurance Co - 114833\11\RCS\187656 - CA Rates\Exec - Anl\TDIC CA PL GL Rate Study 12312010E1.26/29/2011 9:42 PM
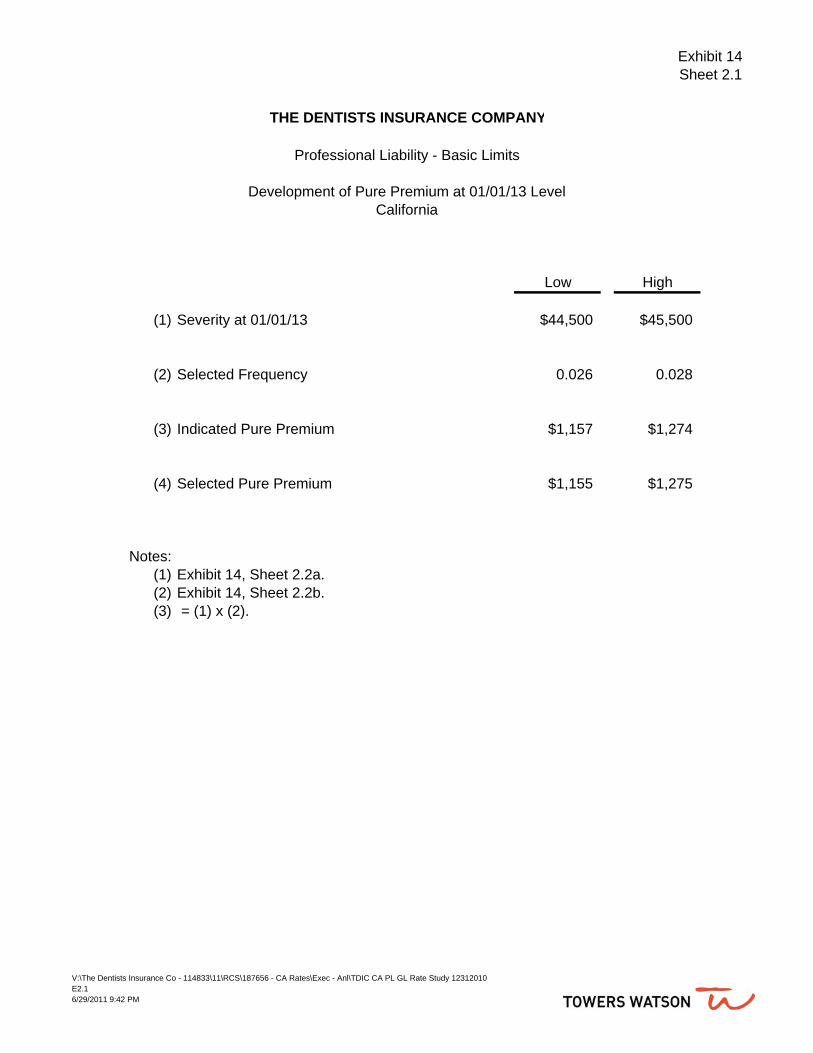
Exhibit 14Sheet 2.1
THE DENTISTS INSURANCE COMPANY
Professional Liability - Basic Limits
Development of Pure Premium at 01/01/13 LevelCalifornia
Low High
(1) Severity at 01/01/13 $44,500 $45,500
(2) Selected Frequency 0.026 0.028
(3) Indicated Pure Premium $1,157 $1,274
(4) Selected Pure Premium $1,155 $1,275
Notes:(1) Exhibit 14, Sheet 2.2a.(2) Exhibit 14, Sheet 2.2b.(3) = (1) x (2).
V:\The Dentists Insurance Co - 114833\11\RCS\187656 - CA Rates\Exec - Anl\TDIC CA PL GL Rate Study 12312010E2.16/29/2011 9:42 PM
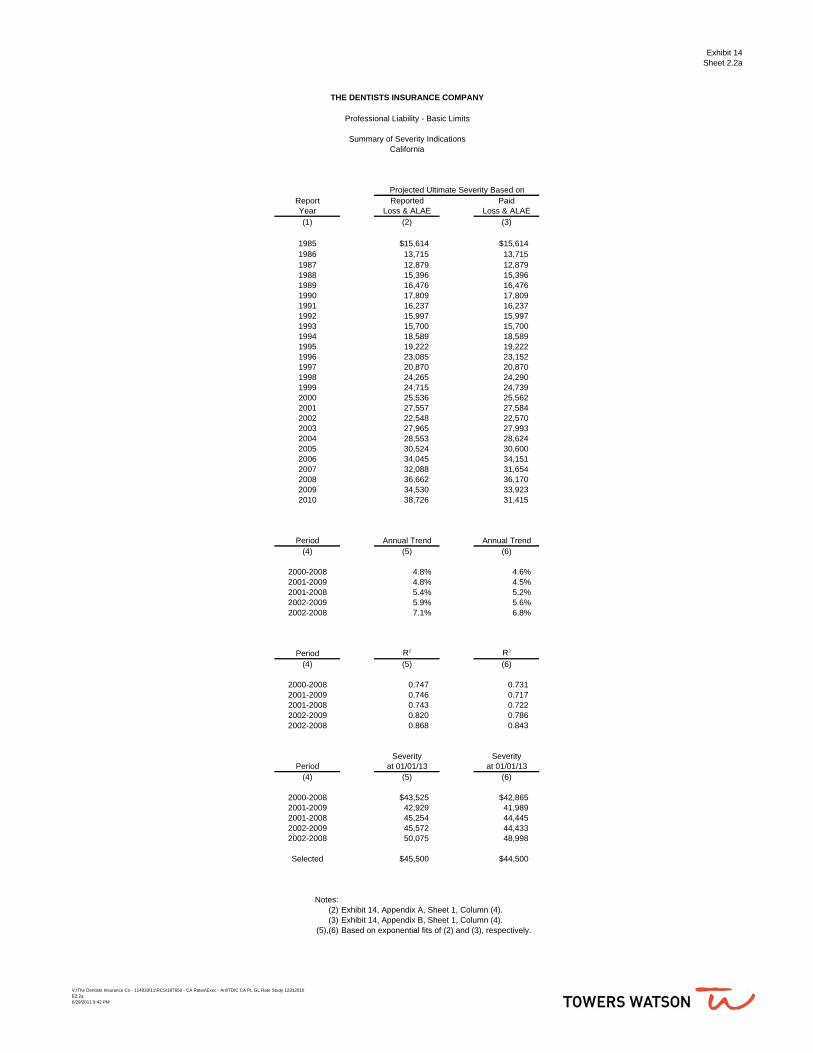
Exhibit 14Sheet 2.2a
THE DENTISTS INSURANCE COMPANY
Professional Liability - Basic Limits
Summary of Severity IndicationsCalifornia
Projected Ultimate Severity Based onReport Reported PaidYear Loss & ALAE Loss & ALAE(1) (2) (3)
1985 $15,614 $15,6141986 13,715 13,7151987 12,879 12,8791988 15,396 15,3961989 16,476 16,4761990 17,809 17,8091991 16,237 16,2371992 15,997 15,9971993 15,700 15,7001994 18,589 18,5891995 19,222 19,2221996 23,085 23,1521997 20,870 20,8701998 24,265 24,2901999 24,715 24,7392000 25,536 25,5622001 27,557 27,5842002 22,548 22,5702003 27,965 27,9932004 28,553 28,6242005 30,524 30,6002006 34,045 34,1512007 32,088 31,6542008 36,662 36,1702009 34,530 33,9232010 38,726 31,415
Period Annual Trend Annual Trend(4) (5) (6)
2000-2008 4.8% 4.6%2001-2009 4.8% 4.5%2001-2008 5.4% 5.2%2002-2009 5.9% 5.6%2002-2008 7.1% 6.8%
Period R2 R2
(4) (5) (6)
2000-2008 0.747 0.7312001-2009 0.746 0.7172001-2008 0.743 0.7222002-2009 0.820 0.7862002-2008 0.868 0.843
Severity SeverityPeriod at 01/01/13 at 01/01/13
(4) (5) (6)
2000-2008 $43,525 $42,8652001-2009 42,929 41,9892001-2008 45,254 44,4452002-2009 45,572 44,4332002-2008 50,075 48,998
Selected $45,500 $44,500
Notes:(2) Exhibit 14, Appendix A, Sheet 1, Column (4).(3) Exhibit 14, Appendix B, Sheet 1, Column (4).
(5),(6) Based on exponential fits of (2) and (3), respectively.
V:\The Dentists Insurance Co - 114833\11\RCS\187656 - CA Rates\Exec - Anl\TDIC CA PL GL Rate Study 12312010E2.2a6/29/2011 9:42 PM
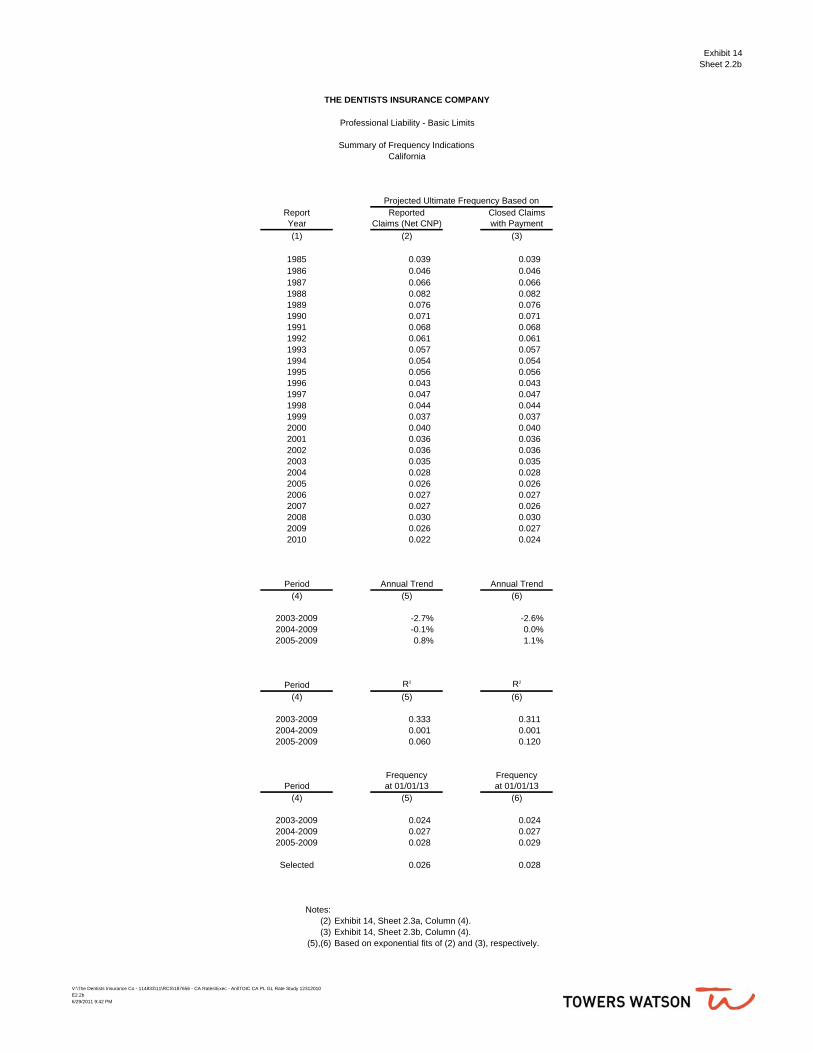
Exhibit 14Sheet 2.2b
THE DENTISTS INSURANCE COMPANY
Professional Liability - Basic Limits
Summary of Frequency IndicationsCalifornia
Projected Ultimate Frequency Based onReport Reported Closed ClaimsYear Claims (Net CNP) with Payment(1) (2) (3)
1985 0.039 0.0391986 0.046 0.0461987 0.066 0.0661988 0.082 0.0821989 0.076 0.0761990 0.071 0.0711991 0.068 0.0681992 0.061 0.0611993 0.057 0.0571994 0.054 0.0541995 0.056 0.0561996 0.043 0.0431997 0.047 0.0471998 0.044 0.0441999 0.037 0.0372000 0.040 0.0402001 0.036 0.0362002 0.036 0.0362003 0.035 0.0352004 0.028 0.0282005 0.026 0.0262006 0.027 0.0272007 0.027 0.0262008 0.030 0.0302009 0.026 0.0272010 0.022 0.024
Period Annual Trend Annual Trend(4) (5) (6)
2003-2009 -2.7% -2.6%2004-2009 -0.1% 0.0%2005-2009 0.8% 1.1%
Period R2 R2
(4) (5) (6)
2003-2009 0.333 0.3112004-2009 0.001 0.0012005-2009 0.060 0.120
Frequency FrequencyPeriod at 01/01/13 at 01/01/13
(4) (5) (6)
2003-2009 0.024 0.0242004-2009 0.027 0.0272005-2009 0.028 0.029
Selected 0.026 0.028
Notes:(2) Exhibit 14, Sheet 2.3a, Column (4).(3) Exhibit 14, Sheet 2.3b, Column (4).
(5),(6) Based on exponential fits of (2) and (3), respectively.
V:\The Dentists Insurance Co - 114833\11\RCS\187656 - CA Rates\Exec - Anl\TDIC CA PL GL Rate Study 12312010E2.2b6/29/2011 9:42 PM
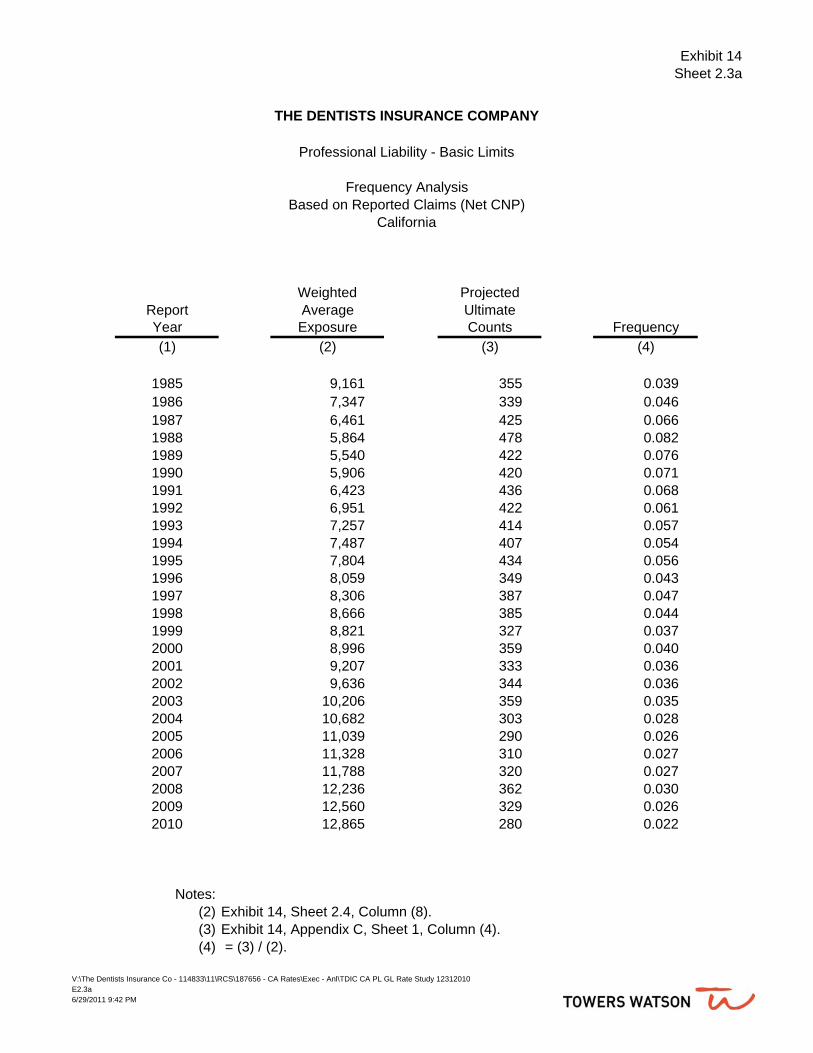
Exhibit 14Sheet 2.3a
THE DENTISTS INSURANCE COMPANY
Professional Liability - Basic Limits
Frequency AnalysisBased on Reported Claims (Net CNP)
California
Weighted ProjectedReport Average UltimateYear Exposure Counts Frequency(1) (2) (3) (4)
1985 9,161 355 0.0391986 7,347 339 0.0461987 6,461 425 0.0661988 5,864 478 0.0821989 5,540 422 0.0761990 5,906 420 0.0711991 6,423 436 0.0681992 6,951 422 0.0611993 7,257 414 0.0571994 7,487 407 0.0541995 7,804 434 0.0561996 8,059 349 0.0431997 8,306 387 0.0471998 8,666 385 0.0441999 8,821 327 0.0372000 8,996 359 0.0402001 9,207 333 0.0362002 9,636 344 0.0362003 10,206 359 0.0352004 10,682 303 0.0282005 11,039 290 0.0262006 11,328 310 0.0272007 11,788 320 0.0272008 12,236 362 0.0302009 12,560 329 0.0262010 12,865 280 0.022
Notes:(2) Exhibit 14, Sheet 2.4, Column (8).(3) Exhibit 14, Appendix C, Sheet 1, Column (4).(4) = (3) / (2).
V:\The Dentists Insurance Co - 114833\11\RCS\187656 - CA Rates\Exec - Anl\TDIC CA PL GL Rate Study 12312010E2.3a6/29/2011 9:42 PM

Exhibit 14Sheet 2.3b
THE DENTISTS INSURANCE COMPANY
Professional Liability - Basic Limits
Frequency AnalysisBased on Closed Claims with Payment
California
Weighted ProjectedReport Average UltimateYear Exposure Counts Frequency(1) (2) (3) (4)
1985 9,161 355 0.0391986 7,347 339 0.0461987 6,461 425 0.0661988 5,864 478 0.0821989 5,540 422 0.0761990 5,906 420 0.0711991 6,423 436 0.0681992 6,951 422 0.0611993 7,257 414 0.0571994 7,487 407 0.0541995 7,804 434 0.0561996 8,059 348 0.0431997 8,306 387 0.0471998 8,666 385 0.0441999 8,821 327 0.0372000 8,996 359 0.0402001 9,207 333 0.0362002 9,636 344 0.0362003 10,206 360 0.0352004 10,682 303 0.0282005 11,039 291 0.0262006 11,328 308 0.0272007 11,788 310 0.0262008 12,236 363 0.0302009 12,560 335 0.0272010 12,865 312 0.024
Notes:(2) Exhibit 14, Sheet 2.4, Column (8).(3) Exhibit 14, Appendix D, Sheet 1, Column (4).(4) = (3) / (2).
V:\The Dentists Insurance Co - 114833\11\RCS\187656 - CA Rates\Exec - Anl\TDIC CA PL GL Rate Study 12312010E2.3b6/29/2011 9:42 PM

Exhibit 14Sheet 2.4
THE DENTISTS INSURANCE COMPANY
Professional Liability
Class 11, Territory A Equivalent ExposuresCalifornia
WeightedReport Accident Year Lag AverageYear 0 1 2 3 4 5 or More Exposure(1) (2) (3) (4) (5) (6) (7) (8)
1980 5,4821981 11,493 5,5041982 12,189 11,535 5,5061983 12,048 12,233 11,539 5,5071984 9,752 12,092 12,237 11,545 5,5071985 7,041 9,085 12,096 12,243 11,544 5,491 9,1611986 6,207 6,071 8,243 12,102 12,244 11,509 7,3471987 5,968 5,840 5,646 5,044 12,102 12,207 6,4611988 5,748 5,610 5,438 5,246 4,246 12,065 5,8641989 5,892 5,646 5,450 5,280 5,070 4,041 5,5401990 6,292 5,999 5,692 5,491 5,300 5,027 5,9061991 6,913 6,530 6,165 5,864 5,642 5,413 6,4231992 7,446 7,107 6,675 6,323 6,006 5,756 6,9511993 7,738 7,419 7,028 6,631 6,286 5,968 7,2571994 7,939 7,642 7,276 6,929 6,553 6,220 7,4871995 8,212 7,960 7,614 7,285 6,942 6,565 7,8041996 8,464 8,195 7,885 7,554 7,238 6,899 8,0591997 8,759 8,437 8,088 7,792 7,463 7,149 8,3061998 9,130 8,817 8,417 8,082 7,782 7,459 8,6661999 9,262 8,976 8,609 8,234 7,908 7,624 8,8212000 9,450 9,144 8,785 8,447 8,081 7,762 8,9962001 9,690 9,352 8,977 8,632 8,303 7,940 9,2072002 10,193 9,793 9,353 8,976 8,619 8,284 9,6362003 10,831 10,393 9,884 9,439 9,038 8,663 10,2062004 11,343 10,889 10,357 9,850 9,403 8,987 10,6822005 11,640 11,276 10,741 10,232 9,725 9,281 11,0392006 11,934 11,532 11,090 10,572 10,071 9,570 11,3282007 12,538 11,972 11,440 10,998 10,481 9,980 11,7882008 12,975 12,482 11,805 11,295 10,863 10,355 12,2362009 13,223 12,810 12,242 11,618 11,137 10,718 12,5602010 13,489 13,096 12,607 12,074 11,476 11,009 12,865
(9) Selected Emergence Pattern22.5% 47.5% 14.0% 5.5% 5.3% 5.3%
Notes:(2)-(7) Exposures provided by TDIC.
(8) Weighted average exposures calculated using selected emergence pattern as weights.(9) Based on TDIC claims-made step factors underlying current rates.
V:\The Dentists Insurance Co - 114833\11\RCS\187656 - CA Rates\Exec - Anl\TDIC CA PL GL Rate Study 12312010E2.46/29/2011 9:42 PM
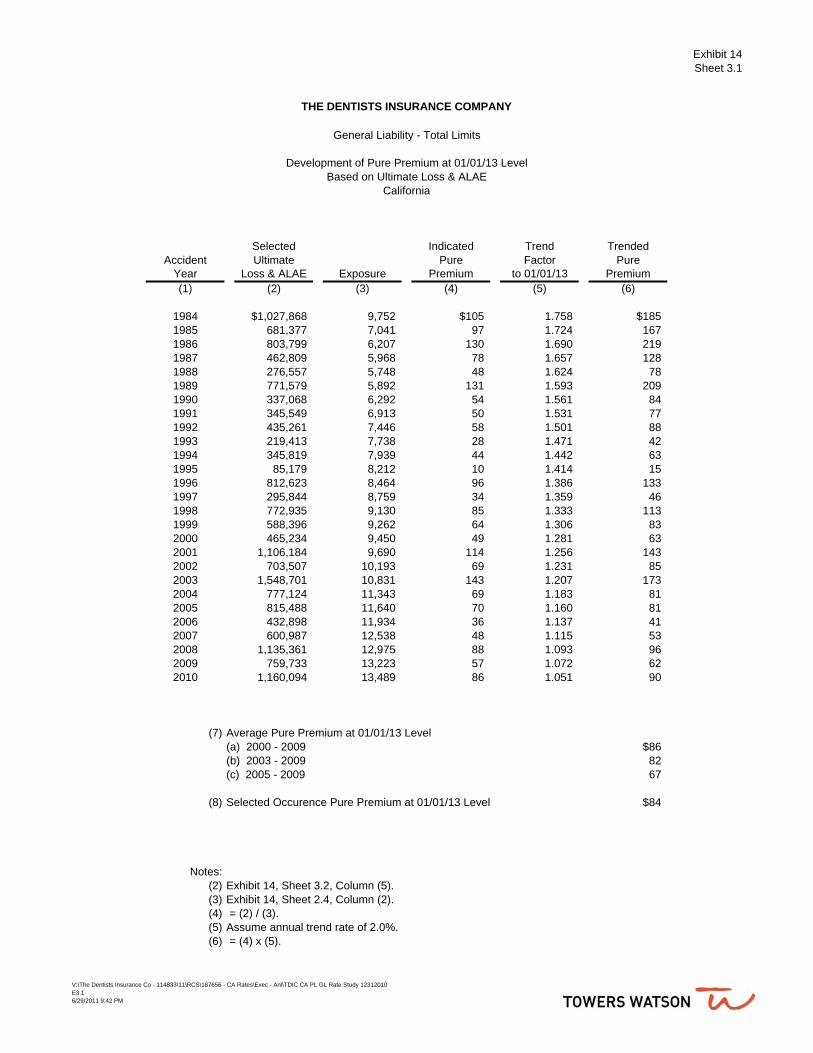
Exhibit 14Sheet 3.1
THE DENTISTS INSURANCE COMPANY
General Liability - Total Limits
Development of Pure Premium at 01/01/13 LevelBased on Ultimate Loss & ALAE
California
Selected Indicated Trend TrendedAccident Ultimate Pure Factor Pure
Year Loss & ALAE Exposure Premium to 01/01/13 Premium(1) (2) (3) (4) (5) (6)
1984 $1,027,868 9,752 $105 1.758 $1851985 681,377 7,041 97 1.724 1671986 803,799 6,207 130 1.690 2191987 462,809 5,968 78 1.657 1281988 276,557 5,748 48 1.624 781989 771,579 5,892 131 1.593 2091990 337,068 6,292 54 1.561 841991 345,549 6,913 50 1.531 771992 435,261 7,446 58 1.501 881993 219,413 7,738 28 1.471 421994 345,819 7,939 44 1.442 631995 85,179 8,212 10 1.414 151996 812,623 8,464 96 1.386 1331997 295,844 8,759 34 1.359 461998 772,935 9,130 85 1.333 1131999 588,396 9,262 64 1.306 832000 465,234 9,450 49 1.281 632001 1,106,184 9,690 114 1.256 1432002 703,507 10,193 69 1.231 852003 1,548,701 10,831 143 1.207 1732004 777,124 11,343 69 1.183 812005 815,488 11,640 70 1.160 812006 432,898 11,934 36 1.137 412007 600,987 12,538 48 1.115 532008 1,135,361 12,975 88 1.093 962009 759,733 13,223 57 1.072 622010 1,160,094 13,489 86 1.051 90
(7) Average Pure Premium at 01/01/13 Level(a) 2000 - 2009 $86(b) 2003 - 2009 82(c) 2005 - 2009 67
(8) Selected Occurence Pure Premium at 01/01/13 Level $84
Notes:(2) Exhibit 14, Sheet 3.2, Column (5).(3) Exhibit 14, Sheet 2.4, Column (2).(4) = (2) / (3).(5) Assume annual trend rate of 2.0%.(6) = (4) x (5).
V:\The Dentists Insurance Co - 114833\11\RCS\187656 - CA Rates\Exec - Anl\TDIC CA PL GL Rate Study 12312010E3.16/29/2011 9:42 PM
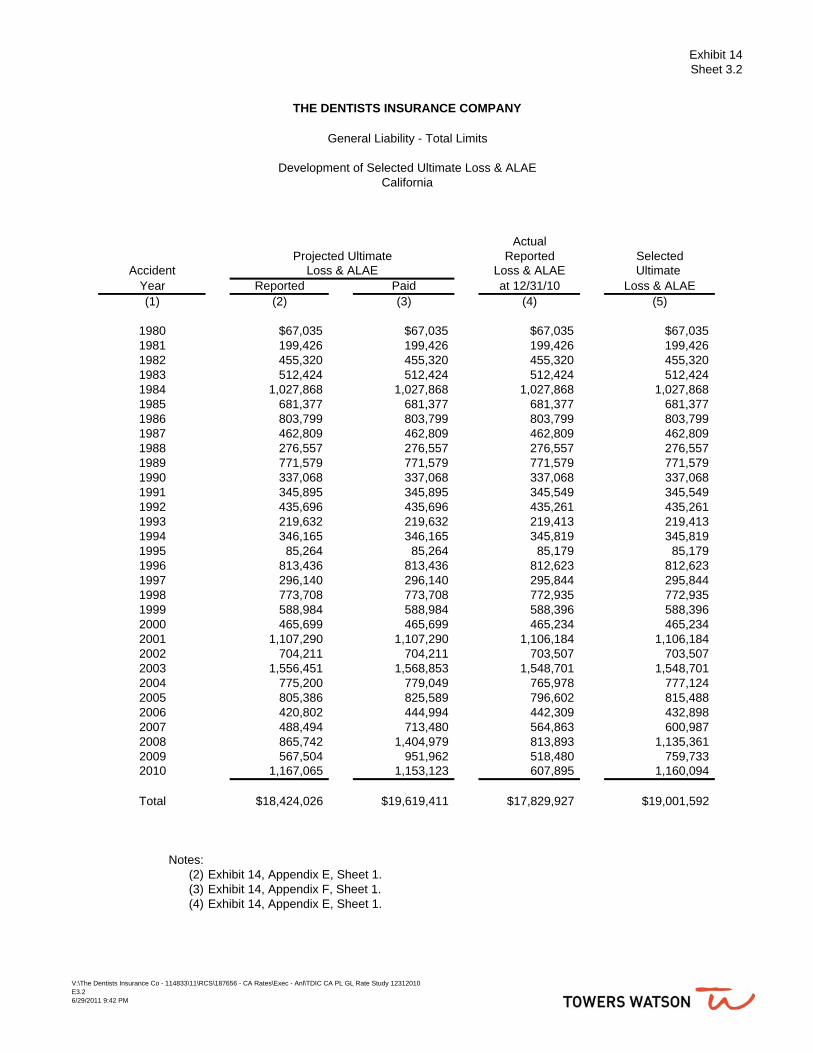
Exhibit 14Sheet 3.2
ActualProjected Ultimate Reported Selected
Accident Loss & ALAE Loss & ALAE Ultimate Year Reported Paid at 12/31/10 Loss & ALAE(1) (2) (3) (4) (5)
1980 $67,035 $67,035 $67,035 $67,0351981 199,426 199,426 199,426 199,4261982 455,320 455,320 455,320 455,3201983 512,424 512,424 512,424 512,4241984 1,027,868 1,027,868 1,027,868 1,027,8681985 681,377 681,377 681,377 681,3771986 803,799 803,799 803,799 803,7991987 462,809 462,809 462,809 462,8091988 276,557 276,557 276,557 276,5571989 771,579 771,579 771,579 771,5791990 337,068 337,068 337,068 337,0681991 345,895 345,895 345,549 345,5491992 435,696 435,696 435,261 435,2611993 219,632 219,632 219,413 219,4131994 346,165 346,165 345,819 345,8191995 85,264 85,264 85,179 85,1791996 813,436 813,436 812,623 812,6231997 296,140 296,140 295,844 295,8441998 773,708 773,708 772,935 772,9351999 588,984 588,984 588,396 588,3962000 465,699 465,699 465,234 465,2342001 1,107,290 1,107,290 1,106,184 1,106,1842002 704,211 704,211 703,507 703,5072003 1,556,451 1,568,853 1,548,701 1,548,7012004 775,200 779,049 765,978 777,1242005 805,386 825,589 796,602 815,4882006 420,802 444,994 442,309 432,8982007 488,494 713,480 564,863 600,9872008 865,742 1,404,979 813,893 1,135,3612009 567,504 951,962 518,480 759,7332010 1,167,065 1,153,123 607,895 1,160,094
Total $18,424,026 $19,619,411 $17,829,927 $19,001,592
Notes:(2) Exhibit 14, Appendix E, Sheet 1.(3) Exhibit 14, Appendix F, Sheet 1.(4) Exhibit 14, Appendix E, Sheet 1.
California
General Liability - Total Limits
THE DENTISTS INSURANCE COMPANY
Development of Selected Ultimate Loss & ALAE
V:\The Dentists Insurance Co - 114833\11\RCS\187656 - CA Rates\Exec - Anl\TDIC CA PL GL Rate Study 12312010E3.26/29/2011 9:42 PM
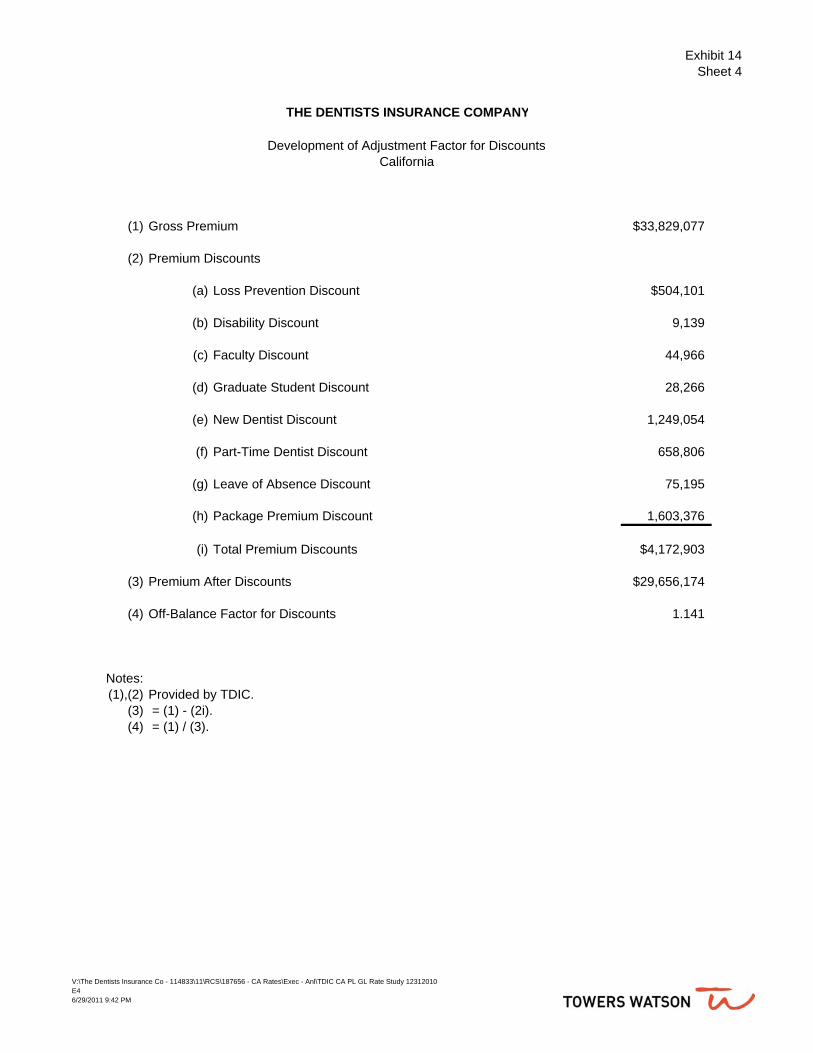
Exhibit 14Sheet 4
THE DENTISTS INSURANCE COMPANY
Development of Adjustment Factor for DiscountsCalifornia
(1) Gross Premium $33,829,077
(2) Premium Discounts
(a) Loss Prevention Discount $504,101
(b) Disability Discount 9,139
(c) Faculty Discount 44,966
(d) Graduate Student Discount 28,266
(e) New Dentist Discount 1,249,054
(f) Part-Time Dentist Discount 658,806
(g) Leave of Absence Discount 75,195
(h) Package Premium Discount 1,603,376
(i) Total Premium Discounts $4,172,903
(3) Premium After Discounts $29,656,174
(4) Off-Balance Factor for Discounts 1.141
Notes:(1),(2) Provided by TDIC.
(3) = (1) - (2i).(4) = (1) / (3).
V:\The Dentists Insurance Co - 114833\11\RCS\187656 - CA Rates\Exec - Anl\TDIC CA PL GL Rate Study 12312010E46/29/2011 9:42 PM

Exhibit 14Sheet 5
The Dentists Insurance Company
Professional and General Liability
Unallocated Loss Adjustment Expense FactorMedical Malpractice - Countrywide
Direct Paid Direct PaidCalendar Loss & ALAE ULAE
Year ($000's) ($000's) Ratio(1) (2) (3) (4)
2006 $13,204 $2,708 0.2052007 14,441 2,572 0.1782008 15,340 2,468 0.1612009 15,395 2,304 0.1502010 17,475 2,793 0.160
Total $75,855 $12,845 0.169Latest 3 48,210 7,565 0.157
(5) Selected 0.160
Notes:(2)-(3) From Schedule P of TDIC Annual Statements for consecutive years.
(4) = (3) / (2).
V:\The Dentists Insurance Co - 114833\11\RCS\187656 - CA Rates\Exec - Anl\TDIC CA PL GL Rate Study 12312010E56/29/2011 9:42 PM

Exhibit 14Sheet 6.1
THE DENTISTS INSURANCE COMPANY
Professional Liability
Development of Discount FactorCalifornia
Present ValueCalendar Cumulative Incremental Factor Discount
Year Payout Payout 6.19% Factor(1) (2) (3) (4) (5)
1 0.115 0.115 0.970 0.1122 0.558 0.443 0.914 0.4053 0.861 0.303 0.861 0.2614 0.957 0.096 0.811 0.0785 0.986 0.029 0.763 0.0226 0.987 0.001 0.719 0.0017 0.989 0.002 0.677 0.0018 0.990 0.001 0.637 0.0019 0.990 0.000 0.600 0.000
10 0.990 0.000 0.565 0.00011 0.990 0.000 0.532 0.00012 0.990 0.000 0.501 0.00013 0.990 0.000 0.472 0.00014 0.993 0.003 0.445 0.00115 0.993 0.000 0.419 0.00016 0.994 0.001 0.394 0.00017 0.998 0.004 0.371 0.00118 0.999 0.001 0.350 0.00019 1.000 0.001 0.329 0.000
Total 1.000 0.884
Notes:(2) Based on Exhibit 14, Appendix H.(3) Downward difference of (2).(4) Assumes that payments are made at mid-year and an annual rate
of return of 6.19%, per CA DOI rate application.(5) = (3) x (4).
V:\The Dentists Insurance Co - 114833\11\RCS\187656 - CA Rates\Exec - Anl\TDIC CA PL GL Rate Study 12312010E6.16/29/2011 9:42 PM

Exhibit 14Sheet 6.2
THE DENTISTS INSURANCE COMPANY
General Liability
Development of Discount FactorCalifornia
Present ValueCalendar Cumulative Incremental Factor Discount
Year Payout Payout 6.19% Factor(1) (2) (3) (4) (5)
1 0.153 0.153 0.970 0.1482 0.364 0.211 0.914 0.1933 0.529 0.165 0.861 0.1424 0.766 0.237 0.811 0.1925 0.950 0.184 0.763 0.1406 0.965 0.015 0.719 0.0117 0.983 0.018 0.677 0.0128 0.987 0.004 0.637 0.0039 0.999 0.012 0.600 0.007
10 0.999 0.000 0.565 0.00011 0.999 0.000 0.532 0.00012 0.999 0.000 0.501 0.00013 0.999 0.000 0.472 0.00014 0.999 0.000 0.445 0.00015 0.999 0.000 0.419 0.00016 0.999 0.000 0.394 0.00017 0.999 0.000 0.371 0.00018 0.999 0.000 0.350 0.00019 0.999 0.000 0.329 0.00020 0.999 0.000 0.310 0.00021 1.000 0.001 0.292 0.000
Total 1.000 0.849
Notes:(2) Based on Exhibit 14, Appendix F, Sheet 2.(3) Downward difference of (2).(4) Assumes that payments are made at mid-year and an annual rate
of return of 6.19%, per CA DOI rate application.(5) = (3) x (4).
V:\The Dentists Insurance Co - 114833\11\RCS\187656 - CA Rates\Exec - Anl\TDIC CA PL GL Rate Study 12312010E6.26/29/2011 9:42 PM

Exhibit 14Sheet 7
THE DENTISTS INSURANCE COMPANY
Professional and General Liability
Direct Expense RatioMedical Malpractice
California
CA CountrywideDirect Direct
Premium Premium Commission & Brokerage General Expense Taxes, Licenses &Calendar Earned Earned Expense Incurred Incurred Fees Incurred
Year ($000's) ($000's) ($000's) Percent ($000's) Percent ($000's) Percent(1) (2) (3) (4) (5) (6) (7) (8) (9)
2008 $27,812 $31,760 $0 0.0% $6,590 20.7% $779 2.8%
2009 28,856 33,046 0 0.0% 7,094 21.5% 910 3.2%
2010 29,510 33,929 0 0.0% 7,042 20.8% 1,005 3.4%
Total/Average $86,178 $98,735 $0 0.0% $20,726 21.0% $2,694 3.1%
(10) Selected 0.0% 21.0% 3.1%
(11) Indicated Expense Ratio 24.1%
(12) Selected Expense Ratio 24.0%
Notes:(2),(4),(8) Annual Statement, Statutory Page 14; provided by TDIC.
(3),(6) IEE, Part III, Medical Malpractice; provided by TDIC. 2009 for Column (6) reflects revised amounts provided by TDIC.
(5) = (4) / (2).(7) = (6) / (3).(9) = (8) / (2).
(11) Total of (10).
V:\The Dentists Insurance Co - 114833\11\RCS\187656 - CA Rates\Exec - Anl\TDIC CA PL GL Rate Study 12312010E76/29/2011 9:42 PM
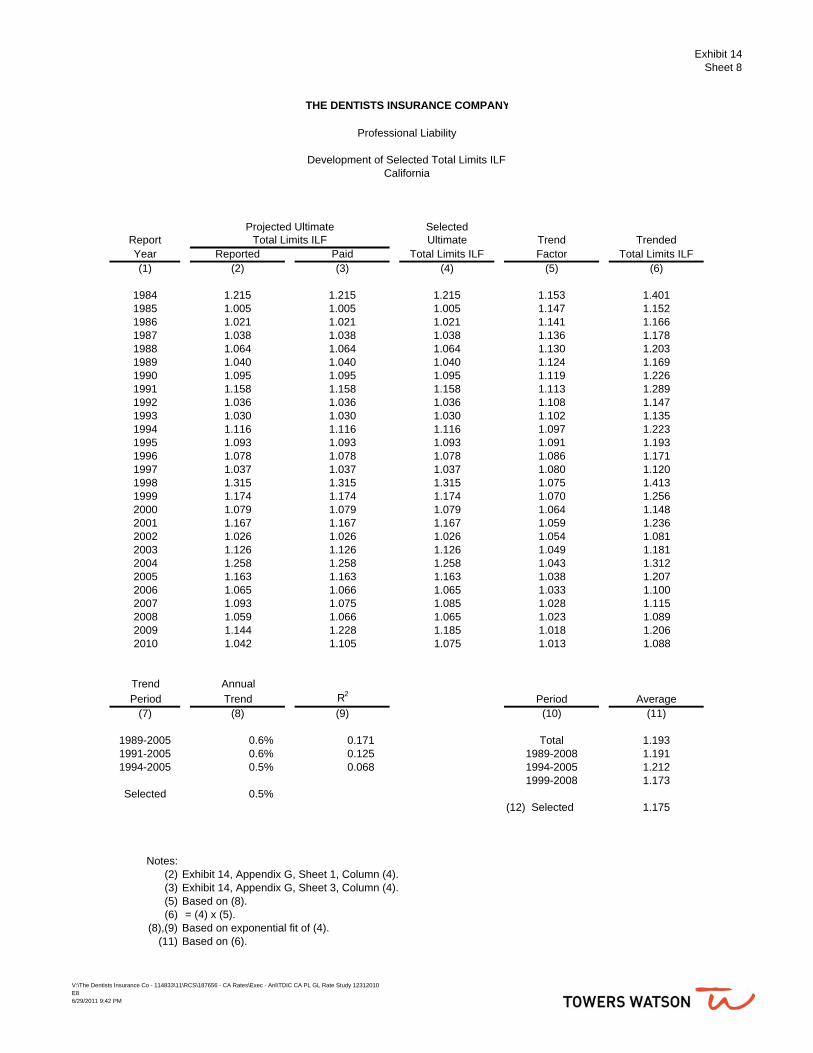
Exhibit 14Sheet 8
THE DENTISTS INSURANCE COMPANY
Professional Liability
Development of Selected Total Limits ILFCalifornia
Projected Ultimate SelectedReport Total Limits ILF Ultimate Trend TrendedYear Reported Paid Total Limits ILF Factor Total Limits ILF(1) (2) (3) (4) (5) (6)
1984 1.215 1.215 1.215 1.153 1.4011985 1.005 1.005 1.005 1.147 1.1521986 1.021 1.021 1.021 1.141 1.1661987 1.038 1.038 1.038 1.136 1.1781988 1.064 1.064 1.064 1.130 1.2031989 1.040 1.040 1.040 1.124 1.1691990 1.095 1.095 1.095 1.119 1.2261991 1.158 1.158 1.158 1.113 1.2891992 1.036 1.036 1.036 1.108 1.1471993 1.030 1.030 1.030 1.102 1.1351994 1.116 1.116 1.116 1.097 1.2231995 1.093 1.093 1.093 1.091 1.1931996 1.078 1.078 1.078 1.086 1.1711997 1.037 1.037 1.037 1.080 1.1201998 1.315 1.315 1.315 1.075 1.4131999 1.174 1.174 1.174 1.070 1.2562000 1.079 1.079 1.079 1.064 1.1482001 1.167 1.167 1.167 1.059 1.2362002 1.026 1.026 1.026 1.054 1.0812003 1.126 1.126 1.126 1.049 1.1812004 1.258 1.258 1.258 1.043 1.3122005 1.163 1.163 1.163 1.038 1.2072006 1.065 1.066 1.065 1.033 1.1002007 1.093 1.075 1.085 1.028 1.1152008 1.059 1.066 1.065 1.023 1.0892009 1.144 1.228 1.185 1.018 1.2062010 1.042 1.105 1.075 1.013 1.088
Trend AnnualPeriod Trend R2 Period Average
(7) (8) (9) (10) (11)
1989-2005 0.6% 0.171 Total 1.1931991-2005 0.6% 0.125 1989-2008 1.1911994-2005 0.5% 0.068 1994-2005 1.212
1999-2008 1.173Selected 0.5%
(12) Selected 1.175
Notes:(2) Exhibit 14, Appendix G, Sheet 1, Column (4).(3) Exhibit 14, Appendix G, Sheet 3, Column (4).(5) Based on (8).(6) = (4) x (5).
(8),(9) Based on exponential fit of (4).(11) Based on (6).
V:\The Dentists Insurance Co - 114833\11\RCS\187656 - CA Rates\Exec - Anl\TDIC CA PL GL Rate Study 12312010E86/29/2011 9:42 PM
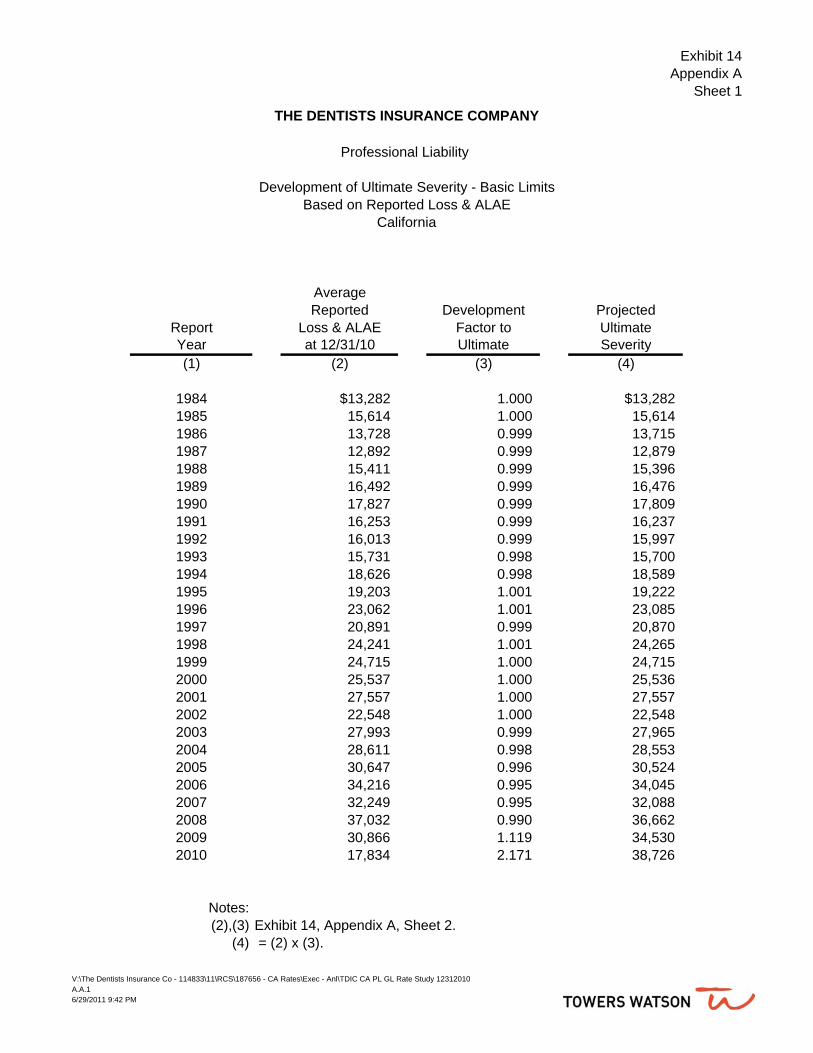
Exhibit 14Appendix A
Sheet 1
THE DENTISTS INSURANCE COMPANY
Professional Liability
Development of Ultimate Severity - Basic LimitsBased on Reported Loss & ALAE
California
AverageReported Development Projected
Report Loss & ALAE Factor to UltimateYear at 12/31/10 Ultimate Severity(1) (2) (3) (4)
1984 $13,282 1.000 $13,2821985 15,614 1.000 15,6141986 13,728 0.999 13,7151987 12,892 0.999 12,8791988 15,411 0.999 15,3961989 16,492 0.999 16,4761990 17,827 0.999 17,8091991 16,253 0.999 16,2371992 16,013 0.999 15,9971993 15,731 0.998 15,7001994 18,626 0.998 18,5891995 19,203 1.001 19,2221996 23,062 1.001 23,0851997 20,891 0.999 20,8701998 24,241 1.001 24,2651999 24,715 1.000 24,7152000 25,537 1.000 25,5362001 27,557 1.000 27,5572002 22,548 1.000 22,5482003 27,993 0.999 27,9652004 28,611 0.998 28,5532005 30,647 0.996 30,5242006 34,216 0.995 34,0452007 32,249 0.995 32,0882008 37,032 0.990 36,6622009 30,866 1.119 34,5302010 17,834 2.171 38,726
Notes:(2),(3) Exhibit 14, Appendix A, Sheet 2.
(4) = (2) x (3).
V:\The Dentists Insurance Co - 114833\11\RCS\187656 - CA Rates\Exec - Anl\TDIC CA PL GL Rate Study 12312010A.A.16/29/2011 9:42 PM

The Dentists Insurance CompanyProfessional LiabilityClaims-Made CoverageCaliforniaBasic LimitsAverage Reported Loss & ALAEData Evaluated as of 12/31/2010
Exhibit 14Appendix A
Sheet 2.1
Report Evaluation Age in MonthsYear 12 24 36 48 60 72 84 96 108 120 132 144 156 168 1801984 3,355 7,917 9,696 12,883 14,008 13,704 13,447 13,368 13,368 13,342 13,342 13,342 13,342 13,342 13,3421985 3,473 7,463 12,129 15,283 16,800 16,105 15,704 15,643 15,621 15,621 15,621 15,621 15,621 15,621 15,6211986 4,264 8,362 12,069 14,103 14,263 14,089 13,954 13,800 13,756 13,756 13,756 13,756 13,756 13,756 13,7561987 4,617 9,634 12,772 13,364 13,271 13,400 13,287 13,031 12,913 12,913 12,917 12,917 12,917 12,917 12,8871988 5,071 10,735 13,299 14,265 15,674 15,741 15,699 15,408 15,420 15,431 15,432 15,432 15,435 15,400 15,4051989 5,916 13,250 16,046 17,221 17,823 17,075 16,626 16,613 16,531 16,522 16,529 16,529 16,529 16,529 16,5291990 7,221 14,314 18,310 18,048 17,871 18,050 17,986 17,986 17,986 17,871 17,878 17,878 17,878 17,878 17,8791991 7,008 16,803 17,213 17,349 16,672 16,454 16,416 16,380 16,352 16,356 16,356 16,321 16,321 16,284 16,2851992 8,697 16,213 17,719 16,084 15,982 15,935 15,918 15,920 15,924 15,924 15,924 15,886 15,887 15,887 15,8871993 8,658 17,894 16,994 15,868 15,899 15,870 15,994 15,812 15,812 15,741 15,741 15,741 15,707 15,707 15,7071994 12,682 20,256 18,943 18,805 18,723 18,769 18,688 18,689 18,643 18,554 18,556 18,587 18,613 18,611 18,6111995 13,401 20,359 18,890 18,950 19,204 19,247 19,198 19,135 19,135 19,092 19,092 19,092 19,117 19,203 19,2031996 14,262 23,602 23,285 22,832 23,313 23,216 23,218 23,218 23,216 23,152 23,174 23,217 23,182 23,192 23,0621997 13,171 21,069 21,662 21,389 21,196 20,888 20,890 20,890 20,891 20,891 20,891 20,891 20,891 20,8911998 17,956 24,455 26,098 26,205 24,391 24,366 24,221 24,242 24,239 24,239 24,239 24,241 24,2411999 15,094 25,807 24,900 25,038 24,956 24,720 24,737 24,706 24,707 24,695 24,703 24,7152000 17,922 24,728 25,657 26,129 25,970 25,788 25,720 25,519 25,519 25,519 25,5372001 16,377 23,795 26,684 27,232 27,131 27,550 27,636 27,629 27,557 27,5572002 15,099 22,266 23,174 23,052 22,806 22,622 22,500 22,548 22,5482003 15,163 28,584 29,089 28,132 28,219 28,162 28,134 27,9932004 16,918 27,537 28,199 28,592 28,551 28,635 28,6112005 17,516 29,160 31,656 30,536 30,752 30,6472006 15,414 30,438 33,665 34,382 34,2162007 16,423 30,223 32,287 32,2492008 15,034 30,429 37,0322009 15,753 30,8662010 17,834
Report Age Interval in MonthsYear 12 - 24 24 - 36 36 - 48 48 - 60 60 - 72 72 - 84 84 - 96 96 - 108 108 - 120 120 - 132 132 - 144 144 - 156 156 - 168 168 - 180 180 - 1921984 2.360 1.225 1.329 1.087 .978 .981 .994 1.000 .998 1.000 1.000 1.000 1.000 1.000 1.0001985 2.149 1.625 1.260 1.099 .959 .975 .996 .999 1.000 1.000 1.000 1.000 1.000 1.000 1.0001986 1.961 1.443 1.169 1.011 .988 .990 .989 .997 1.000 1.000 1.000 1.000 1.000 1.000 .9981987 2.087 1.326 1.046 .993 1.010 .991 .981 .991 1.000 1.000 1.000 1.000 1.000 .998 1.0001988 2.117 1.239 1.073 1.099 1.004 .997 .981 1.001 1.001 1.000 1.000 1.000 .998 1.000 1.0001989 2.240 1.211 1.073 1.035 .958 .974 .999 .995 .999 1.000 1.000 1.000 1.000 1.000 1.0001990 1.982 1.279 .986 .990 1.010 .996 1.000 1.000 .994 1.000 1.000 1.000 1.000 1.000 1.0001991 2.398 1.024 1.008 .961 .987 .998 .998 .998 1.000 1.000 .998 1.000 .998 1.000 1.0001992 1.864 1.093 .908 .994 .997 .999 1.000 1.000 1.000 1.000 .998 1.000 1.000 1.000 1.0001993 2.067 .950 .934 1.002 .998 1.008 .989 1.000 .996 1.000 1.000 .998 1.000 1.000 1.0001994 1.597 .935 .993 .996 1.002 .996 1.000 .998 .995 1.000 1.002 1.001 1.000 1.000 1.0011995 1.519 .928 1.003 1.013 1.002 .997 .997 1.000 .998 1.000 1.000 1.001 1.004 1.000 1.0001996 1.655 .987 .981 1.021 .996 1.000 1.000 1.000 .997 1.001 1.002 .998 1.000 .9941997 1.600 1.028 .987 .991 .985 1.000 1.000 1.000 1.000 1.000 1.000 1.000 1.0001998 1.362 1.067 1.004 .931 .999 .994 1.001 1.000 1.000 1.000 1.000 1.0001999 1.710 .965 1.006 .997 .991 1.001 .999 1.000 1.000 1.000 1.0002000 1.380 1.038 1.018 .994 .993 .997 .992 1.000 1.000 1.0012001 1.453 1.121 1.021 .996 1.015 1.003 1.000 .997 1.0002002 1.475 1.041 .995 .989 .992 .995 1.002 1.0002003 1.885 1.018 .967 1.003 .998 .999 .9952004 1.628 1.024 1.014 .999 1.003 .9992005 1.665 1.086 .965 1.007 .9972006 1.975 1.106 1.021 .9952007 1.840 1.068 .9992008 2.024 1.2172009 1.9592010
Simple Average of Middle 3 of Latest 5 (Non-contiguous, Average High Low)[1] 1.925 1.087 .993 .999 .999 .999 .998 1.000 1.000 1.000 1.000 1.000 1.000 1.000 1.000
Simple Average of Latest 3 (Non-contiguous)[2] 1.941 1.130 .995 1.000 .999 .998 .999 .999 1.000 1.000 1.000 .999 1.002 .998 1.000
Simple Average of Latest 5 (Non-contiguous)[3] 1.893 1.100 .993 .999 1.001 .999 .998 .999 1.000 1.000 1.000 1.000 1.001 .999 1.000
Simple Average of Latest 7 (Non-contiguous)[4] 1.854 1.080 .997 .998 .998 .998 .998 1.000 .999 1.000 1.001 1.000 1.000 .999 1.000
Volume Weighted Average of Latest 3 (Non-Contiguous) - Based on Basic Limits Losses[5] 1.943 1.135 0.996 1.000 0.999 0.998 0.999 0.999 1.000 1.000 1.000 1.000 1.002 0.998 1.000
SelectedSelected 1.941 1.130 .995 1.000 .999 .998 .999 .999 1.000 1.000 1.000 .999 1.002 .998 1.000
Dev To Ult 2.171 1.119 0.990 0.995 0.995 0.996 0.998 0.999 1.000 1.000 1.000 1.000 1.001 0.999 1.001
V:\The Dentists Insurance Co - 114833\11\RCS\187656 - CA Rates\Exec - Anl\TDIC CA PL GL Rate Study 12312010Tri_766/29/2011 9:42 PM

The Dentists Insurance CompanyProfessional LiabilityClaims-Made CoverageCaliforniaBasic LimitsAverage Reported Loss & ALAEData Evaluated as of 12/31/2010
Exhibit 14Appendix A
Sheet 2.2
ReportYear198419851986198719881989199019911992199319941995199619971998199920002001200220032004200520062007200820092010
ReportYear198419851986198719881989199019911992199319941995199619971998199920002001200220032004200520062007200820092010
[1]
[2]
[3]
[4]
[5]
Selected
Dev To Ult
192 204 216 228 240 252 264 276 288 300 312 32413,342 13,342 13,354 13,354 13,318 13,318 13,318 13,318 13,318 13,318 13,284 13,28215,622 15,622 15,622 15,622 15,622 15,604 15,604 15,611 15,614 15,614 15,61413,728 13,728 13,728 13,728 13,728 13,728 13,728 13,728 13,728 13,72812,888 12,888 12,888 12,892 12,892 12,892 12,892 12,892 12,89215,405 15,405 15,405 15,405 15,405 15,405 15,405 15,41116,531 16,492 16,492 16,492 16,492 16,492 16,49217,879 17,879 17,842 17,824 17,824 17,82716,291 16,291 16,291 16,253 16,25315,887 16,013 16,008 16,01315,707 15,724 15,73118,626 18,62619,203
192 - 204 204 - 216 216 - 228 228 - 240 240 - 252 252 - 264 264 - 276 276 - 288 288 - 300 300 - 312 312 - 324 324 - Ult1.000 1.001 1.000 .997 1.000 1.000 1.000 1.000 1.000 .997 1.0001.000 1.000 1.000 1.000 .999 1.000 1.000 1.000 1.000 1.0001.000 1.000 1.000 1.000 1.000 1.000 1.000 1.000 1.0001.000 1.000 1.000 1.000 1.000 1.000 1.000 1.0001.000 1.000 1.000 1.000 1.000 1.000 1.000.998 1.000 1.000 1.000 1.000 1.000
1.000 .998 .999 1.000 1.0001.000 1.000 .998 1.0001.008 1.000 1.0001.001 1.0001.000
1.000 1.000 1.000 1.000 1.000 1.000 1.000 1.000 1.000 .999 1.000 1.000
1.003 1.000 .999 1.000 1.000 1.000 1.000 1.000 1.000 .999 1.000 1.000
1.002 1.000 .999 1.000 1.000 1.000 1.000 1.000 1.000 .999 1.000 1.000
1.001 1.000 1.000 1.000 1.000 1.000 1.000 1.000 1.000 .999 1.000 1.000
1.003 1.000 0.999 1.000 1.000 1.000 1.000 1.000 1.000 0.999 1.000 1.000
1.003 1.000 .999 1.000 1.000 1.000 1.000 1.000 1.000 .999 1.000 1.000
1.001 0.998 0.998 0.999 0.999 0.999 0.999 0.999 0.999 0.999 1.000 1.000
V:\The Dentists Insurance Co - 114833\11\RCS\187656 - CA Rates\Exec - Anl\TDIC CA PL GL Rate Study 12312010Tri_766/29/2011 9:42 PM
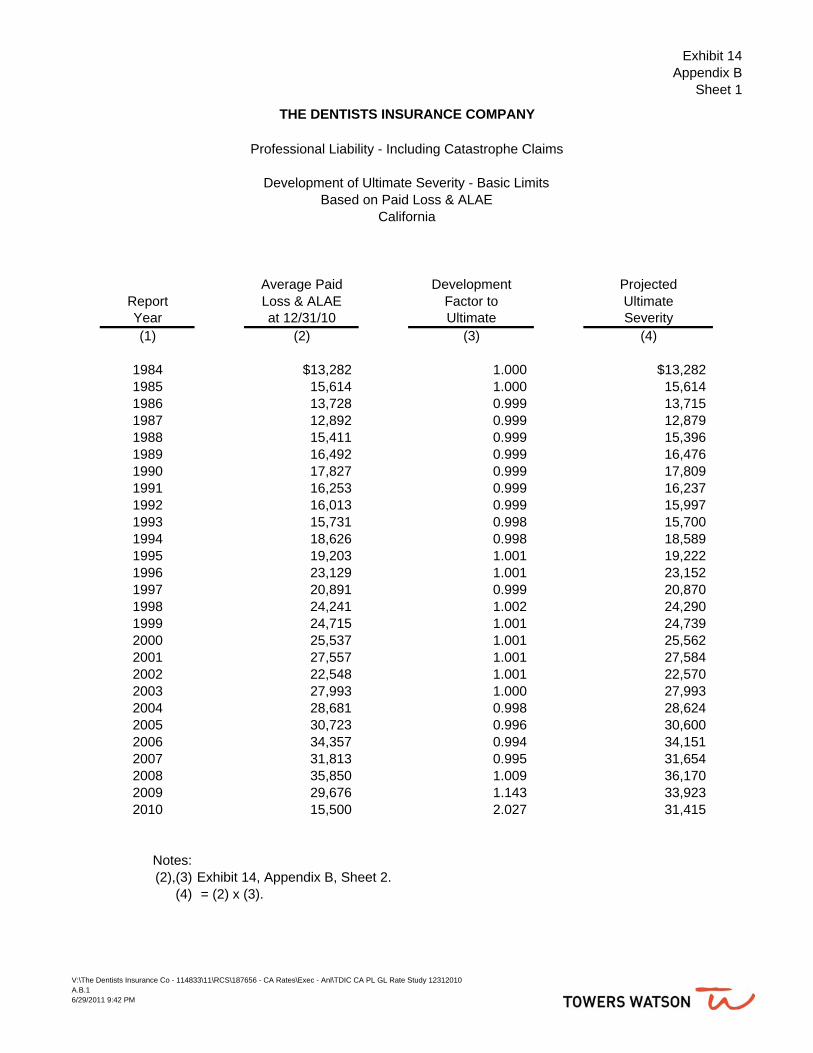
Exhibit 14Appendix B
Sheet 1
THE DENTISTS INSURANCE COMPANY
Professional Liability - Including Catastrophe Claims
Development of Ultimate Severity - Basic LimitsBased on Paid Loss & ALAE
California
Average Paid Development ProjectedReport Loss & ALAE Factor to UltimateYear at 12/31/10 Ultimate Severity(1) (2) (3) (4)
1984 $13,282 1.000 $13,2821985 15,614 1.000 15,6141986 13,728 0.999 13,7151987 12,892 0.999 12,8791988 15,411 0.999 15,3961989 16,492 0.999 16,4761990 17,827 0.999 17,8091991 16,253 0.999 16,2371992 16,013 0.999 15,9971993 15,731 0.998 15,7001994 18,626 0.998 18,5891995 19,203 1.001 19,2221996 23,129 1.001 23,1521997 20,891 0.999 20,8701998 24,241 1.002 24,2901999 24,715 1.001 24,7392000 25,537 1.001 25,5622001 27,557 1.001 27,5842002 22,548 1.001 22,5702003 27,993 1.000 27,9932004 28,681 0.998 28,6242005 30,723 0.996 30,6002006 34,357 0.994 34,1512007 31,813 0.995 31,6542008 35,850 1.009 36,1702009 29,676 1.143 33,9232010 15,500 2.027 31,415
Notes:(2),(3) Exhibit 14, Appendix B, Sheet 2.
(4) = (2) x (3).
V:\The Dentists Insurance Co - 114833\11\RCS\187656 - CA Rates\Exec - Anl\TDIC CA PL GL Rate Study 12312010A.B.16/29/2011 9:42 PM
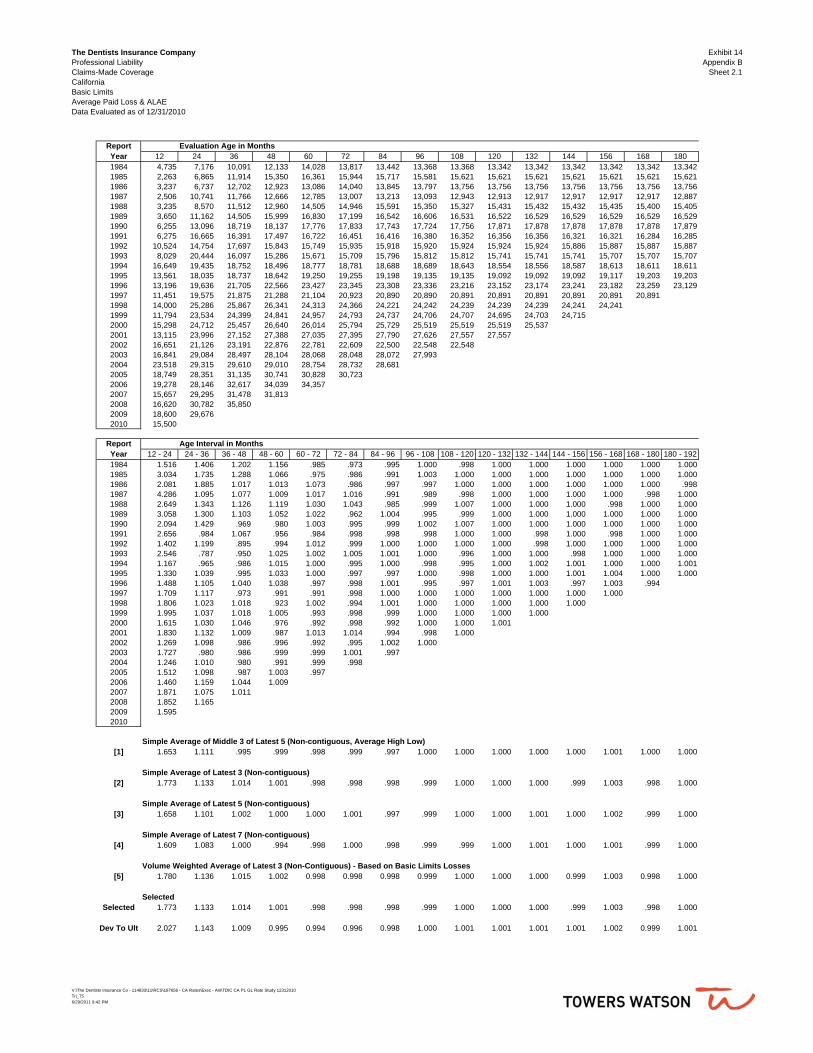
The Dentists Insurance CompanyProfessional LiabilityClaims-Made CoverageCaliforniaBasic LimitsAverage Paid Loss & ALAEData Evaluated as of 12/31/2010
Exhibit 14Appendix B
Sheet 2.1
Report Evaluation Age in MonthsYear 12 24 36 48 60 72 84 96 108 120 132 144 156 168 1801984 4,735 7,176 10,091 12,133 14,028 13,817 13,442 13,368 13,368 13,342 13,342 13,342 13,342 13,342 13,3421985 2,263 6,865 11,914 15,350 16,361 15,944 15,717 15,581 15,621 15,621 15,621 15,621 15,621 15,621 15,6211986 3,237 6,737 12,702 12,923 13,086 14,040 13,845 13,797 13,756 13,756 13,756 13,756 13,756 13,756 13,7561987 2,506 10,741 11,766 12,666 12,785 13,007 13,213 13,093 12,943 12,913 12,917 12,917 12,917 12,917 12,8871988 3,235 8,570 11,512 12,960 14,505 14,946 15,591 15,350 15,327 15,431 15,432 15,432 15,435 15,400 15,4051989 3,650 11,162 14,505 15,999 16,830 17,199 16,542 16,606 16,531 16,522 16,529 16,529 16,529 16,529 16,5291990 6,255 13,096 18,719 18,137 17,776 17,833 17,743 17,724 17,756 17,871 17,878 17,878 17,878 17,878 17,8791991 6,275 16,665 16,391 17,497 16,722 16,451 16,416 16,380 16,352 16,356 16,356 16,321 16,321 16,284 16,2851992 10,524 14,754 17,697 15,843 15,749 15,935 15,918 15,920 15,924 15,924 15,924 15,886 15,887 15,887 15,8871993 8,029 20,444 16,097 15,286 15,671 15,709 15,796 15,812 15,812 15,741 15,741 15,741 15,707 15,707 15,7071994 16,649 19,435 18,752 18,496 18,777 18,781 18,688 18,689 18,643 18,554 18,556 18,587 18,613 18,611 18,6111995 13,561 18,035 18,737 18,642 19,250 19,255 19,198 19,135 19,135 19,092 19,092 19,092 19,117 19,203 19,2031996 13,196 19,636 21,705 22,566 23,427 23,345 23,308 23,336 23,216 23,152 23,174 23,241 23,182 23,259 23,1291997 11,451 19,575 21,875 21,288 21,104 20,923 20,890 20,890 20,891 20,891 20,891 20,891 20,891 20,8911998 14,000 25,286 25,867 26,341 24,313 24,366 24,221 24,242 24,239 24,239 24,239 24,241 24,2411999 11,794 23,534 24,399 24,841 24,957 24,793 24,737 24,706 24,707 24,695 24,703 24,7152000 15,298 24,712 25,457 26,640 26,014 25,794 25,729 25,519 25,519 25,519 25,5372001 13,115 23,996 27,152 27,388 27,035 27,395 27,790 27,626 27,557 27,5572002 16,651 21,126 23,191 22,876 22,781 22,609 22,500 22,548 22,5482003 16,841 29,084 28,497 28,104 28,068 28,048 28,072 27,9932004 23,518 29,315 29,610 29,010 28,754 28,732 28,6812005 18,749 28,351 31,135 30,741 30,828 30,7232006 19,278 28,146 32,617 34,039 34,3572007 15,657 29,295 31,478 31,8132008 16,620 30,782 35,8502009 18,600 29,6762010 15,500
Report Age Interval in MonthsYear 12 - 24 24 - 36 36 - 48 48 - 60 60 - 72 72 - 84 84 - 96 96 - 108 108 - 120 120 - 132 132 - 144 144 - 156 156 - 168 168 - 180 180 - 1921984 1.516 1.406 1.202 1.156 .985 .973 .995 1.000 .998 1.000 1.000 1.000 1.000 1.000 1.0001985 3.034 1.735 1.288 1.066 .975 .986 .991 1.003 1.000 1.000 1.000 1.000 1.000 1.000 1.0001986 2.081 1.885 1.017 1.013 1.073 .986 .997 .997 1.000 1.000 1.000 1.000 1.000 1.000 .9981987 4.286 1.095 1.077 1.009 1.017 1.016 .991 .989 .998 1.000 1.000 1.000 1.000 .998 1.0001988 2.649 1.343 1.126 1.119 1.030 1.043 .985 .999 1.007 1.000 1.000 1.000 .998 1.000 1.0001989 3.058 1.300 1.103 1.052 1.022 .962 1.004 .995 .999 1.000 1.000 1.000 1.000 1.000 1.0001990 2.094 1.429 .969 .980 1.003 .995 .999 1.002 1.007 1.000 1.000 1.000 1.000 1.000 1.0001991 2.656 .984 1.067 .956 .984 .998 .998 .998 1.000 1.000 .998 1.000 .998 1.000 1.0001992 1.402 1.199 .895 .994 1.012 .999 1.000 1.000 1.000 1.000 .998 1.000 1.000 1.000 1.0001993 2.546 .787 .950 1.025 1.002 1.005 1.001 1.000 .996 1.000 1.000 .998 1.000 1.000 1.0001994 1.167 .965 .986 1.015 1.000 .995 1.000 .998 .995 1.000 1.002 1.001 1.000 1.000 1.0011995 1.330 1.039 .995 1.033 1.000 .997 .997 1.000 .998 1.000 1.000 1.001 1.004 1.000 1.0001996 1.488 1.105 1.040 1.038 .997 .998 1.001 .995 .997 1.001 1.003 .997 1.003 .9941997 1.709 1.117 .973 .991 .991 .998 1.000 1.000 1.000 1.000 1.000 1.000 1.0001998 1.806 1.023 1.018 .923 1.002 .994 1.001 1.000 1.000 1.000 1.000 1.0001999 1.995 1.037 1.018 1.005 .993 .998 .999 1.000 1.000 1.000 1.0002000 1.615 1.030 1.046 .976 .992 .998 .992 1.000 1.000 1.0012001 1.830 1.132 1.009 .987 1.013 1.014 .994 .998 1.0002002 1.269 1.098 .986 .996 .992 .995 1.002 1.0002003 1.727 .980 .986 .999 .999 1.001 .9972004 1.246 1.010 .980 .991 .999 .9982005 1.512 1.098 .987 1.003 .9972006 1.460 1.159 1.044 1.0092007 1.871 1.075 1.0112008 1.852 1.1652009 1.5952010
Simple Average of Middle 3 of Latest 5 (Non-contiguous, Average High Low)[1] 1.653 1.111 .995 .999 .998 .999 .997 1.000 1.000 1.000 1.000 1.000 1.001 1.000 1.000
Simple Average of Latest 3 (Non-contiguous)[2] 1.773 1.133 1.014 1.001 .998 .998 .998 .999 1.000 1.000 1.000 .999 1.003 .998 1.000
Simple Average of Latest 5 (Non-contiguous)[3] 1.658 1.101 1.002 1.000 1.000 1.001 .997 .999 1.000 1.000 1.001 1.000 1.002 .999 1.000
Simple Average of Latest 7 (Non-contiguous)[4] 1.609 1.083 1.000 .994 .998 1.000 .998 .999 .999 1.000 1.001 1.000 1.001 .999 1.000
Volume Weighted Average of Latest 3 (Non-Contiguous) - Based on Basic Limits Losses[5] 1.780 1.136 1.015 1.002 0.998 0.998 0.998 0.999 1.000 1.000 1.000 0.999 1.003 0.998 1.000
SelectedSelected 1.773 1.133 1.014 1.001 .998 .998 .998 .999 1.000 1.000 1.000 .999 1.003 .998 1.000
Dev To Ult 2.027 1.143 1.009 0.995 0.994 0.996 0.998 1.000 1.001 1.001 1.001 1.001 1.002 0.999 1.001
V:\The Dentists Insurance Co - 114833\11\RCS\187656 - CA Rates\Exec - Anl\TDIC CA PL GL Rate Study 12312010Tri_756/29/2011 9:42 PM
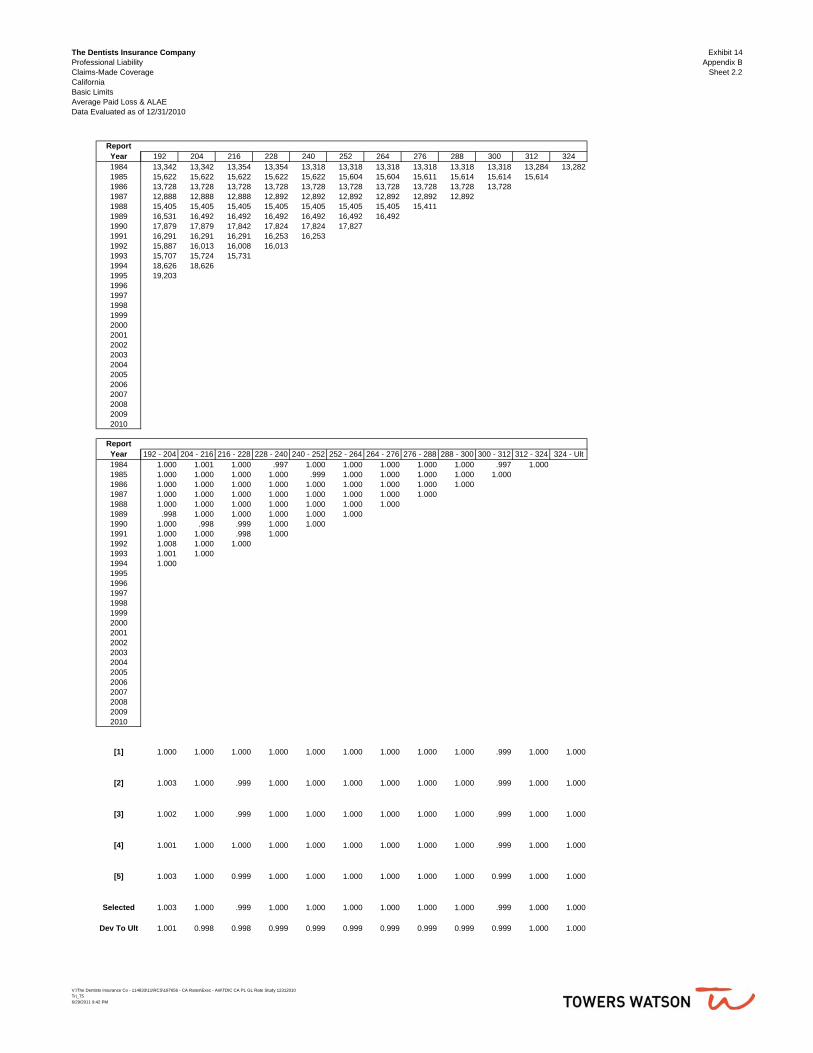
The Dentists Insurance CompanyProfessional LiabilityClaims-Made CoverageCaliforniaBasic LimitsAverage Paid Loss & ALAEData Evaluated as of 12/31/2010
Exhibit 14Appendix B
Sheet 2.2
ReportYear198419851986198719881989199019911992199319941995199619971998199920002001200220032004200520062007200820092010
ReportYear198419851986198719881989199019911992199319941995199619971998199920002001200220032004200520062007200820092010
[1]
[2]
[3]
[4]
[5]
Selected
Dev To Ult
192 204 216 228 240 252 264 276 288 300 312 32413,342 13,342 13,354 13,354 13,318 13,318 13,318 13,318 13,318 13,318 13,284 13,28215,622 15,622 15,622 15,622 15,622 15,604 15,604 15,611 15,614 15,614 15,61413,728 13,728 13,728 13,728 13,728 13,728 13,728 13,728 13,728 13,72812,888 12,888 12,888 12,892 12,892 12,892 12,892 12,892 12,89215,405 15,405 15,405 15,405 15,405 15,405 15,405 15,41116,531 16,492 16,492 16,492 16,492 16,492 16,49217,879 17,879 17,842 17,824 17,824 17,82716,291 16,291 16,291 16,253 16,25315,887 16,013 16,008 16,01315,707 15,724 15,73118,626 18,62619,203
192 - 204 204 - 216 216 - 228 228 - 240 240 - 252 252 - 264 264 - 276 276 - 288 288 - 300 300 - 312 312 - 324 324 - Ult1.000 1.001 1.000 .997 1.000 1.000 1.000 1.000 1.000 .997 1.0001.000 1.000 1.000 1.000 .999 1.000 1.000 1.000 1.000 1.0001.000 1.000 1.000 1.000 1.000 1.000 1.000 1.000 1.0001.000 1.000 1.000 1.000 1.000 1.000 1.000 1.0001.000 1.000 1.000 1.000 1.000 1.000 1.000.998 1.000 1.000 1.000 1.000 1.000
1.000 .998 .999 1.000 1.0001.000 1.000 .998 1.0001.008 1.000 1.0001.001 1.0001.000
1.000 1.000 1.000 1.000 1.000 1.000 1.000 1.000 1.000 .999 1.000 1.000
1.003 1.000 .999 1.000 1.000 1.000 1.000 1.000 1.000 .999 1.000 1.000
1.002 1.000 .999 1.000 1.000 1.000 1.000 1.000 1.000 .999 1.000 1.000
1.001 1.000 1.000 1.000 1.000 1.000 1.000 1.000 1.000 .999 1.000 1.000
1.003 1.000 0.999 1.000 1.000 1.000 1.000 1.000 1.000 0.999 1.000 1.000
1.003 1.000 .999 1.000 1.000 1.000 1.000 1.000 1.000 .999 1.000 1.000
1.001 0.998 0.998 0.999 0.999 0.999 0.999 0.999 0.999 0.999 1.000 1.000
V:\The Dentists Insurance Co - 114833\11\RCS\187656 - CA Rates\Exec - Anl\TDIC CA PL GL Rate Study 12312010Tri_756/29/2011 9:42 PM

Exhibit 14Appendix C
Sheet 1
THE DENTISTS INSURANCE COMPANY
Professional Liability
Development of Ultimate Claim CountsBased on Reported Claim Counts (Net CNP)
California
ReportedClaim Counts Development Projected
Report (Net CNP) Factor to UltimateYear at 12/31/10 Ultimate Claim Counts(1) (2) (3) (4)
1984 184 1.000 1841985 355 1.000 3551986 339 1.001 3391987 425 1.001 4251988 478 1.001 4781989 422 1.001 4221990 420 1.001 4201991 436 1.001 4361992 422 1.001 4221993 413 1.002 4141994 406 1.003 4071995 432 1.005 4341996 348 1.006 3491997 384 1.007 3871998 382 1.009 3851999 325 1.009 3272000 356 1.009 3592001 330 1.009 3332002 341 1.009 3442003 356 1.009 3592004 300 1.009 3032005 287 1.009 2902006 307 1.010 3102007 317 1.009 3202008 359 1.009 3622009 330 0.997 3292010 319 0.877 280
Total 9,768 9,774
Notes:(2),(3) Exhibit 14, Appendix C, Sheet 2.
(4) = (2) x (3).
V:\The Dentists Insurance Co - 114833\11\RCS\187656 - CA Rates\Exec - Anl\TDIC CA PL GL Rate Study 12312010A.C.16/29/2011 9:42 PM

The Dentists Insurance CompanyProfessional LiabilityClaims-Made CoverageCaliforniaTotal LimitsReported Claim Counts excluding CNPData Evaluated as of 12/31/2010
Exhibit 14Appendix C
Sheet 2.1
Report Evaluation Age in MonthsYear 12 24 36 48 60 72 84 96 108 120 132 144 156 168 1801984 279 200 198 186 184 183 183 183 183 183 183 183 183 183 1831985 505 421 372 361 354 354 354 354 354 354 354 354 354 354 3541986 435 367 350 342 338 338 338 338 338 338 338 338 338 338 3381987 548 471 433 428 425 424 424 424 424 424 424 424 424 424 4251988 573 486 482 479 478 478 478 478 478 477 477 477 477 478 4781989 479 438 424 422 423 423 421 421 421 421 421 421 421 421 4211990 492 437 424 422 418 418 418 418 418 418 418 418 418 418 4181991 520 464 441 433 430 430 430 431 432 432 432 433 433 434 4341992 521 448 424 419 418 418 419 419 419 419 419 420 420 420 4201993 502 463 409 408 408 408 408 409 409 411 411 411 412 412 4121994 490 444 402 402 402 402 402 402 403 405 405 405 405 405 4051995 510 438 430 426 427 427 427 428 428 429 429 429 430 432 4321996 420 359 346 346 346 346 346 346 346 346 346 346 346 346 3481997 447 384 380 382 382 384 384 384 384 384 384 384 384 3841998 435 390 382 382 382 382 382 382 382 382 382 382 3821999 387 327 324 324 325 325 325 325 325 325 325 3252000 385 364 357 355 355 355 356 356 356 356 3562001 351 336 331 331 330 330 330 330 330 3302002 389 353 344 342 342 341 341 341 3412003 411 370 358 356 356 356 356 3562004 359 321 305 300 300 300 3002005 327 302 285 286 286 2872006 362 314 309 308 3072007 357 315 317 3172008 411 368 3592009 384 3302010 319
Report Age Interval in MonthsYear 12 - 24 24 - 36 36 - 48 48 - 60 60 - 72 72 - 84 84 - 96 96 - 108 108 - 120 120 - 132 132 - 144 144 - 156 156 - 168 168 - 180 180 - 1921984 .715 .990 .942 .987 .995 1.000 1.000 1.000 1.000 1.000 1.000 1.000 1.000 1.000 1.0001985 .833 .883 .972 .981 1.000 1.000 1.000 1.000 1.000 1.000 1.000 1.000 1.000 1.000 1.0001986 .843 .954 .977 .990 1.000 1.000 1.000 1.000 1.000 1.000 1.000 1.000 1.000 1.000 1.0031987 .860 .918 .988 .993 .998 1.000 1.000 1.000 1.000 1.000 1.000 1.000 1.000 1.002 1.0001988 .847 .993 .994 .998 1.000 1.000 1.000 1.000 .998 1.000 1.000 1.000 1.002 1.000 1.0001989 .914 .969 .995 1.001 1.000 .995 1.000 1.000 1.000 1.000 1.000 1.000 1.000 1.000 1.0001990 .887 .971 .995 .991 1.000 1.000 1.000 1.000 1.000 1.000 1.000 1.000 1.000 1.000 1.0001991 .892 .950 .982 .993 1.000 1.000 1.002 1.002 1.000 1.000 1.002 1.000 1.002 1.000 1.0021992 .861 .945 .988 .998 1.000 1.002 1.000 1.000 1.000 1.000 1.002 1.000 1.000 1.000 1.0001993 .921 .883 .998 1.000 1.000 1.000 1.002 1.000 1.005 1.000 1.000 1.002 1.000 1.000 1.0001994 .906 .905 1.000 1.000 1.000 1.000 1.000 1.002 1.005 1.000 1.000 1.000 1.000 1.000 1.0021995 .859 .982 .991 1.002 1.000 1.000 1.002 1.000 1.002 1.000 1.000 1.002 1.005 1.000 1.0001996 .855 .964 1.000 1.000 1.000 1.000 1.000 1.000 1.000 1.000 1.000 1.000 1.000 1.0061997 .859 .990 1.005 1.000 1.005 1.000 1.000 1.000 1.000 1.000 1.000 1.000 1.0001998 .897 .979 1.000 1.000 1.000 1.000 1.000 1.000 1.000 1.000 1.000 1.0001999 .845 .991 1.000 1.003 1.000 1.000 1.000 1.000 1.000 1.000 1.0002000 .945 .981 .994 1.000 1.000 1.003 1.000 1.000 1.000 1.0002001 .957 .985 1.000 .997 1.000 1.000 1.000 1.000 1.0002002 .907 .975 .994 1.000 .997 1.000 1.000 1.0002003 .900 .968 .994 1.000 1.000 1.000 1.0002004 .894 .950 .984 1.000 1.000 1.0002005 .924 .944 1.004 1.000 1.0032006 .867 .984 .997 .9972007 .882 1.006 1.0002008 .895 .9762009 .8592010
Simple Average of Middle 3 of Latest 5 (Non-contiguous, Average High Low)[1] .882 .970 .997 1.000 1.000 1.000 1.000 1.000 1.000 1.000 1.000 1.000 1.000 1.000 1.001
Volume Weighted Average of Latest 3 (Non-contiguous)[2] .879 .988 1.000 .999 1.001 1.000 1.000 1.000 1.000 1.000 1.000 1.000 1.002 1.002 1.001
Volume Weighted Average of Latest 4 (Non-contiguous)[3] .876 .978 .996 .999 1.000 1.000 1.000 1.000 1.000 1.000 1.000 1.001 1.001 1.001 1.001
Volume Weighted Average of Latest 5 (Non-contiguous)[4] .885 .972 .996 .999 1.000 1.001 1.000 1.000 1.000 1.000 1.000 1.001 1.001 1.001 1.001
SelectedSelected .879 .988 1.000 .999 1.001 1.000 1.000 1.000 1.000 1.000 1.000 1.000 1.002 1.002 1.001
Dev To Ult .877 .997 1.009 1.009 1.010 1.009 1.009 1.009 1.009 1.009 1.009 1.009 1.009 1.007 1.006
V:\The Dentists Insurance Co - 114833\11\RCS\187656 - CA Rates\Exec - Anl\TDIC CA PL GL Rate Study 12312010Tri_746/29/2011 9:42 PM
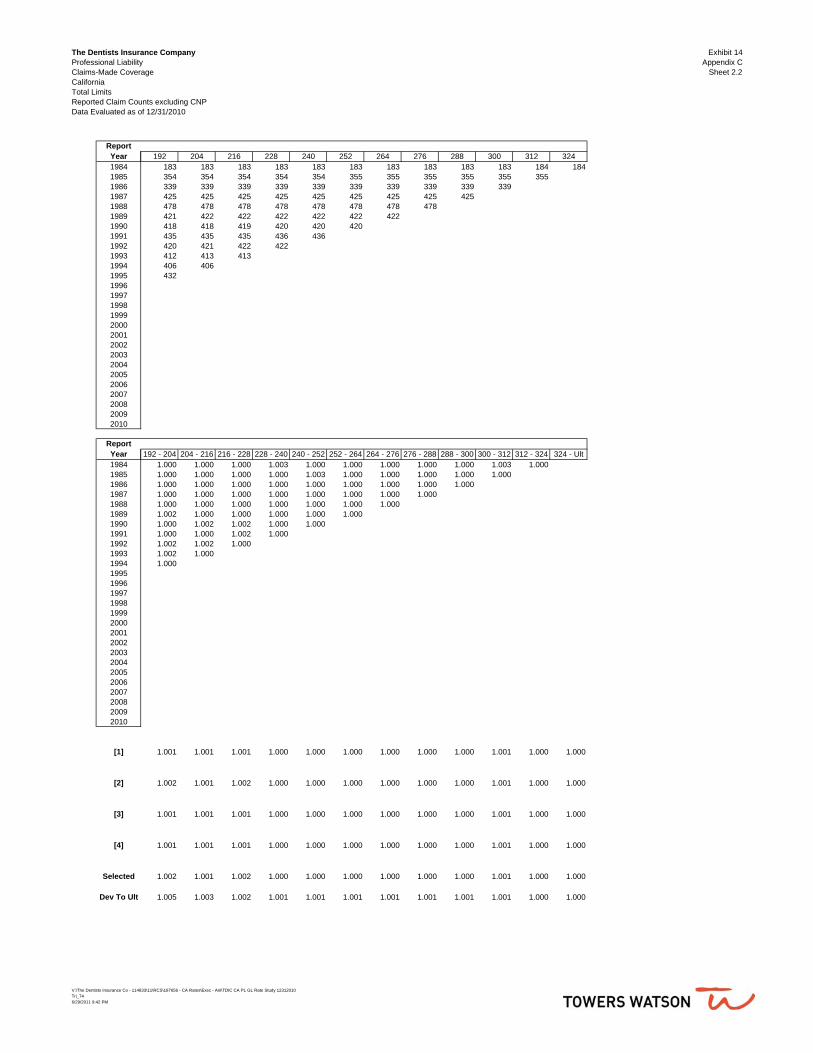
The Dentists Insurance CompanyProfessional LiabilityClaims-Made CoverageCaliforniaTotal LimitsReported Claim Counts excluding CNPData Evaluated as of 12/31/2010
Exhibit 14Appendix C
Sheet 2.2
ReportYear198419851986198719881989199019911992199319941995199619971998199920002001200220032004200520062007200820092010
ReportYear198419851986198719881989199019911992199319941995199619971998199920002001200220032004200520062007200820092010
[1]
[2]
[3]
[4]
Selected
Dev To Ult
192 204 216 228 240 252 264 276 288 300 312 324183 183 183 183 183 183 183 183 183 183 184 184354 354 354 354 354 355 355 355 355 355 355339 339 339 339 339 339 339 339 339 339425 425 425 425 425 425 425 425 425478 478 478 478 478 478 478 478421 422 422 422 422 422 422418 418 419 420 420 420435 435 435 436 436420 421 422 422412 413 413406 406432
192 - 204 204 - 216 216 - 228 228 - 240 240 - 252 252 - 264 264 - 276 276 - 288 288 - 300 300 - 312 312 - 324 324 - Ult1.000 1.000 1.000 1.003 1.000 1.000 1.000 1.000 1.000 1.003 1.0001.000 1.000 1.000 1.000 1.003 1.000 1.000 1.000 1.000 1.0001.000 1.000 1.000 1.000 1.000 1.000 1.000 1.000 1.0001.000 1.000 1.000 1.000 1.000 1.000 1.000 1.0001.000 1.000 1.000 1.000 1.000 1.000 1.0001.002 1.000 1.000 1.000 1.000 1.0001.000 1.002 1.002 1.000 1.0001.000 1.000 1.002 1.0001.002 1.002 1.0001.002 1.0001.000
1.001 1.001 1.001 1.000 1.000 1.000 1.000 1.000 1.000 1.001 1.000 1.000
1.002 1.001 1.002 1.000 1.000 1.000 1.000 1.000 1.000 1.001 1.000 1.000
1.001 1.001 1.001 1.000 1.000 1.000 1.000 1.000 1.000 1.001 1.000 1.000
1.001 1.001 1.001 1.000 1.000 1.000 1.000 1.000 1.000 1.001 1.000 1.000
1.002 1.001 1.002 1.000 1.000 1.000 1.000 1.000 1.000 1.001 1.000 1.000
1.005 1.003 1.002 1.001 1.001 1.001 1.001 1.001 1.001 1.001 1.000 1.000
V:\The Dentists Insurance Co - 114833\11\RCS\187656 - CA Rates\Exec - Anl\TDIC CA PL GL Rate Study 12312010Tri_746/29/2011 9:42 PM

Exhibit 14Appendix D
Sheet 1
THE DENTISTS INSURANCE COMPANY
Professional Liability - Including Catastrophe Claims
Development of Ultimate Claim CountsBased on Closed Claims with Payment
California
Claims Closed Development ProjectedReport with Payment Factor to UltimateYear at 12/31/10 Ultimate Claim Counts(1) (2) (3) (4)
1984 184 1.000 1841985 355 1.000 3551986 339 1.001 3391987 425 1.001 4251988 478 1.001 4781989 422 1.001 4221990 420 1.001 4201991 436 1.001 4361992 422 1.001 4221993 413 1.002 4141994 406 1.003 4071995 432 1.005 4341996 347 1.006 3481997 384 1.007 3871998 382 1.008 3851999 325 1.009 3272000 356 1.009 3592001 330 1.009 3332002 341 1.009 3442003 356 1.010 3602004 299 1.013 3032005 286 1.017 2912006 302 1.020 3082007 298 1.041 3102008 324 1.122 3632009 224 1.495 3352010 80 3.896 312
Total 9,361 9,801
Notes:(2),(3) Exhibit 14, Appendix D, Sheet 2.
(4) = (2) x (3).
V:\The Dentists Insurance Co - 114833\11\RCS\187656 - CA Rates\Exec - Anl\TDIC CA PL GL Rate Study 12312010A.D.16/29/2011 9:42 PM
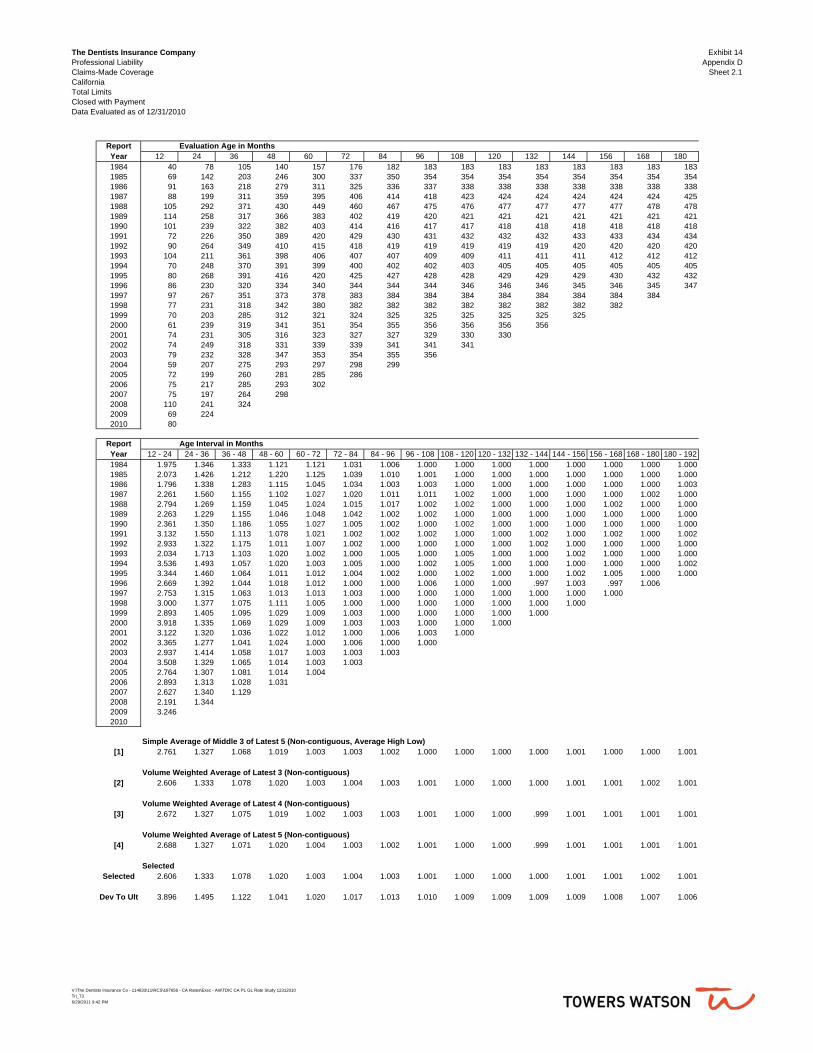
The Dentists Insurance CompanyProfessional LiabilityClaims-Made CoverageCaliforniaTotal LimitsClosed with PaymentData Evaluated as of 12/31/2010
Exhibit 14Appendix D
Sheet 2.1
Report Evaluation Age in MonthsYear 12 24 36 48 60 72 84 96 108 120 132 144 156 168 1801984 40 78 105 140 157 176 182 183 183 183 183 183 183 183 1831985 69 142 203 246 300 337 350 354 354 354 354 354 354 354 3541986 91 163 218 279 311 325 336 337 338 338 338 338 338 338 3381987 88 199 311 359 395 406 414 418 423 424 424 424 424 424 4251988 105 292 371 430 449 460 467 475 476 477 477 477 477 478 4781989 114 258 317 366 383 402 419 420 421 421 421 421 421 421 4211990 101 239 322 382 403 414 416 417 417 418 418 418 418 418 4181991 72 226 350 389 420 429 430 431 432 432 432 433 433 434 4341992 90 264 349 410 415 418 419 419 419 419 419 420 420 420 4201993 104 211 361 398 406 407 407 409 409 411 411 411 412 412 4121994 70 248 370 391 399 400 402 402 403 405 405 405 405 405 4051995 80 268 391 416 420 425 427 428 428 429 429 429 430 432 4321996 86 230 320 334 340 344 344 344 346 346 346 345 346 345 3471997 97 267 351 373 378 383 384 384 384 384 384 384 384 3841998 77 231 318 342 380 382 382 382 382 382 382 382 3821999 70 203 285 312 321 324 325 325 325 325 325 3252000 61 239 319 341 351 354 355 356 356 356 3562001 74 231 305 316 323 327 327 329 330 3302002 74 249 318 331 339 339 341 341 3412003 79 232 328 347 353 354 355 3562004 59 207 275 293 297 298 2992005 72 199 260 281 285 2862006 75 217 285 293 3022007 75 197 264 2982008 110 241 3242009 69 2242010 80
Report Age Interval in MonthsYear 12 - 24 24 - 36 36 - 48 48 - 60 60 - 72 72 - 84 84 - 96 96 - 108 108 - 120 120 - 132 132 - 144 144 - 156 156 - 168 168 - 180 180 - 1921984 1.975 1.346 1.333 1.121 1.121 1.031 1.006 1.000 1.000 1.000 1.000 1.000 1.000 1.000 1.0001985 2.073 1.426 1.212 1.220 1.125 1.039 1.010 1.001 1.000 1.000 1.000 1.000 1.000 1.000 1.0001986 1.796 1.338 1.283 1.115 1.045 1.034 1.003 1.003 1.000 1.000 1.000 1.000 1.000 1.000 1.0031987 2.261 1.560 1.155 1.102 1.027 1.020 1.011 1.011 1.002 1.000 1.000 1.000 1.000 1.002 1.0001988 2.794 1.269 1.159 1.045 1.024 1.015 1.017 1.002 1.002 1.000 1.000 1.000 1.002 1.000 1.0001989 2.263 1.229 1.155 1.046 1.048 1.042 1.002 1.002 1.000 1.000 1.000 1.000 1.000 1.000 1.0001990 2.361 1.350 1.186 1.055 1.027 1.005 1.002 1.000 1.002 1.000 1.000 1.000 1.000 1.000 1.0001991 3.132 1.550 1.113 1.078 1.021 1.002 1.002 1.002 1.000 1.000 1.002 1.000 1.002 1.000 1.0021992 2.933 1.322 1.175 1.011 1.007 1.002 1.000 1.000 1.000 1.000 1.002 1.000 1.000 1.000 1.0001993 2.034 1.713 1.103 1.020 1.002 1.000 1.005 1.000 1.005 1.000 1.000 1.002 1.000 1.000 1.0001994 3.536 1.493 1.057 1.020 1.003 1.005 1.000 1.002 1.005 1.000 1.000 1.000 1.000 1.000 1.0021995 3.344 1.460 1.064 1.011 1.012 1.004 1.002 1.000 1.002 1.000 1.000 1.002 1.005 1.000 1.0001996 2.669 1.392 1.044 1.018 1.012 1.000 1.000 1.006 1.000 1.000 .997 1.003 .997 1.0061997 2.753 1.315 1.063 1.013 1.013 1.003 1.000 1.000 1.000 1.000 1.000 1.000 1.0001998 3.000 1.377 1.075 1.111 1.005 1.000 1.000 1.000 1.000 1.000 1.000 1.0001999 2.893 1.405 1.095 1.029 1.009 1.003 1.000 1.000 1.000 1.000 1.0002000 3.918 1.335 1.069 1.029 1.009 1.003 1.003 1.000 1.000 1.0002001 3.122 1.320 1.036 1.022 1.012 1.000 1.006 1.003 1.0002002 3.365 1.277 1.041 1.024 1.000 1.006 1.000 1.0002003 2.937 1.414 1.058 1.017 1.003 1.003 1.0032004 3.508 1.329 1.065 1.014 1.003 1.0032005 2.764 1.307 1.081 1.014 1.0042006 2.893 1.313 1.028 1.0312007 2.627 1.340 1.1292008 2.191 1.3442009 3.2462010
Simple Average of Middle 3 of Latest 5 (Non-contiguous, Average High Low)[1] 2.761 1.327 1.068 1.019 1.003 1.003 1.002 1.000 1.000 1.000 1.000 1.001 1.000 1.000 1.001
Volume Weighted Average of Latest 3 (Non-contiguous)[2] 2.606 1.333 1.078 1.020 1.003 1.004 1.003 1.001 1.000 1.000 1.000 1.001 1.001 1.002 1.001
Volume Weighted Average of Latest 4 (Non-contiguous)[3] 2.672 1.327 1.075 1.019 1.002 1.003 1.003 1.001 1.000 1.000 .999 1.001 1.001 1.001 1.001
Volume Weighted Average of Latest 5 (Non-contiguous)[4] 2.688 1.327 1.071 1.020 1.004 1.003 1.002 1.001 1.000 1.000 .999 1.001 1.001 1.001 1.001
SelectedSelected 2.606 1.333 1.078 1.020 1.003 1.004 1.003 1.001 1.000 1.000 1.000 1.001 1.001 1.002 1.001
Dev To Ult 3.896 1.495 1.122 1.041 1.020 1.017 1.013 1.010 1.009 1.009 1.009 1.009 1.008 1.007 1.006
V:\The Dentists Insurance Co - 114833\11\RCS\187656 - CA Rates\Exec - Anl\TDIC CA PL GL Rate Study 12312010Tri_736/29/2011 9:42 PM
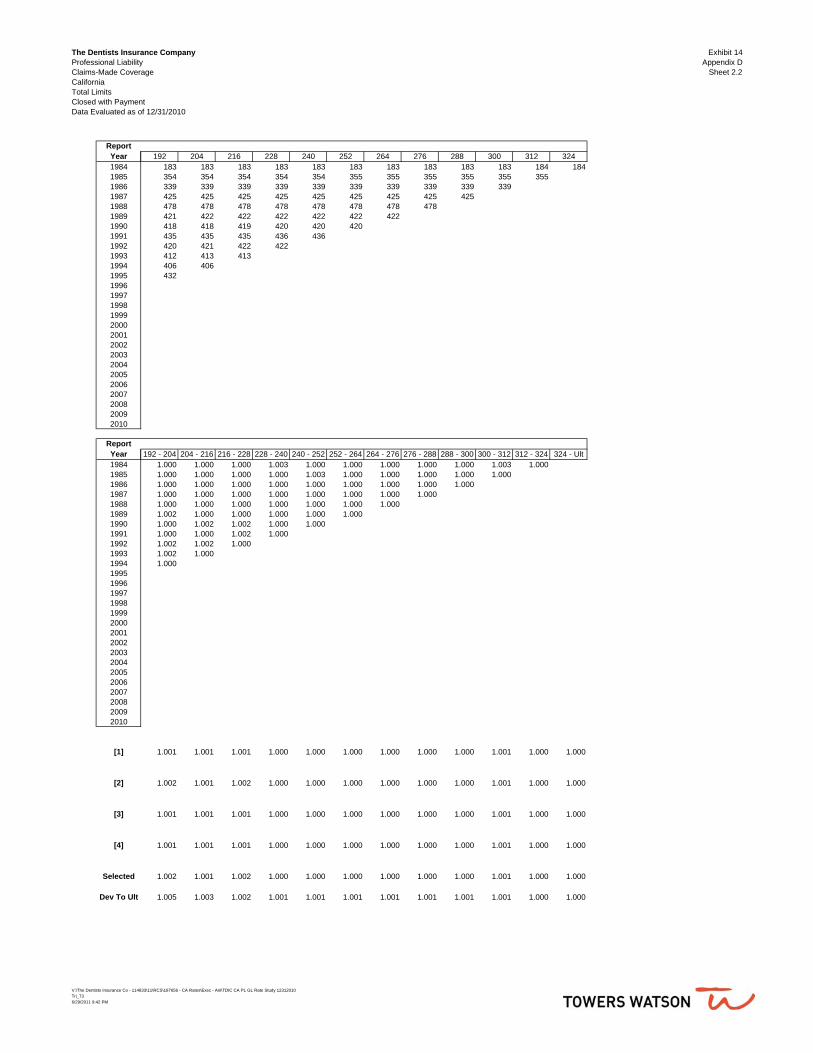
The Dentists Insurance CompanyProfessional LiabilityClaims-Made CoverageCaliforniaTotal LimitsClosed with PaymentData Evaluated as of 12/31/2010
Exhibit 14Appendix D
Sheet 2.2
ReportYear198419851986198719881989199019911992199319941995199619971998199920002001200220032004200520062007200820092010
ReportYear198419851986198719881989199019911992199319941995199619971998199920002001200220032004200520062007200820092010
[1]
[2]
[3]
[4]
Selected
Dev To Ult
192 204 216 228 240 252 264 276 288 300 312 324183 183 183 183 183 183 183 183 183 183 184 184354 354 354 354 354 355 355 355 355 355 355339 339 339 339 339 339 339 339 339 339425 425 425 425 425 425 425 425 425478 478 478 478 478 478 478 478421 422 422 422 422 422 422418 418 419 420 420 420435 435 435 436 436420 421 422 422412 413 413406 406432
192 - 204 204 - 216 216 - 228 228 - 240 240 - 252 252 - 264 264 - 276 276 - 288 288 - 300 300 - 312 312 - 324 324 - Ult1.000 1.000 1.000 1.003 1.000 1.000 1.000 1.000 1.000 1.003 1.0001.000 1.000 1.000 1.000 1.003 1.000 1.000 1.000 1.000 1.0001.000 1.000 1.000 1.000 1.000 1.000 1.000 1.000 1.0001.000 1.000 1.000 1.000 1.000 1.000 1.000 1.0001.000 1.000 1.000 1.000 1.000 1.000 1.0001.002 1.000 1.000 1.000 1.000 1.0001.000 1.002 1.002 1.000 1.0001.000 1.000 1.002 1.0001.002 1.002 1.0001.002 1.0001.000
1.001 1.001 1.001 1.000 1.000 1.000 1.000 1.000 1.000 1.001 1.000 1.000
1.002 1.001 1.002 1.000 1.000 1.000 1.000 1.000 1.000 1.001 1.000 1.000
1.001 1.001 1.001 1.000 1.000 1.000 1.000 1.000 1.000 1.001 1.000 1.000
1.001 1.001 1.001 1.000 1.000 1.000 1.000 1.000 1.000 1.001 1.000 1.000
1.002 1.001 1.002 1.000 1.000 1.000 1.000 1.000 1.000 1.001 1.000 1.000
1.005 1.003 1.002 1.001 1.001 1.001 1.001 1.001 1.001 1.001 1.000 1.000
V:\The Dentists Insurance Co - 114833\11\RCS\187656 - CA Rates\Exec - Anl\TDIC CA PL GL Rate Study 12312010Tri_736/29/2011 9:42 PM
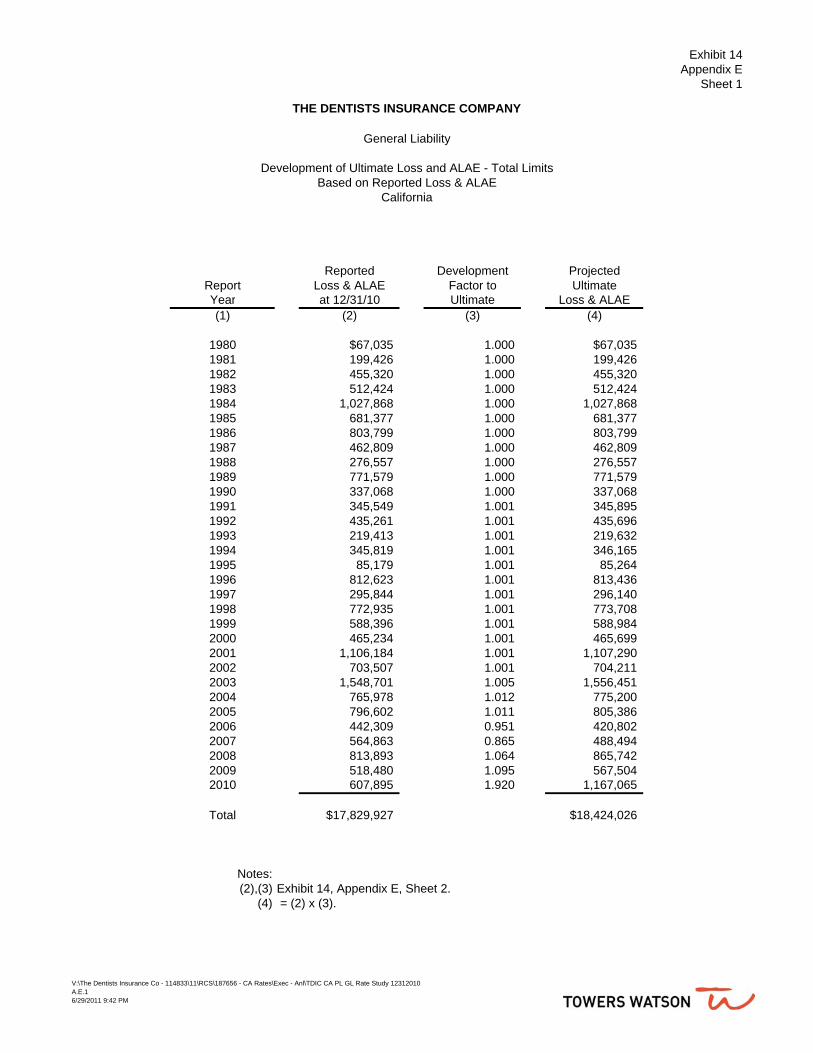
Exhibit 14Appendix E
Sheet 1
THE DENTISTS INSURANCE COMPANY
General Liability
Development of Ultimate Loss and ALAE - Total LimitsBased on Reported Loss & ALAE
California
Reported Development ProjectedReport Loss & ALAE Factor to UltimateYear at 12/31/10 Ultimate Loss & ALAE(1) (2) (3) (4)
1980 $67,035 1.000 $67,0351981 199,426 1.000 199,4261982 455,320 1.000 455,3201983 512,424 1.000 512,4241984 1,027,868 1.000 1,027,8681985 681,377 1.000 681,3771986 803,799 1.000 803,7991987 462,809 1.000 462,8091988 276,557 1.000 276,5571989 771,579 1.000 771,5791990 337,068 1.000 337,0681991 345,549 1.001 345,8951992 435,261 1.001 435,6961993 219,413 1.001 219,6321994 345,819 1.001 346,1651995 85,179 1.001 85,2641996 812,623 1.001 813,4361997 295,844 1.001 296,1401998 772,935 1.001 773,7081999 588,396 1.001 588,9842000 465,234 1.001 465,6992001 1,106,184 1.001 1,107,2902002 703,507 1.001 704,2112003 1,548,701 1.005 1,556,4512004 765,978 1.012 775,2002005 796,602 1.011 805,3862006 442,309 0.951 420,8022007 564,863 0.865 488,4942008 813,893 1.064 865,7422009 518,480 1.095 567,5042010 607,895 1.920 1,167,065
Total $17,829,927 $18,424,026
Notes:(2),(3) Exhibit 14, Appendix E, Sheet 2.
(4) = (2) x (3).
V:\The Dentists Insurance Co - 114833\11\RCS\187656 - CA Rates\Exec - Anl\TDIC CA PL GL Rate Study 12312010A.E.16/29/2011 9:42 PM

The Dentists Insurance CompanyGeneral LiabilityAll CoveragesCaliforniaTotal LimitsReported Loss & ALAEData Evaluated as of 12/31/2010
Exhibit 14Appendix E
Sheet 2.1
Accident Evaluation Age in MonthsYear 12 24 36 48 60 72 84 96 108 120 132 144 156 168 180 192 2041980 67,119 67,119 67,119 67,119 67,119 67,119 67,119 67,119 67,119 67,119 67,119 67,119 67,1191981 151,527 156,356 200,839 199,526 199,526 199,526 199,526 199,526 199,526 199,526 199,526 199,526 199,526 199,5261982 393,908 419,597 455,686 465,946 453,657 457,898 454,198 454,198 454,198 454,198 454,198 454,198 454,198 454,198 454,1981983 331,240 407,447 526,855 587,701 584,223 512,383 512,383 512,383 512,383 512,383 512,383 512,383 512,383 512,383 512,383 512,3831984 345,881 422,466 614,216 889,523 1,034,011 1,105,306 1,033,610 1,034,226 1,028,507 1,027,868 1,027,868 1,027,868 1,027,868 1,027,868 1,027,868 1,027,868 1,027,8681985 249,137 570,775 698,499 704,462 716,823 681,414 681,310 681,310 681,310 681,310 681,310 681,310 681,310 681,310 681,310 681,310 681,3101986 279,416 484,521 617,999 814,635 934,530 880,335 871,999 839,512 839,512 839,511 802,995 802,995 802,995 802,995 802,995 803,799 803,7991987 226,179 368,114 430,915 447,882 421,768 442,863 441,725 442,724 442,593 472,593 462,606 462,606 462,606 462,606 462,606 462,606 462,6061988 217,037 252,549 261,924 285,344 275,807 275,807 275,807 275,807 275,807 275,807 275,807 276,557 276,557 276,557 276,557 276,557 276,5571989 298,716 480,062 690,401 802,268 823,395 795,204 795,204 771,672 771,672 771,579 771,579 771,579 771,579 771,579 771,579 771,579 771,5791990 210,770 392,749 327,372 310,342 409,940 331,557 329,057 331,557 331,557 337,972 331,557 333,536 333,536 333,536 333,536 335,363 335,3631991 266,212 342,568 398,530 331,343 341,616 341,616 341,616 341,616 342,642 342,642 344,873 344,873 344,873 344,873 344,873 344,873 345,5491992 185,508 315,993 230,317 259,326 233,608 233,608 408,608 434,106 434,106 434,106 434,106 434,106 434,106 434,106 435,261 435,261 435,2611993 158,331 361,786 269,697 237,612 232,541 219,413 219,413 219,413 219,413 219,413 219,413 219,413 219,413 219,413 219,413 219,413 219,4131994 181,457 317,549 332,039 311,365 284,499 282,099 303,099 345,819 345,819 345,819 345,819 345,819 345,819 345,819 345,819 345,819 345,8191995 49,383 131,976 98,903 98,903 84,354 85,179 85,179 85,179 85,179 85,179 85,179 85,179 85,179 85,179 85,179 85,1791996 109,963 151,170 480,588 395,538 396,538 910,538 812,566 812,566 812,623 812,623 812,623 812,623 812,623 812,623 812,6231997 299,162 302,904 295,030 264,170 294,170 309,170 309,170 295,235 295,235 295,235 295,235 295,844 295,844 295,8441998 484,289 594,664 842,653 777,564 772,935 772,935 772,935 772,935 772,935 772,935 772,935 772,935 772,9351999 257,857 383,343 465,705 588,071 588,396 588,396 588,396 588,396 588,396 588,396 588,396 588,3962000 290,044 316,591 458,152 463,531 465,234 465,234 466,234 465,234 465,234 465,234 465,2342001 296,177 568,177 1,384,691 1,203,986 1,041,486 1,065,276 1,072,233 1,096,745 1,106,184 1,106,1842002 277,087 398,175 510,519 535,886 570,885 704,002 703,507 703,507 703,5072003 529,917 748,604 1,204,754 1,606,514 1,645,793 1,551,611 1,548,701 1,548,7012004 396,610 789,723 838,880 921,995 871,099 765,355 765,9782005 181,218 484,155 544,732 957,354 792,425 796,6022006 325,149 435,728 537,689 438,455 442,3092007 310,909 620,470 511,922 564,8632008 395,627 755,445 813,8932009 373,801 518,4802010 607,895
Accident Age Interval in MonthsYear 12 - 24 24 - 36 36 - 48 48 - 60 60 - 72 72 - 84 84 - 96 96 - 108 108 - 120 120 - 132 132 - 144 144 - 156 156 - 168 168 - 180 180 - 192 192 - 204 204 - 2161980 1.000 1.000 1.000 1.000 1.000 1.000 1.000 1.000 1.000 1.000 1.000 1.000 1.0001981 1.032 1.284 .993 1.000 1.000 1.000 1.000 1.000 1.000 1.000 1.000 1.000 1.000 1.0001982 1.065 1.086 1.023 .974 1.009 .992 1.000 1.000 1.000 1.000 1.000 1.000 1.000 1.000 1.0021983 1.230 1.293 1.115 .994 .877 1.000 1.000 1.000 1.000 1.000 1.000 1.000 1.000 1.000 1.000 1.0001984 1.221 1.454 1.448 1.162 1.069 .935 1.001 .994 .999 1.000 1.000 1.000 1.000 1.000 1.000 1.000 1.0001985 2.291 1.224 1.009 1.018 .951 1.000 1.000 1.000 1.000 1.000 1.000 1.000 1.000 1.000 1.000 1.000 1.0001986 1.734 1.275 1.318 1.147 .942 .991 .963 1.000 1.000 .957 1.000 1.000 1.000 1.000 1.001 1.000 1.0001987 1.628 1.171 1.039 .942 1.050 .997 1.002 1.000 1.068 .979 1.000 1.000 1.000 1.000 1.000 1.000 1.0001988 1.164 1.037 1.089 .967 1.000 1.000 1.000 1.000 1.000 1.000 1.003 1.000 1.000 1.000 1.000 1.000 1.0001989 1.607 1.438 1.162 1.026 .966 1.000 .970 1.000 1.000 1.000 1.000 1.000 1.000 1.000 1.000 1.000 1.0001990 1.863 .834 .948 1.321 .809 .992 1.008 1.000 1.019 .981 1.006 1.000 1.000 1.000 1.005 1.000 1.0001991 1.287 1.163 .831 1.031 1.000 1.000 1.000 1.003 1.000 1.007 1.000 1.000 1.000 1.000 1.000 1.002 1.0001992 1.703 .729 1.126 .901 1.000 1.749 1.062 1.000 1.000 1.000 1.000 1.000 1.000 1.003 1.000 1.000 1.0001993 2.285 .745 .881 .979 .944 1.000 1.000 1.000 1.000 1.000 1.000 1.000 1.000 1.000 1.000 1.000 1.0001994 1.750 1.046 .938 .914 .992 1.074 1.141 1.000 1.000 1.000 1.000 1.000 1.000 1.000 1.000 1.0001995 2.672 .749 1.000 .853 1.010 1.000 1.000 1.000 1.000 1.000 1.000 1.000 1.000 1.000 1.0001996 1.375 3.179 .823 1.003 2.296 .892 1.000 1.000 1.000 1.000 1.000 1.000 1.000 1.0001997 1.013 .974 .895 1.114 1.051 1.000 .955 1.000 1.000 1.000 1.002 1.000 1.0001998 1.228 1.417 .923 .994 1.000 1.000 1.000 1.000 1.000 1.000 1.000 1.0001999 1.487 1.215 1.263 1.001 1.000 1.000 1.000 1.000 1.000 1.000 1.0002000 1.092 1.447 1.012 1.004 1.000 1.002 .998 1.000 1.000 1.0002001 1.918 2.437 .869 .865 1.023 1.007 1.023 1.009 1.0002002 1.437 1.282 1.050 1.065 1.233 .999 1.000 1.0002003 1.413 1.609 1.333 1.024 .943 .998 1.0002004 1.991 1.062 1.099 .945 .879 1.0012005 2.672 1.125 1.757 .828 1.0052006 1.340 1.234 .815 1.0092007 1.996 .825 1.1032008 1.909 1.0772009 1.3872010
Simple Average of Middle 3 of Latest 5 (Non-contiguous, Average High Low)[1] 1.764 1.088 1.179 .993 .990 1.001 1.000 1.000 1.000 1.000 1.000 1.000 1.000 1.000 1.000 1.000 1.000
Volume Weighted Average of Latest 3 (Non-contiguous)[2] 1.754 1.029 1.230 .909 .941 .999 1.007 1.004 1.000 1.000 1.000 1.000 1.000 1.000 1.000 1.000 1.000
Volume Weighted Average of Latest 4 (Non-contiguous)[3] 1.658 1.049 1.185 .956 .984 1.001 1.006 1.003 1.000 1.000 1.000 1.000 1.000 1.000 1.000 1.001 1.000
Volume Weighted Average of Latest 5 (Non-contiguous)[4] 1.774 1.052 1.234 .969 .992 1.001 1.005 1.003 1.000 1.000 1.000 1.000 1.000 1.001 1.000 1.000 1.000
SelectedSelected 1.754 1.029 1.230 .909 .941 .999 1.007 1.004 1.000 1.000 1.000 1.000 1.000 1.000 1.000 1.000 1.000
Dev To Ult 1.920 1.095 1.064 .865 .951 1.011 1.012 1.005 1.001 1.001 1.001 1.001 1.001 1.001 1.001 1.001 1.001
V:\The Dentists Insurance Co - 114833\11\RCS\187656 - CA Rates\Exec - Anl\TDIC CA PL GL Rate Study 12312010Tri_16/29/2011 9:42 PM

The Dentists Insurance CompanyGeneral LiabilityAll CoveragesCaliforniaTotal LimitsReported Loss & ALAEData Evaluated as of 12/31/2010
Exhibit 14Appendix E
Sheet 2.2
AccidentYear1980198119821983198419851986198719881989199019911992199319941995199619971998199920002001200220032004200520062007200820092010
AccidentYear1980198119821983198419851986198719881989199019911992199319941995199619971998199920002001200220032004200520062007200820092010
[1]
[2]
[3]
[4]
Selected
Dev To Ult
216 228 240 252 264 276 288 300 312 324 336 348 360 37267,119 67,119 67,119 67,119 67,119 67,119 67,119 67,119 67,035 67,035 67,035 67,035 67,035 67,035
199,526 199,526 199,526 199,526 199,526 199,526 199,526 199,376 199,376 199,376 199,376 199,426 199,426454,885 454,885 455,320 455,320 455,320 455,320 455,320 455,320 455,320 455,320 455,320 455,320512,383 512,383 512,383 512,383 512,383 512,383 512,383 512,383 512,383 512,383 512,424
1,027,868 1,027,868 1,027,868 1,027,868 1,027,868 1,027,868 1,027,868 1,027,868 1,027,868 1,027,868681,377 681,377 681,377 681,377 681,377 681,377 681,377 681,377 681,377803,799 803,799 803,799 803,799 803,799 803,799 803,799 803,799462,606 462,809 462,809 462,809 462,809 462,809 462,809276,557 276,557 276,557 276,557 276,557 276,557771,579 771,579 771,579 771,579 771,579335,363 335,363 335,363 337,068345,549 345,549 345,549435,261 435,261219,413
216 - 228 228 - 240 240 - 252 252 - 264 264 - 276 276 - 288 288 - 300 300 - 312 312 - 324 324 - 336 336 - 348 348 - 360 360 - 372 372 - Ult1.000 1.000 1.000 1.000 1.000 1.000 1.000 .999 1.000 1.000 1.000 1.000 1.0001.000 1.000 1.000 1.000 1.000 1.000 .999 1.000 1.000 1.000 1.000 1.0001.000 1.001 1.000 1.000 1.000 1.000 1.000 1.000 1.000 1.000 1.0001.000 1.000 1.000 1.000 1.000 1.000 1.000 1.000 1.000 1.0001.000 1.000 1.000 1.000 1.000 1.000 1.000 1.000 1.0001.000 1.000 1.000 1.000 1.000 1.000 1.000 1.0001.000 1.000 1.000 1.000 1.000 1.000 1.0001.000 1.000 1.000 1.000 1.000 1.0001.000 1.000 1.000 1.000 1.0001.000 1.000 1.000 1.0001.000 1.000 1.0051.000 1.0001.000
1.000 1.000 1.000 1.000 1.000 1.000 1.000 1.000 1.000 1.000 1.000 1.000 1.000 1.000
1.000 1.000 1.001 1.000 1.000 1.000 1.000 1.000 1.000 1.000 1.000 1.000 1.000 1.000
1.000 1.000 1.001 1.000 1.000 1.000 1.000 1.000 1.000 1.000 1.000 1.000 1.000 1.000
1.000 1.000 1.001 1.000 1.000 1.000 1.000 1.000 1.000 1.000 1.000 1.000 1.000 1.000
1.000 1.000 1.001 1.000 1.000 1.000 1.000 1.000 1.000 1.000 1.000 1.000 1.000 1.000
1.001 1.001 1.001 1.000 1.000 1.000 1.000 1.000 1.000 1.000 1.000 1.000 1.000 1.000
V:\The Dentists Insurance Co - 114833\11\RCS\187656 - CA Rates\Exec - Anl\TDIC CA PL GL Rate Study 12312010Tri_16/29/2011 9:42 PM

Exhibit 14Appendix F
Sheet 1
THE DENTISTS INSURANCE COMPANY
General Liability
Development of Ultimate Loss and ALAE - Total LimitsBased on Paid Loss & ALAE
California
Paid Development ProjectedReport Loss & ALAE Factor to UltimateYear at 12/31/10 Ultimate Loss & ALAE(1) (2) (3) (4)
1980 $67,035 1.000 $67,0351981 199,426 1.000 199,4261982 455,320 1.000 455,3201983 512,424 1.000 512,4241984 1,027,868 1.000 1,027,8681985 681,377 1.000 681,3771986 803,799 1.000 803,7991987 462,809 1.000 462,8091988 276,557 1.000 276,5571989 771,579 1.000 771,5791990 337,068 1.000 337,0681991 345,549 1.001 345,8951992 435,261 1.001 435,6961993 219,413 1.001 219,6321994 345,819 1.001 346,1651995 85,179 1.001 85,2641996 812,623 1.001 813,4361997 295,844 1.001 296,1401998 772,935 1.001 773,7081999 588,396 1.001 588,9842000 465,234 1.001 465,6992001 1,106,184 1.001 1,107,2902002 703,507 1.001 704,2112003 1,548,701 1.013 1,568,8532004 765,978 1.017 779,0492005 796,602 1.036 825,5892006 422,608 1.053 444,9942007 546,442 1.306 713,4802008 742,615 1.892 1,404,9792009 346,058 2.751 951,9622010 175,980 6.553 1,153,123
Total $17,116,190 $19,619,411
Notes:(2),(3) Exhibit 14, Appendix F, Sheet 2.
(4) = (2) x (3).
V:\The Dentists Insurance Co - 114833\11\RCS\187656 - CA Rates\Exec - Anl\TDIC CA PL GL Rate Study 12312010A.F.16/29/2011 9:42 PM
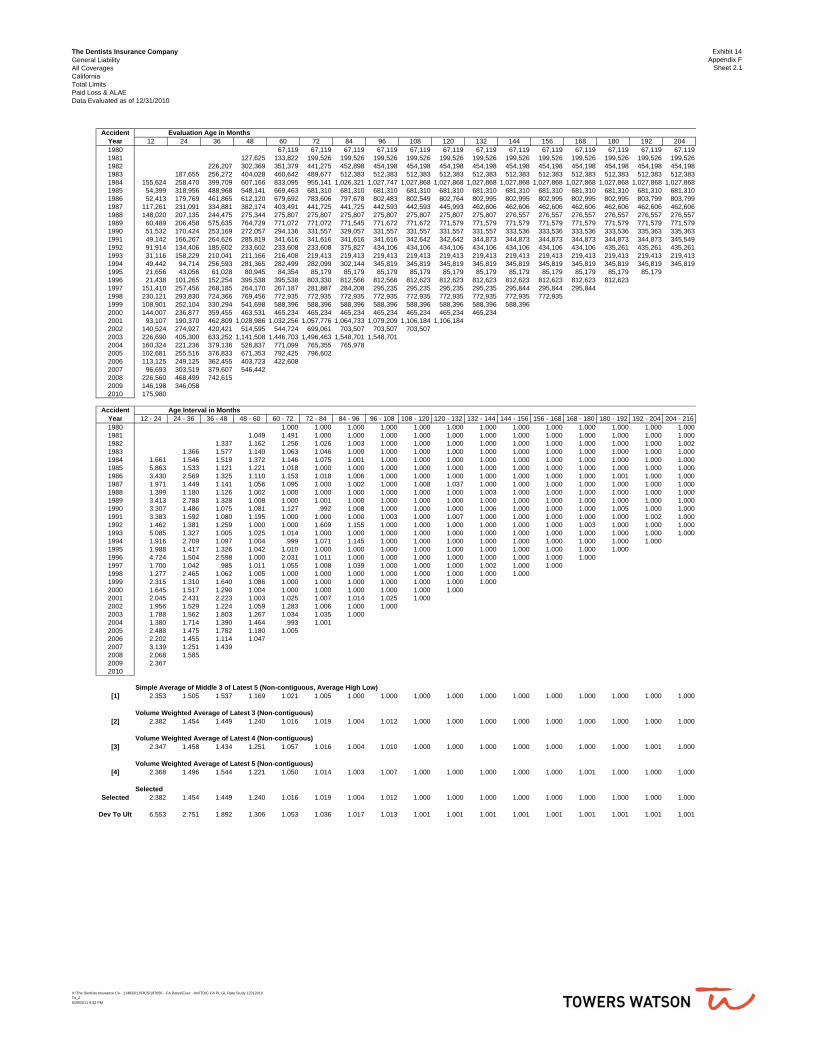
The Dentists Insurance CompanyGeneral LiabilityAll CoveragesCaliforniaTotal LimitsPaid Loss & ALAEData Evaluated as of 12/31/2010
Exhibit 14Appendix F
Sheet 2.1
Accident Evaluation Age in MonthsYear 12 24 36 48 60 72 84 96 108 120 132 144 156 168 180 192 2041980 67,119 67,119 67,119 67,119 67,119 67,119 67,119 67,119 67,119 67,119 67,119 67,119 67,1191981 127,625 133,822 199,526 199,526 199,526 199,526 199,526 199,526 199,526 199,526 199,526 199,526 199,526 199,5261982 226,207 302,369 351,379 441,275 452,898 454,198 454,198 454,198 454,198 454,198 454,198 454,198 454,198 454,198 454,1981983 187,655 256,272 404,028 460,642 489,677 512,383 512,383 512,383 512,383 512,383 512,383 512,383 512,383 512,383 512,383 512,3831984 155,624 258,470 399,709 607,166 833,095 955,141 1,026,321 1,027,747 1,027,868 1,027,868 1,027,868 1,027,868 1,027,868 1,027,868 1,027,868 1,027,868 1,027,8681985 54,399 318,956 488,968 548,141 669,463 681,310 681,310 681,310 681,310 681,310 681,310 681,310 681,310 681,310 681,310 681,310 681,3101986 52,413 179,769 461,865 612,120 679,692 783,606 797,678 802,483 802,549 802,764 802,995 802,995 802,995 802,995 802,995 803,799 803,7991987 117,261 231,091 334,881 382,174 403,491 441,725 441,725 442,593 442,593 445,993 462,606 462,606 462,606 462,606 462,606 462,606 462,6061988 148,020 207,135 244,475 275,344 275,807 275,807 275,807 275,807 275,807 275,807 275,807 276,557 276,557 276,557 276,557 276,557 276,5571989 60,489 206,458 575,635 764,729 771,072 771,072 771,545 771,672 771,672 771,579 771,579 771,579 771,579 771,579 771,579 771,579 771,5791990 51,532 170,424 253,169 272,057 294,136 331,557 329,057 331,557 331,557 331,557 331,557 333,536 333,536 333,536 333,536 335,363 335,3631991 49,142 166,267 264,626 285,819 341,616 341,616 341,616 341,616 342,642 342,642 344,873 344,873 344,873 344,873 344,873 344,873 345,5491992 91,914 134,406 185,602 233,602 233,608 233,608 375,827 434,106 434,106 434,106 434,106 434,106 434,106 434,106 435,261 435,261 435,2611993 31,116 158,229 210,041 211,166 216,408 219,413 219,413 219,413 219,413 219,413 219,413 219,413 219,413 219,413 219,413 219,413 219,4131994 49,442 94,714 256,593 281,365 282,499 282,099 302,144 345,819 345,819 345,819 345,819 345,819 345,819 345,819 345,819 345,819 345,8191995 21,656 43,056 61,028 80,945 84,354 85,179 85,179 85,179 85,179 85,179 85,179 85,179 85,179 85,179 85,179 85,1791996 21,438 101,265 152,254 395,538 395,538 803,330 812,566 812,566 812,623 812,623 812,623 812,623 812,623 812,623 812,6231997 151,410 257,456 268,185 264,170 267,187 281,887 284,208 295,235 295,235 295,235 295,235 295,844 295,844 295,8441998 230,121 293,830 724,366 769,456 772,935 772,935 772,935 772,935 772,935 772,935 772,935 772,935 772,9351999 108,901 252,104 330,294 541,698 588,396 588,396 588,396 588,396 588,396 588,396 588,396 588,3962000 144,007 236,877 359,455 463,531 465,234 465,234 465,234 465,234 465,234 465,234 465,2342001 93,107 190,370 462,809 1,028,986 1,032,256 1,057,776 1,064,733 1,079,209 1,106,184 1,106,1842002 140,524 274,927 420,421 514,595 544,724 699,061 703,507 703,507 703,5072003 226,690 405,300 633,252 1,141,508 1,446,703 1,496,463 1,548,701 1,548,7012004 160,324 221,236 379,136 526,837 771,099 765,355 765,9782005 102,681 255,516 376,833 671,353 792,425 796,6022006 113,125 249,125 362,455 403,723 422,6082007 96,693 303,519 379,607 546,4422008 226,560 468,499 742,6152009 146,198 346,0582010 175,980
Accident Age Interval in MonthsYear 12 - 24 24 - 36 36 - 48 48 - 60 60 - 72 72 - 84 84 - 96 96 - 108 108 - 120 120 - 132 132 - 144 144 - 156 156 - 168 168 - 180 180 - 192 192 - 204 204 - 2161980 1.000 1.000 1.000 1.000 1.000 1.000 1.000 1.000 1.000 1.000 1.000 1.000 1.0001981 1.049 1.491 1.000 1.000 1.000 1.000 1.000 1.000 1.000 1.000 1.000 1.000 1.000 1.0001982 1.337 1.162 1.256 1.026 1.003 1.000 1.000 1.000 1.000 1.000 1.000 1.000 1.000 1.000 1.0021983 1.366 1.577 1.140 1.063 1.046 1.000 1.000 1.000 1.000 1.000 1.000 1.000 1.000 1.000 1.000 1.0001984 1.661 1.546 1.519 1.372 1.146 1.075 1.001 1.000 1.000 1.000 1.000 1.000 1.000 1.000 1.000 1.000 1.0001985 5.863 1.533 1.121 1.221 1.018 1.000 1.000 1.000 1.000 1.000 1.000 1.000 1.000 1.000 1.000 1.000 1.0001986 3.430 2.569 1.325 1.110 1.153 1.018 1.006 1.000 1.000 1.000 1.000 1.000 1.000 1.000 1.001 1.000 1.0001987 1.971 1.449 1.141 1.056 1.095 1.000 1.002 1.000 1.008 1.037 1.000 1.000 1.000 1.000 1.000 1.000 1.0001988 1.399 1.180 1.126 1.002 1.000 1.000 1.000 1.000 1.000 1.000 1.003 1.000 1.000 1.000 1.000 1.000 1.0001989 3.413 2.788 1.328 1.008 1.000 1.001 1.000 1.000 1.000 1.000 1.000 1.000 1.000 1.000 1.000 1.000 1.0001990 3.307 1.486 1.075 1.081 1.127 .992 1.008 1.000 1.000 1.000 1.006 1.000 1.000 1.000 1.005 1.000 1.0001991 3.383 1.592 1.080 1.195 1.000 1.000 1.000 1.003 1.000 1.007 1.000 1.000 1.000 1.000 1.000 1.002 1.0001992 1.462 1.381 1.259 1.000 1.000 1.609 1.155 1.000 1.000 1.000 1.000 1.000 1.000 1.003 1.000 1.000 1.0001993 5.085 1.327 1.005 1.025 1.014 1.000 1.000 1.000 1.000 1.000 1.000 1.000 1.000 1.000 1.000 1.000 1.0001994 1.916 2.709 1.097 1.004 .999 1.071 1.145 1.000 1.000 1.000 1.000 1.000 1.000 1.000 1.000 1.0001995 1.988 1.417 1.326 1.042 1.010 1.000 1.000 1.000 1.000 1.000 1.000 1.000 1.000 1.000 1.0001996 4.724 1.504 2.598 1.000 2.031 1.011 1.000 1.000 1.000 1.000 1.000 1.000 1.000 1.0001997 1.700 1.042 .985 1.011 1.055 1.008 1.039 1.000 1.000 1.000 1.002 1.000 1.0001998 1.277 2.465 1.062 1.005 1.000 1.000 1.000 1.000 1.000 1.000 1.000 1.0001999 2.315 1.310 1.640 1.086 1.000 1.000 1.000 1.000 1.000 1.000 1.0002000 1.645 1.517 1.290 1.004 1.000 1.000 1.000 1.000 1.000 1.0002001 2.045 2.431 2.223 1.003 1.025 1.007 1.014 1.025 1.0002002 1.956 1.529 1.224 1.059 1.283 1.006 1.000 1.0002003 1.788 1.562 1.803 1.267 1.034 1.035 1.0002004 1.380 1.714 1.390 1.464 .993 1.0012005 2.488 1.475 1.782 1.180 1.0052006 2.202 1.455 1.114 1.0472007 3.139 1.251 1.4392008 2.068 1.5852009 2.3672010
Simple Average of Middle 3 of Latest 5 (Non-contiguous, Average High Low)[1] 2.353 1.505 1.537 1.169 1.021 1.005 1.000 1.000 1.000 1.000 1.000 1.000 1.000 1.000 1.000 1.000 1.000
Volume Weighted Average of Latest 3 (Non-contiguous)[2] 2.382 1.454 1.449 1.240 1.016 1.019 1.004 1.012 1.000 1.000 1.000 1.000 1.000 1.000 1.000 1.000 1.000
Volume Weighted Average of Latest 4 (Non-contiguous)[3] 2.347 1.458 1.434 1.251 1.057 1.016 1.004 1.010 1.000 1.000 1.000 1.000 1.000 1.000 1.000 1.001 1.000
Volume Weighted Average of Latest 5 (Non-contiguous)[4] 2.368 1.496 1.544 1.221 1.050 1.014 1.003 1.007 1.000 1.000 1.000 1.000 1.000 1.001 1.000 1.000 1.000
SelectedSelected 2.382 1.454 1.449 1.240 1.016 1.019 1.004 1.012 1.000 1.000 1.000 1.000 1.000 1.000 1.000 1.000 1.000
Dev To Ult 6.553 2.751 1.892 1.306 1.053 1.036 1.017 1.013 1.001 1.001 1.001 1.001 1.001 1.001 1.001 1.001 1.001
V:\The Dentists Insurance Co - 114833\11\RCS\187656 - CA Rates\Exec - Anl\TDIC CA PL GL Rate Study 12312010Tri_26/29/2011 9:42 PM
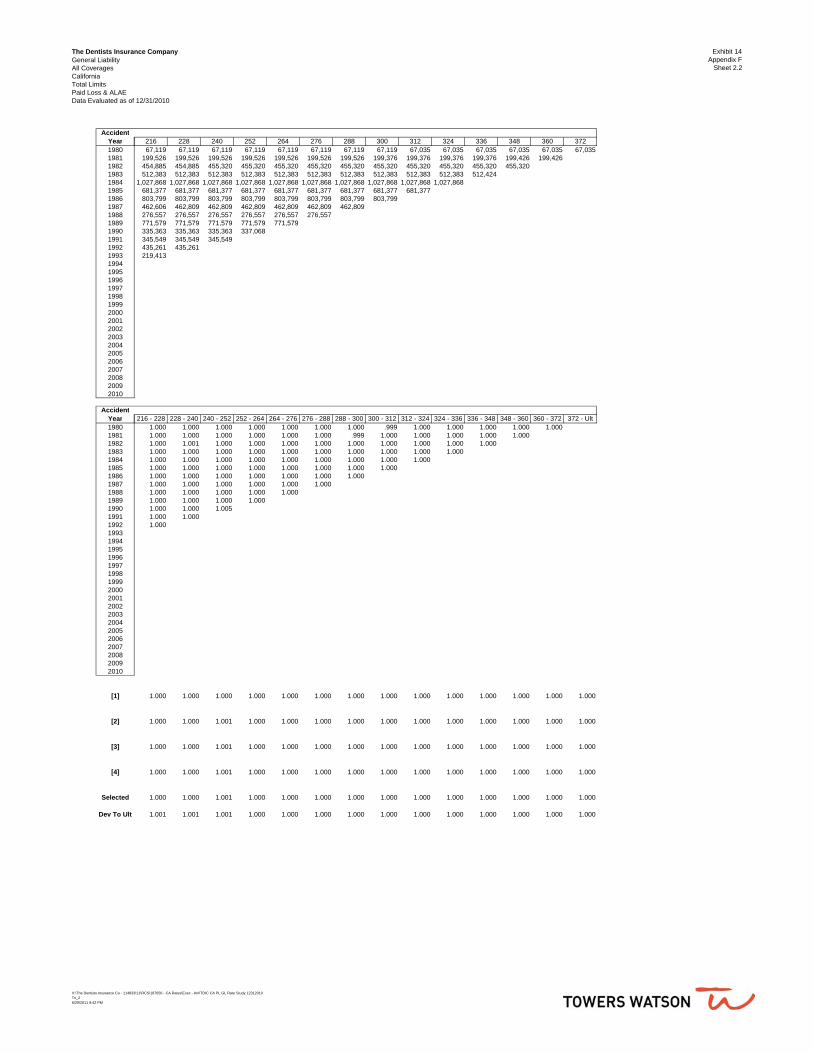
The Dentists Insurance CompanyGeneral LiabilityAll CoveragesCaliforniaTotal LimitsPaid Loss & ALAEData Evaluated as of 12/31/2010
Exhibit 14Appendix F
Sheet 2.2
AccidentYear1980198119821983198419851986198719881989199019911992199319941995199619971998199920002001200220032004200520062007200820092010
AccidentYear1980198119821983198419851986198719881989199019911992199319941995199619971998199920002001200220032004200520062007200820092010
[1]
[2]
[3]
[4]
Selected
Dev To Ult
216 228 240 252 264 276 288 300 312 324 336 348 360 37267,119 67,119 67,119 67,119 67,119 67,119 67,119 67,119 67,035 67,035 67,035 67,035 67,035 67,035
199,526 199,526 199,526 199,526 199,526 199,526 199,526 199,376 199,376 199,376 199,376 199,426 199,426454,885 454,885 455,320 455,320 455,320 455,320 455,320 455,320 455,320 455,320 455,320 455,320512,383 512,383 512,383 512,383 512,383 512,383 512,383 512,383 512,383 512,383 512,424
1,027,868 1,027,868 1,027,868 1,027,868 1,027,868 1,027,868 1,027,868 1,027,868 1,027,868 1,027,868681,377 681,377 681,377 681,377 681,377 681,377 681,377 681,377 681,377803,799 803,799 803,799 803,799 803,799 803,799 803,799 803,799462,606 462,809 462,809 462,809 462,809 462,809 462,809276,557 276,557 276,557 276,557 276,557 276,557771,579 771,579 771,579 771,579 771,579335,363 335,363 335,363 337,068345,549 345,549 345,549435,261 435,261219,413
216 - 228 228 - 240 240 - 252 252 - 264 264 - 276 276 - 288 288 - 300 300 - 312 312 - 324 324 - 336 336 - 348 348 - 360 360 - 372 372 - Ult1.000 1.000 1.000 1.000 1.000 1.000 1.000 .999 1.000 1.000 1.000 1.000 1.0001.000 1.000 1.000 1.000 1.000 1.000 .999 1.000 1.000 1.000 1.000 1.0001.000 1.001 1.000 1.000 1.000 1.000 1.000 1.000 1.000 1.000 1.0001.000 1.000 1.000 1.000 1.000 1.000 1.000 1.000 1.000 1.0001.000 1.000 1.000 1.000 1.000 1.000 1.000 1.000 1.0001.000 1.000 1.000 1.000 1.000 1.000 1.000 1.0001.000 1.000 1.000 1.000 1.000 1.000 1.0001.000 1.000 1.000 1.000 1.000 1.0001.000 1.000 1.000 1.000 1.0001.000 1.000 1.000 1.0001.000 1.000 1.0051.000 1.0001.000
1.000 1.000 1.000 1.000 1.000 1.000 1.000 1.000 1.000 1.000 1.000 1.000 1.000 1.000
1.000 1.000 1.001 1.000 1.000 1.000 1.000 1.000 1.000 1.000 1.000 1.000 1.000 1.000
1.000 1.000 1.001 1.000 1.000 1.000 1.000 1.000 1.000 1.000 1.000 1.000 1.000 1.000
1.000 1.000 1.001 1.000 1.000 1.000 1.000 1.000 1.000 1.000 1.000 1.000 1.000 1.000
1.000 1.000 1.001 1.000 1.000 1.000 1.000 1.000 1.000 1.000 1.000 1.000 1.000 1.000
1.001 1.001 1.001 1.000 1.000 1.000 1.000 1.000 1.000 1.000 1.000 1.000 1.000 1.000
V:\The Dentists Insurance Co - 114833\11\RCS\187656 - CA Rates\Exec - Anl\TDIC CA PL GL Rate Study 12312010Tri_26/29/2011 9:42 PM

Exhibit 14Appendix G
Sheet 1
THE DENTISTS INSURANCE COMPANY
Professional Liability
Development of Total Limits ILFBased on Reported Losses
California
Ratio of Development ProjectedReport Total to Basic Factor to UltimateYear at 12/31/10 Ultimate Total Limits ILF(1) (2) (3) (4)
1984 1.215 1.000 1.2151985 1.005 1.000 1.0051986 1.021 1.000 1.0211987 1.038 1.000 1.0381988 1.064 1.000 1.0641989 1.040 1.000 1.0401990 1.095 1.000 1.0951991 1.158 1.000 1.1581992 1.036 1.000 1.0361993 1.030 1.000 1.0301994 1.116 1.000 1.1161995 1.093 1.000 1.0931996 1.078 1.000 1.0781997 1.037 1.000 1.0371998 1.315 1.000 1.3151999 1.174 1.000 1.1742000 1.079 1.000 1.0792001 1.167 1.000 1.1672002 1.026 1.000 1.0262003 1.126 1.000 1.1262004 1.258 1.000 1.2582005 1.163 1.000 1.1632006 1.065 1.000 1.0652007 1.084 1.008 1.0932008 1.047 1.011 1.0592009 1.133 1.010 1.1442010 1.009 1.033 1.042
Notes:(2),(3) Exhibit 14, Appendix G, Sheet 2.
(4) = (2) x (3).
V:\The Dentists Insurance Co - 114833\11\RCS\187656 - CA Rates\Exec - Anl\TDIC CA PL GL Rate Study 12312010A.G.16/29/2011 9:42 PM

The Dentists Insurance CompanyProfessional LiabilityClaims-Made CoverageCaliforniaRatio of Total to Basic Limits Reported Loss & ALAEData Evaluated as of 12/31/2010
Exhibit 14Appendix G
Sheet 2.1
Report Evaluation Age in MonthsYear 12 24 36 48 60 72 84 96 108 120 132 144 156 168 1801984 1.032 1.301 1.238 1.231 1.204 1.215 1.219 1.221 1.221 1.215 1.215 1.215 1.215 1.215 1.2151985 1.000 1.008 1.006 1.007 1.006 1.004 1.004 1.005 1.005 1.005 1.005 1.005 1.005 1.005 1.0051986 1.054 1.033 1.019 1.068 1.068 1.038 1.038 1.021 1.021 1.021 1.021 1.021 1.021 1.021 1.0211987 1.030 1.055 1.062 1.049 1.045 1.045 1.037 1.037 1.038 1.038 1.038 1.038 1.038 1.038 1.0381988 1.000 1.000 1.070 1.030 1.058 1.049 1.069 1.064 1.064 1.065 1.065 1.065 1.065 1.065 1.0651989 1.035 1.090 1.069 1.031 1.040 1.039 1.040 1.040 1.040 1.040 1.040 1.040 1.040 1.040 1.0401990 1.076 1.063 1.090 1.104 1.107 1.097 1.098 1.098 1.098 1.096 1.096 1.096 1.096 1.096 1.0961991 1.000 1.080 1.134 1.215 1.156 1.158 1.158 1.158 1.158 1.158 1.158 1.158 1.158 1.158 1.1581992 1.011 1.042 1.047 1.051 1.051 1.036 1.036 1.036 1.036 1.036 1.036 1.036 1.036 1.036 1.0361993 1.000 1.039 1.028 1.030 1.030 1.030 1.030 1.030 1.030 1.030 1.030 1.030 1.030 1.030 1.0301994 1.129 1.143 1.141 1.126 1.116 1.116 1.116 1.116 1.116 1.116 1.116 1.116 1.116 1.116 1.1161995 1.114 1.078 1.057 1.101 1.094 1.094 1.094 1.094 1.094 1.094 1.094 1.094 1.094 1.093 1.0931996 1.038 1.103 1.071 1.066 1.078 1.078 1.078 1.078 1.078 1.078 1.078 1.078 1.078 1.078 1.0781997 1.030 1.034 1.036 1.036 1.036 1.037 1.037 1.037 1.037 1.037 1.037 1.037 1.037 1.0371998 1.197 1.238 1.275 1.291 1.313 1.313 1.315 1.315 1.315 1.315 1.315 1.315 1.3151999 1.266 1.142 1.155 1.176 1.172 1.174 1.174 1.174 1.174 1.174 1.174 1.1742000 1.077 1.076 1.072 1.077 1.077 1.078 1.078 1.079 1.079 1.079 1.0792001 1.017 1.046 1.164 1.159 1.160 1.166 1.167 1.167 1.167 1.1672002 1.044 1.036 1.025 1.025 1.026 1.026 1.026 1.026 1.0262003 1.006 1.157 1.135 1.126 1.125 1.125 1.126 1.1262004 1.152 1.118 1.095 1.259 1.258 1.257 1.2582005 1.057 1.080 1.127 1.124 1.163 1.1632006 1.007 1.056 1.072 1.075 1.0652007 1.072 1.084 1.075 1.0842008 1.037 1.056 1.0472009 1.087 1.1332010 1.009
Report Age Interval in MonthsYear 12 - 24 24 - 36 36 - 48 48 - 60 60 - 72 72 - 84 84 - 96 96 - 108 108 - 120 120 - 132 132 - 144 144 - 156 156 - 168 168 - 180 180 - 1921984 1.260 .951 .995 .978 1.009 1.003 1.001 1.000 .996 1.000 1.000 1.000 1.000 1.000 1.0001985 1.008 .998 1.001 1.000 .998 1.000 1.000 1.000 1.000 1.000 1.000 1.000 1.000 1.000 1.0001986 .980 .987 1.049 1.000 .971 1.000 .984 1.000 1.000 1.000 1.000 1.000 1.000 1.000 1.0001987 1.025 1.006 .988 .996 1.000 .992 1.001 1.000 1.000 1.000 1.000 1.000 1.000 1.000 1.0001988 1.000 1.070 .963 1.027 .992 1.019 .995 1.000 1.000 1.000 1.000 1.000 1.000 1.000 1.0001989 1.053 .981 .964 1.009 .999 1.001 1.000 1.000 1.000 1.000 1.000 1.000 1.000 1.000 1.0001990 .988 1.025 1.013 1.002 .992 1.000 1.000 1.000 .998 1.000 1.000 1.000 1.000 1.000 1.0001991 1.080 1.050 1.072 .951 1.002 1.000 1.000 1.000 1.000 1.000 1.000 1.000 1.000 1.000 1.0001992 1.030 1.005 1.004 1.000 .986 1.000 1.000 1.000 1.000 1.000 1.000 1.000 1.000 1.000 1.0001993 1.039 .990 1.002 1.000 1.000 1.000 1.000 1.000 1.000 1.000 1.000 1.000 1.000 1.000 1.0001994 1.013 .998 .986 .992 1.000 1.000 1.000 1.000 1.000 1.000 1.000 1.000 1.000 1.000 1.0001995 .968 .981 1.041 .994 1.000 1.000 1.000 1.000 1.000 1.000 1.000 1.000 .999 1.000 1.0001996 1.063 .971 .995 1.011 1.000 1.000 1.000 1.000 1.000 1.000 1.000 1.000 1.000 1.0001997 1.004 1.002 1.000 1.000 1.000 1.000 1.000 1.000 1.000 1.000 1.000 1.000 1.0001998 1.035 1.030 1.013 1.017 1.000 1.001 1.000 1.000 1.000 1.000 1.000 1.0001999 .903 1.011 1.018 .997 1.001 1.000 1.000 1.000 1.000 1.000 1.0002000 .998 .996 1.005 1.000 1.001 1.000 1.001 1.000 1.000 1.0002001 1.028 1.113 .995 1.001 1.005 1.000 1.000 1.000 1.0002002 .992 .990 1.000 1.000 1.000 1.000 1.000 1.0002003 1.150 .981 .992 1.000 1.000 1.000 1.0012004 .970 .980 1.149 .999 .999 1.0002005 1.022 1.043 .997 1.035 1.0002006 1.049 1.014 1.003 .9912007 1.010 .992 1.0092008 1.018 .9922009 1.0422010
Simple Average of Middle 3 of Latest 5 (Non-contiguous, Average High Low)[1] 1.027 .999 1.003 1.000 1.000 1.000 1.000 1.000 1.000 1.000 1.000 1.000 1.000 1.000 1.000
Simple Average of Latest 3 (Non-contiguous)[2] 1.023 .999 1.003 1.008 1.000 1.000 1.000 1.000 1.000 1.000 1.000 1.000 1.000 1.000 1.000
Simple Average of Latest 5 (Non-contiguous)[3] 1.028 1.004 1.030 1.005 1.001 1.000 1.000 1.000 1.000 1.000 1.000 1.000 1.000 1.000 1.000
Simple Average of Latest 7 (Non-contiguous)[4] 1.037 .999 1.021 1.004 1.001 1.000 1.000 1.000 1.000 1.000 1.000 1.000 1.000 1.000 1.000
Volume Weighted Average of Latest 3 (Non-Contiguous) - Based on Total Limits Losses[5] 1.024 0.999 1.003 1.007 1.000 1.000 1.000 1.000 1.000 1.000 1.000 1.000 1.000 1.000 1.000
SelectedSelected 1.023 .999 1.003 1.008 1.000 1.000 1.000 1.000 1.000 1.000 1.000 1.000 1.000 1.000 1.000
Dev To Ult 1.033 1.010 1.011 1.008 1.000 1.000 1.000 1.000 1.000 1.000 1.000 1.000 1.000 1.000 1.000
V:\The Dentists Insurance Co - 114833\11\RCS\187656 - CA Rates\Exec - Anl\TDIC CA PL GL Rate Study 12312010Tri_726/29/2011 9:42 PM
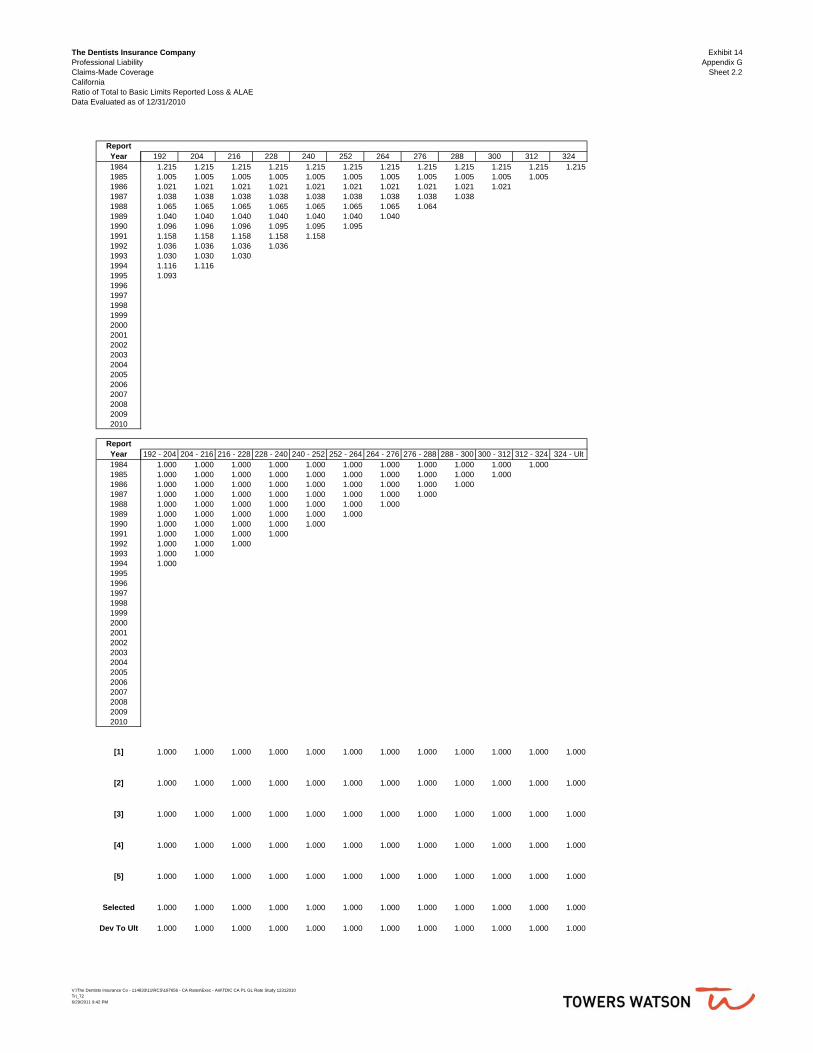
The Dentists Insurance CompanyProfessional LiabilityClaims-Made CoverageCaliforniaRatio of Total to Basic Limits Reported Loss & ALAEData Evaluated as of 12/31/2010
Exhibit 14Appendix G
Sheet 2.2
ReportYear198419851986198719881989199019911992199319941995199619971998199920002001200220032004200520062007200820092010
ReportYear198419851986198719881989199019911992199319941995199619971998199920002001200220032004200520062007200820092010
[1]
[2]
[3]
[4]
[5]
Selected
Dev To Ult
192 204 216 228 240 252 264 276 288 300 312 3241.215 1.215 1.215 1.215 1.215 1.215 1.215 1.215 1.215 1.215 1.215 1.2151.005 1.005 1.005 1.005 1.005 1.005 1.005 1.005 1.005 1.005 1.0051.021 1.021 1.021 1.021 1.021 1.021 1.021 1.021 1.021 1.0211.038 1.038 1.038 1.038 1.038 1.038 1.038 1.038 1.0381.065 1.065 1.065 1.065 1.065 1.065 1.065 1.0641.040 1.040 1.040 1.040 1.040 1.040 1.0401.096 1.096 1.096 1.095 1.095 1.0951.158 1.158 1.158 1.158 1.1581.036 1.036 1.036 1.0361.030 1.030 1.0301.116 1.1161.093
192 - 204 204 - 216 216 - 228 228 - 240 240 - 252 252 - 264 264 - 276 276 - 288 288 - 300 300 - 312 312 - 324 324 - Ult1.000 1.000 1.000 1.000 1.000 1.000 1.000 1.000 1.000 1.000 1.0001.000 1.000 1.000 1.000 1.000 1.000 1.000 1.000 1.000 1.0001.000 1.000 1.000 1.000 1.000 1.000 1.000 1.000 1.0001.000 1.000 1.000 1.000 1.000 1.000 1.000 1.0001.000 1.000 1.000 1.000 1.000 1.000 1.0001.000 1.000 1.000 1.000 1.000 1.0001.000 1.000 1.000 1.000 1.0001.000 1.000 1.000 1.0001.000 1.000 1.0001.000 1.0001.000
1.000 1.000 1.000 1.000 1.000 1.000 1.000 1.000 1.000 1.000 1.000 1.000
1.000 1.000 1.000 1.000 1.000 1.000 1.000 1.000 1.000 1.000 1.000 1.000
1.000 1.000 1.000 1.000 1.000 1.000 1.000 1.000 1.000 1.000 1.000 1.000
1.000 1.000 1.000 1.000 1.000 1.000 1.000 1.000 1.000 1.000 1.000 1.000
1.000 1.000 1.000 1.000 1.000 1.000 1.000 1.000 1.000 1.000 1.000 1.000
1.000 1.000 1.000 1.000 1.000 1.000 1.000 1.000 1.000 1.000 1.000 1.000
1.000 1.000 1.000 1.000 1.000 1.000 1.000 1.000 1.000 1.000 1.000 1.000
V:\The Dentists Insurance Co - 114833\11\RCS\187656 - CA Rates\Exec - Anl\TDIC CA PL GL Rate Study 12312010Tri_726/29/2011 9:42 PM

Exhibit 14Appendix G
Sheet 3
THE DENTISTS INSURANCE COMPANY
Professional Liability
Development of Total Limits ILFBased on Paid Losses
California
Ratio of Development ProjectedReport Total to Basic Factor to UltimateYear at 12/31/10 Ultimate Total Limits ILF(1) (2) (3) (4)
1984 1.215 1.000 1.2151985 1.005 1.000 1.0051986 1.021 1.000 1.0211987 1.038 1.000 1.0381988 1.064 1.000 1.0641989 1.040 1.000 1.0401990 1.095 1.000 1.0951991 1.158 1.000 1.1581992 1.036 1.000 1.0361993 1.030 1.000 1.0301994 1.116 1.000 1.1161995 1.093 1.000 1.0931996 1.078 1.000 1.0781997 1.037 1.000 1.0371998 1.315 1.000 1.3151999 1.174 1.000 1.1742000 1.079 1.000 1.0792001 1.167 1.000 1.1672002 1.026 1.000 1.0262003 1.126 1.000 1.1262004 1.258 1.000 1.2582005 1.163 1.000 1.1632006 1.066 1.000 1.0662007 1.065 1.010 1.0752008 1.036 1.029 1.0662009 1.168 1.052 1.2282010 1.000 1.105 1.105
Notes:(2),(3) Exhibit 14, Appendix G, Sheet 4.
(4) = (2) x (3).
V:\The Dentists Insurance Co - 114833\11\RCS\187656 - CA Rates\Exec - Anl\TDIC CA PL GL Rate Study 12312010A.G.36/29/2011 9:42 PM

The Dentists Insurance CompanyProfessional LiabilityClaims-Made CoverageCaliforniaRatio of Total to Basic Limits Paid Loss & ALAEData Evaluated as of 12/31/2010
Exhibit 14Appendix G
Sheet 4.1
Report Evaluation Age in MonthsYear 12 24 36 48 60 72 84 96 108 120 132 144 156 168 1801984 1.134 1.723 1.382 1.267 1.238 1.221 1.221 1.221 1.221 1.215 1.215 1.215 1.215 1.215 1.2151985 1.000 1.000 1.000 1.000 1.005 1.005 1.005 1.005 1.005 1.005 1.005 1.005 1.005 1.005 1.0051986 1.000 1.000 1.029 1.050 1.044 1.039 1.038 1.021 1.021 1.021 1.021 1.021 1.021 1.021 1.0211987 1.000 1.082 1.063 1.056 1.051 1.048 1.038 1.038 1.038 1.038 1.038 1.038 1.038 1.038 1.0381988 1.000 1.000 1.009 1.015 1.044 1.041 1.065 1.065 1.065 1.065 1.065 1.065 1.065 1.065 1.0651989 1.000 1.060 1.048 1.038 1.035 1.040 1.040 1.040 1.040 1.040 1.040 1.040 1.040 1.040 1.0401990 1.271 1.095 1.091 1.093 1.090 1.093 1.093 1.092 1.092 1.096 1.096 1.096 1.096 1.096 1.0961991 1.000 1.073 1.055 1.053 1.159 1.158 1.158 1.158 1.158 1.158 1.158 1.158 1.158 1.158 1.1581992 1.053 1.013 1.039 1.037 1.037 1.036 1.036 1.036 1.036 1.036 1.036 1.036 1.036 1.036 1.0361993 1.000 1.045 1.034 1.032 1.031 1.031 1.030 1.030 1.030 1.030 1.030 1.030 1.030 1.030 1.0301994 1.000 1.031 1.126 1.121 1.117 1.116 1.116 1.116 1.116 1.116 1.116 1.116 1.116 1.116 1.1161995 1.000 1.018 1.053 1.050 1.095 1.094 1.094 1.094 1.094 1.094 1.094 1.094 1.094 1.093 1.0931996 1.000 1.038 1.039 1.036 1.079 1.078 1.078 1.078 1.078 1.078 1.078 1.078 1.078 1.078 1.0781997 1.090 1.048 1.038 1.037 1.037 1.037 1.037 1.037 1.037 1.037 1.037 1.037 1.037 1.0371998 1.000 1.183 1.333 1.323 1.315 1.313 1.315 1.315 1.315 1.315 1.315 1.315 1.3151999 1.000 1.016 1.040 1.147 1.175 1.174 1.174 1.174 1.174 1.174 1.174 1.1742000 1.062 1.086 1.068 1.079 1.078 1.078 1.078 1.079 1.079 1.079 1.0792001 1.000 1.067 1.161 1.166 1.164 1.160 1.167 1.167 1.167 1.1672002 1.025 1.025 1.027 1.026 1.026 1.026 1.026 1.026 1.0262003 1.011 1.016 1.135 1.129 1.127 1.127 1.126 1.1262004 1.040 1.055 1.101 1.261 1.259 1.258 1.2582005 1.037 1.041 1.066 1.125 1.163 1.1632006 1.028 1.014 1.064 1.068 1.0662007 1.000 1.042 1.068 1.0652008 1.058 1.045 1.0362009 1.039 1.1682010 1.000
Report Age Interval in MonthsYear 12 - 24 24 - 36 36 - 48 48 - 60 60 - 72 72 - 84 84 - 96 96 - 108 108 - 120 120 - 132 132 - 144 144 - 156 156 - 168 168 - 180 180 - 1921984 1.520 .802 .917 .977 .987 .999 1.000 1.000 .996 1.000 1.000 1.000 1.000 1.000 1.0001985 1.000 1.000 1.000 1.005 1.000 1.000 1.000 1.000 1.000 1.000 1.000 1.000 1.000 1.000 1.0001986 1.000 1.029 1.020 .995 .995 .999 .984 1.000 1.000 1.000 1.000 1.000 1.000 1.000 1.0001987 1.082 .982 .994 .995 .998 .990 1.000 1.000 1.000 1.000 1.000 1.000 1.000 1.000 1.0001988 1.000 1.009 1.005 1.028 .998 1.023 1.000 1.000 .999 1.000 1.000 1.000 1.000 1.000 1.0001989 1.060 .989 .990 .997 1.006 1.000 1.000 1.000 1.000 1.000 1.000 1.000 1.000 1.000 1.0001990 .861 .997 1.002 .997 1.002 1.000 1.000 1.000 1.003 1.000 1.000 1.000 1.000 1.000 1.0001991 1.073 .983 .998 1.101 .999 1.000 1.000 1.000 1.000 1.000 1.000 1.000 1.000 1.000 1.0001992 .962 1.026 .998 1.000 .999 1.000 1.000 1.000 1.000 1.000 1.000 1.000 1.000 1.000 1.0001993 1.045 .989 .999 .999 1.000 1.000 1.000 1.000 1.000 1.000 1.000 1.000 1.000 1.000 1.0001994 1.031 1.092 .995 .996 1.000 1.000 1.000 1.000 1.000 1.000 1.000 1.000 1.000 1.000 1.0001995 1.018 1.034 .997 1.043 .999 1.000 1.000 1.000 1.000 1.000 1.000 1.000 .999 1.000 1.0001996 1.038 1.001 .997 1.041 .999 1.000 1.000 1.000 1.000 1.000 1.000 1.000 1.000 1.0001997 .961 .991 .999 1.000 1.000 1.000 1.000 1.000 1.000 1.000 1.000 1.000 1.0001998 1.183 1.127 .993 .994 .998 1.001 1.000 1.000 1.000 1.000 1.000 1.0001999 1.016 1.024 1.104 1.024 1.000 1.000 1.000 1.000 1.000 1.000 1.0002000 1.023 .984 1.010 1.000 1.000 1.000 1.000 1.000 1.000 1.0002001 1.067 1.088 1.004 .999 .996 1.006 1.000 1.000 1.0002002 1.000 1.002 .999 1.000 1.000 1.000 1.000 1.0002003 1.005 1.116 .995 .998 1.000 1.000 1.0002004 1.015 1.043 1.146 .998 .999 1.0002005 1.004 1.024 1.056 1.034 1.0002006 .986 1.050 1.004 .9982007 1.042 1.024 .9972008 .988 .9912009 1.1242010
Simple Average of Middle 3 of Latest 5 (Non-contiguous, Average High Low)[1] 1.011 1.031 1.019 .999 1.000 1.000 1.000 1.000 1.000 1.000 1.000 1.000 1.000 1.000 1.000
Simple Average of Latest 3 (Non-contiguous)[2] 1.051 1.022 1.019 1.010 1.000 1.000 1.000 1.000 1.000 1.000 1.000 1.000 1.000 1.000 1.000
Simple Average of Latest 5 (Non-contiguous)[3] 1.029 1.027 1.040 1.005 .999 1.001 1.000 1.000 1.000 1.000 1.000 1.000 1.000 1.000 1.000
Simple Average of Latest 7 (Non-contiguous)[4] 1.023 1.036 1.029 1.004 .999 1.001 1.000 1.000 1.000 1.000 1.000 1.000 1.000 1.000 1.000
Volume Weighted Average of Latest 3 (Non-Contiguous) - Based on Total Limits Losses[5] 1.043 1.019 1.018 1.009 1.000 1.000 1.000 1.000 1.000 1.000 1.000 1.000 1.000 1.000 1.000
SelectedSelected 1.051 1.022 1.019 1.010 1.000 1.000 1.000 1.000 1.000 1.000 1.000 1.000 1.000 1.000 1.000
Dev To Ult 1.105 1.052 1.029 1.010 1.000 1.000 1.000 1.000 1.000 1.000 1.000 1.000 1.000 1.000 1.000
V:\The Dentists Insurance Co - 114833\11\RCS\187656 - CA Rates\Exec - Anl\TDIC CA PL GL Rate Study 12312010Tri_716/29/2011 9:42 PM

The Dentists Insurance CompanyProfessional LiabilityClaims-Made CoverageCaliforniaRatio of Total to Basic Limits Paid Loss & ALAEData Evaluated as of 12/31/2010
Exhibit 14Appendix G
Sheet 4.2
ReportYear198419851986198719881989199019911992199319941995199619971998199920002001200220032004200520062007200820092010
ReportYear198419851986198719881989199019911992199319941995199619971998199920002001200220032004200520062007200820092010
[1]
[2]
[3]
[4]
[5]
Selected
Dev To Ult
192 204 216 228 240 252 264 276 288 300 312 3241.215 1.215 1.215 1.215 1.215 1.215 1.215 1.215 1.215 1.215 1.215 1.2151.005 1.005 1.005 1.005 1.005 1.005 1.005 1.005 1.005 1.005 1.0051.021 1.021 1.021 1.021 1.021 1.021 1.021 1.021 1.021 1.0211.038 1.038 1.038 1.038 1.038 1.038 1.038 1.038 1.0381.065 1.065 1.065 1.065 1.065 1.065 1.065 1.0641.040 1.040 1.040 1.040 1.040 1.040 1.0401.096 1.096 1.096 1.095 1.095 1.0951.158 1.158 1.158 1.158 1.1581.036 1.036 1.036 1.0361.030 1.030 1.0301.116 1.1161.093
192 - 204 204 - 216 216 - 228 228 - 240 240 - 252 252 - 264 264 - 276 276 - 288 288 - 300 300 - 312 312 - 324 324 - Ult1.000 1.000 1.000 1.000 1.000 1.000 1.000 1.000 1.000 1.000 1.0001.000 1.000 1.000 1.000 1.000 1.000 1.000 1.000 1.000 1.0001.000 1.000 1.000 1.000 1.000 1.000 1.000 1.000 1.0001.000 1.000 1.000 1.000 1.000 1.000 1.000 1.0001.000 1.000 1.000 1.000 1.000 1.000 1.0001.000 1.000 1.000 1.000 1.000 1.0001.000 1.000 1.000 1.000 1.0001.000 1.000 1.000 1.0001.000 1.000 1.0001.000 1.0001.000
1.000 1.000 1.000 1.000 1.000 1.000 1.000 1.000 1.000 1.000 1.000 1.000
1.000 1.000 1.000 1.000 1.000 1.000 1.000 1.000 1.000 1.000 1.000 1.000
1.000 1.000 1.000 1.000 1.000 1.000 1.000 1.000 1.000 1.000 1.000 1.000
1.000 1.000 1.000 1.000 1.000 1.000 1.000 1.000 1.000 1.000 1.000 1.000
1.000 1.000 1.000 1.000 1.000 1.000 1.000 1.000 1.000 1.000 1.000 1.000
1.000 1.000 1.000 1.000 1.000 1.000 1.000 1.000 1.000 1.000 1.000 1.000
1.000 1.000 1.000 1.000 1.000 1.000 1.000 1.000 1.000 1.000 1.000 1.000
V:\The Dentists Insurance Co - 114833\11\RCS\187656 - CA Rates\Exec - Anl\TDIC CA PL GL Rate Study 12312010Tri_716/29/2011 9:42 PM

The Dentists Insurance CompanyProfessional LiabilityClaims-Made CoverageCaliforniaTotal LimitsPaid Loss & ALAEData Evaluated as of 12/31/2010
Exhibit 14Appendix H
Report Evaluation Age in MonthsYear 12 24 36 48 60 72 84 96 108 120 132 144 156 168 1801984 212,037 964,653 1,464,457 2,151,687 2,726,404 2,969,770 2,977,706 2,977,706 2,977,706 2,958,935 2,958,935 2,958,935 2,958,935 2,958,935 2,958,9351985 155,017 974,814 2,412,546 3,768,488 4,925,128 5,398,245 5,525,882 5,533,001 5,554,789 5,554,789 5,554,789 5,554,789 5,554,789 5,554,789 5,554,7891986 292,979 1,094,829 2,841,952 3,784,488 4,248,824 4,741,983 4,830,954 4,749,333 4,749,333 4,749,333 4,749,333 4,749,333 4,749,333 4,749,333 4,749,3331987 220,521 2,312,834 3,883,797 4,796,308 5,305,610 5,529,837 5,669,108 5,678,175 5,673,957 5,673,957 5,675,632 5,675,632 5,675,807 5,675,807 5,675,9841988 338,050 2,502,461 4,304,155 5,647,702 6,796,053 7,158,374 7,756,177 7,766,302 7,770,849 7,835,658 7,835,983 7,835,998 7,837,498 7,835,998 7,838,3741989 416,095 3,052,222 4,820,669 6,078,127 6,668,331 7,183,756 7,201,066 7,244,551 7,229,475 7,225,813 7,228,535 7,228,535 7,228,535 7,228,608 7,228,6081990 803,044 3,419,698 6,578,405 7,574,072 7,809,500 8,066,331 8,064,412 8,074,416 8,087,660 8,184,932 8,187,485 8,187,485 8,187,485 8,187,485 8,187,9351991 451,784 4,033,024 6,043,711 7,165,073 8,129,837 8,164,072 8,165,458 8,166,467 8,170,736 8,172,590 8,172,590 8,173,782 8,173,852 8,173,918 8,174,7291992 997,178 3,945,186 6,418,776 6,737,928 6,770,514 6,895,129 6,904,139 6,904,789 6,906,478 6,906,478 6,906,478 6,906,478 6,906,769 6,906,769 6,906,7691993 831,016 4,498,564 5,997,832 6,271,188 6,549,578 6,580,867 6,615,960 6,654,328 6,654,248 6,656,708 6,656,708 6,656,708 6,658,248 6,658,248 6,658,2481994 1,165,409 4,958,066 7,801,718 8,095,492 8,355,257 8,375,631 8,375,964 8,376,366 8,376,506 8,377,655 8,378,540 8,391,285 8,401,507 8,401,007 8,401,0071995 1,084,841 4,910,522 7,702,754 8,131,684 8,855,761 8,954,095 8,958,398 8,950,745 8,950,802 8,951,402 8,951,402 8,951,402 8,981,402 9,056,567 9,056,5671996 1,134,875 4,676,857 7,205,115 7,796,153 8,579,418 8,645,212 8,632,252 8,642,119 8,647,108 8,625,115 8,632,611 8,632,611 8,635,476 8,638,873 8,640,1441997 1,210,756 5,476,637 7,972,328 8,234,585 8,271,270 8,307,623 8,315,722 8,315,722 8,316,241 8,316,241 8,316,241 8,316,241 8,316,241 8,316,2411998 1,077,981 6,909,504 10,964,016 11,921,933 12,152,244 12,221,213 12,165,803 12,173,969 12,172,789 12,172,789 12,172,789 12,173,643 12,173,6431999 825,580 4,840,642 7,216,440 8,877,747 9,394,722 9,416,528 9,422,962 9,412,887 9,413,384 9,409,384 9,412,076 9,415,8902000 990,703 6,411,099 8,675,880 9,798,396 9,844,941 9,845,121 9,848,043 9,798,930 9,798,930 9,798,929 9,805,1922001 970,514 5,913,073 9,615,660 10,088,999 10,166,749 10,392,389 10,605,703 10,607,280 10,612,306 10,612,3582002 1,263,250 5,391,469 7,573,761 7,771,101 7,921,756 7,863,607 7,871,605 7,887,776 7,887,8772003 1,345,450 6,857,292 10,604,899 11,010,066 11,165,826 11,186,749 11,223,339 11,223,3392004 1,442,590 6,403,196 8,963,139 10,720,151 10,750,190 10,772,347 10,786,0372005 1,399,898 5,871,849 8,626,117 9,719,202 10,217,056 10,217,7542006 1,485,844 6,190,213 9,890,754 10,655,871 11,058,2702007 1,174,300 6,016,127 8,875,195 10,093,2892008 1,934,682 7,753,676 12,035,6342009 1,333,420 7,762,3002010 1,240,019
Report Age Interval in MonthsYear 12 - 24 24 - 36 36 - 48 48 - 60 60 - 72 72 - 84 84 - 96 96 - 108 108 - 120 120 - 132 132 - 144 144 - 156 156 - 168 168 - 180 180 - 1921984 4.549 1.518 1.469 1.267 1.089 1.003 1.000 1.000 .994 1.000 1.000 1.000 1.000 1.000 1.0001985 6.288 2.475 1.562 1.307 1.096 1.024 1.001 1.004 1.000 1.000 1.000 1.000 1.000 1.000 1.0001986 3.737 2.596 1.332 1.123 1.116 1.019 .983 1.000 1.000 1.000 1.000 1.000 1.000 1.000 1.0011987 10.488 1.679 1.235 1.106 1.042 1.025 1.002 .999 1.000 1.000 1.000 1.000 1.000 1.000 1.0001988 7.403 1.720 1.312 1.203 1.053 1.084 1.001 1.001 1.008 1.000 1.000 1.000 1.000 1.000 1.0001989 7.335 1.579 1.261 1.097 1.077 1.002 1.006 .998 .999 1.000 1.000 1.000 1.000 1.000 1.0001990 4.258 1.924 1.151 1.031 1.033 1.000 1.001 1.002 1.012 1.000 1.000 1.000 1.000 1.000 1.0001991 8.927 1.499 1.186 1.135 1.004 1.000 1.000 1.001 1.000 1.000 1.000 1.000 1.000 1.000 1.0021992 3.956 1.627 1.050 1.005 1.018 1.001 1.000 1.000 1.000 1.000 1.000 1.000 1.000 1.000 1.0001993 5.413 1.333 1.046 1.044 1.005 1.005 1.006 1.000 1.000 1.000 1.000 1.000 1.000 1.000 1.0001994 4.254 1.574 1.038 1.032 1.002 1.000 1.000 1.000 1.000 1.000 1.002 1.001 1.000 1.000 1.0031995 4.526 1.569 1.056 1.089 1.011 1.000 .999 1.000 1.000 1.000 1.000 1.003 1.008 1.000 1.0001996 4.121 1.541 1.082 1.100 1.008 .999 1.001 1.001 .997 1.001 1.000 1.000 1.000 1.0001997 4.523 1.456 1.033 1.004 1.004 1.001 1.000 1.000 1.000 1.000 1.000 1.000 1.0001998 6.410 1.587 1.087 1.019 1.006 .995 1.001 1.000 1.000 1.000 1.000 1.0001999 5.863 1.491 1.230 1.058 1.002 1.001 .999 1.000 1.000 1.000 1.0002000 6.471 1.353 1.129 1.005 1.000 1.000 .995 1.000 1.000 1.0012001 6.093 1.626 1.049 1.008 1.022 1.021 1.000 1.000 1.0002002 4.268 1.405 1.026 1.019 .993 1.001 1.002 1.0002003 5.097 1.547 1.038 1.014 1.002 1.003 1.0002004 4.439 1.400 1.196 1.003 1.002 1.0012005 4.194 1.469 1.127 1.051 1.0002006 4.166 1.598 1.077 1.0382007 5.123 1.475 1.1372008 4.008 1.5522009 5.8212010
Simple Average of Middle 3 of Latest 5 (Non-contiguous, Average High Low)[1] 4.495 1.499 1.114 1.024 1.001 1.002 1.000 1.000 1.000 1.000 1.000 1.001 1.000 1.000 1.001
Volume Weighted Average of Latest 3 (Non-contiguous)[2] 4.847 1.543 1.112 1.030 1.001 1.002 1.001 1.000 1.000 1.000 1.000 1.000 1.003 1.000 1.001
Volume Weighted Average of Latest 4 (Non-contiguous)[3] 4.676 1.526 1.133 1.026 1.000 1.007 .999 1.000 1.000 1.000 1.000 1.001 1.002 1.000 1.001
Volume Weighted Average of Latest 5 (Non-contiguous)[4] 4.584 1.501 1.112 1.025 1.004 1.005 .999 1.000 1.000 1.000 1.000 1.001 1.002 1.000 1.001
SelectedSelected 4.847 1.543 1.112 1.030 1.001 1.002 1.001 1.000 1.000 1.000 1.000 1.000 1.003 1.000 1.001
Dev To Ult 8.687 1.792 1.161 1.045 1.014 1.013 1.011 1.010 1.010 1.010 1.010 1.010 1.010 1.007 1.007
V:\The Dentists Insurance Co - 114833\11\RCS\187656 - CA Rates\Exec - Anl\TDIC CA PL GL Rate Study 12312010Tri_106/29/2011 9:42 PM

The Dentists Insurance CompanyProfessional LiabilityClaims-Made CoverageCaliforniaTotal LimitsPaid Loss & ALAEData Evaluated as of 12/31/2010
Exhibit 14Appendix H
ReportYear198419851986198719881989199019911992199319941995199619971998199920002001200220032004200520062007200820092010
ReportYear198419851986198719881989199019911992199319941995199619971998199920002001200220032004200520062007200820092010
[1]
[2]
[3]
[4]
Selected
Dev To Ult
192 204 216 228 240 252 264 276 288 300 312 3242,958,935 2,958,935 2,961,070 2,961,070 2,961,246 2,961,246 2,961,246 2,961,246 2,961,246 2,961,246 2,961,640 2,961,2465,555,033 5,555,033 5,555,033 5,555,033 5,555,033 5,564,522 5,564,522 5,566,876 5,567,941 5,567,940 5,567,9404,753,822 4,753,822 4,753,822 4,753,822 4,753,822 4,753,822 4,753,822 4,753,822 4,753,822 4,753,8225,676,384 5,676,532 5,676,532 5,678,157 5,678,157 5,678,157 5,678,157 5,678,157 5,678,1577,838,374 7,838,374 7,838,374 7,838,374 7,838,374 7,838,374 7,838,374 7,841,4327,229,474 7,229,740 7,229,740 7,229,740 7,229,740 7,229,740 7,229,7408,187,935 8,187,935 8,190,432 8,200,762 8,200,894 8,202,0338,193,225 8,193,225 8,193,225 8,193,234 8,193,2346,906,769 6,976,020 6,989,552 6,991,6486,658,248 6,681,135 6,684,1118,425,522 8,425,5229,056,567
192 - 204 204 - 216 216 - 228 228 - 240 240 - 252 252 - 264 264 - 276 276 - 288 288 - 300 300 - 312 312 - 324 324 - Ult1.000 1.001 1.000 1.000 1.000 1.000 1.000 1.000 1.000 1.000 1.0001.000 1.000 1.000 1.000 1.002 1.000 1.000 1.000 1.000 1.0001.000 1.000 1.000 1.000 1.000 1.000 1.000 1.000 1.0001.000 1.000 1.000 1.000 1.000 1.000 1.000 1.0001.000 1.000 1.000 1.000 1.000 1.000 1.0001.000 1.000 1.000 1.000 1.000 1.0001.000 1.000 1.001 1.000 1.0001.000 1.000 1.000 1.0001.010 1.002 1.0001.003 1.0001.000
1.001 1.000 1.000 1.000 1.000 1.000 1.000 1.000 1.000 1.000 1.000 1.000
1.004 1.001 1.001 1.000 1.000 1.000 1.000 1.000 1.000 1.000 1.000 1.000
1.003 1.001 1.000 1.000 1.000 1.000 1.000 1.000 1.000 1.000 1.000 1.000
1.002 1.001 1.000 1.000 1.000 1.000 1.000 1.000 1.000 1.000 1.000 1.000
1.004 1.001 1.001 1.000 1.000 1.000 1.000 1.000 1.000 1.000 1.000 1.000
1.006 1.002 1.001 1.000 1.000 1.000 1.000 1.000 1.000 1.000 1.000 1.000
V:\The Dentists Insurance Co - 114833\11\RCS\187656 - CA Rates\Exec - Anl\TDIC CA PL GL Rate Study 12312010Tri_106/29/2011 9:42 PM

Exhibit 14Appendix I
Sheet 1
THE DENTISTS INSURANCE COMPANY
Professional Liability
Tail Waiver Loading
California
(1) Estimated Number of DD&Rs 281
(2) Factor to Convert from Claims-Made to Tail Liability Basis 1.482
(3) Average Maturity 0.960
(4) Number of Insureds 14,913
(5) Indicated Factor to Include the Cost of Tail Waiver 1.029
(6) Experience Modification Factor 1.800
(7) Adjusted Factor to Include the Cost of Tail Waiver 1.052
(8) Selected Factor to Include the Cost of Tail Waiver 1.050
Notes:(1),(4) Exhibit 14, Appendix I, Sheet 2.2.
(2) Provided by TDIC; based on current rates.(3) Based on data provided by TDIC.(5) = 1.0 + [(1) x (2)] / [(3) x (4)].(6) Exhibit 14, Appendix I, Sheet 3.(7) = 1.0 + {[(5) - 1.0] x (6)}.
V:\The Dentists Insurance Co - 114833\11\RCS\187656 - CA Rates\Exec - Anl\TDIC CA PL GL Rate Study 12312010A.I.16/29/2011 9:42 PM

Exhibit 14Appendix ISheet 2.1
THE DENTISTS INSURANCE COMPANY
Professional Liability
Estimated Number of Insureds Eligible for Death,Disability and Retirement Benefits in 2011
California
Total Number ofAge in Number of Decrement Rates DD&R2011 Insureds Death Disability Retirement Total Insureds(1) (2) (3) (4) (5) (6) (7)
27 & Under 178 0.0007 0.0008 0.0000 0.0008 028 131 0.0007 0.0008 0.0000 0.0008 029 217 0.0007 0.0008 0.0000 0.0008 030 261 0.0007 0.0008 0.0000 0.0008 031 290 0.0007 0.0008 0.0000 0.0008 032 358 0.0007 0.0008 0.0000 0.0008 033 337 0.0007 0.0008 0.0000 0.0008 034 378 0.0007 0.0008 0.0000 0.0008 035 400 0.0007 0.0008 0.0000 0.0008 036 418 0.0007 0.0008 0.0000 0.0008 037 445 0.0011 0.0008 0.0000 0.0009 038 418 0.0011 0.0008 0.0000 0.0009 039 430 0.0011 0.0008 0.0000 0.0009 040 422 0.0011 0.0008 0.0000 0.0009 041 432 0.0011 0.0008 0.0000 0.0009 042 396 0.0017 0.0014 0.0000 0.0016 143 380 0.0017 0.0014 0.0050 0.0041 244 385 0.0017 0.0014 0.0050 0.0041 245 376 0.0017 0.0014 0.0050 0.0041 246 389 0.0017 0.0014 0.0050 0.0041 247 463 0.0030 0.0024 0.0050 0.0052 248 406 0.0030 0.0024 0.0100 0.0077 349 377 0.0030 0.0024 0.0100 0.0077 350 363 0.0030 0.0024 0.0100 0.0077 351 336 0.0030 0.0024 0.0100 0.0077 352 402 0.0053 0.0041 0.0100 0.0097 453 382 0.0053 0.0041 0.0100 0.0097 454 360 0.0053 0.0041 0.0100 0.0097 355 364 0.0053 0.0041 0.0250 0.0172 656 383 0.0053 0.0041 0.0150 0.0122 557 314 0.0094 0.0080 0.0150 0.0162 558 361 0.0094 0.0080 0.0225 0.0200 759 287 0.0094 0.0080 0.0300 0.0237 7
Note: See Exhibit 14, Appendix I, Sheet 2.2.
V:\The Dentists Insurance Co - 114833\11\RCS\187656 - CA Rates\Exec - Anl\TDIC CA PL GL Rate Study 12312010A.I.2.16/29/2011 9:42 PM

Exhibit 14Appendix ISheet 2.2
THE DENTISTS INSURANCE COMPANY
Professional Liability
Estimated Number of Insureds Eligible for Death,Disability and Retirement Benefits in 2011
California
TotalNumber of Number of
Age in Insureds Decrement Rates DD&R2011 at 12/31/2010 Death Disability Retirement Total Insureds(1) (2) (3) (4) (5) (6) (7)
60 294 0.0094 0.0080 0.0500 0.0337 1061 282 0.0094 0.0080 0.0350 0.0262 762 306 0.0103 0.0110 0.0350 0.0281 963 307 0.0103 0.0110 0.0350 0.0281 964 277 0.0103 0.0110 0.0350 0.0281 865 237 0.0103 0.0110 0.2000 0.1106 2666 210 0.0103 0.0110 0.1500 0.0856 1867 192 0.0174 0.0000 0.1500 0.0837 1668 171 0.0174 0.0000 0.1500 0.0837 1469 116 0.0174 0.0000 0.1500 0.0837 1070 111 0.0174 0.0000 0.2000 0.1087 1271 95 0.0174 0.0000 0.2000 0.1087 1072 78 0.0304 0.0000 0.2000 0.1152 973 72 0.0304 0.0000 0.2000 0.1152 874 55 0.0304 0.0000 0.2000 0.1152 675 52 0.0304 0.0000 0.2000 0.1152 676 36 0.0304 0.0000 0.2000 0.1152 477 34 0.0506 0.0000 0.2000 0.1253 478 39 0.0506 0.0000 0.2000 0.1253 579 29 0.0506 0.0000 0.2000 0.1253 480 21 0.0506 0.0000 0.2000 0.1253 381 17 0.0506 0.0000 0.2000 0.1253 282 8 0.0506 0.0000 0.2000 0.1253 183 9 0.0506 0.0000 0.2000 0.1253 184 3 0.0506 0.0000 0.2000 0.1253 085 7 0.0506 0.0000 0.9494 0.5000 3
86 & Above 16 0.0506 0.0000 1.0000 0.5253 8
Total 14,913 281
Notes:(2) Provided by TDIC.
(3),(4) Based on TSA tables and estimated retirements.(5) Judgmentally selected.(6) = Minimum of {[(3) + (4) + (5)] x utilization adjustment} and 1.0;
adjustment based on TDIC experience.(7) = (2) x (6).
V:\The Dentists Insurance Co - 114833\11\RCS\187656 - CA Rates\Exec - Anl\TDIC CA PL GL Rate Study 12312010A.I.2.26/29/2011 9:42 PM

Exhibit 14Appendix I
Sheet 3
THE DENTISTS INSURANCE COMPANY
Professional LiabilityExtended Reporting Endorsement
Summary of Experience Ratio
Reported Paid(A) (B)
Tail Experience 1.815 1.793
Selected 1.800
Notes: (A) Exhibit 14, Appendix I, Sheet 4.1.(B) Exhibit 14, Appendix I, Sheet 4.2.
V:\The Dentists Insurance Co - 114833\11\RCS\187656 - CA Rates\Exec - Anl\TDIC CA PL GL Rate Study 12312010A.I.36/29/2011 9:42 PM

Exhibit 14Appendix ISheet 4.1
Expected ActualInitial Reported Reported
Report Expected Percent Loss & ALAE Loss & ALAE ExperienceYear Loss & ALAE Reported at 12/31/10 at 12/31/10 Ratio(1) (2) (3) (4) (5) (6)
1985 $66,338 100.0% $66,338 $295,917 4.4611986 138,428 100.0% 138,428 1,151,954 8.3221987 81,370 100.0% 81,370 887,670 10.9091988 65,697 100.0% 65,697 1,007,088 15.3291989 71,697 100.0% 71,697 371,354 5.1801990 70,299 100.0% 70,299 510,536 7.2621991 68,063 100.0% 68,063 632,798 9.2971992 70,560 100.0% 70,560 563,252 7.9831993 76,401 99.9% 76,324 584,371 7.6561994 79,649 99.8% 79,490 1,043,755 13.1311995 84,007 99.4% 83,506 565,601 6.7731996 97,662 99.3% 96,982 446,335 4.6021997 118,774 99.3% 117,946 333,831 2.8301998 128,387 99.0% 127,111 708,970 5.5781999 140,463 99.0% 139,068 369,709 2.6582000 151,479 99.0% 149,974 300,864 2.0062001 162,847 99.0% 161,228 262,185 1.6262002 165,981 99.0% 164,331 389,689 2.3712003 181,622 99.1% 179,997 251,815 1.3992004 201,706 99.2% 200,102 205,494 1.0272005 227,523 99.4% 226,166 295,956 1.3092006 253,369 99.4% 251,858 254,805 1.0122007 286,069 99.5% 284,647 537,218 1.8872008 321,060 99.9% 320,747 636,911 1.9862009 312,856 89.1% 278,815 268,941 0.9652010 274,099 52.2% 143,018 245,461 1.716
Total $3,896,404 $3,713,761 $13,122,480 3.533
1995-2009 $2,833,805 $2,782,479 $5,828,324 2.0952000-2009 $2,264,512 $2,217,866 $3,403,878 1.535
Selected 1.815
Notes: (2) Exhibit 14, Appendix I, Sheet 5.1.(3) Based on TDIC experience.(4) (2) x (3).(5) Provided by TDIC.(6) (5) / (4).
Basic Limits
THE DENTISTS INSURANCE COMPANY
Professional LiabilityExtended Reporting Endorsement
Development of Reported Experience Ratio
V:\The Dentists Insurance Co - 114833\11\RCS\187656 - CA Rates\Exec - Anl\TDIC CA PL GL Rate Study 12312010A.I.4.16/29/2011 9:42 PM
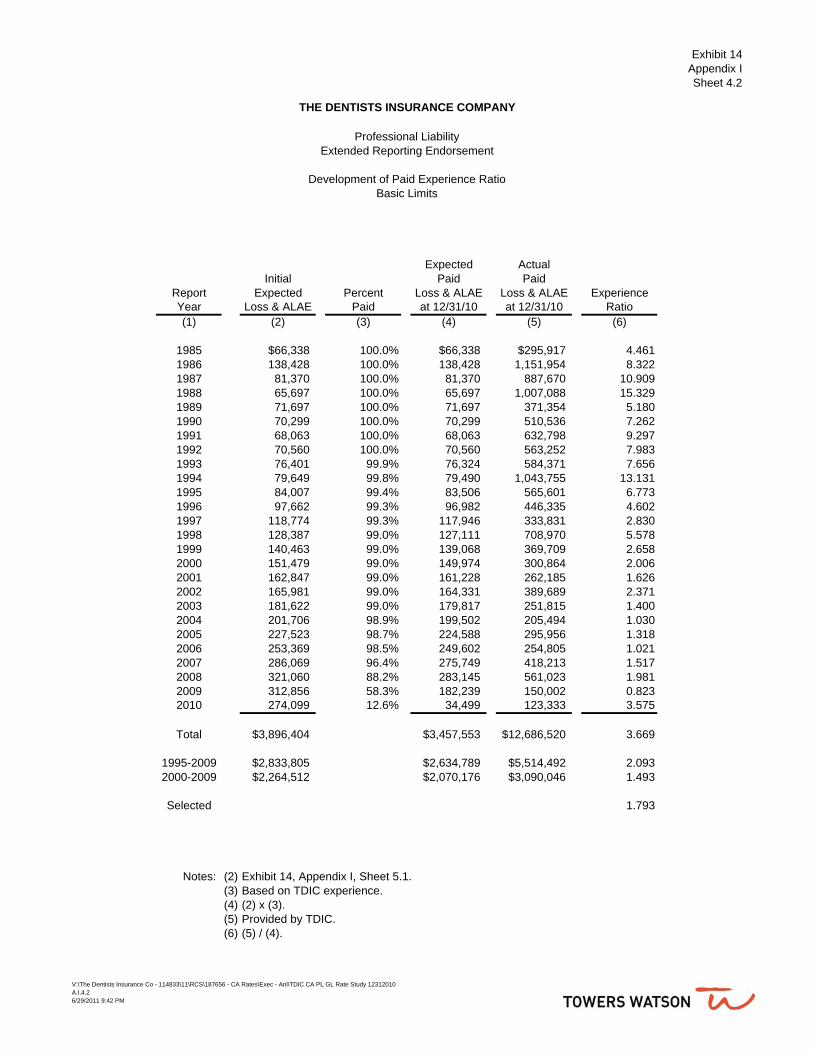
Exhibit 14Appendix ISheet 4.2
Expected ActualInitial Paid Paid
Report Expected Percent Loss & ALAE Loss & ALAE ExperienceYear Loss & ALAE Paid at 12/31/10 at 12/31/10 Ratio(1) (2) (3) (4) (5) (6)
1985 $66,338 100.0% $66,338 $295,917 4.4611986 138,428 100.0% 138,428 1,151,954 8.3221987 81,370 100.0% 81,370 887,670 10.9091988 65,697 100.0% 65,697 1,007,088 15.3291989 71,697 100.0% 71,697 371,354 5.1801990 70,299 100.0% 70,299 510,536 7.2621991 68,063 100.0% 68,063 632,798 9.2971992 70,560 100.0% 70,560 563,252 7.9831993 76,401 99.9% 76,324 584,371 7.6561994 79,649 99.8% 79,490 1,043,755 13.1311995 84,007 99.4% 83,506 565,601 6.7731996 97,662 99.3% 96,982 446,335 4.6021997 118,774 99.3% 117,946 333,831 2.8301998 128,387 99.0% 127,111 708,970 5.5781999 140,463 99.0% 139,068 369,709 2.6582000 151,479 99.0% 149,974 300,864 2.0062001 162,847 99.0% 161,228 262,185 1.6262002 165,981 99.0% 164,331 389,689 2.3712003 181,622 99.0% 179,817 251,815 1.4002004 201,706 98.9% 199,502 205,494 1.0302005 227,523 98.7% 224,588 295,956 1.3182006 253,369 98.5% 249,602 254,805 1.0212007 286,069 96.4% 275,749 418,213 1.5172008 321,060 88.2% 283,145 561,023 1.9812009 312,856 58.3% 182,239 150,002 0.8232010 274,099 12.6% 34,499 123,333 3.575
Total $3,896,404 $3,457,553 $12,686,520 3.669
1995-2009 $2,833,805 $2,634,789 $5,514,492 2.0932000-2009 $2,264,512 $2,070,176 $3,090,046 1.493
Selected 1.793
Notes: (2) Exhibit 14, Appendix I, Sheet 5.1.(3) Based on TDIC experience.(4) (2) x (3).(5) Provided by TDIC.(6) (5) / (4).
Basic Limits
THE DENTISTS INSURANCE COMPANY
Professional LiabilityExtended Reporting Endorsement
Development of Paid Experience Ratio
V:\The Dentists Insurance Co - 114833\11\RCS\187656 - CA Rates\Exec - Anl\TDIC CA PL GL Rate Study 12312010A.I.4.26/29/2011 9:42 PM

Exhibit 14Appendix ISheet 5.1
AccidentYear 1984 1985 1986 1987 1988 1989 1990 1991 1992 1993 1994 1995 1996 1997 1998 1999 2000 2001 2002 2003 2004 2005 2006 2007 2008 2009 2010
1984 $862 $47,579 $32,640 $15,389 $13,029 $15,076 $0 $0 $0 $0 $0 $0 $0 $0 $0 $0 $0 $0 $0 $0 $0 $0 $0 $0 $0 $0 $01985 18,759 102,301 37,024 12,964 14,572 17,316 0 0 0 0 0 0 0 0 0 0 0 0 0 0 0 0 0 0 0 01986 3,488 26,593 14,047 7,362 9,306 11,957 0 0 0 0 0 0 0 0 0 0 0 0 0 0 0 0 0 0 01987 2,363 23,427 12,238 7,064 9,226 12,004 0 0 0 0 0 0 0 0 0 0 0 0 0 0 0 0 0 01988 2,229 20,333 12,074 7,280 9,589 12,369 0 0 0 0 0 0 0 0 0 0 0 0 0 0 0 0 01989 2,115 22,305 13,194 7,972 10,333 13,252 0 0 0 0 0 0 0 0 0 0 0 0 0 0 0 01990 2,234 24,178 14,131 8,343 10,932 14,159 0 0 0 0 0 0 0 0 0 0 0 0 0 0 01991 2,228 24,131 14,319 8,685 11,427 15,367 0 0 0 0 0 0 0 0 0 0 0 0 0 01992 2,732 27,889 15,756 9,432 12,943 17,895 0 0 0 0 0 0 0 0 0 0 0 0 01993 3,148 28,530 16,341 10,514 14,911 20,026 0 0 0 0 0 0 0 0 0 0 0 01994 2,494 28,776 17,895 12,109 16,506 22,295 0 0 0 0 0 0 0 0 0 0 01995 3,873 36,837 22,780 14,186 19,270 25,350 0 0 0 0 0 0 0 0 0 01996 4,106 45,895 25,728 16,066 21,239 27,803 0 0 0 0 0 0 0 0 01997 5,184 47,418 27,578 16,825 22,422 28,640 0 0 0 0 0 0 0 01998 4,523 49,852 28,807 17,874 23,134 29,943 0 0 0 0 0 0 01999 5,403 53,600 30,823 18,380 24,192 32,208 0 0 0 0 0 02000 5,659 57,372 31,481 19,239 26,176 35,435 0 0 0 0 02001 6,552 57,856 33,380 21,132 29,165 39,062 0 0 0 02002 6,489 68,124 39,412 25,155 33,932 45,067 0 0 02003 6,744 74,066 43,865 27,651 37,193 49,876 0 02004 8,713 84,000 48,278 30,443 41,441 52,271 02005 9,903 94,351 54,330 34,515 43,302 53,2112006 10,095 107,168 61,625 35,203 43,4452007 11,868 119,711 60,270 34,0222008 13,892 108,812 51,7262009 12,998 89,1272010 2,567
Total $862 $66,338 $138,428 $81,370 $65,697 $71,697 $70,299 $68,063 $70,560 $76,401 $79,649 $84,007 $97,662 $118,774 $128,387 $140,463 $151,479 $162,847 $165,981 $181,622 $201,706 $227,523 $253,369 $286,069 $321,060 $312,856 $274,099
Note: Exhibit 14, Appendix I, Sheet 5.2 x Exhibit 14, Appendix I, Sheet 5.3.
Basic Limits
Report Year
THE DENTISTS INSURANCE COMPANY
Professional LiabilityExtended Reporting Endorsement
Development of Expected Loss and ALAE
V:\The Dentists Insurance Co - 114833\11\RCS\187656 - CA Rates\Exec - Anl\TDIC CA PL GL Rate Study 12312010A.I.5.16/29/2011 9:42 PM

Exhibit 14Appendix ISheet 5.2
AccidentYear 1984 1985 1986 1987 1988 1989 1990 1991 1992 1993 1994 1995 1996 1997 1998 1999 2000 2001 2002 2003 2004 2005 2006 2007 2008 2009 2010
1984 $45 $100 $31 $13 $13 $14 $0 $0 $0 $0 $0 $0 $0 $0 $0 $0 $0 $0 $0 $0 $0 $0 $0 $0 $0 $0 $01985 47 107 34 14 14 15 0 0 0 0 0 0 0 0 0 0 0 0 0 0 0 0 0 0 0 01986 51 114 36 15 15 16 0 0 0 0 0 0 0 0 0 0 0 0 0 0 0 0 0 0 01987 54 121 38 16 16 17 0 0 0 0 0 0 0 0 0 0 0 0 0 0 0 0 0 01988 57 129 41 17 17 18 0 0 0 0 0 0 0 0 0 0 0 0 0 0 0 0 01989 61 138 43 18 18 20 0 0 0 0 0 0 0 0 0 0 0 0 0 0 0 01990 65 147 46 19 20 21 0 0 0 0 0 0 0 0 0 0 0 0 0 0 01991 70 157 49 21 21 22 0 0 0 0 0 0 0 0 0 0 0 0 0 01992 74 167 52 22 22 24 0 0 0 0 0 0 0 0 0 0 0 0 01993 79 178 56 23 24 25 0 0 0 0 0 0 0 0 0 0 0 01994 84 189 60 25 25 27 0 0 0 0 0 0 0 0 0 0 01995 90 202 63 27 27 29 0 0 0 0 0 0 0 0 0 01996 96 215 68 28 29 31 0 0 0 0 0 0 0 0 01997 102 229 72 30 31 33 0 0 0 0 0 0 0 01998 109 244 77 32 33 35 0 0 0 0 0 0 01999 116 260 82 34 35 37 0 0 0 0 0 02000 123 278 87 37 37 40 0 0 0 0 02001 131 296 93 39 40 42 0 0 0 02002 140 315 99 41 42 45 0 0 02003 149 336 106 44 45 48 0 02004 159 358 112 47 48 51 02005 170 382 120 50 51 542006 181 407 128 53 542007 193 433 136 572008 205 462 1452009 219 4922010 233
Note: Based on 2010 pure premium of $1,036, annual trend of 6.6% and report year lag pattern based on claims-made step factors underlying current rates.
Basic Limits
Report Year
THE DENTISTS INSURANCE COMPANY
Professional LiabilityExtended Reporting Endorsement
Summary of Report Pure Premium by Lag
V:\The Dentists Insurance Co - 114833\11\RCS\187656 - CA Rates\Exec - Anl\TDIC CA PL GL Rate Study 12312010A.I.5.26/29/2011 9:42 PM

Exhibit 14Appendix ISheet 5.3
AccidentYear 1984 1985 1986 1987 1988 1989 1990 1991 1992 1993 1994 1995 1996 1997 1998 1999 2000 2001 2002 2003 2004 2005 2006 2007 2008 2009 2010
1984 19.35 474.58 1036.50 1167.23 971.47 1054.78 1152.38 1257.39 1364.71 1453.14 1536.11 1624.86 1729.98 1847.53 1961.20 2114.92 1741.71 1856.93 1959.45 2055.35 2154.19 2246.22 2356.34 2467.18 2578.28 2667.96 2735.961985 395.03 957.49 1103.23 922.65 1019.52 1136.77 1261.39 1385.90 1492.47 1599.97 1711.72 1838.35 1984.11 2124.45 2277.96 1998.62 2134.33 2253.85 2374.90 2501.70 2626.25 2769.68 2912.65 3061.38 3173.40 3256.141986 68.91 233.55 392.75 491.62 610.93 736.54 862.79 972.79 1081.34 1196.01 1324.88 1474.74 1621.79 1767.79 1871.87 2010.75 2135.76 2261.34 2390.29 2522.57 2670.01 2822.43 2984.26 3102.12 3184.811987 43.82 193.06 321.08 442.63 568.30 693.85 808.55 920.27 1037.14 1166.72 1320.51 1471.99 1625.47 1767.12 1912.03 2039.63 2167.49 2301.47 2438.69 2590.51 2745.75 2909.63 3031.81 3116.961988 38.78 157.23 297.23 428.06 554.27 670.84 783.98 901.16 1031.52 1186.14 1339.88 1495.82 1642.88 1789.57 1916.20 2044.21 2182.00 2323.87 2477.50 2634.62 2801.85 2927.80 3015.821989 34.52 161.84 304.79 439.87 560.42 674.43 792.35 924.85 1085.94 1243.81 1403.91 1556.54 1707.17 1834.89 1964.89 2105.73 2251.68 2407.85 2567.23 2738.66 2865.14 2952.321990 34.22 164.61 306.29 431.95 556.35 676.15 814.36 980.48 1138.33 1300.38 1455.51 1607.93 1736.75 1869.74 2014.44 2160.76 2319.37 2481.92 2655.51 2783.40 2874.681991 32.03 154.16 291.23 421.89 545.66 688.60 857.91 1016.69 1184.61 1340.90 1495.37 1627.52 1764.10 1909.47 2058.71 2221.13 2389.48 2566.13 2695.58 2791.081992 36.85 167.18 300.70 429.92 579.97 752.40 913.71 1081.14 1241.55 1397.58 1531.80 1671.42 1820.22 1972.51 2137.14 2309.24 2488.03 2621.11 2719.821993 39.84 160.48 292.63 449.69 626.93 790.09 960.74 1123.46 1283.46 1420.24 1562.29 1714.44 1870.40 2039.83 2211.85 2391.69 2527.57 2627.931994 29.61 151.88 300.69 486.01 651.21 825.36 990.51 1152.39 1294.19 1437.01 1590.95 1750.48 1917.94 2092.76 2274.41 2411.40 2512.521995 43.16 182.44 359.18 534.23 713.36 880.59 1040.44 1181.13 1327.36 1483.53 1646.12 1817.67 1996.20 2182.76 2319.76 2421.311996 42.93 213.28 380.64 567.73 737.77 906.24 1047.89 1196.85 1357.23 1525.51 1699.51 1879.77 2069.22 2206.91 2308.411997 50.86 206.77 382.85 557.88 730.86 875.96 1023.39 1185.06 1363.95 1540.12 1722.64 1914.66 2054.38 2160.151998 41.64 203.98 375.25 556.12 707.57 859.33 1027.69 1212.75 1393.00 1577.44 1771.36 1913.66 2021.011999 46.67 205.79 376.76 536.60 694.29 867.33 1056.58 1237.35 1422.51 1621.06 1764.73 1872.052000 45.87 206.69 361.07 527.05 704.89 895.40 1080.10 1266.21 1465.62 1610.87 1719.142001 49.83 195.58 359.24 543.20 736.97 926.18 1115.71 1317.51 1468.82 1579.232002 46.31 216.09 398.00 606.74 804.54 1002.66 1209.59 1361.55 1478.832003 45.16 220.45 415.65 625.82 827.49 1041.24 1194.47 1314.382004 54.75 234.60 429.26 646.52 865.13 1023.94 1149.572005 58.39 247.26 453.28 687.80 848.24 978.082006 55.85 263.53 482.44 658.24 798.572007 61.61 276.22 442.74 596.942008 67.67 235.59 356.542009 59.41 181.072010 11.01
Note: Provided by TDIC.
Report Year
THE DENTISTS INSURANCE COMPANY
Professional LiabilityExtended Reporting Endorsement - Waiver
Summary of Exposure Data by Report Year / Accident YearClass 11/Territory A Equivalents
V:\The Dentists Insurance Co - 114833\11\RCS\187656 - CA Rates\Exec - Anl\TDIC CA PL GL Rate Study 12312010A.I.5.36/29/2011 9:42 PM

Exhibit 14Appendix J
Sheet 1
The Dentists Insurance Company
Regulatory Defense
Summary of Ultimate Ratio of RD Cost to PL Loss & ALAEClaims-Made Coverage
Total Limits
Ultimate Ratio of RD to PL ActualReported Paid Ratio of
RD Cost Ratio RD Cost Ratio Reported RD SelectedReport Development Development to Reported PL UltimateYear Method Method at 12/31/10 Ratio of RD to PL(1) (2) (3) (4) (5)
1998 0.006 0.006 0.006 0.0061999 0.019 0.019 0.019 0.0192000 0.004 0.004 0.004 0.0042001 0.006 0.006 0.006 0.0062002 0.008 0.008 0.008 0.0082003 0.021 0.019 0.021 0.0202004 0.026 0.026 0.026 0.0262005 0.018 0.018 0.018 0.0182006 0.020 0.020 0.021 0.0202007 0.053 0.058 0.058 0.0562008 0.023 0.023 0.029 0.0232009 0.020 0.021 0.024 0.0202010 0.042 0.030 0.071 0.036
Averages
Last 7 x-2010 0.027Last 5 x-2010 0.030
Selected RD Load: 0.028
Notes:(2) Exhibit 14, Appendix J, Sheet 2.1, Column (4).(3) Exhibit 14, Appendix J, Sheet 2.2, Column (4).(4) Exhibit 14, Appendix J, Sheet 2.1, Column (2).
V:\The Dentists Insurance Co - 114833\11\RCS\187656 - CA Rates\Exec - Anl\TDIC CA PL GL Rate Study 12312010A.J.16/29/2011 9:42 PM

Exhibit 14Appendix J
Sheet 2.1
The Dentists Insurance Company
Regulatory Defense
Development of Ultimate Ratio of RD Cost to PL Loss & ALAEReported Development Method
Claims-Made CoverageTotal Limits
Ratio ofReported RD Projected
Report to Reported PL Development UltimateYear at 12/31/10 Factor Ratio of RD to PL(1) (2) (3) (4)
1998 0.006 1.000 0.0061999 0.019 1.000 0.0192000 0.004 1.000 0.0042001 0.006 1.000 0.0062002 0.008 1.000 0.0082003 0.021 1.001 0.0212004 0.026 1.002 0.0262005 0.018 1.005 0.0182006 0.021 0.944 0.0202007 0.058 0.914 0.0532008 0.029 0.787 0.0232009 0.024 0.831 0.0202010 0.071 0.596 0.042
Notes:(2),(3) Exhibit 14, Appendix J, Sheet 3.
(4) = (2) x (3).
V:\The Dentists Insurance Co - 114833\11\RCS\187656 - CA Rates\Exec - Anl\TDIC CA PL GL Rate Study 12312010A.J.2.16/29/2011 9:42 PM
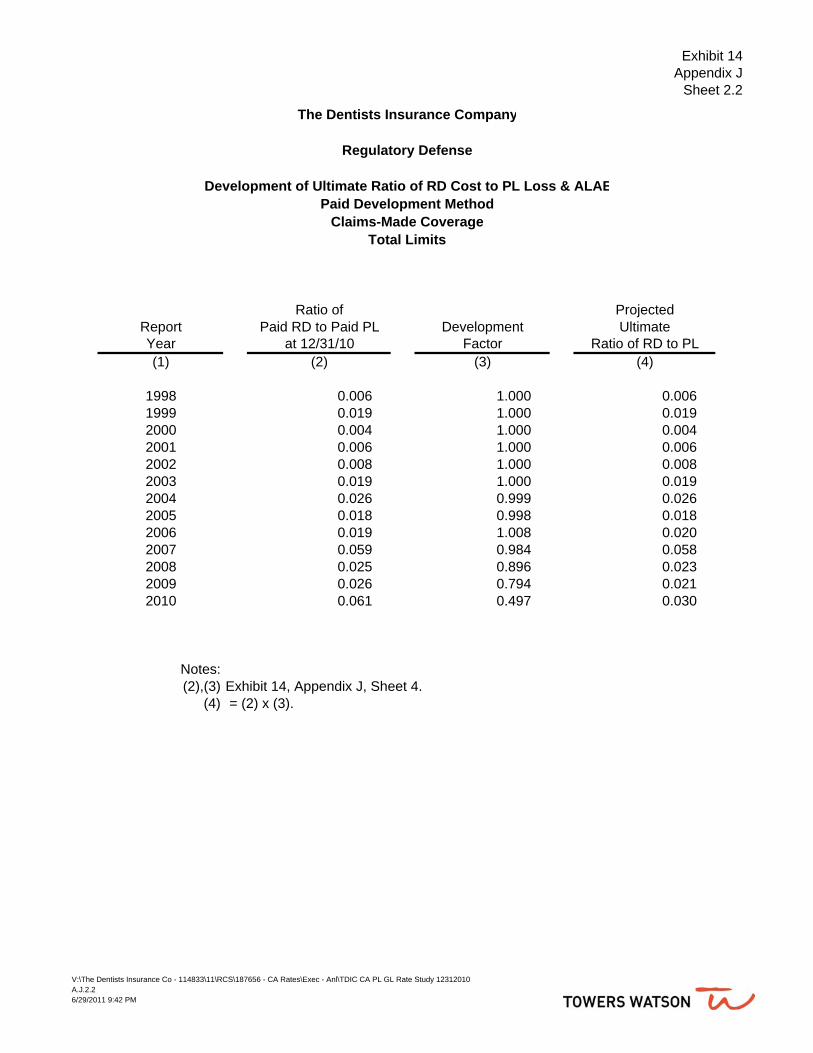
Exhibit 14Appendix J
Sheet 2.2
The Dentists Insurance Company
Regulatory Defense
Development of Ultimate Ratio of RD Cost to PL Loss & ALAEPaid Development Method
Claims-Made CoverageTotal Limits
Ratio of ProjectedReport Paid RD to Paid PL Development UltimateYear at 12/31/10 Factor Ratio of RD to PL(1) (2) (3) (4)
1998 0.006 1.000 0.0061999 0.019 1.000 0.0192000 0.004 1.000 0.0042001 0.006 1.000 0.0062002 0.008 1.000 0.0082003 0.019 1.000 0.0192004 0.026 0.999 0.0262005 0.018 0.998 0.0182006 0.019 1.008 0.0202007 0.059 0.984 0.0582008 0.025 0.896 0.0232009 0.026 0.794 0.0212010 0.061 0.497 0.030
Notes:(2),(3) Exhibit 14, Appendix J, Sheet 4.
(4) = (2) x (3).
V:\The Dentists Insurance Co - 114833\11\RCS\187656 - CA Rates\Exec - Anl\TDIC CA PL GL Rate Study 12312010A.J.2.26/29/2011 9:42 PM
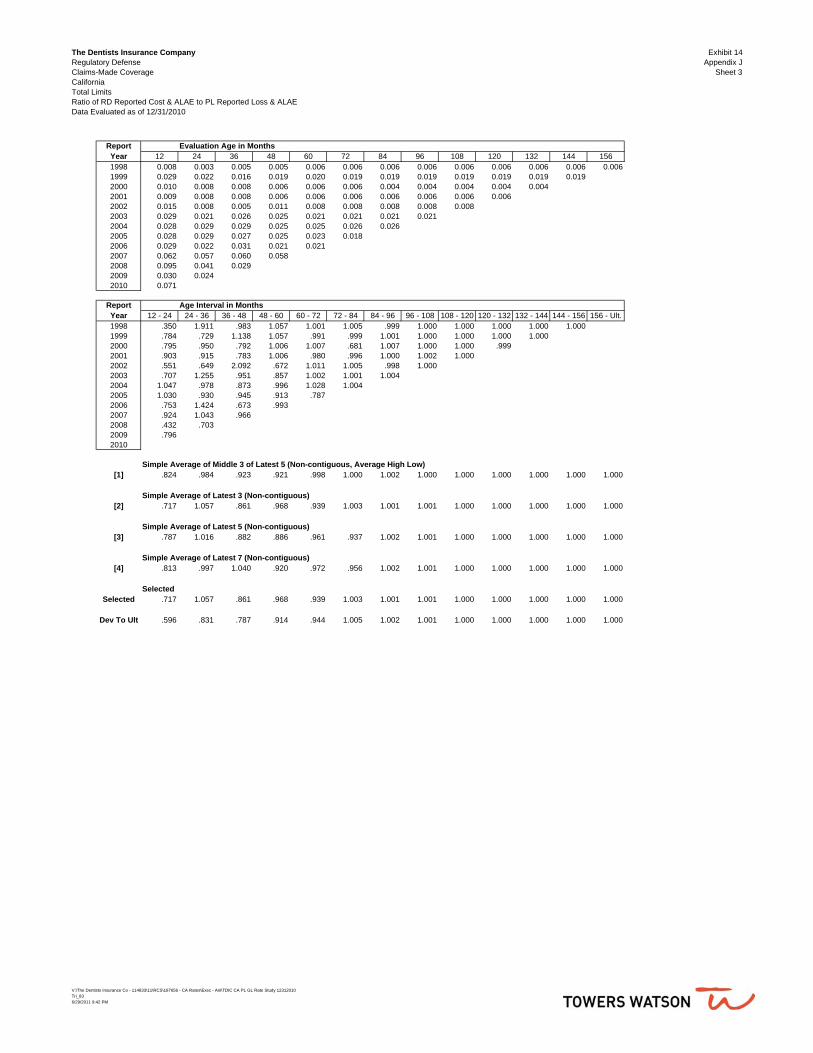
The Dentists Insurance CompanyRegulatory DefenseClaims-Made CoverageCaliforniaTotal LimitsRatio of RD Reported Cost & ALAE to PL Reported Loss & ALAEData Evaluated as of 12/31/2010
Exhibit 14Appendix J
Sheet 3
Report Evaluation Age in MonthsYear 12 24 36 48 60 72 84 96 108 120 132 144 1561998 0.008 0.003 0.005 0.005 0.006 0.006 0.006 0.006 0.006 0.006 0.006 0.006 0.0061999 0.029 0.022 0.016 0.019 0.020 0.019 0.019 0.019 0.019 0.019 0.019 0.0192000 0.010 0.008 0.008 0.006 0.006 0.006 0.004 0.004 0.004 0.004 0.0042001 0.009 0.008 0.008 0.006 0.006 0.006 0.006 0.006 0.006 0.0062002 0.015 0.008 0.005 0.011 0.008 0.008 0.008 0.008 0.0082003 0.029 0.021 0.026 0.025 0.021 0.021 0.021 0.0212004 0.028 0.029 0.029 0.025 0.025 0.026 0.0262005 0.028 0.029 0.027 0.025 0.023 0.0182006 0.029 0.022 0.031 0.021 0.0212007 0.062 0.057 0.060 0.0582008 0.095 0.041 0.0292009 0.030 0.0242010 0.071
Report Age Interval in MonthsYear 12 - 24 24 - 36 36 - 48 48 - 60 60 - 72 72 - 84 84 - 96 96 - 108 108 - 120 120 - 132 132 - 144 144 - 156 156 - Ult.1998 .350 1.911 .983 1.057 1.001 1.005 .999 1.000 1.000 1.000 1.000 1.0001999 .784 .729 1.138 1.057 .991 .999 1.001 1.000 1.000 1.000 1.0002000 .795 .950 .792 1.006 1.007 .681 1.007 1.000 1.000 .9992001 .903 .915 .783 1.006 .980 .996 1.000 1.002 1.0002002 .551 .649 2.092 .672 1.011 1.005 .998 1.0002003 .707 1.255 .951 .857 1.002 1.001 1.0042004 1.047 .978 .873 .996 1.028 1.0042005 1.030 .930 .945 .913 .7872006 .753 1.424 .673 .9932007 .924 1.043 .9662008 .432 .7032009 .7962010
Simple Average of Middle 3 of Latest 5 (Non-contiguous, Average High Low)[1] .824 .984 .923 .921 .998 1.000 1.002 1.000 1.000 1.000 1.000 1.000 1.000
Simple Average of Latest 3 (Non-contiguous)[2] .717 1.057 .861 .968 .939 1.003 1.001 1.001 1.000 1.000 1.000 1.000 1.000
Simple Average of Latest 5 (Non-contiguous)[3] .787 1.016 .882 .886 .961 .937 1.002 1.001 1.000 1.000 1.000 1.000 1.000
Simple Average of Latest 7 (Non-contiguous)[4] .813 .997 1.040 .920 .972 .956 1.002 1.001 1.000 1.000 1.000 1.000 1.000
SelectedSelected .717 1.057 .861 .968 .939 1.003 1.001 1.001 1.000 1.000 1.000 1.000 1.000
Dev To Ult .596 .831 .787 .914 .944 1.005 1.002 1.001 1.000 1.000 1.000 1.000 1.000
V:\The Dentists Insurance Co - 114833\11\RCS\187656 - CA Rates\Exec - Anl\TDIC CA PL GL Rate Study 12312010Tri_836/29/2011 9:42 PM

The Dentists Insurance CompanyRegulatory DefenseClaims-Made CoverageCaliforniaTotal LimitsRatio of Rd Paid Cost & ALAE to PL Paid Loss & ALAEData Evaluated as of 12/31/2010
Exhibit 14Appendix J
Sheet 4
Report Evaluation Age in MonthsYear 12 24 36 48 60 72 84 96 108 120 132 144 1561998 0.003 0.003 0.004 0.005 0.006 0.006 0.006 0.006 0.006 0.006 0.006 0.006 0.0061999 0.023 0.017 0.016 0.017 0.019 0.019 0.019 0.019 0.019 0.019 0.019 0.0192000 0.001 0.002 0.004 0.004 0.004 0.004 0.004 0.004 0.004 0.004 0.0042001 0.006 0.006 0.006 0.006 0.006 0.006 0.006 0.006 0.006 0.0062002 0.013 0.007 0.006 0.006 0.008 0.008 0.008 0.008 0.0082003 0.005 0.008 0.012 0.018 0.019 0.019 0.019 0.0192004 0.075 0.041 0.029 0.025 0.025 0.026 0.0262005 0.058 0.029 0.022 0.019 0.018 0.0182006 0.023 0.025 0.021 0.020 0.0192007 0.080 0.063 0.065 0.0592008 0.087 0.033 0.0252009 0.037 0.0262010 0.061
Report Age Interval in MonthsYear 12 - 24 24 - 36 36 - 48 48 - 60 60 - 72 72 - 84 84 - 96 96 - 108 108 - 120 120 - 132 132 - 144 144 - 156 156 - Ult.1998 1.002 1.290 1.303 1.046 .994 1.005 .999 1.000 1.000 1.000 1.000 1.0001999 .742 .896 1.113 1.123 .999 .999 1.001 1.000 1.000 1.000 1.0002000 1.339 2.191 .935 1.145 1.004 1.000 1.005 1.000 1.000 .9992001 .942 1.086 1.002 .992 .978 .980 1.000 1.000 1.0002002 .509 .883 .975 1.350 1.007 .999 .998 1.0002003 1.532 1.452 1.493 1.085 1.001 .997 1.0002004 .547 .716 .836 1.010 1.028 1.0022005 .500 .749 .876 .955 1.0002006 1.075 .870 .940 .9642007 .785 1.034 .9172008 .384 .7532009 .7092010
Simple Average of Middle 3 of Latest 5 (Non-contiguous, Average High Low)[1] .665 .791 .911 1.020 1.003 .998 1.000 1.000 1.000 1.000 1.000 1.000 1.000
Simple Average of Latest 3 (Non-contiguous)[2] .626 .886 .911 .976 1.010 .999 .999 1.000 1.000 1.000 1.000 1.000 1.000
Simple Average of Latest 5 (Non-contiguous)[3] .690 .824 1.012 1.073 1.003 .995 1.001 1.000 1.000 1.000 1.000 1.000 1.000
Simple Average of Latest 7 (Non-contiguous)[4] .790 .922 1.006 1.072 1.003 .997 1.001 1.000 1.000 1.000 1.000 1.000 1.000
SelectedSelected .626 .886 .911 .976 1.010 .999 .999 1.000 1.000 1.000 1.000 1.000 1.000
Dev To Ult .497 .794 .896 .984 1.008 .998 .999 1.000 1.000 1.000 1.000 1.000 1.000
V:\The Dentists Insurance Co - 114833\11\RCS\187656 - CA Rates\Exec - Anl\TDIC CA PL GL Rate Study 12312010Tri_826/29/2011 9:42 PM

V:\The Dentists Insurance Co - 114833\11\RCS\187656 - CA Rates\Exec - Anl\110629 CA Rate Filing exhs - PL GL.doc
Exhibit 15
THE DENTISTS INSURANCE COMPANY Professional & General Liability - Dentists
Rate Distribution
The company anticipates applying the change in rates in a uniform percentage across all territories, classification and limits.
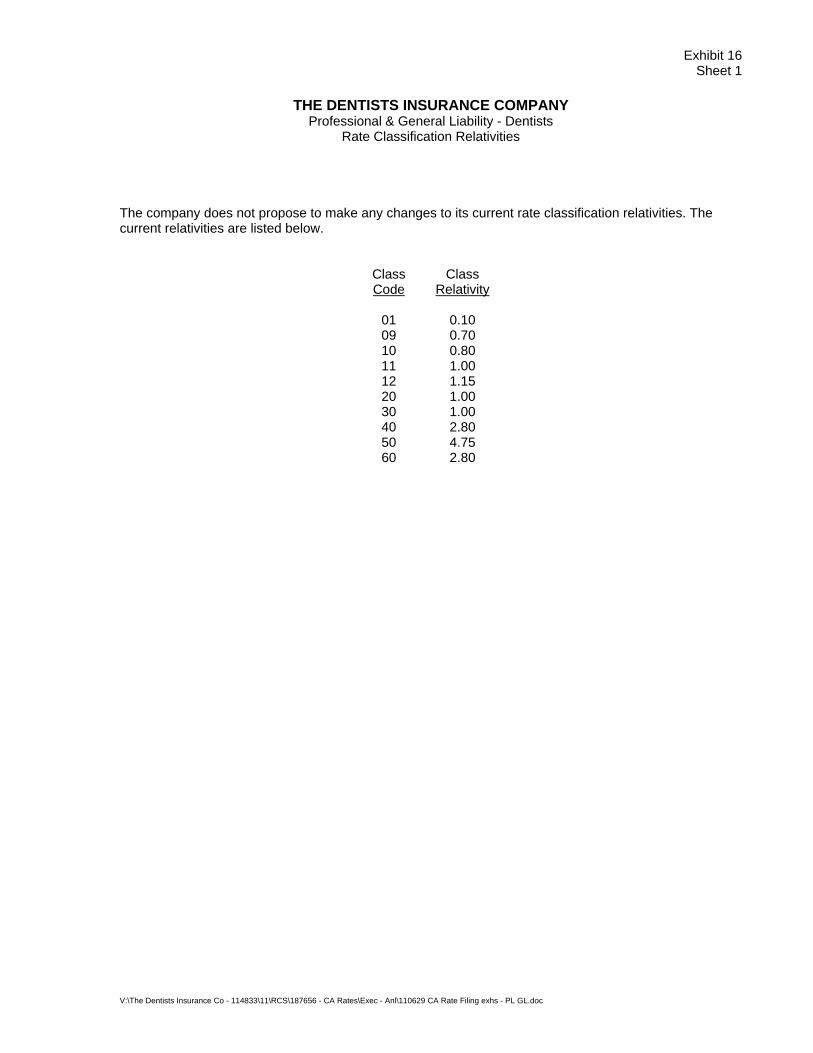
V:\The Dentists Insurance Co - 114833\11\RCS\187656 - CA Rates\Exec - Anl\110629 CA Rate Filing exhs - PL GL.doc
Exhibit 16 Sheet 1
THE DENTISTS INSURANCE COMPANY
Professional & General Liability - Dentists Rate Classification Relativities
The company does not propose to make any changes to its current rate classification relativities. The current relativities are listed below.
Class Class Code Relativity
01 0.10 09 0.70 10 0.80 11 1.00 12 1.15 20 1.00 30 1.00 40 2.80 50 4.75 60 2.80

Exhibit 16Sheet 2TDIC
Class Descriptions
TDIC’s class definitions are as follows:
Class 01 Volunteer Dentist – permits all types of anesthesia except I.V. or I.M. sedation and general anesthesia.
Class 09 Pediatric Dentist with all types of anesthesia allowed.
Class 10 Periodontist and Oral Pathologist with all types of anesthesia allowed.
Class 11 Endodontist with all types of anesthesia allowed and General Dentist with local, nitrous or oral sedation.
Class 12 Orthodontist with all types of anesthesia allowed.
Class 20 General Dentist with anesthesia included in Class 11 and I.V. or I.M. sedation or general anesthesia administered in office, hospital or surgi-center by M.D. Anesthesiologist, Dental Anesthesiologist or Oral Surgeon. Also includes any anesthetic delivered in a hospital or surgi-center.
Class 30 Prosthodontist with all types of anesthesia allowed.
Class 40 General Dentist with anesthesia included in Class 11, 20 and I.V. or I.M. Sedation administered in office by policyholder.
Class 50 Oral Surgeon with all types of anesthesia allowed. Dental Anesthesiologist who also performs dental procedures and General Dentist with anesthesia included in Class 11, 20, and 40 and general anesthesia administered in office by policyholder.
Class 60 Dental Anesthesiologist who does not perform dental procedures.
V:\The Dentists Insurance Co - 114833\11\RCS\187656 - CA Rates\Exec - Anl\Class Descriptions - mod (Exh 16)Sheet16/29/2011 8:37 PM

V:\The Dentists Insurance Co - 114833\11\RCS\187656 - CA Rates\Exec - Anl\110629 CA Rate Filing exhs - PL GL.doc
Exhibit 17
THE DENTISTS INSURANCE COMPANY Professional & General Liability - Dentists
New Program
This is not a filing for a new program.

V:\The Dentists Insurance Co - 114833\11\RCS\187656 - CA Rates\Exec - Anl\110629 CA Rate Filing exhs - PL GL.doc
Exhibit 18
THE DENTISTS INSURANCE COMPANY Professional & General Liability - Dentists
Group Filing
This is not a filing for a group.
V:\The Dentists Insurance Co - 114833\11\RCS\187656 - CA Rates\Exec - Anl\110629 CA Rate Filing exhs - PL GL.doc
Exhibit 19
THE DENTISTS INSURANCE COMPANY Professional & General Liability - Dentists
Super Group Corporate Structure Verification (PPA only)
This is not a filing for Private Passenger Auto line of insurance.
V:\The Dentists Insurance Co - 114833\11\RCS\187656 - CA Rates\Exec - Anl\110629 CA Rate Filing exhs - PL GL.doc
Exhibit 20
THE DENTISTS INSURANCE COMPANY Professional & General Liability - Dentists
Rules
The company does not propose to amend any rules with this filing.