filing at a glance - vermont · filing at a glance company: bcbsvt product name: 2021 vermont...
TRANSCRIPT
Filing at a Glance
Company: BCBSVT
Product Name: 2021 Vermont Individual and Small Group Rate Filing
State: VermontGMCB
TOI: H16G Group Health - Major Medical
Sub-TOI: H16G.001C Any Size Group - Other
Filing Type: GMCB Rate
Date Submitted: 05/08/2020
SERFF Tr Num: BCVT-132371410
SERFF Status: Assigned
State Tr Num:
State Status:
Co Tr Num:
ImplementationDate Requested:
On Approval
Author(s): Jude Daye, Martine Brisson-Lemieux, Andrew Proulx, Matthew Goodrich
Reviewer(s): Thomas Crompton (primary), David Dillon, Jacqueline Lee, Christina McLaughlin, AmerinAborjaily, Michael Barber
Disposition Date:
Disposition Status:
Implementation Date:
State Filing Description:
SERFF Tracking #: BCVT-132371410 State Tracking #: Company Tracking #:
State: VermontGMCB Filing Company: BCBSVT
TOI/Sub-TOI: H16G Group Health - Major Medical/H16G.001C Any Size Group - Other
Product Name: 2021 Vermont Individual and Small Group Rate Filing
Project Name/Number: /
PDF Pipeline for SERFF Tracking Number BCVT-132371410 Generated 05/11/2020 09:51 AM

General Information
Project Name: Status of Filing in Domicile:
Project Number: Date Approved in Domicile:
Requested Filing Mode: Review & Approval Domicile Status Comments:
Explanation for Combination/Other: Market Type: Group
Submission Type: New Submission Group Market Size: Small
Group Market Type: Employer, Other Explanation for Other Group Market Type:
Overall Rate Impact: Filing Status Changed: 05/08/2020
State Status Changed:
Deemer Date: Created By: Jude Daye
Submitted By: Jude Daye Corresponding Filing Tracking Number:
PPACA: Non-Grandfathered Immed Mkt Reforms
PPACA Notes: null
Exchange Intentions: To be sold on Vermont Health Connect or directly toconsumers effective 01/01/2021.
Filing Description:
SERFF Tracking #: BCVT-132371410 State Tracking #: Company Tracking #:
State: VermontGMCB Filing Company: BCBSVT
TOI/Sub-TOI: H16G Group Health - Major Medical/H16G.001C Any Size Group - Other
Product Name: 2021 Vermont Individual and Small Group Rate Filing
Project Name/Number: /
PDF Pipeline for SERFF Tracking Number BCVT-132371410 Generated 05/11/2020 09:51 AM

Company and Contact
May 8, 2020
Thomas CromptonHealth Systems Finance Associate DirectorGreen Mountain Care Board144 State StreetMontpelier, Vermont 05620
Subject:Blue Cross and Blue Shield of Vermont - NAIC # 53295 2021 Vermont Individual and Small Group Rate Filing
Dear Mr. Crompton:
Attached for the Green Mountain Care Board’s review and approval is Blue Cross and Blue Shield of Vermont’s 2021 VermontIndividual and Small Group Rate Filing.
The average increase is 6.3 percent.
Increases for specific plans range from -0.7 percent to 13.3 percent. Apart from the Catastrophic plan and the Vermont SelectCDHP Gold, the increases range from 3.4 percent to 7.2 percent.
Please let me know if we can answer any questions or provide further information during your review.
Sincerely,
Ruth Greene
cc:Michael Barber/GMCB Amerin Aborjaily/GMCBPaul Schultz/BCBSVTMartine Lemieux/BCBSVTMichael Donofrio/Stris&Maher Bridget Asay/Stris&Maher
Filing Contact InformationJude Daye, Executive Assistant [email protected]
445 Industrial Lane
Montpelier, VT 05601
802-371-3244 [Phone]
Filing Company InformationBCBSVT
PO BOX 186
Montpelier, VT 05601
(802) 371-3450 ext. [Phone]
CoCode: 53295
Group Code:
Group Name:
FEIN Number: 03-0277307
State of Domicile: Vermont
Company Type: HospitalService Corp
State ID Number:
SERFF Tracking #: BCVT-132371410 State Tracking #: Company Tracking #:
State: VermontGMCB Filing Company: BCBSVT
TOI/Sub-TOI: H16G Group Health - Major Medical/H16G.001C Any Size Group - Other
Product Name: 2021 Vermont Individual and Small Group Rate Filing
Project Name/Number: /
PDF Pipeline for SERFF Tracking Number BCVT-132371410 Generated 05/11/2020 09:51 AM
Filing Fees Fee Required? Yes
Fee Amount: $150.00
Retaliatory? No
Fee Explanation:
SERFF Tracking #: BCVT-132371410 State Tracking #: Company Tracking #:
State: VermontGMCB Filing Company: BCBSVT
TOI/Sub-TOI: H16G Group Health - Major Medical/H16G.001C Any Size Group - Other
Product Name: 2021 Vermont Individual and Small Group Rate Filing
Project Name/Number: /
PDF Pipeline for SERFF Tracking Number BCVT-132371410 Generated 05/11/2020 09:51 AM

Rate Information Rate data applies to filing.
Filing Method: Experience Rated
Rate Change Type: Increase
Overall Percentage of Last Rate Revision: 12.430%
Effective Date of Last Rate Revision: 01/01/2020
Filing Method of Last Filing: Experience Rated
SERFF Tracking Number of Last Filing: BCVT-131936226
Company Rate Information
Company
Name:
Company
Rate
Change:
Overall %
Indicated
Change:
Overall %
Rate
Impact:
Written
Premium
Change for
this Program:
Number of Policy
Holders Affected
for this Program:
Written
Premium for
this Program:
Maximum %
Change
(where req'd):
Minimum %
Change
(where req'd):
BCBSVT Increase 6.340% 6.340% $18,557,919 23,810 $292,726,577 13.265% -0.656%
SERFF Tracking #: BCVT-132371410 State Tracking #: Company Tracking #:
State: VermontGMCB Filing Company: BCBSVT
TOI/Sub-TOI: H16G Group Health - Major Medical/H16G.001C Any Size Group - Other
Product Name: 2021 Vermont Individual and Small Group Rate Filing
Project Name/Number: /
PDF Pipeline for SERFF Tracking Number BCVT-132371410 Generated 05/11/2020 09:51 AM

Rate Review Detail
COMPANY:Company Name: BCBSVT
HHS Issuer Id: 13627
PRODUCTS:
Product Name HIOS Product ID HIOS Submission ID Number of Covered
LivesBCBSVT EPO (Individual) 13627VT034 10413BCBSVT EPO (Small Group) 13627VT032 12225BCBSVT EPO CDHP (Individual) 13627VT035 1863BCBSVT EPO CDHP (Small Group) 13627VT033 2263BCBSVT EPO Vermont Preferred(Individual)
13627VT038 2505
BCBSVT EPO Vermont Preferred (SmallGroup)
13627VT036 1159
BCBSVT EPO Vermont Select CDHP(Individual)
13627VT039 2846
BCBSVT EPO Vermont Select CDHP (SmallGroup)
13627VT037 5147
Trend Factors:
FORMS:New Policy Forms: N/A
Affected Forms: N/A
Other Affected Forms: N/A
REQUESTED RATE CHANGE INFORMATION:Change Period: Annual
Member Months: 520,581
Benefit Change: Increase
Percent Change Requested: Min: -0.656 Max: 13.265 Avg: 6.34
PRIOR RATE:Total Earned Premium: 292,726,577.00
Total Incurred Claims: 256,406,137.00
Annual $: Min: 265.36 Max: 805.41 Avg: 634.91
REQUESTED RATE:Projected Earned Premium: 311,284,496.00
Projected Incurred Claims: 276,605,385.00
Annual $: Min: 265.07 Max: 959.58 Avg: 675.16
SERFF Tracking #: BCVT-132371410 State Tracking #: Company Tracking #:
State: VermontGMCB Filing Company: BCBSVT
TOI/Sub-TOI: H16G Group Health - Major Medical/H16G.001C Any Size Group - Other
Product Name: 2021 Vermont Individual and Small Group Rate Filing
Project Name/Number: /
PDF Pipeline for SERFF Tracking Number BCVT-132371410 Generated 05/11/2020 09:51 AM
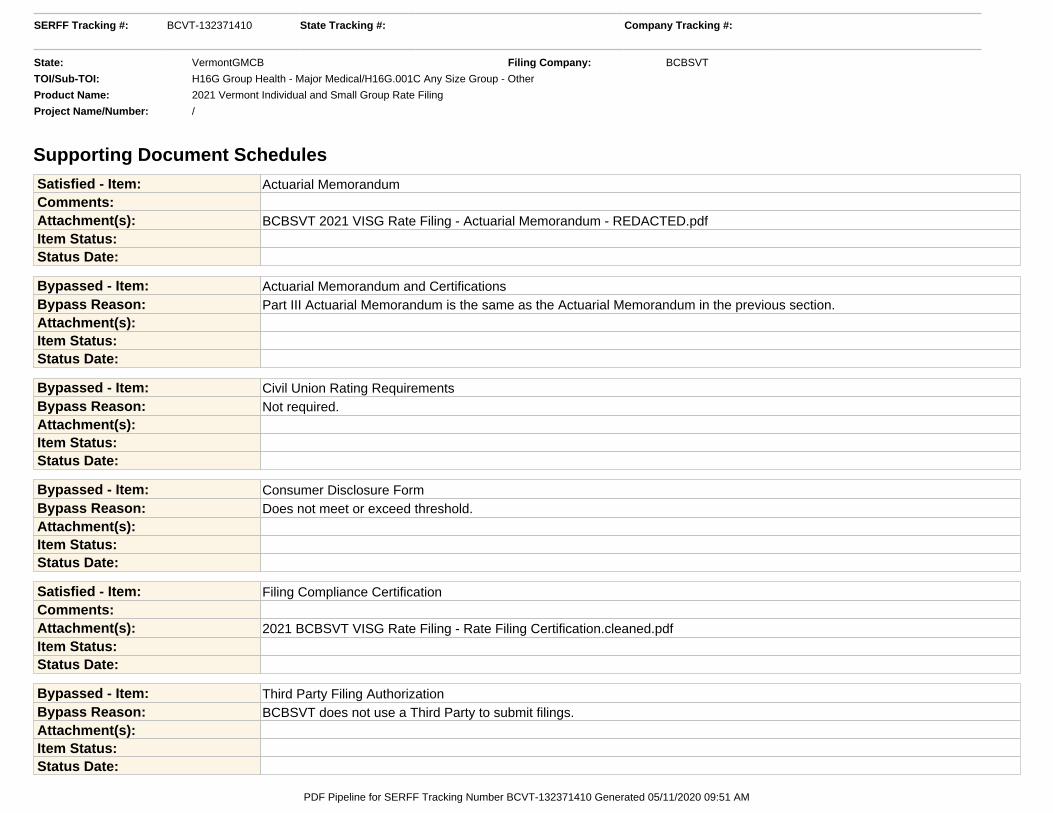
Supporting Document Schedules Satisfied - Item: Actuarial MemorandumComments:Attachment(s): BCBSVT 2021 VISG Rate Filing - Actuarial Memorandum - REDACTED.pdfItem Status:Status Date:
Bypassed - Item: Actuarial Memorandum and CertificationsBypass Reason: Part III Actuarial Memorandum is the same as the Actuarial Memorandum in the previous section.Attachment(s):Item Status:Status Date:
Bypassed - Item: Civil Union Rating RequirementsBypass Reason: Not required.Attachment(s):Item Status:Status Date:
Bypassed - Item: Consumer Disclosure FormBypass Reason: Does not meet or exceed threshold.Attachment(s):Item Status:Status Date:
Satisfied - Item: Filing Compliance CertificationComments:Attachment(s): 2021 BCBSVT VISG Rate Filing - Rate Filing Certification.cleaned.pdfItem Status:Status Date:
Bypassed - Item: Third Party Filing AuthorizationBypass Reason: BCBSVT does not use a Third Party to submit filings.Attachment(s):Item Status:Status Date:
SERFF Tracking #: BCVT-132371410 State Tracking #: Company Tracking #:
State: VermontGMCB Filing Company: BCBSVT
TOI/Sub-TOI: H16G Group Health - Major Medical/H16G.001C Any Size Group - Other
Product Name: 2021 Vermont Individual and Small Group Rate Filing
Project Name/Number: /
PDF Pipeline for SERFF Tracking Number BCVT-132371410 Generated 05/11/2020 09:51 AM

Satisfied - Item: Unified Rate Review TemplateComments:
Attachment(s):Unified-Rate-Review-Template-v5.1_0_BCBSVT_2021.pdfUnified-Rate-Review-Template-v5.1_0_BCBSVT_2021.xlsmUnifiedRateReviewSubmission_BCBSVT_2021_20200506225757_20200508141740.xml
Item Status:Status Date:
Satisfied - Item: Actuarial Memo DatasetComments:
Attachment(s): Actuarial Memo Dataset 2021_BCBSVT_2021.pdfActuarial Memo Dataset 2021_BCBSVT_2021.xlsx
Item Status:Status Date:
Satisfied - Item: AttachmentsComments:
Attachment(s):Attachment A - Standard Plans AV Certification 2021.pdfAttachment B - Non-Standard Plans AV Certification 2021.pdfAttachment C - Contribution to Policyholder Reserves - REDACTED.pdf
Item Status:Status Date:
Satisfied - Item: Rate TablesComments:
Attachment(s):PY21RateTables_BCBSVT_2021.pdfPY21RateTables_BCBSVT_2021.xlsPY21Rate_Data_BCBSVT_2021.xml
Item Status:Status Date:
Satisfied - Item: Plain Language SummaryComments:Attachment(s): BCBSVT 2021 VISG Filing - Plain Language Summary.pdfItem Status:Status Date:
Satisfied - Item: Exhibits
SERFF Tracking #: BCVT-132371410 State Tracking #: Company Tracking #:
State: VermontGMCB Filing Company: BCBSVT
TOI/Sub-TOI: H16G Group Health - Major Medical/H16G.001C Any Size Group - Other
Product Name: 2021 Vermont Individual and Small Group Rate Filing
Project Name/Number: /
PDF Pipeline for SERFF Tracking Number BCVT-132371410 Generated 05/11/2020 09:51 AM
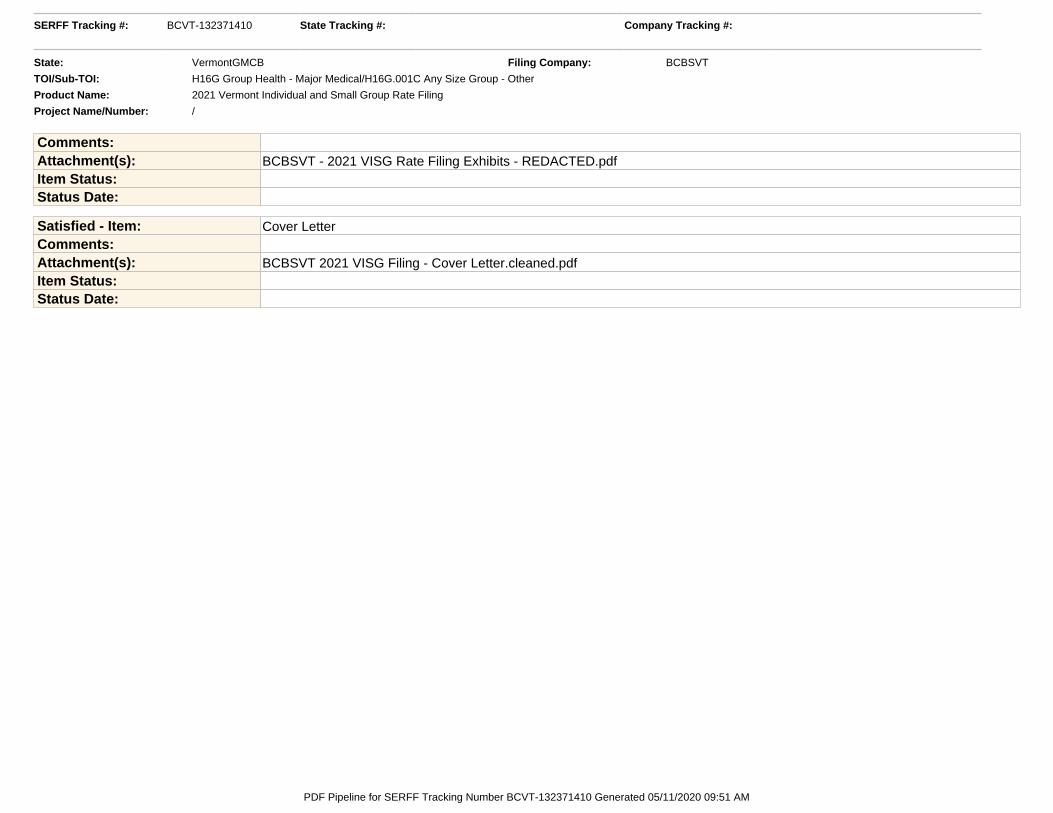
Comments:Attachment(s): BCBSVT - 2021 VISG Rate Filing Exhibits - REDACTED.pdfItem Status:Status Date:
Satisfied - Item: Cover LetterComments:Attachment(s): BCBSVT 2021 VISG Filing - Cover Letter.cleaned.pdfItem Status:Status Date:
SERFF Tracking #: BCVT-132371410 State Tracking #: Company Tracking #:
State: VermontGMCB Filing Company: BCBSVT
TOI/Sub-TOI: H16G Group Health - Major Medical/H16G.001C Any Size Group - Other
Product Name: 2021 Vermont Individual and Small Group Rate Filing
Project Name/Number: /
PDF Pipeline for SERFF Tracking Number BCVT-132371410 Generated 05/11/2020 09:51 AM
Attachment Unified-Rate-Review-Template-v5.1_0_BCBSVT_2021.xlsm is not a PDF document andcannot be reproduced here.
Attachment UnifiedRateReviewSubmission_BCBSVT_2021_20200506225757_20200508141740.xml isnot a PDF document and cannot be reproduced here.
Attachment Actuarial Memo Dataset 2021_BCBSVT_2021.xlsx is not a PDF document and cannot bereproduced here.
Attachment PY21RateTables_BCBSVT_2021.xls is not a PDF document and cannot be reproduced here.
Attachment PY21Rate_Data_BCBSVT_2021.xml is not a PDF document and cannot be reproduced here.
SERFF Tracking #: BCVT-132371410 State Tracking #: Company Tracking #:
State: VermontGMCB Filing Company: BCBSVT
TOI/Sub-TOI: H16G Group Health - Major Medical/H16G.001C Any Size Group - Other
Product Name: 2021 Vermont Individual and Small Group Rate Filing
Project Name/Number: /
PDF Pipeline for SERFF Tracking Number BCVT-132371410 Generated 05/11/2020 09:51 AM

BLUE CROSS BLUE SHIELD OF VERMONT 2021 VERMONT INDIVIDUAL AND SMALL GROUP RATE FILING
ACTUARIAL MEMORANDUM
1 | P a g e
1. GENERAL INFORMATION ......................................................................................................... 3
1.1. Company Identifying Information ....................................................................................................... 3
1.2. Company Contact Information............................................................................................................. 3
1.3. Scope and Purpose ................................................................................................................................ 3
1.4. Proposed Rate Increase(s).................................................................................................................... 4
1.5. Reason for Rate Increase(s) ................................................................................................................. 4
1.6. Historical Financial Results .................................................................................................................. 5
1.7. Environmental Factors ......................................................................................................................... 6
1.8. Vermont Statutory Rate Review Criteria ........................................................................................... 8
2. PROPOSED BENEFITS ............................................................................................................ 10
2.1. Description of Benefits ....................................................................................................................... 10
2.2. AV Metal Values ................................................................................................................................... 11
3. EXPERIENCE RATING ............................................................................................................. 12
3.1. Experience Period Premium and Claims .......................................................................................... 12
3.2. Benefit Categories ............................................................................................................................... 13
3.3. Index Rate............................................................................................................................................. 13
3.4. Projection Factors ............................................................................................................................... 15
3.4.1. Membership Projections .............................................................................................................15
3.4.2. Changes in the Morbidity of the Population Insured ..............................................................15
3.4.3. Changes in Benefits......................................................................................................................16
3.4.4. Changes in Demographics ...........................................................................................................17
3.4.5. Other Adjustments .......................................................................................................................18
3.4.6. Non-System Claims .......................................................................................................................18
3.4.7. Trend Factors (cost/utilization) .................................................................................................20
3.4.7.1. Medical Trend Development .........................................................................................................21
3.4.7.2. Pharmacy Trend Development .....................................................................................................28
3.4.7.3. Vision and Dental Trend Development ........................................................................................30
3.4.7.4. Overall Total Trend .......................................................................................................................31
BLUE CROSS BLUE SHIELD OF VERMONT 2021 VERMONT INDIVIDUAL AND SMALL GROUP RATE FILING
ACTUARIAL MEMORANDUM
2 | P a g e
3.4.8. COVID-19 ............................................................................................................................................... 32
3.5. Credibility of Experience ................................................................................................................... 33
3.6. Credibility manual rate development .............................................................................................. 33
3.7. Market Adjusted Index Rate .............................................................................................................. 33
3.7.1. Projected Risk Adjustment Transfer PMPM: ............................................................................33
3.7.2. Exchange User Fees .....................................................................................................................41
3.8. Plan Adjusted Index Rates ................................................................................................................. 42
3.8.1. Plan Adjustment – Actuarial Value and Cost Sharing adjustment ........................................42
3.8.1.1. Benefit Richness Adjustment ...............................................................................................42
3.8.1.2. Paid-to-Allowed Ratio ...........................................................................................................42
3.8.2. Silver Loading: ..............................................................................................................................43
3.8.3. Provider Network, Delivery System and Utilization Management adjustment: .................43
3.8.4. Adjustment for benefits in addition to the EHBs:...................................................................43
3.8.5. Impact of specific eligibility categories for the catastrophic plan .......................................43
3.8.6 Impact of Selection ............................................................................................................................44
3.8.7. Adjustment for distribution of the administrative costs .......................................................44
3.8.7.1. Administrative Expense Load: ..............................................................................................44
3.8.7.2. Profit (or Contribution to Reserves) & Risk Margin: ..........................................................48
3.8.7.3. Taxes and Fees: .....................................................................................................................49
3.8.8. Calibration .....................................................................................................................................49
3.8.9. Projected Loss Ratio ....................................................................................................................50
3.9. Consumer Adjusted Premium Rate Development .......................................................................... 50
3.10. Small Group Plan Premium Rates...................................................................................................... 50
4. ADDITIONAL INFORMATION ................................................................................................................ 51
4.1. Terminated Products .......................................................................................................................... 51
4.2. Plan Type .............................................................................................................................................. 51
4.3. Act 193 Information ............................................................................................................................ 51
5. RELIANCE AND ACTUARIAL CERTIFICATION ................................................................... 53
5.1. Reliance ................................................................................................................................................ 53
5.2. Actuarial Certification ........................................................................................................................ 53
BLUE CROSS BLUE SHIELD OF VERMONT 2021 VERMONT INDIVIDUAL AND SMALL GROUP RATE FILING
ACTUARIAL MEMORANDUM
3 | P a g e
1. GENERAL INFORMATION 1.1. Company Identifying Information
Company Legal Name: Blue Cross and Blue Shield of Vermont State: Vermont HIOS Issuer ID: 13627 Market: Combined Effective Date: January 1, 2021 1.2. Company Contact Information
Primary Contact Name: Paul A. Schultz, FSA, MAAA Primary Contact Telephone Number: 1-(802)-371-3763 Primary Contact Email Address: [email protected]
1.3. Scope and Purpose
The purpose of this rate filing is to provide the rates and a description of the rate development for the ACA-compliant plans for the Vermont Individual and Small Group merged market that Blue Cross and Blue Shield of Vermont (BCBSVT) proposes to offer for the 2021 benefit year. This rate filing applies to plans both On-Exchange and Off-Exchange. This filing is intended to comply with the following laws:
Vermont State Law 8 V.S.A. § 4062
Vermont State Law 8 V.S.A. § 4512
Vermont State Law 33 V.S.A. § 1806
Vermont State Law 33 V.S.A § 1811
Vermont State Law 33 V.S.A. § 1812
Vermont State Law 18 V.S.A. § 9375(b)(6)
DFR Order establishing tier rate structure and multipliers (Docket No. 13-002-I)
Vermont Agency of Human Services Health Benefits Eligibility and Enrollment Rule, Parts 1 and 2
Green Mountain Care Board, Rule 2.000
Federal Regulation 45 C.F.R. Part 147
Federal Regulation 45 C.F.R. Part 153
Federal Regulation 45 C.F.R. Part 154
Federal Regulation 45 C.F.R. Part 155
Federal Regulation 45 C.F.R. Part 156
Federal Regulation 45 C.F.R. Part 158
Federal Regulation 26 IRC § 223

BLUE CROSS BLUE SHIELD OF VERMONT 2021 VERMONT INDIVIDUAL AND SMALL GROUP RATE FILING
ACTUARIAL MEMORANDUM
4 | P a g e
1.4. Proposed Rate Increase(s)
The average increase is 6.3 percent. Increases for specific plans range from -0.7 percent to 13.3 percent. The range of increases is due to changes to the actuarial values and plan designs. Apart from the Catastrophic plan and the Vermont Select CDHP Gold, the increases range from 3.4 percent to 7.2 percent.
1.5. Reason for Rate Increase(s)
The starting point of any renewal rate analysis is an assessment of actual to expected experience results. The basis for this rate filing is calendar year 2019 experience. Claims experience for 2019 was very slightly favorable relative to the expectation embedded within the 2020 filing, driven by a 1.3 percent improvement due to BCBSVT cost containment programming that exceeded expectations. The addition of a favorable risk adjustment transfer resulted in a net decrease to 2021 rates of 1.4 percent for rebasing to the correct 2019 base experience The 2020 approved rates included assumptions for projecting from 2019 to 2020. Because this 2021 filing is based on updated actuarial assumptions that reflect current data, those assumptions must be re-examined. While some assumptions restated upward and others downward, the current projection of 2020 implicit in the 2021 rates does not differ from the projection in the 2020 filing. Therefore, the impact of rebasing the 2020 projection is zero.
Rebasing of 2020 2021 Rate
Impact
Impact of updated trends 0.7%
Impact of updated 2020 risk adjustment transfer 0.7%
Impact of updated population changes -1.4%
Total impact of rebasing the 2020 projection 0.0%
An additional year of projected trend applies from 2020 to 2021. The overall anticipated increase in rates due to the additional year of projection is 9.2 percent:
2020 to 2021 Trend Component
Filed 2021 2021 Rate
Impact
Medical Utilization 4.0% 3.2%
Medical Unit Cost 3.8% 3.1%
Pharmacy 13.4% 2.7%
Dental 0.7% 0.0%
Vision 0.0% 0.0%
Total 9.2%
Population changes from 2020 to 2021 have the effect of very slightly increasing rates by 0.4 percent. We project a higher risk adjustment receivable in 2021, driven primarily by population
BLUE CROSS BLUE SHIELD OF VERMONT 2021 VERMONT INDIVIDUAL AND SMALL GROUP RATE FILING
ACTUARIAL MEMORANDUM
5 | P a g e
changes, premium increases, and continual changes to the HHS model. The higher projected receivable reduces rates by 1.0 percent. Benefit changes made by the Department of Vermont Health Access for standard plans and by BCBSVT for non-standard plans only partially offset the impact of benefit leverage. Altogether, factors related to plan design, actuarial value, silver loading and induced utilization increased rates by 0.9 percent. BCBSVT base administrative charges increase premiums by 0.4 percent. BCBSVT is preparing to take over the billing for VHC enrolled members. Further, starting in plan year 2021, BCBSVT will offer members the opportunity to pay their premiums via debit or credit card. Projected 2021 expenses for these additional services increase premium by 0.6 percent. Federal and state taxes and fees are expected to decrease substantially in 2021. Driven primarily by the repeal of the federal insurer fee (also known as the Health Insurer Tax) after a one-year return, taxes and fees decrease premiums by 2.0 percent. BCBSVT has embarked on numerous efforts to mitigate premium increases. BCBSVT has continued to work closely with its pharmacy benefit manager to improve network pricing and maximize rebates. We have also developed strategies in partnership with our contracted lab benefit manager that have dramatically reduced expenditures on laboratory services. Altogether, these rate mitigation measures result in a reduction of 1.7 percent, or a projected $5.2 million. 1.6. Historical Financial Results
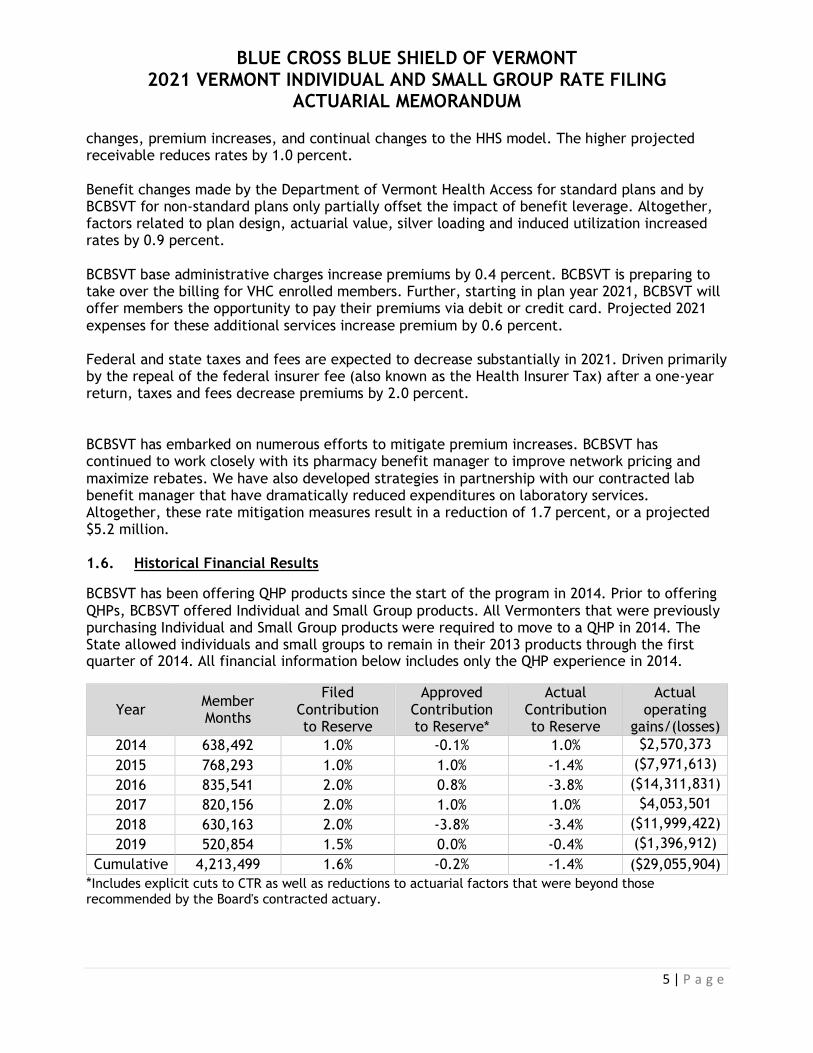
BCBSVT has been offering QHP products since the start of the program in 2014. Prior to offering QHPs, BCBSVT offered Individual and Small Group products. All Vermonters that were previously purchasing Individual and Small Group products were required to move to a QHP in 2014. The State allowed individuals and small groups to remain in their 2013 products through the first quarter of 2014. All financial information below includes only the QHP experience in 2014.
Year Member Months
Filed Contribution to Reserve
Approved Contribution to Reserve*
Actual Contribution to Reserve
Actual operating
gains/(losses)
2014 638,492 1.0% -0.1% 1.0% $2,570,373
2015 768,293 1.0% 1.0% -1.4% ($7,971,613)
2016 835,541 2.0% 0.8% -3.8% ($14,311,831)
2017 820,156 2.0% 1.0% 1.0% $4,053,501
2018 630,163 2.0% -3.8% -3.4% ($11,999,422)
2019 520,854 1.5% 0.0% -0.4% ($1,396,912)
Cumulative 4,213,499 1.6% -0.2% -1.4% ($29,055,904)
*Includes explicit cuts to CTR as well as reductions to actuarial factors that were beyond those recommended by the Board's contracted actuary.
BLUE CROSS BLUE SHIELD OF VERMONT 2021 VERMONT INDIVIDUAL AND SMALL GROUP RATE FILING
ACTUARIAL MEMORANDUM
6 | P a g e
The actual contribution to reserve was calculated by restating financial results to include the impacts of transitional reinsurance, risk adjustment and other prior year events in the year they were incurred, rather than the year when they were booked.
Since inception, BCBSVT has lost over $29 million on this line of business, leading to a reduction
of approximately 126 percentage points of Risk-Based Capital (RBC).
1.7. Environmental Factors
All Payer Model
The All Payer Model agreement between the State and CMS officially began Performance Year 1 on January 1, 2018. The first year of the program included scale target and performance requirements for an Accountable Care Organization (“ACO”) centric value based care arrangement. For the first time, Medicare, Medicaid and BCBSVT held risk based contracts with OneCare Vermont, LLC (“OneCare”). ACO performance for the All Payer Model is assessed by comparing per capita medical expense growth to the 2017 benchmarks. Under this new model, Medicare, Medicaid, and Commercial payers all enter into risk sharing agreements with the ACO, focusing on transitioning to value-based reimbursement methodologies. All beneficiaries keep their current benefits and provider choice — there are no network or benefit restrictions. BCBSVT remains the sole commercial health plan participating in Vermont’s All Payer Model.
Through deployment of new care models, the All Payer Model requires that the ACO strive to reduce cost and meet three health improvement goals: improved access to primary care, reduced deaths from suicide and drug overdose, and reduced prevalence and morbidity of chronic disease. BCBSVT’s agreement with OneCare aligns with the All Payer Model, including quality metrics, member engagement programs and collaboration efforts focusing on underlying programs supporting success in this program, as well as a medical expense target methodology aligned with filed and approved premiums. Alignment between BCSBVT premiums and the medical expense target is necessary both to demonstrate OneCare’s impact on health plan rates and to share savings with policyholders.
Continuation of the BCBSVT and OneCare agreement through 2020 and beyond demonstrates BCBSVT’s continuing leadership and support of health care payment reform and the goals of the All Payer Model. Together, BCBSVT and OneCare made tremendous progress in 2019 to increase participation in the program by including a substantial percentage of BCBSVT’s large group clients in the program. The addition of several thousand members provides additional scale to the All Payer Model, providing additional support to providers who are working to transform patient care.
Though a final reconciliation of 2019 results has not yet been completed, preliminary analysis indicates that OneCare’s performance likely did not result in savings relative to the medical expense target.
While shared accountability of total cost of care with providers is an important step, BCBSVT continues to evaluate areas to achieve savings and improve the health and experience of BCBSVT members. Applying experience and knowledge gained from the first two years of the shared risk agreement, BCBSVT is continuing to work closely with OneCare on targeted approaches to improve access to primary care and close gaps in care in a way that meaningfully impacts the
BLUE CROSS BLUE SHIELD OF VERMONT 2021 VERMONT INDIVIDUAL AND SMALL GROUP RATE FILING
ACTUARIAL MEMORANDUM
7 | P a g e
cost of care. These efforts are necessary to support the provider system as it works to improve the efficiency and effectiveness of the care delivery system.
Though BCBSVT remains committed to and optimistic about this important work, the performance to date of this arrangement gives no clear basis for projecting savings in the near term; as such, this filing does not include any adjustment to projected expenditures related to the OneCare program.
Cost Share Reduction Funding and the Vermont Silver Solution
As part of the Affordable Care Act, the federal Cost Share Reductions (CSR) program is available to benefit low income Vermonters. The CSRs reduce out-of-pocket expenses through lower deductibles, copayments and out-of-pocket maximums if the member enrolls in a Silver level plan, and must meet specific metal actuarial values (AVs).
Beginning in 2019, after the passage of Act 881, issuers are allowed to “load” Silver plans by including the estimated CSR cost into the premium for Silver Level Exchange Plans and offer non-loaded off exchange “Reflective Silver Plans.” This remains a temporary solution due to the present lack and future uncertainty of federal funding.
We believe that silver loading had a positive impact on the market, both by avoiding subsidization of the federal government by policyholders and by allowing subsidized members more freedom of choice through higher federal premium subsidies. Blue Cross is continuing to pursue a legal case to require payment for the lost CSR federal funding. While still in progress, developments in related cases are positive. If these funds are paid in 2021 or a future year, they will be used to mitigate future rate increases by replenishing member reserves that had been depleted by the loss of federal funding in 2017 and 2018.
Vermont State Legislature
The rates submitted reflect current law coverage, benefits and cost sharing amounts in place for 2021. The Vermont legislature is currently in session, and there are a number of bills being considered that could impact the 2021 rates described in this filing. If any of these bills pass and become effective for the 2021 plan year, BCBSVT expressly reserves the right to amend these submitted rates to reflect any changes required by new law.
COVID-19
The COVID-19 pandemic has caused unprecedented disruption to the health care system. Actuarial considerations for projecting 2021 costs are discussed in section 3.4.8. A more complete exploration of the BCBSVT response to COVID-19 can be found in Attachment C.
1 https://legislature.vermont.gov/assets/Documents/2018/Docs/ACTS/ACT088/ACT088%20As%20Enacted.pdf

BLUE CROSS BLUE SHIELD OF VERMONT 2021 VERMONT INDIVIDUAL AND SMALL GROUP RATE FILING
ACTUARIAL MEMORANDUM
8 | P a g e
1.8. Vermont Statutory Rate Review Criteria When reviewing a proposed rate the Green Mountain Care Board must consider:
whether a rate is affordable, promotes quality care, promotes access to health care, protects insurer solvency, and is not unjust, unfair, inequitable, misleading, or contrary to the laws of this State.
8 V.S.A. § 4062(a)(3). The Board must also consider the Department of Financial Regulation’s “analysis and opinion on the impact of the proposed rate on the insurer’s solvency and reserves.” 8 V.S.A. § 4062(a)(2)(B). The purpose of this memorandum is to provide the actuarial basis for the proposed rate. Although a number of the rate review criteria are not technically actuarial in nature, this section briefly explains how BCBSVT’s actuarial calculations relate to the criteria, with the understanding that (consistent with Board practice) these issues will be more fully developed during the rate review process. The in § 4062(a)(3) criteria are interdependent and, in some cases, in tension. This tension reveals itself most clearly in the interplay among promoting “access to health care,” “quality care” and determining whether a rate is “affordable.” For example, lowering rates to make them more “affordable” can render the rates insufficient to cover members’ claims, which in turn threatens access to quality care for insured. As another example, excluding coverage for new, high-cost specialty medications would certainly make rates more affordable, but at the expense of denying access to care for those in need of the medications.
Unlike quality care and access to care, “protection of insurer solvency” is demonstrably not in conflict with affordability. The Vermont Department of Financial Regulation considers insurer solvency to be the most fundamental aspect of consumer protection2. Insurer solvency is a necessary pre-condition for affordability, because reducing rates to levels that result in insurer insolvency would place the entire burden of the cost of care on consumers. Because members cannot likely afford their full cost of care, this result would cut off consumer access to care and impede providers’ ability to provide high-quality care. Furthermore, reductions producing rates that are inadequate to any extent do not promote long-term affordability, as they simply shift costs from current policyholders to future policyholders. The full funding of adequate rates is thereby critical to both insurer solvency and affordability3.
The federal rate review criteria of “not excessive” and “not inadequate” are tested by actuarial analysis. Actuarial Standard of Practice No. 84 provides guidance to actuaries preparing regulatory filings for health insurance premium rate increases. It defines rates as “adequate” if they provide for payment of claims, administrative expenses, taxes, and regulatory fees and have reasonable contingency or profit margins. Similarly, rates are “excessive” if they exceed the amount necessary for these items. As documented in Section 5.2, the rates filed herein are neither excessive nor inadequate. It follows that rates that are adequate but not excessive
2 See, for instance, DFR solvency opinion in filing BCVT-131497882. 3 While it is true that “affordability” is in conflict with “insurer profitability,” the latter quantity is not among Vermont rate review criteria. 4 http://www.actuarialstandardsboard.org/wp-content/uploads/2014/07/asop008_100.pdf

BLUE CROSS BLUE SHIELD OF VERMONT 2021 VERMONT INDIVIDUAL AND SMALL GROUP RATE FILING
ACTUARIAL MEMORANDUM
9 | P a g e
cannot jeopardize insurer solvency or be deemed to be unjust, unfair, inequitable or misleading. Neither are the rates contrary to Vermont law.
Here, projected increases in health care costs would have fueled a premium increase of 9.2 percent in the absence of actions undertaken by BCBSVT to mitigate the increase5.
Spending on specialty pharmaceuticals, through both the retail pharmacy and medical benefits, is driving 3.7 percentage points of the total rate increase. BCBSVT supports and protects our members by ensuring access to medications that significantly improve quality of life, and in many cases save lives. The cost of these drugs is an appropriate topic for public policy discussion, particularly given their impact on rates. However, in the absence of federal or state legislation mitigating the very high cost of these drugs, and given the need to provide access to this care, BCBSVT must include those costs in the rate development. The additional cost of providing these life-altering therapies is expected to lead to greater affordability and/or quality of life in the long term.
Finally, these rates strike the best balance available among affordability, access to care and quality care by providing coverage for necessary medical services that improve the quality of life of Vermonters at a cost of insurance that is far lower than that allowed by federal and State medical loss ratio requirements (see section 3.8.9). Increases in BCBSVT base administrative costs added only 0.4 percent, or just over a million dollars, to premiums, while new programming implemented by BCBSVT shaved over $5 million from required rates.
5 The premium increase was further mitigated by Congress permanently eliminating the Federal Insurer Fee.

BLUE CROSS BLUE SHIELD OF VERMONT 2021 VERMONT INDIVIDUAL AND SMALL GROUP RATE FILING
ACTUARIAL MEMORANDUM
10 | P a g e
2. PROPOSED BENEFITS 2.1. Description of Benefits BCBSVT will be offering two types (Standard and Non-Standard) of plans to the Individual and Small Group market in 2021. These plans include coverage for all Essential Health Benefits (EHBs). All plans are on the Exclusive Provider Organization (EPO) network and offer members access to a nationwide network of providers, including over 94 percent of the providers in Vermont. BCBSVT Standard Plans: BCBSVT is providing rates for the Standard plans with benefits as approved by the Green Mountain Care Board, which are outlined in Exhibit 1A – “State of Vermont Standard Plan Designs.” The form filing for these products can be found under BCVT-132314197 for deductible plans and BCVT-132314338 for CDHP plans. BCBSVT is also providing rates for the catastrophic plan, also outlined in Exhibit 1A. The form filing for this plan can be found under BCVT-132314394.
BCBSVT Non-Standard Plans: BCBSVT is providing rates for two non-standard products. The first product, Vermont Select CDHP, offers HSA compatible plans with deductible at the same level as the out-of-pocket. The second product, Vermont Preferred, offers plans with zero cost share for some primary care or mental health visits and some specialist visits to manage diabetes and heart disease. Both products waive deductibles for wellness drugs. Please see Exhibit 1B – “Non-Standard Plan Designs” for details on the benefit structure. The form filing for these products can be found under BCVT-132314366 for Vermont Preferred and BCVT-132314340 for Vermont Select CDHP.
Reflective Silver Plans As described in section 1.7, pursuant to Act 88, BCBSVT will be offering certain silver plans only off-exchange for the 2021 plan year. These plans will be “reflective” of the Exchange plans and only have a $5 copayment, 5% coinsurance or $25 deductible difference from the Exchange plan. Uniform Compliance Benefits of all Standard plans and Vermont Select CDHP are in compliance with 45 CFR §147.106. Specifically, the benefits continue to be offered on BCBSVT’s Exclusive Provider Organization (EPO) network and continue to cover the same service area. Some cost sharing levels were modified to maintain the same metal tier levels. Each product covers the same benefits as covered for plan year 2020.
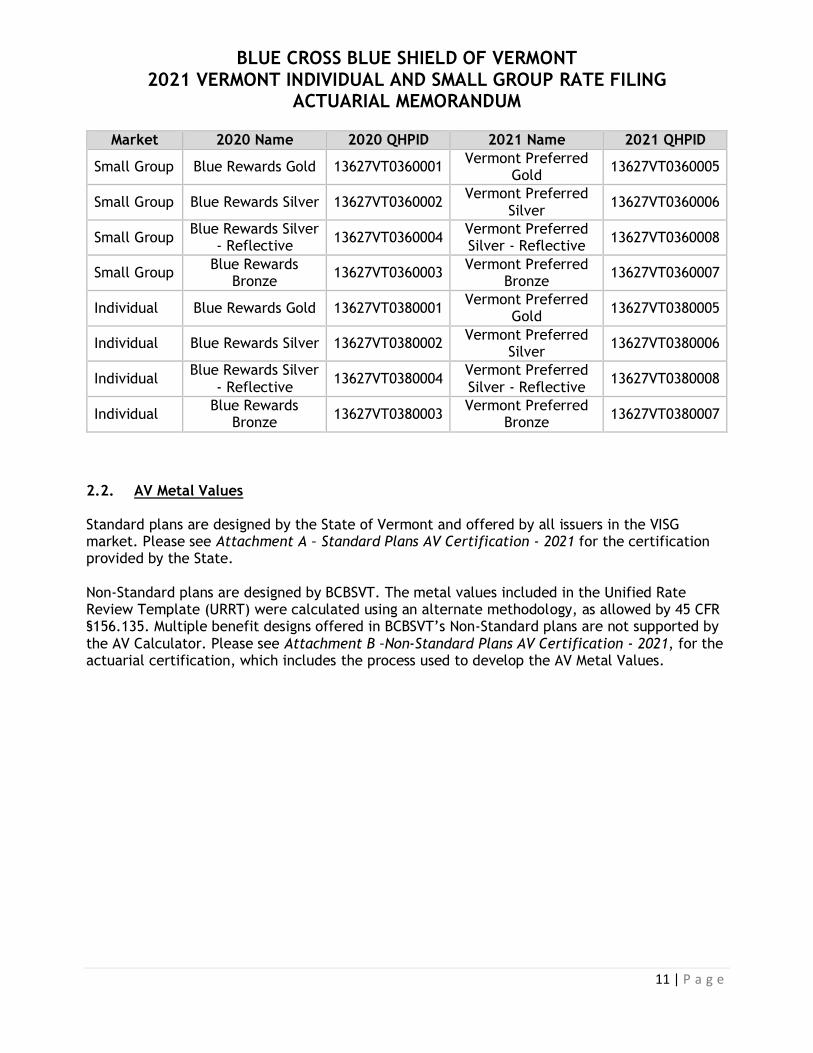
The changes to the Vermont Preferred benefit are not a uniform modification. The benefits continue to be offered on BCBSVT’s Exclusive Provider Organization (EPO) network and continue to cover the same service area. Each product covers the same benefits as covered for plan year 2019. However, in order to provide new and unique benefits to members with certain diagnosed conditions, some cost sharing levels were modified beyond those required only to maintain the same metal tier levels. BCBSVT received approval to withdraw the 2020 plans and replace with 2021 versions. The table below shows the mapping for this change:
BLUE CROSS BLUE SHIELD OF VERMONT 2021 VERMONT INDIVIDUAL AND SMALL GROUP RATE FILING
ACTUARIAL MEMORANDUM
11 | P a g e
Market 2020 Name 2020 QHPID 2021 Name 2021 QHPID
Small Group Blue Rewards Gold 13627VT0360001 Vermont Preferred
Gold 13627VT0360005
Small Group Blue Rewards Silver 13627VT0360002 Vermont Preferred
Silver 13627VT0360006
Small Group Blue Rewards Silver
- Reflective 13627VT0360004
Vermont Preferred Silver - Reflective
13627VT0360008
Small Group Blue Rewards
Bronze 13627VT0360003
Vermont Preferred Bronze
13627VT0360007
Individual Blue Rewards Gold 13627VT0380001 Vermont Preferred
Gold 13627VT0380005
Individual Blue Rewards Silver 13627VT0380002 Vermont Preferred
Silver 13627VT0380006
Individual Blue Rewards Silver
- Reflective 13627VT0380004
Vermont Preferred Silver - Reflective
13627VT0380008
Individual Blue Rewards
Bronze 13627VT0380003
Vermont Preferred Bronze
13627VT0380007
2.2. AV Metal Values Standard plans are designed by the State of Vermont and offered by all issuers in the VISG market. Please see Attachment A – Standard Plans AV Certification - 2021 for the certification provided by the State. Non-Standard plans are designed by BCBSVT. The metal values included in the Unified Rate Review Template (URRT) were calculated using an alternate methodology, as allowed by 45 CFR §156.135. Multiple benefit designs offered in BCBSVT’s Non-Standard plans are not supported by the AV Calculator. Please see Attachment B –Non-Standard Plans AV Certification - 2021, for the actuarial certification, which includes the process used to develop the AV Metal Values.

BLUE CROSS BLUE SHIELD OF VERMONT 2021 VERMONT INDIVIDUAL AND SMALL GROUP RATE FILING
ACTUARIAL MEMORANDUM
12 | P a g e
3. EXPERIENCE RATING 3.1. Experience Period Premium and Claims Our analysis begins with the 2019 experience of Blue Cross and Blue Shield of Vermont (BCBSVT) Individual and Small Group markets. We will refer to this population as the Single Risk Pool. We analyzed claims incurred January 1, 2019 through December 31, 2019 and paid through February 29, 2020. We completed both the paid claims and the allowed charges using BCBSVT’s monthly reserving models that underpin the financial statement reserves (best estimates before margin). These methods are subject to review by independent auditors and examination by Vermont Department of Financial Regulation (DFR). For the purpose of calculating completion factors, the reserving method categorizes claims by reporting/payment process (Local, BlueCard, Pharmacy, Medicare Supplement, etc.). We calculate completion factors separately for each category. We also included an estimate of IBNR for the outstanding pharmacy rebates.
The paid claims and allowed charges come directly from claim records in BCBSVT’s data warehouse. For fee-for-service claims, we combined plan payment with member cost sharing to calculate the allowed charges. For claims under a capitation arrangement, we combined capitation paid to the provider with the member cost sharing to generate allowed charges. The table below shows details underlying the Incurred Claims and Allowed Claims (from URRT, Section I of Worksheet 1) for the Experience Period.
Incurred Claims Allowed Claims
Claims incurred January 1, 2019 through December 31, 2019 and paid through February 29, 2020
$292,938,515 $ 347,812,930
Estimate of IBNR for claims incurred January 1, 2019 through December 31, 2019 as of February 29, 2020
$2,151,106 $1,606,760
Estimate of IBNR pharmacy rebates incurred January 1, 2019 through December 31, 2019 as of February 29, 2020
($3,157,054) ($3,157,054)
Total completed experience period claims $291,932,567 $346,262,636
Member months 520,581 520,581
Total per member per month (PMPM) $560.78 $665.15
The experience period total allowed charges PMPM are $665.15. In the experience period, the earned premium was $309,718,520. BCBSVT will not be required to pay Minimum Loss Ratio (MLR) rebates for the 2019 calendar year. Vermont does not currently have a 1332 waiver for a Reinsurance program. The estimated 2019 risk adjustment receivable, based on the information from the Interim Report, is $20,997,656.

BLUE CROSS BLUE SHIELD OF VERMONT 2021 VERMONT INDIVIDUAL AND SMALL GROUP RATE FILING
ACTUARIAL MEMORANDUM
13 | P a g e
3.2. Benefit Categories Medical claims are initially categorized into two categories based on the type of claim form the provider submitted: UB-04/CMS 1450 (Facility Inpatient/Outpatient) or HCFA/CMS 1500 (Professional/Other). We then separate facility claims into the Inpatient and Outpatient categories in Worksheet 1, Section II of the URRT by the place of service listed on the UB-04 claim form. Professional and Other medical claims are subdivided based on whether the provider is a medical professional or medical supplier as submitted on the HCFA 1500 claim form. We populate the prescription drug benefit category for claims processed through our pharmacy benefit manager. We populate the capitation benefit category with claims that run through our internal capitation system. The capitation category uses “Benefit Period” as a utilization description and the units represent the number of capitations in a given year. 3.3. Index Rate The Index Rate is equal to the experience period allowed charges for EHB. As shown in section 3.1, the allowed charges per member per month in the experience totals $703.28. In 2017, BCBSVT removed an exclusion for routine circumcision (see section 3.8.3 for details). Those services are not considered EHB and must be removed from the experience to calculate the Index Rate.
PMPM
Allowed Claims in section 1 of worksheet 1 of URRT $665.15
Allowed Claims for Non-EHB $0.08
Experience Index Rate in section 2 of worksheet 1 of URRT $665.07
The experience index rate for 2019 is $665.07. To calculate the Projected Period Index Rate, we first excluded pharmacy rebates, BlueCard fees, and payments to the Blueprint program. These claims are not dependent on benefits and are not subject to the projection factors described in the following sections. They are added back into the Projected Period Index Rate as described in section 3.4.6. BCBSVT has access to the detailed claims information underlying capitated claims. We use the FFS equivalent rather than the capitation. These adjustments are included in the “Other” factor in the section II of worksheet 1 of the URRT.

BLUE CROSS BLUE SHIELD OF VERMONT 2021 VERMONT INDIVIDUAL AND SMALL GROUP RATE FILING
ACTUARIAL MEMORANDUM
14 | P a g e
Total Dollars PMPM
Allowed Claims in section 1 of worksheet 1 of URRT $346,262,636 $665.15
Remove BlueCard Fees ($1,248,364) ($2.40)
Remove Pharmacy Rebates $9,924,906 $19.07
Remove Payments to Blueprint Program ($1,992,320) ($3.83)
Replace Capitation with FFS equivalent ($1,562,706) ($3.00)
Line A of Exhibit 5 $351,384,152 $675.98
3.3.1. Pooling experience claims Starting in 2020, BCBSVT purchased reinsurance coverage for the VISG population that covers the portion of claims above one million dollars that is not already reimbursed by the high cost risk pool. To project the claims above the pooling point, we cap the claims and include the full cost of reinsurance and high cost risk pool. To cap the projected claims, we calculate the de-trended pooling level by removing the total trend (see section 3.4.7 for details) from the attachment point of one million dollars. We then exclude the claims above the resulting de-trended limit of $849,023.
CY 2019 total allowed claims (including AHP returning to VISG) A $364,168,549
Claims above $849,023 B $1,225,572
Capped Claims C = A - B $362,942,977
Impact of capping claims (1+a3 on Exhibit 5) D = C/ A 0.9966
BLUE CROSS BLUE SHIELD OF VERMONT 2021 VERMONT INDIVIDUAL AND SMALL GROUP RATE FILING
ACTUARIAL MEMORANDUM
15 | P a g e
3.4. Projection Factors 3.4.1. Membership Projections
As of February 2020, BCBSVT had 39,195 members enrolled in the single risk pool, either individually through Vermont Health Connect or directly as individuals or small group employees. We used this information as the starting point to project the 2021 enrollment and the distribution by plan. BCBSVT currently covers employees and dependents of a sizable group whose members are younger than the remainder of the single risk pool and are exclusively enrolled in the Platinum plan. As this group was established for a specific and temporary effort, we do not expect them to continue enrollment into 2021. We are excluding these members from all our membership projection factors.
Exhibit 2A shows the 2021 BCBSVT Individual and Small Group projected population by plan and market. BCBSVT expects to cover 461,052 member months with this filing. We use this projected membership to adjust our Index Rate for demographics, morbidity, benefit changes, and other allowable adjustments described below.
3.4.2. Changes in the Morbidity of the Population Insured
Impact of Association Health Plans (1+b5) Starting in 2019, Association Health Plans (AHPs) became available to Small Employers. Renewal of these plans was prohibited by federal law. Some, but not all, employers who had purchased AHP benefits in 2019 enrolled in BCBSVT VISG products in 2020. To adjust for these members, we included their claims and member months along with VISG small groups in the various population factors described below. We also made an explicit adjustment to reflect their level of claims compared to the single risk pool in 2019. Pediatric dental and vision benefits we either not offered through BCBSVT or were offered as a rider to the groups. We assume that AHP groups would have had the same PMPM pediatric dental and vision experience as VISG small groups. The calculation of the 1+b5 factor on Exhibit 5 is shown on Exhibit 2B. Changes in pool morbidity (1+b9) This factor measures morbidity differences between the experience period population and projection period population due to choices made by small groups and individuals to voluntarily disenroll from BCBSVT VISG coverage. The impact is measured by observing experience period claims costs for groups and members known to be no longer enrolled as of February 2020. The base for our experience period is calendar year 2019. Using February 2020 enrollment, we grouped members into broad categories of active and canceled. We can further divide canceled members into two categories: voluntary cancelation and cancelation due to death. We can further break down voluntary cancelations by aging out, cancellations from normal group turnover, and individual cancellations. We capture individuals aging out in our demographic

BLUE CROSS BLUE SHIELD OF VERMONT 2021 VERMONT INDIVIDUAL AND SMALL GROUP RATE FILING
ACTUARIAL MEMORANDUM
16 | P a g e
adjustment (see section 3.4.5). In 2020, we again experienced significant cancelations in the Small Group segment. To reflect this, we are adjusting for Small Group members leaving BCBSVT VISG. If all members in a group are no longer enrolled in BCBSVT VISG, we exclude them under the assumption that the entire group moved to a different carrier or different product. If members that canceled were part of a group that is still with BCBSVT VISG, we assumed that group turnover will lead to the hiring of similarly-situated individuals; therefore, an adjustment is not needed for such members. We also excluded members from a sizable group established for a specific and temporary effort, as we do not expect them to continue enrollment into 2021. We split the experience claims costs based on these categories in order to compare the different populations. We adjusted the allowed charges from the experience period to reflect the average claims cost of members who did not voluntarily terminate or are part of a small group still enrolled with BCBSVT prior to the end of calendar year 2019. To ensure that the morbidity and benefit change factors are independent, we adjusted the PMPM to reflect the underlying average induced utilization.
Voluntary Cancelation
in the Individual
Market
Members in Groups
that are no longer with
BCBSVT VISG
All Other Members
Total
Experience Period Allowed $304,699,425 $364,197,058
Member Months 450,000 540,594
PMPM $677.11 $673.70
Experience Period Average Induced Utilization
1.0003 1.0000
PMPM after normalization for induced utilization
$676.91 $673.70
The factor (1+b9 on Exhibit 5) to adjust for the change in pool morbidity is $676.91/$673.70 = 1.0048. 3.4.3. Changes in Benefits Impact of changes in benefits (1+c1) The impact of benefit changes (1+c1 line on Exhibit 5), represents the anticipated change in the average utilization of services due to the change in average cost sharing in the projection period compared to the experience period. In previous filings, we used BCBSVT VISG allowed relativities to calculate this factor. This approach implicitly includes the impact of selection and morbidity. We believe it is more appropriate to use the HHS induced utilization factors by metal to limit the quantification to only the impact of varying cost shares between the experience plan distribution and the projected plan distribution. For groups in AHP in 2019, we assigned a metal level to each of the plans offered. Using the experience member months for members included in the “All Other Members” category of the morbidity factor described above and the projected

BLUE CROSS BLUE SHIELD OF VERMONT 2021 VERMONT INDIVIDUAL AND SMALL GROUP RATE FILING
ACTUARIAL MEMORANDUM
17 | P a g e
membership by metal, we calculated an average induced utilization factor for each and compared the two averages to generate the impact of changes in benefits. The impact of the movement among benefit plans is 0.9961, as shown on Exhibit 2C. 3.4.4. Changes in Demographics Impact of changes in demographics (1+c3) To ensure that we accounted for all moving pieces of the reasons for the change in demographics, we have changed our method for developing the change in demographic factor (factor 1+c3 on Exhibit 5). We calculated factors for small groups, including AHP groups who return to BCBSVT VISG, and for individuals. We then combined the factors based on projected membership. For both market segments, we used the age-gender factors from the SOA’s report Health Care Cost – From Birth to Death6 to calculate the age-gender factors for the experience membership to those of the projected 2021 membership. For small groups, we first observed the historical annual increases in average age-gender factors for continuing and new groups, excluding a sizable group established for a specific and temporary effort. After adjusting for excluding this sizable group, we apply the most recent increase including the new groups to the experience average age-gender factor, to project from 2019 to 2020. Because we assume no material enrollment shifts in 2021, we apply the most recent increase excluding new groups from 2020 to 2021. For individuals, we first split into VHC-enrolled and direct-enrolled members. We then categorized each member in the following sub-categories: continue, retired, newborn, to other BCBSVT line of business, and voluntarily canceled. For continuing members, we aged all members by one year starting with their February 2020 age and calculated the average duration by age. We assigned the age one duration to members age zero in 2020. We assessed historical persistency by age for members who are eligible for Medicare. Based on historical patterns, we assumed that 28 percent of members age 64 in 2020 would remain enrolled through 2021, and that 55 percent of members age 65 and over in 2020 would remained enrolled through 2021. Finally, in order to complete the age distribution, we added new members age zero in 2021. Again, we examined historical patterns to develop newborn assumptions. For the VHC enrolled population, we expect newborns to comprise 0.35 percent of the total population with an average duration of 3.52 months. For direct enrolled members, we expect the newborns to comprise 0.55 percent with an average duration of 4.84 months. We applied these percentages to the inforce 2020 enrollment to estimate the newborns in 2021. We then compared the experience period average age-gender factor to the projected period average age-gender factor. Finally, we combined the individual and small group impacts based on projected enrollment to calculate the demographic adjustment of 1.0070 (1+c3 factor on Exhibit 5). Details of the calculation are shown on Exhibit 2D.
6 https://www.soa.org/Research/Research-Projects/Health/research-health-care-birth-death.aspx
BLUE CROSS BLUE SHIELD OF VERMONT 2021 VERMONT INDIVIDUAL AND SMALL GROUP RATE FILING
ACTUARIAL MEMORANDUM
18 | P a g e
3.4.5. Other Adjustments The buildup of the Projected Index Rate also includes a factor to reflect new pharmacy contracts and adjustments for non-system claims7. Changes in Provider Network (1+c2) Since the experience period claims and the projection period claims are both on the EPO network, the factor for the change in provider networks (factor 1+c2 on Exhibit 5) is 1.000. Impact of the ACO program (1+b4 and 1+b6) In 2019, BCBSVT and OneCare VT (OCV) had a shared-risk/shared-savings agreement covering approximately 20,000 lives within the VISG market. The agreement provides for 50/50 sharing of savings or risk up to six percent above or below the expected medical spend, which is derived from the final approved GMCB rate order for the VISG market.
Our current best estimate of the 2019 transfer is zero. Therefore the factor for this program (1+b4 on Exhibit 5) is 1.000. BCBSVT extended the shared risk/shared-savings agreement with OneCare into 2020 and expects to continue the program in 2021. Due to the impact of the COVID-19 pandemic on providers, members and payers, we expect 2021 to be a recovery year. We therefore include no projected savings from health care reform initiatives in 2021. The factor for these initiatives (1+b6 on Exhibit 5) is 1.000.
3.4.6. Non-System Claims
We add other costs to the buildup of the Projected Index Rate to account for non-system claims (Items e1-e8 on Exhibit 5). As previous explained in section 3.3, these non-system claims are claims that are independent from the benefits but considered claims from an MLR standpoint.
Pharmacy Rebates (e1): Since we have not yet received the details underlying the rebate payment for the fourth quarter of the 2019 calendar year, we use actual rebates from October 2018 through September 2019 as the base. We expect pharmacy rebates to trend at the same rate as Brand Drugs. As shown on Exhibit 3G, the projected total trend for Brand drugs is 7.6 percent, which brings projected pharmacy rebates to $29.91 PMPM.
Blueprint Payments (e2): BCBSVT participates in the Vermont Blueprint for Health8 program. The Vermont Blueprint for Health Manual, effective October 1, 2018, details the funding for both portions of the program: Community Health Teams (CHT) and Patient Centered Medical Homes (PCMH). We do not expect the funding for either CHT or PCMH to change in 2021. Therefore, we assumed that the experienced PMPM of $3.84 would continue to 2021.
7 Non-system claims are payments that are not processed through the claims adjudication system. 8 http://blueprintforhealth.vermont.gov/

BLUE CROSS BLUE SHIELD OF VERMONT 2021 VERMONT INDIVIDUAL AND SMALL GROUP RATE FILING
ACTUARIAL MEMORANDUM
19 | P a g e
Interplan Teleprocessing System (ITS) (e3): The BlueCard® Program gives BCBSVT members healthcare coverage wherever they go across the country and around the world. The fees associated with this program are independent of the amount of the claims and therefore solely dependent on utilization of BlueCard participating providers. As described below, we have selected an annual medical utilization trend, before the impact of the cost containment strategy, of 3.6 percent; therefore, these fees are assumed to increase at 3.6 percent annually. The experience period fees ($2.46 PMPM) are projected to grow to $2.64 PMPM in 2021.
Vermont Vaccine Purchasing Program Payments (e4): The Vermont Vaccine Purchasing Program9 (VVPP) offers health care providers state-supplied vaccines at no charge by collecting payments from health plans, insurers and other payers. This assessment is a PMPM charge applied to members residing in Vermont who are under age 65. On May 1, 2020, the Vermont Vaccine Purchasing Program released a memo10 that included the rates for SFY2021 and the anticipated rates for SFY202211: “The new monthly rate for child covered lives will be $9.26. The new monthly rate for adult covered lives will be $0.96. […] For planning purposes, the best estimate at this time for the SFY2022 assessment rate is $10.60 per child covered life per month and $1.09 per adult covered life per month.” Using the projected enrollment for children and adults, we calculate a projected period PMPM of $2.11 PMPM.
Age Category Weighted Rate for
CY 2021 Weight
Child $10.27 11.7%
Adult $1.06 86.1%
Over 65 $0.00 2.2%
Net Cost of Reinsurance (e5): BCBSVT uses reinsurance to protect itself against very high claims. Starting in 2020, BCBSVT purchased reinsurance for 40 percent of claims above $1 million. When combined with the High Cost Risk Pool program, BCBSVT is fully-reinsured at an attachment point of $1 million. Since we capped claims in the projected period allowed claims for EHB (line D of Exhibit 5) at $1 million, we include the full cost of reinsurance. The projected rate for this coverage in 2021 is $ PMPM.
OneCare Coordination Fee (e6): BCBSVT is paying OneCare VT a PMPM care coordination fee for attributed BCBSVT members to directly support ACO providers, including community providers, as they deploy new care models. This model mirrors the investment Medicaid has made in the ACO provider network
9 http://www.vtvaccine.org/ 10 https://www.vtvaccine.org/vtvaccine.nsf/documents/ApprovalofFY2021AssessmentRateNoticeandLetterfromCommissioner2.html/$File/2020-
04-23%20Assessment%20Rate%20Notice%20SFY2021%20and%20Commissioner%20Letter.pdf 11 The State Fiscal Year runs from April 1 through March 31.

BLUE CROSS BLUE SHIELD OF VERMONT 2021 VERMONT INDIVIDUAL AND SMALL GROUP RATE FILING
ACTUARIAL MEMORANDUM
20 | P a g e
and supports the comprehensive care models being tested within the ACO program. The monthly PMPM for members attributed to OneCare is $3.25. For 2021, we expect that the commercial ACO network will include the same hospitals as in the 2020 network. As of March 2020, 50 percent of the Single Risk Pool was attributed to the 2020 OneCare network. The projected PMPM is therefore $1.63 = $3.25 x 0.50.
ESI Additional Administration Fees (e7): ESI offers additional services to BCBSVT for clinical management programs. These programs include prior authorizations, step therapy, quantity reviews, copay reviews, and pharmacy vaccination programs, as well as ESI’s RationalMedSM program, which protects patients against potentially harmful drug interactions. The total PMPM in the experience period was $ PMPM for these services, and we project them to be the same in 2021.
Accordant Health Services Fees (e8) BCBSVT partners with Accordant Health Services to provide members support with managing their rare diseases. The program targets patients with complex, chronic diseases in neurology, rheumatology, hematology and pulmonology. Accordant provides early intervention and patient compliance services to support BCBSVT’s care management strategies, improve patient health and strengthen physician-patient relationships. The total PMPM in the experience period was $ PMPM for these services, and we project the PMPM to be the same in 2021.
3.4.7. Trend Factors (cost/utilization) The source of the data is BCBSVT’s data warehouse, except where noted below. To ensure accuracy of claims information, the data has been reconciled against internal reserving, enrollment, and other financial reports. The analysis examined claims incurred between January 1, 2015 and December 31, 2019, completed through February 29, 2020. We applied completion factors, based on best estimates from financial reporting before margin for conservatism, to estimate the ultimate incurred claims for each period shown in the exhibits. The data includes claims from the Single Risk Pool and the non-VISG experience for groups with 51-100 employees that joined the Single Risk Pool in 2016, when Vermont changed the definition of Small Group to include groups with 51-100 employees. Over the past few years, we have experienced membership retroactivity, primarily associated with members enrolled through VHC. This retroactivity causes some claims to no longer be associated with active membership. The data excludes claims that are no longer associated with active enrollment. BCBSVT experienced large membership movement out of the VISG market in 2018, 2019 and 2020. We analyzed the individual and small group markets separately, except for pharmaceuticals that are part of the medical benefit. Due to significant changes in membership, we included only membership and claims from small groups that have been with BCBSVT since 2015. Using a static population with demographic adjustment normalizes for changes in population morbidity over time. We did not include a similar restriction in the individual market analysis; however, the individual market adjusted year over year utilization trends for facility, professional and retail pharmacy are consistent with or lower than those for the small group market, indicating that demographic adjustment has appropriately removed any increased

BLUE CROSS BLUE SHIELD OF VERMONT 2021 VERMONT INDIVIDUAL AND SMALL GROUP RATE FILING
ACTUARIAL MEMORANDUM
21 | P a g e
morbidity from the individual market trends. We weighted the adjusted results for each market segment by in-force membership to reflect the mix between the markets, thereby normalizing for the unequal membership shifts by market over time. 3.4.7.1. Medical Trend Development Using the historical contracted reimbursement schedules, we calculate network factors that represent the various contracts. Using these factors, we can modify the claims to reflect a common contract. From there, we can observe the historical cost increases using all claims information. Medical trend is composed of three pieces: cost, utilization, and intensity. In our analysis, we combine utilization and intensity within the utilization metric and analyze the unit cost separately. We normalize historical experience for contract changes so that we can derive a utilization trend in the absence of unit cost changes. We develop future unit cost trends on a discrete basis, using the most recent round of contract negotiations as a starting point. The overall trend is the product of these two components. Unit Cost Observations of recent contracting and provider budgetary changes are the main source of unit cost trend. During calendar year 2019, about 53 percent of total medical claims dollars occurred at Vermont facilities and providers impacted by the hospital budget review process of the Green Mountain Care Board (GMCB). For hospitals under the jurisdiction of the GMCB, we start with the assumption that the GMCB will approve hospital budgets for October 1, 2020 and October 1, 2021 that support identical commercial increases as those approved for October 1, 2019.
Based upon the above assumptions concerning hospital
budget and fee schedule changes, the provider contracting and actuarial departments worked together to assess the impact such an increase would have on contract negotiations specific to the EPO network used for the VISG market. Similarly, we assumed for other providers within the BCBSVT service area that overall 2020 and 2022 budget increases would be identical to those implemented during calendar 2019, with the exception that we have reflected any more recent information gleaned from our early negotiations with providers. Again, the provider contracting and actuarial departments worked closely together to assess the impact these assumptions about other providers within the BCBSVT service area would have on contract negotiations specific to the EPO network used for the VISG market. BCBSVT entered into a contract with a lab benefit manager (LBM) in August 2019 that instigated dramatic changes in the cost of independent labs. To recalibrate to the LBM fee schedule, we recalculated the cost of labs using the October 2019 fee schedule for January 2019 through September 2019 and assumed that 2020 and 2021 would remain at that level. For drugs dispensed in a facility or office, we used the average increase for each facility or provider group to calculate an estimated unit cost trend. As described below, we calculated an overall allowed trend for these drugs but, per the URRT instructions, we must separate cost and

BLUE CROSS BLUE SHIELD OF VERMONT 2021 VERMONT INDIVIDUAL AND SMALL GROUP RATE FILING
ACTUARIAL MEMORANDUM
22 | P a g e
utilization. This estimated unit cost trend is used for URRT purposes as actual unit cost increases by type of service are not readily available. Finally, unit cost increases for providers outside the BCBSVT service area were derived from the Fall 2019 Blue Trend Survey, which is a proprietary and confidential dissemination of the Blue Cross and Blue Shield Association. The chart below summarized the results of the analysis:
Annual Reimbursement Changes due to Budget Increases and Contracting Season
Percent of Total
Allowed Medical
Claims in Experience
Cost Trend from 2019 to
2020
Cost Trend from 2020 to
2021
Total Annual Cost Trend
Vermont facilities and providers impacted by GMCB’s Hospital Budget Review
53.2% 4.2% 4.2% 4.2%
Other facilities and providers 46.8% 2.3% 3.4% 2.9%
Total 100.0% 3.3% 3.8% 3.6%
Pages 1 through 5 of Exhibit 3A show the details of the cost increases by contract and type of claim. Utilization & Intensity To examine historical utilization trend patterns we first normalize for unit cost increases. We measure contract changes for the entirety of the experience period explicitly for each facility within our service area, as well as the three largest physician groups and independent labs. We measure increases for fee schedules and other chargemasters by applying each schedule to a market basket of services. We define the market basket by using Current Procedural Terminology (CPT) codes & CPT modifier combinations that were present in each of the effective periods the schedules covered. Using the same experience period data used throughout the trend analysis, we compare total allowed costs for the selected combinations of CPT and CPT modifier under each schedule to estimate the percentage increase. For contracts under Diagnosis Related Group (DRG) arrangements, we compared the charge for the 1.000 DRG service for each period. Finally, for services under a discount of charge arrangement, we used the contracted chargemaster increase provided by our Provider Contracting department. Contracting changes for out-of-area services were derived from the Fall 2019 Blue Trend Survey, which is a proprietary and confidential dissemination of the Blue Cross and Blue Shield Association.

BLUE CROSS BLUE SHIELD OF VERMONT 2021 VERMONT INDIVIDUAL AND SMALL GROUP RATE FILING
ACTUARIAL MEMORANDUM
23 | P a g e
We normalized claims to the December 2019 contract at each unique provider by applying a factor equal to the product of the impact of each contracting change from the experience month through December 2019. We assume the derived trend for other claims to be continuous. To ensure that random high claims did not skew the trend calculation, we removed all claims from members who exceeded $500,000 in allowed medical claims in a calendar year. As the utilization component includes intensity, an increase in high cost claimants can disproportionately impact the year-over-over and regression calculations. We have selected the following utilization trends:
Category Annual Selected Utilization Trend
Facility 1.1%
Professional 2.2%
Medical Drugs 18.5%
The selection of utilization trend is a complex process that requires observations of historical patterns, statistical analysis and understanding of the different external forces that can influence claims costs in both the experience and projection periods. We analyzed each claim category separately and weighted the selected trends using experience period PMPM claims to derive an overall trend. To adjust for the influence of benefit richness on the utilization of services as benefits vary over time, we calculated the average induced utilization factor based on the actuarial values of the plans in the experience and adjusted each month to reflect the benefits in place in December 2019. Using SOA’s report Health Care Cost – From Birth to Death factors, we calculated the average age-gender factors for the members included in the development. To normalize for the influence of changing demographics over time, we adjusted each month in to reflect the age-gender factor evident in December 2019. Since early 2014, BCBSVT implemented many new programs to combat fraud, waste and abuse (FWA). As shown in the table below, the return of FWA programs has increased rapidly from 2015 to 2018. Due to BCBSVT’s migration to a new operating platform, FWA programs slowed in 2019.
Calendar Year Percent of claims recovered
as part of FWA programs
2015 0.81%
2016 1.05%
2017 1.09%
2018 1.42%
2019 0.77%
BLUE CROSS BLUE SHIELD OF VERMONT 2021 VERMONT INDIVIDUAL AND SMALL GROUP RATE FILING
ACTUARIAL MEMORANDUM
24 | P a g e
The change in recoveries could skew the trend calculation. We have therefore adjusted the claims to reflect 2019 recovery rates. Due to COVID-19, we have stopped some FWA programs in 2020, and it is unclear at this time when we will start them again. For this reason, we assume that the percentage of claims recovered through these programs will remain at approximately three-quarters of percent of total allowed claims over the next two years. We have accordingly not adjusted the trend for future improvements in FWA efforts. We normalized the claims cost such that each month reflects the average number of working days per month in 2019, as defined by our reserving models. The individual and small group population have very different claim levels, and the change in mix of these distinct populations skews the trend analysis. To adjust for this, we performed all calculations by market and blended the results based on in-force membership as of February 2020. Exhibit 3B shows the calculation and resulting factors for these adjustments for each market. Facility Claims For facility claims, we select a 1.1 percent utilization trend. Using the array of PMPM claims costs net of high claimants and adjusted for contract, benefits, aging, FWA programs, and number of working days, and weighted between the individual and small group markets using in-force membership, we performed 24-month regressions, 36-month regressions, 48-month regressions and time series calculations. Certain time series methods, such as those assuming no trend, those assuming that trend is dampening or those for which there is not sufficient historical data12, are not included, as these are inappropriate for use in trend development and/or for the data available. The year ended December 2019 over year ended December 2018 increase, after all the adjustments described above, is 0.9 percent. Logistic regressions using 24, 36 and 48 months calculate -0.1 percent, 0.9 percent and 1.2 percent trends respectively. The three time series that are appropriate to use give a similar range of projected trends (-0.5 percent to 1.9 percent).
12 The seasonal additive, seasonal multiplicative, single moving average, and single exponential smoothing methods cannot be used since they assume zero trend. The dampened trend method already assume a slowdown of trend. The double moving average method requires three times the amount of historical data as projection periods, and therefore should not be used for this analysis.
BLUE CROSS BLUE SHIELD OF VERMONT 2021 VERMONT INDIVIDUAL AND SMALL GROUP RATE FILING
ACTUARIAL MEMORANDUM
25 | P a g e
Method Trend RMSE Theil's U
48 Months Logistic Regression 1.2% 21.84
48 Months Linear Regression 1.2% 21.85
Holt-Winters' Multiplicative 48 Monthly 1.3% 23.28 0.73
Holt-Winters' Additive 48 Monthly 1.4% 23.20 0.72
Double Exponential Smoothing 48 Monthly -0.5% 24.49 0.81
36 Months Logistic Regression 0.9% 21.79
36 Months Linear Regression 0.9% 21.79
Holt-Winters' Multiplicative 36 Monthly 0.3% 27.48 0.90
Holt-Winters' Additive 36 Monthly 0.3% 27.48 0.90
Double Exponential Smoothing 36 Monthly 0.0% 23.16 0.71
24 Months Logistic Regression -0.1% 21.73
24 Months Linear Regression 0.0% 21.72
Holt-Winters' Multiplicative 24 Monthly 0.5% 30.91 0.95
Holt-Winters' Additive 24 Monthly 0.5% 30.90 0.95
Double Exponential Smoothing 24 Monthly 1.9% 24.02 0.80
Year/Year 0.9%
We selected 1.1 percent trend for facility claims. This is a 50/50 blend of the most recent year over year trend with the average of the 48-month regressions and Holt-Winter time series. The double exponential smoothing time series method has produced results that are wildly divergent from the other statistical methods, and we do not consider it in selecting a facility trend. We believe that using a longer view of facility trend is appropriate to smooth out monthly variability. Finally, we note that our selection is in very close proximity with the most recent actual year over year result. Details on facility trends are shown on Exhibit 3C. Professional and Ancillary
Professional claims utilization had been ramping up over the last few years but slowed down in 2019. The main driver of this reduction is the introduction of a lab benefit manager. To account for shift in site of care, we decided to change our methodology to look at services by provider grouping and adjust for historical cost trend to calculate the impact of changes in mix of services. We also experienced a higher than normal October in 2019, followed by a dampening of claims in December 2019. A low last data point skews regressions and time series, which is why we selected trends based on observation of recent patterns instead of statistical methods. To analyze the number of services, we combined all provider groups except for labs processed through the lab benefit manager. For both individual and small group markets, we observed very stable rolling 12-month increases through August 2019 and then a sharp drop through the end of 2019, with December 2019 being abnormally low. We believe that the latter part of 2019 is a step down rather than a trend as we have already observed a leveling off in the early part of 2020. We are therefore adjusting 2019 to reflect a full year at the new level, and then trending

BLUE CROSS BLUE SHIELD OF VERMONT 2021 VERMONT INDIVIDUAL AND SMALL GROUP RATE FILING
ACTUARIAL MEMORANDUM
26 | P a g e
at 2.9 percent for small groups and 3.6 percent for individuals, the year-ended August 2019 values. For lab services, we contracted with a lab benefit manager as of August 2019. This drastically reduced both the fee schedule for independent laboratories and, through the application rigorous clinical protocols, the number of services that policyholders incurred. We adjusted the number of services going forward to reflect the level for the last four months of 2019 for calendar year 2021. Implicit in that adjustment is an assumption that ongoing clinical management will reduce utilization trend for these services to zero. In this method, the intensity component is reflected by the mix of services. To quantify the impact of the changes in mix of services on professional trend, we first normalized the cost per service using the historical cost trend increases. We then measured the increase in cost per service. For services at BlueCard providers, we observed similar patterns for individual and small groups. In both markets, the mix trend increased in 2018 and returned in 2019 to levels experienced in 2017. We are therefore using a two-year average trend to project forward to eliminate the impact of an outlier year. For providers on the Community fee schedule, both hospital owned practices and independent practices, we believe that the recent declining trend in mix of services is due to the reallocation of site of care in 2019. We therefore normalize for site of care. A number of facilities upgraded their billing systems in the fall of 2019 and we experienced an elevated mix trend due to the transition13. We believe that this will continue until reaching a new equilibrium in 2020, and then level off through 2021. Finally, for providers associated with Dartmouth-Hitchcock we select different trends for the individual and small group market segments based on observed mix of services. Finally, we blended the individual and small group trends using in-force membership to adjust for the changing mix between the two markets. The resulting professional trend is 1.1 percent from 2019 to 2020 and 3.4 percent from 2020 to 2021. This method of determining professional trend by fee schedule does not account for the potential changes between the different schedules. Based on historical patterns, we assessed historical movement between the community providers and academic medical center and it does not appear that an adjustment is necessary. Exhibit 3D shows the number of services and adjusted cost per service by fee schedule and market.
13 We note that at least one hospital has cited the EMR impact on volumes as a leading driver of revenue shortfalls. See, for instance, https://gmcboard.vermont.gov/sites/gmcb/files/Board-Meetings/NMC%20FY2020%20Mid%20Year%20Budget%20Adjustment%20-%20Narrative.pdf

BLUE CROSS BLUE SHIELD OF VERMONT 2021 VERMONT INDIVIDUAL AND SMALL GROUP RATE FILING
ACTUARIAL MEMORANDUM
27 | P a g e
Pharmaceuticals As shown on Exhibit 3E, the year-over-year trend experienced in 2018 increased drastically from historical levels before returning toward a more typical increase in 2019. Ocrevus, a blockbuster drug for treatment of Multiple Sclerosis was the main driver of the high increase in 2018. Other drugs also experienced very high increases, and we expect some of these drugs to continue trending at very high rates. With the help of the clinical staff at BCBSVT, we separately projected the expected cost and utilization increase for nine impactful drugs (see Exhibit 3E). Based on the assumptions shown on Exhibit 3B, we project that annual total increases for drugs dispensed in a facility or office will be 18.0 percent. Using the average projected cost increase of 4.5 percent, we calculate a projected annual utilization increase of 12.9 percent. Over the past four years, the impact of new drugs ranged from 3 percent to 9 percent. Our clinical experts advise us that even with the COVID-19 pandemic, we can expect the impact of new drugs to increase trend by five percent, which was the impact of the pipeline for 2019. We therefore select an 18.5 percent utilization trend for pharmaceuticals. Overall Medical Utilization Trend Using the 2019 PMPM of the population used in the trend development as weights, we calculate a 3.6 percent overall medical utilization trend:
Category Allowed Charge
PMPM
Selected Utilization
Trend
Inpatient $104.85 1.1%
Outpatient $209.47 1.1%
Pharmaceuticals $59.38 18.5%
Professional $148.18 2.2%
Total $521.88 3.6%
Cost Containment Strategy BCBSVT transitioned to a new operating platform as of January 1, 2019, leading to a slowdown in claims payments for the first few months of the year as we worked through all the details of the transition. This delayed the start of the cost containment program that was aimed at reducing inpatient readmission and emergency room admissions. Employee turnover in the Integrated Health department further slowed the progress of this program. For these reasons, we did not meet our goal to reduce inpatient readmissions and emergency room visits for the VISG population for 2019. Cost containment programming came to a halt in March of 2020 due to COVID-19. With the continued uncertainty due to the pandemic and its impact on providers and members for the remainder of 2020 and 2021, we do not expect to focus on this programming in the time period considered by this filing. For similar reasons, we have no plans at this time to expand the Convenient Care program that encourages home infusion therapy. The modest impact on the experience period of this program naturally flows through into projected trend as well.

BLUE CROSS BLUE SHIELD OF VERMONT 2021 VERMONT INDIVIDUAL AND SMALL GROUP RATE FILING
ACTUARIAL MEMORANDUM
28 | P a g e
We are continuing our relationship with the lab benefit manager. The impact on 2019 claims experience, even with only five months of programming, was extremely positive. We have reflected an ongoing impact through 2021 directly within the professional trend described above. 3.4.7.2. Pharmacy Trend Development With the emergence of new and expensive specialty drugs, as well as the increasing shift to generics as more brand drugs come off patent, we analyzed the components of trend (cost and utilization) separately for brands, generics, and specialty drugs. Specialty drugs are very high cost drugs with low utilization. Because of their relative infrequency, it is more appropriate to look at the overall PMPM trends for these drugs rather than separate cost and utilization components. We then calculate the overall pharmacy trend by combining the separate projections. Non-Specialty Drug Utilization Similar to medical claims, we observe different levels of utilization of non-specialty drugs between the individual and small group markets. As described above, we adjust utilization trends for changes in benefits, aging and working days. Using the array of monthly PMPM claims after adjustments, we weighted the two markets using in-force membership. We then performed 24-month and 36-month regressions as well as time series, with appropriate underlying assumptions for trend and seasonality. Exhibit 3F provides the monthly and the 12-month rolling data, along with the corresponding year-over-year and exponential regression trends and time series, for non-specialty drug utilization. We use the number of days supply, rather than the number of scripts, to normalize for changes in the days supply per script (e.g. increased use of 90-day fills). Because there are several popular brand drugs that have become generic during the experience period, or will become generic during the projection period, we have combined the data for generic and brand drugs for the purpose of analyzing utilization patterns. The 24-month regression and time series results are higher than both the most recent year over year results and the 36-month regressions and time series. We observed a very high fourth quarter in 2019, which is skewing the 24-month statistics. The longer views also suggest that the most recent year–over-year trend may be artificially low. We select 3.0 percent, the average of the 36-month statistics and the most recent year over year results, as the non-specialty drugs utilization trend.

BLUE CROSS BLUE SHIELD OF VERMONT 2021 VERMONT INDIVIDUAL AND SMALL GROUP RATE FILING
ACTUARIAL MEMORANDUM
29 | P a g e
Instead of projecting a generic dispensing rate, we separated the drugs into seven categories:
Generics: Drugs that have been generic since at least January 2017
New Generics: Generic drugs that have been in the market for less than 36 months (January 2017 to December 2019)
Brands going Generic: brands that are expected to become available in generic form in the projection period, based on a list from our pharmacy benefit manager
Vaccines
Over the Counter (OTC)
Compounds
All other Brands As shown on Exhibit 3I, all days supply is trended forward at the same rate of 3.0 percent. Generic Cost Trend To ensure that the generic cost trend is not skewed by the arrival of new generic drugs, we performed a 24-month regression on monthly Average Wholesale Price (AWP) per days supply on only those generic drugs that have been in the market for more than 36 months.
Brands that are going generic will be subject to the generic discounts. We do not expect that the AWP for these drugs will significantly change from the experience period due to the lack of generic competition for the main drugs in this category. We adjusted the price to reflect the different experienced effective discounts between brands and generics.
Exhibit 3G, page 1, shows monthly cost per days supply and the 24-month regression. We select 0.25 percent for the generic cost trend, which is the average of the 24-month regression and the year over year result. Though the AWP trend has increased in recent months, we consider a 0.25 percent to be a reasonable long-term outlook for generic cost trend. This selection is consistent with recent BCBSVT filings.
Brand Cost Trend To ensure that the brand cost trend is not skewed by brands going generic, vaccines, over the counter, and compounds, we performed a 24-month regression on monthly AWP cost per days supply on the all other brand category only.
Compounds are one-off prescriptions that are constructed at the pharmacy from component ingredients. Because they are not sold on a wholesale basis, there is no official AWP. We select a 0.0 percent cost trend for compounds.
Vaccines cost have been increasing rapidly over the previous three years. We expect this to continue through 2021 and include a 20 percent cost trend for vaccines.
We also do not expect over-the-counter drugs to follow the overall Brand cost trend. Based on historical data, we select a negative 20 percent cost trend for OTC drugs.
Exhibit 3G, page 2, shows monthly cost per days supply and the 24-month regression. We select 10.0 percent for the brand cost trend, which is the average of the 24-month regression and the most recent year over year result. This selection is consistent with recent filings, and we consider it to be an adequate, yet not excessive, outlook of future trend.
Specialty Drugs

BLUE CROSS BLUE SHIELD OF VERMONT 2021 VERMONT INDIVIDUAL AND SMALL GROUP RATE FILING
ACTUARIAL MEMORANDUM
30 | P a g e
In previous filings, the introduction of certain new specialty drugs required an adjustment to the specialty drug trend calculation. The impact of excluding certain specialty drugs has had an increasingly small impact on specialty trend. We no longer judge this impact to be material. Therefore, we combine all specialty drugs to develop trend. We will continue to monitor new specialty drugs and adjust our future methodology as necessary.
In January 2019, we amended our contract with our pharmacy benefit manager to reflect the new Accredo® Exclusive Specialty Program, which increased our discount off AWP for specialty drugs. We adjusted months prior to January 2019 to reflect the new contract. For the same reasons stated in the medical trend section, we adjust each month to reflect aging. We did not adjust for working days, as nearly all retail specialty medications are provided through mail service, and the vast majority of prescriptions are refills. We did not adjust for benefits as there is no impact of induced utilization on high-cost specialty medicines. Again, we calculated PMPM arrays for individual and small groups and re-weighted the experience using in-force membership to adjust for the change in mix between the markets. Using the array of weighted PMPM claims costs after adjustments, we performed 24-month and 36-month regressions as well as two time series. Specialty drug utilization is not seasonal; therefore, we only use the double exponential smoothing method. Exhibit 3H, Page 2 contains the results of the regressions and time series. The average of these five methods, including the year-over-year increase, is 20.5 percent. We select 20.5 percent, which is consistent with previous filings, as a reasonable and appropriate trend for specialty drugs.
Changes in Pharmacy Contracts
To calculate this factor, we applied the contracted discounts and dispensing fees for each type of drug (Generic, Brand and Specialty) to calendar year 2019 claims for both the experience period and the projected period contract provisions. We apply to the projected pharmacy claims the contract adjustment factor for each type of drug, calculated by taking the ratio of the projected pharmacy claims under each contract (see Exhibit 3I for details).
.
Overall Pharmacy Trend Exhibit 3I summarizes the trends and calculates our total allowed pharmacy trend as 13.4 percent. Note that changes in pharmacy contracts are included in the cost trend component on Exhibit 3J.
3.4.7.3. Vision and Dental Trend Development Dental Trend The pediatric dental benefit is available to all members age 21 and under. The proportion of members age 21 and under is very different between the individual and small group markets. We therefore again analyze trend separately for each market and then combine the results using in-force membership.

BLUE CROSS BLUE SHIELD OF VERMONT 2021 VERMONT INDIVIDUAL AND SMALL GROUP RATE FILING
ACTUARIAL MEMORANDUM
31 | P a g e
The allowed per child member per month (PCMPM) trend for the individual market increased in 2018 and decreased in 2019. For the small group market, there was a significant decrease in 2018 and another smaller decrease in 2019. Looking into the details, we can observe that classes III and IV14 are extremely volatile and skew the overall results.
Calendar Year Individual
Classes I and II PCMPM
Trend Small Group
Classes I and II PCMPM
Trend
2016 $14.44 $10.88
2017 $14.01 -3.0% $11.25 3.4%
2018 $15.13 8.0% $10.38 -7.7%
2019 $15.37 1.6% $10.30 -0.8%
We believe that 2018 was an outlier for each market and therefore select the most recent year-over-year increase for each market. After combining using the in-force membership, the overall dental trend is 0.7 percent. For the purpose of the index rate build-up, we included the total dental trend as utilization trend.
Vision Trend The pediatric vision claims experience once again shows 2018 to be an outlier with much higher PCMPM than the other three years in the analysis.
Calendar Year
Individual PCMPM
Trend Small Group PCMCM
Trend
2016 $0.64 $0.68
2017 $0.67 4.2% $0.64 -5.6%
2018 $0.73 9.3% $0.74 15.8%
2019 $0.67 -8.8% $0.63 -15.2%
We expect 2020 and 2021 to remain at the level experienced in 2017 and 2019; we therefore select a 0.0 percent overall vision trend.
3.4.7.4. Overall Total Trend
To calculate the overall trend, we apply the trend factors described above to the adjusted experience period allowed claims for EHB (Exhibit 5, line C), but exclude the adjustment for claims above $1 million. The resulting factors (1+d1 and 1+d2 on Exhibit 5) are calculated as shown on Exhibit 3J.
Row on Exhibit 5 Factor
Cost Trend Factor 1+d1 1.0999
Utilization Trend Factor 1+d2 1.0698
14 Class III dental services include major restorative care such as crown, bridges and implants. Class IV refers to orthodontia.

BLUE CROSS BLUE SHIELD OF VERMONT 2021 VERMONT INDIVIDUAL AND SMALL GROUP RATE FILING
ACTUARIAL MEMORANDUM
32 | P a g e
3.4.8. COVID-19
The COVID-19 pandemic introduces unique and immense uncertainty into actuarial projections of 2021 claims costs. The underlying demand for services that is reflected in our baseline projections certainly exists; however, it is far from clear whether the supply of those services will be affected by the pandemic or its fallout, thereby impacting utilization. Furthermore, there is little to no clarity related to additional costs that should be expected due to COVID-19 and with respect to the deferral of non-emergent care while social distancing measures are in effect.
There are four main categories of considerations regarding the cost of health care services in 2021.
Direct costs of COVID-19 treatment: Information is emerging on the cost of treating a COVID-19 patient experiencing varying degrees of severity and in different settings. However, the overall infection rate remains murky. While the current wave of infection seems to be diminishing, it is possible that additional waves will follow when social distancing is relaxed, at the onset of the winter flu season, or even as a continual challenge fueled by a lower but steady rate of transmission. It is likely that infection will continue until a vaccine is available. The intermediate-term cost of follow-up care for patients who have recovered from an initial bout with COVID-19 could be considerable. These additional costs will be countered by additional deferrals of non-emergent care should social distancing measures become necessary into 2021. It cannot be predicted with any degree of certainty which directional impact will be greater in 2021.
Costs of COVID-19 preventive services: Most experts suggest that the fastest a vaccine could reach the market is within 12 to 18 months. This time frame would place vaccine availability squarely within calendar 2021. While there has been some speculation as to the potential cost of administering the vaccine, estimates vary widely. Current law would require that insurers cover these costs with no member liability. Depending upon their availability and the extent to which they play a role in the government response to the pandemic, antibody tests may be pervasively used as well. These, too, would be covered at zero cost share. Future government actions will dictate the extent to which these costs impact insurer liability in 2021.
Impact of the deferral of non-emergent care: Some portion of deferred care will be foregone altogether, while other services will have only been delayed. The timing of the return of the delayed care will depend upon the timing and severity of additional waves of infection and periods of social distancing. It seems likely that many providers will be operating at or above capacity for at least a portion, and perhaps a significant portion, of 2021 as they endeavor to meet demand and to make up for lost revenue during periods of social distancing. Furthermore, there are concerns about a worsening of the health status of the population following the delay or elimination of preventive and other care. Mental health is of particular concern given the additional stress generated by the health and financial crisis. It is clear that population health will worsen as a result of the pandemic, but the magnitude of the deterioration is difficult to predict.
Impact of economic factors: The covered population itself may change substantially from the enrolled 2020 population. It seems likely that continued unemployment will reduce the size of the small group market, but the same phenomenon is likely to increase the size of the individual

BLUE CROSS BLUE SHIELD OF VERMONT 2021 VERMONT INDIVIDUAL AND SMALL GROUP RATE FILING
ACTUARIAL MEMORANDUM
33 | P a g e
subsidized population. There are selection concerns related to extended grace periods and the potential for individuals to elect to forgo coverage. Naturally, there is a revenue impact here as well, as uncollectible premium may increase. However, it is also possible that currently uninsured individuals, presumably healthier than the average VISG member, could sign up for coverage.
The various impacts of the COVID-19 pandemic will impact 2021 costs, and they will do so in both an upward and a downward direction. Based on information currently available, it is difficult to so much as predict an overall directional impact, particularly because future government actions will drive the timing and magnitude of many of the above considerations. We believe that it is entirely reasonable to forecast that the ongoing pandemic will increase 2021 claims costs beyond the levels projected within this filing. However, because of the margin guidance provided in Attachment C (as discussed in section 3.8.7.2), the addition of a COVID-related factor of any magnitude would be offset by a reduction in CTR of equal and opposite magnitude, resulting in no change to the premiums presented herein. Furthermore, based on information known at the time of filing, we see no reason to believe that the best estimate of the pandemic impact is a decrease in 2021 claims costs. We therefore include a COVID-19 impact of zero within the 2021 premium rates.
3.5. Credibility of Experience BCBSVT’s experience period had 520,581 member months and is therefore fully credible. 3.6. Credibility manual rate development Since BCBSVT’s experience is fully credible, no manual rate was needed in the development of rates for the experience period claims. 3.6.1. Source and Appropriateness of Experience Data Used: Not Applicable
3.6.2. Adjustments Made to the Data: Not Applicable
3.6.3. Inclusion of Capitation Payments: Not Applicable 3.7. Market Adjusted Index Rate The Market Adjusted Index Rate (line H of Exhibit 5) is $714.23. We calculated this quantity by adjusting the Projected Index Rate (line F of Exhibit 5, $778.04) for allowable market-wide modifiers described below. 3.7.1. Projected Risk Adjustment Transfer PMPM: On March 25, 2020, CMS published an Interim Summary Report on Risk Adjustment for the 2019 benefit year15. The BCBSVT data included in the report represents claims incurred in 2019 and paid through December 31, 2019. We made the assumption that MVP’s 2019 interim submission
15 https://www.cms.gov/CCIIO/Programs-and-Initiatives/Premium-Stabilization-Programs/Downloads/Interim-RA-Report-BY2019.pdf

BLUE CROSS BLUE SHIELD OF VERMONT 2021 VERMONT INDIVIDUAL AND SMALL GROUP RATE FILING
ACTUARIAL MEMORANDUM
34 | P a g e
includes the same incurred and paid data as BCBSVT, consistent with previous years’ interim submissions. The final 2019 report will include the impact of supplemental diagnosis files and claims runout. The impact of claims runout and supplemental diagnoses for BCBSVT and MVP was estimated based on the average relationship of the plan liability risk score (PLRS) in the 2017 and 2018 Final Summary Report relative to the 2017 and 2018 Interim Summary Report. The 2021 risk adjustment calculation starts with the estimated final 2019 risk adjustment and projects to 2021 based on projected membership changes, market-wide premium increases, PLRS adjustments due to model changes, and other factors impacting the transfer. Market-Wide Premium Increases We calculated the 2021 market-wide premium PMPM by applying the expected 2021 average rate increase to the estimated 2020 market-wide premium PMPM. The 2020 market-wide premium represents the weighted average of BCBSVT’s billed premium as of February 29, 2020 and MVP’s imputed premium PMPM from their 2020 URRT exhibit based on projected 2021 membership. See Exhibit 4, Table 1 for the statewide premium calculation. Population Adjustments We adjusted the PLRS for both BCBSVT and MVP for the impact of members migrating from BCBSVT’s exchange market to MVP’s, the impact of Association Health Plan (AHP) members re-joining the exchange markets, the impact of new members to BCBSVT and the impact of the 2021 model coefficients. In order to estimate the impact of these items, we calculated risk scores for every BCBSVT exchange and AHP member in the 2019 experience period. We imputed a metal level for AHP members based on their benefit design. Comparing membership in force as of February 2020 to experience membership, we categorized members into “renew”, “cancel” or “new” buckets. For the individual line of business we assumed that members in the new bucket would have a risk score that is proportional to their relative age-gender factor when compared to the age-gender factor and risk scores of the individuals in the renew bucket. We assumed that any member in the cancel bucket that left BCBSVT for reasons other than retirement, death, birth or transition to another BCBSVT line of business either switched to MVP or left the exchange market entirely. We observed that the overall individual market decreased by 414 members16. These members may have left the market due to a change in employment or residence or due to foregoing insurance altogether. Lacking better data, we assumed an equal proportion of each. We estimated the impact by imputing to this population the average of the risk score for total members either switching or leaving (representing those who left due to a change in employment or residence) and the risk score of the 414 lowest risk score adults who cancelled (representing those who dropped insurance altogether). The small group analysis assumes that a new customer entering the BCBSVT market will have risk scores that are proportional to its average age-gender factor relative to that of the renewing small group members. Employer groups we have identified as cancelled are further sub-divided into several categories based on previous carrier, destination (if known), and group size. We separately identified one a sizable group established for a specific and temporary effort that is
16 https://info.healthconnect.vermont.gov/sites/hcexchange/files/2020%20Individual%20and%20Small%20Group%20Enrollment%20Data.pdf
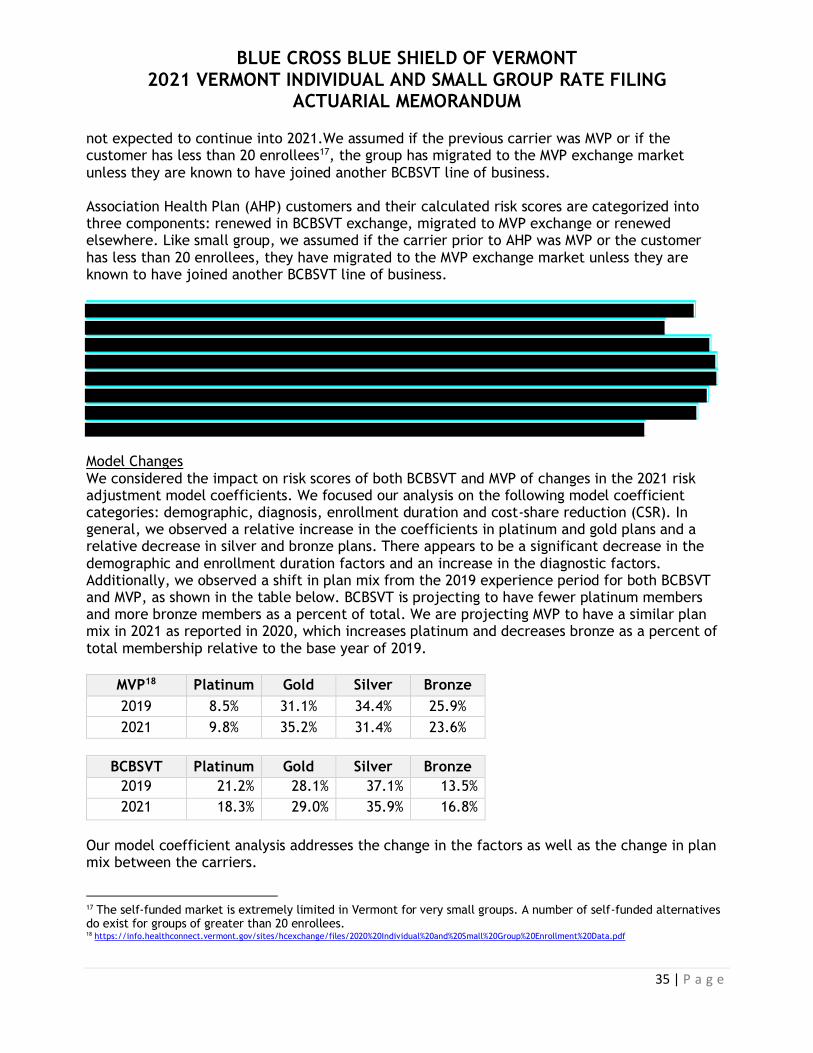
BLUE CROSS BLUE SHIELD OF VERMONT 2021 VERMONT INDIVIDUAL AND SMALL GROUP RATE FILING
ACTUARIAL MEMORANDUM
35 | P a g e
not expected to continue into 2021.We assumed if the previous carrier was MVP or if the customer has less than 20 enrollees17, the group has migrated to the MVP exchange market unless they are known to have joined another BCBSVT line of business. Association Health Plan (AHP) customers and their calculated risk scores are categorized into three components: renewed in BCBSVT exchange, migrated to MVP exchange or renewed elsewhere. Like small group, we assumed if the carrier prior to AHP was MVP or the customer has less than 20 enrollees, they have migrated to the MVP exchange market unless they are known to have joined another BCBSVT line of business.
Model Changes We considered the impact on risk scores of both BCBSVT and MVP of changes in the 2021 risk adjustment model coefficients. We focused our analysis on the following model coefficient categories: demographic, diagnosis, enrollment duration and cost-share reduction (CSR). In general, we observed a relative increase in the coefficients in platinum and gold plans and a relative decrease in silver and bronze plans. There appears to be a significant decrease in the demographic and enrollment duration factors and an increase in the diagnostic factors. Additionally, we observed a shift in plan mix from the 2019 experience period for both BCBSVT and MVP, as shown in the table below. BCBSVT is projecting to have fewer platinum members and more bronze members as a percent of total. We are projecting MVP to have a similar plan mix in 2021 as reported in 2020, which increases platinum and decreases bronze as a percent of total membership relative to the base year of 2019.
MVP18 Platinum Gold Silver Bronze
2019 8.5% 31.1% 34.4% 25.9%
2021 9.8% 35.2% 31.4% 23.6%
BCBSVT Platinum Gold Silver Bronze
2019 21.2% 28.1% 37.1% 13.5%
2021 18.3% 29.0% 35.9% 16.8%
Our model coefficient analysis addresses the change in the factors as well as the change in plan mix between the carriers.
17 The self-funded market is extremely limited in Vermont for very small groups. A number of self-funded alternatives do exist for groups of greater than 20 enrollees. 18 https://info.healthconnect.vermont.gov/sites/hcexchange/files/2020%20Individual%20and%20Small%20Group%20Enrollment%20Data.pdf
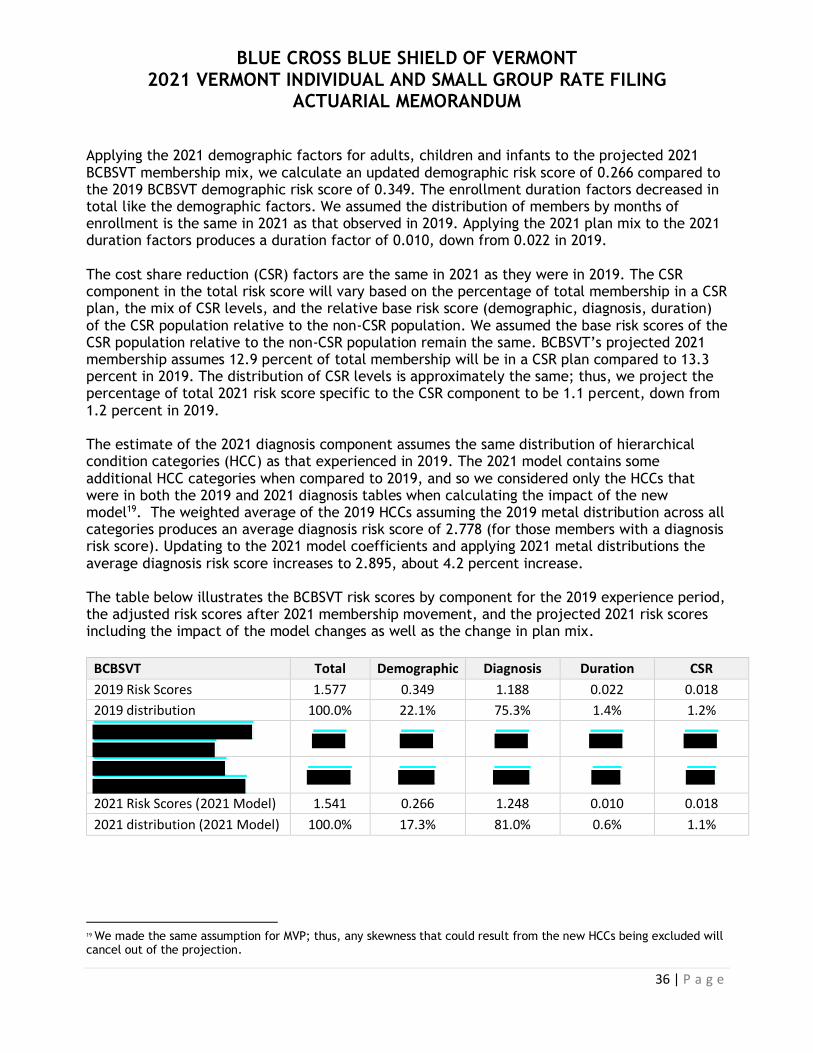
BLUE CROSS BLUE SHIELD OF VERMONT 2021 VERMONT INDIVIDUAL AND SMALL GROUP RATE FILING
ACTUARIAL MEMORANDUM
36 | P a g e
Applying the 2021 demographic factors for adults, children and infants to the projected 2021 BCBSVT membership mix, we calculate an updated demographic risk score of 0.266 compared to the 2019 BCBSVT demographic risk score of 0.349. The enrollment duration factors decreased in total like the demographic factors. We assumed the distribution of members by months of enrollment is the same in 2021 as that observed in 2019. Applying the 2021 plan mix to the 2021 duration factors produces a duration factor of 0.010, down from 0.022 in 2019. The cost share reduction (CSR) factors are the same in 2021 as they were in 2019. The CSR component in the total risk score will vary based on the percentage of total membership in a CSR plan, the mix of CSR levels, and the relative base risk score (demographic, diagnosis, duration) of the CSR population relative to the non-CSR population. We assumed the base risk scores of the CSR population relative to the non-CSR population remain the same. BCBSVT’s projected 2021 membership assumes 12.9 percent of total membership will be in a CSR plan compared to 13.3 percent in 2019. The distribution of CSR levels is approximately the same; thus, we project the percentage of total 2021 risk score specific to the CSR component to be 1.1 percent, down from 1.2 percent in 2019. The estimate of the 2021 diagnosis component assumes the same distribution of hierarchical condition categories (HCC) as that experienced in 2019. The 2021 model contains some additional HCC categories when compared to 2019, and so we considered only the HCCs that were in both the 2019 and 2021 diagnosis tables when calculating the impact of the new model19. The weighted average of the 2019 HCCs assuming the 2019 metal distribution across all categories produces an average diagnosis risk score of 2.778 (for those members with a diagnosis risk score). Updating to the 2021 model coefficients and applying 2021 metal distributions the average diagnosis risk score increases to 2.895, about 4.2 percent increase. The table below illustrates the BCBSVT risk scores by component for the 2019 experience period, the adjusted risk scores after 2021 membership movement, and the projected 2021 risk scores including the impact of the model changes as well as the change in plan mix.
BCBSVT Total Demographic Diagnosis Duration CSR
2019 Risk Scores 1.577 0.349 1.188 0.022 0.018
2019 distribution 100.0% 22.1% 75.3% 1.4% 1.2%
2021 Risk Scores (2021 Model) 1.541 0.266 1.248 0.010 0.018
2021 distribution (2021 Model) 100.0% 17.3% 81.0% 0.6% 1.1%
19 We made the same assumption for MVP; thus, any skewness that could result from the new HCCs being excluded will cancel out of the projection.

BLUE CROSS BLUE SHIELD OF VERMONT 2021 VERMONT INDIVIDUAL AND SMALL GROUP RATE FILING
ACTUARIAL MEMORANDUM
37 | P a g e
We can observe that the projected 2021 risk score drops to 1.541 due to changes in the 2021 model and metallic plan mix. The next step was to develop comparable summaries of MVP’s risk scores and determine the risk score ratio between BCBSVT and MVP after 2021 model and plan mix changes. Because BCBSVT has limited sightlines into MVP data, this necessitated a simplified approach. BCBSVT has estimated MVP’s 2019 experience risk score to be 1.237 by applying a two-year average completion factor to the 2019 interim risk adjustment report.
Starting with the CSR component, we observe the membership mix of total
CSR and CSR level from the market wide enrollment report20. We estimate MVP’s CSR risk score to be 1.49 percent of their total risk score, or 0.018 as a factor. MVP’s 2019 membership consists of 16.8 percent CSR members and their CSR plan mix has an average induced utilization factor of 1.083. BCBSVT by comparison has 13.3 percent of their experience in a CSR plan with an average induced utilization factor of 1.074. Given that MVP has a higher concentration of CSR members and richer CSR plans than BCBSVT their CSR risk score percent is higher as a percent of total. The estimate of the CSR component of MVP’s risk score is therefore (0.168 x 1.083)/ (0.133 x 1.074) x 0.012 = 1.49 percent. The enrollment duration factor for MVP starts with the assumption that they have a mix of membership with less than twelve months of enrollment comparable to that of BCBSVT. Applying MVP’s 2019 metallic plan distribution across the 2019 duration factor table yields an estimate of 0.021. Since the enrollment duration factors apply only to adults, we made an additional adjustment to account for the difference in adults as a percent of total between each carrier. We estimate that 83.821 percent of MVP’s membership is an adult compared to BCBSVT’s experience of 80.3 percent. Thus, MVP’s 2019 enrollment duration risk score is estimated as 0.021 x (0.838/0.803) = 0.022. The demographic factor varies by age, gender and metallic plan. Since we do not know MVP’s age and gender distribution, we applied their metallic plan distribution across all age/gender buckets and compared those results to BCBSVT’s metallic plan distribution applied across all age/gender buckets. The graph below illustrates the relationship between BCBSVT and MVP for each of the model’s age/gender categories. Most of the data points fall between 1.10 and 1.15. The midpoint of this range, 1.125, is where the adults in the 21 to 49 aged data points are heavily concentrated. Since we believe that MVP has a higher proportion of adults relative to their total and presumably has proportionally younger adults, we have selected 1.125 as the demographic risk score ratio. MVP’s 2019 demographic risk score component is therefore estimated as 0.349 / 1.125 = 0.310.
20https://info.healthconnect.vermont.gov/sites/hcexchange/files/2020%20Individual%20and%20Small%20Group%20Enrollment%20Data.pdf 21 Exhibit 4 of MVP’s VT Exchange 2020 filing

BLUE CROSS BLUE SHIELD OF VERMONT 2021 VERMONT INDIVIDUAL AND SMALL GROUP RATE FILING
ACTUARIAL MEMORANDUM
38 | P a g e
The diagnosis component is the difference between MVP’s total risk score and the demographic, enrollment duration and CSR components. This is calculated as 1.237 – 0.310 – 0.022 – 0.018 = 0.886. Adding in the migrating membership from the BCBSVT lines of business produces the following adjusted MVP risk score:
MVP Total demographic diagnosis duration CSR
2019 Risk Scores 1.237 0.310 0.886 0.022 0.018
2019 distribution 100.0% 25.1% 71.6% 1.8% 1.5%
Membership Adjusted Risk Scores (2019 Model)
0.025 0.018
Membership Adjusted distribution (2019 Model)
The risk score information in this table, along with BCBSVT’s projected 2021 risk scores, provides a basis to estimate the impact of the 2021 model coefficients and the projected 2021 metallic plan mix on MVP’s risk scores. The 2021 CSR factor is estimated based on the CSR membership changes as a percent of MVP’s total as well as the change in CSR levels. We project MVP’s 2021 membership to include 13.6 percent in a CSR plan with an average induced utilization factor of 1.084. Comparing these figures to MVP’s 2019 experience attributes 1.20 percent of their 2021 risk score to the CSR component, calculated as (0.136 x 1.084) / (0.168 x 1.083) x 0.0149 = 0.0120. The enrollment duration factor for MVP’s 2021 estimate uses the simplifying assumption that the distribution of months of enrollment is the same as BCBSVT’s. The weighted average MVP’s 2021 metallic distribution on the 2021 model coefficients compared to MVP’s 2019 weighted average
0.950
1.000
1.050
1.100
1.150
1.200
1.250
1.300
F0 M0 F1 M1
F2-4
M2
-4
F5-9
M5
-9
F10
-14
M1
0-1
4
F15
-20
M1
5-2
0
F21
-24
M21
-24
F25
-29
M2
5-2
9
F30
-34
M3
0-3
4
F35
-39
M3
5-3
9
F40
-44
M40
-44
F45
-49
M4
5-4
9
F50
-54
M5
0-5
4
F55
-59
M5
5-5
9
F60
-64
M60
-64
Demographic Risk Score Ratio
cy2019/2019 model

BLUE CROSS BLUE SHIELD OF VERMONT 2021 VERMONT INDIVIDUAL AND SMALL GROUP RATE FILING
ACTUARIAL MEMORANDUM
39 | P a g e
is 0.640. The 2021 enrollment duration factor multiplies this relational value to MVP’s adjusted risk score, calculated as 0.025 x 0.640 = 0.016. The 2021 MVP demographic factor uses a similar approach as 2019 since we do not have the age and gender distribution of MVP members. We applied MVP’s 2021 metallic distribution to each age/gender category and compared it to BCBSVT’s 2021 metallic distribution applied across all age/gender categories. As shown in the graph the relationship between BCBSVT and MVP for the demographic component has converged in 2021 compared to 2019:
Apart from the infant categories, the demographic risk score relationship between BCBSVT and MVP is concentrated mostly within the range of 1.05 to 1.07. We have selected the midpoint of the range as the assumption underlying MVP’s demographic score, calculating a demographic score of 0.266 / 1.06 = 0.251. The diagnosis component varies greatly from one HCC to the next. Some categories had decreases in the 2021 model compared to 2019 while others had increases. We have no insight into the distribution of HCCs underlying MVP’s experience, so we applied MVP’s 2019 metallic distribution to the 2019 model coefficients and compared those results to MVP’s 2021 metallic distribution on the 2021 model coefficients. The graph shows MVP’s increases and decreases for the 25 most common HCCs compared to BCBSVT’s average increase from 2019 to 2021 of 4.2 percent.
0.950
0.970
0.990
1.010
1.030
1.050
1.070
1.090
1.110
F0 M0 F1 M1
F2-4
M2-
4
F5-9
M5-
9
F10-
14
M10
-14
F15-
20
M15
-20
F21-
24
M21
-24
F25-
29
M25
-29
F30-
34
M30
-34
F35-
39
M35
-39
F40-
44
M40
-44
F45-
49
M45
-49
F50-
54
M50
-54
F55-
59
M55
-59
F60-
64
M60
-64
Demographic Risk Score Ratio
cy2021/2021 model
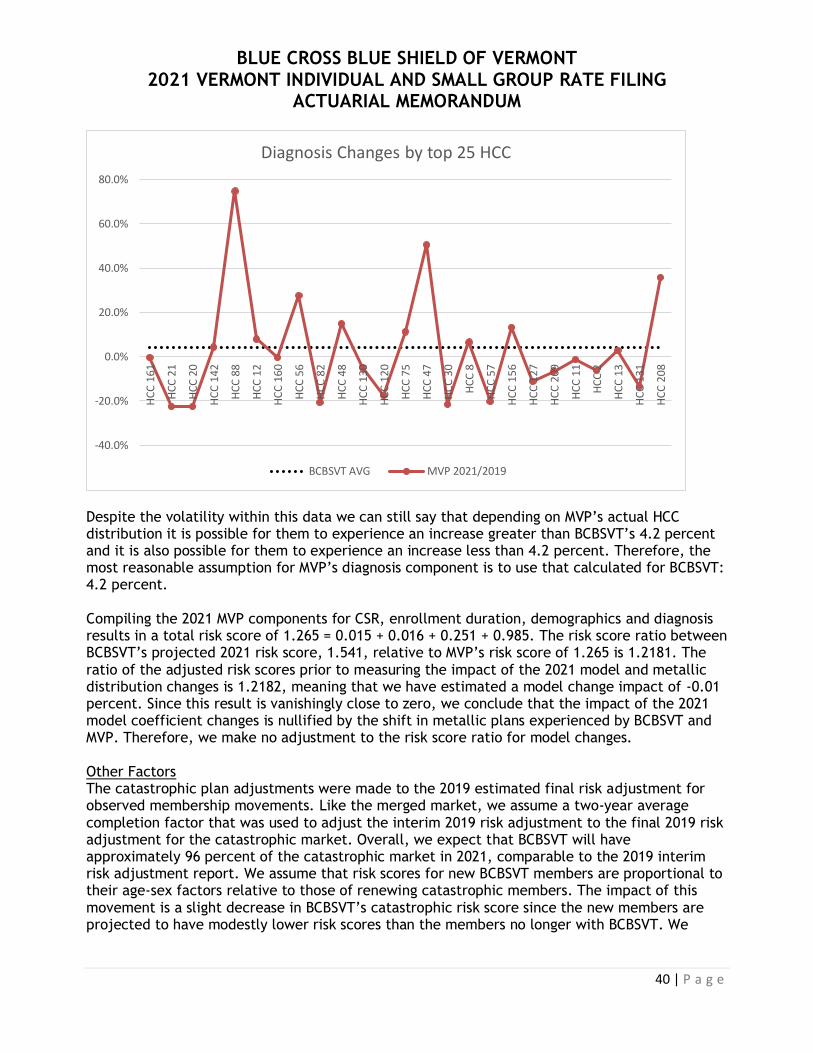
BLUE CROSS BLUE SHIELD OF VERMONT 2021 VERMONT INDIVIDUAL AND SMALL GROUP RATE FILING
ACTUARIAL MEMORANDUM
40 | P a g e
Despite the volatility within this data we can still say that depending on MVP’s actual HCC distribution it is possible for them to experience an increase greater than BCBSVT’s 4.2 percent and it is also possible for them to experience an increase less than 4.2 percent. Therefore, the most reasonable assumption for MVP’s diagnosis component is to use that calculated for BCBSVT: 4.2 percent. Compiling the 2021 MVP components for CSR, enrollment duration, demographics and diagnosis results in a total risk score of 1.265 = 0.015 + 0.016 + 0.251 + 0.985. The risk score ratio between BCBSVT’s projected 2021 risk score, 1.541, relative to MVP’s risk score of 1.265 is 1.2181. The ratio of the adjusted risk scores prior to measuring the impact of the 2021 model and metallic distribution changes is 1.2182, meaning that we have estimated a model change impact of -0.01 percent. Since this result is vanishingly close to zero, we conclude that the impact of the 2021 model coefficient changes is nullified by the shift in metallic plans experienced by BCBSVT and MVP. Therefore, we make no adjustment to the risk score ratio for model changes. Other Factors The catastrophic plan adjustments were made to the 2019 estimated final risk adjustment for observed membership movements. Like the merged market, we assume a two-year average completion factor that was used to adjust the interim 2019 risk adjustment to the final 2019 risk adjustment for the catastrophic market. Overall, we expect that BCBSVT will have approximately 96 percent of the catastrophic market in 2021, comparable to the 2019 interim risk adjustment report. We assume that risk scores for new BCBSVT members are proportional to their age-sex factors relative to those of renewing catastrophic members. The impact of this movement is a slight decrease in BCBSVT’s catastrophic risk score since the new members are projected to have modestly lower risk scores than the members no longer with BCBSVT. We
-40.0%
-20.0%
0.0%
20.0%
40.0%
60.0%
80.0%
HC
C 1
61
HC
C 2
1
HC
C 2
0
HC
C 1
42
HC
C 8
8
HC
C 1
2
HC
C 1
60
HC
C 5
6
HC
C 8
2
HC
C 4
8
HC
C 1
30
HC
C 1
20
HC
C 7
5
HC
C 4
7
HC
C 3
0
HC
C 8
HC
C 5
7
HC
C 1
56
HC
C 1
27
HC
C 2
09
HC
C 1
1
HC
C 2
HC
C 1
3
HC
C 1
31
HC
C 2
08
Diagnosis Changes by top 25 HCC
BCBSVT AVG MVP 2021/2019
BLUE CROSS BLUE SHIELD OF VERMONT 2021 VERMONT INDIVIDUAL AND SMALL GROUP RATE FILING
ACTUARIAL MEMORANDUM
41 | P a g e
assumed that MVP’s catastrophic risk scores would not have a material change; thus, the catastrophic risk score ratio is expected to be slightly lower in 2021. Other factors impacting the risk adjustment transfer include the actuarial value (AV), induced demand factor (IDF) and allowed rating factor (ARF). The AV and IDF factors change from the estimated final 2019 calculation as a result of the metallic distribution changing in 2021. We assume the ARF is unchanged from 2019. These results are shown in Exhibit 4, Table 3.
The 2021 transfer amount PMPM is partially offset by the projected charges and payments for the High Cost Risk Pool (HCRP) program. HHS published the final 2018 Risk Adjustment Summary Report on June 28, 2019, which clarified that the actual 2018 high-cost risk pool charge was 0.21 percent for merged market plans. Because trend leverage for a constant attachment point will increase the charge as a percent of total premium, we estimate the 2021 charge to be 0.25 percent of premium, or $1.69 PMPM. Because the methodology described in Section 3.3.1 nets projected reinsurance payments from projected claims, we effectively assume HCRP payments of zero.
Since the Market Adjusted Index Rate is on an allowed claims basis, we adjusted the net projected risk adjustment payment by the average paid-to-allowed ratio (from Exhibit 6C). The overall market-wide adjustment (line g1 of Exhibit 5) for the risk adjustment program is -$63.97 PMPM as shown on Exhibit 4. 3.7.2. Exchange User Fees
BCBSVT does not expect Vermont Health Connect to charge a user fee for 2021.

BLUE CROSS BLUE SHIELD OF VERMONT 2021 VERMONT INDIVIDUAL AND SMALL GROUP RATE FILING
ACTUARIAL MEMORANDUM
42 | P a g e
3.8. Plan Adjusted Index Rates 3.8.1. Plan Adjustment – Actuarial Value and Cost Sharing adjustment
This plan adjustment, as shown on Exhibit 6A, is informed by two factors:
Benefit Richness Adjustment
Paid-to-Allowed Ratio
The paid-to-allowed ratio comes from the federal actuarial value calculator (AVC) and is adjusted for benefit items that are not supported by the calculator as well the impact of aggregate and stacked deductibles. The adjustments to the federal AVC come from BCBSVT’s internal re-adjudication model. The experience used to calculate the adjustments to the-paid-to allowed ratio is our calendar year 2018 data trended to calendar year 2021 using the trend factors described in section 3.4.7. The model re-adjudicates claims by starting with the allowed charges and applying appropriate cost sharing for each service. The model generates the projected average paid claims for each benefit based on what the AVC can support as well as what the model cannot support. The relationship between these outputs from the BCBSVT based model is applied to the federal AVC paid-to-allowed ratio. The BCBSVT re-adjudication model is calibrated to 2018 experience and able to reproduce the experience paid-to-allowed ratio to within 0.1 percent. The benefit richness adjustment reflects the expected changes in utilization due to different levels of cost sharing. This adjustment is based on the 2020 adjusted federal AVC. The 2021 federal AVC was not used as the basis because the updates made to the AVC produced counterintuitive results across metal levels. The AVC, while not developed as a pricing tool, is used here to set the relativities between the plans because it represents the best approximation of a total market distribution free from selection bias. The adjustment described in section 3.8.6 ensures that the total premium collected is appropriately based on BCBSVT’s re-adjudication model and experience, and not the federal AV calculator.
3.8.1.1. Benefit Richness Adjustment The Benefit Richness Adjustment is the counterpart of the Change in Benefit projection factor (1+c1 line on Exhibit 5) described in Section 3.4.3. This factor represents the different projected utilization for each plan based solely on benefit design. We applied the HHS Induced Utilization formula (IU=AV2-AV+1.24) to each plan’s paid-to-allowed ratio described in the section above. These factors were normalized using the projected membership to ensure that the total adjustment is 1.000. The plan-level adjustment for benefit richness is calculated by applying the benefit richness adjustment by base benefit and applying a factor of 1.000 for non-system claims and market-wide adjustments. See Exhibit 6B for details.
3.8.1.2. Paid-to-Allowed Ratio The paid-to-allowed ratio as seen in Exhibit 6C reflects the expected portion of total claims BCBSVT will pay. To calculate these ratios, we utilize the standard population within the federal AVC. Two adjustments are made to the federal AVC: 1) impact of benefit items not supported by the AVC, and 2) the impact of family deductible and family out of pocket on the paid-to-allowed
BLUE CROSS BLUE SHIELD OF VERMONT 2021 VERMONT INDIVIDUAL AND SMALL GROUP RATE FILING
ACTUARIAL MEMORANDUM
43 | P a g e
ratio. The result is a paid-to-allowed ratio based on a standard population that reflects the BCBSVT plan designs, including the family deductible and out of pocket maximum arrangements. 3.8.2. Silver Loading: The silver loading plan level adjustment represents the impact of the defunding of the federal cost share reduction (CSR) program. Each base silver plan measures the impact of the 73%, 87%, 94% and 100% CSR plans by running each plan design through the BCBSVT re-adjudication model and observing the projected paid-to-allowed ratio differences. These plan specific differences are multiplied through by projected CSR membership. Projected CSR membership is assumed to be equal to the observed February 29, 2020 CSR membership. The total impact of the silver loading is $5.4 million. Please see details in Exhibit 6C. 3.8.3. Provider Network, Delivery System and Utilization Management adjustment: Not applicable. 3.8.4. Adjustment for benefits in addition to the EHBs: We trended our 2019 experience period non-EHB claims using the medical trends described in section 3.4.7, which produced an average allowed charge of $0.09 per member per month. Applying the same paid-to-allowed ratio to this benefit as to the EHB benefit, we calculate plan level factor adjustments that range from 1.0001 to 1.0005, as shown on Exhibit 6A. 3.8.5. Impact of specific eligibility categories for the catastrophic plan This plan adjustment includes two components of the impact of the specific eligibility categories for the catastrophic plan. Both adjustments are based on the eligible population. The eligible population includes Vermont residents who are under age 30 and residents age 30 and over who are granted a hardship exemption by Vermont Health Connect. We used our current enrollment in the catastrophic plan as a proxy for eligibility and adjusted the projected members who would qualify under the hardship rule to account for the increase in premiums.
product will be under age 30.
To adjust for the eligible population, we first calculated the adjustment for the impact on the pricing actuarial value of the expected lower allowed charges of the group eligible to enroll in the catastrophic plan. This was calculated by splitting the experience used to calculate the pricing actuarial value into two populations (qualifying by age or hardship) and re-adjudicating for the catastrophic benefit. Using the projected eligible members as weights, we calculate that the overall expected allowed charges are 0.5187 of the total allowed charges. We then adjusted the paid–to-allowed ratio based on the weighted average paid-to-allowed ratio from both populations. This factor is 0.9467.
These factors were applied to the EHB portion of the Projected Period Index Rate. Because this adjustment has no impact on the Non-System claims and Market Wide Adjustment, we calculated the expected claims cost and backed into the plan level adjustment for the impact of eligibility.
The total adjustment for the specific eligibility categories for the catastrophic plan is 0.4469. See Exhibit 6D for details.
BLUE CROSS BLUE SHIELD OF VERMONT 2021 VERMONT INDIVIDUAL AND SMALL GROUP RATE FILING
ACTUARIAL MEMORANDUM
44 | P a g e
3.8.6 Impact of Selection
Subscribers will make financial decisions that are right for them. Typically, this manifests itself in healthier subscribers selecting low-cost plans while less healthy subscribers select richer benefits. While we do not reflect selection in the plan-level adjustments, as per the instructions, it can be demonstrated that total premium will be understated without adjusting the index rate to spread the impact of selection across all plans (see Exhibit 6E). This is due to the plan share of allowed costs being greater for richer plan designs, which demonstrably experience antiselection in excess of benefit richness adjustments. The left section of Exhibit 6E shows the build-up of paid claims from allowed charges using actual plan-level adjustments described in Section 3.8 of this memorandum. The right section of the same exhibit demonstrates the impact on total paid claims of using benefit richness adjustments that instead reflect actual 2019 single risk pool experience. The ratio of weighted average projected paid claims calculated via each of these two approaches produces a factor that must be included in the index rate so that application of the various plan-level adjustments results in the correct total paid claims across all plans. The total impact of selection is 1.0871, as shown in Exhibit 6E. 3.8.7. Adjustment for distribution of the administrative costs 3.8.7.1. Administrative Expense Load: BCBSVT did not initially calculate the administrative expense load as a percent of premium adjustment. This adjustment is the sum of the following fees: BCBSVT Base Administrative Charges We use calendar year 2019 data from both individual and small group members to develop the Base Administrative Expenses PMPM. The starting PMPM for the base administrative charges is $45.87 PMPM. The single risk pool population is comprised of individuals who can choose to enroll through the Vermont Health Connect (VHC) website or directly with BCBSVT, and small groups that enroll directly with BCBSVT. The experience period base administrative expenses for individuals was $51.05 PMPM compared to $41.90 PMPM for members in small groups. We removed expenses incurred due to one-time, non-recurring events, as these fees are not expected to continue into the projection period. These primarily consist of transitional costs associated with the conversion to a new technology platform. We have reflected transitional savings of $0.46 PMPM in 2021 for the VISG line of business. The remaining charges ($45.41 PMPM) are projected to 2022 using a 2.2 percent annual trend. This projection factor is intended to make reasonable but modest provision for increases in overall operating costs PMPM. We assume that personnel costs (wages and benefits) will increase by 3 percent annually, the budgeted wage increase for 2020, over the projection period. We assumed that other operating costs remain flat. We calculated that 73.2 percent of our administrative costs are for salaries and benefits. The decline in this percentage from previous years is largely due to software depreciation increases due to the new operating platform along with a reduction in consulting services. We therefore increase our projected administrative expenses by the weighted average of 2.2 percent per annum.

BLUE CROSS BLUE SHIELD OF VERMONT 2021 VERMONT INDIVIDUAL AND SMALL GROUP RATE FILING
ACTUARIAL MEMORANDUM
45 | P a g e
Administrative trend calculation Percent of Total BCBSVT
Administrative Costs CY 2019
Employee costs: A = a1 + a2 56.7%
Purchased services B 22.5%
Other operating costs C 20.8%
Total Administrative Expenses D = A + B + C 100.0%
BCBSVT Personnel Cost E = A /(A + C) 73.2%
Projected Personnel Cost Increase F 3.0%
Projected Administrative Cost Increase G = (E x (1+F) + (1-E)) -1 2.2%
Overall enterprise membership decreased significantly in 2020. To adjust for membership losses, we calculate PMPM admin charges with 2019 enrollment and projected 2020 enrollment. Using the lower 2020 enrollment increases the PMPM by 6.0 percent. Cost accounting exercises suggest that variable costs represent half of total administrative expenses. BCBSVT is committed to providing insurance coverage for our members at the most affordable rates possible; as a result, even though it is impractical to react to enrollment shifts by immediately right-sizing staff, we nonetheless remove from our projection the entirety of variable costs associated with the reduced enrollment. We therefore apply an increase of 3.0 percent to the base PMPM charges to account for the reduction in membership. The table below demonstrates the calculation.
Average Monthly 2019 Enrollment A 187,261
Projected Monthly 2020 Enrollment B 176,610
CY 2019 enterprise PMPM with 2019 enrollment C $36.63
Projected CY 2020 enterprise PMPM with 2020 enrollment D = A x C / B $38.84
Reduced Projected CY 2020 enterprise PMPM to reflect 50% variable cost
E = C + (D-C)/2 $37.73
Impact of Membership Losses F = E/C 1.0302
To calculate the projected base administrative charges, we multiplied the experience PMPM, net of non-recurring expenses, by 2.2 percent for two years for trend.
Projected Administrative Charges Calculation PMPM
Experience Base Administrative Charges A $45.87
Exclusion of non-recurring expenses B ($0.46)
Trend Projection (2 years) C 1.0444
Impact of Membership changes D 1.0302
Projected Base Administrative Charges (Exhibit 7A) E = (A-B) x C x D $48.85
The projected base administrative charges PMPM of $48.85 is 7.2 percent of premium.

BLUE CROSS BLUE SHIELD OF VERMONT 2021 VERMONT INDIVIDUAL AND SMALL GROUP RATE FILING
ACTUARIAL MEMORANDUM
46 | P a g e
VHC Billing
Carriers will be taking over premium billing for VHC enrolled members for plan year 2022. BCBSVT must enhance its billing technology capabilities, hire customer service staff and be ready to process transactions by October 2021 for open enrollment. Expenses in plan year 2021 related to the transition of VHC billing are estimated at $0.94 PMPM. These are added to BCBSVT projected base administrative expenses.
Debit and Credit Card Fees
Starting in plan year 2021, BCBSVT will offer members the opportunity to pay their premiums via debit and credit cards. Currently, BCBSVT only offers direct debit and check payments. Banks charge fees as a percent of the transaction for debit and credit card payments. To estimate the average fee, we relied on our banking partners for the projected average fee per transaction. Their estimate, based on an average cost for debit card transaction of 0.7 percent, average cost for credit card transaction of 2.35 percent, and known banking fees of $0.15 and 0.25 percent per transaction, is 2.3 percent of premium. Currently, approximately 25 percent of BCBSVT VISG small groups and individuals directly enrolled with BCBSVT use our online platform to pay their premium via direct debit transactions. We expect that 40 percent of policy holders who currently use direct debit will switch to debit or credit card payment. We also project that the percentage of policyholders that use the online platform will grow to 40 percent, and that 70 percent of the new accounts will elect to pay via debit or credit card. Using these input items, we calculate an estimated fee of 0.4715 percent of premium.
Charges for Outside Vendors
CBA Dental and VSP Vision Dental and vision benefits are administered by third parties. The administrative fees are charged for eligible members only. We assume that these fees will not increase from those in the experience period, and therefore add a charge equal to the experience period PMPM.
HRA/HSA Integration Services All single risk pool members are eligible for HRA and/or HSA integration services. For plans with an HSA-compatible benefit design, we offer a service to integrate with the mechanics of depositing monies into and paying claims out of Health Savings Accounts (HSAs). All plans are also eligible for this service in connection with Health Reimbursement Accounts (HRAs). To calculate these fees, we used the experience of members that are already enrolled in this program and compared it to all members enrolled in the single risk pool in the first quarter of 2020. The total of all administrative charges outlined in this section is 7.91 percent of premium. The details of the administrative charges are on Exhibit 7A.

BLUE CROSS BLUE SHIELD OF VERMONT 2021 VERMONT INDIVIDUAL AND SMALL GROUP RATE FILING
ACTUARIAL MEMORANDUM
47 | P a g e
Reconciliation to the Supplemental Health Care Exhibit The Supplemental Health Care Exhibit (SHCE) is on a statutory accounting basis (as promulgated
by the NAIC), while the administrative charges in this filing were developed based on GAAP
accounting.
In the SHCE, administrative expenses are included in lines 1.5 to 1.7, 6.1 to 6.5, 8.1, 8.2 and 10.4. Line 1.5 also includes an allocation of federal income taxes that are not part of administrative expenses. Those must be excluded to reconcile to statutory basis administrative expenses (note that BCBSVT had an income tax benefit, or negative income tax expense, for 2019). Statutory and GAAP accounting treat some expenses differently, mainly related to ITS fees and pension costs. For the filing, we start with GAAP administrative expenses and then exclude from the base administrative charges federal and state fees and assessments (Federal Insurer Fee, PCORI, HCCA and GMCB billbacks) and certain fees paid to outside vendors, as those are added back into the premium separately. As described above, we also excluded from the experience expenses that were due to one-time, non-recurring events. The following chart demonstrates a reconciliation of the SCHE to base period administrative charges used in this filing:
Individual and Small Group
SCHE lines 1.5 to 1.7, 6.1 to 6.5, 8.1, 8.2 and 10.4. A $26,846,448
Less taxes in SCHE 1.5 that are not admin B ($1,138,520)
Total administrative charges - STAT basis C = A – B $27,984,968
Differences in STAT and GAAP treatment D ($2,102,889)
Total administrative charges - GAAP basis E = C + D $25,882,079
Federal and State fees F ($1,557,213)
Fees for outside vendors G ($231,635)
Exclusions* H ($214,973)
Total base administrative charges I = sum(E:H) $23,878,258
Member months J 520,581
Experience base administrative charges PMPM K = I / J $45.87
* The exclusions include the transitional savings and other one-time, non-recurring events.
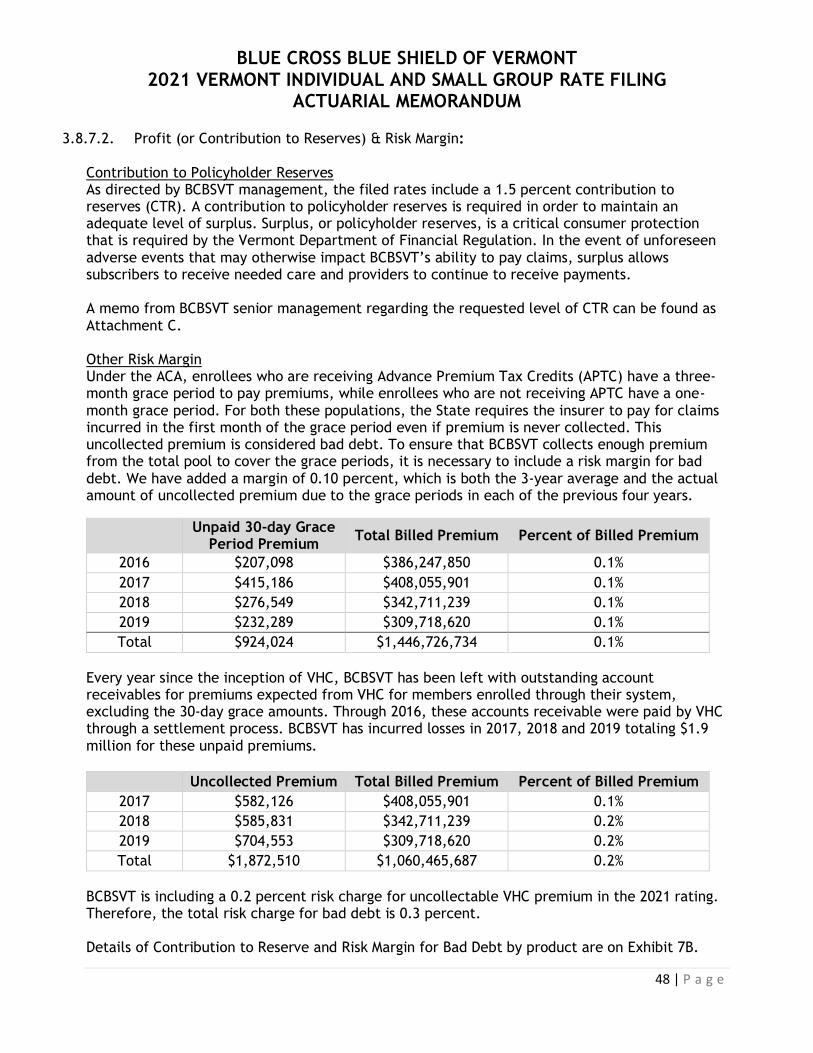
BLUE CROSS BLUE SHIELD OF VERMONT 2021 VERMONT INDIVIDUAL AND SMALL GROUP RATE FILING
ACTUARIAL MEMORANDUM
48 | P a g e
3.8.7.2. Profit (or Contribution to Reserves) & Risk Margin:
Contribution to Policyholder Reserves As directed by BCBSVT management, the filed rates include a 1.5 percent contribution to reserves (CTR). A contribution to policyholder reserves is required in order to maintain an adequate level of surplus. Surplus, or policyholder reserves, is a critical consumer protection that is required by the Vermont Department of Financial Regulation. In the event of unforeseen adverse events that may otherwise impact BCBSVT’s ability to pay claims, surplus allows subscribers to receive needed care and providers to continue to receive payments. A memo from BCBSVT senior management regarding the requested level of CTR can be found as Attachment C. Other Risk Margin Under the ACA, enrollees who are receiving Advance Premium Tax Credits (APTC) have a three-month grace period to pay premiums, while enrollees who are not receiving APTC have a one-month grace period. For both these populations, the State requires the insurer to pay for claims incurred in the first month of the grace period even if premium is never collected. This uncollected premium is considered bad debt. To ensure that BCBSVT collects enough premium from the total pool to cover the grace periods, it is necessary to include a risk margin for bad debt. We have added a margin of 0.10 percent, which is both the 3-year average and the actual amount of uncollected premium due to the grace periods in each of the previous four years.
Unpaid 30-day Grace Period Premium
Total Billed Premium Percent of Billed Premium
2016 $207,098 $386,247,850 0.1%
2017 $415,186 $408,055,901 0.1%
2018 $276,549 $342,711,239 0.1%
2019 $232,289 $309,718,620 0.1%
Total $924,024 $1,446,726,734 0.1%
Every year since the inception of VHC, BCBSVT has been left with outstanding account receivables for premiums expected from VHC for members enrolled through their system, excluding the 30-day grace amounts. Through 2016, these accounts receivable were paid by VHC through a settlement process. BCBSVT has incurred losses in 2017, 2018 and 2019 totaling $1.9 million for these unpaid premiums.
Uncollected Premium Total Billed Premium Percent of Billed Premium
2017 $582,126 $408,055,901 0.1%
2018 $585,831 $342,711,239 0.2%
2019 $704,553 $309,718,620 0.2%
Total $1,872,510 $1,060,465,687 0.2%
BCBSVT is including a 0.2 percent risk charge for uncollectable VHC premium in the 2021 rating. Therefore, the total risk charge for bad debt is 0.3 percent. Details of Contribution to Reserve and Risk Margin for Bad Debt by product are on Exhibit 7B.
BLUE CROSS BLUE SHIELD OF VERMONT 2021 VERMONT INDIVIDUAL AND SMALL GROUP RATE FILING
ACTUARIAL MEMORANDUM
49 | P a g e
3.8.7.3. Taxes and Fees:
The proposed rates include on average 1.43 percent in taxes and fees. These taxes and fees are imposed by both the state and federal government. Green Mountain Care Board Billbacks BCBSVT is assessed a billback from the Green Mountain Care Board. In 2019, $787,708 was allocated to the VISG market. To calculate the increase to this fee, we used the increase in BCBSVT invoice from FY2019 to FY2020 and applied to the portion allocated to VISG in 2019. The BCBSVT total invoice increased by 48.6 percent. We therefore calculate the projected 2021 billback allocated to BCBSVT VISG products as $1,170,718, or $2.54 PMPM.
Health Care Claims Tax The Health Care Claims Tax (HCCT) levied by the State of Vermont totals 0.999 percent of claims. This consists of 0.8 percent of claims for the HCCA tax and 0.199 percent of claims for the VITL assessment. Act 73 of 2013 sunset the 0.199 percent assessment for the Health IT-Fund. A two-year extension was approved by the Vermont legislature in Act 41. Given that this fee has routinely been extended close to its sunset date, we continue to include it in the calculation for the full calendar year.
Patient-Centered Outcomes Research Institute Fee This fee is part of the Affordable Care Act and applies to all plan years through October 1, 2029. We estimate that the fee will be $0.24 PMPM for the plan year ending December 2021. Federal Insurer Fee The Federal Insurer Fee (also known as the Health Insurer Tax, or HIT) funded some provisions of the Affordable Care Act. H.R.1865 ended this fee after 2020.
Risk Adjustment User Fees
Per the 2021 proposed Notice of Benefits and Payment Parameters (85 FR 7088), the risk adjustment user fee is $0.19 per billable member per month. Using the projected relationship of 0.9326 billable months per member month from the risk adjustment transfer calculation, we included $0.18 PMPM for the risk adjustment user fees.
Details of the Taxes and Fees by product are on Exhibit 7C.
3.8.8. Calibration Age, Tobacco, and Geographic factors are not allowed in Vermont. Therefore no calibration is required.

BLUE CROSS BLUE SHIELD OF VERMONT 2021 VERMONT INDIVIDUAL AND SMALL GROUP RATE FILING
ACTUARIAL MEMORANDUM
50 | P a g e
3.8.9. Projected Loss Ratio The MLR calculation will be performed at the combined market level with a minimum requirement of 80 percent. We project that the overall Loss Ratio, using the federally prescribed MLR methodology for the combined market, will be 90.8 percent. See Exhibit 8 for details.
3.9. Consumer Adjusted Premium Rate Development The Consumer Adjusted Premium rates are displayed on Exhibit 9B. Since rate factors for age, tobacco and geography are not allowed in Vermont, the only adjustment is the application of rating tier factors. Vermont has predetermined the tier factors for plans for Individuals and Small Groups. We observed that using the same contract conversion factor on all plans does not produce the same total premium when multiplying members and PMPM and when multiplying contracts and rates. This is due to not all plans having the same distribution in each tier and not all plans receiving the same annual rate increase. To correct this discrepancy, we calculate the contract conversion factor in two steps using projected membership. First, we calculate preliminary rates by tiers by using the simple ratio of average number of members to subscribers to calculate average tier factors for all plans except the catastrophic plan. We then compare the total premium from multiplying members by PMPM to the premium totaled by multiplying contracts by rates, and adjust the contract conversion factor to ensure that we collect the total required annual premium. We calculate a contract conversion factor specifically for the catastrophic plan and one for all other plans. Please see Exhibit 9A for details calculation of the contract conversion factor. The Consumer Adjusted Premium Rates are shown on Exhibit 9B. 3.10. Small Group Plan Premium Rates All Small Groups must renew on January 1, 2021 according to the combined market rules. BCBSVT will not file small group rates for Q2-Q4 2021.
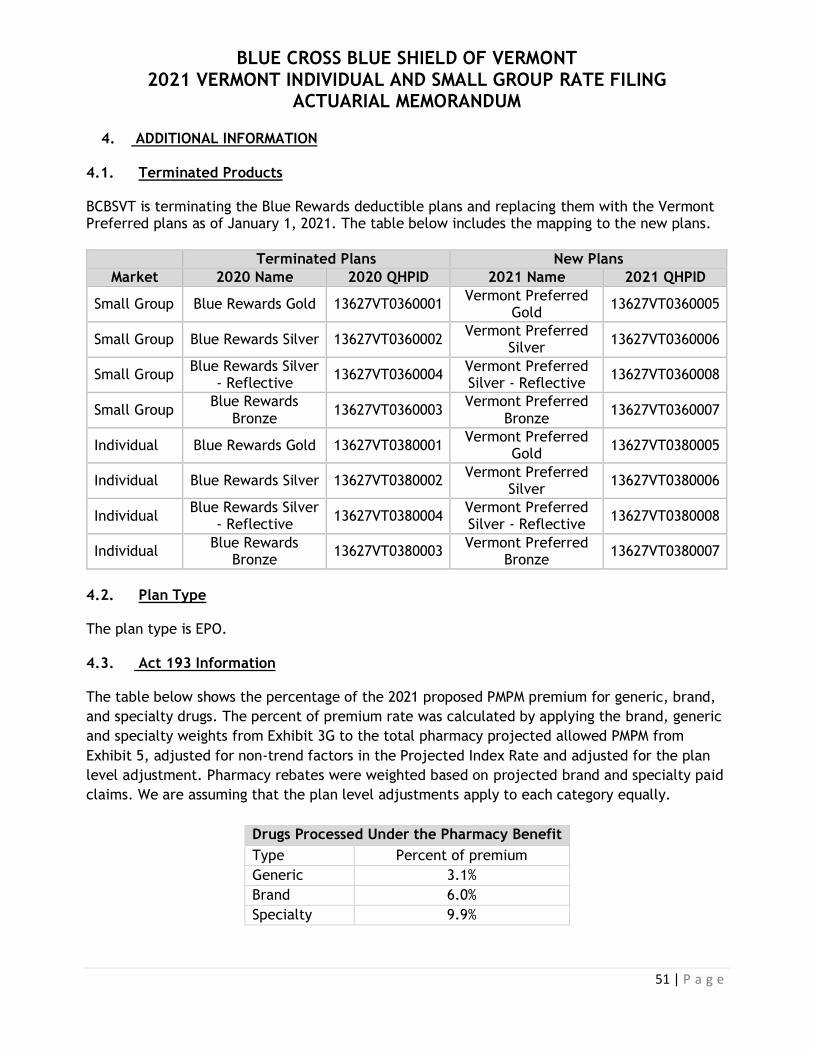
BLUE CROSS BLUE SHIELD OF VERMONT 2021 VERMONT INDIVIDUAL AND SMALL GROUP RATE FILING
ACTUARIAL MEMORANDUM
51 | P a g e
4. ADDITIONAL INFORMATION 4.1. Terminated Products BCBSVT is terminating the Blue Rewards deductible plans and replacing them with the Vermont Preferred plans as of January 1, 2021. The table below includes the mapping to the new plans.
Terminated Plans New Plans
Market 2020 Name 2020 QHPID 2021 Name 2021 QHPID
Small Group Blue Rewards Gold 13627VT0360001 Vermont Preferred
Gold 13627VT0360005
Small Group Blue Rewards Silver 13627VT0360002 Vermont Preferred
Silver 13627VT0360006
Small Group Blue Rewards Silver
- Reflective 13627VT0360004
Vermont Preferred Silver - Reflective
13627VT0360008
Small Group Blue Rewards
Bronze 13627VT0360003
Vermont Preferred Bronze
13627VT0360007
Individual Blue Rewards Gold 13627VT0380001 Vermont Preferred
Gold 13627VT0380005
Individual Blue Rewards Silver 13627VT0380002 Vermont Preferred
Silver 13627VT0380006
Individual Blue Rewards Silver
- Reflective 13627VT0380004
Vermont Preferred Silver - Reflective
13627VT0380008
Individual Blue Rewards
Bronze 13627VT0380003
Vermont Preferred Bronze
13627VT0380007
4.2. Plan Type The plan type is EPO. 4.3. Act 193 Information The table below shows the percentage of the 2021 proposed PMPM premium for generic, brand,
and specialty drugs. The percent of premium rate was calculated by applying the brand, generic
and specialty weights from Exhibit 3G to the total pharmacy projected allowed PMPM from
Exhibit 5, adjusted for non-trend factors in the Projected Index Rate and adjusted for the plan
level adjustment. Pharmacy rebates were weighted based on projected brand and specialty paid
claims. We are assuming that the plan level adjustments apply to each category equally.
Drugs Processed Under the Pharmacy Benefit
Type Percent of premium
Generic 3.1%
Brand 6.0%
Specialty 9.9%

BLUE CROSS BLUE SHIELD OF VERMONT 2021 VERMONT INDIVIDUAL AND SMALL GROUP RATE FILING
ACTUARIAL MEMORANDUM
52 | P a g e
The table below shows the change in allowed charge PMPM from calendar year 2018 to calendar
year 2019 and the annualized projected increase to 2021, including the impact of contract
changes.
Drugs Processed Under the Pharmacy Benefit
Type CY 2018 to CY 2019 CY 2019 to CY 2021, Annualized
Generic 3.0% 4.1%
Brand 9.1% 7.4%
Specialty 15.2% 20.5%
The increase in drug spending compared to other premium components is below:
Premium Increases
Component Increase
Rx Claims 8.5%
Medical Claims 5.8%
Non-Claims Components -6.4%
Information about BCBSVTs National Performance Formulary is located on our website,
https://www.bcbsvt.com/pharmacy/drug-lists/national-performance-formulary-npf . BCBSVT’s benefits do not have a specialty tier. All brand drugs, specialty or not, are included in the preferred brand or non-preferred brand tiers. Drugs administered in an outpatient setting and covered by the medical benefit represent 13.2 percent of the projected 2021 premium PMPM. BCBSVT’s pharmacy benefits are administered by Express Scripts (ESI). ESI manages claims processed through the pharmacy benefit but not claims processed through the medical benefit for use in a facility.
BLUE CROSS BLUE SHIELD OF VERMONT 2021 VERMONT INDIVIDUAL AND SMALL GROUP RATE FILING
ACTUARIAL MEMORANDUM
53 | P a g e
5. RELIANCE AND ACTUARIAL CERTIFICATION 5.1. Reliance
For the metallic AV values of the standard plans we relied upon the certification provided by Julie A. Peper, FSA, MAAA, Principal and Senior Consulting Actuary and Brittney Phillips, ASA, MAAA, Consulting Actuary with Wakely Consulting. (Attachment A) 5.2. Actuarial Certification The purpose of this rate filing is to provide the rates and a description of the rate development for the plans that Blue Cross and Blue Shield of Vermont (BCBSVT) is proposing to offer to the Vermont individual and small group market in 2020. These calculations are not intended to be used for any other purpose. This memorandum documents the methodology used to calculate the AV Metal Value for each Qualified Health plan and Reflective plan offered by BCBSVT in 2021, the appropriateness of the essential health benefit portion of premium upon which advanced payment of premium tax credits (APTCs) are based, that the Index Rate is developed in accordance with federal regulations, and that the Index Rate along with allowable modifiers are used in the development of plan specific premium rates. I, Paul A. Schultz, am a Fellow of the Society of Actuaries, a Member of the American Academy of Actuaries, meet the Qualification Standards for Actuaries Issuing Statements of Actuarial Opinion in the United States promulgated by the American Academy of Actuaries, and have the education and experience necessary to perform the work described herein. In my opinion, the projected Index Rate is in compliance with all applicable State and Federal Statutes and Regulations (including 45 CFR 156.80 and 147.102), has been developed in compliance with the applicable Actuarial Standards of Practice, is reasonable in relation to the benefits provided and the population anticipated to be covered, and is neither excessive nor deficient. The calculations and results are appropriate for the purpose intended. The Index Rate and only the allowable modifiers as described in 45 CFR 156.80(d)(1) and 45 CFR 156.80(d)(2) were used to generate plan level rates. I have relied upon the certification of AV Metal Value provided by the State for Standard Plans, and attached hereto. Metal AVs for Non-Standard Plans were determined using the AV calculator, or in accordance with the requirements of 45 CFR 156.135(b)(3), as described in the attached actuarial certification. Data used in this filing were reviewed for reasonableness, but no audit was performed. The COVID-19 pandemic introduces uncertainty far greater than that present in a typical rate development. Scientific knowledge of the pathogen and its treatment continues to evolve. Furthermore, future governmental action in response to the pandemic will have a material impact on costs. As the health care ecosystem continues to rapidly change, new developments may call into question the adequacy or excessiveness of the premium rates discussed herein.

BLUE CROSS BLUE SHIELD OF VERMONT 2021 VERMONT INDIVIDUAL AND SMALL GROUP RATE FILING
ACTUARIAL MEMORANDUM
54 | P a g e
The Part I Unified Rate Review Template does not demonstrate the process used by the issuer to develop the rates. Rather, it represents information required by Federal regulation to be provided in support of the review of rate increases, for certification of qualified health plans for federally facilitated exchanges, and for certification that the Index Rate is developed in accordance with Federal regulation, is used consistently, and is only adjusted by the allowable modifiers.
__________________________ Paul A. Schultz, F.S.A., M.A.A.A. Chief Actuary Blue Cross and Blue Shield of Vermont May 8, 2020

I HEREBY CERTIFY that I have reviewed the applicable filing requirements for this filing, and, to the best of my knowledge, the filing complies with all applicable statutory and regulatory provisions for the state of Vermont Ruth Greene Date Vice President, Treasurer & Chief Financial Officer
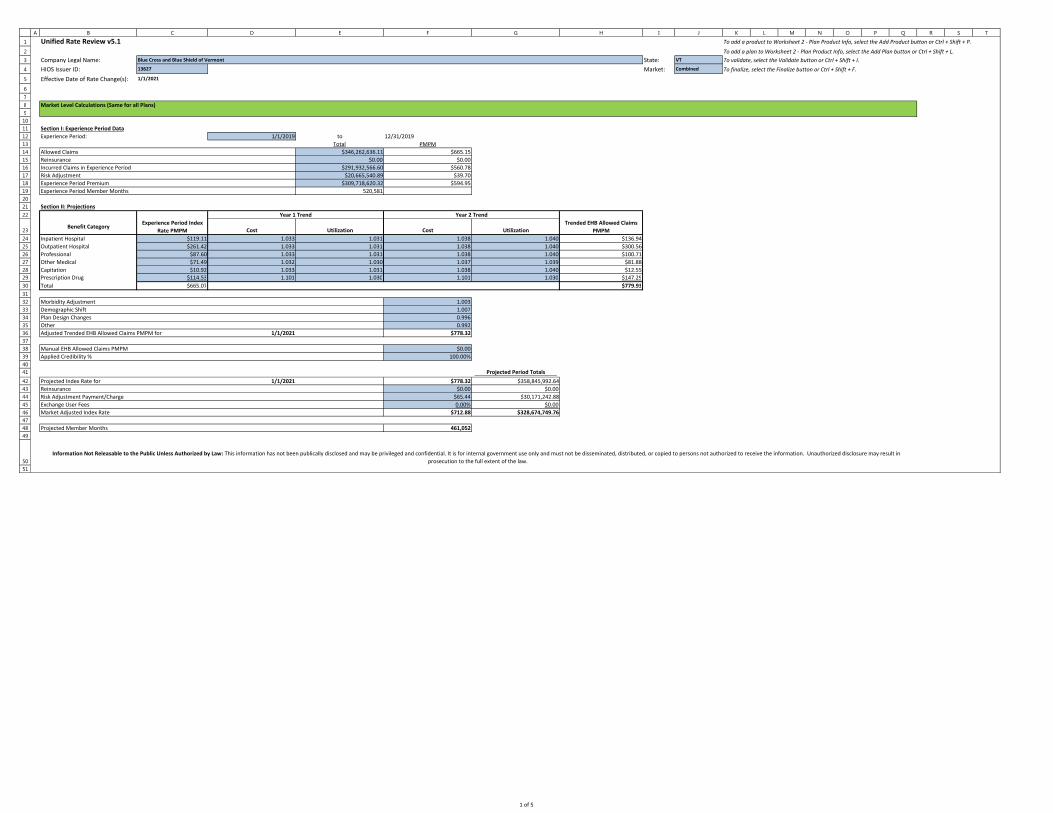
1
2
3
4
5
6
7
8
9
10
11
12
13
14
15
16
17
18
19
20
21
22
23
24
25
26
27
28
29
30
31
32
33
34
35
36
37
38
39
40
41
42
43
44
45
46
47
48
49
50
51
A B C D E F G H I J K L M N O P Q R S T
Pr
esUnified Rate Review v5.1 [assistive technology users, please reference cell A1 for instructions] To add a product to Worksheet 2 - Plan Product Info, select the Add Product button or Ctrl + Shift + P.
To add a plan to Worksheet 2 - Plan Product Info, select the Add Plan button or Ctrl + Shift + L.
Company Legal Name: Blue Cross and Blue Shield of Vermont State: VT To validate, select the Validate button or Ctrl + Shift + I.
HIOS Issuer ID: 13627 Market: Combined To finalize, select the Finalize button or Ctrl + Shift + F.
Effective Date of Rate Change(s): 1/1/2021
Section I: Experience Period Data
Experience Period: 1/1/2019 to 12/31/2019
Total PMPM
$346,262,636.11 $665.15
$0.00 $0.00
$291,932,566.60 $560.78
$20,665,540.89 $39.70
$309,718,620.32 $594.95
520,581
Section II: Projections
Benefit CategoryExperience Period Index
Rate PMPM Cost Utilization Cost Utilization
Trended EHB Allowed Claims
PMPM
Inpatient Hospital $119.11 1.033 1.031 1.038 1.040 $136.94
Outpatient Hospital $261.42 1.033 1.031 1.038 1.040 $300.56
Professional $87.60 1.033 1.031 1.038 1.040 $100.71
Other Medical $71.49 1.032 1.030 1.037 1.039 $81.88
Capitation $10.92 1.033 1.031 1.038 1.040 $12.55
Prescription Drug $114.53 1.101 1.030 1.101 1.030 $147.29
Total $665.07 $779.93
Morbidity Adjustment 1.003
Demographic Shift 1.007
Plan Design Changes 0.996
Other 0.992
Adjusted Trended EHB Allowed Claims PMPM for 1/1/2021 $778.32
Manual EHB Allowed Claims PMPM $0.00
Applied Credibility % 100.00%
Projected Period Totals
Projected Index Rate for 1/1/2021 $778.32 $358,845,992.64
Reinsurance $0.00 $0.00
Risk Adjustment Payment/Charge $65.44 $30,171,242.88
Exchange User Fees 0.00% $0.00
Market Adjusted Index Rate $712.88 $328,674,749.76
Projected Member Months 461,052
Information Not Releasable to the Public Unless Authorized by Law: This information has not been publically disclosed and may be privileged and confidential. It is for internal government use only and must not be disseminated, distributed, or copied to persons not authorized to receive the information. Unauthorized disclosure may result in
prosecution to the full extent of the law.
Market Level Calculations (Same for all Plans)
Year 1 Trend Year 2 Trend
Allowed Claims
Reinsurance
Incurred Claims in Experience Period
Risk Adjustment
Experience Period Premium
Experience Period Member Months
1 of 5

Press TAB and directional arrowProduct-Plan Data Collection [assistive technology users, please reference cell A1 for instructions] To add a product to Worksheet 2 - Plan Product Info, select th
To add a plan to Worksheet 2 - Plan Product Info, select the Add Plan button or Ctrl + Shift + L.
Company Legal Name: Blue Cross and Blue Shield of Vermont State: VT To validate, select the Validate button or Ctrl + Shift + I.
HIOS Issuer ID: 13627 Market: Combined To finalize, select the Finalize button or Ctrl + Shift + F.
Effective Date of Rate Change(s): 1/1/2021 To remove a product, navigate to the corresponding Product
To remove a plan, navigate to the corresponding Plan Name/
Field # Section I: General Product and Plan Information
1.1 Product Name
1.2 Product ID
1.3 Plan Name BCBSVT Platinum BCBSVT Gold Plan BCBSVT Silver Plan BCBSVT Silver BCBSVT Bronze BCBSVT Bronze BCBSVT Silver BCBSVT Silver BCBSVT Bronze BCBSVT Blue BCBSVT Platinum BCBSVT Gold Plan BCBSVT Silver Plan BCBSVT Silver
1.4 Plan ID (Standard Component ID) 13627VT0320001 13627VT0320002 13627VT0320003 13627VT0320006 13627VT0320004 13627VT0320005 13627VT0330001 13627VT0330003 13627VT0330002 13627VT0340001 13627VT0340002 13627VT0340003 13627VT0340004 13627VT0340007
1.5 Metal Platinum Gold Silver Silver Bronze Bronze Silver Silver Bronze Catastrophic Platinum Gold Silver Silver
1.6 AV Metal Value 0.897 0.819 0.718 0.718 0.641 0.648 0.712 0.712 0.638 0.570 0.897 0.819 0.718 0.718
1.7 Plan Category Renewing Renewing Renewing Renewing Renewing Renewing Renewing Renewing Renewing Renewing Renewing Renewing Renewing Renewing
1.8 Plan Type EPO EPO EPO EPO EPO EPO EPO EPO EPO EPO EPO EPO EPO EPO
1.9 Exchange Plan? Yes Yes Yes No Yes Yes Yes No Yes Yes Yes Yes Yes No
1.10 Effective Date of Proposed Rates 1/1/2021 1/1/2021 1/1/2021 1/1/2021 1/1/2021 1/1/2021 1/1/2021 1/1/2021 1/1/2021 1/1/2021 1/1/2021 1/1/2021 1/1/2021 1/1/2021
1.11 Cumulative Rate Change % (over 12 mos prior) 6.60% 4.56% 4.89% 4.41% 4.11% 3.44% 6.16% 5.50% 4.69% -0.66% 6.60% 4.56% 4.89% 4.41%
1.12 Product Rate Increase %
1.13 Submission Level Rate Increase %
Worksheet 1 Totals Section II: Experience Period and Current Plan Level Information
2.1 Plan ID (Standard Component ID) Total 13627VT0320001 13627VT0320002 13627VT0320003 13627VT0320006 13627VT0320004 13627VT0320005 13627VT0330001 13627VT0330003 13627VT0330002 13627VT0340001 13627VT0340002 13627VT0340003 13627VT0340004 13627VT0340007
$346,262,636 2.2 Allowed Claims $346,262,636 $61,237,972 $27,924,248 $0 $23,171,083 $3,959,455 $356,711 $0 $14,019,792 $3,194,550 $813,364 $35,980,998 $19,534,222 $38,782,752 $7,308,842
$0 2.3 Reinsurance $0 $0 $0 $0 $0 $0 $0 $0 $0 $0 $0 $0 $0 $0 $0
2.4 Member Cost Sharing $54,330,069 $4,929,160 $4,377,030 $0 $6,132,871 $1,476,401 $145,735 $0 $3,240,948 $1,048,828 $250,688 $2,074,840 $3,246,361 $4,999,777 $1,922,862
2.5 Cost Sharing Reduction $0 $0 $0 $0 $0 $0 $0 $0 $0 $0 $0 $0 $0 $0 $0
$291,932,567 2.6 Incurred Claims $291,932,567 $56,308,811 $23,547,218 $0 $17,038,212 $2,483,054 $210,976 $0 $10,778,845 $2,145,722 $562,676 $33,906,158 $16,287,861 $33,782,975 $5,385,980
$20,665,541 2.7 Risk Adjustment Transfer Amount $20,665,541 $8,434,352 -$1,064,545 -$3,570 -$5,321,058 -$1,908,787 -$217,026 $4,783 -$1,896,179 -$1,082,343 $11,931 $13,810,078 $1,431,629 $8,264,154 -$830,992
$309,718,620 2.8 Premium $309,718,620 $57,020,420 $26,882,626 $0 $26,473,743 $5,060,436 $495,963 $0 $13,608,653 $3,891,395 $923,348 $20,884,137 $17,654,408 $35,365,653 $7,263,539
520,581 2.9 Experience Period Member Months 520,581 81,736 44,927 0 50,515 10,976 1,099 0 26,452 8,523 3,657 28,090 27,287 52,041 14,399
2.10 Current Enrollment 39,195 5,659 2,870 0 3,443 855 172 0 1,579 684 360 2,078 1,927 3,546 1,143
2.11 Current Premium PMPM $636.85 $805.41 $695.78 $647.12 $576.91 $491.66 $501.48 $650.50 $594.05 $500.42 $265.36 $805.41 $695.78 $647.12 $576.91
2.12 Loss Ratio 88.36% 86.03% 91.20% 0.00% 80.55% 78.79% 75.64% 0.00% 92.03% 76.39% 60.16% 97.73% 85.34% 77.43% 83.73%
Per Member Per Month
2.13 Allowed Claims $665.15 $749.22 $621.55 #DIV/0! $458.70 $360.74 $324.58 #DIV/0! $530.01 $374.82 $222.41 $1,280.92 $715.88 $745.23 $507.59
2.14 Reinsurance $0.00 $0.00 $0.00 #DIV/0! $0.00 $0.00 $0.00 #DIV/0! $0.00 $0.00 $0.00 $0.00 $0.00 $0.00 $0.00
2.15 Member Cost Sharing $104.36 $60.31 $97.43 #DIV/0! $121.41 $134.51 $132.61 #DIV/0! $122.52 $123.06 $68.55 $73.86 $118.97 $96.07 $133.54
2.16 Cost Sharing Reduction $0.00 $0.00 $0.00 #DIV/0! $0.00 $0.00 $0.00 #DIV/0! $0.00 $0.00 $0.00 $0.00 $0.00 $0.00 $0.00
2.17 Incurred Claims $560.78 $688.91 $524.12 #DIV/0! $337.29 $226.23 $191.97 #DIV/0! $407.49 $251.76 $153.86 $1,207.05 $596.91 $649.16 $374.05
2.18 Risk Adjustment Transfer Amount $39.70 $103.19 -$23.69 #DIV/0! -$105.34 -$173.91 -$197.48 #DIV/0! -$71.68 -$126.99 $3.26 $491.64 $52.47 $158.80 -$57.71
2.19 Premium $594.95 $697.62 $598.36 #DIV/0! $524.08 $461.05 $451.29 #DIV/0! $514.47 $456.58 $252.49 $743.47 $646.99 $679.57 $504.45
Section III: Plan Adjustment Factors
3.1 Plan ID (Standard Component ID) 13627VT0320001 13627VT0320002 13627VT0320003 13627VT0320006 13627VT0320004 13627VT0320005 13627VT0330001 13627VT0330003 13627VT0330002 13627VT0340001 13627VT0340002 13627VT0340003 13627VT0340004 13627VT0340007
3.2 Market Adjusted Index Rate
3.3 AV and Cost Sharing Design of Plan 1.0927 1.0026 0.9334 0.8331 0.7116 0.7256 0.9384 0.8576 0.7241 0.3890 1.1589 1.0026 0.9334 0.8331
3.4 Provider Network Adjustment 1.0000 1.0000 1.0000 1.0000 1.0000 1.0000 1.0000 1.0000 1.0000 1.0000 1.0000 1.0000 1.0000 1.0000
3.5 Benefits in Addition to EHB 1.0001 1.0001 1.0002 1.0002 1.0002 1.0002 1.0001 1.0002 1.0002 1.0005 1.0001 1.0001 1.0002 1.0002
Administrative Costs
3.6 Administrative Expense 6.97% 6.50% 6.98% 7.82% 9.17% 8.98% 6.94% 7.60% 9.01% 16.74% 5.63% 6.50% 6.98% 7.82%
3.7 Taxes and Fees 1.47% 3.50% 3.52% 3.57% 3.64% 3.63% 3.52% 3.56% 3.63% 4.04% 3.45% 3.50% 3.52% 3.57%
3.8 Profit & Risk Load 1.99% 1.60% 1.60% 1.60% 1.60% 1.60% 1.60% 1.60% 1.60% 1.60% 1.60% 1.60% 1.60% 1.60%
3.9 Catastrophic Adjustment 1.0000 1.0000 1.0000 1.0000 1.0000 1.0000 1.0000 1.0000 1.0000 0.4469 1.0000 1.0000 1.0000 1.0000
3.10 Plan Adjusted Index Rate $869.76 $808.60 $757.15 $682.70 $592.81 $603.06 $760.78 $700.93 $602.03 $159.74 $925.03 $808.60 $757.15 $682.70
3.11 Age Calibration Factor 1.0000
3.12 Geographic Calibration Factor 1.0000
3.13 Tobacco Calibration Factor 1.0000
3.14 Calibrated Plan Adjusted Index Rate $869.76 $808.60 $757.15 $682.70 $592.81 $603.06 $760.78 $700.93 $602.03 $159.74 $925.03 $808.60 $757.15 $682.70
Section IV: Projected Plan Level Information
4.1 Plan ID (Standard Component ID) Total 13627VT0320001 13627VT0320002 13627VT0320003 13627VT0320006 13627VT0320004 13627VT0320005 13627VT0330001 13627VT0330003 13627VT0330002 13627VT0340001 13627VT0340002 13627VT0340003 13627VT0340004 13627VT0340007
4.2 Allowed Claims $328,783,803 $41,802,891 $24,559,733 $0 $29,463,123 $7,316,576 $1,471,873 $0 $13,512,132 $5,853,260 $3,080,663 $17,782,274 $16,490,107 $30,344,535 $9,781,106
4.3 Reinsurance $0 $0 $0 $0 $0 $0 $0 $0 $0 $0 $0 $0 $0 $0 $0
4.4 Member Cost Sharing $8,205,167 $1,085,713 $634,767 $0 $757,275 $187,163 $37,666 $0 $347,700 $149,832 $78,837 $461,845 $426,201 $779,930 $251,399
4.5 Cost Sharing Reduction $0 $0 $0 $0 $0 $0 $0 $0 $0 $0 $0 $0 $0 $0 $0
4.6 Incurred Claims $320,578,635 $40,717,178 $23,924,967 $0 $28,705,847 $7,129,412 $1,434,206 $0 $13,164,432 $5,703,429 $3,001,826 $17,320,429 $16,063,906 $29,564,605 $9,529,708
4.7 Risk Adjustment Transfer Amount $22,812,485 $7,978,984 -$578,803 $0 -$4,764,897 -$2,035,214 -$468,115 $0 -$1,436,318 -$1,172,492 $11,990 $14,884,381 $1,709,113 $8,456,610 -$810,182
4.8 Premium $311,271,940 $50,421,687 $25,098,904 $0 $24,930,759 $5,261,010 $1,072,618 $0 $11,896,193 $4,307,775 $1,135,238 $21,448,570 $16,852,121 $28,935,142 $8,276,462
4.9 Projected Member Months 461,052 58,620 34,440 0 41,316 10,260 2,064 0 18,948 8,208 4,320 24,936 23,124 42,552 13,716
4.10 Loss Ratio 95.96% 69.72% 97.57% #DIV/0! 142.35% 221.01% 237.25% #DIV/0! 125.86% 181.91% 261.66% 47.67% 86.55% 79.07% 127.64%
Per Member Per Month
4.11 Allowed Claims $713.12 $713.12 $713.12 #DIV/0! $713.12 $713.12 $713.12 #DIV/0! $713.12 $713.12 $713.12 $713.12 $713.12 $713.12 $713.12
4.12 Reinsurance $0.00 $0.00 $0.00 #DIV/0! $0.00 $0.00 $0.00 #DIV/0! $0.00 $0.00 $0.00 $0.00 $0.00 $0.00 $0.00
4.13 Member Cost Sharing $17.80 $18.52 $18.43 #DIV/0! $18.33 $18.24 $18.25 #DIV/0! $18.35 $18.25 $18.25 $18.52 $18.43 $18.33 $18.33
4.14 Cost Sharing Reduction $0.00 $0.00 $0.00 #DIV/0! $0.00 $0.00 $0.00 #DIV/0! $0.00 $0.00 $0.00 $0.00 $0.00 $0.00 $0.00
4.15 Incurred Claims $695.32 $694.60 $694.69 #DIV/0! $694.79 $694.87 $694.87 #DIV/0! $694.77 $694.86 $694.87 $694.60 $694.69 $694.79 $694.79
4.16 Risk Adjustment Transfer Amount $49.48 $136.11 -$16.81 #DIV/0! -$115.33 -$198.36 -$226.80 #DIV/0! -$75.80 -$142.85 $2.78 $596.90 $73.91 $198.74 -$59.07
4.17 Premium $675.13 $860.14 $728.77 #DIV/0! $603.42 $512.77 $519.68 #DIV/0! $627.83 $524.83 $262.79 $860.14 $728.77 $679.99 $603.42
BCBSVT EPO CDHP (Small Group)
13627VT033
5.28%
Product/Plan Level Calculations
BCBSVT EPO (Small Group)
13627VT032
5.52%
BCBSVT EPO (Individual)
13627VT034
5.02%
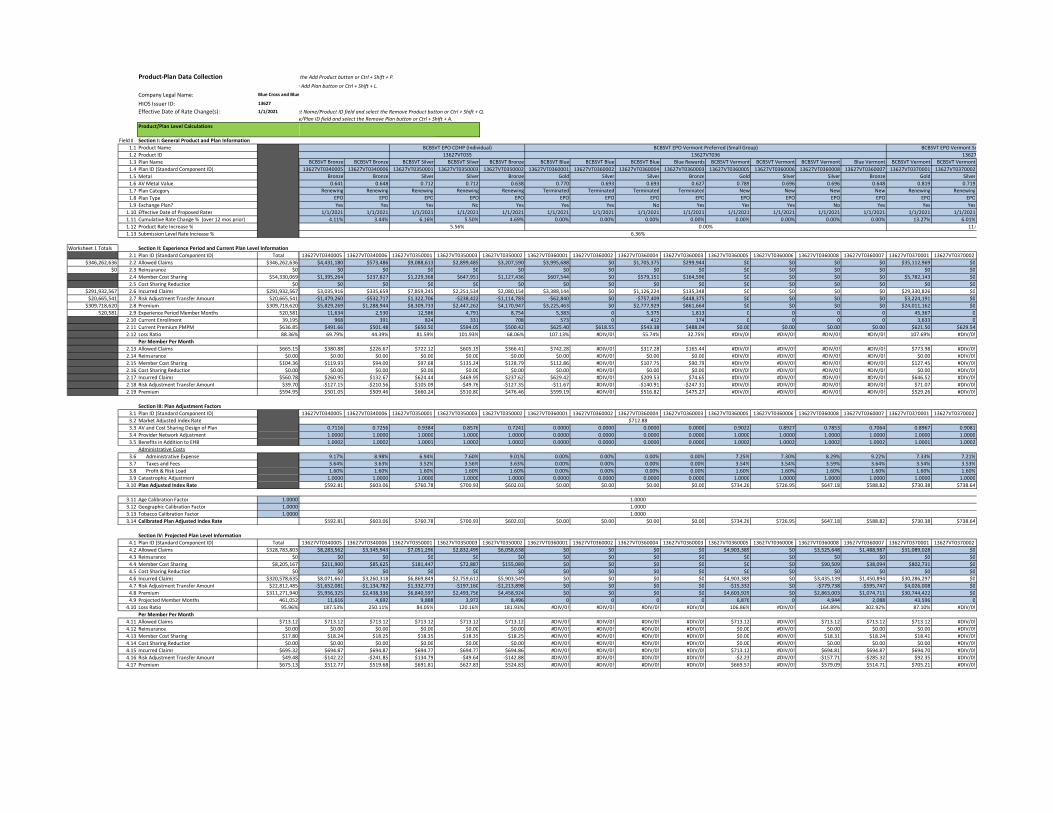
Press TAB and directional arrowProduct-Plan Data Collection [assistive technology users, please reference cell A1 for instructions]
Company Legal Name: Blue Cross and Blue Shield of Vermont
HIOS Issuer ID: 13627
Effective Date of Rate Change(s): 1/1/2021
Field # Section I: General Product and Plan Information
1.1 Product Name
1.2 Product ID
1.3 Plan Name
1.4 Plan ID (Standard Component ID)
1.5 Metal
1.6 AV Metal Value
1.7 Plan Category
1.8 Plan Type
1.9 Exchange Plan?
1.10 Effective Date of Proposed Rates
1.11 Cumulative Rate Change % (over 12 mos prior)
1.12 Product Rate Increase %
1.13 Submission Level Rate Increase %
Worksheet 1 Totals Section II: Experience Period and Current Plan Level Information
2.1 Plan ID (Standard Component ID) Total
$346,262,636 2.2 Allowed Claims $346,262,636
$0 2.3 Reinsurance $0
2.4 Member Cost Sharing $54,330,069
2.5 Cost Sharing Reduction $0
$291,932,567 2.6 Incurred Claims $291,932,567
$20,665,541 2.7 Risk Adjustment Transfer Amount $20,665,541
$309,718,620 2.8 Premium $309,718,620
520,581 2.9 Experience Period Member Months 520,581
2.10 Current Enrollment 39,195
2.11 Current Premium PMPM $636.85
2.12 Loss Ratio 88.36%
Per Member Per Month
2.13 Allowed Claims $665.15
2.14 Reinsurance $0.00
2.15 Member Cost Sharing $104.36
2.16 Cost Sharing Reduction $0.00
2.17 Incurred Claims $560.78
2.18 Risk Adjustment Transfer Amount $39.70
2.19 Premium $594.95
Section III: Plan Adjustment Factors
3.1 Plan ID (Standard Component ID)
3.2 Market Adjusted Index Rate
3.3 AV and Cost Sharing Design of Plan
3.4 Provider Network Adjustment
3.5 Benefits in Addition to EHB
Administrative Costs
3.6 Administrative Expense
3.7 Taxes and Fees
3.8 Profit & Risk Load
3.9 Catastrophic Adjustment
3.10 Plan Adjusted Index Rate
3.11 Age Calibration Factor 1.0000
3.12 Geographic Calibration Factor 1.0000
3.13 Tobacco Calibration Factor 1.0000
3.14 Calibrated Plan Adjusted Index Rate
Section IV: Projected Plan Level Information
4.1 Plan ID (Standard Component ID) Total
4.2 Allowed Claims $328,783,803
4.3 Reinsurance $0
4.4 Member Cost Sharing $8,205,167
4.5 Cost Sharing Reduction $0
4.6 Incurred Claims $320,578,635
4.7 Risk Adjustment Transfer Amount $22,812,485
4.8 Premium $311,271,940
4.9 Projected Member Months 461,052
4.10 Loss Ratio 95.96%
Per Member Per Month
4.11 Allowed Claims $713.12
4.12 Reinsurance $0.00
4.13 Member Cost Sharing $17.80
4.14 Cost Sharing Reduction $0.00
4.15 Incurred Claims $695.32
4.16 Risk Adjustment Transfer Amount $49.48
4.17 Premium $675.13
Product/Plan Level Calculations
To add a product to Worksheet 2 - Plan Product Info, select the Add Product button or Ctrl + Shift + P.
To add a plan to Worksheet 2 - Plan Product Info, select the Add Plan button or Ctrl + Shift + L.
To remove a product, navigate to the corresponding Product Name/Product ID field and select the Remove Product button or Ctrl + Shift + Q.
To remove a plan, navigate to the corresponding Plan Name/Plan ID field and select the Remove Plan button or Ctrl + Shift + A.
BCBSVT Bronze BCBSVT Bronze BCBSVT Silver BCBSVT Silver BCBSVT Bronze BCBSVT Blue BCBSVT Blue BCBSVT Blue Blue Rewards BCBSVT Vermont BCBSVT Vermont BCBSVT Vermont Blue Vermont BCBSVT Vermont BCBSVT Vermont
13627VT0340005 13627VT0340006 13627VT0350001 13627VT0350003 13627VT0350002 13627VT0360001 13627VT0360002 13627VT0360004 13627VT0360003 13627VT0360005 13627VT0360006 13627VT0360008 13627VT0360007 13627VT0370001 13627VT0370002
Bronze Bronze Silver Silver Bronze Gold Silver Silver Bronze Gold Silver Silver Bronze Gold Silver
0.641 0.648 0.712 0.712 0.638 0.770 0.693 0.693 0.627 0.789 0.696 0.696 0.648 0.819 0.719
Renewing Renewing Renewing Renewing Renewing Terminated Terminated Terminated Terminated New New New New Renewing Renewing
EPO EPO EPO EPO EPO EPO EPO EPO EPO EPO EPO EPO EPO EPO EPO
Yes Yes Yes No Yes Yes Yes No Yes Yes Yes No Yes Yes Yes
1/1/2021 1/1/2021 1/1/2021 1/1/2021 1/1/2021 1/1/2021 1/1/2021 1/1/2021 1/1/2021 1/1/2021 1/1/2021 1/1/2021 1/1/2021 1/1/2021 1/1/2021
4.11% 3.44% 6.16% 5.50% 4.69% 0.00% 0.00% 0.00% 0.00% 0.00% 0.00% 0.00% 0.00% 13.27% 6.01%
13627VT0340005 13627VT0340006 13627VT0350001 13627VT0350003 13627VT0350002 13627VT0360001 13627VT0360002 13627VT0360004 13627VT0360003 13627VT0360005 13627VT0360006 13627VT0360008 13627VT0360007 13627VT0370001 13627VT0370002
$4,431,180 $573,486 $9,088,613 $2,899,485 $3,207,590 $3,995,688 $0 $1,705,375 $299,944 $0 $0 $0 $0 $35,112,969 $0
$0 $0 $0 $0 $0 $0 $0 $0 $0 $0 $0 $0 $0 $0 $0
$1,395,264 $237,827 $1,229,368 $647,951 $1,127,436 $607,544 $0 $579,151 $164,596 $0 $0 $0 $0 $5,782,143 $0
$0 $0 $0 $0 $0 $0 $0 $0 $0 $0 $0 $0 $0 $0 $0
$3,035,916 $335,659 $7,859,245 $2,251,534 $2,080,154 $3,388,144 $0 $1,126,224 $135,348 $0 $0 $0 $0 $29,330,826 $0
-$1,479,260 -$532,717 $1,322,706 -$238,422 -$1,114,783 -$62,840 $0 -$757,409 -$448,375 $0 $0 $0 $0 $3,224,191 $0
$5,829,269 $1,288,944 $8,309,733 $2,447,262 $4,170,947 $3,225,463 $0 $2,777,929 $861,664 $0 $0 $0 $0 $24,011,162 $0
11,634 2,530 12,586 4,791 8,754 5,383 0 5,375 1,813 0 0 0 0 45,367 0
968 391 824 331 708 573 0 412 174 0 0 0 0 3,633 0
$491.66 $501.48 $650.50 $594.05 $500.42 $625.40 $618.55 $543.38 $488.04 $0.00 $0.00 $0.00 $0.00 $621.50 $629.54
69.79% 44.39% 81.59% 101.93% 68.06% 107.13% #DIV/0! 55.74% 32.75% #DIV/0! #DIV/0! #DIV/0! #DIV/0! 107.69% #DIV/0!
$380.88 $226.67 $722.12 $605.19 $366.41 $742.28 #DIV/0! $317.28 $165.44 #DIV/0! #DIV/0! #DIV/0! #DIV/0! $773.98 #DIV/0!
$0.00 $0.00 $0.00 $0.00 $0.00 $0.00 #DIV/0! $0.00 $0.00 #DIV/0! #DIV/0! #DIV/0! #DIV/0! $0.00 #DIV/0!
$119.93 $94.00 $97.68 $135.24 $128.79 $112.86 #DIV/0! $107.75 $90.79 #DIV/0! #DIV/0! #DIV/0! #DIV/0! $127.45 #DIV/0!
$0.00 $0.00 $0.00 $0.00 $0.00 $0.00 #DIV/0! $0.00 $0.00 #DIV/0! #DIV/0! #DIV/0! #DIV/0! $0.00 #DIV/0!
$260.95 $132.67 $624.44 $469.95 $237.62 $629.42 #DIV/0! $209.53 $74.65 #DIV/0! #DIV/0! #DIV/0! #DIV/0! $646.52 #DIV/0!
-$127.15 -$210.56 $105.09 -$49.76 -$127.35 -$11.67 #DIV/0! -$140.91 -$247.31 #DIV/0! #DIV/0! #DIV/0! #DIV/0! $71.07 #DIV/0!
$501.05 $509.46 $660.24 $510.80 $476.46 $599.19 #DIV/0! $516.82 $475.27 #DIV/0! #DIV/0! #DIV/0! #DIV/0! $529.26 #DIV/0!
13627VT0340005 13627VT0340006 13627VT0350001 13627VT0350003 13627VT0350002 13627VT0360001 13627VT0360002 13627VT0360004 13627VT0360003 13627VT0360005 13627VT0360006 13627VT0360008 13627VT0360007 13627VT0370001 13627VT0370002
0.7116 0.7256 0.9384 0.8576 0.7241 0.0000 0.0000 0.0000 0.0000 0.9022 0.8927 0.7853 0.7064 0.8967 0.9081
1.0000 1.0000 1.0000 1.0000 1.0000 0.0000 0.0000 0.0000 0.0000 1.0000 1.0000 1.0000 1.0000 1.0000 1.0000
1.0002 1.0002 1.0001 1.0002 1.0002 0.0000 0.0000 0.0000 0.0000 1.0002 1.0002 1.0002 1.0002 1.0001 1.0002
9.17% 8.98% 6.94% 7.60% 9.01% 0.00% 0.00% 0.00% 0.00% 7.25% 7.30% 8.29% 9.22% 7.33% 7.21%
3.64% 3.63% 3.52% 3.56% 3.63% 0.00% 0.00% 0.00% 0.00% 3.54% 3.54% 3.59% 3.64% 3.54% 3.53%
1.60% 1.60% 1.60% 1.60% 1.60% 0.00% 0.00% 0.00% 0.00% 1.60% 1.60% 1.60% 1.60% 1.60% 1.60%
1.0000 1.0000 1.0000 1.0000 1.0000 0.0000 0.0000 0.0000 0.0000 1.0000 1.0000 1.0000 1.0000 1.0000 1.0000
$592.81 $603.06 $760.78 $700.93 $602.03 $0.00 $0.00 $0.00 $0.00 $734.26 $726.95 $647.18 $588.82 $730.38 $738.64
$592.81 $603.06 $760.78 $700.93 $602.03 $0.00 $0.00 $0.00 $0.00 $734.26 $726.95 $647.18 $588.82 $730.38 $738.64
13627VT0340005 13627VT0340006 13627VT0350001 13627VT0350003 13627VT0350002 13627VT0360001 13627VT0360002 13627VT0360004 13627VT0360003 13627VT0360005 13627VT0360006 13627VT0360008 13627VT0360007 13627VT0370001 13627VT0370002
$8,283,562 $3,345,943 $7,051,296 $2,832,499 $6,058,638 $0 $0 $0 $0 $4,903,389 $0 $3,525,648 $1,488,987 $31,089,028 $0
$0 $0 $0 $0 $0 $0 $0 $0 $0 $0 $0 $0 $0 $0 $0
$211,900 $85,625 $181,447 $72,887 $155,089 $0 $0 $0 $0 $0 $0 $90,509 $38,094 $802,731 $0
$0 $0 $0 $0 $0 $0 $0 $0 $0 $0 $0 $0 $0 $0 $0
$8,071,662 $3,260,318 $6,869,849 $2,759,612 $5,903,549 $0 $0 $0 $0 $4,903,389 $0 $3,435,139 $1,450,894 $30,286,297 $0
-$1,652,081 -$1,134,782 $1,332,773 -$197,160 -$1,213,898 $0 $0 $0 $0 -$15,332 $0 -$779,738 -$595,747 $4,026,008 $0
$5,956,325 $2,438,336 $6,840,597 $2,493,756 $4,458,924 $0 $0 $0 $0 $4,603,929 $0 $2,863,003 $1,074,711 $30,744,422 $0
11,616 4,692 9,888 3,972 8,496 0 0 0 0 6,876 0 4,944 2,088 43,596 0
187.53% 250.11% 84.05% 120.16% 181.93% #DIV/0! #DIV/0! #DIV/0! #DIV/0! 106.86% #DIV/0! 164.89% 302.92% 87.10% #DIV/0!
$713.12 $713.12 $713.12 $713.12 $713.12 #DIV/0! #DIV/0! #DIV/0! #DIV/0! $713.12 #DIV/0! $713.12 $713.12 $713.12 #DIV/0!
$0.00 $0.00 $0.00 $0.00 $0.00 #DIV/0! #DIV/0! #DIV/0! #DIV/0! $0.00 #DIV/0! $0.00 $0.00 $0.00 #DIV/0!
$18.24 $18.25 $18.35 $18.35 $18.25 #DIV/0! #DIV/0! #DIV/0! #DIV/0! $0.00 #DIV/0! $18.31 $18.24 $18.41 #DIV/0!
$0.00 $0.00 $0.00 $0.00 $0.00 #DIV/0! #DIV/0! #DIV/0! #DIV/0! $0.00 #DIV/0! $0.00 $0.00 $0.00 #DIV/0!
$694.87 $694.87 $694.77 $694.77 $694.86 #DIV/0! #DIV/0! #DIV/0! #DIV/0! $713.12 #DIV/0! $694.81 $694.87 $694.70 #DIV/0!
-$142.22 -$241.85 $134.79 -$49.64 -$142.88 #DIV/0! #DIV/0! #DIV/0! #DIV/0! -$2.23 #DIV/0! -$157.71 -$285.32 $92.35 #DIV/0!
$512.77 $519.68 $691.81 $627.83 $524.83 #DIV/0! #DIV/0! #DIV/0! #DIV/0! $669.57 #DIV/0! $579.09 $514.71 $705.21 #DIV/0!
1.0000
1.0000
$712.88
6.36%
1.0000
BCBSVT EPO Vermont Sele
13627VT037
11.04%
BCBSVT EPO Vermont Preferred (Small Group)
13627VT036
0.00%
BCBSVT EPO CDHP (Individual)
13627VT035
5.56%

Press TAB and directional arrowProduct-Plan Data Collection [assistive technology users, please reference cell A1 for instructions]
Company Legal Name: Blue Cross and Blue Shield of Vermont
HIOS Issuer ID: 13627
Effective Date of Rate Change(s): 1/1/2021
Field # Section I: General Product and Plan Information
1.1 Product Name
1.2 Product ID
1.3 Plan Name
1.4 Plan ID (Standard Component ID)
1.5 Metal
1.6 AV Metal Value
1.7 Plan Category
1.8 Plan Type
1.9 Exchange Plan?
1.10 Effective Date of Proposed Rates
1.11 Cumulative Rate Change % (over 12 mos prior)
1.12 Product Rate Increase %
1.13 Submission Level Rate Increase %
Worksheet 1 Totals Section II: Experience Period and Current Plan Level Information
2.1 Plan ID (Standard Component ID) Total
$346,262,636 2.2 Allowed Claims $346,262,636
$0 2.3 Reinsurance $0
2.4 Member Cost Sharing $54,330,069
2.5 Cost Sharing Reduction $0
$291,932,567 2.6 Incurred Claims $291,932,567
$20,665,541 2.7 Risk Adjustment Transfer Amount $20,665,541
$309,718,620 2.8 Premium $309,718,620
520,581 2.9 Experience Period Member Months 520,581
2.10 Current Enrollment 39,195
2.11 Current Premium PMPM $636.85
2.12 Loss Ratio 88.36%
Per Member Per Month
2.13 Allowed Claims $665.15
2.14 Reinsurance $0.00
2.15 Member Cost Sharing $104.36
2.16 Cost Sharing Reduction $0.00
2.17 Incurred Claims $560.78
2.18 Risk Adjustment Transfer Amount $39.70
2.19 Premium $594.95
Section III: Plan Adjustment Factors
3.1 Plan ID (Standard Component ID)
3.2 Market Adjusted Index Rate
3.3 AV and Cost Sharing Design of Plan
3.4 Provider Network Adjustment
3.5 Benefits in Addition to EHB
Administrative Costs
3.6 Administrative Expense
3.7 Taxes and Fees
3.8 Profit & Risk Load
3.9 Catastrophic Adjustment
3.10 Plan Adjusted Index Rate
3.11 Age Calibration Factor 1.0000
3.12 Geographic Calibration Factor 1.0000
3.13 Tobacco Calibration Factor 1.0000
3.14 Calibrated Plan Adjusted Index Rate
Section IV: Projected Plan Level Information
4.1 Plan ID (Standard Component ID) Total
4.2 Allowed Claims $328,783,803
4.3 Reinsurance $0
4.4 Member Cost Sharing $8,205,167
4.5 Cost Sharing Reduction $0
4.6 Incurred Claims $320,578,635
4.7 Risk Adjustment Transfer Amount $22,812,485
4.8 Premium $311,271,940
4.9 Projected Member Months 461,052
4.10 Loss Ratio 95.96%
Per Member Per Month
4.11 Allowed Claims $713.12
4.12 Reinsurance $0.00
4.13 Member Cost Sharing $17.80
4.14 Cost Sharing Reduction $0.00
4.15 Incurred Claims $695.32
4.16 Risk Adjustment Transfer Amount $49.48
4.17 Premium $675.13
Product/Plan Level Calculations
BCBSVT Vermont BCBSVT Vermont BCBSVT Blue BCBSVT Blue BCBSVT Blue Blue Rewards BCBSVT Vermont BCBSVT Vermont BCBSVT Vermont Blue Vermont BCBSVT Blue BCBSVT Blue BCBSVT Blue BCBSVT Blue
13627VT0370004 13627VT0370003 13627VT0380001 13627VT0380002 13627VT0380004 13627VT0380003 13627VT0380005 13627VT0380006 13627VT0380008 13627VT0380007 13627VT0390001 13627VT0390002 13627VT0390004 13627VT0390003
Silver Bronze Gold Silver Silver Bronze Gold Silver Silver Bronze Gold Silver Silver Bronze
0.718 0.650 0.770 0.693 0.693 0.627 0.789 0.696 0.696 0.648 0.819 0.719 0.718 0.650
Renewing Renewing Terminated Terminated Terminated Terminated New New New New Renewing Renewing Renewing Renewing
EPO EPO EPO EPO EPO EPO EPO EPO EPO EPO EPO EPO EPO EPO
No Yes Yes Yes No Yes Yes Yes No Yes Yes Yes No Yes
1/1/2021 1/1/2021 1/1/2021 1/1/2021 1/1/2021 1/1/2021 1/1/2021 1/1/2021 1/1/2021 1/1/2021 1/1/2021 1/1/2021 1/1/2021 1/1/2021
5.26% 4.22% 0.00% 0.00% 0.00% 0.00% 0.00% 0.00% 0.00% 0.00% 13.27% 6.01% 5.26% 4.22%
13627VT0370004 13627VT0370003 13627VT0380001 13627VT0380002 13627VT0380004 13627VT0380003 13627VT0380005 13627VT0380006 13627VT0380008 13627VT0380007 13627VT0390001 13627VT0390002 13627VT0390004 13627VT0390003
$778,800 $5,642,394 $5,045,705 $9,821,211 $907,355 $1,149,659 $0 $0 $0 $0 $18,542,886 $1,630,244 $1,099,053 $4,047,010
$0 $0 $0 $0 $0 $0 $0 $0 $0 $0 $0 $0 $0 $0
$237,400 $1,677,930 $753,591 $1,167,454 $317,496 $373,733 $0 $0 $0 $0 $2,437,110 $185,106 $336,937 $1,226,531
$0 $0 $0 $0 $0 $0 $0 $0 $0 $0 $0 $0 $0 $0
$541,399 $3,964,464 $4,292,113 $8,653,757 $589,859 $775,925 $0 $0 $0 $0 $16,105,776 $1,445,138 $762,116 $2,820,480
-$248,728 -$509,697 $599,809 -$333,661 -$440,784 -$716,932 $0 $0 $0 $0 $4,140,102 $271,357 -$169,173 -$1,472,269
$977,325 $4,624,667 $3,684,758 $11,589,127 $1,501,377 $1,653,827 $0 $0 $0 $0 $9,711,642 $1,064,352 $1,236,366 $5,228,489
2,012 10,456 5,724 16,662 2,913 3,382 0 0 0 0 16,730 1,572 2,425 10,770
445 1,069 635 1,299 225 346 0 0 0 0 1,389 212 216 1,029
$563.78 $488.18 $625.40 $618.55 $543.38 $488.04 $0.00 $0.00 $0.00 $0.00 $621.50 $629.54 $563.78 $488.18
74.31% 96.34% 100.18% 76.88% 55.62% 82.82% #DIV/0! #DIV/0! #DIV/0! #DIV/0! 116.27% 108.19% 71.41% 75.09%
$387.08 $539.63 $881.50 $589.44 $311.48 $339.93 #DIV/0! #DIV/0! #DIV/0! #DIV/0! $1,108.36 $1,037.05 $453.22 $375.77
$0.00 $0.00 $0.00 $0.00 $0.00 $0.00 #DIV/0! #DIV/0! #DIV/0! #DIV/0! $0.00 $0.00 $0.00 $0.00
$117.99 $160.48 $131.65 $70.07 $108.99 $110.51 #DIV/0! #DIV/0! #DIV/0! #DIV/0! $145.67 $117.75 $138.94 $113.88
$0.00 $0.00 $0.00 $0.00 $0.00 $0.00 #DIV/0! #DIV/0! #DIV/0! #DIV/0! $0.00 $0.00 $0.00 $0.00
$269.09 $379.16 $749.85 $519.37 $202.49 $229.43 #DIV/0! #DIV/0! #DIV/0! #DIV/0! $962.69 $919.30 $314.27 $261.88
-$123.62 -$48.75 $104.79 -$20.03 -$151.32 -$211.98 #DIV/0! #DIV/0! #DIV/0! #DIV/0! $247.47 $172.62 -$69.76 -$136.70
$485.75 $442.30 $643.74 $695.54 $515.41 $489.01 #DIV/0! #DIV/0! #DIV/0! #DIV/0! $580.49 $677.07 $509.84 $485.47
13627VT0370004 13627VT0370003 13627VT0380001 13627VT0380002 13627VT0380004 13627VT0380003 13627VT0380005 13627VT0380006 13627VT0380008 13627VT0380007 13627VT0390001 13627VT0390002 13627VT0390004 13627VT0390003
0.8144 0.7066 0.0000 0.0000 0.0000 0.0000 0.9022 0.8927 0.7853 0.7064 0.8967 0.9081 0.8144 0.7066
1.0000 1.0000 0.0000 0.0000 0.0000 0.0000 1.0000 1.0000 1.0000 1.0000 1.0000 1.0000 1.0000 1.0000
1.0002 1.0002 0.0000 0.0000 0.0000 0.0000 1.0002 1.0002 1.0002 1.0002 1.0001 1.0002 1.0002 1.0002
8.04% 9.27% 0.00% 0.00% 0.00% 0.00% 7.25% 7.30% 8.29% 9.22% 7.33% 7.21% 8.04% 9.27%
3.58% 3.64% 0.00% 0.00% 0.00% 0.00% 3.54% 3.54% 3.59% 3.64% 3.54% 3.53% 3.58% 3.64%
1.60% 1.60% 0.00% 0.00% 0.00% 0.00% 1.60% 1.60% 1.60% 1.60% 1.60% 1.60% 1.60% 1.60%
1.0000 1.0000 0.0000 0.0000 0.0000 0.0000 1.0000 1.0000 1.0000 1.0000 1.0000 1.0000 1.0000 1.0000
$669.15 $589.33 $0.00 $0.00 $0.00 $0.00 $734.26 $726.95 $647.18 $588.82 $730.38 $738.64 $669.15 $589.33
$669.15 $589.33 $0.00 $0.00 $0.00 $0.00 $734.26 $726.95 $647.18 $588.82 $730.38 $738.64 $669.15 $589.33
13627VT0370004 13627VT0370003 13627VT0380001 13627VT0380002 13627VT0380004 13627VT0380003 13627VT0380005 13627VT0380006 13627VT0380008 13627VT0380007 13627VT0390001 13627VT0390002 13627VT0390004 13627VT0390003
$3,808,042 $9,147,859 $0 $0 $0 $0 $5,433,948 $11,116,060 $1,925,415 $2,960,860 $11,886,226 $1,814,168 $1,848,398 $8,805,563
$0 $0 $0 $0 $0 $0 $0 $0 $0 $0 $0 $0 $0 $0
$97,832 $233,966 $0 $0 $0 $0 $0 $285,366 $49,428 $75,750 $306,907 $46,610 $47,487 $225,211
$0 $0 $0 $0 $0 $0 $0 $0 $0 $0 $0 $0 $0 $0
$3,710,210 $8,913,893 $0 $0 $0 $0 $5,433,948 $10,830,694 $1,875,986 $2,885,110 $11,579,319 $1,767,558 $1,800,911 $8,580,352
-$735,705 -$642,329 $0 $0 $0 $0 $1,037,847 -$464,873 -$458,590 -$1,009,184 $5,081,468 $547,769 -$190,055 -$1,898,962
$3,174,587 $6,538,044 $0 $0 $0 $0 $5,102,085 $10,356,479 $1,563,533 $2,137,068 $11,754,474 $1,700,863 $1,540,923 $6,293,403
5,340 12,828 0 0 0 0 7,620 15,588 2,700 4,152 16,668 2,544 2,592 12,348
152.13% 151.19% #DIV/0! #DIV/0! #DIV/0! #DIV/0! 88.50% 109.49% 169.78% 255.80% 68.78% 78.61% 133.32% 195.25%
$713.12 $713.12 #DIV/0! #DIV/0! #DIV/0! #DIV/0! $713.12 $713.12 $713.12 $713.12 $713.12 $713.12 $713.12 $713.12
$0.00 $0.00 #DIV/0! #DIV/0! #DIV/0! #DIV/0! $0.00 $0.00 $0.00 $0.00 $0.00 $0.00 $0.00 $0.00
$18.32 $18.24 #DIV/0! #DIV/0! #DIV/0! #DIV/0! $0.00 $18.31 $18.31 $18.24 $18.41 $18.32 $18.32 $18.24
$0.00 $0.00 #DIV/0! #DIV/0! #DIV/0! #DIV/0! $0.00 $0.00 $0.00 $0.00 $0.00 $0.00 $0.00 $0.00
$694.80 $694.88 #DIV/0! #DIV/0! #DIV/0! #DIV/0! $713.12 $694.81 $694.81 $694.87 $694.70 $694.79 $694.80 $694.88
-$137.77 -$50.07 #DIV/0! #DIV/0! #DIV/0! #DIV/0! $136.20 -$29.82 -$169.85 -$243.06 $304.86 $215.32 -$73.32 -$153.79
$594.49 $509.67 #DIV/0! #DIV/0! #DIV/0! #DIV/0! $669.57 $664.39 $579.09 $514.71 $705.21 $668.58 $594.49 $509.67
BCBSVT Vermont Select CDHP (Individual)
13627VT039
9.26%
BCBSVT EPO Vermont Preferred (Individual)
13627VT038
0.00%
BCBSVT EPO Vermont Select CDHP (Small Group)
13627VT037
11.04%

Rating Area Data Collection [assistive technology users, please reference cell A2 for instructions]Specify the total number of Rating Areas in your State by selecting the Create Rating Areas button or Ctrl + Shift + R.
Press TAB and directional arrow keys to read through the document. If macros are disabled, press and hold the ALT key and press the F, then I, and then N key. After that, select the Enable All Content option by pressing enter. (note that you can also press the C key to select "Enable All Content") Instructions can be found in cells C1 through C4. If screen reader fails to announce a cell after performing a dropdown selection, please press F2 and then ESC to force the screen reader to resume.Select only the Rating Areas you are offering plans within and add a factor for each area.
To validate, select the Validate button or Ctrl + Shift + I.
To finalize, select the Finalize button or Ctrl + Shift + F.
Rating Area Rating Factor
Rating Area 1 1.0000
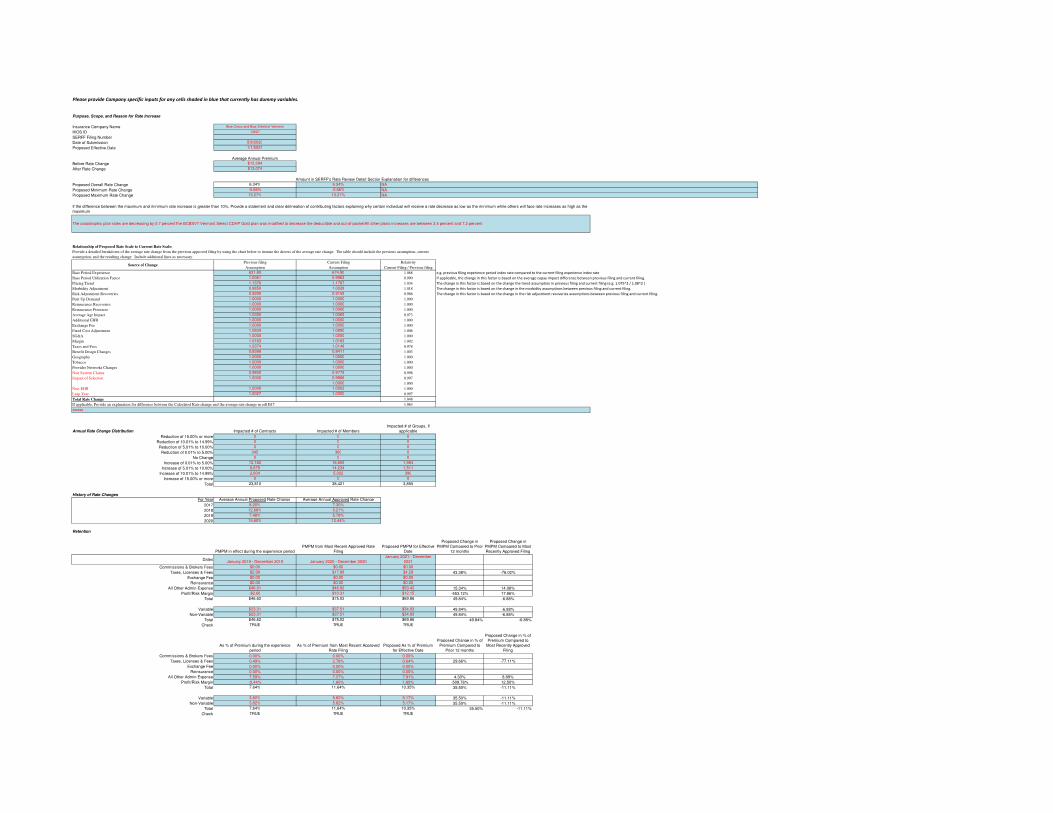
Please provide Company specific inputs for any cells shaded in blue that currently has dummy variables.
Purpose, Scope, and Reason for Rate Increase
Insurance Company Name Blue Cross and Blue Shield of Vermont
HIOS ID 13627
SERFF Filing Number
Date of Submission 5/8/2020
Proposed Effective Date 1/1/2021
Average Annual Premium
Before Rate Change $12,294
After Rate Change $13,074
Amount in SERFF's Rate Review Detail SectionExplanation for differences
Proposed Overall Rate Change 6.34% 6.34%
Proposed Minimum Rate Change -0.66% -0.66%
Proposed Maximum Rate Change 13.27% 13.27%
Relationship of Proposed Rate Scale to Current Rate Scale:
Previous filing Current Filing Relativity
Assumption Assumption Current Filing / Previous filing
Base Period Experience 631.80 674.90 1.068 e.g. previous filing experience period index rate compared to the current filing experience index rate
Base Period Utilization Factor 1.0061 0.9963 0.990 If applicable, the change in this factor is based on the average copay impact difference between previous filing and current filing.
Pricing Trend 1.1376 1.1767 1.034 The change in this factor is based on the change the trend assumption in previous filing and current filing (e.g. 1.075^2 / 1.08^2 )
Morbidity Adjustment 0.9850 1.0028 1.018 The change in this factor is based on the change in the morbidity assumptions between previous filing and current filing.
Risk Adjustment Recoveries 0.9290 0.9159 0.986 The change in this factor is based on the change in the risk adjustment recoveries assumptions between previous filing and current filing.
Pent Up Demand 1.0000 1.0000 1.000
Reinsurance Recoveries 1.0000 1.0000 1.000
Reinsurance Premium 1.0000 1.0000 1.000
Average Age Impact 1.0350 1.0069 0.973
Additional EHB 1.0000 1.0000 1.000
Exchange Fee 1.0000 1.0000 1.000
Fixed Cost Adjustment 1.0829 1.0890 1.006
SG&A 1.0000 1.0000 1.000
Margin 1.0163 1.0183 1.002
Taxes and Fees 1.0374 1.0148 0.978
Benefit Design Changes 0.8388 0.8411 1.003
Geography 1.0000 1.0000 1.000
Tobacco 1.0000 1.0000 1.000
Provider Networks Changes 1.0000 1.0000 1.000
Non System Claims 0.9800 0.9779 0.998
Impact of Selection 1.0000 0.9966 0.997
1.0000 1.000
Non-EHB 1.0000 1.0002 1.000
Leap Year 1.0027 1.0000 0.997
Total Rate Change 1.048
If applicable, Provide an explanation for difference between the Calculated Rate change and the average rate change in cell B17 1.063
Annual Rate Change Distribution Impacted # of Contracts Impacted # of Members
Impacted # of Groups, If
applicable
Reduction of 15.00% or more 0 0 0
Reduction of 10.01% to 14.99% 0 0 0
Reduction of 5.01% to 10.00% 0 0 0
Reduction of 0.01% to 5.00% 345 360 0
No Change 0 0 0
Increase of 0.01% to 5.00% 12,182 18,805 1,954
Increase of 5.01% to 10.00% 8,679 14,234 1,511
Increase of 10.01% to 14.99% 2,604 5,022 390
Increase of 15.00% or more 0 0 0
Total 23,810 38,421 3,855
History of Rate Changes
For Year Average Annual Proposed Rate Change Average Annual Approved Rate Change
2017 8.20% 7.30%
2018 12.68% 9.21%
2019 7.48% 5.78%
2020 15.60% 12.44%
Retention
PMPM in effect during the experience period
PMPM from Most Recent Approved Rate
Filing
Proposed PMPM for Effective
Date
Proposed Change in
PMPM Compared to Prior
12 months
Proposed Change in
PMPM Compared to Most
Recently Approved Filing
DatesJanuary 2019 - December 2019 January 2020 - December 2020
January 2021 - December
2021
Commissions & Brokers Fees $0.00 $0.00 $0.00
Taxes, Licenses & Fees $2.99 $17.88 $4.29 43.38% -76.02%
Exchange Fee $0.00 $0.00 $0.00
Reinsurance $0.00 $0.00 $0.00
All Other Admin Expense $46.31 $46.82 $53.42 15.34% 14.08%
Profit/Risk Margin -$2.68 $10.31 $12.15 -553.12% 17.86%
Total $46.62 $75.02 $69.86 49.84% -6.88%
Variable $23.31 $37.51 $34.93 49.84% -6.88%
Non-Variable $23.31 $37.51 $34.93 49.84% -6.88%
Total $46.62 $75.02 $69.86 49.84% -6.88%
Check TRUE TRUE TRUE
As % of Premium during the experience
period
As % of Premium from Most Recent Approved
Rate Filing
Proposed As % of Premium
for Effective Date
Proposed Change in % of
Premium Compared to
Prior 12 months
Proposed Change in % of
Premium Compared to
Most Recently Approved
Filing
Commissions & Brokers Fees 0.00% 0.00% 0.00%
Taxes, Licenses & Fees 0.49% 2.78% 0.64% 29.66% -77.11%
Exchange Fee 0.00% 0.00% 0.00%
Reinsurance 0.00% 0.00% 0.00%
All Other Admin Expense 7.59% 7.27% 7.91% 4.30% 8.89%
Profit/Risk Margin -0.44% 1.60% 1.80% -509.76% 12.50%
Total 7.64% 11.64% 10.35% 35.50% -11.11%
Variable 3.82% 5.82% 5.17% 35.50% -11.11%
Non-Variable 3.82% 5.82% 5.17% 35.50% -11.11%
Total 7.64% 11.64% 10.35% 35.50% -11.11%
Check TRUE TRUE TRUE
NA
NA
NA
If the difference between the maximum and minimum rate increase is greater than 10%, Provide a statement and clear delineation of contributing factors explaining why certain individual will receive a rate decrease as low as the minimum while others will face rate increases as high as the
maximum
The catastrophic plan rates are decreasing by 0.7 percentThe BCBSVT Vermont Select CDHP Gold plan was modified to decrease the deductible and out-of-pocketAll other plans increases are between 3.4 percent and 7.2 percent
Source of Change
xxxxxx
Provide a detailed breakdown of the average rate change from the previous approved filing by using the chart below to itemize the drivers of the average rate change. The table should include the previous assumption, current
assumption, and the resulting change. Include additional lines as necessary.

Trend & Projection Assumptions
Historical Experience (ACA Only): Incurred or Allowed Basis?(1)
: Allowed (1) Choose the option based on how pricing is developed (i.e., if allowed trends are used in projections, select "Allowed").
Monthly Trend Analysis Based on Experience Data Time Period Month Member Months
Monthly Allowed Claims $
PMPM* Rolling 12 Mo Trend
Annualized Rolling 6 Mo
Trend Annualized Rolling 3 Mo Trend Average Benefit Factor Average Age/Gender Factor Other Factor
Normalized Monthly
Allowed Claims $
PMPM* Normalized Rolling 12 Mo Trend
Normalized Annualized
Rolling 6 Mo Trend
Normalized
Annualized
Rolling 3 Mo
Trend
used for Rate Development (ACA Only) Jan-2017 69,548 $554.31 1.00 1.00 1.00 $554.31
Feb-2017 69,864 $507.75 1.00 1.00 1.00 $507.75
Mar-2017 69,644 $572.98 1.00 1.00 1.00 $572.98
Apr-2017 69,290 $499.09 1.00 1.00 1.00 $499.09
May-2017 68,905 $576.61 1.00 1.00 1.00 $576.61
Jun-2017 68,585 $557.68 -0.45% 1.00 1.00 1.00 $557.68 -0.45%
Jul-2017 68,254 $540.66 26.38% 1.00 1.00 1.00 $540.66 26.38%
Aug-2017 67,928 $566.18 3.90% 1.00 1.00 1.00 $566.18 3.90%
Sep-2017 67,537 $553.51 6.83% 1.00 1.00 1.00 $553.51 6.83%
Oct-2017 67,173 $626.32 17.94% 1.00 1.00 1.00 $626.32 17.94%
Nov-2017 66,847 $591.27 28.13% 1.00 1.00 1.00 $591.27 28.13%
Dec-2017 66,185 $589.10 12.48% 40.30% 1.00 1.00 1.00 $589.10 12.48% 40.30%
Jan-2018 54,765 $609.50 17.76% 9.92% 1.00 1.00 1.00 $609.50 17.76% 9.92%
Feb-2018 53,939 $603.62 16.03% 6.71% 1.00 1.00 1.00 $603.62 16.03% 6.71%
Mar-2018 53,402 $636.09 22.94% 9.62% 1.00 1.00 1.00 $636.09 22.94% 9.62%
Apr-2018 53,011 $636.83 14.30% 21.40% 1.00 1.00 1.00 $636.83 14.30% 21.40%
May-2018 52,810 $647.63 16.98% 29.62% 1.00 1.00 1.00 $647.63 16.98% 29.62%
Jun-2018 52,571 $614.22 16.88% 11.23% 1.00 1.00 1.00 $614.22 16.88% 11.23%
Jul-2018 52,346 $613.19 12.84% -0.23% 1.00 1.00 1.00 $613.19 12.84% -0.23%
Aug-2018 51,955 $627.35 11.93% -13.02% 1.00 1.00 1.00 $627.35 11.93% -13.02%
Sep-2018 51,658 $598.24 4.80% -12.04% 1.00 1.00 1.00 $598.24 4.80% -12.04%
Oct-2018 51,481 $704.45 8.24% 12.15% 1.00 1.00 1.00 $704.45 8.24% 12.15%
Nov-2018 51,200 $634.75 4.17% 19.06% 1.00 1.00 1.00 $634.75 4.17% 19.06%
Dec-2018 50,817 $650.52 12.51% 4.35% 37.17% 1.00 1.00 1.00 $650.52 12.51% 4.35% 37.17%
Jan-2019 44,279 $709.68 13.07% 9.01% 12.80% 1.00 1.00 1.00 $709.68 13.07% 9.01% 12.80%
Feb-2019 44,045 $622.84 11.89% 7.62% 9.49% 1.00 1.00 1.00 $622.84 11.89% 7.62% 9.49%
Mar-2019 43,805 $701.68 11.89% 15.71% 9.19% 1.00 1.00 1.00 $701.68 11.89% 15.71% 9.19%
Apr-2019 43,578 $654.09 9.98% 8.77% -2.05% 1.00 1.00 1.00 $654.09 9.98% 8.77% -2.05%
May-2019 43,488 $736.55 10.11% 15.28% 24.24% 1.00 1.00 1.00 $736.55 10.11% 15.28% 24.24%
Jun-2019 43,359 $671.83 10.05% 14.54% 5.66% 1.00 1.00 1.00 $671.83 10.05% 14.54% 5.66%
Jul-2019 43,366 $680.77 9.82% 7.83% 24.36% 1.00 1.00 1.00 $680.77 9.82% 7.83% 24.36%
Aug-2019 43,229 $636.73 9.05% 8.62% -18.26% 1.00 1.00 1.00 $636.73 9.05% 8.62% -18.26%
Sep-2019 43,083 $635.12 8.85% -0.27% -19.64% 1.00 1.00 1.00 $635.12 8.85% -0.27% -19.64%
Oct-2019 42,949 $744.43 8.25% 7.06% -13.32% 1.00 1.00 1.00 $744.43 8.25% 7.06% -13.32%
Nov-2019 42,863 $625.54 7.51% -3.71% 3.19% 1.00 1.00 1.00 $625.54 7.51% -3.71% 3.19%
Last Month in Experience Period Dec-2019 42,537 $654.80 6.62% -5.73% 15.65% 1.00 1.00 1.00 $654.80 6.62% -5.73% 15.65%
If applicable, please provide an explanation for the Other normalization factor.
The Department is requesting each carrier provide additional trend exhibits, in excel with working formulas, that are similar to the aggregate information provided above. These exhibits should provide the data by Service Category, Metal Tier, etc. that are used by the Company in the trend development. Please state where in the filing it is located.
Solvency
Most Recent Quarterly Financial Statement
Most Recent Annual
Financial Statement
Total Adjusted Capital N/A N/A
Authorized Control Level N/A N/A
RBC Ratio
Loss Ratio
Time Period Period Beginning Date Period Ending Date Member Months Incurred Claims
Earned
Premium
Loss
Ratio
Expected
Incurred Claims
A-to-E
Claims Ratio
Quality
Improvement
Expenses
Adjustments
to Earned Premium
Adj Medical
Loss Ratio
Historical Year -4 1/1/2015 12/31/2015 768,293 294,107,084 330,568,002 89.0% 272,117,666 108.1% 2,113,072 7,798,968 91.8%
Historical Year -3 1/1/2016 12/31/2016 835,541 358,202,866 377,634,175 94.9% 346,524,246 103.4% 2,327,933 7,903,488 97.5%
Historical Year -2 1/1/2017 12/31/2017 820,156 373,101,581 403,294,396 92.5% 413,852,352 90.2% 1,657,256 0 92.9%
Historical Year -1 1/1/2018 12/31/2018 630,163 325,109,232 349,374,495 93.1% 404,372,570 80.4% 2,197,720 9,217,440 96.2%
Historical Year 0 1/1/2019 12/31/2019 520,854 293,513,224 322,747,284 90.9% 332,067,479 88.4% 1,221,877 1,557,213 91.8%
Historical Totals 3,575,007 1,644,033,987 1,783,618,352 92.2% 1,768,934,313 92.9% 9,517,857 26,477,109 94.1%
Interim Time Period 1/1/2020 3/31/2020 117,316 59,831,891 80,439,412 74.4% 65,549,418 91.3% 0 0 74.4%
Future Year 1 1/1/2021 12/31/2021 461,052 278,885,020 309,294,501 90.2% 278,885,020 100.0% 1,454,766 1,977,439 91.2%
Anticipated Pricing Loss Ratio (no adjustments) 89%
Anticipated LR using Federally-prescribed MLR methodology 90%
Note:
The historical time periods should represent calendar years since the inception date of the plan type through the most recent date available allowing for the appropriate amount of run-out.
The interim time period the time periods available in the current year.
The future year should represent the 12 months immediately following the rate effective date.
Consumer Adjusted Premium Rate Development
Section III of WS2 of the 2021 URRT requires that the Issuer provide the Actuarial Value and cost-sharing design of the plan. The Department requires that the issuer provide the breakdown of this value between Cost Sharing Only and Induced Utilization for every plan in the URRT.
Please see the example below.
Actuarial value and cost-sharing design of the plan
Actuarial value and cost-sharing design of the plan (From the URRT) 0.840
Paid/Allowed Ratio (Cost-Sharing only) 0.756
Used Induced utilization factors 1.000
Calculated 0.756
In the text box, please state where in the filing it is located.
Risk Adjustment
Actual Risk Adjustment Received
Assumed in Most Recent Approved Rate
Filing
Assumed in Current Rate
Filing
Proposed Change in
PMPM Compared to Prior
12 months
Proposed Change in
PMPM Compared to Most
Recently Approved Filing
Time Period 1/1/2018 - 12/31/2018 1/1/2020 - 12/31/2020 1/1/2021 - 12/31/2021
Total Risk adjustment (Dollar amount) $15,928,707 $22,653,258 $23,590,665
Membership Member Months 630,163 552,144 461,052 -26.84% -16.50%
PMPM $25.28 $41.03 $51.17 102.42% 24.71%
Premium $349,374,495 $339,717,375 $311,284,496 -10.90% -8.37%
As a % of Premium 5% 7% 8% 66.22% 13.65%
If the actual risk adjustment payable/receivable was more than 20% different than what was estimated in the previous filing, please provide details on how the current risk adjustment estimate has addressed prior results.
xxxxxx
xxxxxx
xxxxxx
See Exhibit 6A for detail by plan

ATLANTA • DENVER • MINNEAPOLIS • NEW YORK • PHOENIX • TAMPA • WAKELY.COM
March 10, 2020 Mr. Dana Houlihan Director, Plan Management & Enrollment Policy VT Health Connect Department of Vermont Health Access Via Email Only
RE: STATE OF VERMONT ACTUARIAL VALUE CERTIFICATION FOR 2021 STANDARD PLAN DESIGNS
Dear Dana:
The Affordable Care Act (ACA) requires that health care coverage provided by issuers to non-grandfathered individual and small groups must cover all Essential Health Benefits (EHBs) and have plan designs that have Actuarial Values (AVs) that fall under the Platinum (90% AV), Gold (80% AV), Silver (70% AV), or Bronze (60% AV) tiers.
The State of Vermont (State) is standardizing several plan designs that all issuers offering plans in the Exchange, Vermont Health Connect, must offer. Issuers must offer the standard plan designs in the individual and small group merged market. In 2020, one Platinum, one Gold, two Silver, and three Bronze standard plan designs were developed for Vermont Health Connect. There is a traditional deductible plan at each of the Platinum, Gold, and Silver metal levels, with two at the Bronze level, and a High Deductible Health Plan (HDHP) at each of the Silver and Bronze levels. The 2020 standard plan designs are all continuing in 2021.
For each of the Silver standard plan designs, the cost sharing reduction plan designs are also standard. Cost sharing reduction (CSR) plan designs were developed at each of the 73% (Federal), 77% (Vermont specific), 87% (Federal), and 94% (Federal) AV levels.
The State contracted with Wakely Consulting Group, LLC (Wakely) to assist in the development of the 2021 standard plan designs and to provide an actuarial certification of the actuarial values of the state’s standard plan designs that do not fit within the parameters of the Federal calculator and require adjustment. This memo documents the approved 2021 standard plan designs as well as the process for developing the corresponding actuarial values. The actuarial certification is provided in Appendix A. The 2021 Notice of Benefit and Payment Parameters (NBPP) is still in draft form. Should there be changes between the draft and final versions, the plan designs reflected here may require changes.
A list of the changes from the 2020 standard plan designs is in Appendix B. At a high level the changes for each base standard plan are:

page 2
Actuarial Value Certification for 2021 Standard Plan Designs State of Vermont
1. Platinum – The medical deductible and medical Maximum Out of Pocket (MOOP) were increased.
2. Gold – The medical deductible, medical Maximum Out of Pocket (MOOP), pharmacy MOOP, generic pharmacy copay, and preferred brand pharmacy copay were all increased.
3. Silver Deductible – The combined medical/pharmacy MOOP and separate pharmacy MOOP were increased. Chiropractic services copays and physical therapy copays were decreased.
4. Bronze Deductible with Pharmacy Limit – The medical deductible, combined medical/pharmacy MOOP, and separate pharmacy MOOP were all increased. The generic pharmacy, chiropractic services, and physical therapy copays were all decreased. The deductible was also waived for generic scripts.
5. Bronze Deductible without Pharmacy Limit – The medical deductible, combined medical/pharmacy MOOP, and generic pharmacy copays were increased.
6. Silver HDHP – The medical deductible, medical MOOP, and the embedded individual combined medical/pharmacy MOOP were increased.
7. Bronze HDHP – The medical MOOP and the embedded individual combined medical/pharmacy MOOP were increased.
In addition to the standard plans, starting in 2016 the State of Vermont requests that issuers offer a Gold plan where the deductible and MOOP are set at the same amount. This means that once the deductible is met, the plan pays 100% of all services. Unlike the standard plans, it is not required that issuers offer this plan, but it is highly recommended. The issuer may determine the amount at which to set the deductible and MOOP, as long as they are equal and the resulting plan falls in the Gold tier. Since the amounts are to be determined by the issuers, these plans are not included within this memo.
Regulatory Background
The ACA allows for a -4% to +2% de minimis range around the target AVs for each metal level. For example, any plan design that has an AV from 66% to 72% is considered a Silver plan. Bronze plan designs meeting certain criteria are eligible for an expanded range of +5% on the higher end, allowing an AV up to 65% compared to a high end at 62%. Applicable plans include High Deductible Health Plans and plans that cover at least one major service, other than preventive, prior to the deductible. Of the Vermont standard plan designs, all three Bronze plans qualify for the expanded range. This is a change for 2021. In 2020 and prior, the Bronze Deductible plan with Pharmacy Limit did not qualify.
page 3
Actuarial Value Certification for 2021 Standard Plan Designs State of Vermont
The Center for Consumer Information and Insurance Oversight (CCIIO) has released the final 2021 Actuarial Value Calculator (AVC)1 that issuers must use to determine the AV of a plan. The final AVC has not yet been released. While CCIIO anticipates that most plans will be able to use the AVC without modification, some plan designs have features which are not supported by the AVC. In these instances, an actuary can either modify the inputs to most closely represent the plan design or an actuary can modify the results of the AVC to account for the features not supported by the AVC. An actuarial certification documenting the development of the AV for these designs is required.
The federal HDHP minimum deductible and MOOP limits are not yet released for 2021. The 2020 minimum deductible and MOOP were $1,400 and $6,900, respectively. Historically, the deductible has increased $50 every two to three years and the MOOP increases around $100 a year, on average. Should the federal HDHP minimum deductible for 2021 increase from $1,400, both the Silver and Bronze HDHPs and associated CSR plan designs will require changes to meet this requirement.
Additionally, the 2021 Notice of Benefits and Payment Parameters (NBPP)2 is still in draft form. Based on the draft regulations, the single annual limit, or MOOP, is expected to be $8,550, up from $8,150 in 2020. Should the single annual limit not be finalized as proposed and the regulations finalize a limit below $8,550, both the Silver and Bronze HDHPs shown in this report will require changes in order to meet this requirement. Additionally, if the final limit is finalized below $8,400 both Bronze Deductible Plans (with and without drug limit) will also require changes in order to meet this requirement.
CSR Loading
As of 2020, Act No. 88 (Bill S.19) requires the premiums of the Silver on-Exchange plans to reflect the cost of funding for CSR subsidies, following the announcement that federal funding would cease. This resulted in a “CSR load” to these plans such that the Silver premiums are higher than they would have been without the CSR load. For individuals who are not eligible for premium subsidies (and are therefore not protected from the CSR load), issuers offer “reflective” off-Exchange Silver plans whose premiums have not been increased for the CSR load and have only a minor difference in plan design compared to their on-Exchange counterparts. These plans will continue in 2021.
1 http://www.cms.gov/CCIIO/Resources/Regulations-and-guidance/index.html
2 https://www.federalregister.gov/documents/2020/01/24/2020-00077/patient-protection-and-affordable-care-act-hhs-notice-of-benefit-and-payment-parameters-for-2021

page 4
Actuarial Value Certification for 2021 Standard Plan Designs State of Vermont
The off-Exchange “reflective” plans will have a $5 copay or 5% coinsurance increase on ambulance services compared to the on-Exchange plans. These differentials apply to both standard and non-standard Silver plans. A comparison of the standard Silver on and off-Exchange plan designs are shown in Appendix C. As ambulance services are not explicitly included in the AVC and the differences in cost sharing are minimal, there is no difference in the calculation of the federal AV for these plans. Unless otherwise noted, in the Appendices the cost sharing for ambulance services represents the on-Exchange plan design.
In the event there is a Silver plan approved with 100% coinsurance, the off-Exchange “reflective” plan will have a $25 deductible and MOOP increase compared to the on-Exchange plan. Unlike the ambulance cost sharing above, this difference will impact the AV. The issuer submitting such a plan will need to ensure that both the on and off-Exchange plan designs fit within the AV requirements. Since this is for non-standard plans only, these plans are not included within this memo.
Chiropractic and Physical Therapy Copays
Act No. 7 (Bill S.1), relating to copayment limits for chiropractic care and physical therapy, was signed into law June 25, 2018. Act No. 7 requires that the copay for chiropractic and physical therapy services for Silver and Bronze metal level plans be between 125%-150% of the copay applicable to services provided by a primary care provider (PCP) in 2020. For 2021, S.202 was introduced which would require the copay for chiropractic services for Silver and Bronze metal level plans to be less than or equal to 125% of the PCP copay. The plan designs shown here have been updated assuming that S.202 is passed as introduced and sets the chiropractic and physical therapy copays equal to 125% of the PCP copay, rounded down to the nearest $5 increment. This change impacts only the Silver and Bronze metal level plans with a copay. Plans with coinsurance are not impacted.
The Federal actuarial value calculator does not account for all service categories and chiropractic services is one of those that is not explicitly included in the calculator. As noted in the “Actuarial Value Considerations” section below, CCIIO has stated and regulations dictate that modifications should be made only for substantial differences. We have not previously made adjustments to the results of the AVC to reflect chiropractic services cost sharing and do not feel that this regulation would warrant a change to that methodology. Therefore, no adjustments have been made to the actuarial value calculations and certification included in this memo for chiropractic services.
S.202 does not specifically require changes to the physical therapy copays. Based on issuer feedback, it is preferable to continue to set physical therapy and chiropractic copays equal to each other. The AVC does account for physical therapy services. The changes to the copays for chiropractic and physical therapy services are reflected in the 2021 standard plan designs.

page 5
Actuarial Value Certification for 2021 Standard Plan Designs State of Vermont
Actuarial Value Considerations
A summary of Vermont’s standard plan designs is in Appendix E. Four of the standard plan designs (and the cost sharing reduction plan designs) have features not supported by the AVC and thus an actuarial certification is required. The remaining standard plan designs have features that may warrant an AV adjustment but no explicit adjustment or actuarial certification has been done for these plans. In developing these standard plan designs and the resulting actuarial certification, Wakely also followed applicable Actuarial Standards of Practice (ASOP) as detailed in Appendix D and including:
• ASOP No. 23 Data Quality;
• ASOP No. 25 Credibility Procedures;
• ASOP No. 41 Actuarial Communications; and
• ASOP No. 50 Determining Minimum Value and Actuarial Value under the Affordable Care Act.
Both Silver plans and two of the three Bronze plans have design features that are both significant and not supported by the AVC. The Silver cost sharing reduction plan designs have similar features. While most plans have some subtleties in their design that are not supported by the AVC, CCIIO has stated and regulations dictate that modifications should be made only for substantial differences. The three potential substantial differences that Wakely considered include:
1. Family deductible and MOOPs. There are two common types of applications for deductibles and MOOPs, commonly referred to in Vermont as stacked and aggregate3. The data supporting the AVC is only at the member level, and thus most closely resembles the stacked application of deductibles and MOOPs although the family stacked AV will be higher in most instances. Most HDHP plans use the aggregate application of deductible
3 Stacked deductibles and MOOPs are typical in traditional deductible plans where the individual deductible and MOOP apply to each member of a contract and the family deductible and MOOP is used as a protection for contracts where multiple members have claims. For example, if the family MOOP is two times the individual MOOP but three members of a contract all would have reached their individual MOOP, it limits the family’s liability to two times the individual MOOP.
Aggregate deductible and MOOPs are typical in HDHPs where all claims for all members of a non-single contract accumulate to the family deductible and MOOP. For two person or family contracts where only one member has significant claims, the member still must reach the higher deductible and MOOP amounts which makes the average member liability higher under an aggregate deductible.

page 6
Actuarial Value Certification for 2021 Standard Plan Designs State of Vermont
and MOOPs which can significantly lower the AV since a family of two would need to accumulate to a deductible that is twice that of a single contract. Note that if the family MOOP is more than the proposed single limit of $8,550, the MOOP must either be stacked or there must be an embedded individual MOOP of $8,550. Wakely developed a model to account for aggregate family deductibles and has modified this model to account for stacked and embedded MOOPs for HDHPs. Thus, a specific adjustment has been made to the appropriate AVs for HDHPs.
2. Vermont implemented a statute (H.559 Sec. 32. 8 V.S.A. § 4089) for prescription drug deductibles and MOOPs. The requirement mandates, in part, that the MOOP for prescription drug costs in any plan design shall not exceed the minimum deductible amount for HDHPs per Section 223(c)(2)(A)(i) of the Internal Revenue Code of 1986 ($1,400 and $2,800 for individual and family coverage in 2020, 2021 amounts are not yet known). The requirement also states that for HDHPs the cost sharing benefit for prescription drugs must start after the minimum deductible amount for HDHPs (same $1,400 and $2,800 for individual and family coverage in 2020) is met, but the amount may be met with either medical or prescription drug claims. This means that for all HDHPs, for purposes of prescription drug coverage, the deductible is considered met when accumulated medical and drug claims reach $1,400 for individual or $2,800 for family, regardless of what the medical deductible amount is. Similarly, the MOOP for only drug claims (including amounts used to accumulate to the deductible) is $1,400 or $2,800, regardless of the amount of the overall MOOP which will include both drug and medical claims.
Since for an integrated deductible and MOOP, only one amount is able to be input in the AVC, the value of the lower drug deductible and MOOP cannot be modeled in the AVC. This statute has a significant impact on AV, particularly at the lower AV tiers where the difference between the medical and prescription drug deductible and MOOP is greater. Wakely has developed a model to account for Vermont’s prescription drug regulation and thus, where appropriate, a specific adjustment has been made to the AVs using this model.
3. In the current market, most Vermont HDHPs waive the deductible for preventive prescription drugs. This is another plan feature not currently supported by the AVC. Wakely has not analyzed the exact portion of drugs this represents and this may vary by issuer. The impact to AV would only apply to drug costs that would normally be incurred prior to the member reaching the deductible. Any costs after the deductible is met and after the MOOP is met would be similar to the AVC. It is possible that this design feature could have a significant impact on the AV. Based on some high level estimates, Wakely believes the impact to AV for this design feature is likely around 0.5%. Since Wakely did not quantify the exact adjustment of the preventive drug difference for HDHPs, Wakely did not make a specific adjustment but did make sure that any AVs developed for HDHPs were at least 0.5% below the high end of the de minimis range in order to account for this

page 7
Actuarial Value Certification for 2021 Standard Plan Designs State of Vermont
increased benefit. It is expected that the impact for these drugs would be highest for the Bronze plan where the deductible is highest and the impact would decrease as deductibles decrease (and AVs increase). Given the issuers now have credible data on the portion of claims that are preventive prescription drugs, it is recommended that the appropriateness of this adjustment is analyzed for the 2022 plan designs.
There are other potential design features for which adjustments could be made. However, given the expectation that adjustments be made for only the most substantive deviations, Wakely does not believe additional adjustments are warranted. It is also important to note that the bucketing of claims and the methodology used to calculate the AVC are not always clearly defined. Thus, at times it is difficult to ascertain whether an adjustment is warranted and how that adjustment would be estimated.
As stated, Wakely made explicit adjustments to account for the stacked and aggregate family deductible/MOOP and Vermont’s prescription drug regulation. These adjustments are described in detail in the Methodology section. For the preventive prescription drug benefits, Wakely did not make an explicit adjustment but did allow cushion in the AV such that an increase of up to 0.5% would not result in the AV falling outside of the required range. The table below shows the acceptable range for each standard plan design after accounting for this cushion where an explicit adjustment was not made.

page 8
Actuarial Value Certification for 2021 Standard Plan Designs State of Vermont
Table 1: Adjusted Acceptable Federal Actuarial Values
Plan
Adjusted Acceptable
Range
Deductible Plans
Platinum 86.0%-92.0% Gold 76.0%-82.0% Silver 66.0%-72.0%
Bronze (with drug limit) 56.0%-65.0%4 Bronze (without drug limit) 56.0%-65.0%
HDHPs Silver - Embedded MOOP 66.0%-71.5% Bronze - Embedded MOOP 56.0%-64.5%
Cost Sharing Reduction Plan Designs - Deductible
Plans
250-300% FPL (73% AV) 72.0%-74.0% 200-250% FPL (77% AV) 76.0%-78.0% 150-200% FPL (87% AV) 86.0%-88.0% 133-150% FPL (94% AV) 93.0%-95.0%
Cost Sharing Reduction Plan Designs - HDHPs
250-300% FPL (73% AV) 72.0%-73.5% 200-250% FPL (77% AV) 76.0%-77.5% 150-200% FPL (87% AV) 86.0%-87.5% 133-150% FPL (94% AV) 93.0%-94.5%
The table in Appendix F shows all plan designs for which adjustments were made, the adjustments considered, the original AV from the AVC, and the final adjusted AV.
Methodology
Since several of the standard plan designs have features not supported by the AVC, Wakely developed a model to capture the impact of these features on the AV. It was anticipated that the AVC would not accommodate all of the Vermont plan design features.
If a plan has substantive differences from what the AVC allows, there are two allowed approaches defined in the federal regulations. The first allows the actuary to adjust the inputs of the plan design to “fit” it into the AVC. The second allows the actuary to put in as many of the design features as possible into the AVC and then adjust the resulting AV to account for the unique design features. Wakely determined the second approach was most appropriate for the Vermont
4 In 2020 and prior, the Bronze Deductible (with drug limit) plan was not eligible for the expanded de minimis range and would had an upper AV limit of 62.0%. Due to changes in the 2021 plan design, this plan now qualifies for the expanded range.

page 9
Actuarial Value Certification for 2021 Standard Plan Designs State of Vermont
plan design differences. Thus for the plan designs where adjustments were made, Wakely first input as much of the plan design as possible into the AVC and then modified the resulting AV to account for the unique features.
The following discusses the model that Wakely developed and the process used to adjust the actuarial values from the AVC.
Vermont-Specific Adjustment Model
Anticipating the need to quantify some of Vermont’s unique plan design features, Wakely developed a model that would account for both aggregate deductibles and MOOPs as well as quantify the impact of Vermont’s prescription drug regulation. This model is updated every few years to capture recent Vermont-specific data. The current model was updated for the 2020 plan designs and includes Vermont-specific ACA data incurred in 2017.
In developing the model, Wakely was provided with membership and medical and pharmacy claims data extracts from the Vermont Healthcare Claims Uniform Reporting and Evaluation System (VHCURES). Filters were then applied to the data to target the most appropriate population for the model and reduce the amount of records included. The data used included:
• Small group and individual ACA markets
• Allowed medical and prescription drug data that was incurred in 2017
• Products types HMO (non-Medicare risk), PPO, POS and EPO
• Excluded claims marked as denied, out-of-state, and duplicates
After all filters were applied, the remaining data included allowed claims and membership for approximately 825,000 member months.
The methodology developed for the model does not use the traditional approach of continuance tables. When determining the paid claims and resulting actuarial value of the plan designs where the prescription drug regulation is a factor, the order in which the claims occur is important. Continuance tables fail to recognize the impact of the order of the claims on actuarial values. Thus, the model re-prices the claims based on the inputs provided in the model rather than rely on continuance tables.
The model allows a user to enter the following:
• Medical and Prescription drug deductible amounts for both individual and family contracts. These amounts can differ but the model assumes the amounts are always integrated, or

page 10
Actuarial Value Certification for 2021 Standard Plan Designs State of Vermont
that both medical and drug claims will accumulate to both deductibles, even if different amounts.
• Medical and prescription drug maximum out of pocket amounts for both individual and family contracts. These amounts can differ and the model allows for different treatment of the MOOPs as noted below.
• Medical and prescription drug coinsurance amounts. If the plan design includes copays, an effective coinsurance needs to be input.
• The structure of the deductibles and MOOPs. As can be seen in the table below, the model can distinguish between aggregate and stacked deductibles and MOOPs. It also allows for different accumulations of claims to the medical and prescription drug MOOPs. There are six structural selections available in the model, described in the table below. Option 5 is most closely aligned to the federal AVC. Option 6 represents the design of the Vermont HDHPs.
Options Costs that Accumulate
Deductible / MOOP Type Deductible Maximum Out-of-Pocket (MOOP) Medical Rx
1 Medical & Rx Medical & Rx Rx Only Aggregate 2 Medical & Rx Medical & Rx Rx Only Stacked 3 Medical & Rx Medical Only Rx Only Aggregate 4 Medical & Rx Medical Only Rx Only Stacked 5 Medical & Rx Medical & Rx Medical & Rx Stacked
6 Medical & Rx Medical & Rx Rx Only
Aggregate Deductible /Aggregate MOOP with Embedded Ind MOOP (can also be used for
Stacked MOOP)
Adjusted AV Calculations
Using the federal AV calculator and the model as outlined above, the following methodology was used to develop the adjusted AV calculations for the HDHPs:
1. The plan designs were entered into the AVC ignoring the separate prescription drug deductible and MOOP thresholds. The resulting AV is the unadjusted value, which does not account for the prescription drug regulations or the aggregate family deductible and MOOP levels.
2. The model was used to determine the revised AV.

page 11
Actuarial Value Certification for 2021 Standard Plan Designs State of Vermont
a. The same plan design input into the AVC was input into the model. The model only allows for coinsurance. Since the HDHP designs include copays, an effective coinsurance was developed for each plan design. The effective coinsurance amounts were developed separately for medical and prescription drug services using the allowed weights and average cost per service from the federal AVC continuance tables for the relevant metal tier.
b. The model was normalized to the AVC for each plan design. This means the same plan design, ignoring the prescription drug thresholds and assuming a stacked family deductible and MOOP, was input into the model and the underlying data was adjusted to arrive at the same AV as the AVC. This was done to ensure the same starting AV in both models and to try to mirror the induced utilization in the AVC. The normalization factors were reviewed for reasonability and deemed reasonable given they are accounting for trend, regional differences in cost and utilization and induced utilization.
c. The plan design in the model was adjusted to lower the prescription drug deductible and MOOP inputs (if applicable) to the appropriate plan design amounts and also to adjust the prescription drug MOOP to only consider prescription drug claims (the medical MOOP amount continues to use both medical and prescription drug claims). The application of deductible and MOOP was also changed to use an aggregate family deductible and family MOOP with an embedded individual MOOP equal to $8,550.
3. The resulting AV from the model is used as the final AV for tier placement.
The model was intended only for HDHPs where medical and drug claims both accumulate to the deductible. The Bronze plan with the pharmacy limit5 and Silver deductible plans (and associated CSR plans) need to be adjusted to account for the lower prescription drug MOOP, but the deductible plan has separate medical and drug deductibles. Thus, the model was used but with a slight variation in methodology. The following highlight the differences in methodology used only for the Bronze and Silver Deductible plans.
1. Same as for HDHPs, as much of the plan design as possible was entered into the AVC. This is the unadjusted AV. The Bronze and Silver Deductible plans then need to be adjusted for the lower and separate prescription drug MOOP.
5 Only the Bronze plan with the pharmacy limit needs to be adjusted. The Bronze plan without the pharmacy limit is not subject to the lower prescription drug MOOP and as such does not require an explicit adjustment to the AVC results.
page 12
Actuarial Value Certification for 2021 Standard Plan Designs State of Vermont
2. The model was used to develop the AV adjustments in a slightly different process than for the HDHPs.
a. Instead of normalizing the model to the AVC, the normalization factor for the Bronze or Silver HDHP was used.
b. The model cannot accommodate plan designs where both medical and drug claims do not accumulate to the deductible. Thus, the same plan design was entered into the model as in the AVC but the model selection indicated that both medical and drug claims accumulated to the deductible amounts.
c. The model was then re-run with the lower drug MOOP and to adjust the prescription drug MOOP to only consider prescription drug claims (the medical MOOP amount continues to use both medical and prescription drug claims). The model continued to use a stacked application for deductible and MOOP since it is a traditional deductible plan.
3. The final AV is the ratio of the AV from 2c and 2b applied to the AV from the AVC in 1.
Appendix G includes screen shots from the AVC and the model for each plan design with an adjusted actuarial value. Also included is a summary of the AVs and in the instance of the Bronze and Silver Deductible plans, a calculation of the adjustment.
Disclosures and Limitations
Responsible Actuary. Julie Peper and Brittney Phillips are the actuaries responsible for this communication. Julie is a Member of the American Academy of Actuaries and a Fellow of the Society of Actuaries. Brittney is a Member of the American Academy of Actuaries and an Associate of the Society of Actuaries. They meet the Qualification Standards of the American Academy of Actuaries to issue this report.
Intended Users. This information has been prepared for the sole use of the State of Vermont and issuers within that state that will be submitting standard plan designs. Distribution to such parties should be made in its entirety. This report cannot be distributed to or relied on by any third party without the prior written permission of Wakely.
Risks and Uncertainties. The assumptions and resulting estimates included in this report and produced by the model are inherently uncertain. Users of the results should be qualified to use it and understand the results and the inherent uncertainty. Actual results may vary, potentially materially, from our estimates. Wakely does not warrant or guarantee that actual experience will tie to the AV estimated for the placement of plan designs into tiers. The developed actuarial values are for the purposes of classifying plan designs of similar value and do not represent the expected

page 13
Actuarial Value Certification for 2021 Standard Plan Designs State of Vermont
actuarial value of a plan or pricing AV used to determine premium rates. Actual AVs will vary based on a plan’s specific population, utilization, unit cost, and other variables.
Conflict of Interest. The responsible actuary is financially independent and free from conflict concerning all matters related to performing the actuarial services underlying this analysis. In addition, Wakely is organizationally and financially independent to the State of Vermont and any issuer in the state.
Data and Reliance. We have relied on others for data and information used in the actuarial value adjustments. We have reviewed the data for reasonableness, but have not performed any independent audit or otherwise verified the accuracy of the data/information. If the underlying information is incomplete or inaccurate, our estimates may be impacted, potentially significantly. Below is a list of data and assumptions provided by others and assumptions required by law.
• Final 2021 Federal AVC Model was relied on for the original AV. While reasonability tests have shown there are some assumptions and methodologies that are not consistent with expectations, the AVC was developed for plan classification and not pricing. Thus, the model is being used as such and we make no warranties for the accuracy of the AVs that result from the AVC.
• VHCURES data supplied by the state was used in the development of the HDHP model.
Subsequent Events. Subsequent events to the date of this report that could impact the plan designs presented include, but are not limited to:
1. The federal HDHP minimum deductible and Maximum Out of Pocket (MOOP) limits are not yet released for 2021. The 2020 minimum deductible and MOOP are $1,400 and $6,900, respectively. Historically, the deductible has increased $50 every two to three years and the MOOP increases around $100 a year on average, though neither changed from 2016 to 2017. The plan designs presented are compliant with the 2020 HDHP limits and may need to change once the 2021 HDHP limits are released, primarily if the minimum deductible is increased.
2. The 2021 Notice of Benefits and Payment Parameters (NBPP) are still in draft form. Based on the draft regulations, the single annual limit is expected to be $8,550, up from $8,150 in 2020. The plan designs presented are compliant with the 2021 draft NBPP and may need to change if the final NBPP lowers the annual limit from the draft notice.
3. Other changes to regulations passed subsequent to this report.
Contents of Actuarial Report. This document and the supporting exhibits/files constitute the entirety of actuarial report and supersede any previous communications on the project.
page 14
Actuarial Value Certification for 2021 Standard Plan Designs State of Vermont
Deviations from ASOPS. Wakely completed the analysis using sound actuarial practice. To the best of my knowledge, the report and methods used in the analysis are in compliance with the appropriate Actuarial Standards of Practice (ASOP) with no known deviations. A summary of ASOP compliance is listed in Exhibit D.
Exhibit A contains the formal actuarial certification. If you have any questions regarding this letter or the certification, please contact us.
Sincerely,
Julie A. Peper, FSA, MAAA Principal and Senior Consulting Actuary
Brittney Phillips, ASA, MAAA Consulting Actuary

page A1
Actuarial Value Certification for 2021 Standard Plan Designs State of Vermont
Appendix A Actuarial Certification
State of Vermont Actuarial Value of Standard Plan Designs
Effective January 1, 2021
I, Brittney Phillips, am associated with the firm of Wakely Consulting Group, LLC (Wakely), am an Associate of the Society of Actuaries and a member of the American Academy of Actuaries, and meet its Qualification Standards for Statements of Actuarial Opinion. Wakely was retained by the State of Vermont to provide a certification of the actuarial value of the state’s standard plan designs that are effective January 1, 2021 on Vermont Health Connect. This certification may not be appropriate for other purposes.
To the best of my information, knowledge and belief, the actuarial values provided with this certification are considered actuarially sound for purposes of § 156.135(b), according to the following criteria:
1. The final 2021 federal Actuarial Value Calculator was used to determine the AV for the plan provisions that fit within the calculator parameters;
2. Appropriate adjustments were calculated, to the AV identified by the calculator, for plan design features that deviate substantially from the parameters of the AV calculator;
3. The actuarial values have been developed in accordance with generally accepted actuarial principles and practices; and
4. The actuarial values meet the requirements of § 156.135(b).
The assumptions and methodology used to develop the actuarial values have been documented in my correspondence with the State of Vermont. The actuarial values associated with this certification are for standard plan designs (Silver HDHP, Bronze HDHP, one Bronze Deductible, Silver Deductible, Silver HDHP CSR 73%, Silver HDHP CSR 77%, Silver HDHP CSR 87%, Silver HDHP CSR 94%, Silver Deductible CSR 73%, Silver Deductible CSR 77%, Silver Deductible CSR 87%, and Silver Deductible CSR 94%) that will be effective as of January 1, 2021 for individual and group coverage sold on Vermont Health Connect.
The developed actuarial values are for the purposes of classifying plan designs of similar value and do not represent the expected actuarial value of a plan. Actual AVs will vary based on a plan’s specific population, utilization, unit cost and other variables.
In developing the actuarial values, I have relied upon the federal Actuarial Value calculator and data from the Vermont Healthcare Claims Uniform Reporting and Evaluation System

page A2
Actuarial Value Certification for 2021 Standard Plan Designs State of Vermont
(VHCURES). I did not audit the data provided; however, I did review the data for reasonableness and consistency.
Actuarial methods, considerations, and analyses used in forming my opinion conform to the appropriate Standards of Practice as promulgated from time-to-time by the Actuarial Standards Board, whose standards form the basis of this Statement of Opinion.
Brittney Phillips, ASA, MAAA March 10, 2020
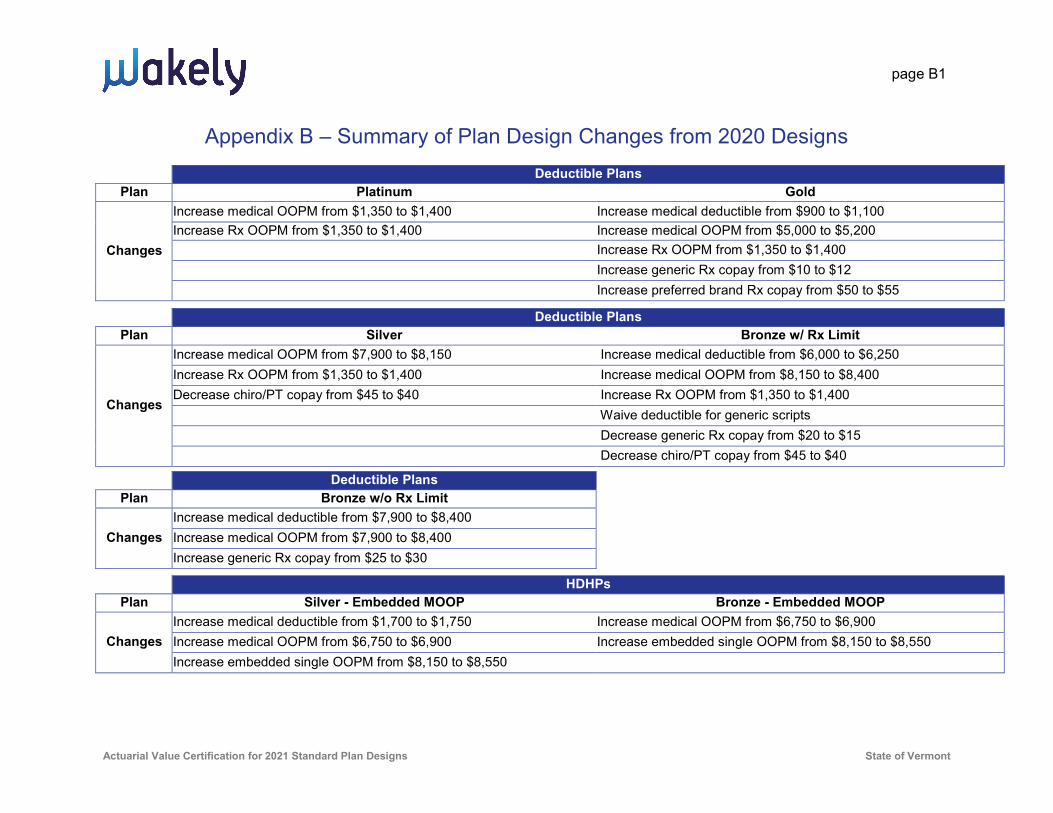
page B1
Actuarial Value Certification for 2021 Standard Plan Designs State of Vermont
Appendix B – Summary of Plan Design Changes from 2020 Designs
Deductible Plans Plan Platinum Gold
Changes
Increase medical OOPM from $1,350 to $1,400 Increase medical deductible from $900 to $1,100 Increase Rx OOPM from $1,350 to $1,400 Increase medical OOPM from $5,000 to $5,200 Increase Rx OOPM from $1,350 to $1,400 Increase generic Rx copay from $10 to $12 Increase preferred brand Rx copay from $50 to $55
Deductible Plans
Plan Silver Bronze w/ Rx Limit
Changes
Increase medical OOPM from $7,900 to $8,150 Increase medical deductible from $6,000 to $6,250 Increase Rx OOPM from $1,350 to $1,400 Increase medical OOPM from $8,150 to $8,400 Decrease chiro/PT copay from $45 to $40 Increase Rx OOPM from $1,350 to $1,400 Waive deductible for generic scripts Decrease generic Rx copay from $20 to $15 Decrease chiro/PT copay from $45 to $40
Deductible Plans
Plan Bronze w/o Rx Limit
Changes Increase medical deductible from $7,900 to $8,400 Increase medical OOPM from $7,900 to $8,400 Increase generic Rx copay from $25 to $30
HDHPs Plan Silver - Embedded MOOP Bronze - Embedded MOOP
Changes Increase medical deductible from $1,700 to $1,750 Increase medical OOPM from $6,750 to $6,900 Increase medical OOPM from $6,750 to $6,900 Increase embedded single OOPM from $8,150 to $8,550 Increase embedded single OOPM from $8,150 to $8,550

page C1
Actuarial Value Certification for 2021 Standard Plan Designs State of Vermont
Appendix C – On and Off-Exchange Reflective Silver Standard Plan Designs
2021 Plan Designs - Silver Deductible Plans 2021 Plan Designs - Silver HDHP Plans Deductible/OOP Max On-Exchange Off-Exchange On-Exchange Off- Exchange Type of Plan Deductible Deductible HSA Q/HDHP HSA Q/HDHP Medical Ded $3,200 $3,200 $1,750 $1,750 Rx Ded $350 $350 $1,400 $1,400 Integrated Ded No No Yes Yes Medical MOOP $8,150 $8,150 $6,900 $6,900 Rx MOOP $1,400 $1,400 $1,400 $1,400 Integrated MOOP Rx -No, Medical - Yes Rx -No, Medical - Yes Yes Yes
Family Deductible / OOP Stacked, 2x Individual Stacked, 2x Individual Aggregate with Combined
Medical/Rx embedded $8,550 Single OOPM; 2x Individual
Aggregate with Combined Medical/Rx embedded $8,550
Single OOPM; 2x Individual Medical Deductible waived for: Prev, OV, UC, Amb Prev, OV, UC, Amb Preventive Preventive Drug Deductible waived for: Generic scripts Generic scripts Wellness scripts Wellness scripts Service Category Copay / Coinsurance Copay / Coinsurance Copay / Coinsurance Copay / Coinsurance Inpatient 50% 50% 30% 30% Outpatient 50% 50% 30% 30% ER $250 $250 30% 30% Radiology (MRI, CT, PET) 50% 50% 30% 30% Preventive $0 $0 0% 0% PCP Office Visit $35 $35 10% 10% MH/SA Office Visit $35 $35 10% 10% Specialist Office Visit $80 $80 30% 30% Chiropractic $40 $40 30% 30% Physical Therapy $40 $40 30% 30% Urgent Care $90 $90 30% 30% Ambulance $100 $105 30% 35% Rx Generic $15 $15 $10 $10 Rx Preferred Brand $60 $60 $40 $40 Rx Non-Preferred Brand 50% 50% 50% 50% Rx Specialty 50% 50% 50% 50% Actuarial Value 2021 Federal AVC, Adjusted if Necessary 71.8% 71.8% 71.2% 71.2%

page D1
Actuarial Value Certification for 2021 Standard Plan Designs State of Vermont
Appendix D – Comments Relative to Applicable ASOPs
This appendix includes comments relative to the following applicable Actuarial Standards of Practice (ASOP).
1. ASOP No. 23, Data Quality;
2. ASOP No. 25, Credibility Procedures;
3. ASOP No. 41, Actuarial Communications; and
4. ASOP No. 50 Determining Minimum Value and Actuarial Value under the Affordable Care Act.
ASOP 23: Data Quality
3.1 Overview ⎯ VHCURES data was used as the basis for the HDHP model and this data source was deemed reasonable for the analysis discussed in the management report.
3.2 Selection of Data - The data was considered reasonable for our analysis subject to the following considerations -
a. The data sources contained all material data elements.
b. The following considerations were reviewed as part of our analysis:
1. Data was appropriate and sufficiently current.
2. Data was reasonable and comprehensive of the necessary data elements.
3. There were no known, material limitations of the data.
4. No alternative data sets were reasonably available. The reliability of the data underlying our analysis did not require support from alternative data sets.
5. Alternative data sets were not deemed necessary to complete the analysis.
6. Sampling methods were not required.
3.3 Reliance on Data Supplied by Others - Reliance is discussed in the management report to which this appendix is attached.

page D2
Actuarial Value Certification for 2021 Standard Plan Designs State of Vermont
3.4 Reliance on Other Information Relevant to the Use of Data - We relied on information contained in the report. We did not detect any material errors in the data provided and relied upon the data as part of our analysis.
3.5 Review of Data - We reviewed the data. Data definitions were included as part of the VHCURES data. Ultimately the data was reasonable with the adjustments discussed in our management report.
3.6 Limitation of the Actuary’s Responsibility - We did not audit the data.
3.7 Use of Data⎯ Use and adjustments to the data are discussed in this management report. In addition:
a. We deem that the data are of sufficient quality to perform the analysis;
b. The data did not require enhancement before the analysis could be performed
c. The data was reasonable for the analysis and did not require adjustment beyond that discussed in the management report;
d. We did not detect any material defects in any data source;
e. The data were adequate to perform our analysis.
ASOP 25: Credibility Procedures
The HDHP model uses data as its starting point. The experience used is fully credible and therefore no credibility blending or adjustments were necessary.
ASOP 41: Actuarial Communications
This report and the actuarial memorandum submitted are consistent with the guidance in ASOP 41.
3.1 General Requirements for Actuarial Communications
3.1.1 Principal and Scope of Engagement – These results were developed to comply with § 156.135(b) and should not be used for any other purpose. The distribution of this report to other users is limited to the State of Vermont.
3.1.2 Form and Content – The State of Vermont was the principal for this engagement and the scope of the engagement included developing and certifying the actuarial values for the standard plan designs as discussed in the management report.
page D3
Actuarial Value Certification for 2021 Standard Plan Designs State of Vermont
3.1.3 Timing of Communication – This report is provided in conjunction with the actuarial certification of the submitted actuarial values.
3.1.4 Identification of Responsible Actuary – The responsible actuary is identified in the attestation and this management report.
3.2 Actuarial Report – This management report is an Actuarial Report as defined in this ASOP. Correspondence between Wakely and the State of Vermont as part of this engagement should also be considered part of the Actuarial Report.
3.3 Specific Circumstances – No constraints apply beyond any discussed in the attachment management report.
3.4 Disclosures Within an Actuarial Report - all relevant disclosures have been made in the management report. Consistent with this ASOP, we make specific mention to the following items here:
3.4.1 Uncertainty or Risk – Uncertainty is discussed in the management report.
3.4.2 Conflict of Interest – Wakely is financially, organizationally, and otherwise independent from the State of Vermont and any reliant parties.
3.4.3 Reliance on Other Sources for Data and Other Information - Reliance regarding data and assumptions are discussed in this management report.
3.4.4 Responsibility for Assumptions and Methods - Assumptions and methods are discussed in the management report and the parties associated with the assumptions and methods have been delineated. Therefore, pursuant to this ASOP, no additional disclosure is necessary.
3.4.5 Information Date of Report -The management report lists the applicable dates for the analysis and correspondence.
3.4.6 Subsequent Events - Subsequent events are listed in the Limitations and Disclosures section.
3.5 Explanation of Material Differences - Wakely has issued no other report regarding the development of these actuarial values. No comparison to prior results is necessary.
3.6 Oral Communications - No oral communication is considered part of this actuarial report. Any material assumptions or methods discussed in oral communications have been documented in written form as well.
3.7 Responsibility to Other Users - Intended users of this report have been specifically noted in the document.
ASOP 50: Determining Minimum Value and Actuarial Value under the Affordable Care Act
3.1 Use of AVC or MVC – The federal AVC was used.
page D4
Actuarial Value Certification for 2021 Standard Plan Designs State of Vermont
3.2 Exceptions to the AVC – The federal AV was determined by making adjustments to the results of the federal AVC based on provisions that could not be appropriate modeled in the AVC.
3.3 Exceptions to the MVC – Not applicable.
3.4 Evaluating Non-Standard Plan Designs – The HDHP model was normalized to the federal AVC.
3.5 Reasonableness of Assumptions for Non-Standard Plan Designs – The assumptions used to modify the federal AVs were reviewed for reasonability.
3.6 Unreasonable Results – Not applicable.
3.7 Documentation – See ASOP 41 documentation above.

page E1
Actuarial Value Certification for 2021 Standard Plan Designs State of Vermont
Appendix E – Standard Plan Designs
Deductible Plan Designs 2021 Plan Designs - Deductible Plans Deductible/OOP Max Platinum Gold Silver Bronze w/ Rx Limit Bronze w/o Rx Limit Type of Plan Deductible Deductible Deductible Deductible Deductible Medical Ded $350 $1,100 $3,200 $6,250 $8,400 Rx Ded $0 $100 $350 $1,000 N/A Integrated Ded No No No No Yes Medical MOOP $1,400 $5,200 $8,150 $8,400 $8,400 Rx MOOP $1,400 $1,400 $1,400 $1,400 N/A Integrated MOOP No No Rx -No, Medical - Yes Rx -No, Medical - Yes Yes Family Deductible / OOP Stacked, 2x Individual Stacked, 2x Individual Stacked, 2x Individual Stacked, 2x Individual Stacked, 2x Individual Medical Deductible waived for: Prev, OV, UC, Amb Prev, OV, UC, Amb Prev, OV, UC, Amb Preventive Preventive, OV Drug Deductible waived for: N/A Generic scripts Generic scripts Generic Scripts Generic Scripts Service Category Copay / Coinsurance Copay / Coinsurance Copay / Coinsurance Copay / Coinsurance Copay / Coinsurance Inpatient 10% 30% 50% 50% 0% Outpatient 10% 30% 50% 50% 0% ER $100 $150 $250 50% 0% Radiology (MRI, CT, PET) 10% 30% 50% 50% 0% Preventive $0 $0 $0 $0 0% PCP Office Visit $15 $20 $35 $35 $40 MH/SA Office Visit $15 $20 $35 $35 $40 Specialist Office Visit $40 $50 $80 $90 $100 Chiropractic $20 $30 $40 $40 $50 Physical Therapy $20 $30 $40 $40 $50 Urgent Care $50 $60 $90 $100 0% Ambulance $60 $70 $100 $100 0% Rx Generic $10 $12 $15 $15 $30 Rx Preferred Brand $50 $55 $60 $85 0% Rx Non-Preferred Brand 50% 50% 50% 60% 0% Rx Specialty 50% 50% 50% 60% 0% Actuarial Value 2021 Federal AVC, Adjusted if Necessary 89.7% 81.9% 71.8% 64.1% 64.8%

page E2
Actuarial Value Certification for 2021 Standard Plan Designs State of Vermont
Deductible Plan Designs – Cost Sharing Reduction Plans 2021 Plan Designs - Deductible Plans
Deductible/OOP Max 70% AV Silver 250-300% FPL (73% AV)
200-250% FPL (77% AV)
150-200% FPL (87% AV)
133-150% FPL (94% AV)
Type of Plan Deductible Deductible Deductible Deductible Deductible Medical Ded $3,200 $3,100 $2,600 $1,100 $200 Rx Ded $350 $350 $300 $200 $0 Integrated Ded No No No No No Medical MOOP $8,150 $6,750 $6,000 $2,200 $900 Rx MOOP $1,400 $1,250 $1,100 $450 $200
Integrated MOOP Rx -No, Medical - Yes
Rx -No, Medical - Yes
Rx -No, Medical - Yes
Rx -No, Medical - Yes
Rx -No, Medical - Yes
Family Deductible / OOP Stacked, 2x Individual
Stacked, 2x Individual
Stacked, 2x Individual
Stacked, 2x Individual
Stacked, 2x Individual
Medical Deductible waived for: Prev, OV, UC, Amb Prev, OV, UC, Amb Prev, OV, UC, Amb Prev, OV, UC, Amb Prev, OV, UC, Amb Drug Deductible waived for: Generic scripts Generic scripts Generic scripts Generic scripts N/A
Service Category Copay / Coinsurance
Copay / Coinsurance
Copay / Coinsurance
Copay / Coinsurance
Copay / Coinsurance
Inpatient 50% 50% 50% 40% 10% Outpatient 50% 50% 50% 40% 10% ER $250 $250 $250 $250 $75 Radiology (MRI, CT, PET) 50% 50% 50% 40% 10% Preventive $0 $0 $0 $0 $0 PCP Office Visit $35 $35 $25 $10 $5 MH/SA Office Visit $35 $35 $25 $10 $5 Specialist Office Visit $80 $70 $50 $30 $15 Chiropractic $40 $40 $30 $12 $6 Physical Therapy $40 $40 $30 $12 $6 Urgent Care $90 $80 $60 $40 $25 Ambulance $100 $100 $100 $100 $50 Rx Generic $15 $12 $12 $10 $5 Rx Preferred Brand $60 $60 $60 $50 $20 Rx Non-Preferred Brand 50% 50% 50% 50% 30% Rx Specialty 50% 50% 50% 50% 30% Actuarial Value 2021 Federal AVC, Adjusted if Necessary 71.8% 74.0% 78.0% 88.0% 94.8%

page E3
Actuarial Value Certification for 2021 Standard Plan Designs State of Vermont
HDHP Plan Designs 2021 Plan Designs - HDHP Plans Deductible/OOP Max Silver Bronze Type of Plan HSA Q/HDHP HSA Q/HDHP Medical Ded $1,750 $5,500 Rx Ded $1,400 $1,400 Integrated Ded Yes Yes Medical MOOP $6,900 $6,900 Rx MOOP $1,400 $1,400 Integrated MOOP Yes Rx -No, Medical - Yes
Family Deductible / OOP Aggregate with Combined
Medical/Rx embedded $8,550 Single OOPM; 2x
Individual
Aggregate with Combined Medical/Rx embedded
$8,550 Single OOPM; 2x Individual
Medical Deductible waived for: Preventive Preventive Drug Deductible waived for: Wellness scripts Wellness scripts Service Category Copay / Coinsurance Copay / Coinsurance Inpatient 30% 50% Outpatient 30% 50% ER 30% 50% Radiology (MRI, CT, PET) 30% 50% Preventive 0% 0% PCP Office Visit 10% 50% MH/SA Office Visit 10% 50% Specialist Office Visit 30% 50% Chiropractic 30% 50% Physical Therapy 30% 50% Urgent Care 30% 50% Ambulance 30% 50% Rx Generic $10 $12 Rx Preferred Brand $40 40% Rx Non-Preferred Brand 50% 60% Rx Specialty 50% 60% Actuarial Value 2021 Federal AVC, Adjusted if Necessary 71.2% 63.8%
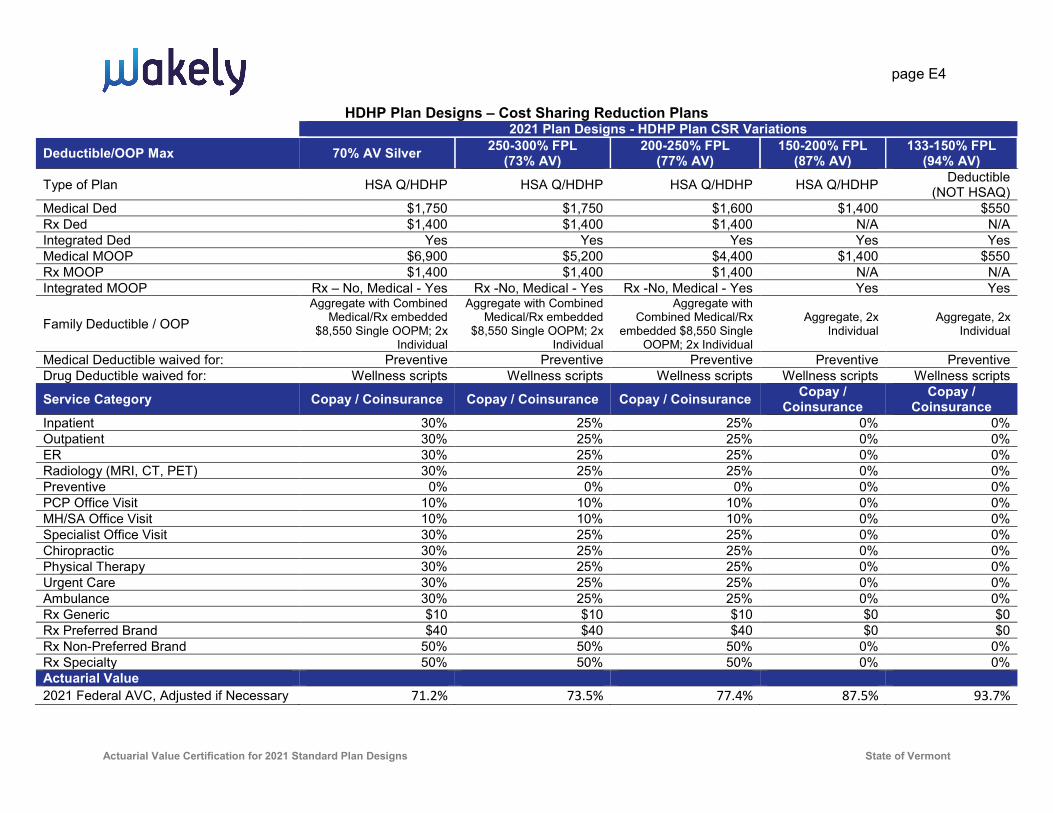
page E4
Actuarial Value Certification for 2021 Standard Plan Designs State of Vermont
HDHP Plan Designs – Cost Sharing Reduction Plans 2021 Plan Designs - HDHP Plan CSR Variations
Deductible/OOP Max 70% AV Silver 250-300% FPL (73% AV)
200-250% FPL (77% AV)
150-200% FPL (87% AV)
133-150% FPL (94% AV)
Type of Plan HSA Q/HDHP HSA Q/HDHP HSA Q/HDHP HSA Q/HDHP Deductible (NOT HSAQ)
Medical Ded $1,750 $1,750 $1,600 $1,400 $550 Rx Ded $1,400 $1,400 $1,400 N/A N/A Integrated Ded Yes Yes Yes Yes Yes Medical MOOP $6,900 $5,200 $4,400 $1,400 $550 Rx MOOP $1,400 $1,400 $1,400 N/A N/A Integrated MOOP Rx – No, Medical - Yes Rx -No, Medical - Yes Rx -No, Medical - Yes Yes Yes
Family Deductible / OOP Aggregate with Combined
Medical/Rx embedded $8,550 Single OOPM; 2x
Individual
Aggregate with Combined Medical/Rx embedded
$8,550 Single OOPM; 2x Individual
Aggregate with Combined Medical/Rx
embedded $8,550 Single OOPM; 2x Individual
Aggregate, 2x Individual
Aggregate, 2x Individual
Medical Deductible waived for: Preventive Preventive Preventive Preventive Preventive Drug Deductible waived for: Wellness scripts Wellness scripts Wellness scripts Wellness scripts Wellness scripts
Service Category Copay / Coinsurance Copay / Coinsurance Copay / Coinsurance Copay / Coinsurance
Copay / Coinsurance
Inpatient 30% 25% 25% 0% 0% Outpatient 30% 25% 25% 0% 0% ER 30% 25% 25% 0% 0% Radiology (MRI, CT, PET) 30% 25% 25% 0% 0% Preventive 0% 0% 0% 0% 0% PCP Office Visit 10% 10% 10% 0% 0% MH/SA Office Visit 10% 10% 10% 0% 0% Specialist Office Visit 30% 25% 25% 0% 0% Chiropractic 30% 25% 25% 0% 0% Physical Therapy 30% 25% 25% 0% 0% Urgent Care 30% 25% 25% 0% 0% Ambulance 30% 25% 25% 0% 0% Rx Generic $10 $10 $10 $0 $0 Rx Preferred Brand $40 $40 $40 $0 $0 Rx Non-Preferred Brand 50% 50% 50% 0% 0% Rx Specialty 50% 50% 50% 0% 0% Actuarial Value 2021 Federal AVC, Adjusted if Necessary 71.2% 73.5% 77.4% 87.5% 93.7%
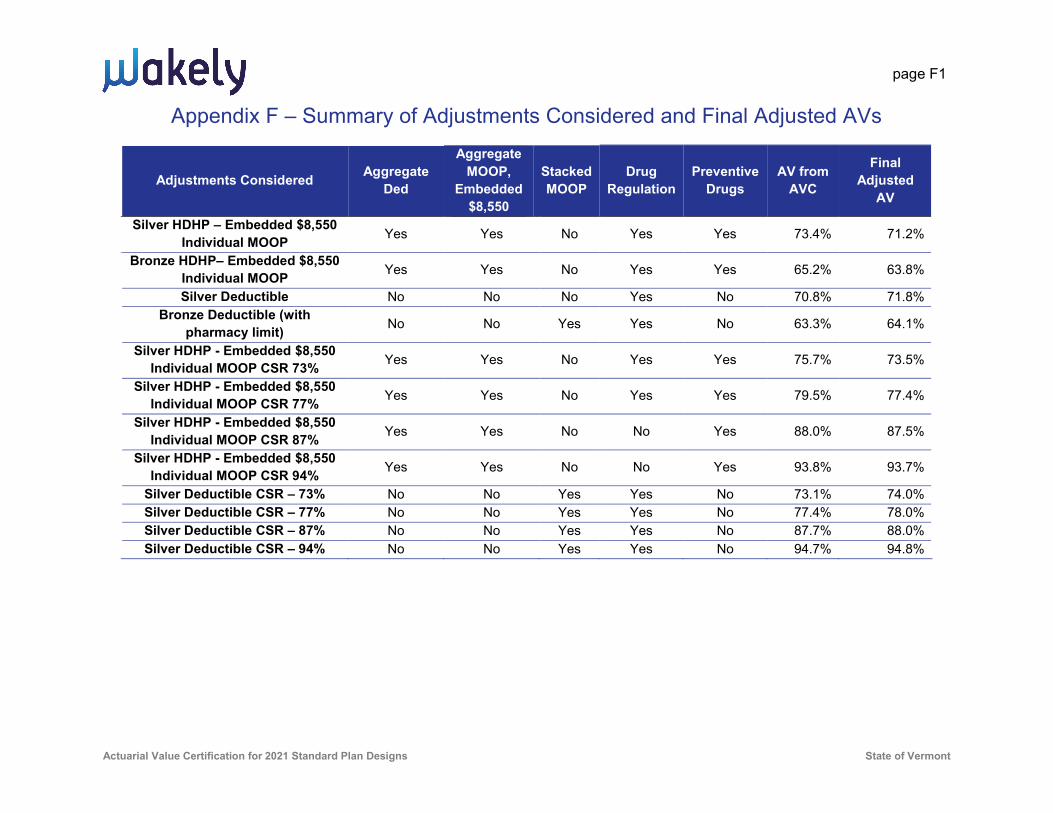
page F1
Actuarial Value Certification for 2021 Standard Plan Designs State of Vermont
Appendix F – Summary of Adjustments Considered and Final Adjusted AVs
Adjustments Considered Aggregate Ded
Aggregate MOOP,
Embedded $8,550
Stacked MOOP
Drug Regulation
Preventive Drugs
AV from AVC
Final Adjusted
AV
Silver HDHP – Embedded $8,550 Individual MOOP Yes Yes No Yes Yes 73.4% 71.2%
Bronze HDHP– Embedded $8,550 Individual MOOP Yes Yes No Yes Yes 65.2% 63.8%
Silver Deductible No No No Yes No 70.8% 71.8% Bronze Deductible (with
pharmacy limit) No No Yes Yes No 63.3% 64.1%
Silver HDHP - Embedded $8,550 Individual MOOP CSR 73% Yes Yes No Yes Yes 75.7% 73.5%
Silver HDHP - Embedded $8,550 Individual MOOP CSR 77% Yes Yes No Yes Yes 79.5% 77.4%
Silver HDHP - Embedded $8,550 Individual MOOP CSR 87% Yes Yes No No Yes 88.0% 87.5%
Silver HDHP - Embedded $8,550 Individual MOOP CSR 94% Yes Yes No No Yes 93.8% 93.7%
Silver Deductible CSR – 73% No No Yes Yes No 73.1% 74.0% Silver Deductible CSR – 77% No No Yes Yes No 77.4% 78.0% Silver Deductible CSR – 87% No No Yes Yes No 87.7% 88.0% Silver Deductible CSR – 94% No No Yes Yes No 94.7% 94.8%

page G1
Actuarial Value Certification for 2021 Standard Plan Designs State of Vermont
Appendix G – Screen Shots and AV Development 1. Silver HDHP – Embedded MOOP
2. Bronze HDHP – Embedded MOOP
3. Silver Deductible Plan
4. Bronze Deductible Plan (with pharmacy limit)
5. Silver HDHP – Embedded MOOP CSR – 73%
6. Silver HDHP – Embedded MOOP CSR – 77%
7. Silver HDHP – Embedded MOOP CSR – 87%
8. Silver HDHP – Embedded MOOP CSR – 94%
9. Silver Deductible CSR – 73%
10. Silver Deductible CSR – 77%
11. Silver Deductible CSR – 87%
12. Silver Deductible CSR – 94%
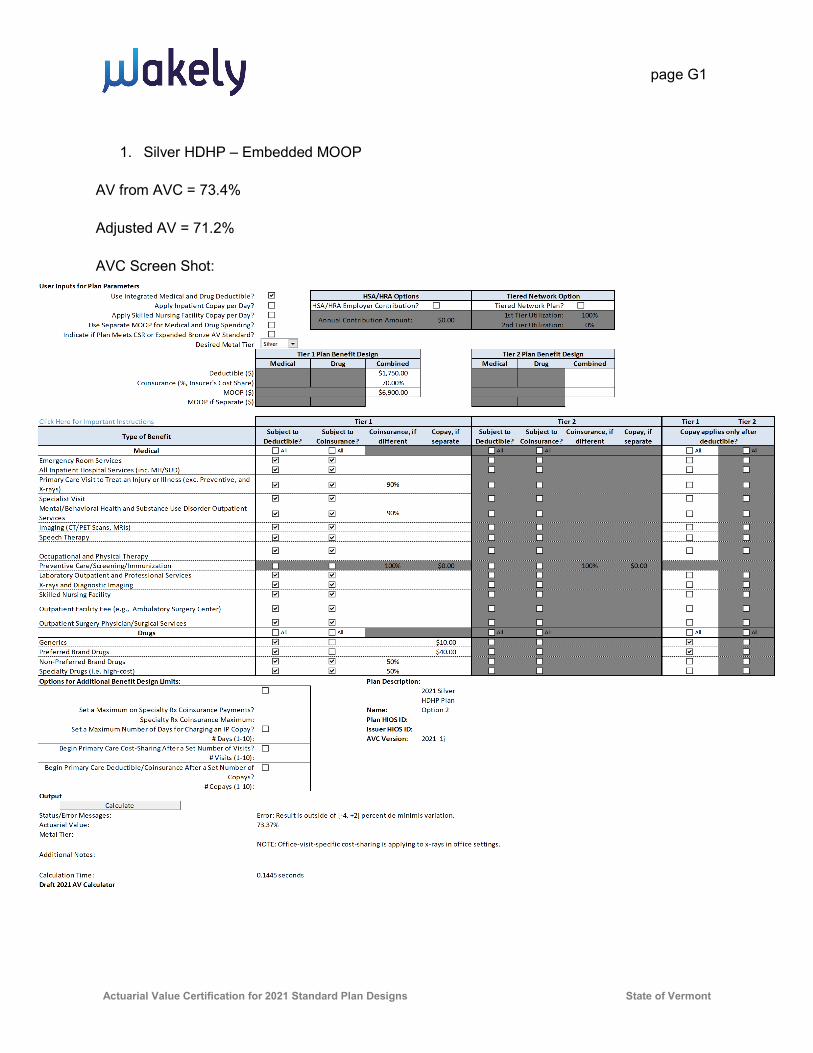
page G1
Actuarial Value Certification for 2021 Standard Plan Designs State of Vermont
1. Silver HDHP – Embedded MOOP
AV from AVC = 73.4%
Adjusted AV = 71.2%
AVC Screen Shot:

page G1
Actuarial Value Certification for 2021 Standard Plan Designs State of Vermont
1. Silver HDHP – Embedded MOOP, Continued
HDHP Model – Normalization:

page G2
Actuarial Value Certification for 2021 Standard Plan Designs State of Vermont
1. Silver HDHP – Embedded MOOP, Continued
HDHP Model – Adjusted Actuarial Value:
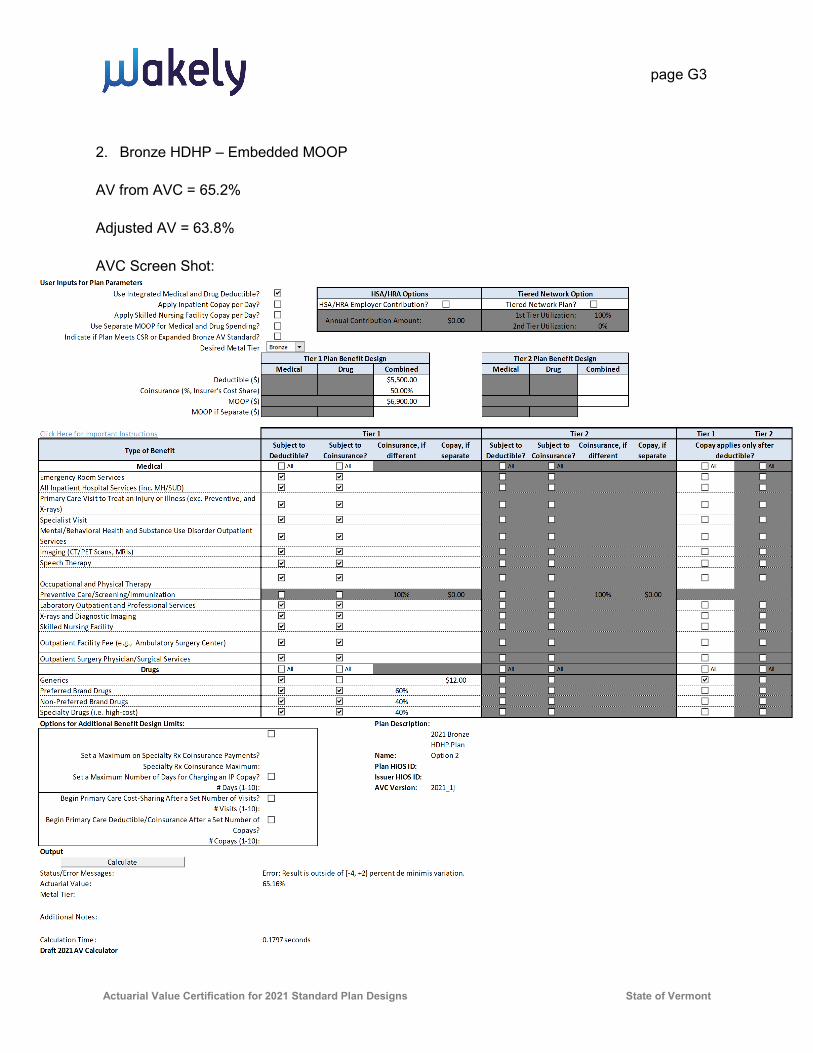
page G3
Actuarial Value Certification for 2021 Standard Plan Designs State of Vermont
2. Bronze HDHP – Embedded MOOP
AV from AVC = 65.2%
Adjusted AV = 63.8%
AVC Screen Shot:

page G4
Actuarial Value Certification for 2021 Standard Plan Designs State of Vermont
2. Bronze HDHP – Embedded MOOP, Continued
HDHP Model – Normalization:

page G5
Actuarial Value Certification for 2021 Standard Plan Designs State of Vermont
2. Bronze HDHP – Embedded MOOP, Continued
HDHP Model – Adjusted Actuarial Value:

page G6
Actuarial Value Certification for 2021 Standard Plan Designs State of Vermont
3. Silver Deductible
AV from AVC = 70.8%
Adjustments
• HDHP Model with drug adjustments / HDHP Model without drug adjustments = 65.96%/65.04% = 1.01 x .708 = 71.8%
Adjusted AV = 71.8%
AVC Screen Shot:

page G7
Actuarial Value Certification for 2021 Standard Plan Designs State of Vermont
Silver Deductible, Continued
HDHP Model – Without Prescription Drug Adjustments:

page G8
Actuarial Value Certification for 2021 Standard Plan Designs State of Vermont
3. Silver Deductible, Continued
HDHP Model – With Prescription Drug Adjustments:
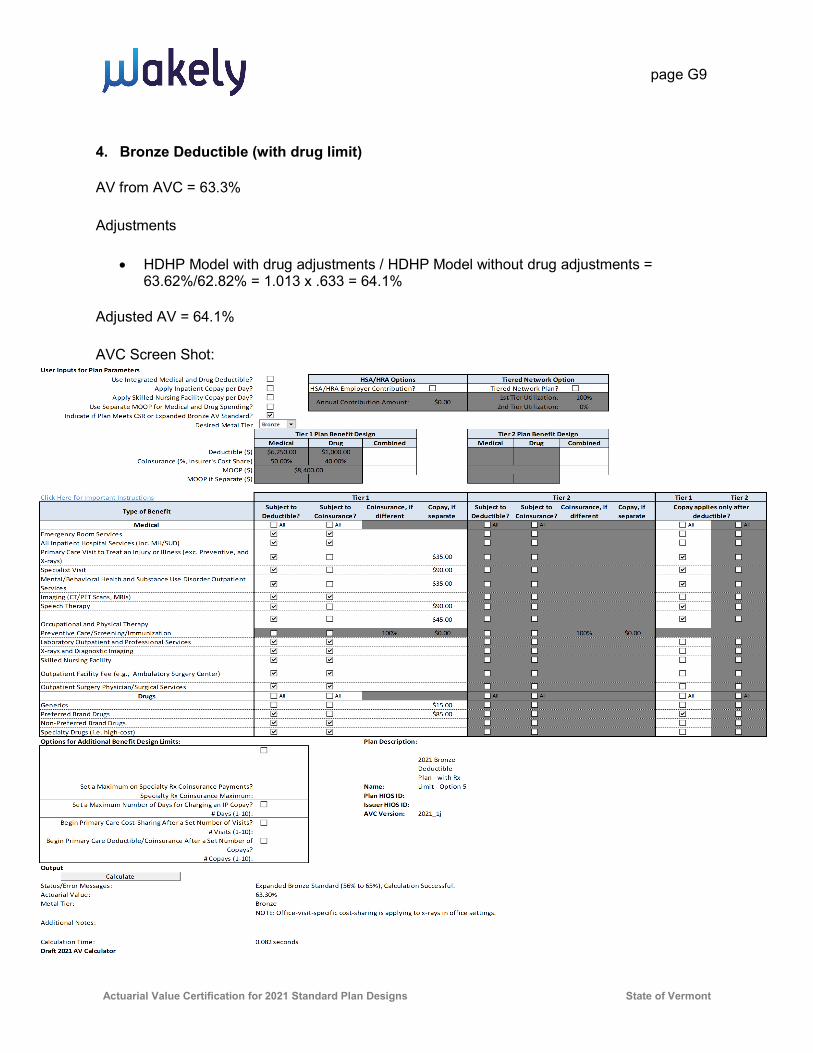
page G9
Actuarial Value Certification for 2021 Standard Plan Designs State of Vermont
4. Bronze Deductible (with drug limit)
AV from AVC = 63.3%
Adjustments
• HDHP Model with drug adjustments / HDHP Model without drug adjustments = 63.62%/62.82% = 1.013 x .633 = 64.1%
Adjusted AV = 64.1%
AVC Screen Shot:

page G10
Actuarial Value Certification for 2021 Standard Plan Designs State of Vermont
4. Bronze Deductible (Continuing, with drug limit), Continued
HDHP Model – Without Prescription Drug Adjustments:
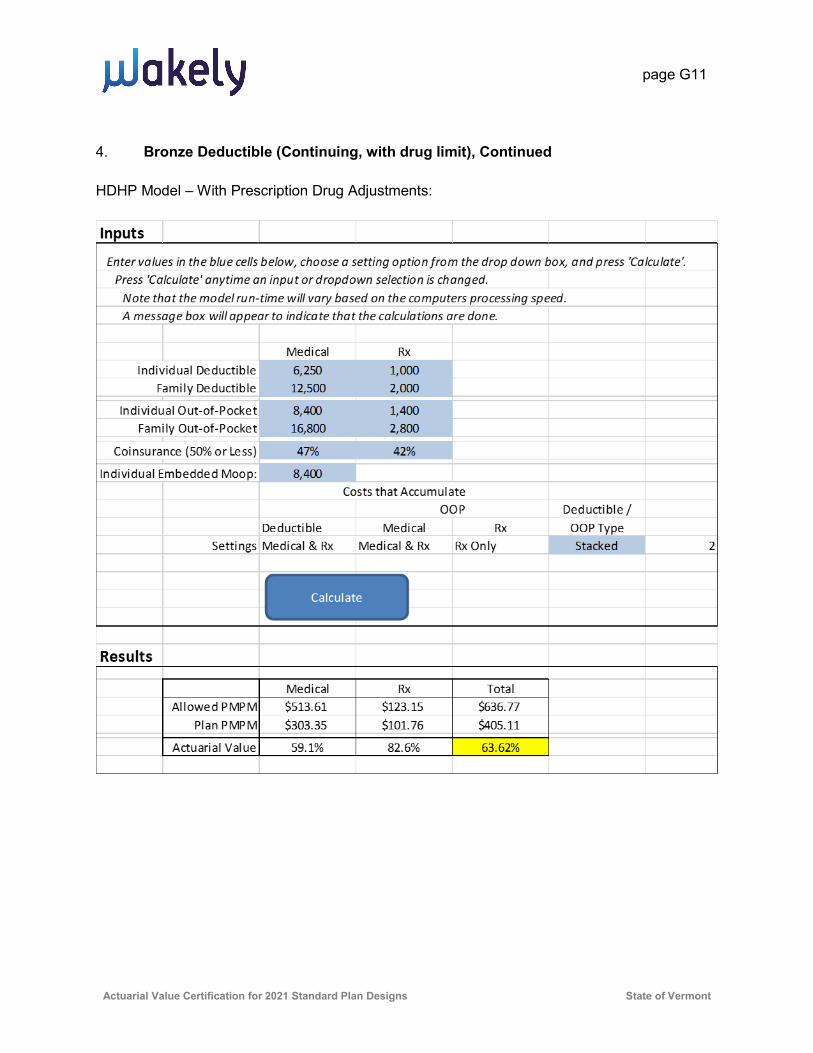
page G11
Actuarial Value Certification for 2021 Standard Plan Designs State of Vermont
4. Bronze Deductible (Continuing, with drug limit), Continued HDHP Model – With Prescription Drug Adjustments:

page G12
Actuarial Value Certification for 2021 Standard Plan Designs State of Vermont
5. Silver HDHP – Embedded MOOP CSR – 73%
AV from AVC = 75.7%
Adjusted AV = 73.5%
AVC Screen Shot:
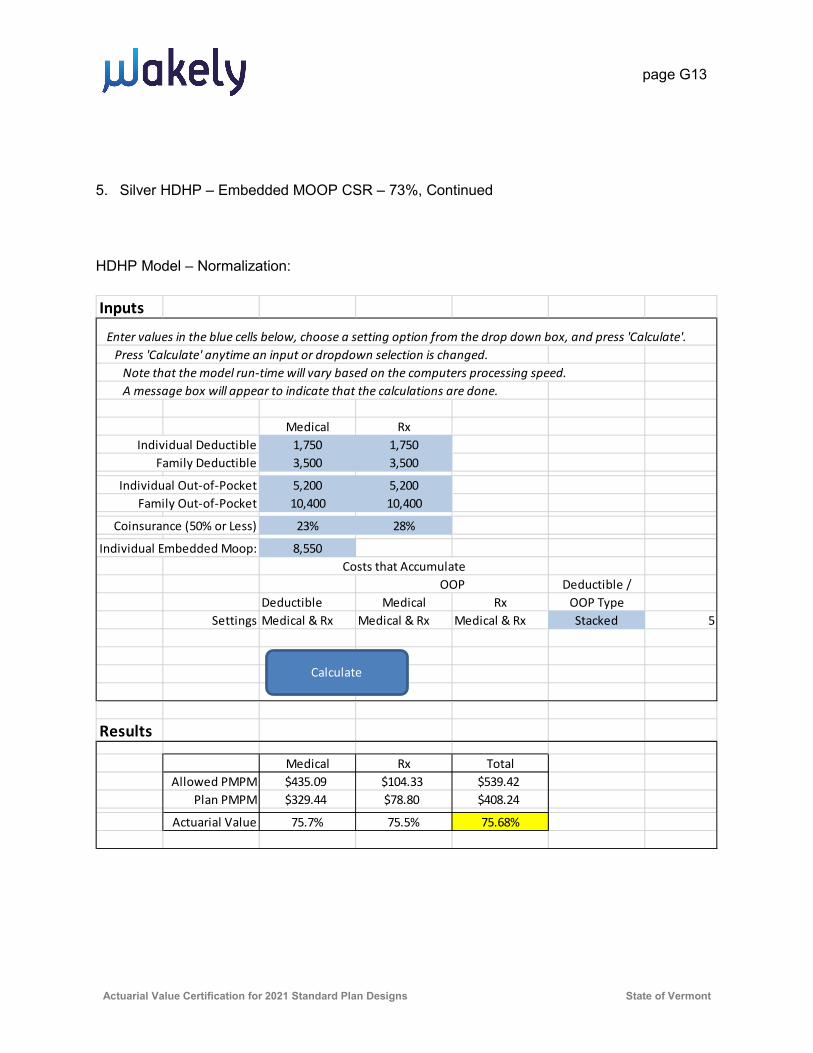
page G13
Actuarial Value Certification for 2021 Standard Plan Designs State of Vermont
5. Silver HDHP – Embedded MOOP CSR – 73%, Continued
HDHP Model – Normalization:
Inputs
Enter values in the blue cells below, choose a setting option from the drop down box, and press 'Calculate'.Press 'Calculate' anytime an input or dropdown selection is changed.
Note that the model run-time will vary based on the computers processing speed.A message box will appear to indicate that the calculations are done.
Medical RxIndividual Deductible 1,750 1,750
Family Deductible 3,500 3,500
Individual Out-of-Pocket 5,200 5,200Family Out-of-Pocket 10,400 10,400
Coinsurance (50% or Less) 23% 28%
Individual Embedded Moop: 8,550Costs that Accumulate
OOP Deductible /Deductible Medical Rx OOP Type
Settings Medical & Rx Medical & Rx Medical & Rx Stacked 5
Results
Medical Rx TotalAllowed PMPM $435.09 $104.33 $539.42
Plan PMPM $329.44 $78.80 $408.24
Actuarial Value 75.7% 75.5% 75.68%
Calculate

page G14
Actuarial Value Certification for 2021 Standard Plan Designs State of Vermont
5. Silver HDHP – Embedded MOOP CSR – 73%, Continued
HDHP Model – Adjusted Actuarial Value:
Inputs
Enter values in the blue cells below, choose a setting option from the drop down box, and press 'Calculate'.Press 'Calculate' anytime an input or dropdown selection is changed.
Note that the model run-time will vary based on the computers processing speed.A message box will appear to indicate that the calculations are done.
Medical RxIndividual Deductible 1,750 1,400
Family Deductible 3,500 2,800
Individual Out-of-Pocket 5,200 1,400Family Out-of-Pocket 10,400 2,800
Coinsurance (50% or Less) 23% 28%
Individual Embedded Moop: 8,550Costs that Accumulate
OOP Deductible /Deductible Medical Rx OOP Type
Settings Medical & Rx Medical & Rx Rx Only Aggregate Plus 6
Results
Medical Rx TotalAllowed PMPM $435.09 $104.33 $539.42
Plan PMPM $313.60 $82.73 $396.33
Actuarial Value 72.1% 79.3% 73.47%
Calculate

page G15
Actuarial Value Certification for 2021 Standard Plan Designs State of Vermont
6. Silver HDHP – Embedded MOOP CSR – 77%
AV from AVC = 79.5%
Adjusted AV = 77.4%
AVC Screen Shot:
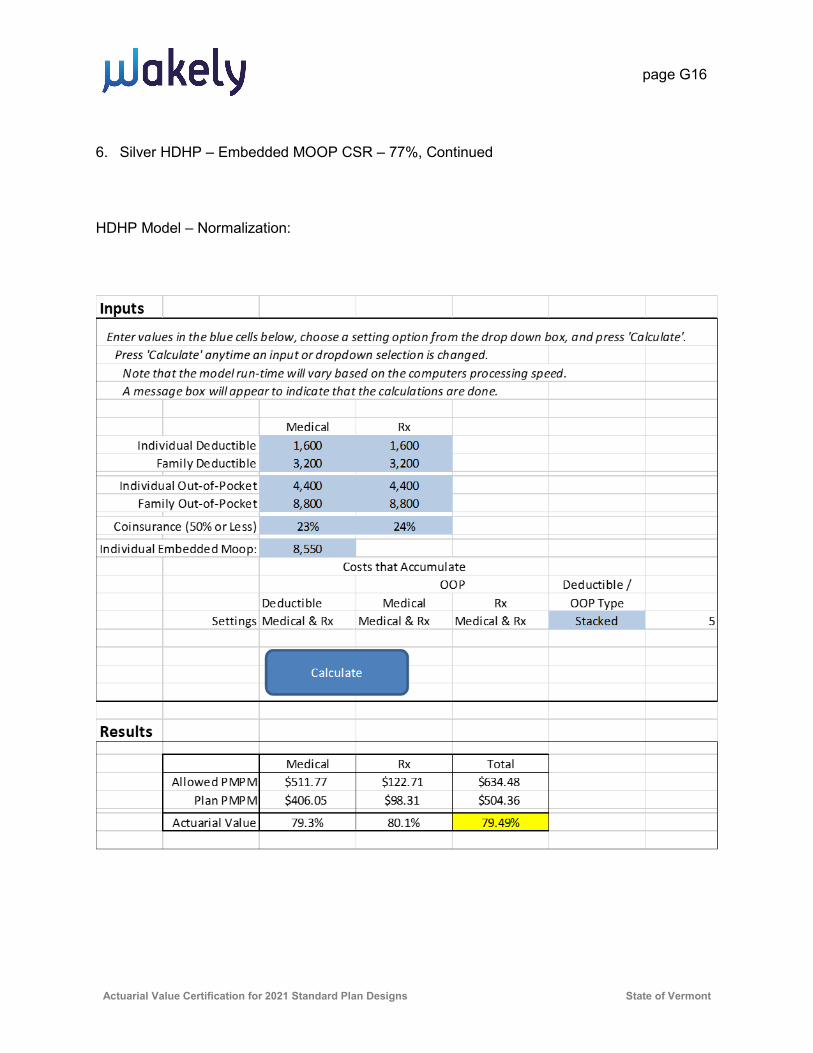
page G16
Actuarial Value Certification for 2021 Standard Plan Designs State of Vermont
6. Silver HDHP – Embedded MOOP CSR – 77%, Continued
HDHP Model – Normalization:

page G17
Actuarial Value Certification for 2021 Standard Plan Designs State of Vermont
6. Silver HDHP – Embedded MOOP CSR – 77%, Continued
HDHP Model – Adjusted Actuarial Value:
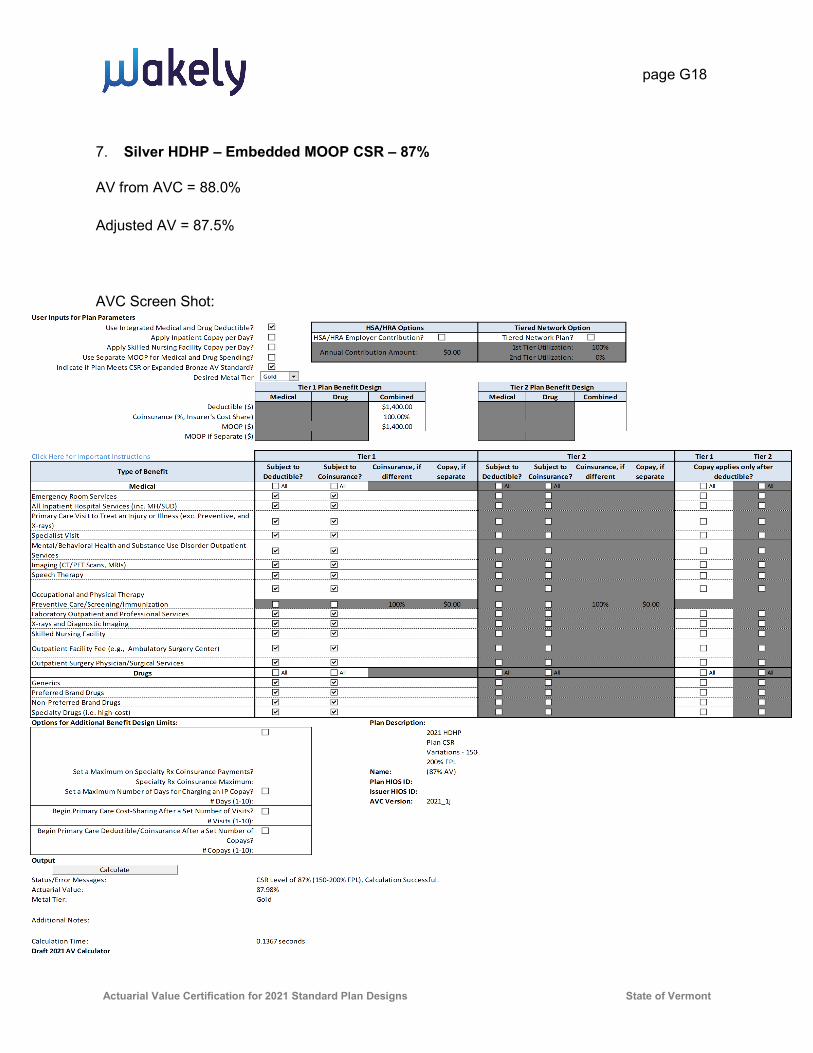
page G18
Actuarial Value Certification for 2021 Standard Plan Designs State of Vermont
7. Silver HDHP – Embedded MOOP CSR – 87%
AV from AVC = 88.0%
Adjusted AV = 87.5%
AVC Screen Shot:
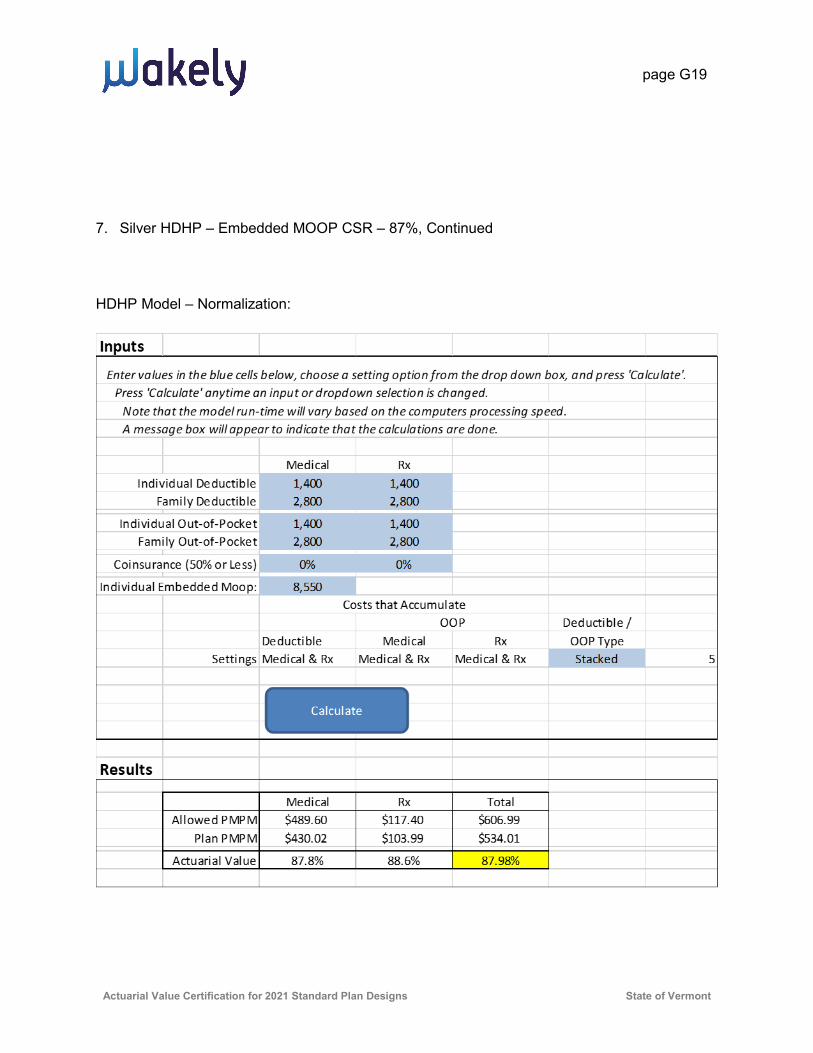
page G19
Actuarial Value Certification for 2021 Standard Plan Designs State of Vermont
7. Silver HDHP – Embedded MOOP CSR – 87%, Continued
HDHP Model – Normalization:

page G20
Actuarial Value Certification for 2021 Standard Plan Designs State of Vermont
7. Silver HDHP – Embedded MOOP CSR – 87%, Continued
HDHP Model – Adjusted Actuarial Value:
Inputs
Enter values in the blue cells below, choose a setting option from the drop down box, and press 'Calculate'.Press 'Calculate' anytime an input or dropdown selection is changed.
Note that the model run-time will vary based on the computers processing speed.A message box will appear to indicate that the calculations are done.
Medical RxIndividual Deductible 1,400 1,400
Family Deductible 2,800 2,800
Individual Out-of-Pocket 1,400 1,400Family Out-of-Pocket 2,800 2,800
Coinsurance (50% or Less) 0% 0%
Individual Embedded Moop: 8,550Costs that Accumulate
OOP Deductible /Deductible Medical Rx OOP Type
Settings Medical & Rx Medical & Rx Rx Only Aggregate Plus 6
Results
Medical Rx TotalAllowed PMPM $489.60 $117.40 $606.99
Plan PMPM $427.60 $103.45 $531.05
Actuarial Value 87.3% 88.1% 87.49%
Calculate

page G21
Actuarial Value Certification for 2021 Standard Plan Designs State of Vermont
8. Silver HDHP – Embedded MOOP CSR – 94%
AV from AVC = 93.8%
Adjusted AV = 93.7%
AVC Screen Shot:

page G22
Actuarial Value Certification for 2021 Standard Plan Designs State of Vermont
8. Silver HDHP – Embedded MOOP CSR – 94%, Continued
HDHP Model – Normalization:
Inputs
Enter values in the blue cells below, choose a setting option from the drop down box, and press 'Calculate'.Press 'Calculate' anytime an input or dropdown selection is changed.
Note that the model run-time will vary based on the computers processing speed.A message box will appear to indicate that the calculations are done.
Medical RxIndividual Deductible 550 550
Family Deductible 1,100 1,100
Individual Out-of-Pocket 550 550Family Out-of-Pocket 1,100 1,100
Coinsurance (50% or Less) 0% 0%
Individual Embedded Moop: 8,550Costs that Accumulate
OOP Deductible /Deductible Medical Rx OOP Type
Settings Medical & Rx Medical & Rx Medical & Rx Stacked 5
Results
Medical Rx TotalAllowed PMPM $415.23 $99.56 $514.80
Plan PMPM $389.34 $93.36 $482.70
Actuarial Value 93.8% 93.8% 93.76%
Calculate

page G23
Actuarial Value Certification for 2021 Standard Plan Designs State of Vermont
8. Silver HDHP – Embedded MOOP CSR – 94%, Continued
HDHP Model – Adjusted Actuarial Value:
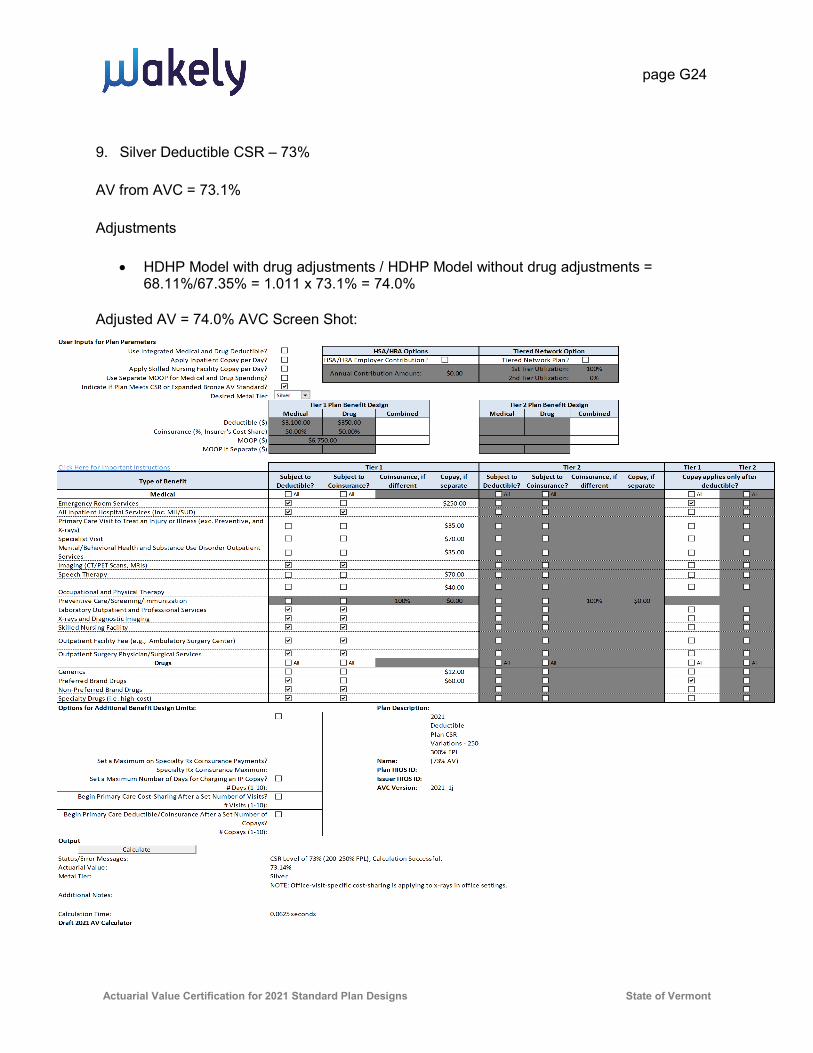
page G24
Actuarial Value Certification for 2021 Standard Plan Designs State of Vermont
9. Silver Deductible CSR – 73%
AV from AVC = 73.1%
Adjustments
• HDHP Model with drug adjustments / HDHP Model without drug adjustments = 68.11%/67.35% = 1.011 x 73.1% = 74.0%
Adjusted AV = 74.0% AVC Screen Shot:
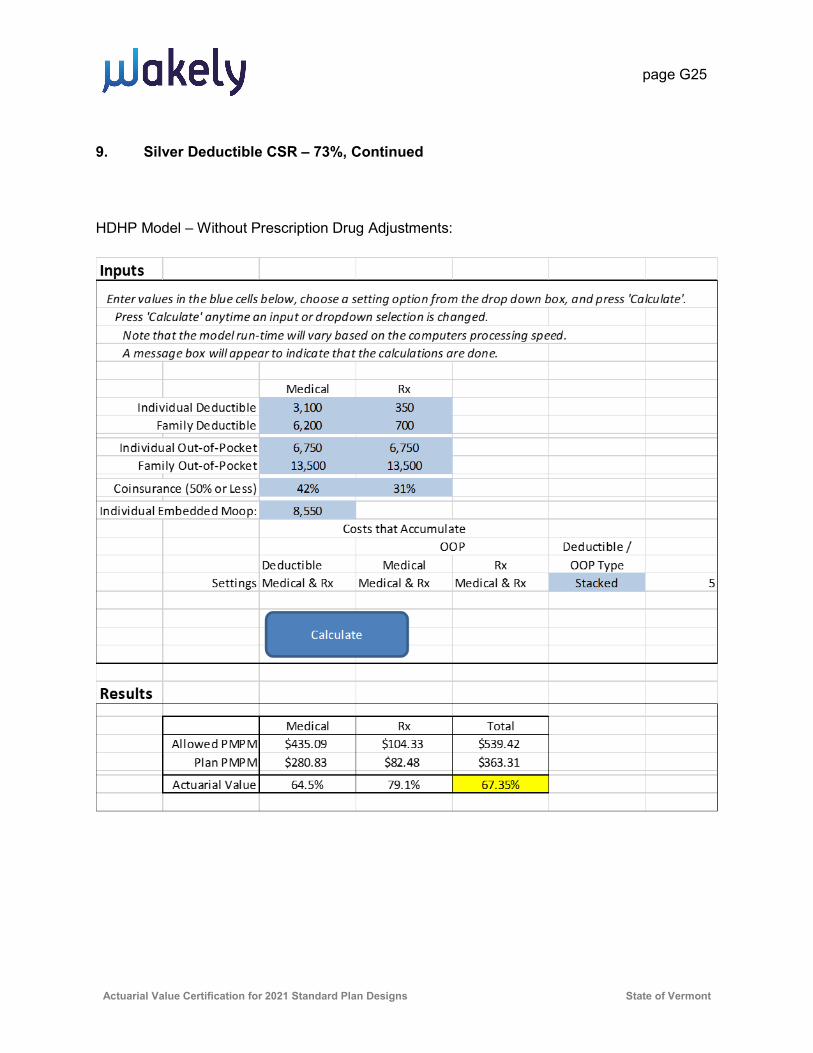
page G25
Actuarial Value Certification for 2021 Standard Plan Designs State of Vermont
9. Silver Deductible CSR – 73%, Continued
HDHP Model – Without Prescription Drug Adjustments:

page G26
Actuarial Value Certification for 2021 Standard Plan Designs State of Vermont
9. Silver Deductible CSR – 73%, Continued
HDHP Model – With Prescription Drug Adjustments:
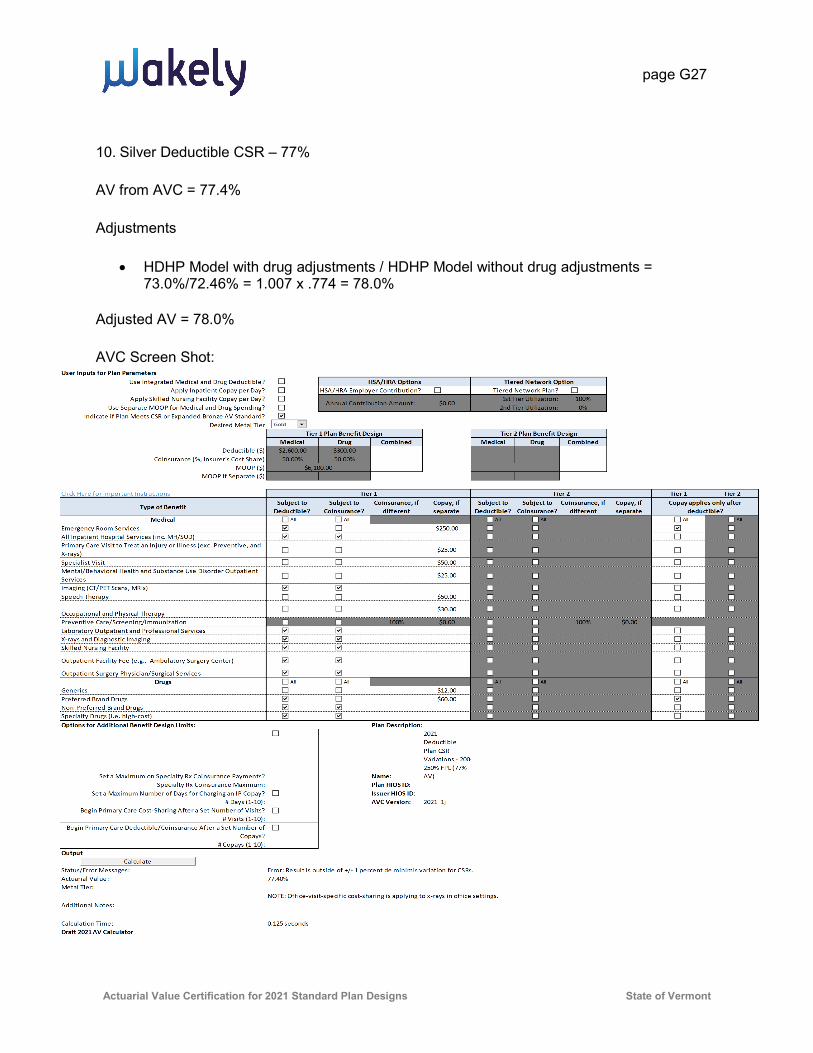
page G27
Actuarial Value Certification for 2021 Standard Plan Designs State of Vermont
10. Silver Deductible CSR – 77%
AV from AVC = 77.4%
Adjustments
• HDHP Model with drug adjustments / HDHP Model without drug adjustments = 73.0%/72.46% = 1.007 x .774 = 78.0%
Adjusted AV = 78.0%
AVC Screen Shot:

page G28
Actuarial Value Certification for 2021 Standard Plan Designs State of Vermont
10. Silver Deductible CSR – 77%, Continued
HDHP Model – Without Prescription Drug Adjustments:

page G29
Actuarial Value Certification for 2021 Standard Plan Designs State of Vermont
10. Silver Deductible CSR – 77%, Continued
HDHP Model – With Prescription Drug Adjustments:
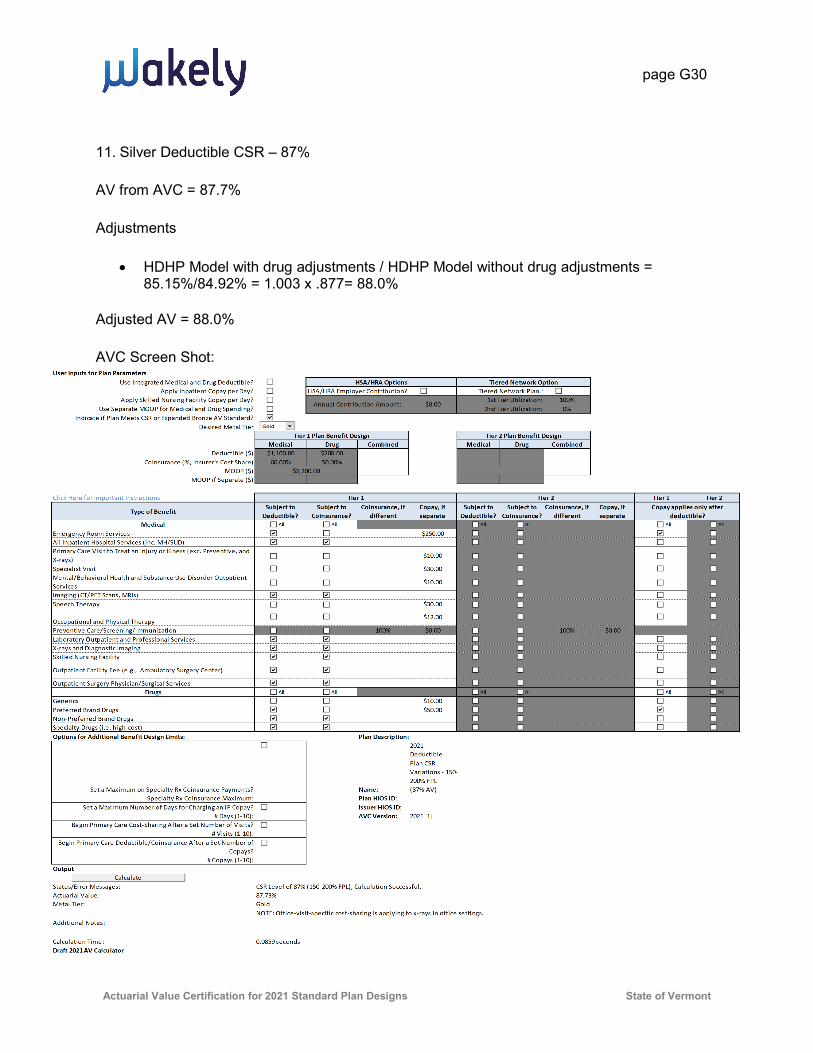
page G30
Actuarial Value Certification for 2021 Standard Plan Designs State of Vermont
11. Silver Deductible CSR – 87%
AV from AVC = 87.7%
Adjustments
• HDHP Model with drug adjustments / HDHP Model without drug adjustments = 85.15%/84.92% = 1.003 x .877= 88.0%
Adjusted AV = 88.0%
AVC Screen Shot:

page G31
Actuarial Value Certification for 2021 Standard Plan Designs State of Vermont
11. Silver Deductible CSR – 87%, Continued
HDHP Model – Without Prescription Drug Adjustments:
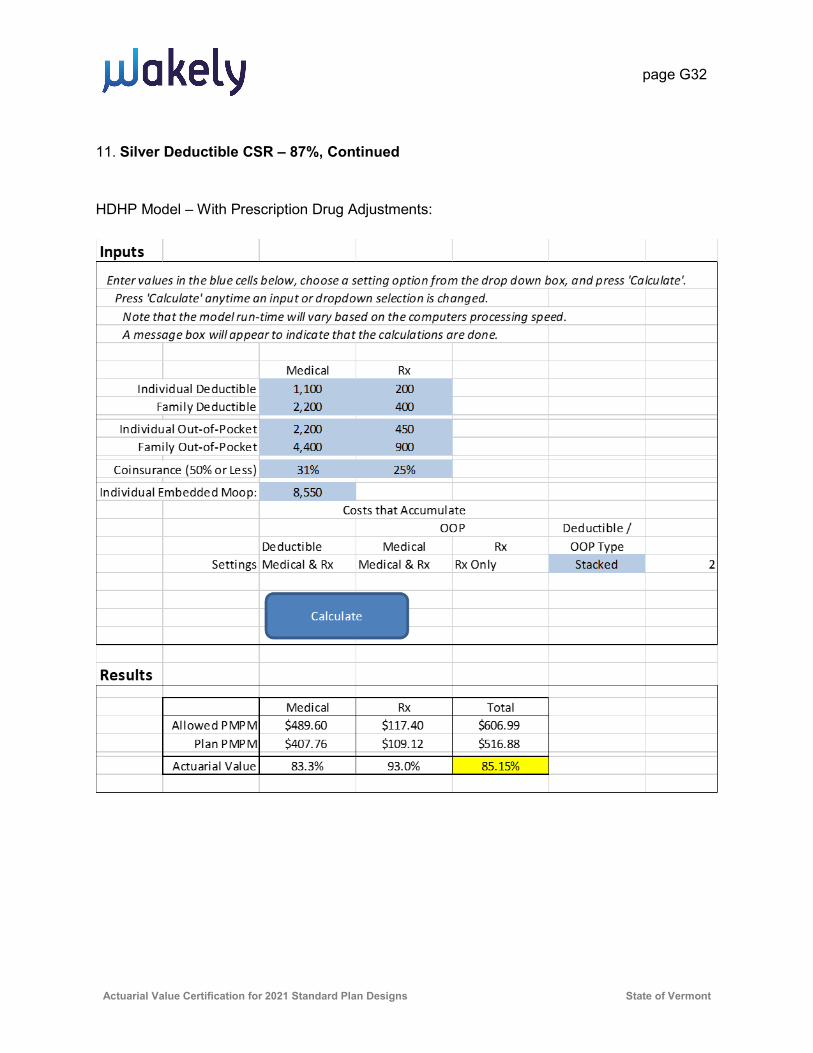
page G32
Actuarial Value Certification for 2021 Standard Plan Designs State of Vermont
11. Silver Deductible CSR – 87%, Continued
HDHP Model – With Prescription Drug Adjustments:

page G33
Actuarial Value Certification for 2021 Standard Plan Designs State of Vermont
12. Silver Deductible CSR – 94%
AV from AVC = 94.7%
Adjustments
• HDHP Model with drug adjustments / HDHP Model without drug adjustments = 94.62%/94.47% = 1.002 x .947 = 94.8%
Adjusted AV = 94.8%
AVC Screen Shot: User Inputs for Plan Parameters
Use Integrated Medical and Drug Deductible?Apply Inpatient Copay per Day? HSA/HRA Employer Contribution? Tiered Network Plan?
Apply Skilled Nursing Facility Copay per Day? 100%Use Separate MOOP for Medical and Drug Spending? 0%
Indicate if Plan Meets CSR or Expanded Bronze AV Standard?Desired Metal Tier
Medical Drug Combined Medical Drug CombinedDeductible ($) $200.00 $0.00
Coinsurance (%, Insurer's Cost Share) 90.00% 70.00%MOOP ($)
MOOP if Separate ($)
Click Here for Important Instructions Tier 1 Tier 2
Type of BenefitSubject to
Deductible?Subject to
Coinsurance?Coinsurance, if
differentCopay, if separate
Subject to Deductible?
Subject to Coinsurance?
Coinsurance, if different
Copay, if separate
MedicalEmergency Room Services $75.00All Inpatient Hospital Services (inc. MH/SUD)Primary Care Visit to Treat an Injury or Illness (exc. Preventive, and X-rays)
$5.00
Specialist Visit $15.00Mental/Behavioral Health and Substance Use Disorder Outpatient Services
$5.00
Imaging (CT/PET Scans, MRIs)Speech Therapy $15.00
Occupational and Physical Therapy$7.00
Preventive Care/Screening/Immunization 100% $0.00 100% $0.00Laboratory Outpatient and Professional ServicesX-rays and Diagnostic ImagingSkilled Nursing Facility
Outpatient Facility Fee (e.g., Ambulatory Surgery Center)
Outpatient Surgery Physician/Surgical ServicesDrugs
Generics $5.00Preferred Brand Drugs $20.00Non-Preferred Brand DrugsSpecialty Drugs (i.e. high-cost)Options for Additional Benefit Design Limits: Plan Description:
Set a Maximum on Specialty Rx Coinsurance Payments? Name:
2020 Deductible Plan CSR Variations - 133-150% FPL(94% AV)
Specialty Rx Coinsurance Maximum: Plan HIOS ID:Set a Maximum Number of Days for Charging an IP Copay? Issuer HIOS ID:
# Days (1-10):Begin Primary Care Cost-Sharing After a Set Number of Visits?
# Visits (1-10): Begin Primary Care Deductible/Coinsurance After a Set Number of
Copays?# Copays (1-10):
Output
Status/Error Messages: CSR Level of 94% (100-150% FPL), Calculation Successful.Actuarial Value: 94.84%Metal Tier: Platinum
Additional Notes:
Calculation Time: 0.0938 secondsDraft 2020 AV Calculator
NOTE: Office-visit-specific cost-sharing is applying to x-rays in office settings.
Copay applies only after deductible?
HSA/HRA Options Tiered Network Option
Annual Contribution Amount: $0.002nd Tier Utilization:1st Tier Utilization:
Tier 1 Plan Benefit Design Tier 2 Plan Benefit Design
Tier 1 Tier 2
$900.00
Calculate
All
All
All
All
All
All
All
All
All All
All All
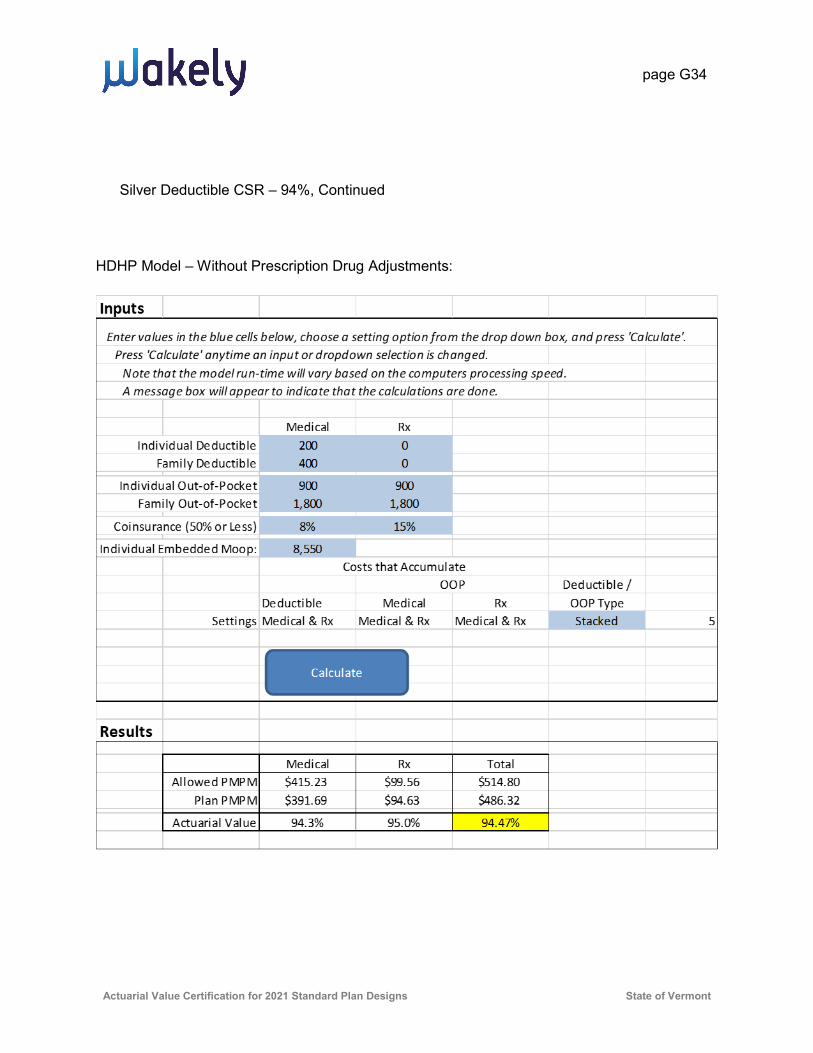
page G34
Actuarial Value Certification for 2021 Standard Plan Designs State of Vermont
Silver Deductible CSR – 94%, Continued
HDHP Model – Without Prescription Drug Adjustments:
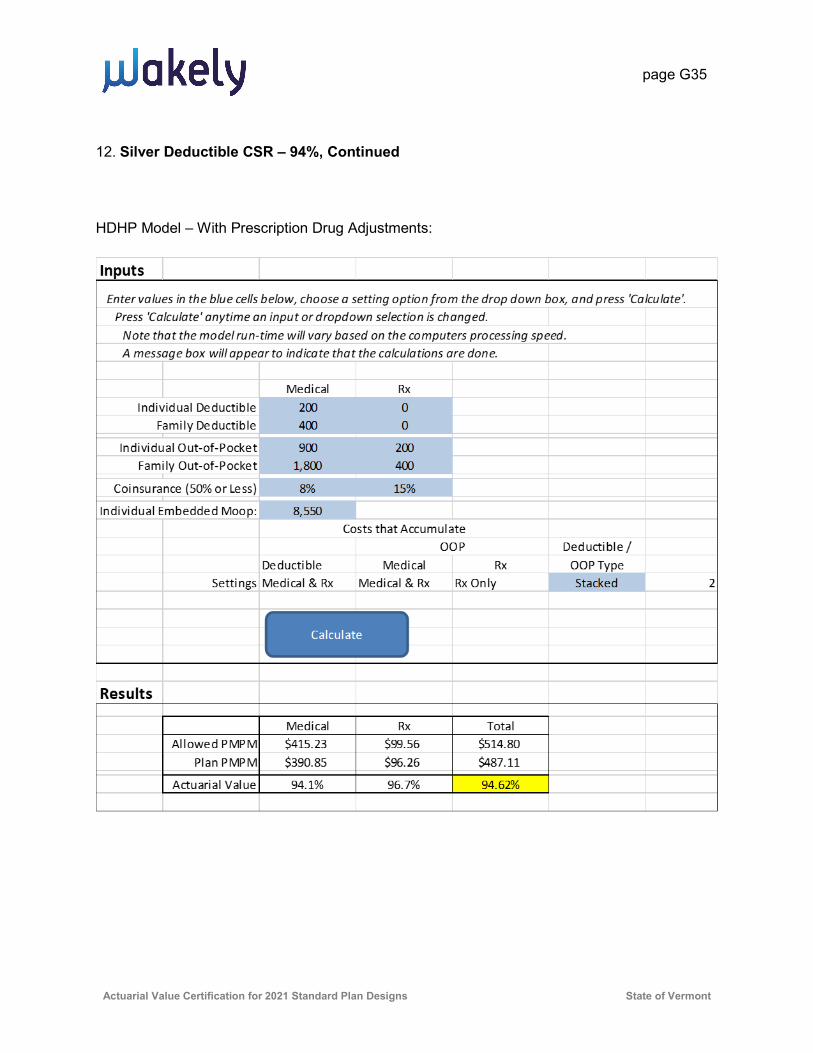
page G35
Actuarial Value Certification for 2021 Standard Plan Designs State of Vermont
12. Silver Deductible CSR – 94%, Continued
HDHP Model – With Prescription Drug Adjustments:

BLUE CROSS AND BLUE SHIELD OF VERMONT 2021 VERMONT INDIVIDUAL AND SMALL GROUP PLANS
METAL ACTUARIAL VALUES CERTIFICATION
1 | P a g e
Introduction
On March 6, 2020, CMS released the final methodology on the Actuarial Value and the final
Actuarial Value Calculator (AVC) for 2021. CMS made significant changes in the 2021 AVC.
Most notably, they updated the base claims data to a radically different distribution and
included additional spending buckets in the continuance tables.
Limitations of the Federal Actuarial Calculator
The AVC is known to have some limitations with respect to certain benefit designs. The most
important limitations in the Final Actuarial Value Calculator for BCBSVT Non-Standard plans
are:
The AVC does not support the Rx OOPM Limit as dictated by Act 171.
The AVC does not support Wellness (Safe Harbor) pharmacy drugs outside the deductible
on HSA compliant plans.
The AVC does not support certain MH/SA visits at no cost share before the deductible.
The AVC does not support a specific copayment on, Chiropractic Services, Physical
Therapy, Urgent Care, Emergency Medical Transportation, DME services nor Home Health
Care.
The AVC does not support Class I Pediatric Dental covered at no cost share.
The AVC does not support the new value-added benefits for members with diabetes or
heart disease
Method Used to Calculate Adjustments
The objective of the adjustment process is to produce an estimate of the result the AVC
would have produced with respect to the specific plan in question had it been able to
measure all cost sharing elements for that plan. We created a model to calculate the ratio of
expected benefits to allowed charges. See the description of the BCBSVT AV Model (BAVM)
below. We used the BAVM to calculate both the complete benefit design and the benefit
design for items supported by the AVC. We then applied the ratio of the two values to the
AVC output for items supported by the AVC.
BCBSVT AV Model Methodology
BCBSVT uses a re-adjudication model to assess the impact of various deductible types, Rx
limits, and out-of-pocket maximums to calculate the paid-to-allowed ratio for different
benefit designs. The re-adjudication is performed using the same set of claims for all benefit
plans. Claims data was taken from BCBSVT’s data warehouse. The starting point of the
analysis is allowed charges as determined by the BCBSVT claims adjudication system. The
claims data includes benefit codes that enable us to identify the services and benefit
structures (copays, deductibles, and coinsurance). The 2018 claims from BCBSVT Vermont
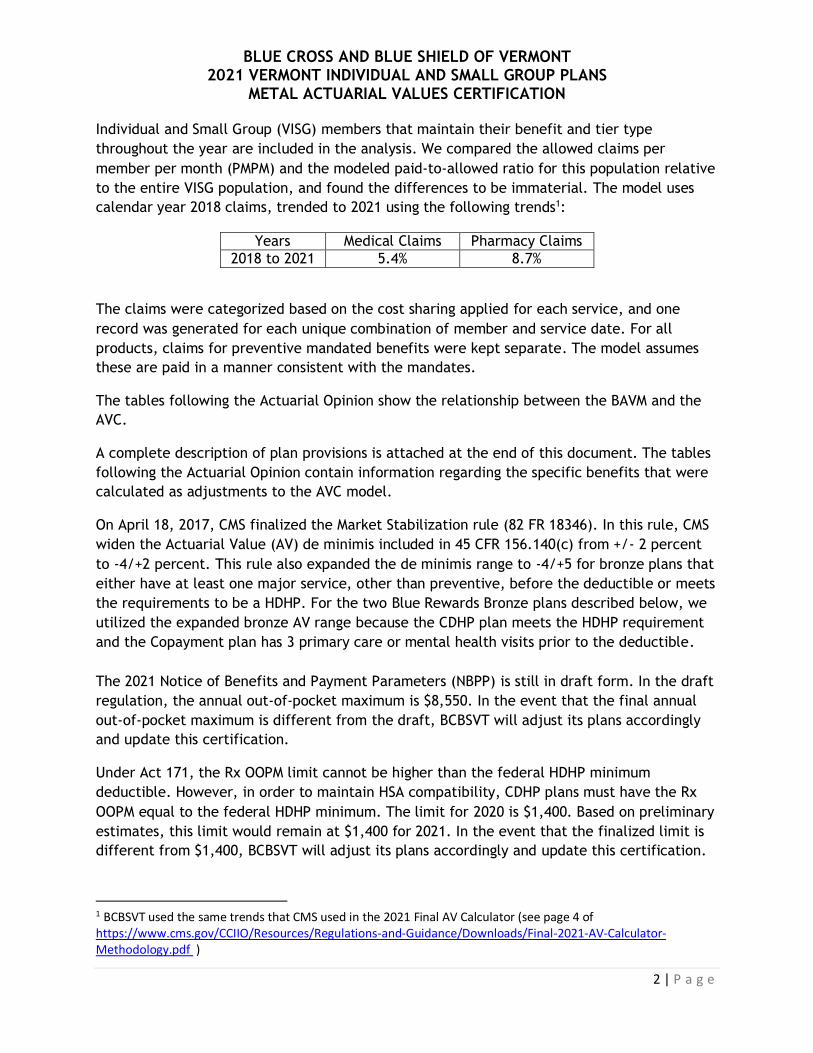
BLUE CROSS AND BLUE SHIELD OF VERMONT 2021 VERMONT INDIVIDUAL AND SMALL GROUP PLANS
METAL ACTUARIAL VALUES CERTIFICATION
2 | P a g e
Individual and Small Group (VISG) members that maintain their benefit and tier type
throughout the year are included in the analysis. We compared the allowed claims per
member per month (PMPM) and the modeled paid-to-allowed ratio for this population relative
to the entire VISG population, and found the differences to be immaterial. The model uses
calendar year 2018 claims, trended to 2021 using the following trends1:
Years Medical Claims Pharmacy Claims
2018 to 2021 5.4% 8.7%
The claims were categorized based on the cost sharing applied for each service, and one
record was generated for each unique combination of member and service date. For all
products, claims for preventive mandated benefits were kept separate. The model assumes
these are paid in a manner consistent with the mandates.
The tables following the Actuarial Opinion show the relationship between the BAVM and the
AVC.
A complete description of plan provisions is attached at the end of this document. The tables
following the Actuarial Opinion contain information regarding the specific benefits that were
calculated as adjustments to the AVC model.
On April 18, 2017, CMS finalized the Market Stabilization rule (82 FR 18346). In this rule, CMS
widen the Actuarial Value (AV) de minimis included in 45 CFR 156.140(c) from +/- 2 percent
to -4/+2 percent. This rule also expanded the de minimis range to -4/+5 for bronze plans that
either have at least one major service, other than preventive, before the deductible or meets
the requirements to be a HDHP. For the two Blue Rewards Bronze plans described below, we
utilized the expanded bronze AV range because the CDHP plan meets the HDHP requirement
and the Copayment plan has 3 primary care or mental health visits prior to the deductible.
The 2021 Notice of Benefits and Payment Parameters (NBPP) is still in draft form. In the draft
regulation, the annual out-of-pocket maximum is $8,550. In the event that the final annual
out-of-pocket maximum is different from the draft, BCBSVT will adjust its plans accordingly
and update this certification.
Under Act 171, the Rx OOPM limit cannot be higher than the federal HDHP minimum
deductible. However, in order to maintain HSA compatibility, CDHP plans must have the Rx
OOPM equal to the federal HDHP minimum. The limit for 2020 is $1,400. Based on preliminary
estimates, this limit would remain at $1,400 for 2021. In the event that the finalized limit is
different from $1,400, BCBSVT will adjust its plans accordingly and update this certification.
1 BCBSVT used the same trends that CMS used in the 2021 Final AV Calculator (see page 4 of https://www.cms.gov/CCIIO/Resources/Regulations-and-Guidance/Downloads/Final-2021-AV-Calculator-Methodology.pdf )

BLUE CROSS AND BLUE SHIELD OF VERMONT 2021 VERMONT INDIVIDUAL AND SMALL GROUP PLANS
METAL ACTUARIAL VALUES CERTIFICATION
3 | P a g e
Actuarial Opinion
The purpose of this calculation is to comply with the requirements of 45 CFR 156.135(b)(3).
The Actuarial Values were determined based on the plans’ benefits and coverage data, the
standard population, utilization and continuance tables published by HHS for purposes of
valuation of Actuarial Value. These calculations are not intended to be used for other
purposes.
I am an Associate of the Society of Actuaries, a Member of the American Academy of
Actuaries, meet the Qualification Standards for Actuaries Issuing Statements of Actuarial
Opinion in the United Stated promulgated by the American Academy of Actuaries, and have
the education and experience necessary to perform the work.
In my opinion, each of the plans described herein meets the AV requirements in the metal
tiers for calendar year 2021.
The adjustments for plan design features unable to be determined directly through
application of the AV calculator were developed in accordance with generally accepted
actuarial principals and methodologies, Actuarial Standards of Practice established by the
Actuarial Standards Board, and applicable laws and regulations, and are appropriate for the
purpose intended.
Data used for the analysis were taken from the BCBSVT claims adjudication system, and
normalized to the data underlying the AV calculator. This data was reviewed for
reasonableness and consistency, but an audit was not performed.
_________________________ Martine Lemieux, A.S.A., M.A.A.A.
Associate Actuary
Blue Cross and Blue Shield of Vermont
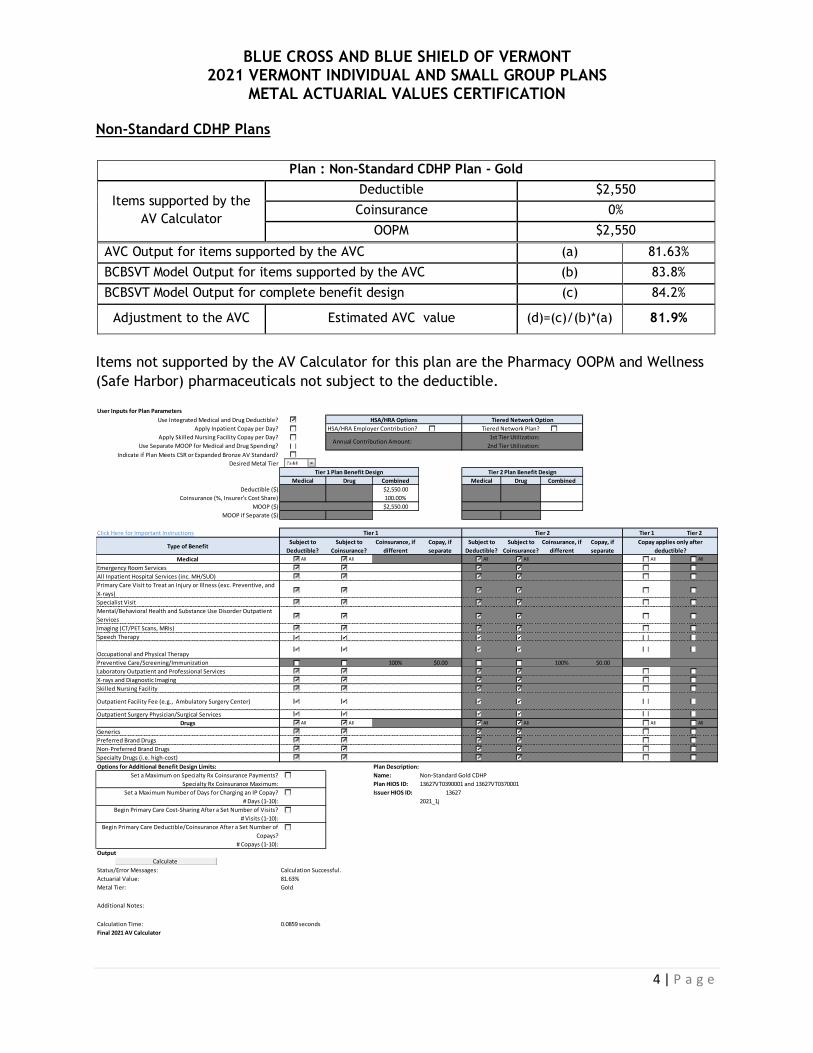
BLUE CROSS AND BLUE SHIELD OF VERMONT 2021 VERMONT INDIVIDUAL AND SMALL GROUP PLANS
METAL ACTUARIAL VALUES CERTIFICATION
4 | P a g e
Non-Standard CDHP Plans
Plan : Non-Standard CDHP Plan - Gold
Items supported by the
AV Calculator
Deductible $2,550
Coinsurance 0%
OOPM $2,550
AVC Output for items supported by the AVC (a) 81.63%
BCBSVT Model Output for items supported by the AVC (b) 83.8%
BCBSVT Model Output for complete benefit design (c) 84.2%
Adjustment to the AVC Estimated AVC value (d)=(c)/(b)*(a) 81.9%
Items not supported by the AV Calculator for this plan are the Pharmacy OOPM and Wellness
(Safe Harbor) pharmaceuticals not subject to the deductible.
User Inputs for Plan Parameters
Use Integrated Medical and Drug Deductible?
Apply Inpatient Copay per Day? HSA/HRA Employer Contribution? Tiered Network Plan?
Apply Skilled Nursing Facility Copay per Day?
Use Separate MOOP for Medical and Drug Spending?
Indicate if Plan Meets CSR or Expanded Bronze AV Standard?
Desired Metal Tier
Medical Drug Combined Medical Drug Combined
Deductible ($) $2,550.00
Coinsurance (%, Insurer's Cost Share) 100.00%
MOOP ($) $2,550.00
MOOP if Separate ($)
Click Here for Important Instructions Tier 1 Tier 2
Type of BenefitSubject to
Deductible?
Subject to
Coinsurance?
Coinsurance, if
different
Copay, if
separate
Subject to
Deductible?
Subject to
Coinsurance?
Coinsurance, if
different
Copay, if
separate
Medical
Emergency Room Services
All Inpatient Hospital Services (inc. MH/SUD)
Primary Care Visit to Treat an Injury or Illness (exc. Preventive, and
X-rays)
Specialist Visit
Mental/Behavioral Health and Substance Use Disorder Outpatient
Services
Imaging (CT/PET Scans, MRIs)
Speech Therapy
Occupational and Physical Therapy
Preventive Care/Screening/Immunization 100% $0.00 100% $0.00
Laboratory Outpatient and Professional Services
X-rays and Diagnostic Imaging
Skilled Nursing Facility
Outpatient Facility Fee (e.g., Ambulatory Surgery Center)
Outpatient Surgery Physician/Surgical Services
Drugs
Generics
Preferred Brand Drugs
Non-Preferred Brand Drugs
Specialty Drugs (i.e. high-cost)
Options for Additional Benefit Design Limits: Plan Description:
Set a Maximum on Specialty Rx Coinsurance Payments? Name: Non-Standard Gold CDHP
Specialty Rx Coinsurance Maximum: Plan HIOS ID: 13627VT0390001 and 13627VT0370001
Set a Maximum Number of Days for Charging an IP Copay? Issuer HIOS ID: 13627
# Days (1-10): 2021_1j
Begin Primary Care Cost-Sharing After a Set Number of Visits?
# Visits (1-10):
Begin Primary Care Deductible/Coinsurance After a Set Number of
Copays?
# Copays (1-10):
Output
Status/Error Messages: Calculation Successful.
Actuarial Value: 81.63%
Metal Tier: Gold
Additional Notes:
Calculation Time: 0.0859 seconds
Final 2021 AV Calculator
Copay applies only after
deductible?
HSA/HRA Options Tiered Network Option
Annual Contribution Amount:2nd Tier Utilization:
1st Tier Utilization:
Tier 1 Plan Benefit Design Tier 2 Plan Benefit Design
Tier 1 Tier 2
Calculate
All
All
All
All
All
All
All
All
All All
All All
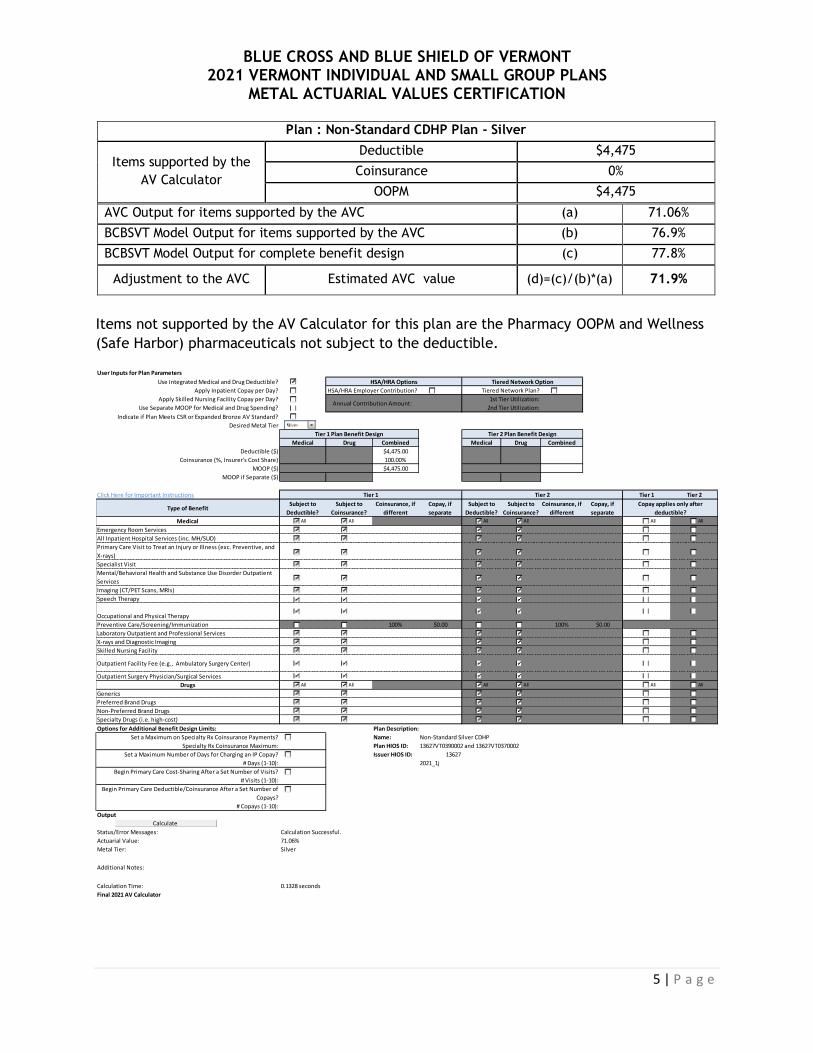
BLUE CROSS AND BLUE SHIELD OF VERMONT 2021 VERMONT INDIVIDUAL AND SMALL GROUP PLANS
METAL ACTUARIAL VALUES CERTIFICATION
5 | P a g e
Plan : Non-Standard CDHP Plan - Silver
Items supported by the
AV Calculator
Deductible $4,475
Coinsurance 0%
OOPM $4,475
AVC Output for items supported by the AVC (a) 71.06%
BCBSVT Model Output for items supported by the AVC (b) 76.9%
BCBSVT Model Output for complete benefit design (c) 77.8%
Adjustment to the AVC Estimated AVC value (d)=(c)/(b)*(a) 71.9%
Items not supported by the AV Calculator for this plan are the Pharmacy OOPM and Wellness
(Safe Harbor) pharmaceuticals not subject to the deductible.
User Inputs for Plan Parameters
Use Integrated Medical and Drug Deductible?
Apply Inpatient Copay per Day? HSA/HRA Employer Contribution? Tiered Network Plan?
Apply Skilled Nursing Facility Copay per Day?
Use Separate MOOP for Medical and Drug Spending?
Indicate if Plan Meets CSR or Expanded Bronze AV Standard?
Desired Metal Tier
Medical Drug Combined Medical Drug Combined
Deductible ($) $4,475.00
Coinsurance (%, Insurer's Cost Share) 100.00%
MOOP ($) $4,475.00
MOOP if Separate ($)
Click Here for Important Instructions Tier 1 Tier 2
Type of BenefitSubject to
Deductible?
Subject to
Coinsurance?
Coinsurance, if
different
Copay, if
separate
Subject to
Deductible?
Subject to
Coinsurance?
Coinsurance, if
different
Copay, if
separate
Medical
Emergency Room Services
All Inpatient Hospital Services (inc. MH/SUD)
Primary Care Visit to Treat an Injury or Illness (exc. Preventive, and
X-rays)
Specialist Visit
Mental/Behavioral Health and Substance Use Disorder Outpatient
Services
Imaging (CT/PET Scans, MRIs)
Speech Therapy
Occupational and Physical Therapy
Preventive Care/Screening/Immunization 100% $0.00 100% $0.00
Laboratory Outpatient and Professional Services
X-rays and Diagnostic Imaging
Skilled Nursing Facility
Outpatient Facility Fee (e.g., Ambulatory Surgery Center)
Outpatient Surgery Physician/Surgical Services
Drugs
Generics
Preferred Brand Drugs
Non-Preferred Brand Drugs
Specialty Drugs (i.e. high-cost)
Options for Additional Benefit Design Limits: Plan Description:
Set a Maximum on Specialty Rx Coinsurance Payments? Name: Non-Standard Silver CDHP
Specialty Rx Coinsurance Maximum: Plan HIOS ID: 13627VT0390002 and 13627VT0370002
Set a Maximum Number of Days for Charging an IP Copay? Issuer HIOS ID: 13627
# Days (1-10): 2021_1j
Begin Primary Care Cost-Sharing After a Set Number of Visits?
# Visits (1-10):
Begin Primary Care Deductible/Coinsurance After a Set Number of
Copays?
# Copays (1-10):
Output
Status/Error Messages: Calculation Successful.
Actuarial Value: 71.06%
Metal Tier: Silver
Additional Notes:
Calculation Time: 0.1328 seconds
Final 2021 AV Calculator
Copay applies only after
deductible?
HSA/HRA Options Tiered Network Option
Annual Contribution Amount:2nd Tier Utilization:
1st Tier Utilization:
Tier 1 Plan Benefit Design Tier 2 Plan Benefit Design
Tier 1 Tier 2
Calculate
All
All
All
All
All
All
All
All
All All
All All

BLUE CROSS AND BLUE SHIELD OF VERMONT 2021 VERMONT INDIVIDUAL AND SMALL GROUP PLANS
METAL ACTUARIAL VALUES CERTIFICATION
6 | P a g e
Plan : Non-Standard CDHP Plan – Silver 73% CSR
Items supported by the
AV Calculator
Deductible $3,850
Coinsurance 0%
OOPM $3,850
AVC Output for items supported by the AVC (a) 73.34%
BCBSVT Model Output for items supported by the AVC (b) 78.9%
BCBSVT Model Output for complete benefit design (c) 79.6%
Adjustment to the AVC Estimated AVC value (d)=(c)/(b)*(a) 74.0%
Items not supported by the AV Calculator for this plan are the Pharmacy OOPM and Wellness
(Safe Harbor) pharmaceuticals not subject to the deductible.
User Inputs for Plan Parameters
Use Integrated Medical and Drug Deductible?
Apply Inpatient Copay per Day? HSA/HRA Employer Contribution? Tiered Network Plan?
Apply Skilled Nursing Facility Copay per Day?
Use Separate MOOP for Medical and Drug Spending?
Indicate if Plan Meets CSR or Expanded Bronze AV Standard?
Desired Metal Tier
Medical Drug Combined Medical Drug Combined
Deductible ($) $3,850.00
Coinsurance (%, Insurer's Cost Share) 100.00%
MOOP ($) $3,850.00
MOOP if Separate ($)
Click Here for Important Instructions Tier 1 Tier 2
Type of BenefitSubject to
Deductible?
Subject to
Coinsurance?
Coinsurance, if
different
Copay, if
separate
Subject to
Deductible?
Subject to
Coinsurance?
Coinsurance, if
different
Copay, if
separate
Medical
Emergency Room Services
All Inpatient Hospital Services (inc. MH/SUD)
Primary Care Visit to Treat an Injury or Illness (exc. Preventive, and
X-rays)
Specialist Visit
Mental/Behavioral Health and Substance Use Disorder Outpatient
Services
Imaging (CT/PET Scans, MRIs)
Speech Therapy
Occupational and Physical Therapy
Preventive Care/Screening/Immunization 100% $0.00 100% $0.00
Laboratory Outpatient and Professional Services
X-rays and Diagnostic Imaging
Skilled Nursing Facility
Outpatient Facility Fee (e.g., Ambulatory Surgery Center)
Outpatient Surgery Physician/Surgical Services
Drugs
Generics
Preferred Brand Drugs
Non-Preferred Brand Drugs
Specialty Drugs (i.e. high-cost)
Options for Additional Benefit Design Limits: Plan Description:
Set a Maximum on Specialty Rx Coinsurance Payments? Name: Non-Standard Silver CDHP - 73%
Specialty Rx Coinsurance Maximum: Plan HIOS ID: 13627VT0390002 and 13627VT0370002
Set a Maximum Number of Days for Charging an IP Copay? Issuer HIOS ID: 13627
# Days (1-10): 2021_1j
Begin Primary Care Cost-Sharing After a Set Number of Visits?
# Visits (1-10):
Begin Primary Care Deductible/Coinsurance After a Set Number of
Copays?
# Copays (1-10):
Output
Status/Error Messages: CSR Level of 73% (200-250% FPL), Calculation Successful.
Actuarial Value: 73.34%
Metal Tier: Silver
Additional Notes:
Calculation Time: 0.1133 seconds
Final 2021 AV Calculator
Copay applies only after
deductible?
HSA/HRA Options Tiered Network Option
Annual Contribution Amount:2nd Tier Utilization:
1st Tier Utilization:
Tier 1 Plan Benefit Design Tier 2 Plan Benefit Design
Tier 1 Tier 2
Calculate
All
All
All
All
All
All
All
All
All All
All All

BLUE CROSS AND BLUE SHIELD OF VERMONT 2021 VERMONT INDIVIDUAL AND SMALL GROUP PLANS
METAL ACTUARIAL VALUES CERTIFICATION
7 | P a g e
Plan : Non-Standard CDHP Plan – Silver 77% CSR
Items supported by the
AV Calculator
Deductible $2,900
Coinsurance 0%
OOPM $2,900
AVC Output for items supported by the AVC (a) 77.35%
BCBSVT Model Output for items supported by the AVC (b) 82.4%
BCBSVT Model Output for complete benefit design (c) 82.8%
Adjustment to the AVC Estimated AVC value (d)=(c)/(b)*(a) 77.7%
Items not supported by the AV Calculator for this plan are the Pharmacy OOPM and Wellness
(Safe Harbor) pharmaceuticals not subject to the deductible.
User Inputs for Plan Parameters
Use Integrated Medical and Drug Deductible?
Apply Inpatient Copay per Day? HSA/HRA Employer Contribution? Tiered Network Plan?
Apply Skilled Nursing Facility Copay per Day?
Use Separate MOOP for Medical and Drug Spending?
Indicate if Plan Meets CSR or Expanded Bronze AV Standard?
Desired Metal Tier
Medical Drug Combined Medical Drug Combined
Deductible ($) $2,900.00
Coinsurance (%, Insurer's Cost Share) 100.00%
MOOP ($) $2,900.00
MOOP if Separate ($)
Click Here for Important Instructions Tier 1 Tier 2
Type of BenefitSubject to
Deductible?
Subject to
Coinsurance?
Coinsurance, if
different
Copay, if
separate
Subject to
Deductible?
Subject to
Coinsurance?
Coinsurance, if
different
Copay, if
separate
Medical
Emergency Room Services
All Inpatient Hospital Services (inc. MH/SUD)
Primary Care Visit to Treat an Injury or Illness (exc. Preventive, and
X-rays)
Specialist Visit
Mental/Behavioral Health and Substance Use Disorder Outpatient
Services
Imaging (CT/PET Scans, MRIs)
Speech Therapy
Occupational and Physical Therapy
Preventive Care/Screening/Immunization 100% $0.00 100% $0.00
Laboratory Outpatient and Professional Services
X-rays and Diagnostic Imaging
Skilled Nursing Facility
Outpatient Facility Fee (e.g., Ambulatory Surgery Center)
Outpatient Surgery Physician/Surgical Services
Drugs
Generics
Preferred Brand Drugs
Non-Preferred Brand Drugs
Specialty Drugs (i.e. high-cost)
Options for Additional Benefit Design Limits: Plan Description:
Set a Maximum on Specialty Rx Coinsurance Payments? Name: Non-Standard Silver CDHP - 77%
Specialty Rx Coinsurance Maximum: Plan HIOS ID: 13627VT0390002 and 13627VT0370002
Set a Maximum Number of Days for Charging an IP Copay? Issuer HIOS ID: 13627
# Days (1-10): 2021_1j
Begin Primary Care Cost-Sharing After a Set Number of Visits?
# Visits (1-10):
Begin Primary Care Deductible/Coinsurance After a Set Number of
Copays?
# Copays (1-10):
Output
Status/Error Messages: Error: Result is outside of +/- 1 percent de minimis variation for CSRs.
Actuarial Value: 77.35%
Metal Tier:
Additional Notes:
Calculation Time: 0.1172 seconds
Final 2021 AV Calculator
Copay applies only after
deductible?
HSA/HRA Options Tiered Network Option
Annual Contribution Amount:2nd Tier Utilization:
1st Tier Utilization:
Tier 1 Plan Benefit Design Tier 2 Plan Benefit Design
Tier 1 Tier 2
Calculate
All
All
All
All
All
All
All
All
All All
All All

BLUE CROSS AND BLUE SHIELD OF VERMONT 2021 VERMONT INDIVIDUAL AND SMALL GROUP PLANS
METAL ACTUARIAL VALUES CERTIFICATION
8 | P a g e
Plan : Non-Standard CDHP Plan – Silver 87% CSR
Items supported by the
AV Calculator
Deductible $1,450
Coinsurance 0%
OOPM $1,450
AVC Output for items supported by the AVC (a) 87.66%
BCBSVT Model Output for items supported by the AVC (b) 89.1%
BCBSVT Model Output for complete benefit design (c) 89.2%
Adjustment to the AVC Estimated AVC value (d)=(c)/(b)*(a) 87.7%
Items not supported by the AV Calculator for this plan are Wellness (Safe Harbor)
pharmaceuticals not subject to the deductible.
User Inputs for Plan Parameters
Use Integrated Medical and Drug Deductible?
Apply Inpatient Copay per Day? HSA/HRA Employer Contribution? Tiered Network Plan?
Apply Skilled Nursing Facility Copay per Day?
Use Separate MOOP for Medical and Drug Spending?
Indicate if Plan Meets CSR or Expanded Bronze AV Standard?
Desired Metal Tier
Medical Drug Combined Medical Drug Combined
Deductible ($) $1,450.00
Coinsurance (%, Insurer's Cost Share) 100.00%
MOOP ($) $1,450.00
MOOP if Separate ($)
Click Here for Important Instructions Tier 1 Tier 2
Type of BenefitSubject to
Deductible?
Subject to
Coinsurance?
Coinsurance, if
different
Copay, if
separate
Subject to
Deductible?
Subject to
Coinsurance?
Coinsurance, if
different
Copay, if
separate
Medical
Emergency Room Services
All Inpatient Hospital Services (inc. MH/SUD)
Primary Care Visit to Treat an Injury or Illness (exc. Preventive, and
X-rays)
Specialist Visit
Mental/Behavioral Health and Substance Use Disorder Outpatient
Services
Imaging (CT/PET Scans, MRIs)
Speech Therapy
Occupational and Physical Therapy
Preventive Care/Screening/Immunization 100% $0.00 100% $0.00
Laboratory Outpatient and Professional Services
X-rays and Diagnostic Imaging
Skilled Nursing Facility
Outpatient Facility Fee (e.g., Ambulatory Surgery Center)
Outpatient Surgery Physician/Surgical Services
Drugs
Generics
Preferred Brand Drugs
Non-Preferred Brand Drugs
Specialty Drugs (i.e. high-cost)
Options for Additional Benefit Design Limits: Plan Description:
Set a Maximum on Specialty Rx Coinsurance Payments? Name: Non-Standard Silver CDHP - 87%
Specialty Rx Coinsurance Maximum: Plan HIOS ID: 13627VT0390002 and 13627VT0370002
Set a Maximum Number of Days for Charging an IP Copay? Issuer HIOS ID: 13627
# Days (1-10): 2021_1j
Begin Primary Care Cost-Sharing After a Set Number of Visits?
# Visits (1-10):
Begin Primary Care Deductible/Coinsurance After a Set Number of
Copays?
# Copays (1-10):
Output
Status/Error Messages: CSR Level of 87% (150-200% FPL), Calculation Successful.
Actuarial Value: 87.66%
Metal Tier: Gold
Additional Notes:
Calculation Time: 0.1055 seconds
Final 2021 AV Calculator
Copay applies only after
deductible?
HSA/HRA Options Tiered Network Option
Annual Contribution Amount:2nd Tier Utilization:
1st Tier Utilization:
Tier 1 Plan Benefit Design Tier 2 Plan Benefit Design
Tier 1 Tier 2
Calculate
All
All
All
All
All
All
All
All
All All
All All

BLUE CROSS AND BLUE SHIELD OF VERMONT 2021 VERMONT INDIVIDUAL AND SMALL GROUP PLANS
METAL ACTUARIAL VALUES CERTIFICATION
9 | P a g e
Plan : Non-Standard CDHP Plan – Silver 94% CSR
Items supported by the
AV Calculator
Deductible $550
Coinsurance 0%
OOPM $550
AVC Output for items supported by the AVC (a) 93.76%
BCBSVT Model Output for items supported by the AVC (b) 94.97%
BCBSVT Model Output for complete benefit design (c) 94.99%
Adjustment to the AVC Estimated AVC value (d)=(c)/(b)*(a) 93.8%
Items not supported by the AV Calculator for this plan are Wellness (Safe Harbor)
pharmaceuticals not subject to the deductible.
User Inputs for Plan Parameters
Use Integrated Medical and Drug Deductible?
Apply Inpatient Copay per Day? HSA/HRA Employer Contribution? Tiered Network Plan?
Apply Skilled Nursing Facility Copay per Day?
Use Separate MOOP for Medical and Drug Spending?
Indicate if Plan Meets CSR or Expanded Bronze AV Standard?
Desired Metal Tier
Medical Drug Combined Medical Drug Combined
Deductible ($) $550.00
Coinsurance (%, Insurer's Cost Share) 100.00%
MOOP ($) $550.00
MOOP if Separate ($)
Click Here for Important Instructions Tier 1 Tier 2
Type of BenefitSubject to
Deductible?
Subject to
Coinsurance?
Coinsurance, if
different
Copay, if
separate
Subject to
Deductible?
Subject to
Coinsurance?
Coinsurance, if
different
Copay, if
separate
Medical
Emergency Room Services
All Inpatient Hospital Services (inc. MH/SUD)
Primary Care Visit to Treat an Injury or Illness (exc. Preventive, and
X-rays)
Specialist Visit
Mental/Behavioral Health and Substance Use Disorder Outpatient
Services
Imaging (CT/PET Scans, MRIs)
Speech Therapy
Occupational and Physical Therapy
Preventive Care/Screening/Immunization 100% $0.00 100% $0.00
Laboratory Outpatient and Professional Services
X-rays and Diagnostic Imaging
Skilled Nursing Facility
Outpatient Facility Fee (e.g., Ambulatory Surgery Center)
Outpatient Surgery Physician/Surgical Services
Drugs
Generics
Preferred Brand Drugs
Non-Preferred Brand Drugs
Specialty Drugs (i.e. high-cost)
Options for Additional Benefit Design Limits: Plan Description:
Set a Maximum on Specialty Rx Coinsurance Payments? Name: Non-Standard Silver CDHP - 94%
Specialty Rx Coinsurance Maximum: Plan HIOS ID: 13627VT0390002 and 13627VT0370002
Set a Maximum Number of Days for Charging an IP Copay? Issuer HIOS ID: 13627
# Days (1-10): 2021_1j
Begin Primary Care Cost-Sharing After a Set Number of Visits?
# Visits (1-10):
Begin Primary Care Deductible/Coinsurance After a Set Number of
Copays?
# Copays (1-10):
Output
Status/Error Messages: CSR Level of 94% (100-150% FPL), Calculation Successful.
Actuarial Value: 93.76%
Metal Tier: Platinum
Additional Notes:
Calculation Time: 0.1133 seconds
Final 2021 AV Calculator
Copay applies only after
deductible?
HSA/HRA Options Tiered Network Option
Annual Contribution Amount:2nd Tier Utilization:
1st Tier Utilization:
Tier 1 Plan Benefit Design Tier 2 Plan Benefit Design
Tier 1 Tier 2
Calculate
All
All
All
All
All
All
All
All
All All
All All
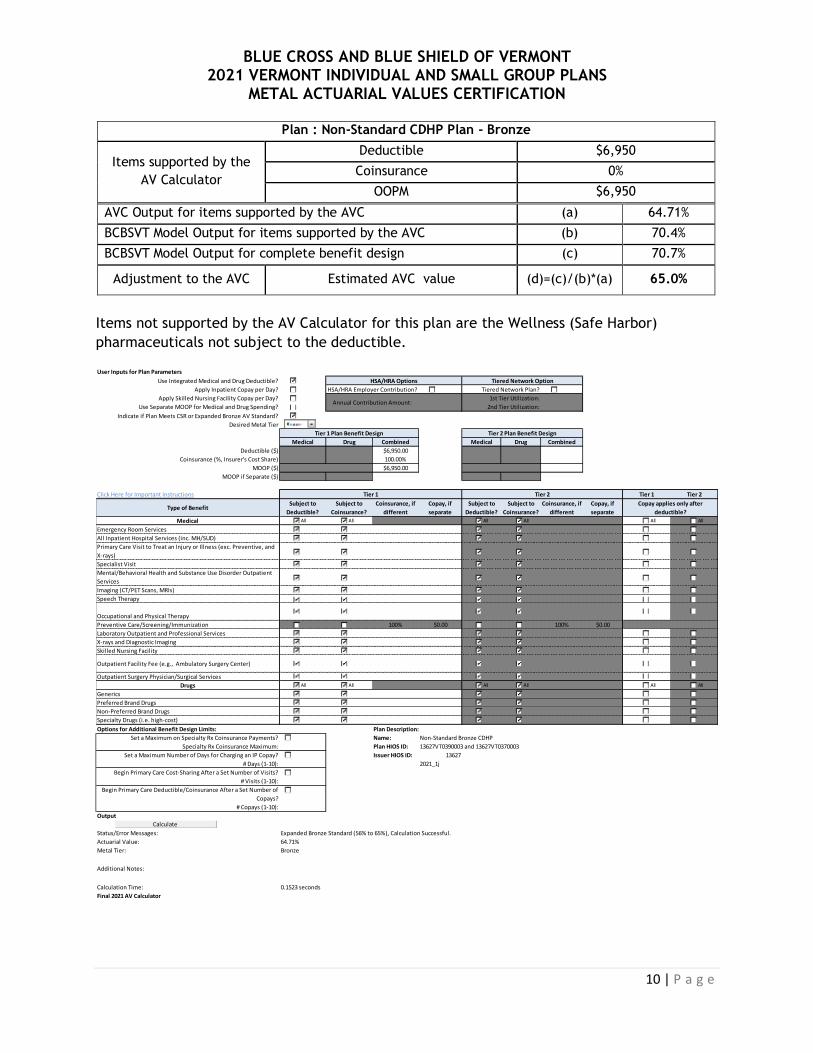
BLUE CROSS AND BLUE SHIELD OF VERMONT 2021 VERMONT INDIVIDUAL AND SMALL GROUP PLANS
METAL ACTUARIAL VALUES CERTIFICATION
10 | P a g e
Plan : Non-Standard CDHP Plan - Bronze
Items supported by the
AV Calculator
Deductible $6,950
Coinsurance 0%
OOPM $6,950
AVC Output for items supported by the AVC (a) 64.71%
BCBSVT Model Output for items supported by the AVC (b) 70.4%
BCBSVT Model Output for complete benefit design (c) 70.7%
Adjustment to the AVC Estimated AVC value (d)=(c)/(b)*(a) 65.0%
Items not supported by the AV Calculator for this plan are the Wellness (Safe Harbor)
pharmaceuticals not subject to the deductible.
User Inputs for Plan Parameters
Use Integrated Medical and Drug Deductible?
Apply Inpatient Copay per Day? HSA/HRA Employer Contribution? Tiered Network Plan?
Apply Skilled Nursing Facility Copay per Day?
Use Separate MOOP for Medical and Drug Spending?
Indicate if Plan Meets CSR or Expanded Bronze AV Standard?
Desired Metal Tier
Medical Drug Combined Medical Drug Combined
Deductible ($) $6,950.00
Coinsurance (%, Insurer's Cost Share) 100.00%
MOOP ($) $6,950.00
MOOP if Separate ($)
Click Here for Important Instructions Tier 1 Tier 2
Type of BenefitSubject to
Deductible?
Subject to
Coinsurance?
Coinsurance, if
different
Copay, if
separate
Subject to
Deductible?
Subject to
Coinsurance?
Coinsurance, if
different
Copay, if
separate
Medical
Emergency Room Services
All Inpatient Hospital Services (inc. MH/SUD)
Primary Care Visit to Treat an Injury or Illness (exc. Preventive, and
X-rays)
Specialist Visit
Mental/Behavioral Health and Substance Use Disorder Outpatient
Services
Imaging (CT/PET Scans, MRIs)
Speech Therapy
Occupational and Physical Therapy
Preventive Care/Screening/Immunization 100% $0.00 100% $0.00
Laboratory Outpatient and Professional Services
X-rays and Diagnostic Imaging
Skilled Nursing Facility
Outpatient Facility Fee (e.g., Ambulatory Surgery Center)
Outpatient Surgery Physician/Surgical Services
Drugs
Generics
Preferred Brand Drugs
Non-Preferred Brand Drugs
Specialty Drugs (i.e. high-cost)
Options for Additional Benefit Design Limits: Plan Description:
Set a Maximum on Specialty Rx Coinsurance Payments? Name: Non-Standard Bronze CDHP
Specialty Rx Coinsurance Maximum: Plan HIOS ID: 13627VT0390003 and 13627VT0370003
Set a Maximum Number of Days for Charging an IP Copay? Issuer HIOS ID: 13627
# Days (1-10): 2021_1j
Begin Primary Care Cost-Sharing After a Set Number of Visits?
# Visits (1-10):
Begin Primary Care Deductible/Coinsurance After a Set Number of
Copays?
# Copays (1-10):
Output
Status/Error Messages: Expanded Bronze Standard (56% to 65%), Calculation Successful.
Actuarial Value: 64.71%
Metal Tier: Bronze
Additional Notes:
Calculation Time: 0.1523 seconds
Final 2021 AV Calculator
Copay applies only after
deductible?
HSA/HRA Options Tiered Network Option
Annual Contribution Amount:2nd Tier Utilization:
1st Tier Utilization:
Tier 1 Plan Benefit Design Tier 2 Plan Benefit Design
Tier 1 Tier 2
Calculate
All
All
All
All
All
All
All
All
All All
All All

BLUE CROSS AND BLUE SHIELD OF VERMONT 2021 VERMONT INDIVIDUAL AND SMALL GROUP PLANS
METAL ACTUARIAL VALUES CERTIFICATION
11 | P a g e
Plan : Non-Standard CDHP Plan – Silver Reflective
Items supported by the
AV Calculator
Deductible $4,500
Coinsurance 0%
OOPM $4,500
AVC Output for items supported by the AVC (a) 70.98%
BCBSVT Model Output for items supported by the AVC (b) 76.8%
BCBSVT Model Output for complete benefit design (c) 77.7%
Adjustment to the AVC Estimated AVC value (d)=(c)/(b)*(a) 71.7%
Items not supported by the AV Calculator for this plan are the Wellness (Safe Harbor)
pharmaceuticals not subject to the deductible.
User Inputs for Plan Parameters
Use Integrated Medical and Drug Deductible?
Apply Inpatient Copay per Day? HSA/HRA Employer Contribution? Tiered Network Plan?
Apply Skilled Nursing Facility Copay per Day?
Use Separate MOOP for Medical and Drug Spending?
Indicate if Plan Meets CSR or Expanded Bronze AV Standard?
Desired Metal Tier
Medical Drug Combined Medical Drug Combined
Deductible ($) $4,500.00
Coinsurance (%, Insurer's Cost Share) 100.00%
MOOP ($) $4,500.00
MOOP if Separate ($)
Click Here for Important Instructions Tier 1 Tier 2
Type of BenefitSubject to
Deductible?
Subject to
Coinsurance?
Coinsurance, if
different
Copay, if
separate
Subject to
Deductible?
Subject to
Coinsurance?
Coinsurance, if
different
Copay, if
separate
Medical
Emergency Room Services
All Inpatient Hospital Services (inc. MH/SUD)
Primary Care Visit to Treat an Injury or Illness (exc. Preventive, and
X-rays)
Specialist Visit
Mental/Behavioral Health and Substance Use Disorder Outpatient
Services
Imaging (CT/PET Scans, MRIs)
Speech Therapy
Occupational and Physical Therapy
Preventive Care/Screening/Immunization 100% $0.00 100% $0.00
Laboratory Outpatient and Professional Services
X-rays and Diagnostic Imaging
Skilled Nursing Facility
Outpatient Facility Fee (e.g., Ambulatory Surgery Center)
Outpatient Surgery Physician/Surgical Services
Drugs
Generics
Preferred Brand Drugs
Non-Preferred Brand Drugs
Specialty Drugs (i.e. high-cost)
Options for Additional Benefit Design Limits: Plan Description:
Set a Maximum on Specialty Rx Coinsurance Payments? Name: Non-Standard Silver CDHP Reflective
Specialty Rx Coinsurance Maximum: Plan HIOS ID: 13627VT0390004 and 13627VT0370004
Set a Maximum Number of Days for Charging an IP Copay? Issuer HIOS ID: 13627
# Days (1-10): 2021_1j
Begin Primary Care Cost-Sharing After a Set Number of Visits?
# Visits (1-10):
Begin Primary Care Deductible/Coinsurance After a Set Number of
Copays?
# Copays (1-10):
Output
Status/Error Messages: Calculation Successful.
Actuarial Value: 70.98%
Metal Tier: Silver
Additional Notes:
Calculation Time: 0.1211 seconds
Final 2021 AV Calculator
Copay applies only after
deductible?
HSA/HRA Options Tiered Network Option
Annual Contribution Amount:2nd Tier Utilization:
1st Tier Utilization:
Tier 1 Plan Benefit Design Tier 2 Plan Benefit Design
Tier 1 Tier 2
Calculate
All
All
All
All
All
All
All
All
All All
All All
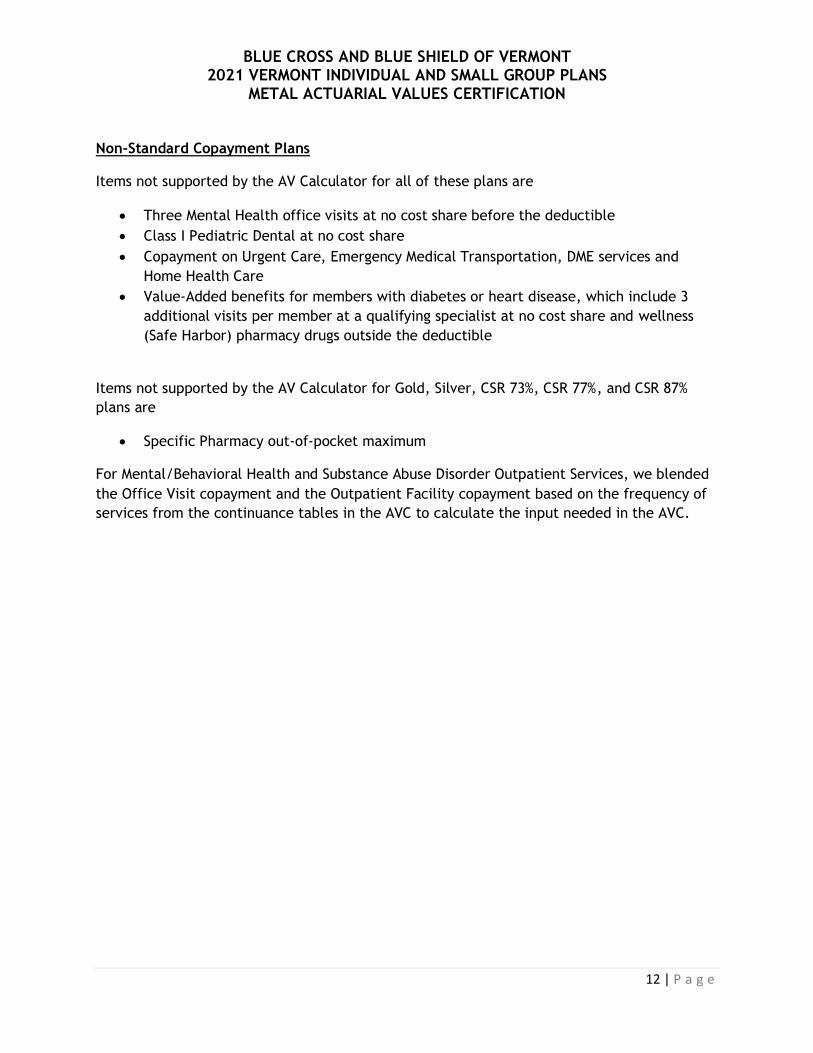
BLUE CROSS AND BLUE SHIELD OF VERMONT 2021 VERMONT INDIVIDUAL AND SMALL GROUP PLANS
METAL ACTUARIAL VALUES CERTIFICATION
12 | P a g e
Non-Standard Copayment Plans
Items not supported by the AV Calculator for all of these plans are
Three Mental Health office visits at no cost share before the deductible
Class I Pediatric Dental at no cost share
Copayment on Urgent Care, Emergency Medical Transportation, DME services and
Home Health Care
Value-Added benefits for members with diabetes or heart disease, which include 3
additional visits per member at a qualifying specialist at no cost share and wellness
(Safe Harbor) pharmacy drugs outside the deductible
Items not supported by the AV Calculator for Gold, Silver, CSR 73%, CSR 77%, and CSR 87%
plans are
Specific Pharmacy out-of-pocket maximum
For Mental/Behavioral Health and Substance Abuse Disorder Outpatient Services, we blended
the Office Visit copayment and the Outpatient Facility copayment based on the frequency of
services from the continuance tables in the AVC to calculate the input needed in the AVC.

BLUE CROSS AND BLUE SHIELD OF VERMONT 2021 VERMONT INDIVIDUAL AND SMALL GROUP PLANS
METAL ACTUARIAL VALUES CERTIFICATION
13 | P a g e
Plan: Non-Standard Copayment Plan – Gold
Items supported
by the AV
Calculator
Deductible $1,550
Coinsurance 0%
OOPM $5,150
Copayments after the deductible See print below
PCP visits at no cost share before the deductible 3
AVC Output for items supported by the AVC (a) 77.74%
BCBSVT Model Output for items supported by the AVC (b) 83.3%
BCBSVT Model Output for complete benefit design (c) 84.5%
Estimated AVC value (d)=(c)/(b)*(a) 78.9%
User Inputs for Plan Parameters
Use Integrated Medical and Drug Deductible?
Apply Inpatient Copay per Day? HSA/HRA Employer Contribution? Tiered Network Plan?
Apply Skilled Nursing Facility Copay per Day?
Use Separate MOOP for Medical and Drug Spending?
Indicate if Plan Meets CSR or Expanded Bronze AV Standard?
Desired Metal Tier
Medical Drug Combined Medical Drug Combined
Deductible ($) $1,550.00
Coinsurance (%, Insurer's Cost Share) 100.00%
MOOP ($) $5,150.00
MOOP if Separate ($)
Click Here for Important Instructions Tier 1 Tier 2
Type of BenefitSubject to
Deductible?
Subject to
Coinsurance?
Coinsurance, if
different
Copay, if
separate
Subject to
Deductible?
Subject to
Coinsurance?
Coinsurance, if
different
Copay, if
separate
Medical
Emergency Room Services $250.00
All Inpatient Hospital Services (inc. MH/SUD) $750.00
Primary Care Visit to Treat an Injury or Illness (exc. Preventive, and
X-rays)$20.00
Specialist Visit $40.00
Mental/Behavioral Health and Substance Use Disorder Outpatient
Services$19.00
Imaging (CT/PET Scans, MRIs) $750.00
Speech Therapy $40.00
Occupational and Physical Therapy$30.00
Preventive Care/Screening/Immunization 100% $0.00 100% $0.00
Laboratory Outpatient and Professional Services $40.00
X-rays and Diagnostic Imaging $40.00
Skilled Nursing Facility $750.00
Outpatient Facility Fee (e.g., Ambulatory Surgery Center) $750.00
Outpatient Surgery Physician/Surgical Services
Drugs
Generics $5.00
Preferred Brand Drugs 60%
Non-Preferred Brand Drugs 40%
Specialty Drugs (i.e. high-cost) 60%
Options for Additional Benefit Design Limits: Plan Description:
Set a Maximum on Specialty Rx Coinsurance Payments? Name: Non-Standard Gold
Specialty Rx Coinsurance Maximum: Plan HIOS ID: 13627VT0380001 and 13627VT0360001
Set a Maximum Number of Days for Charging an IP Copay? Issuer HIOS ID: 13627
# Days (1-10): 2021_1j
Begin Primary Care Cost-Sharing After a Set Number of Visits?
# Visits (1-10): 3
Begin Primary Care Deductible/Coinsurance After a Set Number of
Copays?
# Copays (1-10):
Output
Status/Error Messages: Calculation Successful.
Actuarial Value: 77.74%
Metal Tier: Gold
Additional Notes:
Calculation Time: 0.0586 seconds
Final 2021 AV Calculator
NOTE: Service-specific cost-sharing is applying for service(s) with fac/prof components, overriding outpatient inputs for those service(s).
Copay applies only after
deductible?
HSA/HRA Options Tiered Network Option
Annual Contribution Amount:2nd Tier Utilization:
1st Tier Utilization:
Tier 1 Plan Benefit Design Tier 2 Plan Benefit Design
Tier 1 Tier 2
Calculate
All
All
All
All
All
All
All
All
All All
All All

BLUE CROSS AND BLUE SHIELD OF VERMONT 2021 VERMONT INDIVIDUAL AND SMALL GROUP PLANS
METAL ACTUARIAL VALUES CERTIFICATION
14 | P a g e
Plan: Non-Standard Copayment Plan – Silver
Items supported
by the AV
Calculator
Deductible $3,000
Coinsurance 0%
OOPM $8,150
Copayments after the deductible See print below
PCP visits at no cost share before the deductible 3
AVC Output for items supported by the AVC (a) 67.68%
BCBSVT Model Output for items supported by the AVC (b) 75.5%
BCBSVT Model Output for complete benefit design (c) 77.7%
Estimated AVC value (d)=(c)/(b)*(a) 69.6%
User Inputs for Plan Parameters
Use Integrated Medical and Drug Deductible?
Apply Inpatient Copay per Day? HSA/HRA Employer Contribution? Tiered Network Plan?
Apply Skilled Nursing Facility Copay per Day?
Use Separate MOOP for Medical and Drug Spending?
Indicate if Plan Meets CSR or Expanded Bronze AV Standard?
Desired Metal Tier
Medical Drug Combined Medical Drug Combined
Deductible ($) $3,000.00
Coinsurance (%, Insurer's Cost Share) 100.00%
MOOP ($) $8,150.00
MOOP if Separate ($)
Click Here for Important Instructions Tier 1 Tier 2
Type of BenefitSubject to
Deductible?
Subject to
Coinsurance?
Coinsurance, if
different
Copay, if
separate
Subject to
Deductible?
Subject to
Coinsurance?
Coinsurance, if
different
Copay, if
separate
Medical
Emergency Room Services $450.00
All Inpatient Hospital Services (inc. MH/SUD) $1,750.00
Primary Care Visit to Treat an Injury or Illness (exc. Preventive, and
X-rays)$30.00
Specialist Visit $50.00
Mental/Behavioral Health and Substance Use Disorder Outpatient
Services$29.00
Imaging (CT/PET Scans, MRIs) $1,750.00
Speech Therapy $50.00
Occupational and Physical Therapy$35.00
Preventive Care/Screening/Immunization 100% $0.00 100% $0.00
Laboratory Outpatient and Professional Services $50.00
X-rays and Diagnostic Imaging $50.00
Skilled Nursing Facility $1,750.00
Outpatient Facility Fee (e.g., Ambulatory Surgery Center) $1,750.00
Outpatient Surgery Physician/Surgical Services
Drugs
Generics $5.00
Preferred Brand Drugs 60%
Non-Preferred Brand Drugs 40%
Specialty Drugs (i.e. high-cost) 60%
Options for Additional Benefit Design Limits: Plan Description:
Set a Maximum on Specialty Rx Coinsurance Payments? Name: Non-Standard Silver
Specialty Rx Coinsurance Maximum: Plan HIOS ID: 13627VT0380002 and 13627VT0360002
Set a Maximum Number of Days for Charging an IP Copay? Issuer HIOS ID: 13627
# Days (1-10): 2021_1j
Begin Primary Care Cost-Sharing After a Set Number of Visits?
# Visits (1-10): 3
Begin Primary Care Deductible/Coinsurance After a Set Number of
Copays?
# Copays (1-10):
Output
Status/Error Messages: Calculation Successful.
Actuarial Value: 67.68%
Metal Tier: Silver
Additional Notes:
Calculation Time: 0.0547 seconds
Final 2021 AV Calculator
NOTE: Service-specific cost-sharing is applying for service(s) with fac/prof components, overriding outpatient inputs for those service(s).
Copay applies only after
deductible?
HSA/HRA Options Tiered Network Option
Annual Contribution Amount:2nd Tier Utilization:
1st Tier Utilization:
Tier 1 Plan Benefit Design Tier 2 Plan Benefit Design
Tier 1 Tier 2
Calculate
All
All
All
All
All
All
All
All
All All
All All
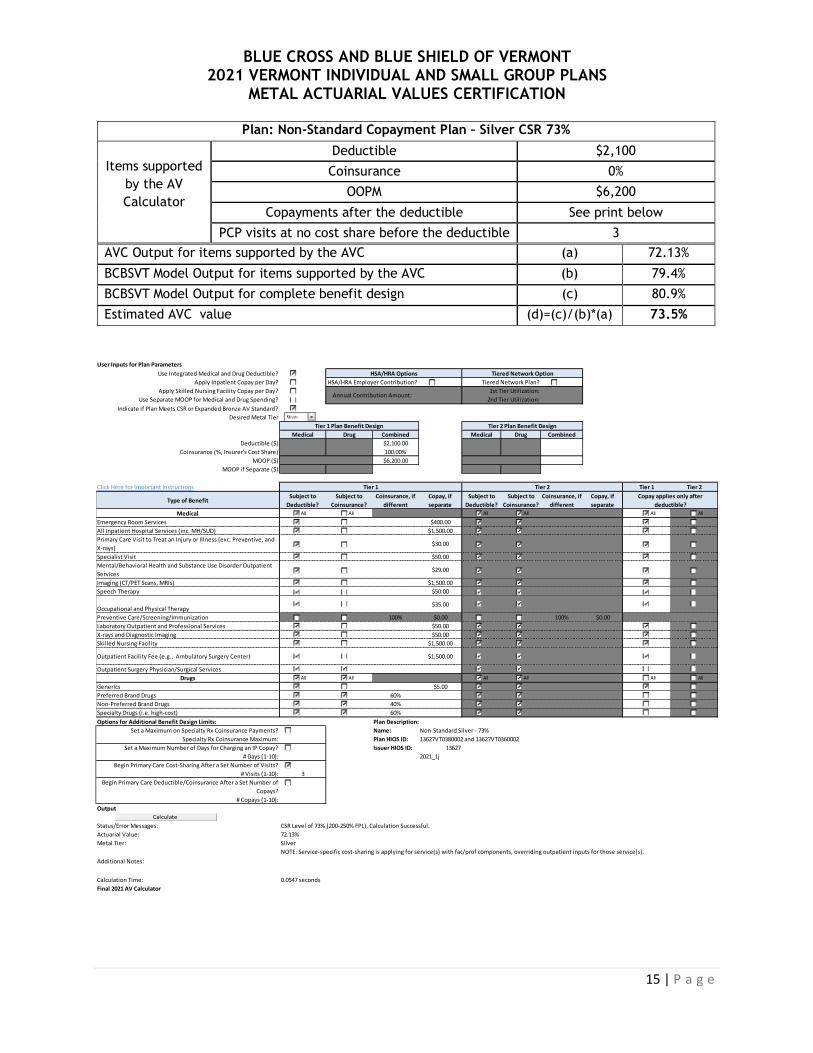
BLUE CROSS AND BLUE SHIELD OF VERMONT 2021 VERMONT INDIVIDUAL AND SMALL GROUP PLANS
METAL ACTUARIAL VALUES CERTIFICATION
15 | P a g e
Plan: Non-Standard Copayment Plan – Silver CSR 73%
Items supported
by the AV
Calculator
Deductible $2,100
Coinsurance 0%
OOPM $6,200
Copayments after the deductible See print below
PCP visits at no cost share before the deductible 3
AVC Output for items supported by the AVC (a) 72.13%
BCBSVT Model Output for items supported by the AVC (b) 79.4%
BCBSVT Model Output for complete benefit design (c) 80.9%
Estimated AVC value (d)=(c)/(b)*(a) 73.5%
User Inputs for Plan Parameters
Use Integrated Medical and Drug Deductible?
Apply Inpatient Copay per Day? HSA/HRA Employer Contribution? Tiered Network Plan?
Apply Skilled Nursing Facility Copay per Day?
Use Separate MOOP for Medical and Drug Spending?
Indicate if Plan Meets CSR or Expanded Bronze AV Standard?
Desired Metal Tier
Medical Drug Combined Medical Drug Combined
Deductible ($) $2,100.00
Coinsurance (%, Insurer's Cost Share) 100.00%
MOOP ($) $6,200.00
MOOP if Separate ($)
Click Here for Important Instructions Tier 1 Tier 2
Type of BenefitSubject to
Deductible?
Subject to
Coinsurance?
Coinsurance, if
different
Copay, if
separate
Subject to
Deductible?
Subject to
Coinsurance?
Coinsurance, if
different
Copay, if
separate
Medical
Emergency Room Services $400.00
All Inpatient Hospital Services (inc. MH/SUD) $1,500.00
Primary Care Visit to Treat an Injury or Illness (exc. Preventive, and
X-rays)$30.00
Specialist Visit $50.00
Mental/Behavioral Health and Substance Use Disorder Outpatient
Services$29.00
Imaging (CT/PET Scans, MRIs) $1,500.00
Speech Therapy $50.00
Occupational and Physical Therapy$35.00
Preventive Care/Screening/Immunization 100% $0.00 100% $0.00
Laboratory Outpatient and Professional Services $50.00
X-rays and Diagnostic Imaging $50.00
Skilled Nursing Facility $1,500.00
Outpatient Facility Fee (e.g., Ambulatory Surgery Center) $1,500.00
Outpatient Surgery Physician/Surgical Services
Drugs
Generics $5.00
Preferred Brand Drugs 60%
Non-Preferred Brand Drugs 40%
Specialty Drugs (i.e. high-cost) 60%
Options for Additional Benefit Design Limits: Plan Description:
Set a Maximum on Specialty Rx Coinsurance Payments? Name: Non-Standard Silver - 73%
Specialty Rx Coinsurance Maximum: Plan HIOS ID: 13627VT0380002 and 13627VT0360002
Set a Maximum Number of Days for Charging an IP Copay? Issuer HIOS ID: 13627
# Days (1-10): 2021_1j
Begin Primary Care Cost-Sharing After a Set Number of Visits?
# Visits (1-10): 3
Begin Primary Care Deductible/Coinsurance After a Set Number of
Copays?
# Copays (1-10):
Output
Status/Error Messages: CSR Level of 73% (200-250% FPL), Calculation Successful.
Actuarial Value: 72.13%
Metal Tier: Silver
Additional Notes:
Calculation Time: 0.0547 seconds
Final 2021 AV Calculator
NOTE: Service-specific cost-sharing is applying for service(s) with fac/prof components, overriding outpatient inputs for those service(s).
Copay applies only after
deductible?
HSA/HRA Options Tiered Network Option
Annual Contribution Amount:2nd Tier Utilization:
1st Tier Utilization:
Tier 1 Plan Benefit Design Tier 2 Plan Benefit Design
Tier 1 Tier 2
Calculate
All
All
All
All
All
All
All
All
All All
All All

BLUE CROSS AND BLUE SHIELD OF VERMONT 2021 VERMONT INDIVIDUAL AND SMALL GROUP PLANS
METAL ACTUARIAL VALUES CERTIFICATION
16 | P a g e
Plan: Non-Standard Copayment Plan – Silver CSR 77%
Items supported
by the AV
Calculator
Deductible $1,000
Coinsurance 0%
OOPM $5,200
Copayments after the deductible See print below
PCP visits at no cost share before the deductible 3
AVC Output for items supported by the AVC (a) 76.86%
BCBSVT Model Output for items supported by the AVC (b) 83.7%
BCBSVT Model Output for complete benefit design (c) 84.9%
Estimated AVC value (d)=(c)/(b)*(a) 77.9%
User Inputs for Plan Parameters
Use Integrated Medical and Drug Deductible?
Apply Inpatient Copay per Day? HSA/HRA Employer Contribution? Tiered Network Plan?
Apply Skilled Nursing Facility Copay per Day?
Use Separate MOOP for Medical and Drug Spending?
Indicate if Plan Meets CSR or Expanded Bronze AV Standard?
Desired Metal Tier
Medical Drug Combined Medical Drug Combined
Deductible ($) $1,000.00
Coinsurance (%, Insurer's Cost Share) 100.00%
MOOP ($) $5,200.00
MOOP if Separate ($)
Click Here for Important Instructions Tier 1 Tier 2
Type of BenefitSubject to
Deductible?
Subject to
Coinsurance?
Coinsurance, if
different
Copay, if
separate
Subject to
Deductible?
Subject to
Coinsurance?
Coinsurance, if
different
Copay, if
separate
Medical
Emergency Room Services $400.00
All Inpatient Hospital Services (inc. MH/SUD) $1,500.00
Primary Care Visit to Treat an Injury or Illness (exc. Preventive, and
X-rays)$30.00
Specialist Visit $50.00
Mental/Behavioral Health and Substance Use Disorder Outpatient
Services$29.00
Imaging (CT/PET Scans, MRIs) $1,500.00
Speech Therapy $50.00
Occupational and Physical Therapy$35.00
Preventive Care/Screening/Immunization 100% $0.00 100% $0.00
Laboratory Outpatient and Professional Services $50.00
X-rays and Diagnostic Imaging $50.00
Skilled Nursing Facility $1,500.00
Outpatient Facility Fee (e.g., Ambulatory Surgery Center) $1,500.00
Outpatient Surgery Physician/Surgical Services
Drugs
Generics $5.00
Preferred Brand Drugs 60%
Non-Preferred Brand Drugs 40%
Specialty Drugs (i.e. high-cost) 60%
Options for Additional Benefit Design Limits: Plan Description:
Set a Maximum on Specialty Rx Coinsurance Payments? Name: Non-Standard Silver - 77%
Specialty Rx Coinsurance Maximum: Plan HIOS ID: 13627VT0380002 and 13627VT0360002
Set a Maximum Number of Days for Charging an IP Copay? Issuer HIOS ID: 13627
# Days (1-10): 2021_1j
Begin Primary Care Cost-Sharing After a Set Number of Visits?
# Visits (1-10): 3
Begin Primary Care Deductible/Coinsurance After a Set Number of
Copays?
# Copays (1-10):
Output
Status/Error Messages: Error: Result is outside of +/- 1 percent de minimis variation for CSRs.
Actuarial Value: 76.86%
Metal Tier:
Additional Notes:
Calculation Time: 0.0547 seconds
Final 2021 AV Calculator
NOTE: Service-specific cost-sharing is applying for service(s) with fac/prof components, overriding outpatient inputs for those service(s).
Copay applies only after
deductible?
HSA/HRA Options Tiered Network Option
Annual Contribution Amount:2nd Tier Utilization:
1st Tier Utilization:
Tier 1 Plan Benefit Design Tier 2 Plan Benefit Design
Tier 1 Tier 2
Calculate
All
All
All
All
All
All
All
All
All All
All All

BLUE CROSS AND BLUE SHIELD OF VERMONT 2021 VERMONT INDIVIDUAL AND SMALL GROUP PLANS
METAL ACTUARIAL VALUES CERTIFICATION
17 | P a g e
Plan: Non-Standard Copayment Plan – Silver CSR 87%
Items supported
by the AV
Calculator
Deductible $200
Coinsurance 0%
OOPM $2,400
Copayments after the deductible See print below
PCP visits at no cost share before the deductible 3
AVC Output for items supported by the AVC (a) 87.63%
BCBSVT Model Output for items supported by the AVC (b) 91.7%
BCBSVT Model Output for complete benefit design (c) 92.0%
Estimated AVC value (d)=(c)/(b)*(a) 87.9%
User Inputs for Plan Parameters
Use Integrated Medical and Drug Deductible?
Apply Inpatient Copay per Day? HSA/HRA Employer Contribution? Tiered Network Plan?
Apply Skilled Nursing Facility Copay per Day?
Use Separate MOOP for Medical and Drug Spending?
Indicate if Plan Meets CSR or Expanded Bronze AV Standard?
Desired Metal Tier
Medical Drug Combined Medical Drug Combined
Deductible ($) $200.00
Coinsurance (%, Insurer's Cost Share) 100.00%
MOOP ($) $2,400.00
MOOP if Separate ($)
Click Here for Important Instructions Tier 1 Tier 2
Type of BenefitSubject to
Deductible?
Subject to
Coinsurance?
Coinsurance, if
different
Copay, if
separate
Subject to
Deductible?
Subject to
Coinsurance?
Coinsurance, if
different
Copay, if
separate
Medical
Emergency Room Services $250.00
All Inpatient Hospital Services (inc. MH/SUD) $500.00
Primary Care Visit to Treat an Injury or Illness (exc. Preventive, and
X-rays)$30.00
Specialist Visit $50.00
Mental/Behavioral Health and Substance Use Disorder Outpatient
Services$29.00
Imaging (CT/PET Scans, MRIs) $500.00
Speech Therapy $50.00
Occupational and Physical Therapy$35.00
Preventive Care/Screening/Immunization 100% $0.00 100% $0.00
Laboratory Outpatient and Professional Services $50.00
X-rays and Diagnostic Imaging $50.00
Skilled Nursing Facility $500.00
Outpatient Facility Fee (e.g., Ambulatory Surgery Center) $500.00
Outpatient Surgery Physician/Surgical Services
Drugs
Generics $5.00
Preferred Brand Drugs 60%
Non-Preferred Brand Drugs 40%
Specialty Drugs (i.e. high-cost) 60%
Options for Additional Benefit Design Limits: Plan Description:
Set a Maximum on Specialty Rx Coinsurance Payments? Name: Non-Standard Silver - 87%
Specialty Rx Coinsurance Maximum: Plan HIOS ID: 13627VT0380002 and 13627VT0360002
Set a Maximum Number of Days for Charging an IP Copay? Issuer HIOS ID: 13627
# Days (1-10): 2021_1j
Begin Primary Care Cost-Sharing After a Set Number of Visits?
# Visits (1-10): 3
Begin Primary Care Deductible/Coinsurance After a Set Number of
Copays?
# Copays (1-10):
Output
Status/Error Messages: CSR Level of 87% (150-200% FPL), Calculation Successful.
Actuarial Value: 87.63%
Metal Tier: Gold
Additional Notes:
Calculation Time: 0.0664 seconds
Final 2021 AV Calculator
NOTE: Service-specific cost-sharing is applying for service(s) with fac/prof components, overriding outpatient inputs for those service(s).
Copay applies only after
deductible?
HSA/HRA Options Tiered Network Option
Annual Contribution Amount:2nd Tier Utilization:
1st Tier Utilization:
Tier 1 Plan Benefit Design Tier 2 Plan Benefit Design
Tier 1 Tier 2
Calculate
All
All
All
All
All
All
All
All
All All
All All

BLUE CROSS AND BLUE SHIELD OF VERMONT 2021 VERMONT INDIVIDUAL AND SMALL GROUP PLANS
METAL ACTUARIAL VALUES CERTIFICATION
18 | P a g e
Plan: Blue Rewards (Non-Standard) Copayment Plan – Silver CSR 94%
Items supported
by the AV
Calculator
Deductible $0
Coinsurance 0%
OOPM $950
Copayments after the deductible See print below
PCP visits at no cost share before the deductible 3
AVC Output for items supported by the AVC (a) 93.95%
BCBSVT Model Output for items supported by the AVC (b) 96.3%
BCBSVT Model Output for complete benefit design (c) 96.5%
Estimated AVC value (d)=(c)/(b)*(a) 94.1%
User Inputs for Plan Parameters
Use Integrated Medical and Drug Deductible?
Apply Inpatient Copay per Day? HSA/HRA Employer Contribution? Tiered Network Plan?
Apply Skilled Nursing Facility Copay per Day?
Use Separate MOOP for Medical and Drug Spending?
Indicate if Plan Meets CSR or Expanded Bronze AV Standard?
Desired Metal Tier
Medical Drug Combined Medical Drug Combined
Deductible ($) $0.00
Coinsurance (%, Insurer's Cost Share) 100.00%
MOOP ($) $950.00
MOOP if Separate ($)
Click Here for Important Instructions Tier 1 Tier 2
Type of BenefitSubject to
Deductible?
Subject to
Coinsurance?
Coinsurance, if
different
Copay, if
separate
Subject to
Deductible?
Subject to
Coinsurance?
Coinsurance, if
different
Copay, if
separate
Medical
Emergency Room Services $250.00
All Inpatient Hospital Services (inc. MH/SUD) $0.00
Primary Care Visit to Treat an Injury or Illness (exc. Preventive, and
X-rays)$15.00
Specialist Visit $35.00
Mental/Behavioral Health and Substance Use Disorder Outpatient
Services$14.00
Imaging (CT/PET Scans, MRIs) $0.00
Speech Therapy $35.00
Occupational and Physical Therapy$15.00
Preventive Care/Screening/Immunization 100% $0.00 100% $0.00
Laboratory Outpatient and Professional Services $35.00
X-rays and Diagnostic Imaging $35.00
Skilled Nursing Facility $0.00
Outpatient Facility Fee (e.g., Ambulatory Surgery Center) $0.00
Outpatient Surgery Physician/Surgical Services
Drugs
Generics $5.00
Preferred Brand Drugs 60%
Non-Preferred Brand Drugs 40%
Specialty Drugs (i.e. high-cost) 60%
Options for Additional Benefit Design Limits: Plan Description:
Set a Maximum on Specialty Rx Coinsurance Payments? Name: Non-Standard Silver - 94%
Specialty Rx Coinsurance Maximum: Plan HIOS ID: 13627VT0380002 and 13627VT0360002
Set a Maximum Number of Days for Charging an IP Copay? Issuer HIOS ID: 13627
# Days (1-10): 2021_1j
Begin Primary Care Cost-Sharing After a Set Number of Visits?
# Visits (1-10): 3
Begin Primary Care Deductible/Coinsurance After a Set Number of
Copays?
# Copays (1-10):
Output
Status/Error Messages: CSR Level of 94% (100-150% FPL), Calculation Successful.
Actuarial Value: 93.95%
Metal Tier: Platinum
Additional Notes:
Calculation Time: 0.0586 seconds
Final 2021 AV Calculator
NOTE: Service-specific cost-sharing is applying for service(s) with fac/prof components, overriding outpatient inputs for those service(s).
Copay applies only after
deductible?
HSA/HRA Options Tiered Network Option
Annual Contribution Amount:2nd Tier Utilization:
1st Tier Utilization:
Tier 1 Plan Benefit Design Tier 2 Plan Benefit Design
Tier 1 Tier 2
Calculate
All
All
All
All
All
All
All
All
All All
All All

BLUE CROSS AND BLUE SHIELD OF VERMONT 2021 VERMONT INDIVIDUAL AND SMALL GROUP PLANS
METAL ACTUARIAL VALUES CERTIFICATION
19 | P a g e
Plan: Non-Standard Copayment Plan – Bronze
Items supported
by the AV
Calculator
Deductible $8,550
Coinsurance 0%
OOPM $8,550
Copayments after the deductible See print below
PCP visits at no cost share before the deductible 3
AVC Output for items supported by the AVC (a) 63.57%
BCBSVT Model Output for items supported by the AVC (b) 68.9%
BCBSVT Model Output for complete benefit design (c) 70.2%
Estimated AVC value (d)=(c)/(b)*(a) 64.8%
User Inputs for Plan Parameters
Use Integrated Medical and Drug Deductible?
Apply Inpatient Copay per Day? HSA/HRA Employer Contribution? Tiered Network Plan?
Apply Skilled Nursing Facility Copay per Day?
Use Separate MOOP for Medical and Drug Spending?
Indicate if Plan Meets CSR or Expanded Bronze AV Standard?
Desired Metal Tier
Medical Drug Combined Medical Drug Combined
Deductible ($) $8,550.00
Coinsurance (%, Insurer's Cost Share) 100.00%
MOOP ($) $8,550.00
MOOP if Separate ($)
Click Here for Important Instructions Tier 1 Tier 2
Type of BenefitSubject to
Deductible?
Subject to
Coinsurance?
Coinsurance, if
different
Copay, if
separate
Subject to
Deductible?
Subject to
Coinsurance?
Coinsurance, if
different
Copay, if
separate
Medical
Emergency Room Services
All Inpatient Hospital Services (inc. MH/SUD)
Primary Care Visit to Treat an Injury or Illness (exc. Preventive, and
X-rays)
Specialist Visit
Mental/Behavioral Health and Substance Use Disorder Outpatient
Services
Imaging (CT/PET Scans, MRIs)
Speech Therapy
Occupational and Physical Therapy
Preventive Care/Screening/Immunization 100% $0.00 100% $0.00
Laboratory Outpatient and Professional Services
X-rays and Diagnostic Imaging
Skilled Nursing Facility
Outpatient Facility Fee (e.g., Ambulatory Surgery Center)
Outpatient Surgery Physician/Surgical Services
Drugs
Generics
Preferred Brand Drugs
Non-Preferred Brand Drugs
Specialty Drugs (i.e. high-cost)
Options for Additional Benefit Design Limits: Plan Description:
Set a Maximum on Specialty Rx Coinsurance Payments? Name: Non-Standard Bronze
Specialty Rx Coinsurance Maximum: Plan HIOS ID: 13627VT0380003 and 13627VT0360003
Set a Maximum Number of Days for Charging an IP Copay? Issuer HIOS ID: 13627
# Days (1-10): 2021_1j
Begin Primary Care Cost-Sharing After a Set Number of Visits?
# Visits (1-10): 3
Begin Primary Care Deductible/Coinsurance After a Set Number of
Copays?
# Copays (1-10):
Output
Status/Error Messages: Expanded Bronze Standard (56% to 65%), Calculation Successful.
Actuarial Value: 63.57%
Metal Tier: Bronze
Additional Notes:
Calculation Time: 0.1523 seconds
Final 2021 AV Calculator
Copay applies only after
deductible?
HSA/HRA Options Tiered Network Option
Annual Contribution Amount:2nd Tier Utilization:
1st Tier Utilization:
Tier 1 Plan Benefit Design Tier 2 Plan Benefit Design
Tier 1 Tier 2
Calculate
All
All
All
All
All
All
All
All
All All
All All

BLUE CROSS AND BLUE SHIELD OF VERMONT 2021 VERMONT INDIVIDUAL AND SMALL GROUP PLANS
METAL ACTUARIAL VALUES CERTIFICATION
20 | P a g e
Plan: Non-Standard Copayment Plan – Silver Reflective
Items supported
by the AV
Calculator
Deductible $3,000
Coinsurance 0%
OOPM $8,150
Copayments after the deductible See print below
PCP visits at no cost share before the deductible 3
AVC Output for items supported by the AVC (a) 67.68%
BCBSVT Model Output for items supported by the AVC (b) 75.5%
BCBSVT Model Output for complete benefit design (c) 77.7%
Estimated AVC value (d)=(c)/(b)*(a) 69.6%
User Inputs for Plan Parameters
Use Integrated Medical and Drug Deductible?
Apply Inpatient Copay per Day? HSA/HRA Employer Contribution? Tiered Network Plan?
Apply Skilled Nursing Facility Copay per Day?
Use Separate MOOP for Medical and Drug Spending?
Indicate if Plan Meets CSR or Expanded Bronze AV Standard?
Desired Metal Tier
Medical Drug Combined Medical Drug Combined
Deductible ($) $3,000.00
Coinsurance (%, Insurer's Cost Share) 100.00%
MOOP ($) $8,150.00
MOOP if Separate ($)
Click Here for Important Instructions Tier 1 Tier 2
Type of BenefitSubject to
Deductible?
Subject to
Coinsurance?
Coinsurance, if
different
Copay, if
separate
Subject to
Deductible?
Subject to
Coinsurance?
Coinsurance, if
different
Copay, if
separate
Medical
Emergency Room Services $450.00
All Inpatient Hospital Services (inc. MH/SUD) $1,750.00
Primary Care Visit to Treat an Injury or Illness (exc. Preventive, and
X-rays)$30.00
Specialist Visit $50.00
Mental/Behavioral Health and Substance Use Disorder Outpatient
Services$29.00
Imaging (CT/PET Scans, MRIs) $1,750.00
Speech Therapy $50.00
Occupational and Physical Therapy$35.00
Preventive Care/Screening/Immunization 100% $0.00 100% $0.00
Laboratory Outpatient and Professional Services $50.00
X-rays and Diagnostic Imaging $50.00
Skilled Nursing Facility $1,750.00
Outpatient Facility Fee (e.g., Ambulatory Surgery Center) $1,750.00
Outpatient Surgery Physician/Surgical Services
Drugs
Generics $5.00
Preferred Brand Drugs 60%
Non-Preferred Brand Drugs 40%
Specialty Drugs (i.e. high-cost) 60%
Options for Additional Benefit Design Limits: Plan Description:
Set a Maximum on Specialty Rx Coinsurance Payments? Name: Non-Standard Silver Reflective
Specialty Rx Coinsurance Maximum: Plan HIOS ID: 13627VT0380004 and 13627VT0360004
Set a Maximum Number of Days for Charging an IP Copay? Issuer HIOS ID: 13627
# Days (1-10): 2021_1j
Begin Primary Care Cost-Sharing After a Set Number of Visits?
# Visits (1-10): 3
Begin Primary Care Deductible/Coinsurance After a Set Number of
Copays?
# Copays (1-10):
Output
Status/Error Messages: Calculation Successful.
Actuarial Value: 67.68%
Metal Tier: Silver
Additional Notes:
Calculation Time: 0.0703 seconds
Final 2021 AV Calculator
NOTE: Service-specific cost-sharing is applying for service(s) with fac/prof components, overriding outpatient inputs for those service(s).
Copay applies only after
deductible?
HSA/HRA Options Tiered Network Option
Annual Contribution Amount:2nd Tier Utilization:
1st Tier Utilization:
Tier 1 Plan Benefit Design Tier 2 Plan Benefit Design
Tier 1 Tier 2
Calculate
All
All
All
All
All
All
All
All
All All
All All
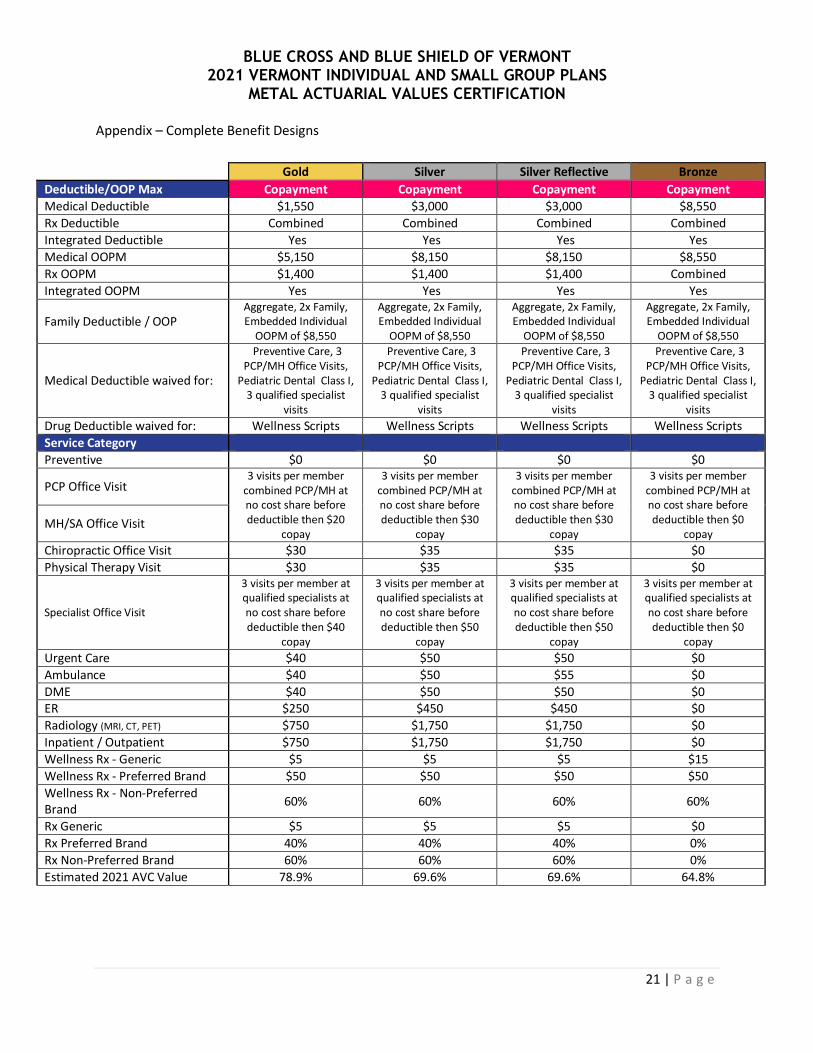
BLUE CROSS AND BLUE SHIELD OF VERMONT 2021 VERMONT INDIVIDUAL AND SMALL GROUP PLANS
METAL ACTUARIAL VALUES CERTIFICATION
21 | P a g e
Appendix – Complete Benefit Designs
Gold Silver Silver Reflective Bronze
Deductible/OOP Max Copayment Copayment Copayment Copayment
Medical Deductible $1,550 $3,000 $3,000 $8,550
Rx Deductible Combined Combined Combined Combined
Integrated Deductible Yes Yes Yes Yes
Medical OOPM $5,150 $8,150 $8,150 $8,550
Rx OOPM $1,400 $1,400 $1,400 Combined
Integrated OOPM Yes Yes Yes Yes
Family Deductible / OOP Aggregate, 2x Family, Embedded Individual
OOPM of $8,550
Aggregate, 2x Family, Embedded Individual
OOPM of $8,550
Aggregate, 2x Family, Embedded Individual
OOPM of $8,550
Aggregate, 2x Family, Embedded Individual
OOPM of $8,550
Medical Deductible waived for:
Preventive Care, 3 PCP/MH Office Visits,
Pediatric Dental Class I, 3 qualified specialist
visits
Preventive Care, 3 PCP/MH Office Visits,
Pediatric Dental Class I, 3 qualified specialist
visits
Preventive Care, 3 PCP/MH Office Visits,
Pediatric Dental Class I, 3 qualified specialist
visits
Preventive Care, 3 PCP/MH Office Visits,
Pediatric Dental Class I, 3 qualified specialist
visits
Drug Deductible waived for: Wellness Scripts Wellness Scripts Wellness Scripts Wellness Scripts
Service Category
Preventive $0 $0 $0 $0
PCP Office Visit 3 visits per member
combined PCP/MH at no cost share before deductible then $20
copay
3 visits per member combined PCP/MH at no cost share before deductible then $30
copay
3 visits per member combined PCP/MH at no cost share before deductible then $30
copay
3 visits per member combined PCP/MH at no cost share before deductible then $0
copay MH/SA Office Visit
Chiropractic Office Visit $30 $35 $35 $0
Physical Therapy Visit $30 $35 $35 $0
Specialist Office Visit
3 visits per member at qualified specialists at no cost share before deductible then $40
copay
3 visits per member at qualified specialists at no cost share before deductible then $50
copay
3 visits per member at qualified specialists at no cost share before deductible then $50
copay
3 visits per member at qualified specialists at no cost share before deductible then $0
copay
Urgent Care $40 $50 $50 $0
Ambulance $40 $50 $55 $0
DME $40 $50 $50 $0 ER $250 $450 $450 $0
Radiology (MRI, CT, PET) $750 $1,750 $1,750 $0
Inpatient / Outpatient $750 $1,750 $1,750 $0
Wellness Rx - Generic $5 $5 $5 $15
Wellness Rx - Preferred Brand $50 $50 $50 $50
Wellness Rx - Non-Preferred Brand
60% 60% 60% 60%
Rx Generic $5 $5 $5 $0
Rx Preferred Brand 40% 40% 40% 0%
Rx Non-Preferred Brand 60% 60% 60% 0%
Estimated 2021 AVC Value 78.9% 69.6% 69.6% 64.8%

BLUE CROSS AND BLUE SHIELD OF VERMONT 2021 VERMONT INDIVIDUAL AND SMALL GROUP PLANS
METAL ACTUARIAL VALUES CERTIFICATION
22 | P a g e
73% AV 77% AV 87% AV 94% AV
Deductible/OOP Max Copayment Copayment Copayment Copayment
Medical Deductible $2,100 $1,000 $200 $0
Rx Deductible Combined Combined Combined Combined
Integrated Deductible Yes Yes Yes Yes
Medical OOPM $6,200 $5,200 $2,400 $950
Rx OOPM $1,400 $1,400 $1,400 $950
Integrated OOPM Yes Yes Yes Yes
Family Deductible / OOP Aggregate, 2x Family, Embedded Individual
OOPM of $8,550
Aggregate, 2x Family, Embedded Individual
OOPM of $8,550 Aggregate, 2x Family Aggregate, 2x Family
Medical Deductible waived for:
Preventive Care, 3 PCP/MH Office Visits,
Pediatric Dental Class I, 3 qualified specialist
visits
Preventive Care, 3 PCP/MH Office Visits,
Pediatric Dental Class I, 3 qualified specialist
visits
Preventive Care, 3 PCP/MH Office Visits,
Pediatric Dental Class I, 3 qualified specialist
visits
Preventive Care, 3 PCP/MH Office Visits,
Pediatric Dental Class I, 3 qualified specialist
visits
Drug Deductible waived for: Wellness Scripts Wellness Scripts Wellness Scripts Wellness Scripts
Service Category
Preventive $0 $0 $0 $0
PCP Office Visit 3 visits per member
combined PCP/MH at no cost share before deductible then $30
copay
3 visits per member combined PCP/MH at no cost share before deductible then $30
copay
3 visits per member combined PCP/MH at no cost share before deductible then $30
copay
3 visits per member combined PCP/MH at no cost share before deductible then $15
copay MH/SA Office Visit
Chiropractic Office Visit $35 $35 $35 $15
Physical Therapy Visit $35 $35 $35 $15
Specialist Office Visit
3 visits per member at qualified specialists at no cost share before deductible then $50
copay
3 visits per member at qualified specialists at no cost share before deductible then $50
copay
3 visits per member at qualified specialists at no cost share before deductible then $50
copay
3 visits per member at qualified specialists at no cost share before deductible then $35
copay
Urgent Care $50 $50 $50 $35
Ambulance $50 $50 $50 $35
DME $50 $50 $50 $35
ER $400 $400 $250 $250
Radiology (MRI, CT, PET) $1,500 $1,500 $500 $0
Inpatient / Outpatient $1,500 $1,500 $500 $0
Wellness Rx - Generic $5 $5 $5 $5
Wellness Rx - Preferred Brand $50 $50 $50 $50
Wellness Rx - Non-Preferred Brand
60% 60% 60% 60%
Rx Generic $5 $5 $5 $5
Rx Preferred Brand 40% 40% 40% 40%
Rx Non-Preferred Brand 60% 60% 60% 60%
Estimated 2021 AVC Value 73.5% 77.9% 87.9% 94.1%
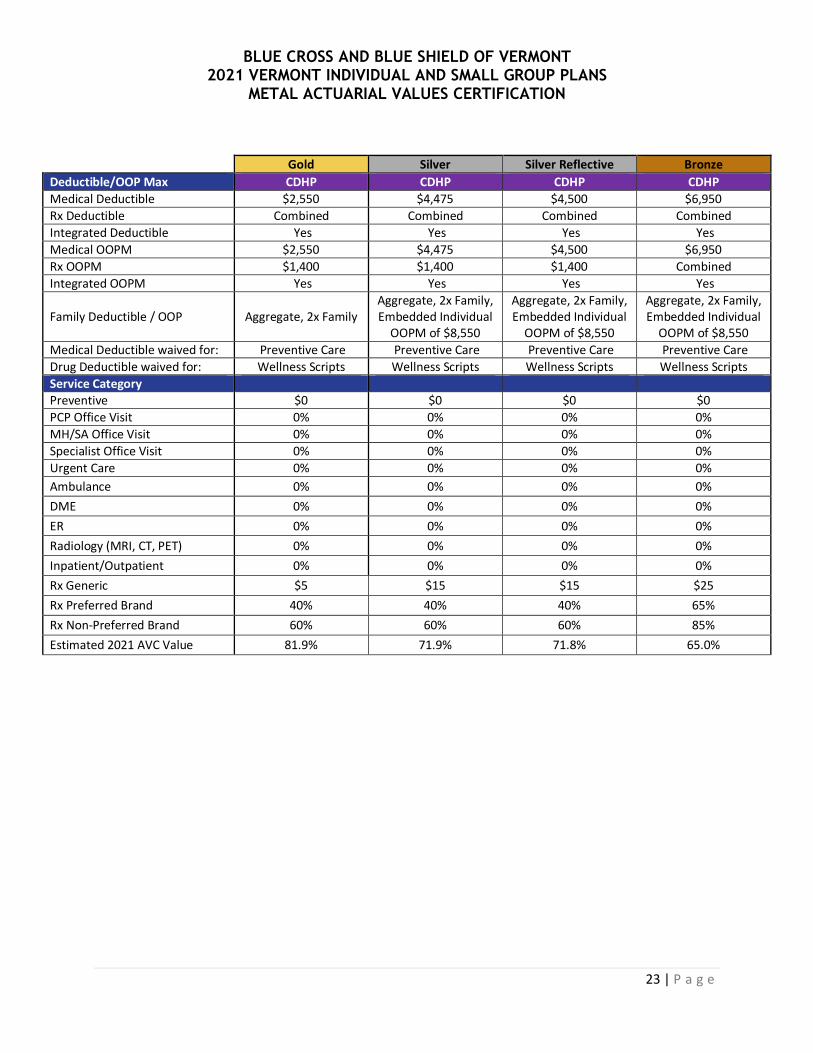
BLUE CROSS AND BLUE SHIELD OF VERMONT 2021 VERMONT INDIVIDUAL AND SMALL GROUP PLANS
METAL ACTUARIAL VALUES CERTIFICATION
23 | P a g e
Gold Silver Silver Reflective Bronze
Deductible/OOP Max CDHP CDHP CDHP CDHP
Medical Deductible $2,550 $4,475 $4,500 $6,950
Rx Deductible Combined Combined Combined Combined
Integrated Deductible Yes Yes Yes Yes
Medical OOPM $2,550 $4,475 $4,500 $6,950
Rx OOPM $1,400 $1,400 $1,400 Combined
Integrated OOPM Yes Yes Yes Yes
Family Deductible / OOP Aggregate, 2x Family Aggregate, 2x Family, Embedded Individual
OOPM of $8,550
Aggregate, 2x Family, Embedded Individual
OOPM of $8,550
Aggregate, 2x Family, Embedded Individual
OOPM of $8,550
Medical Deductible waived for: Preventive Care Preventive Care Preventive Care Preventive Care
Drug Deductible waived for: Wellness Scripts Wellness Scripts Wellness Scripts Wellness Scripts
Service Category Preventive $0 $0 $0 $0
PCP Office Visit 0% 0% 0% 0%
MH/SA Office Visit 0% 0% 0% 0%
Specialist Office Visit 0% 0% 0% 0%
Urgent Care 0% 0% 0% 0%
Ambulance 0% 0% 0% 0%
DME 0% 0% 0% 0%
ER 0% 0% 0% 0%
Radiology (MRI, CT, PET) 0% 0% 0% 0%
Inpatient/Outpatient 0% 0% 0% 0%
Rx Generic $5 $15 $15 $25
Rx Preferred Brand 40% 40% 40% 65%
Rx Non-Preferred Brand 60% 60% 60% 85%
Estimated 2021 AVC Value 81.9% 71.9% 71.8% 65.0%

BLUE CROSS AND BLUE SHIELD OF VERMONT 2021 VERMONT INDIVIDUAL AND SMALL GROUP PLANS
METAL ACTUARIAL VALUES CERTIFICATION
24 | P a g e
73% AV 77% AV 87% AV 94% AV
Deductible/OOP Max CDHP CDHP CDHP CDHP - Not HSAQ
Medical Deductible $3,850 $2,900 $1,450 $550
Rx Deductible Combined Combined Combined Combined
Integrated Deductible Yes Yes Yes Yes
Medical OOPM $3,850 $2,900 $1,450 $550
Rx OOPM $1,400 $1,400 $1,400 $550
Integrated OOPM Yes Yes Yes Yes
Family Deductible / OOP Aggregate, 2x Family Aggregate, 2x Family Aggregate, 2x Family Aggregate, 2x Family
Medical Deductible waived for: Preventive Care Preventive Care Preventive Care Preventive Care
Drug Deductible waived for: Wellness Scripts Wellness Scripts Wellness Scripts Wellness Scripts
Service Category
Preventive $0 $0 $0 $0
PCP Office Visit 0% 0% 0% 0%
MH/SA Office Visit 0% 0% 0% 0%
Specialist Office Visit 0% 0% 0% 0%
Urgent Care 0% 0% 0% 0%
Ambulance 0% 0% 0% 0%
DME 0% 0% 0% 0%
ER 0% 0% 0% 0%
Radiology (MRI, CT, PET) 0% 0% 0% 0%
Inpatient/Outpatient 0% 0% 0% 0%
Rx Generic $15 $15 $15 $15
Rx Preferred Brand 40% 40% 40% 40%
Rx Non-Preferred Brand 60% 60% 60% 60%
Estimated 2021 AVC Value 74.0% 77.7% 87.7% 93.8%

MEMORANDUM
To: Paul Schultz, Chief Actuary From: Ruth Greene, VP and CFO Date: May 8, 2020 Subject: Contribution to Policyholder Reserves for 2021 Vermont Individual and
Small Group filing Upon consideration of the points documented in this memorandum, I am directing you to file a contribution to policyholder reserves (CTR) of 1.5 percent for the 2021 Vermont Individual and Small Group rate filing. BCBSVT CTR Philosophy BCBSVT holds that a long-term CTR of 1.5 percent represents an adequate, yet not excessive, contribution to policyholder reserves. CTR at this level within a typical trend and growth environment allows us to manage short-term fluctuations in order to maintain surplus levels that are within our established, modest target range. Should BCBSVT’s surplus level fall outside our target range, we would adjust our filed CTR accordingly. That is, in the event that surplus exceeds our targeted range, we would reduce our filed CTR from the long-term rate, all else being equal. Similarly, in the absence of mitigating factors, we would need to file a CTR that exceeds the long-term rate should surplus fall below our target range. BCBSVT believes that CTR should be managed to an adequate long-term level rather than fluctuating significantly from year to year with changes in membership and health care cost trend. For this reason, we file a CTR equal to our long-term target. It is our expectation that our future filings will also include contribution to policyholder reserves equal to this target. While the long-term CTR target may exceed or fall below that required to maintain our surplus position in any given year, maintaining an adequate long-term assumption will allow the market to avoid rate shocks in years of high growth in projected claims costs. BCBSVT also chooses to file consistent CTR across product lines. Many insurers file higher CTR for products with more inherent risk. For instance, the dynamic regulatory environment means that the individual and small group market is considered to be riskier
than many other market segments. However, BCBSVT considers it to be more equitable to all Vermonters to use the same CTR target across filings. An adequate long-term contribution to policyholder reserves should exceed the minimum required to keep pace with increases in total claims costs. While best estimate assumptions are by definition expected to lead to equal likelihood of gains and losses, unexpected events or periods of sustained losses may lead to financial deterioration of sufficient magnitude to threaten a company’s solvency. Apart from modest investment income, CTR is the only source of sustained funding to sustain policyholder reserves for BCBSVT. While any rate filing is by definition an estimate of future costs and is therefore subject to gains or losses, BCBSVT files no additional margin beyond the required CTR. Any rate shortfall will first be paid out of CTR, while any shortfall beyond the approved CTR for a particular filing will be funded from existing policyholder reserves (i.e. surplus). Maintaining an adequate surplus level is critical for any insurer. Consequences of low surplus include reduced flexibility in responding to customer needs, a need for higher margins in rates in order to avoid further deterioration, and a reduced ability to attract or retain business or to handle membership growth. Stability is particularly important in times of change, including the continuing evolution at both the federal and Vermont levels of the individual and small group market, the health care reform environment in Vermont, and the ongoing COVID-19 crisis. BCBSVT must remain financially strong in order to continue to provide Vermonters with access to high quality care, outstanding member experiences, and responsible cost management. Realizing a sustainable CTR over time is key to achieving that goal. Tax Cuts and Jobs Act The Tax Cuts and Jobs Act enacted in late 2017 is anticipated to have two specific impacts on BCBSVT’s financials. First, as of the 2018 tax year the BCBSVT legal entity is no longer subject to federal income taxes (note that BCBSVT subsidiaries continue to be taxable). The savings resulting from the elimination of BCBSVT’s annual federal tax obligation have been passed on directly to our customers in premium rates through the reduction of our long-term CTR to 1.5 percent from its historical level of 2.0 percent. The second expected impact results from the repeal of the corporate alternative minimum tax (AMT) in the new law. As a low to moderately capitalized Blue Plan, BCBSVT has been subject to federal income taxes at an AMT rate since 1987. AMT credits accumulated by BCBSVT since 1987 have become refundable under the law, and the total AMT credit balance is scheduled to be paid to BCBSVT over a four year period from 2019 through 2022, based on filed federal tax returns for years 2018 through 2021. The recently enacted CARES Act includes provisions for accelerating the timing of the 2021 payments. Assuming that the credits are refunded to BCBSVT in accordance with the provisions set out in the
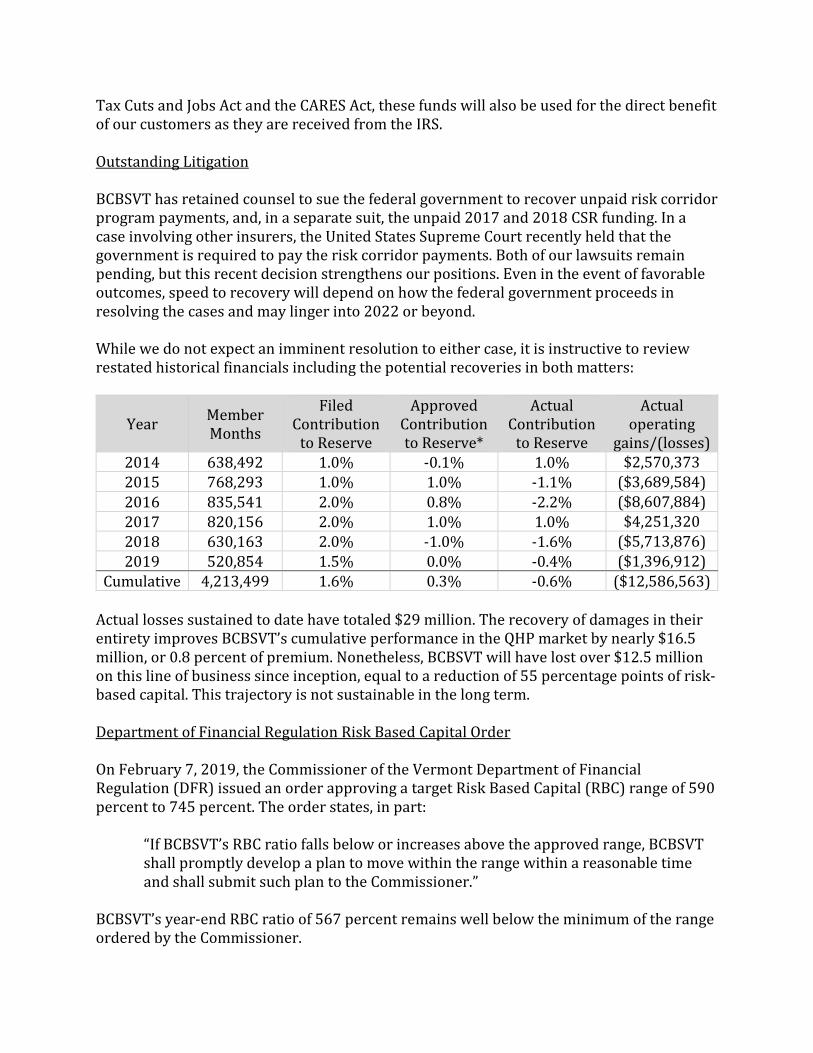
Tax Cuts and Jobs Act and the CARES Act, these funds will also be used for the direct benefit of our customers as they are received from the IRS. Outstanding Litigation BCBSVT has retained counsel to sue the federal government to recover unpaid risk corridor program payments, and, in a separate suit, the unpaid 2017 and 2018 CSR funding. In a case involving other insurers, the United States Supreme Court recently held that the government is required to pay the risk corridor payments. Both of our lawsuits remain pending, but this recent decision strengthens our positions. Even in the event of favorable outcomes, speed to recovery will depend on how the federal government proceeds in resolving the cases and may linger into 2022 or beyond. While we do not expect an imminent resolution to either case, it is instructive to review restated historical financials including the potential recoveries in both matters:
Year Member Months
Filed Contribution
to Reserve
Approved Contribution to Reserve*
Actual Contribution
to Reserve
Actual operating
gains/(losses)
2014 638,492 1.0% -0.1% 1.0% $2,570,373
2015 768,293 1.0% 1.0% -1.1% ($3,689,584)
2016 835,541 2.0% 0.8% -2.2% ($8,607,884)
2017 820,156 2.0% 1.0% 1.0% $4,251,320
2018 630,163 2.0% -1.0% -1.6% ($5,713,876)
2019 520,854 1.5% 0.0% -0.4% ($1,396,912)
Cumulative 4,213,499 1.6% 0.3% -0.6% ($12,586,563)
Actual losses sustained to date have totaled $29 million. The recovery of damages in their entirety improves BCBSVT’s cumulative performance in the QHP market by nearly $16.5 million, or 0.8 percent of premium. Nonetheless, BCBSVT will have lost over $12.5 million on this line of business since inception, equal to a reduction of 55 percentage points of risk-based capital. This trajectory is not sustainable in the long term. Department of Financial Regulation Risk Based Capital Order On February 7, 2019, the Commissioner of the Vermont Department of Financial Regulation (DFR) issued an order approving a target Risk Based Capital (RBC) range of 590 percent to 745 percent. The order states, in part:
“If BCBSVT’s RBC ratio falls below or increases above the approved range, BCBSVT shall promptly develop a plan to move within the range within a reasonable time and shall submit such plan to the Commissioner.”
BCBSVT’s year-end RBC ratio of 567 percent remains well below the minimum of the range ordered by the Commissioner.
Risk Based Capital Plan On January 3, 2020, BCBSVT filed an updated RBC plan with DFR. Updated to the final 2019 RBC of 567 percent, the 2020 portion of the plan was as follows:
RBC position as of December 31, 2019 567%
BCBSVT is pleased to be able to make investments into new enterprises that will generate cost savings while improving access to care for Vermonters. Through a joint venture of BCBSVT and Covantage Health Partners, a subsidiary of BCBS of Michigan, Vermont Blue Advantage will offer high-quality Medicare Advantage products to Vermont seniors starting in 2021, enabling Vermonters who have valued Blue Cross Blue Shield coverage for their entire working lives to remain Blue into retirement. Civica Rx is a joint venture of many Blue plan partners that will manufacture and supply – at zero profit – certain generic drugs where a lack of competition has fostered excessively high prices and profits. Starting in 2022, CivicaRx will introduce certain generic drugs to the market at a price point that is a fraction of the current cost. Because BCBSVT is able to replenish RBC with the AMT tax credits, we are able to not only mitigate rate increases but also invest in these exciting new ventures to the benefit of Vermonters. If 2020 results match expectations, unlikely given the COVID-19 pandemic, BCBSVT would have expected to be within the target RBC range by the end of 2020. We note that, all else being equal, it is better to be near the middle of the target RBC range rather than at an end point, as this minimizes the probability of falling out of the range and triggering a required corrective market action1. We do not intend to waver from our CTR philosophy while within the target range, which will generally have the effect of very modestly increasing RBC when near the low end of the target range and very modestly decreasing RBC when approaching the high end of the target range. Of course, many aspects of our financial outlook changed with the onset of the COVID-19 pandemic. While the January RBC plan provides a solid foundation to understand BCBSVT’s capital position entering 2020, the pervasive unknowns make it impossible to generate with any degree of certainty an RBC outlook for the balance of 2020 into 2021.
1 The Axene Health Partners RBC study indicates that the point within the target RBC range from which it is
least likely to fall outside the range within a one-year period is 690 percent.
COVID-19 BCBSVT’s primary responsibility to Vermonters is to maintain continuity of coverage and claims payments for the duration of the COVID-19 crisis. This understanding necessitates that we continue to rate appropriately so that we can provide extra flexibility to customers and providers who are struggling financially. In only eight weeks, BCBSVT has demonstrated this commitment to the Vermont health care ecosystem in a wide variety of programs. Working closely with state regulators, we:
• Waived member cost sharing for COVID-19 tests and associated telehealth, office, urgent and emergency care visits;
• Expanded access to telemedicine services for members and their providers;
• Paid for Store and Forward means of transmission of medical information;
• Waived cost sharing on inpatient treatment of COVID-19 and are currently working to implement a waiver of cost sharing for medically necessary follow-up care;
• Implemented and extended a special enrollment period to allow the uninsured to enroll in QHP coverage; and
• Continue to work closely with DFR on measures that will remove barriers to access to high-quality prescription drugs.
We have and will continue to comply with these and other regulatory mandates, including covering an eventual COVID-19 vaccine and serological testing at zero cost share. Furthermore, we have unflinchingly ventured well beyond regulatory requirements to offer a number of additional programs to members and providers. Over the past several weeks, we:
• Waived cost share for urgent telemedicine visits through Amwell, our telemedicine partner;
• Paid for telephone triage to allow providers to manage patient needs and direct patients to receive the appropriate care;
• Have allowed additional flexibility for refills and home delivery of essential maintenance medications;
• Temporarily suspended administrative denials such as prior authorization requirements in certain circumstances;
• Extended premium relief to large groups facing financial challenges;
• Extended grace periods for members in all lines of business;
• Provided over $6 million in advance payments to Vermont hospitals;
• Made an additional $2 million available to independent Vermont providers;
• Continue to allow flexibility to group customers so that workers who have been laid off can continue to have access to quality health insurance; and
• Are working quickly to develop and implement a program that will provide targeted relief to Vermonters burdened by health care costs.

These initiatives come with a wide variety of costs and risks. We can start to measure the financial impact of some of these programs, but the costs of many will remain unmeasurable for several months or even years. Furthermore, the worldwide economic crisis spawned by the pandemic and necessary societal response of social distancing will be felt by Vermonters and Vermont companies as well, including BCBSVT. We continue to closely monitor premium revenue as grace period have been extended for groups and members who may be struggling financially. Our investment portfolio is another source of significant risk. These costs and risks have are counterbalanced by the deferral of non-emergent care that has taken place during the declared state of emergency. The resulting reduction in claims costs relating to our insured lines of business bolsters policyholder reserves. We understand that a deferral of necessary but non-emergent care is different from an elimination of services – much of this care will take place once restrictions are loosened. An inestimable portion of the boost to surplus must therefore be temporary. Only eight weeks into an environment with so much uncertainty, it is impossible to confidently conclude that we are tracking to a capital position that is above, below, or safely within our mandated RBC range. However, we also appreciate that accelerations in volatility and uncertainty are themselves a reason that greater RBC may be required. Furthermore, while MLR rebates will refund excessive premiums to policyholders in the event of a continued claims downturn, there is no similar mechanism to protect policyholder reserves or solvency in the event of a surge in claims. For these reasons, we consider it imprudent to reduce CTR from our long-term rate at this time in reaction to the pandemic. I understand that you have opined that the continued pandemic could very reasonably be projected to increase 2021 claims costs beyond their expected level in the absence of the crisis. In this circumstance, the proposed rates would be inadequate to cover the cost of claims projected in the filing. BCBSVT has long maintained that a pandemic is one reason to hold surplus. Given that the designed function of policyholder reserves is to weather the types of uncertainties created by a pandemic without resorting to extreme rate fluctuations, any increased cost in 2021 due to the COVID-19 pandemic will be funded through policyholder reserves. Said differently, I am comfortable that the filed CTR of 1.5 percent will yield our targeted financial outcome in the event that the COVID-19 pandemic is responsible for 2021 claims increases beyond those projected in the filing. Market Considerations In proposing a CTR for any given filing, BCBSVT must consider competitive and marketplace conditions while maintaining the framework of our overarching CTR philosophy and complying with the DFR RBC order. BCBSVT experienced a loss of individual and small group membership from 2019 to 2020. Our competitor in this market enjoys a pricing advantage that is expected to persist into

2021. While we will continue to strive to maintain or grow our market share of the single risk pool, we cannot do so by intentionally underfunding premiums or by filing a CTR that does not adequately protect us from short-term fluctuations or unforeseen events, particularly when facing a time of unprecedented uncertainty with an RBC below the target range. Conclusion In consideration of all the above, I direct you to file a 1.5 percent CTR for the 2020 Vermont Individual and Small Group rate filing.

2021 Rates Table Template v10.0 [assistive technology users, please reference cell A2 for instructions]All fields with an asterisk ( * ) are required. To validate press Validate button or Ctrl + Shift + I. To finalize, press Finalize button or Ctrl + Shift + F.
Press TAB and directional arrow keys to read through the document. If macros are disabled, press and hold the ALT key and press the F, then I, and then N key. After that, select the Enable All Content option by pressing enter. (note that you can also pressIf you are in a community rating state, select Family-Tier Rates under Rating Method and fill in all columns.
If you are not in a community rating state, select Age-Based Rates under Rating Method and provide an Individual Rate for every age band.
If Tobacco is Tobacco User/Non-Tobacco User, you must give a rate for Tobacco Use and Non-Tobacco Use.
To add a new sheet, press the Add Sheet button, or Ctrl + Shift + H. All plans must have the same dates on a sheet.
HIOS Issuer ID* 13627
Rate Effective Date* 1/1/2021
Rate Expiration Date* 12/31/2021
Rating Method* Family-Tier Rates
Plan ID* Rating Area ID* Individual Rate* Couple*Primary Subscriber and
One Dependent*
Primary Subscriber and
Two Dependents*
Primary Subscriber and
Three or More
Dependents*
Couple and One
Dependent*
Couple and Two
Dependents*
Couple and Three or
More Dependents*
Required:
Enter the 14-character Plan ID
Required:
Select the Rating Area ID
Required:
Enter the rate of an Individual Non-Tobacco or
No Preference enrollee on a plan
Required:
Enter the rate of a couple based
on the pairing of a primary
enrollee and a secondary
subscriber (e.g. husband and
spouse)
Required:
Enter the rate of a family based
on a single parent with one
dependent
Required:
Enter the rate of a family based
on a single parent with two
dependents
Required:
Enter the rate of a family based
on a single parent with three or
more dependents
Required:
Enter the rate of a family based
on a couple with one dependent
Required:
Enter the rate of a family based
on a couple with two dependents
Required:
Enter the rate of a family based
on a couple with three or more
dependents
13627VT0320001 Rating Area 1 959.58 1919.16 1851.99 1851.99 1851.99 2696.42 2696.42 2696.42
13627VT0320002 Rating Area 1 813.02 1626.04 1569.13 1569.13 1569.13 2284.59 2284.59 2284.59
13627VT0320003 Rating Area 1 758.60 1517.20 1464.10 1464.10 1464.10 2131.67 2131.67 2131.67
13627VT0320006 Rating Area 1 673.17 1346.34 1299.22 1299.22 1299.22 1891.61 1891.61 1891.61
13627VT0320004 Rating Area 1 572.05 1144.10 1104.06 1104.06 1104.06 1607.46 1607.46 1607.46
13627VT0320005 Rating Area 1 579.75 1159.50 1118.92 1118.92 1118.92 1629.10 1629.10 1629.10
13627VT0330001 Rating Area 1 771.78 1543.56 1489.54 1489.54 1489.54 2168.70 2168.70 2168.70
13627VT0330003 Rating Area 1 700.41 1400.82 1351.79 1351.79 1351.79 1968.15 1968.15 1968.15
13627VT0330002 Rating Area 1 585.50 1171.00 1130.02 1130.02 1130.02 1645.26 1645.26 1645.26
13627VT0340001 Rating Area 1 265.07 530.14 511.59 511.59 511.59 744.85 744.85 744.85
13627VT0340002 Rating Area 1 959.58 1919.16 1851.99 1851.99 1851.99 2696.42 2696.42 2696.42
13627VT0340003 Rating Area 1 813.02 1626.04 1569.13 1569.13 1569.13 2284.59 2284.59 2284.59
13627VT0340004 Rating Area 1 758.60 1517.20 1464.10 1464.10 1464.10 2131.67 2131.67 2131.67
13627VT0340007 Rating Area 1 673.17 1346.34 1299.22 1299.22 1299.22 1891.61 1891.61 1891.61
13627VT0340005 Rating Area 1 572.05 1144.10 1104.06 1104.06 1104.06 1607.46 1607.46 1607.46
13627VT0340006 Rating Area 1 579.75 1159.50 1118.92 1118.92 1118.92 1629.10 1629.10 1629.10
13627VT0350001 Rating Area 1 771.78 1543.56 1489.54 1489.54 1489.54 2168.70 2168.70 2168.70
13627VT0350003 Rating Area 1 700.41 1400.82 1351.79 1351.79 1351.79 1968.15 1968.15 1968.15
13627VT0350002 Rating Area 1 585.50 1171.00 1130.02 1130.02 1130.02 1645.26 1645.26 1645.26
13627VT0360001 Rating Area 1 746.97 1493.94 1441.65 1441.65 1441.65 2098.99 2098.99 2098.99
13627VT0360002 Rating Area 1 741.19 1482.38 1430.50 1430.50 1430.50 2082.74 2082.74 2082.74
13627VT0360004 Rating Area 1 646.03 1292.06 1246.84 1246.84 1246.84 1815.34 1815.34 1815.34
13627VT0360003 Rating Area 1 574.21 1148.42 1108.23 1108.23 1108.23 1613.53 1613.53 1613.53
13627VT0370001 Rating Area 1 786.73 1573.46 1518.39 1518.39 1518.39 2210.71 2210.71 2210.71
13627VT0370002 Rating Area 1 745.87 1491.74 1439.53 1439.53 1439.53 2095.89 2095.89 2095.89
13627VT0370004 Rating Area 1 663.22 1326.44 1280.01 1280.01 1280.01 1863.65 1863.65 1863.65
13627VT0370003 Rating Area 1 568.59 1137.18 1097.38 1097.38 1097.38 1597.74 1597.74 1597.74
13627VT0380001 Rating Area 1 746.97 1493.94 1441.65 1441.65 1441.65 2098.99 2098.99 2098.99
13627VT0380002 Rating Area 1 741.19 1482.38 1430.50 1430.50 1430.50 2082.74 2082.74 2082.74
13627VT0380004 Rating Area 1 646.03 1292.06 1246.84 1246.84 1246.84 1815.34 1815.34 1815.34
13627VT0380003 Rating Area 1 574.21 1148.42 1108.23 1108.23 1108.23 1613.53 1613.53 1613.53
13627VT0390001 Rating Area 1 786.73 1573.46 1518.39 1518.39 1518.39 2210.71 2210.71 2210.71
13627VT0390002 Rating Area 1 745.87 1491.74 1439.53 1439.53 1439.53 2095.89 2095.89 2095.89
13627VT0390004 Rating Area 1 663.22 1326.44 1280.01 1280.01 1280.01 1863.65 1863.65 1863.65
13627VT0390003 Rating Area 1 568.59 1137.18 1097.38 1097.38 1097.38 1597.74 1597.74 1597.74
Family Tier
BLUE CROSS BLUE SHIELD OF VERMONT 2021 VERMONT INDIVIDUAL AND SMALL GROUP RATE FILING
PLAIN LANGUAGE SUMMARY Our mission and vision. Blue Cross and Blue Shield of Vermont (BCBSVT) is committed to giving our members access to high-value health care while responsibly managing healthcare costs. To that end, we seek to improve the health of Vermonters by promoting preventive care and healthy lifestyles. We use our strong care management program to assure better care for our members and avoid unnecessary costs. And we work with providers on strategies to improve health care services and reduce health care costs. BCBSVT’s vision is a transformed health care system in which every Vermonter has health care coverage, and receives timely, effective, affordable care. To achieve that vision, BCBSVT must be financially sound. That means we need to charge rates that cover the cost of providing health care to our members. Rate request summary. This filing provides the proposed rates for individual and small group plans that BCBSVT seeks to offer in 2021. It also describes how we calculated the proposed rates.
There are 39,195 members currently enrolled in the individual and small group plans affected by this rate request.
We are requesting an average rate increase of 6.3 percent.
The increases for specific plans range from -0.7 percent to 13.3 percent.
The increases range from 3.4 percent to 7.2 percent for plans other than Catastrophic and Vermont Select CDHP Gold.
Reasons for the rate increase. The primary reason for the proposed rate increase is that the cost of providing health care to our members is increasing. Specifically:
Our members are using more high-cost specialty medications, which has substantially increased the cost of our pharmacy benefit (3.7 percent).
3.6 percent of the rate increase is due to the increase in medical services for our members. The cost of services and use of services are increasing at a similar pace.
Other factors also contribute to the proposed rate increase, including:
Benefits changed to meet metal level requirements. These benefit changes increased rates by 0.9 percent. That’s because health care costs go up more quickly than cost sharing.
We added the option to pay your premium online with credit or debit cards. Coupled with increases in base administrative expenses, premiums went up 1.0 percent.
Our efforts to reduce premium increases. We know that paying for health insurance is a struggle for many, and we strive to keep premiums as low as possible. The proposed rate reflects our efforts to reduce rate increases, including:
Working closely with our pharmacy benefit manager to improve network pricing and maximize rebates.
Crafting strategies with our lab benefit manager that dramatically reduced lab costs. Together, these steps reduced the requested rate increase by 1.7 percent, or about $5.2 million. The repeal of a federal fee reduced the requested rate increase by 2.2 percent.

BLUE CROSS BLUE SHIELD OF VERMONT 2021 VERMONT INDIVIDUAL AND SMALL GROUP RATE FILING
PLAIN LANGUAGE SUMMARY Our experience in this market. BCBSVT started selling plans in the Vermont Individual and Small Group Merged Market in January 2014. Through the 2019 plan year, BCBSVT has lost over $29 million on this line of business. BCBSVT has not included any additional contribution to member reserves to offset this loss. Our health care system must be adequately funded to keep it strong and accessible. Since the factors that drive this rate increase are primarily the cost and utilization of health care, we believe that there is no way to further reduce these rates without underfunding the health care coverage on which Vermonters rely.
Public comment. Members of the public can submit comments to the Green Mountain Care Board about this rate request from May 11, 2020 through July 22, 2020. For more information, please visit the Board’s Public Comment page: https://ratereview.vermont.gov/public_comment

BLUE CROSS AND BLUE SHIELD OF VERMONT
2021 VERMONT INDIVIDUAL AND SMALL GROUP RATE FILING
STATE OF VERMONT STANDARD PLAN DESIGNS
Exhibit 1A
PLATINUM GOLD SILVER SILVER BRONZE BRONZE BRONZE SILVER REFLECTIVE SILVER REFLECTIVE CATASTROPHIC
Standard Standard Standard Standard Standard Standard Standard Standard Standard Standard
Deductible/OOP Max Deductible Deductible Deductible CDHP Deductible CDHP Integrated Deductible CDHP Deductible
Medical Ded $350 $1,100 $3,200 $1,750 $6,250 $5,500 $8,400 $3,200 $1,750 $8,550
Rx Ded $0 $100 $350 Combined $1,000 Combined Combined $350 Combined Combined
Integrated Ded No No No Yes No Yes Yes No Yes Yes
Medical OOPM $1,400 $5,200 $7,900 $6,900 $8,400 $6,750 $8,400 $8,150 $6,900 $8,550
Rx OOPM $1,400 $1,400 $8,150 $1,400 $1,400 $1,400 Combined $1,400 $1,400 $1,400
Integrated OOPM No No Yes Yes Yes Yes Yes Yes Yes Yes
Family Deductible / OOP Stacked, 2x Family Stacked, 2x Family Stacked, 2x Family
Aggregate, 2x Family,
Embedded Individual OOPM
of $8,550
Stacked, 2x Family
Aggregate, 2x Family,
Embedded Individual OOPM
of $8,550
Stacked, 2x Family Stacked, 2x Family
Aggregate, 2x Family,
Embedded Individual OOPM
of $8,550
Aggregate, 2x Family,
Embedded Individual OOPM
of $8,550
Medical Deductible waived for:
Preventive Care, Office
Visits, Urgent Care,
Ambulance, Pediatric
Dental Class I, Vision
Preventive Care, Office
Visits, Urgent Care,
Ambulance, Pediatric
Dental Class I, Vision
Preventive Care, Office
Visits, Urgent Care,
Ambulance, Pediatric
Dental Class I, Vision
Preventive Care Preventive Care, Pediatric
Dental Class I Preventive Care
Preventive Care, Office
Visits, Pediatric Dental
Class I
Preventive Care, Office
Visits, Urgent Care,
Ambulance, Pediatric
Dental Class I, Vision
Preventive Care Preventive Care, 3
PCP/MH Office Visits
Drug Deductible waived for: N/A Generic Scripts Generic Scripts Wellness Scripts Generic Scripts Wellness Scripts Generic Scripts Generic Scripts Wellness Scripts N/A
Service Category
Preventive $0 $0 $0 0% $0 0% 0% $0 0% $0
PCP Office Visit $15 $20 $35 10% $35 50% $40 $35 10%
MH/SA Office Visit $15 $20 $35 10% $35 50% $40 $35 10%
Chiropractic and Physical Therapy Office Visit $20 $30 $40 30% $40 50% $50 $40 30% 0%
Specialist Office Visit $40 $50 $80 30% $90 50% $100 $80 30% 0%
Urgent Care $50 $60 $90 30% $100 50% 0% $90 30% 0%
Ambulance $60 $70 $100 30% $100 50% 0% $105 35% 0%
DME 10% 30% 50% 30% 50% 50% 0% 50% 30% 0%
ER $100 $150 $250 30% 50% 50% 0% $250 30% 0%
Radiology (MRI, CT, PET) 10% 30% 50% 30% 50% 50% 0% 50% 30% 0%
Outpatient 10% 30% 50% 30% 50% 50% 0% 50% 30% 0%
Inpatient 10% 30% 50% 30% 50% 50% 0% 50% 30% 0%
Wellness Rx - Generic $10 $12 $15 $10 $15 $12 $30 $15 $10 0%
Wellness Rx - Preferred Brand $50 $55 $60 $40 $85 40% 0% $60 $40 0%
Wellness Rx - Non-Preferred Brand 50% 50% 50% 50% 60% 60% 0% 50% 50% 0%
Rx Generic $10 $12 $15 $10 $15 $12 $30 $15 $10 0%
Rx Preferred Brand $50 $55 $60 $40 $85 40% 0% $60 $40 0%
Rx Non-Preferred Brand 50% 50% 50% 50% 60% 60% 0% 50% 50% 0%
Pediatric Vision (Exam and Materials) $40 $50 $80 30% $90 50% $0 $80 30% 0%
Pediatric Dental Class I 0% 0% 0% 0% 0% 0% 0% 0% 0% 0%
Pediatric Dental Class II 30% 30% 30% 30% 30% 30% 0% 30% 30% 0%
Pediatric Dental Class III 50% 50% 50% 50% 50% 50% 0% 50% 50% 0%
3 visits per member
combined PCP/MH at no cost
share before deductible then
0% coinsurance

BLUE CROSS AND BLUE SHIELD OF VERMONT
2021 VERMONT INDIVIDUAL AND SMALL GROUP RATE FILING
NON-STANDARD PLAN DESIGNS
Exhibit 1B
GOLD GOLD SILVER SILVER BRONZE BRONZE SILVER REFLECTIVE SILVER REFLECTIVE
Vermont Preferred Vermont Select Vermont Preferred Vermont Select Vermont Preferred Vermont Select Vermont Preferred Vermont Select
Deductible/OOP Max 3-6-9 CDHP 3-6-9 CDHP 3-6-9 CDHP 3-6-9 CDHP
Medical Ded $1,550 $2,550 $3,000 $4,475 $8,550 $6,950 $3,000 $4,500
Rx Ded Combined Combined Combined Combined Combined Combined Combined Combined
Integrated Ded Yes Yes Yes Yes Yes Yes Yes Yes
Medical OOPM $5,150 $2,550 $8,150 $4,475 $8,550 $6,950 $8,150 $4,500
Rx OOPM $1,400 $1,400 $1,400 $1,400 Combined Combined $1,400 $1,400
Integrated OOPM Yes Yes Yes Yes Yes Yes Yes Yes
Family Deductible / OOP
Aggregate, 2x Family,
Embedded Individual
OOPM of $8,550
Aggregate, 2x Family
Aggregate, 2x Family,
Embedded Individual
OOPM of $8,550
Aggregate, 2x Family,
Embedded Individual
OOPM of $8,550
Aggregate, 2x Family,
Embedded Individual
OOPM of $8,550
Aggregate, 2x Family,
Embedded Individual
OOPM of $8,550
Aggregate, 2x Family,
Embedded Individual
OOPM of $8,550
Aggregate, 2x Family,
Embedded Individual
OOPM of $8,550
Medical Deductible waived for:
Preventive Care, 3
PCP/MH Office Visits,
Pediatric Dental Class I, 3
qualified Specialist Visits
Preventive Care
Preventive Care, 3
PCP/MH Office Visits,
Pediatric Dental Class I, 3
qualified Specialist Visits
Preventive Care
Preventive Care, 3
PCP/MH Office Visits,
Pediatric Dental Class I, 3
qualified Specialist Visits
Preventive Care
Preventive Care, 3
PCP/MH Office Visits,
Pediatric Dental Class I, 3
qualified Specialist Visits
Preventive Care
Drug Deductible waived for: Wellness Scripts Wellness Scripts Wellness Scripts Wellness Scripts Wellness Scripts Wellness Scripts Wellness Scripts Wellness Scripts
Service Category
Preventive $0 $0 $0 $0 $0 $0 $0 $0
PCP Office Visit 0% 0% 0% 0%
MH/SA Office Visit 0% 0% 0% 0%
Chiropractic and Physical Therapy Office Visit $30 0% $35 0% $0 0% $35 0%
Specialist Office Visit
3 visits per member at
qualified specialists at no
cost share before
deductible then $40 copay
0%
3 visits per member at
qualified specialists at no
cost share before
deductible then $50 copay
0%
3 visits per member at
qualified specialists at no
cost share before
deductible then $0 copay
0%
3 visits per member at
qualified specialists at no
cost share before
deductible then $50 copay
0%
Urgent Care $40 0% $50 0% $0 0% $50 0%
Ambulance $40 0% $50 0% $0 0% $55 0%
DME $40 0% $50 0% $0 0% $50 0%
ER $250 0% $450 0% $0 0% $450 0%
Radiology (MRI, CT, PET) $750 0% $1,750 0% $0 0% $1,750 0%
Outpatient $750 0% $1,750 0% $0 0% $1,750 0%
Inpatient $750 0% $1,750 0% $0 0% $1,750 0%
Wellness Rx - Generic $5 $5 $5 $15 $15 $25 $5 $15
Wellness Rx - Preferred Brand $50 40% $50 40% $50 65% $50 40%
Wellness Rx - Non-Preferred Brand 60% 60% 60% 60% 60% 85% 60% 60%
Rx Generic $5 $5 $5 $15 $0 $25 $5 $15
Rx Preferred Brand 40% 40% 40% 40% 0% 40% 40% 40%
Rx Non-Preferred Brand 60% 60% 60% 60% 0% 60% 60% 60%
Pediatric Vision (Exam and Materials) $40 0% $50 0% $0 0% $50 0%
Pediatric Dental Class I 0% 0% 0% 0% 0% 0% 0% 0%
Pediatric Dental Class II 30% 0% 30% 0% 30% 0% 30% 0%
Pediatric Dental Class III 50% 0% 50% 0% 50% 0% 50% 0%
3 visits per member
combined PCP/MH at no
cost share before
deductible then $20 copay
3 visits per member
combined PCP/MH at no
cost share before
deductible then $30 copay
3 visits per member
combined PCP/MH at no
cost share before
deductible then $30 copay
3 visits per member
combined PCP/MH at no
cost share before
deductible then $30 copay
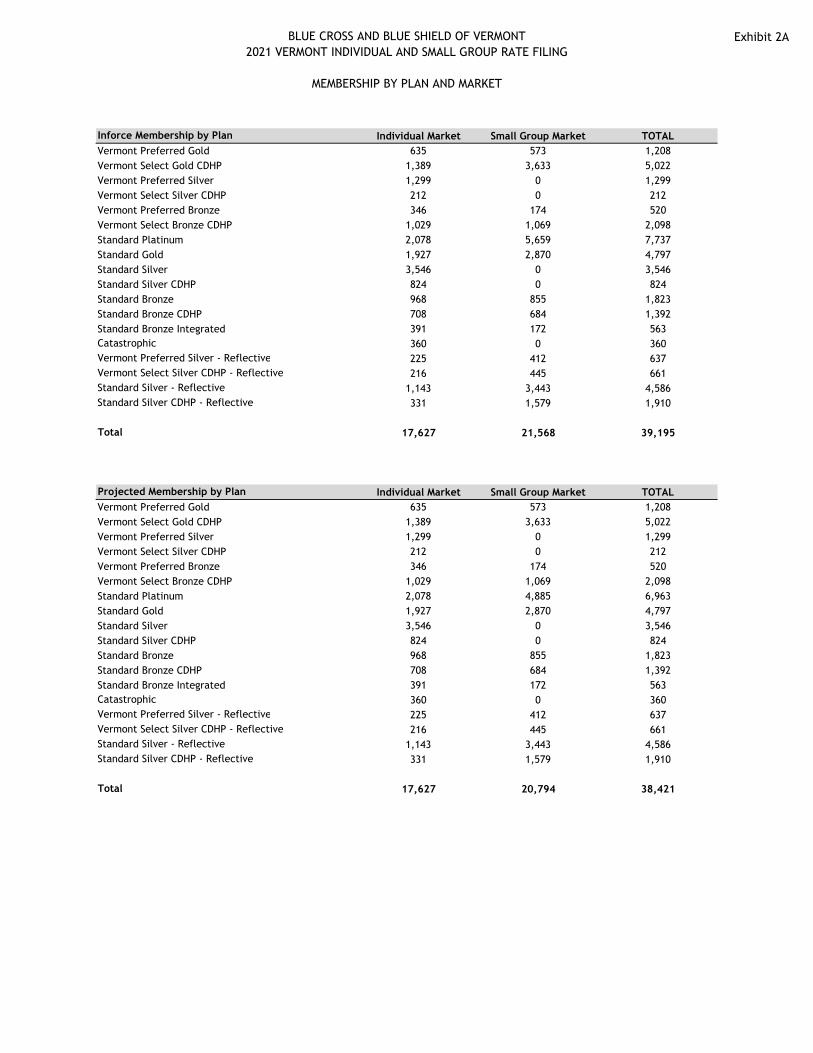
BLUE CROSS AND BLUE SHIELD OF VERMONT
2021 VERMONT INDIVIDUAL AND SMALL GROUP RATE FILING
MEMBERSHIP BY PLAN AND MARKET
Exhibit 2A
Inforce Membership by Plan Individual Market Small Group Market TOTAL
Vermont Preferred Gold 635 573 1,208
Vermont Select Gold CDHP 1,389 3,633 5,022
Vermont Preferred Silver 1,299 0 1,299
Vermont Select Silver CDHP 212 0 212
Vermont Preferred Bronze 346 174 520
Vermont Select Bronze CDHP 1,029 1,069 2,098
Standard Platinum 2,078 5,659 7,737
Standard Gold 1,927 2,870 4,797
Standard Silver 3,546 0 3,546
Standard Silver CDHP 824 0 824
Standard Bronze 968 855 1,823
Standard Bronze CDHP 708 684 1,392
Standard Bronze Integrated 391 172 563
Catastrophic 360 0 360
Vermont Preferred Silver - Reflective 225 412 637
Vermont Select Silver CDHP - Reflective 216 445 661
Standard Silver - Reflective 1,143 3,443 4,586
Standard Silver CDHP - Reflective 331 1,579 1,910
Total 17,627 21,568 39,195
Projected Membership by Plan Individual Market Small Group Market TOTAL
Vermont Preferred Gold 635 573 1,208
Vermont Select Gold CDHP 1,389 3,633 5,022
Vermont Preferred Silver 1,299 0 1,299
Vermont Select Silver CDHP 212 0 212
Vermont Preferred Bronze 346 174 520
Vermont Select Bronze CDHP 1,029 1,069 2,098
Standard Platinum 2,078 4,885 6,963
Standard Gold 1,927 2,870 4,797
Standard Silver 3,546 0 3,546
Standard Silver CDHP 824 0 824
Standard Bronze 968 855 1,823
Standard Bronze CDHP 708 684 1,392
Standard Bronze Integrated 391 172 563
Catastrophic 360 0 360
Vermont Preferred Silver - Reflective 225 412 637
Vermont Select Silver CDHP - Reflective 216 445 661
Standard Silver - Reflective 1,143 3,443 4,586
Standard Silver CDHP - Reflective 331 1,579 1,910
Total 17,627 20,794 38,421

BLUE CROSS AND BLUE SHIELD OF VERMONT
2021 VERMONT INDIVIDUAL AND SMALL GROUP RATE FILING
IMPACT OF ASSOCIATION HEALTH PLANS
Exhibit 2B
Cateogry Medical Claims Pharmacy Claims Dental Claims Vision Claims Member Months
Individual and Small Group 280,759,310 69,554,976 1,026,563 49,766 520,581
AHP groups who enrolled with BCBSVT VISG in 2020 10,146,562 2,623,646 20,013
Medical Claims Pharmacy Claims Dental Claims Vision Claims Total
PMPMs for Individuals and Small Groups (A) $539.32 $133.61 $1.97 $0.10 $675.00
PMPMs including AHP groups enrolled with BCBSVT VISG in 2020 (B) $538.12 $133.52 $1.97 $0.10 $673.71
Impact of Association Health Plans (1+b5 on Exhibit 5) = (A)/(B) = 0.9978 0.9993 1.0009 1.0060 0.9981
Calendar Year 2019 Completed Claims
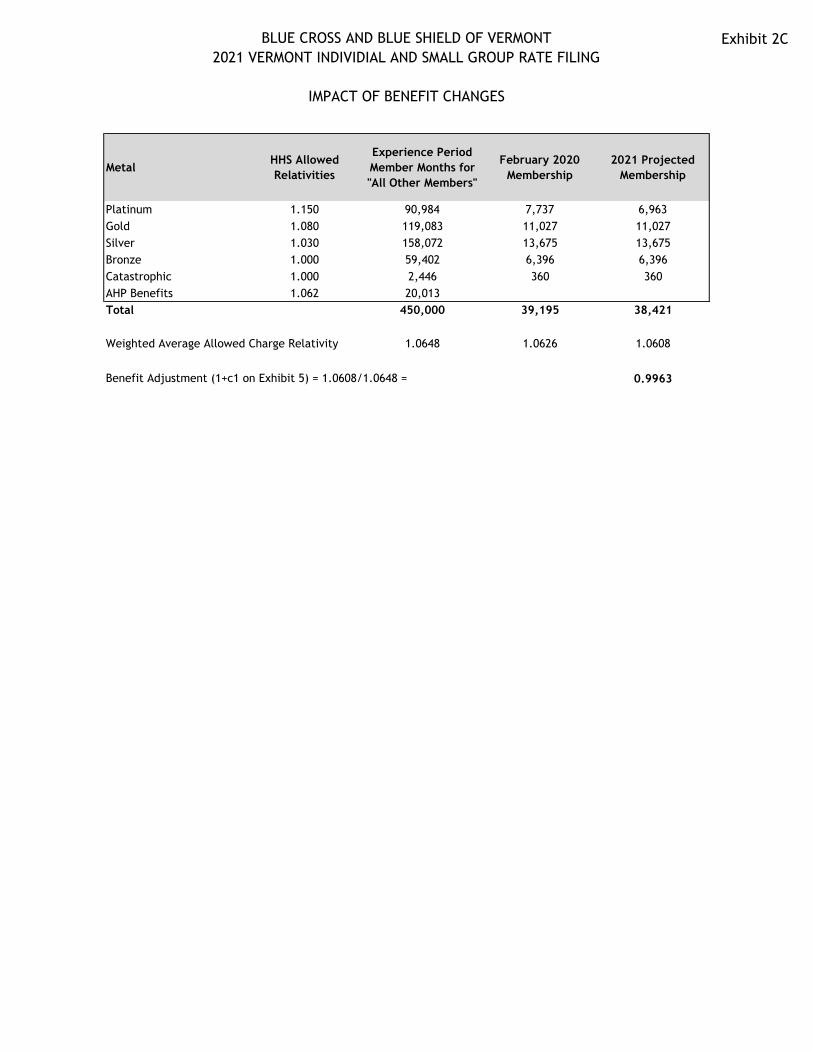
BLUE CROSS AND BLUE SHIELD OF VERMONT
2021 VERMONT INDIVIDIAL AND SMALL GROUP RATE FILING
IMPACT OF BENEFIT CHANGES
Exhibit 2C
MetalHHS Allowed
Relativities
Experience Period
Member Months for
"All Other Members"
February 2020
Membership
2021 Projected
Membership
Platinum 1.150 90,984 7,737 6,963
Gold 1.080 119,083 11,027 11,027
Silver 1.030 158,072 13,675 13,675
Bronze 1.000 59,402 6,396 6,396
Catastrophic 1.000 2,446 360 360
AHP Benefits 1.062 20,013
Total 450,000 39,195 38,421
Weighted Average Allowed Charge Relativity 1.0648 1.0626 1.0608
0.9963Benefit Adjustment (1+c1 on Exhibit 5) = 1.0608/1.0648 =
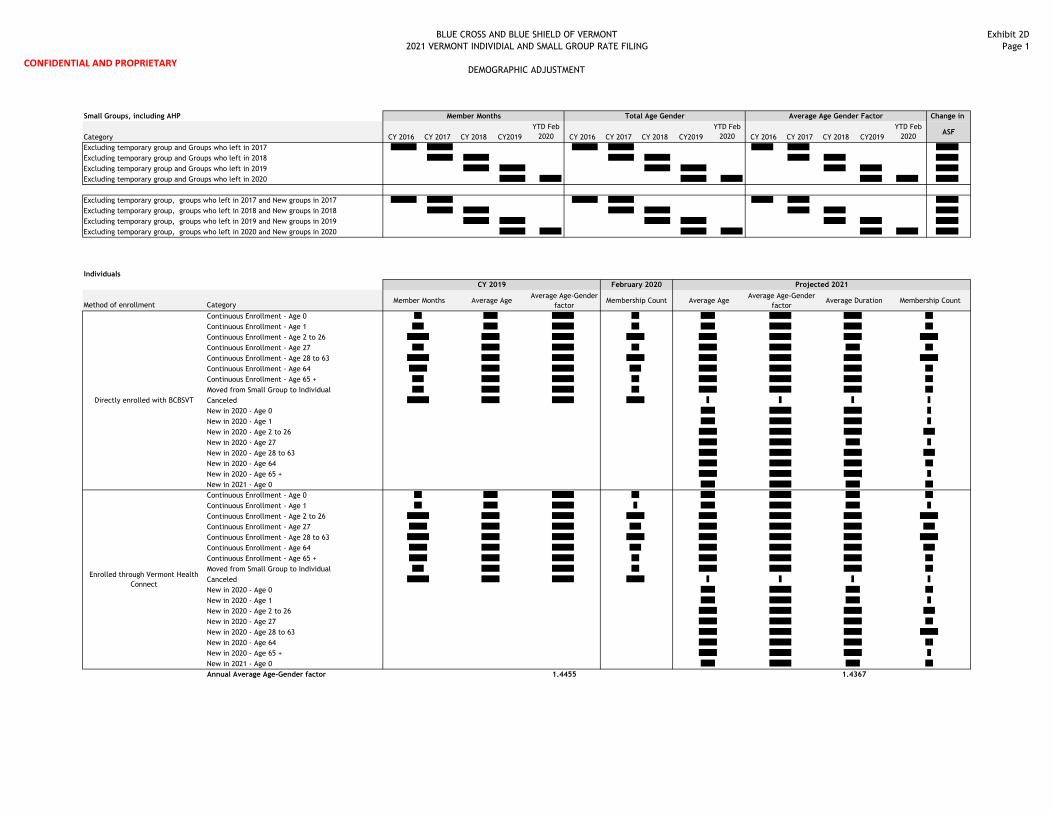
CONFIDENTIAL AND PROPRIETARY
BLUE CROSS AND BLUE SHIELD OF VERMONT
2021 VERMONT INDIVIDIAL AND SMALL GROUP RATE FILING
DEMOGRAPHIC ADJUSTMENT
Exhibit 2D
Page 1
Small Groups, including AHP Change in
Category CY 2016 CY 2017 CY 2018 CY2019
YTD Feb
2020 CY 2016 CY 2017 CY 2018 CY2019
YTD Feb
2020 CY 2016 CY 2017 CY 2018 CY2019
YTD Feb
2020ASF
Individuals
Method of enrollment CategoryMember Months Average Age
Average Age-Gender
factorMembership Count Average Age
Average Age-Gender
factorAverage Duration Membership Count
Continuous Enrollment - Age 0
Continuous Enrollment - Age 1
Continuous Enrollment - Age 2 to 26
Continuous Enrollment - Age 27
Continuous Enrollment - Age 28 to 63
Continuous Enrollment - Age 64
Continuous Enrollment - Age 65 +
Moved from Small Group to Individual
Canceled
New in 2020 - Age 0
New in 2020 - Age 1
New in 2020 - Age 2 to 26
New in 2020 - Age 27
New in 2020 - Age 28 to 63
New in 2020 - Age 64
New in 2020 - Age 65 +
New in 2021 - Age 0
Annual Average Age-Gender factor
Member Months Total Age Gender Average Age Gender Factor
Excluding temporary group and Groups who left in 2017
Excluding temporary group and Groups who left in 2018
Excluding temporary group, groups who left in 2020 and New groups in 2020
CY 2019
Excluding temporary group and Groups who left in 2019
1.4455 1.4367
February 2020 Projected 2021
Directly enrolled with BCBSVT
Enrolled through Vermont Health
Connect
Excluding temporary group and Groups who left in 2020
Excluding temporary group, groups who left in 2017 and New groups in 2017
Excluding temporary group, groups who left in 2018 and New groups in 2018
Excluding temporary group, groups who left in 2019 and New groups in 2019

CONFIDENTIAL AND PROPRIETARY
BLUE CROSS AND BLUE SHIELD OF VERMONT
2021 VERMONT INDIVIDIAL AND SMALL GROUP RATE FILING
DEMOGRAPHIC ADJUSTMENT
Exhibit 2D
Page 2
Combining the Populations Individual Small Group Weighted Average
CY 2019 Average Age-Gender factor 1.4455 1.2005 1.3129
Impact of excluding temporary group and groups that left in 2020
Regular increase for continuing groups
Increase for the impact of new groups
CY 2021 Average Age-Gender factor 1.4367 1.2245 1.3219
Projected Membership 17,627 20,794 38,421
Demographic Adjustment (1+c3 on Exhibit 5) = 1.3219/1.3129 = 1.0069

CONFIDENTIAL AND PROPRIETARYBLUE CROSS AND BLUE SHIELD OF VERMONT
2021 VERMONT INDIVIDUAL AND SMALL GROUP RATE FILING
MEDICAL TREND DEVELOPMENT - INPATIENT
EXHIBIT 3A
PAGE 1
EXHIBIT REDACTED
CONFIDENTIAL AND PROPRIETARYBLUE CROSS AND BLUE SHIELD OF VERMONT
2021 VERMONT INDIVIDUAL AND SMALL GROUP RATE FILING
MEDICAL TREND DEVELOPMENT - OUTPATIENT
EXHIBIT 3A
PAGE 2
EXHIBIT REDACTED

CONFIDENTIAL AND PROPRIETARYBLUE CROSS AND BLUE SHIELD OF VERMONT
2021 VERMONT INDIVIDUAL AND SMALL GROUP RATE FILING
MEDICAL TREND DEVELOPMENT - PROFESSIONAL
EXHIBIT 3A
PAGE 3
EXHIBIT REDACTED

CONFIDENTIAL AND PROPRIETARYBLUE CROSS AND BLUE SHIELD OF VERMONT
2021 VERMONT INDIVIDUAL AND SMALL GROUP RATE FILING
MEDICAL TREND DEVELOPMENT - PHARMACEUTICALS
EXHIBIT 3A
PAGE 4
EXHIBIT REDACTED

CONFIDENTIAL AND PROPRIETARY
BLUE CROSS AND BLUE SHIELD OF VERMONT
2021 VERMONT INDIVIDUAL AND SMALL GROUP RATE FILING
MEDICAL COST TREND DEVELOPMENT - TOTAL TREND
EXHIBIT 3A
PAGE 5
Inpatient Total
Year 0 47,601,830
Year 1 49,235,330
Year 2 50,967,345
Trend Y1/Y0 3.4%
Trend Y2/Y1 3.5%
Annual Cost Trend 3.5%
Outpatient Total
Year 0 95,096,487
Year 1 99,622,900
Year 2 104,368,479
Trend Y1/Y0 4.8%
Trend Y2/Y1 4.8%
Annual Cost Trend 4.8%
Pharmaceuticals Total
Year 0 26,959,975
Year 1 28,130,797
Year 2 29,456,902
Trend Y1/Y0 4.3%
Trend Y2/Y1 4.7%
Annual Cost Trend 4.5%
Professional Total
Year 0 67,271,217
Year 1 67,775,188
Year 2 69,353,602
Trend Y1/Y0 0.7%
Trend Y2/Y1 2.3%
Annual Cost Trend 1.5%
Total Total
Year 0 236,929,510
Year 1 244,764,215
Year 2 254,146,328
Trend Y1/Y0 3.3%
Trend Y2/Y1 3.8%
Annual Cost Trend 3.6%

BLUE CROSS AND BLUE SHIELD OF VERMONT
2021 VERMONT INDIVIDUAL AND SMALL GROUP RATE FILING
MEDICAL TREND DEVELOPMENT - POPULATION ADJUSTMENTS
Exhibit 3B
Page 1
Month Membership
Paid to
Allowed
Ratio
Induced
Utilization
Normalized
Induced
Utilization
Average
Age/Gender
Factor
Normalized
Age/Gender
Factor
FWA FactorNormalized
FWA FactorWorking Days
Nomalized
Working Days
Total
Normalized
Factor
Jan-16 26,634 83.6% 1.103 0.998 1.388 1.027 0.9895 1.003 20 0.949 1.084
Feb-16 26,908 83.6% 1.103 0.999 1.386 1.028 0.990 1.003 20 0.949 1.085
Mar-16 27,492 83.7% 1.104 0.998 1.380 1.033 0.990 1.003 23 1.091 0.948
Apr-16 27,554 83.7% 1.104 0.998 1.379 1.033 0.990 1.003 21 0.996 1.038
May-16 27,625 83.7% 1.104 0.998 1.378 1.034 0.990 1.003 21 0.996 1.039
Jun-16 27,840 83.7% 1.104 0.998 1.381 1.032 0.990 1.003 22 1.043 0.990
Jul-16 28,100 83.8% 1.104 0.998 1.380 1.032 0.990 1.003 20 0.949 1.089
Aug-16 28,322 83.7% 1.104 0.998 1.379 1.033 0.990 1.003 23 1.091 0.948
Sep-16 28,548 83.7% 1.103 0.998 1.378 1.034 0.990 1.003 21 0.996 1.039
Oct-16 28,686 83.7% 1.103 0.998 1.379 1.034 0.990 1.003 21 0.996 1.039
Nov-16 28,720 83.7% 1.104 0.998 1.380 1.033 0.990 1.003 20 0.949 1.090
Dec-16 28,633 83.7% 1.104 0.998 1.383 1.031 0.990 1.003 21 0.996 1.035
Jan-17 28,181 83.5% 1.102 1.000 1.387 1.027 0.989 1.003 21 0.996 1.034
Feb-17 28,546 83.4% 1.102 1.000 1.383 1.030 0.989 1.003 20 0.949 1.089
Mar-17 28,336 83.3% 1.101 1.001 1.382 1.031 0.989 1.003 23 1.091 0.949
Apr-17 28,008 83.3% 1.101 1.001 1.383 1.030 0.989 1.003 20 0.949 1.090
May-17 27,695 83.2% 1.101 1.001 1.385 1.028 0.989 1.003 22 1.043 0.990
Jun-17 27,384 83.2% 1.100 1.001 1.388 1.027 0.989 1.003 22 1.043 0.988
Jul-17 27,181 83.3% 1.101 1.000 1.388 1.026 0.989 1.003 19 0.901 1.143
Aug-17 26,871 83.2% 1.100 1.001 1.389 1.025 0.989 1.003 23 1.091 0.944
Sep-17 26,553 83.2% 1.100 1.001 1.391 1.024 0.989 1.003 20 0.949 1.084
Oct-17 26,251 83.3% 1.101 1.000 1.392 1.023 0.989 1.003 22 1.043 0.984
Nov-17 25,911 83.3% 1.101 1.000 1.394 1.022 0.989 1.003 20 0.949 1.081
Dec-17 25,359 83.3% 1.101 1.000 1.397 1.020 0.989 1.003 20 0.949 1.079
Jan-18 24,001 83.3% 1.101 1.000 1.399 1.019 0.986 1.007 22 1.043 0.983
Feb-18 23,511 83.3% 1.101 1.001 1.401 1.017 0.986 1.007 20 0.949 1.080
Mar-18 23,126 83.3% 1.101 1.000 1.404 1.015 0.986 1.007 22 1.043 0.979
Apr-18 22,798 83.3% 1.101 1.001 1.407 1.013 0.986 1.007 21 0.996 1.024
May-18 22,511 83.3% 1.101 1.001 1.409 1.011 0.986 1.007 22 1.043 0.976
Jun-18 22,306 83.2% 1.100 1.001 1.411 1.009 0.986 1.007 21 0.996 1.021
Jul-18 22,046 83.0% 1.099 1.002 1.414 1.008 0.986 1.007 21 0.996 1.020
Aug-18 21,709 83.0% 1.099 1.002 1.415 1.007 0.986 1.007 23 1.091 0.931
Sep-18 21,412 83.1% 1.100 1.002 1.419 1.004 0.986 1.007 19 0.901 1.123
Oct-18 21,166 83.0% 1.099 1.002 1.423 1.001 0.986 1.007 23 1.091 0.926
Nov-18 20,866 83.1% 1.099 1.002 1.424 1.000 0.986 1.007 20 0.949 1.064
Dec-18 20,602 83.1% 1.099 1.002 1.424 1.001 0.986 1.007 19 0.901 1.120
Jan-19 19,734 83.4% 1.101 1.000 1.424 1.000 0.992 1.000 22 1.043 0.959
Feb-19 19,531 83.4% 1.102 1.000 1.424 1.001 0.992 1.000 20 0.949 1.054
Mar-19 19,330 83.4% 1.102 1.000 1.424 1.000 0.992 1.000 21 0.996 1.004
Apr-19 19,169 83.5% 1.102 0.999 1.425 1.000 0.992 1.000 22 1.043 0.957
May-19 19,035 83.6% 1.103 0.999 1.423 1.001 0.992 1.000 22 1.043 0.958
Jun-19 18,920 83.6% 1.103 0.999 1.424 1.001 0.992 1.000 20 0.949 1.054
Jul-19 18,831 83.5% 1.102 0.999 1.422 1.002 0.992 1.000 21 0.996 1.006
Aug-19 18,705 83.4% 1.102 1.000 1.422 1.002 0.992 1.000 22 1.043 0.960
Sep-19 18,522 83.3% 1.101 1.001 1.422 1.002 0.992 1.000 21 0.996 1.007
Oct-19 18,287 83.3% 1.101 1.001 1.421 1.003 0.992 1.000 22 1.043 0.961
Nov-19 18,096 83.3% 1.101 1.000 1.424 1.000 0.992 1.000 19 0.901 1.111
Dec-19 17,787 83.4% 1.101 1.000 1.425 1.000 0.992 1.000 21 0.996 1.004
Individual Market
Adjustments for Benefits, Aging, Fraud Waste and Abuse Programs and working days
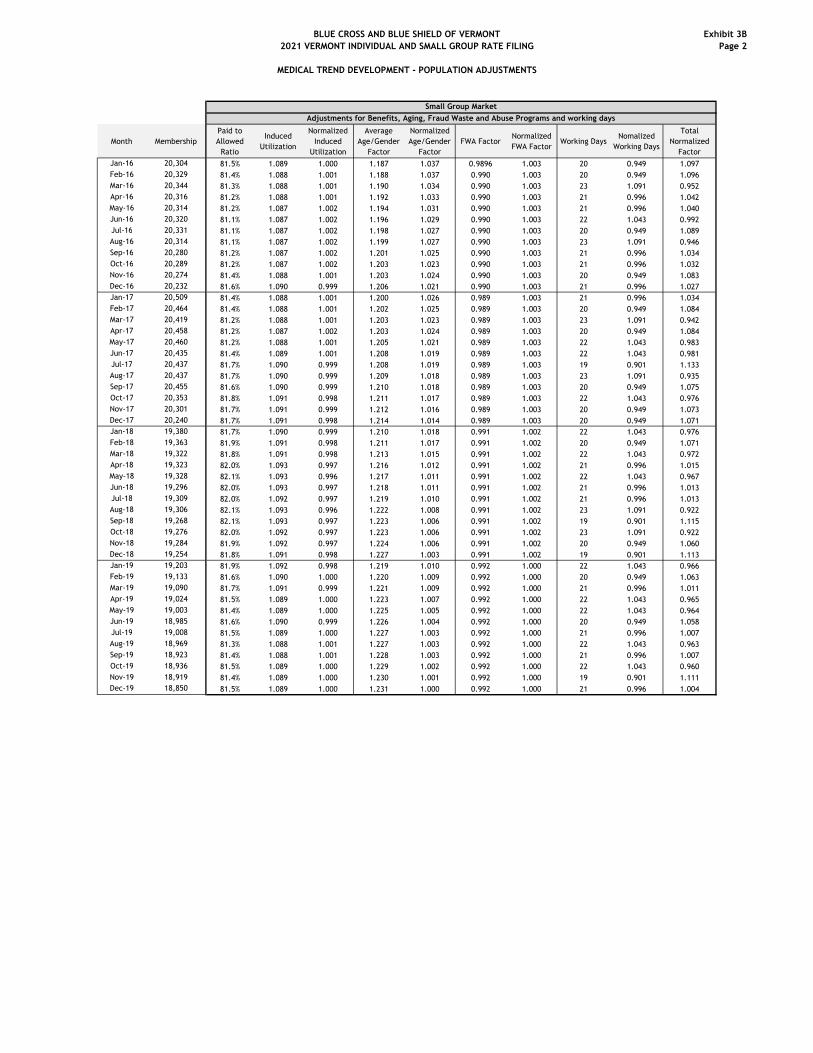
BLUE CROSS AND BLUE SHIELD OF VERMONT
2021 VERMONT INDIVIDUAL AND SMALL GROUP RATE FILING
MEDICAL TREND DEVELOPMENT - POPULATION ADJUSTMENTS
Exhibit 3B
Page 2
Month Membership
Paid to
Allowed
Ratio
Induced
Utilization
Normalized
Induced
Utilization
Average
Age/Gender
Factor
Normalized
Age/Gender
Factor
FWA FactorNormalized
FWA FactorWorking Days
Nomalized
Working Days
Total
Normalized
Factor
Jan-16 20,304 81.5% 1.089 1.000 1.187 1.037 0.9896 1.003 20 0.949 1.097
Feb-16 20,329 81.4% 1.088 1.001 1.188 1.037 0.990 1.003 20 0.949 1.096
Mar-16 20,344 81.3% 1.088 1.001 1.190 1.034 0.990 1.003 23 1.091 0.952
Apr-16 20,316 81.2% 1.088 1.001 1.192 1.033 0.990 1.003 21 0.996 1.042
May-16 20,314 81.2% 1.087 1.002 1.194 1.031 0.990 1.003 21 0.996 1.040
Jun-16 20,320 81.1% 1.087 1.002 1.196 1.029 0.990 1.003 22 1.043 0.992
Jul-16 20,331 81.1% 1.087 1.002 1.198 1.027 0.990 1.003 20 0.949 1.089
Aug-16 20,314 81.1% 1.087 1.002 1.199 1.027 0.990 1.003 23 1.091 0.946
Sep-16 20,280 81.2% 1.087 1.002 1.201 1.025 0.990 1.003 21 0.996 1.034
Oct-16 20,289 81.2% 1.087 1.002 1.203 1.023 0.990 1.003 21 0.996 1.032
Nov-16 20,274 81.4% 1.088 1.001 1.203 1.024 0.990 1.003 20 0.949 1.083
Dec-16 20,232 81.6% 1.090 0.999 1.206 1.021 0.990 1.003 21 0.996 1.027
Jan-17 20,509 81.4% 1.088 1.001 1.200 1.026 0.989 1.003 21 0.996 1.034
Feb-17 20,464 81.4% 1.088 1.001 1.202 1.025 0.989 1.003 20 0.949 1.084
Mar-17 20,419 81.2% 1.088 1.001 1.203 1.023 0.989 1.003 23 1.091 0.942
Apr-17 20,458 81.2% 1.087 1.002 1.203 1.024 0.989 1.003 20 0.949 1.084
May-17 20,460 81.2% 1.088 1.001 1.205 1.021 0.989 1.003 22 1.043 0.983
Jun-17 20,435 81.4% 1.089 1.001 1.208 1.019 0.989 1.003 22 1.043 0.981
Jul-17 20,437 81.7% 1.090 0.999 1.208 1.019 0.989 1.003 19 0.901 1.133
Aug-17 20,437 81.7% 1.090 0.999 1.209 1.018 0.989 1.003 23 1.091 0.935
Sep-17 20,455 81.6% 1.090 0.999 1.210 1.018 0.989 1.003 20 0.949 1.075
Oct-17 20,353 81.8% 1.091 0.998 1.211 1.017 0.989 1.003 22 1.043 0.976
Nov-17 20,301 81.7% 1.091 0.999 1.212 1.016 0.989 1.003 20 0.949 1.073
Dec-17 20,240 81.7% 1.091 0.998 1.214 1.014 0.989 1.003 20 0.949 1.071
Jan-18 19,380 81.7% 1.090 0.999 1.210 1.018 0.991 1.002 22 1.043 0.976
Feb-18 19,363 81.9% 1.091 0.998 1.211 1.017 0.991 1.002 20 0.949 1.071
Mar-18 19,322 81.8% 1.091 0.998 1.213 1.015 0.991 1.002 22 1.043 0.972
Apr-18 19,323 82.0% 1.093 0.997 1.216 1.012 0.991 1.002 21 0.996 1.015
May-18 19,328 82.1% 1.093 0.996 1.217 1.011 0.991 1.002 22 1.043 0.967
Jun-18 19,296 82.0% 1.093 0.997 1.218 1.011 0.991 1.002 21 0.996 1.013
Jul-18 19,309 82.0% 1.092 0.997 1.219 1.010 0.991 1.002 21 0.996 1.013
Aug-18 19,306 82.1% 1.093 0.996 1.222 1.008 0.991 1.002 23 1.091 0.922
Sep-18 19,268 82.1% 1.093 0.997 1.223 1.006 0.991 1.002 19 0.901 1.115
Oct-18 19,276 82.0% 1.092 0.997 1.223 1.006 0.991 1.002 23 1.091 0.922
Nov-18 19,284 81.9% 1.092 0.997 1.224 1.006 0.991 1.002 20 0.949 1.060
Dec-18 19,254 81.8% 1.091 0.998 1.227 1.003 0.991 1.002 19 0.901 1.113
Jan-19 19,203 81.9% 1.092 0.998 1.219 1.010 0.992 1.000 22 1.043 0.966
Feb-19 19,133 81.6% 1.090 1.000 1.220 1.009 0.992 1.000 20 0.949 1.063
Mar-19 19,090 81.7% 1.091 0.999 1.221 1.009 0.992 1.000 21 0.996 1.011
Apr-19 19,024 81.5% 1.089 1.000 1.223 1.007 0.992 1.000 22 1.043 0.965
May-19 19,003 81.4% 1.089 1.000 1.225 1.005 0.992 1.000 22 1.043 0.964
Jun-19 18,985 81.6% 1.090 0.999 1.226 1.004 0.992 1.000 20 0.949 1.058
Jul-19 19,008 81.5% 1.089 1.000 1.227 1.003 0.992 1.000 21 0.996 1.007
Aug-19 18,969 81.3% 1.088 1.001 1.227 1.003 0.992 1.000 22 1.043 0.963
Sep-19 18,923 81.4% 1.088 1.001 1.228 1.003 0.992 1.000 21 0.996 1.007
Oct-19 18,936 81.5% 1.089 1.000 1.229 1.002 0.992 1.000 22 1.043 0.960
Nov-19 18,919 81.4% 1.089 1.000 1.230 1.001 0.992 1.000 19 0.901 1.111
Dec-19 18,850 81.5% 1.089 1.000 1.231 1.000 0.992 1.000 21 0.996 1.004
Small Group Market
Adjustments for Benefits, Aging, Fraud Waste and Abuse Programs and working days
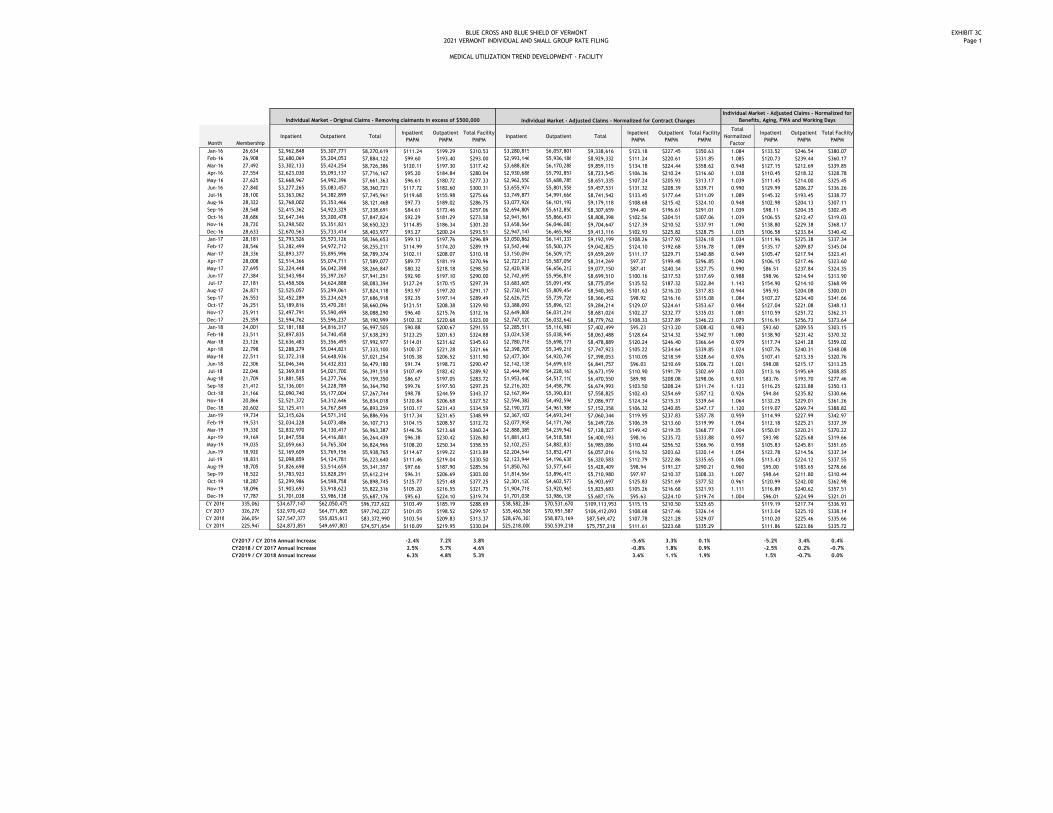
BLUE CROSS AND BLUE SHIELD OF VERMONT
2021 VERMONT INDIVIDUAL AND SMALL GROUP RATE FILING
MEDICAL UTILIZATION TREND DEVELOPMENT - FACILITY
EXHIBIT 3C
Page 1
Month Membership
Inpatient Outpatient TotalInpatient
PMPM
Outpatient
PMPM
Total Facility
PMPMInpatient Outpatient Total
Inpatient
PMPM
Outpatient
PMPM
Total Facility
PMPM
Total
Normalized
Factor
Inpatient
PMPM
Outpatient
PMPM
Total Facility
PMPM
Jan-16 26,634 $2,962,848 $5,307,771 $8,270,619 $111.24 $199.29 $310.53 $3,280,815 $6,057,801 $9,338,616 $123.18 $227.45 $350.63 1.084 $133.52 $246.54 $380.07
Feb-16 26,908 $2,680,069 $5,204,053 $7,884,122 $99.60 $193.40 $293.00 $2,993,146 $5,936,186 $8,929,332 $111.24 $220.61 $331.85 1.085 $120.73 $239.44 $360.17
Mar-16 27,492 $3,302,133 $5,424,254 $8,726,386 $120.11 $197.30 $317.42 $3,688,826 $6,170,288 $9,859,115 $134.18 $224.44 $358.62 0.948 $127.15 $212.69 $339.85
Apr-16 27,554 $2,623,030 $5,093,137 $7,716,167 $95.20 $184.84 $280.04 $2,930,688 $5,792,857 $8,723,545 $106.36 $210.24 $316.60 1.038 $110.45 $218.32 $328.78
May-16 27,625 $2,668,967 $4,992,396 $7,661,363 $96.61 $180.72 $277.33 $2,962,550 $5,688,785 $8,651,335 $107.24 $205.93 $313.17 1.039 $111.45 $214.00 $325.45
Jun-16 27,840 $3,277,265 $5,083,457 $8,360,721 $117.72 $182.60 $300.31 $3,655,974 $5,801,558 $9,457,531 $131.32 $208.39 $339.71 0.990 $129.99 $206.27 $336.26
Jul-16 28,100 $3,363,062 $4,382,899 $7,745,961 $119.68 $155.98 $275.66 $3,749,877 $4,991,666 $8,741,542 $133.45 $177.64 $311.09 1.089 $145.32 $193.45 $338.77
Aug-16 28,322 $2,768,002 $5,353,466 $8,121,468 $97.73 $189.02 $286.75 $3,077,926 $6,101,192 $9,179,118 $108.68 $215.42 $324.10 0.948 $102.98 $204.13 $307.11
Sep-16 28,548 $2,415,362 $4,923,329 $7,338,691 $84.61 $172.46 $257.06 $2,694,809 $5,612,850 $8,307,659 $94.40 $196.61 $291.01 1.039 $98.11 $204.35 $302.45
Oct-16 28,686 $2,647,346 $5,200,478 $7,847,824 $92.29 $181.29 $273.58 $2,941,961 $5,866,437 $8,808,398 $102.56 $204.51 $307.06 1.039 $106.55 $212.47 $319.03
Nov-16 28,720 $3,298,502 $5,351,821 $8,650,323 $114.85 $186.34 $301.20 $3,658,564 $6,046,083 $9,704,647 $127.39 $210.52 $337.91 1.090 $138.80 $229.38 $368.17
Dec-16 28,633 $2,670,563 $5,733,414 $8,403,977 $93.27 $200.24 $293.51 $2,947,147 $6,465,968 $9,413,116 $102.93 $225.82 $328.75 1.035 $106.58 $233.84 $340.42
Jan-17 28,181 $2,793,526 $5,573,126 $8,366,653 $99.13 $197.76 $296.89 $3,050,862 $6,141,337 $9,192,199 $108.26 $217.92 $326.18 1.034 $111.96 $225.38 $337.34
Feb-17 28,546 $3,282,499 $4,972,712 $8,255,211 $114.99 $174.20 $289.19 $3,542,446 $5,500,379 $9,042,825 $124.10 $192.68 $316.78 1.089 $135.17 $209.87 $345.04
Mar-17 28,336 $2,893,377 $5,895,996 $8,789,374 $102.11 $208.07 $310.18 $3,150,094 $6,509,175 $9,659,269 $111.17 $229.71 $340.88 0.949 $105.47 $217.94 $323.41
Apr-17 28,008 $2,514,366 $5,074,711 $7,589,077 $89.77 $181.19 $270.96 $2,727,213 $5,587,056 $8,314,269 $97.37 $199.48 $296.85 1.090 $106.15 $217.46 $323.60
May-17 27,695 $2,224,448 $6,042,398 $8,266,847 $80.32 $218.18 $298.50 $2,420,938 $6,656,212 $9,077,150 $87.41 $240.34 $327.75 0.990 $86.51 $237.84 $324.35
Jun-17 27,384 $2,543,984 $5,397,267 $7,941,251 $92.90 $197.10 $290.00 $2,742,695 $5,956,816 $8,699,510 $100.16 $217.53 $317.69 0.988 $98.96 $214.94 $313.90
Jul-17 27,181 $3,458,506 $4,624,888 $8,083,394 $127.24 $170.15 $297.39 $3,683,605 $5,091,450 $8,775,054 $135.52 $187.32 $322.84 1.143 $154.90 $214.10 $368.99
Aug-17 26,871 $2,525,057 $5,299,061 $7,824,118 $93.97 $197.20 $291.17 $2,730,910 $5,809,454 $8,540,365 $101.63 $216.20 $317.83 0.944 $95.93 $204.08 $300.01
Sep-17 26,553 $2,452,289 $5,234,629 $7,686,918 $92.35 $197.14 $289.49 $2,626,725 $5,739,726 $8,366,452 $98.92 $216.16 $315.08 1.084 $107.27 $234.40 $341.66
Oct-17 26,251 $3,189,816 $5,470,281 $8,660,096 $121.51 $208.38 $329.90 $3,388,092 $5,896,123 $9,284,214 $129.07 $224.61 $353.67 0.984 $127.04 $221.08 $348.13
Nov-17 25,911 $2,497,791 $5,590,499 $8,088,290 $96.40 $215.76 $312.16 $2,649,808 $6,031,216 $8,681,024 $102.27 $232.77 $335.03 1.081 $110.59 $251.72 $362.31
Dec-17 25,359 $2,594,762 $5,596,237 $8,190,999 $102.32 $220.68 $323.00 $2,747,120 $6,032,642 $8,779,762 $108.33 $237.89 $346.22 1.079 $116.91 $256.73 $373.64
Jan-18 24,001 $2,181,188 $4,816,317 $6,997,505 $90.88 $200.67 $291.55 $2,285,511 $5,116,987 $7,402,499 $95.23 $213.20 $308.42 0.983 $93.60 $209.55 $303.15
Feb-18 23,511 $2,897,835 $4,740,458 $7,638,293 $123.25 $201.63 $324.88 $3,024,538 $5,038,949 $8,063,488 $128.64 $214.32 $342.97 1.080 $138.90 $231.42 $370.32
Mar-18 23,126 $2,636,483 $5,356,495 $7,992,977 $114.01 $231.62 $345.63 $2,780,718 $5,698,171 $8,478,889 $120.24 $246.40 $366.64 0.979 $117.74 $241.28 $359.02
Apr-18 22,798 $2,288,279 $5,044,821 $7,333,100 $100.37 $221.28 $321.66 $2,398,705 $5,349,218 $7,747,923 $105.22 $234.64 $339.85 1.024 $107.76 $240.31 $348.08
May-18 22,511 $2,372,318 $4,648,936 $7,021,254 $105.38 $206.52 $311.90 $2,477,304 $4,920,749 $7,398,053 $110.05 $218.59 $328.64 0.976 $107.41 $213.35 $320.76
Jun-18 22,306 $2,046,346 $4,432,833 $6,479,180 $91.74 $198.73 $290.47 $2,142,138 $4,699,618 $6,841,757 $96.03 $210.69 $306.72 1.021 $98.08 $215.17 $313.25
Jul-18 22,046 $2,369,818 $4,021,700 $6,391,518 $107.49 $182.42 $289.92 $2,444,996 $4,228,163 $6,673,159 $110.90 $191.79 $302.69 1.020 $113.16 $195.69 $308.85
Aug-18 21,709 $1,881,585 $4,277,766 $6,159,350 $86.67 $197.05 $283.72 $1,953,440 $4,517,110 $6,470,550 $89.98 $208.08 $298.06 0.931 $83.76 $193.70 $277.46
Sep-18 21,412 $2,136,001 $4,228,789 $6,364,790 $99.76 $197.50 $297.25 $2,216,203 $4,458,790 $6,674,993 $103.50 $208.24 $311.74 1.123 $116.25 $233.88 $350.13
Oct-18 21,166 $2,090,740 $5,177,004 $7,267,744 $98.78 $244.59 $343.37 $2,167,994 $5,390,831 $7,558,825 $102.43 $254.69 $357.12 0.926 $94.84 $235.82 $330.66
Nov-18 20,866 $2,521,372 $4,312,646 $6,834,018 $120.84 $206.68 $327.52 $2,594,382 $4,492,596 $7,086,977 $124.34 $215.31 $339.64 1.064 $132.25 $229.01 $361.26
Dec-18 20,602 $2,125,411 $4,767,849 $6,893,259 $103.17 $231.43 $334.59 $2,190,372 $4,961,986 $7,152,358 $106.32 $240.85 $347.17 1.120 $119.07 $269.74 $388.82
Jan-19 19,734 $2,315,626 $4,571,310 $6,886,936 $117.34 $231.65 $348.99 $2,367,102 $4,693,241 $7,060,344 $119.95 $237.83 $357.78 0.959 $114.99 $227.99 $342.97
Feb-19 19,531 $2,034,228 $4,073,486 $6,107,713 $104.15 $208.57 $312.72 $2,077,958 $4,171,768 $6,249,726 $106.39 $213.60 $319.99 1.054 $112.18 $225.21 $337.39
Mar-19 19,330 $2,832,970 $4,130,417 $6,963,387 $146.56 $213.68 $360.24 $2,888,385 $4,239,942 $7,128,327 $149.42 $219.35 $368.77 1.004 $150.01 $220.21 $370.22
Apr-19 19,169 $1,847,558 $4,416,881 $6,264,439 $96.38 $230.42 $326.80 $1,881,612 $4,518,581 $6,400,193 $98.16 $235.72 $333.88 0.957 $93.98 $225.68 $319.66
May-19 19,035 $2,059,663 $4,765,304 $6,824,966 $108.20 $250.34 $358.55 $2,102,253 $4,882,833 $6,985,086 $110.44 $256.52 $366.96 0.958 $105.83 $245.81 $351.65
Jun-19 18,920 $2,169,609 $3,769,156 $5,938,765 $114.67 $199.22 $313.89 $2,204,544 $3,852,471 $6,057,016 $116.52 $203.62 $320.14 1.054 $122.78 $214.56 $337.34
Jul-19 18,831 $2,098,859 $4,124,781 $6,223,640 $111.46 $219.04 $330.50 $2,123,944 $4,196,638 $6,320,583 $112.79 $222.86 $335.65 1.006 $113.43 $224.12 $337.55
Aug-19 18,705 $1,826,698 $3,514,659 $5,341,357 $97.66 $187.90 $285.56 $1,850,762 $3,577,647 $5,428,409 $98.94 $191.27 $290.21 0.960 $95.00 $183.65 $278.66
Sep-19 18,522 $1,783,923 $3,828,291 $5,612,214 $96.31 $206.69 $303.00 $1,814,564 $3,896,415 $5,710,980 $97.97 $210.37 $308.33 1.007 $98.64 $211.80 $310.44
Oct-19 18,287 $2,299,986 $4,598,758 $6,898,745 $125.77 $251.48 $377.25 $2,301,120 $4,602,577 $6,903,697 $125.83 $251.69 $377.52 0.961 $120.99 $242.00 $362.98
Nov-19 18,096 $1,903,693 $3,918,623 $5,822,316 $105.20 $216.55 $321.75 $1,904,718 $3,920,965 $5,825,683 $105.26 $216.68 $321.93 1.111 $116.89 $240.62 $357.51
Dec-19 17,787 $1,701,038 $3,986,138 $5,687,176 $95.63 $224.10 $319.74 $1,701,038 $3,986,138 $5,687,176 $95.63 $224.10 $319.74 1.004 $96.01 $224.99 $321.01
CY 2016 335,062 $34,677,147 $62,050,475 $96,727,622 $103.49 $185.19 $288.69 $38,582,284 $70,531,670 $109,113,953 $115.15 $210.50 $325.65 $119.19 $217.74 $336.93
CY 2017 326,276 $32,970,422 $64,771,805 $97,742,227 $101.05 $198.52 $299.57 $35,460,506 $70,951,587 $106,412,093 $108.68 $217.46 $326.14 $113.04 $225.10 $338.14
CY 2018 266,054 $27,547,377 $55,825,613 $83,372,990 $103.54 $209.83 $313.37 $28,676,303 $58,873,169 $87,549,472 $107.78 $221.28 $329.07 $110.20 $225.46 $335.66
CY 2019 225,947 $24,873,851 $49,697,803 $74,571,654 $110.09 $219.95 $330.04 $25,218,000 $50,539,218 $75,757,218 $111.61 $223.68 $335.29 $111.86 $223.86 $335.72
CY2017 / CY 2016 Annual Increase -2.4% 7.2% 3.8% -5.6% 3.3% 0.1% -5.2% 3.4% 0.4%
CY2018 / CY 2017 Annual Increase 2.5% 5.7% 4.6% -0.8% 1.8% 0.9% -2.5% 0.2% -0.7%
CY2019 / CY 2018 Annual Increase 6.3% 4.8% 5.3% 3.6% 1.1% 1.9% 1.5% -0.7% 0.0%
Individual Market - Original Claims - Removing claimants in excess of $500,000 Individual Market - Adjusted Claims - Normalized for Contract Changes
Individual Market - Adjusted Claims - Normalized for
Benefits, Aging, FWA and Working Days

BLUE CROSS AND BLUE SHIELD OF VERMONT
2021 VERMONT INDIVIDUAL AND SMALL GROUP RATE FILING
MEDICAL UTILIZATION TREND DEVELOPMENT - FACILITY
EXHIBIT 3C
Page 2
Month Membership
Inpatient Outpatient TotalInpatient
PMPM
Outpatient
PMPM
Total Facility
PMPMInpatient Outpatient Total
Inpatient
PMPM
Outpatient
PMPM
Total Facility
PMPM
Total
Normalized
Factor
Inpatient
PMPM
Outpatient
PMPM
Total Facility
PMPM
Jan-16 20,304 $1,442,611 $3,335,745 $4,778,356 $71.05 $164.29 $235.34 $1,605,425 $3,780,388 $5,385,813 $79.07 $186.19 $265.26 1.097 $86.71 $204.18 $290.90
Feb-16 20,329 $1,391,862 $3,084,577 $4,476,439 $68.47 $151.73 $220.20 $1,547,516 $3,494,447 $5,041,964 $76.12 $171.89 $248.02 1.096 $83.47 $188.48 $271.95
Mar-16 20,344 $1,536,891 $3,489,558 $5,026,450 $75.55 $171.53 $247.07 $1,715,874 $3,954,645 $5,670,519 $84.34 $194.39 $278.73 0.952 $80.29 $185.05 $265.34
Apr-16 20,316 $1,663,493 $3,098,718 $4,762,211 $81.88 $152.53 $234.41 $1,848,274 $3,511,340 $5,359,613 $90.98 $172.84 $263.81 1.042 $94.76 $180.03 $274.79
May-16 20,314 $1,039,917 $3,385,959 $4,425,876 $51.19 $166.68 $217.87 $1,153,340 $3,854,836 $5,008,176 $56.78 $189.76 $246.54 1.040 $59.02 $197.28 $256.30
Jun-16 20,320 $1,337,849 $3,248,116 $4,585,964 $65.84 $159.85 $225.69 $1,498,845 $3,699,684 $5,198,528 $73.76 $182.07 $255.83 0.992 $73.14 $180.54 $253.68
Jul-16 20,331 $1,633,214 $3,051,064 $4,684,279 $80.33 $150.07 $230.40 $1,812,550 $3,476,820 $5,289,370 $89.15 $171.01 $260.16 1.089 $97.06 $186.18 $283.25
Aug-16 20,314 $1,551,827 $3,196,498 $4,748,325 $76.39 $157.35 $233.75 $1,723,262 $3,628,874 $5,352,136 $84.83 $178.64 $263.47 0.946 $80.28 $169.04 $249.32
Sep-16 20,280 $1,998,192 $3,343,321 $5,341,514 $98.53 $164.86 $263.39 $2,212,505 $3,783,818 $5,996,323 $109.10 $186.58 $295.68 1.034 $112.83 $192.95 $305.78
Oct-16 20,289 $1,453,297 $3,618,084 $5,071,381 $71.63 $178.33 $249.96 $1,626,556 $4,073,134 $5,699,690 $80.17 $200.76 $280.93 1.032 $82.74 $207.20 $289.95
Nov-16 20,274 $1,873,221 $3,683,744 $5,556,966 $92.40 $181.70 $274.09 $2,078,358 $4,133,813 $6,212,171 $102.51 $203.90 $306.41 1.083 $111.00 $220.77 $331.77
Dec-16 20,232 $2,194,147 $3,677,209 $5,871,356 $108.45 $181.75 $290.20 $2,453,055 $4,127,327 $6,580,382 $121.25 $204.00 $325.25 1.027 $124.51 $209.50 $334.01
Jan-17 20,509 $1,970,720 $3,460,769 $5,431,489 $96.09 $168.74 $264.83 $2,140,168 $3,816,996 $5,957,164 $104.35 $186.11 $290.47 1.034 $107.93 $192.49 $300.42
Feb-17 20,464 $1,408,723 $3,243,301 $4,652,024 $68.84 $158.49 $227.33 $1,534,888 $3,580,697 $5,115,585 $75.00 $174.98 $249.98 1.084 $81.33 $189.73 $271.06
Mar-17 20,419 $1,435,067 $3,736,353 $5,171,420 $70.28 $182.98 $253.27 $1,547,946 $4,115,562 $5,663,508 $75.81 $201.56 $277.36 0.942 $71.45 $189.96 $261.40
Apr-17 20,458 $1,639,000 $3,296,079 $4,935,080 $80.12 $161.11 $241.23 $1,774,758 $3,638,728 $5,413,486 $86.75 $177.86 $264.61 1.084 $94.06 $192.85 $286.91
May-17 20,460 $1,672,061 $3,586,829 $5,258,890 $81.72 $175.31 $257.03 $1,810,713 $3,952,375 $5,763,088 $88.50 $193.18 $281.68 0.983 $87.01 $189.93 $276.94
Jun-17 20,435 $1,725,580 $3,482,878 $5,208,458 $84.44 $170.44 $254.88 $1,851,959 $3,846,421 $5,698,380 $90.63 $188.23 $278.85 0.981 $88.86 $184.56 $273.43
Jul-17 20,437 $2,393,108 $3,464,065 $5,857,173 $117.10 $169.50 $286.60 $2,559,159 $3,804,152 $6,363,311 $125.22 $186.14 $311.36 1.133 $141.91 $210.95 $352.86
Aug-17 20,437 $1,582,115 $3,542,201 $5,124,316 $77.41 $173.32 $250.74 $1,707,840 $3,885,461 $5,593,301 $83.57 $190.12 $273.69 0.935 $78.16 $177.83 $255.99
Sep-17 20,455 $1,487,474 $3,483,002 $4,970,476 $72.72 $170.28 $243.00 $1,591,791 $3,817,789 $5,409,580 $77.82 $186.64 $264.46 1.075 $83.68 $200.71 $284.39
Oct-17 20,353 $2,801,202 $3,911,821 $6,713,023 $137.63 $192.20 $329.83 $2,981,020 $4,207,184 $7,188,204 $146.47 $206.71 $353.18 0.976 $142.93 $201.73 $344.66
Nov-17 20,301 $1,460,231 $3,845,952 $5,306,183 $71.93 $189.45 $261.38 $1,543,553 $4,152,390 $5,695,944 $76.03 $204.54 $280.57 1.073 $81.57 $219.42 $300.99
Dec-17 20,240 $2,091,167 $3,566,896 $5,658,063 $103.32 $176.23 $279.55 $2,207,791 $3,841,085 $6,048,875 $109.08 $189.78 $298.86 1.071 $116.82 $203.24 $320.06
Jan-18 19,380 $1,863,044 $3,847,962 $5,711,005 $96.13 $198.55 $294.69 $1,946,409 $4,088,874 $6,035,283 $100.43 $210.98 $311.42 0.976 $98.02 $205.91 $303.93
Feb-18 19,363 $1,903,846 $3,642,779 $5,546,625 $98.32 $188.13 $286.45 $1,980,753 $3,870,211 $5,850,964 $102.30 $199.88 $302.17 1.071 $109.60 $214.15 $323.74
Mar-18 19,322 $1,497,102 $3,760,483 $5,257,585 $77.48 $194.62 $272.10 $1,566,850 $3,987,446 $5,554,296 $81.09 $206.37 $287.46 0.972 $78.85 $200.67 $279.52
Apr-18 19,323 $2,547,744 $3,716,190 $6,263,933 $131.85 $192.32 $324.17 $2,652,533 $3,938,594 $6,591,127 $137.27 $203.83 $341.10 1.015 $139.36 $206.93 $346.29
May-18 19,328 $1,592,959 $3,785,445 $5,378,404 $82.42 $195.85 $278.27 $1,646,701 $3,998,458 $5,645,159 $85.20 $206.87 $292.07 0.967 $82.42 $200.14 $282.56
Jun-18 19,296 $1,793,305 $3,575,686 $5,368,991 $92.94 $185.31 $278.24 $1,851,148 $3,785,292 $5,636,439 $95.93 $196.17 $292.10 1.013 $97.20 $198.76 $295.96
Jul-18 19,309 $2,138,376 $3,349,778 $5,488,154 $110.75 $173.48 $284.23 $2,213,307 $3,532,855 $5,746,162 $114.63 $182.96 $297.59 1.013 $116.12 $185.35 $301.47
Aug-18 19,306 $2,226,922 $3,406,755 $5,633,677 $115.35 $176.46 $291.81 $2,307,184 $3,598,520 $5,905,704 $119.51 $186.39 $305.90 0.922 $110.19 $171.87 $282.06
Sep-18 19,268 $1,535,081 $3,181,812 $4,716,892 $79.67 $165.13 $244.80 $1,600,438 $3,353,274 $4,953,713 $83.06 $174.03 $257.10 1.115 $92.62 $194.07 $286.69
Oct-18 19,276 $1,699,904 $3,965,839 $5,665,744 $88.19 $205.74 $293.93 $1,740,456 $4,122,998 $5,863,454 $90.29 $213.89 $304.18 0.922 $83.22 $197.14 $280.35
Nov-18 19,284 $1,351,747 $3,801,820 $5,153,567 $70.10 $197.15 $267.25 $1,391,763 $3,951,947 $5,343,710 $72.17 $204.93 $277.11 1.060 $76.48 $217.18 $293.66
Dec-18 19,254 $1,375,864 $3,918,624 $5,294,488 $71.46 $203.52 $274.98 $1,412,481 $4,069,818 $5,482,298 $73.36 $211.38 $284.74 1.113 $81.68 $235.35 $317.03
Jan-19 19,203 $1,895,480 $4,353,046 $6,248,526 $98.71 $226.69 $325.39 $1,949,515 $4,471,013 $6,420,528 $101.52 $232.83 $334.35 0.966 $98.04 $224.84 $322.88
Feb-19 19,133 $1,796,039 $3,467,117 $5,263,156 $93.87 $181.21 $275.08 $1,838,480 $3,559,846 $5,398,326 $96.09 $186.06 $282.15 1.063 $102.16 $197.81 $299.97
Mar-19 19,090 $2,320,482 $3,920,654 $6,241,136 $121.55 $205.38 $326.93 $2,350,252 $4,019,355 $6,369,606 $123.11 $210.55 $333.66 1.011 $124.50 $212.91 $337.41
Apr-19 19,024 $1,891,357 $3,765,132 $5,656,488 $99.42 $197.91 $297.33 $1,926,221 $3,861,711 $5,787,932 $101.25 $202.99 $304.24 0.965 $97.69 $195.85 $293.55
May-19 19,003 $1,888,717 $3,614,874 $5,503,591 $99.39 $190.23 $289.62 $1,918,519 $3,704,898 $5,623,418 $100.96 $194.96 $295.92 0.964 $97.28 $187.85 $285.13
Jun-19 18,985 $2,286,777 $3,630,840 $5,917,617 $120.45 $191.25 $311.70 $2,327,903 $3,717,927 $6,045,831 $122.62 $195.83 $318.45 1.058 $129.72 $207.18 $336.90
Jul-19 19,008 $1,781,713 $3,934,667 $5,716,380 $93.73 $207.00 $300.74 $1,800,537 $4,005,957 $5,806,494 $94.73 $210.75 $305.48 1.007 $95.42 $212.29 $307.71
Aug-19 18,969 $1,424,428 $3,630,833 $5,055,261 $75.09 $191.41 $266.50 $1,442,955 $3,692,510 $5,135,465 $76.07 $194.66 $270.73 0.963 $73.23 $187.41 $260.64
Sep-19 18,923 $1,649,610 $3,754,711 $5,404,322 $87.17 $198.42 $285.60 $1,666,249 $3,818,991 $5,485,241 $88.05 $201.82 $289.87 1.007 $88.68 $203.25 $291.93
Oct-19 18,936 $2,634,320 $4,031,928 $6,666,248 $139.12 $212.92 $352.04 $2,636,340 $4,036,029 $6,672,369 $139.22 $213.14 $352.36 0.960 $133.66 $204.62 $338.27
Nov-19 18,919 $1,645,879 $3,559,360 $5,205,239 $87.00 $188.14 $275.13 $1,646,207 $3,561,814 $5,208,021 $87.01 $188.27 $275.28 1.111 $96.65 $209.12 $305.77
Dec-19 18,850 $1,513,177 $3,735,523 $5,248,699 $80.27 $198.17 $278.45 $1,513,177 $3,735,523 $5,248,699 $80.27 $198.17 $278.45 1.004 $80.59 $198.96 $279.55
CY 2016 243,647 $19,116,521 $40,212,595 $59,329,116 $78.46 $165.04 $243.50 $21,275,562 $45,519,125 $66,794,687 $87.32 $186.82 $274.15 $90.47 $193.42 $283.89
CY 2017 244,968 $21,666,449 $42,620,147 $64,286,595 $88.45 $173.98 $262.43 $23,251,588 $46,658,839 $69,910,427 $94.92 $190.47 $285.39 $97.96 $196.09 $294.05
CY 2018 231,709 $21,525,894 $43,953,171 $65,479,065 $92.90 $189.69 $282.59 $22,310,022 $46,298,286 $68,608,309 $96.28 $199.81 $296.10 $97.16 $202.29 $299.45
CY 2019 228,043 $22,727,979 $45,398,684 $68,126,663 $99.67 $199.08 $298.74 $23,016,356 $46,185,574 $69,201,931 $100.93 $202.53 $303.46 $101.49 $203.53 $305.02
CY2017 / CY 2016 Annual Increase 12.7% 5.4% 7.8% 8.7% 2.0% 4.1% 8.3% 1.4% 3.6%
CY2018 / CY 2017 Annual Increase 5.0% 9.0% 7.7% 1.4% 4.9% 3.8% -0.8% 3.2% 1.8%
CY2019 / CY 2018 Annual Increase 7.3% 4.9% 5.7% 4.8% 1.4% 2.5% 4.5% 0.6% 1.9%
Small Group Market - Original Claims - Removing claimants in excess of $500,000 Small Group Market - Adjusted Claims - Normalized for Contract Changes
Small Group Market - Adjusted Claims - Normalized
for Benefits, Aging, FWA and Working Days

BLUE CROSS AND BLUE SHIELD OF VERMONT
2021 VERMONT INDIVIDUAL AND SMALL GROUP RATE FILING
MEDICAL UTILIZATION TREND DEVELOPMENT - FACILITY
EXHIBIT 3C
Page 3
MonthIndividual
Weight
Individual
PMPM
Small Group
Weight
Small Group
PMPM
Total
Membership
Total
Weighted
PMPM
Month 24 Months on Monthly 36 Months on Monthly Month 24 Months on Monthly 36 Months on Monthly
Jan-16 45.0% $380.07 55.0% $290.90 46,938 $331.00 Jan-16 $317.67 $308.47 Jan-16 $317.76 $309.19
Feb-16 45.0% $360.17 55.0% $271.95 47,237 $311.62 Feb-16 $317.64 $308.70 Feb-16 $317.75 $309.44
Mar-16 45.0% $339.85 55.0% $265.34 47,836 $298.85 Mar-16 $317.61 $308.93 Mar-16 $317.74 $309.67
Apr-16 45.0% $328.78 55.0% $274.79 47,870 $299.07 Apr-16 $317.58 $309.16 Apr-16 $317.72 $309.91
May-16 45.0% $325.45 55.0% $256.30 47,939 $287.40 May-16 $317.55 $309.39 May-16 $317.71 $310.14
Jun-16 45.0% $336.26 55.0% $253.68 48,160 $290.82 Jun-16 $317.52 $309.63 Jun-16 $317.70 $310.39
Jul-16 45.0% $338.77 55.0% $283.25 48,431 $308.22 Jul-16 $317.49 $309.86 Jul-16 $317.69 $310.62
Aug-16 45.0% $307.11 55.0% $249.32 48,636 $275.31 Aug-16 $317.45 $310.10 Aug-16 $317.67 $310.87
Sep-16 45.0% $302.45 55.0% $305.78 48,828 $304.29 Sep-16 $317.42 $310.34 Sep-16 $317.66 $311.11
Oct-16 45.0% $319.03 55.0% $289.95 48,975 $303.03 Oct-16 $317.39 $310.57 Oct-16 $317.65 $311.34
Nov-16 45.0% $368.17 55.0% $331.77 48,994 $348.14 Nov-16 $317.36 $310.81 Nov-16 $317.64 $311.59
Dec-16 45.0% $340.42 55.0% $334.01 48,865 $336.89 Dec-16 $317.33 $311.04 Dec-16 $317.62 $311.82
Jan-17 45.0% $337.34 55.0% $300.42 48,690 $317.02 Jan-17 $317.30 $311.28 Jan-17 $317.61 $312.07
Feb-17 45.0% $345.04 55.0% $271.06 49,010 $304.33 Feb-17 $317.27 $311.52 Feb-17 $317.60 $312.31
Mar-17 45.0% $323.41 55.0% $261.40 48,755 $289.29 Mar-17 $317.24 $311.74 Mar-17 $317.59 $312.53
Apr-17 45.0% $323.60 55.0% $286.91 48,466 $303.41 Apr-17 $317.20 $311.98 Apr-17 $317.57 $312.77
May-17 45.0% $324.35 55.0% $276.94 48,155 $298.26 May-17 $317.17 $312.21 May-17 $317.56 $313.01
Jun-17 45.0% $313.90 55.0% $273.43 47,819 $291.63 Jun-17 $317.14 $312.45 Jun-17 $317.55 $313.25
Jul-17 45.0% $368.99 55.0% $352.86 47,618 $360.12 Jul-17 $317.11 $312.68 Jul-17 $317.54 $313.49
Aug-17 45.0% $300.01 55.0% $255.99 47,308 $275.79 Aug-17 $317.08 $312.92 Aug-17 $317.52 $313.73
Sep-17 45.0% $341.66 55.0% $284.39 47,008 $310.15 Sep-17 $317.05 $313.16 Sep-17 $317.51 $313.97
Oct-17 45.0% $348.13 55.0% $344.66 46,604 $346.22 Oct-17 $317.02 $313.40 Oct-17 $317.50 $314.21
Nov-17 45.0% $362.31 55.0% $300.99 46,212 $328.57 Nov-17 $316.98 $313.64 Nov-17 $317.48 $314.45
Dec-17 45.0% $373.64 55.0% $320.06 45,599 $344.16 Dec-17 $316.95 $313.87 Dec-17 $317.47 $314.69
Jan-18 45.0% $303.15 55.0% $303.93 43,381 $303.58 Jan-18 $316.92 $314.11 Jan-18 $317.46 $314.93
Feb-18 45.0% $370.32 55.0% $323.74 42,874 $344.69 Feb-18 $316.89 $314.35 Feb-18 $317.45 $315.17
Mar-18 45.0% $359.02 55.0% $279.52 42,448 $315.27 Mar-18 $316.86 $314.57 Mar-18 $317.43 $315.39
Apr-18 45.0% $348.08 55.0% $346.29 42,121 $347.09 Apr-18 $316.83 $314.81 Apr-18 $317.42 $315.64
May-18 45.0% $320.76 55.0% $282.56 41,839 $299.74 May-18 $316.80 $315.05 May-18 $317.41 $315.87
Jun-18 45.0% $313.25 55.0% $295.96 41,602 $303.73 Jun-18 $316.77 $315.29 Jun-18 $317.40 $316.11
Jul-18 45.0% $308.85 55.0% $301.47 41,355 $304.79 Jul-18 $316.74 $315.53 Jul-18 $317.38 $316.35
Aug-18 45.0% $277.46 55.0% $282.06 41,015 $279.99 Aug-18 $316.70 $315.77 Aug-18 $317.37 $316.59
Sep-18 45.0% $350.13 55.0% $286.69 40,680 $315.22 Sep-18 $316.67 $316.01 Sep-18 $317.36 $316.84
Oct-18 45.0% $330.66 55.0% $280.35 40,442 $302.98 Oct-18 $316.64 $316.25 Oct-18 $317.35 $317.07
Nov-18 45.0% $361.26 55.0% $293.66 40,150 $324.06 Nov-18 $316.61 $316.49 Nov-18 $317.33 $317.31
Dec-18 45.0% $388.82 55.0% $317.03 39,856 $349.31 Dec-18 $316.58 $316.73 Dec-18 $317.32 $317.55
Jan-19 45.0% $342.97 55.0% $322.88 38,937 $331.92 Jan-19 $316.55 $316.97 Jan-19 $317.31 $317.79
Feb-19 45.0% $337.39 55.0% $299.97 38,664 $316.80 Feb-19 $316.52 $317.21 Feb-19 $317.29 $318.04
Mar-19 45.0% $370.22 55.0% $337.41 38,420 $352.17 Mar-19 $316.49 $317.43 Mar-19 $317.28 $318.26
Apr-19 45.0% $319.66 55.0% $293.55 38,193 $305.29 Apr-19 $316.45 $317.68 Apr-19 $317.27 $318.50
May-19 45.0% $351.65 55.0% $285.13 38,038 $315.04 May-19 $316.42 $317.91 May-19 $317.26 $318.73
Jun-19 45.0% $337.34 55.0% $336.90 37,905 $337.10 Jun-19 $316.39 $318.16 Jun-19 $317.24 $318.98
Jul-19 45.0% $337.55 55.0% $307.71 37,839 $321.13 Jul-19 $316.36 $318.40 Jul-19 $317.23 $319.21
Aug-19 45.0% $278.66 55.0% $260.64 37,674 $268.74 Aug-19 $316.33 $318.64 Aug-19 $317.22 $319.46
Sep-19 45.0% $310.44 55.0% $291.93 37,445 $300.25 Sep-19 $316.30 $318.89 Sep-19 $317.21 $319.70
Oct-19 45.0% $362.98 55.0% $338.27 37,223 $349.38 Oct-19 $316.27 $319.12 Oct-19 $317.19 $319.93
Nov-19 45.0% $357.51 55.0% $305.77 37,015 $329.04 Nov-19 $316.24 $319.37 Nov-19 $317.18 $320.18
Dec-19 45.0% $321.01 55.0% $279.55 36,637 $298.19 Dec-19 $316.20 $319.61 Dec-19 $317.17 $320.41
Inforce 17,627 21,568 39,195
-0.1% 0.9% 0.0% 0.9%
1.000 364.461 1.000 107.808 0.000 335.366 0.008 -23.217
0.000 3.037 0.000 1.688 0.022 955.401 0.012 532.580
0.000 0.072 0.012 0.074 0.000 22.681 0.012 23.336
0.002 22.000 0.405 34.000 0.000 22.000 0.406 34.000
Weighted Based on Inforce Membership
Logistic Regression on Weighted PMPM-
24 Months on Monthly
Logistic Regression on Weighted
PMPM-36 Months on Monthly
Linear Regression on Weighted PMPM-
24 Months on Monthly
Linear Regression on Weighted
PMPM-36 Months on Monthly
Logistic Regression on Weighted PMPM Linear Regression on Weighted PMPM
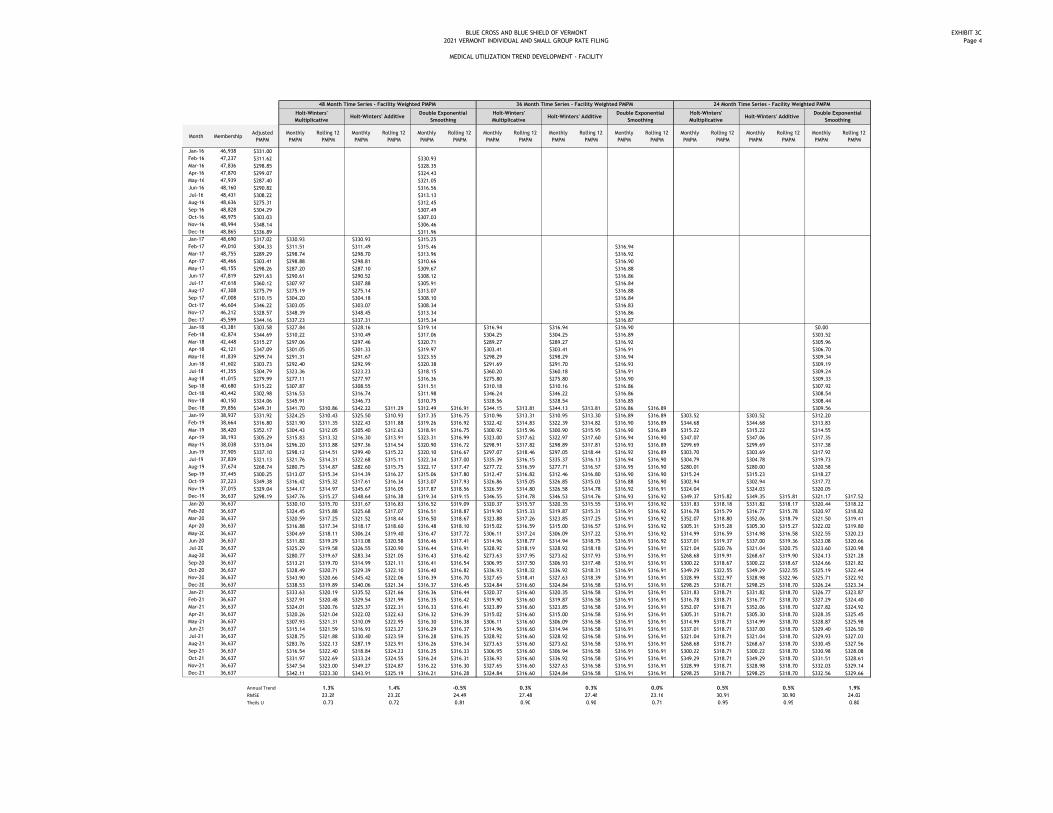
BLUE CROSS AND BLUE SHIELD OF VERMONT
2021 VERMONT INDIVIDUAL AND SMALL GROUP RATE FILING
MEDICAL UTILIZATION TREND DEVELOPMENT - FACILITY
EXHIBIT 3C
Page 4
Month MembershipAdjusted
PMPM
Monthly
PMPM
Rolling 12
PMPM
Monthly
PMPM
Rolling 12
PMPM
Monthly
PMPM
Rolling 12
PMPM
Monthly
PMPM
Rolling 12
PMPM
Monthly
PMPM
Rolling 12
PMPM
Monthly
PMPM
Rolling 12
PMPM
Monthly
PMPM
Rolling 12
PMPM
Monthly
PMPM
Rolling 12
PMPM
Monthly
PMPM
Rolling 12
PMPM
Jan-16 46,938 $331.00
Feb-16 47,237 $311.62 $330.93
Mar-16 47,836 $298.85 $328.35
Apr-16 47,870 $299.07 $324.43
May-16 47,939 $287.40 $321.05
Jun-16 48,160 $290.82 $316.56
Jul-16 48,431 $308.22 $313.13
Aug-16 48,636 $275.31 $312.45
Sep-16 48,828 $304.29 $307.49
Oct-16 48,975 $303.03 $307.03
Nov-16 48,994 $348.14 $306.46
Dec-16 48,865 $336.89 $311.96
Jan-17 48,690 $317.02 $330.93 $330.93 $315.25
Feb-17 49,010 $304.33 $311.51 $311.49 $315.46 $316.94
Mar-17 48,755 $289.29 $298.74 $298.70 $313.96 $316.92
Apr-17 48,466 $303.41 $298.88 $298.81 $310.66 $316.90
May-17 48,155 $298.26 $287.20 $287.10 $309.67 $316.88
Jun-17 47,819 $291.63 $290.61 $290.52 $308.12 $316.86
Jul-17 47,618 $360.12 $307.97 $307.88 $305.91 $316.84
Aug-17 47,308 $275.79 $275.19 $275.14 $313.07 $316.88
Sep-17 47,008 $310.15 $304.20 $304.18 $308.10 $316.84
Oct-17 46,604 $346.22 $303.05 $303.07 $308.34 $316.83
Nov-17 46,212 $328.57 $348.39 $348.45 $313.34 $316.86
Dec-17 45,599 $344.16 $337.23 $337.31 $315.34 $316.87
Jan-18 43,381 $303.58 $327.84 $328.16 $319.14 $316.94 $316.94 $316.90 $0.00
Feb-18 42,874 $344.69 $310.22 $310.49 $317.06 $304.25 $304.25 $316.89 $303.52
Mar-18 42,448 $315.27 $297.06 $297.46 $320.71 $289.27 $289.27 $316.92 $305.96
Apr-18 42,121 $347.09 $301.05 $301.33 $319.97 $303.41 $303.41 $316.91 $306.70
May-18 41,839 $299.74 $291.31 $291.67 $323.55 $298.29 $298.29 $316.94 $309.34
Jun-18 41,602 $303.73 $292.40 $292.99 $320.38 $291.69 $291.70 $316.93 $309.19
Jul-18 41,355 $304.79 $323.36 $323.23 $318.15 $360.20 $360.18 $316.91 $309.24
Aug-18 41,015 $279.99 $277.11 $277.97 $316.36 $275.80 $275.80 $316.90 $309.33
Sep-18 40,680 $315.22 $307.87 $308.55 $311.51 $310.18 $310.16 $316.86 $307.92
Oct-18 40,442 $302.98 $316.53 $316.74 $311.98 $346.24 $346.22 $316.86 $308.54
Nov-18 40,150 $324.06 $345.91 $346.73 $310.75 $328.56 $328.54 $316.85 $308.44
Dec-18 39,856 $349.31 $341.70 $310.86 $342.22 $311.29 $312.49 $316.91 $344.15 $313.81 $344.13 $313.81 $316.86 $316.89 $309.56
Jan-19 38,937 $331.92 $324.25 $310.43 $325.50 $310.93 $317.35 $316.75 $310.96 $313.31 $310.95 $313.30 $316.89 $316.89 $303.52 $303.52 $312.20
Feb-19 38,664 $316.80 $321.90 $311.35 $322.43 $311.88 $319.26 $316.92 $322.42 $314.83 $322.39 $314.82 $316.90 $316.89 $344.68 $344.68 $313.83
Mar-19 38,420 $352.17 $304.43 $312.05 $305.40 $312.63 $318.91 $316.75 $300.92 $315.96 $300.90 $315.95 $316.90 $316.89 $315.22 $315.22 $314.55
Apr-19 38,193 $305.29 $315.83 $313.32 $316.30 $313.91 $323.31 $316.99 $323.00 $317.62 $322.97 $317.60 $316.94 $316.90 $347.07 $347.06 $317.35
May-19 38,038 $315.04 $296.20 $313.88 $297.36 $314.54 $320.90 $316.72 $298.91 $317.82 $298.89 $317.81 $316.93 $316.89 $299.69 $299.69 $317.38
Jun-19 37,905 $337.10 $298.12 $314.51 $299.40 $315.22 $320.10 $316.67 $297.07 $318.46 $297.05 $318.44 $316.92 $316.89 $303.70 $303.69 $317.92
Jul-19 37,839 $321.13 $321.76 $314.31 $322.68 $315.11 $322.34 $317.00 $335.39 $316.15 $335.37 $316.13 $316.94 $316.90 $304.79 $304.78 $319.73
Aug-19 37,674 $268.74 $280.75 $314.87 $282.60 $315.75 $322.17 $317.47 $277.72 $316.59 $277.71 $316.57 $316.95 $316.90 $280.01 $280.00 $320.58
Sep-19 37,445 $300.25 $313.07 $315.34 $314.39 $316.27 $315.06 $317.80 $312.47 $316.82 $312.46 $316.80 $316.90 $316.90 $315.24 $315.23 $318.27
Oct-19 37,223 $349.38 $316.42 $315.32 $317.61 $316.34 $313.07 $317.93 $326.86 $315.05 $326.85 $315.03 $316.88 $316.90 $302.94 $302.94 $317.72
Nov-19 37,015 $329.04 $344.17 $314.97 $345.67 $316.05 $317.87 $318.56 $326.59 $314.80 $326.58 $314.78 $316.92 $316.91 $324.04 $324.03 $320.05
Dec-19 36,637 $298.19 $347.76 $315.27 $348.64 $316.38 $319.34 $319.15 $346.55 $314.78 $346.53 $314.76 $316.93 $316.92 $349.37 $315.82 $349.35 $315.81 $321.17 $317.52
Jan-20 36,637 $330.10 $315.70 $331.67 $316.83 $316.52 $319.09 $320.37 $315.57 $320.35 $315.55 $316.91 $316.92 $331.83 $318.18 $331.82 $318.17 $320.44 $318.22
Feb-20 36,637 $324.45 $315.88 $325.68 $317.07 $316.51 $318.87 $319.90 $315.33 $319.87 $315.31 $316.91 $316.92 $316.78 $315.79 $316.77 $315.78 $320.97 $318.82
Mar-20 36,637 $320.59 $317.25 $321.52 $318.44 $316.50 $318.67 $323.88 $317.26 $323.85 $317.25 $316.91 $316.92 $352.07 $318.80 $352.06 $318.79 $321.50 $319.41
Apr-20 36,637 $316.88 $317.34 $318.17 $318.60 $316.48 $318.10 $315.02 $316.59 $315.00 $316.57 $316.91 $316.92 $305.31 $315.28 $305.30 $315.27 $322.02 $319.80
May-20 36,637 $304.69 $318.11 $306.24 $319.40 $316.47 $317.72 $306.11 $317.24 $306.09 $317.22 $316.91 $316.92 $314.99 $316.59 $314.98 $316.58 $322.55 $320.23
Jun-20 36,637 $311.82 $319.29 $313.08 $320.58 $316.46 $317.41 $314.96 $318.77 $314.94 $318.75 $316.91 $316.92 $337.01 $319.37 $337.00 $319.36 $323.08 $320.66
Jul-20 36,637 $325.29 $319.58 $326.55 $320.90 $316.44 $316.91 $328.92 $318.19 $328.92 $318.18 $316.91 $316.91 $321.04 $320.76 $321.04 $320.75 $323.60 $320.98
Aug-20 36,637 $280.77 $319.67 $283.34 $321.05 $316.43 $316.42 $273.63 $317.95 $273.62 $317.93 $316.91 $316.91 $268.68 $319.91 $268.67 $319.90 $324.13 $321.28
Sep-20 36,637 $313.21 $319.70 $314.99 $321.11 $316.41 $316.54 $306.95 $317.50 $306.93 $317.48 $316.91 $316.91 $300.22 $318.67 $300.22 $318.67 $324.66 $321.82
Oct-20 36,637 $328.49 $320.71 $329.39 $322.10 $316.40 $316.82 $336.93 $318.32 $336.92 $318.31 $316.91 $316.91 $349.29 $322.55 $349.29 $322.55 $325.19 $322.44
Nov-20 36,637 $343.90 $320.66 $345.42 $322.06 $316.39 $316.70 $327.65 $318.41 $327.63 $318.39 $316.91 $316.91 $328.99 $322.97 $328.98 $322.96 $325.71 $322.92
Dec-20 36,637 $338.53 $319.89 $340.06 $321.34 $316.37 $316.45 $324.84 $316.60 $324.84 $316.58 $316.91 $316.91 $298.25 $318.71 $298.25 $318.70 $326.24 $323.34
Jan-21 36,637 $333.63 $320.19 $335.52 $321.66 $316.36 $316.44 $320.37 $316.60 $320.35 $316.58 $316.91 $316.91 $331.83 $318.71 $331.82 $318.70 $326.77 $323.87
Feb-21 36,637 $327.91 $320.48 $329.54 $321.99 $316.35 $316.42 $319.90 $316.60 $319.87 $316.58 $316.91 $316.91 $316.78 $318.71 $316.77 $318.70 $327.29 $324.40
Mar-21 36,637 $324.01 $320.76 $325.37 $322.31 $316.33 $316.41 $323.89 $316.60 $323.85 $316.58 $316.91 $316.91 $352.07 $318.71 $352.06 $318.70 $327.82 $324.92
Apr-21 36,637 $320.26 $321.04 $322.02 $322.63 $316.32 $316.39 $315.02 $316.60 $315.00 $316.58 $316.91 $316.91 $305.31 $318.71 $305.30 $318.70 $328.35 $325.45
May-21 36,637 $307.93 $321.31 $310.09 $322.95 $316.30 $316.38 $306.11 $316.60 $306.09 $316.58 $316.91 $316.91 $314.99 $318.71 $314.99 $318.70 $328.87 $325.98
Jun-21 36,637 $315.14 $321.59 $316.93 $323.27 $316.29 $316.37 $314.96 $316.60 $314.94 $316.58 $316.91 $316.91 $337.01 $318.71 $337.00 $318.70 $329.40 $326.50
Jul-21 36,637 $328.75 $321.88 $330.40 $323.59 $316.28 $316.35 $328.92 $316.60 $328.92 $316.58 $316.91 $316.91 $321.04 $318.71 $321.04 $318.70 $329.93 $327.03
Aug-21 36,637 $283.76 $322.13 $287.19 $323.91 $316.26 $316.34 $273.63 $316.60 $273.62 $316.58 $316.91 $316.91 $268.68 $318.71 $268.67 $318.70 $330.45 $327.56
Sep-21 36,637 $316.54 $322.40 $318.84 $324.23 $316.25 $316.33 $306.95 $316.60 $306.94 $316.58 $316.91 $316.91 $300.22 $318.71 $300.22 $318.70 $330.98 $328.08
Oct-21 36,637 $331.97 $322.69 $333.24 $324.55 $316.24 $316.31 $336.93 $316.60 $336.92 $316.58 $316.91 $316.91 $349.29 $318.71 $349.29 $318.70 $331.51 $328.61
Nov-21 36,637 $347.54 $323.00 $349.27 $324.87 $316.22 $316.30 $327.65 $316.60 $327.63 $316.58 $316.91 $316.91 $328.99 $318.71 $328.98 $318.70 $332.03 $329.14
Dec-21 36,637 $342.11 $323.30 $343.91 $325.19 $316.21 $316.28 $324.84 $316.60 $324.84 $316.58 $316.91 $316.91 $298.25 $318.71 $298.25 $318.70 $332.56 $329.66
Annual Trend 1.3% 1.4% -0.5% 0.3% 0.3% 0.0% 0.5% 0.5% 1.9%
RMSE 23.28 23.20 24.49 27.48 27.48 23.16 30.91 30.90 24.02
Theils U 0.73 0.72 0.81 0.90 0.90 0.71 0.95 0.95 0.80
24 Month Time Series - Facility Weighted PMPM
Holt-Winters'
MultiplicativeHolt-Winters' Additive
Double Exponential
Smoothing
Holt-Winters'
Multiplicative
48 Month Time Series - Facility Weighted PMPM 36 Month Time Series - Facility Weighted PMPM
Holt-Winters' AdditiveDouble Exponential
Smoothing
Holt-Winters'
MultiplicativeHolt-Winters' Additive
Double Exponential
Smoothing

CONFIDENTIAL AND PROPRIETARY BLUE CROSS AND BLUE SHIELD OF VERMONT
2021 VERMONT INDIVIDUAL AND SMALL GROUP RATE FILING
MEDICAL UTILIZATION TREND DEVELOPMENT - PROFESSIONAL
EXHIBIT 3D
Page 1
Month Membership BlueCardCommunity -
Independents
Community -
Hospital OwnedCVMC and Porter UVMMC DHMC Total
Total
Normalized
Factor
Total
Adjusted
Services
Total
Adjusted
Services per
1,000
Members
Total Adjusted
Services per
1,000 Members
Trend
Jan-16 26,634 32,179 1.084 34,881 1,310
Feb-16 26,908 31,412 1.085 34,093 1,267
Mar-16 27,492 36,134 0.948 34,243 1,246
Apr-16 27,554 32,023 1.038 33,255 1,207
May-16 27,625 33,218 1.039 34,520 1,250
Jun-16 27,840 33,811 0.990 33,467 1,202
Jul-16 28,100 29,858 1.089 32,515 1,157
Aug-16 28,322 34,476 0.948 32,669 1,153
Sep-16 28,548 34,768 1.039 36,136 1,266
Oct-16 28,686 37,675 1.039 39,143 1,365
Nov-16 28,720 37,384 1.090 40,733 1,418
Dec-16 28,633 35,350 1.035 36,605 1,278 1,260
Jan-17 28,181 35,722 1.034 36,943 1,311 1,261
Feb-17 28,546 31,981 1.089 34,834 1,220 1,257
Mar-17 28,336 36,403 0.949 34,538 1,219 1,254
Apr-17 28,008 32,306 1.090 35,217 1,257 1,259
May-17 27,695 36,504 0.990 36,125 1,304 1,263
Jun-17 27,384 34,215 0.988 33,808 1,235 1,266
Jul-17 27,181 29,718 1.143 33,967 1,250 1,273
Aug-17 26,871 33,418 0.944 31,545 1,174 1,276
Sep-17 26,553 32,128 1.084 34,839 1,312 1,279
Oct-17 26,251 38,010 0.984 37,414 1,425 1,283
Nov-17 25,911 35,727 1.081 38,635 1,491 1,288
Dec-17 25,359 31,777 1.079 34,294 1,352 1,294 2.7%
Jan-18 24,001 32,196 0.983 31,645 1,318 1,294 2.7%
Feb-18 23,511 28,634 1.080 30,917 1,315 1,302 3.6%
Mar-18 23,126 30,292 0.979 29,662 1,283 1,309 4.3%
Apr-18 22,798 28,674 1.024 29,368 1,288 1,312 4.2%
May-18 22,511 30,740 0.976 30,002 1,333 1,314 4.0%
Jun-18 22,306 28,280 1.021 28,882 1,295 1,320 4.3%
Jul-18 22,046 26,912 1.020 27,459 1,246 1,321 3.7%
Aug-18 21,709 28,671 0.931 26,689 1,229 1,328 4.1%
Sep-18 21,412 26,342 1.123 29,586 1,382 1,333 4.2%
Oct-18 21,166 33,788 0.926 31,285 1,478 1,336 4.1%
Nov-18 20,866 29,431 1.064 31,304 1,500 1,333 3.5%
Dec-18 20,602 26,897 1.120 30,124 1,462 1,342 3.7%
Jan-19 19,734 28,086 0.959 26,924 1,364 1,345 4.0%
Feb-19 19,531 24,515 1.054 25,848 1,323 1,346 3.4%
Mar-19 19,330 26,393 1.004 26,497 1,371 1,354 3.5%
Apr-19 19,169 26,325 0.957 25,204 1,315 1,357 3.5%
May-19 19,035 27,099 0.958 25,968 1,364 1,360 3.5%
Jun-19 18,920 24,149 1.054 25,446 1,345 1,365 3.4%
Jul-19 18,831 24,831 1.006 24,972 1,326 1,373 3.9%
Aug-19 18,705 24,113 0.960 23,153 1,238 1,375 3.6%
Sep-19 18,522 24,135 1.007 24,299 1,312 1,369 2.7%
Oct-19 18,287 29,141 0.961 28,019 1,532 1,372 2.8%
Nov-19 18,096 23,652 1.111 26,266 1,451 1,367 2.5%
Dec-19 17,787 24,062 1.004 24,158 1,358 1,358 1.2%
CY 2016 335,062 408,288 422,259 1,260
CY 2017 326,276 407,909 422,158 1,294
CY 2018 266,054 350,855 356,923 1,342
CY 2019 225,947 306,500 306,755 1,358
CY2017 / CY 2016 Annual Increase 2.7%
CY2018 / CY 2017 Annual Increase 3.7%
CY2019 / CY 2018 Annual Increase 1.2%
Projected CY 2020 1,370 0.9%
Projected CY 2021 1,419 3.6%
Individual Market - Professional Services excluding Independent Labs
Individual Market - Monthly Adjusted
Services - Normalized for Benefits,
Aging, FWA and Working Days
Individual Market - Rolling 12
Adjusted Services - Normalized
for Benefits, Aging, FWA and
Working Days
Selected Trends

CONFIDENTIAL AND PROPRIETARY BLUE CROSS AND BLUE SHIELD OF VERMONT
2021 VERMONT INDIVIDUAL AND SMALL GROUP RATE FILING
MEDICAL UTILIZATION TREND DEVELOPMENT - PROFESSIONAL
EXHIBIT 3D
Page 2
Month Services Allowed ChargesCost Trend
Normalization
Normalized
Allowed Charges
Monthly
Normalized
Cost per
Service
Rolling 12
Normalized
Cost per
Service
Annual Trend Services Allowed ChargesCost Trend
Normalization
Normalized
Allowed Charges
Monthly
Normalized
Cost per
Service
Rolling 12
Normalized
Cost per
Service
Annual Trend
Jan-16
Feb-16
Mar-16
Apr-16
May-16
Jun-16
Jul-16
Aug-16
Sep-16
Oct-16
Nov-16
Dec-16
Jan-17
Feb-17
Mar-17
Apr-17
May-17
Jun-17
Jul-17
Aug-17
Sep-17
Oct-17
Nov-17
Dec-17
Jan-18
Feb-18
Mar-18
Apr-18
May-18
Jun-18
Jul-18
Aug-18
Sep-18
Oct-18
Nov-18
Dec-18
Jan-19
Feb-19
Mar-19
Apr-19
May-19
Jun-19
Jul-19
Aug-19
Sep-19
Oct-19
Nov-19
Dec-19
CY 2016
CY 2017
CY 2018
CY 2019
Projected CY 2020 Projected CY 2020
Projected CY 2021 Projected CY 2021
Individual Market - BlueCard Individual Market - Community - Independents
Selected Trends Selected Trends

CONFIDENTIAL AND PROPRIETARY BLUE CROSS AND BLUE SHIELD OF VERMONT
2021 VERMONT INDIVIDUAL AND SMALL GROUP RATE FILING
MEDICAL UTILIZATION TREND DEVELOPMENT - PROFESSIONAL
EXHIBIT 3D
Page 3
Services Allowed ChargesCost Trend
Normalization
Normalized
Allowed Charges
Monthly
Normalized
Cost per
Service
Rolling 12
Normalized
Cost per
Service
Annual Trend Services Allowed ChargesCost Trend
Normalization
Normalized
Allowed Charges
Monthly
Normalized
Cost per
Service
Rolling 12
Normalized
Cost per
Service
Annual Trend
Projected CY 2020 Projected CY 2020
Projected CY 2021 Projected CY 2021
Individual Market - Community - Hospital Owned Individual Market - CVMC and Porter
Selected Trends Selected Trends

CONFIDENTIAL AND PROPRIETARY BLUE CROSS AND BLUE SHIELD OF VERMONT
2021 VERMONT INDIVIDUAL AND SMALL GROUP RATE FILING
MEDICAL UTILIZATION TREND DEVELOPMENT - PROFESSIONAL
EXHIBIT 3D
Page 4
Services Allowed ChargesCost Trend
Normalization
Normalized
Allowed Charges
Monthly
Normalized
Cost per
Service
Rolling 12
Normalized
Cost per
Service
Annual Trend Services Allowed ChargesCost Trend
Normalization
Normalized
Allowed Charges
Monthly
Normalized
Cost per
Service
Rolling 12
Normalized
Cost per
Service
Annual Trend
Projected CY 2020 Projected CY 2020
Projected CY 2021 Projected CY 2021
Individual Market - UVMMC Individual Market - DHMC
Selected Trends Selected Trends

CONFIDENTIAL AND PROPRIETARY BLUE CROSS AND BLUE SHIELD OF VERMONT
2021 VERMONT INDIVIDUAL AND SMALL GROUP RATE FILING
MEDICAL UTILIZATION TREND DEVELOPMENT - PROFESSIONAL
EXHIBIT 3D
Page 5
Individual
Market
Month MembershipIndependent Lab
Services
Total
Normalized
Factor
Total
Adjusted
Services
Total
Adjusted
Services per
1,000
Members
Total Adjusted
Services per
1,000 Members
Trend Allowed ChargesCost Trend
Normalization
Normalized
Allowed Charges
Monthly
Normalized
Cost per
Service
Rolling 12
Normalized
Cost per
Service
Annual Trend
Jan-16 26,634 1.084
Feb-16 26,908 1.085
Mar-16 27,492 0.948
Apr-16 27,554 1.038
May-16 27,625 1.039
Jun-16 27,840 0.990
Jul-16 28,100 1.089
Aug-16 28,322 0.948
Sep-16 28,548 1.039
Oct-16 28,686 1.039
Nov-16 28,720 1.090
Dec-16 28,633 1.035
Jan-17 28,181 1.034
Feb-17 28,546 1.089
Mar-17 28,336 0.949
Apr-17 28,008 1.090
May-17 27,695 0.990
Jun-17 27,384 0.988
Jul-17 27,181 1.143
Aug-17 26,871 0.944
Sep-17 26,553 1.084
Oct-17 26,251 0.984
Nov-17 25,911 1.081
Dec-17 25,359 1.079
Jan-18 24,001 0.983
Feb-18 23,511 1.080
Mar-18 23,126 0.979
Apr-18 22,798 1.024
May-18 22,511 0.976
Jun-18 22,306 1.021
Jul-18 22,046 1.020
Aug-18 21,709 0.931
Sep-18 21,412 1.123
Oct-18 21,166 0.926
Nov-18 20,866 1.064
Dec-18 20,602 1.120
Jan-19 19,734 0.959
Feb-19 19,531 1.054
Mar-19 19,330 1.004
Apr-19 19,169 0.957
May-19 19,035 0.958
Jun-19 18,920 1.054
Jul-19 18,831 1.006
Aug-19 18,705 0.960
Sep-19 18,522 1.007
Oct-19 18,287 0.961
Nov-19 18,096 1.111
Dec-19 17,787 1.004
CY 2016 335,062
CY 2017 326,276
CY 2018 266,054
CY 2019 225,947
Projected CY 2020 Projected CY 2020
Projected CY 2021 0.0% Projected CY 2021
Individual Market - Individual Lab Cost per Service - Normalized
Individual Market - Monthly Adjusted
Services - Normalized for Benefits,
Aging, FWA and Working Days
Individual Market - Rolling 12
Adjusted Services -
Normalized for Benefits,
Aging, FWA and Working Days
Selected Trends Selected Trends
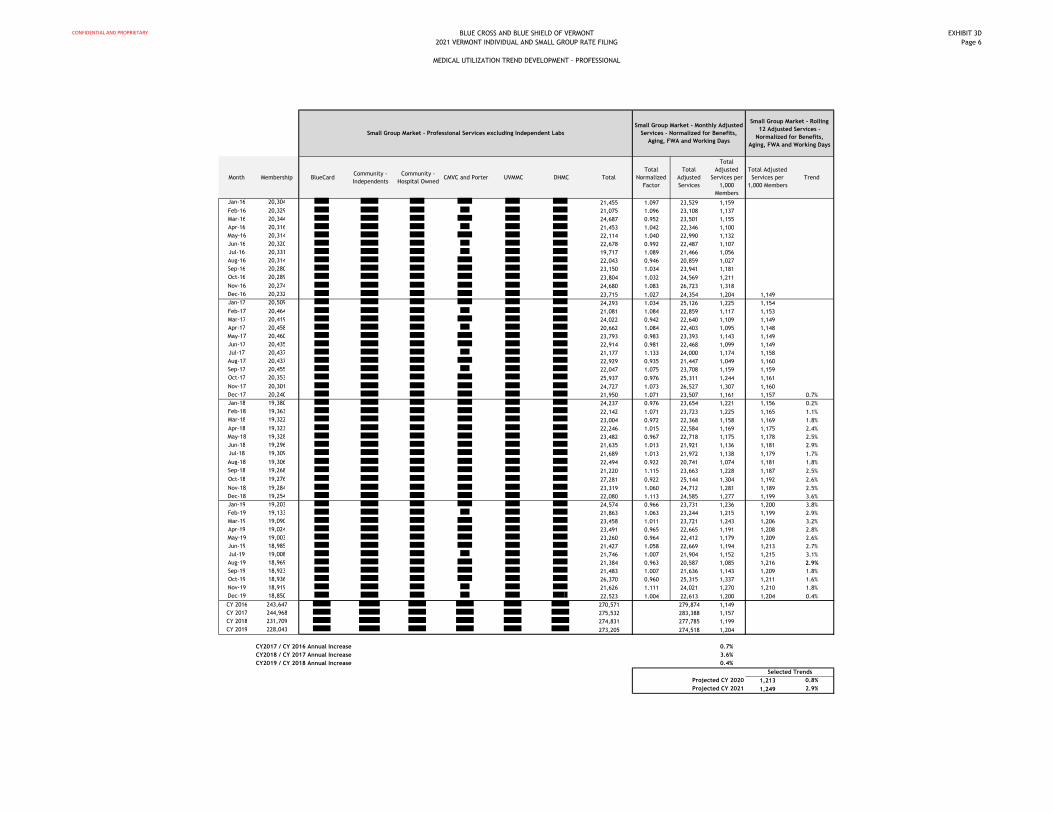
CONFIDENTIAL AND PROPRIETARY BLUE CROSS AND BLUE SHIELD OF VERMONT
2021 VERMONT INDIVIDUAL AND SMALL GROUP RATE FILING
MEDICAL UTILIZATION TREND DEVELOPMENT - PROFESSIONAL
EXHIBIT 3D
Page 6
Month Membership BlueCardCommunity -
Independents
Community -
Hospital OwnedCMVC and Porter UVMMC DHMC Total
Total
Normalized
Factor
Total
Adjusted
Services
Total
Adjusted
Services per
1,000
Members
Total Adjusted
Services per
1,000 Members
Trend
Jan-16 20,304 21,455 1.097 23,529 1,159
Feb-16 20,329 21,075 1.096 23,108 1,137
Mar-16 20,344 24,687 0.952 23,501 1,155
Apr-16 20,316 21,453 1.042 22,346 1,100
May-16 20,314 22,114 1.040 22,990 1,132
Jun-16 20,320 22,678 0.992 22,487 1,107
Jul-16 20,331 19,717 1.089 21,466 1,056
Aug-16 20,314 22,043 0.946 20,859 1,027
Sep-16 20,280 23,150 1.034 23,941 1,181
Oct-16 20,289 23,804 1.032 24,569 1,211
Nov-16 20,274 24,680 1.083 26,723 1,318
Dec-16 20,232 23,715 1.027 24,354 1,204 1,149
Jan-17 20,509 24,293 1.034 25,126 1,225 1,154
Feb-17 20,464 21,081 1.084 22,859 1,117 1,153
Mar-17 20,419 24,022 0.942 22,640 1,109 1,149
Apr-17 20,458 20,662 1.084 22,403 1,095 1,148
May-17 20,460 23,793 0.983 23,393 1,143 1,149
Jun-17 20,435 22,914 0.981 22,468 1,099 1,149
Jul-17 20,437 21,177 1.133 24,000 1,174 1,158
Aug-17 20,437 22,929 0.935 21,447 1,049 1,160
Sep-17 20,455 22,047 1.075 23,708 1,159 1,159
Oct-17 20,353 25,937 0.976 25,311 1,244 1,161
Nov-17 20,301 24,727 1.073 26,527 1,307 1,160
Dec-17 20,240 21,950 1.071 23,507 1,161 1,157 0.7%
Jan-18 19,380 24,237 0.976 23,654 1,221 1,156 0.2%
Feb-18 19,363 22,142 1.071 23,723 1,225 1,165 1.1%
Mar-18 19,322 23,004 0.972 22,368 1,158 1,169 1.8%
Apr-18 19,323 22,246 1.015 22,584 1,169 1,175 2.4%
May-18 19,328 23,482 0.967 22,718 1,175 1,178 2.5%
Jun-18 19,296 21,635 1.013 21,921 1,136 1,181 2.9%
Jul-18 19,309 21,689 1.013 21,972 1,138 1,179 1.7%
Aug-18 19,306 22,494 0.922 20,741 1,074 1,181 1.8%
Sep-18 19,268 21,220 1.115 23,663 1,228 1,187 2.5%
Oct-18 19,276 27,281 0.922 25,144 1,304 1,192 2.6%
Nov-18 19,284 23,319 1.060 24,712 1,281 1,189 2.5%
Dec-18 19,254 22,080 1.113 24,585 1,277 1,199 3.6%
Jan-19 19,203 24,574 0.966 23,731 1,236 1,200 3.8%
Feb-19 19,133 21,863 1.063 23,244 1,215 1,199 2.9%
Mar-19 19,090 23,458 1.011 23,721 1,243 1,206 3.2%
Apr-19 19,024 23,491 0.965 22,665 1,191 1,208 2.8%
May-19 19,003 23,260 0.964 22,412 1,179 1,209 2.6%
Jun-19 18,985 21,427 1.058 22,669 1,194 1,213 2.7%
Jul-19 19,008 21,746 1.007 21,904 1,152 1,215 3.1%
Aug-19 18,969 21,384 0.963 20,587 1,085 1,216 2.9%
Sep-19 18,923 21,483 1.007 21,636 1,143 1,209 1.8%
Oct-19 18,936 26,370 0.960 25,315 1,337 1,211 1.6%
Nov-19 18,919 21,626 1.111 24,021 1,270 1,210 1.8%
Dec-19 18,850 22,523 1.004 22,613 1,200 1,204 0.4%
CY 2016 243,647 270,571 279,874 1,149
CY 2017 244,968 275,532 283,388 1,157
CY 2018 231,709 274,831 277,785 1,199
CY 2019 228,043 273,205 274,518 1,204
CY2017 / CY 2016 Annual Increase 0.7%
CY2018 / CY 2017 Annual Increase 3.6%
CY2019 / CY 2018 Annual Increase 0.4%
Projected CY 2020 1,213 0.8%
Projected CY 2021 1,249 2.9%
Small Group Market - Professional Services excluding Independent Labs
Small Group Market - Monthly Adjusted
Services - Normalized for Benefits,
Aging, FWA and Working Days
Small Group Market - Rolling
12 Adjusted Services -
Normalized for Benefits,
Aging, FWA and Working Days
Selected Trends
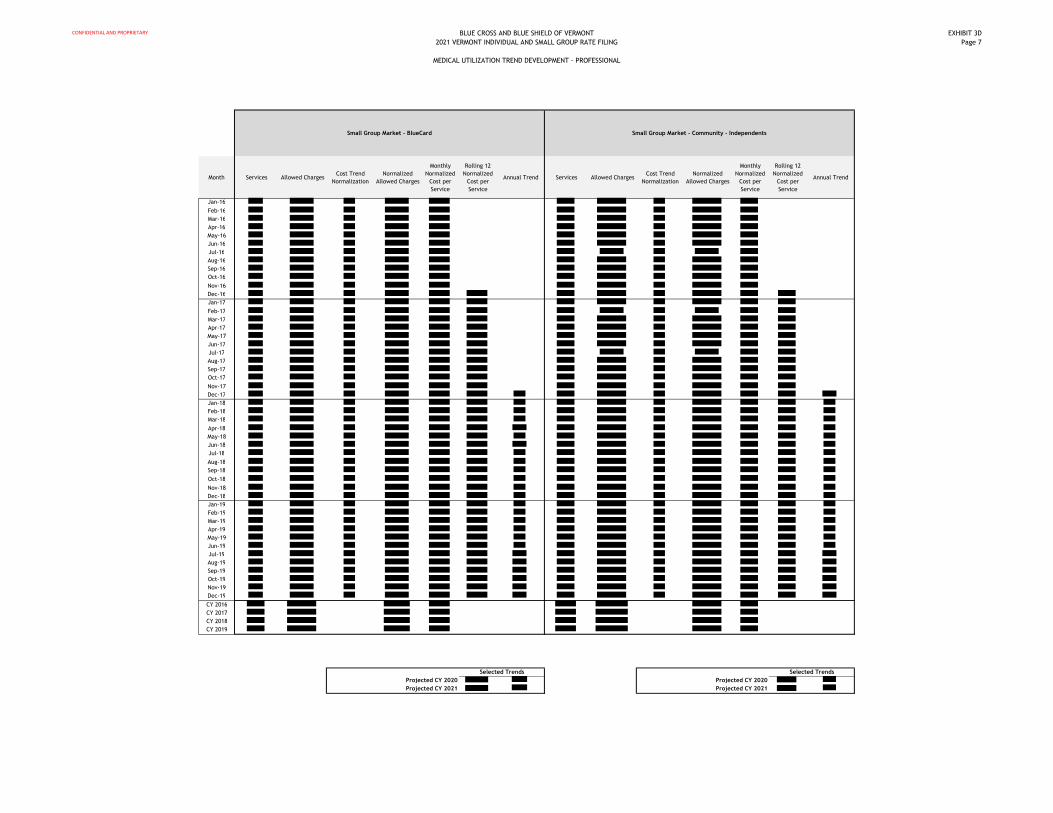
CONFIDENTIAL AND PROPRIETARY BLUE CROSS AND BLUE SHIELD OF VERMONT
2021 VERMONT INDIVIDUAL AND SMALL GROUP RATE FILING
MEDICAL UTILIZATION TREND DEVELOPMENT - PROFESSIONAL
EXHIBIT 3D
Page 7
Month Services Allowed ChargesCost Trend
Normalization
Normalized
Allowed Charges
Monthly
Normalized
Cost per
Service
Rolling 12
Normalized
Cost per
Service
Annual Trend Services Allowed ChargesCost Trend
Normalization
Normalized
Allowed Charges
Monthly
Normalized
Cost per
Service
Rolling 12
Normalized
Cost per
Service
Annual Trend
Jan-16
Feb-16
Mar-16
Apr-16
May-16
Jun-16
Jul-16
Aug-16
Sep-16
Oct-16
Nov-16
Dec-16
Jan-17
Feb-17
Mar-17
Apr-17
May-17
Jun-17
Jul-17
Aug-17
Sep-17
Oct-17
Nov-17
Dec-17
Jan-18
Feb-18
Mar-18
Apr-18
May-18
Jun-18
Jul-18
Aug-18
Sep-18
Oct-18
Nov-18
Dec-18
Jan-19
Feb-19
Mar-19
Apr-19
May-19
Jun-19
Jul-19
Aug-19
Sep-19
Oct-19
Nov-19
Dec-19
CY 2016
CY 2017
CY 2018
CY 2019
Projected CY 2020 Projected CY 2020
Projected CY 2021 Projected CY 2021
Small Group Market - BlueCard Small Group Market - Community - Independents
Selected Trends Selected Trends

CONFIDENTIAL AND PROPRIETARY BLUE CROSS AND BLUE SHIELD OF VERMONT
2021 VERMONT INDIVIDUAL AND SMALL GROUP RATE FILING
MEDICAL UTILIZATION TREND DEVELOPMENT - PROFESSIONAL
EXHIBIT 3D
Page 8
Services Allowed ChargesCost Trend
Normalization
Normalized
Allowed Charges
Monthly
Normalized
Cost per
Service
Rolling 12
Normalized
Cost per
Service
Annual Trend Services Allowed ChargesCost Trend
Normalization
Normalized
Allowed Charges
Monthly
Normalized
Cost per
Service
Rolling 12
Normalized
Cost per
Service
Annual Trend
Projected CY 2020 Projected CY 2020
Projected CY 2021 Projected CY 2021
Small Group Market - Community - Hospital Owned Small Group Market - CVMC and Porter
Selected Trends Selected Trends

CONFIDENTIAL AND PROPRIETARY BLUE CROSS AND BLUE SHIELD OF VERMONT
2021 VERMONT INDIVIDUAL AND SMALL GROUP RATE FILING
MEDICAL UTILIZATION TREND DEVELOPMENT - PROFESSIONAL
EXHIBIT 3D
Page 9
Services Allowed ChargesCost Trend
Normalization
Normalized
Allowed Charges
Monthly
Normalized
Cost per
Service
Rolling 12
Normalized
Cost per
Service
Annual Trend Services Allowed ChargesCost Trend
Normalization
Normalized
Allowed Charges
Monthly
Normalized
Cost per
Service
Rolling 12
Normalized
Cost per
Service
Annual Trend
Projected CY 2020 Projected CY 2020
Projected CY 2021 Projected CY 2021
Small Group Market - UVMMC Small Group Market - DHMC
Selected Trends Selected Trends
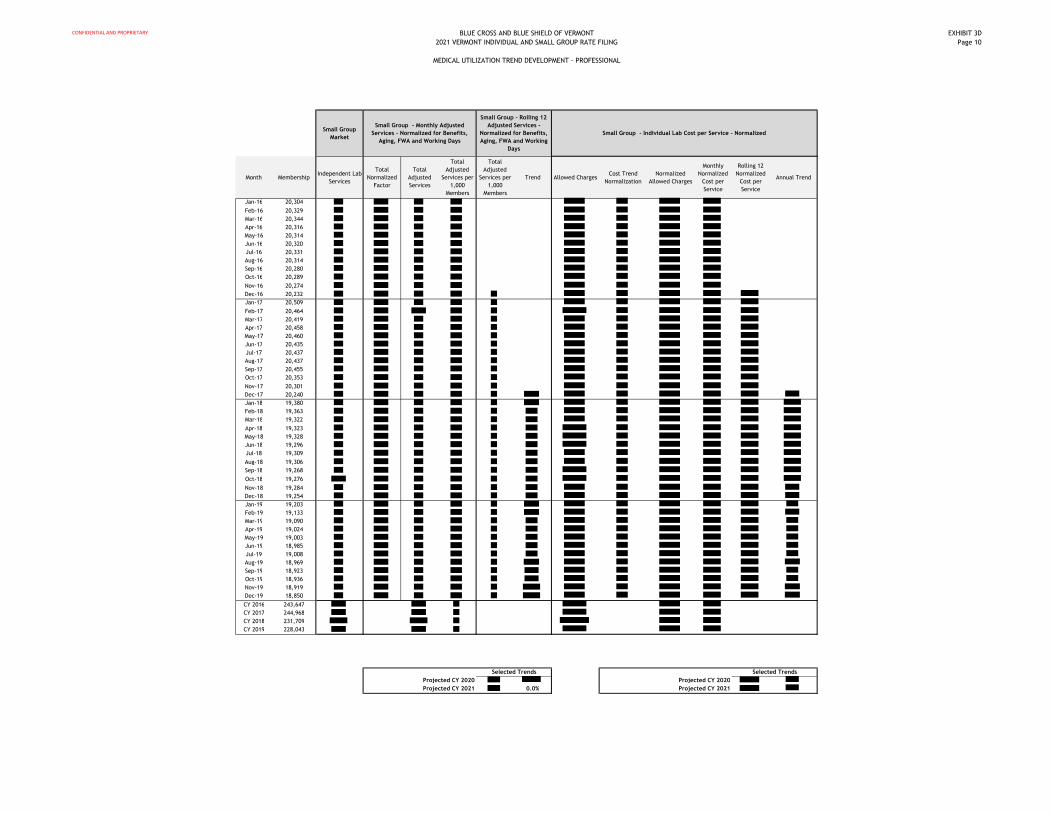
CONFIDENTIAL AND PROPRIETARY BLUE CROSS AND BLUE SHIELD OF VERMONT
2021 VERMONT INDIVIDUAL AND SMALL GROUP RATE FILING
MEDICAL UTILIZATION TREND DEVELOPMENT - PROFESSIONAL
EXHIBIT 3D
Page 10
Small Group
Market
Month MembershipIndependent Lab
Services
Total
Normalized
Factor
Total
Adjusted
Services
Total
Adjusted
Services per
1,000
Members
Total
Adjusted
Services per
1,000
Members
Trend Allowed ChargesCost Trend
Normalization
Normalized
Allowed Charges
Monthly
Normalized
Cost per
Service
Rolling 12
Normalized
Cost per
Service
Annual Trend
Jan-16 20,304
Feb-16 20,329
Mar-16 20,344
Apr-16 20,316
May-16 20,314
Jun-16 20,320
Jul-16 20,331
Aug-16 20,314
Sep-16 20,280
Oct-16 20,289
Nov-16 20,274
Dec-16 20,232
Jan-17 20,509
Feb-17 20,464
Mar-17 20,419
Apr-17 20,458
May-17 20,460
Jun-17 20,435
Jul-17 20,437
Aug-17 20,437
Sep-17 20,455
Oct-17 20,353
Nov-17 20,301
Dec-17 20,240
Jan-18 19,380
Feb-18 19,363
Mar-18 19,322
Apr-18 19,323
May-18 19,328
Jun-18 19,296
Jul-18 19,309
Aug-18 19,306
Sep-18 19,268
Oct-18 19,276
Nov-18 19,284
Dec-18 19,254
Jan-19 19,203
Feb-19 19,133
Mar-19 19,090
Apr-19 19,024
May-19 19,003
Jun-19 18,985
Jul-19 19,008
Aug-19 18,969
Sep-19 18,923
Oct-19 18,936
Nov-19 18,919
Dec-19 18,850
CY 2016 243,647
CY 2017 244,968
CY 2018 231,709
CY 2019 228,043
Projected CY 2020 Projected CY 2020
Projected CY 2021 0.0% Projected CY 2021
Small Group - Individual Lab Cost per Service - Normalized
Small Group - Monthly Adjusted
Services - Normalized for Benefits,
Aging, FWA and Working Days
Small Group - Rolling 12
Adjusted Services -
Normalized for Benefits,
Aging, FWA and Working
Days
Selected TrendsSelected Trends

CONFIDENTIAL AND PROPRIETARY BLUE CROSS AND BLUE SHIELD OF VERMONT
2021 VERMONT INDIVIDUAL AND SMALL GROUP RATE FILING
MEDICAL UTILIZATION TREND DEVELOPMENT - PROFESSIONAL
EXHIBIT 3D
Page 11
Individual Market
BlueCard 0.9% 3.6%
Community - Independents 0.9% 3.6%
Community - Hospital Owned 0.9% 3.6%
CMVC and Porter 0.9% 3.6%
UVMMC 0.9% 3.6%
DHMC 0.9% 3.6%
Independent Labs 0.0%
Total Individual Market $158.09 0.7% 2.2% $161.56 2.3% 6.0% $171.32
Small Group Market
BlueCard 0.8% 2.9%
Community - Independents 0.8% 2.9%
Community - Hospital Owned 0.8% 2.9%
CMVC and Porter 0.8% 2.9%
UVMMC 0.8% 2.9%
DHMC 0.8% 2.9%
Independent Labs 0.0%
Total Small Group Market $138.35 0.7% 1.6% $140.58 2.3% 5.7% $148.52
Combined Risk Pool
Individual $158.09 0.7% 2.2% $161.56 2.3% 6.0% $171.32
Small Group $138.35 0.7% 1.6% $140.58 2.3% 5.7% $148.52
Total $147.23 0.7% 1.9% $150.01 2.3% 5.8% $158.77
Individual Inforce 17,627 Annual 2.3%
Small Group Inforce 21,568
Total Inforce 39,195
Summary of Medical Utilization Trend for Professional Services
From 2019 to 2020 From 2020 to 2021
2019Cost per Service
Trend
Number of
Services Trend
Mix of Services
Trend
Total Annual
Trend2020
Cost per Service
Trend
Number of
Services Trend
Mix of Services
Trend
Total Annual
Trend2021
1.4% 3.6%
From 2019 to 2020 From 2020 to 2021
From 2019 to 2020 From 2020 to 2021
2020Cost per Service
Trend
Number of
Services Trend
Mix of Services
Trend
Total Annual
Trend2021
0.9% 3.2%
2019Cost per Service
Trend
Number of
Services Trend
Mix of Services
Trend
Total Annual
Trend
2019Cost per Service
Trend
Number of
Services Trend
Mix of Services
Trend
Total Annual
Trend
Total Annual
Trend2021
0.9% 3.2%
1.1% 3.4%
1.4% 3.6%
2020Cost per Service
Trend
Number of
Services Trend
Mix of Services
Trend
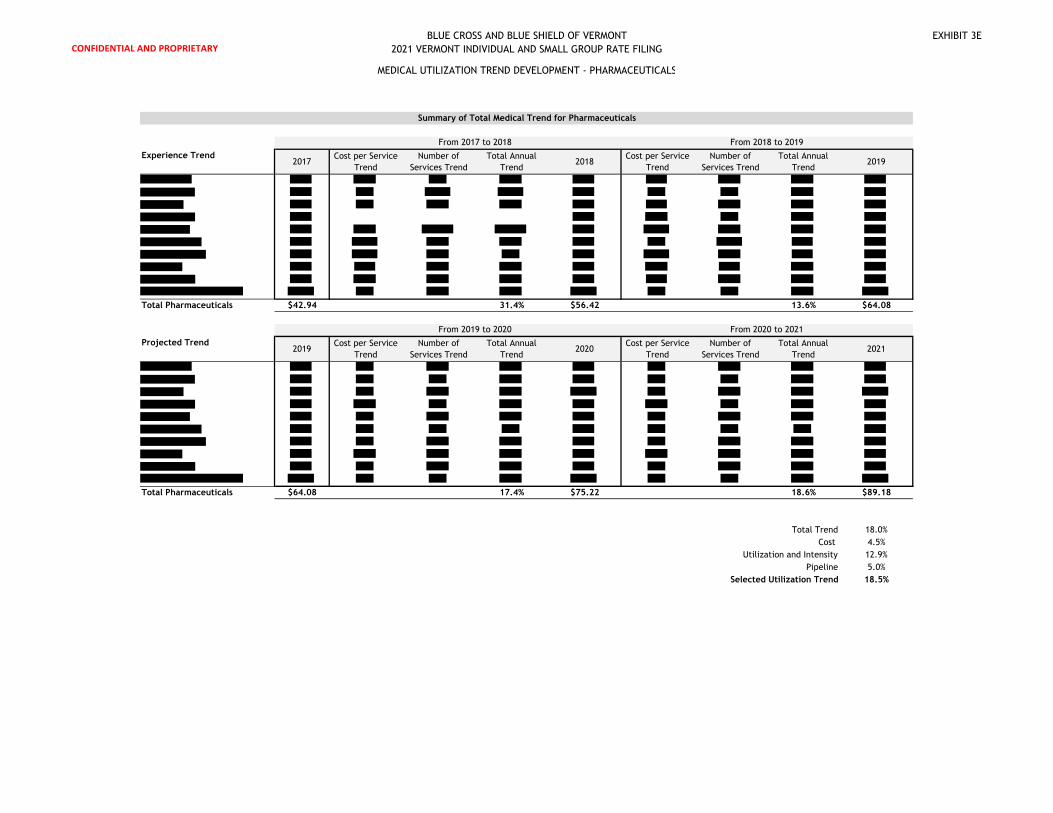
CONFIDENTIAL AND PROPRIETARY
BLUE CROSS AND BLUE SHIELD OF VERMONT
2021 VERMONT INDIVIDUAL AND SMALL GROUP RATE FILING
EXHIBIT 3E
Experience Trend
Total Pharmaceuticals $42.94 31.4% $56.42 13.6% $64.08
Projected Trend
Total Pharmaceuticals $64.08 17.4% $75.22 18.6% $89.18
Total Trend 18.0%
Cost 4.5%
Utilization and Intensity 12.9%
Pipeline 5.0%
Selected Utilization Trend 18.5%
MEDICAL UTILIZATION TREND DEVELOPMENT - PHARMACEUTICALS
Summary of Total Medical Trend for Pharmaceuticals
From 2017 to 2018 From 2018 to 2019
2017Cost per Service
Trend
Number of
Services Trend
Total Annual
Trend2018
Cost per Service
Trend
Number of
Services Trend
Total Annual
Trend2019
From 2019 to 2020 From 2020 to 2021
2019Cost per Service
Trend
Number of
Services Trend
Total Annual
Trend2020
Cost per Service
Trend
Number of
Services Trend
Total Annual
Trend2021
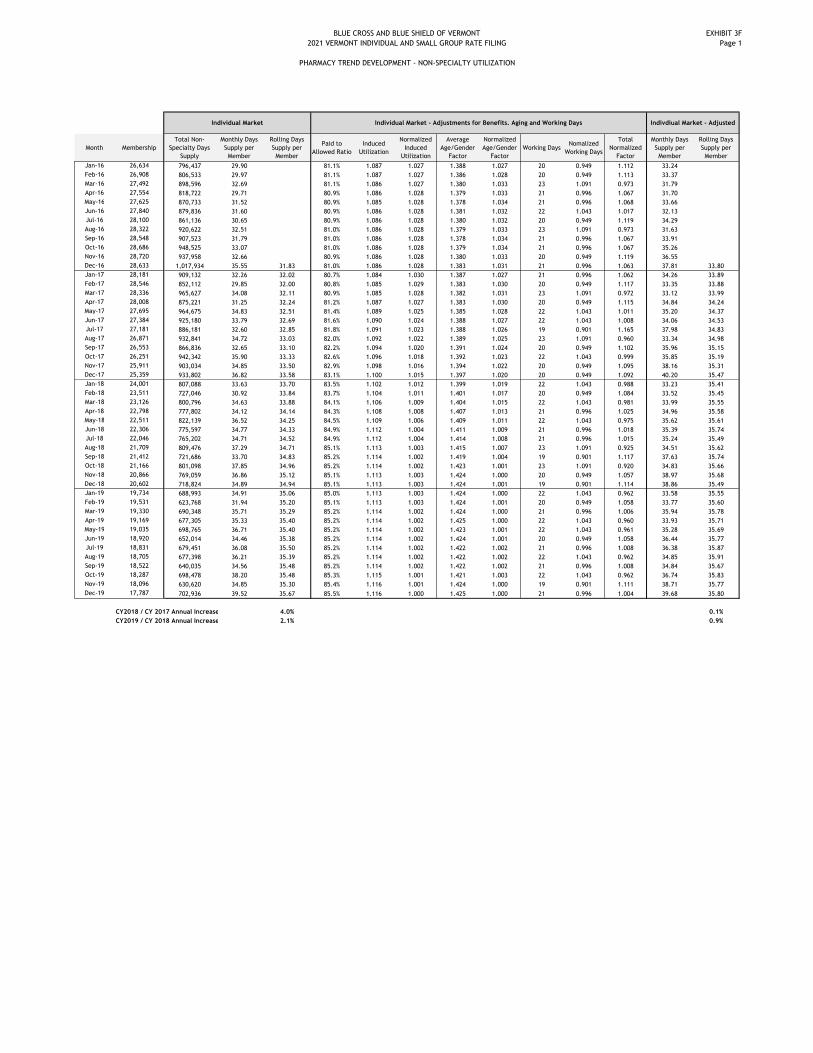
BLUE CROSS AND BLUE SHIELD OF VERMONT
2021 VERMONT INDIVIDUAL AND SMALL GROUP RATE FILING
PHARMACY TREND DEVELOPMENT - NON-SPECIALTY UTILIZATION
EXHIBIT 3F
Page 1
Month Membership
Total Non-
Specialty Days
Supply
Monthly Days
Supply per
Member
Rolling Days
Supply per
Member
Paid to
Allowed Ratio
Induced
Utilization
Normalized
Induced
Utilization
Average
Age/Gender
Factor
Normalized
Age/Gender
Factor
Working DaysNomalized
Working Days
Total
Normalized
Factor
Monthly Days
Supply per
Member
Rolling Days
Supply per
Member
Jan-16 26,634 796,437 29.90 81.1% 1.087 1.027 1.388 1.027 20 0.949 1.112 33.24
Feb-16 26,908 806,533 29.97 81.1% 1.087 1.027 1.386 1.028 20 0.949 1.113 33.37
Mar-16 27,492 898,596 32.69 81.1% 1.086 1.027 1.380 1.033 23 1.091 0.973 31.79
Apr-16 27,554 818,722 29.71 80.9% 1.086 1.028 1.379 1.033 21 0.996 1.067 31.70
May-16 27,625 870,733 31.52 80.9% 1.085 1.028 1.378 1.034 21 0.996 1.068 33.66
Jun-16 27,840 879,836 31.60 80.9% 1.086 1.028 1.381 1.032 22 1.043 1.017 32.13
Jul-16 28,100 861,136 30.65 80.9% 1.086 1.028 1.380 1.032 20 0.949 1.119 34.29
Aug-16 28,322 920,622 32.51 81.0% 1.086 1.028 1.379 1.033 23 1.091 0.973 31.63
Sep-16 28,548 907,523 31.79 81.0% 1.086 1.028 1.378 1.034 21 0.996 1.067 33.91
Oct-16 28,686 948,525 33.07 81.0% 1.086 1.028 1.379 1.034 21 0.996 1.067 35.26
Nov-16 28,720 937,958 32.66 80.9% 1.086 1.028 1.380 1.033 20 0.949 1.119 36.55
Dec-16 28,633 1,017,934 35.55 31.83 81.0% 1.086 1.028 1.383 1.031 21 0.996 1.063 37.81 33.80
Jan-17 28,181 909,132 32.26 32.02 80.7% 1.084 1.030 1.387 1.027 21 0.996 1.062 34.26 33.89
Feb-17 28,546 852,112 29.85 32.00 80.8% 1.085 1.029 1.383 1.030 20 0.949 1.117 33.35 33.88
Mar-17 28,336 965,627 34.08 32.11 80.9% 1.085 1.028 1.382 1.031 23 1.091 0.972 33.12 33.99
Apr-17 28,008 875,221 31.25 32.24 81.2% 1.087 1.027 1.383 1.030 20 0.949 1.115 34.84 34.24
May-17 27,695 964,675 34.83 32.51 81.4% 1.089 1.025 1.385 1.028 22 1.043 1.011 35.20 34.37
Jun-17 27,384 925,180 33.79 32.69 81.6% 1.090 1.024 1.388 1.027 22 1.043 1.008 34.06 34.53
Jul-17 27,181 886,181 32.60 32.85 81.8% 1.091 1.023 1.388 1.026 19 0.901 1.165 37.98 34.83
Aug-17 26,871 932,841 34.72 33.03 82.0% 1.092 1.022 1.389 1.025 23 1.091 0.960 33.34 34.98
Sep-17 26,553 866,836 32.65 33.10 82.2% 1.094 1.020 1.391 1.024 20 0.949 1.102 35.96 35.15
Oct-17 26,251 942,342 35.90 33.33 82.6% 1.096 1.018 1.392 1.023 22 1.043 0.999 35.85 35.19
Nov-17 25,911 903,034 34.85 33.50 82.9% 1.098 1.016 1.394 1.022 20 0.949 1.095 38.16 35.31
Dec-17 25,359 933,802 36.82 33.58 83.1% 1.100 1.015 1.397 1.020 20 0.949 1.092 40.20 35.47
Jan-18 24,001 807,088 33.63 33.70 83.5% 1.102 1.012 1.399 1.019 22 1.043 0.988 33.23 35.41
Feb-18 23,511 727,046 30.92 33.84 83.7% 1.104 1.011 1.401 1.017 20 0.949 1.084 33.52 35.45
Mar-18 23,126 800,796 34.63 33.88 84.1% 1.106 1.009 1.404 1.015 22 1.043 0.981 33.99 35.55
Apr-18 22,798 777,802 34.12 34.14 84.3% 1.108 1.008 1.407 1.013 21 0.996 1.025 34.96 35.58
May-18 22,511 822,139 36.52 34.25 84.5% 1.109 1.006 1.409 1.011 22 1.043 0.975 35.62 35.61
Jun-18 22,306 775,597 34.77 34.33 84.9% 1.112 1.004 1.411 1.009 21 0.996 1.018 35.39 35.74
Jul-18 22,046 765,202 34.71 34.52 84.9% 1.112 1.004 1.414 1.008 21 0.996 1.015 35.24 35.49
Aug-18 21,709 809,476 37.29 34.71 85.1% 1.113 1.003 1.415 1.007 23 1.091 0.925 34.51 35.62
Sep-18 21,412 721,686 33.70 34.83 85.2% 1.114 1.002 1.419 1.004 19 0.901 1.117 37.63 35.74
Oct-18 21,166 801,098 37.85 34.96 85.2% 1.114 1.002 1.423 1.001 23 1.091 0.920 34.83 35.66
Nov-18 20,866 769,059 36.86 35.12 85.1% 1.113 1.003 1.424 1.000 20 0.949 1.057 38.97 35.68
Dec-18 20,602 718,824 34.89 34.94 85.1% 1.113 1.003 1.424 1.001 19 0.901 1.114 38.86 35.49
Jan-19 19,734 688,993 34.91 35.06 85.0% 1.113 1.003 1.424 1.000 22 1.043 0.962 33.58 35.55
Feb-19 19,531 623,768 31.94 35.20 85.1% 1.113 1.003 1.424 1.001 20 0.949 1.058 33.77 35.60
Mar-19 19,330 690,348 35.71 35.29 85.2% 1.114 1.002 1.424 1.000 21 0.996 1.006 35.94 35.78
Apr-19 19,169 677,305 35.33 35.40 85.2% 1.114 1.002 1.425 1.000 22 1.043 0.960 33.93 35.71
May-19 19,035 698,765 36.71 35.40 85.2% 1.114 1.002 1.423 1.001 22 1.043 0.961 35.28 35.69
Jun-19 18,920 652,014 34.46 35.38 85.2% 1.114 1.002 1.424 1.001 20 0.949 1.058 36.44 35.77
Jul-19 18,831 679,451 36.08 35.50 85.2% 1.114 1.002 1.422 1.002 21 0.996 1.008 36.38 35.87
Aug-19 18,705 677,398 36.21 35.39 85.2% 1.114 1.002 1.422 1.002 22 1.043 0.962 34.85 35.91
Sep-19 18,522 640,035 34.56 35.48 85.2% 1.114 1.002 1.422 1.002 21 0.996 1.008 34.84 35.67
Oct-19 18,287 698,478 38.20 35.48 85.3% 1.115 1.001 1.421 1.003 22 1.043 0.962 36.74 35.83
Nov-19 18,096 630,620 34.85 35.30 85.4% 1.116 1.001 1.424 1.000 19 0.901 1.111 38.71 35.77
Dec-19 17,787 702,936 39.52 35.67 85.5% 1.116 1.000 1.425 1.000 21 0.996 1.004 39.68 35.80
CY2018 / CY 2017 Annual Increase 4.0% 0.1%
CY2019 / CY 2018 Annual Increase 2.1% 0.9%
Individual Market Individual Market - Adjustments for Benefits. Aging and Working Days Indivdiual Market - Adjusted
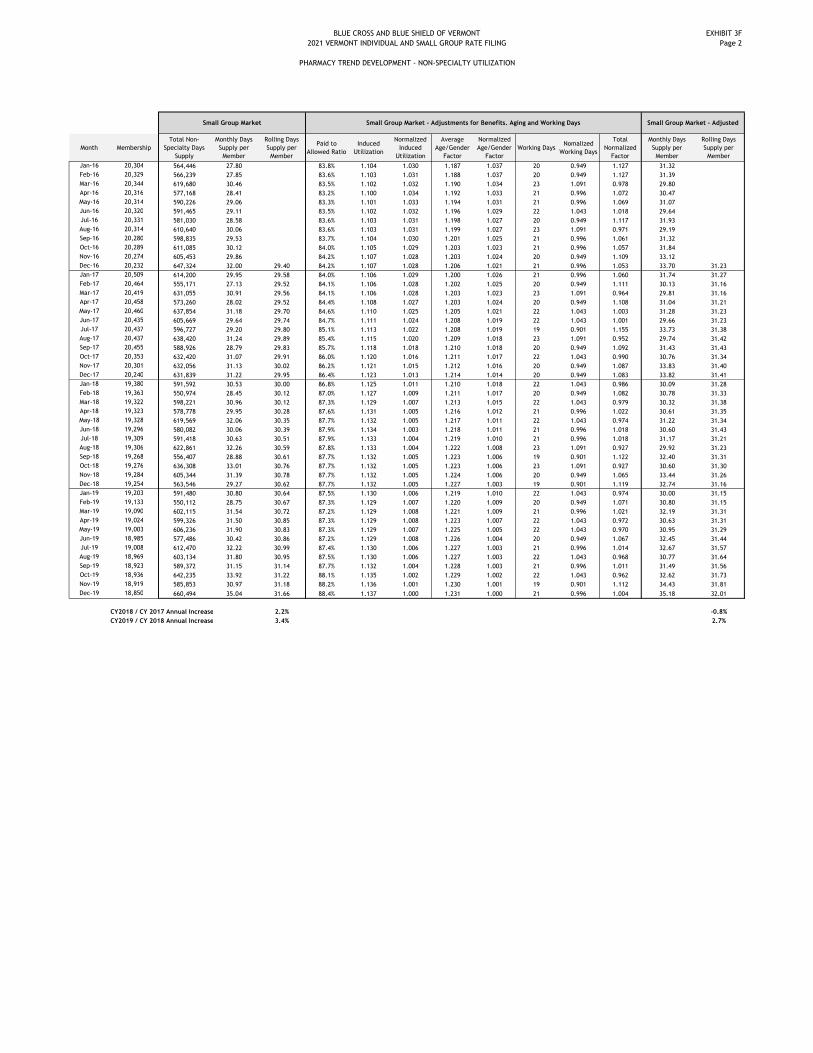
BLUE CROSS AND BLUE SHIELD OF VERMONT
2021 VERMONT INDIVIDUAL AND SMALL GROUP RATE FILING
PHARMACY TREND DEVELOPMENT - NON-SPECIALTY UTILIZATION
EXHIBIT 3F
Page 2
Month Membership
Total Non-
Specialty Days
Supply
Monthly Days
Supply per
Member
Rolling Days
Supply per
Member
Paid to
Allowed Ratio
Induced
Utilization
Normalized
Induced
Utilization
Average
Age/Gender
Factor
Normalized
Age/Gender
Factor
Working DaysNomalized
Working Days
Total
Normalized
Factor
Monthly Days
Supply per
Member
Rolling Days
Supply per
Member
Jan-16 20,304 564,446 27.80 83.8% 1.104 1.030 1.187 1.037 20 0.949 1.127 31.32
Feb-16 20,329 566,239 27.85 83.6% 1.103 1.031 1.188 1.037 20 0.949 1.127 31.39
Mar-16 20,344 619,680 30.46 83.5% 1.102 1.032 1.190 1.034 23 1.091 0.978 29.80
Apr-16 20,316 577,168 28.41 83.2% 1.100 1.034 1.192 1.033 21 0.996 1.072 30.47
May-16 20,314 590,226 29.06 83.3% 1.101 1.033 1.194 1.031 21 0.996 1.069 31.07
Jun-16 20,320 591,465 29.11 83.5% 1.102 1.032 1.196 1.029 22 1.043 1.018 29.64
Jul-16 20,331 581,030 28.58 83.6% 1.103 1.031 1.198 1.027 20 0.949 1.117 31.93
Aug-16 20,314 610,640 30.06 83.6% 1.103 1.031 1.199 1.027 23 1.091 0.971 29.19
Sep-16 20,280 598,835 29.53 83.7% 1.104 1.030 1.201 1.025 21 0.996 1.061 31.32
Oct-16 20,289 611,085 30.12 84.0% 1.105 1.029 1.203 1.023 21 0.996 1.057 31.84
Nov-16 20,274 605,453 29.86 84.2% 1.107 1.028 1.203 1.024 20 0.949 1.109 33.12
Dec-16 20,232 647,324 32.00 29.40 84.2% 1.107 1.028 1.206 1.021 21 0.996 1.053 33.70 31.23
Jan-17 20,509 614,200 29.95 29.58 84.0% 1.106 1.029 1.200 1.026 21 0.996 1.060 31.74 31.27
Feb-17 20,464 555,171 27.13 29.52 84.1% 1.106 1.028 1.202 1.025 20 0.949 1.111 30.13 31.16
Mar-17 20,419 631,055 30.91 29.56 84.1% 1.106 1.028 1.203 1.023 23 1.091 0.964 29.81 31.16
Apr-17 20,458 573,260 28.02 29.52 84.4% 1.108 1.027 1.203 1.024 20 0.949 1.108 31.04 31.21
May-17 20,460 637,854 31.18 29.70 84.6% 1.110 1.025 1.205 1.021 22 1.043 1.003 31.28 31.23
Jun-17 20,435 605,669 29.64 29.74 84.7% 1.111 1.024 1.208 1.019 22 1.043 1.001 29.66 31.23
Jul-17 20,437 596,727 29.20 29.80 85.1% 1.113 1.022 1.208 1.019 19 0.901 1.155 33.73 31.38
Aug-17 20,437 638,420 31.24 29.89 85.4% 1.115 1.020 1.209 1.018 23 1.091 0.952 29.74 31.42
Sep-17 20,455 588,926 28.79 29.83 85.7% 1.118 1.018 1.210 1.018 20 0.949 1.092 31.43 31.43
Oct-17 20,353 632,420 31.07 29.91 86.0% 1.120 1.016 1.211 1.017 22 1.043 0.990 30.76 31.34
Nov-17 20,301 632,056 31.13 30.02 86.2% 1.121 1.015 1.212 1.016 20 0.949 1.087 33.83 31.40
Dec-17 20,240 631,839 31.22 29.95 86.4% 1.123 1.013 1.214 1.014 20 0.949 1.083 33.82 31.41
Jan-18 19,380 591,592 30.53 30.00 86.8% 1.125 1.011 1.210 1.018 22 1.043 0.986 30.09 31.28
Feb-18 19,363 550,974 28.45 30.12 87.0% 1.127 1.009 1.211 1.017 20 0.949 1.082 30.78 31.33
Mar-18 19,322 598,221 30.96 30.12 87.3% 1.129 1.007 1.213 1.015 22 1.043 0.979 30.32 31.38
Apr-18 19,323 578,778 29.95 30.28 87.6% 1.131 1.005 1.216 1.012 21 0.996 1.022 30.61 31.35
May-18 19,328 619,569 32.06 30.35 87.7% 1.132 1.005 1.217 1.011 22 1.043 0.974 31.22 31.34
Jun-18 19,296 580,082 30.06 30.39 87.9% 1.134 1.003 1.218 1.011 21 0.996 1.018 30.60 31.43
Jul-18 19,309 591,418 30.63 30.51 87.9% 1.133 1.004 1.219 1.010 21 0.996 1.018 31.17 31.21
Aug-18 19,306 622,861 32.26 30.59 87.8% 1.133 1.004 1.222 1.008 23 1.091 0.927 29.92 31.23
Sep-18 19,268 556,407 28.88 30.61 87.7% 1.132 1.005 1.223 1.006 19 0.901 1.122 32.40 31.31
Oct-18 19,276 636,308 33.01 30.76 87.7% 1.132 1.005 1.223 1.006 23 1.091 0.927 30.60 31.30
Nov-18 19,284 605,344 31.39 30.78 87.7% 1.132 1.005 1.224 1.006 20 0.949 1.065 33.44 31.26
Dec-18 19,254 563,546 29.27 30.62 87.7% 1.132 1.005 1.227 1.003 19 0.901 1.119 32.74 31.16
Jan-19 19,203 591,480 30.80 30.64 87.5% 1.130 1.006 1.219 1.010 22 1.043 0.974 30.00 31.15
Feb-19 19,133 550,112 28.75 30.67 87.3% 1.129 1.007 1.220 1.009 20 0.949 1.071 30.80 31.15
Mar-19 19,090 602,115 31.54 30.72 87.2% 1.129 1.008 1.221 1.009 21 0.996 1.021 32.19 31.31
Apr-19 19,024 599,326 31.50 30.85 87.3% 1.129 1.008 1.223 1.007 22 1.043 0.972 30.63 31.31
May-19 19,003 606,236 31.90 30.83 87.3% 1.129 1.007 1.225 1.005 22 1.043 0.970 30.95 31.29
Jun-19 18,985 577,486 30.42 30.86 87.2% 1.129 1.008 1.226 1.004 20 0.949 1.067 32.45 31.44
Jul-19 19,008 612,470 32.22 30.99 87.4% 1.130 1.006 1.227 1.003 21 0.996 1.014 32.67 31.57
Aug-19 18,969 603,134 31.80 30.95 87.5% 1.130 1.006 1.227 1.003 22 1.043 0.968 30.77 31.64
Sep-19 18,923 589,372 31.15 31.14 87.7% 1.132 1.004 1.228 1.003 21 0.996 1.011 31.49 31.56
Oct-19 18,936 642,235 33.92 31.22 88.1% 1.135 1.002 1.229 1.002 22 1.043 0.962 32.62 31.73
Nov-19 18,919 585,853 30.97 31.18 88.2% 1.136 1.001 1.230 1.001 19 0.901 1.112 34.43 31.81
Dec-19 18,850 660,494 35.04 31.66 88.4% 1.137 1.000 1.231 1.000 21 0.996 1.004 35.18 32.01
CY2018 / CY 2017 Annual Increase 2.2% -0.8%
CY2019 / CY 2018 Annual Increase 3.4% 2.7%
Small Group Market Small Group Market - Adjustments for Benefits. Aging and Working Days Small Group Market - Adjusted
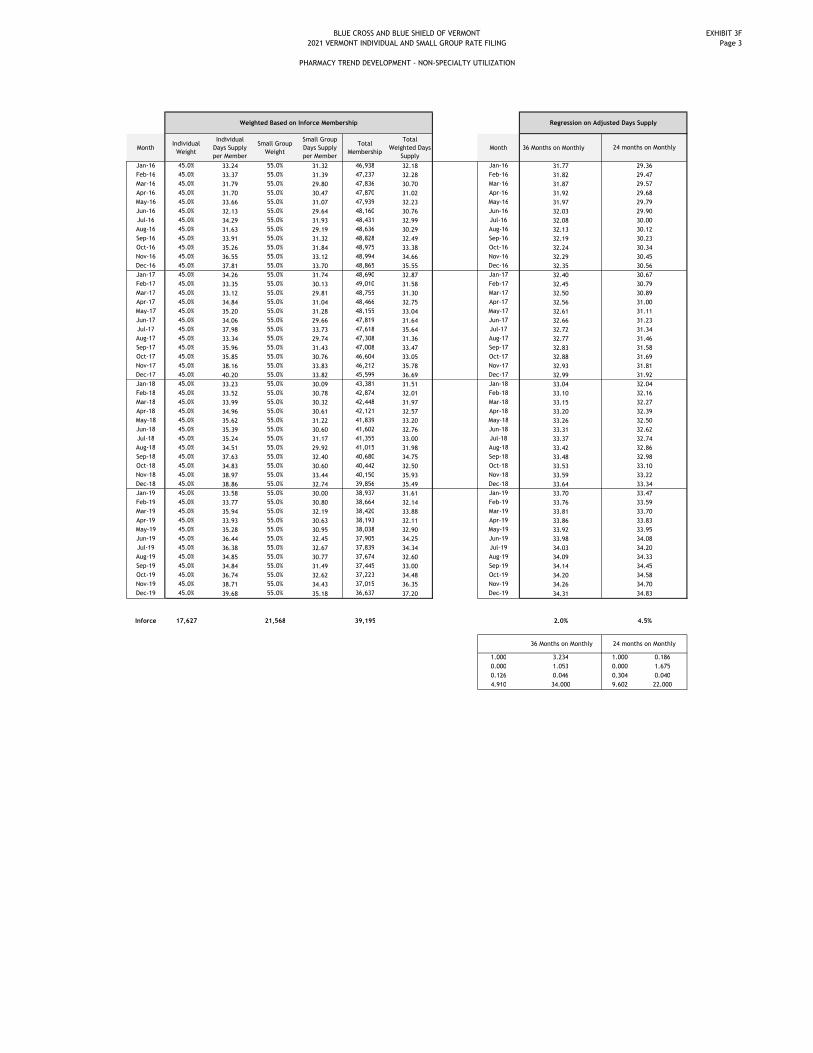
BLUE CROSS AND BLUE SHIELD OF VERMONT
2021 VERMONT INDIVIDUAL AND SMALL GROUP RATE FILING
PHARMACY TREND DEVELOPMENT - NON-SPECIALTY UTILIZATION
EXHIBIT 3F
Page 3
MonthIndividual
Weight
Individual
Days Supply
per Member
Small Group
Weight
Small Group
Days Supply
per Member
Total
Membership
Total
Weighted Days
Supply
Month 36 Months on Monthly
Jan-16 45.0% 33.24 55.0% 31.32 46,938 32.18 Jan-16 31.77
Feb-16 45.0% 33.37 55.0% 31.39 47,237 32.28 Feb-16 31.82
Mar-16 45.0% 31.79 55.0% 29.80 47,836 30.70 Mar-16 31.87
Apr-16 45.0% 31.70 55.0% 30.47 47,870 31.02 Apr-16 31.92
May-16 45.0% 33.66 55.0% 31.07 47,939 32.23 May-16 31.97
Jun-16 45.0% 32.13 55.0% 29.64 48,160 30.76 Jun-16 32.03
Jul-16 45.0% 34.29 55.0% 31.93 48,431 32.99 Jul-16 32.08
Aug-16 45.0% 31.63 55.0% 29.19 48,636 30.29 Aug-16 32.13
Sep-16 45.0% 33.91 55.0% 31.32 48,828 32.49 Sep-16 32.19
Oct-16 45.0% 35.26 55.0% 31.84 48,975 33.38 Oct-16 32.24
Nov-16 45.0% 36.55 55.0% 33.12 48,994 34.66 Nov-16 32.29
Dec-16 45.0% 37.81 55.0% 33.70 48,865 35.55 Dec-16 32.35
Jan-17 45.0% 34.26 55.0% 31.74 48,690 32.87 Jan-17 32.40
Feb-17 45.0% 33.35 55.0% 30.13 49,010 31.58 Feb-17 32.45
Mar-17 45.0% 33.12 55.0% 29.81 48,755 31.30 Mar-17 32.50
Apr-17 45.0% 34.84 55.0% 31.04 48,466 32.75 Apr-17 32.56
May-17 45.0% 35.20 55.0% 31.28 48,155 33.04 May-17 32.61
Jun-17 45.0% 34.06 55.0% 29.66 47,819 31.64 Jun-17 32.66
Jul-17 45.0% 37.98 55.0% 33.73 47,618 35.64 Jul-17 32.72
Aug-17 45.0% 33.34 55.0% 29.74 47,308 31.36 Aug-17 32.77
Sep-17 45.0% 35.96 55.0% 31.43 47,008 33.47 Sep-17 32.83
Oct-17 45.0% 35.85 55.0% 30.76 46,604 33.05 Oct-17 32.88
Nov-17 45.0% 38.16 55.0% 33.83 46,212 35.78 Nov-17 32.93
Dec-17 45.0% 40.20 55.0% 33.82 45,599 36.69 Dec-17 32.99
Jan-18 45.0% 33.23 55.0% 30.09 43,381 31.51 Jan-18 33.04
Feb-18 45.0% 33.52 55.0% 30.78 42,874 32.01 Feb-18 33.10
Mar-18 45.0% 33.99 55.0% 30.32 42,448 31.97 Mar-18 33.15
Apr-18 45.0% 34.96 55.0% 30.61 42,121 32.57 Apr-18 33.20
May-18 45.0% 35.62 55.0% 31.22 41,839 33.20 May-18 33.26
Jun-18 45.0% 35.39 55.0% 30.60 41,602 32.76 Jun-18 33.31
Jul-18 45.0% 35.24 55.0% 31.17 41,355 33.00 Jul-18 33.37
Aug-18 45.0% 34.51 55.0% 29.92 41,015 31.98 Aug-18 33.42
Sep-18 45.0% 37.63 55.0% 32.40 40,680 34.75 Sep-18 33.48
Oct-18 45.0% 34.83 55.0% 30.60 40,442 32.50 Oct-18 33.53
Nov-18 45.0% 38.97 55.0% 33.44 40,150 35.93 Nov-18 33.59
Dec-18 45.0% 38.86 55.0% 32.74 39,856 35.49 Dec-18 33.64
Jan-19 45.0% 33.58 55.0% 30.00 38,937 31.61 Jan-19 33.70
Feb-19 45.0% 33.77 55.0% 30.80 38,664 32.14 Feb-19 33.76
Mar-19 45.0% 35.94 55.0% 32.19 38,420 33.88 Mar-19 33.81
Apr-19 45.0% 33.93 55.0% 30.63 38,193 32.11 Apr-19 33.86
May-19 45.0% 35.28 55.0% 30.95 38,038 32.90 May-19 33.92
Jun-19 45.0% 36.44 55.0% 32.45 37,905 34.25 Jun-19 33.98
Jul-19 45.0% 36.38 55.0% 32.67 37,839 34.34 Jul-19 34.03
Aug-19 45.0% 34.85 55.0% 30.77 37,674 32.60 Aug-19 34.09
Sep-19 45.0% 34.84 55.0% 31.49 37,445 33.00 Sep-19 34.14
Oct-19 45.0% 36.74 55.0% 32.62 37,223 34.48 Oct-19 34.20
Nov-19 45.0% 38.71 55.0% 34.43 37,015 36.35 Nov-19 34.26
Dec-19 45.0% 39.68 55.0% 35.18 36,637 37.20 Dec-19 34.31
Inforce 17,627 21,568 39,195 2.0%
1.000 3.234 1.000 0.186
0.000 1.053 0.000 1.675
0.126 0.046 0.304 0.040
4.910 34.000 9.602 22.000
Weighted Based on Inforce Membership Regression on Adjusted Days Supply
29.79
24 months on Monthly
29.36
29.47
29.57
29.68
31.11
29.90
30.00
30.12
30.23
30.34
30.45
30.56
30.67
30.79
30.89
31.00
32.50
31.23
31.34
31.46
31.58
31.69
31.81
31.92
32.04
32.16
32.27
32.39
33.95
32.62
32.74
32.86
32.98
33.10
33.22
33.34
33.47
33.59
33.70
33.83
34.83
4.5%
36 Months on Monthly 24 months on Monthly
34.08
34.20
34.33
34.45
34.58
34.70
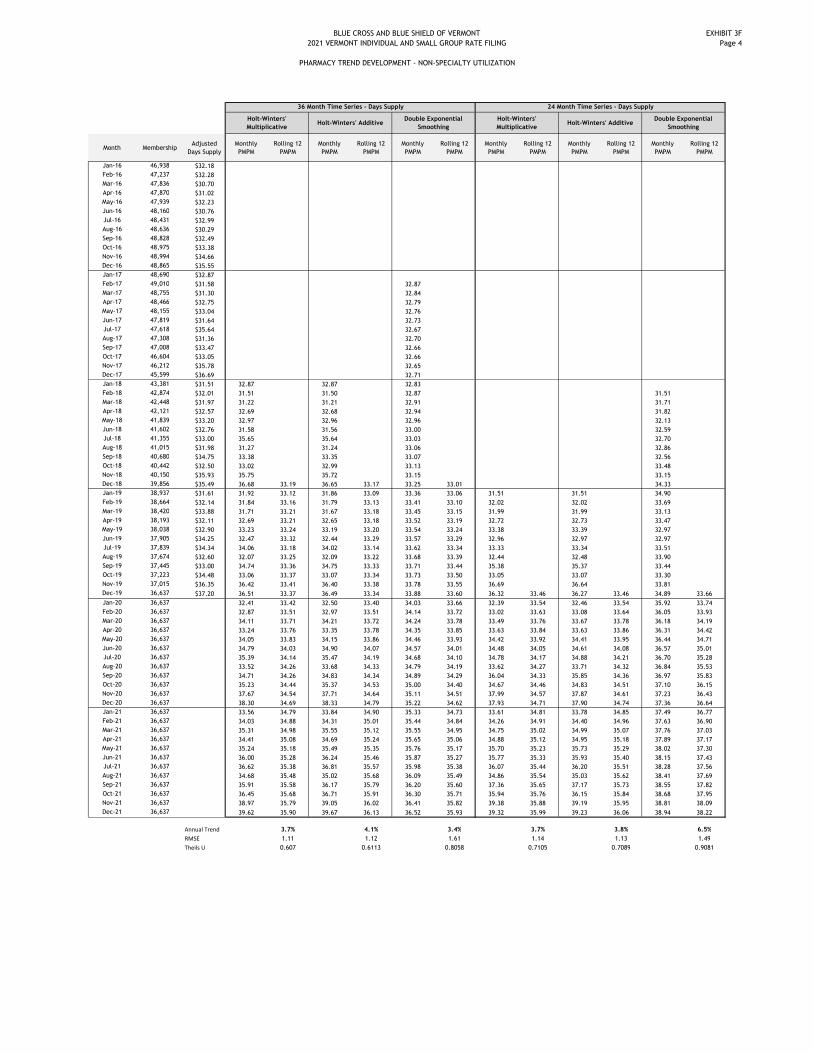
BLUE CROSS AND BLUE SHIELD OF VERMONT
2021 VERMONT INDIVIDUAL AND SMALL GROUP RATE FILING
PHARMACY TREND DEVELOPMENT - NON-SPECIALTY UTILIZATION
EXHIBIT 3F
Page 4
Month MembershipAdjusted
Days Supply
Monthly
PMPM
Rolling 12
PMPM
Monthly
PMPM
Rolling 12
PMPM
Monthly
PMPM
Rolling 12
PMPM
Monthly
PMPM
Rolling 12
PMPM
Monthly
PMPM
Rolling 12
PMPM
Monthly
PMPM
Rolling 12
PMPM
Jan-16 46,938 $32.18
Feb-16 47,237 $32.28
Mar-16 47,836 $30.70
Apr-16 47,870 $31.02
May-16 47,939 $32.23
Jun-16 48,160 $30.76
Jul-16 48,431 $32.99
Aug-16 48,636 $30.29
Sep-16 48,828 $32.49
Oct-16 48,975 $33.38
Nov-16 48,994 $34.66
Dec-16 48,865 $35.55
Jan-17 48,690 $32.87
Feb-17 49,010 $31.58 32.87
Mar-17 48,755 $31.30 32.84
Apr-17 48,466 $32.75 32.79
May-17 48,155 $33.04 32.76
Jun-17 47,819 $31.64 32.73
Jul-17 47,618 $35.64 32.67
Aug-17 47,308 $31.36 32.70
Sep-17 47,008 $33.47 32.66
Oct-17 46,604 $33.05 32.66
Nov-17 46,212 $35.78 32.65
Dec-17 45,599 $36.69 32.71
Jan-18 43,381 $31.51 32.87 32.87 32.83
Feb-18 42,874 $32.01 31.51 31.50 32.87 31.51
Mar-18 42,448 $31.97 31.22 31.21 32.91 31.71
Apr-18 42,121 $32.57 32.69 32.68 32.94 31.82
May-18 41,839 $33.20 32.97 32.96 32.96 32.13
Jun-18 41,602 $32.76 31.58 31.56 33.00 32.59
Jul-18 41,355 $33.00 35.65 35.64 33.03 32.70
Aug-18 41,015 $31.98 31.27 31.24 33.06 32.86
Sep-18 40,680 $34.75 33.38 33.35 33.07 32.56
Oct-18 40,442 $32.50 33.02 32.99 33.13 33.48
Nov-18 40,150 $35.93 35.75 35.72 33.15 33.15
Dec-18 39,856 $35.49 36.68 33.19 36.65 33.17 33.25 33.01 34.33
Jan-19 38,937 $31.61 31.92 33.12 31.86 33.09 33.36 33.06 31.51 31.51 34.90
Feb-19 38,664 $32.14 31.84 33.16 31.79 33.13 33.41 33.10 32.02 32.02 33.69
Mar-19 38,420 $33.88 31.71 33.21 31.67 33.18 33.45 33.15 31.99 31.99 33.13
Apr-19 38,193 $32.11 32.69 33.21 32.65 33.18 33.52 33.19 32.72 32.73 33.47
May-19 38,038 $32.90 33.23 33.24 33.19 33.20 33.54 33.24 33.38 33.39 32.97
Jun-19 37,905 $34.25 32.47 33.32 32.44 33.29 33.57 33.29 32.96 32.97 32.97
Jul-19 37,839 $34.34 34.06 33.18 34.02 33.14 33.62 33.34 33.33 33.34 33.51
Aug-19 37,674 $32.60 32.07 33.25 32.09 33.22 33.68 33.39 32.44 32.48 33.90
Sep-19 37,445 $33.00 34.74 33.36 34.75 33.33 33.71 33.44 35.38 35.37 33.44
Oct-19 37,223 $34.48 33.06 33.37 33.07 33.34 33.73 33.50 33.05 33.07 33.30
Nov-19 37,015 $36.35 36.42 33.41 36.40 33.38 33.78 33.55 36.69 36.64 33.81
Dec-19 36,637 $37.20 36.51 33.37 36.49 33.34 33.88 33.60 36.32 33.46 36.27 33.46 34.89 33.66
Jan-20 36,637 32.41 33.42 32.50 33.40 34.03 33.66 32.39 33.54 32.46 33.54 35.92 33.74
Feb-20 36,637 32.87 33.51 32.97 33.51 34.14 33.72 33.02 33.63 33.08 33.64 36.05 33.93
Mar-20 36,637 34.11 33.71 34.21 33.72 34.24 33.78 33.49 33.76 33.67 33.78 36.18 34.19
Apr-20 36,637 33.24 33.76 33.35 33.78 34.35 33.85 33.63 33.84 33.63 33.86 36.31 34.42
May-20 36,637 34.05 33.83 34.15 33.86 34.46 33.93 34.42 33.92 34.41 33.95 36.44 34.71
Jun-20 36,637 34.79 34.03 34.90 34.07 34.57 34.01 34.48 34.05 34.61 34.08 36.57 35.01
Jul-20 36,637 35.39 34.14 35.47 34.19 34.68 34.10 34.78 34.17 34.88 34.21 36.70 35.28
Aug-20 36,637 33.52 34.26 33.68 34.33 34.79 34.19 33.62 34.27 33.71 34.32 36.84 35.53
Sep-20 36,637 34.71 34.26 34.83 34.34 34.89 34.29 36.04 34.33 35.85 34.36 36.97 35.83
Oct-20 36,637 35.23 34.44 35.37 34.53 35.00 34.40 34.67 34.46 34.83 34.51 37.10 36.15
Nov-20 36,637 37.67 34.54 37.71 34.64 35.11 34.51 37.99 34.57 37.87 34.61 37.23 36.43
Dec-20 36,637 38.30 34.69 38.33 34.79 35.22 34.62 37.93 34.71 37.90 34.74 37.36 36.64
Jan-21 36,637 33.56 34.79 33.84 34.90 35.33 34.73 33.61 34.81 33.78 34.85 37.49 36.77
Feb-21 36,637 34.03 34.88 34.31 35.01 35.44 34.84 34.26 34.91 34.40 34.96 37.63 36.90
Mar-21 36,637 35.31 34.98 35.55 35.12 35.55 34.95 34.75 35.02 34.99 35.07 37.76 37.03
Apr-21 36,637 34.41 35.08 34.69 35.24 35.65 35.06 34.88 35.12 34.95 35.18 37.89 37.17
May-21 36,637 35.24 35.18 35.49 35.35 35.76 35.17 35.70 35.23 35.73 35.29 38.02 37.30
Jun-21 36,637 36.00 35.28 36.24 35.46 35.87 35.27 35.77 35.33 35.93 35.40 38.15 37.43
Jul-21 36,637 36.62 35.38 36.81 35.57 35.98 35.38 36.07 35.44 36.20 35.51 38.28 37.56
Aug-21 36,637 34.68 35.48 35.02 35.68 36.09 35.49 34.86 35.54 35.03 35.62 38.41 37.69
Sep-21 36,637 35.91 35.58 36.17 35.79 36.20 35.60 37.36 35.65 37.17 35.73 38.55 37.82
Oct-21 36,637 36.45 35.68 36.71 35.91 36.30 35.71 35.94 35.76 36.15 35.84 38.68 37.95
Nov-21 36,637 38.97 35.79 39.05 36.02 36.41 35.82 39.38 35.88 39.19 35.95 38.81 38.09
Dec-21 36,637 39.62 35.90 39.67 36.13 36.52 35.93 39.32 35.99 39.23 36.06 38.94 38.22
Annual Trend 3.7% 4.1% 3.4% 3.7% 3.8% 6.5%
RMSE 1.11 1.12 1.61 1.14 1.13 1.49
Theils U 0.607 0.6113 0.8058 0.7105 0.7089 0.9081
Holt-Winters' AdditiveDouble Exponential
Smoothing
36 Month Time Series - Days Supply 24 Month Time Series - Days Supply
Holt-Winters'
MultiplicativeHolt-Winters' Additive
Double Exponential
Smoothing
Holt-Winters'
Multiplicative

CONFIDENTIAL AND PROPRIETARY BLUE CROSS AND BLUE SHIELD OF VERMONT
2021 VERMONT INDIVIDUAL AND SMALL GROUP RATE FILING
PHARMACY TREND DEVELOPMENT - SPECIALTY
Exhibit 3G
Page 1
Month MembershipTotal Allowed
Charges
Adjustment for
Contract
Allowed Charges
Adjusted for
Contract
PMPM Adjusted
for Contract
Rolling 12 PMPM
Adjusted for
Contract
Average
Age/Gender
Factor
Normalized
Age/Gender
Factor
Monthly Rolling 12
Jan-16 26,634 $665,390 $24.98 1.388 1.027 $25.65
Feb-16 26,908 $872,582 $32.43 1.386 1.028 $33.34
Mar-16 27,492 $903,652 $32.87 1.380 1.033 $33.95
Apr-16 27,554 $811,017 $29.43 1.379 1.033 $30.42
May-16 27,625 $911,333 $32.99 1.378 1.034 $34.11
Jun-16 27,840 $903,485 $32.45 1.381 1.032 $33.49
Jul-16 28,100 $913,128 $32.50 1.380 1.032 $33.55
Aug-16 28,322 $1,073,949 $37.92 1.379 1.033 $39.17
Sep-16 28,548 $949,087 $33.25 1.378 1.034 $34.37
Oct-16 28,686 $980,600 $34.18 1.379 1.034 $35.33
Nov-16 28,720 $1,038,447 $36.16 1.380 1.033 $37.34
Dec-16 28,633 $1,113,745 $38.90 $33.24 1.383 1.031 $40.08 34.30
Jan-17 28,181 $950,942 $33.74 $33.93 1.387 1.027 $34.66 35.02
Feb-17 28,546 $1,173,345 $41.10 $34.66 1.383 1.030 $42.34 35.77
Mar-17 28,336 $1,259,631 $44.45 $35.62 1.382 1.031 $45.84 36.76
Apr-17 28,008 $1,110,790 $39.66 $36.46 1.383 1.030 $40.86 37.61
May-17 27,695 $1,362,103 $49.18 $37.78 1.385 1.028 $50.58 38.95
Jun-17 27,384 $1,232,072 $44.99 $38.80 1.388 1.027 $46.20 39.99
Jul-17 27,181 $1,214,915 $44.70 $39.79 1.388 1.026 $45.87 40.99
Aug-17 26,871 $1,428,073 $53.15 $41.02 1.389 1.025 $54.50 42.22
Sep-17 26,553 $1,299,449 $48.94 $42.31 1.391 1.024 $50.12 43.52
Oct-17 26,251 $1,269,245 $48.35 $43.49 1.392 1.023 $49.48 44.70
Nov-17 25,911 $1,399,424 $54.01 $44.95 1.394 1.022 $55.20 46.16
Dec-17 25,359 $1,389,017 $54.77 $46.25 1.397 1.020 $55.88 47.45
Jan-18 24,001 $1,285,263 $53.55 $47.88 1.399 1.019 $54.55 49.10
Feb-18 23,511 $1,136,511 $48.34 $48.53 1.401 1.017 $49.16 49.71
Mar-18 23,126 $1,324,276 $57.26 $49.55 1.404 1.015 $58.12 50.69
Apr-18 22,798 $1,402,975 $61.54 $51.34 1.407 1.013 $62.33 52.45
May-18 22,511 $1,346,731 $59.83 $52.17 1.409 1.011 $60.50 53.23
Jun-18 22,306 $1,386,174 $62.14 $53.59 1.411 1.009 $62.73 54.59
Jul-18 22,046 $1,532,818 $69.53 $55.62 1.414 1.008 $70.06 56.58
Aug-18 21,709 $1,525,766 $70.28 $56.97 1.415 1.007 $70.76 57.85
Sep-18 21,412 $1,424,517 $66.53 $58.46 1.419 1.004 $66.79 59.26
Oct-18 21,166 $1,622,499 $76.66 $60.81 1.423 1.001 $76.77 61.53
Nov-18 20,866 $1,438,297 $68.93 $62.09 1.424 1.000 $68.96 62.71
Dec-18 20,602 $1,134,883 $55.09 $62.25 1.424 1.001 $55.13 62.78
Jan-19 19,734 $1,267,691 $64.24 $63.19 1.424 1.000 $64.26 63.64
Feb-19 19,531 $1,143,607 $58.55 $64.20 1.424 1.001 $58.58 64.58
Mar-19 19,330 $1,340,806 $69.36 $65.22 1.424 1.000 $69.38 65.53
Apr-19 19,169 $1,456,441 $75.98 $66.38 1.425 1.000 $75.96 66.62
May-19 19,035 $1,408,919 $74.02 $67.57 1.423 1.001 $74.09 67.76
Jun-19 18,920 $1,370,159 $72.42 $68.44 1.424 1.001 $72.48 68.58
Jul-19 18,831 $1,409,184 $74.83 $68.84 1.422 1.002 $75.00 68.95
Aug-19 18,705 $1,456,918 $77.89 $69.42 1.422 1.002 $78.05 69.50
Sep-19 18,522 $1,348,976 $72.83 $69.96 1.422 1.002 $73.00 70.03
Oct-19 18,287 $1,392,820 $76.16 $69.83 1.421 1.003 $76.36 69.91
Nov-19 18,096 $1,332,201 $73.62 $70.22 1.424 1.000 $73.65 70.29
Dec-19 17,787 $1,363,735 $76.67 $72.10 1.425 1.000 $76.67 72.18
CY2017 / CY 2016 Annual Increase 39.1% 38.3%
CY2018 / CY 2017 Annual Increase 34.6% 32.3%
CY2019 / CY 2018 Annual Increase 15.8% 15.0%
Individual Market - Specialty Drug - Adjustment for Contract Adjustment for Aging

CONFIDENTIAL AND PROPRIETARY BLUE CROSS AND BLUE SHIELD OF VERMONT
2021 VERMONT INDIVIDUAL AND SMALL GROUP RATE FILING
PHARMACY TREND DEVELOPMENT - SPECIALTY
Exhibit 3G
Page 2
Month MembershipTotal Allowed
Charges
Adjustment for
Contract
Allowed Charges
Adjusted for
Contract
PMPM Adjusted
for Contract
Rolling 12 PMPM
Adjusted for
Contract
Average
Age/Gender
Factor
Normalized
Age/Gender
Factor
Monthly Rolling 12
Jan-16 20,304 $465,136 $22.91 1.187 1.037 $23.77
Feb-16 20,329 $647,646 $31.86 1.188 1.037 $33.02
Mar-16 20,344 $598,018 $29.40 1.190 1.034 $30.41
Apr-16 20,316 $583,284 $28.71 1.192 1.033 $29.66
May-16 20,314 $573,125 $28.21 1.194 1.031 $29.08
Jun-16 20,320 $627,085 $30.86 1.196 1.029 $31.77
Jul-16 20,331 $519,308 $25.54 1.198 1.027 $26.24
Aug-16 20,314 $700,585 $34.49 1.199 1.027 $35.42
Sep-16 20,280 $630,849 $31.11 1.201 1.025 $31.89
Oct-16 20,289 $552,258 $27.22 1.203 1.023 $27.86
Nov-16 20,274 $744,944 $36.74 1.203 1.024 $37.61
Dec-16 20,232 $784,878 $38.79 $30.48 1.206 1.021 $39.60 31.36
Jan-17 20,509 $761,878 $37.15 $31.67 1.200 1.026 $38.12 32.56
Feb-17 20,464 $682,030 $33.33 $31.80 1.202 1.025 $34.15 32.65
Mar-17 20,419 $837,010 $40.99 $32.77 1.203 1.023 $41.95 33.62
Apr-17 20,458 $580,521 $28.38 $32.74 1.203 1.024 $29.05 33.56
May-17 20,460 $713,990 $34.90 $33.29 1.205 1.021 $35.64 34.11
Jun-17 20,435 $726,238 $35.54 $33.68 1.208 1.019 $36.23 34.48
Jul-17 20,437 $675,565 $33.06 $34.31 1.208 1.019 $33.68 35.10
Aug-17 20,437 $834,155 $40.82 $34.84 1.209 1.018 $41.56 35.61
Sep-17 20,455 $815,922 $39.89 $35.57 1.210 1.018 $40.59 36.34
Oct-17 20,353 $966,582 $47.49 $37.25 1.211 1.017 $48.28 38.03
Nov-17 20,301 $891,452 $43.91 $37.84 1.212 1.016 $44.60 38.61
Dec-17 20,240 $758,882 $37.49 $37.74 1.214 1.014 $38.03 38.48
Jan-18 19,380 $944,164 $48.72 $38.66 1.210 1.018 $49.58 39.39
Feb-18 19,363 $798,066 $41.22 $39.31 1.211 1.017 $41.90 40.04
Mar-18 19,322 $931,525 $48.21 $39.88 1.213 1.015 $48.92 40.58
Apr-18 19,323 $1,020,935 $52.84 $41.90 1.216 1.012 $53.49 42.60
May-18 19,328 $1,022,855 $52.92 $43.39 1.217 1.011 $53.51 44.08
Jun-18 19,296 $920,541 $47.71 $44.41 1.218 1.011 $48.21 45.09
Jul-18 19,309 $914,464 $47.36 $45.63 1.219 1.010 $47.83 46.29
Aug-18 19,306 $948,213 $49.11 $46.33 1.222 1.008 $49.50 46.97
Sep-18 19,268 $894,164 $46.41 $46.90 1.223 1.006 $46.71 47.50
Oct-18 19,276 $1,092,169 $56.66 $47.65 1.223 1.006 $57.02 48.22
Nov-18 19,284 $924,944 $47.96 $48.01 1.224 1.006 $48.26 48.54
Dec-18 19,254 $780,138 $40.52 $48.30 1.227 1.003 $40.65 48.80
Jan-19 19,203 $984,700 $51.28 $48.51 1.219 1.010 $51.80 48.98
Feb-19 19,133 $1,035,033 $54.10 $49.59 1.220 1.009 $54.58 50.04
Mar-19 19,090 $954,341 $49.99 $49.74 1.221 1.009 $50.42 50.16
Apr-19 19,024 $1,143,974 $60.13 $50.33 1.223 1.007 $60.54 50.74
May-19 19,003 $1,185,831 $62.40 $51.11 1.225 1.005 $62.72 51.49
Jun-19 18,985 $1,046,516 $55.12 $51.73 1.226 1.004 $55.35 52.09
Jul-19 19,008 $1,230,471 $64.73 $53.17 1.227 1.003 $64.96 53.51
Aug-19 18,969 $1,220,419 $64.34 $54.44 1.227 1.003 $64.56 54.76
Sep-19 18,923 $1,059,282 $55.98 $55.24 1.228 1.003 $56.12 55.55
Oct-19 18,936 $1,177,531 $62.18 $55.69 1.229 1.002 $62.29 55.98
Nov-19 18,919 $1,087,452 $57.48 $56.49 1.230 1.001 $57.53 56.76
Dec-19 18,850 $1,461,804 $77.55 $59.58 1.231 1.000 $77.55 59.84
CY2017 / CY 2016 Annual Increase 23.8% 22.7%
CY2018 / CY 2017 Annual Increase 28.0% 26.8%
CY2019 / CY 2018 Annual Increase 23.4% 22.6%
Small Group Market - Specialty Drug - Adjustment for Contract Adjustment for Aging

CONFIDENTIAL AND PROPRIETARY BLUE CROSS AND BLUE SHIELD OF VERMONT
2021 VERMONT INDIVIDUAL AND SMALL GROUP RATE FILING
PHARMACY TREND DEVELOPMENT - SPECIALTY
Exhibit 3G
Page 3
MonthIndividual
Weight
Individual
PMPM
Small Group
Weight
Small Group
PMPM
Total
Membership
Total
Weighted
PMPMMonth
24 Months on Monthly 36 Months on Monthly
Jan-16 45.0% $25.65 55.0% $23.77 46,938 $24.62 Jan-16 $36.04 $31.35
Feb-16 45.0% $33.34 55.0% $33.02 47,237 $33.17 Feb-16 $36.57 $31.93
Mar-16 45.0% $33.95 55.0% $30.41 47,836 $32.00 Mar-16 $37.07 $32.48
Apr-16 45.0% $30.42 55.0% $29.66 47,870 $30.00 Apr-16 $37.61 $33.08
May-16 45.0% $34.11 55.0% $29.08 47,939 $31.34 May-16 $38.15 $33.67
Jun-16 45.0% $33.49 55.0% $31.77 48,160 $32.54 Jun-16 $38.71 $34.30
Jul-16 45.0% $33.55 55.0% $26.24 48,431 $29.53 Jul-16 $39.26 $34.91
Aug-16 45.0% $39.17 55.0% $35.42 48,636 $37.11 Aug-16 $39.83 $35.56
Sep-16 45.0% $34.37 55.0% $31.89 48,828 $33.01 Sep-16 $40.42 $36.22
Oct-16 45.0% $35.33 55.0% $27.86 48,975 $31.22 Oct-16 $40.99 $36.86
Nov-16 45.0% $37.34 55.0% $37.61 48,994 $37.49 Nov-16 $41.59 $37.55
Dec-16 45.0% $40.08 55.0% $39.60 48,865 $39.82 Dec-16 $42.18 $38.22
Jan-17 45.0% $34.66 55.0% $38.12 48,690 $36.57 Jan-17 $42.80 $38.93
Feb-17 45.0% $42.34 55.0% $34.15 49,010 $37.83 Feb-17 $43.43 $39.65
Mar-17 45.0% $45.84 55.0% $41.95 48,755 $43.70 Mar-17 $44.00 $40.31
Apr-17 45.0% $40.86 55.0% $29.05 48,466 $34.36 Apr-17 $44.65 $41.06
May-17 45.0% $50.58 55.0% $35.64 48,155 $42.36 May-17 $45.28 $41.79
Jun-17 45.0% $46.20 55.0% $36.23 47,819 $40.71 Jun-17 $45.94 $42.57
Jul-17 45.0% $45.87 55.0% $33.68 47,618 $39.16 Jul-17 $46.59 $43.33
Aug-17 45.0% $54.50 55.0% $41.56 47,308 $47.38 Aug-17 $47.28 $44.13
Sep-17 45.0% $50.12 55.0% $40.59 47,008 $44.87 Sep-17 $47.97 $44.95
Oct-17 45.0% $49.48 55.0% $48.28 46,604 $48.82 Oct-17 $48.65 $45.76
Nov-17 45.0% $55.20 55.0% $44.60 46,212 $49.37 Nov-17 $49.36 $46.60
Dec-17 45.0% $55.88 55.0% $38.03 45,599 $46.06 Dec-17 $50.06 $47.44
Jan-18 45.0% $54.55 55.0% $49.58 43,381 $51.81 Jan-18 $50.80 $48.32
Feb-18 45.0% $49.16 55.0% $41.90 42,874 $45.16 Feb-18 $51.54 $49.21
Mar-18 45.0% $58.12 55.0% $48.92 42,448 $53.05 Mar-18 $52.23 $50.03
Apr-18 45.0% $62.33 55.0% $53.49 42,121 $57.47 Apr-18 $52.99 $50.96
May-18 45.0% $60.50 55.0% $53.51 41,839 $56.66 May-18 $53.74 $51.87
Jun-18 45.0% $62.73 55.0% $48.21 41,602 $54.74 Jun-18 $54.53 $52.83
Jul-18 45.0% $70.06 55.0% $47.83 41,355 $57.83 Jul-18 $55.30 $53.78
Aug-18 45.0% $70.76 55.0% $49.50 41,015 $59.06 Aug-18 $56.11 $54.78
Sep-18 45.0% $66.79 55.0% $46.71 40,680 $55.74 Sep-18 $56.94 $55.79
Oct-18 45.0% $76.77 55.0% $57.02 40,442 $65.90 Oct-18 $57.74 $56.79
Nov-18 45.0% $68.96 55.0% $48.26 40,150 $57.57 Nov-18 $58.59 $57.84
Dec-18 45.0% $55.13 55.0% $40.65 39,856 $47.16 Dec-18 $59.42 $58.88
Jan-19 45.0% $64.26 55.0% $51.80 38,937 $57.40 Jan-19 $60.29 $59.97
Feb-19 45.0% $58.58 55.0% $54.58 38,664 $56.38 Feb-19 $61.18 $61.08
Mar-19 45.0% $69.38 55.0% $50.42 38,420 $58.95 Mar-19 $61.99 $62.10
Apr-19 45.0% $75.96 55.0% $60.54 38,193 $67.47 Apr-19 $62.90 $63.25
May-19 45.0% $74.09 55.0% $62.72 38,038 $67.83 May-19 $63.79 $64.38
Jun-19 45.0% $72.48 55.0% $55.35 37,905 $63.05 Jun-19 $64.72 $65.57
Jul-19 45.0% $75.00 55.0% $64.96 37,839 $69.48 Jul-19 $65.64 $66.75
Aug-19 45.0% $78.05 55.0% $64.56 37,674 $70.63 Aug-19 $66.60 $67.99
Sep-19 45.0% $73.00 55.0% $56.12 37,445 $63.71 Sep-19 $67.58 $69.24
Oct-19 45.0% $76.36 55.0% $62.29 37,223 $68.62 Oct-19 $68.54 $70.49
Nov-19 45.0% $73.65 55.0% $57.53 37,015 $64.78 Nov-19 $69.54 $71.79
Dec-19 45.0% $76.67 55.0% $77.55 36,637 $77.15 Dec-19 $70.53 $73.08
Inforce 17,627 21,568 39,195
18.7% 24.1%
1.000 0.000 1.001 0.000
0.000 3.454 0.000 1.899
0.613 0.082 0.843 0.083
34.877 22.000 181.888 34.000
Regression on Adjusted PMPM-24 Months
on Monthly
Regression on Adjusted PMPM-36
Months on Monthly
Weighted Based on Inforce Membership Regression on Adjusted PMPM

CONFIDENTIAL AND PROPRIETARY BLUE CROSS AND BLUE SHIELD OF VERMONT
2021 VERMONT INDIVIDUAL AND SMALL GROUP RATE FILING
PHARMACY TREND DEVELOPMENT - SPECIALTY
Exhibit 3G
Page 4
Month Membership
Adjusted
PMPM
Monthly
PMPM
Rolling 12
PMPM
Monthly
PMPM
Rolling 12
PMPM
Jan-16 46,938 $24.62
Feb-16 47,237 $33.17
Mar-16 47,836 $32.00
Apr-16 47,870 $30.00
May-16 47,939 $31.34
Jun-16 48,160 $32.54
Jul-16 48,431 $29.53
Aug-16 48,636 $37.11
Sep-16 48,828 $33.01
Oct-16 48,975 $31.22
Nov-16 48,994 $37.49
Dec-16 48,865 $39.82
Jan-17 48,690 $36.57
Feb-17 49,010 $37.83 $36.57
Mar-17 48,755 $43.70 $36.98
Apr-17 48,466 $34.36 $39.21
May-17 48,155 $42.36 $37.86
Jun-17 47,819 $40.71 $39.42
Jul-17 47,618 $39.16 $40.07
Aug-17 47,308 $47.38 $40.04
Sep-17 47,008 $44.87 $42.67
Oct-17 46,604 $48.82 $43.85
Nov-17 46,212 $49.37 $45.99
Dec-17 45,599 $46.06 $47.77
Jan-18 43,381 $51.81 $47.98
Feb-18 42,874 $45.16 $49.95 $51.81
Mar-18 42,448 $53.05 $49.22 $51.26
Apr-18 42,121 $57.47 $51.17 $51.14
May-18 41,839 $56.66 $54.03 $51.46
Jun-18 41,602 $54.74 $55.88 $51.95
Jul-18 41,355 $57.83 $56.58 $52.46
Aug-18 41,015 $59.06 $58.03 $53.29
Sep-18 40,680 $55.74 $59.44 $54.38
Oct-18 40,442 $65.90 $59.34 $55.34
Nov-18 40,150 $57.57 $62.48 $57.12
Dec-18 39,856 $47.16 $62.07 $55.39 $58.50
Jan-19 38,937 $57.40 $58.25 $56.27 $58.92
Feb-19 38,664 $56.38 $58.58 $57.01 $59.69
Mar-19 38,420 $58.95 $58.44 $57.80 $60.25
Apr-19 38,193 $67.47 $59.11 $58.49 $60.83
May-19 38,038 $67.83 $62.37 $59.19 $62.02
Jun-19 37,905 $63.05 $64.92 $59.94 $63.42
Jul-19 37,839 $69.48 $65.25 $60.66 $64.54
Aug-19 37,674 $70.63 $67.51 $61.44 $66.09
Sep-19 37,445 $63.71 $69.54 $62.27 $67.80
Oct-19 37,223 $68.62 $68.74 $63.05 $69.00
Nov-19 37,015 $64.78 $69.63 $63.64 $70.33
Dec-19 36,637 $77.15 $68.97 $64.20 $71.21 $64.44
Jan-20 36,637 $72.42 $65.38 $72.82 $65.59
Feb-20 36,637 $73.44 $66.63 $74.18 $66.80
Mar-20 36,637 $74.46 $67.97 $75.54 $68.08
Apr-20 36,637 $75.49 $69.34 $76.90 $69.42
May-20 36,637 $76.51 $70.53 $78.27 $70.78
Jun-20 36,637 $77.53 $71.59 $79.63 $72.14
Jul-20 36,637 $78.56 $72.71 $80.99 $73.53
Aug-20 36,637 $79.58 $73.72 $82.35 $74.89
Sep-20 36,637 $80.60 $74.65 $83.71 $76.23
Oct-20 36,637 $81.63 $75.73 $85.07 $77.58
Nov-20 36,637 $82.65 $76.82 $86.43 $78.93
Dec-20 36,637 $83.67 $78.05 $87.80 $80.31
Jan-21 36,637 $84.70 $79.07 $89.16 $81.67
Feb-21 36,637 $85.72 $80.09 $90.52 $83.03
Mar-21 36,637 $86.74 $81.12 $91.88 $84.39
Apr-21 36,637 $87.77 $82.14 $93.24 $85.75
May-21 36,637 $88.79 $83.16 $94.60 $87.12
Jun-21 36,637 $89.82 $84.19 $95.97 $88.48
Jul-21 36,637 $90.84 $85.21 $97.33 $89.84
Aug-21 36,637 $91.86 $86.23 $98.69 $91.20
Sep-21 36,637 $92.89 $87.26 $100.05 $92.56
Oct-21 36,637 $93.91 $88.28 $101.41 $93.92
Nov-21 36,637 $94.93 $89.30 $102.77 $95.29
Dec-21 36,637 $95.96 $90.33 $104.13 $96.65
Annual Trend 18.6% 22.5%
RMSE 4.95 5.31
Theils U 0.80 0.82
36 Month Time Series -
Specialty PMPM
24 Month Time Series -
Specialty PMPM
Double Exponential
Smoothing
Double Exponential
Smoothing

BLUE CROSS AND BLUE SHIELD OF VERMONT
2021 VERMONT INDIVIDUAL AND SMALL GROUP RATE FILING
PHARMACY TREND DEVELOPMENT - COST
EXHIBIT 3H
Page 1
Month
Days SupplyAverage
Wholesale Price
Cost per Days
SupplyDays Supply
Average
Wholesale Price
Cost per Days
SupplyDays Supply
Average
Wholesale Price
Cost per Days
SupplyMonth 36 Months
Jan-17 1,341,711 $5,135,489 $3.83 7,011 $59,859 $8.54 1,348,722 $5,195,348 $3.85 Jan-17 $3.87
Feb-17 1,235,879 $4,771,402 $3.86 10,311 $83,680 $8.12 1,246,190 4,855,082 $3.90 Feb-17 $3.87
Mar-17 1,388,140 $5,333,376 $3.84 17,555 $132,116 $7.53 1,405,695 5,465,492 $3.89 Mar-17 $3.87
Apr-17 1,250,660 $4,796,026 $3.83 29,257 $179,563 $6.14 1,279,917 4,975,589 $3.89 Apr-17 $3.87
May-17 1,353,544 $5,258,108 $3.88 54,130 $307,052 $5.67 1,407,675 5,565,160 $3.95 May-17 $3.87
Jun-17 1,282,527 $4,934,025 $3.85 67,076 $344,152 $5.13 1,349,603 5,278,177 $3.91 Jun-17 $3.87
Jul-17 1,219,655 $4,748,247 $3.89 83,400 $474,135 $5.69 1,303,055 5,222,383 $4.01 Jul-17 $3.87
Aug-17 1,278,410 $4,992,276 $3.91 102,834 $570,870 $5.55 1,381,243 5,563,146 $4.03 Aug-17 $3.87
Sep-17 1,167,562 $4,557,385 $3.90 106,273 $584,963 $5.50 1,273,835 5,142,348 $4.04 Sep-17 $3.87
Oct-17 1,244,289 $4,842,683 $3.89 127,323 $753,259 $5.92 1,371,612 5,595,942 $4.08 Oct-17 $3.87
Nov-17 1,195,650 $4,641,629 $3.88 137,323 $807,461 $5.88 1,332,973 5,449,090 $4.09 Nov-17 $3.87
Dec-17 1,196,206 $4,741,252 $3.96 149,822 $840,757 $5.61 1,346,028 5,582,009 $4.15 Dec-17 $3.87
Jan-18 1,087,873 $4,229,640 $3.89 154,246 $802,864 $5.21 1,242,119 5,032,504 $4.05 Jan-18 $3.87
Feb-18 970,283 $3,787,371 $3.90 158,901 $783,326 $4.93 1,129,184 4,570,697 $4.05 Feb-18 $3.87
Mar-18 1,035,752 $4,048,124 $3.91 196,726 $968,086 $4.92 1,232,478 5,016,210 $4.07 Mar-18 $3.87
Apr-18 998,199 $3,883,935 $3.89 199,334 $963,639 $4.83 1,197,533 4,847,574 $4.05 Apr-18 $3.87
May-18 1,051,926 $4,057,246 $3.86 218,871 $1,056,058 $4.83 1,270,797 5,113,305 $4.02 May-18 $3.87
Jun-18 972,578 $3,768,792 $3.88 213,026 $1,057,166 $4.96 1,185,604 4,825,958 $4.07 Jun-18 $3.87
Jul-18 985,320 $3,762,408 $3.82 209,901 $1,030,601 $4.91 1,195,221 4,793,009 $4.01 Jul-18 $3.87
Aug-18 1,012,335 $3,878,926 $3.83 242,247 $1,234,141 $5.09 1,254,582 5,113,067 $4.08 Aug-18 $3.87
Sep-18 891,882 $3,476,235 $3.90 224,755 $1,143,895 $5.09 1,116,637 4,620,130 $4.14 Sep-18 $3.87
Oct-18 1,003,409 $3,806,502 $3.79 252,429 $1,263,453 $5.01 1,255,838 5,069,955 $4.04 Oct-18 $3.87
Nov-18 941,514 $3,571,566 $3.79 254,590 $1,220,437 $4.79 1,196,104 4,792,003 $4.01 Nov-18 $3.87
Dec-18 854,625 $3,293,751 $3.85 250,588 $1,264,377 $5.05 1,105,213 4,558,128 $4.12 Dec-18 $3.87
Jan-19 867,825 $3,302,620 $3.81 261,772 $1,259,166 $4.81 1,129,597 4,561,785 $4.04 Jan-19 $3.87
Feb-19 774,211 $2,947,488 $3.81 258,752 $1,209,696 $4.68 1,032,963 4,157,185 $4.02 Feb-19 $3.87
Mar-19 840,819 $3,293,346 $3.92 299,438 $1,429,611 $4.77 1,140,257 4,722,957 $4.14 Mar-19 $3.87
Apr-19 828,863 $3,141,654 $3.79 295,011 $1,433,626 $4.86 1,123,874 4,575,280 $4.07 Apr-19 $3.87
May-19 834,393 $3,210,563 $3.85 310,071 $1,525,930 $4.92 1,144,464 4,736,493 $4.14 May-19 $3.87
Jun-19 779,716 $3,048,890 $3.91 302,669 $1,454,877 $4.81 1,082,385 4,503,767 $4.16 Jun-19 $3.87
Jul-19 808,639 $3,116,245 $3.85 323,990 $1,613,096 $4.98 1,132,629 4,729,341 $4.18 Jul-19 $3.87
Aug-19 785,548 $3,039,305 $3.87 344,592 $1,811,345 $5.26 1,130,140 4,850,650 $4.29 Aug-19 $3.87
Sep-19 739,607 $2,883,693 $3.90 336,216 $1,665,328 $4.95 1,075,823 4,549,020 $4.23 Sep-19 $3.87
Oct-19 814,018 $3,176,472 $3.90 360,296 $1,811,085 $5.03 1,174,314 4,987,557 $4.25 Oct-19 $3.87
Nov-19 733,915 $2,888,092 $3.94 327,890 $1,651,984 $5.04 1,061,805 4,540,077 $4.28 Nov-19 $3.87
Dec-19 810,785 $3,164,395 $3.90 374,886 $1,936,792 $5.17 1,185,671 5,101,187 $4.30 Dec-19 $3.87
CY2018 / CY 2017 Annual Increase -0.4% -1.2% 1.9%
CY2019 / CY 2018 Annual Increase 0.24% -0.2% 2.9% 0.02%
1.000 3.772 1.000 2.834
0.000 0.255 0.000 0.495
0.000 0.011 0.018 0.012
0.010 34.000 0.393 22.000
24 Months
$3.84
GENERIC COST TREND
"Old" Generics New Generics All Generics
Regression on Cost per Days Supply on
"Old" Generics
$3.85
$3.85
$3.85
$3.85
$3.85
$3.85
$3.85
$3.85
$3.85
$3.85
$3.85
$3.85
$3.86
$3.86
$3.86
$3.86
$3.86
$3.86
$3.86
$3.86
$3.86
$3.86
$3.86
$3.86
$3.87
$3.87
$3.87
$3.87
$3.87
$3.87
$3.87
$3.87
$3.87
Regression on Cost per Days Supply
on "Old" Generics-36 Months
Regression on Cost
per Days Supply on
"Old" Generics-
$3.87
$3.87
0.26%
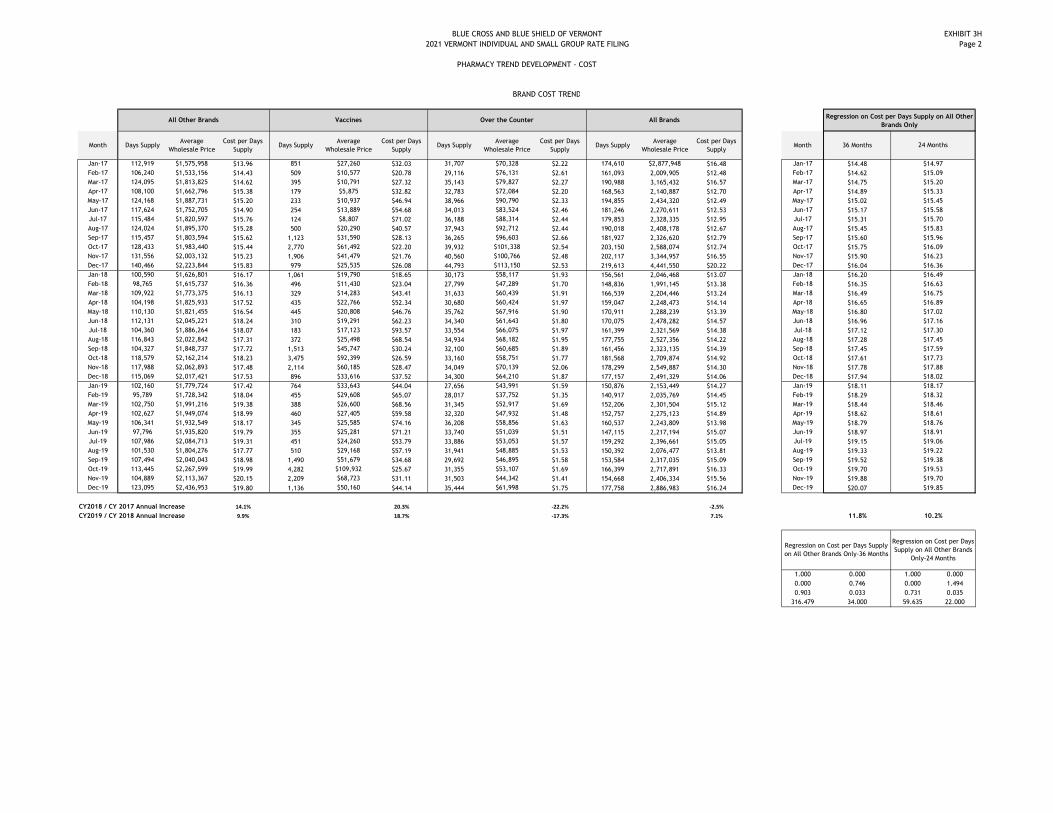
BLUE CROSS AND BLUE SHIELD OF VERMONT
2021 VERMONT INDIVIDUAL AND SMALL GROUP RATE FILING
PHARMACY TREND DEVELOPMENT - COST
EXHIBIT 3H
Page 2
Month Days SupplyAverage
Wholesale Price
Cost per Days
SupplyDays Supply
Average
Wholesale Price
Cost per Days
SupplyDays Supply
Average
Wholesale Price
Cost per Days
SupplyDays Supply
Average
Wholesale Price
Cost per Days
SupplyMonth 36 Months
Jan-17 112,919 $1,575,958 $13.96 851 $27,260 $32.03 31,707 $70,328 $2.22 174,610 $2,877,948 $16.48 Jan-17 $14.48
Feb-17 106,240 $1,533,156 $14.43 509 $10,577 $20.78 29,116 $76,131 $2.61 161,093 2,009,905 $12.48 Feb-17 $14.62
Mar-17 124,095 $1,813,825 $14.62 395 $10,791 $27.32 35,143 $79,827 $2.27 190,988 3,165,432 $16.57 Mar-17 $14.75
Apr-17 108,100 $1,662,796 $15.38 179 $5,875 $32.82 32,783 $72,084 $2.20 168,563 2,140,887 $12.70 Apr-17 $14.89
May-17 124,168 $1,887,731 $15.20 233 $10,937 $46.94 38,966 $90,790 $2.33 194,855 2,434,320 $12.49 May-17 $15.02
Jun-17 117,624 $1,752,705 $14.90 254 $13,889 $54.68 34,013 $83,524 $2.46 181,246 2,270,611 $12.53 Jun-17 $15.17
Jul-17 115,484 $1,820,597 $15.76 124 $8,807 $71.02 36,188 $88,314 $2.44 179,853 2,328,335 $12.95 Jul-17 $15.31
Aug-17 124,024 $1,895,370 $15.28 500 $20,290 $40.57 37,943 $92,712 $2.44 190,018 2,408,178 $12.67 Aug-17 $15.45
Sep-17 115,457 $1,803,594 $15.62 1,123 $31,590 $28.13 36,265 $96,603 $2.66 181,927 2,326,620 $12.79 Sep-17 $15.60
Oct-17 128,433 $1,983,440 $15.44 2,770 $61,492 $22.20 39,932 $101,338 $2.54 203,150 2,588,074 $12.74 Oct-17 $15.75
Nov-17 131,556 $2,003,132 $15.23 1,906 $41,479 $21.76 40,560 $100,766 $2.48 202,117 3,344,957 $16.55 Nov-17 $15.90
Dec-17 140,466 $2,223,844 $15.83 979 $25,535 $26.08 44,793 $113,150 $2.53 219,613 4,441,550 $20.22 Dec-17 $16.04
Jan-18 100,590 $1,626,801 $16.17 1,061 $19,790 $18.65 30,173 $58,117 $1.93 156,561 2,046,468 $13.07 Jan-18 $16.20
Feb-18 98,765 $1,615,737 $16.36 496 $11,430 $23.04 27,799 $47,289 $1.70 148,836 1,991,145 $13.38 Feb-18 $16.35
Mar-18 109,922 $1,773,375 $16.13 329 $14,283 $43.41 31,633 $60,439 $1.91 166,539 2,204,446 $13.24 Mar-18 $16.49
Apr-18 104,198 $1,825,933 $17.52 435 $22,766 $52.34 30,680 $60,424 $1.97 159,047 2,248,473 $14.14 Apr-18 $16.65
May-18 110,130 $1,821,455 $16.54 445 $20,808 $46.76 35,762 $67,916 $1.90 170,911 2,288,239 $13.39 May-18 $16.80
Jun-18 112,131 $2,045,221 $18.24 310 $19,291 $62.23 34,340 $61,643 $1.80 170,075 2,478,282 $14.57 Jun-18 $16.96
Jul-18 104,360 $1,886,264 $18.07 183 $17,123 $93.57 33,554 $66,075 $1.97 161,399 2,321,569 $14.38 Jul-18 $17.12
Aug-18 116,843 $2,022,842 $17.31 372 $25,498 $68.54 34,934 $68,182 $1.95 177,755 2,527,356 $14.22 Aug-18 $17.28
Sep-18 104,327 $1,848,737 $17.72 1,513 $45,747 $30.24 32,100 $60,685 $1.89 161,456 2,323,135 $14.39 Sep-18 $17.45
Oct-18 118,579 $2,162,214 $18.23 3,475 $92,399 $26.59 33,160 $58,751 $1.77 181,568 2,709,874 $14.92 Oct-18 $17.61
Nov-18 117,988 $2,062,893 $17.48 2,114 $60,185 $28.47 34,049 $70,139 $2.06 178,299 2,549,887 $14.30 Nov-18 $17.78
Dec-18 115,069 $2,017,421 $17.53 896 $33,616 $37.52 34,300 $64,210 $1.87 177,157 2,491,329 $14.06 Dec-18 $17.94
Jan-19 102,160 $1,779,724 $17.42 764 $33,643 $44.04 27,656 $43,991 $1.59 150,876 2,153,449 $14.27 Jan-19 $18.11
Feb-19 95,789 $1,728,342 $18.04 455 $29,608 $65.07 28,017 $37,752 $1.35 140,917 2,035,769 $14.45 Feb-19 $18.29
Mar-19 102,750 $1,991,216 $19.38 388 $26,600 $68.56 31,345 $52,917 $1.69 152,206 2,301,504 $15.12 Mar-19 $18.44
Apr-19 102,627 $1,949,074 $18.99 460 $27,405 $59.58 32,320 $47,932 $1.48 152,757 2,275,123 $14.89 Apr-19 $18.62
May-19 106,341 $1,932,549 $18.17 345 $25,585 $74.16 36,208 $58,856 $1.63 160,537 2,243,809 $13.98 May-19 $18.79
Jun-19 97,796 $1,935,820 $19.79 355 $25,281 $71.21 33,740 $51,039 $1.51 147,115 2,217,194 $15.07 Jun-19 $18.97
Jul-19 107,986 $2,084,713 $19.31 451 $24,260 $53.79 33,886 $53,053 $1.57 159,292 2,396,661 $15.05 Jul-19 $19.15
Aug-19 101,530 $1,804,276 $17.77 510 $29,168 $57.19 31,941 $48,885 $1.53 150,392 2,076,477 $13.81 Aug-19 $19.33
Sep-19 107,494 $2,040,043 $18.98 1,490 $51,679 $34.68 29,692 $46,895 $1.58 153,584 2,317,035 $15.09 Sep-19 $19.52
Oct-19 113,445 $2,267,599 $19.99 4,282 $109,932 $25.67 31,355 $53,107 $1.69 166,399 2,717,891 $16.33 Oct-19 $19.70
Nov-19 104,889 $2,113,367 $20.15 2,209 $68,723 $31.11 31,503 $44,342 $1.41 154,668 2,406,334 $15.56 Nov-19 $19.88
Dec-19 123,095 $2,436,953 $19.80 1,136 $50,160 $44.14 35,444 $61,998 $1.75 177,758 2,886,983 $16.24 Dec-19 $20.07
CY2018 / CY 2017 Annual Increase 14.1% 20.3% -22.2% -2.5%
CY2019 / CY 2018 Annual Increase 9.9% 18.7% -17.3% 7.1% 11.8%
1.000 0.000 1.000 0.000
0.000 0.746 0.000 1.494
0.903 0.033 0.731 0.035
316.479 34.000 59.635 22.000
24 Months
BRAND COST TREND
All Other Brands Vaccines Over the Counter All BrandsRegression on Cost per Days Supply on All Other
Brands Only
$14.97
$15.20
$15.33
$15.09
$15.45
$15.58
$15.70
$15.83
$15.96
$16.09
$16.23
$16.36
$16.49
$16.63
$16.75
$16.89
$17.02
$17.16
$17.30
$17.45
$17.59
$17.73
$17.88
$18.02
$18.17
$18.32
$18.46
$18.61
$18.76
$18.91
$19.06
$19.22
$19.38
$19.53
Regression on Cost per Days Supply
on All Other Brands Only-36 Months
Regression on Cost per Days
Supply on All Other Brands
Only-24 Months
$19.70
$19.85
10.2%
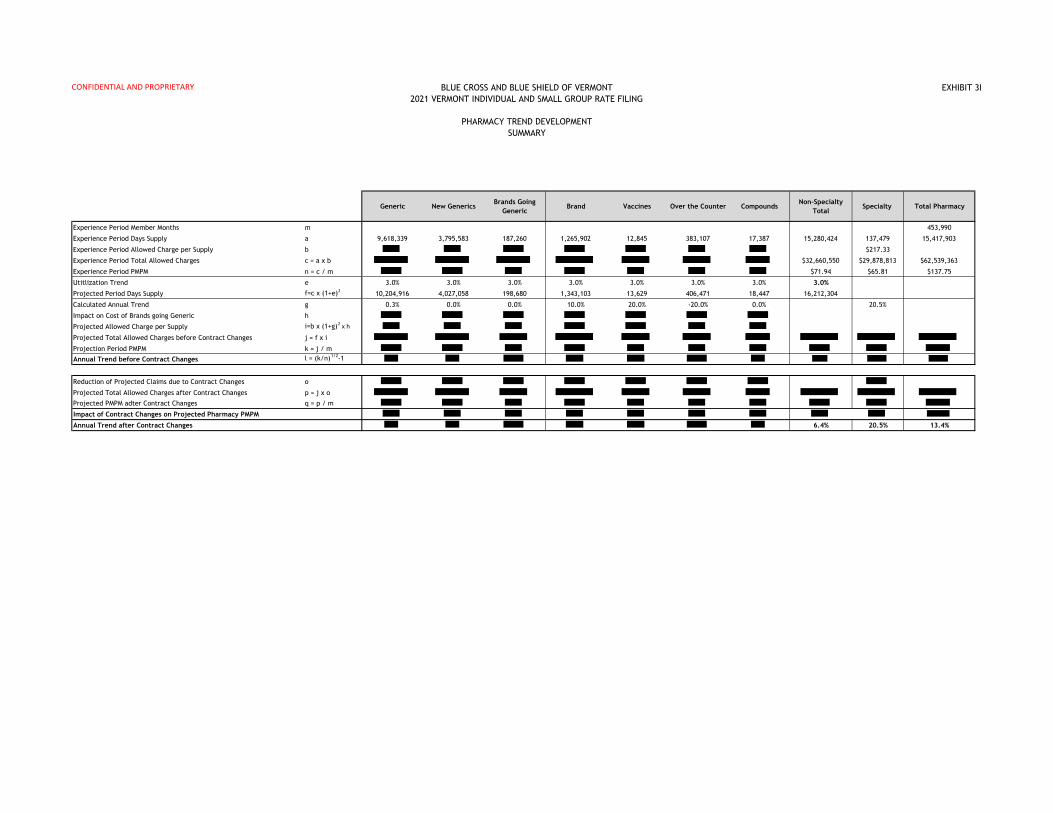
CONFIDENTIAL AND PROPRIETARY BLUE CROSS AND BLUE SHIELD OF VERMONT
2021 VERMONT INDIVIDUAL AND SMALL GROUP RATE FILING
PHARMACY TREND DEVELOPMENT
SUMMARY
EXHIBIT 3I
Generic New GenericsBrands Going
GenericBrand Vaccines Over the Counter Compounds
Non-Specialty
TotalSpecialty Total Pharmacy
Experience Period Member Months m 453,990
Experience Period Days Supply a 9,618,339 3,795,583 187,260 1,265,902 12,845 383,107 17,387 15,280,424 137,479 15,417,903
Experience Period Allowed Charge per Supply b $217.33
Experience Period Total Allowed Charges c = a x b $32,660,550 $29,878,813 $62,539,363
Experience Period PMPM n = c / m $71.94 $65.81 $137.75
Utitlization Trend e 3.0% 3.0% 3.0% 3.0% 3.0% 3.0% 3.0% 3.0%
Projected Period Days Supply f=c x (1+e)210,204,916 4,027,058 198,680 1,343,103 13,629 406,471 18,447 16,212,304
Calculated Annual Trend g 0.3% 0.0% 0.0% 10.0% 20.0% -20.0% 0.0% 20.5%
Impact on Cost of Brands going Generic h
Projected Allowed Charge per Supply i=b x (1+g)2 x h
Projected Total Allowed Charges before Contract Changes j = f x i
Projection Period PMPM k = j / m
Annual Trend before Contract Changes l = (k/n)1/2-1
Reduction of Projected Claims due to Contract Changes o
Projected Total Allowed Charges after Contract Changes p = j x o
Projected PMPM adter Contract Changes q = p / m
Impact of Contract Changes on Projected Pharmacy PMPM
Annual Trend after Contract Changes 6.4% 20.5% 13.4%

BLUE CROSS AND BLUE SHIELD OF VERMONT
2021 VERMONT INDIVIDUAL AND SMALL GROUP RATE FILING
TREND DEVELOPMENT
PROJECTION FACTOR FOR INDEX RATE CALCULATION
EXHIBIT 3J
TREND FACTORS - FROM 2019 to 2020 TREND FACTORS - FROM 2020 to 2021
Claim Type Cost Utilization Total Claim Type Cost Utilization Total
Medical 3.3% 3.1% 6.5% Medical 3.8% 4.0% 8.0%
Pharmacy 10.1% 3.0% 13.4% Pharmacy 10.1% 3.0% 13.4%
Dental 0.0% 0.7% 0.7% Dental 0.0% 0.7% 0.7%
Vision 0.0% 0.0% 0.0% Vision 0.0% 0.0% 0.0%
Claim TypeExperience Allowed
PMPMCost Trend Adding Cost Trend Utilization Trend
CY 2020 Allowed
PMPM
Medical Claims $542.29 1.0331 $560.22 1.0309 $577.55
Pharmacy Claims $134.56 1.1005 $148.08 1.0300 $152.53
Dental Claims $1.99 1.0000 $1.99 1.0071 $2.00
Vision claims $0.10 1.0000 $0.10 1.0000 $0.10
Total $678.93 1.0463 $710.39 1.0307 $732.18
Cost Trend FactorUtilization Trend
Factor
Claim TypeCY 2020 Allowed
PMPMCost Trend Adding Cost Trend Utilization Trend
CY 2021 Allowed
PMPM1+d1 1+d2
Medical Claims $577.55 1.0383 $599.68 1.0403 $623.85 1.0727 1.0725
Pharmacy Claims $152.53 1.1005 $167.86 1.0300 $172.91 1.2111 1.0610
Dental Claims $2.00 1.0000 $2.00 1.0071 $2.02 1.0000 1.0142
Vision claims $0.10 1.0000 $0.10 1.0000 $0.10 1.0000 1.0000
Total $732.18 1.0512 $769.65 1.0380 $798.87 1.0999 1.0698
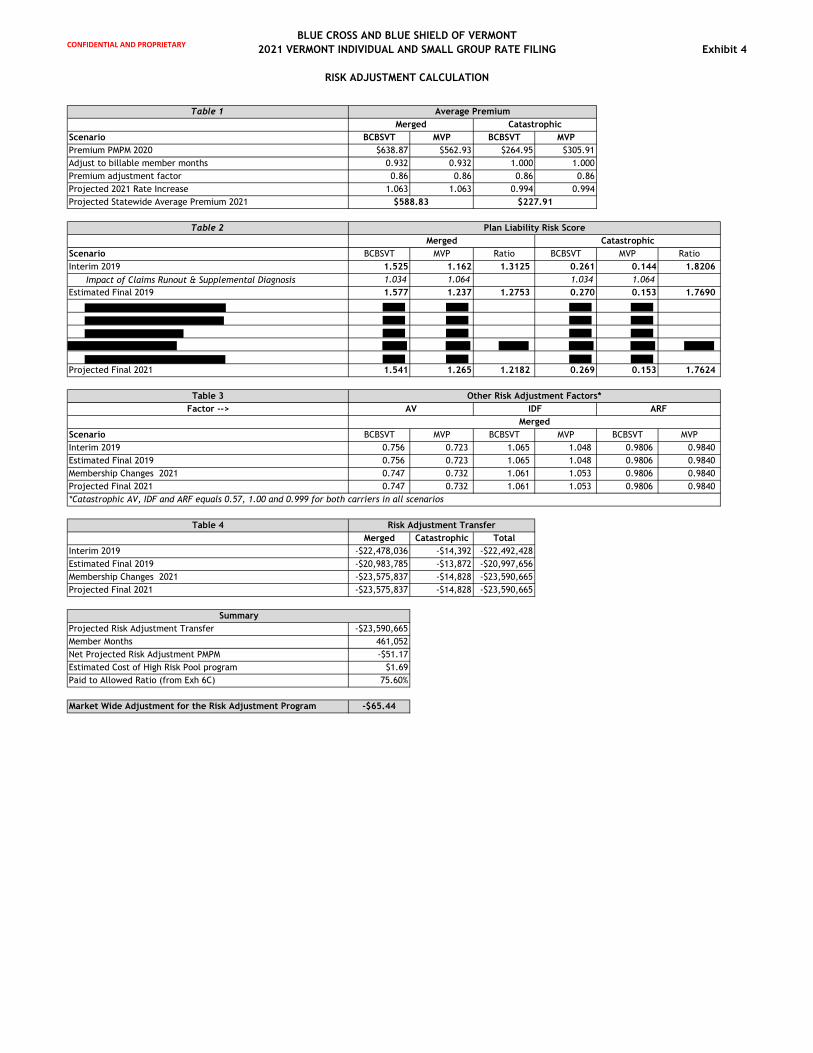
CONFIDENTIAL AND PROPRIETARY
BLUE CROSS AND BLUE SHIELD OF VERMONT
2021 VERMONT INDIVIDUAL AND SMALL GROUP RATE FILING
RISK ADJUSTMENT CALCULATION
Exhibit 4
Table 1
Scenario BCBSVT MVP BCBSVT MVP
Premium PMPM 2020 $638.87 $562.93 $264.95 $305.91
Adjust to billable member months 0.932 0.932 1.000 1.000
Premium adjustment factor 0.86 0.86 0.86 0.86
Projected 2021 Rate Increase 1.063 1.063 0.994 0.994
Projected Statewide Average Premium 2021
Table 2
Scenario BCBSVT MVP Ratio BCBSVT MVP Ratio
Interim 2019 1.525 1.162 1.3125 0.261 0.144 1.8206
Impact of Claims Runout & Supplemental Diagnosis 1.034 1.064 1.034 1.064
Estimated Final 2019 1.577 1.237 1.2753 0.270 0.153 1.7690
Projected Final 2021 1.541 1.265 1.2182 0.269 0.153 1.7624
Table 3
Factor -->
Scenario BCBSVT MVP BCBSVT MVP BCBSVT MVP
Interim 2019 0.756 0.723 1.065 1.048 0.9806 0.9840
Estimated Final 2019 0.756 0.723 1.065 1.048 0.9806 0.9840
Membership Changes 2021 0.747 0.732 1.061 1.053 0.9806 0.9840
Projected Final 2021 0.747 0.732 1.061 1.053 0.9806 0.9840
*Catastrophic AV, IDF and ARF equals 0.57, 1.00 and 0.999 for both carriers in all scenarios
Table 4
Merged Catastrophic Total
Interim 2019 -$22,478,036 -$14,392 -$22,492,428
Estimated Final 2019 -$20,983,785 -$13,872 -$20,997,656
Membership Changes 2021 -$23,575,837 -$14,828 -$23,590,665
Projected Final 2021 -$23,575,837 -$14,828 -$23,590,665
Projected Risk Adjustment Transfer -$23,590,665
Member Months 461,052
Net Projected Risk Adjustment PMPM -$51.17
Estimated Cost of High Risk Pool program $1.69
Paid to Allowed Ratio (from Exh 6C) 75.60%
Market Wide Adjustment for the Risk Adjustment Program -$65.44
Plan Liability Risk Score
Average Premium
Merged Catastrophic
$588.83 $227.91
Merged
Risk Adjustment Transfer
Summary
Merged Catastrophic
Other Risk Adjustment Factors*
AV IDF ARF

BLUE CROSS AND BLUE SHIELD OF VERMONT
2021 VERMONT INDIVIDUAL AND SMALL GROUP RATE FILING
INDEX RATE CALCULATION
Exhibit 5
Medical Pharmacy Dental Vision Total
Total Experience Period Allowed Claims PMPM a1 $539.32 $133.60 $1.97 $0.10 $674.98
Experience Period Allowed Claims PMPM for Non-EHB a2 $0.08 $0.00 $0.00 $0.00 $0.08
Index Rate : Experience Period Allowed Claims for EHB A $539.24 $133.60 $1.97 $0.10 $674.90
Capping experience claims a3 0.9966 0.9966 0.9966 0.9966 0.9966
Capped Experience Period Allowed Claims for EHB B = A x a3 $537.42 $133.15 $1.97 $0.10 $672.63
Impact of the ACO Experience Settlement 1+b4 1.0000 1.0000 1.0000 1.0000 1.0000
Impact of Association Health Plans 1+b5 0.9978 0.9993 1.0009 1.0060 0.9981
Impact of Projected ACO Savings 1+b6 1.0000 1.0000 1.0000 1.0000 1.0000
Changes in pool morbidity 1+b9 1.0048 1.0048 1.0048 1.0048 1.0048
Impact of different benefit plans (in experience vs projection) 1+c1 0.9963 0.9963 0.9963 0.9963 0.9963
Changes in provider networks 1+c2 1.0000 1.0000 1.0000 1.0000 1.0000
Changes in demographics (age, gender, region, etc.) 1+c3 1.0069 1.0069 1.0069 1.0069 1.0069
Adjusted Experience Period Allowed Claims for EHB C $540.46 $134.10 $1.98 $0.10 $676.65
Cost Trend 1+d1 1.0727 1.2111 1.0000 1.0000 1.0999
Utilization Trend 1+d2 1.0725 1.0610 1.0142 1.0000 1.0698
Projected Period Allowed Claims for Experience EHB D $621.75 $172.32 $2.01 $0.10 $796.18
Projected Pharmacy Rebates e1 -$29.91
Projected Blue Print Payments e2 $3.85
Projected ITS Fees e3 $2.64
Projected Vaccine Payments e4 $2.11
Contractual Fees e5, e7 and e8 $2.06
OneCare Care Coordination Fee e6 $1.63
Projected Index Rate : Projected Period Expected Allowed Claims for EHB F = D + ∑ei $778.56
Risk Adjustment Payments and Fees g1 -$65.44
Transitional Reinsurance Payments and Recoveries g2 $0.00
Vermont Exchange Fees g3 $0.00
Market Adjusted Index Rate H = F + g1 + g2 + g3 $713.12
Mark
et
Wid
e
Adju
stm
ents
Exp
eri
ence
Morb
idit
yO
ther
Tre
nd
Non-S
yste
m C
laim
s

BLUE CROSS AND BLUE SHIELD OF VERMONT
2021 VERMONT INDIVIDUAL AND SMALL GROUP RATE FILING
PLAN LEVEL ADJUSTMENT SUMMARY
Exhibit 6A
Market
Adjusted Index
Rate
Benefit
Richness
Adjustment
Paid to Allowed
Ratio
Plan Benefits in
addition to EHB
For
Catastrophic
Only - Impact of
Eligibility
Expected
Claims Cost
Administrative
Charges Plan
Level
Adjustment
Taxes and Fees
Plan Level
Adjustment
Contribution to
Reserve Plan
Level
Adjustment
Plan Level
Adjusted Index
Rate
Projected
Membership
GOLD Vermont Preferred $713.12 0.9970 83.60% 1.0002 1.0000 $594.49 1.0899 1.0148 1.0183 $669.57 1,208
GOLD Vermont Select CDHP $713.12 1.0134 86.99% 1.0001 1.0000 $628.73 1.0856 1.0146 1.0183 $705.21 5,022
SILVER Vermont Preferred $713.12 0.9600 86.12% 1.0002 1.0000 $589.65 1.0903 1.0148 1.0183 $664.39 1,299
SILVER Vermont Select CDHP $713.12 0.9660 86.17% 1.0002 1.0000 $593.70 1.0897 1.0148 1.0183 $668.58 212
BRONZE Vermont Preferred $713.12 0.9377 66.50% 1.0002 1.0000 $444.79 1.1182 1.0163 1.0183 $514.71 520
BRONZE Vermont Select CDHP $713.12 0.9362 65.84% 1.0002 1.0000 $439.68 1.1200 1.0163 1.0183 $509.67 2,098
PLATINUM Deductible $713.12 1.0908 100.13% 1.0001 1.0000 $778.96 1.0697 1.0137 1.0183 $860.14 6,963
GOLD Deductible $713.12 1.0248 89.19% 1.0001 1.0000 $651.90 1.0822 1.0144 1.0183 $728.77 4,797
SILVER Deductible $713.12 0.9692 87.49% 1.0002 1.0000 $604.75 1.0882 1.0147 1.0183 $679.99 3,546
SILVER CDHP $713.12 0.9790 88.24% 1.0001 1.0000 $616.18 1.0866 1.0146 1.0183 $691.81 824
BRONZE Deductible $713.12 0.9371 66.25% 1.0002 1.0000 $442.83 1.1188 1.0163 1.0183 $512.77 1,823
BRONZE CDHP $713.12 0.9407 67.74% 1.0002 1.0000 $454.55 1.1158 1.0162 1.0183 $524.83 1,392
BRONZE Integrated $713.12 0.9392 67.12% 1.0002 1.0000 $449.62 1.1169 1.0162 1.0183 $519.68 563
Catastrophic Deductible $713.12 0.9392 67.13% 1.0005 0.4469 $201.05 1.2554 1.0224 1.0183 $262.79 360
SILVER Vermont Preferred $713.12 0.9593 74.11% 1.0002 1.0000 $507.06 1.1043 1.0156 1.0183 $579.09 637
SILVER Vermont Select CDHP $713.12 0.9651 75.79% 1.0002 1.0000 $521.70 1.1020 1.0154 1.0183 $594.49 661
SILVER Deductible $713.12 0.9688 76.79% 1.0002 1.0000 $530.57 1.1000 1.0153 1.0183 $603.42 4,586
SILVER CDHP $713.12 0.9788 79.38% 1.0002 1.0000 $554.17 1.0960 1.0151 1.0183 $627.83 1,910
Total $713.12 $599.92 $675.13 38,421
NO
N-S
TA
ND
AR
D
PLA
NS
ST
AN
DA
RD
PLA
NS
REFLEC
TIV
E P
LA
NS

BLUE CROSS AND BLUE SHIELD OF VERMONT
2021 VERMONT INDIVIDUAL AND SMALL GROUP RATE FILING
PLAN LEVEL ADJUSTMENT
BENEFIT RICHNESS ADJUSTMENT FACTOR
Exhibit 6B
Base Paid to
Allowed Ratio
before Silver
Load
Benefit
Richness
Adjustment for
EHB
Normalized
Benefit
Richness
Adjustment for
EHB
For
Catastrophic
Only - Impact
of Eligibility
Projected
Period Paid
Claims for
Experience EHB
Benefit
Richness
Adjustment for
EHB
Non-System
Claims
Market Wide
Adjustments
Total Paid
Claims with
Benefit
Richness
Adjustment
Overall Benefit
Richness
Adjustment
Projected
Membership
GOLD Vermont Preferred 76.64% 1.0609 0.9973 1.000 $663.27 0.9973 -$17.62 -$49.48 $594.40 0.9970 1,208
GOLD Vermont Select CDHP 79.43% 1.0766 1.0121 1.000 $687.45 1.0121 -$17.62 -$49.48 $628.64 1.0134 5,022
SILVER Vermont Preferred 68.81% 1.0254 0.9639 1.000 $681.24 0.9639 -$17.62 -$49.48 $589.56 0.9600 1,299
SILVER Vermont Select CDHP 70.29% 1.0312 0.9693 1.000 $681.60 0.9693 -$17.62 -$49.48 $593.61 0.9660 212
BRONZE Vermont Preferred 62.55% 1.0057 0.9454 1.000 $541.34 0.9454 -$17.62 -$49.48 $444.70 0.9377 520
BRONZE Vermont Select CDHP 62.00% 1.0044 0.9442 1.000 $536.64 0.9442 -$17.62 -$49.48 $439.59 0.9362 2,098
PLATINUM Deductible 90.26% 1.1521 1.0830 1.000 $781.15 1.0830 -$17.62 -$49.48 $778.87 1.0908 6,963
GOLD Deductible 81.24% 1.0876 1.0224 1.000 $703.16 1.0224 -$17.62 -$49.48 $651.81 1.0248 4,797
SILVER Deductible 71.02% 1.0342 0.9722 1.000 $690.98 0.9722 -$17.62 -$49.48 $604.66 0.9692 3,546
SILVER CDHP 73.16% 1.0436 0.9811 1.000 $696.37 0.9811 -$17.62 -$49.48 $616.09 0.9790 824
BRONZE Deductible 62.34% 1.0052 0.9449 1.000 $539.54 0.9449 -$17.62 -$49.48 $442.74 0.9371 1,823
BRONZE CDHP 63.57% 1.0084 0.9479 1.000 $550.19 0.9479 -$17.62 -$49.48 $454.45 0.9407 1,392
BRONZE Integrated 63.06% 1.0070 0.9467 1.000 $545.73 0.9467 -$17.62 -$49.48 $449.53 0.9392 563
Catastrophic Deductible 63.07% 1.0071 0.9467 0.447 $545.84 0.9467 -$17.62 -$49.48 $449.65 0.9392 360
SILVER Vermont Preferred 68.81% 1.0254 0.9639 1.000 $595.56 0.9639 -$17.62 -$49.48 $506.97 0.9593 637
SILVER Vermont Select CDHP 70.20% 1.0308 0.9690 1.000 $607.55 0.9690 -$17.62 -$49.48 $521.61 0.9651 661
SILVER Deductible 71.02% 1.0342 0.9722 1.000 $614.68 0.9722 -$17.62 -$49.48 $530.48 0.9688 4,586
SILVER CDHP 73.16% 1.0436 0.9810 1.000 $633.17 0.9810 -$17.62 -$49.48 $554.08 0.9788 1,910
Total 1.0638 1.0000 0.9994 38,421
NO
N-S
TA
ND
AR
D
PLA
NS
ST
AN
DA
RD
PLA
NS
REFLEC
TIV
E P
LA
NS
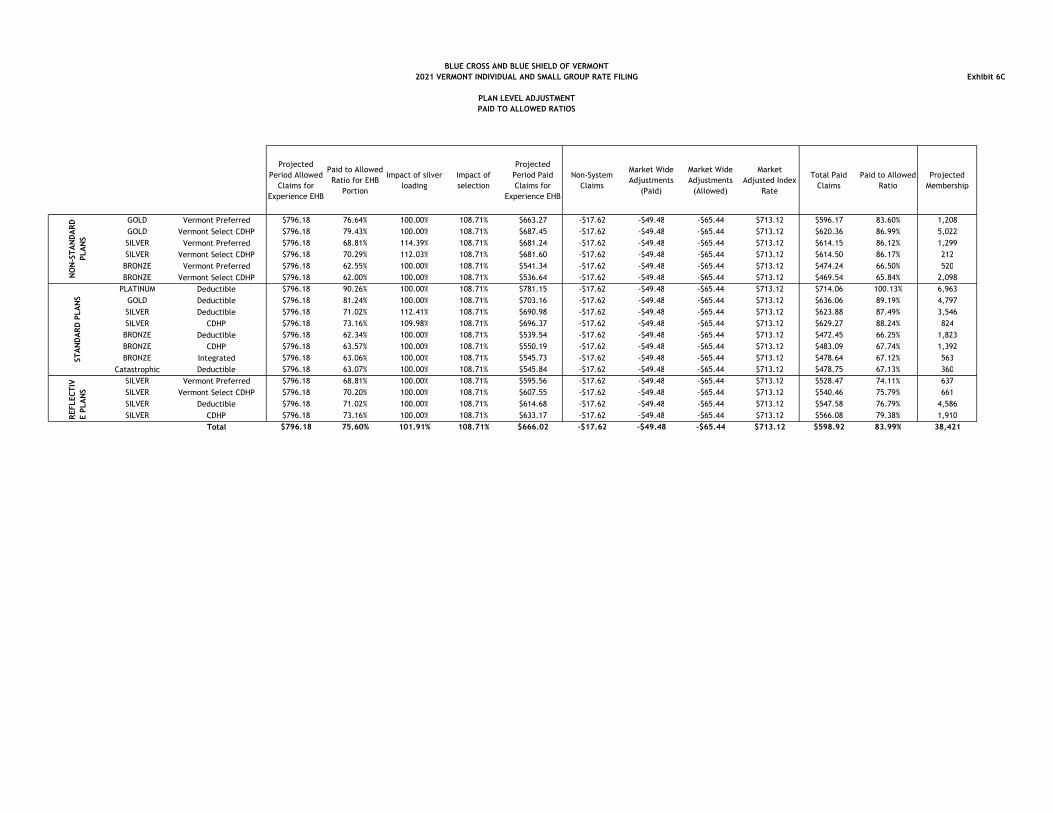
BLUE CROSS AND BLUE SHIELD OF VERMONT
2021 VERMONT INDIVIDUAL AND SMALL GROUP RATE FILING
PLAN LEVEL ADJUSTMENT
PAID TO ALLOWED RATIOS
Exhibit 6C
Projected
Period Allowed
Claims for
Experience EHB
Paid to Allowed
Ratio for EHB
Portion
Impact of silver
loading
Impact of
selection
Projected
Period Paid
Claims for
Experience EHB
Non-System
Claims
Market Wide
Adjustments
(Paid)
Market Wide
Adjustments
(Allowed)
Market
Adjusted Index
Rate
Total Paid
Claims
Paid to Allowed
Ratio
Projected
Membership
GOLD Vermont Preferred $796.18 76.64% 100.00% 108.71% $663.27 -$17.62 -$49.48 -$65.44 $713.12 $596.17 83.60% 1,208
GOLD Vermont Select CDHP $796.18 79.43% 100.00% 108.71% $687.45 -$17.62 -$49.48 -$65.44 $713.12 $620.36 86.99% 5,022
SILVER Vermont Preferred $796.18 68.81% 114.39% 108.71% $681.24 -$17.62 -$49.48 -$65.44 $713.12 $614.15 86.12% 1,299
SILVER Vermont Select CDHP $796.18 70.29% 112.03% 108.71% $681.60 -$17.62 -$49.48 -$65.44 $713.12 $614.50 86.17% 212
BRONZE Vermont Preferred $796.18 62.55% 100.00% 108.71% $541.34 -$17.62 -$49.48 -$65.44 $713.12 $474.24 66.50% 520
BRONZE Vermont Select CDHP $796.18 62.00% 100.00% 108.71% $536.64 -$17.62 -$49.48 -$65.44 $713.12 $469.54 65.84% 2,098
PLATINUM Deductible $796.18 90.26% 100.00% 108.71% $781.15 -$17.62 -$49.48 -$65.44 $713.12 $714.06 100.13% 6,963
GOLD Deductible $796.18 81.24% 100.00% 108.71% $703.16 -$17.62 -$49.48 -$65.44 $713.12 $636.06 89.19% 4,797
SILVER Deductible $796.18 71.02% 112.41% 108.71% $690.98 -$17.62 -$49.48 -$65.44 $713.12 $623.88 87.49% 3,546
SILVER CDHP $796.18 73.16% 109.98% 108.71% $696.37 -$17.62 -$49.48 -$65.44 $713.12 $629.27 88.24% 824
BRONZE Deductible $796.18 62.34% 100.00% 108.71% $539.54 -$17.62 -$49.48 -$65.44 $713.12 $472.45 66.25% 1,823
BRONZE CDHP $796.18 63.57% 100.00% 108.71% $550.19 -$17.62 -$49.48 -$65.44 $713.12 $483.09 67.74% 1,392
BRONZE Integrated $796.18 63.06% 100.00% 108.71% $545.73 -$17.62 -$49.48 -$65.44 $713.12 $478.64 67.12% 563
Catastrophic Deductible $796.18 63.07% 100.00% 108.71% $545.84 -$17.62 -$49.48 -$65.44 $713.12 $478.75 67.13% 360
SILVER Vermont Preferred $796.18 68.81% 100.00% 108.71% $595.56 -$17.62 -$49.48 -$65.44 $713.12 $528.47 74.11% 637
SILVER Vermont Select CDHP $796.18 70.20% 100.00% 108.71% $607.55 -$17.62 -$49.48 -$65.44 $713.12 $540.46 75.79% 661
SILVER Deductible $796.18 71.02% 100.00% 108.71% $614.68 -$17.62 -$49.48 -$65.44 $713.12 $547.58 76.79% 4,586
SILVER CDHP $796.18 73.16% 100.00% 108.71% $633.17 -$17.62 -$49.48 -$65.44 $713.12 $566.08 79.38% 1,910
Total $796.18 75.60% 101.91% 108.71% $666.02 -$17.62 -$49.48 -$65.44 $713.12 $598.92 83.99% 38,421
NO
N-S
TA
ND
AR
D
PLA
NS
ST
AN
DA
RD
PLA
NS
REFLEC
TIV
E P
LA
NS

CONFIDENTIAL AND PROPRIETARY BLUE CROSS AND BLUE SHIELD OF VERMONT
2021 VERMONT INDIVIDUAL AND SMALL GROUP RATE FILING
PLAN LEVEL ADJUSTMENTS
Exhibit 6D
Percent of Eligible
Population
Projected Allowed
Charges for
Experience EHB
Paid to
Allowed Ratio
for EHB Claims
Projected Paid
Claims for EHB
Claims
Average Population 100.0% $796.18 63.1% $502.13
Individual Ages 30 or Less
Individual Ages over 30
Weighted Average $445.15 58.5% $260.48
Allowed Charges Adjustment 0.5591
Paid to Allowed Ratio Adjustment 0.9278
Plan Level Adjustment Calculation
Projected Period Allowed Claims for Experience EHB $796.18
Paid to Allowed Ratio for EHB Portion 68.6%
Benefit Richness Adjustment for EHB 0.9467
Adjustment for Allowed Charges and Paid to Allowed Ratio 0.5187
Projected Period Paid Claims for Experience EHB $268.06
Non-System Claims -$17.62
Market Wide Adjustments -$49.48
Plans Benefits in addition to EHB $0.09
Expected Claims Cost $201.05
Market Adjusted Index Rate $713.12
Paid to Allowed Ratio 67.1%
Benefit Richness Adjustment 0.9392
Plan Benefits in addition to EHB 1.0005
For Catastrophic Only - Impact of Eligibility 0.4469
Expected Claims Cost $201.05
Total Adjustment for Catastrophic Plan 0.4469
IMPACT OF SPECIFIC ELIGIBILITY CAREGORIES FOR THE CATASTROPHIC PLAN

BLUE CROSS AND BLUE SHIELD OF VERMONT
2021 VERMONT INDIVIDUAL AND SMALL GROUP RATE FILING
IMPACT OF SELECTION
Exhibit 6E
Projected FFS
Allowed
Charges -
Without
Selection
Benefit
Richness
Adjustment
Actuarial Value
from Standard
Population
For
Catastrophic
Plan only -
Impact of the
specific
eligibility
Projected Paid
Claims
Projected FFS
Allowed
Charges -
Without
Selection
Benefit
Richness
Adjustment
Actuarial Value
from BCBSVT
Population
Projected Paid
Claims
Projected
Membership
GOLD Vermont Preferred $796.18 0.9973 76.64% 1.0000 $608.52 $796.18 1.0295 83.54% $684.71 1,208
GOLD Vermont Select CDHP $796.18 1.0121 79.43% 1.0000 $640.02 $796.18 1.2977 86.46% $893.32 5,022
SILVER Vermont Preferred $796.18 0.9639 68.81% 1.0000 $528.09 $796.18 1.0623 76.44% $646.52 1,299
SILVER Vermont Select CDHP $796.18 0.9693 70.29% 1.0000 $542.51 $796.18 1.0623 75.67% $640.02 212
BRONZE Vermont Preferred $796.18 0.9454 62.55% 1.0000 $470.81 $796.18 0.5902 69.00% $324.23 520
BRONZE Vermont Select CDHP $796.18 0.9442 62.00% 1.0000 $466.11 $796.18 0.5902 67.52% $317.28 2,098
PLATINUM Deductible $796.18 1.0830 90.26% 1.0000 $778.22 $796.18 1.3866 93.50% $1,032.16 6,963
GOLD Deductible $796.18 1.0224 81.24% 1.0000 $661.34 $796.18 1.0295 84.08% $689.16 4,797
SILVER Deductible $796.18 0.9722 71.02% 1.0000 $549.73 $796.18 1.0623 76.25% $644.93 3,546
SILVER CDHP $796.18 0.9811 73.16% 1.0000 $571.47 $796.18 1.0623 78.00% $659.73 824
BRONZE Deductible $796.18 0.9449 62.34% 1.0000 $469.01 $796.18 0.5902 67.76% $318.40 1,823
BRONZE CDHP $796.18 0.9479 63.57% 1.0000 $479.78 $796.18 0.5902 68.66% $322.63 1,392
BRONZE Integrated $796.18 0.9467 63.06% 1.0000 $475.25 $796.18 0.5902 69.51% $326.63 563
Catastrophic Deductible $796.18 0.9467 63.07% 0.5187 $246.59 $796.18 0.3529 69.95% $196.52 360
SILVER Vermont Preferred $796.18 0.9639 68.81% 1.0000 $528.09 $796.18 0.7594 72.80% $440.12 637
SILVER Vermont Select CDHP $796.18 0.9690 70.20% 1.0000 $541.56 $796.18 0.7594 71.43% $431.88 661
SILVER Deductible $796.18 0.9722 71.02% 1.0000 $549.72 $796.18 0.7594 73.07% $441.76 4,586
SILVER CDHP $796.18 0.9810 73.16% 1.0000 $571.43 $796.18 0.7594 74.91% $452.89 1,910
Total $603.07 $655.57 38,421
Impact of Selection = $655.57 / $603.07 1.0871
Projected Paid Claims - Using HHS Induced Utilization Factor Projected Paid Claims - Using BCBSVT Induced Utilization Factor
NO
N-S
TA
ND
AR
D
PLA
NS
ST
AN
DA
RD
PLA
NS
REFLEC
TIV
E P
LA
NS

BLUE CROSS AND BLUE SHIELD OF VERMONT
2021 VERMONT INDIVIDUAL AND SMALL GROUP RATE FILING
DETAILS OF ADMINISTRATIVE CHARGES
Exhibit 7A
BCBSVT Base
Administrative
Charges
Administrative
Charges for
Outside
Vendors
VHC BillingCredit Card
Fees
Total
Administrative
Charges PMPM
Administrative
Charges Plan
Level
Adjustment
Administrative
Charges as a
percent of
Premium
Projected
Membership
GOLD Vermont Preferred $48.85 $0.48 $0.94 $3.16 $53.43 1.0899 7.98% 1,208
GOLD Vermont Select CDHP $48.85 $0.73 $0.94 $3.33 $53.85 1.0856 7.64% 5,022
SILVER Vermont Preferred $48.85 $0.31 $0.94 $3.13 $53.24 1.0903 8.01% 1,299
SILVER Vermont Select CDHP $48.85 $0.31 $0.94 $3.15 $53.26 1.0897 7.97% 212
BRONZE Vermont Preferred $48.85 $0.34 $0.94 $2.43 $52.55 1.1182 10.21% 520
BRONZE Vermont Select CDHP $48.85 $0.58 $0.94 $2.40 $52.77 1.1200 10.35% 2,098
PLATINUM Deductible $48.85 $0.42 $0.94 $4.06 $54.26 1.0697 6.31% 6,963
GOLD Deductible $48.85 $0.36 $0.94 $3.44 $53.59 1.0822 7.35% 4,797
SILVER Deductible $48.85 $0.31 $0.94 $3.21 $53.31 1.0882 7.84% 3,546
SILVER CDHP $48.85 $0.32 $0.94 $3.26 $53.37 1.0866 7.71% 824
BRONZE Deductible $48.85 $0.42 $0.94 $2.42 $52.63 1.1188 10.26% 1,823
BRONZE CDHP $48.85 $0.38 $0.94 $2.47 $52.64 1.1158 10.03% 1,392
BRONZE Integrated $48.85 $0.32 $0.94 $2.45 $52.56 1.1169 10.11% 563
Catastrophic Deductible $48.85 $0.31 $0.94 $1.24 $51.34 1.2554 19.54% 360
SILVER Vermont Preferred $48.85 $0.36 $0.94 $2.73 $52.88 1.1043 9.13% 637
SILVER Vermont Select CDHP $48.85 $0.63 $0.94 $2.80 $53.22 1.1020 8.95% 661
SILVER Deductible $48.85 $0.40 $0.94 $2.85 $53.03 1.1000 8.79% 4,586
SILVER CDHP $48.85 $0.42 $0.94 $2.96 $53.17 1.0960 8.47% 1,910
Total $48.85 $0.44 $0.94 $3.18 $53.42 1.0890 7.91% 38,421
NO
N-S
TA
ND
AR
D
PLA
NS
ST
AN
DA
RD
PLA
NS
REFLEC
TIV
E P
LA
NS

BLUE CROSS AND BLUE SHIELD OF VERMONT
2021 VERMONT INDIVIDUAL AND SMALL GROUP RATE FILING
DETAILS OF CONTRIBUTION TO RESERVE
Exhibit 7B
BCBSVT
Contribution to
Reserve
Risk Margin for
Bad Debt
Total
Contribution to
Reserve PMPM
Contribution to
Reserve and
Risk Margin
Plan Level
Adjustment
Contribution to
Reserve as a
percent of
Premium
Risk Margin Bad
Debt as a
percent of
Premium
Projected
Membership
GOLD Vermont Preferred $10.04 $2.01 $12.05 1.0183 1.50% 0.30% 1,208
GOLD Vermont Select CDHP $10.58 $2.12 $12.69 1.0183 1.50% 0.30% 5,022
SILVER Vermont Preferred $9.97 $1.99 $11.96 1.0183 1.50% 0.30% 1,299
SILVER Vermont Select CDHP $10.03 $2.01 $12.03 1.0183 1.50% 0.30% 212
BRONZE Vermont Preferred $7.72 $1.54 $9.26 1.0183 1.50% 0.30% 520
BRONZE Vermont Select CDHP $7.65 $1.53 $9.17 1.0183 1.50% 0.30% 2,098
PLATINUM Deductible $12.90 $2.58 $15.48 1.0183 1.50% 0.30% 6,963
GOLD Deductible $10.93 $2.19 $13.12 1.0183 1.50% 0.30% 4,797
SILVER Deductible $10.20 $2.04 $12.24 1.0183 1.50% 0.30% 3,546
SILVER CDHP $10.38 $2.08 $12.45 1.0183 1.50% 0.30% 824
BRONZE Deductible $7.69 $1.54 $9.23 1.0183 1.50% 0.30% 1,823
BRONZE CDHP $7.87 $1.57 $9.45 1.0183 1.50% 0.30% 1,392
BRONZE Integrated $7.80 $1.56 $9.35 1.0183 1.50% 0.30% 563
Catastrophic Deductible $3.94 $0.79 $4.73 1.0183 1.50% 0.30% 360
SILVER Vermont Preferred $8.69 $1.74 $10.42 1.0183 1.50% 0.30% 637
SILVER Vermont Select CDHP $8.92 $1.78 $10.70 1.0183 1.50% 0.30% 661
SILVER Deductible $9.05 $1.81 $10.86 1.0183 1.50% 0.30% 4,586
SILVER CDHP $9.42 $1.88 $11.30 1.0183 1.50% 0.30% 1,910
Total $10.13 $2.03 $12.15 1.0183 1.50% 0.30% 38,421
NO
N-S
TA
ND
AR
D
PLA
NS
STA
ND
AR
D P
LA
NS
REFLEC
TIV
E P
LA
NS

BLUE CROSS AND BLUE SHIELD OF VERMONT
2021 VERMONT INDIVIDUAL AND SMALL GROUP RATE FILING
DETAILS OF TAXES AND FEES
Exhibit 7C
0.800% 0.199%
State
Assessment -
HCCA
State Tax -
VITLGMCB Billbacks
Federal
Assessment -
PCORI
Federal Insurer
Fee
Risk
Adjustment
User Fee
Total Taxes
and Fees PMPM
Taxes and Fees
Plan Level
Adjustment
Taxes and Fees
as a percent of
Premium
Projected
Membership
GOLD Vermont Preferred $5.31 $1.32 $2.54 $0.24 $0.00 $0.18 $9.59 1.0148 1.43% 1,208
GOLD Vermont Select CDHP $5.59 $1.39 $2.54 $0.24 $0.00 $0.18 $9.93 1.0146 1.41% 5,022
SILVER Vermont Preferred $5.27 $1.31 $2.54 $0.24 $0.00 $0.18 $9.54 1.0148 1.44% 1,299
SILVER Vermont Select CDHP $5.31 $1.32 $2.54 $0.24 $0.00 $0.18 $9.58 1.0148 1.43% 212
BRONZE Vermont Preferred $4.12 $1.02 $2.54 $0.24 $0.00 $0.18 $8.10 1.0163 1.57% 520
BRONZE Vermont Select CDHP $4.07 $1.01 $2.54 $0.24 $0.00 $0.18 $8.04 1.0163 1.58% 2,098
PLATINUM Deductible $6.79 $1.69 $2.54 $0.24 $0.00 $0.18 $11.43 1.0137 1.33% 6,963
GOLD Deductible $5.77 $1.44 $2.54 $0.24 $0.00 $0.18 $10.16 1.0144 1.39% 4,797
SILVER Deductible $5.40 $1.34 $2.54 $0.24 $0.00 $0.18 $9.69 1.0147 1.43% 3,546
SILVER CDHP $5.49 $1.36 $2.54 $0.24 $0.00 $0.18 $9.81 1.0146 1.42% 824
BRONZE Deductible $4.10 $1.02 $2.54 $0.24 $0.00 $0.18 $8.08 1.0163 1.58% 1,823
BRONZE CDHP $4.19 $1.04 $2.54 $0.24 $0.00 $0.18 $8.19 1.0162 1.56% 1,392
BRONZE Integrated $4.15 $1.03 $2.54 $0.24 $0.00 $0.18 $8.14 1.0162 1.57% 563
Catastrophic Deductible $2.17 $0.54 $2.54 $0.24 $0.00 $0.18 $5.66 1.0224 2.15% 360
SILVER Vermont Preferred $4.61 $1.15 $2.54 $0.24 $0.00 $0.18 $8.72 1.0156 1.51% 637
SILVER Vermont Select CDHP $4.73 $1.18 $2.54 $0.24 $0.00 $0.18 $8.86 1.0154 1.49% 661
SILVER Deductible $4.80 $1.19 $2.54 $0.24 $0.00 $0.18 $8.95 1.0153 1.48% 4,586
SILVER CDHP $4.99 $1.24 $2.54 $0.24 $0.00 $0.18 $9.19 1.0151 1.46% 1,910
Total $5.36 $1.33 $2.54 $0.24 $0.00 $0.18 $9.65 1.0148 1.43% 38,421
NO
N-S
TA
ND
AR
D
PLA
NS
ST
AN
DA
RD
PLA
NS
REFLEC
TIV
E P
LA
NS
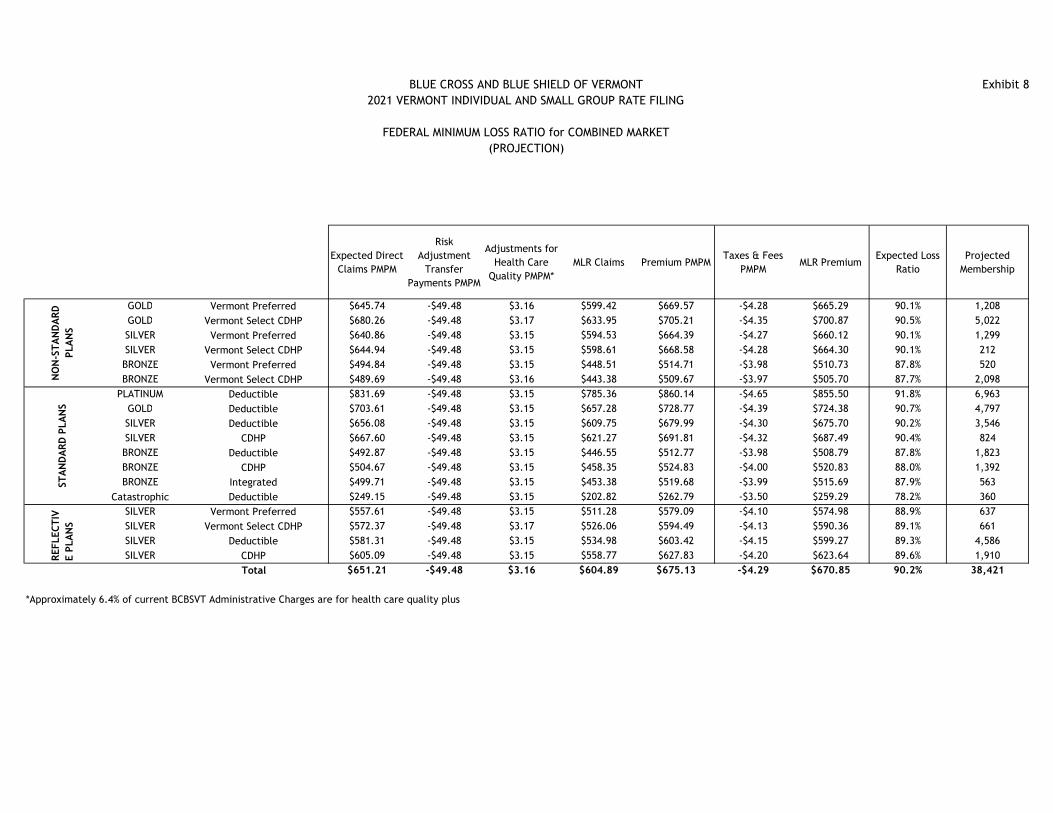
BLUE CROSS AND BLUE SHIELD OF VERMONT
2021 VERMONT INDIVIDUAL AND SMALL GROUP RATE FILING
FEDERAL MINIMUM LOSS RATIO for COMBINED MARKET
(PROJECTION)
Exhibit 8
Expected Direct
Claims PMPM
Risk
Adjustment
Transfer
Payments PMPM
Adjustments for
Health Care
Quality PMPM*
MLR Claims Premium PMPMTaxes & Fees
PMPMMLR Premium
Expected Loss
Ratio
Projected
Membership
GOLD Vermont Preferred $645.74 -$49.48 $3.16 $599.42 $669.57 -$4.28 $665.29 90.1% 1,208
GOLD Vermont Select CDHP $680.26 -$49.48 $3.17 $633.95 $705.21 -$4.35 $700.87 90.5% 5,022
SILVER Vermont Preferred $640.86 -$49.48 $3.15 $594.53 $664.39 -$4.27 $660.12 90.1% 1,299
SILVER Vermont Select CDHP $644.94 -$49.48 $3.15 $598.61 $668.58 -$4.28 $664.30 90.1% 212
BRONZE Vermont Preferred $494.84 -$49.48 $3.15 $448.51 $514.71 -$3.98 $510.73 87.8% 520
BRONZE Vermont Select CDHP $489.69 -$49.48 $3.16 $443.38 $509.67 -$3.97 $505.70 87.7% 2,098
PLATINUM Deductible $831.69 -$49.48 $3.15 $785.36 $860.14 -$4.65 $855.50 91.8% 6,963
GOLD Deductible $703.61 -$49.48 $3.15 $657.28 $728.77 -$4.39 $724.38 90.7% 4,797
SILVER Deductible $656.08 -$49.48 $3.15 $609.75 $679.99 -$4.30 $675.70 90.2% 3,546
SILVER CDHP $667.60 -$49.48 $3.15 $621.27 $691.81 -$4.32 $687.49 90.4% 824
BRONZE Deductible $492.87 -$49.48 $3.15 $446.55 $512.77 -$3.98 $508.79 87.8% 1,823
BRONZE CDHP $504.67 -$49.48 $3.15 $458.35 $524.83 -$4.00 $520.83 88.0% 1,392
BRONZE Integrated $499.71 -$49.48 $3.15 $453.38 $519.68 -$3.99 $515.69 87.9% 563
Catastrophic Deductible $249.15 -$49.48 $3.15 $202.82 $262.79 -$3.50 $259.29 78.2% 360
SILVER Vermont Preferred $557.61 -$49.48 $3.15 $511.28 $579.09 -$4.10 $574.98 88.9% 637
SILVER Vermont Select CDHP $572.37 -$49.48 $3.17 $526.06 $594.49 -$4.13 $590.36 89.1% 661
SILVER Deductible $581.31 -$49.48 $3.15 $534.98 $603.42 -$4.15 $599.27 89.3% 4,586
SILVER CDHP $605.09 -$49.48 $3.15 $558.77 $627.83 -$4.20 $623.64 89.6% 1,910
Total $651.21 -$49.48 $3.16 $604.89 $675.13 -$4.29 $670.85 90.2% 38,421
*Approximately 6.4% of current BCBSVT Administrative Charges are for health care quality plus
NO
N-S
TA
ND
AR
D
PLA
NS
ST
AN
DA
RD
PLA
NS
REFLEC
TIV
E P
LA
NS

BLUE CROSS AND BLUE SHIELD OF VERMONT
2021 VERMONT INDIVIDUAL AND SMALL GROUP RATE FILING
CONTRACT CONVERSION FACTOR
Exhibit 9A
Projected
Membership
Plan Level
Adjusted Index
Rate
Average
Members per
Subcribers
Average Tier
Factor
Ratio of
Members per
Subcribers to
Tier Factor
Single Rate Couple RateAdult and
Child(ren) RateFamily Rate Single Rate Couple Rate
Adult and
Child(ren)
Rate
Family Rate
GOLD Vermont Preferred 1,208 $669.57 1.6220 1.4565 1.1137 $745.69 $1,491.38 $1,439.18 $2,095.39 522 120 26 101
GOLD Vermont Select CDHP 5,022 $705.21 1.6220 1.4565 1.1137 $785.39 $1,570.78 $1,515.80 $2,206.95 1,356 563 134 551
SILVER Vermont Preferred 1,299 $664.39 1.6220 1.4565 1.1137 $739.93 $1,479.86 $1,428.06 $2,079.20 714 195 30 37
SILVER Vermont Select CDHP 212 $668.58 1.6220 1.4565 1.1137 $744.60 $1,489.20 $1,437.08 $2,092.33 118 32 5 6
BRONZE Vermont Preferred 520 $514.71 1.6220 1.4565 1.1137 $573.23 $1,146.46 $1,106.33 $1,610.78 264 50 13 35
BRONZE Vermont Select CDHP 2,098 $509.67 1.6220 1.4565 1.1137 $567.62 $1,135.24 $1,095.51 $1,595.01 834 192 37 203
PLATINUM Deductible 6,963 $860.14 1.6220 1.4565 1.1137 $957.94 $1,915.88 $1,848.82 $2,691.81 2,330 798 215 630
GOLD Deductible 4,797 $728.77 1.6220 1.4565 1.1137 $811.63 $1,623.26 $1,566.45 $2,280.68 1,903 507 113 403
SILVER Deductible 3,546 $679.99 1.6220 1.4565 1.1137 $757.31 $1,514.62 $1,461.61 $2,128.04 1,844 551 77 124
SILVER CDHP 824 $691.81 1.6220 1.4565 1.1137 $770.47 $1,540.94 $1,487.01 $2,165.02 376 128 17 41
BRONZE Deductible 1,823 $512.77 1.6220 1.4565 1.1137 $571.07 $1,142.14 $1,102.17 $1,604.71 896 193 40 119
BRONZE CDHP 1,392 $524.83 1.6220 1.4565 1.1137 $584.50 $1,169.00 $1,128.09 $1,642.45 588 128 35 122
BRONZE Integrated 563 $519.68 1.6220 1.4565 1.1137 $578.77 $1,157.54 $1,117.03 $1,626.34 272 53 13 40
Catastrophic Deductible 360 $262.79 1.0435 1.0362 1.0070 $264.63 $529.26 $510.74 $743.61 334 7 2 2
SILVER Vermont Preferred 637 $579.09 1.6220 1.4565 1.1137 $644.93 $1,289.86 $1,244.71 $1,812.25 321 45 14 48
SILVER Vermont Select CDHP 661 $594.49 1.6220 1.4565 1.1137 $662.09 $1,324.18 $1,277.83 $1,860.47 208 54 12 80
SILVER Deductible 4,586 $603.42 1.6220 1.4565 1.1137 $672.03 $1,344.06 $1,297.02 $1,888.40 1,977 439 110 369
SILVER CDHP 1,910 $627.83 1.6220 1.4565 1.1137 $699.22 $1,398.44 $1,349.49 $1,964.81 676 174 53 191
Total 38,421 $675.13 $674.01
Additional Factor for Contract Conversion Factor 100.17%
Preliminary Rates Projected Contracts
NO
N-S
TA
ND
AR
D
PLA
NS
ST
AN
DA
RD
PLA
NS
REFLEC
TIV
E P
LA
NS

BLUE CROSS AND BLUE SHIELD OF VERMONT
2021 VERMONT INDIVIDUAL AND SMALL GROUP RATE FILING
CONSUMER ADJUSTED PREMIUM RATES
Exhibit 9B
Page 7
Plan Level
Adjusted Index
Rate
PMPM to Single
Contract
Conversion
Factor
Single Rate Couple RateAdult and
Child(ren) RateFamily Rate Single Rate Couple Rate
Adult and
Child(ren) RateFamily Rate Single Rate Couple Rate
Adult and
Child(ren)
Rate
Family Rate
GOLD Vermont Preferred $669.57 1.1156 $746.97 $1,493.94 $1,441.65 $2,098.99 $698.95 $1,397.90 $1,348.97 $1,964.05 6.9% 6.9% 6.9% 6.9%
GOLD Vermont Select CDHP $705.21 1.1156 $786.73 $1,573.46 $1,518.39 $2,210.71 $694.59 $1,389.18 $1,340.56 $1,951.80 13.3% 13.3% 13.3% 13.3%
SILVER Vermont Preferred $664.39 1.1156 $741.19 $1,482.38 $1,430.50 $2,082.74 $691.29 $1,382.58 $1,334.19 $1,942.52 7.2% 7.2% 7.2% 7.2%
SILVER Vermont Select CDHP $668.58 1.1156 $745.87 $1,491.74 $1,439.53 $2,095.89 $703.57 $1,407.14 $1,357.89 $1,977.03 6.0% 6.0% 6.0% 6.0%
BRONZE Vermont Preferred $514.71 1.1156 $574.21 $1,148.42 $1,108.23 $1,613.53 $545.43 $1,090.86 $1,052.68 $1,532.66 5.3% 5.3% 5.3% 5.3%
BRONZE Vermont Select CDHP $509.67 1.1156 $568.59 $1,137.18 $1,097.38 $1,597.74 $545.59 $1,091.18 $1,052.99 $1,533.11 4.2% 4.2% 4.2% 4.2%
PLATINUM Deductible $860.14 1.1156 $959.58 $1,919.16 $1,851.99 $2,696.42 $900.13 $1,800.26 $1,737.25 $2,529.37 6.6% 6.6% 6.6% 6.6%
GOLD Deductible $728.77 1.1156 $813.02 $1,626.04 $1,569.13 $2,284.59 $777.60 $1,555.20 $1,500.77 $2,185.06 4.6% 4.6% 4.6% 4.6%
SILVER Deductible $679.99 1.1156 $758.60 $1,517.20 $1,464.10 $2,131.67 $723.22 $1,446.44 $1,395.81 $2,032.25 4.9% 4.9% 4.9% 4.9%
SILVER CDHP $691.81 1.1156 $771.78 $1,543.56 $1,489.54 $2,168.70 $727.00 $1,454.00 $1,403.11 $2,042.87 6.2% 6.2% 6.2% 6.2%
BRONZE Deductible $512.77 1.1156 $572.05 $1,144.10 $1,104.06 $1,607.46 $549.48 $1,098.96 $1,060.50 $1,544.04 4.1% 4.1% 4.1% 4.1%
BRONZE CDHP $524.83 1.1156 $585.50 $1,171.00 $1,130.02 $1,645.26 $559.27 $1,118.54 $1,079.39 $1,571.55 4.7% 4.7% 4.7% 4.7%
BRONZE Integrated $519.68 1.1156 $579.75 $1,159.50 $1,118.92 $1,629.10 $560.45 $1,120.90 $1,081.67 $1,574.86 3.4% 3.4% 3.4% 3.4%
Catastrophic Deductible $262.79 1.0087 $265.07 $530.14 $511.59 $744.85 $266.82 $533.64 $514.96 $749.76 -0.7% -0.7% -0.7% -0.7%
SILVER Vermont Preferred $579.09 1.1156 $646.03 $1,292.06 $1,246.84 $1,815.34 $607.28 $1,214.56 $1,172.05 $1,706.46 6.4% 6.4% 6.4% 6.4%
SILVER Vermont Select CDHP $594.49 1.1156 $663.22 $1,326.44 $1,280.01 $1,863.65 $630.08 $1,260.16 $1,216.05 $1,770.52 5.3% 5.3% 5.3% 5.3%
SILVER Deductible $603.42 1.1156 $673.17 $1,346.34 $1,299.22 $1,891.61 $644.75 $1,289.50 $1,244.37 $1,811.75 4.4% 4.4% 4.4% 4.4%
SILVER CDHP $627.83 1.1156 $700.41 $1,400.82 $1,351.79 $1,968.15 $663.91 $1,327.82 $1,281.35 $1,865.59 5.5% 5.5% 5.5% 5.5%
Total $311,284,496 $292,726,577 6.34%
NO
N-S
TA
ND
AR
D
PLA
NS
ST
AN
DA
RD
PLA
NS
REFLEC
TIV
E P
LA
NS
2021 Proposed Rates 2020 Approved Rates 2021 Proposed Rate Increases
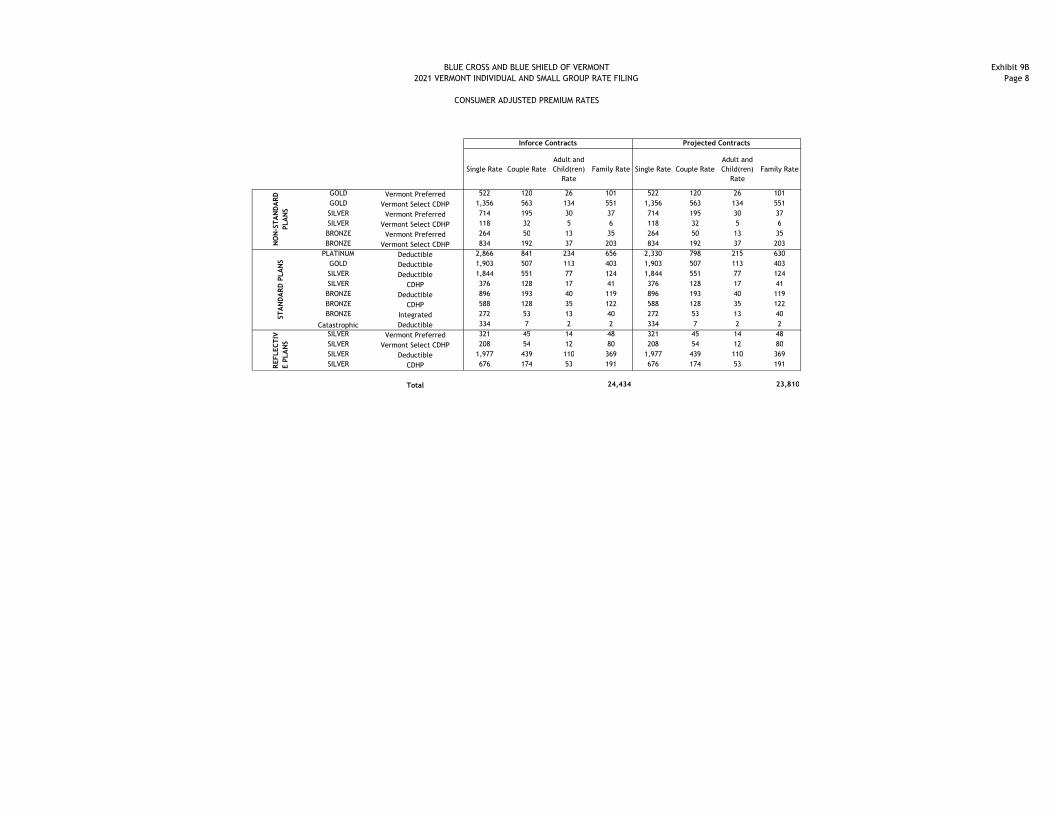
BLUE CROSS AND BLUE SHIELD OF VERMONT
2021 VERMONT INDIVIDUAL AND SMALL GROUP RATE FILING
CONSUMER ADJUSTED PREMIUM RATES
Exhibit 9B
Page 8
GOLD Vermont PreferredGOLD Vermont Select CDHPSILVER Vermont PreferredSILVER Vermont Select CDHPBRONZE Vermont PreferredBRONZE Vermont Select CDHP
PLATINUM DeductibleGOLD DeductibleSILVER DeductibleSILVER CDHPBRONZE DeductibleBRONZE CDHPBRONZE Integrated
Catastrophic DeductibleSILVER Vermont PreferredSILVER Vermont Select CDHPSILVER DeductibleSILVER CDHP
Total
NO
N-S
TA
ND
AR
D
PLA
NS
ST
AN
DA
RD
PLA
NS
REFLEC
TIV
E P
LA
NS
Single Rate Couple Rate
Adult and
Child(ren)
Rate
Family Rate Single Rate Couple Rate
Adult and
Child(ren)
Rate
Family Rate
522 120 26 101 522 120 26 101
1,356 563 134 551 1,356 563 134 551
714 195 30 37 714 195 30 37
118 32 5 6 118 32 5 6
264 50 13 35 264 50 13 35
834 192 37 203 834 192 37 203
2,866 841 234 656 2,330 798 215 630
1,903 507 113 403 1,903 507 113 403
1,844 551 77 124 1,844 551 77 124
376 128 17 41 376 128 17 41
896 193 40 119 896 193 40 119
588 128 35 122 588 128 35 122
272 53 13 40 272 53 13 40
334 7 2 2 334 7 2 2
321 45 14 48 321 45 14 48
208 54 12 80 208 54 12 80
1,977 439 110 369 1,977 439 110 369
676 174 53 191 676 174 53 191
24,434 23,810
Inforce Contracts Projected Contracts
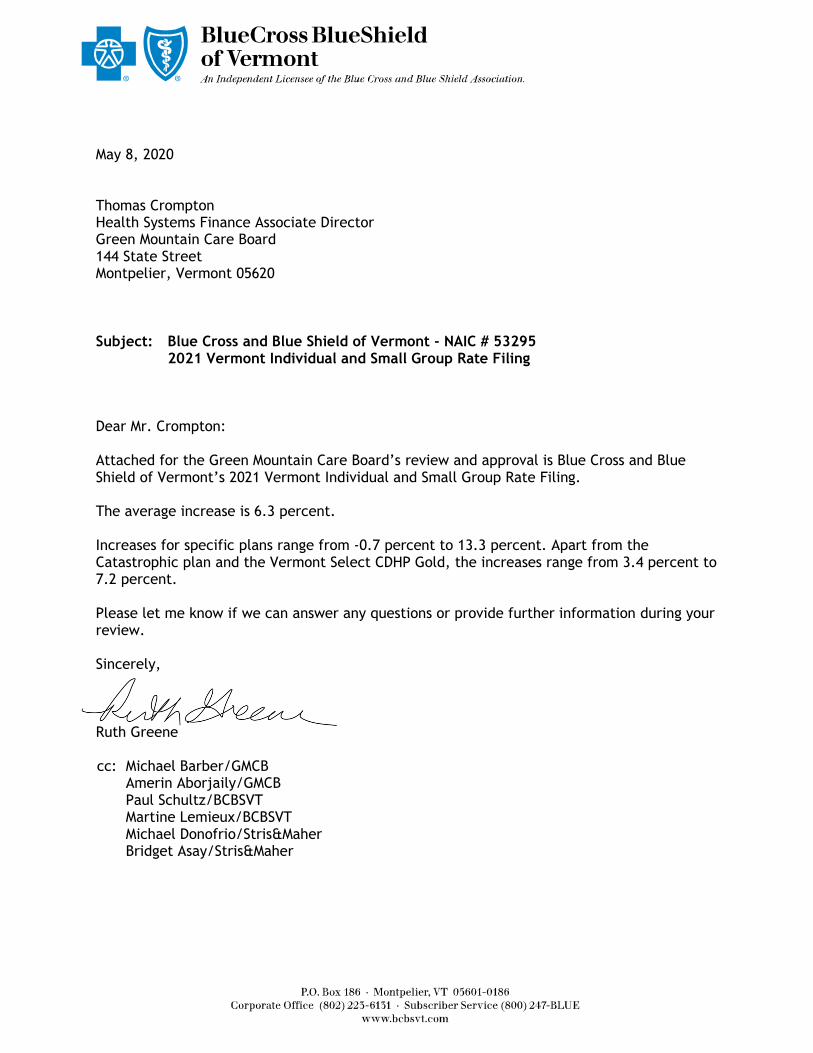
May 8, 2020 Thomas Crompton Health Systems Finance Associate Director Green Mountain Care Board 144 State Street Montpelier, Vermont 05620 Subject: Blue Cross and Blue Shield of Vermont - NAIC # 53295
2021 Vermont Individual and Small Group Rate Filing Dear Mr. Crompton: Attached for the Green Mountain Care Board’s review and approval is Blue Cross and Blue Shield of Vermont’s 2021 Vermont Individual and Small Group Rate Filing. The average increase is 6.3 percent. Increases for specific plans range from -0.7 percent to 13.3 percent. Apart from the Catastrophic plan and the Vermont Select CDHP Gold, the increases range from 3.4 percent to 7.2 percent. Please let me know if we can answer any questions or provide further information during your review. Sincerely, Ruth Greene cc: Michael Barber/GMCB Amerin Aborjaily/GMCB Paul Schultz/BCBSVT Martine Lemieux/BCBSVT Michael Donofrio/Stris&Maher
Bridget Asay/Stris&Maher