filing at a glance - missouri
TRANSCRIPT
Filing at a Glance
Company: NCCI
Product Name: Missouri Voluntary Market Advisory Loss Costs and Rating Values Effective January 1, 2015
State: Missouri
TOI: 16.0 Workers Compensation
Sub-TOI: 16.0004 Standard WC
Filing Type: Rate
Date Submitted: 08/22/2014
SERFF Tr Num: NCCI-129681068
SERFF Status: Closed-REVIEWED
State Tr Num: 317
State Status: REVIEWED
Co Tr Num: MISSOURI LC 01012015
Effective DateRequested (New):
01/01/2015
Effective DateRequested (Renewal):
01/01/2015
Author(s): Lesley O'Brien, Alison Herwig, Frank Gnolfo, Roy Wood, Dennis Kokulak, Robert Dalton,Michelle Baker, Miguel Joubert
Reviewer(s): Patrick Lennon (primary), Julie Lederer
Disposition Date: 12/15/2014
Disposition Status: REVIEWED
Effective Date (New): 01/01/2015
Effective Date (Renewal): 01/01/2015
State Filing Description:
SERFF Tracking #: NCCI-129681068 State Tracking #: 317 Company Tracking #: MISSOURI LC 01012015
State: Missouri Filing Company: NCCI
TOI/Sub-TOI: 16.0 Workers Compensation/16.0004 Standard WC
Product Name: Missouri Voluntary Market Advisory Loss Costs and Rating Values Effective January 1, 2015
Project Name/Number: /
PDF Pipeline for SERFF Tracking Number NCCI-129681068 Generated 12/15/2014 11:46 AM

General Information
Company and Contact
Filing Fees
State Specific
Project Name: Status of Filing in Domicile:
Project Number: Domicile Status Comments:
Reference Organization: Reference Number:
Reference Title: Advisory Org. Circular:
Filing Status Changed: 12/15/2014
State Status Changed: 12/15/2014 Deemer Date:
Created By: Frank Gnolfo Submitted By: Robert Dalton
Corresponding Filing Tracking Number:
State TOI: 16.0 Workers Compensation State Sub-TOI: 16.0004 Standard WC
Filing Description:
Enclosed are the NCCI Voluntary Loss Costs Including Trend proposed to be effective January 1, 2015. The proposal is for anoverall average decrease of (-3.7%)% from the January 1, 2014.
Filing Contact InformationRoy Wood, State Relations Executive [email protected]
11430 Gravois Road
Suite 310
St. Louis, MO 63126
314-843-4001 [Phone]
314-842-3188 [FAX]
Filing Company InformationNCCI
901 Peninsula Corporate Circle
Boca Raton, FL 33487
(561) 893-3186 ext. [Phone]
CoCode:
Group Code:
Group Name:
FEIN Number: 65-0439698
State of Domicile: Florida
Company Type:
State ID Number: 9999-85000
Fee Required? Yes
Fee Amount: $50.00
Retaliatory? No
Fee Explanation: Rate
Per Company: Yes
Company Amount Date Processed Transaction #NCCI $50.00 08/22/2014 85349390
NAIC Number: RO99985Have you reviewed the General Instructions document? (yes/no)(General Instructions updated 9/14/07): YesIf this is a rate filing, was rate data added on the rate/rule schedule? (yes/no): YesAre you paying the $50 per company per submission filing fee electronically using EFT or would you like to be billed inarrears? All companies and filing entities are strongly encouraged to take advantage of the EFT payment option. Theutilization of SERFF and EFT for the payment of filing fees in other states has resulted in a more efficient filing review process
SERFF Tracking #: NCCI-129681068 State Tracking #: 317 Company Tracking #: MISSOURI LC 01012015
State: Missouri Filing Company: NCCI
TOI/Sub-TOI: 16.0 Workers Compensation/16.0004 Standard WC
Product Name: Missouri Voluntary Market Advisory Loss Costs and Rating Values Effective January 1, 2015
Project Name/Number: /
PDF Pipeline for SERFF Tracking Number NCCI-129681068 Generated 12/15/2014 11:46 AM

and has provided a significant administrative cost savings for the industry.: Yes
SERFF Tracking #: NCCI-129681068 State Tracking #: 317 Company Tracking #: MISSOURI LC 01012015
State: Missouri Filing Company: NCCI
TOI/Sub-TOI: 16.0 Workers Compensation/16.0004 Standard WC
Product Name: Missouri Voluntary Market Advisory Loss Costs and Rating Values Effective January 1, 2015
Project Name/Number: /
PDF Pipeline for SERFF Tracking Number NCCI-129681068 Generated 12/15/2014 11:46 AM

Rate/Rule Schedule
Item
No.
Schedule Item
Status Exhibit Name Rule # or Page # Rate Action
Previous State
Filing Number Attachments1 REVIEWED
12/15/2014New Filing NA Replacement 387 _MO Filing
1.1.2015_FINAL.pdf
SERFF Tracking #: NCCI-129681068 State Tracking #: 317 Company Tracking #: MISSOURI LC 01012015
State: Missouri Filing Company: NCCI
TOI/Sub-TOI: 16.0 Workers Compensation/16.0004 Standard WC
Product Name: Missouri Voluntary Market Advisory Loss Costs and Rating Values Effective January 1, 2015
Project Name/Number: /
PDF Pipeline for SERFF Tracking Number NCCI-129681068 Generated 12/15/2014 11:46 AM
Missouri
Voluntary Loss Cost Filing Proposed Effective January 1, 2015

Roy O. Wood State Relations Executive Regulatory Services Division
(P) 314-843-4001 (F) 561-893-5550 Email: [email protected]
11430 Gravois Road, Suite 310 St. Louis, MO 63126-0530 www.ncci.com
National Council on Compensation Insurance, Inc.
August 22, 2014
The Honorable John Huff Director Missouri Department of Insurance, Financial Institutions, and Professional Registration 301 West High Street P.O. Box 690 Jefferson City, Missouri 65102-0690 Re: Missouri Voluntary Loss Costs – Effective January 1, 2015 Dear Director Huff: Enclosed are the NCCI Voluntary Loss Costs Including Trend proposed to be effective January 1, 2015. The proposal is for an overall average decrease of 3.7% from the January 1, 2014 NCCI Voluntary Loss Costs Including Trend. Please note the following in connection with this filing:
As a result of Item B-1397, effective January 1, 2008, the experience for Class Codes 7704, 7710, and 7711 is combined to determine a single loss cost for Class Codes 7710 and 7711.
As a result of Item E-1402, the split point for experience rating was changed from $10,000 to $13,500.
As a result of Items R-1408 and R-1409, the retrospective rating plan parameters were updated.
As a result of Item B-1426, the Per Passenger Seat Surcharge for Class Code 7421 is discontinued effective January 1, 2015.
As a result of Item B-1427, Class Code 3069 is discontinued effective January 1, 2015, and Class Code 3076 reflects the combined experience of Class Codes 3069 and 3076.
As a result of Item 02-MO-2009, effective January 1, 2010, the payroll determination amounts for Class Codes 9178 and 9179 were calculated based on the state average weekly wage and, therefore, multiple Expected Loss Rates are reflected for these Class Codes.
I hereby certify that I am familiar with the insurance laws, rules and regulations of the State of Missouri, and to the best of my knowledge, information, and belief, this filing complies in all respects to such laws, rules, and regulations. This filing is made on behalf of the
The Honorable John Huff Page 2 August 22, 2014
members and subscribers of the National Council on Compensation Insurance, Inc., who are now writing or will write workers compensation insurance in Missouri. This filing is made exclusively on behalf of the companies that have given valid consideration for the express purpose of fulfilling regulatory rate or pure premium filing requirements and other private use of this information. In the enclosed appendix is a list of companies, sorted by group, which as of the time this filing is submitted, are eligible to reference this information. The inclusion of a company on this list merely indicates that the company, or the group to which it belongs, is affiliated with NCCI in this state, or has licensed this information as a non-affiliate, and is not intended to indicate whether the company is currently writing business or is even licensed to write business in this state. Please contact me if you have any questions or need any further information. Respectfully submitted,
Roy O. Wood State Relations Executive Regulatory Services Division
Actuarial Certification
I, Nadege Bernard-Ahrendts, am a Manager and Associate Actuary for the National Council on Compensation Insurance, Inc. I am a Fellow of the Casualty Actuarial Society and a member of the American Academy of Actuaries, and I meet the Qualification Standards of the American Academy of Actuaries to provide the actuarial report contained herein. The information contained in this report has been prepared under my direction in accordance with applicable Actuarial Standards of Practice as promulgated by the Actuarial Standards Board. The Actuarial Standards Board is vested by the U.S.-based actuarial organizations with the responsibility for promulgating Actuarial Standards of Practice for actuaries providing professional services in the United States. Each of these organizations requires its members, through its Code of Professional Conduct, to observe the Actuarial Standards of Practice when practicing in the United States. ________________________ Nadege Bernard-Ahrendts Manager and Associate Actuary Actuarial and Economic Services
© Copyright 2014 National Council on Compensation Insurance, Inc. All Rights Reserved.
© Copyright 2014 National Council on Compensation Insurance, Inc. All Rights Reserved These materials are comprised of NCCI actuarial judgment and proprietary and confidential information which are valuable assets of NCCI and are protected by copyright and other intellectual property laws. The uses of these materials are governed by a separate contractual agreement between NCCI and its licensees such as an affiliation agreement between NCCI and an end user. Unless expressly authorized by NCCI, you may not copy, create derivative works (by way of example, create or supplement your own works or other materials), display, perform, or use the materials, in whole or in part, in any media. Such actions taken by you, or by your direction, may be in violation of federal copyright and other commercial laws. NCCI does not permit or agree to such use of its materials. In the event such use is contemplated or desired, please contact NCCI's Legal Department for permission. NCCI MAKES NO REPRESENTATIONS OR WARRANTIES RELATING TO THESE MATERIALS, INCLUDING ANY EXPRESS, STATUTORY OR IMPLIED WARRANTIES INCLUDING THE IMPLIED WARRANTY OF MERCHANTABILITY AND FITNESS FOR A PARTICULAR PURPOSE. ADDITIONALLY, AUTHORIZED END USERS ASSUME RESPONSIBILITY FOR THE USE OF, AND FOR ANY AND ALL RESULTS DERIVED OR OBTAINED THROUGH THE USE OF SUCH MATERIALS.
MISSOURI
WORKERS COMPENSATION FILING – JANUARY 1, 2015
Table of Contents
Background and Filing Procedure ....................................................................... ..1
Proposed Changes in Voluntary Loss Costs ......................................................... 3
Key Components
Experience ..................................................................................................................... 4
Trend ............................................................................................................................. 5
Benefits ........................................................................................................................ 13
Loss Adjustment Expenses ......................................................................................... 13
Conclusion .......................................................................................................... 14
Exhibits
Exhibit I - Missouri Historical Loss Cost Changes - NCCI Including Trend .................. 15
Exhibit II - Missouri Written Premium ........................................................................... 16
Exhibit III - Missouri Largest Workers Compensation Writers ...................................... 17
Exhibit IV - Proposed Voluntary Market Loss Costs and Rating Values - NCCI Including Trend ............................................................................................................ 18
NCCI Key Contacts ............................................................................................. 29
Appendix—Affiliate List ...................................................................................... 30
© Copyright 2014 National Council on Compensation Insurance, Inc. All Rights Reserved.
MISSOURI
WORKERS COMPENSATION FILING – JANUARY 1, 2015
Background and Filing Procedure The workers compensation benefit system is designed to cover medical costs associated with workplace injuries, as well as provide wage replacement (indemnity) benefits to injured workers for lost work time. The Missouri Department of Insurance, Financial Institutions, and Professional Registration (DIFP) has designated the National Council on Compensation Insurance, Inc. (NCCI) to collect, validate, and analyze workers compensation data from insurance companies. The National Council on Compensation Insurance, Inc. (NCCI) collects an extensive amount of information regarding the workers compensation system in Missouri. Using this information, NCCI develops prospective voluntary loss costs to be effective on January 1st of each year. Based upon the NCCI proposal and supporting information, the DIFP also determines what it believes to be the appropriate loss cost level. Specifically, the DIFP makes a recommendation as to the appropriate overall statewide premium level change. The DIFP must rely on NCCI to develop the loss costs by classification since NCCI houses the data by classification. Pursuant to Missouri Statute, NCCI is required to distribute the following three sets of loss costs as recommended by NCCI and the DIFP: 1) NCCI Loss Costs Including Trend, 2) NCCI Loss Costs Excluding Trend, and 3) DIFP Loss Costs Including Trend. This filing contains only the NCCI Loss Costs Including Trend. The other two sets of loss costs will be published at a later date. These prospective loss costs are intended to cover the indemnity and medical benefits provided under the system, as well as some of the expenses associated with providing these benefits (loss adjustment expenses). They do not, however, contemplate any other costs associated with providing workers compensation insurance (such as commissions, taxes, etc.). Under the competitive rating laws of the State of Missouri, carriers may reference any of these sets of loss costs in determining their individual rates that are filed with the DIFP. Carriers may elect to change the effective date or may elect not to adopt the revised loss costs. Each insurance company offering workers compensation insurance in Missouri must file a loss cost multiplier to be applied to the approved prospective loss costs in order to compute the final workers compensation rates they intend to charge. This multiplier is intended to cover the other costs associated with
© Copyright 2014 National Council on Compensation Insurance, Inc. All Rights Reserved.
Page 1 of 37

MISSOURI
WORKERS COMPENSATION FILING – JANUARY 1, 2015
providing workers compensation insurance that are not already part of the prospective loss costs. In this filing, NCCI is proposing an overall average decrease of 3.7% to the current loss cost level (in effect since January 1, 2014), and that the new values will become effective on January 1, 2015. Per Item E-1402 (Revisions to the Experience Rating Plan Primary/Excess Split Point Value and Maximum Debit Modification Formula), the primary/excess split point will increase to an inflation adjusted amount over a four year transition period and continue to increase the amount thereafter on an annual basis using a countrywide inflation index. The loss costs effective January 1, 2015 reflect the primary/excess split point of $13,500. This document will explain why these changes are indicated. NCCI separately determines voluntary loss costs for each workers compensation classification. In this filing, the actual change from the current loss cost is different depending on the classification.
© Copyright 2014 National Council on Compensation Insurance, Inc. All Rights Reserved.
Page 2 of 37
MISSOURI
WORKERS COMPENSATION FILING – JANUARY 1, 2015
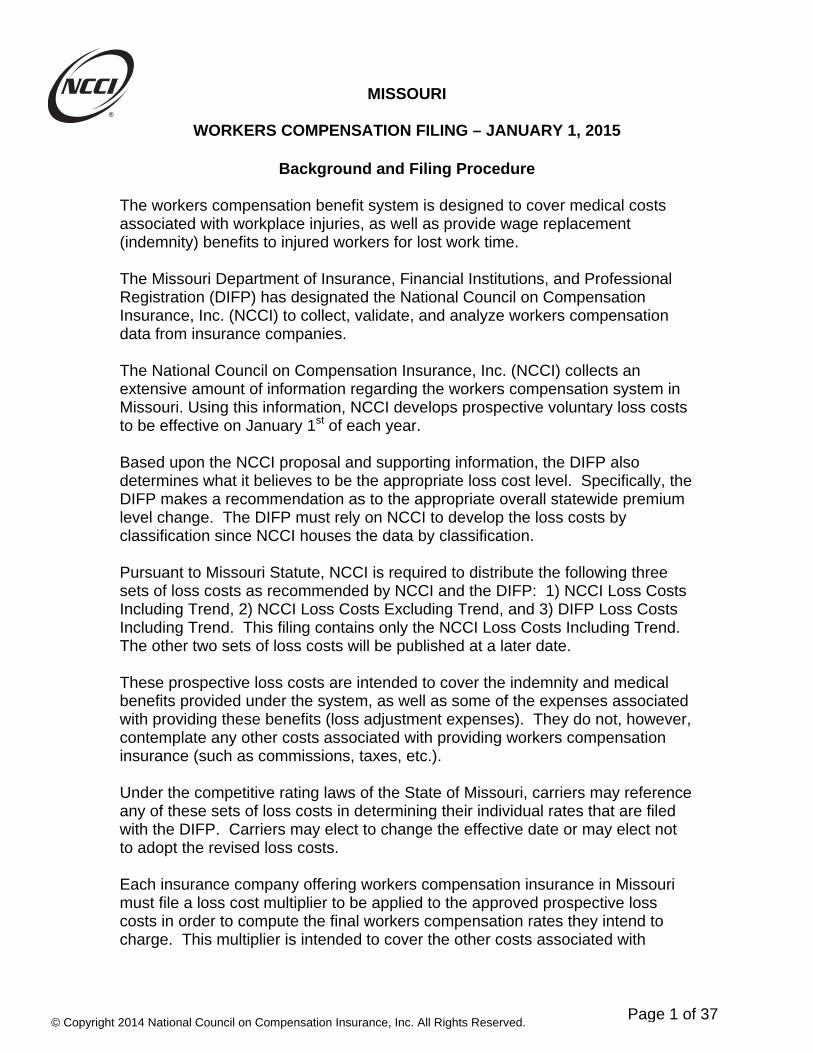
Proposed Overall Average Change in Voluntary Loss Cost Level
Key Components Percentage Change
Experience & Trend –4.0% Benefits +0.2% Loss Adjustment Expenses +0.1%
Overall Change Requested –3.7%
The change in loss costs varies depending on the classification. Each classification belongs to one of five industry groups. The average voluntary loss cost level change proposed for each of these five groups is displayed below, as well as the largest increase and largest decrease possible for a classification in each of those groups.
OVERALL AVERAGE LOSS COST LEVEL CHANGE
–3.7%
GOODS & SERVICES –4.3%
Maximum Increase +16% Maximum Decrease –24%
MANUFACTURING –4.4%
Maximum Increase +16% Maximum Decrease –24%
CONTRACTING –1.3%
Maximum Increase +19% Maximum Decrease –21%
MISCELLANEOUS –2.2%
Maximum Increase +18% Maximum Decrease –22%
OFFICE & CLERICAL –7.2%
Maximum Increase +13% Maximum Decrease –27%
© Copyright 2014 National Council on Compensation Insurance, Inc. All Rights Reserved.
Page 3 of 37
MISSOURI
WORKERS COMPENSATION FILING – JANUARY 1, 2015
Key Components
There are four key components in this filing: experience, trend, benefits, and loss adjustment expenses. They will each be separately discussed. Experience NCCI analyzed the emerging experience of Missouri workers compensation policies in recent years. The primary focus of our analysis was on premiums and losses from policy years 2011 and 2012, evaluated as of December 31, 2013 (a policy year captures the premiums and losses from the block of policies that had effective dates during a given year). The most recently available full policy year is 2012 since the last policy had an effective date of December 31, 2012 and did not expire until December 31, 2013. During this year’s analysis, after reviewing various possible experience periods, the use of the two most recently available full policy years of data was selected as most appropriate in terms of providing balance between stability and responsiveness. It should be noted that NCCI adjusts (via premium and loss on-level factors) the historical policy year experience to reflect approved loss cost changes as well as statutory benefit level changes implemented since that time period. Different aggregations of limited loss experience were analyzed in preparation of this filing. These were (i) paid losses (benefit amounts already paid by insurers on reported claims) and (ii) the sum of paid losses plus case reserves (paid losses and the amounts set aside to cover future payments on those claims). For use in this filing, NCCI utilized loss development factors based on each of these two loss aggregations. This is consistent with NCCI filings made in the past several years in Missouri. Loss development factors are needed since paid losses and case reserve estimates on a given claim change over time until the claim is finally closed. The loss development factors are based on how paid losses and case reserve estimates changed over time for claims from older years.
© Copyright 2014 National Council on Compensation Insurance, Inc. All Rights Reserved.
Page 4 of 37

MISSOURI
WORKERS COMPENSATION FILING – JANUARY 1, 2015
Key Components (Continued) Trend As noted previously, the filing relies primarily on the experience from policy years 2011 and 2012. However, the proposed loss costs are intended for use with policies with effective dates starting on January 1, 2015. It is necessary to use trend factors that forecast how much the future Missouri workers compensation experience will differ from the past. These trend factors measure anticipated changes in the amount of indemnity and medical benefits as compared with anticipated changes in the amount of workers’ wages. For example, if benefit costs are expected to grow faster than wages, then a trend factor greater than zero is indicated. Conversely, if wages are expected to grow faster than benefit costs, then a trend factor less than zero is indicated. In order to appreciate the impact of the various filing components on overall system costs, it is helpful to consider the separate indemnity and medical segments of Missouri benefit costs.
As can be seen, 58% of Missouri’s total benefit costs are medical. This percentage is similar to most other states.
Medical58%
Indemnity42%
Distribution of Missouri Benefit Costs
© Copyright 2014 National Council on Compensation Insurance, Inc. All Rights Reserved.
Page 5 of 37

MISSOURI
WORKERS COMPENSATION FILING – JANUARY 1, 2015
Let us begin by analyzing a measure of the number of workplace injuries (claim frequency) and the average cost of each of these injuries (claim severity). The chart below summarizes the recent history of Missouri lost-time claims (i.e., those claims where a worker has received wage replacement benefits due to a compensable workplace injury). The data in the chart reflect premiums at today’s loss cost and wage levels.
As this chart illustrates, Missouri’s claim frequency has generally declined over the past eight policy years.
20.9
19.8 19.9
18.6
17.518.4
17.416.7
10.0
15.0
20.0
25.0
2005 2006 2007 2008 2009 2010 2011 2012
Fre
qu
ency
per
Mill
ion
of
On
-Lev
eled
, W
age-
Ad
just
ed P
rem
ium
Policy Year
Missouri Claim Frequency
Policy Year Lost-Time Claim Frequency
© Copyright 2014 National Council on Compensation Insurance, Inc. All Rights Reserved.
Page 6 of 37

MISSOURI
WORKERS COMPENSATION FILING – JANUARY 1, 2015
Let us look at the indemnity side of benefits. The chart below shows Missouri’s historical average indemnity cost per case figures for the most recent eight years. The data in the below chart reflect losses at today’s statutory benefit levels.
After removing the impact of the growth in workers’ wages that occurred over this time period, the average indemnity cost per case in excess of wage growth is shown in the following chart.
18,351 18,326
19,53020,338
19,69920,291
20,890 20,903
10,000
15,000
20,000
25,000
2005 2006 2007 2008 2009 2010 2011 2012
Ave
rag
e C
ost
Per
Cas
e
Policy Year
Missouri Indemnity Cost Per Case
Policy Year Indemnity Cost Per Case (Based on an Average of Paid & Paid + Case Losses)
© Copyright 2014 National Council on Compensation Insurance, Inc. All Rights Reserved.
Page 7 of 37
MISSOURI
WORKERS COMPENSATION FILING – JANUARY 1, 2015
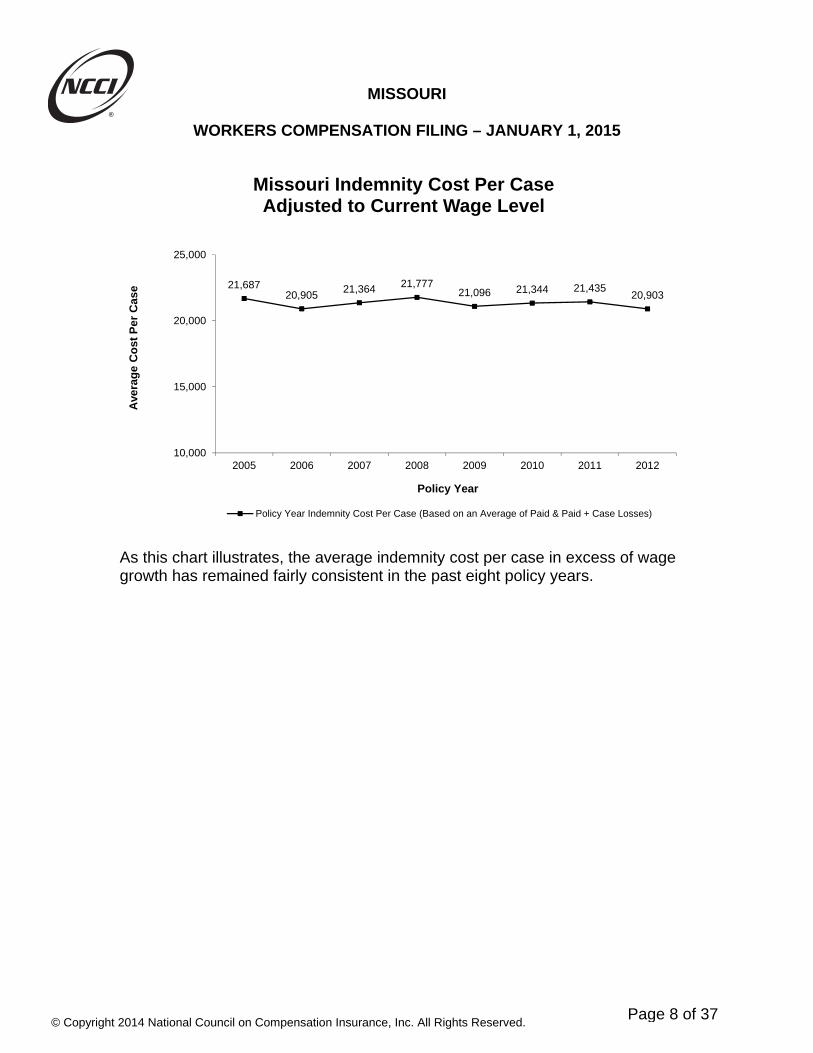
As this chart illustrates, the average indemnity cost per case in excess of wage growth has remained fairly consistent in the past eight policy years.
21,68720,905
21,364 21,77721,096 21,344 21,435
20,903
10,000
15,000
20,000
25,000
2005 2006 2007 2008 2009 2010 2011 2012
Ave
rag
e C
ost
Per
Cas
e
Policy Year
Missouri Indemnity Cost Per CaseAdjusted to Current Wage Level
Policy Year Indemnity Cost Per Case (Based on an Average of Paid & Paid + Case Losses)
© Copyright 2014 National Council on Compensation Insurance, Inc. All Rights Reserved.
Page 8 of 37

MISSOURI
WORKERS COMPENSATION FILING – JANUARY 1, 2015
The indemnity loss ratios below result after combining the observed changes in Missouri’s average claim frequency with the corresponding changes in Missouri’s average indemnity cost per case. An indemnity loss ratio represents the proportion of premium dollars that are necessary to cover indemnity (wage replacement) benefits on behalf of injured workers. The data in the chart reflect premiums at today’s loss costs and losses at today’s statutory benefit levels.
This chart shows that indemnity loss ratios have generally declined over the past eight years. The trend in indemnity loss ratios follows closely to the trend in frequency. In last year’s Missouri filing, NCCI proposed an indemnity trend factor of –4.0% per year. Based on our analysis this year, we are proposing to increase the current indemnity trend factor to –3.0% per year. This means that indemnity benefits are once again expected to increase at a slower pace than workers’ wages.
0.453
0.414 0.4250.404
0.3700.393
0.3720.349
0.20
0.30
0.40
0.50
0.60
2005 2006 2007 2008 2009 2010 2011 2012
Ind
emn
ity
Lo
ss R
atio
Policy Year
Missouri Indemnity Loss Ratio History
Policy Year Indemnity Loss Ratios (Based on an Average of Paid & Paid + Case Losses)
© Copyright 2014 National Council on Compensation Insurance, Inc. All Rights Reserved.
Page 9 of 37
MISSOURI
WORKERS COMPENSATION FILING – JANUARY 1, 2015
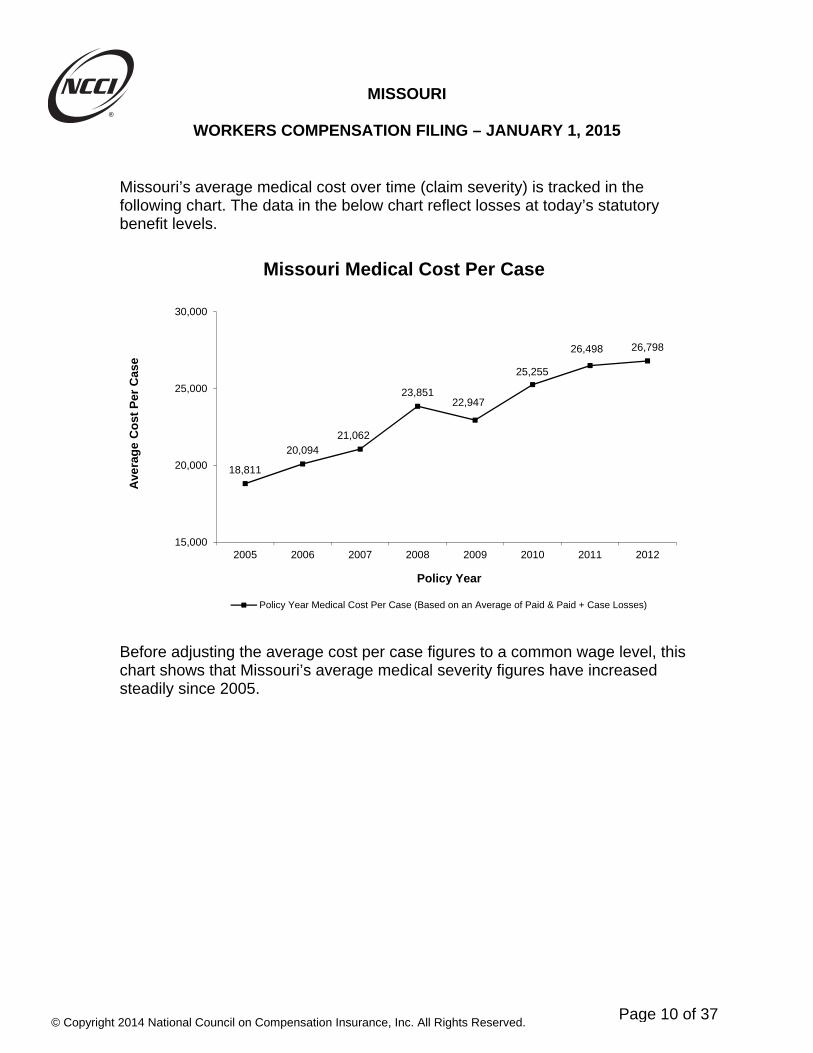
Missouri’s average medical cost over time (claim severity) is tracked in the following chart. The data in the below chart reflect losses at today’s statutory benefit levels.
Before adjusting the average cost per case figures to a common wage level, this chart shows that Missouri’s average medical severity figures have increased steadily since 2005.
18,811
20,094
21,062
23,85122,947
25,255
26,498 26,798
15,000
20,000
25,000
30,000
2005 2006 2007 2008 2009 2010 2011 2012
Ave
rag
e C
ost
Per
Cas
e
Policy Year
Missouri Medical Cost Per Case
Policy Year Medical Cost Per Case (Based on an Average of Paid & Paid + Case Losses)
© Copyright 2014 National Council on Compensation Insurance, Inc. All Rights Reserved.
Page 10 of 37

MISSOURI
WORKERS COMPENSATION FILING – JANUARY 1, 2015
After removing the impact of the growth in workers’ wages that occurred over this time period, the average medical cost per case in excess of wage growth is shown in the following chart.
The average Missouri medical cost per case in excess of wage growth has generally increased in the past eight policy years, as shown above. Considering the fact that 58% of the state’s benefits are medical, claims cost changes in this area can notably impact the workers compensation system. (Note: Unlike indemnity benefits, the level of workers compensation medical benefits is not directly based on average weekly wages. Even so, it is still instructive to review the changes in medical average cost per case in excess of wage growth—as this allows one to combine the change in the wage-adjusted medical average cost per case by the similarly-adjusted change in claim frequency in order to approximate the change over time in the overall medical loss ratios.)
22,22722,927 23,042
25,54424,576
26,56827,187 26,798
15,000
20,000
25,000
30,000
2005 2006 2007 2008 2009 2010 2011 2012
Ave
rag
e C
ost
Per
Cas
e
Policy Year
Missouri Medical Cost Per CaseAdjusted to Current Wage Level
Policy Year Medical Cost Per Case (Based on an Average of Paid & Paid + Case Losses)
© Copyright 2014 National Council on Compensation Insurance, Inc. All Rights Reserved.
Page 11 of 37

MISSOURI
WORKERS COMPENSATION FILING – JANUARY 1, 2015
The medical loss ratios below result after combining the observed changes in Missouri’s average claim frequency with the corresponding changes in the average medical cost per case. A medical loss ratio represents the proportion of premium dollars that are necessary to cover medical benefits on behalf of injured workers. The data in the chart reflect premiums at today’s loss costs and losses at today’s statutory benefit levels.
The medical loss ratio declined in the latest year. Policy year 2009 is notably down and is driven by a lack of large medical claims. In last year’s Missouri filing, NCCI proposed a medical trend factor of +0.5% per year. Based on our analysis this year, we are proposing to maintain the medical trend factor of +0.5% per year. This means that the rate of growth in medical benefits is once again expected to increase at a faster pace than workers’ wages.
0.4640.454 0.458
0.474
0.431
0.4890.472
0.448
0.20
0.30
0.40
0.50
0.60
2005 2006 2007 2008 2009 2010 2011 2012
Med
ical
Lo
ss R
atio
Policy Year
Missouri Medical Loss Ratio History
Policy Year Medical Loss Ratios (Based on an Average of Paid & Paid + Case Losses)
© Copyright 2014 National Council on Compensation Insurance, Inc. All Rights Reserved.
Page 12 of 37
MISSOURI
WORKERS COMPENSATION FILING – JANUARY 1, 2015
Key Components (Continued) Benefits Workers injured in Missouri receive wage replacement (indemnity) benefits at a rate of two-thirds of their pre-injury weekly wage. These benefits are subject to a weekly minimum and maximum. Each July 1, the minimum and maximum weekly benefits are updated based on Missouri’s most recent state average weekly wage. The latest increase in Missouri’s state average weekly wage is estimated to increase overall system costs by 0.2%. Loss Adjustment Expenses The proposed loss costs include a provision for loss adjustment expenses (LAE). LAE is included in the loss costs by using a ratio of loss adjustment expense dollars to loss dollars (called the LAE provision). After examining LAE indications based on both Missouri-specific data and countrywide data, NCCI is proposing to increase the currently approved LAE provision from 19.6% to 19.7% of losses.
© Copyright 2014 National Council on Compensation Insurance, Inc. All Rights Reserved.
Page 13 of 37

MISSOURI
WORKERS COMPENSATION FILING – JANUARY 1, 2015
Conclusion This filing document provides a high-level perspective in support of decreasing Missouri’s current loss cost levels by an average of –3.7%. Here are some of the key observations:
The financial data experience period evaluated as of December 31, 2013 shows notable improvement when compared with the experience period evaluated as of December 31, 2012 on which the previous filing was made. This notable improvement is primarily driven by the new experience policy year, 2012.
Lost-time claim frequency has continued to decline steadily.
Indemnity severity remains flat while the indemnity loss ratios have declined in the last eight policy years. The continued decline in indemnity loss ratios are most notably due to the decreasing trend in frequency.
Medical severity growth has abated in the latest year.
The following pages contain additional exhibits that may be of interest, as well as the proposed voluntary loss costs and rating values by classification.
Page 14 of 37
© Copyright 2014 National Council on Compensation Insurance, Inc. All Rights Reserved.

MISSOURI
WORKERS COMPENSATION FILING – JANUARY 1, 2015
EXHIBIT I
The chart above shows the average approved voluntary loss cost level changes in Missouri for each of the last five years.
-1.9%
-4.4%-3.0%
+2.1%
+11.6%
-10.0%
-5.0%
0.0%
5.0%
10.0%
15.0%
1/1/2010 1/1/2011 1/1/2012 1/1/2013 1/1/2014*
Ap
pro
ved
Ch
ang
e
Effective Date
MissouriHistorical Loss Cost Changes - NCCI Including
Trend
* 1/1/2014 loss cost level change includes a 3.8% increase due to the impact of Senate Bill 1
© Copyright 2014 National Council on Compensation Insurance, Inc. All Rights Reserved.
Page 15 of 37

MISSOURI
WORKERS COMPENSATION FILING – JANUARY 1, 2015
EXHIBIT II
This exhibit illustrates Missouri’s calendar year written premium totals for the latest ten years.
9641,008 1,003 986
882
744680
712769
826
0
200
400
600
800
1000
1200
2004 2005 2006 2007 2008 2009 2010 2011 2012 2013
Wri
tten
Pre
miu
m (
$ m
illio
ns)
Calendar Year
Missouri Written Premium
© Copyright 2014 National Council on Compensation Insurance, Inc. All Rights Reserved.
Page 16 of 37

MISSOURI
WORKERS COMPENSATION FILING – JANUARY 1, 2015
EXHIBIT III
The five largest insurance company groups providing workers compensation insurance in Missouri in 2013 are shown in this chart.
Missouri Employers Mutual Ins. Co.,
20.2%
Travelers Group, 13.6%
Liberty Mutual Group, 7.2%
Hartford Fire & Casualty Group, 6.0%Blue Cross & Blue
Shield of MI Group, 3.8%
All Other Carriers, 49.2%
MissouriLargest Workers Compensation Writers CY 2013
Source: NAIC Annual Statement Data
© Copyright 2014 National Council on Compensation Insurance, Inc. All Rights Reserved.
Page 17 of 37
MISSOURI
WORKERS COMPENSATION FILING – JANUARY 1, 2015
EXHIBIT IV
Proposed Voluntary Market Loss Costs and Rating Values – NCCI Including Trend
© Copyright 2014 National Council on Compensation Insurance, Inc. All Rights Reserved.
Page 18 of 37
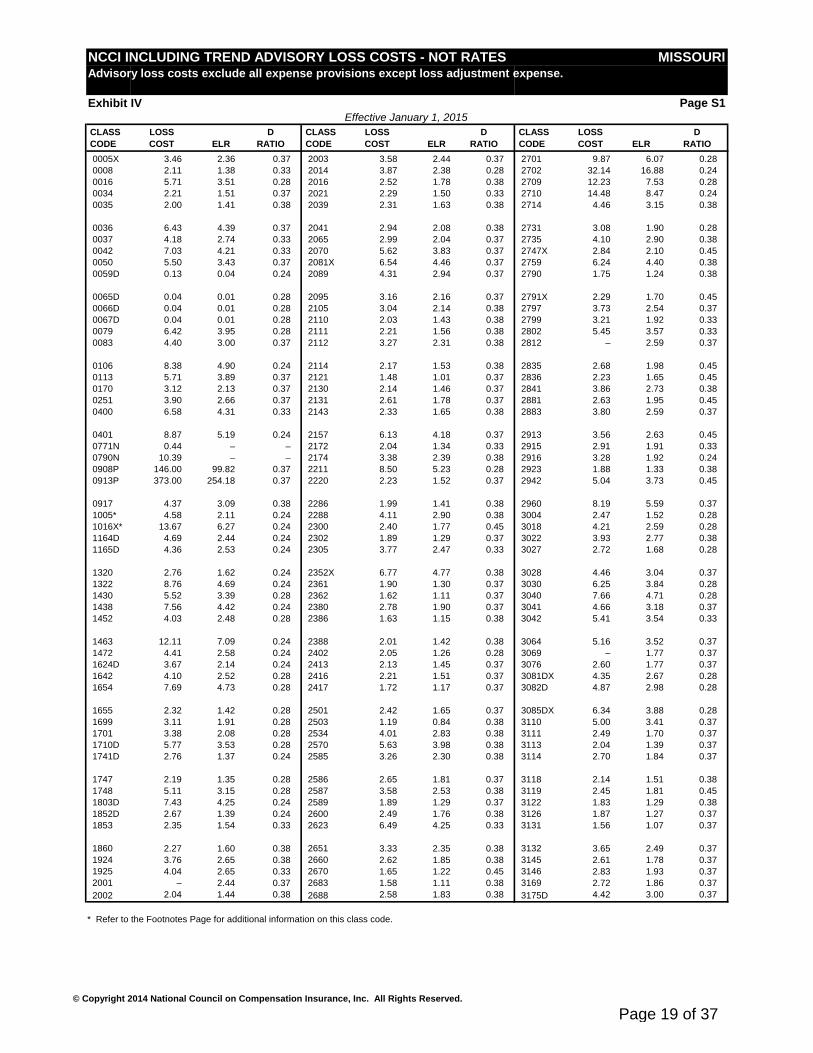
NCCI INCLUDING TREND ADVISORY LOSS COSTS - NOT RATES MISSOURIAdvisory loss costs exclude all expense provisions except loss adjustment expense.
Exhibit IV Page S1Effective January 1, 2015
CLASS LOSS D CLASS LOSS D CLASS LOSS D CODE COST ELR RATIO CODE COST ELR RATIO CODE COST ELR RATIO
0005X 3.46 2.36 0.37 2003 3.58 2.44 0.37 2701 9.87 6.07 0.28 0008 2.11 1.38 0.33 2014 3.87 2.38 0.28 2702 32.14 16.88 0.24 0016 5.71 3.51 0.28 2016 2.52 1.78 0.38 2709 12.23 7.53 0.28 0034 2.21 1.51 0.37 2021 2.29 1.50 0.33 2710 14.48 8.47 0.24 0035 2.00 1.41 0.38 2039 2.31 1.63 0.38 2714 4.46 3.15 0.38
0036 6.43 4.39 0.37 2041 2.94 2.08 0.38 2731 3.08 1.90 0.28 0037 4.18 2.74 0.33 2065 2.99 2.04 0.37 2735 4.10 2.90 0.38 0042 7.03 4.21 0.33 2070 5.62 3.83 0.37 2747X 2.84 2.10 0.45 0050 5.50 3.43 0.37 2081X 6.54 4.46 0.37 2759 6.24 4.40 0.38 0059D 0.13 0.04 0.24 2089 4.31 2.94 0.37 2790 1.75 1.24 0.38
0065D 0.04 0.01 0.28 2095 3.16 2.16 0.37 2791X 2.29 1.70 0.45 0066D 0.04 0.01 0.28 2105 3.04 2.14 0.38 2797 3.73 2.54 0.37 0067D 0.04 0.01 0.28 2110 2.03 1.43 0.38 2799 3.21 1.92 0.33 0079 6.42 3.95 0.28 2111 2.21 1.56 0.38 2802 5.45 3.57 0.33 0083 4.40 3.00 0.37 2112 3.27 2.31 0.38 2812 – 2.59 0.37
0106 8.38 4.90 0.24 2114 2.17 1.53 0.38 2835 2.68 1.98 0.45 0113 5.71 3.89 0.37 2121 1.48 1.01 0.37 2836 2.23 1.65 0.45 0170 3.12 2.13 0.37 2130 2.14 1.46 0.37 2841 3.86 2.73 0.38 0251 3.90 2.66 0.37 2131 2.61 1.78 0.37 2881 2.63 1.95 0.45 0400 6.58 4.31 0.33 2143 2.33 1.65 0.38 2883 3.80 2.59 0.37
0401 8.87 5.19 0.24 2157 6.13 4.18 0.37 2913 3.56 2.63 0.45 0771N 0.44 – – 2172 2.04 1.34 0.33 2915 2.91 1.91 0.33 0790N 10.39 – – 2174 3.38 2.39 0.38 2916 3.28 1.92 0.24 0908P 146.00 99.82 0.37 2211 8.50 5.23 0.28 2923 1.88 1.33 0.38 0913P 373.00 254.18 0.37 2220 2.23 1.52 0.37 2942 5.04 3.73 0.45
0917 4.37 3.09 0.38 2286 1.99 1.41 0.38 2960 8.19 5.59 0.37 1005* 4.58 2.11 0.24 2288 4.11 2.90 0.38 3004 2.47 1.52 0.28 1016X* 13.67 6.27 0.24 2300 2.40 1.77 0.45 3018 4.21 2.59 0.28 1164D 4.69 2.44 0.24 2302 1.89 1.29 0.37 3022 3.93 2.77 0.38 1165D 4.36 2.53 0.24 2305 3.77 2.47 0.33 3027 2.72 1.68 0.28
1320 2.76 1.62 0.24 2352X 6.77 4.77 0.38 3028 4.46 3.04 0.37 1322 8.76 4.69 0.24 2361 1.90 1.30 0.37 3030 6.25 3.84 0.28 1430 5.52 3.39 0.28 2362 1.62 1.11 0.37 3040 7.66 4.71 0.28 1438 7.56 4.42 0.24 2380 2.78 1.90 0.37 3041 4.66 3.18 0.37 1452 4.03 2.48 0.28 2386 1.63 1.15 0.38 3042 5.41 3.54 0.33
1463 12.11 7.09 0.24 2388 2.01 1.42 0.38 3064 5.16 3.52 0.37 1472 4.41 2.58 0.24 2402 2.05 1.26 0.28 3069 – 1.77 0.37 1624D 3.67 2.14 0.24 2413 2.13 1.45 0.37 3076 2.60 1.77 0.37 1642 4.10 2.52 0.28 2416 2.21 1.51 0.37 3081DX 4.35 2.67 0.28 1654 7.69 4.73 0.28 2417 1.72 1.17 0.37 3082D 4.87 2.98 0.28
1655 2.32 1.42 0.28 2501 2.42 1.65 0.37 3085DX 6.34 3.88 0.28 1699 3.11 1.91 0.28 2503 1.19 0.84 0.38 3110 5.00 3.41 0.37 1701 3.38 2.08 0.28 2534 4.01 2.83 0.38 3111 2.49 1.70 0.37 1710D 5.77 3.53 0.28 2570 5.63 3.98 0.38 3113 2.04 1.39 0.37 1741D 2.76 1.37 0.24 2585 3.26 2.30 0.38 3114 2.70 1.84 0.37
1747 2.19 1.35 0.28 2586 2.65 1.81 0.37 3118 2.14 1.51 0.38 1748 5.11 3.15 0.28 2587 3.58 2.53 0.38 3119 2.45 1.81 0.45 1803D 7.43 4.25 0.24 2589 1.89 1.29 0.37 3122 1.83 1.29 0.38 1852D 2.67 1.39 0.24 2600 2.49 1.76 0.38 3126 1.87 1.27 0.37 1853 2.35 1.54 0.33 2623 6.49 4.25 0.33 3131 1.56 1.07 0.37
1860 2.27 1.60 0.38 2651 3.33 2.35 0.38 3132 3.65 2.49 0.37 1924 3.76 2.65 0.38 2660 2.62 1.85 0.38 3145 2.61 1.78 0.37 1925 4.04 2.65 0.33 2670 1.65 1.22 0.45 3146 2.83 1.93 0.37 2001 – 2.44 0.37 2683 1.58 1.11 0.38 3169 2.72 1.86 0.37 2002 2.04 1.44 0.38 2688 2.58 1.83 0.38 3175D 4.42 3.00 0.37
* Refer to the Footnotes Page for additional information on this class code.
© Copyright 2014 National Council on Compensation Insurance, Inc. All Rights Reserved.
Page 19 of 37

NCCI INCLUDING TREND ADVISORY LOSS COSTS - NOT RATES MISSOURIAdvisory loss costs exclude all expense provisions except loss adjustment expense.
Exhibit IV Page S2Effective January 1, 2015
CLASS LOSS D CLASS LOSS D CLASS LOSS D CODE COST ELR RATIO CODE COST ELR RATIO CODE COST ELR RATIO
3179 2.87 2.03 0.38 3851 7.34 5.18 0.38 4511 0.36 0.23 0.33 3180 1.90 1.34 0.38 3865 1.58 1.17 0.45 4557 2.54 1.79 0.38 3188 1.99 1.41 0.38 3881 4.78 3.26 0.37 4558 1.55 1.06 0.37 3220 1.98 1.35 0.37 4000 4.91 2.87 0.24 4561 – 1.60 0.33 3223 5.09 3.77 0.45 4018DX 4.49 2.73 0.28 4568 3.75 2.31 0.28
3224 3.48 2.45 0.38 4021 5.56 3.42 0.28 4581 0.94 0.55 0.24 3227 3.08 2.18 0.38 4034 6.97 4.29 0.28 4583 4.49 2.62 0.24 3240 2.11 1.49 0.38 4036 1.92 1.18 0.28 4597X 1.07 0.75 0.38 3241 3.91 2.66 0.37 4038 4.64 3.43 0.45 4611 0.94 0.66 0.38 3255 2.04 1.51 0.45 4053 2.23 1.52 0.37 4635 2.57 1.35 0.24
3257 3.05 2.08 0.37 4061 4.76 3.36 0.38 4653 1.92 1.36 0.38 3270 5.25 3.58 0.37 4062 1.81 1.23 0.37 4665 9.33 5.74 0.28 3300 4.13 2.81 0.37 4101 3.21 2.10 0.33 4670 6.58 4.05 0.28 3303 2.81 1.98 0.38 4109 1.29 0.91 0.38 4683 3.23 2.20 0.37 3307 5.15 3.51 0.37 4110 3.11 2.12 0.36 4686 2.29 1.41 0.28
3315 3.49 2.46 0.38 4111 3.28 2.32 0.38 4692 0.57 0.40 0.38 3334 2.60 1.77 0.37 4112 – 2.12 0.36 4693 0.61 0.42 0.37 3336 2.75 1.69 0.28 4113 1.51 1.03 0.37 4703 2.49 1.70 0.37 3365 6.88 3.87 0.28 4114 3.33 2.27 0.37 4716X 4.23 2.99 0.38 3372 3.18 2.08 0.33 4130 4.40 3.00 0.37 4717 2.04 1.51 0.45
3373 7.45 5.08 0.37 4131 3.04 2.14 0.38 4720 1.92 1.31 0.37 3383 1.48 1.05 0.38 4133 1.99 1.41 0.38 4740 1.09 0.67 0.28 3385 0.72 0.51 0.38 4149 0.93 0.69 0.45 4741 2.20 1.50 0.37 3400 3.78 2.48 0.33 4150 – 0.69 0.45 4751 2.65 1.63 0.28 3507 3.41 2.32 0.37 4206 3.13 2.13 0.37 4771N 2.48 1.30 0.24
3515 2.05 1.40 0.37 4207 1.55 0.96 0.28 4777 4.27 2.24 0.24 3548 1.58 1.07 0.37 4239 2.72 1.68 0.28 4825 0.80 0.49 0.28 3559 2.80 1.91 0.37 4240 2.12 1.50 0.38 4828 2.27 1.49 0.33 3574 1.16 0.82 0.38 4243 2.39 1.63 0.37 4829 1.12 0.66 0.24 3581 1.54 1.09 0.38 4244 3.78 2.58 0.37 4902 3.84 2.71 0.38
3612 1.98 1.30 0.33 4250 1.58 1.07 0.37 4923 1.46 1.00 0.37 3620X 4.11 2.53 0.28 4251 4.01 2.73 0.37 4940X 1.92 1.18 0.28 3629 1.58 1.11 0.38 4263 3.94 2.69 0.37 5020 4.24 2.39 0.28 3632X 3.33 2.18 0.33 4273 2.57 1.75 0.37 5022 7.40 3.96 0.24 3634 1.41 1.00 0.38 4279 2.98 2.03 0.37 5037 23.76 11.40 0.24
3635 3.16 2.16 0.37 4282 2.24 1.58 0.38 5040 18.74 9.00 0.24 3638 3.09 2.19 0.38 4283 2.80 1.91 0.37 5057 6.66 3.20 0.24 3642 1.26 0.86 0.37 4299 2.31 1.63 0.38 5059 30.95 14.86 0.24 3643 2.62 1.79 0.37 4304 4.87 3.19 0.33 5067X 10.67 5.12 0.24 3647 2.92 1.91 0.33 4307 2.05 1.52 0.45 5069 25.22 12.10 0.24
3648 1.68 1.19 0.38 4351 1.07 0.73 0.37 5102 6.75 3.61 0.24 3681 0.97 0.69 0.38 4352 1.63 1.15 0.38 5146 5.45 3.06 0.28 3685 1.18 0.83 0.38 4360 0.93 0.65 0.38 5160 3.07 1.65 0.24 3719 3.46 1.66 0.24 4361 0.98 0.69 0.38 5183 4.06 2.28 0.28 3724 4.84 2.59 0.24 4362 – 0.65 0.38 5188 3.46 1.94 0.28
3726 5.87 2.82 0.24 4410 3.88 2.65 0.37 5190 3.37 1.89 0.28 3803 2.60 1.77 0.37 4420 3.92 2.29 0.24 5191 0.89 0.60 0.37 3807 2.28 1.61 0.38 4431 1.38 1.02 0.45 5192 2.63 1.79 0.37 3808 3.89 2.55 0.33 4432 1.59 1.17 0.45 5213X 6.45 3.45 0.24 3821 4.97 3.26 0.33 4439 2.45 1.60 0.33 5215 5.34 3.20 0.33
3822X 6.40 4.19 0.33 4452 2.80 1.91 0.37 5221X 5.56 3.12 0.28 3824X 5.57 3.65 0.33 4459 2.28 1.56 0.37 5222 8.97 4.80 0.24 3826 0.93 0.63 0.37 4470 2.11 1.44 0.37 5223 6.65 3.74 0.28 3827 2.27 1.49 0.33 4484 2.74 1.86 0.37 5348 6.12 3.44 0.28 3830 0.72 0.47 0.33 4493 3.49 2.38 0.37 5402 3.65 2.36 0.38
* Refer to the Footnotes Page for additional information on this class code.
© Copyright 2014 National Council on Compensation Insurance, Inc. All Rights Reserved.
Page 20 of 37
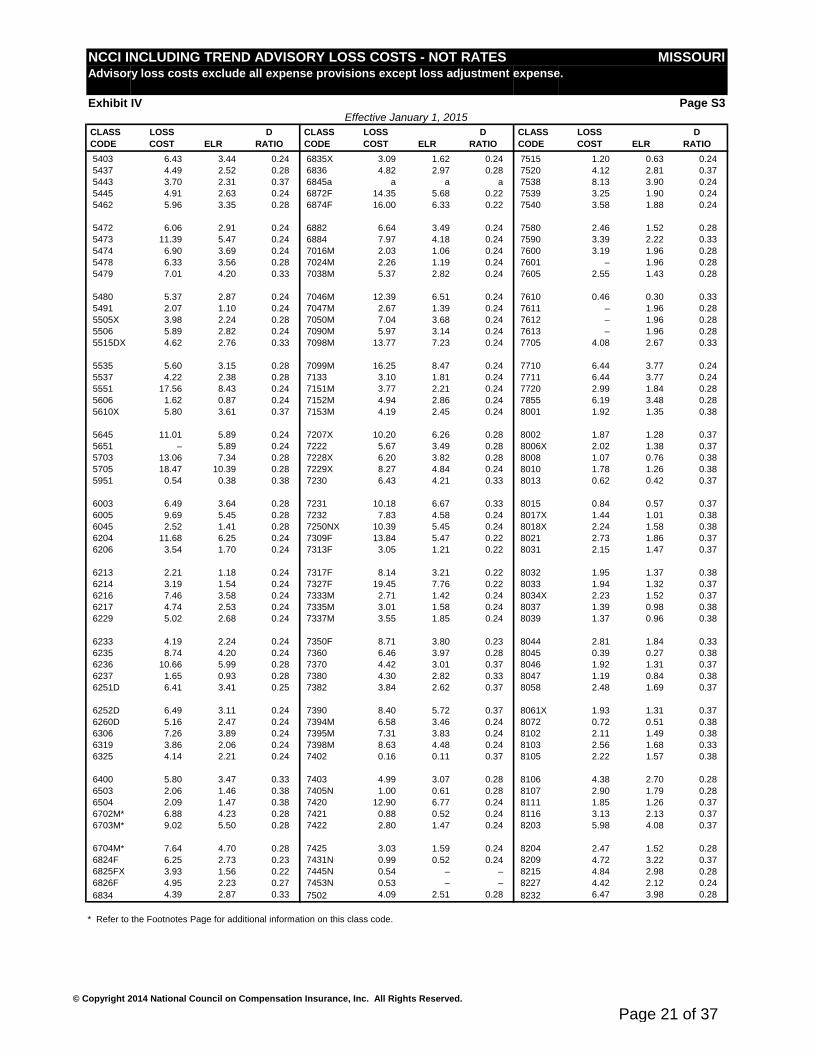
NCCI INCLUDING TREND ADVISORY LOSS COSTS - NOT RATES MISSOURIAdvisory loss costs exclude all expense provisions except loss adjustment expense.
Exhibit IV Page S3Effective January 1, 2015
CLASS LOSS D CLASS LOSS D CLASS LOSS D CODE COST ELR RATIO CODE COST ELR RATIO CODE COST ELR RATIO
5403 6.43 3.44 0.24 6835X 3.09 1.62 0.24 7515 1.20 0.63 0.24 5437 4.49 2.52 0.28 6836 4.82 2.97 0.28 7520 4.12 2.81 0.37 5443 3.70 2.31 0.37 6845a a a a 7538 8.13 3.90 0.24 5445 4.91 2.63 0.24 6872F 14.35 5.68 0.22 7539 3.25 1.90 0.24 5462 5.96 3.35 0.28 6874F 16.00 6.33 0.22 7540 3.58 1.88 0.24
5472 6.06 2.91 0.24 6882 6.64 3.49 0.24 7580 2.46 1.52 0.28 5473 11.39 5.47 0.24 6884 7.97 4.18 0.24 7590 3.39 2.22 0.33 5474 6.90 3.69 0.24 7016M 2.03 1.06 0.24 7600 3.19 1.96 0.28 5478 6.33 3.56 0.28 7024M 2.26 1.19 0.24 7601 – 1.96 0.28 5479 7.01 4.20 0.33 7038M 5.37 2.82 0.24 7605 2.55 1.43 0.28
5480 5.37 2.87 0.24 7046M 12.39 6.51 0.24 7610 0.46 0.30 0.33 5491 2.07 1.10 0.24 7047M 2.67 1.39 0.24 7611 – 1.96 0.28 5505X 3.98 2.24 0.28 7050M 7.04 3.68 0.24 7612 – 1.96 0.28 5506 5.89 2.82 0.24 7090M 5.97 3.14 0.24 7613 – 1.96 0.28 5515DX 4.62 2.76 0.33 7098M 13.77 7.23 0.24 7705 4.08 2.67 0.33
5535 5.60 3.15 0.28 7099M 16.25 8.47 0.24 7710 6.44 3.77 0.24 5537 4.22 2.38 0.28 7133 3.10 1.81 0.24 7711 6.44 3.77 0.24 5551 17.56 8.43 0.24 7151M 3.77 2.21 0.24 7720 2.99 1.84 0.28 5606 1.62 0.87 0.24 7152M 4.94 2.86 0.24 7855 6.19 3.48 0.28 5610X 5.80 3.61 0.37 7153M 4.19 2.45 0.24 8001 1.92 1.35 0.38
5645 11.01 5.89 0.24 7207X 10.20 6.26 0.28 8002 1.87 1.28 0.37 5651 – 5.89 0.24 7222 5.67 3.49 0.28 8006X 2.02 1.38 0.37 5703 13.06 7.34 0.28 7228X 6.20 3.82 0.28 8008 1.07 0.76 0.38 5705 18.47 10.39 0.28 7229X 8.27 4.84 0.24 8010 1.78 1.26 0.38 5951 0.54 0.38 0.38 7230 6.43 4.21 0.33 8013 0.62 0.42 0.37
6003 6.49 3.64 0.28 7231 10.18 6.67 0.33 8015 0.84 0.57 0.37 6005 9.69 5.45 0.28 7232 7.83 4.58 0.24 8017X 1.44 1.01 0.38 6045 2.52 1.41 0.28 7250NX 10.39 5.45 0.24 8018X 2.24 1.58 0.38 6204 11.68 6.25 0.24 7309F 13.84 5.47 0.22 8021 2.73 1.86 0.37 6206 3.54 1.70 0.24 7313F 3.05 1.21 0.22 8031 2.15 1.47 0.37
6213 2.21 1.18 0.24 7317F 8.14 3.21 0.22 8032 1.95 1.37 0.38 6214 3.19 1.54 0.24 7327F 19.45 7.76 0.22 8033 1.94 1.32 0.37 6216 7.46 3.58 0.24 7333M 2.71 1.42 0.24 8034X 2.23 1.52 0.37 6217 4.74 2.53 0.24 7335M 3.01 1.58 0.24 8037 1.39 0.98 0.38 6229 5.02 2.68 0.24 7337M 3.55 1.85 0.24 8039 1.37 0.96 0.38
6233 4.19 2.24 0.24 7350F 8.71 3.80 0.23 8044 2.81 1.84 0.33 6235 8.74 4.20 0.24 7360 6.46 3.97 0.28 8045 0.39 0.27 0.38 6236 10.66 5.99 0.28 7370 4.42 3.01 0.37 8046 1.92 1.31 0.37 6237 1.65 0.93 0.28 7380 4.30 2.82 0.33 8047 1.19 0.84 0.38 6251D 6.41 3.41 0.25 7382 3.84 2.62 0.37 8058 2.48 1.69 0.37
6252D 6.49 3.11 0.24 7390 8.40 5.72 0.37 8061X 1.93 1.31 0.37 6260D 5.16 2.47 0.24 7394M 6.58 3.46 0.24 8072 0.72 0.51 0.38 6306 7.26 3.89 0.24 7395M 7.31 3.83 0.24 8102 2.11 1.49 0.38 6319 3.86 2.06 0.24 7398M 8.63 4.48 0.24 8103 2.56 1.68 0.33 6325 4.14 2.21 0.24 7402 0.16 0.11 0.37 8105 2.22 1.57 0.38
6400 5.80 3.47 0.33 7403 4.99 3.07 0.28 8106 4.38 2.70 0.28 6503 2.06 1.46 0.38 7405N 1.00 0.61 0.28 8107 2.90 1.79 0.28 6504 2.09 1.47 0.38 7420 12.90 6.77 0.24 8111 1.85 1.26 0.37 6702M* 6.88 4.23 0.28 7421 0.88 0.52 0.24 8116 3.13 2.13 0.37 6703M* 9.02 5.50 0.28 7422 2.80 1.47 0.24 8203 5.98 4.08 0.37
6704M* 7.64 4.70 0.28 7425 3.03 1.59 0.24 8204 2.47 1.52 0.28 6824F 6.25 2.73 0.23 7431N 0.99 0.52 0.24 8209 4.72 3.22 0.37 6825FX 3.93 1.56 0.22 7445N 0.54 – – 8215 4.84 2.98 0.28 6826F 4.95 2.23 0.27 7453N 0.53 – – 8227 4.42 2.12 0.24 6834 4.39 2.87 0.33 7502 4.09 2.51 0.28 8232 6.47 3.98 0.28
* Refer to the Footnotes Page for additional information on this class code.
© Copyright 2014 National Council on Compensation Insurance, Inc. All Rights Reserved.
Page 21 of 37
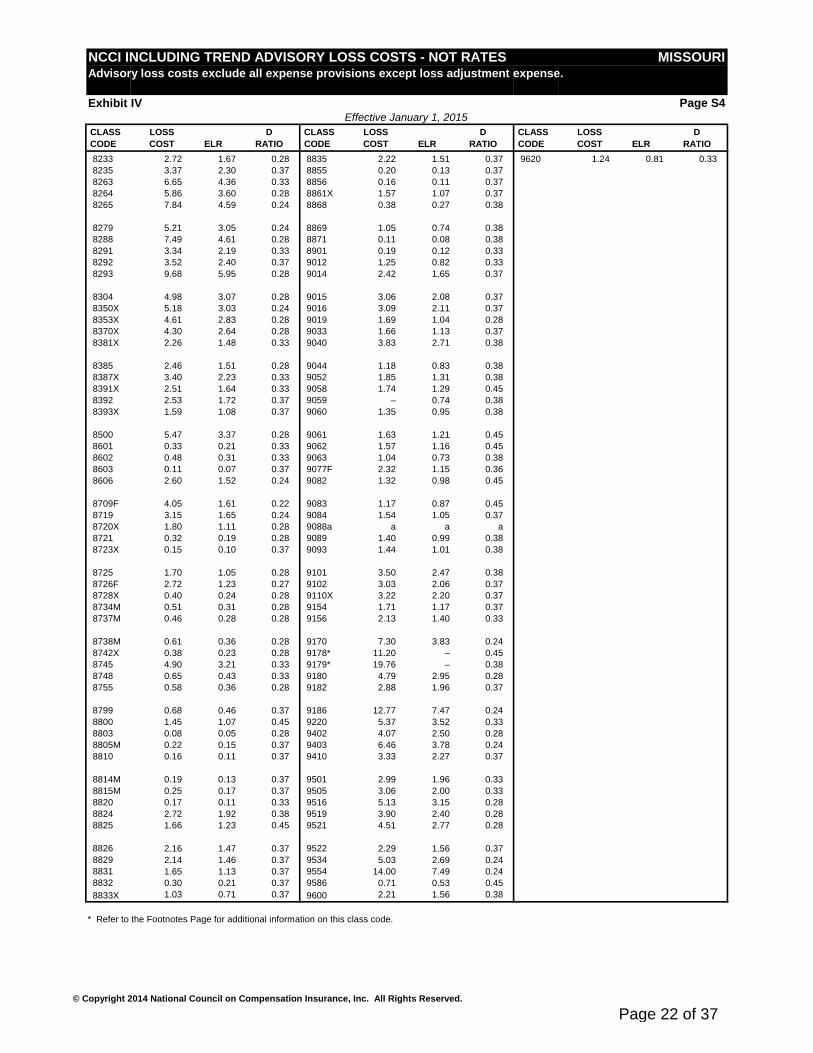
NCCI INCLUDING TREND ADVISORY LOSS COSTS - NOT RATES MISSOURIAdvisory loss costs exclude all expense provisions except loss adjustment expense.
Exhibit IV Page S4Effective January 1, 2015
CLASS LOSS D CLASS LOSS D CLASS LOSS D CODE COST ELR RATIO CODE COST ELR RATIO CODE COST ELR RATIO
8233 2.72 1.67 0.28 8835 2.22 1.51 0.37 9620 1.24 0.81 0.33 8235 3.37 2.30 0.37 8855 0.20 0.13 0.37 8263 6.65 4.36 0.33 8856 0.16 0.11 0.37 8264 5.86 3.60 0.28 8861X 1.57 1.07 0.37 8265 7.84 4.59 0.24 8868 0.38 0.27 0.38
8279 5.21 3.05 0.24 8869 1.05 0.74 0.38 8288 7.49 4.61 0.28 8871 0.11 0.08 0.38 8291 3.34 2.19 0.33 8901 0.19 0.12 0.33 8292 3.52 2.40 0.37 9012 1.25 0.82 0.33 8293 9.68 5.95 0.28 9014 2.42 1.65 0.37
8304 4.98 3.07 0.28 9015 3.06 2.08 0.37 8350X 5.18 3.03 0.24 9016 3.09 2.11 0.37 8353X 4.61 2.83 0.28 9019 1.69 1.04 0.28 8370X 4.30 2.64 0.28 9033 1.66 1.13 0.37 8381X 2.26 1.48 0.33 9040 3.83 2.71 0.38
8385 2.46 1.51 0.28 9044 1.18 0.83 0.38 8387X 3.40 2.23 0.33 9052 1.85 1.31 0.38 8391X 2.51 1.64 0.33 9058 1.74 1.29 0.45 8392 2.53 1.72 0.37 9059 – 0.74 0.38 8393X 1.59 1.08 0.37 9060 1.35 0.95 0.38
8500 5.47 3.37 0.28 9061 1.63 1.21 0.45 8601 0.33 0.21 0.33 9062 1.57 1.16 0.45 8602 0.48 0.31 0.33 9063 1.04 0.73 0.38 8603 0.11 0.07 0.37 9077F 2.32 1.15 0.36 8606 2.60 1.52 0.24 9082 1.32 0.98 0.45
8709F 4.05 1.61 0.22 9083 1.17 0.87 0.45 8719 3.15 1.65 0.24 9084 1.54 1.05 0.37 8720X 1.80 1.11 0.28 9088a a a a 8721 0.32 0.19 0.28 9089 1.40 0.99 0.38 8723X 0.15 0.10 0.37 9093 1.44 1.01 0.38
8725 1.70 1.05 0.28 9101 3.50 2.47 0.38 8726F 2.72 1.23 0.27 9102 3.03 2.06 0.37 8728X 0.40 0.24 0.28 9110X 3.22 2.20 0.37 8734M 0.51 0.31 0.28 9154 1.71 1.17 0.37 8737M 0.46 0.28 0.28 9156 2.13 1.40 0.33
8738M 0.61 0.36 0.28 9170 7.30 3.83 0.24 8742X 0.38 0.23 0.28 9178* 11.20 – 0.45 8745 4.90 3.21 0.33 9179* 19.76 – 0.38 8748 0.65 0.43 0.33 9180 4.79 2.95 0.28 8755 0.58 0.36 0.28 9182 2.88 1.96 0.37
8799 0.68 0.46 0.37 9186 12.77 7.47 0.24 8800 1.45 1.07 0.45 9220 5.37 3.52 0.33 8803 0.08 0.05 0.28 9402 4.07 2.50 0.28 8805M 0.22 0.15 0.37 9403 6.46 3.78 0.24 8810 0.16 0.11 0.37 9410 3.33 2.27 0.37
8814M 0.19 0.13 0.37 9501 2.99 1.96 0.33 8815M 0.25 0.17 0.37 9505 3.06 2.00 0.33 8820 0.17 0.11 0.33 9516 5.13 3.15 0.28 8824 2.72 1.92 0.38 9519 3.90 2.40 0.28 8825 1.66 1.23 0.45 9521 4.51 2.77 0.28
8826 2.16 1.47 0.37 9522 2.29 1.56 0.37 8829 2.14 1.46 0.37 9534 5.03 2.69 0.24 8831 1.65 1.13 0.37 9554 14.00 7.49 0.24 8832 0.30 0.21 0.37 9586 0.71 0.53 0.45 8833X 1.03 0.71 0.37 9600 2.21 1.56 0.38
* Refer to the Footnotes Page for additional information on this class code.
© Copyright 2014 National Council on Compensation Insurance, Inc. All Rights Reserved.
Page 22 of 37

WORKERS COMPENSATION AND EMPLOYERS LIABILITY MISSOURIExhibit IV
Page S5
Effective January 1, 2015 Exhibit IV:NCCI Including Trend
FOOTNOTES
a Advisory loss cost for each individual risk must be obtained from NCCI Customer Service or the Rating Organizationhaving jurisdiction.
D Advisory loss cost for classification already includes the specific disease loading shown in the table below. See Basic Manual Rule 3-A-7.
Code No.Disease Loading Symbol Code No.
Disease Loading Symbol Code No.
Disease Loading Symbol
0059D 0.13 S 1710D 0.03 S 3175D 0.02 S0065D 0.04 S 1741D 0.15 S 4018DX 0.05 S0066D 0.04 S 1803D 0.16 S 5515DX 0.01 S0067D 0.04 S 1852D 0.03 Asb 6251D 0.02 S1164D 0.04 S 3081DX 0.02 S 6252D 0.02 S1165D 0.03 S 3082D 0.03 S 6260D 0.01 S1624D 0.01 S 3085DX 0.04 S,LS=Silica, Asb=Asbestos, L=Lead
F Advisory loss cost provides for coverage under the United States Longshore and Harbor Workers CompensationAct and its extensions. Loss cost contains a provision for the USL&HW Assessment.
M Risks are subject to Admiralty Law or Federal Employers Liability Act (FELA). However, the published loss cost is for risks that voluntarily purchase standard workers compensation and employers liability coverage. A provision for the USL&HW Assessment is included for those classifications under Program II USL Act.
N This code is part of a ratable / non-ratable group shown below. The statistical non-ratable code and correspondingadvisory loss cost are applied in addition to the basic classification when determining premium.
Class Non-RatableCode Element Code4771 07717250 07907405 74457431 7453
P Classification is computed on a per capita basis.
X Refer to special classification phraseology in these pages which is applicable in this state.
* Class Codes with Specific Footnotes
1005 Advisory loss cost includes a non-ratable disease element of $0.57. (For coverage written separately for federalbenefits only, $0.56. For coverage written separately for state benefits only, $0.01.)
1016 Advisory loss cost includes a non-ratable disease element of $1.72. (For coverage written separately for federalbenefits only, $1.68. For coverage written separately for state benefits only, $0.04.)
6702 Loss cost and rating values only appropriate for laying or relaying of tracks or maintenance of way - no work on elevated railroads. Otherwise, assign appropriate construction or erection code loss cost and elr each x 1.215.
6703 Loss cost and rating values only appropriate for laying or relaying of tracks or maintenance of way - no work on elevated railroads. Otherwise, assign appropriate construction or erection class loss cost x 1.593 and elr x 1.581.
6704 Loss cost and rating values only appropriate for laying or relaying of tracks or maintenance of way - no work onelevated railroads. Otherwise, assign appropriate construction or erection class loss cost and elr each x 1.35.
9178 ELR of 12.63 will be applied to polices in the experience rating period that were effective prior to 1/1/2010. As a result of the increase in maximum payroll for this class, an ELR of 8.30 will be applied to any policies in the experience rating period that are effective 1/1/2010 or subsequent.
9179 ELR of 21.25 will be applied to polices in the experience rating period that were effective prior to 1/1/2010. As a result of the increase in maximum payroll for this class, an ELR of 13.96 will be applied to any policies in the experience rating period that are effective 1/1/2010 or subsequent.
© Copyright 2014 National Council on Compensation Insurance, Inc. All Rights Reserved.
Page 23 of 37

WORKERS COMPENSATION AND EMPLOYERS LIABILITY MISSOURIExhibit IV
Page S6Effective January 1, 2015
ADVISORY MISCELLANEOUS VALUES
Deductible HAZARD GROUPAmount A B C D E F G
$100 1.1% 0.8% 0.7% 0.5% 0.3% 0.2% 0.2%$200 2.1% 1.6% 1.3% 0.9% 0.7% 0.5% 0.5%$300 3.0% 2.3% 1.8% 1.4% 1.0% 0.7% 0.7%$400 3.9% 2.9% 2.4% 1.8% 1.3% 0.9% 0.9%$500 4.7% 3.6% 2.9% 2.1% 1.6% 1.1% 1.1%
$1,000 8.0% 6.1% 5.0% 3.8% 2.8% 2.0% 1.9%$1,500 10.5% 8.1% 6.7% 5.1% 3.8% 2.8% 2.6%$2,000 12.5% 9.8% 8.1% 6.2% 4.8% 3.5% 3.2%$2,500 14.3% 11.3% 9.4% 7.3% 5.6% 4.2% 3.8%$5,000 21.0% 16.9% 14.4% 11.5% 9.2% 7.1% 6.3%
$10,000 29.8% 24.6% 21.5% 17.8% 14.6% 11.8% 10.2%$15,000 36.3% 30.4% 27.1% 22.8% 19.1% 15.8% 13.6%$20,000 41.5% 35.1% 31.7% 27.0% 22.9% 19.2% 16.5%
Basis of premium applicable in accordance with Basic Manual footnote instructions for Code 7370 --"Taxicab Co.":
Employee operated vehicle………………………………………………………………………………… $64,000Leased or rented vehicle…………………………………………………………………………………… $42,600
9178 -- "Athletic Sports or Park: Non-Contact Sports," and Code 9179 -- "Athletic Sports or Park:Contact Sports" ...................................................................................................................................................... $800
Partners and Sole Proprietors in accordance with Basic Manual Rule 2-E (Annual Payroll) ………………… $38,400
Terrorism - (Advisory Loss Cost) ….…………………………………………………………………………………… 0.01
United States Longshore and Harbor Workers' Compensation Coverage Percentage applicableonly in connection with Basic Manual Rule 3-A-4……………………………………………….…………….……… 44%
Experience Rating Eligibility
Advisory Loss Elimination Ratios - The following percentages are applicable by deductible amount and hazard group for total losses on a per occurrence basis. They do not include a safety factor.
A risk is eligible for intrastate experience rating when the payrolls or other exposures developed in the last year or last two years of the experience period produced a premium of at least $7,000. If more than two years, an average annual premium of at least $3,500 is required. The Experience Rating Plan Manual should be referenced for the latest approved eligibility amounts by state.
(Multiply a Non-F classification loss cost by a factor of 1.44 to adjust for differences in benefits and loss-based expenses. This factor is the product of the adjustment for differences in benefits (1.36) and the adjustment for differences in loss-based expenses (1.058).)
Total Losses
Maximum Weekly Payroll applicable in accordance with the Basic Manual footnote instructions for Code
Premium Determination for Executive Officers, Members of Limited Liability Companies,
© Copyright 2014 National Council on Compensation Insurance, Inc. All Rights Reserved.
Page 24 of 37

EXPERIENCE RATING PLAN MANUAL MISSOURIExhibit IV
Effective January 1, 2015 Page S7TABLE OF WEIGHTING VALUESAPPLICABLE TO ALL POLICIESExperience Rating Program - ERA
Expected Weighting Expected WeightingLosses Values Losses Values
0 -- 2,356 0.04 1,328,501 -- 1,401,780 0.442,357 -- 9,523 0.05 1,401,781 -- 1,479,303 0.459,524 -- 16,844 0.06 1,479,304 -- 1,561,448 0.46
16,845 -- 24,324 0.07 1,561,449 -- 1,648,643 0.4724,325 -- 31,967 0.08 1,648,644 -- 1,741,370 0.48
31,968 -- 53,467 0.09 1,741,371 -- 1,840,172 0.4953,468 -- 79,588 0.10 1,840,173 -- 1,945,668 0.5079,589 -- 102,823 0.11 1,945,669 -- 2,058,563 0.51
102,824 -- 125,445 0.12 2,058,564 -- 2,179,664 0.52125,446 -- 148,071 0.13 2,179,665 -- 2,309,900 0.53
148,072 -- 170,976 0.14 2,309,901 -- 2,450,347 0.54170,977 -- 194,314 0.15 2,450,348 -- 2,602,255 0.55194,315 -- 218,191 0.16 2,602,256 -- 2,767,087 0.56218,192 -- 242,687 0.17 2,767,088 -- 2,946,567 0.57242,688 -- 267,867 0.18 2,946,568 -- 3,142,739 0.58
267,868 -- 293,791 0.19 3,142,740 -- 3,358,047 0.59293,792 -- 320,516 0.20 3,358,048 -- 3,595,433 0.60320,517 -- 348,095 0.21 3,595,434 -- 3,858,478 0.61348,096 -- 376,585 0.22 3,858,479 -- 4,151,583 0.62376,586 -- 406,043 0.23 4,151,584 -- 4,480,211 0.63
406,044 -- 436,526 0.24 4,480,212 -- 4,851,239 0.64436,527 -- 468,097 0.25 4,851,240 -- 5,273,439 0.65468,098 -- 500,822 0.26 5,273,440 -- 5,758,184 0.66500,823 -- 534,770 0.27 5,758,185 -- 6,320,483 0.67534,771 -- 570,016 0.28 6,320,484 -- 6,980,570 0.68
570,017 -- 606,639 0.29 6,980,571 -- 7,766,383 0.69606,640 -- 644,725 0.30 7,766,384 -- 8,717,625 0.70644,726 -- 684,366 0.31 8,717,626 -- 9,892,684 0.71684,367 -- 725,663 0.32 9,892,685 -- 11,381,087 0.72725,664 -- 768,724 0.33 11,381,088 -- 13,327,454 0.73
768,725 -- 813,665 0.34 13,327,455 -- 15,981,584 0.74813,666 -- 860,617 0.35 15,981,585 -- 19,815,319 0.75860,618 -- 909,717 0.36 19,815,320 -- 25,839,750 0.76909,718 -- 961,118 0.37 25,839,751 -- 36,683,714 0.77961,119 -- 1,014,989 0.38 36,683,715 -- 61,986,274 0.78
1,014,990 -- 1,071,512 0.39 61,986,275 -- 188,499,016 0.791,071,513 -- 1,130,889 0.40 188,499,017 AND OVER 0.801,130,890 -- 1,193,344 0.411,193,345 -- 1,259,123 0.421,259,124 -- 1,328,500 0.43
(a) G . . . . . . . . . . . . . . . . . . . . . . . . . . . . . . . . . . . . . . . . . . . . . . . . . . . . . . . . . . . . . . . . . . . 11.25 (b) State Per Claim Accident Limitation . . . . . . . . . . . . . . . . . . . . . . . . . . . . . . . . . . . . . . . . $281,000(c) State Multiple Claim Accident Limitation . . . . . . . . . . . . . . . . . . . . . . . . . . . . . . . . . . . . . . . . $562,000(d) USL&HW Per Claim Accident Limitation . . . . . . . . . . . . . . . . . . . . . . . . . . . . . . . . . . . . . . . . $475,500(e) USL&HW Multiple Claim Accident Limitation . . . . . . . . . . . . . . . . . . . . . . . . . . . . . . . . . . . . . $951,000(f) Employers Liability Accident Limitation . . . . . . . . . . . . . . . . . . . . . . . . . . . . . . . . . . . . . . . . $55,000(g) Primary/Excess Loss Split Point . . . . . . . . . . . . . . . . . . . . . . . . . . . . . . . . . . . . . . . . . . . . . . $13,500(h) USL&HW Act -- Expected Loss Factor -- Non-F Classes . . . . . . . . . . . . . . . . . . . . . . . . . . . . 1.42(Multiply a Non-F classification ELR by the USL&HW Act - Expected Loss Factor of 1.42.)
© Copyright 2014 National Council on Compensation Insurance, Inc. All Rights Reserved. 8/14
Page 25 of 37

EXPERIENCE RATING PLAN MANUAL MISSOURIExhibit IV
Effective January 1, 2015 Page S8TABLE OF BALLAST VALUES
APPLICABLE TO ALL POLICIESExperience Rating Plan - ERA
Expected Ballast Expected Ballast Expected BallastLosses Values Losses Values Losses Values
0 -- 60,511 28,125 1,941,762 -- 1,997,979 225,000 3,909,941 -- 3,966,182 421,87560,512 -- 104,146 33,750 1,997,980 -- 2,054,199 230,625 3,966,183 -- 4,022,424 427,500
104,147 -- 154,283 39,375 2,054,200 -- 2,110,420 236,250 4,022,425 -- 4,078,666 433,125154,284 -- 207,174 45,000 2,110,421 -- 2,166,643 241,875 4,078,667 -- 4,134,909 438,750207,175 -- 261,351 50,625 2,166,644 -- 2,222,867 247,500 4,134,910 -- 4,191,152 444,375
261,352 -- 316,209 56,250 2,222,868 -- 2,279,093 253,125 4,191,153 -- 4,247,395 450,000316,210 -- 371,463 61,875 2,279,094 -- 2,335,320 258,750 4,247,396 -- 4,303,638 455,625371,464 -- 426,968 67,500 2,335,321 -- 2,391,548 264,375 4,303,639 -- 4,359,882 461,250426,969 -- 482,640 73,125 2,391,549 -- 2,447,776 270,000 4,359,883 -- 4,416,125 466,875482,641 -- 538,429 78,750 2,447,777 -- 2,504,006 275,625 4,416,126 -- 4,472,369 472,500
538,430 -- 594,303 84,375 2,504,007 -- 2,560,237 281,250 4,472,370 -- 4,528,613 478,125594,304 -- 650,240 90,000 2,560,238 -- 2,616,468 286,875 4,528,614 -- 4,584,857 483,750650,241 -- 706,226 95,625 2,616,469 -- 2,672,701 292,500 4,584,858 -- 4,641,101 489,375706,227 -- 762,250 101,250 2,672,702 -- 2,728,934 298,125 4,641,102 -- 4,697,345 495,000762,251 -- 818,305 106,875 2,728,935 -- 2,785,167 303,750 4,697,346 -- 4,753,590 500,625
818,306 -- 874,385 112,500 2,785,168 -- 2,841,402 309,375 4,753,591 -- 4,809,834 506,250874,386 -- 930,485 118,125 2,841,403 -- 2,897,637 315,000 4,809,835 -- 4,866,079 511,875930,486 -- 986,602 123,750 2,897,638 -- 2,953,872 320,625 4,866,080 -- 4,922,324 517,500986,603 -- 1,042,733 129,375 2,953,873 -- 3,010,108 326,250 4,922,325 -- 4,978,569 523,125
1,042,734 -- 1,098,876 135,000 3,010,109 -- 3,066,345 331,875 4,978,570 -- 5,034,814 528,750
1,098,877 -- 1,155,029 140,625 3,066,346 -- 3,122,582 337,500 5,034,815 -- 5,091,059 534,3751,155,030 -- 1,211,191 146,250 3,122,583 -- 3,178,820 343,125 5,091,060 -- 5,147,304 540,0001,211,192 -- 1,267,361 151,875 3,178,821 -- 3,235,057 348,750 5,147,305 -- 5,203,549 545,6251,267,362 -- 1,323,538 157,500 3,235,058 -- 3,291,296 354,375 5,203,550 -- 5,259,795 551,2501,323,539 -- 1,379,721 163,125 3,291,297 -- 3,347,535 360,000 5,259,796 -- 5,316,041 556,875
1,379,722 -- 1,435,909 168,750 3,347,536 -- 3,403,774 365,625 5,316,042 -- 5,371,875 562,5001,435,910 -- 1,492,101 174,375 3,403,775 -- 3,460,013 371,2501,492,102 -- 1,548,298 180,000 3,460,014 -- 3,516,253 376,8751,548,299 -- 1,604,498 185,625 3,516,254 -- 3,572,493 382,5001,604,499 -- 1,660,702 191,250 3,572,494 -- 3,628,734 388,125
1,660,703 -- 1,716,909 196,875 3,628,735 -- 3,684,974 393,7501,716,910 -- 1,773,118 202,500 3,684,975 -- 3,741,215 399,3751,773,119 -- 1,829,330 208,125 3,741,216 -- 3,797,457 405,0001,829,331 -- 1,885,544 213,750 3,797,458 -- 3,853,698 410,6251,885,545 -- 1,941,761 219,375 3,853,699 -- 3,909,940 416,250
For Expected Losses greater than $5,371,875, the Ballast Value can be calculated using the following formula (rounded to the nearest 1):
Ballast = (0.10)(Expected Losses) + 2500(Expected Losses)(11.25) / (Expected Losses + (700)(11.25))
G = 11.25
© Copyright 2014 National Council on Compensation Insurance, Inc. All Rights Reserved. 8/14
Page 26 of 37

RETROSPECTIVE RATING PLAN MANUAL MISSOURISTATE SPECIAL RATING VALUES RR 1
Effective January 1, 2015 Exhibit IV
1. Hazard Group Differentials A B C D E F G 1.65 1.30 1.20 1.00 0.83 0.70 0.57
2. 2013 Table of Expected Loss RangesEffective January 1, 2013
3. Excess Loss Pure Premium Factors(Applicable to New and Renewal Policies)
Per Accident Hazard GroupsLimitation A B C D E F G
$10,000 0.587 0.631 0.656 0.687 0.713 0.737 0.750$15,000 0.532 0.582 0.610 0.645 0.676 0.704 0.722$20,000 0.489 0.542 0.571 0.610 0.644 0.675 0.697$25,000 0.452 0.508 0.538 0.579 0.616 0.649 0.675$30,000 0.422 0.479 0.509 0.551 0.591 0.626 0.655$35,000 0.395 0.453 0.484 0.527 0.568 0.604 0.637$40,000 0.372 0.430 0.461 0.505 0.547 0.585 0.620$50,000 0.333 0.392 0.423 0.467 0.512 0.550 0.590$75,000 0.267 0.322 0.354 0.397 0.443 0.483 0.530
$100,000 0.224 0.276 0.307 0.347 0.395 0.434 0.485$125,000 0.193 0.243 0.273 0.311 0.358 0.396 0.450$150,000 0.171 0.217 0.247 0.283 0.329 0.366 0.422$175,000 0.153 0.197 0.226 0.261 0.306 0.341 0.398$200,000 0.139 0.181 0.209 0.242 0.287 0.321 0.378$225,000 0.127 0.168 0.195 0.227 0.270 0.303 0.361$250,000 0.118 0.157 0.184 0.214 0.257 0.288 0.347$275,000 0.109 0.147 0.173 0.202 0.244 0.275 0.334$300,000 0.102 0.138 0.164 0.192 0.234 0.263 0.322$325,000 0.096 0.131 0.157 0.183 0.224 0.252 0.311$350,000 0.090 0.124 0.149 0.176 0.216 0.243 0.302$375,000 0.085 0.119 0.143 0.168 0.208 0.234 0.293$400,000 0.081 0.113 0.137 0.162 0.201 0.227 0.285$425,000 0.077 0.108 0.132 0.156 0.194 0.220 0.278$450,000 0.073 0.104 0.127 0.151 0.188 0.213 0.271$475,000 0.070 0.100 0.123 0.146 0.183 0.207 0.265$500,000 0.067 0.096 0.119 0.141 0.178 0.201 0.259$600,000 0.057 0.084 0.106 0.126 0.161 0.182 0.239$700,000 0.050 0.075 0.095 0.114 0.147 0.167 0.222$800,000 0.044 0.067 0.087 0.104 0.136 0.155 0.209$900,000 0.040 0.061 0.080 0.096 0.127 0.145 0.197
$1,000,000 0.036 0.056 0.074 0.089 0.119 0.136 0.187$2,000,000 0.018 0.031 0.043 0.053 0.075 0.087 0.128$3,000,000 0.011 0.021 0.030 0.037 0.054 0.064 0.099$4,000,000 0.008 0.015 0.023 0.028 0.042 0.051 0.080$5,000,000 0.006 0.012 0.018 0.022 0.034 0.042 0.066$6,000,000 0.005 0.010 0.014 0.018 0.028 0.035 0.056$7,000,000 0.004 0.008 0.012 0.015 0.024 0.030 0.048$8,000,000 0.003 0.007 0.010 0.013 0.020 0.026 0.042$9,000,000 0.003 0.006 0.008 0.011 0.018 0.022 0.037
$10,000,000 0.002 0.005 0.007 0.010 0.015 0.020 0.033
© Copyright 2014 National Council on Compensation Insurance, Inc. All Rights Reserved.
Page 27 of 37

RETROSPECTIVE RATING PLAN MANUAL MISSOURISTATE SPECIAL RATING VALUES RR 2
Effective January 1, 2015 Exhibit IV
Excess Loss and AllocatedExpense Pure Premium Factors
(Applicable to New and Renewal Policies)
Per Accident Hazard GroupsLimitation A B C D E F G
$10,000 0.678 0.725 0.752 0.785 0.813 0.838 0.851$15,000 0.618 0.672 0.702 0.740 0.773 0.803 0.821$20,000 0.570 0.629 0.660 0.702 0.739 0.772 0.795$25,000 0.530 0.591 0.623 0.668 0.708 0.744 0.771$30,000 0.495 0.558 0.591 0.638 0.680 0.718 0.749$35,000 0.465 0.529 0.563 0.611 0.655 0.695 0.729$40,000 0.439 0.504 0.538 0.586 0.633 0.674 0.710$50,000 0.395 0.460 0.495 0.544 0.592 0.635 0.677$75,000 0.319 0.381 0.416 0.464 0.515 0.560 0.610
$100,000 0.269 0.328 0.362 0.408 0.460 0.504 0.559$125,000 0.234 0.290 0.323 0.366 0.418 0.461 0.519$150,000 0.208 0.261 0.293 0.334 0.385 0.427 0.487$175,000 0.188 0.238 0.269 0.308 0.359 0.398 0.460$200,000 0.171 0.219 0.250 0.287 0.336 0.375 0.438$225,000 0.157 0.203 0.233 0.269 0.318 0.355 0.418$250,000 0.146 0.190 0.220 0.254 0.302 0.337 0.401$275,000 0.136 0.178 0.208 0.241 0.287 0.322 0.386$300,000 0.127 0.168 0.197 0.229 0.275 0.308 0.373$325,000 0.119 0.160 0.188 0.219 0.264 0.296 0.361$350,000 0.113 0.152 0.179 0.209 0.254 0.285 0.350$375,000 0.107 0.145 0.172 0.201 0.245 0.276 0.340$400,000 0.101 0.138 0.165 0.193 0.237 0.267 0.331$425,000 0.097 0.133 0.159 0.186 0.229 0.258 0.323$450,000 0.092 0.127 0.153 0.180 0.222 0.251 0.315$475,000 0.088 0.122 0.148 0.174 0.216 0.244 0.308$500,000 0.084 0.118 0.143 0.169 0.210 0.237 0.301$600,000 0.072 0.103 0.127 0.150 0.190 0.215 0.277$700,000 0.063 0.092 0.114 0.136 0.174 0.197 0.258$800,000 0.056 0.083 0.104 0.124 0.160 0.183 0.243$900,000 0.050 0.075 0.096 0.115 0.149 0.171 0.229
$1,000,000 0.045 0.069 0.089 0.106 0.140 0.160 0.218$2,000,000 0.023 0.038 0.051 0.063 0.087 0.102 0.149$3,000,000 0.014 0.025 0.035 0.044 0.063 0.075 0.114$4,000,000 0.010 0.019 0.026 0.033 0.049 0.059 0.092$5,000,000 0.008 0.014 0.021 0.026 0.039 0.048 0.076$6,000,000 0.006 0.011 0.016 0.021 0.033 0.040 0.065$7,000,000 0.005 0.009 0.014 0.017 0.027 0.034 0.056$8,000,000 0.004 0.008 0.011 0.015 0.023 0.029 0.048$9,000,000 0.003 0.006 0.010 0.012 0.020 0.025 0.042
$10,000,000 0.003 0.006 0.008 0.011 0.017 0.022 0.037
© Copyright 2014 National Council on Compensation Insurance, Inc. All Rights Reserved.
Page 28 of 37

MISSOURI
WORKERS COMPENSATION FILING – JANUARY 1, 2015
NCCI KEY CONTACTS
Roy O. Wood, State Relations Executive Regulatory Services Division
National Council on Compensation Insurance, Inc. (NCCI) 11430 Gravois Road, Suite 310
St. Louis, MO 63126-0530 Phone (314) 843-4001 Fax (561) 893-5550
Nadege Bernard-Ahrendts, FCAS, MAAA
Manager and Associate Actuary Actuarial and Economic Services Division
National Council on Compensation Insurance, Inc. (NCCI) 901 Peninsula Corporate Circle Boca Raton, Florida 33487-1362
Phone (561) 893-3082 Fax (561) 893-5060
All NCCI employees can be contacted via e-mail using the following format:
First Name_Last [email protected]
© Copyright 2014 National Council on Compensation Insurance, Inc. All Rights Reserved.
Page 29 of 37
MISSOURI
WORKERS COMPENSATION FILING - JANUARY 1, 2015
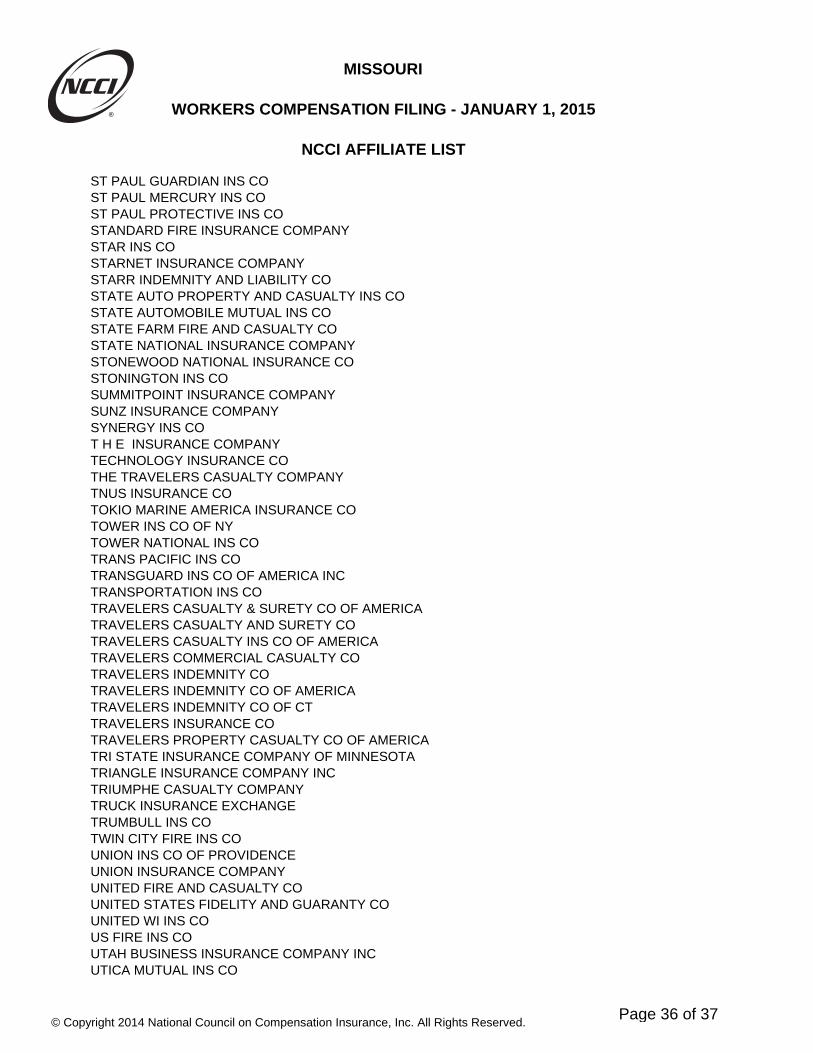
NCCI AFFILIATE LIST
A M C O INSURANCE COMPANYACADIA INSURANCE COMPANYACCIDENT FUND GENERAL INS COACCIDENT FUND INS CO OF AMERICAACCIDENT FUND NATIONAL INS COACCIDENT INSURANCE COMPANY INCACE AMERICAN INSURANCE COMPANYACE FIRE UNDERWRITERS INSURANCE COMPANYACE PROPERTY & CASUALTY INSURANCE COMPANYACIG INS COACUITY A MUTUAL INS COMPANYADDISON INSURANCE COMPANYADVANTAGE WC INSURANCE COAIG ASSURANCE COMPANYAIG PROPERTY CASUALTY COMPANYAIU INSURANCE CO (NATIONAL UNION FIRE OF PITTS PA)AK NATIONAL INS COALLIED EASTERN IND COALLIED INSURANCE COMPANY OF AMERICAALLIED PROPERTY AND CASUALTY INS COALLMERICA FINANCIAL BENEFIT INS COAMERICAN ALTERNATIVE INSURANCE CORPORATIONAMERICAN AUTOMOBILE INSURANCE COAMERICAN BUSINESS AND MERCANTILE INS MUTUAL INCAMERICAN CASUALTY COMPANY OF READING P AAMERICAN COMPENSATION INS COAMERICAN ECONOMY INS COAMERICAN FAMILY HOME INS COAMERICAN FAMILY INS COAMERICAN FAMILY MUTUAL INSURANCE COAMERICAN FIRE AND CASUALTY COAMERICAN GUARANTEE AND LIABILITY INS COAMERICAN HOME ASSUR CO-NATIONAL UNION FIRE OF PITAMERICAN INS COAMERICAN INTERSTATE INS COAMERICAN MINING INS COAMERICAN MODERN HOME INS COAMERICAN NATIONAL PROPERTY AND CASUALTY COAMERICAN SELECT INS COAMERICAN STATES INS CO A SAFECO COMPANYAMERICAN ZURICH INS COAMERISURE INS COAMERISURE MUTUAL INS COAMERISURE PARTNERS INS COAMERITRUST INS CORPAMGUARD INS COAMTRUST INSURANCE CO OF KS INCARCH INSURANCE COMPANYARGONAUT GREAT CENTRAL INS CO
© Copyright 2014 National Council on Compensation Insurance, Inc. All Rights Reserved.
Page 30 of 37

MISSOURI
WORKERS COMPENSATION FILING - JANUARY 1, 2015
NCCI AFFILIATE LIST
ARGONAUT INS COARGONAUT MIDWEST INS COASSOCIATED INDEMNITY CORPASSURANCE COMPANY OF AMERICAATLANTIC SPECIALTY INS CO (ONEBEACON)AUSTIN MUTUAL INSURANCE COMPANYAUTO OWNERS INS COBANKERS STANDARD FIRE AND MARINE COBANKERS STANDARD INS COBEARING MIDWEST CAUSALTY COMPANYBENCHMARK INSURANCE COMPANYBERKLEY NATIONAL INSURANCE COMPANYBERKLEY REGIONAL INS COBERKSHIRE HATHAWAY HOMESTATE INS COBITUMINOUS CASUALTY CORPBITUMINOUS FIRE AND MARINE INS COBLOOMINGTON COMPENSATION INS COBRICKSTREET MUTUAL INS COBROTHERHOOD MUTUAL INS COCALIFORNIA INSURANCE COMPANYCAPITOL INDEMNITY CORPCAROLINA CASUALTY INS COCASTLEPOINT NATIONAL INS COCHARTER OAK FIRE INS COCHEROKEE INS COCHUBB INDEMNITY INS COCHUBB NATIONAL INS COCHURCH MUTUAL INS COCINCINNATI CASUALTY COMPANYCINCINNATI INDEMNITY COMPANYCINCINNATI INS COCITIZENS INS CO OF AMERICACOLONIAL AMERICAN CASUALTY & SURETY COCOLUMBIA NATIONAL INS COCOMMERCE AND INDUSTRY INS COCOMPANION COMMERCIAL INS COCOMPANION PROPERTY AND CASUALTY INS COCONTINENTAL CASUALTY COCONTINENTAL INDEMNITY COCONTINENTAL INS COCONTINENTAL WESTERN INSURANCE COMPANYCRUM AND FORSTER INDEMNITY CODAKOTA TRUCK UNDERWRITERSDEERFIELD INS CODEPOSITORS INS CODIAMOND INS CODISCOVER PROPERTY & CASUALTY INS COEASTERN ADVANTAGE ASSURANCE COMPANYEASTERN ALLIANCE INSURANCE COMPANY
© Copyright 2014 National Council on Compensation Insurance, Inc. All Rights Reserved.
Page 31 of 37
MISSOURI
WORKERS COMPENSATION FILING - JANUARY 1, 2015
NCCI AFFILIATE LIST
EASTGUARD INS COELECTRIC INS COEMC PROPERTY & CASUALTY COMPANYEMCASCO INS COEMPLOYERS ASSURANCE COMPANYEMPLOYERS FIRE INSURANCE COMPANYEMPLOYERS INS CO OF WAUSAUEMPLOYERS MUTUAL CASUALTY COEMPLOYERS PREFERRED INS COEVEREST NATIONAL INS COEVEREST REINSURANCE CO DIRECTEXACT PROPERTY AND CASUALTY CO INCEXECUTIVE RISK INDEMNITY INCFARMERS INSURANCE EXCHANGEFARMINGTON CASUALTY COMPANYFARMLAND MUTUAL INSURANCE COMPANYFCCI INSURANCE COMPANYFEDERAL INSURANCE COMPANYFEDERATED MUTUAL INS COFEDERATED RURAL ELECTRIC INS EXCHANGEFEDERATED SERVICE INS COFIDELITY & DEPOSIT COMPANY OF MARYLANDFIDELITY & GUARANTY INS UNDERWRITERSFIDELITY & GUARANTY INSURANCE COFIREMANS FUND INSURANCE COFIREMENS INS CO OF WASHINGTON DCFIRST DAKOTA INDEMNITY COFIRST LIBERTY INS CORPFIRST NATIONAL INS CO OF AMERICAFIRST NONPROFIT INS COFIRSTCOMP INSURANCE COFLORISTS MUTUAL INSURANCE COFOREMOST INS CO GRAND RAPIDS MICHIGANFOREMOST PROPERTY & CAS INSFOREMOST SIGNATURE INS COFRANK WINSTON CRUM INSURANCE COFREESTONE INSURANCE COMPANYFUEL MARKETERS INSURANCE TRUSTGENERAL CASUALTY COMPANY OF WISCONSINGENERAL CASUALTY INSURANCE COMPANYGENERAL INS CO OF AMERICAGENESIS INS COGRANITE STATE INSURANCE COMPANYGREAT AMERICAN ALLIANCE INS COGREAT AMERICAN ASSURANCE COMPANYGREAT AMERICAN INS CO OF NYGREAT AMERICAN INSURANCE COMPANYGREAT AMERICAN SPIRIT INS COGREAT DIVIDE INSURANCE COMPANY
© Copyright 2014 National Council on Compensation Insurance, Inc. All Rights Reserved.
Page 32 of 37

MISSOURI
WORKERS COMPENSATION FILING - JANUARY 1, 2015
NCCI AFFILIATE LIST
GREAT NORTHERN INS COGREAT WEST CASUALTY COMPANYGREENWICH INS COGRINNELL MUTUAL REINSURANCE COGUARANTEE INS COGUIDEONE ELITE INS COGUIDEONE MUTUAL INS COHANOVER AMERICAN INS COHANOVER INS COHARLEYSVILLE INSURANCE COMPANYHARTFORD ACCIDENT AND INDEMNITY COHARTFORD CASUALTY INS COHARTFORD FIRE INSURANCE COHARTFORD INS CO OF ILHARTFORD INS CO OF MIDWESTHARTFORD INS CO OF THE SOUTHEASTHARTFORD UNDERWRITERS INS COHAWKEYE-SECURITY INS COHDI GERLING AMERICA INSURANCE COMPANYHOME OWNERS INS COHORIZON MIDWEST CASUALTY COMPANYILLINOIS CASUALTY COMPANYILLINOIS NATIONAL INSURANCE COMPANYIMPERIUM INSURANCE COMPANYINDEMNITY INS CO OF N AMERICA (INA INS) (CT GEN)INS CO OF NORTH AMERICAINS CO OF THE STATE PAINS CO OF THE WESTKODIAK INSURANCE COLIBERTY INS CORPLIBERTY INSURANCE UNDERWRITERS INCLIBERTY MUTUAL FIRE INS COLIBERTY MUTUAL INS COLM INS CORPLUMBERMENS UNDERWRITING ALLIANCEMA BAY INS COMANUFACTURERS ALLIANCE INS COMARKEL AMERICAN INSURANCE COMARKEL INSURANCE COMARYLAND CASUALTY COMPANYMCDONALDS OPERATORS RISK MGMT ASSOC OF MOMEMIC INDEMNITY COMERIDIAN CITIZENS MUTUAL INSURANCE COMERIDIAN SECURITY INSURANCE COMPANYMID CENTURY INS COMIDVALE INDEMNITY COMPANYMIDWEST BUILDERS CASUALTY MUTUAL COMPANYMIDWEST EMPLOYERS CASUALTY COMIDWEST FAMILY MUTUAL INS CO
© Copyright 2014 National Council on Compensation Insurance, Inc. All Rights Reserved.
Page 33 of 37
MISSOURI
WORKERS COMPENSATION FILING - JANUARY 1, 2015
NCCI AFFILIATE LIST
MIDWEST INS COMIDWESTERN INDEMNITY COMILBANK INSURANCE COMPANYMILWAUKEE CASUALTY INSURANCE CO (AMTRUST GROUP)MITSUI SUMITOMO INS CO OF AMERICAMITSUI SUMITOMO INS USA INCMO EMPLOYERS MUTUAL INS COMO RURAL SERVICES WC INS TRUSTMO WOOD INDUSTRY INS TRUSTMONROE GUARANTY INS CONATIONAL AMERICAN INS CONATIONAL CASUALTY CONATIONAL FIRE INS CO OF HARTFORDNATIONAL INTERSTATE INS CONATIONAL LIABILITY & FIRE INSURANCE CONATIONAL SURETY CORPNATIONAL TRUST INS CONATIONAL UNION FIRE INS CO OF PITTSBURG PANATIONWIDE AGRIBUSINESS INS CONATIONWIDE MUTUAL FIRE INS CONATIONWIDE MUTUAL INS CONATIONWIDE PROPERTY AND CASUALTY INS CONETHERLANDS INSURANCE COMPANYNEW HAMPSHIRE INSURANCE COMPANYNEW YORK MARINE AND GENERAL INSURANCE CONIPPONKOA INS CO LIMITED (US BRANCH)NORGUARD INS CONORTH AMERICAN ELITE INSURANCE CONORTH AMERICAN SPECIALTY INS CONORTH POINTE INS CONORTH RIVER INS CONORTHERN INSURANCE CO OF N YNORTHSTONE INSURANCE COMPANYNOVA CASUALTY COMPANYOAK RIVER INSURANCE COMPANYOBI NATIONAL INSURANCE COMPANYOH CASUALTY INS COOH FARMERS INS COOHIO SECURITY INS COOLD REPUBLIC GENERAL INSURANCE CORPORATIONOLD REPUBLIC INS COONEBEACON AMERICA INS COONEBEACON INSURANCE COMPANYOWNERS INSURANCE COMPANYPA MANUFACTURERS ASSN INS COPA MANUFACTURERS INDEMNITY COPA NATIONAL MUTUAL CAS INS COPACIFIC EMPLOYERS INS COPACIFIC INDEMNITY CO
© Copyright 2014 National Council on Compensation Insurance, Inc. All Rights Reserved.
Page 34 of 37
MISSOURI
WORKERS COMPENSATION FILING - JANUARY 1, 2015
NCCI AFFILIATE LIST
PATRONS MUTUAL INS CO OF CTPEERLESS INDEMNITY INS COPEERLESS INSURANCE COMPANYPENN MILLERS INS COPENNSYLVANIA INSURANCE COMPANYPETROLEUM CASUALTY COPHARMACISTS MUTUAL INS COPHOENIX INS COPINNACLEPOINT INSURANCE COMPANYPLAZA INSURANCE COPRAETORIAN INSURANCE COMPANYPREFERRED PROFESSIONAL INSURANCE COMPANYPREMIER GROUP INS COPRESERVER INS COPROPERTY AND CASUALTY INS CO OF HARTFORDPROTECTIVE INS COPUBLIC SERVICE INSURANCE COMPANYQBE INSURANCE CORPORATIONREDWOOD FIRE & CASUALTY INS COREGENT INSURANCE COMPANYREPUBLIC INDEMNITY CO OF CAREPUBLIC INDEMNITY COMPANY OF AMERICARIVERPORT INSURANCE COMPANYRLI INSURANCE COMPANYROCKFORD MUTUAL INS COROCKWOOD CASUALTY INS COSAFECO INS CO OF AMERICASAFETY FIRST INS COSAFETY NATIONAL CASUALTY CORPSAGAMORE INSURANCE COSAMSUNG FIRE AND MARINE INS CO LTD USBSAVERS PROPERTY & CASUALTY INS COSECURA INSURANCE A MUTUAL COSECURA SUPREME INS COSECURITY NATIONAL INS CO (AMTRUST GROUP)SELECT INS COSELECTIVE INS CO OF SCSELECTIVE INS CO OF THE SOUTHEASTSELECTIVE INSURANCE COMPANY OF AMERICASELECTIVE WAY INS COSENTINEL INS COSENTRY CASUALTY COSENTRY INSURANCE A MUTUAL COSENTRY SELECT INSURANCE COMPANYSFM MUTUAL INS COSOMPO JAPAN INSURANCE CO OF AMERICASOUTHERN INS COSPARTA INSURANCE COMPANYST PAUL FIRE AND MARINE INS CO
© Copyright 2014 National Council on Compensation Insurance, Inc. All Rights Reserved.
Page 35 of 37
MISSOURI
WORKERS COMPENSATION FILING - JANUARY 1, 2015
NCCI AFFILIATE LIST
ST PAUL GUARDIAN INS COST PAUL MERCURY INS COST PAUL PROTECTIVE INS COSTANDARD FIRE INSURANCE COMPANYSTAR INS COSTARNET INSURANCE COMPANYSTARR INDEMNITY AND LIABILITY COSTATE AUTO PROPERTY AND CASUALTY INS COSTATE AUTOMOBILE MUTUAL INS COSTATE FARM FIRE AND CASUALTY COSTATE NATIONAL INSURANCE COMPANYSTONEWOOD NATIONAL INSURANCE COSTONINGTON INS COSUMMITPOINT INSURANCE COMPANYSUNZ INSURANCE COMPANYSYNERGY INS COT H E INSURANCE COMPANYTECHNOLOGY INSURANCE COTHE TRAVELERS CASUALTY COMPANYTNUS INSURANCE COTOKIO MARINE AMERICA INSURANCE COTOWER INS CO OF NYTOWER NATIONAL INS COTRANS PACIFIC INS COTRANSGUARD INS CO OF AMERICA INCTRANSPORTATION INS COTRAVELERS CASUALTY & SURETY CO OF AMERICATRAVELERS CASUALTY AND SURETY COTRAVELERS CASUALTY INS CO OF AMERICATRAVELERS COMMERCIAL CASUALTY COTRAVELERS INDEMNITY COTRAVELERS INDEMNITY CO OF AMERICATRAVELERS INDEMNITY CO OF CTTRAVELERS INSURANCE COTRAVELERS PROPERTY CASUALTY CO OF AMERICATRI STATE INSURANCE COMPANY OF MINNESOTATRIANGLE INSURANCE COMPANY INCTRIUMPHE CASUALTY COMPANYTRUCK INSURANCE EXCHANGETRUMBULL INS COTWIN CITY FIRE INS COUNION INS CO OF PROVIDENCEUNION INSURANCE COMPANYUNITED FIRE AND CASUALTY COUNITED STATES FIDELITY AND GUARANTY COUNITED WI INS COUS FIRE INS COUTAH BUSINESS INSURANCE COMPANY INCUTICA MUTUAL INS CO
© Copyright 2014 National Council on Compensation Insurance, Inc. All Rights Reserved.
Page 36 of 37

MISSOURI
WORKERS COMPENSATION FILING - JANUARY 1, 2015
NCCI AFFILIATE LIST
VALLEY FORGE INS COVANLINER INS COVIGILANT INS COWAUSAU BUSINESS INSURANCE COMPANYWAUSAU UNDERWRITERS INSURANCE COMPANYWESCO INSURANCE COMPANY (AMTRUST GROUP)WEST AMERICAN INS COWEST BEND MUTUAL INS COWESTCHESTER FIRE INSURANCE COMPANYWESTFIELD INS COWESTFIELD NATIONAL INS COWESTPORT INSURANCE CORPORATIONWILLIAMSBURG NATIONAL INS COWORK FIRST CASUALTY COXL INS CO OF NY INCXL INSURANCE AMERICA INCXL SPECIALTY INS COZENITH INS COZURICH AMERICAN INS COZURICH AMERICAN INS CO OF IL
© Copyright 2014 National Council on Compensation Insurance, Inc. All Rights Reserved.
Page 37 of 37

Supporting Document Schedules Satisfied - Item: Electronic Rate SubmissionComments: CompleteAttachment(s):Item Status: REVIEWEDStatus Date: 12/15/2014
Bypassed - Item: Exhibits A & B (20 CSR 500-6.950)(2)Bypass Reason: NAAttachment(s):Item Status: REVIEWEDStatus Date: 12/15/2014
Satisfied - Item: Filing MemorandumComments:Attachment(s): Filing Memo.pdfItem Status: REVIEWEDStatus Date: 12/15/2014
Satisfied - Item: A SheetsComments:Attachment(s): MO 1-1-2015 A_SHEET_CRO Including F-Class.pdfItem Status: REVIEWEDStatus Date: 12/15/2014
Satisfied - Item: LC ComparisonComments:Attachment(s): MO 1-1-2015 LC Comparison.pdfItem Status: REVIEWEDStatus Date: 12/15/2014
SERFF Tracking #: NCCI-129681068 State Tracking #: 317 Company Tracking #: MISSOURI LC 01012015
State: Missouri Filing Company: NCCI
TOI/Sub-TOI: 16.0 Workers Compensation/16.0004 Standard WC
Product Name: Missouri Voluntary Market Advisory Loss Costs and Rating Values Effective January 1, 2015
Project Name/Number: /
PDF Pipeline for SERFF Tracking Number NCCI-129681068 Generated 12/15/2014 11:46 AM
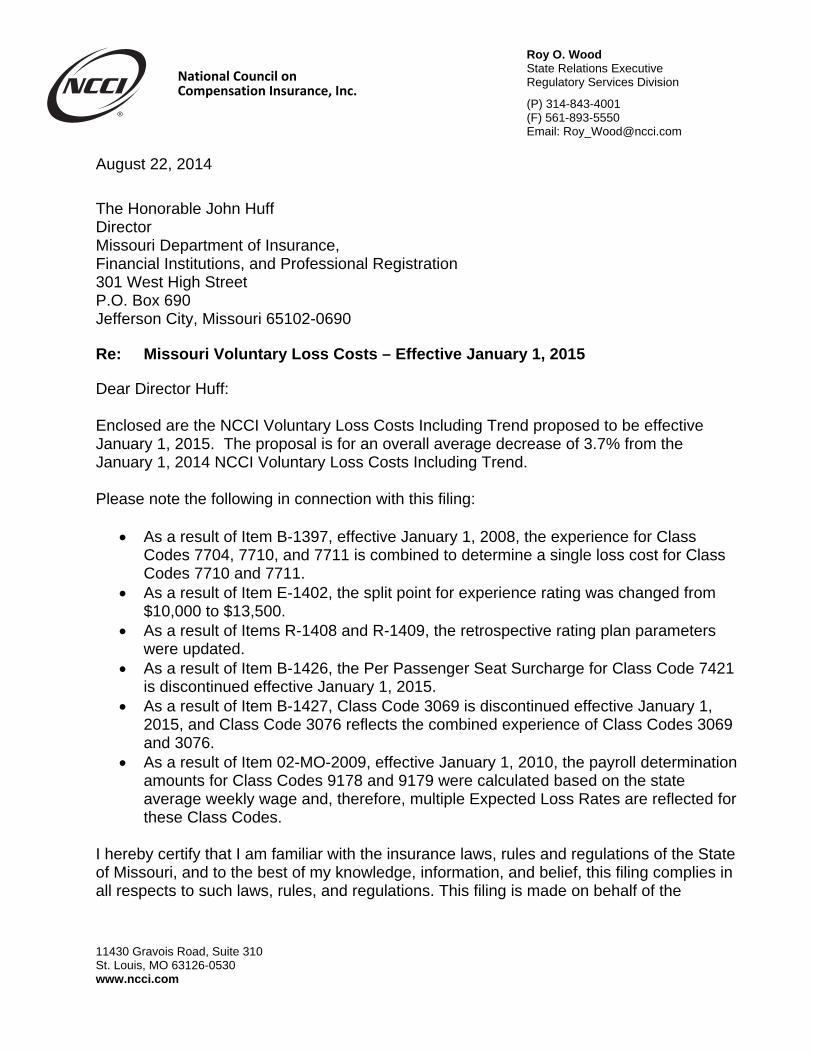
Roy O. Wood State Relations Executive Regulatory Services Division
(P) 314-843-4001 (F) 561-893-5550 Email: [email protected]
11430 Gravois Road, Suite 310 St. Louis, MO 63126-0530 www.ncci.com
National Council on Compensation Insurance, Inc.
August 22, 2014
The Honorable John Huff Director Missouri Department of Insurance, Financial Institutions, and Professional Registration 301 West High Street P.O. Box 690 Jefferson City, Missouri 65102-0690 Re: Missouri Voluntary Loss Costs – Effective January 1, 2015 Dear Director Huff: Enclosed are the NCCI Voluntary Loss Costs Including Trend proposed to be effective January 1, 2015. The proposal is for an overall average decrease of 3.7% from the January 1, 2014 NCCI Voluntary Loss Costs Including Trend. Please note the following in connection with this filing:
As a result of Item B-1397, effective January 1, 2008, the experience for Class Codes 7704, 7710, and 7711 is combined to determine a single loss cost for Class Codes 7710 and 7711.
As a result of Item E-1402, the split point for experience rating was changed from $10,000 to $13,500.
As a result of Items R-1408 and R-1409, the retrospective rating plan parameters were updated.
As a result of Item B-1426, the Per Passenger Seat Surcharge for Class Code 7421 is discontinued effective January 1, 2015.
As a result of Item B-1427, Class Code 3069 is discontinued effective January 1, 2015, and Class Code 3076 reflects the combined experience of Class Codes 3069 and 3076.
As a result of Item 02-MO-2009, effective January 1, 2010, the payroll determination amounts for Class Codes 9178 and 9179 were calculated based on the state average weekly wage and, therefore, multiple Expected Loss Rates are reflected for these Class Codes.
I hereby certify that I am familiar with the insurance laws, rules and regulations of the State of Missouri, and to the best of my knowledge, information, and belief, this filing complies in all respects to such laws, rules, and regulations. This filing is made on behalf of the

The Honorable John Huff Page 2 August 22, 2014
members and subscribers of the National Council on Compensation Insurance, Inc., who are now writing or will write workers compensation insurance in Missouri. This filing is made exclusively on behalf of the companies that have given valid consideration for the express purpose of fulfilling regulatory rate or pure premium filing requirements and other private use of this information. In the enclosed appendix is a list of companies, sorted by group, which as of the time this filing is submitted, are eligible to reference this information. The inclusion of a company on this list merely indicates that the company, or the group to which it belongs, is affiliated with NCCI in this state, or has licensed this information as a non-affiliate, and is not intended to indicate whether the company is currently writing business or is even licensed to write business in this state. Please contact me if you have any questions or need any further information. Respectfully submitted,
Roy O. Wood State Relations Executive Regulatory Services Division

MISSOURI
EFFECTIVE 1/1/2015CLASS FARM: NURSERY EMPLOYEES & DRIVERS
0005
Industry Group: Goods and Services CONVERTED LOSSESHazard Group: C INDEMNITY LIKELY INDEMNITY NOT-LIKELY MED LIKELY MED NOT-LIKELY TOTAL TOTAL
POLICY PERIOD PAYROLL CASES AMOUNT CASES AMOUNT AMOUNT AMOUNT AMOUNT PURE PREM.7/07 through 6/08 16,185,068 2 167,968 13 98,079 29,637 235,387 531,071 3.287/08 through 6/09 13,786,951 1 8,369 11 301,297 92,545 249,456 651,667 4.737/09 through 6/10 11,279,651 2 54,869 11 363,499 13,060 429,615 861,043 7.637/10 through 6/11 12,070,213 1 8,334 8 27,749 7,357 91,306 134,746 1.127/11 through 6/12 12,127,114 1 54,313 7 171,379 31,534 286,027 543,253 4.48
5 YR. TOTAL 65,448,997 7 293,853 50 962,003 174,133 1,291,791 2,721,780 4.16INDEMNITY MEDICAL TOTAL
CRED. PURE PREM.* CRED. PURE PREM.* PURE PREM.*Indicated Pure Premium 30% 1.919 39% 2.240 4.16Pure Premium Indicated by National Relativity 35% 0.948 30% 1.843 2.79Pure Premium Present on Rate Level 35% 1.320 31% 1.913 3.23Pure Premium Derived by Formula 1.370 2.020 3.39
CLASS FARM: GARDENING-MARKET OR TRUCK-& DRIVERS
0008
Industry Group: Goods and Services CONVERTED LOSSESHazard Group: D INDEMNITY LIKELY INDEMNITY NOT-LIKELY MED LIKELY MED NOT-LIKELY TOTAL TOTAL
POLICY PERIOD PAYROLL CASES AMOUNT CASES AMOUNT AMOUNT AMOUNT AMOUNT PURE PREM.7/07 through 6/08 2,227,922 0 0 0 0 0 2,048 2,048 0.097/08 through 6/09 2,302,395 0 0 0 0 0 606 606 0.037/09 through 6/10 2,100,555 0 0 1 2,918 0 5,977 8,895 0.427/10 through 6/11 3,611,490 1 7,146 4 7,002 7,740 28,010 49,898 1.387/11 through 6/12 5,241,499 2 61,482 3 7,751 89,905 22,509 181,647 3.47
5 YR. TOTAL 15,483,861 3 68,628 8 17,671 97,645 59,150 243,094 1.57INDEMNITY MEDICAL TOTAL
CRED. PURE PREM.* CRED. PURE PREM.* PURE PREM.*Indicated Pure Premium 13% 0.557 18% 1.013 1.57Pure Premium Indicated by National Relativity 43% 0.819 41% 1.662 2.48Pure Premium Present on Rate Level 44% 0.677 41% 1.166 1.84Pure Premium Derived by Formula 0.722 1.342 2.06
CLASS FARM - ORCHARD OR GROVE & DRIVERS
0016
Industry Group: Goods and Services CONVERTED LOSSESHazard Group: E INDEMNITY LIKELY INDEMNITY NOT-LIKELY MED LIKELY MED NOT-LIKELY TOTAL TOTAL
POLICY PERIOD PAYROLL CASES AMOUNT CASES AMOUNT AMOUNT AMOUNT AMOUNT PURE PREM.7/07 through 6/08 1,573,216 0 0 0 0 0 2,357 2,357 0.157/08 through 6/09 1,510,677 0 0 0 0 0 0 0 0.007/09 through 6/10 1,642,567 0 0 2 68,037 0 204,952 272,989 16.627/10 through 6/11 1,607,669 1 42,887 2 2,703 145,333 16,120 207,043 12.887/11 through 6/12 1,830,615 0 0 0 0 0 0 0 0.00
5 YR. TOTAL 8,164,744 1 42,887 4 70,740 145,333 223,429 482,389 5.91INDEMNITY MEDICAL TOTAL
CRED. PURE PREM.* CRED. PURE PREM.* PURE PREM.*Indicated Pure Premium 15% 1.392 21% 4.517 5.91Pure Premium Indicated by National Relativity 42% 2.210 39% 3.610 5.82Pure Premium Present on Rate Level 43% 1.800 40% 3.296 5.10Pure Premium Derived by Formula 1.911 3.675 5.59
Page 1
* Pure Premium per $100 of Payroll** Pure Premium per employee++ Non-Standard Calculation© Copyright 2014 National Council on Compensation Insurance, Inc. All Rights Reserved.

MISSOURI
EFFECTIVE 1/1/2015CLASS FARM: POULTRY OR EGG PRODUCER & DRIVERS
0034
Industry Group: Goods and Services CONVERTED LOSSESHazard Group: C INDEMNITY LIKELY INDEMNITY NOT-LIKELY MED LIKELY MED NOT-LIKELY TOTAL TOTAL
POLICY PERIOD PAYROLL CASES AMOUNT CASES AMOUNT AMOUNT AMOUNT AMOUNT PURE PREM.7/07 through 6/08 17,137,519 1 3,804 10 47,123 2,844 113,628 167,399 0.987/08 through 6/09 23,793,004 4 57,674 7 39,040 78,872 162,301 337,887 1.427/09 through 6/10 23,829,407 3 142,590 4 38,818 78,666 98,226 358,300 1.507/10 through 6/11 22,957,244 1 17,241 1 363 34,780 45,628 98,012 0.437/11 through 6/12 25,314,958 0 0 16 175,326 0 442,350 617,676 2.44
5 YR. TOTAL 113,032,132 9 221,309 38 300,670 195,162 862,133 1,579,274 1.40INDEMNITY MEDICAL TOTAL
CRED. PURE PREM.* CRED. PURE PREM.* PURE PREM.*Indicated Pure Premium 32% 0.462 43% 0.935 1.40Pure Premium Indicated by National Relativity 34% 1.135 28% 1.937 3.07Pure Premium Present on Rate Level 34% 0.858 29% 1.341 2.20Pure Premium Derived by Formula 0.825 1.333 2.16
CLASS FARM: FLORIST & DRIVERS
0035
Industry Group: Goods and Services CONVERTED LOSSESHazard Group: B INDEMNITY LIKELY INDEMNITY NOT-LIKELY MED LIKELY MED NOT-LIKELY TOTAL TOTAL
POLICY PERIOD PAYROLL CASES AMOUNT CASES AMOUNT AMOUNT AMOUNT AMOUNT PURE PREM.7/07 through 6/08 15,568,385 2 23,735 7 43,026 10,449 127,149 204,359 1.317/08 through 6/09 15,522,566 1 36,348 8 83,874 23,773 135,733 279,728 1.807/09 through 6/10 15,242,923 0 0 4 20,219 0 166,140 186,359 1.227/10 through 6/11 15,311,248 1 4,988 6 12,943 4,892 63,698 86,521 0.577/11 through 6/12 14,118,562 0 0 1 21,468 0 57,137 78,605 0.56
5 YR. TOTAL 75,763,684 4 65,071 26 181,530 39,114 549,857 835,572 1.10INDEMNITY MEDICAL TOTAL
CRED. PURE PREM.* CRED. PURE PREM.* PURE PREM.*Indicated Pure Premium 25% 0.325 35% 0.777 1.10Pure Premium Indicated by National Relativity 37% 0.939 32% 1.733 2.67Pure Premium Present on Rate Level 38% 0.736 33% 1.269 2.01Pure Premium Derived by Formula 0.708 1.245 1.95
CLASS FARM: DAIRY & DRIVERS
0036
Industry Group: Goods and Services CONVERTED LOSSESHazard Group: C INDEMNITY LIKELY INDEMNITY NOT-LIKELY MED LIKELY MED NOT-LIKELY TOTAL TOTAL
POLICY PERIOD PAYROLL CASES AMOUNT CASES AMOUNT AMOUNT AMOUNT AMOUNT PURE PREM.7/07 through 6/08 5,771,174 3 75,921 11 99,982 164,104 285,912 625,919 10.857/08 through 6/09 6,208,011 0 0 13 91,524 0 199,424 290,948 4.697/09 through 6/10 6,689,396 2 19,383 13 146,661 24,763 385,998 576,805 8.627/10 through 6/11 10,183,115 4 135,753 16 286,670 69,606 576,746 1,068,775 10.507/11 through 6/12 9,710,778 3 109,116 9 81,783 65,689 256,137 512,725 5.28
5 YR. TOTAL 38,562,474 12 340,173 62 706,620 324,162 1,704,217 3,075,172 7.98INDEMNITY MEDICAL TOTAL
CRED. PURE PREM.* CRED. PURE PREM.* PURE PREM.*Indicated Pure Premium 29% 2.715 45% 5.260 7.98Pure Premium Indicated by National Relativity 35% 1.237 27% 2.455 3.69Pure Premium Present on Rate Level 36% 2.104 28% 4.567 6.67Pure Premium Derived by Formula 1.978 4.309 6.29
Page 2
* Pure Premium per $100 of Payroll** Pure Premium per employee++ Non-Standard Calculation© Copyright 2014 National Council on Compensation Insurance, Inc. All Rights Reserved.

MISSOURI
EFFECTIVE 1/1/2015CLASS FARM: FIELD CROPS & DRIVERS
0037
Industry Group: Goods and Services CONVERTED LOSSESHazard Group: D INDEMNITY LIKELY INDEMNITY NOT-LIKELY MED LIKELY MED NOT-LIKELY TOTAL TOTAL
POLICY PERIOD PAYROLL CASES AMOUNT CASES AMOUNT AMOUNT AMOUNT AMOUNT PURE PREM.7/07 through 6/08 31,455,709 2 94,464 13 53,850 196,365 174,190 518,869 1.657/08 through 6/09 33,716,721 1 43,437 16 766,582 16,082 1,117,113 1,943,214 5.767/09 through 6/10 37,996,934 4 98,627 23 313,301 247,961 775,601 1,435,490 3.787/10 through 6/11 40,377,712 1 306,027 14 217,479 516,226 407,098 1,446,830 3.587/11 through 6/12 43,654,656 7 737,626 11 202,181 1,303,913 443,103 2,686,823 6.16
5 YR. TOTAL 187,201,732 15 1,280,181 77 1,553,393 2,280,547 2,917,105 8,031,226 4.29INDEMNITY MEDICAL TOTAL
CRED. PURE PREM.* CRED. PURE PREM.* PURE PREM.*Indicated Pure Premium 45% 1.514 66% 2.776 4.29Pure Premium Indicated by National Relativity 27% 1.409 17% 2.530 3.94Pure Premium Present on Rate Level 28% 1.232 17% 2.459 3.69Pure Premium Derived by Formula 1.407 2.680 4.09
CLASS LANDSCAPE GARDENING & DRIVERS
0042
Industry Group: Contracting CONVERTED LOSSESHazard Group: D INDEMNITY LIKELY INDEMNITY NOT-LIKELY MED LIKELY MED NOT-LIKELY TOTAL TOTAL
POLICY PERIOD PAYROLL CASES AMOUNT CASES AMOUNT AMOUNT AMOUNT AMOUNT PURE PREM.7/07 through 6/08 58,886,765 9 565,440 54 1,009,355 671,502 1,594,204 3,840,501 6.527/08 through 6/09 51,706,710 8 277,815 48 481,343 268,996 956,907 1,985,061 3.847/09 through 6/10 49,347,381 11 511,793 48 528,564 435,885 1,455,115 2,931,357 5.947/10 through 6/11 55,363,408 12 372,241 47 930,983 509,839 1,164,181 2,977,244 5.387/11 through 6/12 54,550,423 16 1,014,373 52 931,825 1,154,724 1,168,582 4,269,504 7.83
5 YR. TOTAL 269,854,687 56 2,741,662 249 3,882,070 3,040,946 6,338,989 16,003,667 5.93INDEMNITY MEDICAL TOTAL
CRED. PURE PREM.* CRED. PURE PREM.* PURE PREM.*Indicated Pure Premium 63% 2.455 84% 3.476 5.93Pure Premium Indicated by National Relativity 18% 1.906 8% 3.129 5.04Pure Premium Present on Rate Level 19% 2.113 8% 3.153 5.27Pure Premium Derived by Formula 2.291 3.422 5.71
CLASS FARM MACHINERY OPERATION-BY CONTRACTOR-& DRIVERS
0050
Industry Group: Contracting CONVERTED LOSSESHazard Group: C INDEMNITY LIKELY INDEMNITY NOT-LIKELY MED LIKELY MED NOT-LIKELY TOTAL TOTAL
POLICY PERIOD PAYROLL CASES AMOUNT CASES AMOUNT AMOUNT AMOUNT AMOUNT PURE PREM.7/07 through 6/08 10,473,549 1 6,321 7 214,552 7,605 331,762 560,240 5.357/08 through 6/09 9,452,456 0 0 8 103,886 0 171,705 275,591 2.927/09 through 6/10 10,996,423 1 30,039 12 165,328 20,295 235,836 451,498 4.117/10 through 6/11 11,836,024 0 0 8 96,727 0 281,517 378,244 3.207/11 through 6/12 12,669,015 0 0 7 65,293 0 151,809 217,102 1.71
5 YR. TOTAL 55,427,467 2 36,360 42 645,786 27,900 1,172,629 1,882,675 3.40INDEMNITY MEDICAL TOTAL
CRED. PURE PREM.* CRED. PURE PREM.* PURE PREM.*Indicated Pure Premium 34% 1.231 43% 2.166 3.40Pure Premium Indicated by National Relativity 33% 2.147 28% 3.124 5.27Pure Premium Present on Rate Level 33% 2.105 29% 2.926 5.03Pure Premium Derived by Formula 1.822 2.655 4.48
Page 3
* Pure Premium per $100 of Payroll** Pure Premium per employee++ Non-Standard Calculation© Copyright 2014 National Council on Compensation Insurance, Inc. All Rights Reserved.

MISSOURI
EFFECTIVE 1/1/2015CLASS FARM: BERRY OR VINEYARD & DRIVERS
0079
Industry Group: Goods and Services CONVERTED LOSSESHazard Group: E INDEMNITY LIKELY INDEMNITY NOT-LIKELY MED LIKELY MED NOT-LIKELY TOTAL TOTAL
POLICY PERIOD PAYROLL CASES AMOUNT CASES AMOUNT AMOUNT AMOUNT AMOUNT PURE PREM.7/07 through 6/08 2,643,896 0 0 3 30,038 0 54,396 84,434 3.197/08 through 6/09 2,349,978 1 16,788 2 88,075 11,657 63,937 180,457 7.687/09 through 6/10 2,344,375 0 0 2 106,568 0 621,232 727,800 31.057/10 through 6/11 2,164,694 0 0 4 16,868 0 92,127 108,995 5.047/11 through 6/12 2,272,226 0 0 3 59,818 0 191,883 251,701 11.08
5 YR. TOTAL 11,775,169 1 16,788 14 301,367 11,657 1,023,575 1,353,387 11.49INDEMNITY MEDICAL TOTAL
CRED. PURE PREM.* CRED. PURE PREM.* PURE PREM.*Indicated Pure Premium 16% 2.702 27% 8.792 11.49Pure Premium Indicated by National Relativity 39% 0.973 36% 2.531 3.50Pure Premium Present on Rate Level 45% 1.558 37% 4.009 5.57Pure Premium Derived by Formula 1.513 4.768 6.28
CLASS FARM: CATTLE OR LIVESTOCK RAISING NOC & DRIVERS
0083
Industry Group: Goods and Services CONVERTED LOSSESHazard Group: C INDEMNITY LIKELY INDEMNITY NOT-LIKELY MED LIKELY MED NOT-LIKELY TOTAL TOTAL
POLICY PERIOD PAYROLL CASES AMOUNT CASES AMOUNT AMOUNT AMOUNT AMOUNT PURE PREM.7/07 through 6/08 55,983,312 4 76,105 41 296,037 66,476 742,704 1,181,322 2.117/08 through 6/09 55,190,763 14 544,989 39 430,541 447,724 1,600,730 3,023,984 5.487/09 through 6/10 55,802,115 7 229,515 43 493,624 958,374 1,416,138 3,097,651 5.557/10 through 6/11 57,429,691 5 237,347 36 292,756 329,725 836,317 1,696,145 2.957/11 through 6/12 31,663,901 2 52,812 23 358,323 18,390 803,241 1,232,766 3.89
5 YR. TOTAL 256,069,782 32 1,140,768 182 1,871,281 1,820,689 5,399,130 10,231,868 4.00INDEMNITY MEDICAL TOTAL
CRED. PURE PREM.* CRED. PURE PREM.* PURE PREM.*Indicated Pure Premium 55% 1.176 81% 2.819 4.00Pure Premium Indicated by National Relativity 22% 1.836 9% 3.635 5.47Pure Premium Present on Rate Level 23% 1.498 10% 2.975 4.47Pure Premium Derived by Formula 1.395 2.908 4.30
CLASS TREE PRUNING, SPRAYING, REPAIRING -- ALL OPERATIONS & DRIVERS
0106
Industry Group: Miscellaneous CONVERTED LOSSESHazard Group: F INDEMNITY LIKELY INDEMNITY NOT-LIKELY MED LIKELY MED NOT-LIKELY TOTAL TOTAL
POLICY PERIOD PAYROLL CASES AMOUNT CASES AMOUNT AMOUNT AMOUNT AMOUNT PURE PREM.7/07 through 6/08 51,159,107 17 1,483,311 52 822,940 2,426,733 1,735,726 6,468,710 12.647/08 through 6/09 54,290,780 15 709,735 61 924,549 767,239 1,785,534 4,187,057 7.717/09 through 6/10 54,095,670 12 740,313 48 764,043 1,189,627 1,377,546 4,071,529 7.537/10 through 6/11 58,857,931 14 489,255 40 723,700 768,794 1,365,932 3,347,681 5.697/11 through 6/12 59,166,351 6 419,554 41 535,677 761,867 1,301,740 3,018,838 5.10
5 YR. TOTAL 277,569,839 64 3,842,168 242 3,770,909 5,914,260 7,566,478 21,093,815 7.60INDEMNITY MEDICAL TOTAL
CRED. PURE PREM.* CRED. PURE PREM.* PURE PREM.*Indicated Pure Premium 77% 2.743 100% 4.857 7.60Pure Premium Indicated by National Relativity 11% 4.633 0% 7.715 12.35Pure Premium Present on Rate Level 12% 3.340 0% 5.081 8.42Pure Premium Derived by Formula 3.023 4.857 7.88
Page 4
* Pure Premium per $100 of Payroll** Pure Premium per employee++ Non-Standard Calculation© Copyright 2014 National Council on Compensation Insurance, Inc. All Rights Reserved.

MISSOURI
EFFECTIVE 1/1/2015CLASS FARM: FISH HATCHERY & DRIVERS
0113
Industry Group: Goods and Services CONVERTED LOSSESHazard Group: C INDEMNITY LIKELY INDEMNITY NOT-LIKELY MED LIKELY MED NOT-LIKELY TOTAL TOTAL
POLICY PERIOD PAYROLL CASES AMOUNT CASES AMOUNT AMOUNT AMOUNT AMOUNT PURE PREM.7/07 through 6/08 1,222,318 0 0 2 12,263 0 39,011 51,274 4.207/08 through 6/09 1,348,511 2 51,998 2 3,075 52,405 23,441 130,919 9.717/09 through 6/10 1,328,460 0 0 3 20,958 0 75,143 96,101 7.237/10 through 6/11 1,164,442 1 417,717 0 0 382,334 2,032 802,083 68.887/11 through 6/12 1,261,137 0 0 1 240 0 602 842 0.07
5 YR. TOTAL 6,324,868 3 469,715 8 36,536 434,739 140,229 1,081,219 17.10INDEMNITY MEDICAL TOTAL
CRED. PURE PREM.* CRED. PURE PREM.* PURE PREM.*Indicated Pure Premium 12% 8.004 19% 9.091 17.10Pure Premium Indicated by National Relativity 44% 1.672 40% 2.428 4.10Pure Premium Present on Rate Level 44% 1.417 41% 3.203 4.62Pure Premium Derived by Formula 2.320 4.012 6.33
CLASS FARM: ANIMAL RAISING & DRIVERS
0170
Industry Group: Goods and Services CONVERTED LOSSESHazard Group: C INDEMNITY LIKELY INDEMNITY NOT-LIKELY MED LIKELY MED NOT-LIKELY TOTAL TOTAL
POLICY PERIOD PAYROLL CASES AMOUNT CASES AMOUNT AMOUNT AMOUNT AMOUNT PURE PREM.7/07 through 6/08 30,221 0 0 0 0 0 0 0 0.007/08 through 6/09 31,246 0 0 0 0 0 0 0 0.007/09 through 6/10 47,825 0 0 0 0 0 0 0 0.007/10 through 6/11 80,297 0 0 0 0 0 0 0 0.007/11 through 6/12 48,321 0 0 0 0 0 0 0 0.00
5 YR. TOTAL 237,910 0 0 0 0 0 0 0 0.00INDEMNITY MEDICAL TOTAL
CRED. PURE PREM.* CRED. PURE PREM.* PURE PREM.*Indicated Pure Premium 3% 0.000 4% 0.000 0.00Pure Premium Indicated by National Relativity 26% 1.119 28% 1.352 2.47Pure Premium Present on Rate Level 71% 1.306 68% 2.143 3.45Pure Premium Derived by Formula 1.218 1.836 3.05
CLASS IRRIGATION WORKS OPERATION & DRIVERS
0251
Industry Group: Miscellaneous CONVERTED LOSSESHazard Group: C INDEMNITY LIKELY INDEMNITY NOT-LIKELY MED LIKELY MED NOT-LIKELY TOTAL TOTAL
POLICY PERIOD PAYROLL CASES AMOUNT CASES AMOUNT AMOUNT AMOUNT AMOUNT PURE PREM.7/07 through 6/08 964,517 0 0 0 0 0 2,396 2,396 0.257/08 through 6/09 761,686 0 0 2 35,732 0 68,645 104,377 13.707/09 through 6/10 881,530 0 0 0 0 0 564 564 0.067/10 through 6/11 885,298 0 0 1 10,646 0 13,179 23,825 2.697/11 through 6/12 995,283 0 0 1 12,926 0 12,103 25,029 2.52
5 YR. TOTAL 4,488,314 0 0 4 59,304 0 96,887 156,191 3.48INDEMNITY MEDICAL TOTAL
CRED. PURE PREM.* CRED. PURE PREM.* PURE PREM.*Indicated Pure Premium 11% 1.321 14% 2.159 3.48Pure Premium Indicated by National Relativity 44% 1.273 43% 2.303 3.58Pure Premium Present on Rate Level 45% 1.524 43% 2.275 3.80Pure Premium Derived by Formula 1.391 2.271 3.66
Page 5
* Pure Premium per $100 of Payroll** Pure Premium per employee++ Non-Standard Calculation© Copyright 2014 National Council on Compensation Insurance, Inc. All Rights Reserved.

MISSOURI
EFFECTIVE 1/1/2015CLASS COTTON COMPRESSING & DRIVERS
0400
Industry Group: Goods and Services CONVERTED LOSSESHazard Group: D INDEMNITY LIKELY INDEMNITY NOT-LIKELY MED LIKELY MED NOT-LIKELY TOTAL TOTAL
POLICY PERIOD PAYROLL CASES AMOUNT CASES AMOUNT AMOUNT AMOUNT AMOUNT PURE PREM.7/07 through 6/08 5,370 0 0 0 0 0 0 0 0.007/08 through 6/09 0 0 0 0 0 0 0 0 0.007/09 through 6/10 0 0 0 0 0 0 0 0 0.007/10 through 6/11 0 0 0 0 0 0 0 0 0.007/11 through 6/12 0 0 0 0 0 0 0 0 0.00
5 YR. TOTAL 5,370 0 0 0 0 0 0 0 0.00INDEMNITY MEDICAL TOTAL
CRED. PURE PREM.* CRED. PURE PREM.* PURE PREM.*Indicated Pure Premium 1% 0.000 1% 0.000 0.00Pure Premium Indicated by National Relativity 0% 0.000 0% 0.173 0.17Pure Premium Present on Rate Level 99% 3.130 99% 3.374 6.50Pure Premium Derived by Formula 3.099 3.340 6.44
CLASS COTTON GIN OPERATION & LOCAL MANAGERS, DRIVERS
0401
Industry Group: Goods and Services CONVERTED LOSSESHazard Group: F INDEMNITY LIKELY INDEMNITY NOT-LIKELY MED LIKELY MED NOT-LIKELY TOTAL TOTAL
POLICY PERIOD PAYROLL CASES AMOUNT CASES AMOUNT AMOUNT AMOUNT AMOUNT PURE PREM.7/07 through 6/08 6,577,543 1 11,829 7 181,380 28,342 103,438 324,989 4.947/08 through 6/09 6,610,855 1 13,775 6 99,817 23,584 125,052 262,228 3.977/09 through 6/10 6,766,160 1 124,500 8 74,978 147,752 102,472 449,702 6.657/10 through 6/11 8,015,081 0 0 8 372,399 0 515,284 887,683 11.087/11 through 6/12 8,520,379 1 137,514 5 317,808 290,932 463,813 1,210,067 14.20
5 YR. TOTAL 36,490,018 4 287,618 34 1,046,382 490,610 1,310,059 3,134,669 8.59INDEMNITY MEDICAL TOTAL
CRED. PURE PREM.* CRED. PURE PREM.* PURE PREM.*Indicated Pure Premium 34% 3.656 46% 4.935 8.59Pure Premium Indicated by National Relativity 33% 3.421 27% 6.247 9.67Pure Premium Present on Rate Level 33% 3.085 27% 4.923 8.01Pure Premium Derived by Formula 3.390 5.286 8.68
CLASS DOMESTIC WORKERS - RESIDENCES - PART-TIME
0908 + +
Industry Group: Goods and Services CONVERTED LOSSESHazard Group: C INDEMNITY LIKELY INDEMNITY NOT-LIKELY MED LIKELY MED NOT-LIKELY TOTAL TOTAL
POLICY PERIOD EXPOSURE CASES AMOUNT CASES AMOUNT AMOUNT AMOUNT AMOUNT PURE PREM.7/07 through 6/08 2,405 0 0 1 22,647 0 10,129 32,776 136.287/08 through 6/09 2,285 0 0 1 11,360 0 37,470 48,830 213.707/09 through 6/10 2,255 0 0 0 0 0 100 100 0.447/10 through 6/11 2,401 0 0 1 20,918 0 24,040 44,958 187.257/11 through 6/12 2,726 1 27,704 0 0 175,790 0 203,494 746.49
5 YR. TOTAL 12,072 1 27,704 3 54,925 175,790 71,739 330,158 273.49INDEMNITY MEDICAL TOTAL
CRED. PURE PREM.** CRED. PURE PREM.** PURE PREM.**Indicated Pure Premium 11% 68.447 14% 205.043 273.49Pure Premium Indicated by National Relativity 33% 41.532 35% 70.280 111.81Pure Premium Present on Rate Level 56% 56.675 51% 72.399 129.07Pure Premium Derived by Formula 52.973 90.228 143.20
Page 6
* Pure Premium per $100 of Payroll** Pure Premium per employee++ Non-Standard Calculation© Copyright 2014 National Council on Compensation Insurance, Inc. All Rights Reserved.

MISSOURI
EFFECTIVE 1/1/2015CLASS DOMESTIC WORKERS - RESIDENCES - FULL-TIME
0913 + +
Industry Group: Goods and Services CONVERTED LOSSESHazard Group: C INDEMNITY LIKELY INDEMNITY NOT-LIKELY MED LIKELY MED NOT-LIKELY TOTAL TOTAL
POLICY PERIOD EXPOSURE CASES AMOUNT CASES AMOUNT AMOUNT AMOUNT AMOUNT PURE PREM.7/07 through 6/08 4,131 0 0 3 39,571 0 34,304 73,875 178.837/08 through 6/09 3,826 0 0 2 71,964 0 144,675 216,639 566.237/09 through 6/10 3,315 0 0 0 0 0 2,736 2,736 8.257/10 through 6/11 3,161 0 0 0 0 0 0 0 0.007/11 through 6/12 2,937 0 0 3 26,597 0 55,178 81,775 278.43
5 YR. TOTAL 17,370 0 0 8 138,132 0 236,893 375,025 215.91INDEMNITY MEDICAL TOTAL
CRED. PURE PREM.** CRED. PURE PREM.** PURE PREM.**Indicated Pure Premium 18% 79.524 25% 136.381 215.91Pure Premium Indicated by National Relativity 41% 186.263 37% 245.300 431.56Pure Premium Present on Rate Level 41% 141.200 38% 240.179 381.38Pure Premium Derived by Formula 148.574 216.124 364.70
CLASS RESIDENTIAL CLEANING SERVICES BY CONTRACTOR - INSIDE
0917
Industry Group: Goods and Services CONVERTED LOSSESHazard Group: B INDEMNITY LIKELY INDEMNITY NOT-LIKELY MED LIKELY MED NOT-LIKELY TOTAL TOTAL
POLICY PERIOD PAYROLL CASES AMOUNT CASES AMOUNT AMOUNT AMOUNT AMOUNT PURE PREM.7/07 through 6/08 3,151,141 1 6,708 5 12,667 0 29,552 48,927 1.557/08 through 6/09 5,018,035 0 0 5 43,754 0 110,220 153,974 3.077/09 through 6/10 6,950,616 4 108,123 6 16,173 182,855 36,191 343,342 4.947/10 through 6/11 8,355,230 0 0 12 132,540 0 256,997 389,537 4.667/11 through 6/12 9,441,703 1 20,202 12 117,801 29,552 276,052 443,607 4.70
5 YR. TOTAL 32,916,725 6 135,033 40 322,935 212,407 709,012 1,379,387 4.19INDEMNITY MEDICAL TOTAL
CRED. PURE PREM.* CRED. PURE PREM.* PURE PREM.*Indicated Pure Premium 25% 1.391 34% 2.799 4.19Pure Premium Indicated by National Relativity 37% 1.612 33% 2.737 4.35Pure Premium Present on Rate Level 38% 1.594 33% 2.638 4.23Pure Premium Derived by Formula 1.550 2.725 4.28
CLASS COAL MINING-SURFACE & DRIVERS
1005
Industry Group: Miscellaneous CONVERTED LOSSESHazard Group: G INDEMNITY LIKELY INDEMNITY NOT-LIKELY MED LIKELY MED NOT-LIKELY TOTAL TOTAL
POLICY PERIOD PAYROLL CASES AMOUNT CASES AMOUNT AMOUNT AMOUNT AMOUNT PURE PREM.7/07 through 6/08 315,925 0 0 0 0 0 0 0 0.007/08 through 6/09 1,900,420 0 0 0 0 0 0 0 0.007/09 through 6/10 1,780,498 0 0 0 0 0 0 0 0.007/10 through 6/11 1,962,671 0 0 0 0 0 0 0 0.007/11 through 6/12 2,080,820 0 0 0 0 0 0 0 0.00
5 YR. TOTAL 8,040,334 0 0 0 0 0 0 0 0.00INDEMNITY MEDICAL TOTAL
CRED. PURE PREM.* CRED. PURE PREM.* PURE PREM.*Indicated Pure Premium 15% 0.000 17% 0.000 0.00Pure Premium Indicated by National Relativity 42% 2.510 41% 2.458 4.97Pure Premium Present on Rate Level 43% 2.071 42% 1.972 4.04Pure Premium Derived by Formula 1.945 1.836 3.78
Page 7
* Pure Premium per $100 of Payroll** Pure Premium per employee++ Non-Standard Calculation© Copyright 2014 National Council on Compensation Insurance, Inc. All Rights Reserved.
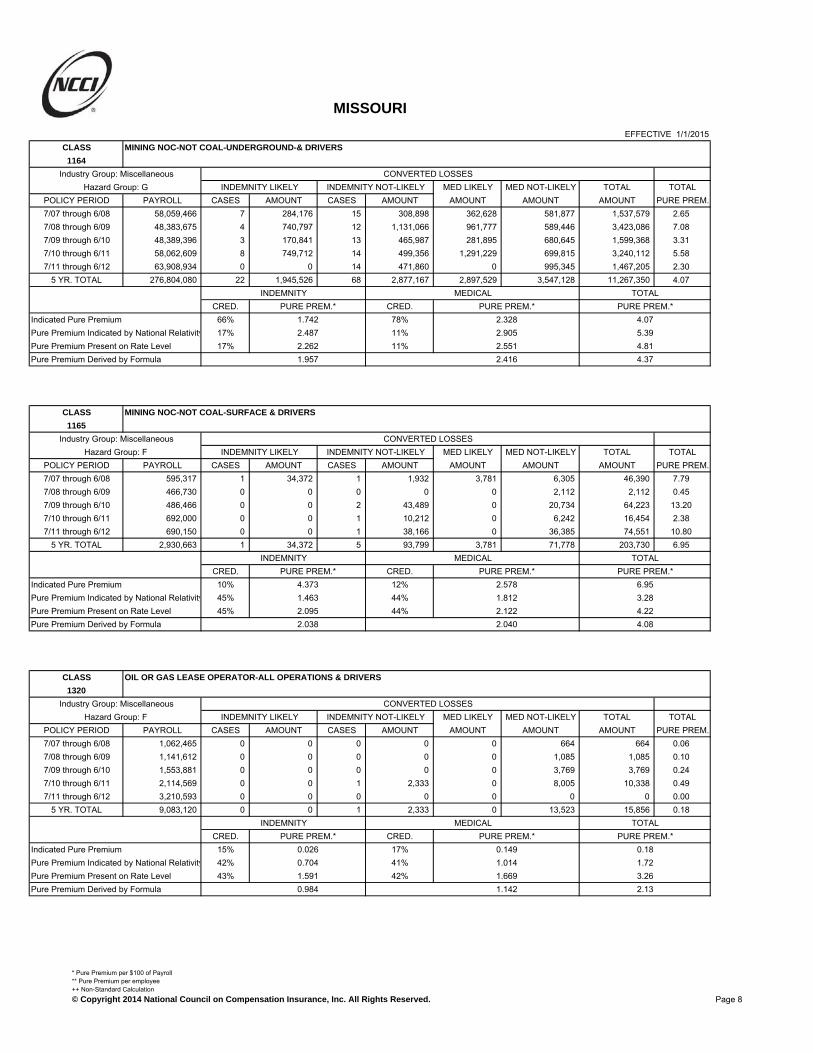
MISSOURI
EFFECTIVE 1/1/2015CLASS MINING NOC-NOT COAL-UNDERGROUND-& DRIVERS
1164
Industry Group: Miscellaneous CONVERTED LOSSESHazard Group: G INDEMNITY LIKELY INDEMNITY NOT-LIKELY MED LIKELY MED NOT-LIKELY TOTAL TOTAL
POLICY PERIOD PAYROLL CASES AMOUNT CASES AMOUNT AMOUNT AMOUNT AMOUNT PURE PREM.7/07 through 6/08 58,059,466 7 284,176 15 308,898 362,628 581,877 1,537,579 2.657/08 through 6/09 48,383,675 4 740,797 12 1,131,066 961,777 589,446 3,423,086 7.087/09 through 6/10 48,389,396 3 170,841 13 465,987 281,895 680,645 1,599,368 3.317/10 through 6/11 58,062,609 8 749,712 14 499,356 1,291,229 699,815 3,240,112 5.587/11 through 6/12 63,908,934 0 0 14 471,860 0 995,345 1,467,205 2.30
5 YR. TOTAL 276,804,080 22 1,945,526 68 2,877,167 2,897,529 3,547,128 11,267,350 4.07INDEMNITY MEDICAL TOTAL
CRED. PURE PREM.* CRED. PURE PREM.* PURE PREM.*Indicated Pure Premium 66% 1.742 78% 2.328 4.07Pure Premium Indicated by National Relativity 17% 2.487 11% 2.905 5.39Pure Premium Present on Rate Level 17% 2.262 11% 2.551 4.81Pure Premium Derived by Formula 1.957 2.416 4.37
CLASS MINING NOC-NOT COAL-SURFACE & DRIVERS
1165
Industry Group: Miscellaneous CONVERTED LOSSESHazard Group: F INDEMNITY LIKELY INDEMNITY NOT-LIKELY MED LIKELY MED NOT-LIKELY TOTAL TOTAL
POLICY PERIOD PAYROLL CASES AMOUNT CASES AMOUNT AMOUNT AMOUNT AMOUNT PURE PREM.7/07 through 6/08 595,317 1 34,372 1 1,932 3,781 6,305 46,390 7.797/08 through 6/09 466,730 0 0 0 0 0 2,112 2,112 0.457/09 through 6/10 486,466 0 0 2 43,489 0 20,734 64,223 13.207/10 through 6/11 692,000 0 0 1 10,212 0 6,242 16,454 2.387/11 through 6/12 690,150 0 0 1 38,166 0 36,385 74,551 10.80
5 YR. TOTAL 2,930,663 1 34,372 5 93,799 3,781 71,778 203,730 6.95INDEMNITY MEDICAL TOTAL
CRED. PURE PREM.* CRED. PURE PREM.* PURE PREM.*Indicated Pure Premium 10% 4.373 12% 2.578 6.95Pure Premium Indicated by National Relativity 45% 1.463 44% 1.812 3.28Pure Premium Present on Rate Level 45% 2.095 44% 2.122 4.22Pure Premium Derived by Formula 2.038 2.040 4.08
CLASS OIL OR GAS LEASE OPERATOR-ALL OPERATIONS & DRIVERS
1320
Industry Group: Miscellaneous CONVERTED LOSSESHazard Group: F INDEMNITY LIKELY INDEMNITY NOT-LIKELY MED LIKELY MED NOT-LIKELY TOTAL TOTAL
POLICY PERIOD PAYROLL CASES AMOUNT CASES AMOUNT AMOUNT AMOUNT AMOUNT PURE PREM.7/07 through 6/08 1,062,465 0 0 0 0 0 664 664 0.067/08 through 6/09 1,141,612 0 0 0 0 0 1,085 1,085 0.107/09 through 6/10 1,553,881 0 0 0 0 0 3,769 3,769 0.247/10 through 6/11 2,114,569 0 0 1 2,333 0 8,005 10,338 0.497/11 through 6/12 3,210,593 0 0 0 0 0 0 0 0.00
5 YR. TOTAL 9,083,120 0 0 1 2,333 0 13,523 15,856 0.18INDEMNITY MEDICAL TOTAL
CRED. PURE PREM.* CRED. PURE PREM.* PURE PREM.*Indicated Pure Premium 15% 0.026 17% 0.149 0.18Pure Premium Indicated by National Relativity 42% 0.704 41% 1.014 1.72Pure Premium Present on Rate Level 43% 1.591 42% 1.669 3.26Pure Premium Derived by Formula 0.984 1.142 2.13
Page 8
* Pure Premium per $100 of Payroll** Pure Premium per employee++ Non-Standard Calculation© Copyright 2014 National Council on Compensation Insurance, Inc. All Rights Reserved.
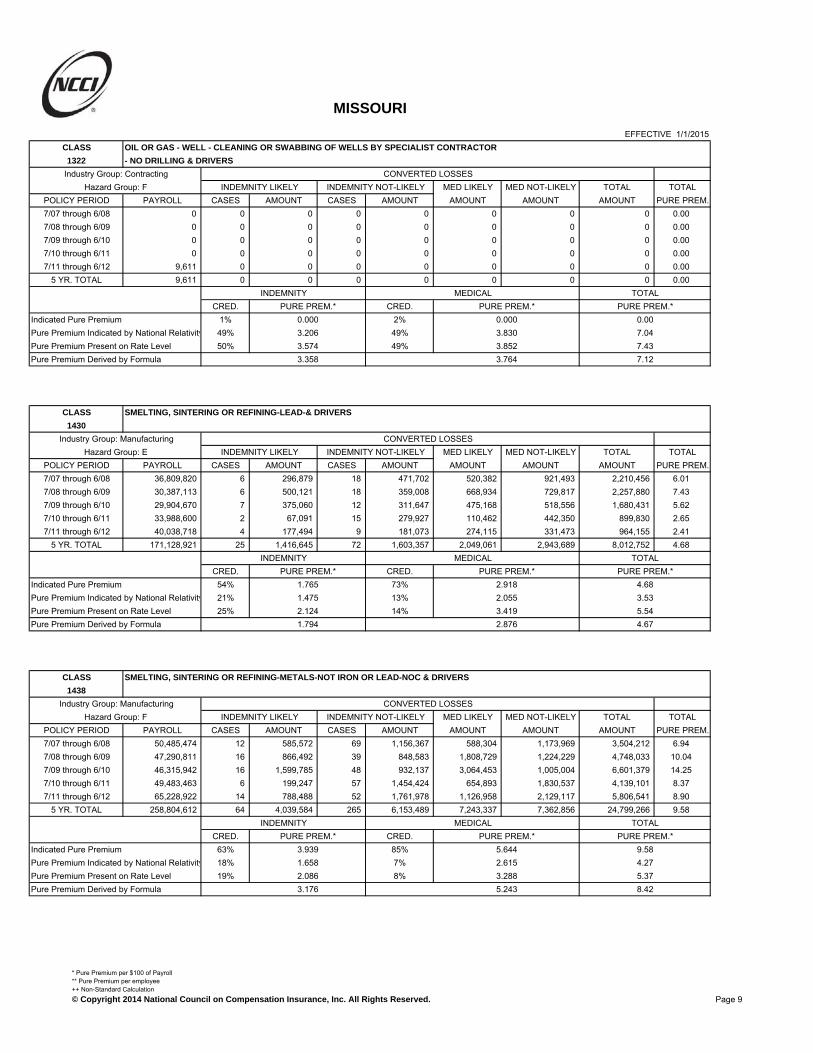
MISSOURI
EFFECTIVE 1/1/2015CLASS OIL OR GAS - WELL - CLEANING OR SWABBING OF WELLS BY SPECIALIST CONTRACTOR
1322 - NO DRILLING & DRIVERS
Industry Group: Contracting CONVERTED LOSSESHazard Group: F INDEMNITY LIKELY INDEMNITY NOT-LIKELY MED LIKELY MED NOT-LIKELY TOTAL TOTAL
POLICY PERIOD PAYROLL CASES AMOUNT CASES AMOUNT AMOUNT AMOUNT AMOUNT PURE PREM.7/07 through 6/08 0 0 0 0 0 0 0 0 0.007/08 through 6/09 0 0 0 0 0 0 0 0 0.007/09 through 6/10 0 0 0 0 0 0 0 0 0.007/10 through 6/11 0 0 0 0 0 0 0 0 0.007/11 through 6/12 9,611 0 0 0 0 0 0 0 0.00
5 YR. TOTAL 9,611 0 0 0 0 0 0 0 0.00INDEMNITY MEDICAL TOTAL
CRED. PURE PREM.* CRED. PURE PREM.* PURE PREM.*Indicated Pure Premium 1% 0.000 2% 0.000 0.00Pure Premium Indicated by National Relativity 49% 3.206 49% 3.830 7.04Pure Premium Present on Rate Level 50% 3.574 49% 3.852 7.43Pure Premium Derived by Formula 3.358 3.764 7.12
CLASS SMELTING, SINTERING OR REFINING-LEAD-& DRIVERS
1430
Industry Group: Manufacturing CONVERTED LOSSESHazard Group: E INDEMNITY LIKELY INDEMNITY NOT-LIKELY MED LIKELY MED NOT-LIKELY TOTAL TOTAL
POLICY PERIOD PAYROLL CASES AMOUNT CASES AMOUNT AMOUNT AMOUNT AMOUNT PURE PREM.7/07 through 6/08 36,809,820 6 296,879 18 471,702 520,382 921,493 2,210,456 6.017/08 through 6/09 30,387,113 6 500,121 18 359,008 668,934 729,817 2,257,880 7.437/09 through 6/10 29,904,670 7 375,060 12 311,647 475,168 518,556 1,680,431 5.627/10 through 6/11 33,988,600 2 67,091 15 279,927 110,462 442,350 899,830 2.657/11 through 6/12 40,038,718 4 177,494 9 181,073 274,115 331,473 964,155 2.41
5 YR. TOTAL 171,128,921 25 1,416,645 72 1,603,357 2,049,061 2,943,689 8,012,752 4.68INDEMNITY MEDICAL TOTAL
CRED. PURE PREM.* CRED. PURE PREM.* PURE PREM.*Indicated Pure Premium 54% 1.765 73% 2.918 4.68Pure Premium Indicated by National Relativity 21% 1.475 13% 2.055 3.53Pure Premium Present on Rate Level 25% 2.124 14% 3.419 5.54Pure Premium Derived by Formula 1.794 2.876 4.67
CLASS SMELTING, SINTERING OR REFINING-METALS-NOT IRON OR LEAD-NOC & DRIVERS
1438
Industry Group: Manufacturing CONVERTED LOSSESHazard Group: F INDEMNITY LIKELY INDEMNITY NOT-LIKELY MED LIKELY MED NOT-LIKELY TOTAL TOTAL
POLICY PERIOD PAYROLL CASES AMOUNT CASES AMOUNT AMOUNT AMOUNT AMOUNT PURE PREM.7/07 through 6/08 50,485,474 12 585,572 69 1,156,367 588,304 1,173,969 3,504,212 6.947/08 through 6/09 47,290,811 16 866,492 39 848,583 1,808,729 1,224,229 4,748,033 10.047/09 through 6/10 46,315,942 16 1,599,785 48 932,137 3,064,453 1,005,004 6,601,379 14.257/10 through 6/11 49,483,463 6 199,247 57 1,454,424 654,893 1,830,537 4,139,101 8.377/11 through 6/12 65,228,922 14 788,488 52 1,761,978 1,126,958 2,129,117 5,806,541 8.90
5 YR. TOTAL 258,804,612 64 4,039,584 265 6,153,489 7,243,337 7,362,856 24,799,266 9.58INDEMNITY MEDICAL TOTAL
CRED. PURE PREM.* CRED. PURE PREM.* PURE PREM.*Indicated Pure Premium 63% 3.939 85% 5.644 9.58Pure Premium Indicated by National Relativity 18% 1.658 7% 2.615 4.27Pure Premium Present on Rate Level 19% 2.086 8% 3.288 5.37Pure Premium Derived by Formula 3.176 5.243 8.42
Page 9
* Pure Premium per $100 of Payroll** Pure Premium per employee++ Non-Standard Calculation© Copyright 2014 National Council on Compensation Insurance, Inc. All Rights Reserved.

MISSOURI
EFFECTIVE 1/1/2015CLASS ORE MILLING & DRIVERS
1452
Industry Group: Manufacturing CONVERTED LOSSESHazard Group: E INDEMNITY LIKELY INDEMNITY NOT-LIKELY MED LIKELY MED NOT-LIKELY TOTAL TOTAL
POLICY PERIOD PAYROLL CASES AMOUNT CASES AMOUNT AMOUNT AMOUNT AMOUNT PURE PREM.7/07 through 6/08 1,524,574 0 0 1 46,962 0 45,918 92,880 6.097/08 through 6/09 1,735,375 0 0 5 8,751 0 47,209 55,960 3.227/09 through 6/10 1,423,316 2 53,735 1 23,184 87,873 6,490 171,282 12.037/10 through 6/11 1,615,078 0 0 1 50,192 0 86,485 136,677 8.467/11 through 6/12 1,382,177 0 0 0 0 0 0 0 0.00
5 YR. TOTAL 7,680,520 2 53,735 8 129,089 87,873 186,102 456,799 5.95INDEMNITY MEDICAL TOTAL
CRED. PURE PREM.* CRED. PURE PREM.* PURE PREM.*Indicated Pure Premium 13% 2.380 16% 3.567 5.95Pure Premium Indicated by National Relativity 43% 1.308 42% 1.563 2.87Pure Premium Present on Rate Level 44% 1.271 42% 1.801 3.07Pure Premium Derived by Formula 1.431 1.984 3.42
CLASS ASPHALT WORKS OPERATED BY PAVING CONTRACTORS - PERMANENT LOCATION & DRIVERS
1463
Industry Group: Manufacturing CONVERTED LOSSESHazard Group: F INDEMNITY LIKELY INDEMNITY NOT-LIKELY MED LIKELY MED NOT-LIKELY TOTAL TOTAL
POLICY PERIOD PAYROLL CASES AMOUNT CASES AMOUNT AMOUNT AMOUNT AMOUNT PURE PREM.7/07 through 6/08 9,554,463 2 93,610 9 326,856 119,755 354,876 895,097 9.377/08 through 6/09 9,224,017 2 44,704 10 333,488 49,879 365,424 793,495 8.607/09 through 6/10 9,786,218 2 105,203 12 481,999 104,234 803,734 1,495,170 15.287/10 through 6/11 9,624,950 2 152,919 5 173,358 802,375 366,391 1,495,043 15.537/11 through 6/12 9,855,480 1 43,893 3 54,330 54,143 173,829 326,195 3.31
5 YR. TOTAL 48,045,128 9 440,329 39 1,370,031 1,130,386 2,064,254 5,005,000 10.42INDEMNITY MEDICAL TOTAL
CRED. PURE PREM.* CRED. PURE PREM.* PURE PREM.*Indicated Pure Premium 43% 3.768 57% 6.649 10.42Pure Premium Indicated by National Relativity 28% 3.547 21% 5.777 9.32Pure Premium Present on Rate Level 29% 4.220 22% 6.371 10.59Pure Premium Derived by Formula 3.837 6.405 10.24
CLASS DISTILLATION-WOOD-& DRIVERS
1472
Industry Group: Manufacturing CONVERTED LOSSESHazard Group: F INDEMNITY LIKELY INDEMNITY NOT-LIKELY MED LIKELY MED NOT-LIKELY TOTAL TOTAL
POLICY PERIOD PAYROLL CASES AMOUNT CASES AMOUNT AMOUNT AMOUNT AMOUNT PURE PREM.7/07 through 6/08 13,508,421 2 81,922 6 50,055 228,881 102,066 462,924 3.437/08 through 6/09 14,857,466 2 39,828 14 217,298 120,606 468,737 846,469 5.707/09 through 6/10 15,112,018 2 127,857 6 40,356 191,685 148,707 508,605 3.377/10 through 6/11 16,701,042 2 94,694 7 8,511 91,125 91,221 285,551 1.717/11 through 6/12 17,132,173 0 0 4 47,684 0 217,981 265,665 1.55
5 YR. TOTAL 77,311,120 8 344,301 37 363,904 632,297 1,028,712 2,369,214 3.06INDEMNITY MEDICAL TOTAL
CRED. PURE PREM.* CRED. PURE PREM.* PURE PREM.*Indicated Pure Premium 30% 0.916 44% 2.148 3.06Pure Premium Indicated by National Relativity 20% 2.266 21% 5.329 7.60Pure Premium Present on Rate Level 50% 1.074 35% 2.066 3.14Pure Premium Derived by Formula 1.265 2.787 4.05
Page 10
* Pure Premium per $100 of Payroll** Pure Premium per employee++ Non-Standard Calculation© Copyright 2014 National Council on Compensation Insurance, Inc. All Rights Reserved.

MISSOURI
EFFECTIVE 1/1/2015CLASS QUARRY NOC & DRIVERS
1624
Industry Group: Miscellaneous CONVERTED LOSSESHazard Group: F INDEMNITY LIKELY INDEMNITY NOT-LIKELY MED LIKELY MED NOT-LIKELY TOTAL TOTAL
POLICY PERIOD PAYROLL CASES AMOUNT CASES AMOUNT AMOUNT AMOUNT AMOUNT PURE PREM.7/07 through 6/08 95,024,393 4 256,793 39 594,285 551,165 964,881 2,367,124 2.497/08 through 6/09 96,725,681 7 240,607 35 1,056,247 142,923 1,720,391 3,160,168 3.277/09 through 6/10 62,369,670 4 705,091 20 176,141 951,355 531,079 2,363,666 3.797/10 through 6/11 63,160,161 5 723,567 18 375,375 751,741 903,245 2,753,928 4.367/11 through 6/12 70,328,084 5 516,268 28 744,496 710,131 1,173,530 3,144,425 4.47
5 YR. TOTAL 387,607,989 25 2,442,326 140 2,946,544 3,107,315 5,293,126 13,789,311 3.56INDEMNITY MEDICAL TOTAL
CRED. PURE PREM.* CRED. PURE PREM.* PURE PREM.*Indicated Pure Premium 59% 1.390 76% 2.167 3.56Pure Premium Indicated by National Relativity 20% 1.474 12% 1.882 3.36Pure Premium Present on Rate Level 21% 1.197 12% 1.729 2.93Pure Premium Derived by Formula 1.366 2.080 3.45
CLASS LIME MFG
1642
Industry Group: Manufacturing CONVERTED LOSSESHazard Group: E INDEMNITY LIKELY INDEMNITY NOT-LIKELY MED LIKELY MED NOT-LIKELY TOTAL TOTAL
POLICY PERIOD PAYROLL CASES AMOUNT CASES AMOUNT AMOUNT AMOUNT AMOUNT PURE PREM.7/07 through 6/08 24,907,858 2 140,675 10 615,072 162,965 201,913 1,120,625 4.507/08 through 6/09 24,241,384 2 118,428 9 185,887 449,243 394,857 1,148,415 4.747/09 through 6/10 23,423,926 1 87,531 11 230,973 143,260 382,731 844,495 3.617/10 through 6/11 20,273,527 1 14,927 10 306,953 26,253 480,931 829,064 4.097/11 through 6/12 28,866,501 1 40,331 10 319,579 85,510 492,478 937,898 3.25
5 YR. TOTAL 121,713,196 7 401,892 50 1,658,464 867,231 1,952,910 4,880,497 4.01INDEMNITY MEDICAL TOTAL
CRED. PURE PREM.* CRED. PURE PREM.* PURE PREM.*Indicated Pure Premium 42% 1.693 56% 2.317 4.01Pure Premium Indicated by National Relativity 29% 0.763 22% 1.094 1.86Pure Premium Present on Rate Level 29% 1.596 22% 2.419 4.02Pure Premium Derived by Formula 1.395 2.070 3.47
CLASS QUARRY-CEMENT ROCK-SURFACE-& DRIVERS
1654
Industry Group: Miscellaneous CONVERTED LOSSESHazard Group: E INDEMNITY LIKELY INDEMNITY NOT-LIKELY MED LIKELY MED NOT-LIKELY TOTAL TOTAL
POLICY PERIOD PAYROLL CASES AMOUNT CASES AMOUNT AMOUNT AMOUNT AMOUNT PURE PREM.7/07 through 6/08 4,435,476 0 0 7 62,519 0 130,282 192,801 4.357/08 through 6/09 4,795,733 2 21,132 6 70,842 2,132 252,546 346,652 7.237/09 through 6/10 2,844,973 0 0 1 12,335 0 26,469 38,804 1.367/10 through 6/11 3,104,168 0 0 0 0 0 0 0 0.007/11 through 6/12 2,306,478 1 53,527 0 0 45,836 21,934 121,297 5.26
5 YR. TOTAL 17,486,828 3 74,659 14 145,696 47,968 431,231 699,554 4.00INDEMNITY MEDICAL TOTAL
CRED. PURE PREM.* CRED. PURE PREM.* PURE PREM.*Indicated Pure Premium 24% 1.260 33% 2.740 4.00Pure Premium Indicated by National Relativity 32% 4.006 33% 5.739 9.75Pure Premium Present on Rate Level 44% 2.821 34% 4.739 7.56Pure Premium Derived by Formula 2.826 4.409 7.24
Page 11
* Pure Premium per $100 of Payroll** Pure Premium per employee++ Non-Standard Calculation© Copyright 2014 National Council on Compensation Insurance, Inc. All Rights Reserved.

MISSOURI
EFFECTIVE 1/1/2015CLASS LIME MFG-QUARRY-SURFACE-& DRIVERS
1655
Industry Group: Miscellaneous CONVERTED LOSSESHazard Group: E INDEMNITY LIKELY INDEMNITY NOT-LIKELY MED LIKELY MED NOT-LIKELY TOTAL TOTAL
POLICY PERIOD PAYROLL CASES AMOUNT CASES AMOUNT AMOUNT AMOUNT AMOUNT PURE PREM.7/07 through 6/08 9,613,144 0 0 3 45,661 0 141,675 187,336 1.957/08 through 6/09 8,560,021 0 0 2 14,686 0 38,732 53,418 0.627/09 through 6/10 8,849,840 0 0 1 740 0 11,648 12,388 0.147/10 through 6/11 9,046,582 0 0 1 7,900 0 7,921 15,821 0.187/11 through 6/12 9,631,132 0 0 1 23,307 0 64,294 87,601 0.91
5 YR. TOTAL 45,700,719 0 0 8 92,294 0 264,270 356,564 0.78INDEMNITY MEDICAL TOTAL
CRED. PURE PREM.* CRED. PURE PREM.* PURE PREM.*Indicated Pure Premium 24% 0.202 31% 0.578 0.78Pure Premium Indicated by National Relativity 24% 1.105 26% 1.415 2.52Pure Premium Present on Rate Level 52% 1.144 43% 1.597 2.74Pure Premium Derived by Formula 0.909 1.234 2.14
CLASS ROCK WOOL MFG
1699
Industry Group: Manufacturing CONVERTED LOSSESHazard Group: E INDEMNITY LIKELY INDEMNITY NOT-LIKELY MED LIKELY MED NOT-LIKELY TOTAL TOTAL
POLICY PERIOD PAYROLL CASES AMOUNT CASES AMOUNT AMOUNT AMOUNT AMOUNT PURE PREM.7/07 through 6/08 3,336,123 0 0 0 0 0 0 0 0.007/08 through 6/09 2,734,662 0 0 0 0 0 1,762 1,762 0.067/09 through 6/10 206,674 0 0 0 0 0 2,216 2,216 1.077/10 through 6/11 157,124 0 0 0 0 0 0 0 0.007/11 through 6/12 196,025 0 0 0 0 0 0 0 0.00
5 YR. TOTAL 6,630,608 0 0 0 0 0 3,978 3,978 0.06INDEMNITY MEDICAL TOTAL
CRED. PURE PREM.* CRED. PURE PREM.* PURE PREM.*Indicated Pure Premium 11% 0.000 15% 0.060 0.06Pure Premium Indicated by National Relativity 40% 1.105 42% 2.162 3.27Pure Premium Present on Rate Level 49% 1.149 43% 1.640 2.79Pure Premium Derived by Formula 1.005 1.622 2.63
CLASS CEMENT MFG
1701
Industry Group: Manufacturing CONVERTED LOSSESHazard Group: E INDEMNITY LIKELY INDEMNITY NOT-LIKELY MED LIKELY MED NOT-LIKELY TOTAL TOTAL
POLICY PERIOD PAYROLL CASES AMOUNT CASES AMOUNT AMOUNT AMOUNT AMOUNT PURE PREM.7/07 through 6/08 45,534,607 1 21,498 29 273,131 15,410 560,796 870,835 1.917/08 through 6/09 65,038,568 10 454,593 26 409,333 447,471 954,844 2,266,241 3.487/09 through 6/10 56,654,867 2 108,850 22 292,142 164,386 559,340 1,124,718 1.997/10 through 6/11 55,062,531 2 121,491 31 642,088 106,263 1,246,784 2,116,626 3.847/11 through 6/12 55,683,766 3 137,995 17 246,153 114,710 609,391 1,108,249 1.99
5 YR. TOTAL 277,974,339 18 844,427 125 1,862,847 848,240 3,931,155 7,486,669 2.69INDEMNITY MEDICAL TOTAL
CRED. PURE PREM.* CRED. PURE PREM.* PURE PREM.*Indicated Pure Premium 51% 0.974 69% 1.719 2.69Pure Premium Indicated by National Relativity 24% 1.271 15% 1.945 3.22Pure Premium Present on Rate Level 25% 1.150 16% 1.825 2.98Pure Premium Derived by Formula 1.089 1.770 2.86
Page 12
* Pure Premium per $100 of Payroll** Pure Premium per employee++ Non-Standard Calculation© Copyright 2014 National Council on Compensation Insurance, Inc. All Rights Reserved.
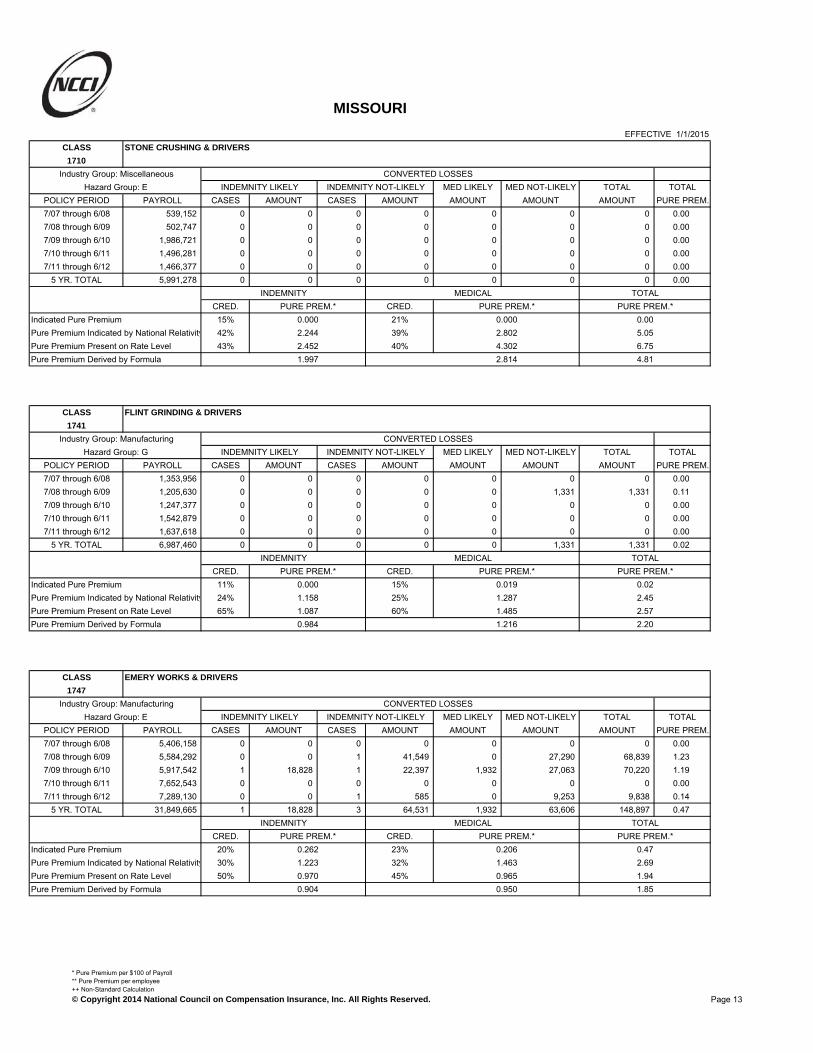
MISSOURI
EFFECTIVE 1/1/2015CLASS STONE CRUSHING & DRIVERS
1710
Industry Group: Miscellaneous CONVERTED LOSSESHazard Group: E INDEMNITY LIKELY INDEMNITY NOT-LIKELY MED LIKELY MED NOT-LIKELY TOTAL TOTAL
POLICY PERIOD PAYROLL CASES AMOUNT CASES AMOUNT AMOUNT AMOUNT AMOUNT PURE PREM.7/07 through 6/08 539,152 0 0 0 0 0 0 0 0.007/08 through 6/09 502,747 0 0 0 0 0 0 0 0.007/09 through 6/10 1,986,721 0 0 0 0 0 0 0 0.007/10 through 6/11 1,496,281 0 0 0 0 0 0 0 0.007/11 through 6/12 1,466,377 0 0 0 0 0 0 0 0.00
5 YR. TOTAL 5,991,278 0 0 0 0 0 0 0 0.00INDEMNITY MEDICAL TOTAL
CRED. PURE PREM.* CRED. PURE PREM.* PURE PREM.*Indicated Pure Premium 15% 0.000 21% 0.000 0.00Pure Premium Indicated by National Relativity 42% 2.244 39% 2.802 5.05Pure Premium Present on Rate Level 43% 2.452 40% 4.302 6.75Pure Premium Derived by Formula 1.997 2.814 4.81
CLASS FLINT GRINDING & DRIVERS
1741
Industry Group: Manufacturing CONVERTED LOSSESHazard Group: G INDEMNITY LIKELY INDEMNITY NOT-LIKELY MED LIKELY MED NOT-LIKELY TOTAL TOTAL
POLICY PERIOD PAYROLL CASES AMOUNT CASES AMOUNT AMOUNT AMOUNT AMOUNT PURE PREM.7/07 through 6/08 1,353,956 0 0 0 0 0 0 0 0.007/08 through 6/09 1,205,630 0 0 0 0 0 1,331 1,331 0.117/09 through 6/10 1,247,377 0 0 0 0 0 0 0 0.007/10 through 6/11 1,542,879 0 0 0 0 0 0 0 0.007/11 through 6/12 1,637,618 0 0 0 0 0 0 0 0.00
5 YR. TOTAL 6,987,460 0 0 0 0 0 1,331 1,331 0.02INDEMNITY MEDICAL TOTAL
CRED. PURE PREM.* CRED. PURE PREM.* PURE PREM.*Indicated Pure Premium 11% 0.000 15% 0.019 0.02Pure Premium Indicated by National Relativity 24% 1.158 25% 1.287 2.45Pure Premium Present on Rate Level 65% 1.087 60% 1.485 2.57Pure Premium Derived by Formula 0.984 1.216 2.20
CLASS EMERY WORKS & DRIVERS
1747
Industry Group: Manufacturing CONVERTED LOSSESHazard Group: E INDEMNITY LIKELY INDEMNITY NOT-LIKELY MED LIKELY MED NOT-LIKELY TOTAL TOTAL
POLICY PERIOD PAYROLL CASES AMOUNT CASES AMOUNT AMOUNT AMOUNT AMOUNT PURE PREM.7/07 through 6/08 5,406,158 0 0 0 0 0 0 0 0.007/08 through 6/09 5,584,292 0 0 1 41,549 0 27,290 68,839 1.237/09 through 6/10 5,917,542 1 18,828 1 22,397 1,932 27,063 70,220 1.197/10 through 6/11 7,652,543 0 0 0 0 0 0 0 0.007/11 through 6/12 7,289,130 0 0 1 585 0 9,253 9,838 0.14
5 YR. TOTAL 31,849,665 1 18,828 3 64,531 1,932 63,606 148,897 0.47INDEMNITY MEDICAL TOTAL
CRED. PURE PREM.* CRED. PURE PREM.* PURE PREM.*Indicated Pure Premium 20% 0.262 23% 0.206 0.47Pure Premium Indicated by National Relativity 30% 1.223 32% 1.463 2.69Pure Premium Present on Rate Level 50% 0.970 45% 0.965 1.94Pure Premium Derived by Formula 0.904 0.950 1.85
Page 13
* Pure Premium per $100 of Payroll** Pure Premium per employee++ Non-Standard Calculation© Copyright 2014 National Council on Compensation Insurance, Inc. All Rights Reserved.

MISSOURI
EFFECTIVE 1/1/2015CLASS ABRASIVE WHEEL MFG & DRIVERS
1748
Industry Group: Manufacturing CONVERTED LOSSESHazard Group: E INDEMNITY LIKELY INDEMNITY NOT-LIKELY MED LIKELY MED NOT-LIKELY TOTAL TOTAL
POLICY PERIOD PAYROLL CASES AMOUNT CASES AMOUNT AMOUNT AMOUNT AMOUNT PURE PREM.7/07 through 6/08 440,286 0 0 0 0 0 1,588 1,588 0.367/08 through 6/09 181,159 1 15,298 4 27,249 11,067 55,746 109,360 60.377/09 through 6/10 479,242 0 0 0 0 0 1,012 1,012 0.217/10 through 6/11 623,015 0 0 1 49,547 0 126,225 175,772 28.217/11 through 6/12 0 0 0 0 0 0 0 0 0.00
5 YR. TOTAL 1,723,702 1 15,298 5 76,796 11,067 184,571 287,732 16.69INDEMNITY MEDICAL TOTAL
CRED. PURE PREM.* CRED. PURE PREM.* PURE PREM.*Indicated Pure Premium 7% 5.343 10% 11.350 16.69Pure Premium Indicated by National Relativity 29% 1.154 30% 2.858 4.01Pure Premium Present on Rate Level 64% 1.196 60% 2.431 3.63Pure Premium Derived by Formula 1.474 3.451 4.93
CLASS STONE CUTTING OR POLISHING NOC & DRIVERS
1803
Industry Group: Manufacturing CONVERTED LOSSESHazard Group: F INDEMNITY LIKELY INDEMNITY NOT-LIKELY MED LIKELY MED NOT-LIKELY TOTAL TOTAL
POLICY PERIOD PAYROLL CASES AMOUNT CASES AMOUNT AMOUNT AMOUNT AMOUNT PURE PREM.7/07 through 6/08 13,969,554 4 158,671 19 313,239 184,216 518,885 1,175,011 8.417/08 through 6/09 11,194,252 0 0 10 169,899 0 317,245 487,144 4.357/09 through 6/10 10,760,741 2 98,895 12 99,490 79,497 216,949 494,831 4.607/10 through 6/11 11,311,635 3 53,250 8 188,255 109,160 290,151 640,816 5.677/11 through 6/12 10,541,494 2 204,055 11 144,401 273,265 271,817 893,538 8.48
5 YR. TOTAL 57,777,676 11 514,871 60 915,284 646,138 1,615,047 3,691,340 6.39INDEMNITY MEDICAL TOTAL
CRED. PURE PREM.* CRED. PURE PREM.* PURE PREM.*Indicated Pure Premium 36% 2.475 46% 3.914 6.39Pure Premium Indicated by National Relativity 32% 2.488 27% 3.827 6.32Pure Premium Present on Rate Level 32% 2.363 27% 3.217 5.58Pure Premium Derived by Formula 2.443 3.702 6.15
CLASS ASBESTOS GOODS MFG
1852
Industry Group: Manufacturing CONVERTED LOSSESHazard Group: G INDEMNITY LIKELY INDEMNITY NOT-LIKELY MED LIKELY MED NOT-LIKELY TOTAL TOTAL
POLICY PERIOD PAYROLL CASES AMOUNT CASES AMOUNT AMOUNT AMOUNT AMOUNT PURE PREM.7/07 through 6/08 0 0 0 0 0 0 0 0 0.007/08 through 6/09 0 0 0 0 0 0 0 0 0.007/09 through 6/10 0 0 0 0 0 0 0 0 0.007/10 through 6/11 0 0 0 0 0 0 0 0 0.007/11 through 6/12 0 0 0 0 0 0 0 0 0.00
5 YR. TOTAL 0 0 0 0 0 0 0 0 0.00INDEMNITY MEDICAL TOTAL
CRED. PURE PREM.* CRED. PURE PREM.* PURE PREM.*Indicated Pure Premium 0% 0.000 0% 0.000 0.00Pure Premium Indicated by National Relativity 16% 0.910 16% 1.588 2.50Pure Premium Present on Rate Level 84% 0.796 84% 1.384 2.18Pure Premium Derived by Formula 0.814 1.417 2.23
Page 14
* Pure Premium per $100 of Payroll** Pure Premium per employee++ Non-Standard Calculation© Copyright 2014 National Council on Compensation Insurance, Inc. All Rights Reserved.

MISSOURI
EFFECTIVE 1/1/2015CLASS MICA GOODS MFG & MICA PREPARING
1853
Industry Group: Manufacturing CONVERTED LOSSESHazard Group: D INDEMNITY LIKELY INDEMNITY NOT-LIKELY MED LIKELY MED NOT-LIKELY TOTAL TOTAL
POLICY PERIOD PAYROLL CASES AMOUNT CASES AMOUNT AMOUNT AMOUNT AMOUNT PURE PREM.7/07 through 6/08 0 0 0 0 0 0 0 0 0.007/08 through 6/09 0 0 0 0 0 0 0 0 0.007/09 through 6/10 0 0 0 0 0 0 0 0 0.007/10 through 6/11 0 0 0 0 0 0 0 0 0.007/11 through 6/12 0 0 0 0 0 0 0 0 0.00
5 YR. TOTAL 0 0 0 0 0 0 0 0 0.00INDEMNITY MEDICAL TOTAL
CRED. PURE PREM.* CRED. PURE PREM.* PURE PREM.*Indicated Pure Premium 0% 0.000 0% 0.000 0.00Pure Premium Indicated by National Relativity 9% 0.418 10% 0.724 1.14Pure Premium Present on Rate Level 91% 1.228 90% 0.847 2.08Pure Premium Derived by Formula 1.155 0.835 1.99
CLASS ABRASIVE PAPER OR CLOTH PREPARATION
1860
Industry Group: Manufacturing CONVERTED LOSSESHazard Group: B INDEMNITY LIKELY INDEMNITY NOT-LIKELY MED LIKELY MED NOT-LIKELY TOTAL TOTAL
POLICY PERIOD PAYROLL CASES AMOUNT CASES AMOUNT AMOUNT AMOUNT AMOUNT PURE PREM.7/07 through 6/08 2,933,911 1 58,235 3 17,200 61,165 35,856 172,456 5.887/08 through 6/09 2,355,939 0 0 0 0 0 2,311 2,311 0.107/09 through 6/10 2,562,958 0 0 0 0 0 1,495 1,495 0.067/10 through 6/11 2,730,367 1 1,368 0 0 0 0 1,368 0.057/11 through 6/12 2,843,837 0 0 2 40,514 0 46,525 87,039 3.06
5 YR. TOTAL 13,427,012 2 59,603 5 57,714 61,165 86,187 264,669 1.97INDEMNITY MEDICAL TOTAL
CRED. PURE PREM.* CRED. PURE PREM.* PURE PREM.*Indicated Pure Premium 13% 0.874 16% 1.097 1.97Pure Premium Indicated by National Relativity 24% 1.221 25% 1.177 2.40Pure Premium Present on Rate Level 63% 0.748 59% 0.964 1.71Pure Premium Derived by Formula 0.878 1.039 1.92
CLASS WIRE DRAWING OR CABLE MFG - NOT IRON OR STEEL
1924
Industry Group: Manufacturing CONVERTED LOSSESHazard Group: B INDEMNITY LIKELY INDEMNITY NOT-LIKELY MED LIKELY MED NOT-LIKELY TOTAL TOTAL
POLICY PERIOD PAYROLL CASES AMOUNT CASES AMOUNT AMOUNT AMOUNT AMOUNT PURE PREM.7/07 through 6/08 3,397,432 0 0 5 242,945 0 293,020 535,965 15.787/08 through 6/09 3,381,206 1 697 5 68,084 226 106,671 175,678 5.207/09 through 6/10 3,825,821 1 2,581 7 93,560 0 54,546 150,687 3.947/10 through 6/11 3,832,199 0 0 0 0 0 0 0 0.007/11 through 6/12 4,348,313 0 0 0 0 0 0 0 0.00
5 YR. TOTAL 18,784,971 2 3,278 17 404,589 226 454,237 862,330 4.59INDEMNITY MEDICAL TOTAL
CRED. PURE PREM.* CRED. PURE PREM.* PURE PREM.*Indicated Pure Premium 19% 2.171 27% 2.419 4.59Pure Premium Indicated by National Relativity 40% 0.618 36% 1.060 1.68Pure Premium Present on Rate Level 41% 1.367 37% 2.481 3.85Pure Premium Derived by Formula 1.220 1.953 3.17
Page 15
* Pure Premium per $100 of Payroll** Pure Premium per employee++ Non-Standard Calculation© Copyright 2014 National Council on Compensation Insurance, Inc. All Rights Reserved.

MISSOURI
EFFECTIVE 1/1/2015CLASS DIE CASTING MFG
1925
Industry Group: Manufacturing CONVERTED LOSSESHazard Group: D INDEMNITY LIKELY INDEMNITY NOT-LIKELY MED LIKELY MED NOT-LIKELY TOTAL TOTAL
POLICY PERIOD PAYROLL CASES AMOUNT CASES AMOUNT AMOUNT AMOUNT AMOUNT PURE PREM.7/07 through 6/08 45,811,004 0 0 26 331,984 0 691,473 1,023,457 2.237/08 through 6/09 26,445,292 3 166,456 12 71,623 935,497 193,729 1,367,305 5.177/09 through 6/10 16,404,347 5 124,502 11 117,939 282,241 248,039 772,721 4.717/10 through 6/11 16,414,882 1 8,155 5 60,973 17,109 133,860 220,097 1.347/11 through 6/12 17,891,487 1 52,031 10 174,225 0 391,428 617,684 3.45
5 YR. TOTAL 122,967,012 10 351,144 64 756,744 1,234,847 1,658,529 4,001,264 3.25INDEMNITY MEDICAL TOTAL
CRED. PURE PREM.* CRED. PURE PREM.* PURE PREM.*Indicated Pure Premium 41% 0.901 58% 2.353 3.25Pure Premium Indicated by National Relativity 29% 0.935 21% 1.960 2.90Pure Premium Present on Rate Level 30% 1.497 21% 2.617 4.11Pure Premium Derived by Formula 1.090 2.326 3.42
CLASS PASTA OR NOODLE MFG
2002
Industry Group: Manufacturing CONVERTED LOSSESHazard Group: B INDEMNITY LIKELY INDEMNITY NOT-LIKELY MED LIKELY MED NOT-LIKELY TOTAL TOTAL
POLICY PERIOD PAYROLL CASES AMOUNT CASES AMOUNT AMOUNT AMOUNT AMOUNT PURE PREM.7/07 through 6/08 17,986,740 3 34,484 9 101,030 31,161 195,121 361,796 2.017/08 through 6/09 20,363,261 0 0 11 95,611 0 201,046 296,657 1.467/09 through 6/10 19,558,266 4 36,952 2 10,119 33,802 43,850 124,723 0.647/10 through 6/11 16,315,475 0 0 2 34,609 0 36,032 70,641 0.437/11 through 6/12 21,100,781 1 8,253 5 21,409 4,600 145,791 180,053 0.85
5 YR. TOTAL 95,324,523 8 79,689 29 262,778 69,563 621,840 1,033,870 1.08INDEMNITY MEDICAL TOTAL
CRED. PURE PREM.* CRED. PURE PREM.* PURE PREM.*Indicated Pure Premium 28% 0.359 39% 0.725 1.08Pure Premium Indicated by National Relativity 36% 0.595 30% 1.601 2.20Pure Premium Present on Rate Level 36% 0.711 31% 1.252 1.96Pure Premium Derived by Formula 0.571 1.151 1.72
CLASS BAKERY - SALESPERSONS & DRIVERS
2003
Industry Group: Manufacturing CONVERTED LOSSESHazard Group: C INDEMNITY LIKELY INDEMNITY NOT-LIKELY MED LIKELY MED NOT-LIKELY TOTAL TOTAL
POLICY PERIOD PAYROLL CASES AMOUNT CASES AMOUNT AMOUNT AMOUNT AMOUNT PURE PREM.7/07 through 6/08 49,770,289 10 105,484 33 327,811 203,596 660,403 1,297,294 2.617/08 through 6/09 49,693,142 5 59,202 28 240,683 12,914 547,544 860,343 1.737/09 through 6/10 49,965,991 9 466,514 33 238,717 684,359 536,883 1,926,473 3.867/10 through 6/11 65,602,682 14 491,537 25 238,823 450,784 499,696 1,680,840 2.567/11 through 6/12 60,978,792 10 402,824 38 535,828 418,610 924,727 2,281,989 3.74
5 YR. TOTAL 276,010,896 48 1,525,561 157 1,581,862 1,770,263 3,169,253 8,046,939 2.92INDEMNITY MEDICAL TOTAL
CRED. PURE PREM.* CRED. PURE PREM.* PURE PREM.*Indicated Pure Premium 51% 1.126 67% 1.790 2.92Pure Premium Indicated by National Relativity 24% 1.409 16% 2.149 3.56Pure Premium Present on Rate Level 25% 1.170 17% 1.675 2.85Pure Premium Derived by Formula 1.205 1.828 3.03
Page 16
* Pure Premium per $100 of Payroll** Pure Premium per employee++ Non-Standard Calculation© Copyright 2014 National Council on Compensation Insurance, Inc. All Rights Reserved.
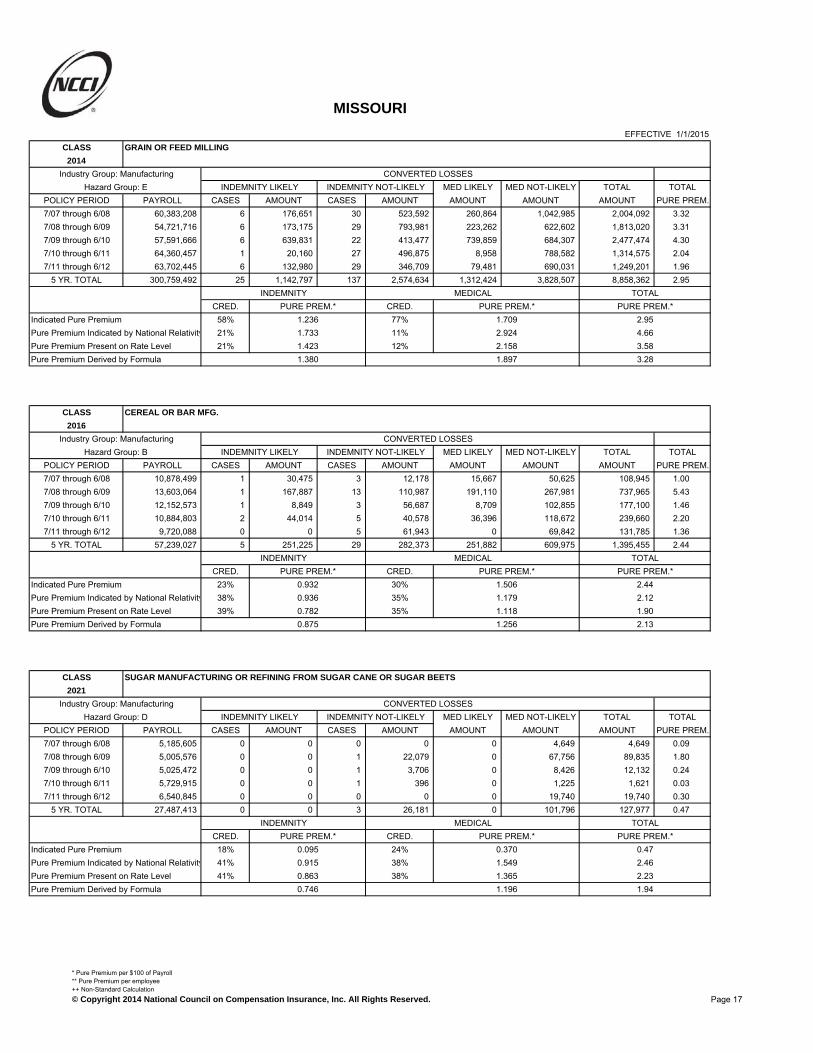
MISSOURI
EFFECTIVE 1/1/2015CLASS GRAIN OR FEED MILLING
2014
Industry Group: Manufacturing CONVERTED LOSSESHazard Group: E INDEMNITY LIKELY INDEMNITY NOT-LIKELY MED LIKELY MED NOT-LIKELY TOTAL TOTAL
POLICY PERIOD PAYROLL CASES AMOUNT CASES AMOUNT AMOUNT AMOUNT AMOUNT PURE PREM.7/07 through 6/08 60,383,208 6 176,651 30 523,592 260,864 1,042,985 2,004,092 3.327/08 through 6/09 54,721,716 6 173,175 29 793,981 223,262 622,602 1,813,020 3.317/09 through 6/10 57,591,666 6 639,831 22 413,477 739,859 684,307 2,477,474 4.307/10 through 6/11 64,360,457 1 20,160 27 496,875 8,958 788,582 1,314,575 2.047/11 through 6/12 63,702,445 6 132,980 29 346,709 79,481 690,031 1,249,201 1.96
5 YR. TOTAL 300,759,492 25 1,142,797 137 2,574,634 1,312,424 3,828,507 8,858,362 2.95INDEMNITY MEDICAL TOTAL
CRED. PURE PREM.* CRED. PURE PREM.* PURE PREM.*Indicated Pure Premium 58% 1.236 77% 1.709 2.95Pure Premium Indicated by National Relativity 21% 1.733 11% 2.924 4.66Pure Premium Present on Rate Level 21% 1.423 12% 2.158 3.58Pure Premium Derived by Formula 1.380 1.897 3.28
CLASS CEREAL OR BAR MFG.
2016
Industry Group: Manufacturing CONVERTED LOSSESHazard Group: B INDEMNITY LIKELY INDEMNITY NOT-LIKELY MED LIKELY MED NOT-LIKELY TOTAL TOTAL
POLICY PERIOD PAYROLL CASES AMOUNT CASES AMOUNT AMOUNT AMOUNT AMOUNT PURE PREM.7/07 through 6/08 10,878,499 1 30,475 3 12,178 15,667 50,625 108,945 1.007/08 through 6/09 13,603,064 1 167,887 13 110,987 191,110 267,981 737,965 5.437/09 through 6/10 12,152,573 1 8,849 3 56,687 8,709 102,855 177,100 1.467/10 through 6/11 10,884,803 2 44,014 5 40,578 36,396 118,672 239,660 2.207/11 through 6/12 9,720,088 0 0 5 61,943 0 69,842 131,785 1.36
5 YR. TOTAL 57,239,027 5 251,225 29 282,373 251,882 609,975 1,395,455 2.44INDEMNITY MEDICAL TOTAL
CRED. PURE PREM.* CRED. PURE PREM.* PURE PREM.*Indicated Pure Premium 23% 0.932 30% 1.506 2.44Pure Premium Indicated by National Relativity 38% 0.936 35% 1.179 2.12Pure Premium Present on Rate Level 39% 0.782 35% 1.118 1.90Pure Premium Derived by Formula 0.875 1.256 2.13
CLASS SUGAR MANUFACTURING OR REFINING FROM SUGAR CANE OR SUGAR BEETS
2021
Industry Group: Manufacturing CONVERTED LOSSESHazard Group: D INDEMNITY LIKELY INDEMNITY NOT-LIKELY MED LIKELY MED NOT-LIKELY TOTAL TOTAL
POLICY PERIOD PAYROLL CASES AMOUNT CASES AMOUNT AMOUNT AMOUNT AMOUNT PURE PREM.7/07 through 6/08 5,185,605 0 0 0 0 0 4,649 4,649 0.097/08 through 6/09 5,005,576 0 0 1 22,079 0 67,756 89,835 1.807/09 through 6/10 5,025,472 0 0 1 3,706 0 8,426 12,132 0.247/10 through 6/11 5,729,915 0 0 1 396 0 1,225 1,621 0.037/11 through 6/12 6,540,845 0 0 0 0 0 19,740 19,740 0.30
5 YR. TOTAL 27,487,413 0 0 3 26,181 0 101,796 127,977 0.47INDEMNITY MEDICAL TOTAL
CRED. PURE PREM.* CRED. PURE PREM.* PURE PREM.*Indicated Pure Premium 18% 0.095 24% 0.370 0.47Pure Premium Indicated by National Relativity 41% 0.915 38% 1.549 2.46Pure Premium Present on Rate Level 41% 0.863 38% 1.365 2.23Pure Premium Derived by Formula 0.746 1.196 1.94
Page 17
* Pure Premium per $100 of Payroll** Pure Premium per employee++ Non-Standard Calculation© Copyright 2014 National Council on Compensation Insurance, Inc. All Rights Reserved.

MISSOURI
EFFECTIVE 1/1/2015CLASS ICE CREAM MFG & DRIVERS
2039
Industry Group: Manufacturing CONVERTED LOSSESHazard Group: B INDEMNITY LIKELY INDEMNITY NOT-LIKELY MED LIKELY MED NOT-LIKELY TOTAL TOTAL
POLICY PERIOD PAYROLL CASES AMOUNT CASES AMOUNT AMOUNT AMOUNT AMOUNT PURE PREM.7/07 through 6/08 39,451,263 3 147,881 23 278,205 154,928 449,517 1,030,531 2.617/08 through 6/09 38,815,995 1 15,564 9 337,920 6,584 248,184 608,252 1.577/09 through 6/10 45,234,592 3 136,794 13 139,534 98,508 163,429 538,265 1.197/10 through 6/11 38,496,283 1 6,690 9 213,753 2,602 376,809 599,854 1.567/11 through 6/12 44,339,962 3 31,362 20 338,558 33,523 442,577 846,020 1.91
5 YR. TOTAL 206,338,095 11 338,291 74 1,307,970 296,145 1,680,516 3,622,922 1.76INDEMNITY MEDICAL TOTAL
CRED. PURE PREM.* CRED. PURE PREM.* PURE PREM.*Indicated Pure Premium 42% 0.798 50% 0.958 1.76Pure Premium Indicated by National Relativity 29% 0.937 25% 1.288 2.23Pure Premium Present on Rate Level 29% 0.917 25% 1.100 2.02Pure Premium Derived by Formula 0.873 1.076 1.95
CLASS CANDY, CHOCOLATE AND CONFECTION MFG
2041
Industry Group: Manufacturing CONVERTED LOSSESHazard Group: B INDEMNITY LIKELY INDEMNITY NOT-LIKELY MED LIKELY MED NOT-LIKELY TOTAL TOTAL
POLICY PERIOD PAYROLL CASES AMOUNT CASES AMOUNT AMOUNT AMOUNT AMOUNT PURE PREM.7/07 through 6/08 4,785,245 1 12,184 4 37,997 23,368 85,483 159,032 3.327/08 through 6/09 3,576,805 0 0 1 907 0 19,575 20,482 0.577/09 through 6/10 4,652,120 0 0 1 10,644 0 40,947 51,591 1.117/10 through 6/11 4,635,870 1 14,996 5 22,648 8,338 54,290 100,272 2.167/11 through 6/12 4,898,010 0 0 0 0 0 25,684 25,684 0.52
5 YR. TOTAL 22,548,050 2 27,180 11 72,196 31,706 225,979 357,061 1.58INDEMNITY MEDICAL TOTAL
CRED. PURE PREM.* CRED. PURE PREM.* PURE PREM.*Indicated Pure Premium 17% 0.441 24% 1.143 1.58Pure Premium Indicated by National Relativity 41% 1.119 38% 1.795 2.91Pure Premium Present on Rate Level 42% 0.950 38% 1.580 2.53Pure Premium Derived by Formula 0.933 1.557 2.49
CLASS MILK PRODUCTS MFG NOC
2065
Industry Group: Manufacturing CONVERTED LOSSESHazard Group: C INDEMNITY LIKELY INDEMNITY NOT-LIKELY MED LIKELY MED NOT-LIKELY TOTAL TOTAL
POLICY PERIOD PAYROLL CASES AMOUNT CASES AMOUNT AMOUNT AMOUNT AMOUNT PURE PREM.7/07 through 6/08 8,996,671 0 0 1 11,868 0 29,530 41,398 0.467/08 through 6/09 3,961,154 1 4,595 0 0 7,461 4,646 16,702 0.427/09 through 6/10 2,916,540 1 12,031 0 0 11,426 7,239 30,696 1.057/10 through 6/11 435,533 0 0 0 0 0 295 295 0.077/11 through 6/12 1,144,003 0 0 1 5,496 0 11,593 17,089 1.49
5 YR. TOTAL 17,453,901 2 16,626 2 17,364 18,887 53,303 106,180 0.61INDEMNITY MEDICAL TOTAL
CRED. PURE PREM.* CRED. PURE PREM.* PURE PREM.*Indicated Pure Premium 18% 0.195 22% 0.414 0.61Pure Premium Indicated by National Relativity 41% 1.305 39% 1.813 3.12Pure Premium Present on Rate Level 41% 1.318 39% 1.598 2.92Pure Premium Derived by Formula 1.111 1.421 2.53
Page 18
* Pure Premium per $100 of Payroll** Pure Premium per employee++ Non-Standard Calculation© Copyright 2014 National Council on Compensation Insurance, Inc. All Rights Reserved.

MISSOURI
EFFECTIVE 1/1/2015CLASS CREAMERY & ROUTE SUPERVISORS, DRIVERS
2070
Industry Group: Manufacturing CONVERTED LOSSESHazard Group: C INDEMNITY LIKELY INDEMNITY NOT-LIKELY MED LIKELY MED NOT-LIKELY TOTAL TOTAL
POLICY PERIOD PAYROLL CASES AMOUNT CASES AMOUNT AMOUNT AMOUNT AMOUNT PURE PREM.7/07 through 6/08 89,792,674 22 868,158 76 1,819,052 1,546,930 1,449,501 5,683,641 6.337/08 through 6/09 92,477,141 12 597,702 63 691,492 571,334 1,153,850 3,014,378 3.267/09 through 6/10 98,500,931 10 844,800 70 1,377,986 889,827 1,521,076 4,633,689 4.717/10 through 6/11 66,975,228 16 422,903 52 1,014,097 595,497 1,631,952 3,664,449 5.477/11 through 6/12 24,665,033 5 95,226 24 390,619 92,587 613,776 1,192,208 4.83
5 YR. TOTAL 372,411,007 65 2,828,789 285 5,293,246 3,696,175 6,370,155 18,188,365 4.88INDEMNITY MEDICAL TOTAL
CRED. PURE PREM.* CRED. PURE PREM.* PURE PREM.*Indicated Pure Premium 72% 2.181 86% 2.703 4.88Pure Premium Indicated by National Relativity 14% 1.795 7% 2.402 4.20Pure Premium Present on Rate Level 14% 1.995 7% 2.324 4.32Pure Premium Derived by Formula 2.101 2.655 4.76
CLASS BUTCHERING
2081
Industry Group: Manufacturing CONVERTED LOSSESHazard Group: C INDEMNITY LIKELY INDEMNITY NOT-LIKELY MED LIKELY MED NOT-LIKELY TOTAL TOTAL
POLICY PERIOD PAYROLL CASES AMOUNT CASES AMOUNT AMOUNT AMOUNT AMOUNT PURE PREM.7/07 through 6/08 1,423,351 0 0 7 13,815 0 48,866 62,681 4.407/08 through 6/09 2,471,349 1 14,939 6 52,829 7,509 62,934 138,211 5.597/09 through 6/10 1,670,124 1 10,195 7 55,191 6,984 174,458 246,828 14.787/10 through 6/11 3,019,965 1 51,096 4 53,182 26,563 188,916 319,757 10.597/11 through 6/12 2,398,393 0 0 5 57,653 0 113,980 171,633 7.16
5 YR. TOTAL 10,983,182 3 76,230 29 232,670 41,056 589,154 939,110 8.55INDEMNITY MEDICAL TOTAL
CRED. PURE PREM.* CRED. PURE PREM.* PURE PREM.*Indicated Pure Premium 17% 2.812 27% 5.738 8.55Pure Premium Indicated by National Relativity 41% 0.892 36% 1.812 2.70Pure Premium Present on Rate Level 42% 1.927 37% 4.510 6.44Pure Premium Derived by Formula 1.653 3.870 5.52
CLASS PACKING HOUSE-ALL OPERATIONS
2089
Industry Group: Manufacturing CONVERTED LOSSESHazard Group: C INDEMNITY LIKELY INDEMNITY NOT-LIKELY MED LIKELY MED NOT-LIKELY TOTAL TOTAL
POLICY PERIOD PAYROLL CASES AMOUNT CASES AMOUNT AMOUNT AMOUNT AMOUNT PURE PREM.7/07 through 6/08 76,368,452 16 419,439 54 464,514 529,357 1,104,001 2,517,311 3.307/08 through 6/09 135,629,675 20 516,543 142 1,337,560 1,090,021 3,007,825 5,951,949 4.397/09 through 6/10 139,674,962 23 404,928 129 1,401,078 413,351 2,896,667 5,116,024 3.667/10 through 6/11 159,217,940 24 572,750 159 1,446,674 547,959 3,431,176 5,998,559 3.777/11 through 6/12 124,171,372 5 108,640 126 1,102,343 100,219 2,332,439 3,643,641 2.93
5 YR. TOTAL 635,062,401 88 2,022,300 610 5,752,169 2,680,907 12,772,108 23,227,484 3.66INDEMNITY MEDICAL TOTAL
CRED. PURE PREM.* CRED. PURE PREM.* PURE PREM.*Indicated Pure Premium 74% 1.224 100% 2.433 3.66Pure Premium Indicated by National Relativity 13% 1.094 0% 1.968 3.06Pure Premium Present on Rate Level 13% 1.260 0% 2.565 3.83Pure Premium Derived by Formula 1.212 2.433 3.65
Page 19
* Pure Premium per $100 of Payroll** Pure Premium per employee++ Non-Standard Calculation© Copyright 2014 National Council on Compensation Insurance, Inc. All Rights Reserved.

MISSOURI
EFFECTIVE 1/1/2015CLASS MEAT PRODUCTS MFG NOC
2095
Industry Group: Manufacturing CONVERTED LOSSESHazard Group: C INDEMNITY LIKELY INDEMNITY NOT-LIKELY MED LIKELY MED NOT-LIKELY TOTAL TOTAL
POLICY PERIOD PAYROLL CASES AMOUNT CASES AMOUNT AMOUNT AMOUNT AMOUNT PURE PREM.7/07 through 6/08 187,169,480 35 801,303 75 919,914 935,897 1,844,879 4,501,993 2.417/08 through 6/09 142,921,898 21 649,090 82 1,108,106 697,545 2,051,997 4,506,738 3.157/09 through 6/10 157,708,559 19 812,083 66 1,017,755 1,028,812 1,779,100 4,637,750 2.947/10 through 6/11 131,367,649 18 696,703 49 854,081 725,850 1,728,338 4,004,972 3.057/11 through 6/12 136,028,268 5 72,297 42 847,796 75,752 1,309,978 2,305,823 1.70
5 YR. TOTAL 755,195,854 98 3,031,476 314 4,747,652 3,463,856 8,714,292 19,957,276 2.64INDEMNITY MEDICAL TOTAL
CRED. PURE PREM.* CRED. PURE PREM.* PURE PREM.*Indicated Pure Premium 76% 1.030 100% 1.613 2.64Pure Premium Indicated by National Relativity 12% 1.152 0% 2.078 3.23Pure Premium Present on Rate Level 12% 1.144 0% 1.709 2.85Pure Premium Derived by Formula 1.058 1.613 2.67
CLASS FRUIT PACKING
2105
Industry Group: Manufacturing CONVERTED LOSSESHazard Group: B INDEMNITY LIKELY INDEMNITY NOT-LIKELY MED LIKELY MED NOT-LIKELY TOTAL TOTAL
POLICY PERIOD PAYROLL CASES AMOUNT CASES AMOUNT AMOUNT AMOUNT AMOUNT PURE PREM.7/07 through 6/08 1,431,179 0 0 0 0 0 0 0 0.007/08 through 6/09 1,626,742 0 0 0 0 0 759 759 0.057/09 through 6/10 2,393,838 0 0 0 0 0 0 0 0.007/10 through 6/11 1,088,384 0 0 0 0 0 0 0 0.007/11 through 6/12 1,677,872 0 0 0 0 0 30 30 0.00
5 YR. TOTAL 8,218,015 0 0 0 0 0 789 789 0.01INDEMNITY MEDICAL TOTAL
CRED. PURE PREM.* CRED. PURE PREM.* PURE PREM.*Indicated Pure Premium 12% 0.000 16% 0.010 0.01Pure Premium Indicated by National Relativity 44% 1.290 42% 2.274 3.56Pure Premium Present on Rate Level 44% 0.937 42% 1.508 2.45Pure Premium Derived by Formula 0.980 1.590 2.57
CLASS PICKLE MFG
2110
Industry Group: Manufacturing CONVERTED LOSSESHazard Group: B INDEMNITY LIKELY INDEMNITY NOT-LIKELY MED LIKELY MED NOT-LIKELY TOTAL TOTAL
POLICY PERIOD PAYROLL CASES AMOUNT CASES AMOUNT AMOUNT AMOUNT AMOUNT PURE PREM.7/07 through 6/08 2,483,995 0 0 1 1,906 0 15,666 17,572 0.717/08 through 6/09 2,110,728 0 0 1 22,676 0 29,213 51,889 2.467/09 through 6/10 2,232,809 0 0 2 1,133 0 7,790 8,923 0.407/10 through 6/11 573,981 0 0 2 11,322 0 3,407 14,729 2.577/11 through 6/12 704 0 0 0 0 0 0 0 0.00
5 YR. TOTAL 7,402,217 0 0 6 37,037 0 56,076 93,113 1.26INDEMNITY MEDICAL TOTAL
CRED. PURE PREM.* CRED. PURE PREM.* PURE PREM.*Indicated Pure Premium 10% 0.500 13% 0.758 1.26Pure Premium Indicated by National Relativity 34% 0.577 35% 1.233 1.81Pure Premium Present on Rate Level 56% 0.721 52% 1.037 1.76Pure Premium Derived by Formula 0.650 1.069 1.72
Page 20
* Pure Premium per $100 of Payroll** Pure Premium per employee++ Non-Standard Calculation© Copyright 2014 National Council on Compensation Insurance, Inc. All Rights Reserved.
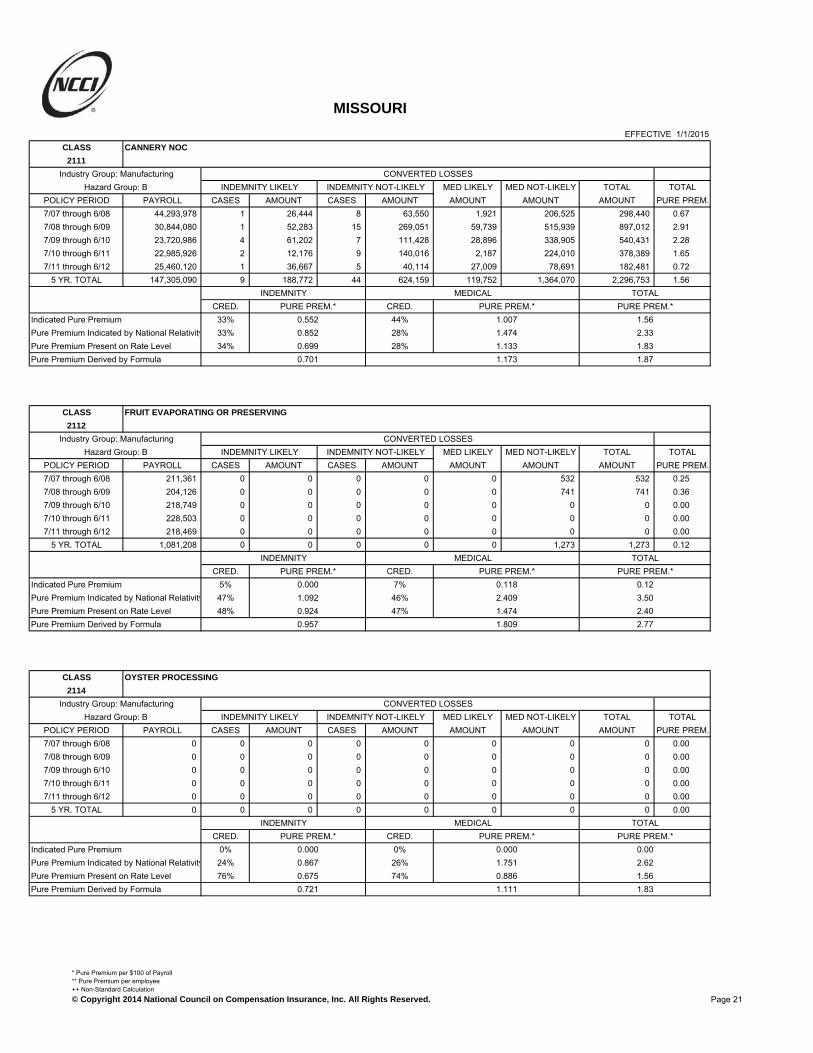
MISSOURI
EFFECTIVE 1/1/2015CLASS CANNERY NOC
2111
Industry Group: Manufacturing CONVERTED LOSSESHazard Group: B INDEMNITY LIKELY INDEMNITY NOT-LIKELY MED LIKELY MED NOT-LIKELY TOTAL TOTAL
POLICY PERIOD PAYROLL CASES AMOUNT CASES AMOUNT AMOUNT AMOUNT AMOUNT PURE PREM.7/07 through 6/08 44,293,978 1 26,444 8 63,550 1,921 206,525 298,440 0.677/08 through 6/09 30,844,080 1 52,283 15 269,051 59,739 515,939 897,012 2.917/09 through 6/10 23,720,986 4 61,202 7 111,428 28,896 338,905 540,431 2.287/10 through 6/11 22,985,926 2 12,176 9 140,016 2,187 224,010 378,389 1.657/11 through 6/12 25,460,120 1 36,667 5 40,114 27,009 78,691 182,481 0.72
5 YR. TOTAL 147,305,090 9 188,772 44 624,159 119,752 1,364,070 2,296,753 1.56INDEMNITY MEDICAL TOTAL
CRED. PURE PREM.* CRED. PURE PREM.* PURE PREM.*Indicated Pure Premium 33% 0.552 44% 1.007 1.56Pure Premium Indicated by National Relativity 33% 0.852 28% 1.474 2.33Pure Premium Present on Rate Level 34% 0.699 28% 1.133 1.83Pure Premium Derived by Formula 0.701 1.173 1.87
CLASS FRUIT EVAPORATING OR PRESERVING
2112
Industry Group: Manufacturing CONVERTED LOSSESHazard Group: B INDEMNITY LIKELY INDEMNITY NOT-LIKELY MED LIKELY MED NOT-LIKELY TOTAL TOTAL
POLICY PERIOD PAYROLL CASES AMOUNT CASES AMOUNT AMOUNT AMOUNT AMOUNT PURE PREM.7/07 through 6/08 211,361 0 0 0 0 0 532 532 0.257/08 through 6/09 204,126 0 0 0 0 0 741 741 0.367/09 through 6/10 218,749 0 0 0 0 0 0 0 0.007/10 through 6/11 228,503 0 0 0 0 0 0 0 0.007/11 through 6/12 218,469 0 0 0 0 0 0 0 0.00
5 YR. TOTAL 1,081,208 0 0 0 0 0 1,273 1,273 0.12INDEMNITY MEDICAL TOTAL
CRED. PURE PREM.* CRED. PURE PREM.* PURE PREM.*Indicated Pure Premium 5% 0.000 7% 0.118 0.12Pure Premium Indicated by National Relativity 47% 1.092 46% 2.409 3.50Pure Premium Present on Rate Level 48% 0.924 47% 1.474 2.40Pure Premium Derived by Formula 0.957 1.809 2.77
CLASS OYSTER PROCESSING
2114
Industry Group: Manufacturing CONVERTED LOSSESHazard Group: B INDEMNITY LIKELY INDEMNITY NOT-LIKELY MED LIKELY MED NOT-LIKELY TOTAL TOTAL
POLICY PERIOD PAYROLL CASES AMOUNT CASES AMOUNT AMOUNT AMOUNT AMOUNT PURE PREM.7/07 through 6/08 0 0 0 0 0 0 0 0 0.007/08 through 6/09 0 0 0 0 0 0 0 0 0.007/09 through 6/10 0 0 0 0 0 0 0 0 0.007/10 through 6/11 0 0 0 0 0 0 0 0 0.007/11 through 6/12 0 0 0 0 0 0 0 0 0.00
5 YR. TOTAL 0 0 0 0 0 0 0 0 0.00INDEMNITY MEDICAL TOTAL
CRED. PURE PREM.* CRED. PURE PREM.* PURE PREM.*Indicated Pure Premium 0% 0.000 0% 0.000 0.00Pure Premium Indicated by National Relativity 24% 0.867 26% 1.751 2.62Pure Premium Present on Rate Level 76% 0.675 74% 0.886 1.56Pure Premium Derived by Formula 0.721 1.111 1.83
Page 21
* Pure Premium per $100 of Payroll** Pure Premium per employee++ Non-Standard Calculation© Copyright 2014 National Council on Compensation Insurance, Inc. All Rights Reserved.

MISSOURI
EFFECTIVE 1/1/2015CLASS BREWERY & DRIVERS
2121
Industry Group: Manufacturing CONVERTED LOSSESHazard Group: C INDEMNITY LIKELY INDEMNITY NOT-LIKELY MED LIKELY MED NOT-LIKELY TOTAL TOTAL
POLICY PERIOD PAYROLL CASES AMOUNT CASES AMOUNT AMOUNT AMOUNT AMOUNT PURE PREM.7/07 through 6/08 9,275,476 1 18,803 3 73,767 12,179 85,563 190,312 2.057/08 through 6/09 99,894,471 44 425,134 16 73,402 181,669 142,908 823,113 0.827/09 through 6/10 75,035,119 12 339,832 28 230,962 313,438 160,839 1,045,071 1.397/10 through 6/11 69,247,933 6 492,436 38 233,835 519,238 119,442 1,364,951 1.977/11 through 6/12 75,251,297 4 95,122 16 280,558 60,495 308,174 744,349 0.99
5 YR. TOTAL 328,704,296 67 1,371,327 101 892,524 1,087,019 816,926 4,167,796 1.27INDEMNITY MEDICAL TOTAL
CRED. PURE PREM.* CRED. PURE PREM.* PURE PREM.*Indicated Pure Premium 42% 0.689 49% 0.579 1.27Pure Premium Indicated by National Relativity 29% 0.452 25% 0.809 1.26Pure Premium Present on Rate Level 29% 0.597 26% 0.663 1.26Pure Premium Derived by Formula 0.594 0.658 1.25
CLASS SPIRITUOUS LIQUOR DISTILLERY
2130
Industry Group: Manufacturing CONVERTED LOSSESHazard Group: C INDEMNITY LIKELY INDEMNITY NOT-LIKELY MED LIKELY MED NOT-LIKELY TOTAL TOTAL
POLICY PERIOD PAYROLL CASES AMOUNT CASES AMOUNT AMOUNT AMOUNT AMOUNT PURE PREM.7/07 through 6/08 7,531,288 0 0 3 32,936 0 28,841 61,777 0.827/08 through 6/09 8,069,475 1 12,672 1 12,737 10,880 41,045 77,334 0.967/09 through 6/10 8,804,923 0 0 1 11,682 0 8,213 19,895 0.237/10 through 6/11 9,579,460 0 0 2 38,924 0 85,653 124,577 1.307/11 through 6/12 10,426,913 0 0 4 24,439 0 74,834 99,273 0.95
5 YR. TOTAL 44,412,059 1 12,672 11 120,718 10,880 238,586 382,856 0.86INDEMNITY MEDICAL TOTAL
CRED. PURE PREM.* CRED. PURE PREM.* PURE PREM.*Indicated Pure Premium 22% 0.300 28% 0.562 0.86Pure Premium Indicated by National Relativity 39% 0.857 36% 1.357 2.21Pure Premium Present on Rate Level 39% 0.845 36% 1.225 2.07Pure Premium Derived by Formula 0.730 1.087 1.82
CLASS SPIRITUOUS LIQUOR BOTTLING
2131
Industry Group: Manufacturing CONVERTED LOSSESHazard Group: C INDEMNITY LIKELY INDEMNITY NOT-LIKELY MED LIKELY MED NOT-LIKELY TOTAL TOTAL
POLICY PERIOD PAYROLL CASES AMOUNT CASES AMOUNT AMOUNT AMOUNT AMOUNT PURE PREM.7/07 through 6/08 7,219,892 0 0 7 125,154 0 64,323 189,477 2.627/08 through 6/09 7,095,523 0 0 4 74,729 0 101,992 176,721 2.497/09 through 6/10 8,306,590 1 1,925 7 55,621 2,310 113,015 172,871 2.087/10 through 6/11 8,079,051 0 0 5 46,413 0 58,950 105,363 1.307/11 through 6/12 8,536,845 0 0 7 39,900 0 88,329 128,229 1.50
5 YR. TOTAL 39,237,901 1 1,925 30 341,817 2,310 426,609 772,661 1.97INDEMNITY MEDICAL TOTAL
CRED. PURE PREM.* CRED. PURE PREM.* PURE PREM.*Indicated Pure Premium 22% 0.876 27% 1.093 1.97Pure Premium Indicated by National Relativity 39% 0.812 36% 1.470 2.28Pure Premium Present on Rate Level 39% 1.021 37% 1.279 2.30Pure Premium Derived by Formula 0.908 1.298 2.21
Page 22
* Pure Premium per $100 of Payroll** Pure Premium per employee++ Non-Standard Calculation© Copyright 2014 National Council on Compensation Insurance, Inc. All Rights Reserved.
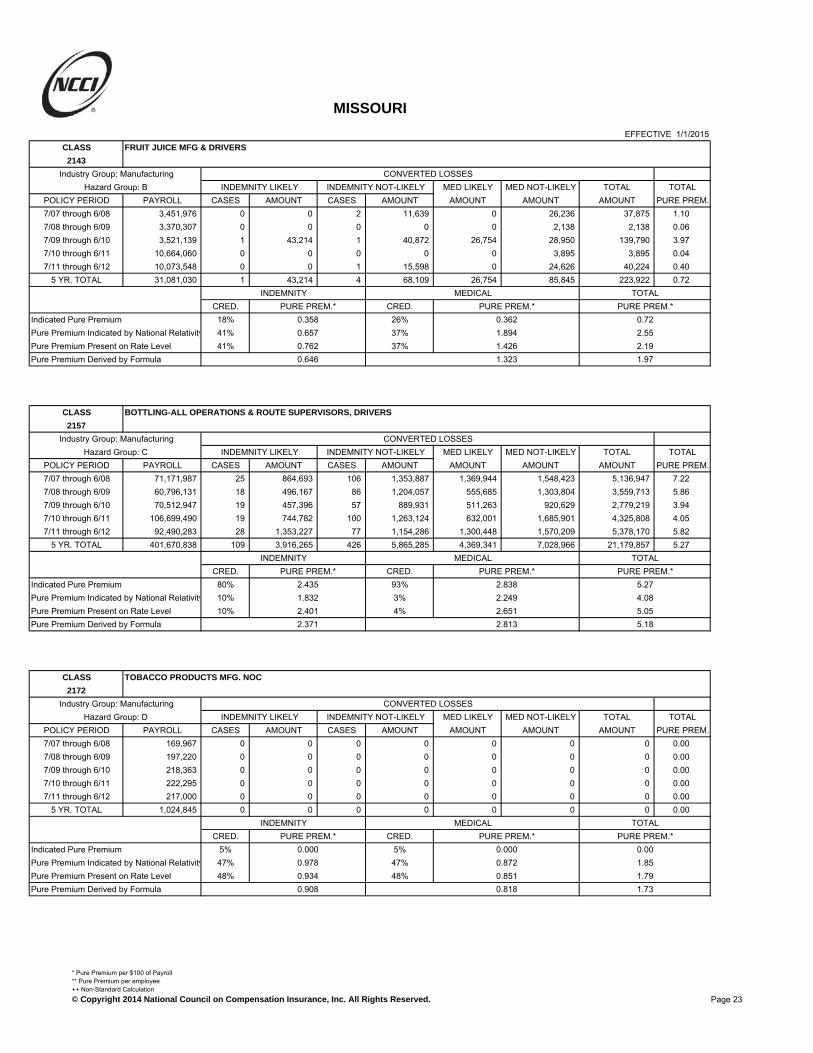
MISSOURI
EFFECTIVE 1/1/2015CLASS FRUIT JUICE MFG & DRIVERS
2143
Industry Group: Manufacturing CONVERTED LOSSESHazard Group: B INDEMNITY LIKELY INDEMNITY NOT-LIKELY MED LIKELY MED NOT-LIKELY TOTAL TOTAL
POLICY PERIOD PAYROLL CASES AMOUNT CASES AMOUNT AMOUNT AMOUNT AMOUNT PURE PREM.7/07 through 6/08 3,451,976 0 0 2 11,639 0 26,236 37,875 1.107/08 through 6/09 3,370,307 0 0 0 0 0 2,138 2,138 0.067/09 through 6/10 3,521,139 1 43,214 1 40,872 26,754 28,950 139,790 3.977/10 through 6/11 10,664,060 0 0 0 0 0 3,895 3,895 0.047/11 through 6/12 10,073,548 0 0 1 15,598 0 24,626 40,224 0.40
5 YR. TOTAL 31,081,030 1 43,214 4 68,109 26,754 85,845 223,922 0.72INDEMNITY MEDICAL TOTAL
CRED. PURE PREM.* CRED. PURE PREM.* PURE PREM.*Indicated Pure Premium 18% 0.358 26% 0.362 0.72Pure Premium Indicated by National Relativity 41% 0.657 37% 1.894 2.55Pure Premium Present on Rate Level 41% 0.762 37% 1.426 2.19Pure Premium Derived by Formula 0.646 1.323 1.97
CLASS BOTTLING-ALL OPERATIONS & ROUTE SUPERVISORS, DRIVERS
2157
Industry Group: Manufacturing CONVERTED LOSSESHazard Group: C INDEMNITY LIKELY INDEMNITY NOT-LIKELY MED LIKELY MED NOT-LIKELY TOTAL TOTAL
POLICY PERIOD PAYROLL CASES AMOUNT CASES AMOUNT AMOUNT AMOUNT AMOUNT PURE PREM.7/07 through 6/08 71,171,987 25 864,693 106 1,353,887 1,369,944 1,548,423 5,136,947 7.227/08 through 6/09 60,796,131 18 496,167 86 1,204,057 555,685 1,303,804 3,559,713 5.867/09 through 6/10 70,512,947 19 457,396 57 889,931 511,263 920,629 2,779,219 3.947/10 through 6/11 106,699,490 19 744,782 100 1,263,124 632,001 1,685,901 4,325,808 4.057/11 through 6/12 92,490,283 28 1,353,227 77 1,154,286 1,300,448 1,570,209 5,378,170 5.82
5 YR. TOTAL 401,670,838 109 3,916,265 426 5,865,285 4,369,341 7,028,966 21,179,857 5.27INDEMNITY MEDICAL TOTAL
CRED. PURE PREM.* CRED. PURE PREM.* PURE PREM.*Indicated Pure Premium 80% 2.435 93% 2.838 5.27Pure Premium Indicated by National Relativity 10% 1.832 3% 2.249 4.08Pure Premium Present on Rate Level 10% 2.401 4% 2.651 5.05Pure Premium Derived by Formula 2.371 2.813 5.18
CLASS TOBACCO PRODUCTS MFG. NOC
2172
Industry Group: Manufacturing CONVERTED LOSSESHazard Group: D INDEMNITY LIKELY INDEMNITY NOT-LIKELY MED LIKELY MED NOT-LIKELY TOTAL TOTAL
POLICY PERIOD PAYROLL CASES AMOUNT CASES AMOUNT AMOUNT AMOUNT AMOUNT PURE PREM.7/07 through 6/08 169,967 0 0 0 0 0 0 0 0.007/08 through 6/09 197,220 0 0 0 0 0 0 0 0.007/09 through 6/10 218,363 0 0 0 0 0 0 0 0.007/10 through 6/11 222,295 0 0 0 0 0 0 0 0.007/11 through 6/12 217,000 0 0 0 0 0 0 0 0.00
5 YR. TOTAL 1,024,845 0 0 0 0 0 0 0 0.00INDEMNITY MEDICAL TOTAL
CRED. PURE PREM.* CRED. PURE PREM.* PURE PREM.*Indicated Pure Premium 5% 0.000 5% 0.000 0.00Pure Premium Indicated by National Relativity 47% 0.978 47% 0.872 1.85Pure Premium Present on Rate Level 48% 0.934 48% 0.851 1.79Pure Premium Derived by Formula 0.908 0.818 1.73
Page 23
* Pure Premium per $100 of Payroll** Pure Premium per employee++ Non-Standard Calculation© Copyright 2014 National Council on Compensation Insurance, Inc. All Rights Reserved.

MISSOURI
EFFECTIVE 1/1/2015CLASS TOBACCO REHANDLING OR WAREHOUSING
2174
Industry Group: Manufacturing CONVERTED LOSSESHazard Group: B INDEMNITY LIKELY INDEMNITY NOT-LIKELY MED LIKELY MED NOT-LIKELY TOTAL TOTAL
POLICY PERIOD PAYROLL CASES AMOUNT CASES AMOUNT AMOUNT AMOUNT AMOUNT PURE PREM.7/07 through 6/08 0 0 0 0 0 0 0 0 0.007/08 through 6/09 0 0 0 0 0 0 0 0 0.007/09 through 6/10 0 0 0 0 0 0 0 0 0.007/10 through 6/11 0 0 0 0 0 0 0 0 0.007/11 through 6/12 0 0 0 0 0 0 0 0 0.00
5 YR. TOTAL 0 0 0 0 0 0 0 0 0.00INDEMNITY MEDICAL TOTAL
CRED. PURE PREM.* CRED. PURE PREM.* PURE PREM.*Indicated Pure Premium 0% 0.000 0% 0.000 0.00Pure Premium Indicated by National Relativity 36% 1.218 38% 2.025 3.24Pure Premium Present on Rate Level 64% 1.182 62% 1.450 2.63Pure Premium Derived by Formula 1.195 1.669 2.86
CLASS COTTON BATTING, WADDING OR WASTE MFG
2211
Industry Group: Manufacturing CONVERTED LOSSESHazard Group: E INDEMNITY LIKELY INDEMNITY NOT-LIKELY MED LIKELY MED NOT-LIKELY TOTAL TOTAL
POLICY PERIOD PAYROLL CASES AMOUNT CASES AMOUNT AMOUNT AMOUNT AMOUNT PURE PREM.7/07 through 6/08 138,701 0 0 0 0 0 0 0 0.007/08 through 6/09 92,669 0 0 0 0 0 0 0 0.007/09 through 6/10 89,604 0 0 0 0 0 0 0 0.007/10 through 6/11 86,046 0 0 1 29,568 0 26,841 56,409 65.567/11 through 6/12 27,760 0 0 1 6,101 0 14,377 20,478 73.77
5 YR. TOTAL 434,780 0 0 2 35,669 0 41,218 76,887 17.68INDEMNITY MEDICAL TOTAL
CRED. PURE PREM.* CRED. PURE PREM.* PURE PREM.*Indicated Pure Premium 5% 8.204 7% 9.480 17.68Pure Premium Indicated by National Relativity 29% 4.255 31% 4.875 9.13Pure Premium Present on Rate Level 66% 2.164 62% 3.873 6.04Pure Premium Derived by Formula 3.072 4.576 7.65
CLASS YARN OR THREAD MFG-COTTON
2220
Industry Group: Manufacturing CONVERTED LOSSESHazard Group: C INDEMNITY LIKELY INDEMNITY NOT-LIKELY MED LIKELY MED NOT-LIKELY TOTAL TOTAL
POLICY PERIOD PAYROLL CASES AMOUNT CASES AMOUNT AMOUNT AMOUNT AMOUNT PURE PREM.7/07 through 6/08 875,630 0 0 3 8,453 0 9,791 18,244 2.087/08 through 6/09 803,338 0 0 1 7,658 0 13,942 21,600 2.697/09 through 6/10 1,021,574 0 0 0 0 0 5,932 5,932 0.587/10 through 6/11 1,012,473 0 0 1 6,381 0 6,055 12,436 1.237/11 through 6/12 956,187 0 0 0 0 0 0 0 0.00
5 YR. TOTAL 4,669,202 0 0 5 22,492 0 35,720 58,212 1.25INDEMNITY MEDICAL TOTAL
CRED. PURE PREM.* CRED. PURE PREM.* PURE PREM.*Indicated Pure Premium 8% 0.482 11% 0.765 1.25Pure Premium Indicated by National Relativity 46% 0.808 44% 1.216 2.02Pure Premium Present on Rate Level 46% 0.762 45% 1.119 1.88Pure Premium Derived by Formula 0.761 1.123 1.88
Page 24
* Pure Premium per $100 of Payroll** Pure Premium per employee++ Non-Standard Calculation© Copyright 2014 National Council on Compensation Insurance, Inc. All Rights Reserved.

MISSOURI
EFFECTIVE 1/1/2015CLASS WOOL SPINNING AND WEAVING
2286
Industry Group: Manufacturing CONVERTED LOSSESHazard Group: B INDEMNITY LIKELY INDEMNITY NOT-LIKELY MED LIKELY MED NOT-LIKELY TOTAL TOTAL
POLICY PERIOD PAYROLL CASES AMOUNT CASES AMOUNT AMOUNT AMOUNT AMOUNT PURE PREM.7/07 through 6/08 0 0 0 0 0 0 0 0 0.007/08 through 6/09 0 0 0 0 0 0 0 0 0.007/09 through 6/10 0 0 0 0 0 0 0 0 0.007/10 through 6/11 0 0 0 0 0 0 0 0 0.007/11 through 6/12 0 0 0 0 0 0 0 0 0.00
5 YR. TOTAL 0 0 0 0 0 0 0 0 0.00INDEMNITY MEDICAL TOTAL
CRED. PURE PREM.* CRED. PURE PREM.* PURE PREM.*Indicated Pure Premium 0% 0.000 0% 0.000 0.00Pure Premium Indicated by National Relativity 22% 0.511 23% 0.801 1.31Pure Premium Present on Rate Level 78% 0.620 77% 1.172 1.79Pure Premium Derived by Formula 0.596 1.087 1.68
CLASS FELTING MFG
2288
Industry Group: Manufacturing CONVERTED LOSSESHazard Group: B INDEMNITY LIKELY INDEMNITY NOT-LIKELY MED LIKELY MED NOT-LIKELY TOTAL TOTAL
POLICY PERIOD PAYROLL CASES AMOUNT CASES AMOUNT AMOUNT AMOUNT AMOUNT PURE PREM.7/07 through 6/08 1,991,159 0 0 1 1,613 0 2,346 3,959 0.207/08 through 6/09 1,472,705 1 538,718 0 0 199,614 0 738,332 50.137/09 through 6/10 1,665,729 0 0 2 49,649 0 90,189 139,838 8.407/10 through 6/11 1,726,183 0 0 0 0 0 0 0 0.007/11 through 6/12 1,918,196 0 0 0 0 0 0 0 0.00
5 YR. TOTAL 8,773,972 1 538,718 3 51,262 199,614 92,535 882,129 10.05INDEMNITY MEDICAL TOTAL
CRED. PURE PREM.* CRED. PURE PREM.* PURE PREM.*Indicated Pure Premium 14% 6.724 16% 3.330 10.05Pure Premium Indicated by National Relativity 41% 1.617 42% 2.242 3.86Pure Premium Present on Rate Level 45% 1.498 42% 1.443 2.94Pure Premium Derived by Formula 2.278 2.081 4.36
CLASS PLUSH MFG
2300
Industry Group: Manufacturing CONVERTED LOSSESHazard Group: A INDEMNITY LIKELY INDEMNITY NOT-LIKELY MED LIKELY MED NOT-LIKELY TOTAL TOTAL
POLICY PERIOD PAYROLL CASES AMOUNT CASES AMOUNT AMOUNT AMOUNT AMOUNT PURE PREM.7/07 through 6/08 0 0 0 0 0 0 0 0 0.007/08 through 6/09 0 0 0 0 0 0 0 0 0.007/09 through 6/10 0 0 0 0 0 0 0 0 0.007/10 through 6/11 0 0 0 0 0 0 0 0 0.007/11 through 6/12 0 0 0 0 0 0 0 0 0.00
5 YR. TOTAL 0 0 0 0 0 0 0 0 0.00INDEMNITY MEDICAL TOTAL
CRED. PURE PREM.* CRED. PURE PREM.* PURE PREM.*Indicated Pure Premium 0% 0.000 0% 0.000 0.00Pure Premium Indicated by National Relativity 17% 0.825 18% 1.275 2.10Pure Premium Present on Rate Level 83% 0.904 82% 1.103 2.01Pure Premium Derived by Formula 0.891 1.134 2.03
Page 25
* Pure Premium per $100 of Payroll** Pure Premium per employee++ Non-Standard Calculation© Copyright 2014 National Council on Compensation Insurance, Inc. All Rights Reserved.

MISSOURI
EFFECTIVE 1/1/2015CLASS SILK THREAD OR YARN MFG
2302
Industry Group: Manufacturing CONVERTED LOSSESHazard Group: C INDEMNITY LIKELY INDEMNITY NOT-LIKELY MED LIKELY MED NOT-LIKELY TOTAL TOTAL
POLICY PERIOD PAYROLL CASES AMOUNT CASES AMOUNT AMOUNT AMOUNT AMOUNT PURE PREM.7/07 through 6/08 0 0 0 0 0 0 0 0 0.007/08 through 6/09 0 0 0 0 0 0 0 0 0.007/09 through 6/10 0 0 0 0 0 0 0 0 0.007/10 through 6/11 0 0 0 0 0 0 0 0 0.007/11 through 6/12 0 0 0 0 0 0 0 0 0.00
5 YR. TOTAL 0 0 0 0 0 0 0 0 0.00INDEMNITY MEDICAL TOTAL
CRED. PURE PREM.* CRED. PURE PREM.* PURE PREM.*Indicated Pure Premium 0% 0.000 0% 0.000 0.00Pure Premium Indicated by National Relativity 50% 0.569 50% 0.954 1.52Pure Premium Present on Rate Level 50% 0.669 50% 1.003 1.67Pure Premium Derived by Formula 0.619 0.979 1.60
CLASS TEXTILE FIBER MFG-SYNTHETIC
2305
Industry Group: Manufacturing CONVERTED LOSSESHazard Group: D INDEMNITY LIKELY INDEMNITY NOT-LIKELY MED LIKELY MED NOT-LIKELY TOTAL TOTAL
POLICY PERIOD PAYROLL CASES AMOUNT CASES AMOUNT AMOUNT AMOUNT AMOUNT PURE PREM.7/07 through 6/08 2,208,833 0 0 1 10,665 0 15,281 25,946 1.187/08 through 6/09 1,681,366 0 0 0 0 0 6,138 6,138 0.377/09 through 6/10 1,535,291 1 91,979 2 8,647 276,475 28,837 405,938 26.447/10 through 6/11 1,390,140 0 0 1 49,345 0 149,456 198,801 14.307/11 through 6/12 2,766,298 0 0 3 36,439 0 57,027 93,466 3.38
5 YR. TOTAL 9,581,928 1 91,979 7 105,096 276,475 256,739 730,289 7.62INDEMNITY MEDICAL TOTAL
CRED. PURE PREM.* CRED. PURE PREM.* PURE PREM.*Indicated Pure Premium 14% 2.057 17% 5.565 7.62Pure Premium Indicated by National Relativity 43% 0.744 41% 1.061 1.81Pure Premium Present on Rate Level 43% 1.297 42% 1.525 2.82Pure Premium Derived by Formula 1.166 2.022 3.19
CLASS CORDAGE ROPE OR TWINE MFG. NOC
2352
Industry Group: Manufacturing CONVERTED LOSSESHazard Group: B INDEMNITY LIKELY INDEMNITY NOT-LIKELY MED LIKELY MED NOT-LIKELY TOTAL TOTAL
POLICY PERIOD PAYROLL CASES AMOUNT CASES AMOUNT AMOUNT AMOUNT AMOUNT PURE PREM.7/07 through 6/08 0 0 0 0 0 0 0 0 0.007/08 through 6/09 0 0 0 0 0 0 0 0 0.007/09 through 6/10 0 0 0 0 0 0 0 0 0.007/10 through 6/11 0 0 0 0 0 0 0 0 0.007/11 through 6/12 0 0 0 0 0 0 0 0 0.00
5 YR. TOTAL 0 0 0 0 0 0 0 0 0.00INDEMNITY MEDICAL TOTAL
CRED. PURE PREM.* CRED. PURE PREM.* PURE PREM.*Indicated Pure Premium 0% 0.000 0% 0.000 0.00Pure Premium Indicated by National Relativity 0% 0.000 0% 0.000 0.00Pure Premium Present on Rate Level 100% 4.986 100% 0.734 5.72Pure Premium Derived by Formula 4.986 0.734 5.72
Page 26
* Pure Premium per $100 of Payroll** Pure Premium per employee++ Non-Standard Calculation© Copyright 2014 National Council on Compensation Insurance, Inc. All Rights Reserved.

MISSOURI
EFFECTIVE 1/1/2015CLASS HOSIERY MFG
2361
Industry Group: Manufacturing CONVERTED LOSSESHazard Group: C INDEMNITY LIKELY INDEMNITY NOT-LIKELY MED LIKELY MED NOT-LIKELY TOTAL TOTAL
POLICY PERIOD PAYROLL CASES AMOUNT CASES AMOUNT AMOUNT AMOUNT AMOUNT PURE PREM.7/07 through 6/08 286,530 0 0 0 0 0 0 0 0.007/08 through 6/09 281,689 0 0 0 0 0 0 0 0.007/09 through 6/10 276,503 0 0 0 0 0 0 0 0.007/10 through 6/11 297,380 0 0 0 0 0 0 0 0.007/11 through 6/12 301,186 0 0 0 0 0 0 0 0.00
5 YR. TOTAL 1,443,288 0 0 0 0 0 0 0 0.00INDEMNITY MEDICAL TOTAL
CRED. PURE PREM.* CRED. PURE PREM.* PURE PREM.*Indicated Pure Premium 5% 0.000 6% 0.000 0.00Pure Premium Indicated by National Relativity 47% 0.753 47% 1.182 1.94Pure Premium Present on Rate Level 48% 0.586 47% 0.879 1.47Pure Premium Derived by Formula 0.635 0.969 1.60
CLASS KNIT GOODS MFG NOC
2362
Industry Group: Manufacturing CONVERTED LOSSESHazard Group: C INDEMNITY LIKELY INDEMNITY NOT-LIKELY MED LIKELY MED NOT-LIKELY TOTAL TOTAL
POLICY PERIOD PAYROLL CASES AMOUNT CASES AMOUNT AMOUNT AMOUNT AMOUNT PURE PREM.7/07 through 6/08 110,217 0 0 0 0 0 0 0 0.007/08 through 6/09 103,471 0 0 0 0 0 0 0 0.007/09 through 6/10 118,989 0 0 0 0 0 0 0 0.007/10 through 6/11 116,523 0 0 0 0 0 0 0 0.007/11 through 6/12 418,987 0 0 0 0 0 0 0 0.00
5 YR. TOTAL 868,187 0 0 0 0 0 0 0 0.00INDEMNITY MEDICAL TOTAL
CRED. PURE PREM.* CRED. PURE PREM.* PURE PREM.*Indicated Pure Premium 4% 0.000 5% 0.000 0.00Pure Premium Indicated by National Relativity 44% 0.506 47% 0.753 1.26Pure Premium Present on Rate Level 52% 0.655 48% 0.951 1.61Pure Premium Derived by Formula 0.563 0.810 1.37
CLASS WEBBING MFG
2380
Industry Group: Manufacturing CONVERTED LOSSESHazard Group: C INDEMNITY LIKELY INDEMNITY NOT-LIKELY MED LIKELY MED NOT-LIKELY TOTAL TOTAL
POLICY PERIOD PAYROLL CASES AMOUNT CASES AMOUNT AMOUNT AMOUNT AMOUNT PURE PREM.7/07 through 6/08 2,120 0 0 0 0 0 0 0 0.007/08 through 6/09 0 0 0 0 0 0 0 0 0.007/09 through 6/10 2,308 0 0 0 0 0 0 0 0.007/10 through 6/11 3,000 0 0 0 0 0 0 0 0.007/11 through 6/12 0 0 0 0 0 0 0 0 0.00
5 YR. TOTAL 7,428 0 0 0 0 0 0 0 0.00INDEMNITY MEDICAL TOTAL
CRED. PURE PREM.* CRED. PURE PREM.* PURE PREM.*Indicated Pure Premium 1% 0.000 1% 0.000 0.00Pure Premium Indicated by National Relativity 49% 0.901 49% 1.514 2.42Pure Premium Present on Rate Level 50% 0.839 50% 1.500 2.34Pure Premium Derived by Formula 0.861 1.492 2.35
Page 27
* Pure Premium per $100 of Payroll** Pure Premium per employee++ Non-Standard Calculation© Copyright 2014 National Council on Compensation Insurance, Inc. All Rights Reserved.

MISSOURI
EFFECTIVE 1/1/2015CLASS LACE MFG
2386
Industry Group: Manufacturing CONVERTED LOSSESHazard Group: B INDEMNITY LIKELY INDEMNITY NOT-LIKELY MED LIKELY MED NOT-LIKELY TOTAL TOTAL
POLICY PERIOD PAYROLL CASES AMOUNT CASES AMOUNT AMOUNT AMOUNT AMOUNT PURE PREM.7/07 through 6/08 0 0 0 0 0 0 0 0 0.007/08 through 6/09 0 0 0 0 0 0 0 0 0.007/09 through 6/10 0 0 0 0 0 0 0 0 0.007/10 through 6/11 0 0 0 0 0 0 0 0 0.007/11 through 6/12 0 0 0 0 0 0 0 0 0.00
5 YR. TOTAL 0 0 0 0 0 0 0 0 0.00INDEMNITY MEDICAL TOTAL
CRED. PURE PREM.* CRED. PURE PREM.* PURE PREM.*Indicated Pure Premium 0% 0.000 0% 0.000 0.00Pure Premium Indicated by National Relativity 12% 0.292 13% 0.508 0.80Pure Premium Present on Rate Level 88% 0.702 87% 0.758 1.46Pure Premium Derived by Formula 0.653 0.726 1.38
CLASS EMBROIDERY MFG
2388
Industry Group: Manufacturing CONVERTED LOSSESHazard Group: B INDEMNITY LIKELY INDEMNITY NOT-LIKELY MED LIKELY MED NOT-LIKELY TOTAL TOTAL
POLICY PERIOD PAYROLL CASES AMOUNT CASES AMOUNT AMOUNT AMOUNT AMOUNT PURE PREM.7/07 through 6/08 5,732,760 1 18,572 3 40,168 37,542 105,925 202,207 3.537/08 through 6/09 4,902,404 0 0 2 22,127 0 55,240 77,367 1.587/09 through 6/10 7,646,878 0 0 5 32,517 0 101,325 133,842 1.757/10 through 6/11 6,516,975 0 0 2 24,229 0 29,121 53,350 0.827/11 through 6/12 6,928,322 0 0 1 19,186 0 12,735 31,921 0.46
5 YR. TOTAL 31,727,339 1 18,572 13 138,227 37,542 304,346 498,687 1.57INDEMNITY MEDICAL TOTAL
CRED. PURE PREM.* CRED. PURE PREM.* PURE PREM.*Indicated Pure Premium 17% 0.494 25% 1.078 1.57Pure Premium Indicated by National Relativity 37% 0.647 37% 0.924 1.57Pure Premium Present on Rate Level 46% 0.659 38% 1.189 1.85Pure Premium Derived by Formula 0.627 1.063 1.69
CLASS CARPET OR RUG MFG NOC
2402
Industry Group: Manufacturing CONVERTED LOSSESHazard Group: E INDEMNITY LIKELY INDEMNITY NOT-LIKELY MED LIKELY MED NOT-LIKELY TOTAL TOTAL
POLICY PERIOD PAYROLL CASES AMOUNT CASES AMOUNT AMOUNT AMOUNT AMOUNT PURE PREM.7/07 through 6/08 205,077 0 0 0 0 0 0 0 0.007/08 through 6/09 675,829 0 0 0 0 0 3,986 3,986 0.597/09 through 6/10 455,160 0 0 0 0 0 0 0 0.007/10 through 6/11 338,256 0 0 0 0 0 0 0 0.007/11 through 6/12 333,438 0 0 0 0 0 0 0 0.00
5 YR. TOTAL 2,007,760 0 0 0 0 0 3,986 3,986 0.20INDEMNITY MEDICAL TOTAL
CRED. PURE PREM.* CRED. PURE PREM.* PURE PREM.*Indicated Pure Premium 6% 0.000 8% 0.199 0.20Pure Premium Indicated by National Relativity 47% 0.700 46% 1.283 1.98Pure Premium Present on Rate Level 47% 0.673 46% 1.056 1.73Pure Premium Derived by Formula 0.645 1.092 1.74
Page 28
* Pure Premium per $100 of Payroll** Pure Premium per employee++ Non-Standard Calculation© Copyright 2014 National Council on Compensation Insurance, Inc. All Rights Reserved.

MISSOURI
EFFECTIVE 1/1/2015CLASS TEXTILE-BLEACHING, DYEING, MERCERIZING, FINISHING
2413
Industry Group: Manufacturing CONVERTED LOSSESHazard Group: C INDEMNITY LIKELY INDEMNITY NOT-LIKELY MED LIKELY MED NOT-LIKELY TOTAL TOTAL
POLICY PERIOD PAYROLL CASES AMOUNT CASES AMOUNT AMOUNT AMOUNT AMOUNT PURE PREM.7/07 through 6/08 279,822 0 0 0 0 0 0 0 0.007/08 through 6/09 429,635 0 0 0 0 0 0 0 0.007/09 through 6/10 492,208 0 0 0 0 0 0 0 0.007/10 through 6/11 500,844 0 0 0 0 0 0 0 0.007/11 through 6/12 763,329 0 0 1 3,498 0 27,956 31,454 4.12
5 YR. TOTAL 2,465,838 0 0 1 3,498 0 27,956 31,454 1.28INDEMNITY MEDICAL TOTAL
CRED. PURE PREM.* CRED. PURE PREM.* PURE PREM.*Indicated Pure Premium 7% 0.142 9% 1.134 1.28Pure Premium Indicated by National Relativity 46% 0.626 45% 1.153 1.78Pure Premium Present on Rate Level 47% 0.743 46% 1.155 1.90Pure Premium Derived by Formula 0.647 1.152 1.80
CLASS YARN DYEING OR FINISHING
2416
Industry Group: Manufacturing CONVERTED LOSSESHazard Group: C INDEMNITY LIKELY INDEMNITY NOT-LIKELY MED LIKELY MED NOT-LIKELY TOTAL TOTAL
POLICY PERIOD PAYROLL CASES AMOUNT CASES AMOUNT AMOUNT AMOUNT AMOUNT PURE PREM.7/07 through 6/08 0 0 0 0 0 0 0 0 0.007/08 through 6/09 0 0 0 0 0 0 0 0 0.007/09 through 6/10 0 0 0 0 0 0 0 0 0.007/10 through 6/11 0 0 0 0 0 0 0 0 0.007/11 through 6/12 70,287 0 0 0 0 0 0 0 0.00
5 YR. TOTAL 70,287 0 0 0 0 0 0 0 0.00INDEMNITY MEDICAL TOTAL
CRED. PURE PREM.* CRED. PURE PREM.* PURE PREM.*Indicated Pure Premium 1% 0.000 2% 0.000 0.00Pure Premium Indicated by National Relativity 27% 0.876 28% 2.186 3.06Pure Premium Present on Rate Level 72% 0.612 70% 0.965 1.58Pure Premium Derived by Formula 0.677 1.288 1.97
CLASS CLOTH PRINTING
2417
Industry Group: Manufacturing CONVERTED LOSSESHazard Group: C INDEMNITY LIKELY INDEMNITY NOT-LIKELY MED LIKELY MED NOT-LIKELY TOTAL TOTAL
POLICY PERIOD PAYROLL CASES AMOUNT CASES AMOUNT AMOUNT AMOUNT AMOUNT PURE PREM.7/07 through 6/08 934,866 0 0 0 0 0 0 0 0.007/08 through 6/09 586,037 0 0 1 7,643 0 16,728 24,371 4.167/09 through 6/10 971,418 0 0 0 0 0 0 0 0.007/10 through 6/11 1,112,296 0 0 0 0 0 0 0 0.007/11 through 6/12 1,149,677 0 0 1 623 0 45,758 46,381 4.03
5 YR. TOTAL 4,754,294 0 0 2 8,266 0 62,486 70,752 1.49INDEMNITY MEDICAL TOTAL
CRED. PURE PREM.* CRED. PURE PREM.* PURE PREM.*Indicated Pure Premium 8% 0.174 10% 1.314 1.49Pure Premium Indicated by National Relativity 26% 0.448 28% 0.974 1.42Pure Premium Present on Rate Level 66% 0.643 62% 0.787 1.43Pure Premium Derived by Formula 0.555 0.892 1.45
Page 29
* Pure Premium per $100 of Payroll** Pure Premium per employee++ Non-Standard Calculation© Copyright 2014 National Council on Compensation Insurance, Inc. All Rights Reserved.

MISSOURI
EFFECTIVE 1/1/2015CLASS CLOTH, CANVAS AND RELATED PRODUCTS MFG. NOC
2501
Industry Group: Manufacturing CONVERTED LOSSESHazard Group: C INDEMNITY LIKELY INDEMNITY NOT-LIKELY MED LIKELY MED NOT-LIKELY TOTAL TOTAL
POLICY PERIOD PAYROLL CASES AMOUNT CASES AMOUNT AMOUNT AMOUNT AMOUNT PURE PREM.7/07 through 6/08 102,748,767 11 243,383 36 499,528 299,102 974,263 2,016,276 1.967/08 through 6/09 89,783,480 4 99,278 42 594,762 261,828 1,096,763 2,052,631 2.297/09 through 6/10 84,934,677 5 139,516 39 455,444 245,144 781,738 1,621,842 1.917/10 through 6/11 84,660,259 9 135,708 31 394,887 148,057 997,837 1,676,489 1.987/11 through 6/12 85,922,069 3 121,689 34 490,862 107,126 891,767 1,611,444 1.88
5 YR. TOTAL 448,049,252 32 739,574 182 2,435,483 1,061,257 4,742,368 8,978,682 2.00INDEMNITY MEDICAL TOTAL
CRED. PURE PREM.* CRED. PURE PREM.* PURE PREM.*Indicated Pure Premium 53% 0.709 74% 1.295 2.00Pure Premium Indicated by National Relativity 23% 0.795 13% 1.387 2.18Pure Premium Present on Rate Level 24% 0.759 13% 1.317 2.08Pure Premium Derived by Formula 0.741 1.310 2.05
CLASS DRESSMAKING OR TAILORING-CUSTOM EXCLUSIVELY
2503
Industry Group: Manufacturing CONVERTED LOSSESHazard Group: B INDEMNITY LIKELY INDEMNITY NOT-LIKELY MED LIKELY MED NOT-LIKELY TOTAL TOTAL
POLICY PERIOD PAYROLL CASES AMOUNT CASES AMOUNT AMOUNT AMOUNT AMOUNT PURE PREM.7/07 through 6/08 2,054,208 0 0 1 134 0 703 837 0.047/08 through 6/09 1,982,811 0 0 0 0 0 18,406 18,406 0.937/09 through 6/10 2,422,858 0 0 1 3,818 0 4,530 8,348 0.357/10 through 6/11 2,310,307 0 0 0 0 0 729 729 0.037/11 through 6/12 1,674,401 0 0 0 0 0 0 0 0.00
5 YR. TOTAL 10,444,585 0 0 2 3,952 0 24,368 28,320 0.27INDEMNITY MEDICAL TOTAL
CRED. PURE PREM.* CRED. PURE PREM.* PURE PREM.*Indicated Pure Premium 9% 0.038 12% 0.233 0.27Pure Premium Indicated by National Relativity 30% 0.407 32% 0.748 1.16Pure Premium Present on Rate Level 61% 0.413 56% 0.644 1.06Pure Premium Derived by Formula 0.377 0.628 1.01
CLASS FEATHER OR FLOWER MFG-ARTIFICIAL
2534
Industry Group: Manufacturing CONVERTED LOSSESHazard Group: B INDEMNITY LIKELY INDEMNITY NOT-LIKELY MED LIKELY MED NOT-LIKELY TOTAL TOTAL
POLICY PERIOD PAYROLL CASES AMOUNT CASES AMOUNT AMOUNT AMOUNT AMOUNT PURE PREM.7/07 through 6/08 1,769,760 0 0 0 0 0 7,138 7,138 0.407/08 through 6/09 1,766,320 0 0 6 85,405 0 253,120 338,525 19.177/09 through 6/10 2,075,488 0 0 0 0 0 18,228 18,228 0.887/10 through 6/11 2,303,331 0 0 1 11,850 0 43,790 55,640 2.427/11 through 6/12 2,012,861 0 0 3 36,458 0 76,956 113,414 5.63
5 YR. TOTAL 9,927,760 0 0 10 133,713 0 399,232 532,945 5.37INDEMNITY MEDICAL TOTAL
CRED. PURE PREM.* CRED. PURE PREM.* PURE PREM.*Indicated Pure Premium 13% 1.347 20% 4.021 5.37Pure Premium Indicated by National Relativity 11% 0.166 12% 0.307 0.47Pure Premium Present on Rate Level 76% 0.980 68% 2.370 3.35Pure Premium Derived by Formula 0.938 2.453 3.39
Page 30
* Pure Premium per $100 of Payroll** Pure Premium per employee++ Non-Standard Calculation© Copyright 2014 National Council on Compensation Insurance, Inc. All Rights Reserved.

MISSOURI
EFFECTIVE 1/1/2015CLASS MATTRESS OR BOX SPRING MFG
2570
Industry Group: Manufacturing CONVERTED LOSSESHazard Group: B INDEMNITY LIKELY INDEMNITY NOT-LIKELY MED LIKELY MED NOT-LIKELY TOTAL TOTAL
POLICY PERIOD PAYROLL CASES AMOUNT CASES AMOUNT AMOUNT AMOUNT AMOUNT PURE PREM.7/07 through 6/08 3,929,579 4 48,952 3 26,011 6,129 44,613 125,705 3.207/08 through 6/09 2,000,098 4 209,078 2 32,996 271,787 32,511 546,372 27.327/09 through 6/10 2,192,244 1 24,165 1 10,876 67,844 8,777 111,662 5.097/10 through 6/11 1,707,618 0 0 1 3,715 0 6,111 9,826 0.587/11 through 6/12 1,819,976 0 0 3 45,736 0 44,879 90,615 4.98
5 YR. TOTAL 11,649,515 9 282,195 10 119,334 345,760 136,891 884,180 7.59INDEMNITY MEDICAL TOTAL
CRED. PURE PREM.* CRED. PURE PREM.* PURE PREM.*Indicated Pure Premium 18% 3.447 22% 4.143 7.59Pure Premium Indicated by National Relativity 41% 1.498 39% 2.300 3.80Pure Premium Present on Rate Level 41% 1.881 39% 2.443 4.32Pure Premium Derived by Formula 2.006 2.761 4.77
CLASS LAUNDRY NOC & ROUTE SUPERVISORS, DRIVERS
2585
Industry Group: Manufacturing CONVERTED LOSSESHazard Group: B INDEMNITY LIKELY INDEMNITY NOT-LIKELY MED LIKELY MED NOT-LIKELY TOTAL TOTAL
POLICY PERIOD PAYROLL CASES AMOUNT CASES AMOUNT AMOUNT AMOUNT AMOUNT PURE PREM.7/07 through 6/08 82,691,759 17 336,764 36 323,016 598,709 679,096 1,937,585 2.347/08 through 6/09 78,146,932 14 375,953 40 393,718 570,021 1,077,932 2,417,624 3.097/09 through 6/10 77,039,867 14 443,827 33 376,374 655,046 795,824 2,271,071 2.957/10 through 6/11 83,499,151 9 251,245 32 424,096 303,239 791,022 1,769,602 2.127/11 through 6/12 83,858,072 17 490,240 23 281,743 535,499 590,625 1,898,107 2.26
5 YR. TOTAL 405,235,781 71 1,898,029 164 1,798,947 2,662,514 3,934,499 10,293,989 2.54INDEMNITY MEDICAL TOTAL
CRED. PURE PREM.* CRED. PURE PREM.* PURE PREM.*Indicated Pure Premium 60% 0.912 83% 1.628 2.54Pure Premium Indicated by National Relativity 20% 1.340 8% 2.178 3.52Pure Premium Present on Rate Level 20% 1.155 9% 1.969 3.12Pure Premium Derived by Formula 1.046 1.703 2.75
CLASS CLEANING OR DYEING & ROUTE SUPERVISORS, DRIVERS
2586
Industry Group: Manufacturing CONVERTED LOSSESHazard Group: C INDEMNITY LIKELY INDEMNITY NOT-LIKELY MED LIKELY MED NOT-LIKELY TOTAL TOTAL
POLICY PERIOD PAYROLL CASES AMOUNT CASES AMOUNT AMOUNT AMOUNT AMOUNT PURE PREM.7/07 through 6/08 9,750,964 2 23,181 2 32,507 32,353 42,940 130,981 1.347/08 through 6/09 5,132,566 1 24,030 1 17,354 68,094 68,222 177,700 3.467/09 through 6/10 7,016,574 1 52,754 2 8,495 29,535 41,441 132,225 1.897/10 through 6/11 5,778,656 0 0 3 21,496 0 35,567 57,063 0.997/11 through 6/12 5,473,935 0 0 2 28,696 0 22,899 51,595 0.94
5 YR. TOTAL 33,152,695 4 99,965 10 108,548 129,982 211,069 549,564 1.66INDEMNITY MEDICAL TOTAL
CRED. PURE PREM.* CRED. PURE PREM.* PURE PREM.*Indicated Pure Premium 21% 0.629 28% 1.029 1.66Pure Premium Indicated by National Relativity 39% 0.842 36% 1.480 2.32Pure Premium Present on Rate Level 40% 0.989 36% 1.570 2.56Pure Premium Derived by Formula 0.856 1.386 2.24
Page 31
* Pure Premium per $100 of Payroll** Pure Premium per employee++ Non-Standard Calculation© Copyright 2014 National Council on Compensation Insurance, Inc. All Rights Reserved.

MISSOURI
EFFECTIVE 1/1/2015CLASS TOWEL OR TOILET SUPPLY CO. & ROUTE SUPERVISORS, DRIVERS
2587
Industry Group: Goods and Services CONVERTED LOSSESHazard Group: B INDEMNITY LIKELY INDEMNITY NOT-LIKELY MED LIKELY MED NOT-LIKELY TOTAL TOTAL
POLICY PERIOD PAYROLL CASES AMOUNT CASES AMOUNT AMOUNT AMOUNT AMOUNT PURE PREM.7/07 through 6/08 2,179,097 1 49,056 0 0 45,664 21,772 116,492 5.357/08 through 6/09 2,734,837 1 4,178 0 0 3,189 6,902 14,269 0.527/09 through 6/10 3,059,488 0 0 3 21,229 0 89,373 110,602 3.627/10 through 6/11 2,955,665 0 0 2 15,194 0 59,190 74,384 2.527/11 through 6/12 3,060,249 0 0 0 0 0 6,695 6,695 0.22
5 YR. TOTAL 13,989,336 2 53,234 5 36,423 48,853 183,932 322,442 2.31INDEMNITY MEDICAL TOTAL
CRED. PURE PREM.* CRED. PURE PREM.* PURE PREM.*Indicated Pure Premium 19% 0.641 23% 1.664 2.31Pure Premium Indicated by National Relativity 40% 1.050 38% 1.514 2.56Pure Premium Present on Rate Level 41% 2.031 39% 2.416 4.45Pure Premium Derived by Formula 1.375 1.900 3.28
CLASS LAUNDRY AND DRY CLEANING STORE-RETAIL-& ROUTE SUPERVISORS, DRIVERS
2589
Industry Group: Manufacturing CONVERTED LOSSESHazard Group: C INDEMNITY LIKELY INDEMNITY NOT-LIKELY MED LIKELY MED NOT-LIKELY TOTAL TOTAL
POLICY PERIOD PAYROLL CASES AMOUNT CASES AMOUNT AMOUNT AMOUNT AMOUNT PURE PREM.7/07 through 6/08 26,025,384 1 2,993 10 99,956 0 200,773 303,722 1.177/08 through 6/09 27,034,986 1 246 7 60,939 20,286 149,962 231,433 0.867/09 through 6/10 23,235,056 1 73,661 7 102,316 34,230 216,696 426,903 1.847/10 through 6/11 23,565,811 0 0 14 136,840 0 227,307 364,147 1.557/11 through 6/12 22,746,954 2 21,643 9 76,408 16,310 230,912 345,273 1.52
5 YR. TOTAL 122,608,191 5 98,543 47 476,459 70,826 1,025,650 1,671,478 1.36INDEMNITY MEDICAL TOTAL
CRED. PURE PREM.* CRED. PURE PREM.* PURE PREM.*Indicated Pure Premium 28% 0.469 40% 0.894 1.36Pure Premium Indicated by National Relativity 36% 0.644 30% 1.178 1.82Pure Premium Present on Rate Level 36% 0.590 30% 1.032 1.62Pure Premium Derived by Formula 0.576 1.021 1.60
CLASS FUR PROCESSING-PREPARING SKINS
2600
Industry Group: Manufacturing CONVERTED LOSSESHazard Group: B INDEMNITY LIKELY INDEMNITY NOT-LIKELY MED LIKELY MED NOT-LIKELY TOTAL TOTAL
POLICY PERIOD PAYROLL CASES AMOUNT CASES AMOUNT AMOUNT AMOUNT AMOUNT PURE PREM.7/07 through 6/08 0 0 0 0 0 0 0 0 0.007/08 through 6/09 0 0 0 0 0 0 0 0 0.007/09 through 6/10 0 0 0 0 0 0 0 0 0.007/10 through 6/11 0 0 0 0 0 0 0 0 0.007/11 through 6/12 0 0 0 0 0 0 0 0 0.00
5 YR. TOTAL 0 0 0 0 0 0 0 0 0.00INDEMNITY MEDICAL TOTAL
CRED. PURE PREM.* CRED. PURE PREM.* PURE PREM.*Indicated Pure Premium 0% 0.000 0% 0.000 0.00Pure Premium Indicated by National Relativity 16% 1.459 16% 1.876 3.34Pure Premium Present on Rate Level 84% 0.971 84% 0.899 1.87Pure Premium Derived by Formula 1.049 1.055 2.10
Page 32
* Pure Premium per $100 of Payroll** Pure Premium per employee++ Non-Standard Calculation© Copyright 2014 National Council on Compensation Insurance, Inc. All Rights Reserved.

MISSOURI
EFFECTIVE 1/1/2015CLASS LEATHER MFG.--INCLUDING TANNING, LEATHER EMBOSSING, AND WOOL PULLING
2623
Industry Group: Manufacturing CONVERTED LOSSESHazard Group: D INDEMNITY LIKELY INDEMNITY NOT-LIKELY MED LIKELY MED NOT-LIKELY TOTAL TOTAL
POLICY PERIOD PAYROLL CASES AMOUNT CASES AMOUNT AMOUNT AMOUNT AMOUNT PURE PREM.7/07 through 6/08 2,893,942 0 0 1 12,342 0 21,733 34,075 1.187/08 through 6/09 4,954,784 4 34,667 5 51,530 73,145 164,488 323,830 6.547/09 through 6/10 3,033,428 2 45,234 4 115,793 37,068 228,766 426,861 14.077/10 through 6/11 6,054,693 0 0 0 0 0 0 0 0.007/11 through 6/12 2,623,094 0 0 3 40,705 0 83,929 124,634 4.75
5 YR. TOTAL 19,559,941 6 79,901 13 220,370 110,213 498,916 909,400 4.65INDEMNITY MEDICAL TOTAL
CRED. PURE PREM.* CRED. PURE PREM.* PURE PREM.*Indicated Pure Premium 23% 1.535 29% 3.114 4.65Pure Premium Indicated by National Relativity 26% 2.704 28% 4.139 6.84Pure Premium Present on Rate Level 51% 2.102 43% 3.031 5.13Pure Premium Derived by Formula 2.128 3.365 5.49
CLASS SHOE STOCK MFG
2651
Industry Group: Manufacturing CONVERTED LOSSESHazard Group: B INDEMNITY LIKELY INDEMNITY NOT-LIKELY MED LIKELY MED NOT-LIKELY TOTAL TOTAL
POLICY PERIOD PAYROLL CASES AMOUNT CASES AMOUNT AMOUNT AMOUNT AMOUNT PURE PREM.7/07 through 6/08 6,586,993 0 0 3 409,991 0 323,056 733,047 11.137/08 through 6/09 4,776,398 0 0 1 6,888 0 18,336 25,224 0.537/09 through 6/10 5,384,299 0 0 2 62,322 0 647,221 709,543 13.187/10 through 6/11 7,075,921 0 0 2 10,769 0 27,058 37,827 0.537/11 through 6/12 7,993,861 2 29,568 6 43,931 18,240 118,651 210,390 2.63
5 YR. TOTAL 31,817,472 2 29,568 14 533,901 18,240 1,134,322 1,716,031 5.39INDEMNITY MEDICAL TOTAL
CRED. PURE PREM.* CRED. PURE PREM.* PURE PREM.*Indicated Pure Premium 17% 1.771 31% 3.622 5.39Pure Premium Indicated by National Relativity 29% 0.248 31% 0.676 0.92Pure Premium Present on Rate Level 54% 0.598 38% 2.076 2.67Pure Premium Derived by Formula 0.696 2.121 2.82
CLASS BOOT OR SHOE MFG NOC
2660
Industry Group: Manufacturing CONVERTED LOSSESHazard Group: B INDEMNITY LIKELY INDEMNITY NOT-LIKELY MED LIKELY MED NOT-LIKELY TOTAL TOTAL
POLICY PERIOD PAYROLL CASES AMOUNT CASES AMOUNT AMOUNT AMOUNT AMOUNT PURE PREM.7/07 through 6/08 16,348,081 1 82,559 11 63,041 93,435 169,583 408,618 2.507/08 through 6/09 14,922,842 1 8,356 10 53,880 16,083 122,193 200,512 1.347/09 through 6/10 19,788,512 1 29,359 11 66,021 134,295 99,172 328,847 1.667/10 through 6/11 23,995,186 7 143,199 21 159,477 89,901 360,736 753,313 3.147/11 through 6/12 24,748,525 2 43,226 23 164,824 89,463 300,186 597,699 2.42
5 YR. TOTAL 99,803,146 12 306,699 76 507,243 423,177 1,051,870 2,288,989 2.29INDEMNITY MEDICAL TOTAL
CRED. PURE PREM.* CRED. PURE PREM.* PURE PREM.*Indicated Pure Premium 28% 0.816 39% 1.478 2.29Pure Premium Indicated by National Relativity 36% 0.826 30% 1.593 2.42Pure Premium Present on Rate Level 36% 0.719 31% 1.225 1.94Pure Premium Derived by Formula 0.785 1.434 2.22
Page 33
* Pure Premium per $100 of Payroll** Pure Premium per employee++ Non-Standard Calculation© Copyright 2014 National Council on Compensation Insurance, Inc. All Rights Reserved.

MISSOURI
EFFECTIVE 1/1/2015CLASS GLOVE MFG-LEATHER OR TEXTILE
2670
Industry Group: Manufacturing CONVERTED LOSSESHazard Group: A INDEMNITY LIKELY INDEMNITY NOT-LIKELY MED LIKELY MED NOT-LIKELY TOTAL TOTAL
POLICY PERIOD PAYROLL CASES AMOUNT CASES AMOUNT AMOUNT AMOUNT AMOUNT PURE PREM.7/07 through 6/08 2,109,765 0 0 0 0 0 16,323 16,323 0.777/08 through 6/09 2,083,451 0 0 1 6,687 0 44,127 50,814 2.447/09 through 6/10 2,082,515 0 0 1 4,917 0 15,049 19,966 0.967/10 through 6/11 1,887,950 0 0 0 0 0 1,062 1,062 0.067/11 through 6/12 1,821,895 0 0 0 0 0 0 0 0.00
5 YR. TOTAL 9,985,576 0 0 2 11,604 0 76,561 88,165 0.88INDEMNITY MEDICAL TOTAL
CRED. PURE PREM.* CRED. PURE PREM.* PURE PREM.*Indicated Pure Premium 10% 0.116 14% 0.767 0.88Pure Premium Indicated by National Relativity 25% 0.475 26% 1.066 1.54Pure Premium Present on Rate Level 65% 0.539 60% 0.877 1.42Pure Premium Derived by Formula 0.481 0.911 1.39
CLASS LUGGAGE MFG
2683
Industry Group: Manufacturing CONVERTED LOSSESHazard Group: B INDEMNITY LIKELY INDEMNITY NOT-LIKELY MED LIKELY MED NOT-LIKELY TOTAL TOTAL
POLICY PERIOD PAYROLL CASES AMOUNT CASES AMOUNT AMOUNT AMOUNT AMOUNT PURE PREM.7/07 through 6/08 945,264 0 0 0 0 0 4,580 4,580 0.497/08 through 6/09 994,055 0 0 1 5,851 0 10,257 16,108 1.627/09 through 6/10 1,629,768 0 0 1 3,056 0 6,221 9,277 0.577/10 through 6/11 1,034,030 0 0 0 0 0 1,972 1,972 0.197/11 through 6/12 1,300,191 0 0 0 0 0 1,937 1,937 0.15
5 YR. TOTAL 5,903,308 0 0 2 8,907 0 24,967 33,874 0.57INDEMNITY MEDICAL TOTAL
CRED. PURE PREM.* CRED. PURE PREM.* PURE PREM.*Indicated Pure Premium 8% 0.151 12% 0.423 0.57Pure Premium Indicated by National Relativity 22% 0.343 23% 0.731 1.07Pure Premium Present on Rate Level 70% 0.531 65% 1.005 1.54Pure Premium Derived by Formula 0.459 0.872 1.33
CLASS LEATHER GOODS MFG NOC
2688
Industry Group: Manufacturing CONVERTED LOSSESHazard Group: B INDEMNITY LIKELY INDEMNITY NOT-LIKELY MED LIKELY MED NOT-LIKELY TOTAL TOTAL
POLICY PERIOD PAYROLL CASES AMOUNT CASES AMOUNT AMOUNT AMOUNT AMOUNT PURE PREM.7/07 through 6/08 6,637,456 2 13,249 6 29,253 13,857 47,021 103,380 1.567/08 through 6/09 5,067,328 0 0 3 13,019 0 38,635 51,654 1.027/09 through 6/10 5,182,032 0 0 3 31,517 0 122,736 154,253 2.987/10 through 6/11 5,571,738 1 13,500 2 37,265 14,855 86,726 152,346 2.737/11 through 6/12 6,287,142 0 0 4 36,957 0 108,102 145,059 2.31
5 YR. TOTAL 28,745,696 3 26,749 18 148,011 28,712 403,220 606,692 2.11INDEMNITY MEDICAL TOTAL
CRED. PURE PREM.* CRED. PURE PREM.* PURE PREM.*Indicated Pure Premium 18% 0.608 25% 1.503 2.11Pure Premium Indicated by National Relativity 36% 0.885 37% 1.283 2.17Pure Premium Present on Rate Level 46% 0.802 38% 1.415 2.22Pure Premium Derived by Formula 0.797 1.388 2.19
Page 34
* Pure Premium per $100 of Payroll** Pure Premium per employee++ Non-Standard Calculation© Copyright 2014 National Council on Compensation Insurance, Inc. All Rights Reserved.

MISSOURI
EFFECTIVE 1/1/2015CLASS LOGGING OR TREE REMOVAL - LOG HAULING & DRIVERS
2701
Industry Group: Miscellaneous CONVERTED LOSSESHazard Group: E INDEMNITY LIKELY INDEMNITY NOT-LIKELY MED LIKELY MED NOT-LIKELY TOTAL TOTAL
POLICY PERIOD PAYROLL CASES AMOUNT CASES AMOUNT AMOUNT AMOUNT AMOUNT PURE PREM.7/07 through 6/08 90,178 0 0 0 0 0 0 0 0.007/08 through 6/09 254,774 0 0 0 0 0 0 0 0.007/09 through 6/10 266,984 0 0 0 0 0 0 0 0.007/10 through 6/11 409,620 0 0 0 0 0 0 0 0.007/11 through 6/12 334,041 0 0 0 0 0 0 0 0.00
5 YR. TOTAL 1,355,597 0 0 0 0 0 0 0 0.00INDEMNITY MEDICAL TOTAL
CRED. PURE PREM.* CRED. PURE PREM.* PURE PREM.*Indicated Pure Premium 10% 0.000 12% 0.000 0.00Pure Premium Indicated by National Relativity 45% 4.759 44% 6.324 11.08Pure Premium Present on Rate Level 45% 4.597 44% 5.207 9.80Pure Premium Derived by Formula 4.210 5.074 9.28
CLASS LOGGING OR TREE REMOVAL - NONMECHANIZED OPERATIONS
2702
Industry Group: Miscellaneous CONVERTED LOSSESHazard Group: G INDEMNITY LIKELY INDEMNITY NOT-LIKELY MED LIKELY MED NOT-LIKELY TOTAL TOTAL
POLICY PERIOD PAYROLL CASES AMOUNT CASES AMOUNT AMOUNT AMOUNT AMOUNT PURE PREM.7/07 through 6/08 1,335,208 1 121,989 9 114,820 292,514 317,317 846,640 63.417/08 through 6/09 1,364,643 1 115,269 3 63,246 358,658 69,714 606,887 44.477/09 through 6/10 1,889,983 1 101,715 10 98,977 374,700 254,976 830,368 43.947/10 through 6/11 2,189,952 0 0 4 22,884 0 214,992 237,876 10.867/11 through 6/12 2,143,315 2 41,278 4 739,019 228,444 204,285 1,213,026 56.60
5 YR. TOTAL 8,923,101 5 380,251 30 1,038,946 1,254,316 1,061,284 3,734,797 41.86INDEMNITY MEDICAL TOTAL
CRED. PURE PREM.* CRED. PURE PREM.* PURE PREM.*Indicated Pure Premium 29% 15.905 43% 25.951 41.86Pure Premium Indicated by National Relativity 35% 8.441 28% 10.862 19.30Pure Premium Present on Rate Level 36% 8.788 29% 18.290 27.08Pure Premium Derived by Formula 10.730 19.504 30.23
CLASS LOGGING OR TREE REMOVAL - MECHANIZED EQUIPMENT OPERATORS
2709
Industry Group: Miscellaneous CONVERTED LOSSESHazard Group: E INDEMNITY LIKELY INDEMNITY NOT-LIKELY MED LIKELY MED NOT-LIKELY TOTAL TOTAL
POLICY PERIOD PAYROLL CASES AMOUNT CASES AMOUNT AMOUNT AMOUNT AMOUNT PURE PREM.7/07 through 6/08 0 0 0 0 0 0 0 0 0.007/08 through 6/09 0 0 0 0 0 0 0 0 0.007/09 through 6/10 0 0 0 0 0 0 0 0 0.007/10 through 6/11 70,033 0 0 0 0 0 0 0 0.007/11 through 6/12 8,730 0 0 0 0 0 0 0 0.00
5 YR. TOTAL 78,763 0 0 0 0 0 0 0 0.00INDEMNITY MEDICAL TOTAL
CRED. PURE PREM.* CRED. PURE PREM.* PURE PREM.*Indicated Pure Premium 4% 0.000 4% 0.000 0.00Pure Premium Indicated by National Relativity 48% 5.040 48% 6.461 11.50Pure Premium Present on Rate Level 48% 5.826 48% 6.655 12.48Pure Premium Derived by Formula 5.216 6.296 11.51
Page 35
* Pure Premium per $100 of Payroll** Pure Premium per employee++ Non-Standard Calculation© Copyright 2014 National Council on Compensation Insurance, Inc. All Rights Reserved.
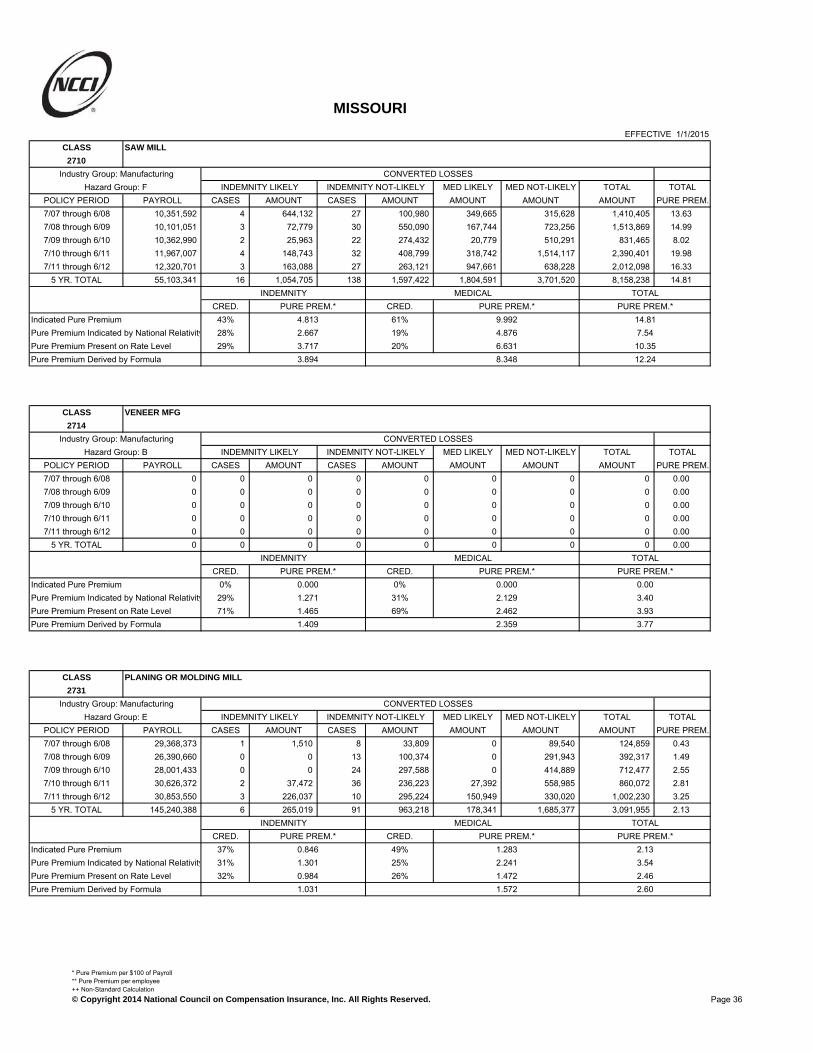
MISSOURI
EFFECTIVE 1/1/2015CLASS SAW MILL
2710
Industry Group: Manufacturing CONVERTED LOSSESHazard Group: F INDEMNITY LIKELY INDEMNITY NOT-LIKELY MED LIKELY MED NOT-LIKELY TOTAL TOTAL
POLICY PERIOD PAYROLL CASES AMOUNT CASES AMOUNT AMOUNT AMOUNT AMOUNT PURE PREM.7/07 through 6/08 10,351,592 4 644,132 27 100,980 349,665 315,628 1,410,405 13.637/08 through 6/09 10,101,051 3 72,779 30 550,090 167,744 723,256 1,513,869 14.997/09 through 6/10 10,362,990 2 25,963 22 274,432 20,779 510,291 831,465 8.027/10 through 6/11 11,967,007 4 148,743 32 408,799 318,742 1,514,117 2,390,401 19.987/11 through 6/12 12,320,701 3 163,088 27 263,121 947,661 638,228 2,012,098 16.33
5 YR. TOTAL 55,103,341 16 1,054,705 138 1,597,422 1,804,591 3,701,520 8,158,238 14.81INDEMNITY MEDICAL TOTAL
CRED. PURE PREM.* CRED. PURE PREM.* PURE PREM.*Indicated Pure Premium 43% 4.813 61% 9.992 14.81Pure Premium Indicated by National Relativity 28% 2.667 19% 4.876 7.54Pure Premium Present on Rate Level 29% 3.717 20% 6.631 10.35Pure Premium Derived by Formula 3.894 8.348 12.24
CLASS VENEER MFG
2714
Industry Group: Manufacturing CONVERTED LOSSESHazard Group: B INDEMNITY LIKELY INDEMNITY NOT-LIKELY MED LIKELY MED NOT-LIKELY TOTAL TOTAL
POLICY PERIOD PAYROLL CASES AMOUNT CASES AMOUNT AMOUNT AMOUNT AMOUNT PURE PREM.7/07 through 6/08 0 0 0 0 0 0 0 0 0.007/08 through 6/09 0 0 0 0 0 0 0 0 0.007/09 through 6/10 0 0 0 0 0 0 0 0 0.007/10 through 6/11 0 0 0 0 0 0 0 0 0.007/11 through 6/12 0 0 0 0 0 0 0 0 0.00
5 YR. TOTAL 0 0 0 0 0 0 0 0 0.00INDEMNITY MEDICAL TOTAL
CRED. PURE PREM.* CRED. PURE PREM.* PURE PREM.*Indicated Pure Premium 0% 0.000 0% 0.000 0.00Pure Premium Indicated by National Relativity 29% 1.271 31% 2.129 3.40Pure Premium Present on Rate Level 71% 1.465 69% 2.462 3.93Pure Premium Derived by Formula 1.409 2.359 3.77
CLASS PLANING OR MOLDING MILL
2731
Industry Group: Manufacturing CONVERTED LOSSESHazard Group: E INDEMNITY LIKELY INDEMNITY NOT-LIKELY MED LIKELY MED NOT-LIKELY TOTAL TOTAL
POLICY PERIOD PAYROLL CASES AMOUNT CASES AMOUNT AMOUNT AMOUNT AMOUNT PURE PREM.7/07 through 6/08 29,368,373 1 1,510 8 33,809 0 89,540 124,859 0.437/08 through 6/09 26,390,660 0 0 13 100,374 0 291,943 392,317 1.497/09 through 6/10 28,001,433 0 0 24 297,588 0 414,889 712,477 2.557/10 through 6/11 30,626,372 2 37,472 36 236,223 27,392 558,985 860,072 2.817/11 through 6/12 30,853,550 3 226,037 10 295,224 150,949 330,020 1,002,230 3.25
5 YR. TOTAL 145,240,388 6 265,019 91 963,218 178,341 1,685,377 3,091,955 2.13INDEMNITY MEDICAL TOTAL
CRED. PURE PREM.* CRED. PURE PREM.* PURE PREM.*Indicated Pure Premium 37% 0.846 49% 1.283 2.13Pure Premium Indicated by National Relativity 31% 1.301 25% 2.241 3.54Pure Premium Present on Rate Level 32% 0.984 26% 1.472 2.46Pure Premium Derived by Formula 1.031 1.572 2.60
Page 36
* Pure Premium per $100 of Payroll** Pure Premium per employee++ Non-Standard Calculation© Copyright 2014 National Council on Compensation Insurance, Inc. All Rights Reserved.

MISSOURI
EFFECTIVE 1/1/2015CLASS FURNITURE STOCK MFG
2735
Industry Group: Manufacturing CONVERTED LOSSESHazard Group: B INDEMNITY LIKELY INDEMNITY NOT-LIKELY MED LIKELY MED NOT-LIKELY TOTAL TOTAL
POLICY PERIOD PAYROLL CASES AMOUNT CASES AMOUNT AMOUNT AMOUNT AMOUNT PURE PREM.7/07 through 6/08 3,334,293 0 0 1 475 0 4,496 4,971 0.157/08 through 6/09 2,688,475 0 0 0 0 0 3,141 3,141 0.127/09 through 6/10 2,562,280 0 0 1 10,907 0 16,836 27,743 1.087/10 through 6/11 3,331,834 1 31,882 3 13,965 47,385 28,788 122,020 3.667/11 through 6/12 3,095,025 0 0 4 28,633 0 101,203 129,836 4.20
5 YR. TOTAL 15,011,907 1 31,882 9 53,980 47,385 154,464 287,711 1.92INDEMNITY MEDICAL TOTAL
CRED. PURE PREM.* CRED. PURE PREM.* PURE PREM.*Indicated Pure Premium 18% 0.572 23% 1.345 1.92Pure Premium Indicated by National Relativity 41% 1.399 38% 2.695 4.09Pure Premium Present on Rate Level 41% 1.498 39% 2.169 3.67Pure Premium Derived by Formula 1.291 2.179 3.47
CLASS COOPERAGE ASSEMBLY
2747
Industry Group: Manufacturing CONVERTED LOSSESHazard Group: A INDEMNITY LIKELY INDEMNITY NOT-LIKELY MED LIKELY MED NOT-LIKELY TOTAL TOTAL
POLICY PERIOD PAYROLL CASES AMOUNT CASES AMOUNT AMOUNT AMOUNT AMOUNT PURE PREM.7/07 through 6/08 1,998,536 0 0 2 13,256 0 28,799 42,055 2.107/08 through 6/09 2,255,454 0 0 0 0 0 0 0 0.007/09 through 6/10 2,661,929 0 0 4 17,283 0 82,901 100,184 3.767/10 through 6/11 2,287,064 0 0 6 38,633 0 58,817 97,450 4.267/11 through 6/12 2,648,845 2 47,778 4 56,624 82,723 209,615 396,740 14.98
5 YR. TOTAL 11,851,828 2 47,778 16 125,796 82,723 380,132 636,429 5.37INDEMNITY MEDICAL TOTAL
CRED. PURE PREM.* CRED. PURE PREM.* PURE PREM.*Indicated Pure Premium 11% 1.465 18% 3.905 5.37Pure Premium Indicated by National Relativity 6% 0.173 6% 0.339 0.51Pure Premium Present on Rate Level 83% 0.621 76% 1.393 2.01Pure Premium Derived by Formula 0.687 1.782 2.47
CLASS BOX OR BOX SHOOK MFG
2759
Industry Group: Manufacturing CONVERTED LOSSESHazard Group: B INDEMNITY LIKELY INDEMNITY NOT-LIKELY MED LIKELY MED NOT-LIKELY TOTAL TOTAL
POLICY PERIOD PAYROLL CASES AMOUNT CASES AMOUNT AMOUNT AMOUNT AMOUNT PURE PREM.7/07 through 6/08 20,360,078 4 51,663 30 285,194 49,473 628,824 1,015,154 4.997/08 through 6/09 20,028,147 1 85,877 36 486,037 55,468 1,108,850 1,736,232 8.677/09 through 6/10 19,251,005 1 22,124 17 175,123 14,670 361,204 573,121 2.987/10 through 6/11 21,619,767 5 139,608 19 160,584 185,007 553,284 1,038,483 4.807/11 through 6/12 22,254,853 3 74,597 28 260,429 152,462 552,426 1,039,914 4.67
5 YR. TOTAL 103,513,850 14 373,869 130 1,367,367 457,080 3,204,588 5,402,904 5.22INDEMNITY MEDICAL TOTAL
CRED. PURE PREM.* CRED. PURE PREM.* PURE PREM.*Indicated Pure Premium 41% 1.682 61% 3.537 5.22Pure Premium Indicated by National Relativity 29% 1.871 19% 3.254 5.13Pure Premium Present on Rate Level 30% 1.818 20% 3.592 5.41Pure Premium Derived by Formula 1.778 3.494 5.27
Page 37
* Pure Premium per $100 of Payroll** Pure Premium per employee++ Non-Standard Calculation© Copyright 2014 National Council on Compensation Insurance, Inc. All Rights Reserved.

MISSOURI
EFFECTIVE 1/1/2015CLASS PATTERN MAKING NOC
2790
Industry Group: Manufacturing CONVERTED LOSSESHazard Group: B INDEMNITY LIKELY INDEMNITY NOT-LIKELY MED LIKELY MED NOT-LIKELY TOTAL TOTAL
POLICY PERIOD PAYROLL CASES AMOUNT CASES AMOUNT AMOUNT AMOUNT AMOUNT PURE PREM.7/07 through 6/08 4,941,016 0 0 3 17,034 0 42,709 59,743 1.217/08 through 6/09 5,145,391 0 0 2 21,389 0 95,840 117,229 2.287/09 through 6/10 4,515,184 0 0 2 1,648 0 5,206 6,854 0.157/10 through 6/11 3,788,292 0 0 1 2,909 0 17,866 20,775 0.557/11 through 6/12 3,831,810 1 5,654 1 6,185 9,549 24,408 45,796 1.20
5 YR. TOTAL 22,221,693 1 5,654 9 49,165 9,549 186,029 250,397 1.13INDEMNITY MEDICAL TOTAL
CRED. PURE PREM.* CRED. PURE PREM.* PURE PREM.*Indicated Pure Premium 14% 0.247 20% 0.880 1.13Pure Premium Indicated by National Relativity 40% 0.458 40% 1.048 1.51Pure Premium Present on Rate Level 46% 0.523 40% 1.070 1.59Pure Premium Derived by Formula 0.458 1.023 1.48
CLASS PIPE MFG. - WOODEN, TOBACCO
2791
Industry Group: Manufacturing CONVERTED LOSSESHazard Group: A INDEMNITY LIKELY INDEMNITY NOT-LIKELY MED LIKELY MED NOT-LIKELY TOTAL TOTAL
POLICY PERIOD PAYROLL CASES AMOUNT CASES AMOUNT AMOUNT AMOUNT AMOUNT PURE PREM.7/07 through 6/08 523,818 0 0 0 0 0 0 0 0.007/08 through 6/09 485,102 0 0 1 3,050 0 4,282 7,332 1.517/09 through 6/10 561,983 0 0 0 0 0 2,960 2,960 0.537/10 through 6/11 524,176 0 0 1 31,132 0 601,067 632,199 120.617/11 through 6/12 504,605 0 0 0 0 0 0 0 0.00
5 YR. TOTAL 2,599,684 0 0 2 34,182 0 608,309 642,491 24.71INDEMNITY MEDICAL TOTAL
CRED. PURE PREM.* CRED. PURE PREM.* PURE PREM.*Indicated Pure Premium 5% 1.315 9% 23.399 24.71Pure Premium Indicated by National Relativity 0% 0.000 0% 0.000 0.00Pure Premium Present on Rate Level 95% 0.412 91% 1.213 1.63Pure Premium Derived by Formula 0.457 3.210 3.67
CLASS MANUFACTURED, MODULAR, OR PREFABRICATED HOME MANUFACTURING - SHOP WORK -
2797 ALL OPERATIONS & DRIVERS
Industry Group: Manufacturing CONVERTED LOSSESHazard Group: C INDEMNITY LIKELY INDEMNITY NOT-LIKELY MED LIKELY MED NOT-LIKELY TOTAL TOTAL
POLICY PERIOD PAYROLL CASES AMOUNT CASES AMOUNT AMOUNT AMOUNT AMOUNT PURE PREM.7/07 through 6/08 0 0 0 0 0 0 0 0 0.007/08 through 6/09 0 0 0 0 0 0 0 0 0.007/09 through 6/10 0 0 0 0 0 0 0 0 0.007/10 through 6/11 140,000 0 0 0 0 0 0 0 0.007/11 through 6/12 879,421 0 0 0 0 0 0 0 0.00
5 YR. TOTAL 1,019,421 0 0 0 0 0 0 0 0.00INDEMNITY MEDICAL TOTAL
CRED. PURE PREM.* CRED. PURE PREM.* PURE PREM.*Indicated Pure Premium 6% 0.000 8% 0.000 0.00Pure Premium Indicated by National Relativity 47% 1.424 46% 1.998 3.42Pure Premium Present on Rate Level 47% 1.400 46% 1.975 3.38Pure Premium Derived by Formula 1.327 1.828 3.16
Page 38
* Pure Premium per $100 of Payroll** Pure Premium per employee++ Non-Standard Calculation© Copyright 2014 National Council on Compensation Insurance, Inc. All Rights Reserved.
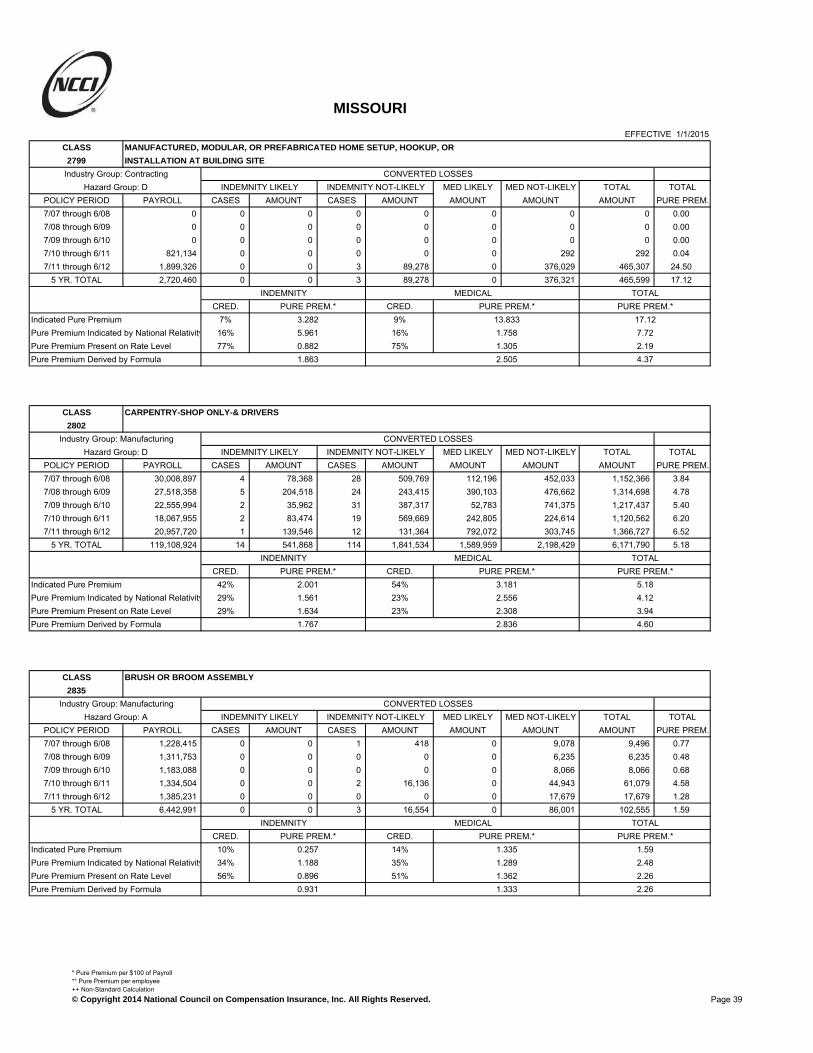
MISSOURI
EFFECTIVE 1/1/2015CLASS MANUFACTURED, MODULAR, OR PREFABRICATED HOME SETUP, HOOKUP, OR
2799 INSTALLATION AT BUILDING SITE
Industry Group: Contracting CONVERTED LOSSESHazard Group: D INDEMNITY LIKELY INDEMNITY NOT-LIKELY MED LIKELY MED NOT-LIKELY TOTAL TOTAL
POLICY PERIOD PAYROLL CASES AMOUNT CASES AMOUNT AMOUNT AMOUNT AMOUNT PURE PREM.7/07 through 6/08 0 0 0 0 0 0 0 0 0.007/08 through 6/09 0 0 0 0 0 0 0 0 0.007/09 through 6/10 0 0 0 0 0 0 0 0 0.007/10 through 6/11 821,134 0 0 0 0 0 292 292 0.047/11 through 6/12 1,899,326 0 0 3 89,278 0 376,029 465,307 24.50
5 YR. TOTAL 2,720,460 0 0 3 89,278 0 376,321 465,599 17.12INDEMNITY MEDICAL TOTAL
CRED. PURE PREM.* CRED. PURE PREM.* PURE PREM.*Indicated Pure Premium 7% 3.282 9% 13.833 17.12Pure Premium Indicated by National Relativity 16% 5.961 16% 1.758 7.72Pure Premium Present on Rate Level 77% 0.882 75% 1.305 2.19Pure Premium Derived by Formula 1.863 2.505 4.37
CLASS CARPENTRY-SHOP ONLY-& DRIVERS
2802
Industry Group: Manufacturing CONVERTED LOSSESHazard Group: D INDEMNITY LIKELY INDEMNITY NOT-LIKELY MED LIKELY MED NOT-LIKELY TOTAL TOTAL
POLICY PERIOD PAYROLL CASES AMOUNT CASES AMOUNT AMOUNT AMOUNT AMOUNT PURE PREM.7/07 through 6/08 30,008,897 4 78,368 28 509,769 112,196 452,033 1,152,366 3.847/08 through 6/09 27,518,358 5 204,518 24 243,415 390,103 476,662 1,314,698 4.787/09 through 6/10 22,555,994 2 35,962 31 387,317 52,783 741,375 1,217,437 5.407/10 through 6/11 18,067,955 2 83,474 19 569,669 242,805 224,614 1,120,562 6.207/11 through 6/12 20,957,720 1 139,546 12 131,364 792,072 303,745 1,366,727 6.52
5 YR. TOTAL 119,108,924 14 541,868 114 1,841,534 1,589,959 2,198,429 6,171,790 5.18INDEMNITY MEDICAL TOTAL
CRED. PURE PREM.* CRED. PURE PREM.* PURE PREM.*Indicated Pure Premium 42% 2.001 54% 3.181 5.18Pure Premium Indicated by National Relativity 29% 1.561 23% 2.556 4.12Pure Premium Present on Rate Level 29% 1.634 23% 2.308 3.94Pure Premium Derived by Formula 1.767 2.836 4.60
CLASS BRUSH OR BROOM ASSEMBLY
2835
Industry Group: Manufacturing CONVERTED LOSSESHazard Group: A INDEMNITY LIKELY INDEMNITY NOT-LIKELY MED LIKELY MED NOT-LIKELY TOTAL TOTAL
POLICY PERIOD PAYROLL CASES AMOUNT CASES AMOUNT AMOUNT AMOUNT AMOUNT PURE PREM.7/07 through 6/08 1,228,415 0 0 1 418 0 9,078 9,496 0.777/08 through 6/09 1,311,753 0 0 0 0 0 6,235 6,235 0.487/09 through 6/10 1,183,088 0 0 0 0 0 8,066 8,066 0.687/10 through 6/11 1,334,504 0 0 2 16,136 0 44,943 61,079 4.587/11 through 6/12 1,385,231 0 0 0 0 0 17,679 17,679 1.28
5 YR. TOTAL 6,442,991 0 0 3 16,554 0 86,001 102,555 1.59INDEMNITY MEDICAL TOTAL
CRED. PURE PREM.* CRED. PURE PREM.* PURE PREM.*Indicated Pure Premium 10% 0.257 14% 1.335 1.59Pure Premium Indicated by National Relativity 34% 1.188 35% 1.289 2.48Pure Premium Present on Rate Level 56% 0.896 51% 1.362 2.26Pure Premium Derived by Formula 0.931 1.333 2.26
Page 39
* Pure Premium per $100 of Payroll** Pure Premium per employee++ Non-Standard Calculation© Copyright 2014 National Council on Compensation Insurance, Inc. All Rights Reserved.

MISSOURI
EFFECTIVE 1/1/2015CLASS BRUSH OR BROOM MFG NOC
2836
Industry Group: Manufacturing CONVERTED LOSSESHazard Group: A INDEMNITY LIKELY INDEMNITY NOT-LIKELY MED LIKELY MED NOT-LIKELY TOTAL TOTAL
POLICY PERIOD PAYROLL CASES AMOUNT CASES AMOUNT AMOUNT AMOUNT AMOUNT PURE PREM.7/07 through 6/08 974,734 0 0 0 0 0 626 626 0.067/08 through 6/09 843,922 0 0 0 0 0 2,277 2,277 0.277/09 through 6/10 233,849 0 0 0 0 0 0 0 0.007/10 through 6/11 130,699 0 0 0 0 0 2,636 2,636 2.027/11 through 6/12 153,798 0 0 0 0 0 0 0 0.00
5 YR. TOTAL 2,337,002 0 0 0 0 0 5,539 5,539 0.24INDEMNITY MEDICAL TOTAL
CRED. PURE PREM.* CRED. PURE PREM.* PURE PREM.*Indicated Pure Premium 6% 0.000 9% 0.237 0.24Pure Premium Indicated by National Relativity 28% 0.468 29% 1.247 1.72Pure Premium Present on Rate Level 66% 0.734 62% 1.425 2.16Pure Premium Derived by Formula 0.615 1.266 1.88
CLASS WOODENWARE MANUFACTURING NOC
2841
Industry Group: Manufacturing CONVERTED LOSSESHazard Group: B INDEMNITY LIKELY INDEMNITY NOT-LIKELY MED LIKELY MED NOT-LIKELY TOTAL TOTAL
POLICY PERIOD PAYROLL CASES AMOUNT CASES AMOUNT AMOUNT AMOUNT AMOUNT PURE PREM.7/07 through 6/08 3,945,337 0 0 2 2,402 0 24,512 26,914 0.687/08 through 6/09 2,535,967 2 6,665 3 22,766 13,421 31,626 74,478 2.947/09 through 6/10 2,450,442 0 0 3 67,918 0 42,618 110,536 4.517/10 through 6/11 2,939,374 3 18,963 0 0 23,830 4,164 46,957 1.607/11 through 6/12 2,716,181 0 0 2 98,343 0 130,360 228,703 8.42
5 YR. TOTAL 14,587,301 5 25,628 10 191,429 37,251 233,280 487,588 3.34INDEMNITY MEDICAL TOTAL
CRED. PURE PREM.* CRED. PURE PREM.* PURE PREM.*Indicated Pure Premium 16% 1.488 22% 1.855 3.34Pure Premium Indicated by National Relativity 42% 1.128 39% 2.034 3.16Pure Premium Present on Rate Level 42% 1.271 39% 2.080 3.35Pure Premium Derived by Formula 1.246 2.013 3.26
CLASS FURNITURE MANUFACTURING AND CABINET SHOP - ASSEMBLY BY HAND - WOOD
2881
Industry Group: Manufacturing CONVERTED LOSSESHazard Group: A INDEMNITY LIKELY INDEMNITY NOT-LIKELY MED LIKELY MED NOT-LIKELY TOTAL TOTAL
POLICY PERIOD PAYROLL CASES AMOUNT CASES AMOUNT AMOUNT AMOUNT AMOUNT PURE PREM.7/07 through 6/08 9,726,819 0 0 7 55,324 0 86,127 141,451 1.457/08 through 6/09 8,684,870 0 0 2 16,896 0 31,868 48,764 0.567/09 through 6/10 7,862,252 2 55,041 2 9,463 45,734 27,379 137,617 1.757/10 through 6/11 8,254,697 0 0 10 121,780 0 179,938 301,718 3.667/11 through 6/12 8,941,233 1 18,137 5 92,060 24,607 135,183 269,987 3.02
5 YR. TOTAL 43,469,871 3 73,178 26 295,523 70,341 460,495 899,537 2.07INDEMNITY MEDICAL TOTAL
CRED. PURE PREM.* CRED. PURE PREM.* PURE PREM.*Indicated Pure Premium 22% 0.848 29% 1.221 2.07Pure Premium Indicated by National Relativity 39% 0.860 35% 1.432 2.29Pure Premium Present on Rate Level 39% 0.923 36% 1.345 2.27Pure Premium Derived by Formula 0.882 1.339 2.22
Page 40
* Pure Premium per $100 of Payroll** Pure Premium per employee++ Non-Standard Calculation© Copyright 2014 National Council on Compensation Insurance, Inc. All Rights Reserved.

MISSOURI
EFFECTIVE 1/1/2015CLASS FURNITURE MANUFACTURING AND CABINET SHOP - WOOD - NOC
2883
Industry Group: Manufacturing CONVERTED LOSSESHazard Group: C INDEMNITY LIKELY INDEMNITY NOT-LIKELY MED LIKELY MED NOT-LIKELY TOTAL TOTAL
POLICY PERIOD PAYROLL CASES AMOUNT CASES AMOUNT AMOUNT AMOUNT AMOUNT PURE PREM.7/07 through 6/08 113,169,365 8 338,298 76 804,872 689,249 1,753,410 3,585,829 3.177/08 through 6/09 83,458,114 7 149,539 35 380,423 225,489 807,800 1,563,251 1.877/09 through 6/10 85,118,149 8 927,421 49 730,766 1,288,629 1,377,142 4,323,958 5.087/10 through 6/11 91,120,096 7 172,215 47 732,038 156,050 1,154,317 2,214,620 2.437/11 through 6/12 89,668,307 8 640,423 36 718,650 590,671 1,195,625 3,145,369 3.51
5 YR. TOTAL 462,534,031 38 2,227,896 243 3,366,749 2,950,088 6,288,294 14,833,027 3.21INDEMNITY MEDICAL TOTAL
CRED. PURE PREM.* CRED. PURE PREM.* PURE PREM.*Indicated Pure Premium 64% 1.210 87% 1.997 3.21Pure Premium Indicated by National Relativity 18% 1.247 6% 2.020 3.27Pure Premium Present on Rate Level 18% 1.225 7% 1.948 3.17Pure Premium Derived by Formula 1.219 1.995 3.21
CLASS RATTAN, WILLOW OR TWISTED FIBER PRODUCTS MFG
2913
Industry Group: Manufacturing CONVERTED LOSSESHazard Group: A INDEMNITY LIKELY INDEMNITY NOT-LIKELY MED LIKELY MED NOT-LIKELY TOTAL TOTAL
POLICY PERIOD PAYROLL CASES AMOUNT CASES AMOUNT AMOUNT AMOUNT AMOUNT PURE PREM.7/07 through 6/08 84,679 0 0 1 1,431 0 10,957 12,388 14.637/08 through 6/09 98,304 0 0 0 0 0 253 253 0.267/09 through 6/10 70,000 0 0 0 0 0 0 0 0.007/10 through 6/11 41,700 0 0 0 0 0 0 0 0.007/11 through 6/12 33,835 0 0 0 0 0 0 0 0.00
5 YR. TOTAL 328,518 0 0 1 1,431 0 11,210 12,641 3.85INDEMNITY MEDICAL TOTAL
CRED. PURE PREM.* CRED. PURE PREM.* PURE PREM.*Indicated Pure Premium 4% 0.436 5% 3.412 3.85Pure Premium Indicated by National Relativity 11% 0.096 12% 0.992 1.09Pure Premium Present on Rate Level 85% 1.200 83% 2.018 3.22Pure Premium Derived by Formula 1.048 1.965 3.01
CLASS VENEER PRODUCTS MFG
2915
Industry Group: Manufacturing CONVERTED LOSSESHazard Group: D INDEMNITY LIKELY INDEMNITY NOT-LIKELY MED LIKELY MED NOT-LIKELY TOTAL TOTAL
POLICY PERIOD PAYROLL CASES AMOUNT CASES AMOUNT AMOUNT AMOUNT AMOUNT PURE PREM.7/07 through 6/08 199,019 0 0 0 0 0 307 307 0.157/08 through 6/09 199,090 0 0 0 0 0 21 21 0.017/09 through 6/10 245,459 1 8,896 0 0 12,546 0 21,442 8.747/10 through 6/11 215,018 0 0 0 0 0 0 0 0.007/11 through 6/12 0 0 0 0 0 0 0 0 0.00
5 YR. TOTAL 858,586 1 8,896 0 0 12,546 328 21,770 2.54INDEMNITY MEDICAL TOTAL
CRED. PURE PREM.* CRED. PURE PREM.* PURE PREM.*Indicated Pure Premium 5% 1.036 6% 1.499 2.54Pure Premium Indicated by National Relativity 47% 0.972 47% 1.269 2.24Pure Premium Present on Rate Level 48% 1.091 47% 1.574 2.67Pure Premium Derived by Formula 1.032 1.426 2.46
Page 41
* Pure Premium per $100 of Payroll** Pure Premium per employee++ Non-Standard Calculation© Copyright 2014 National Council on Compensation Insurance, Inc. All Rights Reserved.
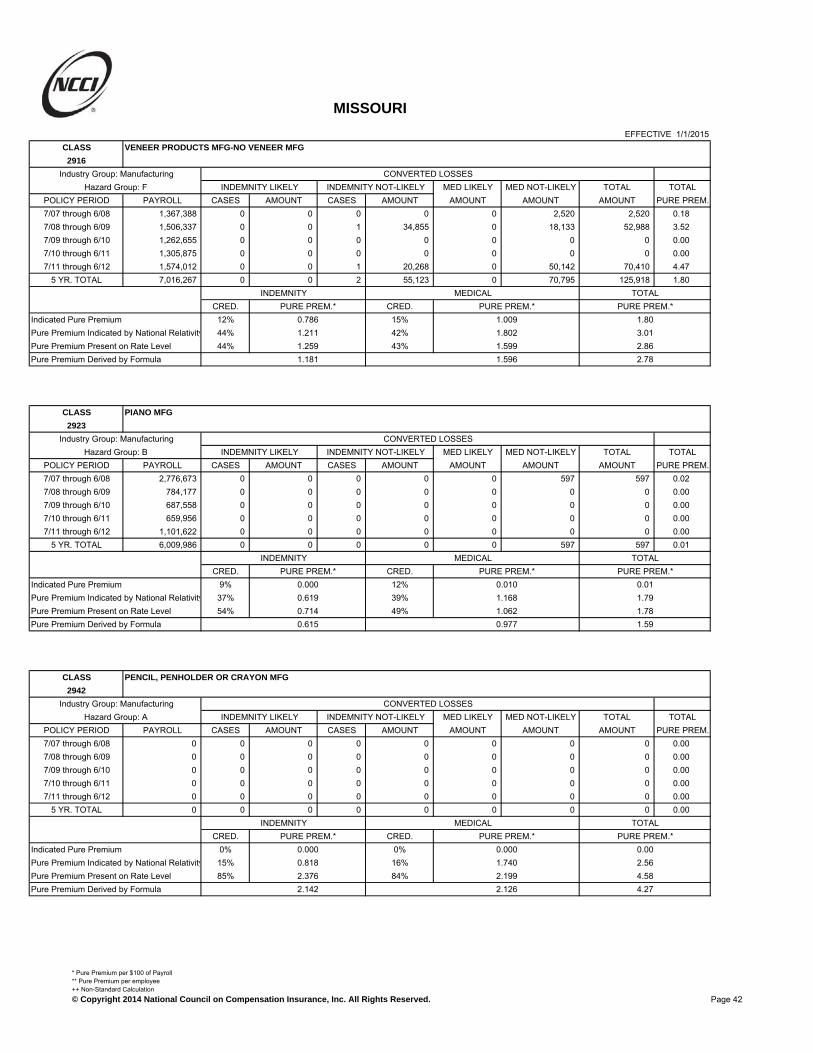
MISSOURI
EFFECTIVE 1/1/2015CLASS VENEER PRODUCTS MFG-NO VENEER MFG
2916
Industry Group: Manufacturing CONVERTED LOSSESHazard Group: F INDEMNITY LIKELY INDEMNITY NOT-LIKELY MED LIKELY MED NOT-LIKELY TOTAL TOTAL
POLICY PERIOD PAYROLL CASES AMOUNT CASES AMOUNT AMOUNT AMOUNT AMOUNT PURE PREM.7/07 through 6/08 1,367,388 0 0 0 0 0 2,520 2,520 0.187/08 through 6/09 1,506,337 0 0 1 34,855 0 18,133 52,988 3.527/09 through 6/10 1,262,655 0 0 0 0 0 0 0 0.007/10 through 6/11 1,305,875 0 0 0 0 0 0 0 0.007/11 through 6/12 1,574,012 0 0 1 20,268 0 50,142 70,410 4.47
5 YR. TOTAL 7,016,267 0 0 2 55,123 0 70,795 125,918 1.80INDEMNITY MEDICAL TOTAL
CRED. PURE PREM.* CRED. PURE PREM.* PURE PREM.*Indicated Pure Premium 12% 0.786 15% 1.009 1.80Pure Premium Indicated by National Relativity 44% 1.211 42% 1.802 3.01Pure Premium Present on Rate Level 44% 1.259 43% 1.599 2.86Pure Premium Derived by Formula 1.181 1.596 2.78
CLASS PIANO MFG
2923
Industry Group: Manufacturing CONVERTED LOSSESHazard Group: B INDEMNITY LIKELY INDEMNITY NOT-LIKELY MED LIKELY MED NOT-LIKELY TOTAL TOTAL
POLICY PERIOD PAYROLL CASES AMOUNT CASES AMOUNT AMOUNT AMOUNT AMOUNT PURE PREM.7/07 through 6/08 2,776,673 0 0 0 0 0 597 597 0.027/08 through 6/09 784,177 0 0 0 0 0 0 0 0.007/09 through 6/10 687,558 0 0 0 0 0 0 0 0.007/10 through 6/11 659,956 0 0 0 0 0 0 0 0.007/11 through 6/12 1,101,622 0 0 0 0 0 0 0 0.00
5 YR. TOTAL 6,009,986 0 0 0 0 0 597 597 0.01INDEMNITY MEDICAL TOTAL
CRED. PURE PREM.* CRED. PURE PREM.* PURE PREM.*Indicated Pure Premium 9% 0.000 12% 0.010 0.01Pure Premium Indicated by National Relativity 37% 0.619 39% 1.168 1.79Pure Premium Present on Rate Level 54% 0.714 49% 1.062 1.78Pure Premium Derived by Formula 0.615 0.977 1.59
CLASS PENCIL, PENHOLDER OR CRAYON MFG
2942
Industry Group: Manufacturing CONVERTED LOSSESHazard Group: A INDEMNITY LIKELY INDEMNITY NOT-LIKELY MED LIKELY MED NOT-LIKELY TOTAL TOTAL
POLICY PERIOD PAYROLL CASES AMOUNT CASES AMOUNT AMOUNT AMOUNT AMOUNT PURE PREM.7/07 through 6/08 0 0 0 0 0 0 0 0 0.007/08 through 6/09 0 0 0 0 0 0 0 0 0.007/09 through 6/10 0 0 0 0 0 0 0 0 0.007/10 through 6/11 0 0 0 0 0 0 0 0 0.007/11 through 6/12 0 0 0 0 0 0 0 0 0.00
5 YR. TOTAL 0 0 0 0 0 0 0 0 0.00INDEMNITY MEDICAL TOTAL
CRED. PURE PREM.* CRED. PURE PREM.* PURE PREM.*Indicated Pure Premium 0% 0.000 0% 0.000 0.00Pure Premium Indicated by National Relativity 15% 0.818 16% 1.740 2.56Pure Premium Present on Rate Level 85% 2.376 84% 2.199 4.58Pure Premium Derived by Formula 2.142 2.126 4.27
Page 42
* Pure Premium per $100 of Payroll** Pure Premium per employee++ Non-Standard Calculation© Copyright 2014 National Council on Compensation Insurance, Inc. All Rights Reserved.

MISSOURI
EFFECTIVE 1/1/2015CLASS WOOD PRESERVING & DRIVERS
2960
Industry Group: Manufacturing CONVERTED LOSSESHazard Group: C INDEMNITY LIKELY INDEMNITY NOT-LIKELY MED LIKELY MED NOT-LIKELY TOTAL TOTAL
POLICY PERIOD PAYROLL CASES AMOUNT CASES AMOUNT AMOUNT AMOUNT AMOUNT PURE PREM.7/07 through 6/08 1,719,354 0 0 4 7,790 0 33,593 41,383 2.417/08 through 6/09 1,630,109 0 0 5 58,742 0 108,654 167,396 10.277/09 through 6/10 2,134,237 2 78,884 3 34,421 386,510 40,458 540,273 25.327/10 through 6/11 2,186,801 2 59,377 5 87,629 159,318 191,388 497,712 22.767/11 through 6/12 2,889,966 0 0 3 53,876 0 75,838 129,714 4.49
5 YR. TOTAL 10,560,467 4 138,261 20 242,458 545,828 449,931 1,376,478 13.03INDEMNITY MEDICAL TOTAL
CRED. PURE PREM.* CRED. PURE PREM.* PURE PREM.*Indicated Pure Premium 17% 3.605 26% 9.429 13.03Pure Premium Indicated by National Relativity 41% 1.650 37% 2.257 3.91Pure Premium Present on Rate Level 42% 1.904 37% 4.188 6.09Pure Premium Derived by Formula 2.089 4.836 6.93
CLASS IRON OR STEEL: MANUFACTURING: STEEL MAKING-& DRIVERS
3004
Industry Group: Manufacturing CONVERTED LOSSESHazard Group: E INDEMNITY LIKELY INDEMNITY NOT-LIKELY MED LIKELY MED NOT-LIKELY TOTAL TOTAL
POLICY PERIOD PAYROLL CASES AMOUNT CASES AMOUNT AMOUNT AMOUNT AMOUNT PURE PREM.7/07 through 6/08 7,288,346 0 0 4 39,680 0 74,883 114,563 1.577/08 through 6/09 9,209,853 1 29,987 5 52,204 15,188 117,316 214,695 2.337/09 through 6/10 9,690,247 0 0 3 51,259 0 145,846 197,105 2.037/10 through 6/11 11,320,037 1 29,925 3 22,641 3,698 58,424 114,688 1.017/11 through 6/12 8,850,652 1 3,369 4 52,755 3,146 138,806 198,076 2.24
5 YR. TOTAL 46,359,135 3 63,281 19 218,539 22,032 535,275 839,127 1.81INDEMNITY MEDICAL TOTAL
CRED. PURE PREM.* CRED. PURE PREM.* PURE PREM.*Indicated Pure Premium 22% 0.608 29% 1.202 1.81Pure Premium Indicated by National Relativity 39% 1.032 35% 1.251 2.28Pure Premium Present on Rate Level 39% 0.834 36% 1.226 2.06Pure Premium Derived by Formula 0.862 1.228 2.09
CLASS IRON OR STEEL: MANUFACTURING: ROLLING MILL & DRIVERS
3018
Industry Group: Manufacturing CONVERTED LOSSESHazard Group: E INDEMNITY LIKELY INDEMNITY NOT-LIKELY MED LIKELY MED NOT-LIKELY TOTAL TOTAL
POLICY PERIOD PAYROLL CASES AMOUNT CASES AMOUNT AMOUNT AMOUNT AMOUNT PURE PREM.7/07 through 6/08 1,779,345 1 13,548 0 0 12,180 6,644 32,372 1.827/08 through 6/09 1,349,649 0 0 2 12,118 0 13,051 25,169 1.877/09 through 6/10 1,379,755 0 0 0 0 0 22,040 22,040 1.607/10 through 6/11 1,542,780 0 0 4 32,669 0 77,189 109,858 7.127/11 through 6/12 2,323,748 2 110,226 4 109,062 169,123 67,851 456,262 19.64
5 YR. TOTAL 8,375,277 3 123,774 10 153,849 181,303 186,775 645,701 7.71INDEMNITY MEDICAL TOTAL
CRED. PURE PREM.* CRED. PURE PREM.* PURE PREM.*Indicated Pure Premium 13% 3.315 17% 4.395 7.71Pure Premium Indicated by National Relativity 43% 0.934 41% 1.579 2.51Pure Premium Present on Rate Level 44% 1.274 42% 1.845 3.12Pure Premium Derived by Formula 1.393 2.169 3.56
Page 43
* Pure Premium per $100 of Payroll** Pure Premium per employee++ Non-Standard Calculation© Copyright 2014 National Council on Compensation Insurance, Inc. All Rights Reserved.

MISSOURI
EFFECTIVE 1/1/2015CLASS PIPE OR TUBE MFG NOC & DRIVERS
3022
Industry Group: Manufacturing CONVERTED LOSSESHazard Group: B INDEMNITY LIKELY INDEMNITY NOT-LIKELY MED LIKELY MED NOT-LIKELY TOTAL TOTAL
POLICY PERIOD PAYROLL CASES AMOUNT CASES AMOUNT AMOUNT AMOUNT AMOUNT PURE PREM.7/07 through 6/08 110,776 0 0 0 0 0 0 0 0.007/08 through 6/09 253,870 0 0 0 0 0 3,208 3,208 1.267/09 through 6/10 6,886,180 0 0 5 51,076 0 98,395 149,471 2.177/10 through 6/11 8,857,924 2 138,016 3 41,039 206,804 130,545 516,404 5.837/11 through 6/12 9,447,597 0 0 4 64,354 0 85,012 149,366 1.58
5 YR. TOTAL 25,556,347 2 138,016 12 156,469 206,804 317,160 818,449 3.20INDEMNITY MEDICAL TOTAL
CRED. PURE PREM.* CRED. PURE PREM.* PURE PREM.*Indicated Pure Premium 21% 1.152 27% 2.050 3.20Pure Premium Indicated by National Relativity 39% 1.402 36% 2.087 3.49Pure Premium Present on Rate Level 40% 1.276 37% 1.936 3.21Pure Premium Derived by Formula 1.299 2.021 3.32
CLASS ROLLING MILL NOC & DRIVERS
3027
Industry Group: Manufacturing CONVERTED LOSSESHazard Group: E INDEMNITY LIKELY INDEMNITY NOT-LIKELY MED LIKELY MED NOT-LIKELY TOTAL TOTAL
POLICY PERIOD PAYROLL CASES AMOUNT CASES AMOUNT AMOUNT AMOUNT AMOUNT PURE PREM.7/07 through 6/08 170,715 0 0 0 0 0 0 0 0.007/08 through 6/09 55,846 0 0 0 0 0 0 0 0.007/09 through 6/10 389,664 0 0 0 0 0 1,811 1,811 0.477/10 through 6/11 1,142,581 0 0 0 0 0 279 279 0.027/11 through 6/12 1,497,926 0 0 0 0 0 0 0 0.00
5 YR. TOTAL 3,256,732 0 0 0 0 0 2,090 2,090 0.06INDEMNITY MEDICAL TOTAL
CRED. PURE PREM.* CRED. PURE PREM.* PURE PREM.*Indicated Pure Premium 8% 0.000 10% 0.064 0.06Pure Premium Indicated by National Relativity 46% 1.122 45% 1.480 2.60Pure Premium Present on Rate Level 46% 1.093 45% 1.359 2.45Pure Premium Derived by Formula 1.019 1.284 2.30
CLASS PIPE OR TUBE MFG-IRON OR STEEL-& DRIVERS
3028
Industry Group: Manufacturing CONVERTED LOSSESHazard Group: C INDEMNITY LIKELY INDEMNITY NOT-LIKELY MED LIKELY MED NOT-LIKELY TOTAL TOTAL
POLICY PERIOD PAYROLL CASES AMOUNT CASES AMOUNT AMOUNT AMOUNT AMOUNT PURE PREM.7/07 through 6/08 8,125,679 1 14,671 11 106,457 9,409 163,315 293,852 3.627/08 through 6/09 5,898,416 2 113,997 5 130,820 145,766 209,166 599,749 10.177/09 through 6/10 29,015,643 1 3,810 30 564,576 3,389 660,207 1,231,982 4.257/10 through 6/11 46,938,751 2 286,679 33 649,892 236,901 1,078,724 2,252,196 4.807/11 through 6/12 43,326,425 5 344,932 20 265,770 290,567 393,112 1,294,381 2.99
5 YR. TOTAL 133,304,914 11 764,089 99 1,717,515 686,032 2,504,524 5,672,160 4.26INDEMNITY MEDICAL TOTAL
CRED. PURE PREM.* CRED. PURE PREM.* PURE PREM.*Indicated Pure Premium 44% 1.862 58% 2.393 4.26Pure Premium Indicated by National Relativity 28% 0.919 21% 1.594 2.51Pure Premium Present on Rate Level 28% 1.643 21% 2.439 4.08Pure Premium Derived by Formula 1.537 2.235 3.77
Page 44
* Pure Premium per $100 of Payroll** Pure Premium per employee++ Non-Standard Calculation© Copyright 2014 National Council on Compensation Insurance, Inc. All Rights Reserved.

MISSOURI
EFFECTIVE 1/1/2015CLASS IRON OR STEEL: FABRICATION: IRON OR STEEL WORKS-SHOP-STRUCTURAL-& DRIVERS
3030
Industry Group: Manufacturing CONVERTED LOSSESHazard Group: E INDEMNITY LIKELY INDEMNITY NOT-LIKELY MED LIKELY MED NOT-LIKELY TOTAL TOTAL
POLICY PERIOD PAYROLL CASES AMOUNT CASES AMOUNT AMOUNT AMOUNT AMOUNT PURE PREM.7/07 through 6/08 53,279,213 7 173,000 53 615,923 905,667 1,187,381 2,881,971 5.417/08 through 6/09 44,391,846 13 295,156 27 642,864 471,688 1,200,000 2,609,708 5.887/09 through 6/10 49,068,535 9 375,111 41 727,633 620,849 1,257,680 2,981,273 6.087/10 through 6/11 53,442,782 7 356,058 45 797,778 352,088 1,215,544 2,721,468 5.097/11 through 6/12 56,150,848 8 351,817 42 586,245 447,435 872,184 2,257,681 4.02
5 YR. TOTAL 256,333,224 44 1,551,142 208 3,370,443 2,797,727 5,732,789 13,452,101 5.25INDEMNITY MEDICAL TOTAL
CRED. PURE PREM.* CRED. PURE PREM.* PURE PREM.*Indicated Pure Premium 64% 1.920 88% 3.328 5.25Pure Premium Indicated by National Relativity 18% 1.874 6% 2.912 4.79Pure Premium Present on Rate Level 18% 2.204 6% 3.574 5.78Pure Premium Derived by Formula 1.963 3.318 5.28
CLASS IRON OR STEEL: FABRICATION: IRON WORKS-SHOP-ORNAMENTAL-& DRIVERS
3040
Industry Group: Manufacturing CONVERTED LOSSESHazard Group: E INDEMNITY LIKELY INDEMNITY NOT-LIKELY MED LIKELY MED NOT-LIKELY TOTAL TOTAL
POLICY PERIOD PAYROLL CASES AMOUNT CASES AMOUNT AMOUNT AMOUNT AMOUNT PURE PREM.7/07 through 6/08 26,825,951 9 417,686 39 631,736 394,680 762,220 2,206,322 8.237/08 through 6/09 21,117,253 5 138,192 23 623,635 152,623 854,254 1,768,704 8.387/09 through 6/10 20,787,189 5 299,499 21 494,788 241,084 695,042 1,730,413 8.327/10 through 6/11 24,842,514 2 75,273 18 329,907 45,659 504,502 955,341 3.857/11 through 6/12 23,374,714 2 234,428 21 270,984 292,232 692,446 1,490,090 6.38
5 YR. TOTAL 116,947,621 23 1,165,078 122 2,351,050 1,126,278 3,508,464 8,150,870 6.97INDEMNITY MEDICAL TOTAL
CRED. PURE PREM.* CRED. PURE PREM.* PURE PREM.*Indicated Pure Premium 52% 3.007 67% 3.963 6.97Pure Premium Indicated by National Relativity 24% 1.883 16% 2.868 4.75Pure Premium Present on Rate Level 24% 2.805 17% 3.954 6.76Pure Premium Derived by Formula 2.689 3.786 6.48
CLASS IRON OR STEEL: FABRICATION: IRON WORKS-SHOP-DECORATIVE OR ARTISTIC- &
3041 FOUNDRIES, DRIVERS
Industry Group: Manufacturing CONVERTED LOSSESHazard Group: C INDEMNITY LIKELY INDEMNITY NOT-LIKELY MED LIKELY MED NOT-LIKELY TOTAL TOTAL
POLICY PERIOD PAYROLL CASES AMOUNT CASES AMOUNT AMOUNT AMOUNT AMOUNT PURE PREM.7/07 through 6/08 1,450,441 0 0 0 0 0 4,359 4,359 0.307/08 through 6/09 997,943 0 0 1 29,421 0 52,922 82,343 8.257/09 through 6/10 875,448 0 0 0 0 0 5,391 5,391 0.627/10 through 6/11 877,377 0 0 0 0 0 2,327 2,327 0.277/11 through 6/12 1,234,142 0 0 1 53,755 0 122,705 176,460 14.30
5 YR. TOTAL 5,435,351 0 0 2 83,176 0 187,704 270,880 4.98INDEMNITY MEDICAL TOTAL
CRED. PURE PREM.* CRED. PURE PREM.* PURE PREM.*Indicated Pure Premium 11% 1.530 15% 3.453 4.98Pure Premium Indicated by National Relativity 44% 1.636 42% 2.496 4.13Pure Premium Present on Rate Level 45% 1.358 43% 2.034 3.39Pure Premium Derived by Formula 1.499 2.441 3.94
Page 45
* Pure Premium per $100 of Payroll** Pure Premium per employee++ Non-Standard Calculation© Copyright 2014 National Council on Compensation Insurance, Inc. All Rights Reserved.

MISSOURI
EFFECTIVE 1/1/2015CLASS ELEVATOR OR ESCALATOR MFG
3042
Industry Group: Manufacturing CONVERTED LOSSESHazard Group: D INDEMNITY LIKELY INDEMNITY NOT-LIKELY MED LIKELY MED NOT-LIKELY TOTAL TOTAL
POLICY PERIOD PAYROLL CASES AMOUNT CASES AMOUNT AMOUNT AMOUNT AMOUNT PURE PREM.7/07 through 6/08 3,973,863 0 0 0 0 0 14,603 14,603 0.377/08 through 6/09 2,948,499 1 348,349 1 4,244 0 16,809 369,402 12.537/09 through 6/10 2,037,413 0 0 2 320,052 0 237,368 557,420 27.367/10 through 6/11 1,042,885 0 0 0 0 0 2,445 2,445 0.237/11 through 6/12 282,404 0 0 0 0 0 0 0 0.00
5 YR. TOTAL 10,285,064 1 348,349 3 324,296 0 271,225 943,870 9.18INDEMNITY MEDICAL TOTAL
CRED. PURE PREM.* CRED. PURE PREM.* PURE PREM.*Indicated Pure Premium 17% 6.540 19% 2.637 9.18Pure Premium Indicated by National Relativity 41% 1.764 40% 2.598 4.36Pure Premium Present on Rate Level 42% 2.013 41% 1.860 3.87Pure Premium Derived by Formula 2.681 2.303 4.98
CLASS SIGN MFG-METAL
3064
Industry Group: Manufacturing CONVERTED LOSSESHazard Group: C INDEMNITY LIKELY INDEMNITY NOT-LIKELY MED LIKELY MED NOT-LIKELY TOTAL TOTAL
POLICY PERIOD PAYROLL CASES AMOUNT CASES AMOUNT AMOUNT AMOUNT AMOUNT PURE PREM.7/07 through 6/08 10,831,304 3 334,275 7 119,105 414,143 196,825 1,064,348 9.837/08 through 6/09 9,847,265 0 0 9 137,629 0 250,120 387,749 3.947/09 through 6/10 9,199,802 0 0 1 46,372 0 68,606 114,978 1.257/10 through 6/11 8,799,390 1 5,367 5 81,049 3,991 159,624 250,031 2.847/11 through 6/12 9,847,902 0 0 4 84,515 0 134,309 218,824 2.22
5 YR. TOTAL 48,525,663 4 339,642 26 468,670 418,134 809,484 2,035,930 4.20INDEMNITY MEDICAL TOTAL
CRED. PURE PREM.* CRED. PURE PREM.* PURE PREM.*Indicated Pure Premium 30% 1.666 40% 2.530 4.20Pure Premium Indicated by National Relativity 35% 1.699 30% 2.878 4.58Pure Premium Present on Rate Level 35% 1.682 30% 2.671 4.35Pure Premium Derived by Formula 1.683 2.677 4.36
CLASS SHEET METAL PRODUCTS MFG.
3069 + +
Industry Group: Manufacturing CONVERTED LOSSESHazard Group: E INDEMNITY LIKELY INDEMNITY NOT-LIKELY MED LIKELY MED NOT-LIKELY TOTAL TOTAL
POLICY PERIOD PAYROLL CASES AMOUNT CASES AMOUNT AMOUNT AMOUNT AMOUNT PURE PREM.7/07 through 6/08 23,676,916 0 0 13 304,291 0 384,664 688,955 2.917/08 through 6/09 26,643,975 0 0 7 246,111 0 336,733 582,844 2.197/09 through 6/10 29,923,690 5 355,790 16 216,353 536,359 421,722 1,530,224 5.117/10 through 6/11 33,273,670 2 55,020 18 233,048 52,063 525,080 865,211 2.607/11 through 6/12 35,661,040 3 59,279 30 694,647 24,920 968,585 1,747,431 4.90
5 YR. TOTAL 149,179,291 10 470,089 84 1,694,450 613,342 2,636,784 5,414,665 3.63INDEMNITY MEDICAL TOTAL
CRED. PURE PREM.* CRED. PURE PREM.* PURE PREM.*Indicated Pure Premium 42% 1.451 56% 2.179 3.63Pure Premium Indicated by National Relativity 29% 1.235 22% 2.018 3.25Pure Premium Present on Rate Level 29% 1.312 22% 1.948 3.26Pure Premium Derived by Formula 1.348 2.093 3.44
Page 46
* Pure Premium per $100 of Payroll** Pure Premium per employee++ Non-Standard Calculation© Copyright 2014 National Council on Compensation Insurance, Inc. All Rights Reserved.

MISSOURI
EFFECTIVE 1/1/2015CLASS SHEET METAL PRODUCTS MFG.
3076 + +
Industry Group: Manufacturing CONVERTED LOSSESHazard Group: C INDEMNITY LIKELY INDEMNITY NOT-LIKELY MED LIKELY MED NOT-LIKELY TOTAL TOTAL
POLICY PERIOD PAYROLL CASES AMOUNT CASES AMOUNT AMOUNT AMOUNT AMOUNT PURE PREM.7/07 through 6/08 371,584,771 31 941,077 221 2,378,940 1,307,692 4,193,578 8,821,287 2.377/08 through 6/09 292,002,615 16 208,955 136 1,591,036 242,990 3,192,923 5,235,904 1.797/09 through 6/10 280,912,119 21 493,670 133 1,292,388 688,837 2,972,557 5,447,452 1.947/10 through 6/11 325,268,186 17 509,050 130 1,618,370 537,448 3,696,642 6,361,510 1.967/11 through 6/12 353,723,969 27 635,256 150 2,136,541 573,705 4,098,407 7,443,909 2.11
5 YR. TOTAL 1,623,491,660 112 2,788,008 770 9,017,275 3,350,672 18,154,107 33,310,062 2.05INDEMNITY MEDICAL TOTAL
CRED. PURE PREM.* CRED. PURE PREM.* PURE PREM.*Indicated Pure Premium 90% 0.727 100% 1.325 2.05Pure Premium Indicated by National Relativity 5% 0.985 0% 1.733 2.72Pure Premium Present on Rate Level 5% 0.796 0% 1.449 2.25Pure Premium Derived by Formula 0.743 1.325 2.07
CLASS FOUNDRY-FERROUS-NOC
3081
Industry Group: Manufacturing CONVERTED LOSSESHazard Group: E INDEMNITY LIKELY INDEMNITY NOT-LIKELY MED LIKELY MED NOT-LIKELY TOTAL TOTAL
POLICY PERIOD PAYROLL CASES AMOUNT CASES AMOUNT AMOUNT AMOUNT AMOUNT PURE PREM.7/07 through 6/08 12,144,934 6 118,207 13 82,647 91,970 184,814 477,638 3.937/08 through 6/09 8,499,016 1 33,861 6 94,100 32,098 123,017 283,076 3.337/09 through 6/10 11,363,570 1 24,752 6 51,797 23,497 106,003 206,049 1.817/10 through 6/11 8,320,147 1 6,455 2 13,169 1,477 46,124 67,225 0.817/11 through 6/12 12,108,855 2 72,851 7 77,844 22,047 117,982 290,724 2.40
5 YR. TOTAL 52,436,522 11 256,126 34 319,557 171,089 577,940 1,324,712 2.53INDEMNITY MEDICAL TOTAL
CRED. PURE PREM.* CRED. PURE PREM.* PURE PREM.*Indicated Pure Premium 31% 1.098 38% 1.428 2.53Pure Premium Indicated by National Relativity 34% 1.870 31% 2.898 4.77Pure Premium Present on Rate Level 35% 1.672 31% 2.123 3.80Pure Premium Derived by Formula 1.561 2.099 3.66
CLASS FOUNDRY-STEEL CASTINGS
3082
Industry Group: Manufacturing CONVERTED LOSSESHazard Group: E INDEMNITY LIKELY INDEMNITY NOT-LIKELY MED LIKELY MED NOT-LIKELY TOTAL TOTAL
POLICY PERIOD PAYROLL CASES AMOUNT CASES AMOUNT AMOUNT AMOUNT AMOUNT PURE PREM.7/07 through 6/08 3,477,443 0 0 3 7,001 0 52,229 59,230 1.707/08 through 6/09 2,957,122 1 150 1 35,186 5,949 47,214 88,499 2.997/09 through 6/10 2,997,886 0 0 2 40,918 0 97,120 138,038 4.617/10 through 6/11 3,788,684 0 0 2 39,143 0 144,868 184,011 4.867/11 through 6/12 4,386,101 0 0 8 73,578 0 176,132 249,710 5.69
5 YR. TOTAL 17,607,236 1 150 16 195,826 5,949 517,563 719,488 4.09INDEMNITY MEDICAL TOTAL
CRED. PURE PREM.* CRED. PURE PREM.* PURE PREM.*Indicated Pure Premium 21% 1.113 29% 2.973 4.09Pure Premium Indicated by National Relativity 39% 0.996 35% 1.906 2.90Pure Premium Present on Rate Level 40% 1.907 36% 3.292 5.20Pure Premium Derived by Formula 1.385 2.714 4.10
Page 47
* Pure Premium per $100 of Payroll** Pure Premium per employee++ Non-Standard Calculation© Copyright 2014 National Council on Compensation Insurance, Inc. All Rights Reserved.

MISSOURI
EFFECTIVE 1/1/2015CLASS FOUNDRY-NON-FERROUS
3085
Industry Group: Manufacturing CONVERTED LOSSESHazard Group: E INDEMNITY LIKELY INDEMNITY NOT-LIKELY MED LIKELY MED NOT-LIKELY TOTAL TOTAL
POLICY PERIOD PAYROLL CASES AMOUNT CASES AMOUNT AMOUNT AMOUNT AMOUNT PURE PREM.7/07 through 6/08 47,532,197 11 313,075 47 678,599 529,452 1,387,730 2,908,856 6.127/08 through 6/09 39,022,726 4 557,097 19 223,271 510,052 482,688 1,773,108 4.547/09 through 6/10 40,899,887 7 1,156,673 27 786,873 733,214 888,028 3,564,788 8.727/10 through 6/11 8,796,484 1 8,801 12 64,504 2,715 207,404 283,424 3.227/11 through 6/12 9,179,237 2 55,098 18 105,085 37,309 176,119 373,611 4.07
5 YR. TOTAL 145,430,531 25 2,090,744 123 1,858,332 1,812,742 3,141,969 8,903,787 6.12INDEMNITY MEDICAL TOTAL
CRED. PURE PREM.* CRED. PURE PREM.* PURE PREM.*Indicated Pure Premium 48% 2.715 65% 3.407 6.12Pure Premium Indicated by National Relativity 26% 1.537 17% 2.378 3.92Pure Premium Present on Rate Level 26% 1.833 18% 2.954 4.79Pure Premium Derived by Formula 2.179 3.151 5.33
CLASS FORGING WORK-DROP OR MACHINE
3110
Industry Group: Manufacturing CONVERTED LOSSESHazard Group: C INDEMNITY LIKELY INDEMNITY NOT-LIKELY MED LIKELY MED NOT-LIKELY TOTAL TOTAL
POLICY PERIOD PAYROLL CASES AMOUNT CASES AMOUNT AMOUNT AMOUNT AMOUNT PURE PREM.7/07 through 6/08 6,156,402 0 0 1 32,718 0 74,075 106,793 1.737/08 through 6/09 5,001,238 0 0 2 4,066 0 17,898 21,964 0.447/09 through 6/10 5,915,699 0 0 5 105,219 0 220,351 325,570 5.507/10 through 6/11 5,991,934 0 0 3 82,870 0 197,896 280,766 4.697/11 through 6/12 6,819,568 0 0 3 58,291 0 688,075 746,366 10.95
5 YR. TOTAL 29,884,841 0 0 14 283,164 0 1,198,295 1,481,459 4.96INDEMNITY MEDICAL TOTAL
CRED. PURE PREM.* CRED. PURE PREM.* PURE PREM.*Indicated Pure Premium 23% 0.948 31% 4.010 4.96Pure Premium Indicated by National Relativity 38% 1.580 34% 2.314 3.89Pure Premium Present on Rate Level 39% 1.477 35% 2.282 3.76Pure Premium Derived by Formula 1.394 2.829 4.22
CLASS BLACKSMITH
3111
Industry Group: Manufacturing CONVERTED LOSSESHazard Group: C INDEMNITY LIKELY INDEMNITY NOT-LIKELY MED LIKELY MED NOT-LIKELY TOTAL TOTAL
POLICY PERIOD PAYROLL CASES AMOUNT CASES AMOUNT AMOUNT AMOUNT AMOUNT PURE PREM.7/07 through 6/08 108,491 0 0 0 0 0 0 0 0.007/08 through 6/09 86,395 0 0 0 0 0 0 0 0.007/09 through 6/10 70,061 0 0 0 0 0 0 0 0.007/10 through 6/11 62,247 0 0 0 0 0 0 0 0.007/11 through 6/12 55,804 0 0 0 0 0 0 0 0.00
5 YR. TOTAL 382,998 0 0 0 0 0 0 0 0.00INDEMNITY MEDICAL TOTAL
CRED. PURE PREM.* CRED. PURE PREM.* PURE PREM.*Indicated Pure Premium 3% 0.000 4% 0.000 0.00Pure Premium Indicated by National Relativity 48% 0.835 48% 1.480 2.32Pure Premium Present on Rate Level 49% 0.787 48% 1.262 2.05Pure Premium Derived by Formula 0.786 1.316 2.10
Page 48
* Pure Premium per $100 of Payroll** Pure Premium per employee++ Non-Standard Calculation© Copyright 2014 National Council on Compensation Insurance, Inc. All Rights Reserved.
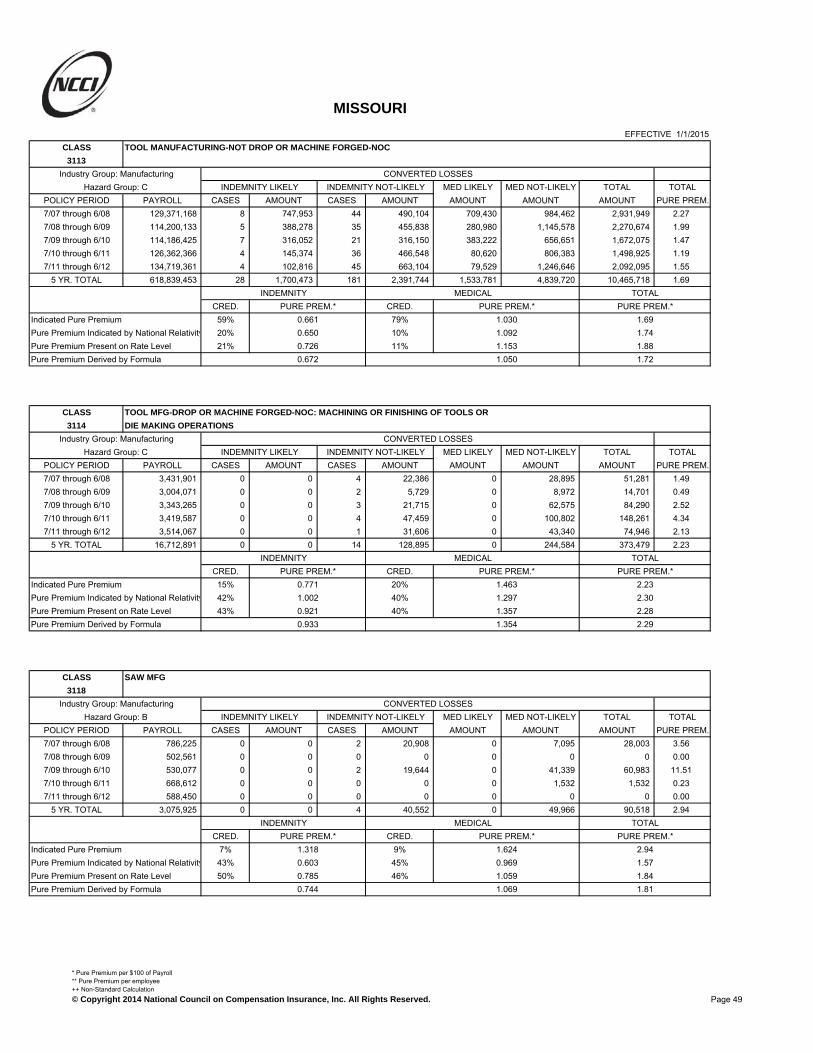
MISSOURI
EFFECTIVE 1/1/2015CLASS TOOL MANUFACTURING-NOT DROP OR MACHINE FORGED-NOC
3113
Industry Group: Manufacturing CONVERTED LOSSESHazard Group: C INDEMNITY LIKELY INDEMNITY NOT-LIKELY MED LIKELY MED NOT-LIKELY TOTAL TOTAL
POLICY PERIOD PAYROLL CASES AMOUNT CASES AMOUNT AMOUNT AMOUNT AMOUNT PURE PREM.7/07 through 6/08 129,371,168 8 747,953 44 490,104 709,430 984,462 2,931,949 2.277/08 through 6/09 114,200,133 5 388,278 35 455,838 280,980 1,145,578 2,270,674 1.997/09 through 6/10 114,186,425 7 316,052 21 316,150 383,222 656,651 1,672,075 1.477/10 through 6/11 126,362,366 4 145,374 36 466,548 80,620 806,383 1,498,925 1.197/11 through 6/12 134,719,361 4 102,816 45 663,104 79,529 1,246,646 2,092,095 1.55
5 YR. TOTAL 618,839,453 28 1,700,473 181 2,391,744 1,533,781 4,839,720 10,465,718 1.69INDEMNITY MEDICAL TOTAL
CRED. PURE PREM.* CRED. PURE PREM.* PURE PREM.*Indicated Pure Premium 59% 0.661 79% 1.030 1.69Pure Premium Indicated by National Relativity 20% 0.650 10% 1.092 1.74Pure Premium Present on Rate Level 21% 0.726 11% 1.153 1.88Pure Premium Derived by Formula 0.672 1.050 1.72
CLASS TOOL MFG-DROP OR MACHINE FORGED-NOC: MACHINING OR FINISHING OF TOOLS OR
3114 DIE MAKING OPERATIONS
Industry Group: Manufacturing CONVERTED LOSSESHazard Group: C INDEMNITY LIKELY INDEMNITY NOT-LIKELY MED LIKELY MED NOT-LIKELY TOTAL TOTAL
POLICY PERIOD PAYROLL CASES AMOUNT CASES AMOUNT AMOUNT AMOUNT AMOUNT PURE PREM.7/07 through 6/08 3,431,901 0 0 4 22,386 0 28,895 51,281 1.497/08 through 6/09 3,004,071 0 0 2 5,729 0 8,972 14,701 0.497/09 through 6/10 3,343,265 0 0 3 21,715 0 62,575 84,290 2.527/10 through 6/11 3,419,587 0 0 4 47,459 0 100,802 148,261 4.347/11 through 6/12 3,514,067 0 0 1 31,606 0 43,340 74,946 2.13
5 YR. TOTAL 16,712,891 0 0 14 128,895 0 244,584 373,479 2.23INDEMNITY MEDICAL TOTAL
CRED. PURE PREM.* CRED. PURE PREM.* PURE PREM.*Indicated Pure Premium 15% 0.771 20% 1.463 2.23Pure Premium Indicated by National Relativity 42% 1.002 40% 1.297 2.30Pure Premium Present on Rate Level 43% 0.921 40% 1.357 2.28Pure Premium Derived by Formula 0.933 1.354 2.29
CLASS SAW MFG
3118
Industry Group: Manufacturing CONVERTED LOSSESHazard Group: B INDEMNITY LIKELY INDEMNITY NOT-LIKELY MED LIKELY MED NOT-LIKELY TOTAL TOTAL
POLICY PERIOD PAYROLL CASES AMOUNT CASES AMOUNT AMOUNT AMOUNT AMOUNT PURE PREM.7/07 through 6/08 786,225 0 0 2 20,908 0 7,095 28,003 3.567/08 through 6/09 502,561 0 0 0 0 0 0 0 0.007/09 through 6/10 530,077 0 0 2 19,644 0 41,339 60,983 11.517/10 through 6/11 668,612 0 0 0 0 0 1,532 1,532 0.237/11 through 6/12 588,450 0 0 0 0 0 0 0 0.00
5 YR. TOTAL 3,075,925 0 0 4 40,552 0 49,966 90,518 2.94INDEMNITY MEDICAL TOTAL
CRED. PURE PREM.* CRED. PURE PREM.* PURE PREM.*Indicated Pure Premium 7% 1.318 9% 1.624 2.94Pure Premium Indicated by National Relativity 43% 0.603 45% 0.969 1.57Pure Premium Present on Rate Level 50% 0.785 46% 1.059 1.84Pure Premium Derived by Formula 0.744 1.069 1.81
Page 49
* Pure Premium per $100 of Payroll** Pure Premium per employee++ Non-Standard Calculation© Copyright 2014 National Council on Compensation Insurance, Inc. All Rights Reserved.

MISSOURI
EFFECTIVE 1/1/2015CLASS NEEDLE MFG
3119
Industry Group: Manufacturing CONVERTED LOSSESHazard Group: A INDEMNITY LIKELY INDEMNITY NOT-LIKELY MED LIKELY MED NOT-LIKELY TOTAL TOTAL
POLICY PERIOD PAYROLL CASES AMOUNT CASES AMOUNT AMOUNT AMOUNT AMOUNT PURE PREM.7/07 through 6/08 478,308 0 0 2 17,618 0 32,396 50,014 10.467/08 through 6/09 511,998 0 0 0 0 0 0 0 0.007/09 through 6/10 494,169 0 0 0 0 0 0 0 0.007/10 through 6/11 492,416 1 17,621 0 0 18,797 4,954 41,372 8.407/11 through 6/12 757,287 0 0 1 3,634 0 9,757 13,391 1.77
5 YR. TOTAL 2,734,178 1 17,621 3 21,252 18,797 47,107 104,777 3.83INDEMNITY MEDICAL TOTAL
CRED. PURE PREM.* CRED. PURE PREM.* PURE PREM.*Indicated Pure Premium 8% 1.422 9% 2.410 3.83Pure Premium Indicated by National Relativity 19% 0.182 20% 0.490 0.67Pure Premium Present on Rate Level 73% 0.962 71% 1.270 2.23Pure Premium Derived by Formula 0.851 1.217 2.07
CLASS CUTLERY MFG NOC
3122
Industry Group: Manufacturing CONVERTED LOSSESHazard Group: B INDEMNITY LIKELY INDEMNITY NOT-LIKELY MED LIKELY MED NOT-LIKELY TOTAL TOTAL
POLICY PERIOD PAYROLL CASES AMOUNT CASES AMOUNT AMOUNT AMOUNT AMOUNT PURE PREM.7/07 through 6/08 0 0 0 0 0 0 0 0 0.007/08 through 6/09 0 0 0 0 0 0 0 0 0.007/09 through 6/10 0 0 0 0 0 0 0 0 0.007/10 through 6/11 30,202 0 0 0 0 0 0 0 0.007/11 through 6/12 7,520 0 0 0 0 0 0 0 0.00
5 YR. TOTAL 37,722 0 0 0 0 0 0 0 0.00INDEMNITY MEDICAL TOTAL
CRED. PURE PREM.* CRED. PURE PREM.* PURE PREM.*Indicated Pure Premium 1% 0.000 2% 0.000 0.00Pure Premium Indicated by National Relativity 28% 0.258 29% 0.724 0.98Pure Premium Present on Rate Level 71% 0.581 69% 1.237 1.82Pure Premium Derived by Formula 0.485 1.063 1.55
CLASS TOOL MFG-AGRICULTURAL, CONSTRUCTION, LOGGING, MINING, OIL OR ARTESIAN WELL
3126
Industry Group: Manufacturing CONVERTED LOSSESHazard Group: C INDEMNITY LIKELY INDEMNITY NOT-LIKELY MED LIKELY MED NOT-LIKELY TOTAL TOTAL
POLICY PERIOD PAYROLL CASES AMOUNT CASES AMOUNT AMOUNT AMOUNT AMOUNT PURE PREM.7/07 through 6/08 4,797,452 0 0 5 20,910 0 70,429 91,339 1.907/08 through 6/09 5,397,047 0 0 1 7,643 0 7,578 15,221 0.287/09 through 6/10 6,238,251 0 0 0 0 0 1,870 1,870 0.037/10 through 6/11 5,750,079 0 0 3 15,961 0 16,169 32,130 0.567/11 through 6/12 6,636,294 0 0 0 0 0 2,344 2,344 0.04
5 YR. TOTAL 28,819,123 0 0 9 44,514 0 98,390 142,904 0.50INDEMNITY MEDICAL TOTAL
CRED. PURE PREM.* CRED. PURE PREM.* PURE PREM.*Indicated Pure Premium 18% 0.154 23% 0.341 0.50Pure Premium Indicated by National Relativity 41% 0.717 38% 1.119 1.84Pure Premium Present on Rate Level 41% 0.793 39% 1.098 1.89Pure Premium Derived by Formula 0.647 0.932 1.58
Page 50
* Pure Premium per $100 of Payroll** Pure Premium per employee++ Non-Standard Calculation© Copyright 2014 National Council on Compensation Insurance, Inc. All Rights Reserved.
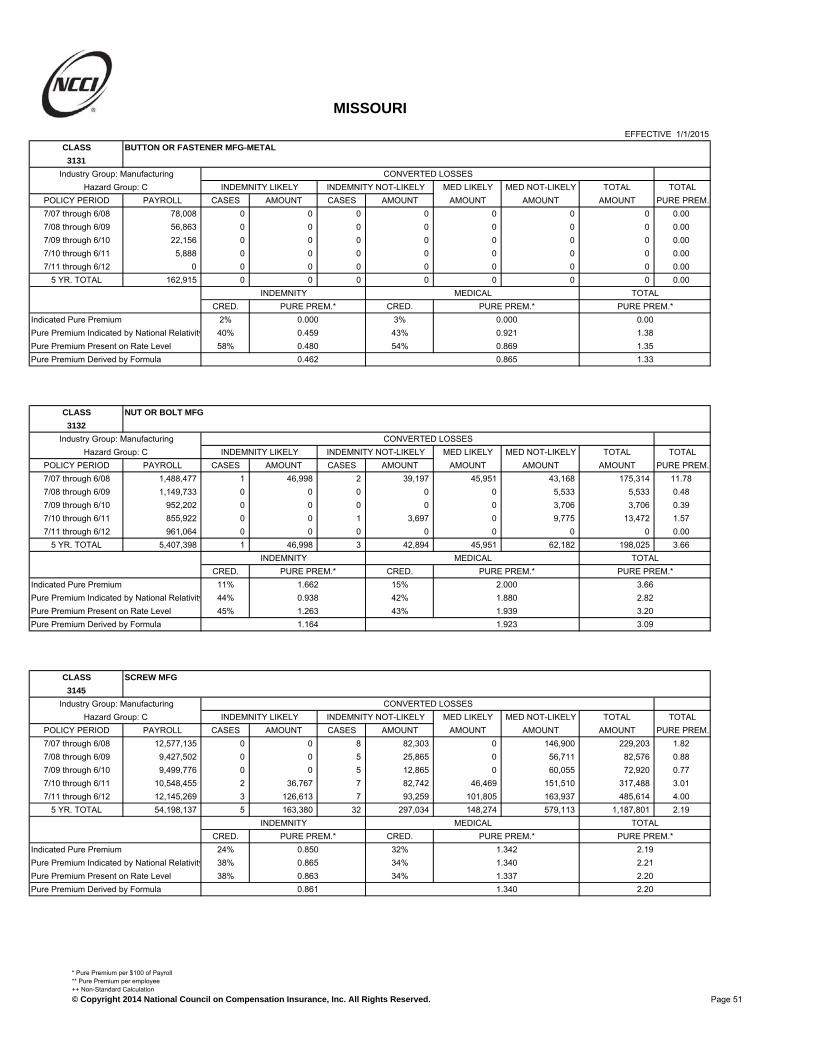
MISSOURI
EFFECTIVE 1/1/2015CLASS BUTTON OR FASTENER MFG-METAL
3131
Industry Group: Manufacturing CONVERTED LOSSESHazard Group: C INDEMNITY LIKELY INDEMNITY NOT-LIKELY MED LIKELY MED NOT-LIKELY TOTAL TOTAL
POLICY PERIOD PAYROLL CASES AMOUNT CASES AMOUNT AMOUNT AMOUNT AMOUNT PURE PREM.7/07 through 6/08 78,008 0 0 0 0 0 0 0 0.007/08 through 6/09 56,863 0 0 0 0 0 0 0 0.007/09 through 6/10 22,156 0 0 0 0 0 0 0 0.007/10 through 6/11 5,888 0 0 0 0 0 0 0 0.007/11 through 6/12 0 0 0 0 0 0 0 0 0.00
5 YR. TOTAL 162,915 0 0 0 0 0 0 0 0.00INDEMNITY MEDICAL TOTAL
CRED. PURE PREM.* CRED. PURE PREM.* PURE PREM.*Indicated Pure Premium 2% 0.000 3% 0.000 0.00Pure Premium Indicated by National Relativity 40% 0.459 43% 0.921 1.38Pure Premium Present on Rate Level 58% 0.480 54% 0.869 1.35Pure Premium Derived by Formula 0.462 0.865 1.33
CLASS NUT OR BOLT MFG
3132
Industry Group: Manufacturing CONVERTED LOSSESHazard Group: C INDEMNITY LIKELY INDEMNITY NOT-LIKELY MED LIKELY MED NOT-LIKELY TOTAL TOTAL
POLICY PERIOD PAYROLL CASES AMOUNT CASES AMOUNT AMOUNT AMOUNT AMOUNT PURE PREM.7/07 through 6/08 1,488,477 1 46,998 2 39,197 45,951 43,168 175,314 11.787/08 through 6/09 1,149,733 0 0 0 0 0 5,533 5,533 0.487/09 through 6/10 952,202 0 0 0 0 0 3,706 3,706 0.397/10 through 6/11 855,922 0 0 1 3,697 0 9,775 13,472 1.577/11 through 6/12 961,064 0 0 0 0 0 0 0 0.00
5 YR. TOTAL 5,407,398 1 46,998 3 42,894 45,951 62,182 198,025 3.66INDEMNITY MEDICAL TOTAL
CRED. PURE PREM.* CRED. PURE PREM.* PURE PREM.*Indicated Pure Premium 11% 1.662 15% 2.000 3.66Pure Premium Indicated by National Relativity 44% 0.938 42% 1.880 2.82Pure Premium Present on Rate Level 45% 1.263 43% 1.939 3.20Pure Premium Derived by Formula 1.164 1.923 3.09
CLASS SCREW MFG
3145
Industry Group: Manufacturing CONVERTED LOSSESHazard Group: C INDEMNITY LIKELY INDEMNITY NOT-LIKELY MED LIKELY MED NOT-LIKELY TOTAL TOTAL
POLICY PERIOD PAYROLL CASES AMOUNT CASES AMOUNT AMOUNT AMOUNT AMOUNT PURE PREM.7/07 through 6/08 12,577,135 0 0 8 82,303 0 146,900 229,203 1.827/08 through 6/09 9,427,502 0 0 5 25,865 0 56,711 82,576 0.887/09 through 6/10 9,499,776 0 0 5 12,865 0 60,055 72,920 0.777/10 through 6/11 10,548,455 2 36,767 7 82,742 46,469 151,510 317,488 3.017/11 through 6/12 12,145,269 3 126,613 7 93,259 101,805 163,937 485,614 4.00
5 YR. TOTAL 54,198,137 5 163,380 32 297,034 148,274 579,113 1,187,801 2.19INDEMNITY MEDICAL TOTAL
CRED. PURE PREM.* CRED. PURE PREM.* PURE PREM.*Indicated Pure Premium 24% 0.850 32% 1.342 2.19Pure Premium Indicated by National Relativity 38% 0.865 34% 1.340 2.21Pure Premium Present on Rate Level 38% 0.863 34% 1.337 2.20Pure Premium Derived by Formula 0.861 1.340 2.20
Page 51
* Pure Premium per $100 of Payroll** Pure Premium per employee++ Non-Standard Calculation© Copyright 2014 National Council on Compensation Insurance, Inc. All Rights Reserved.

MISSOURI
EFFECTIVE 1/1/2015CLASS HARDWARE MFG NOC
3146
Industry Group: Manufacturing CONVERTED LOSSESHazard Group: C INDEMNITY LIKELY INDEMNITY NOT-LIKELY MED LIKELY MED NOT-LIKELY TOTAL TOTAL
POLICY PERIOD PAYROLL CASES AMOUNT CASES AMOUNT AMOUNT AMOUNT AMOUNT PURE PREM.7/07 through 6/08 8,564,919 0 0 2 13,372 0 54,371 67,743 0.797/08 through 6/09 6,194,934 1 41,407 3 2,457 7,631 21,385 72,880 1.187/09 through 6/10 11,920,754 1 31,406 9 156,727 115,943 614,606 918,682 7.717/10 through 6/11 12,522,870 0 0 8 34,548 0 108,546 143,094 1.147/11 through 6/12 12,459,689 0 0 3 56,293 0 98,268 154,561 1.24
5 YR. TOTAL 51,663,166 2 72,813 25 263,397 123,574 897,176 1,356,960 2.63INDEMNITY MEDICAL TOTAL
CRED. PURE PREM.* CRED. PURE PREM.* PURE PREM.*Indicated Pure Premium 23% 0.651 34% 1.976 2.63Pure Premium Indicated by National Relativity 38% 0.732 33% 1.292 2.02Pure Premium Present on Rate Level 39% 0.825 33% 1.644 2.47Pure Premium Derived by Formula 0.750 1.641 2.39
CLASS STOVE MFG
3169
Industry Group: Manufacturing CONVERTED LOSSESHazard Group: C INDEMNITY LIKELY INDEMNITY NOT-LIKELY MED LIKELY MED NOT-LIKELY TOTAL TOTAL
POLICY PERIOD PAYROLL CASES AMOUNT CASES AMOUNT AMOUNT AMOUNT AMOUNT PURE PREM.7/07 through 6/08 4,808,086 0 0 1 26,575 0 39,036 65,611 1.377/08 through 6/09 3,547,745 0 0 3 15,869 0 19,449 35,318 1.007/09 through 6/10 3,238,698 0 0 1 9,536 0 53,836 63,372 1.967/10 through 6/11 3,830,359 0 0 1 51,709 0 69,633 121,342 3.177/11 through 6/12 9,010,166 0 0 0 0 0 1,376 1,376 0.02
5 YR. TOTAL 24,435,054 0 0 6 103,689 0 183,330 287,019 1.17INDEMNITY MEDICAL TOTAL
CRED. PURE PREM.* CRED. PURE PREM.* PURE PREM.*Indicated Pure Premium 19% 0.424 26% 0.750 1.17Pure Premium Indicated by National Relativity 40% 0.931 37% 1.525 2.46Pure Premium Present on Rate Level 41% 1.066 37% 1.757 2.82Pure Premium Derived by Formula 0.890 1.409 2.30
CLASS RADIATOR OR HEATER MFG
3175
Industry Group: Manufacturing CONVERTED LOSSESHazard Group: C INDEMNITY LIKELY INDEMNITY NOT-LIKELY MED LIKELY MED NOT-LIKELY TOTAL TOTAL
POLICY PERIOD PAYROLL CASES AMOUNT CASES AMOUNT AMOUNT AMOUNT AMOUNT PURE PREM.7/07 through 6/08 822,412 0 0 0 0 0 10,751 10,751 1.317/08 through 6/09 285,231 1 418 2 6,798 3,091 67,101 77,408 27.147/09 through 6/10 608,142 0 0 1 10,836 0 61,131 71,967 11.837/10 through 6/11 1,177,282 1 2,588 0 0 0 71 2,659 0.237/11 through 6/12 289,794 0 0 1 2,372 0 4,594 6,966 2.40
5 YR. TOTAL 3,182,861 2 3,006 4 20,006 3,091 143,648 169,751 5.33INDEMNITY MEDICAL TOTAL
CRED. PURE PREM.* CRED. PURE PREM.* PURE PREM.*Indicated Pure Premium 9% 0.723 12% 4.610 5.33Pure Premium Indicated by National Relativity 23% 1.517 24% 2.600 4.12Pure Premium Present on Rate Level 68% 1.147 64% 2.116 3.26Pure Premium Derived by Formula 1.194 2.531 3.73
Page 52
* Pure Premium per $100 of Payroll** Pure Premium per employee++ Non-Standard Calculation© Copyright 2014 National Council on Compensation Insurance, Inc. All Rights Reserved.

MISSOURI
EFFECTIVE 1/1/2015CLASS ELECTRICAL APPARATUS MFG NOC
3179
Industry Group: Manufacturing CONVERTED LOSSESHazard Group: B INDEMNITY LIKELY INDEMNITY NOT-LIKELY MED LIKELY MED NOT-LIKELY TOTAL TOTAL
POLICY PERIOD PAYROLL CASES AMOUNT CASES AMOUNT AMOUNT AMOUNT AMOUNT PURE PREM.7/07 through 6/08 172,071,023 28 909,577 73 864,669 496,598 1,329,604 3,600,448 2.097/08 through 6/09 148,598,600 19 650,304 95 1,564,307 928,545 1,934,895 5,078,051 3.427/09 through 6/10 153,040,792 15 365,321 83 1,549,364 283,142 2,095,781 4,293,608 2.817/10 through 6/11 182,254,809 14 326,430 83 1,290,163 394,336 2,345,144 4,356,073 2.397/11 through 6/12 165,682,786 11 370,592 57 806,889 217,379 1,509,767 2,904,627 1.75
5 YR. TOTAL 821,648,010 87 2,622,224 391 6,075,392 2,320,000 9,215,191 20,232,807 2.46INDEMNITY MEDICAL TOTAL
CRED. PURE PREM.* CRED. PURE PREM.* PURE PREM.*Indicated Pure Premium 78% 1.059 98% 1.404 2.46Pure Premium Indicated by National Relativity 11% 0.708 1% 1.119 1.83Pure Premium Present on Rate Level 11% 1.098 1% 1.447 2.55Pure Premium Derived by Formula 1.025 1.402 2.43
CLASS ELECTRIC OR GAS LIGHTING FIXTURES MFG
3180
Industry Group: Manufacturing CONVERTED LOSSESHazard Group: B INDEMNITY LIKELY INDEMNITY NOT-LIKELY MED LIKELY MED NOT-LIKELY TOTAL TOTAL
POLICY PERIOD PAYROLL CASES AMOUNT CASES AMOUNT AMOUNT AMOUNT AMOUNT PURE PREM.7/07 through 6/08 13,387,826 3 78,367 3 19,384 24,078 42,953 164,782 1.237/08 through 6/09 11,700,849 0 0 2 32,275 0 48,332 80,607 0.697/09 through 6/10 11,360,275 0 0 1 2,664 0 7,770 10,434 0.097/10 through 6/11 12,594,140 2 8,992 1 48,009 8,065 60,546 125,612 1.007/11 through 6/12 12,414,046 0 0 4 126,471 0 148,439 274,910 2.22
5 YR. TOTAL 61,457,136 5 87,359 11 228,803 32,143 308,040 656,345 1.07INDEMNITY MEDICAL TOTAL
CRED. PURE PREM.* CRED. PURE PREM.* PURE PREM.*Indicated Pure Premium 22% 0.514 30% 0.554 1.07Pure Premium Indicated by National Relativity 39% 0.695 35% 1.267 1.96Pure Premium Present on Rate Level 39% 0.656 35% 1.006 1.66Pure Premium Derived by Formula 0.640 0.962 1.60
CLASS PLUMBERS SUPPLIES MFG NOC
3188
Industry Group: Manufacturing CONVERTED LOSSESHazard Group: B INDEMNITY LIKELY INDEMNITY NOT-LIKELY MED LIKELY MED NOT-LIKELY TOTAL TOTAL
POLICY PERIOD PAYROLL CASES AMOUNT CASES AMOUNT AMOUNT AMOUNT AMOUNT PURE PREM.7/07 through 6/08 8,916,369 0 0 5 48,350 0 57,575 105,925 1.197/08 through 6/09 11,955,296 0 0 8 70,300 0 135,321 205,621 1.727/09 through 6/10 14,886,118 2 18,126 16 120,534 52,944 217,862 409,466 2.757/10 through 6/11 16,440,221 2 26,338 11 83,059 18,837 156,483 284,717 1.737/11 through 6/12 17,286,783 0 0 12 105,294 0 169,369 274,663 1.59
5 YR. TOTAL 69,484,787 4 44,464 52 427,537 71,781 736,610 1,280,392 1.84INDEMNITY MEDICAL TOTAL
CRED. PURE PREM.* CRED. PURE PREM.* PURE PREM.*Indicated Pure Premium 24% 0.679 33% 1.163 1.84Pure Premium Indicated by National Relativity 38% 0.532 33% 0.869 1.40Pure Premium Present on Rate Level 38% 0.715 34% 1.108 1.82Pure Premium Derived by Formula 0.637 1.047 1.68
Page 53
* Pure Premium per $100 of Payroll** Pure Premium per employee++ Non-Standard Calculation© Copyright 2014 National Council on Compensation Insurance, Inc. All Rights Reserved.

MISSOURI
EFFECTIVE 1/1/2015CLASS CAN MFG
3220
Industry Group: Manufacturing CONVERTED LOSSESHazard Group: C INDEMNITY LIKELY INDEMNITY NOT-LIKELY MED LIKELY MED NOT-LIKELY TOTAL TOTAL
POLICY PERIOD PAYROLL CASES AMOUNT CASES AMOUNT AMOUNT AMOUNT AMOUNT PURE PREM.7/07 through 6/08 18,455,168 0 0 4 239,703 0 219,124 458,827 2.497/08 through 6/09 28,406,681 2 55,584 7 80,136 67,535 146,008 349,263 1.237/09 through 6/10 21,786,753 4 134,074 7 75,703 125,510 139,154 474,441 2.187/10 through 6/11 21,149,434 3 102,843 3 86,518 95,218 87,890 372,469 1.767/11 through 6/12 21,627,791 1 219,738 6 54,487 190,234 121,104 585,563 2.71
5 YR. TOTAL 111,425,827 10 512,239 27 536,547 478,497 713,280 2,240,563 2.01INDEMNITY MEDICAL TOTAL
CRED. PURE PREM.* CRED. PURE PREM.* PURE PREM.*Indicated Pure Premium 31% 0.941 37% 1.070 2.01Pure Premium Indicated by National Relativity 34% 0.514 31% 0.748 1.26Pure Premium Present on Rate Level 35% 0.787 32% 0.964 1.75Pure Premium Derived by Formula 0.742 0.936 1.68
CLASS LAMP OR PORTABLE LANTERN MFG
3223
Industry Group: Manufacturing CONVERTED LOSSESHazard Group: A INDEMNITY LIKELY INDEMNITY NOT-LIKELY MED LIKELY MED NOT-LIKELY TOTAL TOTAL
POLICY PERIOD PAYROLL CASES AMOUNT CASES AMOUNT AMOUNT AMOUNT AMOUNT PURE PREM.7/07 through 6/08 8,933,362 0 0 7 91,031 0 247,986 339,017 3.807/08 through 6/09 7,428,603 4 30,051 6 74,982 98,679 180,901 384,613 5.187/09 through 6/10 7,604,544 1 2,872 6 57,187 6,673 149,253 215,985 2.847/10 through 6/11 7,901,669 3 127,029 8 113,126 168,249 263,114 671,518 8.507/11 through 6/12 8,186,532 4 268,202 10 58,314 495,198 262,816 1,084,530 13.25
5 YR. TOTAL 40,054,710 12 428,154 37 394,640 768,799 1,104,070 2,695,663 6.73INDEMNITY MEDICAL TOTAL
CRED. PURE PREM.* CRED. PURE PREM.* PURE PREM.*Indicated Pure Premium 23% 2.054 37% 4.676 6.73Pure Premium Indicated by National Relativity 13% 0.327 14% 0.645 0.97Pure Premium Present on Rate Level 64% 1.054 49% 2.642 3.70Pure Premium Derived by Formula 1.189 3.115 4.30
CLASS ENAMEL WARE MFG.
3224
Industry Group: Manufacturing CONVERTED LOSSESHazard Group: B INDEMNITY LIKELY INDEMNITY NOT-LIKELY MED LIKELY MED NOT-LIKELY TOTAL TOTAL
POLICY PERIOD PAYROLL CASES AMOUNT CASES AMOUNT AMOUNT AMOUNT AMOUNT PURE PREM.7/07 through 6/08 1,962 0 0 0 0 0 0 0 0.007/08 through 6/09 0 0 0 0 0 0 0 0 0.007/09 through 6/10 0 0 0 0 0 0 0 0 0.007/10 through 6/11 0 0 0 0 0 0 0 0 0.007/11 through 6/12 0 0 0 0 0 0 0 0 0.00
5 YR. TOTAL 1,962 0 0 0 0 0 0 0 0.00INDEMNITY MEDICAL TOTAL
CRED. PURE PREM.* CRED. PURE PREM.* PURE PREM.*Indicated Pure Premium 0% 0.000 1% 0.000 0.00Pure Premium Indicated by National Relativity 24% 2.370 25% 1.533 3.90Pure Premium Present on Rate Level 76% 1.198 74% 1.453 2.65Pure Premium Derived by Formula 1.479 1.458 2.94
Page 54
* Pure Premium per $100 of Payroll** Pure Premium per employee++ Non-Standard Calculation© Copyright 2014 National Council on Compensation Insurance, Inc. All Rights Reserved.

MISSOURI
EFFECTIVE 1/1/2015CLASS ALUMINUM WARE MFG
3227
Industry Group: Manufacturing CONVERTED LOSSESHazard Group: B INDEMNITY LIKELY INDEMNITY NOT-LIKELY MED LIKELY MED NOT-LIKELY TOTAL TOTAL
POLICY PERIOD PAYROLL CASES AMOUNT CASES AMOUNT AMOUNT AMOUNT AMOUNT PURE PREM.7/07 through 6/08 11,467,648 4 93,811 2 362 106,156 36,942 237,271 2.077/08 through 6/09 10,656,556 5 74,340 4 11,017 179,031 56,637 321,025 3.017/09 through 6/10 11,127,956 4 125,703 7 38,667 166,806 83,154 414,330 3.727/10 through 6/11 12,230,990 3 56,580 4 15,901 72,689 59,748 204,918 1.687/11 through 6/12 8,816,628 5 74,610 7 48,536 112,437 76,161 311,744 3.54
5 YR. TOTAL 54,299,778 21 425,044 24 114,483 637,119 312,642 1,489,288 2.74INDEMNITY MEDICAL TOTAL
CRED. PURE PREM.* CRED. PURE PREM.* PURE PREM.*Indicated Pure Premium 26% 0.994 34% 1.749 2.74Pure Premium Indicated by National Relativity 37% 1.114 33% 1.306 2.42Pure Premium Present on Rate Level 37% 1.067 33% 1.570 2.64Pure Premium Derived by Formula 1.065 1.544 2.61
CLASS WIRE ROPE MFG-IRON OR STEEL
3240
Industry Group: Manufacturing CONVERTED LOSSESHazard Group: B INDEMNITY LIKELY INDEMNITY NOT-LIKELY MED LIKELY MED NOT-LIKELY TOTAL TOTAL
POLICY PERIOD PAYROLL CASES AMOUNT CASES AMOUNT AMOUNT AMOUNT AMOUNT PURE PREM.7/07 through 6/08 14,121,295 2 37,560 6 27,130 21,451 28,025 114,166 0.817/08 through 6/09 9,632,400 0 0 0 0 0 8,226 8,226 0.097/09 through 6/10 8,860,633 0 0 3 94,855 0 71,033 165,888 1.877/10 through 6/11 8,334,813 0 0 0 0 0 3,649 3,649 0.047/11 through 6/12 257,877 0 0 0 0 0 0 0 0.00
5 YR. TOTAL 41,207,018 2 37,560 9 121,985 21,451 110,933 291,929 0.71INDEMNITY MEDICAL TOTAL
CRED. PURE PREM.* CRED. PURE PREM.* PURE PREM.*Indicated Pure Premium 19% 0.387 26% 0.321 0.71Pure Premium Indicated by National Relativity 26% 0.956 28% 1.917 2.87Pure Premium Present on Rate Level 55% 0.660 46% 1.040 1.70Pure Premium Derived by Formula 0.685 1.099 1.78
CLASS WIRE DRAWING-IRON OR STEEL
3241
Industry Group: Manufacturing CONVERTED LOSSESHazard Group: C INDEMNITY LIKELY INDEMNITY NOT-LIKELY MED LIKELY MED NOT-LIKELY TOTAL TOTAL
POLICY PERIOD PAYROLL CASES AMOUNT CASES AMOUNT AMOUNT AMOUNT AMOUNT PURE PREM.7/07 through 6/08 30,301,794 1 23,246 23 193,256 50,013 348,173 614,688 2.037/08 through 6/09 22,985,747 3 257,849 14 488,255 288,797 510,953 1,545,854 6.737/09 through 6/10 26,835,245 2 36,910 14 289,835 10,794 578,566 916,105 3.417/10 through 6/11 27,388,996 1 2,040 23 212,433 2,434 364,931 581,838 2.127/11 through 6/12 27,158,447 1 35,110 21 456,496 9,938 1,087,576 1,589,120 5.85
5 YR. TOTAL 134,670,229 8 355,155 95 1,640,275 361,976 2,890,199 5,247,605 3.90INDEMNITY MEDICAL TOTAL
CRED. PURE PREM.* CRED. PURE PREM.* PURE PREM.*Indicated Pure Premium 39% 1.482 51% 2.415 3.90Pure Premium Indicated by National Relativity 30% 0.997 24% 1.626 2.62Pure Premium Present on Rate Level 31% 1.163 25% 1.775 2.94Pure Premium Derived by Formula 1.238 2.066 3.30
Page 55
* Pure Premium per $100 of Payroll** Pure Premium per employee++ Non-Standard Calculation© Copyright 2014 National Council on Compensation Insurance, Inc. All Rights Reserved.

MISSOURI
EFFECTIVE 1/1/2015CLASS WIRE CLOTH MFG
3255
Industry Group: Manufacturing CONVERTED LOSSESHazard Group: A INDEMNITY LIKELY INDEMNITY NOT-LIKELY MED LIKELY MED NOT-LIKELY TOTAL TOTAL
POLICY PERIOD PAYROLL CASES AMOUNT CASES AMOUNT AMOUNT AMOUNT AMOUNT PURE PREM.7/07 through 6/08 4,887,394 1 15,402 2 101,272 42,058 61,738 220,470 4.517/08 through 6/09 3,809,711 0 0 1 6,709 0 6,987 13,696 0.367/09 through 6/10 3,319,584 0 0 1 24,576 0 45,435 70,011 2.117/10 through 6/11 162,008 0 0 0 0 0 1,989 1,989 1.237/11 through 6/12 163,852 0 0 0 0 0 0 0 0.00
5 YR. TOTAL 12,342,549 1 15,402 4 132,557 42,058 116,149 306,166 2.48INDEMNITY MEDICAL TOTAL
CRED. PURE PREM.* CRED. PURE PREM.* PURE PREM.*Indicated Pure Premium 12% 1.199 15% 1.282 2.48Pure Premium Indicated by National Relativity 18% 0.540 19% 1.115 1.66Pure Premium Present on Rate Level 70% 0.656 66% 0.941 1.60Pure Premium Derived by Formula 0.700 1.025 1.73
CLASS WIRE GOODS MFG NOC
3257
Industry Group: Manufacturing CONVERTED LOSSESHazard Group: C INDEMNITY LIKELY INDEMNITY NOT-LIKELY MED LIKELY MED NOT-LIKELY TOTAL TOTAL
POLICY PERIOD PAYROLL CASES AMOUNT CASES AMOUNT AMOUNT AMOUNT AMOUNT PURE PREM.7/07 through 6/08 30,948,583 6 405,990 16 80,649 964,320 136,592 1,587,551 5.137/08 through 6/09 25,303,357 2 8,171 16 108,053 754 214,244 331,222 1.317/09 through 6/10 28,090,466 2 22,801 16 83,654 8,551 311,975 426,981 1.527/10 through 6/11 30,401,018 4 72,500 16 249,748 71,555 481,844 875,647 2.887/11 through 6/12 30,007,543 1 3,923 16 210,834 24,090 423,193 662,040 2.21
5 YR. TOTAL 144,750,967 15 513,385 80 732,938 1,069,270 1,567,848 3,883,441 2.68INDEMNITY MEDICAL TOTAL
CRED. PURE PREM.* CRED. PURE PREM.* PURE PREM.*Indicated Pure Premium 37% 0.861 50% 1.822 2.68Pure Premium Indicated by National Relativity 31% 0.830 25% 1.506 2.34Pure Premium Present on Rate Level 32% 1.007 25% 1.581 2.59Pure Premium Derived by Formula 0.898 1.683 2.58
CLASS EYELET MFG
3270
Industry Group: Manufacturing CONVERTED LOSSESHazard Group: C INDEMNITY LIKELY INDEMNITY NOT-LIKELY MED LIKELY MED NOT-LIKELY TOTAL TOTAL
POLICY PERIOD PAYROLL CASES AMOUNT CASES AMOUNT AMOUNT AMOUNT AMOUNT PURE PREM.7/07 through 6/08 6,099,952 2 84,720 5 17,306 214,472 42,586 359,084 5.897/08 through 6/09 4,996,103 2 145,553 4 38,363 145,346 23,395 352,657 7.067/09 through 6/10 5,639,904 0 0 4 465,728 0 519,188 984,916 17.467/10 through 6/11 7,060,924 2 51,513 6 54,854 79,966 400,644 586,977 8.317/11 through 6/12 8,705,052 2 25,717 9 98,253 37,103 206,219 367,292 4.22
5 YR. TOTAL 32,501,935 8 307,503 28 674,504 476,887 1,192,032 2,650,926 8.16INDEMNITY MEDICAL TOTAL
CRED. PURE PREM.* CRED. PURE PREM.* PURE PREM.*Indicated Pure Premium 22% 3.021 34% 5.135 8.16Pure Premium Indicated by National Relativity 39% 0.696 33% 1.289 1.99Pure Premium Present on Rate Level 39% 1.229 33% 2.585 3.81Pure Premium Derived by Formula 1.415 3.024 4.44
Page 56
* Pure Premium per $100 of Payroll** Pure Premium per employee++ Non-Standard Calculation© Copyright 2014 National Council on Compensation Insurance, Inc. All Rights Reserved.

MISSOURI
EFFECTIVE 1/1/2015CLASS BED SPRING OR WIRE MATTRESS MFG
3300
Industry Group: Manufacturing CONVERTED LOSSESHazard Group: C INDEMNITY LIKELY INDEMNITY NOT-LIKELY MED LIKELY MED NOT-LIKELY TOTAL TOTAL
POLICY PERIOD PAYROLL CASES AMOUNT CASES AMOUNT AMOUNT AMOUNT AMOUNT PURE PREM.7/07 through 6/08 46,789,856 11 218,416 40 589,278 165,417 821,821 1,794,932 3.847/08 through 6/09 24,195,226 4 119,851 23 128,360 99,929 309,874 658,014 2.727/09 through 6/10 25,956,542 1 37,179 26 142,894 23,960 265,879 469,912 1.817/10 through 6/11 26,547,187 2 36,119 19 202,618 20,807 339,000 598,544 2.257/11 through 6/12 27,919,882 8 385,335 28 345,845 521,153 492,353 1,744,686 6.25
5 YR. TOTAL 151,408,693 26 796,900 136 1,408,995 831,266 2,228,927 5,266,088 3.48INDEMNITY MEDICAL TOTAL
CRED. PURE PREM.* CRED. PURE PREM.* PURE PREM.*Indicated Pure Premium 45% 1.457 58% 2.021 3.48Pure Premium Indicated by National Relativity 27% 1.043 21% 2.432 3.48Pure Premium Present on Rate Level 28% 1.498 21% 2.150 3.65Pure Premium Derived by Formula 1.357 2.134 3.49
CLASS SPRING MFG
3303
Industry Group: Manufacturing CONVERTED LOSSESHazard Group: B INDEMNITY LIKELY INDEMNITY NOT-LIKELY MED LIKELY MED NOT-LIKELY TOTAL TOTAL
POLICY PERIOD PAYROLL CASES AMOUNT CASES AMOUNT AMOUNT AMOUNT AMOUNT PURE PREM.7/07 through 6/08 12,447,335 3 81,875 3 5,075 51,286 31,252 169,488 1.367/08 through 6/09 8,461,969 0 0 1 3,202 0 11,208 14,410 0.177/09 through 6/10 10,844,606 2 21,474 5 6,343 41,790 16,424 86,031 0.797/10 through 6/11 14,565,126 2 91,195 5 24,723 155,614 78,292 349,824 2.407/11 through 6/12 14,021,312 0 0 6 21,912 0 39,051 60,963 0.44
5 YR. TOTAL 60,340,348 7 194,544 20 61,255 248,690 176,227 680,716 1.13INDEMNITY MEDICAL TOTAL
CRED. PURE PREM.* CRED. PURE PREM.* PURE PREM.*Indicated Pure Premium 25% 0.424 31% 0.704 1.13Pure Premium Indicated by National Relativity 37% 1.534 34% 2.519 4.05Pure Premium Present on Rate Level 38% 0.869 35% 1.136 2.01Pure Premium Derived by Formula 1.004 1.472 2.48
CLASS HEAT-TREATING-METAL
3307
Industry Group: Manufacturing CONVERTED LOSSESHazard Group: C INDEMNITY LIKELY INDEMNITY NOT-LIKELY MED LIKELY MED NOT-LIKELY TOTAL TOTAL
POLICY PERIOD PAYROLL CASES AMOUNT CASES AMOUNT AMOUNT AMOUNT AMOUNT PURE PREM.7/07 through 6/08 5,875,004 2 347,385 2 18,344 369,198 47,676 782,603 13.327/08 through 6/09 5,668,644 1 7,207 5 94,203 10,521 86,277 198,208 3.507/09 through 6/10 5,660,149 1 45,406 5 19,872 57,312 95,895 218,485 3.867/10 through 6/11 6,210,567 1 53,824 8 143,447 47,123 312,028 556,422 8.967/11 through 6/12 7,964,159 0 0 4 30,682 0 103,269 133,951 1.68
5 YR. TOTAL 31,378,523 5 453,822 24 306,548 484,154 645,145 1,889,669 6.02INDEMNITY MEDICAL TOTAL
CRED. PURE PREM.* CRED. PURE PREM.* PURE PREM.*Indicated Pure Premium 26% 2.423 35% 3.599 6.02Pure Premium Indicated by National Relativity 37% 0.926 32% 1.519 2.45Pure Premium Present on Rate Level 37% 1.808 33% 2.913 4.72Pure Premium Derived by Formula 1.642 2.707 4.35
Page 57
* Pure Premium per $100 of Payroll** Pure Premium per employee++ Non-Standard Calculation© Copyright 2014 National Council on Compensation Insurance, Inc. All Rights Reserved.

MISSOURI
EFFECTIVE 1/1/2015CLASS BRASS OR COPPER GOODS MFG
3315
Industry Group: Manufacturing CONVERTED LOSSESHazard Group: B INDEMNITY LIKELY INDEMNITY NOT-LIKELY MED LIKELY MED NOT-LIKELY TOTAL TOTAL
POLICY PERIOD PAYROLL CASES AMOUNT CASES AMOUNT AMOUNT AMOUNT AMOUNT PURE PREM.7/07 through 6/08 2,952,618 0 0 0 0 0 247 247 0.017/08 through 6/09 2,712,577 0 0 0 0 0 0 0 0.007/09 through 6/10 2,908,122 1 17,698 1 45,579 1 62,911 126,189 4.347/10 through 6/11 2,755,127 0 0 1 4,400 0 51,033 55,433 2.017/11 through 6/12 2,980,235 0 0 0 0 0 3,142 3,142 0.11
5 YR. TOTAL 14,308,679 1 17,698 2 49,979 1 117,333 185,011 1.29INDEMNITY MEDICAL TOTAL
CRED. PURE PREM.* CRED. PURE PREM.* PURE PREM.*Indicated Pure Premium 17% 0.473 20% 0.820 1.29Pure Premium Indicated by National Relativity 41% 1.650 40% 1.972 3.62Pure Premium Present on Rate Level 42% 1.414 40% 1.608 3.02Pure Premium Derived by Formula 1.351 1.596 2.95
CLASS TIN FOIL MFG
3334
Industry Group: Manufacturing CONVERTED LOSSESHazard Group: C INDEMNITY LIKELY INDEMNITY NOT-LIKELY MED LIKELY MED NOT-LIKELY TOTAL TOTAL
POLICY PERIOD PAYROLL CASES AMOUNT CASES AMOUNT AMOUNT AMOUNT AMOUNT PURE PREM.7/07 through 6/08 11,070,085 0 0 3 14,004 0 33,889 47,893 0.437/08 through 6/09 10,501,425 1 22,983 3 81,463 12,858 94,565 211,869 2.027/09 through 6/10 13,102,119 1 51,679 2 26,695 30,555 13,663 122,592 0.947/10 through 6/11 11,673,686 0 0 1 3,412 0 26,696 30,108 0.267/11 through 6/12 11,765,512 2 20,680 1 80,583 112,452 68,606 282,321 2.40
5 YR. TOTAL 58,112,827 4 95,342 10 206,157 155,865 237,419 694,783 1.20INDEMNITY MEDICAL TOTAL
CRED. PURE PREM.* CRED. PURE PREM.* PURE PREM.*Indicated Pure Premium 28% 0.519 30% 0.677 1.20Pure Premium Indicated by National Relativity 34% 1.436 35% 1.467 2.90Pure Premium Present on Rate Level 38% 1.188 35% 1.119 2.31Pure Premium Derived by Formula 1.085 1.108 2.19
CLASS TYPE FOUNDRY
3336
Industry Group: Manufacturing CONVERTED LOSSESHazard Group: E INDEMNITY LIKELY INDEMNITY NOT-LIKELY MED LIKELY MED NOT-LIKELY TOTAL TOTAL
POLICY PERIOD PAYROLL CASES AMOUNT CASES AMOUNT AMOUNT AMOUNT AMOUNT PURE PREM.7/07 through 6/08 6,836,141 0 0 5 28,463 0 39,627 68,090 1.007/08 through 6/09 8,359,387 0 0 3 10,223 0 25,441 35,664 0.437/09 through 6/10 6,861,967 0 0 3 36,671 0 62,739 99,410 1.457/10 through 6/11 6,973,657 0 0 1 3,070 0 114,216 117,286 1.687/11 through 6/12 7,508,490 0 0 3 32,897 0 39,777 72,674 0.97
5 YR. TOTAL 36,539,642 0 0 15 111,324 0 281,800 393,124 1.08INDEMNITY MEDICAL TOTAL
CRED. PURE PREM.* CRED. PURE PREM.* PURE PREM.*Indicated Pure Premium 21% 0.305 28% 0.771 1.08Pure Premium Indicated by National Relativity 39% 1.231 36% 1.878 3.11Pure Premium Present on Rate Level 40% 0.962 36% 1.391 2.35Pure Premium Derived by Formula 0.929 1.393 2.32
Page 58
* Pure Premium per $100 of Payroll** Pure Premium per employee++ Non-Standard Calculation© Copyright 2014 National Council on Compensation Insurance, Inc. All Rights Reserved.

MISSOURI
EFFECTIVE 1/1/2015CLASS WELDING OR CUTTING NOC & DRIVERS
3365
Industry Group: Contracting CONVERTED LOSSESHazard Group: E INDEMNITY LIKELY INDEMNITY NOT-LIKELY MED LIKELY MED NOT-LIKELY TOTAL TOTAL
POLICY PERIOD PAYROLL CASES AMOUNT CASES AMOUNT AMOUNT AMOUNT AMOUNT PURE PREM.7/07 through 6/08 20,155,554 3 243,032 14 681,880 598,306 473,383 1,996,601 9.917/08 through 6/09 23,580,411 2 75,700 11 241,489 59,168 163,797 540,154 2.297/09 through 6/10 19,095,247 4 391,067 7 104,741 912,309 321,283 1,729,400 9.067/10 through 6/11 17,685,159 0 0 10 149,454 0 405,812 555,266 3.147/11 through 6/12 17,815,932 0 0 11 138,571 0 208,546 347,117 1.95
5 YR. TOTAL 98,332,303 9 709,799 53 1,316,135 1,569,783 1,572,821 5,168,538 5.26INDEMNITY MEDICAL TOTAL
CRED. PURE PREM.* CRED. PURE PREM.* PURE PREM.*Indicated Pure Premium 46% 2.060 62% 3.196 5.26Pure Premium Indicated by National Relativity 27% 2.335 19% 2.950 5.29Pure Premium Present on Rate Level 27% 2.629 19% 4.046 6.68Pure Premium Derived by Formula 2.288 3.311 5.60
CLASS ELECTROPLATING
3372
Industry Group: Manufacturing CONVERTED LOSSESHazard Group: D INDEMNITY LIKELY INDEMNITY NOT-LIKELY MED LIKELY MED NOT-LIKELY TOTAL TOTAL
POLICY PERIOD PAYROLL CASES AMOUNT CASES AMOUNT AMOUNT AMOUNT AMOUNT PURE PREM.7/07 through 6/08 31,291,965 3 96,903 16 193,860 30,653 441,200 762,616 2.447/08 through 6/09 21,175,802 1 25,616 3 19,170 24,943 63,157 132,886 0.637/09 through 6/10 24,554,319 1 1,150 10 63,096 2,531 169,418 236,195 0.967/10 through 6/11 16,858,753 2 56,166 10 53,977 27,459 142,526 280,128 1.667/11 through 6/12 28,398,463 3 458,624 9 116,969 565,604 176,934 1,318,131 4.64
5 YR. TOTAL 122,279,302 10 638,459 48 447,072 651,190 993,235 2,729,956 2.23INDEMNITY MEDICAL TOTAL
CRED. PURE PREM.* CRED. PURE PREM.* PURE PREM.*Indicated Pure Premium 37% 0.888 48% 1.345 2.23Pure Premium Indicated by National Relativity 31% 1.145 26% 2.086 3.23Pure Premium Present on Rate Level 32% 1.195 26% 1.661 2.86Pure Premium Derived by Formula 1.066 1.620 2.69
CLASS GALVANIZING OR TINNING-NOT ELECTROLYTIC
3373
Industry Group: Manufacturing CONVERTED LOSSESHazard Group: C INDEMNITY LIKELY INDEMNITY NOT-LIKELY MED LIKELY MED NOT-LIKELY TOTAL TOTAL
POLICY PERIOD PAYROLL CASES AMOUNT CASES AMOUNT AMOUNT AMOUNT AMOUNT PURE PREM.7/07 through 6/08 6,420,132 0 0 1 19,027 0 177,601 196,628 3.067/08 through 6/09 4,180,549 0 0 8 278,237 0 579,856 858,093 20.537/09 through 6/10 3,111,803 0 0 6 64,834 0 96,941 161,775 5.207/10 through 6/11 3,869,953 3 20,637 8 58,360 98,419 188,270 365,686 9.457/11 through 6/12 3,697,032 0 0 6 77,112 0 116,802 193,914 5.25
5 YR. TOTAL 21,279,469 3 20,637 29 497,570 98,419 1,159,470 1,776,096 8.35INDEMNITY MEDICAL TOTAL
CRED. PURE PREM.* CRED. PURE PREM.* PURE PREM.*Indicated Pure Premium 23% 2.435 35% 5.911 8.35Pure Premium Indicated by National Relativity 38% 1.703 32% 2.578 4.28Pure Premium Present on Rate Level 39% 1.962 33% 4.337 6.30Pure Premium Derived by Formula 1.972 4.325 6.30
Page 59
* Pure Premium per $100 of Payroll** Pure Premium per employee++ Non-Standard Calculation© Copyright 2014 National Council on Compensation Insurance, Inc. All Rights Reserved.
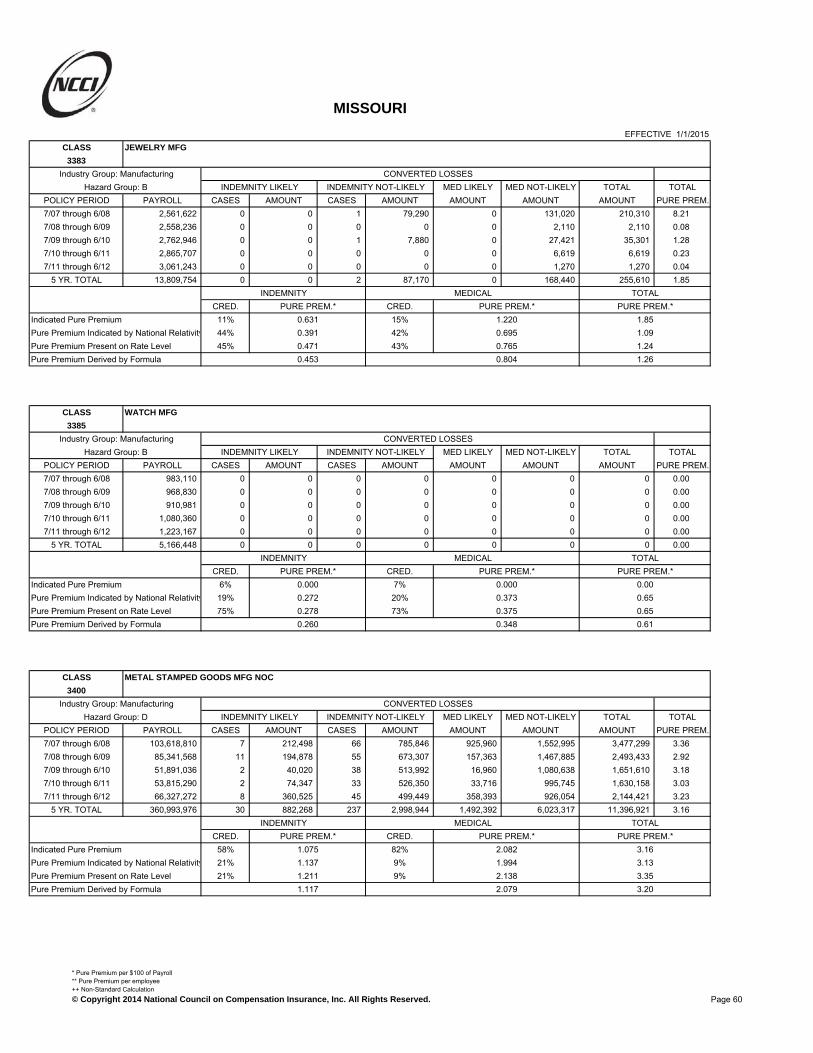
MISSOURI
EFFECTIVE 1/1/2015CLASS JEWELRY MFG
3383
Industry Group: Manufacturing CONVERTED LOSSESHazard Group: B INDEMNITY LIKELY INDEMNITY NOT-LIKELY MED LIKELY MED NOT-LIKELY TOTAL TOTAL
POLICY PERIOD PAYROLL CASES AMOUNT CASES AMOUNT AMOUNT AMOUNT AMOUNT PURE PREM.7/07 through 6/08 2,561,622 0 0 1 79,290 0 131,020 210,310 8.217/08 through 6/09 2,558,236 0 0 0 0 0 2,110 2,110 0.087/09 through 6/10 2,762,946 0 0 1 7,880 0 27,421 35,301 1.287/10 through 6/11 2,865,707 0 0 0 0 0 6,619 6,619 0.237/11 through 6/12 3,061,243 0 0 0 0 0 1,270 1,270 0.04
5 YR. TOTAL 13,809,754 0 0 2 87,170 0 168,440 255,610 1.85INDEMNITY MEDICAL TOTAL
CRED. PURE PREM.* CRED. PURE PREM.* PURE PREM.*Indicated Pure Premium 11% 0.631 15% 1.220 1.85Pure Premium Indicated by National Relativity 44% 0.391 42% 0.695 1.09Pure Premium Present on Rate Level 45% 0.471 43% 0.765 1.24Pure Premium Derived by Formula 0.453 0.804 1.26
CLASS WATCH MFG
3385
Industry Group: Manufacturing CONVERTED LOSSESHazard Group: B INDEMNITY LIKELY INDEMNITY NOT-LIKELY MED LIKELY MED NOT-LIKELY TOTAL TOTAL
POLICY PERIOD PAYROLL CASES AMOUNT CASES AMOUNT AMOUNT AMOUNT AMOUNT PURE PREM.7/07 through 6/08 983,110 0 0 0 0 0 0 0 0.007/08 through 6/09 968,830 0 0 0 0 0 0 0 0.007/09 through 6/10 910,981 0 0 0 0 0 0 0 0.007/10 through 6/11 1,080,360 0 0 0 0 0 0 0 0.007/11 through 6/12 1,223,167 0 0 0 0 0 0 0 0.00
5 YR. TOTAL 5,166,448 0 0 0 0 0 0 0 0.00INDEMNITY MEDICAL TOTAL
CRED. PURE PREM.* CRED. PURE PREM.* PURE PREM.*Indicated Pure Premium 6% 0.000 7% 0.000 0.00Pure Premium Indicated by National Relativity 19% 0.272 20% 0.373 0.65Pure Premium Present on Rate Level 75% 0.278 73% 0.375 0.65Pure Premium Derived by Formula 0.260 0.348 0.61
CLASS METAL STAMPED GOODS MFG NOC
3400
Industry Group: Manufacturing CONVERTED LOSSESHazard Group: D INDEMNITY LIKELY INDEMNITY NOT-LIKELY MED LIKELY MED NOT-LIKELY TOTAL TOTAL
POLICY PERIOD PAYROLL CASES AMOUNT CASES AMOUNT AMOUNT AMOUNT AMOUNT PURE PREM.7/07 through 6/08 103,618,810 7 212,498 66 785,846 925,960 1,552,995 3,477,299 3.367/08 through 6/09 85,341,568 11 194,878 55 673,307 157,363 1,467,885 2,493,433 2.927/09 through 6/10 51,891,036 2 40,020 38 513,992 16,960 1,080,638 1,651,610 3.187/10 through 6/11 53,815,290 2 74,347 33 526,350 33,716 995,745 1,630,158 3.037/11 through 6/12 66,327,272 8 360,525 45 499,449 358,393 926,054 2,144,421 3.23
5 YR. TOTAL 360,993,976 30 882,268 237 2,998,944 1,492,392 6,023,317 11,396,921 3.16INDEMNITY MEDICAL TOTAL
CRED. PURE PREM.* CRED. PURE PREM.* PURE PREM.*Indicated Pure Premium 58% 1.075 82% 2.082 3.16Pure Premium Indicated by National Relativity 21% 1.137 9% 1.994 3.13Pure Premium Present on Rate Level 21% 1.211 9% 2.138 3.35Pure Premium Derived by Formula 1.117 2.079 3.20
Page 60
* Pure Premium per $100 of Payroll** Pure Premium per employee++ Non-Standard Calculation© Copyright 2014 National Council on Compensation Insurance, Inc. All Rights Reserved.

MISSOURI
EFFECTIVE 1/1/2015CLASS CONSTRUCTION OR AGRICULTURAL MACHINERY MFG
3507
Industry Group: Manufacturing CONVERTED LOSSESHazard Group: C INDEMNITY LIKELY INDEMNITY NOT-LIKELY MED LIKELY MED NOT-LIKELY TOTAL TOTAL
POLICY PERIOD PAYROLL CASES AMOUNT CASES AMOUNT AMOUNT AMOUNT AMOUNT PURE PREM.7/07 through 6/08 71,629,237 4 89,545 52 694,575 63,174 1,178,448 2,025,742 2.837/08 through 6/09 56,637,550 3 174,729 33 481,758 271,762 952,242 1,880,491 3.327/09 through 6/10 55,051,915 5 417,870 42 870,053 660,745 922,135 2,870,803 5.217/10 through 6/11 76,574,584 4 147,820 34 434,022 75,528 935,283 1,592,653 2.087/11 through 6/12 94,167,300 5 201,764 32 444,775 176,945 781,600 1,605,084 1.71
5 YR. TOTAL 354,060,586 21 1,031,728 193 2,925,183 1,248,154 4,769,708 9,974,773 2.82INDEMNITY MEDICAL TOTAL
CRED. PURE PREM.* CRED. PURE PREM.* PURE PREM.*Indicated Pure Premium 59% 1.118 79% 1.700 2.82Pure Premium Indicated by National Relativity 20% 1.096 10% 1.728 2.82Pure Premium Present on Rate Level 21% 1.268 11% 2.000 3.27Pure Premium Derived by Formula 1.145 1.736 2.88
CLASS TEXTILE MACHINERY MFG
3515
Industry Group: Manufacturing CONVERTED LOSSESHazard Group: C INDEMNITY LIKELY INDEMNITY NOT-LIKELY MED LIKELY MED NOT-LIKELY TOTAL TOTAL
POLICY PERIOD PAYROLL CASES AMOUNT CASES AMOUNT AMOUNT AMOUNT AMOUNT PURE PREM.7/07 through 6/08 174,271 0 0 0 0 0 0 0 0.007/08 through 6/09 113,923 0 0 0 0 0 0 0 0.007/09 through 6/10 203,930 0 0 0 0 0 0 0 0.007/10 through 6/11 161,299 0 0 0 0 0 0 0 0.007/11 through 6/12 117,046 0 0 1 8,347 0 24,546 32,893 28.10
5 YR. TOTAL 770,469 0 0 1 8,347 0 24,546 32,893 4.27INDEMNITY MEDICAL TOTAL
CRED. PURE PREM.* CRED. PURE PREM.* PURE PREM.*Indicated Pure Premium 4% 1.083 5% 3.186 4.27Pure Premium Indicated by National Relativity 29% 0.486 30% 0.927 1.41Pure Premium Present on Rate Level 67% 0.766 65% 0.929 1.70Pure Premium Derived by Formula 0.697 1.041 1.74
CLASS PRINTING OR BOOKBINDING MACHINE MFG
3548
Industry Group: Manufacturing CONVERTED LOSSESHazard Group: C INDEMNITY LIKELY INDEMNITY NOT-LIKELY MED LIKELY MED NOT-LIKELY TOTAL TOTAL
POLICY PERIOD PAYROLL CASES AMOUNT CASES AMOUNT AMOUNT AMOUNT AMOUNT PURE PREM.7/07 through 6/08 2,783,703 0 0 3 12,767 0 48,837 61,604 2.217/08 through 6/09 3,055,355 0 0 0 0 0 4,424 4,424 0.157/09 through 6/10 1,558,770 0 0 0 0 0 0 0 0.007/10 through 6/11 1,527,599 0 0 0 0 0 1,781 1,781 0.127/11 through 6/12 1,625,131 0 0 0 0 0 0 0 0.00
5 YR. TOTAL 10,550,558 0 0 3 12,767 0 55,042 67,809 0.64INDEMNITY MEDICAL TOTAL
CRED. PURE PREM.* CRED. PURE PREM.* PURE PREM.*Indicated Pure Premium 11% 0.121 14% 0.522 0.64Pure Premium Indicated by National Relativity 36% 0.454 39% 0.801 1.26Pure Premium Present on Rate Level 53% 0.634 47% 0.925 1.56Pure Premium Derived by Formula 0.513 0.820 1.33
Page 61
* Pure Premium per $100 of Payroll** Pure Premium per employee++ Non-Standard Calculation© Copyright 2014 National Council on Compensation Insurance, Inc. All Rights Reserved.

MISSOURI
EFFECTIVE 1/1/2015CLASS CONFECTION MACHINE MFG
3559
Industry Group: Manufacturing CONVERTED LOSSESHazard Group: C INDEMNITY LIKELY INDEMNITY NOT-LIKELY MED LIKELY MED NOT-LIKELY TOTAL TOTAL
POLICY PERIOD PAYROLL CASES AMOUNT CASES AMOUNT AMOUNT AMOUNT AMOUNT PURE PREM.7/07 through 6/08 9,475,449 2 14,298 6 65,881 1,255 48,801 130,235 1.377/08 through 6/09 9,215,776 2 14,731 14 174,521 0 198,260 387,512 4.217/09 through 6/10 5,485,312 2 7,626 1 7,521 4,718 26,570 46,435 0.857/10 through 6/11 3,124,453 0 0 2 46,963 0 107,976 154,939 4.967/11 through 6/12 2,958,663 1 63,545 0 0 34,381 4,729 102,655 3.47
5 YR. TOTAL 30,259,653 7 100,200 23 294,886 40,354 386,336 821,776 2.72INDEMNITY MEDICAL TOTAL
CRED. PURE PREM.* CRED. PURE PREM.* PURE PREM.*Indicated Pure Premium 19% 1.306 25% 1.410 2.72Pure Premium Indicated by National Relativity 40% 0.930 37% 1.543 2.47Pure Premium Present on Rate Level 41% 0.839 38% 1.277 2.12Pure Premium Derived by Formula 0.964 1.409 2.37
CLASS COMPUTING, RECORDING OR OFFICE MACHINE MFG NOC
3574
Industry Group: Manufacturing CONVERTED LOSSESHazard Group: B INDEMNITY LIKELY INDEMNITY NOT-LIKELY MED LIKELY MED NOT-LIKELY TOTAL TOTAL
POLICY PERIOD PAYROLL CASES AMOUNT CASES AMOUNT AMOUNT AMOUNT AMOUNT PURE PREM.7/07 through 6/08 36,021,190 3 85,737 6 48,845 56,687 76,983 268,252 0.757/08 through 6/09 31,992,486 1 2,185 6 83,864 0 191,534 277,583 0.877/09 through 6/10 29,223,641 1 82,191 7 198,679 98,525 274,479 653,874 2.247/10 through 6/11 31,901,393 0 0 9 72,617 0 149,197 221,814 0.707/11 through 6/12 35,297,584 0 0 7 42,048 0 112,317 154,365 0.44
5 YR. TOTAL 164,436,294 5 170,113 35 446,053 155,212 804,510 1,575,888 0.96INDEMNITY MEDICAL TOTAL
CRED. PURE PREM.* CRED. PURE PREM.* PURE PREM.*Indicated Pure Premium 27% 0.375 36% 0.584 0.96Pure Premium Indicated by National Relativity 36% 0.381 32% 0.576 0.96Pure Premium Present on Rate Level 37% 0.408 32% 0.612 1.02Pure Premium Derived by Formula 0.389 0.590 0.98
CLASS FUEL INJECTION DEVICE MFG
3581
Industry Group: Manufacturing CONVERTED LOSSESHazard Group: B INDEMNITY LIKELY INDEMNITY NOT-LIKELY MED LIKELY MED NOT-LIKELY TOTAL TOTAL
POLICY PERIOD PAYROLL CASES AMOUNT CASES AMOUNT AMOUNT AMOUNT AMOUNT PURE PREM.7/07 through 6/08 3,648,749 0 0 2 22,684 0 16,673 39,357 1.087/08 through 6/09 5,125,659 0 0 2 59,772 0 85,601 145,373 2.847/09 through 6/10 5,263,834 1 6,844 4 71,228 4,923 115,772 198,767 3.787/10 through 6/11 5,564,465 0 0 3 17,046 0 76,285 93,331 1.687/11 through 6/12 5,235,639 0 0 1 10,084 0 6,766 16,850 0.32
5 YR. TOTAL 24,838,346 1 6,844 12 180,814 4,923 301,097 493,678 1.99INDEMNITY MEDICAL TOTAL
CRED. PURE PREM.* CRED. PURE PREM.* PURE PREM.*Indicated Pure Premium 15% 0.756 19% 1.232 1.99Pure Premium Indicated by National Relativity 42% 0.323 40% 0.617 0.94Pure Premium Present on Rate Level 43% 0.566 41% 0.814 1.38Pure Premium Derived by Formula 0.492 0.815 1.31
Page 62
* Pure Premium per $100 of Payroll** Pure Premium per employee++ Non-Standard Calculation© Copyright 2014 National Council on Compensation Insurance, Inc. All Rights Reserved.
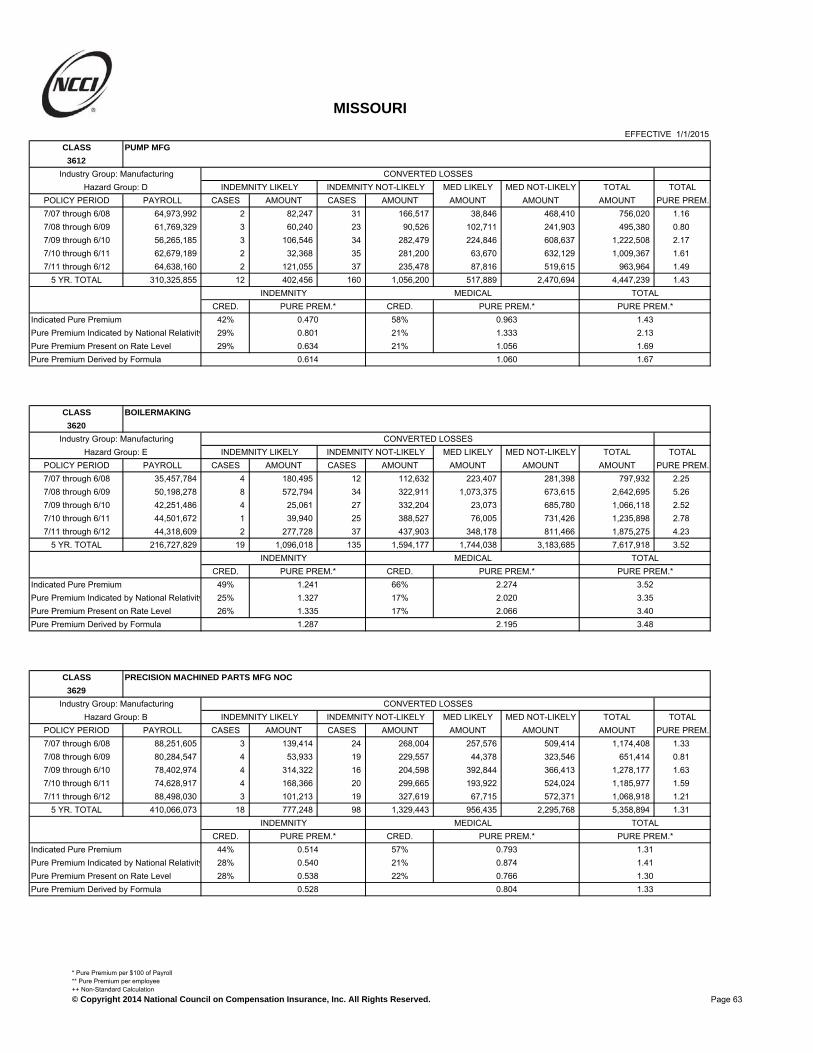
MISSOURI
EFFECTIVE 1/1/2015CLASS PUMP MFG
3612
Industry Group: Manufacturing CONVERTED LOSSESHazard Group: D INDEMNITY LIKELY INDEMNITY NOT-LIKELY MED LIKELY MED NOT-LIKELY TOTAL TOTAL
POLICY PERIOD PAYROLL CASES AMOUNT CASES AMOUNT AMOUNT AMOUNT AMOUNT PURE PREM.7/07 through 6/08 64,973,992 2 82,247 31 166,517 38,846 468,410 756,020 1.167/08 through 6/09 61,769,329 3 60,240 23 90,526 102,711 241,903 495,380 0.807/09 through 6/10 56,265,185 3 106,546 34 282,479 224,846 608,637 1,222,508 2.177/10 through 6/11 62,679,189 2 32,368 35 281,200 63,670 632,129 1,009,367 1.617/11 through 6/12 64,638,160 2 121,055 37 235,478 87,816 519,615 963,964 1.49
5 YR. TOTAL 310,325,855 12 402,456 160 1,056,200 517,889 2,470,694 4,447,239 1.43INDEMNITY MEDICAL TOTAL
CRED. PURE PREM.* CRED. PURE PREM.* PURE PREM.*Indicated Pure Premium 42% 0.470 58% 0.963 1.43Pure Premium Indicated by National Relativity 29% 0.801 21% 1.333 2.13Pure Premium Present on Rate Level 29% 0.634 21% 1.056 1.69Pure Premium Derived by Formula 0.614 1.060 1.67
CLASS BOILERMAKING
3620
Industry Group: Manufacturing CONVERTED LOSSESHazard Group: E INDEMNITY LIKELY INDEMNITY NOT-LIKELY MED LIKELY MED NOT-LIKELY TOTAL TOTAL
POLICY PERIOD PAYROLL CASES AMOUNT CASES AMOUNT AMOUNT AMOUNT AMOUNT PURE PREM.7/07 through 6/08 35,457,784 4 180,495 12 112,632 223,407 281,398 797,932 2.257/08 through 6/09 50,198,278 8 572,794 34 322,911 1,073,375 673,615 2,642,695 5.267/09 through 6/10 42,251,486 4 25,061 27 332,204 23,073 685,780 1,066,118 2.527/10 through 6/11 44,501,672 1 39,940 25 388,527 76,005 731,426 1,235,898 2.787/11 through 6/12 44,318,609 2 277,728 37 437,903 348,178 811,466 1,875,275 4.23
5 YR. TOTAL 216,727,829 19 1,096,018 135 1,594,177 1,744,038 3,183,685 7,617,918 3.52INDEMNITY MEDICAL TOTAL
CRED. PURE PREM.* CRED. PURE PREM.* PURE PREM.*Indicated Pure Premium 49% 1.241 66% 2.274 3.52Pure Premium Indicated by National Relativity 25% 1.327 17% 2.020 3.35Pure Premium Present on Rate Level 26% 1.335 17% 2.066 3.40Pure Premium Derived by Formula 1.287 2.195 3.48
CLASS PRECISION MACHINED PARTS MFG NOC
3629
Industry Group: Manufacturing CONVERTED LOSSESHazard Group: B INDEMNITY LIKELY INDEMNITY NOT-LIKELY MED LIKELY MED NOT-LIKELY TOTAL TOTAL
POLICY PERIOD PAYROLL CASES AMOUNT CASES AMOUNT AMOUNT AMOUNT AMOUNT PURE PREM.7/07 through 6/08 88,251,605 3 139,414 24 268,004 257,576 509,414 1,174,408 1.337/08 through 6/09 80,284,547 4 53,933 19 229,557 44,378 323,546 651,414 0.817/09 through 6/10 78,402,974 4 314,322 16 204,598 392,844 366,413 1,278,177 1.637/10 through 6/11 74,628,917 4 168,366 20 299,665 193,922 524,024 1,185,977 1.597/11 through 6/12 88,498,030 3 101,213 19 327,619 67,715 572,371 1,068,918 1.21
5 YR. TOTAL 410,066,073 18 777,248 98 1,329,443 956,435 2,295,768 5,358,894 1.31INDEMNITY MEDICAL TOTAL
CRED. PURE PREM.* CRED. PURE PREM.* PURE PREM.*Indicated Pure Premium 44% 0.514 57% 0.793 1.31Pure Premium Indicated by National Relativity 28% 0.540 21% 0.874 1.41Pure Premium Present on Rate Level 28% 0.538 22% 0.766 1.30Pure Premium Derived by Formula 0.528 0.804 1.33
Page 63
* Pure Premium per $100 of Payroll** Pure Premium per employee++ Non-Standard Calculation© Copyright 2014 National Council on Compensation Insurance, Inc. All Rights Reserved.

MISSOURI
EFFECTIVE 1/1/2015CLASS MACHINE SHOP NOC
3632
Industry Group: Manufacturing CONVERTED LOSSESHazard Group: D INDEMNITY LIKELY INDEMNITY NOT-LIKELY MED LIKELY MED NOT-LIKELY TOTAL TOTAL
POLICY PERIOD PAYROLL CASES AMOUNT CASES AMOUNT AMOUNT AMOUNT AMOUNT PURE PREM.7/07 through 6/08 296,607,413 31 901,057 157 2,504,830 1,426,908 4,676,755 9,509,550 3.217/08 through 6/09 237,036,550 12 808,871 107 1,928,185 1,021,175 2,992,393 6,750,624 2.857/09 through 6/10 242,377,968 26 942,498 120 1,512,606 1,093,799 2,834,090 6,382,993 2.637/10 through 6/11 279,676,285 20 662,324 157 2,103,214 932,496 3,838,087 7,536,121 2.707/11 through 6/12 313,760,509 27 1,092,265 154 1,977,964 1,567,752 3,755,917 8,393,898 2.68
5 YR. TOTAL 1,369,458,725 116 4,407,015 695 10,026,799 6,042,130 18,097,242 38,573,186 2.82INDEMNITY MEDICAL TOTAL
CRED. PURE PREM.* CRED. PURE PREM.* PURE PREM.*Indicated Pure Premium 94% 1.054 100% 1.763 2.82Pure Premium Indicated by National Relativity 3% 1.032 0% 1.628 2.66Pure Premium Present on Rate Level 3% 1.062 0% 1.798 2.86Pure Premium Derived by Formula 1.054 1.763 2.82
CLASS VALVE MFG
3634
Industry Group: Manufacturing CONVERTED LOSSESHazard Group: B INDEMNITY LIKELY INDEMNITY NOT-LIKELY MED LIKELY MED NOT-LIKELY TOTAL TOTAL
POLICY PERIOD PAYROLL CASES AMOUNT CASES AMOUNT AMOUNT AMOUNT AMOUNT PURE PREM.7/07 through 6/08 40,209,894 2 24,636 10 99,591 1,680 136,404 262,311 0.657/08 through 6/09 35,704,519 1 68,576 6 100,076 53,028 137,567 359,247 1.017/09 through 6/10 37,470,666 0 0 9 83,057 0 122,586 205,643 0.557/10 through 6/11 31,940,476 1 20,309 8 98,073 12,410 171,676 302,468 0.957/11 through 6/12 47,250,386 0 0 12 166,486 0 376,278 542,764 1.15
5 YR. TOTAL 192,575,941 4 113,521 45 547,283 67,118 944,511 1,672,433 0.87INDEMNITY MEDICAL TOTAL
CRED. PURE PREM.* CRED. PURE PREM.* PURE PREM.*Indicated Pure Premium 32% 0.343 41% 0.525 0.87Pure Premium Indicated by National Relativity 34% 0.621 29% 0.916 1.54Pure Premium Present on Rate Level 34% 0.521 30% 0.709 1.23Pure Premium Derived by Formula 0.498 0.694 1.19
CLASS GEAR MFG OR GRINDING
3635
Industry Group: Manufacturing CONVERTED LOSSESHazard Group: C INDEMNITY LIKELY INDEMNITY NOT-LIKELY MED LIKELY MED NOT-LIKELY TOTAL TOTAL
POLICY PERIOD PAYROLL CASES AMOUNT CASES AMOUNT AMOUNT AMOUNT AMOUNT PURE PREM.7/07 through 6/08 12,017,385 2 40,718 15 160,186 3,240 206,159 410,303 3.417/08 through 6/09 3,552,870 0 0 4 105,682 0 142,233 247,915 6.987/09 through 6/10 3,140,765 0 0 0 0 0 3,746 3,746 0.127/10 through 6/11 3,930,490 0 0 1 375 0 21,973 22,348 0.577/11 through 6/12 4,586,268 2 29,967 5 43,735 46,993 49,570 170,265 3.71
5 YR. TOTAL 27,227,778 4 70,685 25 309,978 50,233 423,681 854,577 3.14INDEMNITY MEDICAL TOTAL
CRED. PURE PREM.* CRED. PURE PREM.* PURE PREM.*Indicated Pure Premium 21% 1.398 25% 1.741 3.14Pure Premium Indicated by National Relativity 39% 0.957 37% 1.463 2.42Pure Premium Present on Rate Level 40% 1.193 38% 1.449 2.64Pure Premium Derived by Formula 1.144 1.527 2.67
Page 64
* Pure Premium per $100 of Payroll** Pure Premium per employee++ Non-Standard Calculation© Copyright 2014 National Council on Compensation Insurance, Inc. All Rights Reserved.
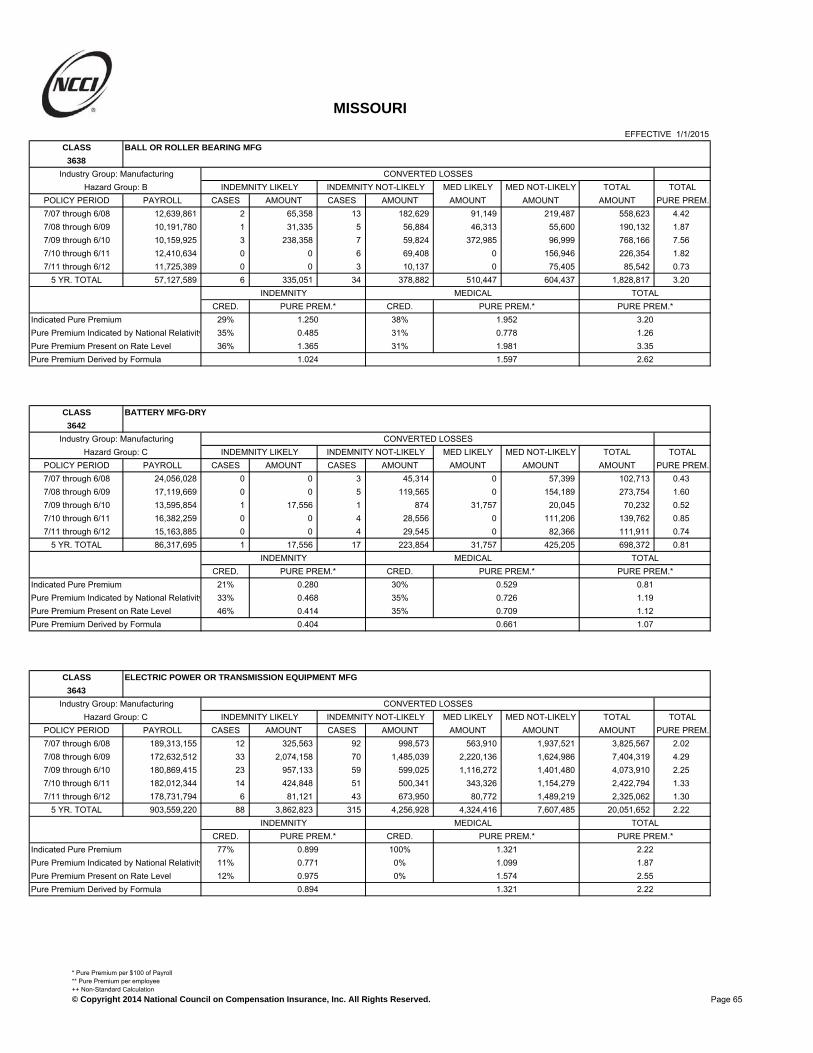
MISSOURI
EFFECTIVE 1/1/2015CLASS BALL OR ROLLER BEARING MFG
3638
Industry Group: Manufacturing CONVERTED LOSSESHazard Group: B INDEMNITY LIKELY INDEMNITY NOT-LIKELY MED LIKELY MED NOT-LIKELY TOTAL TOTAL
POLICY PERIOD PAYROLL CASES AMOUNT CASES AMOUNT AMOUNT AMOUNT AMOUNT PURE PREM.7/07 through 6/08 12,639,861 2 65,358 13 182,629 91,149 219,487 558,623 4.427/08 through 6/09 10,191,780 1 31,335 5 56,884 46,313 55,600 190,132 1.877/09 through 6/10 10,159,925 3 238,358 7 59,824 372,985 96,999 768,166 7.567/10 through 6/11 12,410,634 0 0 6 69,408 0 156,946 226,354 1.827/11 through 6/12 11,725,389 0 0 3 10,137 0 75,405 85,542 0.73
5 YR. TOTAL 57,127,589 6 335,051 34 378,882 510,447 604,437 1,828,817 3.20INDEMNITY MEDICAL TOTAL
CRED. PURE PREM.* CRED. PURE PREM.* PURE PREM.*Indicated Pure Premium 29% 1.250 38% 1.952 3.20Pure Premium Indicated by National Relativity 35% 0.485 31% 0.778 1.26Pure Premium Present on Rate Level 36% 1.365 31% 1.981 3.35Pure Premium Derived by Formula 1.024 1.597 2.62
CLASS BATTERY MFG-DRY
3642
Industry Group: Manufacturing CONVERTED LOSSESHazard Group: C INDEMNITY LIKELY INDEMNITY NOT-LIKELY MED LIKELY MED NOT-LIKELY TOTAL TOTAL
POLICY PERIOD PAYROLL CASES AMOUNT CASES AMOUNT AMOUNT AMOUNT AMOUNT PURE PREM.7/07 through 6/08 24,056,028 0 0 3 45,314 0 57,399 102,713 0.437/08 through 6/09 17,119,669 0 0 5 119,565 0 154,189 273,754 1.607/09 through 6/10 13,595,854 1 17,556 1 874 31,757 20,045 70,232 0.527/10 through 6/11 16,382,259 0 0 4 28,556 0 111,206 139,762 0.857/11 through 6/12 15,163,885 0 0 4 29,545 0 82,366 111,911 0.74
5 YR. TOTAL 86,317,695 1 17,556 17 223,854 31,757 425,205 698,372 0.81INDEMNITY MEDICAL TOTAL
CRED. PURE PREM.* CRED. PURE PREM.* PURE PREM.*Indicated Pure Premium 21% 0.280 30% 0.529 0.81Pure Premium Indicated by National Relativity 33% 0.468 35% 0.726 1.19Pure Premium Present on Rate Level 46% 0.414 35% 0.709 1.12Pure Premium Derived by Formula 0.404 0.661 1.07
CLASS ELECTRIC POWER OR TRANSMISSION EQUIPMENT MFG
3643
Industry Group: Manufacturing CONVERTED LOSSESHazard Group: C INDEMNITY LIKELY INDEMNITY NOT-LIKELY MED LIKELY MED NOT-LIKELY TOTAL TOTAL
POLICY PERIOD PAYROLL CASES AMOUNT CASES AMOUNT AMOUNT AMOUNT AMOUNT PURE PREM.7/07 through 6/08 189,313,155 12 325,563 92 998,573 563,910 1,937,521 3,825,567 2.027/08 through 6/09 172,632,512 33 2,074,158 70 1,485,039 2,220,136 1,624,986 7,404,319 4.297/09 through 6/10 180,869,415 23 957,133 59 599,025 1,116,272 1,401,480 4,073,910 2.257/10 through 6/11 182,012,344 14 424,848 51 500,341 343,326 1,154,279 2,422,794 1.337/11 through 6/12 178,731,794 6 81,121 43 673,950 80,772 1,489,219 2,325,062 1.30
5 YR. TOTAL 903,559,220 88 3,862,823 315 4,256,928 4,324,416 7,607,485 20,051,652 2.22INDEMNITY MEDICAL TOTAL
CRED. PURE PREM.* CRED. PURE PREM.* PURE PREM.*Indicated Pure Premium 77% 0.899 100% 1.321 2.22Pure Premium Indicated by National Relativity 11% 0.771 0% 1.099 1.87Pure Premium Present on Rate Level 12% 0.975 0% 1.574 2.55Pure Premium Derived by Formula 0.894 1.321 2.22
Page 65
* Pure Premium per $100 of Payroll** Pure Premium per employee++ Non-Standard Calculation© Copyright 2014 National Council on Compensation Insurance, Inc. All Rights Reserved.

MISSOURI
EFFECTIVE 1/1/2015CLASS BATTERY MFG-STORAGE
3647
Industry Group: Manufacturing CONVERTED LOSSESHazard Group: D INDEMNITY LIKELY INDEMNITY NOT-LIKELY MED LIKELY MED NOT-LIKELY TOTAL TOTAL
POLICY PERIOD PAYROLL CASES AMOUNT CASES AMOUNT AMOUNT AMOUNT AMOUNT PURE PREM.7/07 through 6/08 52,816,403 7 383,050 27 240,286 686,834 703,656 2,013,826 3.817/08 through 6/09 42,933,050 3 105,324 26 280,525 178,712 734,739 1,299,300 3.037/09 through 6/10 50,798,738 5 149,530 32 401,779 153,122 761,219 1,465,650 2.897/10 through 6/11 52,170,992 8 208,009 23 172,544 318,408 599,025 1,297,986 2.497/11 through 6/12 95,116,026 5 111,480 27 368,267 179,780 847,116 1,506,643 1.58
5 YR. TOTAL 293,835,209 28 957,393 135 1,463,401 1,516,856 3,645,755 7,583,405 2.58INDEMNITY MEDICAL TOTAL
CRED. PURE PREM.* CRED. PURE PREM.* PURE PREM.*Indicated Pure Premium 47% 0.824 68% 1.757 2.58Pure Premium Indicated by National Relativity 26% 0.694 16% 1.303 2.00Pure Premium Present on Rate Level 27% 0.886 16% 1.641 2.53Pure Premium Derived by Formula 0.807 1.666 2.47
CLASS AUTOMOTIVE LIGHTING, IGNITION OR STARTING APPARATUS MFG NOC
3648
Industry Group: Manufacturing CONVERTED LOSSESHazard Group: B INDEMNITY LIKELY INDEMNITY NOT-LIKELY MED LIKELY MED NOT-LIKELY TOTAL TOTAL
POLICY PERIOD PAYROLL CASES AMOUNT CASES AMOUNT AMOUNT AMOUNT AMOUNT PURE PREM.7/07 through 6/08 6,817,709 1 5,646 4 13,264 0 54,475 73,385 1.087/08 through 6/09 5,722,514 0 0 2 56,032 0 63,915 119,947 2.107/09 through 6/10 6,040,603 0 0 2 98,496 0 43,958 142,454 2.367/10 through 6/11 8,690,506 1 16,293 5 15,641 49,280 49,371 130,585 1.507/11 through 6/12 8,980,475 0 0 5 36,623 0 66,922 103,545 1.15
5 YR. TOTAL 36,251,807 2 21,939 18 220,056 49,280 278,641 569,916 1.57INDEMNITY MEDICAL TOTAL
CRED. PURE PREM.* CRED. PURE PREM.* PURE PREM.*Indicated Pure Premium 17% 0.668 23% 0.905 1.57Pure Premium Indicated by National Relativity 41% 0.478 38% 0.847 1.33Pure Premium Present on Rate Level 42% 0.567 39% 0.887 1.45Pure Premium Derived by Formula 0.548 0.876 1.42
CLASS TELEVISION, RADIO, TELEPHONE OR TELECOMMUNICATION DEVICE MFG NOC
3681
Industry Group: Manufacturing CONVERTED LOSSESHazard Group: B INDEMNITY LIKELY INDEMNITY NOT-LIKELY MED LIKELY MED NOT-LIKELY TOTAL TOTAL
POLICY PERIOD PAYROLL CASES AMOUNT CASES AMOUNT AMOUNT AMOUNT AMOUNT PURE PREM.7/07 through 6/08 179,474,699 3 77,508 33 446,423 169,874 1,021,042 1,714,847 0.967/08 through 6/09 156,732,959 3 542,611 26 320,199 67,701 637,029 1,567,540 1.007/09 through 6/10 190,388,730 3 74,305 25 278,393 83,981 561,811 998,490 0.527/10 through 6/11 195,197,466 6 216,270 33 309,788 269,759 839,828 1,635,645 0.847/11 through 6/12 195,460,440 3 191,980 27 384,283 259,974 763,063 1,599,300 0.82
5 YR. TOTAL 917,254,294 18 1,102,674 144 1,739,086 851,289 3,822,773 7,515,822 0.82INDEMNITY MEDICAL TOTAL
CRED. PURE PREM.* CRED. PURE PREM.* PURE PREM.*Indicated Pure Premium 49% 0.310 71% 0.510 0.82Pure Premium Indicated by National Relativity 25% 0.281 14% 0.480 0.76Pure Premium Present on Rate Level 26% 0.317 15% 0.589 0.91Pure Premium Derived by Formula 0.305 0.518 0.82
Page 66
* Pure Premium per $100 of Payroll** Pure Premium per employee++ Non-Standard Calculation© Copyright 2014 National Council on Compensation Insurance, Inc. All Rights Reserved.

MISSOURI
EFFECTIVE 1/1/2015CLASS INSTRUMENT MFG NOC
3685
Industry Group: Manufacturing CONVERTED LOSSESHazard Group: B INDEMNITY LIKELY INDEMNITY NOT-LIKELY MED LIKELY MED NOT-LIKELY TOTAL TOTAL
POLICY PERIOD PAYROLL CASES AMOUNT CASES AMOUNT AMOUNT AMOUNT AMOUNT PURE PREM.7/07 through 6/08 74,831,885 3 85,092 13 159,917 27,887 192,160 465,056 0.627/08 through 6/09 74,718,537 6 103,688 14 213,837 33,018 313,457 664,000 0.897/09 through 6/10 93,747,941 5 210,774 22 318,444 257,052 397,816 1,184,086 1.267/10 through 6/11 91,368,379 4 163,057 27 305,388 130,313 631,844 1,230,602 1.357/11 through 6/12 96,738,700 4 71,823 29 443,808 33,139 726,052 1,274,822 1.32
5 YR. TOTAL 431,405,442 22 634,434 105 1,441,394 481,409 2,261,329 4,818,566 1.12INDEMNITY MEDICAL TOTAL
CRED. PURE PREM.* CRED. PURE PREM.* PURE PREM.*Indicated Pure Premium 39% 0.481 53% 0.636 1.12Pure Premium Indicated by National Relativity 30% 0.298 23% 0.553 0.85Pure Premium Present on Rate Level 31% 0.381 24% 0.591 0.97Pure Premium Derived by Formula 0.395 0.606 1.00
CLASS OIL STILL ERECTION OR REPAIR
3719
Industry Group: Contracting CONVERTED LOSSESHazard Group: G INDEMNITY LIKELY INDEMNITY NOT-LIKELY MED LIKELY MED NOT-LIKELY TOTAL TOTAL
POLICY PERIOD PAYROLL CASES AMOUNT CASES AMOUNT AMOUNT AMOUNT AMOUNT PURE PREM.7/07 through 6/08 7,174,394 1 479,599 2 15,025 412,378 6,391 913,393 12.737/08 through 6/09 3,225,008 0 0 2 102,398 0 239,116 341,514 10.597/09 through 6/10 1,281,486 0 0 0 0 0 0 0 0.007/10 through 6/11 776,154 0 0 0 0 0 0 0 0.007/11 through 6/12 760,393 0 0 0 0 0 0 0 0.00
5 YR. TOTAL 13,217,435 1 479,599 4 117,423 412,378 245,507 1,254,907 9.49INDEMNITY MEDICAL TOTAL
CRED. PURE PREM.* CRED. PURE PREM.* PURE PREM.*Indicated Pure Premium 15% 4.517 17% 4.977 9.49Pure Premium Indicated by National Relativity 42% 0.613 41% 0.777 1.39Pure Premium Present on Rate Level 43% 1.149 42% 1.214 2.36Pure Premium Derived by Formula 1.429 1.675 3.10
CLASS MACHINERY OR EQUIPMENT ERECTION OR REPAIR NOC & DRIVERS
3724
Industry Group: Contracting CONVERTED LOSSESHazard Group: F INDEMNITY LIKELY INDEMNITY NOT-LIKELY MED LIKELY MED NOT-LIKELY TOTAL TOTAL
POLICY PERIOD PAYROLL CASES AMOUNT CASES AMOUNT AMOUNT AMOUNT AMOUNT PURE PREM.7/07 through 6/08 190,675,617 29 1,144,629 81 1,628,155 1,189,621 2,535,818 6,498,223 3.417/08 through 6/09 158,638,287 17 580,937 72 1,816,873 761,141 2,751,200 5,910,151 3.737/09 through 6/10 137,418,960 15 947,169 51 828,132 2,078,704 1,316,470 5,170,475 3.767/10 through 6/11 156,996,112 15 1,171,001 73 1,896,871 1,350,126 2,673,590 7,091,588 4.527/11 through 6/12 178,653,843 18 1,191,778 78 2,095,128 835,317 3,718,983 7,841,206 4.39
5 YR. TOTAL 822,382,819 94 5,035,514 355 8,265,159 6,214,909 12,996,061 32,511,643 3.95INDEMNITY MEDICAL TOTAL
CRED. PURE PREM.* CRED. PURE PREM.* PURE PREM.*Indicated Pure Premium 87% 1.617 100% 2.336 3.95Pure Premium Indicated by National Relativity 6% 1.388 0% 1.901 3.29Pure Premium Present on Rate Level 7% 1.556 0% 2.183 3.74Pure Premium Derived by Formula 1.599 2.336 3.94
Page 67
* Pure Premium per $100 of Payroll** Pure Premium per employee++ Non-Standard Calculation© Copyright 2014 National Council on Compensation Insurance, Inc. All Rights Reserved.

MISSOURI
EFFECTIVE 1/1/2015CLASS BOILER INSTALLATION OR REPAIR-STEAM
3726
Industry Group: Contracting CONVERTED LOSSESHazard Group: G INDEMNITY LIKELY INDEMNITY NOT-LIKELY MED LIKELY MED NOT-LIKELY TOTAL TOTAL
POLICY PERIOD PAYROLL CASES AMOUNT CASES AMOUNT AMOUNT AMOUNT AMOUNT PURE PREM.7/07 through 6/08 67,447,180 15 2,082,548 29 1,201,405 2,006,146 1,271,578 6,561,677 9.737/08 through 6/09 37,235,651 0 0 13 318,786 0 533,090 851,876 2.297/09 through 6/10 46,425,299 3 152,417 12 376,609 76,749 477,434 1,083,209 2.337/10 through 6/11 14,034,615 1 84,778 10 250,726 60,692 211,474 607,670 4.337/11 through 6/12 23,974,564 1 20,546 6 240,712 30,371 373,076 664,705 2.77
5 YR. TOTAL 189,117,309 20 2,340,289 70 2,388,238 2,173,958 2,866,652 9,769,137 5.17INDEMNITY MEDICAL TOTAL
CRED. PURE PREM.* CRED. PURE PREM.* PURE PREM.*Indicated Pure Premium 58% 2.500 69% 2.665 5.17Pure Premium Indicated by National Relativity 21% 1.365 15% 1.701 3.07Pure Premium Present on Rate Level 21% 2.384 16% 2.746 5.13Pure Premium Derived by Formula 2.237 2.533 4.77
CLASS AUTOMOBILE WHEEL MFG-METAL-NOT CAST
3803
Industry Group: Manufacturing CONVERTED LOSSESHazard Group: C INDEMNITY LIKELY INDEMNITY NOT-LIKELY MED LIKELY MED NOT-LIKELY TOTAL TOTAL
POLICY PERIOD PAYROLL CASES AMOUNT CASES AMOUNT AMOUNT AMOUNT AMOUNT PURE PREM.7/07 through 6/08 17,486,354 1 17,661 9 219,957 8,291 203,727 449,636 2.577/08 through 6/09 13,809,647 1 41,885 1 7,643 0 10,608 60,136 0.447/09 through 6/10 15,642,475 0 0 5 134,664 0 192,792 327,456 2.097/10 through 6/11 14,436,936 0 0 4 165,315 0 149,815 315,130 2.187/11 through 6/12 13,690,912 0 0 2 10,549 0 33,591 44,140 0.32
5 YR. TOTAL 75,066,324 2 59,546 21 538,128 8,291 590,533 1,196,498 1.59INDEMNITY MEDICAL TOTAL
CRED. PURE PREM.* CRED. PURE PREM.* PURE PREM.*Indicated Pure Premium 27% 0.796 34% 0.798 1.59Pure Premium Indicated by National Relativity 27% 1.402 29% 1.735 3.14Pure Premium Present on Rate Level 46% 0.896 37% 1.110 2.01Pure Premium Derived by Formula 1.006 1.185 2.19
CLASS AUTOMOBILE RADIATOR MFG
3807
Industry Group: Manufacturing CONVERTED LOSSESHazard Group: B INDEMNITY LIKELY INDEMNITY NOT-LIKELY MED LIKELY MED NOT-LIKELY TOTAL TOTAL
POLICY PERIOD PAYROLL CASES AMOUNT CASES AMOUNT AMOUNT AMOUNT AMOUNT PURE PREM.7/07 through 6/08 26,038,152 2 85,591 17 143,187 90,048 317,089 635,915 2.447/08 through 6/09 20,029,181 1 40,772 10 131,490 0 321,782 494,044 2.477/09 through 6/10 25,628,693 1 81,055 10 82,433 74,249 143,564 381,301 1.497/10 through 6/11 25,242,501 1 123,143 4 72,827 140,928 159,191 496,089 1.977/11 through 6/12 22,968,246 0 0 10 99,709 0 132,667 232,376 1.01
5 YR. TOTAL 119,906,773 5 330,561 51 529,646 305,225 1,074,293 2,239,725 1.87INDEMNITY MEDICAL TOTAL
CRED. PURE PREM.* CRED. PURE PREM.* PURE PREM.*Indicated Pure Premium 32% 0.717 43% 1.150 1.87Pure Premium Indicated by National Relativity 34% 0.809 28% 0.983 1.79Pure Premium Present on Rate Level 34% 0.820 29% 1.295 2.12Pure Premium Derived by Formula 0.783 1.145 1.93
Page 68
* Pure Premium per $100 of Payroll** Pure Premium per employee++ Non-Standard Calculation© Copyright 2014 National Council on Compensation Insurance, Inc. All Rights Reserved.

MISSOURI
EFFECTIVE 1/1/2015CLASS AUTOMOBILE MFG OR ASSEMBLY
3808
Industry Group: Manufacturing CONVERTED LOSSESHazard Group: D INDEMNITY LIKELY INDEMNITY NOT-LIKELY MED LIKELY MED NOT-LIKELY TOTAL TOTAL
POLICY PERIOD PAYROLL CASES AMOUNT CASES AMOUNT AMOUNT AMOUNT AMOUNT PURE PREM.7/07 through 6/08 36,621,983 2 34,039 31 424,242 46,724 492,266 997,271 2.727/08 through 6/09 22,960,624 2 5,935 17 210,603 811 283,800 501,149 2.187/09 through 6/10 16,616,382 2 74,027 11 188,742 136,504 327,163 726,436 4.377/10 through 6/11 50,022,845 4 69,371 39 711,984 70,184 1,188,223 2,039,762 4.087/11 through 6/12 54,584,034 4 253,049 40 635,481 465,003 853,501 2,207,034 4.04
5 YR. TOTAL 180,805,868 14 436,421 138 2,171,052 719,226 3,144,953 6,471,652 3.58INDEMNITY MEDICAL TOTAL
CRED. PURE PREM.* CRED. PURE PREM.* PURE PREM.*Indicated Pure Premium 47% 1.442 57% 2.137 3.58Pure Premium Indicated by National Relativity 26% 1.183 21% 1.502 2.69Pure Premium Present on Rate Level 27% 1.430 22% 1.751 3.18Pure Premium Derived by Formula 1.371 1.919 3.29
CLASS AUTOMOBILE RECYCLING & DRIVERS
3821
Industry Group: Goods and Services CONVERTED LOSSESHazard Group: D INDEMNITY LIKELY INDEMNITY NOT-LIKELY MED LIKELY MED NOT-LIKELY TOTAL TOTAL
POLICY PERIOD PAYROLL CASES AMOUNT CASES AMOUNT AMOUNT AMOUNT AMOUNT PURE PREM.7/07 through 6/08 13,664,146 4 36,073 8 59,176 63,532 164,148 322,929 2.367/08 through 6/09 13,148,880 3 49,034 10 158,807 50,790 407,325 665,956 5.077/09 through 6/10 14,647,431 1 19,477 13 42,488 11,383 152,635 225,983 1.547/10 through 6/11 19,305,317 5 172,059 19 819,319 147,539 607,681 1,746,598 9.057/11 through 6/12 16,247,553 2 202,761 11 157,365 209,180 251,625 820,931 5.05
5 YR. TOTAL 77,013,327 15 479,404 61 1,237,155 482,424 1,583,414 3,782,397 4.91INDEMNITY MEDICAL TOTAL
CRED. PURE PREM.* CRED. PURE PREM.* PURE PREM.*Indicated Pure Premium 38% 2.229 49% 2.682 4.91Pure Premium Indicated by National Relativity 31% 1.834 25% 3.098 4.93Pure Premium Present on Rate Level 31% 2.035 26% 2.788 4.82Pure Premium Derived by Formula 2.046 2.814 4.86
CLASS AUTOMOBILE, BUS, TRUCK OR TRAILER BODY MFG: DIE-PRESSED STEEL
3822
Industry Group: Manufacturing CONVERTED LOSSESHazard Group: D INDEMNITY LIKELY INDEMNITY NOT-LIKELY MED LIKELY MED NOT-LIKELY TOTAL TOTAL
POLICY PERIOD PAYROLL CASES AMOUNT CASES AMOUNT AMOUNT AMOUNT AMOUNT PURE PREM.7/07 through 6/08 226,094 0 0 0 0 0 0 0 0.007/08 through 6/09 200,161 0 0 0 0 0 0 0 0.007/09 through 6/10 879,551 0 0 0 0 0 2,551 2,551 0.297/10 through 6/11 1,077,051 1 38,618 1 6,515 25,437 12,050 82,620 7.677/11 through 6/12 3,126,417 1 5,347 4 83,808 1,654 88,495 179,304 5.74
5 YR. TOTAL 5,509,274 2 43,965 5 90,323 27,091 103,096 264,475 4.80INDEMNITY MEDICAL TOTAL
CRED. PURE PREM.* CRED. PURE PREM.* PURE PREM.*Indicated Pure Premium 18% 2.437 17% 2.363 4.80Pure Premium Indicated by National Relativity 41% 1.653 41% 2.753 4.41Pure Premium Present on Rate Level 41% 4.057 42% 2.631 6.69Pure Premium Derived by Formula 2.780 2.635 5.42
Page 69
* Pure Premium per $100 of Payroll** Pure Premium per employee++ Non-Standard Calculation© Copyright 2014 National Council on Compensation Insurance, Inc. All Rights Reserved.

MISSOURI
EFFECTIVE 1/1/2015CLASS AUTOMOBILE, BUS, TRUCK OR TRAILER BODY MFG: NOC
3824
Industry Group: Manufacturing CONVERTED LOSSESHazard Group: D INDEMNITY LIKELY INDEMNITY NOT-LIKELY MED LIKELY MED NOT-LIKELY TOTAL TOTAL
POLICY PERIOD PAYROLL CASES AMOUNT CASES AMOUNT AMOUNT AMOUNT AMOUNT PURE PREM.7/07 through 6/08 62,315,485 10 408,689 51 758,665 545,824 1,276,325 2,989,503 4.807/08 through 6/09 46,003,319 3 90,928 42 574,933 51,113 933,728 1,650,702 3.597/09 through 6/10 55,078,835 9 271,719 40 611,648 585,508 1,073,480 2,542,355 4.627/10 through 6/11 69,704,480 5 130,125 68 906,703 131,331 2,108,880 3,277,039 4.707/11 through 6/12 76,294,931 14 556,298 78 1,396,409 555,525 2,193,371 4,701,603 6.16
5 YR. TOTAL 309,397,050 41 1,457,759 279 4,248,358 1,869,301 7,585,784 15,161,202 4.90INDEMNITY MEDICAL TOTAL
CRED. PURE PREM.* CRED. PURE PREM.* PURE PREM.*Indicated Pure Premium 60% 1.844 82% 3.056 4.90Pure Premium Indicated by National Relativity 20% 1.654 9% 2.766 4.42Pure Premium Present on Rate Level 20% 1.515 9% 2.478 3.99Pure Premium Derived by Formula 1.740 2.978 4.72
CLASS AIRCRAFT ENGINE MFG
3826
Industry Group: Manufacturing CONVERTED LOSSESHazard Group: C INDEMNITY LIKELY INDEMNITY NOT-LIKELY MED LIKELY MED NOT-LIKELY TOTAL TOTAL
POLICY PERIOD PAYROLL CASES AMOUNT CASES AMOUNT AMOUNT AMOUNT AMOUNT PURE PREM.7/07 through 6/08 14,000,875 0 0 4 13,776 0 53,103 66,879 0.487/08 through 6/09 13,066,123 0 0 2 24,121 0 88,813 112,934 0.877/09 through 6/10 13,070,116 1 119,357 3 16,508 43,749 99,995 279,609 2.147/10 through 6/11 13,270,131 0 0 0 0 0 6,438 6,438 0.057/11 through 6/12 12,548,115 0 0 3 104,329 0 100,057 204,386 1.63
5 YR. TOTAL 65,955,360 1 119,357 12 158,734 43,749 348,406 670,246 1.02INDEMNITY MEDICAL TOTAL
CRED. PURE PREM.* CRED. PURE PREM.* PURE PREM.*Indicated Pure Premium 18% 0.422 22% 0.595 1.02Pure Premium Indicated by National Relativity 41% 0.310 39% 0.345 0.66Pure Premium Present on Rate Level 41% 0.359 39% 0.436 0.80Pure Premium Derived by Formula 0.350 0.435 0.79
CLASS AUTOMOBILE ENGINE MFG
3827
Industry Group: Manufacturing CONVERTED LOSSESHazard Group: D INDEMNITY LIKELY INDEMNITY NOT-LIKELY MED LIKELY MED NOT-LIKELY TOTAL TOTAL
POLICY PERIOD PAYROLL CASES AMOUNT CASES AMOUNT AMOUNT AMOUNT AMOUNT PURE PREM.7/07 through 6/08 1,456,876 0 0 0 0 0 3,781 3,781 0.267/08 through 6/09 3,185,439 0 0 0 0 0 1,239 1,239 0.047/09 through 6/10 3,903,083 1 3,744 8 46,624 3,660 95,917 149,945 3.847/10 through 6/11 7,177,911 1 13,817 10 38,179 2,993 197,848 252,837 3.527/11 through 6/12 340,997 0 0 0 0 0 253 253 0.07
5 YR. TOTAL 16,064,306 2 17,561 18 84,803 6,653 299,038 408,055 2.54INDEMNITY MEDICAL TOTAL
CRED. PURE PREM.* CRED. PURE PREM.* PURE PREM.*Indicated Pure Premium 13% 0.637 18% 1.903 2.54Pure Premium Indicated by National Relativity 43% 0.721 41% 1.186 1.91Pure Premium Present on Rate Level 44% 0.634 41% 1.018 1.65Pure Premium Derived by Formula 0.672 1.246 1.92
Page 70
* Pure Premium per $100 of Payroll** Pure Premium per employee++ Non-Standard Calculation© Copyright 2014 National Council on Compensation Insurance, Inc. All Rights Reserved.

MISSOURI
EFFECTIVE 1/1/2015CLASS AIRPLANE MFG
3830
Industry Group: Manufacturing CONVERTED LOSSESHazard Group: D INDEMNITY LIKELY INDEMNITY NOT-LIKELY MED LIKELY MED NOT-LIKELY TOTAL TOTAL
POLICY PERIOD PAYROLL CASES AMOUNT CASES AMOUNT AMOUNT AMOUNT AMOUNT PURE PREM.7/07 through 6/08 897,769,962 80 2,041,071 43 593,745 2,115,585 690,823 5,441,224 0.617/08 through 6/09 870,319,611 91 2,084,284 34 695,042 2,165,885 1,109,722 6,054,933 0.707/09 through 6/10 936,607,706 27 684,445 90 1,732,296 696,788 1,949,923 5,063,452 0.547/10 through 6/11 938,540,359 25 722,102 94 1,981,877 620,136 2,424,317 5,748,432 0.617/11 through 6/12 936,593,046 22 819,867 74 2,138,446 527,713 1,874,703 5,360,729 0.57
5 YR. TOTAL 4,579,830,684 245 6,351,769 335 7,141,406 6,126,107 8,049,488 27,668,770 0.61INDEMNITY MEDICAL TOTAL
CRED. PURE PREM.* CRED. PURE PREM.* PURE PREM.*Indicated Pure Premium 93% 0.295 100% 0.310 0.61Pure Premium Indicated by National Relativity 3% 0.458 0% 0.728 1.19Pure Premium Present on Rate Level 4% 0.308 0% 0.327 0.64Pure Premium Derived by Formula 0.300 0.310 0.61
CLASS MOTORCYCLE MFG OR ASSEMBLY
3851
Industry Group: Manufacturing CONVERTED LOSSESHazard Group: B INDEMNITY LIKELY INDEMNITY NOT-LIKELY MED LIKELY MED NOT-LIKELY TOTAL TOTAL
POLICY PERIOD PAYROLL CASES AMOUNT CASES AMOUNT AMOUNT AMOUNT AMOUNT PURE PREM.7/07 through 6/08 41,723,741 15 487,241 44 668,441 659,109 1,184,003 2,998,794 7.197/08 through 6/09 29,696,387 9 419,092 29 590,921 474,556 1,194,313 2,678,882 9.027/09 through 6/10 39,350,420 7 315,323 40 852,094 278,696 1,144,237 2,590,350 6.587/10 through 6/11 39,580,935 7 222,870 43 1,261,432 202,492 1,422,464 3,109,258 7.867/11 through 6/12 29,326,161 3 91,959 22 821,138 32,235 728,591 1,673,923 5.71
5 YR. TOTAL 179,677,644 41 1,536,485 178 4,194,026 1,647,088 5,673,608 13,051,207 7.26INDEMNITY MEDICAL TOTAL
CRED. PURE PREM.* CRED. PURE PREM.* PURE PREM.*Indicated Pure Premium 58% 3.189 78% 4.074 7.26Pure Premium Indicated by National Relativity 21% 0.645 11% 1.103 1.75Pure Premium Present on Rate Level 21% 2.400 11% 3.786 6.19Pure Premium Derived by Formula 2.489 3.716 6.21
CLASS BABY CARRIAGE MFG
3865
Industry Group: Manufacturing CONVERTED LOSSESHazard Group: A INDEMNITY LIKELY INDEMNITY NOT-LIKELY MED LIKELY MED NOT-LIKELY TOTAL TOTAL
POLICY PERIOD PAYROLL CASES AMOUNT CASES AMOUNT AMOUNT AMOUNT AMOUNT PURE PREM.7/07 through 6/08 169,408 0 0 0 0 0 0 0 0.007/08 through 6/09 629,890 0 0 0 0 0 0 0 0.007/09 through 6/10 930,360 0 0 0 0 0 0 0 0.007/10 through 6/11 677,720 0 0 0 0 0 2,015 2,015 0.307/11 through 6/12 1,601,722 0 0 0 0 0 5,409 5,409 0.34
5 YR. TOTAL 4,009,100 0 0 0 0 0 7,424 7,424 0.19INDEMNITY MEDICAL TOTAL
CRED. PURE PREM.* CRED. PURE PREM.* PURE PREM.*Indicated Pure Premium 7% 0.000 9% 0.185 0.19Pure Premium Indicated by National Relativity 24% 0.292 26% 1.136 1.43Pure Premium Present on Rate Level 69% 0.570 65% 0.857 1.43Pure Premium Derived by Formula 0.463 0.869 1.33
Page 71
* Pure Premium per $100 of Payroll** Pure Premium per employee++ Non-Standard Calculation© Copyright 2014 National Council on Compensation Insurance, Inc. All Rights Reserved.

MISSOURI
EFFECTIVE 1/1/2015CLASS CAR MFG-RAILROAD-& DRIVERS
3881
Industry Group: Manufacturing CONVERTED LOSSESHazard Group: C INDEMNITY LIKELY INDEMNITY NOT-LIKELY MED LIKELY MED NOT-LIKELY TOTAL TOTAL
POLICY PERIOD PAYROLL CASES AMOUNT CASES AMOUNT AMOUNT AMOUNT AMOUNT PURE PREM.7/07 through 6/08 21,378,891 5 139,051 16 235,629 248,801 292,170 915,651 4.287/08 through 6/09 16,376,280 5 97,772 12 192,974 95,954 268,965 655,665 4.007/09 through 6/10 9,687,505 2 58,395 4 23,582 68,292 53,932 204,201 2.117/10 through 6/11 13,963,582 0 0 10 188,468 0 392,160 580,628 4.167/11 through 6/12 17,435,942 4 275,690 11 140,618 350,459 210,729 977,496 5.61
5 YR. TOTAL 78,842,200 16 570,908 53 781,271 763,506 1,217,956 3,333,641 4.23INDEMNITY MEDICAL TOTAL
CRED. PURE PREM.* CRED. PURE PREM.* PURE PREM.*Indicated Pure Premium 35% 1.715 46% 2.513 4.23Pure Premium Indicated by National Relativity 32% 1.730 27% 2.222 3.95Pure Premium Present on Rate Level 33% 1.562 27% 2.265 3.83Pure Premium Derived by Formula 1.669 2.367 4.04
CLASS SAND OR GRAVEL DIGGING & DRIVERS
4000
Industry Group: Miscellaneous CONVERTED LOSSESHazard Group: F INDEMNITY LIKELY INDEMNITY NOT-LIKELY MED LIKELY MED NOT-LIKELY TOTAL TOTAL
POLICY PERIOD PAYROLL CASES AMOUNT CASES AMOUNT AMOUNT AMOUNT AMOUNT PURE PREM.7/07 through 6/08 11,369,206 1 194,782 7 126,416 301,359 114,064 736,621 6.487/08 through 6/09 7,778,285 0 0 2 21,628 0 47,177 68,805 0.897/09 through 6/10 9,437,939 1 184,514 3 29,641 340,301 205,632 760,088 8.057/10 through 6/11 10,586,246 0 0 6 88,781 0 128,435 217,216 2.057/11 through 6/12 9,502,663 0 0 4 51,750 0 206,591 258,341 2.72
5 YR. TOTAL 48,674,339 2 379,296 22 318,216 641,660 701,899 2,041,071 4.19INDEMNITY MEDICAL TOTAL
CRED. PURE PREM.* CRED. PURE PREM.* PURE PREM.*Indicated Pure Premium 31% 1.433 40% 2.760 4.19Pure Premium Indicated by National Relativity 34% 2.099 30% 2.979 5.08Pure Premium Present on Rate Level 35% 1.901 30% 2.666 4.57Pure Premium Derived by Formula 1.823 2.798 4.62
CLASS REFRACTORY PRODUCTS MFG-ALL EMPLOYEES & DRIVERS
4018
Industry Group: Manufacturing CONVERTED LOSSESHazard Group: E INDEMNITY LIKELY INDEMNITY NOT-LIKELY MED LIKELY MED NOT-LIKELY TOTAL TOTAL
POLICY PERIOD PAYROLL CASES AMOUNT CASES AMOUNT AMOUNT AMOUNT AMOUNT PURE PREM.7/07 through 6/08 18,507,631 1 17,314 12 124,726 9,276 200,924 352,240 1.907/08 through 6/09 12,289,357 1 24,239 10 157,245 18,289 152,781 352,554 2.877/09 through 6/10 11,760,629 3 116,259 12 143,688 170,777 260,751 691,475 5.887/10 through 6/11 14,695,850 3 105,324 14 176,595 77,442 257,606 616,967 4.207/11 through 6/12 14,597,446 0 0 15 350,434 0 405,995 756,429 5.18
5 YR. TOTAL 71,850,913 8 263,136 63 952,688 275,784 1,278,057 2,769,665 3.86INDEMNITY MEDICAL TOTAL
CRED. PURE PREM.* CRED. PURE PREM.* PURE PREM.*Indicated Pure Premium 35% 1.692 41% 2.163 3.86Pure Premium Indicated by National Relativity 0% 0.000 0% 0.000 0.00Pure Premium Present on Rate Level 65% 1.770 59% 1.908 3.68Pure Premium Derived by Formula 1.743 2.013 3.76
Page 72
* Pure Premium per $100 of Payroll** Pure Premium per employee++ Non-Standard Calculation© Copyright 2014 National Council on Compensation Insurance, Inc. All Rights Reserved.

MISSOURI
EFFECTIVE 1/1/2015CLASS BRICK OR CLAY PRODUCTS MFG. NOC & DRIVERS
4021
Industry Group: Manufacturing CONVERTED LOSSESHazard Group: E INDEMNITY LIKELY INDEMNITY NOT-LIKELY MED LIKELY MED NOT-LIKELY TOTAL TOTAL
POLICY PERIOD PAYROLL CASES AMOUNT CASES AMOUNT AMOUNT AMOUNT AMOUNT PURE PREM.7/07 through 6/08 1,129,854 0 0 5 21,670 0 34,867 56,537 5.007/08 through 6/09 914,077 0 0 4 8,361 0 15,720 24,081 2.647/09 through 6/10 2,036,755 1 39,700 0 0 30,503 700 70,903 3.487/10 through 6/11 2,043,672 1 134,169 4 34,543 209,061 50,139 427,912 20.947/11 through 6/12 1,923,307 0 0 2 12,336 0 46,175 58,511 3.04
5 YR. TOTAL 8,047,665 2 173,869 15 76,910 239,564 147,601 637,944 7.93INDEMNITY MEDICAL TOTAL
CRED. PURE PREM.* CRED. PURE PREM.* PURE PREM.*Indicated Pure Premium 15% 3.116 19% 4.811 7.93Pure Premium Indicated by National Relativity 42% 1.567 40% 2.116 3.68Pure Premium Present on Rate Level 43% 1.875 41% 2.477 4.35Pure Premium Derived by Formula 1.932 2.776 4.71
CLASS CONCRETE PRODUCTS MFG & DRIVERS
4034
Industry Group: Manufacturing CONVERTED LOSSESHazard Group: E INDEMNITY LIKELY INDEMNITY NOT-LIKELY MED LIKELY MED NOT-LIKELY TOTAL TOTAL
POLICY PERIOD PAYROLL CASES AMOUNT CASES AMOUNT AMOUNT AMOUNT AMOUNT PURE PREM.7/07 through 6/08 38,382,279 9 342,250 45 821,282 469,619 1,351,101 2,984,252 7.787/08 through 6/09 31,079,719 3 77,142 27 451,465 244,333 790,609 1,563,549 5.037/09 through 6/10 29,499,684 1 28,976 21 296,509 0 531,019 856,504 2.907/10 through 6/11 29,507,418 4 138,339 25 385,852 86,654 552,782 1,163,627 3.947/11 through 6/12 28,364,818 6 539,424 27 677,336 758,628 1,279,555 3,254,943 11.48
5 YR. TOTAL 156,833,918 23 1,126,131 145 2,632,444 1,559,234 4,505,066 9,822,875 6.26INDEMNITY MEDICAL TOTAL
CRED. PURE PREM.* CRED. PURE PREM.* PURE PREM.*Indicated Pure Premium 51% 2.397 68% 3.867 6.26Pure Premium Indicated by National Relativity 24% 2.136 16% 3.296 5.43Pure Premium Present on Rate Level 25% 2.028 16% 3.064 5.09Pure Premium Derived by Formula 2.242 3.647 5.89
CLASS PLASTER BOARD OR PLASTER BLOCK MFG & DRIVERS
4036
Industry Group: Manufacturing CONVERTED LOSSESHazard Group: E INDEMNITY LIKELY INDEMNITY NOT-LIKELY MED LIKELY MED NOT-LIKELY TOTAL TOTAL
POLICY PERIOD PAYROLL CASES AMOUNT CASES AMOUNT AMOUNT AMOUNT AMOUNT PURE PREM.7/07 through 6/08 5,169,513 0 0 2 1,509 0 8,638 10,147 0.207/08 through 6/09 3,479,843 0 0 2 15,325 0 37,372 52,697 1.517/09 through 6/10 5,286,113 0 0 1 163 0 18,089 18,252 0.357/10 through 6/11 5,024,188 0 0 1 3,820 0 15,951 19,771 0.397/11 through 6/12 6,088,353 1 22,511 3 50,179 0 167,628 240,318 3.95
5 YR. TOTAL 25,048,010 1 22,511 9 70,996 0 247,678 341,185 1.36INDEMNITY MEDICAL TOTAL
CRED. PURE PREM.* CRED. PURE PREM.* PURE PREM.*Indicated Pure Premium 16% 0.373 21% 0.989 1.36Pure Premium Indicated by National Relativity 42% 0.694 39% 1.016 1.71Pure Premium Present on Rate Level 42% 0.665 40% 0.979 1.64Pure Premium Derived by Formula 0.630 0.996 1.63
Page 73
* Pure Premium per $100 of Payroll** Pure Premium per employee++ Non-Standard Calculation© Copyright 2014 National Council on Compensation Insurance, Inc. All Rights Reserved.
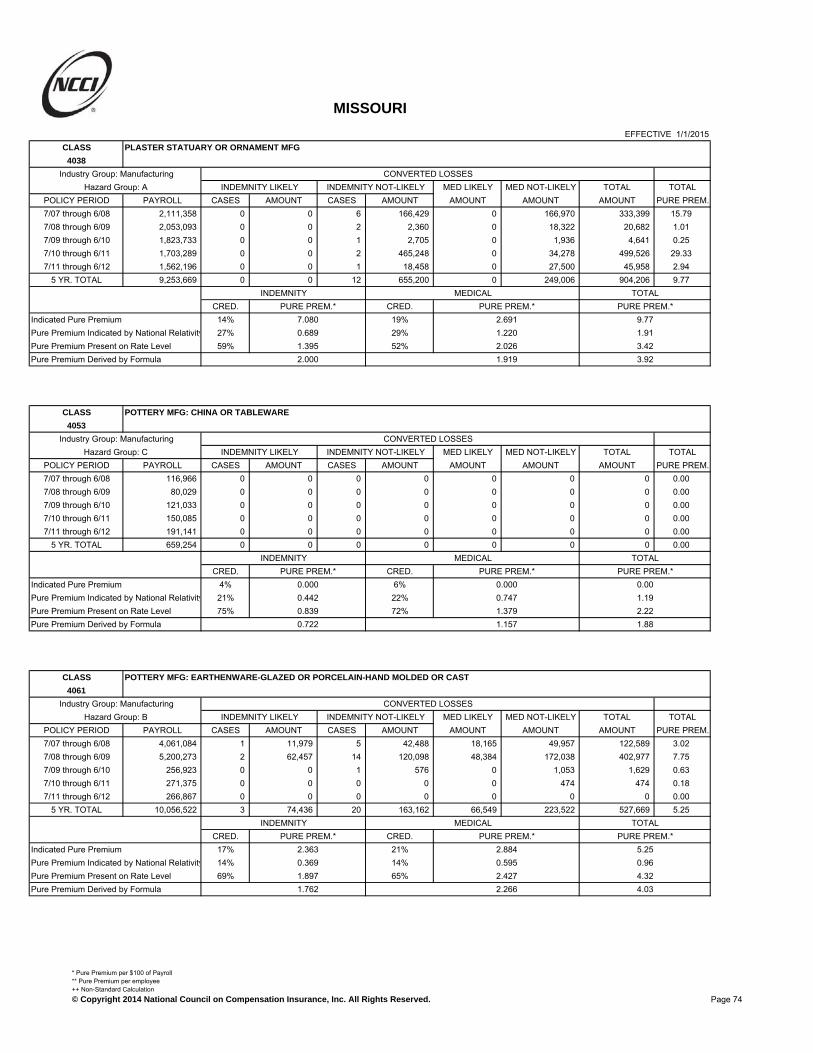
MISSOURI
EFFECTIVE 1/1/2015CLASS PLASTER STATUARY OR ORNAMENT MFG
4038
Industry Group: Manufacturing CONVERTED LOSSESHazard Group: A INDEMNITY LIKELY INDEMNITY NOT-LIKELY MED LIKELY MED NOT-LIKELY TOTAL TOTAL
POLICY PERIOD PAYROLL CASES AMOUNT CASES AMOUNT AMOUNT AMOUNT AMOUNT PURE PREM.7/07 through 6/08 2,111,358 0 0 6 166,429 0 166,970 333,399 15.797/08 through 6/09 2,053,093 0 0 2 2,360 0 18,322 20,682 1.017/09 through 6/10 1,823,733 0 0 1 2,705 0 1,936 4,641 0.257/10 through 6/11 1,703,289 0 0 2 465,248 0 34,278 499,526 29.337/11 through 6/12 1,562,196 0 0 1 18,458 0 27,500 45,958 2.94
5 YR. TOTAL 9,253,669 0 0 12 655,200 0 249,006 904,206 9.77INDEMNITY MEDICAL TOTAL
CRED. PURE PREM.* CRED. PURE PREM.* PURE PREM.*Indicated Pure Premium 14% 7.080 19% 2.691 9.77Pure Premium Indicated by National Relativity 27% 0.689 29% 1.220 1.91Pure Premium Present on Rate Level 59% 1.395 52% 2.026 3.42Pure Premium Derived by Formula 2.000 1.919 3.92
CLASS POTTERY MFG: CHINA OR TABLEWARE
4053
Industry Group: Manufacturing CONVERTED LOSSESHazard Group: C INDEMNITY LIKELY INDEMNITY NOT-LIKELY MED LIKELY MED NOT-LIKELY TOTAL TOTAL
POLICY PERIOD PAYROLL CASES AMOUNT CASES AMOUNT AMOUNT AMOUNT AMOUNT PURE PREM.7/07 through 6/08 116,966 0 0 0 0 0 0 0 0.007/08 through 6/09 80,029 0 0 0 0 0 0 0 0.007/09 through 6/10 121,033 0 0 0 0 0 0 0 0.007/10 through 6/11 150,085 0 0 0 0 0 0 0 0.007/11 through 6/12 191,141 0 0 0 0 0 0 0 0.00
5 YR. TOTAL 659,254 0 0 0 0 0 0 0 0.00INDEMNITY MEDICAL TOTAL
CRED. PURE PREM.* CRED. PURE PREM.* PURE PREM.*Indicated Pure Premium 4% 0.000 6% 0.000 0.00Pure Premium Indicated by National Relativity 21% 0.442 22% 0.747 1.19Pure Premium Present on Rate Level 75% 0.839 72% 1.379 2.22Pure Premium Derived by Formula 0.722 1.157 1.88
CLASS POTTERY MFG: EARTHENWARE-GLAZED OR PORCELAIN-HAND MOLDED OR CAST
4061
Industry Group: Manufacturing CONVERTED LOSSESHazard Group: B INDEMNITY LIKELY INDEMNITY NOT-LIKELY MED LIKELY MED NOT-LIKELY TOTAL TOTAL
POLICY PERIOD PAYROLL CASES AMOUNT CASES AMOUNT AMOUNT AMOUNT AMOUNT PURE PREM.7/07 through 6/08 4,061,084 1 11,979 5 42,488 18,165 49,957 122,589 3.027/08 through 6/09 5,200,273 2 62,457 14 120,098 48,384 172,038 402,977 7.757/09 through 6/10 256,923 0 0 1 576 0 1,053 1,629 0.637/10 through 6/11 271,375 0 0 0 0 0 474 474 0.187/11 through 6/12 266,867 0 0 0 0 0 0 0 0.00
5 YR. TOTAL 10,056,522 3 74,436 20 163,162 66,549 223,522 527,669 5.25INDEMNITY MEDICAL TOTAL
CRED. PURE PREM.* CRED. PURE PREM.* PURE PREM.*Indicated Pure Premium 17% 2.363 21% 2.884 5.25Pure Premium Indicated by National Relativity 14% 0.369 14% 0.595 0.96Pure Premium Present on Rate Level 69% 1.897 65% 2.427 4.32Pure Premium Derived by Formula 1.762 2.266 4.03
Page 74
* Pure Premium per $100 of Payroll** Pure Premium per employee++ Non-Standard Calculation© Copyright 2014 National Council on Compensation Insurance, Inc. All Rights Reserved.

MISSOURI
EFFECTIVE 1/1/2015CLASS POTTERY MFG: PORCELAIN WARE-MECHANICAL PRESS FORMING
4062
Industry Group: Manufacturing CONVERTED LOSSESHazard Group: C INDEMNITY LIKELY INDEMNITY NOT-LIKELY MED LIKELY MED NOT-LIKELY TOTAL TOTAL
POLICY PERIOD PAYROLL CASES AMOUNT CASES AMOUNT AMOUNT AMOUNT AMOUNT PURE PREM.7/07 through 6/08 1,304,380 0 0 0 0 0 1,300 1,300 0.107/08 through 6/09 588,544 0 0 0 0 0 1,736 1,736 0.307/09 through 6/10 786,325 0 0 0 0 0 2,908 2,908 0.377/10 through 6/11 972,772 0 0 0 0 0 0 0 0.007/11 through 6/12 1,020,459 0 0 0 0 0 0 0 0.00
5 YR. TOTAL 4,672,480 0 0 0 0 0 5,944 5,944 0.13INDEMNITY MEDICAL TOTAL
CRED. PURE PREM.* CRED. PURE PREM.* PURE PREM.*Indicated Pure Premium 8% 0.000 11% 0.127 0.13Pure Premium Indicated by National Relativity 46% 0.616 44% 1.079 1.70Pure Premium Present on Rate Level 46% 0.600 45% 1.070 1.67Pure Premium Derived by Formula 0.559 0.970 1.53
CLASS GLASS MFG-& DRIVERS
4101
Industry Group: Manufacturing CONVERTED LOSSESHazard Group: D INDEMNITY LIKELY INDEMNITY NOT-LIKELY MED LIKELY MED NOT-LIKELY TOTAL TOTAL
POLICY PERIOD PAYROLL CASES AMOUNT CASES AMOUNT AMOUNT AMOUNT AMOUNT PURE PREM.7/07 through 6/08 3,560,775 0 0 3 28,317 0 138,264 166,581 4.687/08 through 6/09 2,901,098 2 46,593 2 6,428 16,517 21,648 91,186 3.147/09 through 6/10 1,622,887 0 0 0 0 0 3,528 3,528 0.227/10 through 6/11 3,618,224 0 0 6 70,324 0 90,649 160,973 4.457/11 through 6/12 4,410,992 0 0 1 8,804 0 73,150 81,954 1.86
5 YR. TOTAL 16,113,976 2 46,593 12 113,873 16,517 327,239 504,222 3.13INDEMNITY MEDICAL TOTAL
CRED. PURE PREM.* CRED. PURE PREM.* PURE PREM.*Indicated Pure Premium 15% 0.996 21% 2.133 3.13Pure Premium Indicated by National Relativity 42% 1.005 39% 1.599 2.60Pure Premium Present on Rate Level 43% 0.978 40% 1.628 2.61Pure Premium Derived by Formula 0.992 1.723 2.72
CLASS INTEGRATED CIRCUIT MFG.
4109
Industry Group: Manufacturing CONVERTED LOSSESHazard Group: B INDEMNITY LIKELY INDEMNITY NOT-LIKELY MED LIKELY MED NOT-LIKELY TOTAL TOTAL
POLICY PERIOD PAYROLL CASES AMOUNT CASES AMOUNT AMOUNT AMOUNT AMOUNT PURE PREM.7/07 through 6/08 0 0 0 0 0 0 0 0 0.007/08 through 6/09 0 0 0 0 0 0 0 0 0.007/09 through 6/10 0 0 0 0 0 0 0 0 0.007/10 through 6/11 9,037,693 0 0 2 30,974 0 60,123 91,097 1.017/11 through 6/12 537,766 0 0 0 0 0 0 0 0.00
5 YR. TOTAL 9,575,459 0 0 2 30,974 0 60,123 91,097 0.95INDEMNITY MEDICAL TOTAL
CRED. PURE PREM.* CRED. PURE PREM.* PURE PREM.*Indicated Pure Premium 9% 0.323 12% 0.628 0.95Pure Premium Indicated by National Relativity 0% 0.000 0% 0.010 0.01Pure Premium Present on Rate Level 91% 0.445 88% 0.660 1.11Pure Premium Derived by Formula 0.434 0.656 1.09
Page 75
* Pure Premium per $100 of Payroll** Pure Premium per employee++ Non-Standard Calculation© Copyright 2014 National Council on Compensation Insurance, Inc. All Rights Reserved.

MISSOURI
EFFECTIVE 1/1/2015CLASS ELECTRIC BULB MFG
4110
Industry Group: Manufacturing CONVERTED LOSSESHazard Group: C INDEMNITY LIKELY INDEMNITY NOT-LIKELY MED LIKELY MED NOT-LIKELY TOTAL TOTAL
POLICY PERIOD PAYROLL CASES AMOUNT CASES AMOUNT AMOUNT AMOUNT AMOUNT PURE PREM.7/07 through 6/08 0 0 0 0 0 0 0 0 0.007/08 through 6/09 0 0 0 0 0 0 0 0 0.007/09 through 6/10 0 0 0 0 0 0 0 0 0.007/10 through 6/11 441,934 0 0 0 0 0 0 0 0.007/11 through 6/12 13,507,334 1 27,120 6 135,969 12,563 182,704 358,356 2.65
5 YR. TOTAL 13,949,268 1 27,120 6 135,969 12,563 182,704 358,356 2.57INDEMNITY MEDICAL TOTAL
CRED. PURE PREM.* CRED. PURE PREM.* PURE PREM.*Indicated Pure Premium 18% 1.169 17% 1.400 2.57Pure Premium Indicated by National Relativity 6% 0.050 6% 0.269 0.32Pure Premium Present on Rate Level 76% 1.691 77% 1.137 2.83Pure Premium Derived by Formula 1.499 1.130 2.63
CLASS GLASSWARE MFG-NO AUTOMATIC BLOWING MACHINES
4111
Industry Group: Manufacturing CONVERTED LOSSESHazard Group: B INDEMNITY LIKELY INDEMNITY NOT-LIKELY MED LIKELY MED NOT-LIKELY TOTAL TOTAL
POLICY PERIOD PAYROLL CASES AMOUNT CASES AMOUNT AMOUNT AMOUNT AMOUNT PURE PREM.7/07 through 6/08 8,642,661 0 0 9 90,561 0 279,221 369,782 4.287/08 through 6/09 7,393,843 1 58,722 9 102,561 84,642 228,731 474,656 6.427/09 through 6/10 8,106,238 0 0 10 173,431 0 348,292 521,723 6.447/10 through 6/11 8,989,085 0 0 5 63,162 0 144,907 208,069 2.327/11 through 6/12 9,531,439 0 0 2 18,403 0 47,994 66,397 0.70
5 YR. TOTAL 42,663,266 1 58,722 35 448,118 84,642 1,049,145 1,640,627 3.85INDEMNITY MEDICAL TOTAL
CRED. PURE PREM.* CRED. PURE PREM.* PURE PREM.*Indicated Pure Premium 24% 1.188 34% 2.658 3.85Pure Premium Indicated by National Relativity 34% 0.572 33% 0.763 1.34Pure Premium Present on Rate Level 42% 1.148 33% 1.994 3.14Pure Premium Derived by Formula 0.962 1.814 2.78
CLASS INCANDESCENT LAMP MFG
4112 + +
Industry Group: Manufacturing CONVERTED LOSSESHazard Group: C INDEMNITY LIKELY INDEMNITY NOT-LIKELY MED LIKELY MED NOT-LIKELY TOTAL TOTAL
POLICY PERIOD PAYROLL CASES AMOUNT CASES AMOUNT AMOUNT AMOUNT AMOUNT PURE PREM.7/07 through 6/08 582,017 0 0 0 0 0 0 0 0.007/08 through 6/09 1,117,779 0 0 0 0 0 0 0 0.007/09 through 6/10 1,094,969 0 0 0 0 0 0 0 0.007/10 through 6/11 0 0 0 0 0 0 0 0 0.007/11 through 6/12 0 0 0 0 0 0 0 0 0.00
5 YR. TOTAL 2,794,765 0 0 0 0 0 0 0 0.00INDEMNITY MEDICAL TOTAL
CRED. PURE PREM.* CRED. PURE PREM.* PURE PREM.*Indicated Pure Premium 9% 0.000 9% 0.000 0.00Pure Premium Indicated by National Relativity 45% 0.317 45% 0.450 0.77Pure Premium Present on Rate Level 46% 1.691 46% 1.137 2.83Pure Premium Derived by Formula 0.921 0.726 1.65
Page 76
* Pure Premium per $100 of Payroll** Pure Premium per employee++ Non-Standard Calculation© Copyright 2014 National Council on Compensation Insurance, Inc. All Rights Reserved.
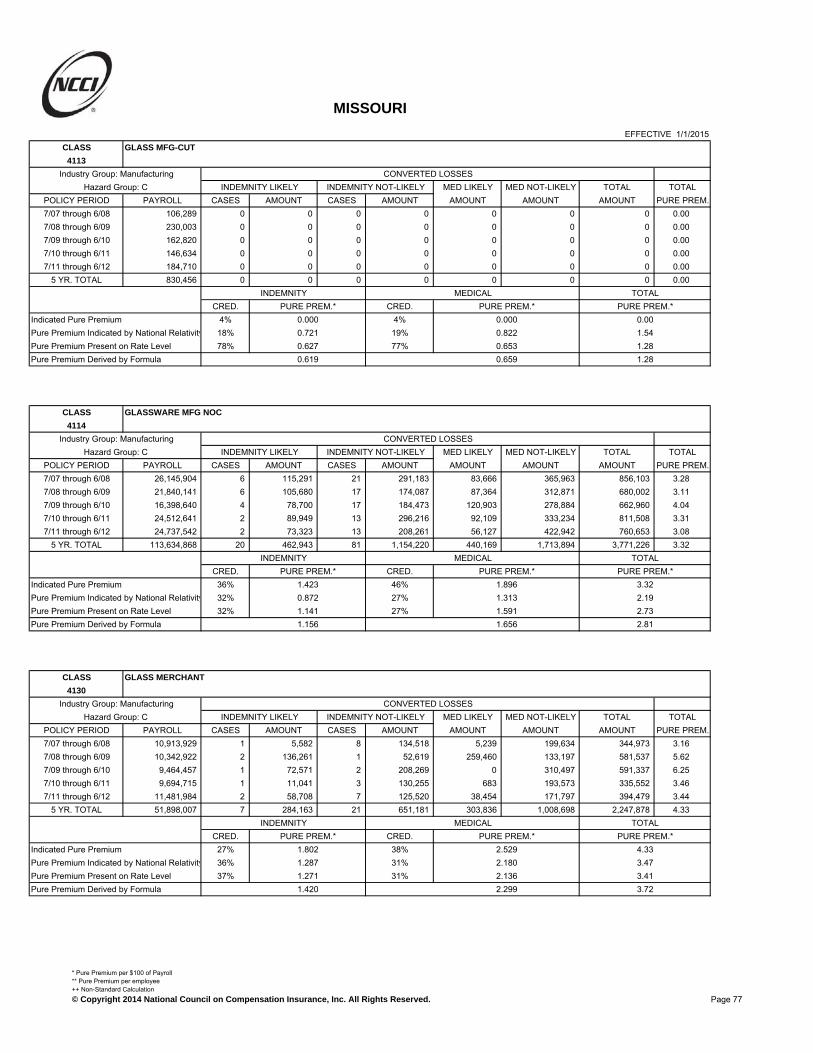
MISSOURI
EFFECTIVE 1/1/2015CLASS GLASS MFG-CUT
4113
Industry Group: Manufacturing CONVERTED LOSSESHazard Group: C INDEMNITY LIKELY INDEMNITY NOT-LIKELY MED LIKELY MED NOT-LIKELY TOTAL TOTAL
POLICY PERIOD PAYROLL CASES AMOUNT CASES AMOUNT AMOUNT AMOUNT AMOUNT PURE PREM.7/07 through 6/08 106,289 0 0 0 0 0 0 0 0.007/08 through 6/09 230,003 0 0 0 0 0 0 0 0.007/09 through 6/10 162,820 0 0 0 0 0 0 0 0.007/10 through 6/11 146,634 0 0 0 0 0 0 0 0.007/11 through 6/12 184,710 0 0 0 0 0 0 0 0.00
5 YR. TOTAL 830,456 0 0 0 0 0 0 0 0.00INDEMNITY MEDICAL TOTAL
CRED. PURE PREM.* CRED. PURE PREM.* PURE PREM.*Indicated Pure Premium 4% 0.000 4% 0.000 0.00Pure Premium Indicated by National Relativity 18% 0.721 19% 0.822 1.54Pure Premium Present on Rate Level 78% 0.627 77% 0.653 1.28Pure Premium Derived by Formula 0.619 0.659 1.28
CLASS GLASSWARE MFG NOC
4114
Industry Group: Manufacturing CONVERTED LOSSESHazard Group: C INDEMNITY LIKELY INDEMNITY NOT-LIKELY MED LIKELY MED NOT-LIKELY TOTAL TOTAL
POLICY PERIOD PAYROLL CASES AMOUNT CASES AMOUNT AMOUNT AMOUNT AMOUNT PURE PREM.7/07 through 6/08 26,145,904 6 115,291 21 291,183 83,666 365,963 856,103 3.287/08 through 6/09 21,840,141 6 105,680 17 174,087 87,364 312,871 680,002 3.117/09 through 6/10 16,398,640 4 78,700 17 184,473 120,903 278,884 662,960 4.047/10 through 6/11 24,512,641 2 89,949 13 296,216 92,109 333,234 811,508 3.317/11 through 6/12 24,737,542 2 73,323 13 208,261 56,127 422,942 760,653 3.08
5 YR. TOTAL 113,634,868 20 462,943 81 1,154,220 440,169 1,713,894 3,771,226 3.32INDEMNITY MEDICAL TOTAL
CRED. PURE PREM.* CRED. PURE PREM.* PURE PREM.*Indicated Pure Premium 36% 1.423 46% 1.896 3.32Pure Premium Indicated by National Relativity 32% 0.872 27% 1.313 2.19Pure Premium Present on Rate Level 32% 1.141 27% 1.591 2.73Pure Premium Derived by Formula 1.156 1.656 2.81
CLASS GLASS MERCHANT
4130
Industry Group: Manufacturing CONVERTED LOSSESHazard Group: C INDEMNITY LIKELY INDEMNITY NOT-LIKELY MED LIKELY MED NOT-LIKELY TOTAL TOTAL
POLICY PERIOD PAYROLL CASES AMOUNT CASES AMOUNT AMOUNT AMOUNT AMOUNT PURE PREM.7/07 through 6/08 10,913,929 1 5,582 8 134,518 5,239 199,634 344,973 3.167/08 through 6/09 10,342,922 2 136,261 1 52,619 259,460 133,197 581,537 5.627/09 through 6/10 9,464,457 1 72,571 2 208,269 0 310,497 591,337 6.257/10 through 6/11 9,694,715 1 11,041 3 130,255 683 193,573 335,552 3.467/11 through 6/12 11,481,984 2 58,708 7 125,520 38,454 171,797 394,479 3.44
5 YR. TOTAL 51,898,007 7 284,163 21 651,181 303,836 1,008,698 2,247,878 4.33INDEMNITY MEDICAL TOTAL
CRED. PURE PREM.* CRED. PURE PREM.* PURE PREM.*Indicated Pure Premium 27% 1.802 38% 2.529 4.33Pure Premium Indicated by National Relativity 36% 1.287 31% 2.180 3.47Pure Premium Present on Rate Level 37% 1.271 31% 2.136 3.41Pure Premium Derived by Formula 1.420 2.299 3.72
Page 77
* Pure Premium per $100 of Payroll** Pure Premium per employee++ Non-Standard Calculation© Copyright 2014 National Council on Compensation Insurance, Inc. All Rights Reserved.

MISSOURI
EFFECTIVE 1/1/2015CLASS MIRROR MFG
4131
Industry Group: Manufacturing CONVERTED LOSSESHazard Group: B INDEMNITY LIKELY INDEMNITY NOT-LIKELY MED LIKELY MED NOT-LIKELY TOTAL TOTAL
POLICY PERIOD PAYROLL CASES AMOUNT CASES AMOUNT AMOUNT AMOUNT AMOUNT PURE PREM.7/07 through 6/08 316,461 0 0 0 0 0 0 0 0.007/08 through 6/09 238,955 0 0 0 0 0 0 0 0.007/09 through 6/10 241,174 0 0 0 0 0 0 0 0.007/10 through 6/11 211,954 0 0 0 0 0 0 0 0.007/11 through 6/12 374,510 0 0 0 0 0 0 0 0.00
5 YR. TOTAL 1,383,054 0 0 0 0 0 0 0 0.00INDEMNITY MEDICAL TOTAL
CRED. PURE PREM.* CRED. PURE PREM.* PURE PREM.*Indicated Pure Premium 6% 0.000 8% 0.000 0.00Pure Premium Indicated by National Relativity 29% 0.801 31% 1.750 2.55Pure Premium Present on Rate Level 65% 1.165 61% 1.690 2.86Pure Premium Derived by Formula 0.990 1.573 2.56
CLASS CATHEDRAL OR ART GLASS WINDOW MFG
4133
Industry Group: Manufacturing CONVERTED LOSSESHazard Group: B INDEMNITY LIKELY INDEMNITY NOT-LIKELY MED LIKELY MED NOT-LIKELY TOTAL TOTAL
POLICY PERIOD PAYROLL CASES AMOUNT CASES AMOUNT AMOUNT AMOUNT AMOUNT PURE PREM.7/07 through 6/08 755,627 0 0 0 0 0 915 915 0.127/08 through 6/09 832,997 0 0 0 0 0 129 129 0.027/09 through 6/10 687,126 0 0 1 1,578 0 10,626 12,204 1.787/10 through 6/11 703,212 0 0 0 0 0 366 366 0.057/11 through 6/12 673,168 0 0 0 0 0 1,179 1,179 0.18
5 YR. TOTAL 3,652,130 0 0 1 1,578 0 13,215 14,793 0.41INDEMNITY MEDICAL TOTAL
CRED. PURE PREM.* CRED. PURE PREM.* PURE PREM.*Indicated Pure Premium 7% 0.043 11% 0.362 0.41Pure Premium Indicated by National Relativity 20% 0.660 21% 0.917 1.58Pure Premium Present on Rate Level 73% 0.639 68% 1.246 1.89Pure Premium Derived by Formula 0.601 1.080 1.68
CLASS OPTICAL GOODS MFG. NOC
4149
Industry Group: Manufacturing CONVERTED LOSSESHazard Group: A INDEMNITY LIKELY INDEMNITY NOT-LIKELY MED LIKELY MED NOT-LIKELY TOTAL TOTAL
POLICY PERIOD PAYROLL CASES AMOUNT CASES AMOUNT AMOUNT AMOUNT AMOUNT PURE PREM.7/07 through 6/08 0 0 0 0 0 0 0 0 0.007/08 through 6/09 0 0 0 0 0 0 0 0 0.007/09 through 6/10 0 0 0 0 0 0 0 0 0.007/10 through 6/11 18,402,088 1 39,400 1 21,759 37,513 24,581 123,253 0.677/11 through 6/12 19,750,621 1 16,287 2 46,027 36,991 49,478 148,783 0.75
5 YR. TOTAL 38,152,709 2 55,687 3 67,786 74,504 74,059 272,036 0.71INDEMNITY MEDICAL TOTAL
CRED. PURE PREM.* CRED. PURE PREM.* PURE PREM.*Indicated Pure Premium 15% 0.324 19% 0.389 0.71Pure Premium Indicated by National Relativity 16% 0.083 17% 0.237 0.32Pure Premium Present on Rate Level 69% 0.374 64% 0.552 0.93Pure Premium Derived by Formula 0.320 0.467 0.79
Page 78
* Pure Premium per $100 of Payroll** Pure Premium per employee++ Non-Standard Calculation© Copyright 2014 National Council on Compensation Insurance, Inc. All Rights Reserved.

MISSOURI
EFFECTIVE 1/1/2015CLASS OPTICAL GOODS MFG NOC
4150 + +
Industry Group: Manufacturing CONVERTED LOSSESHazard Group: A INDEMNITY LIKELY INDEMNITY NOT-LIKELY MED LIKELY MED NOT-LIKELY TOTAL TOTAL
POLICY PERIOD PAYROLL CASES AMOUNT CASES AMOUNT AMOUNT AMOUNT AMOUNT PURE PREM.7/07 through 6/08 58,604,980 2 64,875 14 171,723 52,203 275,438 564,239 0.967/08 through 6/09 46,659,640 4 69,573 14 192,270 78,699 278,979 619,521 1.337/09 through 6/10 37,983,766 1 49,057 2 2,143 97,935 67,803 216,938 0.577/10 through 6/11 2,744,268 0 0 0 0 0 8,112 8,112 0.307/11 through 6/12 0 0 0 0 0 0 0 0 0.00
5 YR. TOTAL 145,992,654 7 183,505 30 366,136 228,837 630,332 1,408,810 0.97INDEMNITY MEDICAL TOTAL
CRED. PURE PREM.* CRED. PURE PREM.* PURE PREM.*Indicated Pure Premium 25% 0.376 33% 0.589 0.97Pure Premium Indicated by National Relativity 37% 0.244 33% 0.400 0.64Pure Premium Present on Rate Level 38% 0.374 34% 0.552 0.93Pure Premium Derived by Formula 0.326 0.514 0.84
CLASS PULP MFG-GROUND WOOD PROCESS
4206
Industry Group: Manufacturing CONVERTED LOSSESHazard Group: C INDEMNITY LIKELY INDEMNITY NOT-LIKELY MED LIKELY MED NOT-LIKELY TOTAL TOTAL
POLICY PERIOD PAYROLL CASES AMOUNT CASES AMOUNT AMOUNT AMOUNT AMOUNT PURE PREM.7/07 through 6/08 7,972 0 0 0 0 0 0 0 0.007/08 through 6/09 153,380 0 0 0 0 0 0 0 0.007/09 through 6/10 241,332 0 0 0 0 0 0 0 0.007/10 through 6/11 18,731 0 0 0 0 0 0 0 0.007/11 through 6/12 444,258 0 0 0 0 0 0 0 0.00
5 YR. TOTAL 865,673 0 0 0 0 0 0 0 0.00INDEMNITY MEDICAL TOTAL
CRED. PURE PREM.* CRED. PURE PREM.* PURE PREM.*Indicated Pure Premium 5% 0.000 7% 0.000 0.00Pure Premium Indicated by National Relativity 32% 0.998 34% 1.931 2.93Pure Premium Present on Rate Level 63% 1.128 59% 1.623 2.75Pure Premium Derived by Formula 1.030 1.614 2.64
CLASS PULP MFG-CHEMICAL PROCESS
4207
Industry Group: Manufacturing CONVERTED LOSSESHazard Group: E INDEMNITY LIKELY INDEMNITY NOT-LIKELY MED LIKELY MED NOT-LIKELY TOTAL TOTAL
POLICY PERIOD PAYROLL CASES AMOUNT CASES AMOUNT AMOUNT AMOUNT AMOUNT PURE PREM.7/07 through 6/08 0 0 0 0 0 0 0 0 0.007/08 through 6/09 0 0 0 0 0 0 0 0 0.007/09 through 6/10 0 0 0 0 0 0 0 0 0.007/10 through 6/11 0 0 0 0 0 0 0 0 0.007/11 through 6/12 0 0 0 0 0 0 0 0 0.00
5 YR. TOTAL 0 0 0 0 0 0 0 0 0.00INDEMNITY MEDICAL TOTAL
CRED. PURE PREM.* CRED. PURE PREM.* PURE PREM.*Indicated Pure Premium 0% 0.000 0% 0.000 0.00Pure Premium Indicated by National Relativity 45% 0.715 48% 0.753 1.47Pure Premium Present on Rate Level 55% 0.563 52% 0.621 1.18Pure Premium Derived by Formula 0.631 0.684 1.32
Page 79
* Pure Premium per $100 of Payroll** Pure Premium per employee++ Non-Standard Calculation© Copyright 2014 National Council on Compensation Insurance, Inc. All Rights Reserved.
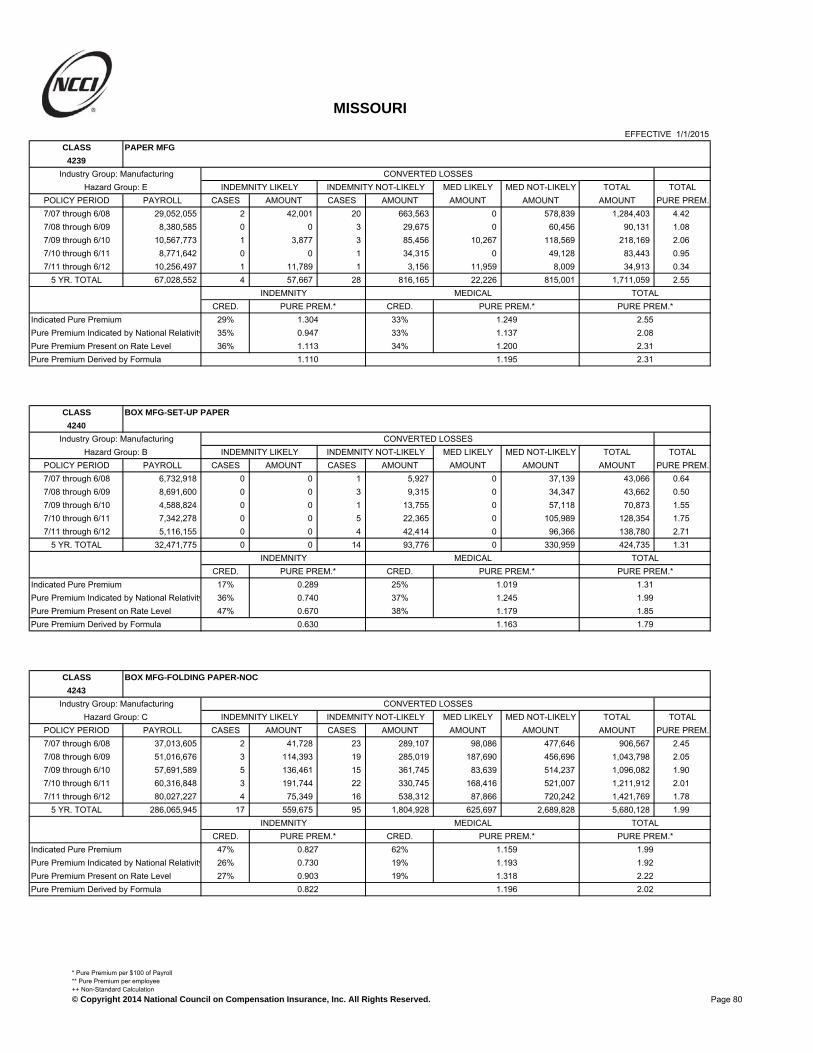
MISSOURI
EFFECTIVE 1/1/2015CLASS PAPER MFG
4239
Industry Group: Manufacturing CONVERTED LOSSESHazard Group: E INDEMNITY LIKELY INDEMNITY NOT-LIKELY MED LIKELY MED NOT-LIKELY TOTAL TOTAL
POLICY PERIOD PAYROLL CASES AMOUNT CASES AMOUNT AMOUNT AMOUNT AMOUNT PURE PREM.7/07 through 6/08 29,052,055 2 42,001 20 663,563 0 578,839 1,284,403 4.427/08 through 6/09 8,380,585 0 0 3 29,675 0 60,456 90,131 1.087/09 through 6/10 10,567,773 1 3,877 3 85,456 10,267 118,569 218,169 2.067/10 through 6/11 8,771,642 0 0 1 34,315 0 49,128 83,443 0.957/11 through 6/12 10,256,497 1 11,789 1 3,156 11,959 8,009 34,913 0.34
5 YR. TOTAL 67,028,552 4 57,667 28 816,165 22,226 815,001 1,711,059 2.55INDEMNITY MEDICAL TOTAL
CRED. PURE PREM.* CRED. PURE PREM.* PURE PREM.*Indicated Pure Premium 29% 1.304 33% 1.249 2.55Pure Premium Indicated by National Relativity 35% 0.947 33% 1.137 2.08Pure Premium Present on Rate Level 36% 1.113 34% 1.200 2.31Pure Premium Derived by Formula 1.110 1.195 2.31
CLASS BOX MFG-SET-UP PAPER
4240
Industry Group: Manufacturing CONVERTED LOSSESHazard Group: B INDEMNITY LIKELY INDEMNITY NOT-LIKELY MED LIKELY MED NOT-LIKELY TOTAL TOTAL
POLICY PERIOD PAYROLL CASES AMOUNT CASES AMOUNT AMOUNT AMOUNT AMOUNT PURE PREM.7/07 through 6/08 6,732,918 0 0 1 5,927 0 37,139 43,066 0.647/08 through 6/09 8,691,600 0 0 3 9,315 0 34,347 43,662 0.507/09 through 6/10 4,588,824 0 0 1 13,755 0 57,118 70,873 1.557/10 through 6/11 7,342,278 0 0 5 22,365 0 105,989 128,354 1.757/11 through 6/12 5,116,155 0 0 4 42,414 0 96,366 138,780 2.71
5 YR. TOTAL 32,471,775 0 0 14 93,776 0 330,959 424,735 1.31INDEMNITY MEDICAL TOTAL
CRED. PURE PREM.* CRED. PURE PREM.* PURE PREM.*Indicated Pure Premium 17% 0.289 25% 1.019 1.31Pure Premium Indicated by National Relativity 36% 0.740 37% 1.245 1.99Pure Premium Present on Rate Level 47% 0.670 38% 1.179 1.85Pure Premium Derived by Formula 0.630 1.163 1.79
CLASS BOX MFG-FOLDING PAPER-NOC
4243
Industry Group: Manufacturing CONVERTED LOSSESHazard Group: C INDEMNITY LIKELY INDEMNITY NOT-LIKELY MED LIKELY MED NOT-LIKELY TOTAL TOTAL
POLICY PERIOD PAYROLL CASES AMOUNT CASES AMOUNT AMOUNT AMOUNT AMOUNT PURE PREM.7/07 through 6/08 37,013,605 2 41,728 23 289,107 98,086 477,646 906,567 2.457/08 through 6/09 51,016,676 3 114,393 19 285,019 187,690 456,696 1,043,798 2.057/09 through 6/10 57,691,589 5 136,461 15 361,745 83,639 514,237 1,096,082 1.907/10 through 6/11 60,316,848 3 191,744 22 330,745 168,416 521,007 1,211,912 2.017/11 through 6/12 80,027,227 4 75,349 16 538,312 87,866 720,242 1,421,769 1.78
5 YR. TOTAL 286,065,945 17 559,675 95 1,804,928 625,697 2,689,828 5,680,128 1.99INDEMNITY MEDICAL TOTAL
CRED. PURE PREM.* CRED. PURE PREM.* PURE PREM.*Indicated Pure Premium 47% 0.827 62% 1.159 1.99Pure Premium Indicated by National Relativity 26% 0.730 19% 1.193 1.92Pure Premium Present on Rate Level 27% 0.903 19% 1.318 2.22Pure Premium Derived by Formula 0.822 1.196 2.02
Page 80
* Pure Premium per $100 of Payroll** Pure Premium per employee++ Non-Standard Calculation© Copyright 2014 National Council on Compensation Insurance, Inc. All Rights Reserved.
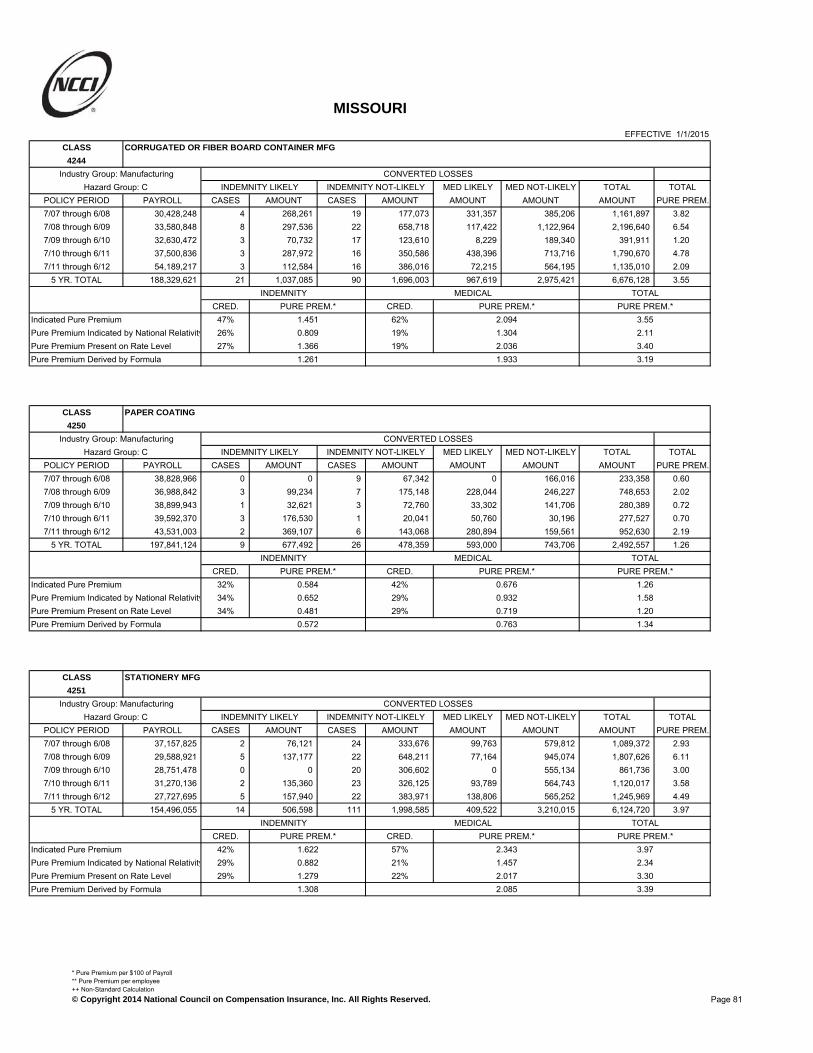
MISSOURI
EFFECTIVE 1/1/2015CLASS CORRUGATED OR FIBER BOARD CONTAINER MFG
4244
Industry Group: Manufacturing CONVERTED LOSSESHazard Group: C INDEMNITY LIKELY INDEMNITY NOT-LIKELY MED LIKELY MED NOT-LIKELY TOTAL TOTAL
POLICY PERIOD PAYROLL CASES AMOUNT CASES AMOUNT AMOUNT AMOUNT AMOUNT PURE PREM.7/07 through 6/08 30,428,248 4 268,261 19 177,073 331,357 385,206 1,161,897 3.827/08 through 6/09 33,580,848 8 297,536 22 658,718 117,422 1,122,964 2,196,640 6.547/09 through 6/10 32,630,472 3 70,732 17 123,610 8,229 189,340 391,911 1.207/10 through 6/11 37,500,836 3 287,972 16 350,586 438,396 713,716 1,790,670 4.787/11 through 6/12 54,189,217 3 112,584 16 386,016 72,215 564,195 1,135,010 2.09
5 YR. TOTAL 188,329,621 21 1,037,085 90 1,696,003 967,619 2,975,421 6,676,128 3.55INDEMNITY MEDICAL TOTAL
CRED. PURE PREM.* CRED. PURE PREM.* PURE PREM.*Indicated Pure Premium 47% 1.451 62% 2.094 3.55Pure Premium Indicated by National Relativity 26% 0.809 19% 1.304 2.11Pure Premium Present on Rate Level 27% 1.366 19% 2.036 3.40Pure Premium Derived by Formula 1.261 1.933 3.19
CLASS PAPER COATING
4250
Industry Group: Manufacturing CONVERTED LOSSESHazard Group: C INDEMNITY LIKELY INDEMNITY NOT-LIKELY MED LIKELY MED NOT-LIKELY TOTAL TOTAL
POLICY PERIOD PAYROLL CASES AMOUNT CASES AMOUNT AMOUNT AMOUNT AMOUNT PURE PREM.7/07 through 6/08 38,828,966 0 0 9 67,342 0 166,016 233,358 0.607/08 through 6/09 36,988,842 3 99,234 7 175,148 228,044 246,227 748,653 2.027/09 through 6/10 38,899,943 1 32,621 3 72,760 33,302 141,706 280,389 0.727/10 through 6/11 39,592,370 3 176,530 1 20,041 50,760 30,196 277,527 0.707/11 through 6/12 43,531,003 2 369,107 6 143,068 280,894 159,561 952,630 2.19
5 YR. TOTAL 197,841,124 9 677,492 26 478,359 593,000 743,706 2,492,557 1.26INDEMNITY MEDICAL TOTAL
CRED. PURE PREM.* CRED. PURE PREM.* PURE PREM.*Indicated Pure Premium 32% 0.584 42% 0.676 1.26Pure Premium Indicated by National Relativity 34% 0.652 29% 0.932 1.58Pure Premium Present on Rate Level 34% 0.481 29% 0.719 1.20Pure Premium Derived by Formula 0.572 0.763 1.34
CLASS STATIONERY MFG
4251
Industry Group: Manufacturing CONVERTED LOSSESHazard Group: C INDEMNITY LIKELY INDEMNITY NOT-LIKELY MED LIKELY MED NOT-LIKELY TOTAL TOTAL
POLICY PERIOD PAYROLL CASES AMOUNT CASES AMOUNT AMOUNT AMOUNT AMOUNT PURE PREM.7/07 through 6/08 37,157,825 2 76,121 24 333,676 99,763 579,812 1,089,372 2.937/08 through 6/09 29,588,921 5 137,177 22 648,211 77,164 945,074 1,807,626 6.117/09 through 6/10 28,751,478 0 0 20 306,602 0 555,134 861,736 3.007/10 through 6/11 31,270,136 2 135,360 23 326,125 93,789 564,743 1,120,017 3.587/11 through 6/12 27,727,695 5 157,940 22 383,971 138,806 565,252 1,245,969 4.49
5 YR. TOTAL 154,496,055 14 506,598 111 1,998,585 409,522 3,210,015 6,124,720 3.97INDEMNITY MEDICAL TOTAL
CRED. PURE PREM.* CRED. PURE PREM.* PURE PREM.*Indicated Pure Premium 42% 1.622 57% 2.343 3.97Pure Premium Indicated by National Relativity 29% 0.882 21% 1.457 2.34Pure Premium Present on Rate Level 29% 1.279 22% 2.017 3.30Pure Premium Derived by Formula 1.308 2.085 3.39
Page 81
* Pure Premium per $100 of Payroll** Pure Premium per employee++ Non-Standard Calculation© Copyright 2014 National Council on Compensation Insurance, Inc. All Rights Reserved.

MISSOURI
EFFECTIVE 1/1/2015CLASS FIBER GOODS MFG
4263
Industry Group: Manufacturing CONVERTED LOSSESHazard Group: C INDEMNITY LIKELY INDEMNITY NOT-LIKELY MED LIKELY MED NOT-LIKELY TOTAL TOTAL
POLICY PERIOD PAYROLL CASES AMOUNT CASES AMOUNT AMOUNT AMOUNT AMOUNT PURE PREM.7/07 through 6/08 1,860,665 0 0 2 7,145 0 39,566 46,711 2.517/08 through 6/09 2,833,720 0 0 1 907 0 3,294 4,201 0.157/09 through 6/10 1,328,767 0 0 2 70,272 0 172,755 243,027 18.297/10 through 6/11 1,655,369 0 0 4 60,388 0 97,632 158,020 9.557/11 through 6/12 1,671,367 0 0 4 41,514 0 46,991 88,505 5.30
5 YR. TOTAL 9,349,888 0 0 13 180,226 0 360,238 540,464 5.78INDEMNITY MEDICAL TOTAL
CRED. PURE PREM.* CRED. PURE PREM.* PURE PREM.*Indicated Pure Premium 13% 1.928 20% 3.853 5.78Pure Premium Indicated by National Relativity 43% 0.791 40% 1.378 2.17Pure Premium Present on Rate Level 44% 1.073 40% 2.355 3.43Pure Premium Derived by Formula 1.063 2.264 3.33
CLASS BAG MFG. - PLASTIC OR PAPER
4273
Industry Group: Manufacturing CONVERTED LOSSESHazard Group: C INDEMNITY LIKELY INDEMNITY NOT-LIKELY MED LIKELY MED NOT-LIKELY TOTAL TOTAL
POLICY PERIOD PAYROLL CASES AMOUNT CASES AMOUNT AMOUNT AMOUNT AMOUNT PURE PREM.7/07 through 6/08 34,149,914 2 39,703 30 233,632 22,058 506,766 802,159 2.357/08 through 6/09 35,564,551 2 27,887 21 191,369 5,258 281,904 506,418 1.427/09 through 6/10 39,681,543 5 113,375 24 239,520 118,906 416,469 888,270 2.247/10 through 6/11 39,933,747 0 0 14 238,982 0 700,936 939,918 2.357/11 through 6/12 40,379,378 0 0 16 397,054 0 506,655 903,709 2.24
5 YR. TOTAL 189,709,133 9 180,965 105 1,300,557 146,222 2,412,730 4,040,474 2.13INDEMNITY MEDICAL TOTAL
CRED. PURE PREM.* CRED. PURE PREM.* PURE PREM.*Indicated Pure Premium 40% 0.781 54% 1.349 2.13Pure Premium Indicated by National Relativity 30% 0.786 23% 1.351 2.14Pure Premium Present on Rate Level 30% 0.883 23% 1.412 2.30Pure Premium Derived by Formula 0.813 1.364 2.18
CLASS PAPER GOODS MFG NOC
4279
Industry Group: Manufacturing CONVERTED LOSSESHazard Group: C INDEMNITY LIKELY INDEMNITY NOT-LIKELY MED LIKELY MED NOT-LIKELY TOTAL TOTAL
POLICY PERIOD PAYROLL CASES AMOUNT CASES AMOUNT AMOUNT AMOUNT AMOUNT PURE PREM.7/07 through 6/08 22,845,464 1 26,165 12 173,386 3,851 603,415 806,817 3.537/08 through 6/09 23,489,644 1 3,821 11 138,951 605 254,039 397,416 1.697/09 through 6/10 23,603,482 1 3,112 10 147,727 4,015 232,803 387,657 1.647/10 through 6/11 15,708,728 0 0 11 156,289 0 240,714 397,003 2.537/11 through 6/12 15,769,147 3 52,309 6 483,700 60,406 159,501 755,916 4.79
5 YR. TOTAL 101,416,465 6 85,407 50 1,100,053 68,877 1,490,472 2,744,809 2.71INDEMNITY MEDICAL TOTAL
CRED. PURE PREM.* CRED. PURE PREM.* PURE PREM.*Indicated Pure Premium 32% 1.169 45% 1.538 2.71Pure Premium Indicated by National Relativity 34% 0.841 27% 1.392 2.23Pure Premium Present on Rate Level 34% 0.934 28% 1.679 2.61Pure Premium Derived by Formula 0.978 1.538 2.52
Page 82
* Pure Premium per $100 of Payroll** Pure Premium per employee++ Non-Standard Calculation© Copyright 2014 National Council on Compensation Insurance, Inc. All Rights Reserved.

MISSOURI
EFFECTIVE 1/1/2015CLASS DRESS PATTERN MFG-PAPER
4282
Industry Group: Manufacturing CONVERTED LOSSESHazard Group: B INDEMNITY LIKELY INDEMNITY NOT-LIKELY MED LIKELY MED NOT-LIKELY TOTAL TOTAL
POLICY PERIOD PAYROLL CASES AMOUNT CASES AMOUNT AMOUNT AMOUNT AMOUNT PURE PREM.7/07 through 6/08 260,746 0 0 0 0 0 2,780 2,780 1.077/08 through 6/09 270,828 0 0 0 0 0 0 0 0.007/09 through 6/10 308,817 0 0 2 127 0 1,839 1,966 0.647/10 through 6/11 450,300 0 0 1 4,415 0 3,476 7,891 1.757/11 through 6/12 97,603 0 0 0 0 0 15,538 15,538 15.92
5 YR. TOTAL 1,388,294 0 0 3 4,542 0 23,633 28,175 2.03INDEMNITY MEDICAL TOTAL
CRED. PURE PREM.* CRED. PURE PREM.* PURE PREM.*Indicated Pure Premium 6% 0.327 6% 1.702 2.03Pure Premium Indicated by National Relativity 10% 0.184 11% 0.692 0.88Pure Premium Present on Rate Level 84% 1.043 83% 0.961 2.00Pure Premium Derived by Formula 0.914 0.976 1.89
CLASS BUILDING OR ROOFING PAPER OR FELT PREPARATION-NO INSTALLATION
4283
Industry Group: Manufacturing CONVERTED LOSSESHazard Group: C INDEMNITY LIKELY INDEMNITY NOT-LIKELY MED LIKELY MED NOT-LIKELY TOTAL TOTAL
POLICY PERIOD PAYROLL CASES AMOUNT CASES AMOUNT AMOUNT AMOUNT AMOUNT PURE PREM.7/07 through 6/08 12,316,741 1 89,230 7 140,533 232,199 206,899 668,861 5.437/08 through 6/09 13,625,133 0 0 5 35,557 0 120,445 156,002 1.157/09 through 6/10 12,830,417 0 0 2 12,594 0 92,672 105,266 0.827/10 through 6/11 14,603,803 3 88,866 4 30,639 196,424 53,148 369,077 2.537/11 through 6/12 16,568,389 0 0 4 14,398 0 33,379 47,777 0.29
5 YR. TOTAL 69,944,483 4 178,096 22 233,721 428,623 506,543 1,346,983 1.93INDEMNITY MEDICAL TOTAL
CRED. PURE PREM.* CRED. PURE PREM.* PURE PREM.*Indicated Pure Premium 28% 0.589 42% 1.337 1.93Pure Premium Indicated by National Relativity 36% 0.664 29% 0.965 1.63Pure Premium Present on Rate Level 36% 0.981 29% 2.043 3.02Pure Premium Derived by Formula 0.757 1.434 2.19
CLASS PRINTING
4299
Industry Group: Manufacturing CONVERTED LOSSESHazard Group: B INDEMNITY LIKELY INDEMNITY NOT-LIKELY MED LIKELY MED NOT-LIKELY TOTAL TOTAL
POLICY PERIOD PAYROLL CASES AMOUNT CASES AMOUNT AMOUNT AMOUNT AMOUNT PURE PREM.7/07 through 6/08 264,693,339 15 245,346 97 947,546 295,577 1,785,252 3,273,721 1.247/08 through 6/09 246,830,713 7 153,506 104 1,334,712 218,961 3,550,861 5,258,040 2.137/09 through 6/10 232,467,403 10 347,232 98 1,400,165 212,081 2,567,425 4,526,903 1.957/10 through 6/11 242,037,979 10 437,509 85 1,454,460 664,073 2,580,470 5,136,512 2.127/11 through 6/12 241,605,665 11 417,039 107 2,223,990 363,567 2,891,534 5,896,130 2.44
5 YR. TOTAL 1,227,635,099 53 1,600,632 491 7,360,873 1,754,259 13,375,542 24,091,306 1.96INDEMNITY MEDICAL TOTAL
CRED. PURE PREM.* CRED. PURE PREM.* PURE PREM.*Indicated Pure Premium 76% 0.730 100% 1.232 1.96Pure Premium Indicated by National Relativity 12% 0.698 0% 1.136 1.83Pure Premium Present on Rate Level 12% 0.689 0% 1.216 1.91Pure Premium Derived by Formula 0.721 1.232 1.95
Page 83
* Pure Premium per $100 of Payroll** Pure Premium per employee++ Non-Standard Calculation© Copyright 2014 National Council on Compensation Insurance, Inc. All Rights Reserved.
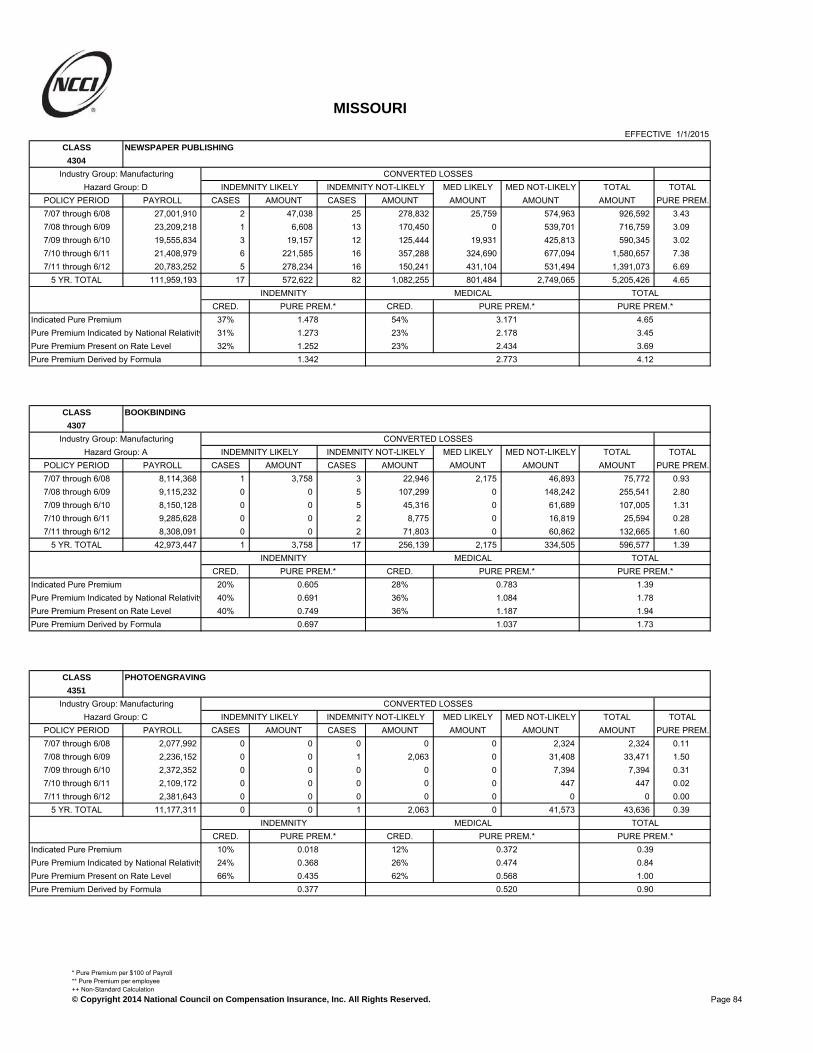
MISSOURI
EFFECTIVE 1/1/2015CLASS NEWSPAPER PUBLISHING
4304
Industry Group: Manufacturing CONVERTED LOSSESHazard Group: D INDEMNITY LIKELY INDEMNITY NOT-LIKELY MED LIKELY MED NOT-LIKELY TOTAL TOTAL
POLICY PERIOD PAYROLL CASES AMOUNT CASES AMOUNT AMOUNT AMOUNT AMOUNT PURE PREM.7/07 through 6/08 27,001,910 2 47,038 25 278,832 25,759 574,963 926,592 3.437/08 through 6/09 23,209,218 1 6,608 13 170,450 0 539,701 716,759 3.097/09 through 6/10 19,555,834 3 19,157 12 125,444 19,931 425,813 590,345 3.027/10 through 6/11 21,408,979 6 221,585 16 357,288 324,690 677,094 1,580,657 7.387/11 through 6/12 20,783,252 5 278,234 16 150,241 431,104 531,494 1,391,073 6.69
5 YR. TOTAL 111,959,193 17 572,622 82 1,082,255 801,484 2,749,065 5,205,426 4.65INDEMNITY MEDICAL TOTAL
CRED. PURE PREM.* CRED. PURE PREM.* PURE PREM.*Indicated Pure Premium 37% 1.478 54% 3.171 4.65Pure Premium Indicated by National Relativity 31% 1.273 23% 2.178 3.45Pure Premium Present on Rate Level 32% 1.252 23% 2.434 3.69Pure Premium Derived by Formula 1.342 2.773 4.12
CLASS BOOKBINDING
4307
Industry Group: Manufacturing CONVERTED LOSSESHazard Group: A INDEMNITY LIKELY INDEMNITY NOT-LIKELY MED LIKELY MED NOT-LIKELY TOTAL TOTAL
POLICY PERIOD PAYROLL CASES AMOUNT CASES AMOUNT AMOUNT AMOUNT AMOUNT PURE PREM.7/07 through 6/08 8,114,368 1 3,758 3 22,946 2,175 46,893 75,772 0.937/08 through 6/09 9,115,232 0 0 5 107,299 0 148,242 255,541 2.807/09 through 6/10 8,150,128 0 0 5 45,316 0 61,689 107,005 1.317/10 through 6/11 9,285,628 0 0 2 8,775 0 16,819 25,594 0.287/11 through 6/12 8,308,091 0 0 2 71,803 0 60,862 132,665 1.60
5 YR. TOTAL 42,973,447 1 3,758 17 256,139 2,175 334,505 596,577 1.39INDEMNITY MEDICAL TOTAL
CRED. PURE PREM.* CRED. PURE PREM.* PURE PREM.*Indicated Pure Premium 20% 0.605 28% 0.783 1.39Pure Premium Indicated by National Relativity 40% 0.691 36% 1.084 1.78Pure Premium Present on Rate Level 40% 0.749 36% 1.187 1.94Pure Premium Derived by Formula 0.697 1.037 1.73
CLASS PHOTOENGRAVING
4351
Industry Group: Manufacturing CONVERTED LOSSESHazard Group: C INDEMNITY LIKELY INDEMNITY NOT-LIKELY MED LIKELY MED NOT-LIKELY TOTAL TOTAL
POLICY PERIOD PAYROLL CASES AMOUNT CASES AMOUNT AMOUNT AMOUNT AMOUNT PURE PREM.7/07 through 6/08 2,077,992 0 0 0 0 0 2,324 2,324 0.117/08 through 6/09 2,236,152 0 0 1 2,063 0 31,408 33,471 1.507/09 through 6/10 2,372,352 0 0 0 0 0 7,394 7,394 0.317/10 through 6/11 2,109,172 0 0 0 0 0 447 447 0.027/11 through 6/12 2,381,643 0 0 0 0 0 0 0 0.00
5 YR. TOTAL 11,177,311 0 0 1 2,063 0 41,573 43,636 0.39INDEMNITY MEDICAL TOTAL
CRED. PURE PREM.* CRED. PURE PREM.* PURE PREM.*Indicated Pure Premium 10% 0.018 12% 0.372 0.39Pure Premium Indicated by National Relativity 24% 0.368 26% 0.474 0.84Pure Premium Present on Rate Level 66% 0.435 62% 0.568 1.00Pure Premium Derived by Formula 0.377 0.520 0.90
Page 84
* Pure Premium per $100 of Payroll** Pure Premium per employee++ Non-Standard Calculation© Copyright 2014 National Council on Compensation Insurance, Inc. All Rights Reserved.
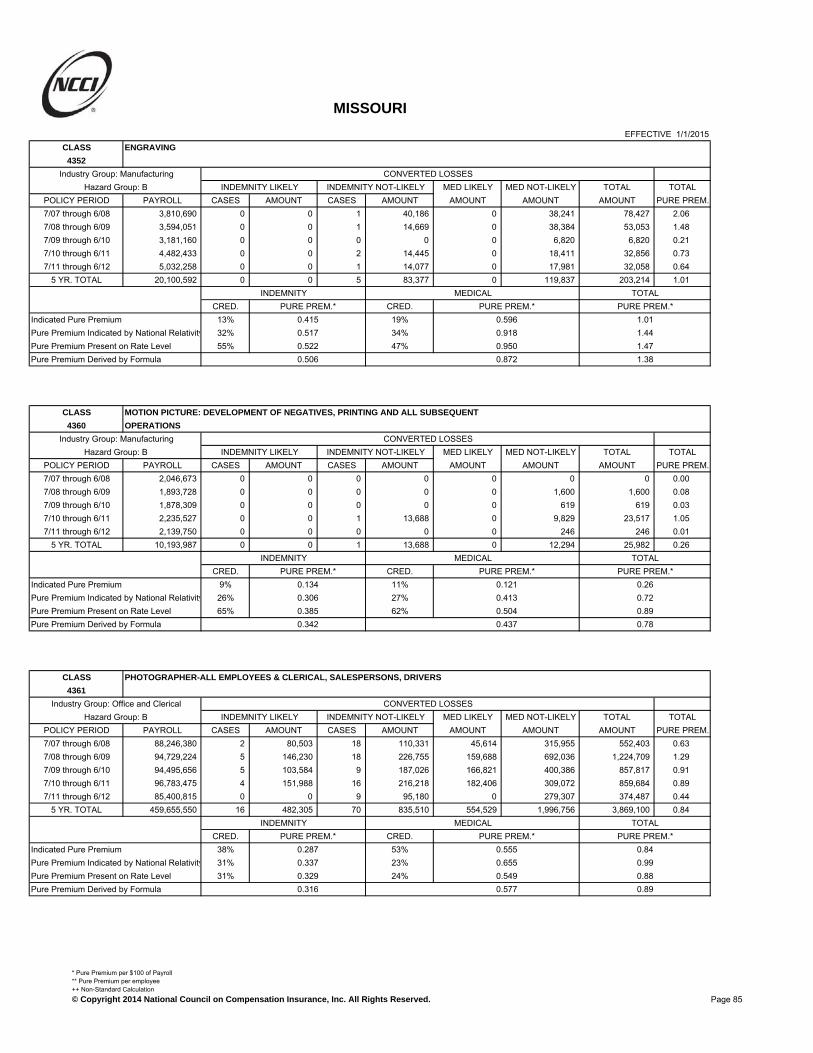
MISSOURI
EFFECTIVE 1/1/2015CLASS ENGRAVING
4352
Industry Group: Manufacturing CONVERTED LOSSESHazard Group: B INDEMNITY LIKELY INDEMNITY NOT-LIKELY MED LIKELY MED NOT-LIKELY TOTAL TOTAL
POLICY PERIOD PAYROLL CASES AMOUNT CASES AMOUNT AMOUNT AMOUNT AMOUNT PURE PREM.7/07 through 6/08 3,810,690 0 0 1 40,186 0 38,241 78,427 2.067/08 through 6/09 3,594,051 0 0 1 14,669 0 38,384 53,053 1.487/09 through 6/10 3,181,160 0 0 0 0 0 6,820 6,820 0.217/10 through 6/11 4,482,433 0 0 2 14,445 0 18,411 32,856 0.737/11 through 6/12 5,032,258 0 0 1 14,077 0 17,981 32,058 0.64
5 YR. TOTAL 20,100,592 0 0 5 83,377 0 119,837 203,214 1.01INDEMNITY MEDICAL TOTAL
CRED. PURE PREM.* CRED. PURE PREM.* PURE PREM.*Indicated Pure Premium 13% 0.415 19% 0.596 1.01Pure Premium Indicated by National Relativity 32% 0.517 34% 0.918 1.44Pure Premium Present on Rate Level 55% 0.522 47% 0.950 1.47Pure Premium Derived by Formula 0.506 0.872 1.38
CLASS MOTION PICTURE: DEVELOPMENT OF NEGATIVES, PRINTING AND ALL SUBSEQUENT
4360 OPERATIONS
Industry Group: Manufacturing CONVERTED LOSSESHazard Group: B INDEMNITY LIKELY INDEMNITY NOT-LIKELY MED LIKELY MED NOT-LIKELY TOTAL TOTAL
POLICY PERIOD PAYROLL CASES AMOUNT CASES AMOUNT AMOUNT AMOUNT AMOUNT PURE PREM.7/07 through 6/08 2,046,673 0 0 0 0 0 0 0 0.007/08 through 6/09 1,893,728 0 0 0 0 0 1,600 1,600 0.087/09 through 6/10 1,878,309 0 0 0 0 0 619 619 0.037/10 through 6/11 2,235,527 0 0 1 13,688 0 9,829 23,517 1.057/11 through 6/12 2,139,750 0 0 0 0 0 246 246 0.01
5 YR. TOTAL 10,193,987 0 0 1 13,688 0 12,294 25,982 0.26INDEMNITY MEDICAL TOTAL
CRED. PURE PREM.* CRED. PURE PREM.* PURE PREM.*Indicated Pure Premium 9% 0.134 11% 0.121 0.26Pure Premium Indicated by National Relativity 26% 0.306 27% 0.413 0.72Pure Premium Present on Rate Level 65% 0.385 62% 0.504 0.89Pure Premium Derived by Formula 0.342 0.437 0.78
CLASS PHOTOGRAPHER-ALL EMPLOYEES & CLERICAL, SALESPERSONS, DRIVERS
4361
Industry Group: Office and Clerical CONVERTED LOSSESHazard Group: B INDEMNITY LIKELY INDEMNITY NOT-LIKELY MED LIKELY MED NOT-LIKELY TOTAL TOTAL
POLICY PERIOD PAYROLL CASES AMOUNT CASES AMOUNT AMOUNT AMOUNT AMOUNT PURE PREM.7/07 through 6/08 88,246,380 2 80,503 18 110,331 45,614 315,955 552,403 0.637/08 through 6/09 94,729,224 5 146,230 18 226,755 159,688 692,036 1,224,709 1.297/09 through 6/10 94,495,656 5 103,584 9 187,026 166,821 400,386 857,817 0.917/10 through 6/11 96,783,475 4 151,988 16 216,218 182,406 309,072 859,684 0.897/11 through 6/12 85,400,815 0 0 9 95,180 0 279,307 374,487 0.44
5 YR. TOTAL 459,655,550 16 482,305 70 835,510 554,529 1,996,756 3,869,100 0.84INDEMNITY MEDICAL TOTAL
CRED. PURE PREM.* CRED. PURE PREM.* PURE PREM.*Indicated Pure Premium 38% 0.287 53% 0.555 0.84Pure Premium Indicated by National Relativity 31% 0.337 23% 0.655 0.99Pure Premium Present on Rate Level 31% 0.329 24% 0.549 0.88Pure Premium Derived by Formula 0.316 0.577 0.89
Page 85
* Pure Premium per $100 of Payroll** Pure Premium per employee++ Non-Standard Calculation© Copyright 2014 National Council on Compensation Insurance, Inc. All Rights Reserved.
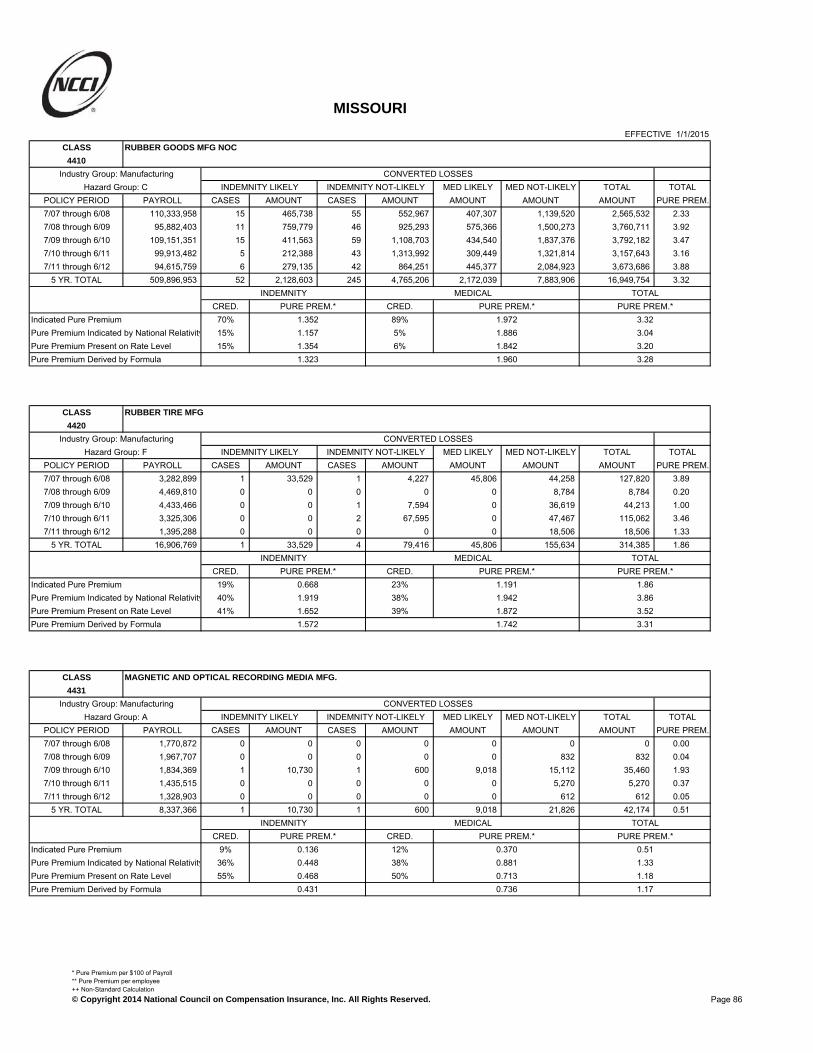
MISSOURI
EFFECTIVE 1/1/2015CLASS RUBBER GOODS MFG NOC
4410
Industry Group: Manufacturing CONVERTED LOSSESHazard Group: C INDEMNITY LIKELY INDEMNITY NOT-LIKELY MED LIKELY MED NOT-LIKELY TOTAL TOTAL
POLICY PERIOD PAYROLL CASES AMOUNT CASES AMOUNT AMOUNT AMOUNT AMOUNT PURE PREM.7/07 through 6/08 110,333,958 15 465,738 55 552,967 407,307 1,139,520 2,565,532 2.337/08 through 6/09 95,882,403 11 759,779 46 925,293 575,366 1,500,273 3,760,711 3.927/09 through 6/10 109,151,351 15 411,563 59 1,108,703 434,540 1,837,376 3,792,182 3.477/10 through 6/11 99,913,482 5 212,388 43 1,313,992 309,449 1,321,814 3,157,643 3.167/11 through 6/12 94,615,759 6 279,135 42 864,251 445,377 2,084,923 3,673,686 3.88
5 YR. TOTAL 509,896,953 52 2,128,603 245 4,765,206 2,172,039 7,883,906 16,949,754 3.32INDEMNITY MEDICAL TOTAL
CRED. PURE PREM.* CRED. PURE PREM.* PURE PREM.*Indicated Pure Premium 70% 1.352 89% 1.972 3.32Pure Premium Indicated by National Relativity 15% 1.157 5% 1.886 3.04Pure Premium Present on Rate Level 15% 1.354 6% 1.842 3.20Pure Premium Derived by Formula 1.323 1.960 3.28
CLASS RUBBER TIRE MFG
4420
Industry Group: Manufacturing CONVERTED LOSSESHazard Group: F INDEMNITY LIKELY INDEMNITY NOT-LIKELY MED LIKELY MED NOT-LIKELY TOTAL TOTAL
POLICY PERIOD PAYROLL CASES AMOUNT CASES AMOUNT AMOUNT AMOUNT AMOUNT PURE PREM.7/07 through 6/08 3,282,899 1 33,529 1 4,227 45,806 44,258 127,820 3.897/08 through 6/09 4,469,810 0 0 0 0 0 8,784 8,784 0.207/09 through 6/10 4,433,466 0 0 1 7,594 0 36,619 44,213 1.007/10 through 6/11 3,325,306 0 0 2 67,595 0 47,467 115,062 3.467/11 through 6/12 1,395,288 0 0 0 0 0 18,506 18,506 1.33
5 YR. TOTAL 16,906,769 1 33,529 4 79,416 45,806 155,634 314,385 1.86INDEMNITY MEDICAL TOTAL
CRED. PURE PREM.* CRED. PURE PREM.* PURE PREM.*Indicated Pure Premium 19% 0.668 23% 1.191 1.86Pure Premium Indicated by National Relativity 40% 1.919 38% 1.942 3.86Pure Premium Present on Rate Level 41% 1.652 39% 1.872 3.52Pure Premium Derived by Formula 1.572 1.742 3.31
CLASS MAGNETIC AND OPTICAL RECORDING MEDIA MFG.
4431
Industry Group: Manufacturing CONVERTED LOSSESHazard Group: A INDEMNITY LIKELY INDEMNITY NOT-LIKELY MED LIKELY MED NOT-LIKELY TOTAL TOTAL
POLICY PERIOD PAYROLL CASES AMOUNT CASES AMOUNT AMOUNT AMOUNT AMOUNT PURE PREM.7/07 through 6/08 1,770,872 0 0 0 0 0 0 0 0.007/08 through 6/09 1,967,707 0 0 0 0 0 832 832 0.047/09 through 6/10 1,834,369 1 10,730 1 600 9,018 15,112 35,460 1.937/10 through 6/11 1,435,515 0 0 0 0 0 5,270 5,270 0.377/11 through 6/12 1,328,903 0 0 0 0 0 612 612 0.05
5 YR. TOTAL 8,337,366 1 10,730 1 600 9,018 21,826 42,174 0.51INDEMNITY MEDICAL TOTAL
CRED. PURE PREM.* CRED. PURE PREM.* PURE PREM.*Indicated Pure Premium 9% 0.136 12% 0.370 0.51Pure Premium Indicated by National Relativity 36% 0.448 38% 0.881 1.33Pure Premium Present on Rate Level 55% 0.468 50% 0.713 1.18Pure Premium Derived by Formula 0.431 0.736 1.17
Page 86
* Pure Premium per $100 of Payroll** Pure Premium per employee++ Non-Standard Calculation© Copyright 2014 National Council on Compensation Insurance, Inc. All Rights Reserved.

MISSOURI
EFFECTIVE 1/1/2015CLASS PEN MFG
4432
Industry Group: Manufacturing CONVERTED LOSSESHazard Group: A INDEMNITY LIKELY INDEMNITY NOT-LIKELY MED LIKELY MED NOT-LIKELY TOTAL TOTAL
POLICY PERIOD PAYROLL CASES AMOUNT CASES AMOUNT AMOUNT AMOUNT AMOUNT PURE PREM.7/07 through 6/08 0 0 0 0 0 0 0 0 0.007/08 through 6/09 0 0 0 0 0 0 0 0 0.007/09 through 6/10 0 0 0 0 0 0 0 0 0.007/10 through 6/11 0 0 0 0 0 0 0 0 0.007/11 through 6/12 0 0 0 0 0 0 0 0 0.00
5 YR. TOTAL 0 0 0 0 0 0 0 0 0.00INDEMNITY MEDICAL TOTAL
CRED. PURE PREM.* CRED. PURE PREM.* PURE PREM.*Indicated Pure Premium 0% 0.000 0% 0.000 0.00Pure Premium Indicated by National Relativity 24% 0.366 25% 0.605 0.97Pure Premium Present on Rate Level 76% 0.639 75% 0.828 1.47Pure Premium Derived by Formula 0.573 0.772 1.35
CLASS LACQUER OR VARNISH MANUFACTURING
4439
Industry Group: Manufacturing CONVERTED LOSSESHazard Group: D INDEMNITY LIKELY INDEMNITY NOT-LIKELY MED LIKELY MED NOT-LIKELY TOTAL TOTAL
POLICY PERIOD PAYROLL CASES AMOUNT CASES AMOUNT AMOUNT AMOUNT AMOUNT PURE PREM.7/07 through 6/08 7,328,183 0 0 1 20,532 0 67,898 88,430 1.217/08 through 6/09 6,648,008 0 0 1 442 0 6,812 7,254 0.117/09 through 6/10 8,680,182 2 13,258 1 978 5,039 14,284 33,559 0.397/10 through 6/11 8,306,816 1 8,789 1 130,567 0 305,507 444,863 5.367/11 through 6/12 8,829,591 1 68,714 1 30,172 328,042 90,664 517,592 5.86
5 YR. TOTAL 39,792,780 4 90,761 5 182,691 333,081 485,165 1,091,698 2.74INDEMNITY MEDICAL TOTAL
CRED. PURE PREM.* CRED. PURE PREM.* PURE PREM.*Indicated Pure Premium 19% 0.687 26% 2.056 2.74Pure Premium Indicated by National Relativity 17% 0.649 18% 1.329 1.98Pure Premium Present on Rate Level 64% 0.653 56% 1.130 1.78Pure Premium Derived by Formula 0.659 1.407 2.07
CLASS PLASTICS MFG: FABRICATED PRODUCTS NOC
4452
Industry Group: Manufacturing CONVERTED LOSSESHazard Group: C INDEMNITY LIKELY INDEMNITY NOT-LIKELY MED LIKELY MED NOT-LIKELY TOTAL TOTAL
POLICY PERIOD PAYROLL CASES AMOUNT CASES AMOUNT AMOUNT AMOUNT AMOUNT PURE PREM.7/07 through 6/08 24,475,432 0 0 9 99,489 0 195,385 294,874 1.207/08 through 6/09 22,613,147 2 90,746 11 214,516 208,037 426,089 939,388 4.157/09 through 6/10 21,815,576 2 13,277 8 78,533 76,788 201,086 369,684 1.707/10 through 6/11 20,975,213 2 81,594 12 62,554 69,869 190,422 404,439 1.937/11 through 6/12 27,876,564 1 9,419 16 194,615 815 337,454 542,303 1.95
5 YR. TOTAL 117,755,932 7 195,036 56 649,707 355,509 1,350,436 2,550,688 2.17INDEMNITY MEDICAL TOTAL
CRED. PURE PREM.* CRED. PURE PREM.* PURE PREM.*Indicated Pure Premium 33% 0.717 45% 1.449 2.17Pure Premium Indicated by National Relativity 33% 0.970 27% 1.675 2.65Pure Premium Present on Rate Level 34% 0.886 28% 1.455 2.34Pure Premium Derived by Formula 0.858 1.512 2.37
Page 87
* Pure Premium per $100 of Payroll** Pure Premium per employee++ Non-Standard Calculation© Copyright 2014 National Council on Compensation Insurance, Inc. All Rights Reserved.
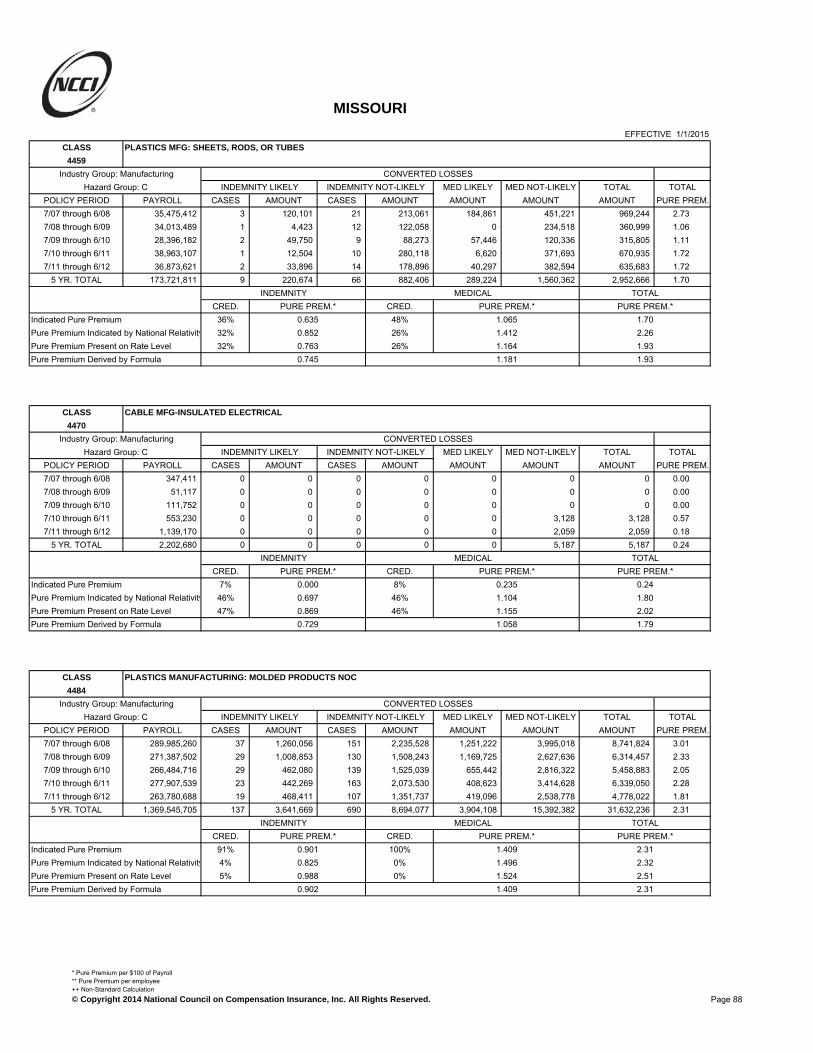
MISSOURI
EFFECTIVE 1/1/2015CLASS PLASTICS MFG: SHEETS, RODS, OR TUBES
4459
Industry Group: Manufacturing CONVERTED LOSSESHazard Group: C INDEMNITY LIKELY INDEMNITY NOT-LIKELY MED LIKELY MED NOT-LIKELY TOTAL TOTAL
POLICY PERIOD PAYROLL CASES AMOUNT CASES AMOUNT AMOUNT AMOUNT AMOUNT PURE PREM.7/07 through 6/08 35,475,412 3 120,101 21 213,061 184,861 451,221 969,244 2.737/08 through 6/09 34,013,489 1 4,423 12 122,058 0 234,518 360,999 1.067/09 through 6/10 28,396,182 2 49,750 9 88,273 57,446 120,336 315,805 1.117/10 through 6/11 38,963,107 1 12,504 10 280,118 6,620 371,693 670,935 1.727/11 through 6/12 36,873,621 2 33,896 14 178,896 40,297 382,594 635,683 1.72
5 YR. TOTAL 173,721,811 9 220,674 66 882,406 289,224 1,560,362 2,952,666 1.70INDEMNITY MEDICAL TOTAL
CRED. PURE PREM.* CRED. PURE PREM.* PURE PREM.*Indicated Pure Premium 36% 0.635 48% 1.065 1.70Pure Premium Indicated by National Relativity 32% 0.852 26% 1.412 2.26Pure Premium Present on Rate Level 32% 0.763 26% 1.164 1.93Pure Premium Derived by Formula 0.745 1.181 1.93
CLASS CABLE MFG-INSULATED ELECTRICAL
4470
Industry Group: Manufacturing CONVERTED LOSSESHazard Group: C INDEMNITY LIKELY INDEMNITY NOT-LIKELY MED LIKELY MED NOT-LIKELY TOTAL TOTAL
POLICY PERIOD PAYROLL CASES AMOUNT CASES AMOUNT AMOUNT AMOUNT AMOUNT PURE PREM.7/07 through 6/08 347,411 0 0 0 0 0 0 0 0.007/08 through 6/09 51,117 0 0 0 0 0 0 0 0.007/09 through 6/10 111,752 0 0 0 0 0 0 0 0.007/10 through 6/11 553,230 0 0 0 0 0 3,128 3,128 0.577/11 through 6/12 1,139,170 0 0 0 0 0 2,059 2,059 0.18
5 YR. TOTAL 2,202,680 0 0 0 0 0 5,187 5,187 0.24INDEMNITY MEDICAL TOTAL
CRED. PURE PREM.* CRED. PURE PREM.* PURE PREM.*Indicated Pure Premium 7% 0.000 8% 0.235 0.24Pure Premium Indicated by National Relativity 46% 0.697 46% 1.104 1.80Pure Premium Present on Rate Level 47% 0.869 46% 1.155 2.02Pure Premium Derived by Formula 0.729 1.058 1.79
CLASS PLASTICS MANUFACTURING: MOLDED PRODUCTS NOC
4484
Industry Group: Manufacturing CONVERTED LOSSESHazard Group: C INDEMNITY LIKELY INDEMNITY NOT-LIKELY MED LIKELY MED NOT-LIKELY TOTAL TOTAL
POLICY PERIOD PAYROLL CASES AMOUNT CASES AMOUNT AMOUNT AMOUNT AMOUNT PURE PREM.7/07 through 6/08 289,985,260 37 1,260,056 151 2,235,528 1,251,222 3,995,018 8,741,824 3.017/08 through 6/09 271,387,502 29 1,008,853 130 1,508,243 1,169,725 2,627,636 6,314,457 2.337/09 through 6/10 266,484,716 29 462,080 139 1,525,039 655,442 2,816,322 5,458,883 2.057/10 through 6/11 277,907,539 23 442,269 163 2,073,530 408,623 3,414,628 6,339,050 2.287/11 through 6/12 263,780,688 19 468,411 107 1,351,737 419,096 2,538,778 4,778,022 1.81
5 YR. TOTAL 1,369,545,705 137 3,641,669 690 8,694,077 3,904,108 15,392,382 31,632,236 2.31INDEMNITY MEDICAL TOTAL
CRED. PURE PREM.* CRED. PURE PREM.* PURE PREM.*Indicated Pure Premium 91% 0.901 100% 1.409 2.31Pure Premium Indicated by National Relativity 4% 0.825 0% 1.496 2.32Pure Premium Present on Rate Level 5% 0.988 0% 1.524 2.51Pure Premium Derived by Formula 0.902 1.409 2.31
Page 88
* Pure Premium per $100 of Payroll** Pure Premium per employee++ Non-Standard Calculation© Copyright 2014 National Council on Compensation Insurance, Inc. All Rights Reserved.

MISSOURI
EFFECTIVE 1/1/2015CLASS FABRIC COATING OR IMPREGNATING NOC
4493
Industry Group: Manufacturing CONVERTED LOSSESHazard Group: C INDEMNITY LIKELY INDEMNITY NOT-LIKELY MED LIKELY MED NOT-LIKELY TOTAL TOTAL
POLICY PERIOD PAYROLL CASES AMOUNT CASES AMOUNT AMOUNT AMOUNT AMOUNT PURE PREM.7/07 through 6/08 353,453 0 0 0 0 0 5,632 5,632 1.597/08 through 6/09 457,152 0 0 0 0 0 1,051 1,051 0.237/09 through 6/10 397,341 0 0 1 44,123 0 82,062 126,185 31.767/10 through 6/11 530,342 0 0 0 0 0 1,971 1,971 0.377/11 through 6/12 834,908 1 152,065 0 0 631,340 1,412 784,817 94.00
5 YR. TOTAL 2,573,196 1 152,065 1 44,123 631,340 92,128 919,656 35.74INDEMNITY MEDICAL TOTAL
CRED. PURE PREM.* CRED. PURE PREM.* PURE PREM.*Indicated Pure Premium 8% 7.624 9% 28.116 35.74Pure Premium Indicated by National Relativity 42% 0.756 45% 1.283 2.04Pure Premium Present on Rate Level 50% 1.222 46% 1.272 2.49Pure Premium Derived by Formula 1.538 3.693 5.23
CLASS ANALYTICAL LABORATORIES OR ASSAYING - INCLUDING LABORATORY, OUTSIDE
4511 EMPLOYEES, COLLECTORS OF SAMPLES, & DRIVERS
Industry Group: Goods and Services CONVERTED LOSSESHazard Group: D INDEMNITY LIKELY INDEMNITY NOT-LIKELY MED LIKELY MED NOT-LIKELY TOTAL TOTAL
POLICY PERIOD PAYROLL CASES AMOUNT CASES AMOUNT AMOUNT AMOUNT AMOUNT PURE PREM.7/07 through 6/08 278,524,371 2 67,970 11 188,927 40,757 336,891 634,545 0.237/08 through 6/09 275,909,293 2 16,889 12 216,615 2,979 295,284 531,767 0.197/09 through 6/10 279,975,748 3 35,782 12 197,735 47,253 934,578 1,215,348 0.437/10 through 6/11 370,565,362 2 207,853 12 101,088 84,923 241,273 635,137 0.177/11 through 6/12 360,571,163 6 150,381 19 161,304 232,900 543,271 1,087,856 0.30
5 YR. TOTAL 1,565,545,937 15 478,875 66 865,669 408,812 2,351,297 4,104,653 0.26INDEMNITY MEDICAL TOTAL
CRED. PURE PREM.* CRED. PURE PREM.* PURE PREM.*Indicated Pure Premium 46% 0.086 59% 0.176 0.26Pure Premium Indicated by National Relativity 27% 0.194 20% 0.344 0.54Pure Premium Present on Rate Level 27% 0.155 21% 0.218 0.37Pure Premium Derived by Formula 0.134 0.218 0.35
CLASS INK MFG
4557
Industry Group: Manufacturing CONVERTED LOSSESHazard Group: B INDEMNITY LIKELY INDEMNITY NOT-LIKELY MED LIKELY MED NOT-LIKELY TOTAL TOTAL
POLICY PERIOD PAYROLL CASES AMOUNT CASES AMOUNT AMOUNT AMOUNT AMOUNT PURE PREM.7/07 through 6/08 26,352,746 0 0 11 97,117 0 151,835 248,952 0.957/08 through 6/09 19,238,262 2 72,427 5 145,843 223,011 190,764 632,045 3.297/09 through 6/10 19,262,154 2 44,419 8 46,431 27,387 61,098 179,335 0.937/10 through 6/11 19,447,217 1 46,834 11 260,816 295,828 716,167 1,319,645 6.797/11 through 6/12 20,671,943 0 0 7 90,274 0 111,578 201,852 0.98
5 YR. TOTAL 104,972,322 5 163,680 42 640,481 546,226 1,231,442 2,581,829 2.46INDEMNITY MEDICAL TOTAL
CRED. PURE PREM.* CRED. PURE PREM.* PURE PREM.*Indicated Pure Premium 29% 0.766 40% 1.693 2.46Pure Premium Indicated by National Relativity 35% 0.715 30% 1.207 1.92Pure Premium Present on Rate Level 36% 0.715 30% 1.247 1.96Pure Premium Derived by Formula 0.730 1.413 2.14
Page 89
* Pure Premium per $100 of Payroll** Pure Premium per employee++ Non-Standard Calculation© Copyright 2014 National Council on Compensation Insurance, Inc. All Rights Reserved.

MISSOURI
EFFECTIVE 1/1/2015CLASS PAINT MFG
4558
Industry Group: Manufacturing CONVERTED LOSSESHazard Group: C INDEMNITY LIKELY INDEMNITY NOT-LIKELY MED LIKELY MED NOT-LIKELY TOTAL TOTAL
POLICY PERIOD PAYROLL CASES AMOUNT CASES AMOUNT AMOUNT AMOUNT AMOUNT PURE PREM.7/07 through 6/08 32,971,733 0 0 22 120,460 0 178,292 298,752 0.917/08 through 6/09 26,188,831 0 0 11 41,502 0 86,917 128,419 0.497/09 through 6/10 29,019,458 0 0 4 112,279 0 137,682 249,961 0.867/10 through 6/11 25,196,238 2 46,969 6 71,234 19,056 112,715 249,974 0.997/11 through 6/12 27,368,180 2 92,118 15 278,423 37,569 289,475 697,585 2.55
5 YR. TOTAL 140,744,440 4 139,087 58 623,898 56,625 805,081 1,624,691 1.15INDEMNITY MEDICAL TOTAL
CRED. PURE PREM.* CRED. PURE PREM.* PURE PREM.*Indicated Pure Premium 29% 0.542 38% 0.612 1.15Pure Premium Indicated by National Relativity 35% 0.506 31% 0.941 1.45Pure Premium Present on Rate Level 36% 0.552 31% 0.818 1.37Pure Premium Derived by Formula 0.533 0.778 1.31
CLASS SALT BORAX OR POTASH PRODUCING OR REFINING & DRIVERS
4568
Industry Group: Manufacturing CONVERTED LOSSESHazard Group: E INDEMNITY LIKELY INDEMNITY NOT-LIKELY MED LIKELY MED NOT-LIKELY TOTAL TOTAL
POLICY PERIOD PAYROLL CASES AMOUNT CASES AMOUNT AMOUNT AMOUNT AMOUNT PURE PREM.7/07 through 6/08 367,491 0 0 0 0 0 0 0 0.007/08 through 6/09 362,564 0 0 0 0 0 2,441 2,441 0.677/09 through 6/10 493,207 0 0 0 0 0 0 0 0.007/10 through 6/11 1,797,772 0 0 0 0 0 1,174 1,174 0.077/11 through 6/12 1,988,436 0 0 4 232,716 0 679,278 911,994 45.86
5 YR. TOTAL 5,009,470 0 0 4 232,716 0 682,893 915,609 18.28INDEMNITY MEDICAL TOTAL
CRED. PURE PREM.* CRED. PURE PREM.* PURE PREM.*Indicated Pure Premium 11% 4.646 13% 13.632 18.28Pure Premium Indicated by National Relativity 38% 0.738 40% 1.007 1.75Pure Premium Present on Rate Level 51% 1.214 47% 1.466 2.68Pure Premium Derived by Formula 1.411 2.864 4.28
CLASS PHOSPHATE WORKS & DRIVERS
4581
Industry Group: Manufacturing CONVERTED LOSSESHazard Group: F INDEMNITY LIKELY INDEMNITY NOT-LIKELY MED LIKELY MED NOT-LIKELY TOTAL TOTAL
POLICY PERIOD PAYROLL CASES AMOUNT CASES AMOUNT AMOUNT AMOUNT AMOUNT PURE PREM.7/07 through 6/08 1,142,451 0 0 1 755 0 7,195 7,950 0.707/08 through 6/09 1,043,266 0 0 0 0 0 0 0 0.007/09 through 6/10 773,910 0 0 0 0 0 0 0 0.007/10 through 6/11 1,141,618 0 0 0 0 0 0 0 0.007/11 through 6/12 1,197,214 0 0 0 0 0 0 0 0.00
5 YR. TOTAL 5,298,459 0 0 1 755 0 7,195 7,950 0.15INDEMNITY MEDICAL TOTAL
CRED. PURE PREM.* CRED. PURE PREM.* PURE PREM.*Indicated Pure Premium 7% 0.014 9% 0.136 0.15Pure Premium Indicated by National Relativity 34% 0.207 36% 0.472 0.68Pure Premium Present on Rate Level 59% 0.389 55% 0.556 0.95Pure Premium Derived by Formula 0.301 0.488 0.79
Page 90
* Pure Premium per $100 of Payroll** Pure Premium per employee++ Non-Standard Calculation© Copyright 2014 National Council on Compensation Insurance, Inc. All Rights Reserved.

MISSOURI
EFFECTIVE 1/1/2015CLASS FERTILIZER MFG & DRIVERS
4583
Industry Group: Manufacturing CONVERTED LOSSESHazard Group: F INDEMNITY LIKELY INDEMNITY NOT-LIKELY MED LIKELY MED NOT-LIKELY TOTAL TOTAL
POLICY PERIOD PAYROLL CASES AMOUNT CASES AMOUNT AMOUNT AMOUNT AMOUNT PURE PREM.7/07 through 6/08 28,735,574 4 112,133 14 420,621 242,962 876,628 1,652,344 5.757/08 through 6/09 30,326,323 0 0 13 202,894 0 447,451 650,345 2.147/09 through 6/10 25,665,827 3 117,030 12 192,038 187,154 398,751 894,973 3.497/10 through 6/11 32,195,065 5 135,829 14 958,358 120,025 438,777 1,652,989 5.147/11 through 6/12 34,902,312 2 17,728 9 150,242 21,283 364,724 553,977 1.59
5 YR. TOTAL 151,825,101 14 382,720 62 1,924,153 571,424 2,526,331 5,404,628 3.56INDEMNITY MEDICAL TOTAL
CRED. PURE PREM.* CRED. PURE PREM.* PURE PREM.*Indicated Pure Premium 46% 1.519 59% 2.040 3.56Pure Premium Indicated by National Relativity 27% 1.495 20% 2.913 4.41Pure Premium Present on Rate Level 27% 1.639 21% 2.211 3.85Pure Premium Derived by Formula 1.545 2.251 3.80
CLASS INK (WRITING), MUCILAGE OR PASTE MFG.
4597
Industry Group: Manufacturing CONVERTED LOSSESHazard Group: B INDEMNITY LIKELY INDEMNITY NOT-LIKELY MED LIKELY MED NOT-LIKELY TOTAL TOTAL
POLICY PERIOD PAYROLL CASES AMOUNT CASES AMOUNT AMOUNT AMOUNT AMOUNT PURE PREM.7/07 through 6/08 241,110 0 0 1 96 0 5,385 5,481 2.277/08 through 6/09 1,398,989 0 0 0 0 0 294 294 0.027/09 through 6/10 1,338,433 0 0 0 0 0 2,984 2,984 0.227/10 through 6/11 288,621 0 0 0 0 0 2,007 2,007 0.707/11 through 6/12 91,572 0 0 0 0 0 0 0 0.00
5 YR. TOTAL 3,358,725 0 0 1 96 0 10,670 10,766 0.32INDEMNITY MEDICAL TOTAL
CRED. PURE PREM.* CRED. PURE PREM.* PURE PREM.*Indicated Pure Premium 5% 0.003 7% 0.318 0.32Pure Premium Indicated by National Relativity 11% 0.888 12% 1.075 1.96Pure Premium Present on Rate Level 84% 0.351 81% 0.444 0.80Pure Premium Derived by Formula 0.393 0.511 0.90
CLASS DRUG, MEDICINE OR PHARMACEUTICAL PREPARATION, COMPOUNDING, OR BLENDING-NO
4611 MFG OF INGREDIENTS
Industry Group: Manufacturing CONVERTED LOSSESHazard Group: B INDEMNITY LIKELY INDEMNITY NOT-LIKELY MED LIKELY MED NOT-LIKELY TOTAL TOTAL
POLICY PERIOD PAYROLL CASES AMOUNT CASES AMOUNT AMOUNT AMOUNT AMOUNT PURE PREM.7/07 through 6/08 225,821,788 9 144,425 41 413,400 137,487 702,424 1,397,736 0.627/08 through 6/09 217,643,227 3 18,243 46 797,476 5,774 948,795 1,770,288 0.817/09 through 6/10 239,175,755 8 143,383 30 385,896 89,211 671,698 1,290,188 0.547/10 through 6/11 282,148,445 20 667,160 40 614,639 718,312 904,065 2,904,176 1.037/11 through 6/12 268,349,335 11 274,840 29 401,398 359,363 933,819 1,969,420 0.73
5 YR. TOTAL 1,233,138,550 51 1,248,051 186 2,612,809 1,310,147 4,160,801 9,331,808 0.76INDEMNITY MEDICAL TOTAL
CRED. PURE PREM.* CRED. PURE PREM.* PURE PREM.*Indicated Pure Premium 58% 0.313 77% 0.444 0.76Pure Premium Indicated by National Relativity 21% 0.328 11% 0.546 0.87Pure Premium Present on Rate Level 21% 0.351 12% 0.527 0.88Pure Premium Derived by Formula 0.324 0.465 0.79
Page 91
* Pure Premium per $100 of Payroll** Pure Premium per employee++ Non-Standard Calculation© Copyright 2014 National Council on Compensation Insurance, Inc. All Rights Reserved.

MISSOURI
EFFECTIVE 1/1/2015CLASS OXYGEN OR HYDROGEN MFG & DRIVERS
4635
Industry Group: Manufacturing CONVERTED LOSSESHazard Group: G INDEMNITY LIKELY INDEMNITY NOT-LIKELY MED LIKELY MED NOT-LIKELY TOTAL TOTAL
POLICY PERIOD PAYROLL CASES AMOUNT CASES AMOUNT AMOUNT AMOUNT AMOUNT PURE PREM.7/07 through 6/08 22,528,752 3 225,786 4 35,515 123,022 139,135 523,458 2.327/08 through 6/09 22,986,271 1 24,959 6 81,658 117,910 172,835 397,362 1.737/09 through 6/10 25,005,859 0 0 6 64,124 0 199,002 263,126 1.057/10 through 6/11 24,278,732 1 49,137 8 134,189 33,817 282,775 499,918 2.067/11 through 6/12 28,521,938 2 68,691 4 120,957 78,146 242,565 510,359 1.79
5 YR. TOTAL 123,321,552 7 368,573 28 436,443 352,895 1,036,312 2,194,223 1.78INDEMNITY MEDICAL TOTAL
CRED. PURE PREM.* CRED. PURE PREM.* PURE PREM.*Indicated Pure Premium 36% 0.653 43% 1.126 1.78Pure Premium Indicated by National Relativity 32% 1.023 28% 1.529 2.55Pure Premium Present on Rate Level 32% 1.076 29% 1.244 2.32Pure Premium Derived by Formula 0.907 1.273 2.18
CLASS GLUE MFG & DRIVERS
4653
Industry Group: Manufacturing CONVERTED LOSSESHazard Group: B INDEMNITY LIKELY INDEMNITY NOT-LIKELY MED LIKELY MED NOT-LIKELY TOTAL TOTAL
POLICY PERIOD PAYROLL CASES AMOUNT CASES AMOUNT AMOUNT AMOUNT AMOUNT PURE PREM.7/07 through 6/08 985,418 0 0 0 0 0 0 0 0.007/08 through 6/09 739,261 0 0 0 0 0 0 0 0.007/09 through 6/10 708,197 0 0 1 5,200 0 0 5,200 0.737/10 through 6/11 416,569 0 0 0 0 0 0 0 0.007/11 through 6/12 342,840 0 0 0 0 0 0 0 0.00
5 YR. TOTAL 3,192,285 0 0 1 5,200 0 0 5,200 0.16INDEMNITY MEDICAL TOTAL
CRED. PURE PREM.* CRED. PURE PREM.* PURE PREM.*Indicated Pure Premium 7% 0.163 9% 0.000 0.16Pure Premium Indicated by National Relativity 26% 0.589 28% 1.475 2.06Pure Premium Present on Rate Level 67% 0.700 63% 0.918 1.62Pure Premium Derived by Formula 0.634 0.991 1.63
CLASS RENDERING WORKS NOC & DRIVERS
4665
Industry Group: Manufacturing CONVERTED LOSSESHazard Group: E INDEMNITY LIKELY INDEMNITY NOT-LIKELY MED LIKELY MED NOT-LIKELY TOTAL TOTAL
POLICY PERIOD PAYROLL CASES AMOUNT CASES AMOUNT AMOUNT AMOUNT AMOUNT PURE PREM.7/07 through 6/08 1,997,593 1 378,006 4 42,936 387,720 68,055 876,717 43.897/08 through 6/09 2,229,204 1 3,644 2 2,670 2,063 2,093 10,470 0.477/09 through 6/10 2,091,687 0 0 0 0 0 2,093 2,093 0.107/10 through 6/11 2,152,369 1 28,844 1 878 7,027 1,472 38,221 1.787/11 through 6/12 2,540,530 0 0 1 26,890 0 60,394 87,284 3.44
5 YR. TOTAL 11,011,383 3 410,494 8 73,374 396,810 134,107 1,014,785 9.22INDEMNITY MEDICAL TOTAL
CRED. PURE PREM.* CRED. PURE PREM.* PURE PREM.*Indicated Pure Premium 22% 4.394 28% 4.822 9.22Pure Premium Indicated by National Relativity 39% 2.888 36% 4.005 6.89Pure Premium Present on Rate Level 39% 3.313 36% 4.768 8.08Pure Premium Derived by Formula 3.385 4.508 7.89
Page 92
* Pure Premium per $100 of Payroll** Pure Premium per employee++ Non-Standard Calculation© Copyright 2014 National Council on Compensation Insurance, Inc. All Rights Reserved.
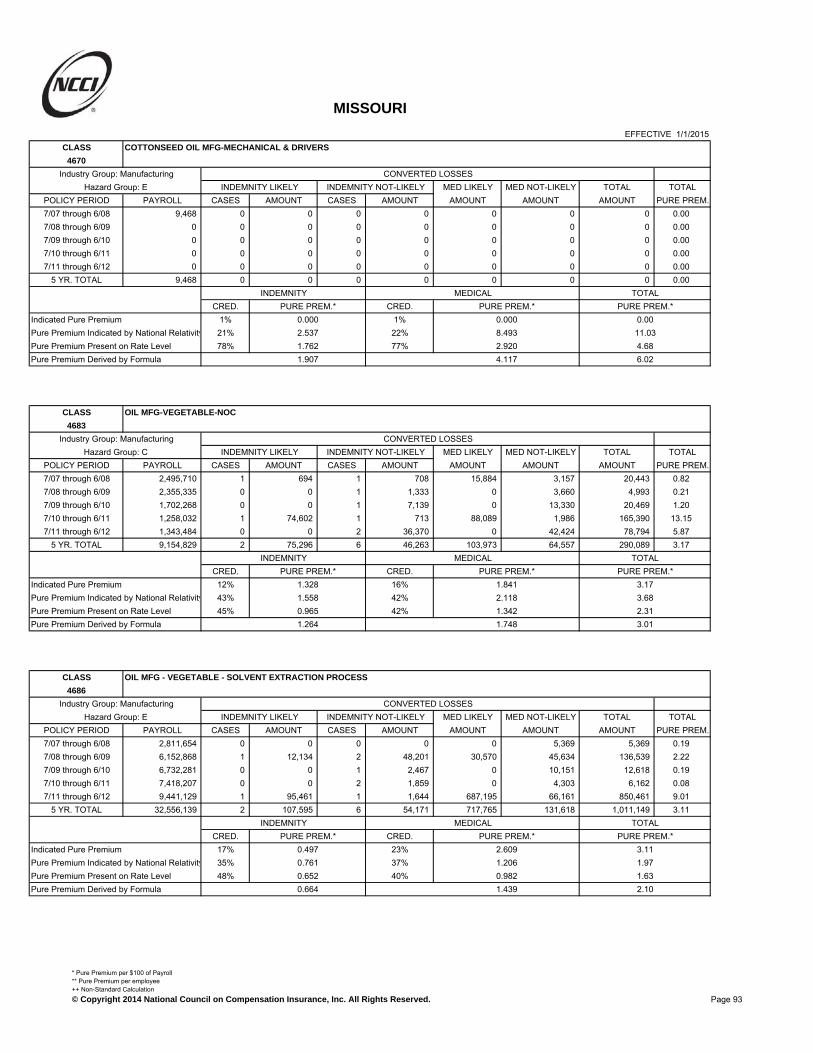
MISSOURI
EFFECTIVE 1/1/2015CLASS COTTONSEED OIL MFG-MECHANICAL & DRIVERS
4670
Industry Group: Manufacturing CONVERTED LOSSESHazard Group: E INDEMNITY LIKELY INDEMNITY NOT-LIKELY MED LIKELY MED NOT-LIKELY TOTAL TOTAL
POLICY PERIOD PAYROLL CASES AMOUNT CASES AMOUNT AMOUNT AMOUNT AMOUNT PURE PREM.7/07 through 6/08 9,468 0 0 0 0 0 0 0 0.007/08 through 6/09 0 0 0 0 0 0 0 0 0.007/09 through 6/10 0 0 0 0 0 0 0 0 0.007/10 through 6/11 0 0 0 0 0 0 0 0 0.007/11 through 6/12 0 0 0 0 0 0 0 0 0.00
5 YR. TOTAL 9,468 0 0 0 0 0 0 0 0.00INDEMNITY MEDICAL TOTAL
CRED. PURE PREM.* CRED. PURE PREM.* PURE PREM.*Indicated Pure Premium 1% 0.000 1% 0.000 0.00Pure Premium Indicated by National Relativity 21% 2.537 22% 8.493 11.03Pure Premium Present on Rate Level 78% 1.762 77% 2.920 4.68Pure Premium Derived by Formula 1.907 4.117 6.02
CLASS OIL MFG-VEGETABLE-NOC
4683
Industry Group: Manufacturing CONVERTED LOSSESHazard Group: C INDEMNITY LIKELY INDEMNITY NOT-LIKELY MED LIKELY MED NOT-LIKELY TOTAL TOTAL
POLICY PERIOD PAYROLL CASES AMOUNT CASES AMOUNT AMOUNT AMOUNT AMOUNT PURE PREM.7/07 through 6/08 2,495,710 1 694 1 708 15,884 3,157 20,443 0.827/08 through 6/09 2,355,335 0 0 1 1,333 0 3,660 4,993 0.217/09 through 6/10 1,702,268 0 0 1 7,139 0 13,330 20,469 1.207/10 through 6/11 1,258,032 1 74,602 1 713 88,089 1,986 165,390 13.157/11 through 6/12 1,343,484 0 0 2 36,370 0 42,424 78,794 5.87
5 YR. TOTAL 9,154,829 2 75,296 6 46,263 103,973 64,557 290,089 3.17INDEMNITY MEDICAL TOTAL
CRED. PURE PREM.* CRED. PURE PREM.* PURE PREM.*Indicated Pure Premium 12% 1.328 16% 1.841 3.17Pure Premium Indicated by National Relativity 43% 1.558 42% 2.118 3.68Pure Premium Present on Rate Level 45% 0.965 42% 1.342 2.31Pure Premium Derived by Formula 1.264 1.748 3.01
CLASS OIL MFG - VEGETABLE - SOLVENT EXTRACTION PROCESS
4686
Industry Group: Manufacturing CONVERTED LOSSESHazard Group: E INDEMNITY LIKELY INDEMNITY NOT-LIKELY MED LIKELY MED NOT-LIKELY TOTAL TOTAL
POLICY PERIOD PAYROLL CASES AMOUNT CASES AMOUNT AMOUNT AMOUNT AMOUNT PURE PREM.7/07 through 6/08 2,811,654 0 0 0 0 0 5,369 5,369 0.197/08 through 6/09 6,152,868 1 12,134 2 48,201 30,570 45,634 136,539 2.227/09 through 6/10 6,732,281 0 0 1 2,467 0 10,151 12,618 0.197/10 through 6/11 7,418,207 0 0 2 1,859 0 4,303 6,162 0.087/11 through 6/12 9,441,129 1 95,461 1 1,644 687,195 66,161 850,461 9.01
5 YR. TOTAL 32,556,139 2 107,595 6 54,171 717,765 131,618 1,011,149 3.11INDEMNITY MEDICAL TOTAL
CRED. PURE PREM.* CRED. PURE PREM.* PURE PREM.*Indicated Pure Premium 17% 0.497 23% 2.609 3.11Pure Premium Indicated by National Relativity 35% 0.761 37% 1.206 1.97Pure Premium Present on Rate Level 48% 0.652 40% 0.982 1.63Pure Premium Derived by Formula 0.664 1.439 2.10
Page 93
* Pure Premium per $100 of Payroll** Pure Premium per employee++ Non-Standard Calculation© Copyright 2014 National Council on Compensation Insurance, Inc. All Rights Reserved.

MISSOURI
EFFECTIVE 1/1/2015CLASS DENTAL LABORATORY
4692
Industry Group: Manufacturing CONVERTED LOSSESHazard Group: B INDEMNITY LIKELY INDEMNITY NOT-LIKELY MED LIKELY MED NOT-LIKELY TOTAL TOTAL
POLICY PERIOD PAYROLL CASES AMOUNT CASES AMOUNT AMOUNT AMOUNT AMOUNT PURE PREM.7/07 through 6/08 23,062,384 0 0 2 27,934 0 60,451 88,385 0.387/08 through 6/09 23,349,978 2 48,820 1 2,789 33,533 28,716 113,858 0.497/09 through 6/10 23,374,524 1 44,724 3 40,515 0 49,131 134,370 0.587/10 through 6/11 23,152,297 0 0 2 22,393 0 41,981 64,374 0.287/11 through 6/12 25,278,590 0 0 1 57,319 0 76,365 133,684 0.53
5 YR. TOTAL 118,217,773 3 93,544 9 150,950 33,533 256,644 534,671 0.45INDEMNITY MEDICAL TOTAL
CRED. PURE PREM.* CRED. PURE PREM.* PURE PREM.*Indicated Pure Premium 19% 0.207 24% 0.245 0.45Pure Premium Indicated by National Relativity 40% 0.193 38% 0.274 0.47Pure Premium Present on Rate Level 41% 0.213 38% 0.298 0.51Pure Premium Derived by Formula 0.204 0.276 0.48
CLASS PHARMACEUTICAL OR SURGICAL GOODS MFG NOC
4693
Industry Group: Manufacturing CONVERTED LOSSESHazard Group: C INDEMNITY LIKELY INDEMNITY NOT-LIKELY MED LIKELY MED NOT-LIKELY TOTAL TOTAL
POLICY PERIOD PAYROLL CASES AMOUNT CASES AMOUNT AMOUNT AMOUNT AMOUNT PURE PREM.7/07 through 6/08 88,254,434 1 34,052 9 52,134 28,145 105,442 219,773 0.257/08 through 6/09 247,267,691 3 68,501 16 255,744 47,253 450,137 821,635 0.337/09 through 6/10 249,540,075 5 138,051 13 295,257 178,475 393,319 1,005,102 0.407/10 through 6/11 121,873,229 7 256,565 13 159,600 227,279 294,694 938,138 0.777/11 through 6/12 122,394,992 0 0 6 70,757 0 139,483 210,240 0.17
5 YR. TOTAL 829,330,421 16 497,169 57 833,492 481,152 1,383,075 3,194,888 0.39INDEMNITY MEDICAL TOTAL
CRED. PURE PREM.* CRED. PURE PREM.* PURE PREM.*Indicated Pure Premium 41% 0.160 52% 0.225 0.39Pure Premium Indicated by National Relativity 29% 0.265 24% 0.490 0.76Pure Premium Present on Rate Level 30% 0.222 24% 0.299 0.52Pure Premium Derived by Formula 0.209 0.306 0.52
CLASS CORN PRODUCTS MFG
4703
Industry Group: Manufacturing CONVERTED LOSSESHazard Group: C INDEMNITY LIKELY INDEMNITY NOT-LIKELY MED LIKELY MED NOT-LIKELY TOTAL TOTAL
POLICY PERIOD PAYROLL CASES AMOUNT CASES AMOUNT AMOUNT AMOUNT AMOUNT PURE PREM.7/07 through 6/08 3,179,961 0 0 1 20,349 0 45,248 65,597 2.067/08 through 6/09 3,224,371 0 0 2 73,129 0 81,712 154,841 4.807/09 through 6/10 3,078,071 0 0 0 0 0 1,883 1,883 0.067/10 through 6/11 9,149,667 0 0 4 116,325 0 122,751 239,076 2.617/11 through 6/12 13,365,620 0 0 2 20,854 0 69,596 90,450 0.68
5 YR. TOTAL 31,997,690 0 0 9 230,657 0 321,190 551,847 1.73INDEMNITY MEDICAL TOTAL
CRED. PURE PREM.* CRED. PURE PREM.* PURE PREM.*Indicated Pure Premium 20% 0.721 27% 1.004 1.73Pure Premium Indicated by National Relativity 40% 0.808 36% 1.175 1.98Pure Premium Present on Rate Level 40% 0.916 37% 1.557 2.47Pure Premium Derived by Formula 0.834 1.270 2.10
Page 94
* Pure Premium per $100 of Payroll** Pure Premium per employee++ Non-Standard Calculation© Copyright 2014 National Council on Compensation Insurance, Inc. All Rights Reserved.

MISSOURI
EFFECTIVE 1/1/2015CLASS LARD REFINING
4716
Industry Group: Manufacturing CONVERTED LOSSESHazard Group: B INDEMNITY LIKELY INDEMNITY NOT-LIKELY MED LIKELY MED NOT-LIKELY TOTAL TOTAL
POLICY PERIOD PAYROLL CASES AMOUNT CASES AMOUNT AMOUNT AMOUNT AMOUNT PURE PREM.7/07 through 6/08 299,903 0 0 0 0 0 0 0 0.007/08 through 6/09 270,102 0 0 0 0 0 0 0 0.007/09 through 6/10 282,850 0 0 0 0 0 0 0 0.007/10 through 6/11 314,930 0 0 0 0 0 2,393 2,393 0.767/11 through 6/12 318,383 0 0 0 0 0 0 0 0.00
5 YR. TOTAL 1,486,168 0 0 0 0 0 2,393 2,393 0.16INDEMNITY MEDICAL TOTAL
CRED. PURE PREM.* CRED. PURE PREM.* PURE PREM.*Indicated Pure Premium 8% 0.000 8% 0.161 0.16Pure Premium Indicated by National Relativity 8% 2.337 8% 3.379 5.72Pure Premium Present on Rate Level 84% 1.920 84% 1.783 3.70Pure Premium Derived by Formula 1.800 1.781 3.58
CLASS BUTTER SUBSTITUTE MFG
4717
Industry Group: Manufacturing CONVERTED LOSSESHazard Group: A INDEMNITY LIKELY INDEMNITY NOT-LIKELY MED LIKELY MED NOT-LIKELY TOTAL TOTAL
POLICY PERIOD PAYROLL CASES AMOUNT CASES AMOUNT AMOUNT AMOUNT AMOUNT PURE PREM.7/07 through 6/08 4,431,702 1 22,364 1 23,806 27,682 28,177 102,029 2.307/08 through 6/09 4,657,365 0 0 1 804 0 26,008 26,812 0.587/09 through 6/10 5,081,931 0 0 0 0 0 4,005 4,005 0.087/10 through 6/11 5,780,780 0 0 1 11,603 0 17,437 29,040 0.507/11 through 6/12 5,403,876 1 77,638 1 15,444 38,917 36,032 168,031 3.11
5 YR. TOTAL 25,355,654 2 100,002 4 51,657 66,599 111,659 329,917 1.30INDEMNITY MEDICAL TOTAL
CRED. PURE PREM.* CRED. PURE PREM.* PURE PREM.*Indicated Pure Premium 15% 0.598 20% 0.703 1.30Pure Premium Indicated by National Relativity 27% 0.784 28% 1.696 2.48Pure Premium Present on Rate Level 58% 0.561 52% 0.921 1.48Pure Premium Derived by Formula 0.627 1.094 1.72
CLASS SOAP OR SYNTHETIC DETERGENT MFG
4720
Industry Group: Manufacturing CONVERTED LOSSESHazard Group: C INDEMNITY LIKELY INDEMNITY NOT-LIKELY MED LIKELY MED NOT-LIKELY TOTAL TOTAL
POLICY PERIOD PAYROLL CASES AMOUNT CASES AMOUNT AMOUNT AMOUNT AMOUNT PURE PREM.7/07 through 6/08 88,905,124 7 161,619 25 283,125 668,620 454,309 1,567,673 1.767/08 through 6/09 86,149,879 14 406,139 34 333,693 526,557 495,532 1,761,921 2.057/09 through 6/10 79,286,697 1 6,609 28 289,167 6,514 406,872 709,162 0.897/10 through 6/11 75,553,061 4 117,303 27 267,506 127,783 511,241 1,023,833 1.367/11 through 6/12 80,294,579 1 17,006 19 258,366 20,439 595,026 890,837 1.11
5 YR. TOTAL 410,189,340 27 708,676 133 1,431,857 1,349,913 2,462,980 5,953,426 1.45INDEMNITY MEDICAL TOTAL
CRED. PURE PREM.* CRED. PURE PREM.* PURE PREM.*Indicated Pure Premium 50% 0.522 66% 0.930 1.45Pure Premium Indicated by National Relativity 25% 0.695 17% 1.217 1.91Pure Premium Present on Rate Level 25% 0.721 17% 1.102 1.82Pure Premium Derived by Formula 0.615 1.008 1.62
Page 95
* Pure Premium per $100 of Payroll** Pure Premium per employee++ Non-Standard Calculation© Copyright 2014 National Council on Compensation Insurance, Inc. All Rights Reserved.

MISSOURI
EFFECTIVE 1/1/2015CLASS OIL REFINING-PETROLEUM-& DRIVERS
4740
Industry Group: Manufacturing CONVERTED LOSSESHazard Group: E INDEMNITY LIKELY INDEMNITY NOT-LIKELY MED LIKELY MED NOT-LIKELY TOTAL TOTAL
POLICY PERIOD PAYROLL CASES AMOUNT CASES AMOUNT AMOUNT AMOUNT AMOUNT PURE PREM.7/07 through 6/08 4,296,577 0 0 0 0 0 1,852 1,852 0.047/08 through 6/09 3,709,209 0 0 2 12,133 0 36,859 48,992 1.327/09 through 6/10 2,216,096 0 0 1 445 0 6,607 7,052 0.327/10 through 6/11 2,856,818 0 0 3 15,341 0 15,872 31,213 1.097/11 through 6/12 6,255,937 0 0 2 30,080 0 98,336 128,416 2.05
5 YR. TOTAL 19,334,637 0 0 8 57,999 0 159,526 217,525 1.13INDEMNITY MEDICAL TOTAL
CRED. PURE PREM.* CRED. PURE PREM.* PURE PREM.*Indicated Pure Premium 11% 0.300 15% 0.825 1.13Pure Premium Indicated by National Relativity 44% 0.329 42% 0.481 0.81Pure Premium Present on Rate Level 45% 0.371 43% 0.574 0.95Pure Premium Derived by Formula 0.345 0.573 0.92
CLASS ASPHALT OR TAR DISTILLING OR REFINING & DRIVERS
4741
Industry Group: Manufacturing CONVERTED LOSSESHazard Group: C INDEMNITY LIKELY INDEMNITY NOT-LIKELY MED LIKELY MED NOT-LIKELY TOTAL TOTAL
POLICY PERIOD PAYROLL CASES AMOUNT CASES AMOUNT AMOUNT AMOUNT AMOUNT PURE PREM.7/07 through 6/08 7,464,888 0 0 4 26,288 0 83,949 110,237 1.487/08 through 6/09 8,722,321 1 8,361 4 41,685 51,661 43,246 144,953 1.667/09 through 6/10 9,471,770 1 17,923 1 6,295 19,881 57,621 101,720 1.077/10 through 6/11 10,198,827 0 0 7 99,144 0 87,186 186,330 1.837/11 through 6/12 10,463,502 1 52,401 2 7,459 59,703 14,238 133,801 1.28
5 YR. TOTAL 46,321,308 3 78,685 18 180,871 131,245 286,240 677,041 1.46INDEMNITY MEDICAL TOTAL
CRED. PURE PREM.* CRED. PURE PREM.* PURE PREM.*Indicated Pure Premium 21% 0.560 30% 0.901 1.46Pure Premium Indicated by National Relativity 39% 0.775 35% 1.175 1.95Pure Premium Present on Rate Level 40% 0.737 35% 1.329 2.07Pure Premium Derived by Formula 0.715 1.147 1.86
CLASS SYNTHETIC RUBBER MFG
4751
Industry Group: Manufacturing CONVERTED LOSSESHazard Group: E INDEMNITY LIKELY INDEMNITY NOT-LIKELY MED LIKELY MED NOT-LIKELY TOTAL TOTAL
POLICY PERIOD PAYROLL CASES AMOUNT CASES AMOUNT AMOUNT AMOUNT AMOUNT PURE PREM.7/07 through 6/08 15,739 0 0 0 0 0 0 0 0.007/08 through 6/09 0 0 0 0 0 0 0 0 0.007/09 through 6/10 0 0 0 0 0 0 0 0 0.007/10 through 6/11 0 0 0 0 0 0 0 0 0.007/11 through 6/12 0 0 0 0 0 0 0 0 0.00
5 YR. TOTAL 15,739 0 0 0 0 0 0 0 0.00INDEMNITY MEDICAL TOTAL
CRED. PURE PREM.* CRED. PURE PREM.* PURE PREM.*Indicated Pure Premium 1% 0.000 1% 0.000 0.00Pure Premium Indicated by National Relativity 36% 0.641 38% 1.635 2.28Pure Premium Present on Rate Level 63% 0.682 61% 1.586 2.27Pure Premium Derived by Formula 0.660 1.589 2.25
Page 96
* Pure Premium per $100 of Payroll** Pure Premium per employee++ Non-Standard Calculation© Copyright 2014 National Council on Compensation Insurance, Inc. All Rights Reserved.

MISSOURI
EFFECTIVE 1/1/2015CLASS EXPLOSIVES OR AMMUNITION MFG: NOC & DRIVERS
4771
Industry Group: Manufacturing CONVERTED LOSSESHazard Group: G INDEMNITY LIKELY INDEMNITY NOT-LIKELY MED LIKELY MED NOT-LIKELY TOTAL TOTAL
POLICY PERIOD PAYROLL CASES AMOUNT CASES AMOUNT AMOUNT AMOUNT AMOUNT PURE PREM.7/07 through 6/08 103,591,577 10 385,266 33 306,069 473,370 524,590 1,689,295 1.637/08 through 6/09 115,474,405 3 266,469 40 1,038,488 229,403 837,841 2,372,201 2.057/09 through 6/10 113,311,360 5 812,528 30 495,662 595,858 897,768 2,801,816 2.477/10 through 6/11 125,402,585 10 389,325 24 520,120 1,061,427 749,473 2,720,345 2.177/11 through 6/12 131,877,350 10 297,162 32 496,465 175,877 892,031 1,861,535 1.41
5 YR. TOTAL 589,657,277 38 2,150,750 159 2,856,804 2,535,935 3,901,703 11,445,192 1.94INDEMNITY MEDICAL TOTAL
CRED. PURE PREM.* CRED. PURE PREM.* PURE PREM.*Indicated Pure Premium 60% 0.849 79% 1.092 1.94Pure Premium Indicated by National Relativity 20% 1.109 10% 2.152 3.26Pure Premium Present on Rate Level 20% 0.790 11% 1.194 1.98Pure Premium Derived by Formula 0.889 1.209 2.10
CLASS EXPLOSIVES DISTRIBUTORS & DRIVERS
4777
Industry Group: Manufacturing CONVERTED LOSSESHazard Group: G INDEMNITY LIKELY INDEMNITY NOT-LIKELY MED LIKELY MED NOT-LIKELY TOTAL TOTAL
POLICY PERIOD PAYROLL CASES AMOUNT CASES AMOUNT AMOUNT AMOUNT AMOUNT PURE PREM.7/07 through 6/08 3,796,789 1 24,315 5 44,854 22,431 110,852 202,452 5.337/08 through 6/09 1,669,832 0 0 1 1,826 0 10,176 12,002 0.727/09 through 6/10 1,141,201 0 0 0 0 0 0 0 0.007/10 through 6/11 1,167,430 1 14,569 0 0 35,900 6,028 56,497 4.847/11 through 6/12 1,265,868 0 0 0 0 0 2,392 2,392 0.19
5 YR. TOTAL 9,041,120 2 38,884 6 46,680 58,331 129,448 273,343 3.02INDEMNITY MEDICAL TOTAL
CRED. PURE PREM.* CRED. PURE PREM.* PURE PREM.*Indicated Pure Premium 14% 0.946 19% 2.077 3.02Pure Premium Indicated by National Relativity 33% 1.658 35% 2.284 3.94Pure Premium Present on Rate Level 53% 1.339 46% 2.220 3.56Pure Premium Derived by Formula 1.389 2.215 3.60
CLASS DRUG, MEDICINE OR PHARMACEUTICAL PREPARATION MFG & INCLUDES MFG OF
4825 INGREDIENTS
Industry Group: Manufacturing CONVERTED LOSSESHazard Group: E INDEMNITY LIKELY INDEMNITY NOT-LIKELY MED LIKELY MED NOT-LIKELY TOTAL TOTAL
POLICY PERIOD PAYROLL CASES AMOUNT CASES AMOUNT AMOUNT AMOUNT AMOUNT PURE PREM.7/07 through 6/08 191,310,239 1 15,056 15 241,847 0 224,064 480,967 0.257/08 through 6/09 154,029,721 3 126,858 15 236,880 142,057 417,884 923,679 0.607/09 through 6/10 94,815,428 3 471,406 12 256,995 485,496 288,540 1,502,437 1.587/10 through 6/11 87,299,568 1 4,400 11 111,666 4,691 277,691 398,448 0.467/11 through 6/12 107,843,713 2 20,819 7 91,093 30,710 244,801 387,423 0.36
5 YR. TOTAL 635,298,669 10 638,539 60 938,481 662,954 1,452,980 3,692,954 0.58INDEMNITY MEDICAL TOTAL
CRED. PURE PREM.* CRED. PURE PREM.* PURE PREM.*Indicated Pure Premium 42% 0.248 51% 0.333 0.58Pure Premium Indicated by National Relativity 29% 0.332 24% 0.504 0.84Pure Premium Present on Rate Level 29% 0.303 25% 0.379 0.68Pure Premium Derived by Formula 0.288 0.386 0.67
Page 97
* Pure Premium per $100 of Payroll** Pure Premium per employee++ Non-Standard Calculation© Copyright 2014 National Council on Compensation Insurance, Inc. All Rights Reserved.

MISSOURI
EFFECTIVE 1/1/2015CLASS CHEMICAL BLENDING AND MIXING NOC-ALL OPERATIONS & DRIVERS
4828
Industry Group: Manufacturing CONVERTED LOSSESHazard Group: D INDEMNITY LIKELY INDEMNITY NOT-LIKELY MED LIKELY MED NOT-LIKELY TOTAL TOTAL
POLICY PERIOD PAYROLL CASES AMOUNT CASES AMOUNT AMOUNT AMOUNT AMOUNT PURE PREM.7/07 through 6/08 40,598,431 5 81,486 18 265,283 122,360 484,750 953,879 2.357/08 through 6/09 33,336,417 2 38,310 12 227,445 12,094 446,782 724,631 2.177/09 through 6/10 28,114,955 1 94,675 7 77,661 192,610 134,074 499,020 1.787/10 through 6/11 32,502,438 3 166,429 9 119,162 160,546 190,916 637,053 1.967/11 through 6/12 44,580,943 3 81,041 19 254,533 103,084 554,801 993,459 2.23
5 YR. TOTAL 179,133,184 14 461,941 65 944,084 590,694 1,811,323 3,808,042 2.13INDEMNITY MEDICAL TOTAL
CRED. PURE PREM.* CRED. PURE PREM.* PURE PREM.*Indicated Pure Premium 37% 0.785 48% 1.341 2.13Pure Premium Indicated by National Relativity 31% 0.652 26% 0.958 1.61Pure Premium Present on Rate Level 32% 0.765 26% 1.125 1.89Pure Premium Derived by Formula 0.737 1.185 1.92
CLASS CHEMICAL MANUFACTURING NOC-ALL OPERATIONS & DRIVERS
4829
Industry Group: Manufacturing CONVERTED LOSSESHazard Group: F INDEMNITY LIKELY INDEMNITY NOT-LIKELY MED LIKELY MED NOT-LIKELY TOTAL TOTAL
POLICY PERIOD PAYROLL CASES AMOUNT CASES AMOUNT AMOUNT AMOUNT AMOUNT PURE PREM.7/07 through 6/08 103,772,954 10 501,255 12 123,309 991,625 289,744 1,905,933 1.847/08 through 6/09 103,734,978 5 58,415 8 101,966 15,374 274,826 450,581 0.447/09 through 6/10 129,447,769 4 163,272 14 204,179 147,942 339,685 855,078 0.667/10 through 6/11 143,190,983 3 79,277 13 224,944 125,822 458,526 888,569 0.627/11 through 6/12 133,360,531 4 194,120 17 334,525 179,246 607,074 1,314,965 0.99
5 YR. TOTAL 613,507,215 26 996,339 64 988,923 1,460,009 1,969,855 5,415,126 0.88INDEMNITY MEDICAL TOTAL
CRED. PURE PREM.* CRED. PURE PREM.* PURE PREM.*Indicated Pure Premium 44% 0.324 58% 0.559 0.88Pure Premium Indicated by National Relativity 28% 0.470 21% 0.658 1.13Pure Premium Present on Rate Level 28% 0.366 21% 0.523 0.89Pure Premium Derived by Formula 0.377 0.572 0.95
CLASS SPORTING GOODS MFG NOC
4902
Industry Group: Manufacturing CONVERTED LOSSESHazard Group: B INDEMNITY LIKELY INDEMNITY NOT-LIKELY MED LIKELY MED NOT-LIKELY TOTAL TOTAL
POLICY PERIOD PAYROLL CASES AMOUNT CASES AMOUNT AMOUNT AMOUNT AMOUNT PURE PREM.7/07 through 6/08 8,137,200 1 345,877 10 107,395 325,423 252,478 1,031,173 12.677/08 through 6/09 7,937,578 1 9,425 3 25,311 16,086 75,279 126,101 1.597/09 through 6/10 8,662,049 1 34,151 3 6,540 9,947 56,871 107,509 1.247/10 through 6/11 11,929,473 2 139,578 4 5,360 365,858 70,792 581,588 4.887/11 through 6/12 10,616,798 0 0 2 15,068 0 8,770 23,838 0.23
5 YR. TOTAL 47,283,098 5 529,031 22 159,674 717,314 464,190 1,870,209 3.96INDEMNITY MEDICAL TOTAL
CRED. PURE PREM.* CRED. PURE PREM.* PURE PREM.*Indicated Pure Premium 26% 1.457 36% 2.499 3.96Pure Premium Indicated by National Relativity 37% 0.834 32% 1.525 2.36Pure Premium Present on Rate Level 37% 1.298 32% 2.147 3.45Pure Premium Derived by Formula 1.168 2.075 3.24
Page 98
* Pure Premium per $100 of Payroll** Pure Premium per employee++ Non-Standard Calculation© Copyright 2014 National Council on Compensation Insurance, Inc. All Rights Reserved.

MISSOURI
EFFECTIVE 1/1/2015CLASS PHOTOGRAPHIC SUPPLIES MFG
4923
Industry Group: Manufacturing CONVERTED LOSSESHazard Group: C INDEMNITY LIKELY INDEMNITY NOT-LIKELY MED LIKELY MED NOT-LIKELY TOTAL TOTAL
POLICY PERIOD PAYROLL CASES AMOUNT CASES AMOUNT AMOUNT AMOUNT AMOUNT PURE PREM.7/07 through 6/08 18,467,341 1 70,245 6 123,501 64,618 202,198 460,562 2.497/08 through 6/09 15,547,755 1 44,356 2 27,294 4,493 53,390 129,533 0.837/09 through 6/10 15,776,466 1 45,116 1 17,242 42,223 84,355 188,936 1.207/10 through 6/11 15,014,793 1 43,719 3 175,562 52,488 254,653 526,422 3.517/11 through 6/12 15,175,158 1 37,540 4 58,815 15,225 97,427 209,007 1.38
5 YR. TOTAL 79,981,513 5 240,976 16 402,414 179,047 692,023 1,514,460 1.89INDEMNITY MEDICAL TOTAL
CRED. PURE PREM.* CRED. PURE PREM.* PURE PREM.*Indicated Pure Premium 20% 0.804 29% 1.089 1.89Pure Premium Indicated by National Relativity 40% 0.313 35% 0.579 0.89Pure Premium Present on Rate Level 40% 0.393 36% 0.748 1.14Pure Premium Derived by Formula 0.443 0.788 1.23
CLASS SODA WATER FOUNTAIN OR APPARATUS MFG.
4940
Industry Group: Manufacturing CONVERTED LOSSESHazard Group: E INDEMNITY LIKELY INDEMNITY NOT-LIKELY MED LIKELY MED NOT-LIKELY TOTAL TOTAL
POLICY PERIOD PAYROLL CASES AMOUNT CASES AMOUNT AMOUNT AMOUNT AMOUNT PURE PREM.7/07 through 6/08 0 0 0 0 0 0 0 0 0.007/08 through 6/09 0 0 0 0 0 0 0 0 0.007/09 through 6/10 0 0 0 0 0 0 0 0 0.007/10 through 6/11 0 0 0 0 0 0 0 0 0.007/11 through 6/12 0 0 0 0 0 0 0 0 0.00
5 YR. TOTAL 0 0 0 0 0 0 0 0 0.00INDEMNITY MEDICAL TOTAL
CRED. PURE PREM.* CRED. PURE PREM.* PURE PREM.*Indicated Pure Premium 0% 0.000 0% 0.000 0.00Pure Premium Indicated by National Relativity 18% 0.714 19% 1.430 2.14Pure Premium Present on Rate Level 82% 0.807 81% 0.703 1.51Pure Premium Derived by Formula 0.790 0.841 1.63
CLASS CEILING INSTALLATION-SUSPENDED ACOUSTICAL GRID TYPE
5020
Industry Group: Contracting CONVERTED LOSSESHazard Group: E INDEMNITY LIKELY INDEMNITY NOT-LIKELY MED LIKELY MED NOT-LIKELY TOTAL TOTAL
POLICY PERIOD PAYROLL CASES AMOUNT CASES AMOUNT AMOUNT AMOUNT AMOUNT PURE PREM.7/07 through 6/08 10,593,626 1 16,706 1 1,275 20,983 8,593 47,557 0.457/08 through 6/09 9,582,762 0 0 3 46,004 0 125,161 171,165 1.797/09 through 6/10 7,754,181 0 0 1 4,630 0 5,268 9,898 0.137/10 through 6/11 6,232,144 0 0 4 52,733 0 55,358 108,091 1.737/11 through 6/12 6,772,143 0 0 3 74,224 0 181,187 255,411 3.77
5 YR. TOTAL 40,934,856 1 16,706 12 178,866 20,983 375,567 592,122 1.45INDEMNITY MEDICAL TOTAL
CRED. PURE PREM.* CRED. PURE PREM.* PURE PREM.*Indicated Pure Premium 29% 0.478 34% 0.969 1.45Pure Premium Indicated by National Relativity 35% 2.167 33% 2.540 4.71Pure Premium Present on Rate Level 36% 1.902 33% 2.124 4.03Pure Premium Derived by Formula 1.582 1.869 3.45
Page 99
* Pure Premium per $100 of Payroll** Pure Premium per employee++ Non-Standard Calculation© Copyright 2014 National Council on Compensation Insurance, Inc. All Rights Reserved.

MISSOURI
EFFECTIVE 1/1/2015CLASS MASONRY NOC
5022
Industry Group: Contracting CONVERTED LOSSESHazard Group: F INDEMNITY LIKELY INDEMNITY NOT-LIKELY MED LIKELY MED NOT-LIKELY TOTAL TOTAL
POLICY PERIOD PAYROLL CASES AMOUNT CASES AMOUNT AMOUNT AMOUNT AMOUNT PURE PREM.7/07 through 6/08 157,664,843 32 1,663,115 94 2,743,950 2,423,596 3,385,452 10,216,113 6.487/08 through 6/09 127,777,428 24 1,838,418 77 1,892,932 2,612,807 2,405,123 8,749,280 6.857/09 through 6/10 100,089,342 15 1,236,667 55 1,394,071 1,414,433 1,803,527 5,848,698 5.847/10 through 6/11 105,138,451 9 697,955 36 934,925 950,001 1,559,773 4,142,654 3.947/11 through 6/12 96,666,232 10 1,288,773 49 2,068,942 1,020,256 1,954,904 6,332,875 6.55
5 YR. TOTAL 587,336,296 90 6,724,928 311 9,034,820 8,421,093 11,108,779 35,289,620 6.01INDEMNITY MEDICAL TOTAL
CRED. PURE PREM.* CRED. PURE PREM.* PURE PREM.*Indicated Pure Premium 92% 2.683 100% 3.325 6.01Pure Premium Indicated by National Relativity 4% 2.927 0% 3.968 6.90Pure Premium Present on Rate Level 4% 2.494 0% 3.130 5.62Pure Premium Derived by Formula 2.685 3.325 6.01
CLASS PAINTING: METAL STRUCTURES-OVER TWO STORIES IN HEIGHT-& DRIVERS
5037
Industry Group: Contracting CONVERTED LOSSESHazard Group: G INDEMNITY LIKELY INDEMNITY NOT-LIKELY MED LIKELY MED NOT-LIKELY TOTAL TOTAL
POLICY PERIOD PAYROLL CASES AMOUNT CASES AMOUNT AMOUNT AMOUNT AMOUNT PURE PREM.7/07 through 6/08 271,911 1 154,069 0 0 116,060 0 270,129 99.357/08 through 6/09 276,157 0 0 0 0 0 6,056 6,056 2.197/09 through 6/10 288,496 0 0 0 0 0 0 0 0.007/10 through 6/11 846,043 0 0 0 0 0 0 0 0.007/11 through 6/12 1,013,794 0 0 1 192,602 0 122,443 315,045 31.08
5 YR. TOTAL 2,696,401 1 154,069 1 192,602 116,060 128,499 591,230 21.93INDEMNITY MEDICAL TOTAL
CRED. PURE PREM.* CRED. PURE PREM.* PURE PREM.*Indicated Pure Premium 20% 12.857 21% 9.070 21.93Pure Premium Indicated by National Relativity 30% 7.153 32% 7.843 15.00Pure Premium Present on Rate Level 50% 11.347 47% 9.588 20.94Pure Premium Derived by Formula 10.391 8.921 19.31
CLASS IRON OR STEEL: ERECTION-FRAME STRUCTURES
5040
Industry Group: Contracting CONVERTED LOSSESHazard Group: G INDEMNITY LIKELY INDEMNITY NOT-LIKELY MED LIKELY MED NOT-LIKELY TOTAL TOTAL
POLICY PERIOD PAYROLL CASES AMOUNT CASES AMOUNT AMOUNT AMOUNT AMOUNT PURE PREM.7/07 through 6/08 15,435,081 3 355,800 17 281,323 630,378 657,768 1,925,269 12.477/08 through 6/09 18,174,634 6 885,885 13 519,173 1,994,346 404,344 3,803,748 20.937/09 through 6/10 12,109,727 3 729,431 8 363,219 752,374 341,054 2,186,078 18.057/10 through 6/11 11,913,361 1 131,092 7 235,724 115,898 924,752 1,407,466 11.817/11 through 6/12 15,359,900 6 437,104 14 390,724 830,251 532,427 2,190,506 14.26
5 YR. TOTAL 72,992,703 19 2,539,312 59 1,790,163 4,323,247 2,860,345 11,513,067 15.77INDEMNITY MEDICAL TOTAL
CRED. PURE PREM.* CRED. PURE PREM.* PURE PREM.*Indicated Pure Premium 61% 5.931 80% 9.842 15.77Pure Premium Indicated by National Relativity 19% 4.063 10% 4.924 8.99Pure Premium Present on Rate Level 20% 7.177 10% 10.465 17.64Pure Premium Derived by Formula 5.825 9.413 15.24
Page 100
* Pure Premium per $100 of Payroll** Pure Premium per employee++ Non-Standard Calculation© Copyright 2014 National Council on Compensation Insurance, Inc. All Rights Reserved.

MISSOURI
EFFECTIVE 1/1/2015CLASS IRON OR STEEL: ERECTION NOC
5057
Industry Group: Contracting CONVERTED LOSSESHazard Group: G INDEMNITY LIKELY INDEMNITY NOT-LIKELY MED LIKELY MED NOT-LIKELY TOTAL TOTAL
POLICY PERIOD PAYROLL CASES AMOUNT CASES AMOUNT AMOUNT AMOUNT AMOUNT PURE PREM.7/07 through 6/08 75,646,133 6 788,806 36 784,560 915,316 963,740 3,452,422 4.567/08 through 6/09 47,712,302 8 981,605 18 539,220 747,176 714,418 2,982,419 6.257/09 through 6/10 22,168,149 6 559,223 5 245,784 427,450 280,363 1,512,820 6.827/10 through 6/11 18,710,066 3 220,609 13 645,304 207,354 542,482 1,615,749 8.647/11 through 6/12 20,711,338 2 57,149 7 301,516 34,185 300,886 693,736 3.35
5 YR. TOTAL 184,947,988 25 2,607,392 79 2,516,384 2,331,481 2,801,889 10,257,146 5.55INDEMNITY MEDICAL TOTAL
CRED. PURE PREM.* CRED. PURE PREM.* PURE PREM.*Indicated Pure Premium 61% 2.770 72% 2.776 5.55Pure Premium Indicated by National Relativity 19% 1.903 14% 2.576 4.48Pure Premium Present on Rate Level 20% 2.850 14% 3.139 5.99Pure Premium Derived by Formula 2.621 2.799 5.42
CLASS IRON OR STEEL: ERECTION-FRAME STRUCTURES NOT OVER TWO STORIES IN HEIGHT
5059
Industry Group: Contracting CONVERTED LOSSESHazard Group: G INDEMNITY LIKELY INDEMNITY NOT-LIKELY MED LIKELY MED NOT-LIKELY TOTAL TOTAL
POLICY PERIOD PAYROLL CASES AMOUNT CASES AMOUNT AMOUNT AMOUNT AMOUNT PURE PREM.7/07 through 6/08 3,529,684 1 150,733 13 169,066 164,751 288,080 772,630 21.897/08 through 6/09 2,257,362 2 110,307 2 256,592 75,233 618,440 1,060,572 46.987/09 through 6/10 1,798,840 2 60,739 3 16,155 106,101 26,540 209,535 11.657/10 through 6/11 1,843,420 1 97,133 2 40,913 85,982 54,886 278,914 15.137/11 through 6/12 1,904,740 1 88,535 6 133,883 36,561 196,307 455,286 23.90
5 YR. TOTAL 11,334,046 7 507,447 26 616,609 468,628 1,184,253 2,776,937 24.50INDEMNITY MEDICAL TOTAL
CRED. PURE PREM.* CRED. PURE PREM.* PURE PREM.*Indicated Pure Premium 38% 9.918 47% 14.583 24.50Pure Premium Indicated by National Relativity 31% 5.789 26% 10.221 16.01Pure Premium Present on Rate Level 31% 13.581 27% 18.102 31.68Pure Premium Derived by Formula 9.774 14.399 24.17
CLASS BRIDGE BUILDING-METAL
5067
Industry Group: Contracting CONVERTED LOSSESHazard Group: G INDEMNITY LIKELY INDEMNITY NOT-LIKELY MED LIKELY MED NOT-LIKELY TOTAL TOTAL
POLICY PERIOD PAYROLL CASES AMOUNT CASES AMOUNT AMOUNT AMOUNT AMOUNT PURE PREM.7/07 through 6/08 68,148 0 0 0 0 0 0 0 0.007/08 through 6/09 271,113 0 0 0 0 0 0 0 0.007/09 through 6/10 279,701 0 0 1 4,664 0 38,343 43,007 15.387/10 through 6/11 88,465 0 0 1 189,494 0 189,279 378,773 428.167/11 through 6/12 536,669 0 0 1 20,398 0 9,347 29,745 5.54
5 YR. TOTAL 1,244,096 0 0 3 214,556 0 236,969 451,525 36.29INDEMNITY MEDICAL TOTAL
CRED. PURE PREM.* CRED. PURE PREM.* PURE PREM.*Indicated Pure Premium 8% 17.246 11% 19.047 36.29Pure Premium Indicated by National Relativity 6% 0.048 6% 5.082 5.13Pure Premium Present on Rate Level 86% 2.901 83% 4.352 7.25Pure Premium Derived by Formula 3.877 6.012 9.89
Page 101
* Pure Premium per $100 of Payroll** Pure Premium per employee++ Non-Standard Calculation© Copyright 2014 National Council on Compensation Insurance, Inc. All Rights Reserved.

MISSOURI
EFFECTIVE 1/1/2015CLASS IRON OR STEEL: ERECTION-CONSTRUCTION OF DWELLINGS NOT OVER TWO STORIES IN
5069 HEIGHT
Industry Group: Contracting CONVERTED LOSSESHazard Group: G INDEMNITY LIKELY INDEMNITY NOT-LIKELY MED LIKELY MED NOT-LIKELY TOTAL TOTAL
POLICY PERIOD PAYROLL CASES AMOUNT CASES AMOUNT AMOUNT AMOUNT AMOUNT PURE PREM.7/07 through 6/08 68,775 0 0 0 0 0 0 0 0.007/08 through 6/09 49,675 0 0 0 0 0 0 0 0.007/09 through 6/10 34,309 0 0 0 0 0 0 0 0.007/10 through 6/11 2,029 0 0 0 0 0 0 0 0.007/11 through 6/12 1,426 0 0 0 0 0 0 0 0.00
5 YR. TOTAL 156,214 0 0 0 0 0 0 0 0.00INDEMNITY MEDICAL TOTAL
CRED. PURE PREM.* CRED. PURE PREM.* PURE PREM.*Indicated Pure Premium 7% 0.000 7% 0.000 0.00Pure Premium Indicated by National Relativity 10% 0.871 11% 1.195 2.07Pure Premium Present on Rate Level 83% 13.763 82% 10.797 24.56Pure Premium Derived by Formula 11.510 8.985 20.50
CLASS DOOR AND WINDOW INSTALLATION - ALL TYPES - RESIDENTIAL AND COMMERCIAL
5102
Industry Group: Contracting CONVERTED LOSSESHazard Group: F INDEMNITY LIKELY INDEMNITY NOT-LIKELY MED LIKELY MED NOT-LIKELY TOTAL TOTAL
POLICY PERIOD PAYROLL CASES AMOUNT CASES AMOUNT AMOUNT AMOUNT AMOUNT PURE PREM.7/07 through 6/08 35,223,592 3 94,644 24 555,039 135,290 975,137 1,760,110 5.007/08 through 6/09 26,552,408 0 0 15 439,291 0 964,580 1,403,871 5.297/09 through 6/10 24,377,596 1 67,747 11 257,800 39,127 343,136 707,810 2.907/10 through 6/11 26,575,632 4 299,700 15 348,149 421,217 599,839 1,668,905 6.287/11 through 6/12 25,965,856 5 417,396 12 374,306 989,238 589,892 2,370,832 9.13
5 YR. TOTAL 138,695,084 13 879,487 77 1,974,585 1,584,872 3,472,584 7,911,528 5.70INDEMNITY MEDICAL TOTAL
CRED. PURE PREM.* CRED. PURE PREM.* PURE PREM.*Indicated Pure Premium 48% 2.058 61% 3.646 5.70Pure Premium Indicated by National Relativity 26% 2.260 19% 3.168 5.43Pure Premium Present on Rate Level 26% 2.005 20% 2.817 4.82Pure Premium Derived by Formula 2.097 3.389 5.49
CLASS FURNITURE OR FIXTURES INSTALLATION-PORTABLE-NOC
5146
Industry Group: Contracting CONVERTED LOSSESHazard Group: E INDEMNITY LIKELY INDEMNITY NOT-LIKELY MED LIKELY MED NOT-LIKELY TOTAL TOTAL
POLICY PERIOD PAYROLL CASES AMOUNT CASES AMOUNT AMOUNT AMOUNT AMOUNT PURE PREM.7/07 through 6/08 31,597,169 4 244,957 19 255,427 422,327 444,450 1,367,161 4.337/08 through 6/09 28,715,918 4 157,531 19 726,595 80,635 558,997 1,523,758 5.317/09 through 6/10 28,827,958 1 9,001 19 202,531 19,466 348,751 579,749 2.017/10 through 6/11 29,787,883 4 495,756 21 417,798 92,585 593,884 1,600,023 5.377/11 through 6/12 29,655,196 5 382,471 16 237,338 493,439 361,920 1,475,168 4.97
5 YR. TOTAL 148,584,124 18 1,289,716 94 1,839,689 1,108,452 2,308,002 6,545,859 4.41INDEMNITY MEDICAL TOTAL
CRED. PURE PREM.* CRED. PURE PREM.* PURE PREM.*Indicated Pure Premium 50% 2.106 60% 2.299 4.41Pure Premium Indicated by National Relativity 25% 1.805 20% 2.528 4.33Pure Premium Present on Rate Level 25% 2.111 20% 2.539 4.65Pure Premium Derived by Formula 2.032 2.393 4.43
Page 102
* Pure Premium per $100 of Payroll** Pure Premium per employee++ Non-Standard Calculation© Copyright 2014 National Council on Compensation Insurance, Inc. All Rights Reserved.

MISSOURI
EFFECTIVE 1/1/2015CLASS ELEVATOR ERECTION OR REPAIR
5160
Industry Group: Contracting CONVERTED LOSSESHazard Group: F INDEMNITY LIKELY INDEMNITY NOT-LIKELY MED LIKELY MED NOT-LIKELY TOTAL TOTAL
POLICY PERIOD PAYROLL CASES AMOUNT CASES AMOUNT AMOUNT AMOUNT AMOUNT PURE PREM.7/07 through 6/08 34,656,886 1 210,927 11 256,169 125,881 281,315 874,292 2.527/08 through 6/09 33,121,188 4 257,052 5 60,326 333,357 151,938 802,673 2.427/09 through 6/10 33,213,470 2 247,458 7 110,803 167,559 235,092 760,912 2.297/10 through 6/11 32,835,921 1 48,152 5 129,826 75,158 707,907 961,043 2.937/11 through 6/12 25,097,256 3 272,270 9 123,853 223,450 174,709 794,282 3.16
5 YR. TOTAL 158,924,721 11 1,035,859 37 680,977 925,405 1,550,961 4,193,202 2.64INDEMNITY MEDICAL TOTAL
CRED. PURE PREM.* CRED. PURE PREM.* PURE PREM.*Indicated Pure Premium 39% 1.080 49% 1.558 2.64Pure Premium Indicated by National Relativity 30% 1.069 25% 1.190 2.26Pure Premium Present on Rate Level 31% 1.057 26% 1.440 2.50Pure Premium Derived by Formula 1.070 1.435 2.51
CLASS PLUMBING NOC & DRIVERS
5183
Industry Group: Contracting CONVERTED LOSSESHazard Group: E INDEMNITY LIKELY INDEMNITY NOT-LIKELY MED LIKELY MED NOT-LIKELY TOTAL TOTAL
POLICY PERIOD PAYROLL CASES AMOUNT CASES AMOUNT AMOUNT AMOUNT AMOUNT PURE PREM.7/07 through 6/08 411,969,655 33 1,790,128 145 3,263,828 2,871,118 4,627,088 12,552,162 3.057/08 through 6/09 355,673,869 35 3,634,847 131 3,793,546 3,879,361 4,148,445 15,456,199 4.357/09 through 6/10 346,382,852 37 1,668,908 102 2,722,136 2,585,771 3,469,867 10,446,682 3.027/10 through 6/11 330,948,297 26 1,516,318 109 2,363,128 2,885,309 3,335,263 10,100,018 3.057/11 through 6/12 345,931,457 19 1,444,248 124 2,920,654 1,204,945 4,799,447 10,369,294 3.00
5 YR. TOTAL 1,790,906,130 150 10,054,449 611 15,063,292 13,426,504 20,380,110 58,924,355 3.29INDEMNITY MEDICAL TOTAL
CRED. PURE PREM.* CRED. PURE PREM.* PURE PREM.*Indicated Pure Premium 100% 1.403 100% 1.888 3.29Pure Premium Indicated by National Relativity 0% 1.294 0% 1.607 2.90Pure Premium Present on Rate Level 0% 1.590 0% 1.964 3.55Pure Premium Derived by Formula 1.403 1.888 3.29
CLASS AUTOMATIC SPRINKLER INSTALLATION & DRIVERS
5188
Industry Group: Contracting CONVERTED LOSSESHazard Group: E INDEMNITY LIKELY INDEMNITY NOT-LIKELY MED LIKELY MED NOT-LIKELY TOTAL TOTAL
POLICY PERIOD PAYROLL CASES AMOUNT CASES AMOUNT AMOUNT AMOUNT AMOUNT PURE PREM.7/07 through 6/08 45,182,177 3 844,250 13 395,908 380,990 487,818 2,108,966 4.677/08 through 6/09 42,501,114 4 47,655 17 290,460 38,899 353,066 730,080 1.727/09 through 6/10 37,725,209 2 56,292 10 150,424 18,338 225,380 450,434 1.197/10 through 6/11 33,826,374 4 219,684 6 175,987 138,273 240,104 774,048 2.297/11 through 6/12 36,337,328 1 72,148 5 146,315 108,086 152,196 478,745 1.32
5 YR. TOTAL 195,572,202 14 1,240,029 51 1,159,094 684,586 1,458,564 4,542,273 2.32INDEMNITY MEDICAL TOTAL
CRED. PURE PREM.* CRED. PURE PREM.* PURE PREM.*Indicated Pure Premium 50% 1.227 55% 1.096 2.32Pure Premium Indicated by National Relativity 25% 1.618 22% 1.904 3.52Pure Premium Present on Rate Level 25% 1.643 23% 1.541 3.18Pure Premium Derived by Formula 1.429 1.376 2.81
Page 103
* Pure Premium per $100 of Payroll** Pure Premium per employee++ Non-Standard Calculation© Copyright 2014 National Council on Compensation Insurance, Inc. All Rights Reserved.

MISSOURI
EFFECTIVE 1/1/2015CLASS ELECTRICAL WIRING-WITHIN BUILDINGS & DRIVERS
5190
Industry Group: Contracting CONVERTED LOSSESHazard Group: E INDEMNITY LIKELY INDEMNITY NOT-LIKELY MED LIKELY MED NOT-LIKELY TOTAL TOTAL
POLICY PERIOD PAYROLL CASES AMOUNT CASES AMOUNT AMOUNT AMOUNT AMOUNT PURE PREM.7/07 through 6/08 533,352,542 47 3,754,075 185 4,895,149 4,800,643 6,318,194 19,768,061 3.717/08 through 6/09 498,044,503 29 1,312,054 145 3,126,454 1,352,124 3,980,995 9,771,627 1.967/09 through 6/10 386,802,123 23 1,506,338 115 2,763,208 1,693,289 3,331,877 9,294,712 2.407/10 through 6/11 363,660,362 21 1,667,848 104 2,492,087 2,182,493 3,794,110 10,136,538 2.797/11 through 6/12 379,376,191 24 2,186,590 84 2,079,853 2,725,279 3,302,879 10,294,601 2.71
5 YR. TOTAL 2,161,235,721 144 10,426,905 633 15,356,751 12,753,828 20,728,055 59,265,539 2.74INDEMNITY MEDICAL TOTAL
CRED. PURE PREM.* CRED. PURE PREM.* PURE PREM.*Indicated Pure Premium 100% 1.193 100% 1.549 2.74Pure Premium Indicated by National Relativity 0% 1.103 0% 1.489 2.59Pure Premium Present on Rate Level 0% 1.120 0% 1.408 2.53Pure Premium Derived by Formula 1.193 1.549 2.74
CLASS OFFICE MACHINE INSTALLATION, INSPECTION, ADJUSTMENT OR REPAIR
5191
Industry Group: Goods and Services CONVERTED LOSSESHazard Group: C INDEMNITY LIKELY INDEMNITY NOT-LIKELY MED LIKELY MED NOT-LIKELY TOTAL TOTAL
POLICY PERIOD PAYROLL CASES AMOUNT CASES AMOUNT AMOUNT AMOUNT AMOUNT PURE PREM.7/07 through 6/08 318,069,090 8 771,540 40 929,912 203,354 780,706 2,685,512 0.847/08 through 6/09 302,901,240 9 306,211 49 645,276 332,077 940,769 2,224,333 0.737/09 through 6/10 299,630,225 19 1,623,730 41 787,972 1,086,612 1,075,143 4,573,457 1.537/10 through 6/11 307,768,993 14 475,164 37 463,114 457,244 1,162,642 2,558,164 0.837/11 through 6/12 328,265,231 3 106,912 33 528,534 65,733 1,024,010 1,725,189 0.53
5 YR. TOTAL 1,556,634,779 53 3,283,557 200 3,354,808 2,145,020 4,983,270 13,766,655 0.88INDEMNITY MEDICAL TOTAL
CRED. PURE PREM.* CRED. PURE PREM.* PURE PREM.*Indicated Pure Premium 67% 0.426 79% 0.458 0.88Pure Premium Indicated by National Relativity 16% 0.328 10% 0.459 0.79Pure Premium Present on Rate Level 17% 0.409 11% 0.455 0.86Pure Premium Derived by Formula 0.407 0.458 0.87
CLASS VENDING OR COIN OPERATED MACHINES-INSTALLATION, SERVICE OR REPAIR &
5192 SALESPERSONS, DRIVERS
Industry Group: Goods and Services CONVERTED LOSSESHazard Group: C INDEMNITY LIKELY INDEMNITY NOT-LIKELY MED LIKELY MED NOT-LIKELY TOTAL TOTAL
POLICY PERIOD PAYROLL CASES AMOUNT CASES AMOUNT AMOUNT AMOUNT AMOUNT PURE PREM.7/07 through 6/08 46,857,175 8 120,968 32 324,942 87,873 597,018 1,130,801 2.417/08 through 6/09 47,934,049 3 209,255 25 271,338 253,698 574,947 1,309,238 2.737/09 through 6/10 48,801,471 4 230,467 22 285,635 89,019 416,432 1,021,553 2.097/10 through 6/11 54,619,920 2 321,093 21 274,372 168,934 460,592 1,224,991 2.247/11 through 6/12 55,038,750 5 227,732 11 273,534 151,887 513,729 1,166,882 2.12
5 YR. TOTAL 253,251,365 22 1,109,515 111 1,429,821 751,411 2,562,718 5,853,465 2.31INDEMNITY MEDICAL TOTAL
CRED. PURE PREM.* CRED. PURE PREM.* PURE PREM.*Indicated Pure Premium 50% 1.003 63% 1.309 2.31Pure Premium Indicated by National Relativity 25% 1.279 18% 1.780 3.06Pure Premium Present on Rate Level 25% 1.189 19% 1.606 2.80Pure Premium Derived by Formula 1.119 1.450 2.57
Page 104
* Pure Premium per $100 of Payroll** Pure Premium per employee++ Non-Standard Calculation© Copyright 2014 National Council on Compensation Insurance, Inc. All Rights Reserved.

MISSOURI
EFFECTIVE 1/1/2015CLASS CONCRETE CONSTRUCTION NOC
5213
Industry Group: Contracting CONVERTED LOSSESHazard Group: F INDEMNITY LIKELY INDEMNITY NOT-LIKELY MED LIKELY MED NOT-LIKELY TOTAL TOTAL
POLICY PERIOD PAYROLL CASES AMOUNT CASES AMOUNT AMOUNT AMOUNT AMOUNT PURE PREM.7/07 through 6/08 153,356,816 12 633,201 77 1,599,893 841,066 2,262,348 5,336,508 3.487/08 through 6/09 114,681,996 12 1,084,686 63 1,835,027 1,341,890 2,266,075 6,527,678 5.697/09 through 6/10 96,231,242 10 1,196,912 46 1,331,933 1,646,316 1,998,605 6,173,766 6.427/10 through 6/11 96,649,015 10 678,549 49 1,519,153 619,786 1,594,296 4,411,784 4.577/11 through 6/12 90,468,688 11 1,287,172 46 1,679,481 1,276,060 2,461,365 6,704,078 7.41
5 YR. TOTAL 551,387,757 55 4,880,520 281 7,965,487 5,725,118 10,582,689 29,153,814 5.29INDEMNITY MEDICAL TOTAL
CRED. PURE PREM.* CRED. PURE PREM.* PURE PREM.*Indicated Pure Premium 82% 2.330 100% 2.958 5.29Pure Premium Indicated by National Relativity 9% 2.275 0% 3.080 5.36Pure Premium Present on Rate Level 9% 1.966 0% 2.444 4.41Pure Premium Derived by Formula 2.292 2.958 5.25
CLASS CONCRETE WORK-INCIDENTAL TO THE CONSTRUCTION OF PRIVATE RESIDENCE
5215
Industry Group: Contracting CONVERTED LOSSESHazard Group: D INDEMNITY LIKELY INDEMNITY NOT-LIKELY MED LIKELY MED NOT-LIKELY TOTAL TOTAL
POLICY PERIOD PAYROLL CASES AMOUNT CASES AMOUNT AMOUNT AMOUNT AMOUNT PURE PREM.7/07 through 6/08 36,359,637 9 718,998 22 269,430 591,511 439,667 2,019,606 5.557/08 through 6/09 28,034,605 2 127,973 16 134,877 182,432 294,170 739,452 2.647/09 through 6/10 27,877,249 8 104,339 14 144,626 89,586 378,643 717,194 2.577/10 through 6/11 26,351,630 2 313,167 24 234,847 564,662 439,000 1,551,676 5.897/11 through 6/12 31,624,466 6 312,918 18 230,940 340,560 342,164 1,226,582 3.88
5 YR. TOTAL 150,247,587 27 1,577,395 94 1,014,720 1,768,751 1,893,644 6,254,510 4.16INDEMNITY MEDICAL TOTAL
CRED. PURE PREM.* CRED. PURE PREM.* PURE PREM.*Indicated Pure Premium 47% 1.725 58% 2.438 4.16Pure Premium Indicated by National Relativity 26% 2.200 21% 2.719 4.92Pure Premium Present on Rate Level 27% 1.817 21% 2.264 4.08Pure Premium Derived by Formula 1.873 2.460 4.33
CLASS CONCRETE OR CEMENT WORK-FLOORS, DRIVEWAYS, YARDS OR SIDEWALKS-& DRIVERS
5221
Industry Group: Contracting CONVERTED LOSSESHazard Group: E INDEMNITY LIKELY INDEMNITY NOT-LIKELY MED LIKELY MED NOT-LIKELY TOTAL TOTAL
POLICY PERIOD PAYROLL CASES AMOUNT CASES AMOUNT AMOUNT AMOUNT AMOUNT PURE PREM.7/07 through 6/08 223,962,025 39 2,552,702 103 2,322,654 2,287,273 3,108,045 10,270,674 4.597/08 through 6/09 178,275,586 26 1,335,527 90 3,644,143 2,247,028 3,026,186 10,252,884 5.757/09 through 6/10 170,423,798 16 876,900 85 2,076,173 1,650,403 2,552,074 7,155,550 4.207/10 through 6/11 179,033,815 17 1,171,059 91 2,015,599 1,725,683 3,147,334 8,059,675 4.507/11 through 6/12 181,724,271 14 1,123,725 65 1,782,249 808,048 2,715,691 6,429,713 3.54
5 YR. TOTAL 933,419,495 112 7,059,913 434 11,840,818 8,718,435 14,549,330 42,168,496 4.52INDEMNITY MEDICAL TOTAL
CRED. PURE PREM.* CRED. PURE PREM.* PURE PREM.*Indicated Pure Premium 100% 2.025 100% 2.493 4.52Pure Premium Indicated by National Relativity 0% 1.762 0% 2.368 4.13Pure Premium Present on Rate Level 0% 2.057 0% 2.610 4.67Pure Premium Derived by Formula 2.025 2.493 4.52
Page 105
* Pure Premium per $100 of Payroll** Pure Premium per employee++ Non-Standard Calculation© Copyright 2014 National Council on Compensation Insurance, Inc. All Rights Reserved.

MISSOURI
EFFECTIVE 1/1/2015CLASS CONCRETE CONSTRUCTION IN CONNECTION WITH BRIDGES OR CULVERTS
5222
Industry Group: Contracting CONVERTED LOSSESHazard Group: F INDEMNITY LIKELY INDEMNITY NOT-LIKELY MED LIKELY MED NOT-LIKELY TOTAL TOTAL
POLICY PERIOD PAYROLL CASES AMOUNT CASES AMOUNT AMOUNT AMOUNT AMOUNT PURE PREM.7/07 through 6/08 26,138,515 3 304,328 24 440,799 224,646 501,127 1,470,900 5.637/08 through 6/09 31,892,382 5 297,025 15 998,395 927,929 1,167,615 3,390,964 10.637/09 through 6/10 35,772,310 2 74,167 20 538,503 98,139 686,258 1,397,067 3.917/10 through 6/11 34,140,841 4 150,004 16 522,307 120,136 915,823 1,708,270 5.007/11 through 6/12 25,192,020 7 1,006,179 13 1,044,788 1,223,525 508,187 3,782,679 15.02
5 YR. TOTAL 153,136,068 21 1,831,703 88 3,544,792 2,594,375 3,779,010 11,749,880 7.67INDEMNITY MEDICAL TOTAL
CRED. PURE PREM.* CRED. PURE PREM.* PURE PREM.*Indicated Pure Premium 58% 3.511 70% 4.162 7.67Pure Premium Indicated by National Relativity 21% 2.919 15% 3.845 6.76Pure Premium Present on Rate Level 21% 2.980 15% 3.504 6.48Pure Premium Derived by Formula 3.275 4.016 7.29
CLASS SWIMMING POOL CONSTRUCTION-NOT IRON OR STEEL- & DRIVERS
5223
Industry Group: Contracting CONVERTED LOSSESHazard Group: E INDEMNITY LIKELY INDEMNITY NOT-LIKELY MED LIKELY MED NOT-LIKELY TOTAL TOTAL
POLICY PERIOD PAYROLL CASES AMOUNT CASES AMOUNT AMOUNT AMOUNT AMOUNT PURE PREM.7/07 through 6/08 10,051,644 2 91,606 8 76,438 120,316 163,387 451,747 4.497/08 through 6/09 7,697,504 1 26,475 6 82,448 43,656 146,211 298,790 3.887/09 through 6/10 7,909,058 4 50,048 4 27,299 75,167 71,432 223,946 2.837/10 through 6/11 9,026,108 1 71,095 8 197,793 62,936 251,149 582,973 6.467/11 through 6/12 8,161,910 1 264,408 13 147,701 260,482 221,169 893,760 10.95
5 YR. TOTAL 42,846,224 9 503,632 39 531,679 562,557 853,348 2,451,216 5.72INDEMNITY MEDICAL TOTAL
CRED. PURE PREM.* CRED. PURE PREM.* PURE PREM.*Indicated Pure Premium 33% 2.416 42% 3.305 5.72Pure Premium Indicated by National Relativity 33% 1.720 29% 2.437 4.16Pure Premium Present on Rate Level 34% 2.639 29% 3.636 6.28Pure Premium Derived by Formula 2.262 3.149 5.41
CLASS CERAMIC TILE, INDOOR STONE, MARBLE, OR MOSAIC WORK
5348
Industry Group: Contracting CONVERTED LOSSESHazard Group: E INDEMNITY LIKELY INDEMNITY NOT-LIKELY MED LIKELY MED NOT-LIKELY TOTAL TOTAL
POLICY PERIOD PAYROLL CASES AMOUNT CASES AMOUNT AMOUNT AMOUNT AMOUNT PURE PREM.7/07 through 6/08 48,605,401 6 334,698 33 592,964 253,490 1,332,986 2,514,138 5.177/08 through 6/09 38,847,601 2 53,316 22 565,907 90,271 896,853 1,606,347 4.147/09 through 6/10 34,347,431 7 324,629 22 367,822 459,353 627,859 1,779,663 5.187/10 through 6/11 36,677,167 5 462,009 18 948,848 582,243 1,037,112 3,030,212 8.267/11 through 6/12 37,236,000 6 258,094 15 386,821 207,811 387,737 1,240,463 3.33
5 YR. TOTAL 195,713,600 26 1,432,746 110 2,862,362 1,593,168 4,282,547 10,170,823 5.20INDEMNITY MEDICAL TOTAL
CRED. PURE PREM.* CRED. PURE PREM.* PURE PREM.*Indicated Pure Premium 56% 2.195 71% 3.002 5.20Pure Premium Indicated by National Relativity 22% 1.780 14% 2.210 3.99Pure Premium Present on Rate Level 22% 2.168 15% 2.895 5.06Pure Premium Derived by Formula 2.098 2.875 4.97
Page 106
* Pure Premium per $100 of Payroll** Pure Premium per employee++ Non-Standard Calculation© Copyright 2014 National Council on Compensation Insurance, Inc. All Rights Reserved.

MISSOURI
EFFECTIVE 1/1/2015CLASS HOTHOUSE ERECTION-ALL OPERATIONS
5402
Industry Group: Contracting CONVERTED LOSSESHazard Group: B INDEMNITY LIKELY INDEMNITY NOT-LIKELY MED LIKELY MED NOT-LIKELY TOTAL TOTAL
POLICY PERIOD PAYROLL CASES AMOUNT CASES AMOUNT AMOUNT AMOUNT AMOUNT PURE PREM.7/07 through 6/08 480,920 0 0 0 0 0 1,358 1,358 0.287/08 through 6/09 613,575 0 0 0 0 0 0 0 0.007/09 through 6/10 504,493 0 0 0 0 0 0 0 0.007/10 through 6/11 1,088,152 0 0 0 0 0 0 0 0.007/11 through 6/12 1,212,505 0 0 0 0 0 2,549 2,549 0.21
5 YR. TOTAL 3,899,645 0 0 0 0 0 3,907 3,907 0.10INDEMNITY MEDICAL TOTAL
CRED. PURE PREM.* CRED. PURE PREM.* PURE PREM.*Indicated Pure Premium 9% 0.000 11% 0.100 0.10Pure Premium Indicated by National Relativity 21% 1.737 22% 3.458 5.20Pure Premium Present on Rate Level 70% 1.150 67% 1.526 2.68Pure Premium Derived by Formula 1.170 1.794 2.96
CLASS CARPENTRY NOC
5403
Industry Group: Contracting CONVERTED LOSSESHazard Group: F INDEMNITY LIKELY INDEMNITY NOT-LIKELY MED LIKELY MED NOT-LIKELY TOTAL TOTAL
POLICY PERIOD PAYROLL CASES AMOUNT CASES AMOUNT AMOUNT AMOUNT AMOUNT PURE PREM.7/07 through 6/08 268,005,172 34 2,404,140 170 2,617,008 3,067,461 4,616,265 12,704,874 4.747/08 through 6/09 213,847,912 18 1,618,066 105 2,671,403 2,714,362 3,290,812 10,294,643 4.817/09 through 6/10 201,828,718 29 1,585,078 96 2,486,893 2,574,427 4,372,460 11,018,858 5.467/10 through 6/11 207,386,024 24 1,192,456 114 2,884,622 2,107,790 4,949,131 11,133,999 5.377/11 through 6/12 199,402,586 32 2,899,285 81 1,978,301 3,253,974 3,768,676 11,900,236 5.97
5 YR. TOTAL 1,090,470,412 137 9,699,025 566 12,638,227 13,718,014 20,997,344 57,052,610 5.23INDEMNITY MEDICAL TOTAL
CRED. PURE PREM.* CRED. PURE PREM.* PURE PREM.*Indicated Pure Premium 100% 2.048 100% 3.184 5.23Pure Premium Indicated by National Relativity 0% 2.431 0% 3.447 5.88Pure Premium Present on Rate Level 0% 2.006 0% 3.197 5.20Pure Premium Derived by Formula 2.048 3.184 5.23
CLASS CARPENTRY-INSTALLATION OF CABINET WORK OR INTERIOR TRIM
5437
Industry Group: Contracting CONVERTED LOSSESHazard Group: E INDEMNITY LIKELY INDEMNITY NOT-LIKELY MED LIKELY MED NOT-LIKELY TOTAL TOTAL
POLICY PERIOD PAYROLL CASES AMOUNT CASES AMOUNT AMOUNT AMOUNT AMOUNT PURE PREM.7/07 through 6/08 104,238,013 5 322,908 58 1,061,698 241,475 1,893,908 3,519,989 3.387/08 through 6/09 80,192,549 4 30,405 48 1,023,671 5,287 1,684,515 2,743,878 3.427/09 through 6/10 73,423,745 9 335,362 41 704,185 276,522 1,115,017 2,431,086 3.317/10 through 6/11 75,386,438 10 467,122 37 719,736 424,062 1,092,235 2,703,155 3.597/11 through 6/12 85,728,844 2 201,885 37 952,302 212,774 1,558,325 2,925,286 3.41
5 YR. TOTAL 418,969,589 30 1,357,682 221 4,461,592 1,160,120 7,344,000 14,323,394 3.42INDEMNITY MEDICAL TOTAL
CRED. PURE PREM.* CRED. PURE PREM.* PURE PREM.*Indicated Pure Premium 68% 1.389 86% 2.030 3.42Pure Premium Indicated by National Relativity 16% 2.124 7% 2.808 4.93Pure Premium Present on Rate Level 16% 1.637 7% 2.173 3.81Pure Premium Derived by Formula 1.546 2.094 3.64
Page 107
* Pure Premium per $100 of Payroll** Pure Premium per employee++ Non-Standard Calculation© Copyright 2014 National Council on Compensation Insurance, Inc. All Rights Reserved.
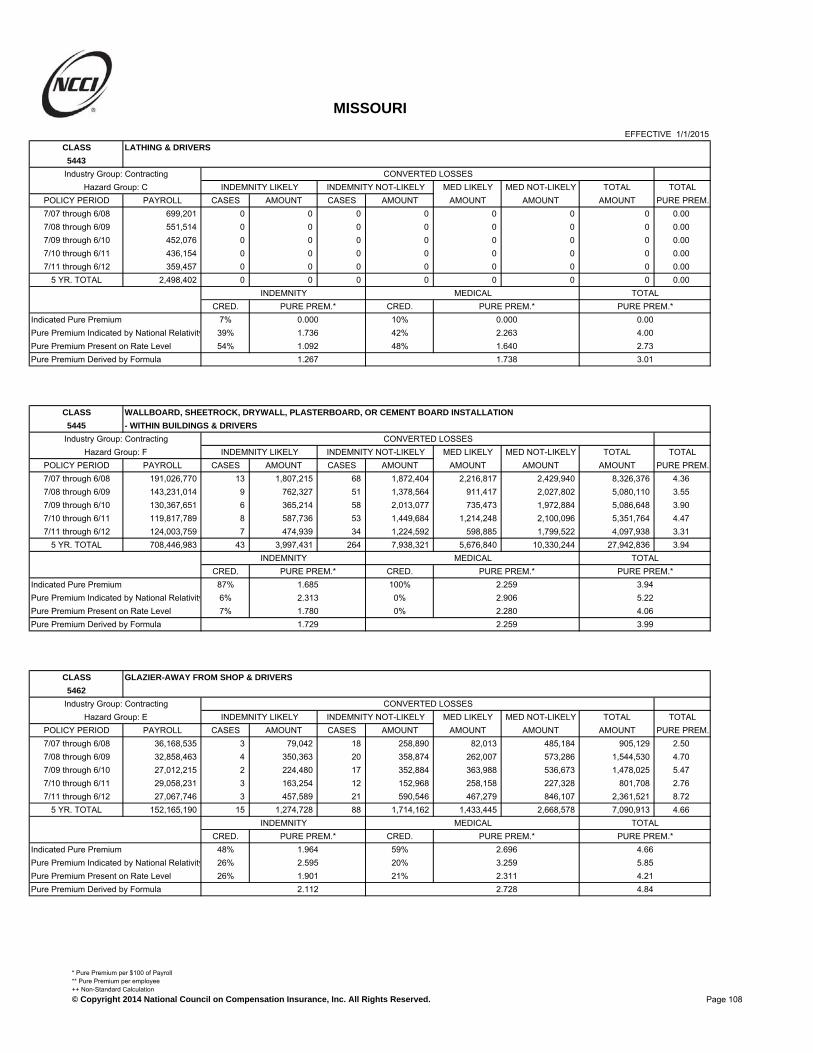
MISSOURI
EFFECTIVE 1/1/2015CLASS LATHING & DRIVERS
5443
Industry Group: Contracting CONVERTED LOSSESHazard Group: C INDEMNITY LIKELY INDEMNITY NOT-LIKELY MED LIKELY MED NOT-LIKELY TOTAL TOTAL
POLICY PERIOD PAYROLL CASES AMOUNT CASES AMOUNT AMOUNT AMOUNT AMOUNT PURE PREM.7/07 through 6/08 699,201 0 0 0 0 0 0 0 0.007/08 through 6/09 551,514 0 0 0 0 0 0 0 0.007/09 through 6/10 452,076 0 0 0 0 0 0 0 0.007/10 through 6/11 436,154 0 0 0 0 0 0 0 0.007/11 through 6/12 359,457 0 0 0 0 0 0 0 0.00
5 YR. TOTAL 2,498,402 0 0 0 0 0 0 0 0.00INDEMNITY MEDICAL TOTAL
CRED. PURE PREM.* CRED. PURE PREM.* PURE PREM.*Indicated Pure Premium 7% 0.000 10% 0.000 0.00Pure Premium Indicated by National Relativity 39% 1.736 42% 2.263 4.00Pure Premium Present on Rate Level 54% 1.092 48% 1.640 2.73Pure Premium Derived by Formula 1.267 1.738 3.01
CLASS WALLBOARD, SHEETROCK, DRYWALL, PLASTERBOARD, OR CEMENT BOARD INSTALLATION
5445 - WITHIN BUILDINGS & DRIVERS
Industry Group: Contracting CONVERTED LOSSESHazard Group: F INDEMNITY LIKELY INDEMNITY NOT-LIKELY MED LIKELY MED NOT-LIKELY TOTAL TOTAL
POLICY PERIOD PAYROLL CASES AMOUNT CASES AMOUNT AMOUNT AMOUNT AMOUNT PURE PREM.7/07 through 6/08 191,026,770 13 1,807,215 68 1,872,404 2,216,817 2,429,940 8,326,376 4.367/08 through 6/09 143,231,014 9 762,327 51 1,378,564 911,417 2,027,802 5,080,110 3.557/09 through 6/10 130,367,651 6 365,214 58 2,013,077 735,473 1,972,884 5,086,648 3.907/10 through 6/11 119,817,789 8 587,736 53 1,449,684 1,214,248 2,100,096 5,351,764 4.477/11 through 6/12 124,003,759 7 474,939 34 1,224,592 598,885 1,799,522 4,097,938 3.31
5 YR. TOTAL 708,446,983 43 3,997,431 264 7,938,321 5,676,840 10,330,244 27,942,836 3.94INDEMNITY MEDICAL TOTAL
CRED. PURE PREM.* CRED. PURE PREM.* PURE PREM.*Indicated Pure Premium 87% 1.685 100% 2.259 3.94Pure Premium Indicated by National Relativity 6% 2.313 0% 2.906 5.22Pure Premium Present on Rate Level 7% 1.780 0% 2.280 4.06Pure Premium Derived by Formula 1.729 2.259 3.99
CLASS GLAZIER-AWAY FROM SHOP & DRIVERS
5462
Industry Group: Contracting CONVERTED LOSSESHazard Group: E INDEMNITY LIKELY INDEMNITY NOT-LIKELY MED LIKELY MED NOT-LIKELY TOTAL TOTAL
POLICY PERIOD PAYROLL CASES AMOUNT CASES AMOUNT AMOUNT AMOUNT AMOUNT PURE PREM.7/07 through 6/08 36,168,535 3 79,042 18 258,890 82,013 485,184 905,129 2.507/08 through 6/09 32,858,463 4 350,363 20 358,874 262,007 573,286 1,544,530 4.707/09 through 6/10 27,012,215 2 224,480 17 352,884 363,988 536,673 1,478,025 5.477/10 through 6/11 29,058,231 3 163,254 12 152,968 258,158 227,328 801,708 2.767/11 through 6/12 27,067,746 3 457,589 21 590,546 467,279 846,107 2,361,521 8.72
5 YR. TOTAL 152,165,190 15 1,274,728 88 1,714,162 1,433,445 2,668,578 7,090,913 4.66INDEMNITY MEDICAL TOTAL
CRED. PURE PREM.* CRED. PURE PREM.* PURE PREM.*Indicated Pure Premium 48% 1.964 59% 2.696 4.66Pure Premium Indicated by National Relativity 26% 2.595 20% 3.259 5.85Pure Premium Present on Rate Level 26% 1.901 21% 2.311 4.21Pure Premium Derived by Formula 2.112 2.728 4.84
Page 108
* Pure Premium per $100 of Payroll** Pure Premium per employee++ Non-Standard Calculation© Copyright 2014 National Council on Compensation Insurance, Inc. All Rights Reserved.

MISSOURI
EFFECTIVE 1/1/2015CLASS ASBESTOS CONTRACTOR-PIPE AND BOILER WORK EXCLUSIVELY & DRIVERS
5472
Industry Group: Contracting CONVERTED LOSSESHazard Group: G INDEMNITY LIKELY INDEMNITY NOT-LIKELY MED LIKELY MED NOT-LIKELY TOTAL TOTAL
POLICY PERIOD PAYROLL CASES AMOUNT CASES AMOUNT AMOUNT AMOUNT AMOUNT PURE PREM.7/07 through 6/08 10,897,402 1 4,346 3 14,510 8,358 63,347 90,561 0.837/08 through 6/09 9,019,118 3 37,155 3 160,051 41,950 371,767 610,923 6.777/09 through 6/10 11,729,596 2 178,601 7 322,007 234,781 321,141 1,056,530 9.017/10 through 6/11 7,368,357 1 52,199 3 187,539 76,786 184,373 500,897 6.807/11 through 6/12 8,498,521 1 75,352 3 93,651 41,186 202,754 412,943 4.86
5 YR. TOTAL 47,512,994 8 347,653 19 777,758 403,061 1,143,382 2,671,854 5.62INDEMNITY MEDICAL TOTAL
CRED. PURE PREM.* CRED. PURE PREM.* PURE PREM.*Indicated Pure Premium 32% 2.369 40% 3.255 5.62Pure Premium Indicated by National Relativity 34% 1.761 30% 2.272 4.03Pure Premium Present on Rate Level 34% 2.138 30% 2.856 4.99Pure Premium Derived by Formula 2.084 2.840 4.92
CLASS ASBESTOS CONTRACTOR-NOC & DRIVERS
5473
Industry Group: Contracting CONVERTED LOSSESHazard Group: G INDEMNITY LIKELY INDEMNITY NOT-LIKELY MED LIKELY MED NOT-LIKELY TOTAL TOTAL
POLICY PERIOD PAYROLL CASES AMOUNT CASES AMOUNT AMOUNT AMOUNT AMOUNT PURE PREM.7/07 through 6/08 6,854,163 2 69,575 3 107,935 67,606 185,248 430,364 6.287/08 through 6/09 5,531,304 1 87,133 0 0 138,037 0 225,170 4.077/09 through 6/10 7,603,137 1 482,051 4 152,922 502,773 282,245 1,419,991 18.687/10 through 6/11 7,496,364 1 64,096 5 321,444 32,122 509,076 926,738 12.367/11 through 6/12 7,684,704 1 96,793 6 684,958 116,028 253,505 1,151,284 14.98
5 YR. TOTAL 35,169,672 6 799,648 18 1,267,259 856,566 1,230,074 4,153,547 11.81INDEMNITY MEDICAL TOTAL
CRED. PURE PREM.* CRED. PURE PREM.* PURE PREM.*Indicated Pure Premium 33% 5.877 43% 5.933 11.81Pure Premium Indicated by National Relativity 33% 2.959 28% 4.778 7.74Pure Premium Present on Rate Level 34% 3.295 29% 4.609 7.90Pure Premium Derived by Formula 4.036 5.226 9.26
CLASS PAINTING NOC & SHOP OPERATIONS, DRIVERS
5474
Industry Group: Contracting CONVERTED LOSSESHazard Group: F INDEMNITY LIKELY INDEMNITY NOT-LIKELY MED LIKELY MED NOT-LIKELY TOTAL TOTAL
POLICY PERIOD PAYROLL CASES AMOUNT CASES AMOUNT AMOUNT AMOUNT AMOUNT PURE PREM.7/07 through 6/08 163,232,921 13 1,016,844 78 2,075,869 1,270,960 2,690,212 7,053,885 4.327/08 through 6/09 138,599,617 16 1,585,493 63 2,092,927 1,993,321 2,830,198 8,501,939 6.137/09 through 6/10 132,462,986 17 1,623,641 58 2,532,419 2,195,902 2,502,423 8,854,385 6.697/10 through 6/11 134,026,107 19 1,571,568 54 2,694,770 2,770,855 1,799,147 8,836,340 6.597/11 through 6/12 141,666,793 11 1,139,914 63 2,361,371 1,109,992 1,985,614 6,596,891 4.66
5 YR. TOTAL 709,988,424 76 6,937,460 316 11,757,356 9,341,030 11,807,594 39,843,440 5.61INDEMNITY MEDICAL TOTAL
CRED. PURE PREM.* CRED. PURE PREM.* PURE PREM.*Indicated Pure Premium 100% 2.633 100% 2.979 5.61Pure Premium Indicated by National Relativity 0% 2.164 0% 3.343 5.51Pure Premium Present on Rate Level 0% 2.600 0% 3.057 5.66Pure Premium Derived by Formula 2.633 2.979 5.61
Page 109
* Pure Premium per $100 of Payroll** Pure Premium per employee++ Non-Standard Calculation© Copyright 2014 National Council on Compensation Insurance, Inc. All Rights Reserved.

MISSOURI
EFFECTIVE 1/1/2015CLASS FLOOR COVERING INSTALLATION--RESILIENT FLOORING -- CARPET AND LAMINATE
5478 FLOORING
Industry Group: Contracting CONVERTED LOSSESHazard Group: E INDEMNITY LIKELY INDEMNITY NOT-LIKELY MED LIKELY MED NOT-LIKELY TOTAL TOTAL
POLICY PERIOD PAYROLL CASES AMOUNT CASES AMOUNT AMOUNT AMOUNT AMOUNT PURE PREM.7/07 through 6/08 55,149,018 9 160,644 49 787,110 104,539 1,109,444 2,161,737 3.927/08 through 6/09 44,977,690 4 512,007 28 561,667 504,440 1,030,104 2,608,218 5.807/09 through 6/10 43,419,381 5 171,659 28 809,294 179,210 793,096 1,953,259 4.507/10 through 6/11 45,729,639 6 516,420 29 604,381 585,210 927,111 2,633,122 5.767/11 through 6/12 47,606,728 7 566,596 32 447,456 1,783,444 674,698 3,472,194 7.29
5 YR. TOTAL 236,882,456 31 1,927,326 166 3,209,908 3,156,843 4,534,453 12,828,530 5.42INDEMNITY MEDICAL TOTAL
CRED. PURE PREM.* CRED. PURE PREM.* PURE PREM.*Indicated Pure Premium 61% 2.169 75% 3.247 5.42Pure Premium Indicated by National Relativity 19% 1.857 12% 1.927 3.78Pure Premium Present on Rate Level 20% 2.238 13% 2.750 4.99Pure Premium Derived by Formula 2.124 3.024 5.15
CLASS INSULATION WORK NOC & DRIVERS
5479
Industry Group: Contracting CONVERTED LOSSESHazard Group: D INDEMNITY LIKELY INDEMNITY NOT-LIKELY MED LIKELY MED NOT-LIKELY TOTAL TOTAL
POLICY PERIOD PAYROLL CASES AMOUNT CASES AMOUNT AMOUNT AMOUNT AMOUNT PURE PREM.7/07 through 6/08 12,876,384 1 26,297 15 241,564 42,173 345,096 655,130 5.097/08 through 6/09 10,435,846 2 46,483 14 98,053 134,612 232,869 512,017 4.917/09 through 6/10 11,920,220 1 14,963 14 224,749 17,365 352,045 609,122 5.117/10 through 6/11 11,263,839 3 134,673 16 215,059 211,337 377,487 938,556 8.337/11 through 6/12 11,426,438 2 100,683 7 124,018 257,135 239,814 721,650 6.32
5 YR. TOTAL 57,922,727 9 323,099 66 903,443 662,622 1,547,311 3,436,475 5.93INDEMNITY MEDICAL TOTAL
CRED. PURE PREM.* CRED. PURE PREM.* PURE PREM.*Indicated Pure Premium 34% 2.118 45% 3.815 5.93Pure Premium Indicated by National Relativity 33% 2.375 27% 3.509 5.88Pure Premium Present on Rate Level 33% 2.024 28% 3.063 5.09Pure Premium Derived by Formula 2.172 3.522 5.69
CLASS PLASTERING NOC & DRIVERS
5480
Industry Group: Contracting CONVERTED LOSSESHazard Group: F INDEMNITY LIKELY INDEMNITY NOT-LIKELY MED LIKELY MED NOT-LIKELY TOTAL TOTAL
POLICY PERIOD PAYROLL CASES AMOUNT CASES AMOUNT AMOUNT AMOUNT AMOUNT PURE PREM.7/07 through 6/08 9,337,247 1 115,700 4 88,657 247,868 117,374 569,599 6.107/08 through 6/09 6,741,859 0 0 1 17,458 0 43,496 60,954 0.907/09 through 6/10 5,094,417 0 0 2 71,579 0 90,745 162,324 3.197/10 through 6/11 4,587,083 0 0 4 112,790 0 113,234 226,024 4.937/11 through 6/12 4,602,697 0 0 4 64,545 0 206,186 270,731 5.88
5 YR. TOTAL 30,363,303 1 115,700 15 355,029 247,868 571,035 1,289,632 4.25INDEMNITY MEDICAL TOTAL
CRED. PURE PREM.* CRED. PURE PREM.* PURE PREM.*Indicated Pure Premium 26% 1.550 31% 2.697 4.25Pure Premium Indicated by National Relativity 37% 2.261 34% 2.095 4.36Pure Premium Present on Rate Level 37% 1.999 35% 2.392 4.39Pure Premium Derived by Formula 1.979 2.386 4.37
Page 110
* Pure Premium per $100 of Payroll** Pure Premium per employee++ Non-Standard Calculation© Copyright 2014 National Council on Compensation Insurance, Inc. All Rights Reserved.

MISSOURI
EFFECTIVE 1/1/2015CLASS PAPERHANGING & DRIVERS
5491
Industry Group: Contracting CONVERTED LOSSESHazard Group: F INDEMNITY LIKELY INDEMNITY NOT-LIKELY MED LIKELY MED NOT-LIKELY TOTAL TOTAL
POLICY PERIOD PAYROLL CASES AMOUNT CASES AMOUNT AMOUNT AMOUNT AMOUNT PURE PREM.7/07 through 6/08 1,352,950 0 0 0 0 0 0 0 0.007/08 through 6/09 1,277,894 0 0 0 0 0 0 0 0.007/09 through 6/10 1,146,927 0 0 2 26,148 0 41,761 67,909 5.927/10 through 6/11 1,278,271 0 0 0 0 0 0 0 0.007/11 through 6/12 1,868,568 0 0 0 0 0 0 0 0.00
5 YR. TOTAL 6,924,610 0 0 2 26,148 0 41,761 67,909 0.98INDEMNITY MEDICAL TOTAL
CRED. PURE PREM.* CRED. PURE PREM.* PURE PREM.*Indicated Pure Premium 10% 0.378 13% 0.603 0.98Pure Premium Indicated by National Relativity 26% 0.742 27% 0.773 1.52Pure Premium Present on Rate Level 64% 0.807 60% 1.073 1.88Pure Premium Derived by Formula 0.747 0.931 1.68
CLASS PAVING OR ROAD SURFACING OR SCRAPING NOC & YARDS, DRIVERS
5505
Industry Group: Contracting CONVERTED LOSSESHazard Group: E INDEMNITY LIKELY INDEMNITY NOT-LIKELY MED LIKELY MED NOT-LIKELY TOTAL TOTAL
POLICY PERIOD PAYROLL CASES AMOUNT CASES AMOUNT AMOUNT AMOUNT AMOUNT PURE PREM.7/07 through 6/08 1,224,967 0 0 1 563 0 1,659 2,222 0.187/08 through 6/09 1,103,355 0 0 0 0 0 0 0 0.007/09 through 6/10 1,380,770 0 0 1 8,052 0 9,489 17,541 1.277/10 through 6/11 855,527 0 0 0 0 0 3,140 3,140 0.377/11 through 6/12 1,004,493 0 0 1 42,106 0 46,236 88,342 8.80
5 YR. TOTAL 5,569,112 0 0 3 50,721 0 60,524 111,245 2.00INDEMNITY MEDICAL TOTAL
CRED. PURE PREM.* CRED. PURE PREM.* PURE PREM.*Indicated Pure Premium 13% 0.911 13% 1.087 2.00Pure Premium Indicated by National Relativity 0% 0.000 0% 0.000 0.00Pure Premium Present on Rate Level 87% 2.003 87% 1.420 3.42Pure Premium Derived by Formula 1.861 1.377 3.24
CLASS STREET OR ROAD CONSTRUCTION: PAVING OR REPAVING & DRIVERS
5506
Industry Group: Contracting CONVERTED LOSSESHazard Group: G INDEMNITY LIKELY INDEMNITY NOT-LIKELY MED LIKELY MED NOT-LIKELY TOTAL TOTAL
POLICY PERIOD PAYROLL CASES AMOUNT CASES AMOUNT AMOUNT AMOUNT AMOUNT PURE PREM.7/07 through 6/08 174,157,861 24 1,328,976 109 1,914,273 2,344,077 3,789,967 9,377,293 5.387/08 through 6/09 173,168,950 16 937,912 90 2,948,496 1,655,104 2,978,765 8,520,277 4.927/09 through 6/10 169,762,707 20 1,311,895 91 1,418,251 784,597 2,447,433 5,962,176 3.517/10 through 6/11 162,239,854 20 1,889,404 68 2,527,762 2,202,522 2,691,459 9,311,147 5.747/11 through 6/12 156,889,809 18 936,009 67 1,721,370 1,228,143 2,939,469 6,824,991 4.35
5 YR. TOTAL 836,219,181 98 6,404,196 425 10,530,152 8,214,443 14,847,093 39,995,884 4.78INDEMNITY MEDICAL TOTAL
CRED. PURE PREM.* CRED. PURE PREM.* PURE PREM.*Indicated Pure Premium 100% 2.025 100% 2.758 4.78Pure Premium Indicated by National Relativity 0% 2.244 0% 3.336 5.58Pure Premium Present on Rate Level 0% 2.219 0% 2.866 5.09Pure Premium Derived by Formula 2.025 2.758 4.78
Page 111
* Pure Premium per $100 of Payroll** Pure Premium per employee++ Non-Standard Calculation© Copyright 2014 National Council on Compensation Insurance, Inc. All Rights Reserved.
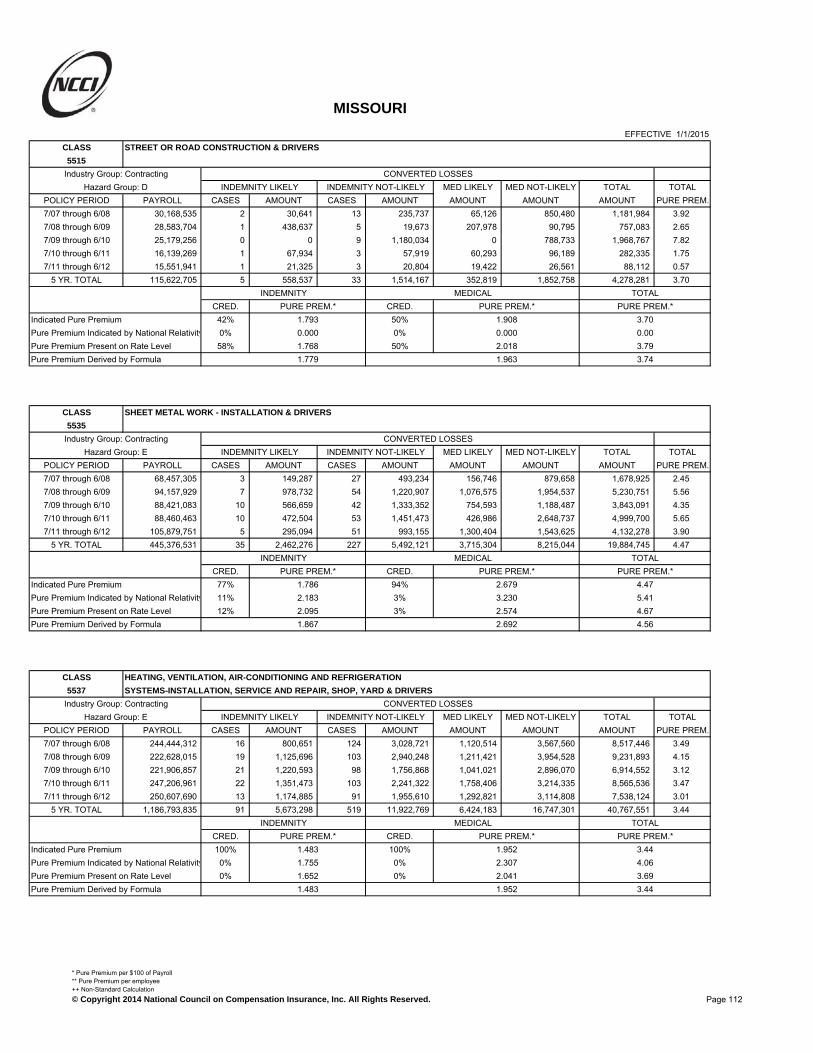
MISSOURI
EFFECTIVE 1/1/2015CLASS STREET OR ROAD CONSTRUCTION & DRIVERS
5515
Industry Group: Contracting CONVERTED LOSSESHazard Group: D INDEMNITY LIKELY INDEMNITY NOT-LIKELY MED LIKELY MED NOT-LIKELY TOTAL TOTAL
POLICY PERIOD PAYROLL CASES AMOUNT CASES AMOUNT AMOUNT AMOUNT AMOUNT PURE PREM.7/07 through 6/08 30,168,535 2 30,641 13 235,737 65,126 850,480 1,181,984 3.927/08 through 6/09 28,583,704 1 438,637 5 19,673 207,978 90,795 757,083 2.657/09 through 6/10 25,179,256 0 0 9 1,180,034 0 788,733 1,968,767 7.827/10 through 6/11 16,139,269 1 67,934 3 57,919 60,293 96,189 282,335 1.757/11 through 6/12 15,551,941 1 21,325 3 20,804 19,422 26,561 88,112 0.57
5 YR. TOTAL 115,622,705 5 558,537 33 1,514,167 352,819 1,852,758 4,278,281 3.70INDEMNITY MEDICAL TOTAL
CRED. PURE PREM.* CRED. PURE PREM.* PURE PREM.*Indicated Pure Premium 42% 1.793 50% 1.908 3.70Pure Premium Indicated by National Relativity 0% 0.000 0% 0.000 0.00Pure Premium Present on Rate Level 58% 1.768 50% 2.018 3.79Pure Premium Derived by Formula 1.779 1.963 3.74
CLASS SHEET METAL WORK - INSTALLATION & DRIVERS
5535
Industry Group: Contracting CONVERTED LOSSESHazard Group: E INDEMNITY LIKELY INDEMNITY NOT-LIKELY MED LIKELY MED NOT-LIKELY TOTAL TOTAL
POLICY PERIOD PAYROLL CASES AMOUNT CASES AMOUNT AMOUNT AMOUNT AMOUNT PURE PREM.7/07 through 6/08 68,457,305 3 149,287 27 493,234 156,746 879,658 1,678,925 2.457/08 through 6/09 94,157,929 7 978,732 54 1,220,907 1,076,575 1,954,537 5,230,751 5.567/09 through 6/10 88,421,083 10 566,659 42 1,333,352 754,593 1,188,487 3,843,091 4.357/10 through 6/11 88,460,463 10 472,504 53 1,451,473 426,986 2,648,737 4,999,700 5.657/11 through 6/12 105,879,751 5 295,094 51 993,155 1,300,404 1,543,625 4,132,278 3.90
5 YR. TOTAL 445,376,531 35 2,462,276 227 5,492,121 3,715,304 8,215,044 19,884,745 4.47INDEMNITY MEDICAL TOTAL
CRED. PURE PREM.* CRED. PURE PREM.* PURE PREM.*Indicated Pure Premium 77% 1.786 94% 2.679 4.47Pure Premium Indicated by National Relativity 11% 2.183 3% 3.230 5.41Pure Premium Present on Rate Level 12% 2.095 3% 2.574 4.67Pure Premium Derived by Formula 1.867 2.692 4.56
CLASS HEATING, VENTILATION, AIR-CONDITIONING AND REFRIGERATION
5537 SYSTEMS-INSTALLATION, SERVICE AND REPAIR, SHOP, YARD & DRIVERS
Industry Group: Contracting CONVERTED LOSSESHazard Group: E INDEMNITY LIKELY INDEMNITY NOT-LIKELY MED LIKELY MED NOT-LIKELY TOTAL TOTAL
POLICY PERIOD PAYROLL CASES AMOUNT CASES AMOUNT AMOUNT AMOUNT AMOUNT PURE PREM.7/07 through 6/08 244,444,312 16 800,651 124 3,028,721 1,120,514 3,567,560 8,517,446 3.497/08 through 6/09 222,628,015 19 1,125,696 103 2,940,248 1,211,421 3,954,528 9,231,893 4.157/09 through 6/10 221,906,857 21 1,220,593 98 1,756,868 1,041,021 2,896,070 6,914,552 3.127/10 through 6/11 247,206,961 22 1,351,473 103 2,241,322 1,758,406 3,214,335 8,565,536 3.477/11 through 6/12 250,607,690 13 1,174,885 91 1,955,610 1,292,821 3,114,808 7,538,124 3.01
5 YR. TOTAL 1,186,793,835 91 5,673,298 519 11,922,769 6,424,183 16,747,301 40,767,551 3.44INDEMNITY MEDICAL TOTAL
CRED. PURE PREM.* CRED. PURE PREM.* PURE PREM.*Indicated Pure Premium 100% 1.483 100% 1.952 3.44Pure Premium Indicated by National Relativity 0% 1.755 0% 2.307 4.06Pure Premium Present on Rate Level 0% 1.652 0% 2.041 3.69Pure Premium Derived by Formula 1.483 1.952 3.44
Page 112
* Pure Premium per $100 of Payroll** Pure Premium per employee++ Non-Standard Calculation© Copyright 2014 National Council on Compensation Insurance, Inc. All Rights Reserved.

MISSOURI
EFFECTIVE 1/1/2015CLASS SHEET METAL WORK-SHOP AND OUTSIDE-NOC & DRIVERS
5538
Industry Group: Contracting CONVERTED LOSSESHazard Group: E INDEMNITY LIKELY INDEMNITY NOT-LIKELY MED LIKELY MED NOT-LIKELY TOTAL TOTAL
POLICY PERIOD PAYROLL CASES AMOUNT CASES AMOUNT AMOUNT AMOUNT AMOUNT PURE PREM.7/07 through 6/08 42,242,450 11 1,003,861 26 565,226 1,067,549 1,048,721 3,685,357 8.727/08 through 6/09 43,327 0 0 1 622 0 11,791 12,413 28.657/09 through 6/10 45,612 0 0 0 0 0 0 0 0.007/10 through 6/11 0 0 0 0 0 0 0 0 0.007/11 through 6/12 0 0 0 0 0 0 0 0 0.00
5 YR. TOTAL 42,331,389 11 1,003,861 27 565,848 1,067,549 1,060,512 3,697,770 8.74INDEMNITY MEDICAL TOTAL
CRED. PURE PREM.* CRED. PURE PREM.* PURE PREM.*Indicated Pure Premium 29% 3.708 38% 5.027 8.74Pure Premium Indicated by National Relativity 30% 1.197 31% 1.770 2.97Pure Premium Present on Rate Level 41% 1.978 31% 2.755 4.73Pure Premium Derived by Formula 2.245 3.313 5.56
CLASS ROOFING-ALL KINDS & DRIVERS
5551
Industry Group: Contracting CONVERTED LOSSESHazard Group: G INDEMNITY LIKELY INDEMNITY NOT-LIKELY MED LIKELY MED NOT-LIKELY TOTAL TOTAL
POLICY PERIOD PAYROLL CASES AMOUNT CASES AMOUNT AMOUNT AMOUNT AMOUNT PURE PREM.7/07 through 6/08 75,038,851 21 3,117,802 76 1,780,842 3,939,486 2,517,157 11,355,287 15.137/08 through 6/09 63,334,840 14 799,198 57 2,260,186 1,379,625 5,288,515 9,727,524 15.367/09 through 6/10 63,459,274 17 1,015,333 60 2,063,351 1,176,144 2,127,063 6,381,891 10.067/10 through 6/11 71,217,584 24 1,921,278 70 2,640,549 2,946,732 3,864,684 11,373,243 15.977/11 through 6/12 73,752,322 15 948,552 96 3,711,771 1,737,253 4,268,401 10,665,977 14.46
5 YR. TOTAL 346,802,871 91 7,802,163 359 12,456,699 11,179,240 18,065,820 49,503,922 14.28INDEMNITY MEDICAL TOTAL
CRED. PURE PREM.* CRED. PURE PREM.* PURE PREM.*Indicated Pure Premium 100% 5.842 100% 8.433 14.28Pure Premium Indicated by National Relativity 0% 4.908 0% 8.649 13.56Pure Premium Present on Rate Level 0% 6.366 0% 9.132 15.50Pure Premium Derived by Formula 5.842 8.433 14.28
CLASS CONTRACTOR--PROJECT MANAGER, CONSTRUCTION EXECUTIVE, CONSTRUCTION MANAGER
5606 OR CONSTRUCTION SUPERINTENDENT
Industry Group: Contracting CONVERTED LOSSESHazard Group: F INDEMNITY LIKELY INDEMNITY NOT-LIKELY MED LIKELY MED NOT-LIKELY TOTAL TOTAL
POLICY PERIOD PAYROLL CASES AMOUNT CASES AMOUNT AMOUNT AMOUNT AMOUNT PURE PREM.7/07 through 6/08 382,994,528 9 752,613 54 1,002,215 1,011,404 1,682,391 4,448,623 1.167/08 through 6/09 362,749,225 7 1,467,501 38 1,551,324 811,547 1,766,838 5,597,210 1.547/09 through 6/10 334,157,729 7 560,283 43 1,302,078 825,067 1,948,960 4,636,388 1.397/10 through 6/11 339,843,979 9 462,872 38 1,129,526 521,658 1,997,963 4,112,019 1.217/11 through 6/12 355,012,403 11 1,090,773 38 851,466 1,288,825 1,381,406 4,612,470 1.30
5 YR. TOTAL 1,774,757,864 43 4,334,042 211 5,836,609 4,458,501 8,777,558 23,406,710 1.32INDEMNITY MEDICAL TOTAL
CRED. PURE PREM.* CRED. PURE PREM.* PURE PREM.*Indicated Pure Premium 88% 0.573 100% 0.746 1.32Pure Premium Indicated by National Relativity 6% 0.489 0% 0.704 1.19Pure Premium Present on Rate Level 6% 0.733 0% 0.822 1.56Pure Premium Derived by Formula 0.578 0.746 1.32
Page 113
* Pure Premium per $100 of Payroll** Pure Premium per employee++ Non-Standard Calculation© Copyright 2014 National Council on Compensation Insurance, Inc. All Rights Reserved.

MISSOURI
EFFECTIVE 1/1/2015CLASS CLEANER - DEBRIS REMOVAL - NEW CONSTRUCTION
5610
Industry Group: Contracting CONVERTED LOSSESHazard Group: C INDEMNITY LIKELY INDEMNITY NOT-LIKELY MED LIKELY MED NOT-LIKELY TOTAL TOTAL
POLICY PERIOD PAYROLL CASES AMOUNT CASES AMOUNT AMOUNT AMOUNT AMOUNT PURE PREM.7/07 through 6/08 11,021,786 3 148,749 5 46,386 296,047 76,589 567,771 5.157/08 through 6/09 7,215,290 2 53,077 4 30,974 39,388 103,070 226,509 3.147/09 through 6/10 6,193,661 0 0 5 19,230 0 20,025 39,255 0.637/10 through 6/11 5,629,985 1 268,953 0 0 213,911 4,749 487,613 8.667/11 through 6/12 6,860,447 2 171,117 4 69,089 73,371 76,900 390,477 5.69
5 YR. TOTAL 36,921,169 8 641,896 18 165,679 622,717 281,333 1,711,625 4.64INDEMNITY MEDICAL TOTAL
CRED. PURE PREM.* CRED. PURE PREM.* PURE PREM.*Indicated Pure Premium 27% 2.187 38% 2.449 4.64Pure Premium Indicated by National Relativity 36% 1.765 31% 2.705 4.47Pure Premium Present on Rate Level 37% 1.884 31% 3.285 5.17Pure Premium Derived by Formula 1.923 2.788 4.71
CLASS CARPENTRY- CONSTRUCTION OF RESIDENTIAL DWELLINGS NOT EXCEEDING THREE
5645 STORIES IN HEIGHT
Industry Group: Contracting CONVERTED LOSSESHazard Group: F INDEMNITY LIKELY INDEMNITY NOT-LIKELY MED LIKELY MED NOT-LIKELY TOTAL TOTAL
POLICY PERIOD PAYROLL CASES AMOUNT CASES AMOUNT AMOUNT AMOUNT AMOUNT PURE PREM.7/07 through 6/08 264,739,832 50 2,938,711 242 5,159,985 6,133,618 7,434,797 21,667,111 8.187/08 through 6/09 198,234,085 33 1,962,231 171 4,963,549 4,184,451 7,681,858 18,792,089 9.487/09 through 6/10 185,499,713 32 2,195,755 145 2,835,164 4,334,141 5,631,059 14,996,119 8.087/10 through 6/11 188,964,230 30 1,946,212 176 4,237,777 3,831,797 9,029,493 19,045,279 10.087/11 through 6/12 196,691,292 25 1,682,018 167 5,499,878 3,307,228 7,543,708 18,032,832 9.17
5 YR. TOTAL 1,034,129,152 170 10,724,927 901 22,696,353 21,791,235 37,320,915 92,533,430 8.95INDEMNITY MEDICAL TOTAL
CRED. PURE PREM.* CRED. PURE PREM.* PURE PREM.*Indicated Pure Premium 100% 3.232 100% 5.716 8.95Pure Premium Indicated by National Relativity 0% 3.654 0% 5.827 9.48Pure Premium Present on Rate Level 0% 3.209 0% 5.494 8.70Pure Premium Derived by Formula 3.232 5.716 8.95
CLASS BUILDING RAISING OR MOVING
5703
Industry Group: Contracting CONVERTED LOSSESHazard Group: E INDEMNITY LIKELY INDEMNITY NOT-LIKELY MED LIKELY MED NOT-LIKELY TOTAL TOTAL
POLICY PERIOD PAYROLL CASES AMOUNT CASES AMOUNT AMOUNT AMOUNT AMOUNT PURE PREM.7/07 through 6/08 110,231 0 0 0 0 0 0 0 0.007/08 through 6/09 84,444 0 0 0 0 0 0 0 0.007/09 through 6/10 59,305 0 0 0 0 0 0 0 0.007/10 through 6/11 136,289 0 0 1 9,396 0 11,220 20,616 15.137/11 through 6/12 93,660 0 0 0 0 0 0 0 0.00
5 YR. TOTAL 483,929 0 0 1 9,396 0 11,220 20,616 4.26INDEMNITY MEDICAL TOTAL
CRED. PURE PREM.* CRED. PURE PREM.* PURE PREM.*Indicated Pure Premium 7% 1.942 8% 2.319 4.26Pure Premium Indicated by National Relativity 28% 5.563 29% 6.682 12.25Pure Premium Present on Rate Level 65% 5.052 63% 5.581 10.63Pure Premium Derived by Formula 4.977 5.639 10.62
Page 114
* Pure Premium per $100 of Payroll** Pure Premium per employee++ Non-Standard Calculation© Copyright 2014 National Council on Compensation Insurance, Inc. All Rights Reserved.
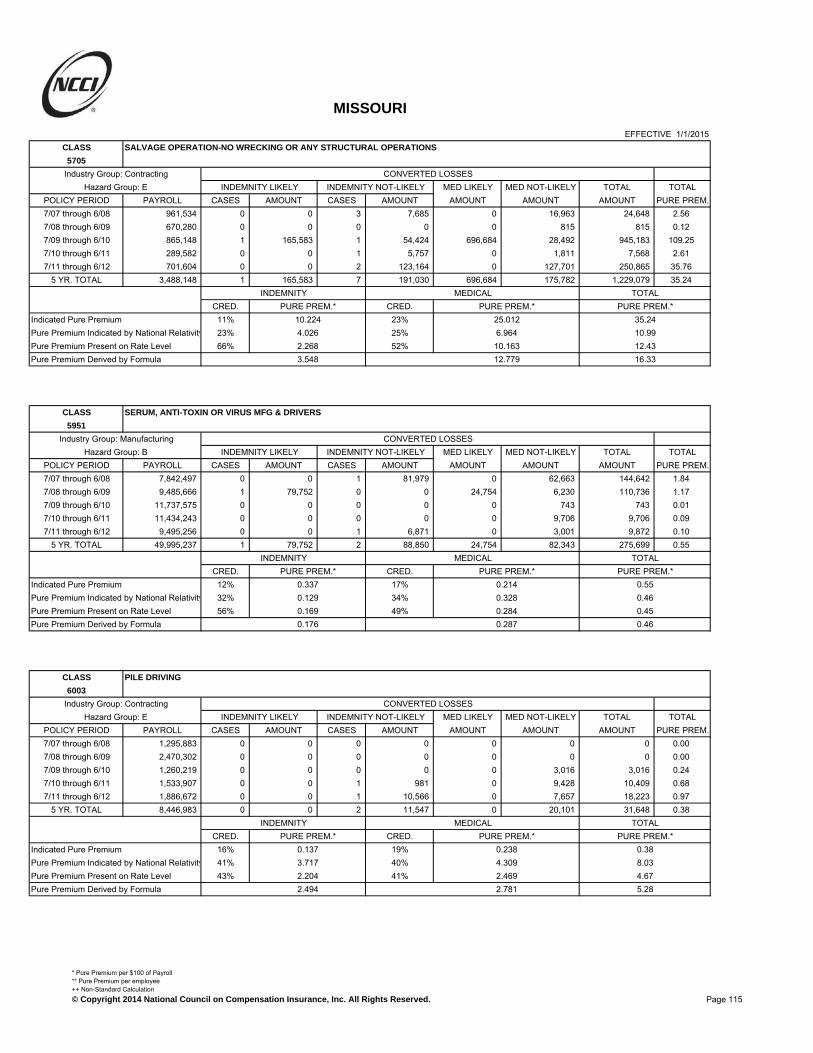
MISSOURI
EFFECTIVE 1/1/2015CLASS SALVAGE OPERATION-NO WRECKING OR ANY STRUCTURAL OPERATIONS
5705
Industry Group: Contracting CONVERTED LOSSESHazard Group: E INDEMNITY LIKELY INDEMNITY NOT-LIKELY MED LIKELY MED NOT-LIKELY TOTAL TOTAL
POLICY PERIOD PAYROLL CASES AMOUNT CASES AMOUNT AMOUNT AMOUNT AMOUNT PURE PREM.7/07 through 6/08 961,534 0 0 3 7,685 0 16,963 24,648 2.567/08 through 6/09 670,280 0 0 0 0 0 815 815 0.127/09 through 6/10 865,148 1 165,583 1 54,424 696,684 28,492 945,183 109.257/10 through 6/11 289,582 0 0 1 5,757 0 1,811 7,568 2.617/11 through 6/12 701,604 0 0 2 123,164 0 127,701 250,865 35.76
5 YR. TOTAL 3,488,148 1 165,583 7 191,030 696,684 175,782 1,229,079 35.24INDEMNITY MEDICAL TOTAL
CRED. PURE PREM.* CRED. PURE PREM.* PURE PREM.*Indicated Pure Premium 11% 10.224 23% 25.012 35.24Pure Premium Indicated by National Relativity 23% 4.026 25% 6.964 10.99Pure Premium Present on Rate Level 66% 2.268 52% 10.163 12.43Pure Premium Derived by Formula 3.548 12.779 16.33
CLASS SERUM, ANTI-TOXIN OR VIRUS MFG & DRIVERS
5951
Industry Group: Manufacturing CONVERTED LOSSESHazard Group: B INDEMNITY LIKELY INDEMNITY NOT-LIKELY MED LIKELY MED NOT-LIKELY TOTAL TOTAL
POLICY PERIOD PAYROLL CASES AMOUNT CASES AMOUNT AMOUNT AMOUNT AMOUNT PURE PREM.7/07 through 6/08 7,842,497 0 0 1 81,979 0 62,663 144,642 1.847/08 through 6/09 9,485,666 1 79,752 0 0 24,754 6,230 110,736 1.177/09 through 6/10 11,737,575 0 0 0 0 0 743 743 0.017/10 through 6/11 11,434,243 0 0 0 0 0 9,706 9,706 0.097/11 through 6/12 9,495,256 0 0 1 6,871 0 3,001 9,872 0.10
5 YR. TOTAL 49,995,237 1 79,752 2 88,850 24,754 82,343 275,699 0.55INDEMNITY MEDICAL TOTAL
CRED. PURE PREM.* CRED. PURE PREM.* PURE PREM.*Indicated Pure Premium 12% 0.337 17% 0.214 0.55Pure Premium Indicated by National Relativity 32% 0.129 34% 0.328 0.46Pure Premium Present on Rate Level 56% 0.169 49% 0.284 0.45Pure Premium Derived by Formula 0.176 0.287 0.46
CLASS PILE DRIVING
6003
Industry Group: Contracting CONVERTED LOSSESHazard Group: E INDEMNITY LIKELY INDEMNITY NOT-LIKELY MED LIKELY MED NOT-LIKELY TOTAL TOTAL
POLICY PERIOD PAYROLL CASES AMOUNT CASES AMOUNT AMOUNT AMOUNT AMOUNT PURE PREM.7/07 through 6/08 1,295,883 0 0 0 0 0 0 0 0.007/08 through 6/09 2,470,302 0 0 0 0 0 0 0 0.007/09 through 6/10 1,260,219 0 0 0 0 0 3,016 3,016 0.247/10 through 6/11 1,533,907 0 0 1 981 0 9,428 10,409 0.687/11 through 6/12 1,886,672 0 0 1 10,566 0 7,657 18,223 0.97
5 YR. TOTAL 8,446,983 0 0 2 11,547 0 20,101 31,648 0.38INDEMNITY MEDICAL TOTAL
CRED. PURE PREM.* CRED. PURE PREM.* PURE PREM.*Indicated Pure Premium 16% 0.137 19% 0.238 0.38Pure Premium Indicated by National Relativity 41% 3.717 40% 4.309 8.03Pure Premium Present on Rate Level 43% 2.204 41% 2.469 4.67Pure Premium Derived by Formula 2.494 2.781 5.28
Page 115
* Pure Premium per $100 of Payroll** Pure Premium per employee++ Non-Standard Calculation© Copyright 2014 National Council on Compensation Insurance, Inc. All Rights Reserved.

MISSOURI
EFFECTIVE 1/1/2015CLASS JETTY OR BREAKWATER CONSTRUCTION-ALL OPERATIONS TO COMPLETION & DRIVERS
6005
Industry Group: Contracting CONVERTED LOSSESHazard Group: E INDEMNITY LIKELY INDEMNITY NOT-LIKELY MED LIKELY MED NOT-LIKELY TOTAL TOTAL
POLICY PERIOD PAYROLL CASES AMOUNT CASES AMOUNT AMOUNT AMOUNT AMOUNT PURE PREM.7/07 through 6/08 18,516 0 0 0 0 0 0 0 0.007/08 through 6/09 0 0 0 0 0 0 0 0 0.007/09 through 6/10 81,025 0 0 0 0 0 0 0 0.007/10 through 6/11 72,800 0 0 0 0 0 0 0 0.007/11 through 6/12 103,020 0 0 0 0 0 0 0 0.00
5 YR. TOTAL 275,361 0 0 0 0 0 0 0 0.00INDEMNITY MEDICAL TOTAL
CRED. PURE PREM.* CRED. PURE PREM.* PURE PREM.*Indicated Pure Premium 5% 0.000 7% 0.000 0.00Pure Premium Indicated by National Relativity 14% 0.567 15% 1.617 2.18Pure Premium Present on Rate Level 81% 3.944 78% 5.600 9.54Pure Premium Derived by Formula 3.274 4.611 7.89
CLASS LEVEE CONSTRUCTION-ALL OPERATIONS TO COMPLETION & DRIVERS
6045
Industry Group: Contracting CONVERTED LOSSESHazard Group: E INDEMNITY LIKELY INDEMNITY NOT-LIKELY MED LIKELY MED NOT-LIKELY TOTAL TOTAL
POLICY PERIOD PAYROLL CASES AMOUNT CASES AMOUNT AMOUNT AMOUNT AMOUNT PURE PREM.7/07 through 6/08 1,282,720 0 0 1 250 0 4,576 4,826 0.387/08 through 6/09 512,599 0 0 0 0 0 932 932 0.187/09 through 6/10 1,054,926 0 0 1 15,748 0 26,473 42,221 4.007/10 through 6/11 1,643,348 0 0 0 0 0 0 0 0.007/11 through 6/12 1,611,496 1 19,076 0 0 4,554 499 24,129 1.50
5 YR. TOTAL 6,105,089 1 19,076 2 15,998 4,554 32,480 72,108 1.18INDEMNITY MEDICAL TOTAL
CRED. PURE PREM.* CRED. PURE PREM.* PURE PREM.*Indicated Pure Premium 10% 0.575 11% 0.607 1.18Pure Premium Indicated by National Relativity 24% 1.908 25% 2.144 4.05Pure Premium Present on Rate Level 66% 0.823 64% 0.902 1.73Pure Premium Derived by Formula 1.059 1.180 2.24
CLASS DRILLING NOC & DRIVERS
6204
Industry Group: Contracting CONVERTED LOSSESHazard Group: F INDEMNITY LIKELY INDEMNITY NOT-LIKELY MED LIKELY MED NOT-LIKELY TOTAL TOTAL
POLICY PERIOD PAYROLL CASES AMOUNT CASES AMOUNT AMOUNT AMOUNT AMOUNT PURE PREM.7/07 through 6/08 11,539,769 2 7,592 12 128,708 9,958 262,775 409,033 3.547/08 through 6/09 10,594,781 1 4,957 10 156,420 2,132 303,392 466,901 4.417/09 through 6/10 9,906,840 2 214,532 12 351,172 227,704 455,116 1,248,524 12.607/10 through 6/11 9,937,524 3 214,745 11 611,040 1,007,992 787,514 2,621,291 26.387/11 through 6/12 10,461,421 0 0 11 411,375 0 375,473 786,848 7.52
5 YR. TOTAL 52,440,335 8 441,826 56 1,658,715 1,247,786 2,184,270 5,532,597 10.55INDEMNITY MEDICAL TOTAL
CRED. PURE PREM.* CRED. PURE PREM.* PURE PREM.*Indicated Pure Premium 39% 4.006 52% 6.545 10.55Pure Premium Indicated by National Relativity 30% 3.737 24% 4.943 8.68Pure Premium Present on Rate Level 31% 3.339 24% 4.939 8.28Pure Premium Derived by Formula 3.719 5.775 9.49
Page 116
* Pure Premium per $100 of Payroll** Pure Premium per employee++ Non-Standard Calculation© Copyright 2014 National Council on Compensation Insurance, Inc. All Rights Reserved.

MISSOURI
EFFECTIVE 1/1/2015CLASS OIL OR GAS WELL: CEMENTING & DRIVERS
6206
Industry Group: Contracting CONVERTED LOSSESHazard Group: G INDEMNITY LIKELY INDEMNITY NOT-LIKELY MED LIKELY MED NOT-LIKELY TOTAL TOTAL
POLICY PERIOD PAYROLL CASES AMOUNT CASES AMOUNT AMOUNT AMOUNT AMOUNT PURE PREM.7/07 through 6/08 133,417 0 0 0 0 0 0 0 0.007/08 through 6/09 60,532 0 0 0 0 0 0 0 0.007/09 through 6/10 170,567 0 0 0 0 0 0 0 0.007/10 through 6/11 3,517 0 0 0 0 0 0 0 0.007/11 through 6/12 24,982 0 0 0 0 0 0 0 0.00
5 YR. TOTAL 393,015 0 0 0 0 0 0 0 0.00INDEMNITY MEDICAL TOTAL
CRED. PURE PREM.* CRED. PURE PREM.* PURE PREM.*Indicated Pure Premium 4% 0.000 5% 0.000 0.00Pure Premium Indicated by National Relativity 48% 1.301 47% 1.701 3.00Pure Premium Present on Rate Level 48% 1.331 48% 1.695 3.03Pure Premium Derived by Formula 1.263 1.613 2.88
CLASS OIL OR GAS - WELL - SPECIALTY TOOL & EQUIPMENT LEASING NOC - ALL EMPLOYEES
6213 AND DRIVERS
Industry Group: Contracting CONVERTED LOSSESHazard Group: F INDEMNITY LIKELY INDEMNITY NOT-LIKELY MED LIKELY MED NOT-LIKELY TOTAL TOTAL
POLICY PERIOD PAYROLL CASES AMOUNT CASES AMOUNT AMOUNT AMOUNT AMOUNT PURE PREM.7/07 through 6/08 559,286 0 0 0 0 0 0 0 0.007/08 through 6/09 421,042 0 0 0 0 0 0 0 0.007/09 through 6/10 379,653 0 0 0 0 0 0 0 0.007/10 through 6/11 411,681 0 0 0 0 0 0 0 0.007/11 through 6/12 212,848 0 0 0 0 0 0 0 0.00
5 YR. TOTAL 1,984,510 0 0 0 0 0 0 0 0.00INDEMNITY MEDICAL TOTAL
CRED. PURE PREM.* CRED. PURE PREM.* PURE PREM.*Indicated Pure Premium 6% 0.000 7% 0.000 0.00Pure Premium Indicated by National Relativity 47% 0.865 46% 1.172 2.04Pure Premium Present on Rate Level 47% 0.809 47% 1.002 1.81Pure Premium Derived by Formula 0.787 1.010 1.80
CLASS OIL OR GAS WELL: PERFORATING OF CASING-ALL EMPLOYEES & DRIVERS
6214
Industry Group: Contracting CONVERTED LOSSESHazard Group: G INDEMNITY LIKELY INDEMNITY NOT-LIKELY MED LIKELY MED NOT-LIKELY TOTAL TOTAL
POLICY PERIOD PAYROLL CASES AMOUNT CASES AMOUNT AMOUNT AMOUNT AMOUNT PURE PREM.7/07 through 6/08 0 0 0 0 0 0 0 0 0.007/08 through 6/09 0 0 0 0 0 0 0 0 0.007/09 through 6/10 0 0 0 0 0 0 0 0 0.007/10 through 6/11 0 0 0 0 0 0 0 0 0.007/11 through 6/12 0 0 0 0 0 0 0 0 0.00
5 YR. TOTAL 0 0 0 0 0 0 0 0 0.00INDEMNITY MEDICAL TOTAL
CRED. PURE PREM.* CRED. PURE PREM.* PURE PREM.*Indicated Pure Premium 0% 0.000 0% 0.000 0.00Pure Premium Indicated by National Relativity 25% 1.144 27% 1.259 2.40Pure Premium Present on Rate Level 75% 1.180 73% 1.488 2.67Pure Premium Derived by Formula 1.171 1.426 2.60
Page 117
* Pure Premium per $100 of Payroll** Pure Premium per employee++ Non-Standard Calculation© Copyright 2014 National Council on Compensation Insurance, Inc. All Rights Reserved.

MISSOURI
EFFECTIVE 1/1/2015CLASS OIL OR GAS - LEASE WORK NOC - BY SPECIALIST CONTRACTOR & DRIVERS
6216
Industry Group: Contracting CONVERTED LOSSESHazard Group: G INDEMNITY LIKELY INDEMNITY NOT-LIKELY MED LIKELY MED NOT-LIKELY TOTAL TOTAL
POLICY PERIOD PAYROLL CASES AMOUNT CASES AMOUNT AMOUNT AMOUNT AMOUNT PURE PREM.7/07 through 6/08 255,692 0 0 1 10,824 0 45,035 55,859 21.857/08 through 6/09 257,276 0 0 0 0 0 0 0 0.007/09 through 6/10 141,008 0 0 0 0 0 0 0 0.007/10 through 6/11 167,755 0 0 0 0 0 2,813 2,813 1.687/11 through 6/12 271,040 0 0 1 3,888 0 21,640 25,528 9.42
5 YR. TOTAL 1,092,771 0 0 2 14,712 0 69,488 84,200 7.71INDEMNITY MEDICAL TOTAL
CRED. PURE PREM.* CRED. PURE PREM.* PURE PREM.*Indicated Pure Premium 8% 1.346 10% 6.359 7.71Pure Premium Indicated by National Relativity 46% 2.535 45% 3.146 5.68Pure Premium Present on Rate Level 46% 2.531 45% 3.505 6.04Pure Premium Derived by Formula 2.438 3.629 6.07
CLASS EXCAVATION & DRIVERS
6217
Industry Group: Contracting CONVERTED LOSSESHazard Group: F INDEMNITY LIKELY INDEMNITY NOT-LIKELY MED LIKELY MED NOT-LIKELY TOTAL TOTAL
POLICY PERIOD PAYROLL CASES AMOUNT CASES AMOUNT AMOUNT AMOUNT AMOUNT PURE PREM.7/07 through 6/08 242,192,674 22 2,113,130 85 1,969,597 2,532,902 3,630,493 10,246,122 4.237/08 through 6/09 191,215,858 11 379,049 57 1,328,186 435,692 1,680,698 3,823,625 2.007/09 through 6/10 164,147,908 19 958,758 37 1,179,936 1,520,737 1,679,908 5,339,339 3.257/10 through 6/11 174,084,846 13 1,100,134 78 1,896,046 1,769,763 2,882,839 7,648,782 4.397/11 through 6/12 164,312,002 13 1,377,047 65 2,015,378 1,677,800 3,759,106 8,829,331 5.37
5 YR. TOTAL 935,953,288 78 5,928,118 322 8,389,143 7,936,894 13,633,044 35,887,199 3.84INDEMNITY MEDICAL TOTAL
CRED. PURE PREM.* CRED. PURE PREM.* PURE PREM.*Indicated Pure Premium 91% 1.530 100% 2.305 3.84Pure Premium Indicated by National Relativity 4% 1.904 0% 2.539 4.44Pure Premium Present on Rate Level 5% 1.522 0% 2.059 3.58Pure Premium Derived by Formula 1.545 2.305 3.85
CLASS IRRIGATION OR DRAINAGE SYSTEM CONSTRUCTION & DRIVERS
6229
Industry Group: Contracting CONVERTED LOSSESHazard Group: F INDEMNITY LIKELY INDEMNITY NOT-LIKELY MED LIKELY MED NOT-LIKELY TOTAL TOTAL
POLICY PERIOD PAYROLL CASES AMOUNT CASES AMOUNT AMOUNT AMOUNT AMOUNT PURE PREM.7/07 through 6/08 7,781,298 1 55,050 2 12,077 79,377 34,118 180,622 2.327/08 through 6/09 7,250,866 0 0 7 70,717 0 166,129 236,846 3.277/09 through 6/10 7,794,431 0 0 4 44,108 0 93,339 137,447 1.767/10 through 6/11 8,129,668 0 0 7 83,647 0 190,110 273,757 3.377/11 through 6/12 8,266,879 2 259,649 4 101,923 386,388 117,665 865,625 10.47
5 YR. TOTAL 39,223,142 3 314,699 24 312,472 465,765 601,361 1,694,297 4.32INDEMNITY MEDICAL TOTAL
CRED. PURE PREM.* CRED. PURE PREM.* PURE PREM.*Indicated Pure Premium 26% 1.599 36% 2.721 4.32Pure Premium Indicated by National Relativity 37% 1.580 32% 2.104 3.68Pure Premium Present on Rate Level 37% 1.601 32% 2.599 4.20Pure Premium Derived by Formula 1.593 2.485 4.08
Page 118
* Pure Premium per $100 of Payroll** Pure Premium per employee++ Non-Standard Calculation© Copyright 2014 National Council on Compensation Insurance, Inc. All Rights Reserved.
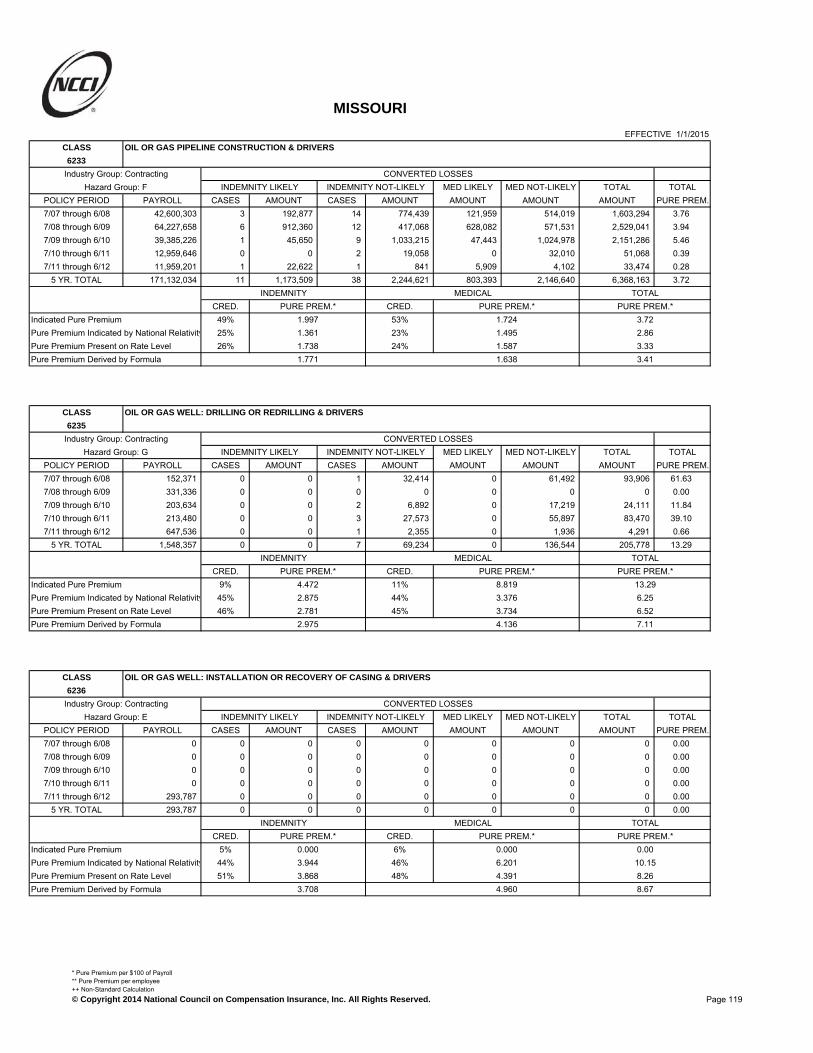
MISSOURI
EFFECTIVE 1/1/2015CLASS OIL OR GAS PIPELINE CONSTRUCTION & DRIVERS
6233
Industry Group: Contracting CONVERTED LOSSESHazard Group: F INDEMNITY LIKELY INDEMNITY NOT-LIKELY MED LIKELY MED NOT-LIKELY TOTAL TOTAL
POLICY PERIOD PAYROLL CASES AMOUNT CASES AMOUNT AMOUNT AMOUNT AMOUNT PURE PREM.7/07 through 6/08 42,600,303 3 192,877 14 774,439 121,959 514,019 1,603,294 3.767/08 through 6/09 64,227,658 6 912,360 12 417,068 628,082 571,531 2,529,041 3.947/09 through 6/10 39,385,226 1 45,650 9 1,033,215 47,443 1,024,978 2,151,286 5.467/10 through 6/11 12,959,646 0 0 2 19,058 0 32,010 51,068 0.397/11 through 6/12 11,959,201 1 22,622 1 841 5,909 4,102 33,474 0.28
5 YR. TOTAL 171,132,034 11 1,173,509 38 2,244,621 803,393 2,146,640 6,368,163 3.72INDEMNITY MEDICAL TOTAL
CRED. PURE PREM.* CRED. PURE PREM.* PURE PREM.*Indicated Pure Premium 49% 1.997 53% 1.724 3.72Pure Premium Indicated by National Relativity 25% 1.361 23% 1.495 2.86Pure Premium Present on Rate Level 26% 1.738 24% 1.587 3.33Pure Premium Derived by Formula 1.771 1.638 3.41
CLASS OIL OR GAS WELL: DRILLING OR REDRILLING & DRIVERS
6235
Industry Group: Contracting CONVERTED LOSSESHazard Group: G INDEMNITY LIKELY INDEMNITY NOT-LIKELY MED LIKELY MED NOT-LIKELY TOTAL TOTAL
POLICY PERIOD PAYROLL CASES AMOUNT CASES AMOUNT AMOUNT AMOUNT AMOUNT PURE PREM.7/07 through 6/08 152,371 0 0 1 32,414 0 61,492 93,906 61.637/08 through 6/09 331,336 0 0 0 0 0 0 0 0.007/09 through 6/10 203,634 0 0 2 6,892 0 17,219 24,111 11.847/10 through 6/11 213,480 0 0 3 27,573 0 55,897 83,470 39.107/11 through 6/12 647,536 0 0 1 2,355 0 1,936 4,291 0.66
5 YR. TOTAL 1,548,357 0 0 7 69,234 0 136,544 205,778 13.29INDEMNITY MEDICAL TOTAL
CRED. PURE PREM.* CRED. PURE PREM.* PURE PREM.*Indicated Pure Premium 9% 4.472 11% 8.819 13.29Pure Premium Indicated by National Relativity 45% 2.875 44% 3.376 6.25Pure Premium Present on Rate Level 46% 2.781 45% 3.734 6.52Pure Premium Derived by Formula 2.975 4.136 7.11
CLASS OIL OR GAS WELL: INSTALLATION OR RECOVERY OF CASING & DRIVERS
6236
Industry Group: Contracting CONVERTED LOSSESHazard Group: E INDEMNITY LIKELY INDEMNITY NOT-LIKELY MED LIKELY MED NOT-LIKELY TOTAL TOTAL
POLICY PERIOD PAYROLL CASES AMOUNT CASES AMOUNT AMOUNT AMOUNT AMOUNT PURE PREM.7/07 through 6/08 0 0 0 0 0 0 0 0 0.007/08 through 6/09 0 0 0 0 0 0 0 0 0.007/09 through 6/10 0 0 0 0 0 0 0 0 0.007/10 through 6/11 0 0 0 0 0 0 0 0 0.007/11 through 6/12 293,787 0 0 0 0 0 0 0 0.00
5 YR. TOTAL 293,787 0 0 0 0 0 0 0 0.00INDEMNITY MEDICAL TOTAL
CRED. PURE PREM.* CRED. PURE PREM.* PURE PREM.*Indicated Pure Premium 5% 0.000 6% 0.000 0.00Pure Premium Indicated by National Relativity 44% 3.944 46% 6.201 10.15Pure Premium Present on Rate Level 51% 3.868 48% 4.391 8.26Pure Premium Derived by Formula 3.708 4.960 8.67
Page 119
* Pure Premium per $100 of Payroll** Pure Premium per employee++ Non-Standard Calculation© Copyright 2014 National Council on Compensation Insurance, Inc. All Rights Reserved.
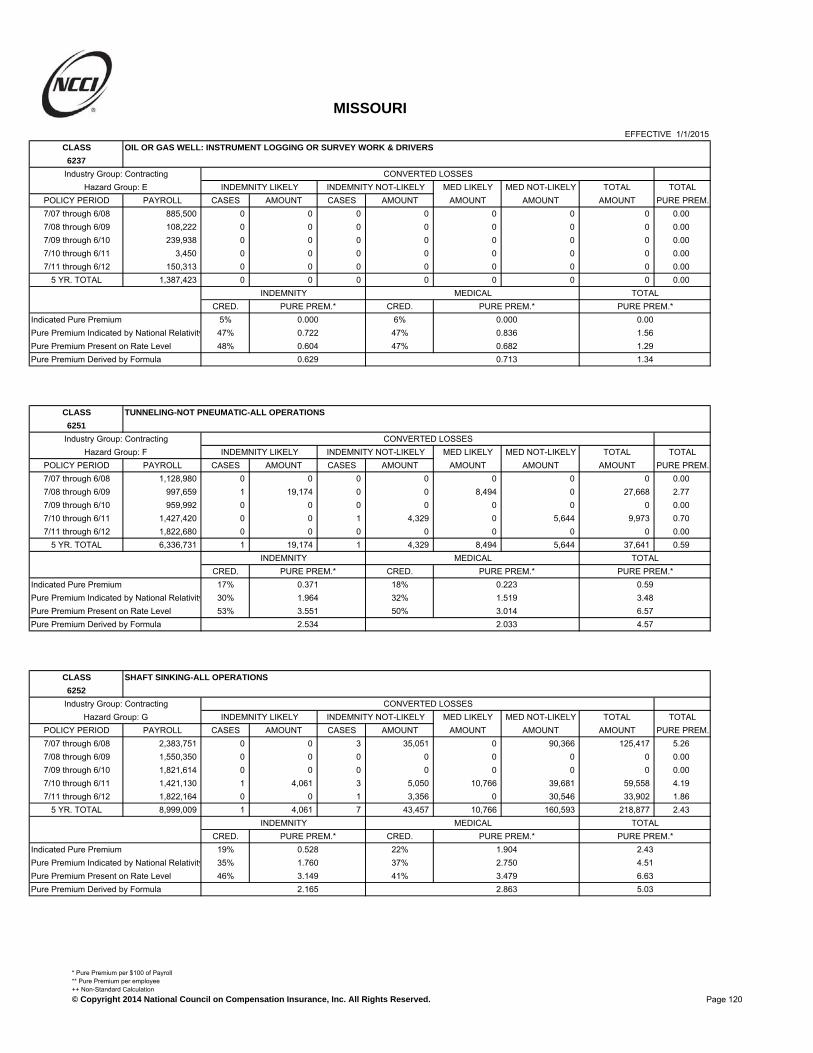
MISSOURI
EFFECTIVE 1/1/2015CLASS OIL OR GAS WELL: INSTRUMENT LOGGING OR SURVEY WORK & DRIVERS
6237
Industry Group: Contracting CONVERTED LOSSESHazard Group: E INDEMNITY LIKELY INDEMNITY NOT-LIKELY MED LIKELY MED NOT-LIKELY TOTAL TOTAL
POLICY PERIOD PAYROLL CASES AMOUNT CASES AMOUNT AMOUNT AMOUNT AMOUNT PURE PREM.7/07 through 6/08 885,500 0 0 0 0 0 0 0 0.007/08 through 6/09 108,222 0 0 0 0 0 0 0 0.007/09 through 6/10 239,938 0 0 0 0 0 0 0 0.007/10 through 6/11 3,450 0 0 0 0 0 0 0 0.007/11 through 6/12 150,313 0 0 0 0 0 0 0 0.00
5 YR. TOTAL 1,387,423 0 0 0 0 0 0 0 0.00INDEMNITY MEDICAL TOTAL
CRED. PURE PREM.* CRED. PURE PREM.* PURE PREM.*Indicated Pure Premium 5% 0.000 6% 0.000 0.00Pure Premium Indicated by National Relativity 47% 0.722 47% 0.836 1.56Pure Premium Present on Rate Level 48% 0.604 47% 0.682 1.29Pure Premium Derived by Formula 0.629 0.713 1.34
CLASS TUNNELING-NOT PNEUMATIC-ALL OPERATIONS
6251
Industry Group: Contracting CONVERTED LOSSESHazard Group: F INDEMNITY LIKELY INDEMNITY NOT-LIKELY MED LIKELY MED NOT-LIKELY TOTAL TOTAL
POLICY PERIOD PAYROLL CASES AMOUNT CASES AMOUNT AMOUNT AMOUNT AMOUNT PURE PREM.7/07 through 6/08 1,128,980 0 0 0 0 0 0 0 0.007/08 through 6/09 997,659 1 19,174 0 0 8,494 0 27,668 2.777/09 through 6/10 959,992 0 0 0 0 0 0 0 0.007/10 through 6/11 1,427,420 0 0 1 4,329 0 5,644 9,973 0.707/11 through 6/12 1,822,680 0 0 0 0 0 0 0 0.00
5 YR. TOTAL 6,336,731 1 19,174 1 4,329 8,494 5,644 37,641 0.59INDEMNITY MEDICAL TOTAL
CRED. PURE PREM.* CRED. PURE PREM.* PURE PREM.*Indicated Pure Premium 17% 0.371 18% 0.223 0.59Pure Premium Indicated by National Relativity 30% 1.964 32% 1.519 3.48Pure Premium Present on Rate Level 53% 3.551 50% 3.014 6.57Pure Premium Derived by Formula 2.534 2.033 4.57
CLASS SHAFT SINKING-ALL OPERATIONS
6252
Industry Group: Contracting CONVERTED LOSSESHazard Group: G INDEMNITY LIKELY INDEMNITY NOT-LIKELY MED LIKELY MED NOT-LIKELY TOTAL TOTAL
POLICY PERIOD PAYROLL CASES AMOUNT CASES AMOUNT AMOUNT AMOUNT AMOUNT PURE PREM.7/07 through 6/08 2,383,751 0 0 3 35,051 0 90,366 125,417 5.267/08 through 6/09 1,550,350 0 0 0 0 0 0 0 0.007/09 through 6/10 1,821,614 0 0 0 0 0 0 0 0.007/10 through 6/11 1,421,130 1 4,061 3 5,050 10,766 39,681 59,558 4.197/11 through 6/12 1,822,164 0 0 1 3,356 0 30,546 33,902 1.86
5 YR. TOTAL 8,999,009 1 4,061 7 43,457 10,766 160,593 218,877 2.43INDEMNITY MEDICAL TOTAL
CRED. PURE PREM.* CRED. PURE PREM.* PURE PREM.*Indicated Pure Premium 19% 0.528 22% 1.904 2.43Pure Premium Indicated by National Relativity 35% 1.760 37% 2.750 4.51Pure Premium Present on Rate Level 46% 3.149 41% 3.479 6.63Pure Premium Derived by Formula 2.165 2.863 5.03
Page 120
* Pure Premium per $100 of Payroll** Pure Premium per employee++ Non-Standard Calculation© Copyright 2014 National Council on Compensation Insurance, Inc. All Rights Reserved.

MISSOURI
EFFECTIVE 1/1/2015CLASS SEWER CONSTRUCTION-ALL OPERATIONS & DRIVERS
6306
Industry Group: Contracting CONVERTED LOSSESHazard Group: F INDEMNITY LIKELY INDEMNITY NOT-LIKELY MED LIKELY MED NOT-LIKELY TOTAL TOTAL
POLICY PERIOD PAYROLL CASES AMOUNT CASES AMOUNT AMOUNT AMOUNT AMOUNT PURE PREM.7/07 through 6/08 38,534,845 4 288,758 18 196,489 754,927 251,925 1,492,099 3.877/08 through 6/09 29,552,771 3 178,442 16 320,130 274,917 461,604 1,235,093 4.187/09 through 6/10 29,990,887 3 84,748 13 282,049 73,408 267,884 708,089 2.367/10 through 6/11 27,239,746 2 252,288 19 673,311 795,675 1,856,135 3,577,409 13.137/11 through 6/12 25,992,552 2 501,336 13 1,282,431 782,074 670,365 3,236,206 12.45
5 YR. TOTAL 151,310,801 14 1,305,572 79 2,754,410 2,681,001 3,507,913 10,248,896 6.77INDEMNITY MEDICAL TOTAL
CRED. PURE PREM.* CRED. PURE PREM.* PURE PREM.*Indicated Pure Premium 50% 2.683 65% 4.090 6.77Pure Premium Indicated by National Relativity 25% 1.738 17% 2.389 4.13Pure Premium Present on Rate Level 25% 2.083 18% 2.997 5.08Pure Premium Derived by Formula 2.297 3.604 5.90
CLASS GAS MAIN OR CONNECTION CONSTRUCTION & DRIVERS
6319
Industry Group: Contracting CONVERTED LOSSESHazard Group: F INDEMNITY LIKELY INDEMNITY NOT-LIKELY MED LIKELY MED NOT-LIKELY TOTAL TOTAL
POLICY PERIOD PAYROLL CASES AMOUNT CASES AMOUNT AMOUNT AMOUNT AMOUNT PURE PREM.7/07 through 6/08 28,274,718 1 89,614 6 148,793 101,417 125,575 465,399 1.657/08 through 6/09 25,911,985 3 189,592 5 97,372 65,671 146,997 499,632 1.937/09 through 6/10 24,617,319 1 23,154 9 125,621 24,630 272,075 445,480 1.817/10 through 6/11 26,676,699 5 716,713 6 24,057 701,098 51,361 1,493,229 5.607/11 through 6/12 31,561,622 4 361,458 3 86,048 1,195,562 115,745 1,758,813 5.57
5 YR. TOTAL 137,042,343 14 1,380,531 29 481,891 2,088,378 711,753 4,662,553 3.40INDEMNITY MEDICAL TOTAL
CRED. PURE PREM.* CRED. PURE PREM.* PURE PREM.*Indicated Pure Premium 39% 1.359 46% 2.043 3.40Pure Premium Indicated by National Relativity 30% 1.474 27% 2.064 3.54Pure Premium Present on Rate Level 31% 1.252 27% 1.379 2.63Pure Premium Derived by Formula 1.360 1.869 3.23
CLASS CONDUIT CONSTRUCTION-FOR CABLES OR WIRES-& DRIVERS
6325
Industry Group: Contracting CONVERTED LOSSESHazard Group: F INDEMNITY LIKELY INDEMNITY NOT-LIKELY MED LIKELY MED NOT-LIKELY TOTAL TOTAL
POLICY PERIOD PAYROLL CASES AMOUNT CASES AMOUNT AMOUNT AMOUNT AMOUNT PURE PREM.7/07 through 6/08 45,200,789 5 446,286 25 301,116 748,225 559,026 2,054,653 4.557/08 through 6/09 46,115,322 4 157,391 11 175,741 184,406 279,698 797,236 1.737/09 through 6/10 39,990,467 4 792,760 19 341,178 418,862 418,486 1,971,286 4.937/10 through 6/11 43,950,741 1 64,534 15 221,867 33,354 420,811 740,566 1.697/11 through 6/12 45,312,258 2 88,497 15 317,653 91,289 548,552 1,045,991 2.31
5 YR. TOTAL 220,569,577 16 1,549,468 85 1,357,555 1,476,136 2,226,573 6,609,732 3.00INDEMNITY MEDICAL TOTAL
CRED. PURE PREM.* CRED. PURE PREM.* PURE PREM.*Indicated Pure Premium 53% 1.318 64% 1.679 3.00Pure Premium Indicated by National Relativity 23% 1.746 18% 2.476 4.22Pure Premium Present on Rate Level 24% 1.631 18% 1.964 3.60Pure Premium Derived by Formula 1.492 1.874 3.37
Page 121
* Pure Premium per $100 of Payroll** Pure Premium per employee++ Non-Standard Calculation© Copyright 2014 National Council on Compensation Insurance, Inc. All Rights Reserved.

MISSOURI
EFFECTIVE 1/1/2015CLASS FENCE INSTALLATION AND REPAIR - METAL, VINYL, WOOD, OR PREFABRICATED
6400 CONCRETE PANEL FENCE INSTALLED BY HAND
Industry Group: Contracting CONVERTED LOSSESHazard Group: D INDEMNITY LIKELY INDEMNITY NOT-LIKELY MED LIKELY MED NOT-LIKELY TOTAL TOTAL
POLICY PERIOD PAYROLL CASES AMOUNT CASES AMOUNT AMOUNT AMOUNT AMOUNT PURE PREM.7/07 through 6/08 10,504,493 0 0 9 196,941 0 303,511 500,452 4.767/08 through 6/09 7,797,580 0 0 4 32,332 0 58,356 90,688 1.167/09 through 6/10 9,314,282 1 71,548 3 58,735 73,267 192,552 396,102 4.257/10 through 6/11 9,929,328 0 0 9 238,030 0 348,495 586,525 5.917/11 through 6/12 11,318,257 0 0 11 89,122 0 148,649 237,771 2.10
5 YR. TOTAL 48,863,940 1 71,548 36 615,160 73,267 1,051,563 1,811,538 3.71INDEMNITY MEDICAL TOTAL
CRED. PURE PREM.* CRED. PURE PREM.* PURE PREM.*Indicated Pure Premium 33% 1.405 39% 2.302 3.71Pure Premium Indicated by National Relativity 33% 2.444 30% 3.146 5.59Pure Premium Present on Rate Level 34% 2.306 31% 2.655 4.96Pure Premium Derived by Formula 2.054 2.665 4.72
CLASS POTATO CHIP, POPCORN & SNACK CHIP MFG. NOC
6503
Industry Group: Manufacturing CONVERTED LOSSESHazard Group: B INDEMNITY LIKELY INDEMNITY NOT-LIKELY MED LIKELY MED NOT-LIKELY TOTAL TOTAL
POLICY PERIOD PAYROLL CASES AMOUNT CASES AMOUNT AMOUNT AMOUNT AMOUNT PURE PREM.7/07 through 6/08 0 0 0 0 0 0 0 0 0.007/08 through 6/09 0 0 0 0 0 0 0 0 0.007/09 through 6/10 0 0 0 0 0 0 0 0 0.007/10 through 6/11 1,414,861 0 0 2 4,162 0 18,812 22,974 1.627/11 through 6/12 2,424,215 0 0 2 31,823 0 120,204 152,027 6.27
5 YR. TOTAL 3,839,076 0 0 4 35,985 0 139,016 175,001 4.56INDEMNITY MEDICAL TOTAL
CRED. PURE PREM.* CRED. PURE PREM.* PURE PREM.*Indicated Pure Premium 7% 0.937 10% 3.621 4.56Pure Premium Indicated by National Relativity 19% 0.192 20% 0.369 0.56Pure Premium Present on Rate Level 74% 0.637 70% 1.053 1.69Pure Premium Derived by Formula 0.573 1.173 1.75
CLASS FOOD PRODUCTS MFG. NOC
6504
Industry Group: Manufacturing CONVERTED LOSSESHazard Group: B INDEMNITY LIKELY INDEMNITY NOT-LIKELY MED LIKELY MED NOT-LIKELY TOTAL TOTAL
POLICY PERIOD PAYROLL CASES AMOUNT CASES AMOUNT AMOUNT AMOUNT AMOUNT PURE PREM.7/07 through 6/08 341,524,270 23 616,016 143 1,507,089 780,217 3,411,987 6,315,309 1.857/08 through 6/09 314,605,422 13 635,603 102 1,459,998 767,903 3,242,240 6,105,744 1.947/09 through 6/10 329,303,108 14 423,758 74 1,063,221 439,917 2,093,425 4,020,321 1.227/10 through 6/11 339,129,771 24 799,811 93 3,079,694 909,998 2,340,092 7,129,595 2.107/11 through 6/12 336,053,564 8 1,293,876 97 1,330,625 466,883 2,461,843 5,553,227 1.65
5 YR. TOTAL 1,660,616,135 82 3,769,064 509 8,440,627 3,364,918 13,549,587 29,124,196 1.75INDEMNITY MEDICAL TOTAL
CRED. PURE PREM.* CRED. PURE PREM.* PURE PREM.*Indicated Pure Premium 88% 0.735 100% 1.019 1.75Pure Premium Indicated by National Relativity 6% 0.925 0% 1.464 2.39Pure Premium Present on Rate Level 6% 0.748 0% 1.057 1.81Pure Premium Derived by Formula 0.747 1.019 1.77
Page 122
* Pure Premium per $100 of Payroll** Pure Premium per employee++ Non-Standard Calculation© Copyright 2014 National Council on Compensation Insurance, Inc. All Rights Reserved.
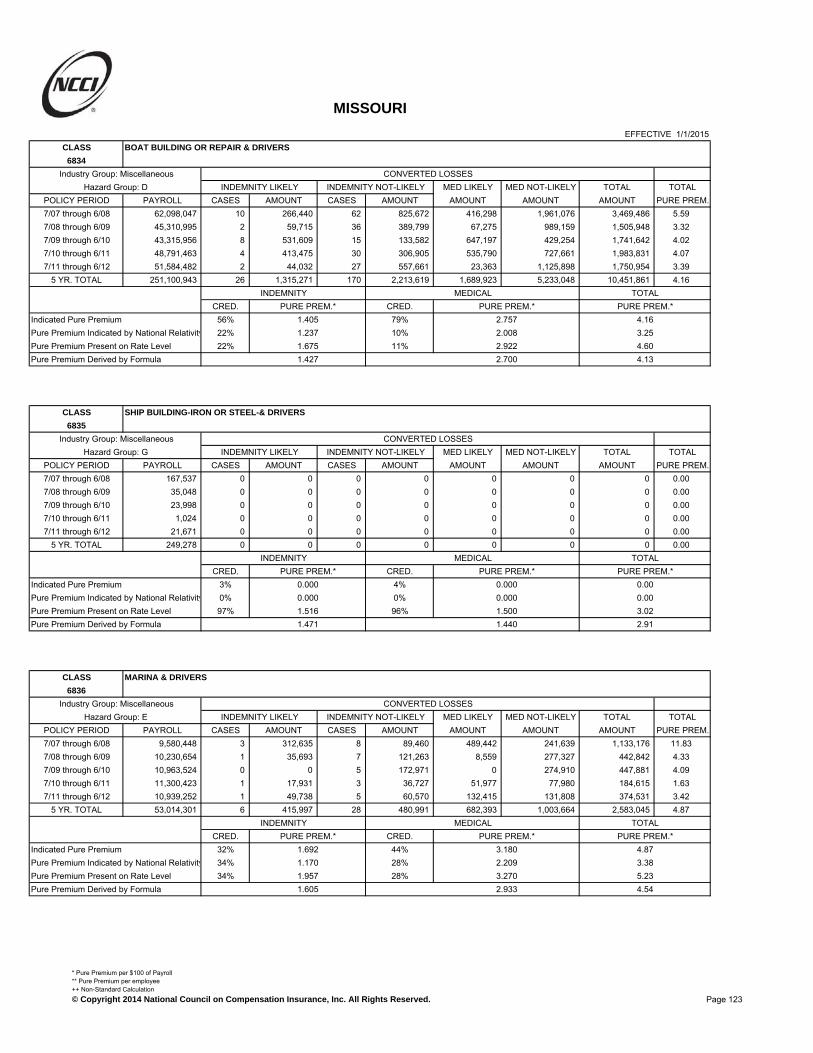
MISSOURI
EFFECTIVE 1/1/2015CLASS BOAT BUILDING OR REPAIR & DRIVERS
6834
Industry Group: Miscellaneous CONVERTED LOSSESHazard Group: D INDEMNITY LIKELY INDEMNITY NOT-LIKELY MED LIKELY MED NOT-LIKELY TOTAL TOTAL
POLICY PERIOD PAYROLL CASES AMOUNT CASES AMOUNT AMOUNT AMOUNT AMOUNT PURE PREM.7/07 through 6/08 62,098,047 10 266,440 62 825,672 416,298 1,961,076 3,469,486 5.597/08 through 6/09 45,310,995 2 59,715 36 389,799 67,275 989,159 1,505,948 3.327/09 through 6/10 43,315,956 8 531,609 15 133,582 647,197 429,254 1,741,642 4.027/10 through 6/11 48,791,463 4 413,475 30 306,905 535,790 727,661 1,983,831 4.077/11 through 6/12 51,584,482 2 44,032 27 557,661 23,363 1,125,898 1,750,954 3.39
5 YR. TOTAL 251,100,943 26 1,315,271 170 2,213,619 1,689,923 5,233,048 10,451,861 4.16INDEMNITY MEDICAL TOTAL
CRED. PURE PREM.* CRED. PURE PREM.* PURE PREM.*Indicated Pure Premium 56% 1.405 79% 2.757 4.16Pure Premium Indicated by National Relativity 22% 1.237 10% 2.008 3.25Pure Premium Present on Rate Level 22% 1.675 11% 2.922 4.60Pure Premium Derived by Formula 1.427 2.700 4.13
CLASS SHIP BUILDING-IRON OR STEEL-& DRIVERS
6835
Industry Group: Miscellaneous CONVERTED LOSSESHazard Group: G INDEMNITY LIKELY INDEMNITY NOT-LIKELY MED LIKELY MED NOT-LIKELY TOTAL TOTAL
POLICY PERIOD PAYROLL CASES AMOUNT CASES AMOUNT AMOUNT AMOUNT AMOUNT PURE PREM.7/07 through 6/08 167,537 0 0 0 0 0 0 0 0.007/08 through 6/09 35,048 0 0 0 0 0 0 0 0.007/09 through 6/10 23,998 0 0 0 0 0 0 0 0.007/10 through 6/11 1,024 0 0 0 0 0 0 0 0.007/11 through 6/12 21,671 0 0 0 0 0 0 0 0.00
5 YR. TOTAL 249,278 0 0 0 0 0 0 0 0.00INDEMNITY MEDICAL TOTAL
CRED. PURE PREM.* CRED. PURE PREM.* PURE PREM.*Indicated Pure Premium 3% 0.000 4% 0.000 0.00Pure Premium Indicated by National Relativity 0% 0.000 0% 0.000 0.00Pure Premium Present on Rate Level 97% 1.516 96% 1.500 3.02Pure Premium Derived by Formula 1.471 1.440 2.91
CLASS MARINA & DRIVERS
6836
Industry Group: Miscellaneous CONVERTED LOSSESHazard Group: E INDEMNITY LIKELY INDEMNITY NOT-LIKELY MED LIKELY MED NOT-LIKELY TOTAL TOTAL
POLICY PERIOD PAYROLL CASES AMOUNT CASES AMOUNT AMOUNT AMOUNT AMOUNT PURE PREM.7/07 through 6/08 9,580,448 3 312,635 8 89,460 489,442 241,639 1,133,176 11.837/08 through 6/09 10,230,654 1 35,693 7 121,263 8,559 277,327 442,842 4.337/09 through 6/10 10,963,524 0 0 5 172,971 0 274,910 447,881 4.097/10 through 6/11 11,300,423 1 17,931 3 36,727 51,977 77,980 184,615 1.637/11 through 6/12 10,939,252 1 49,738 5 60,570 132,415 131,808 374,531 3.42
5 YR. TOTAL 53,014,301 6 415,997 28 480,991 682,393 1,003,664 2,583,045 4.87INDEMNITY MEDICAL TOTAL
CRED. PURE PREM.* CRED. PURE PREM.* PURE PREM.*Indicated Pure Premium 32% 1.692 44% 3.180 4.87Pure Premium Indicated by National Relativity 34% 1.170 28% 2.209 3.38Pure Premium Present on Rate Level 34% 1.957 28% 3.270 5.23Pure Premium Derived by Formula 1.605 2.933 4.54
Page 123
* Pure Premium per $100 of Payroll** Pure Premium per employee++ Non-Standard Calculation© Copyright 2014 National Council on Compensation Insurance, Inc. All Rights Reserved.

MISSOURI
EFFECTIVE 1/1/2015CLASS SHIP REPAIR CONVERSION-ALL OPERATIONS & DRIVERS
6882
Industry Group: Miscellaneous CONVERTED LOSSESHazard Group: G INDEMNITY LIKELY INDEMNITY NOT-LIKELY MED LIKELY MED NOT-LIKELY TOTAL TOTAL
POLICY PERIOD PAYROLL CASES AMOUNT CASES AMOUNT AMOUNT AMOUNT AMOUNT PURE PREM.7/07 through 6/08 229,350 0 0 2 42,414 0 88,567 130,981 57.117/08 through 6/09 215,676 0 0 1 3,087 0 7,366 10,453 4.857/09 through 6/10 189,398 0 0 0 0 0 0 0 0.007/10 through 6/11 246,352 0 0 0 0 0 0 0 0.007/11 through 6/12 164,011 0 0 1 4,164 0 2,345 6,509 3.97
5 YR. TOTAL 1,044,787 0 0 4 49,665 0 98,278 147,943 14.16INDEMNITY MEDICAL TOTAL
CRED. PURE PREM.* CRED. PURE PREM.* PURE PREM.*Indicated Pure Premium 7% 4.754 9% 9.407 14.16Pure Premium Indicated by National Relativity 18% 1.525 19% 2.843 4.37Pure Premium Present on Rate Level 75% 2.465 72% 3.333 5.80Pure Premium Derived by Formula 2.456 3.787 6.24
CLASS SHIP SCALING
6884
Industry Group: Miscellaneous CONVERTED LOSSESHazard Group: G INDEMNITY LIKELY INDEMNITY NOT-LIKELY MED LIKELY MED NOT-LIKELY TOTAL TOTAL
POLICY PERIOD PAYROLL CASES AMOUNT CASES AMOUNT AMOUNT AMOUNT AMOUNT PURE PREM.7/07 through 6/08 0 0 0 0 0 0 0 0 0.007/08 through 6/09 0 0 0 0 0 0 0 0 0.007/09 through 6/10 0 0 0 0 0 0 0 0 0.007/10 through 6/11 0 0 0 0 0 0 0 0 0.007/11 through 6/12 0 0 0 0 0 0 0 0 0.00
5 YR. TOTAL 0 0 0 0 0 0 0 0 0.00INDEMNITY MEDICAL TOTAL
CRED. PURE PREM.* CRED. PURE PREM.* PURE PREM.*Indicated Pure Premium 0% 0.000 0% 0.000 0.00Pure Premium Indicated by National Relativity 11% 1.038 12% 1.117 2.16Pure Premium Present on Rate Level 89% 5.060 88% 3.120 8.18Pure Premium Derived by Formula 4.618 2.880 7.50
CLASS VESSELS-NOC-PROGRAM I
7016 + +
Industry Group: Miscellaneous CONVERTED LOSSESHazard Group: G INDEMNITY LIKELY INDEMNITY NOT-LIKELY MED LIKELY MED NOT-LIKELY TOTAL TOTAL
POLICY PERIOD PAYROLL CASES AMOUNT CASES AMOUNT AMOUNT AMOUNT AMOUNT PURE PREM.7/07 through 6/08 0 0 0 0 0 0 0 0 0.007/08 through 6/09 0 0 0 0 0 0 0 0 0.007/09 through 6/10 0 0 0 0 0 0 0 0 0.007/10 through 6/11 0 0 0 0 0 0 0 0 0.007/11 through 6/12 0 0 0 0 0 0 0 0 0.00
5 YR. TOTAL 0 0 0 0 0 0 0 0 0.00INDEMNITY MEDICAL TOTAL
CRED. PURE PREM.* CRED. PURE PREM.* PURE PREM.*Indicated Pure Premium 0% 0.000 0% 0.000 0.00Pure Premium Indicated by National Relativity 0% 0.000 0% 0.000 0.00Pure Premium Present on Rate Level 100% 1.268 100% 0.927 2.20Pure Premium Derived by Formula 1.268 0.927 2.20
Page 124
* Pure Premium per $100 of Payroll** Pure Premium per employee++ Non-Standard Calculation© Copyright 2014 National Council on Compensation Insurance, Inc. All Rights Reserved.

MISSOURI
EFFECTIVE 1/1/2015CLASS VESSELS-NOC-PROGRAM II-STATE ACT WITH PROGRAM I AND PROGRAM II USL DATA
7024 ADDED FOR RATEMAKING
Industry Group: Miscellaneous CONVERTED LOSSESHazard Group: G INDEMNITY LIKELY INDEMNITY NOT-LIKELY MED LIKELY MED NOT-LIKELY TOTAL TOTAL
POLICY PERIOD PAYROLL CASES AMOUNT CASES AMOUNT AMOUNT AMOUNT AMOUNT PURE PREM.7/07 through 6/08 290,669 0 0 0 0 0 0 0 0.007/08 through 6/09 1,657,160 0 0 0 0 0 0 0 0.007/09 through 6/10 368,538 0 0 0 0 0 0 0 0.007/10 through 6/11 130,701 0 0 0 0 0 0 0 0.007/11 through 6/12 344,233 0 0 0 0 0 0 0 0.00
5 YR. TOTAL 2,791,301 0 0 0 0 0 0 0 0.00INDEMNITY MEDICAL TOTAL
CRED. PURE PREM.* CRED. PURE PREM.* PURE PREM.*Indicated Pure Premium 9% 0.000 9% 0.000 0.00Pure Premium Indicated by National Relativity 24% 1.082 25% 0.966 2.05Pure Premium Present on Rate Level 67% 1.410 66% 1.032 2.44Pure Premium Derived by Formula 1.204 0.923 2.13
CLASS BOAT LIVERY-BOATS UNDER 15 TONS-PROGRAM I
7038 + +
Industry Group: Miscellaneous CONVERTED LOSSESHazard Group: G INDEMNITY LIKELY INDEMNITY NOT-LIKELY MED LIKELY MED NOT-LIKELY TOTAL TOTAL
POLICY PERIOD PAYROLL CASES AMOUNT CASES AMOUNT AMOUNT AMOUNT AMOUNT PURE PREM.7/07 through 6/08 0 0 0 0 0 0 0 0 0.007/08 through 6/09 0 0 0 0 0 0 0 0 0.007/09 through 6/10 0 0 0 0 0 0 0 0 0.007/10 through 6/11 0 0 0 0 0 0 0 0 0.007/11 through 6/12 0 0 0 0 0 0 0 0 0.00
5 YR. TOTAL 0 0 0 0 0 0 0 0 0.00INDEMNITY MEDICAL TOTAL
CRED. PURE PREM.* CRED. PURE PREM.* PURE PREM.*Indicated Pure Premium 0% 0.000 0% 0.000 0.00Pure Premium Indicated by National Relativity 0% 0.000 0% 0.000 0.00Pure Premium Present on Rate Level 100% 2.206 100% 3.204 5.41Pure Premium Derived by Formula 2.206 3.204 5.41
CLASS VESSELS-NOT SELF-PROPELLED-PROGRAM I
7046 + +
Industry Group: Miscellaneous CONVERTED LOSSESHazard Group: G INDEMNITY LIKELY INDEMNITY NOT-LIKELY MED LIKELY MED NOT-LIKELY TOTAL TOTAL
POLICY PERIOD PAYROLL CASES AMOUNT CASES AMOUNT AMOUNT AMOUNT AMOUNT PURE PREM.7/07 through 6/08 0 0 0 0 0 0 0 0 0.007/08 through 6/09 0 0 0 0 0 0 0 0 0.007/09 through 6/10 0 0 0 0 0 0 0 0 0.007/10 through 6/11 0 0 0 0 0 0 0 0 0.007/11 through 6/12 0 0 0 0 0 0 0 0 0.00
5 YR. TOTAL 0 0 0 0 0 0 0 0 0.00INDEMNITY MEDICAL TOTAL
CRED. PURE PREM.* CRED. PURE PREM.* PURE PREM.*Indicated Pure Premium 0% 0.000 0% 0.000 0.00Pure Premium Indicated by National Relativity 0% 0.000 0% 0.000 0.00Pure Premium Present on Rate Level 100% 6.210 100% 5.938 12.15Pure Premium Derived by Formula 6.210 5.938 12.15
Page 125
* Pure Premium per $100 of Payroll** Pure Premium per employee++ Non-Standard Calculation© Copyright 2014 National Council on Compensation Insurance, Inc. All Rights Reserved.

MISSOURI
EFFECTIVE 1/1/2015CLASS VESSELS-NOC-PROGRAM II-USL ACT
7047 + +
Industry Group: Miscellaneous CONVERTED LOSSESHazard Group: G INDEMNITY LIKELY INDEMNITY NOT-LIKELY MED LIKELY MED NOT-LIKELY TOTAL TOTAL
POLICY PERIOD PAYROLL CASES AMOUNT CASES AMOUNT AMOUNT AMOUNT AMOUNT PURE PREM.7/07 through 6/08 0 0 0 0 0 0 0 0 0.007/08 through 6/09 0 0 0 0 0 0 0 0 0.007/09 through 6/10 0 0 0 0 0 0 0 0 0.007/10 through 6/11 0 0 0 0 0 0 0 0 0.007/11 through 6/12 0 0 0 0 0 0 0 0 0.00
5 YR. TOTAL 0 0 0 0 0 0 0 0 0.00INDEMNITY MEDICAL TOTAL
CRED. PURE PREM.* CRED. PURE PREM.* PURE PREM.*Indicated Pure Premium 0% 0.000 0% 0.000 0.00Pure Premium Indicated by National Relativity 0% 0.000 0% 0.000 0.00Pure Premium Present on Rate Level 100% 2.799 100% 0.925 3.72Pure Premium Derived by Formula 2.799 0.925 3.72
CLASS BOAT LIVERY-BOATS UNDER 15 TONS-PROGRAM II-USL ACT
7050 + +
Industry Group: Miscellaneous CONVERTED LOSSESHazard Group: G INDEMNITY LIKELY INDEMNITY NOT-LIKELY MED LIKELY MED NOT-LIKELY TOTAL TOTAL
POLICY PERIOD PAYROLL CASES AMOUNT CASES AMOUNT AMOUNT AMOUNT AMOUNT PURE PREM.7/07 through 6/08 0 0 0 0 0 0 0 0 0.007/08 through 6/09 0 0 0 0 0 0 0 0 0.007/09 through 6/10 0 0 0 0 0 0 0 0 0.007/10 through 6/11 0 0 0 0 0 0 0 0 0.007/11 through 6/12 0 0 0 0 0 0 0 0 0.00
5 YR. TOTAL 0 0 0 0 0 0 0 0 0.00INDEMNITY MEDICAL TOTAL
CRED. PURE PREM.* CRED. PURE PREM.* PURE PREM.*Indicated Pure Premium 0% 0.000 0% 0.000 0.00Pure Premium Indicated by National Relativity 0% 0.000 0% 0.000 0.00Pure Premium Present on Rate Level 100% 6.746 100% 2.631 9.38Pure Premium Derived by Formula 6.746 2.631 9.38
CLASS BOAT LIVERY-BOATS UNDER 15 TONS-PROGRAM II-STATE ACT WITH PROGRAM I AND
7090 PROGRAM II USL DATA ADDED FOR RATEMAKING
Industry Group: Miscellaneous CONVERTED LOSSESHazard Group: G INDEMNITY LIKELY INDEMNITY NOT-LIKELY MED LIKELY MED NOT-LIKELY TOTAL TOTAL
POLICY PERIOD PAYROLL CASES AMOUNT CASES AMOUNT AMOUNT AMOUNT AMOUNT PURE PREM.7/07 through 6/08 0 0 0 0 0 0 0 0 0.007/08 through 6/09 0 0 0 0 0 0 0 0 0.007/09 through 6/10 0 0 0 0 0 0 0 0 0.007/10 through 6/11 16,443 0 0 0 0 0 0 0 0.007/11 through 6/12 48,700 0 0 0 0 0 0 0 0.00
5 YR. TOTAL 65,143 0 0 0 0 0 0 0 0.00INDEMNITY MEDICAL TOTAL
CRED. PURE PREM.* CRED. PURE PREM.* PURE PREM.*Indicated Pure Premium 2% 0.000 3% 0.000 0.00Pure Premium Indicated by National Relativity 27% 1.128 29% 3.976 5.10Pure Premium Present on Rate Level 71% 2.451 68% 3.559 6.01Pure Premium Derived by Formula 2.045 3.573 5.62
Page 126
* Pure Premium per $100 of Payroll** Pure Premium per employee++ Non-Standard Calculation© Copyright 2014 National Council on Compensation Insurance, Inc. All Rights Reserved.
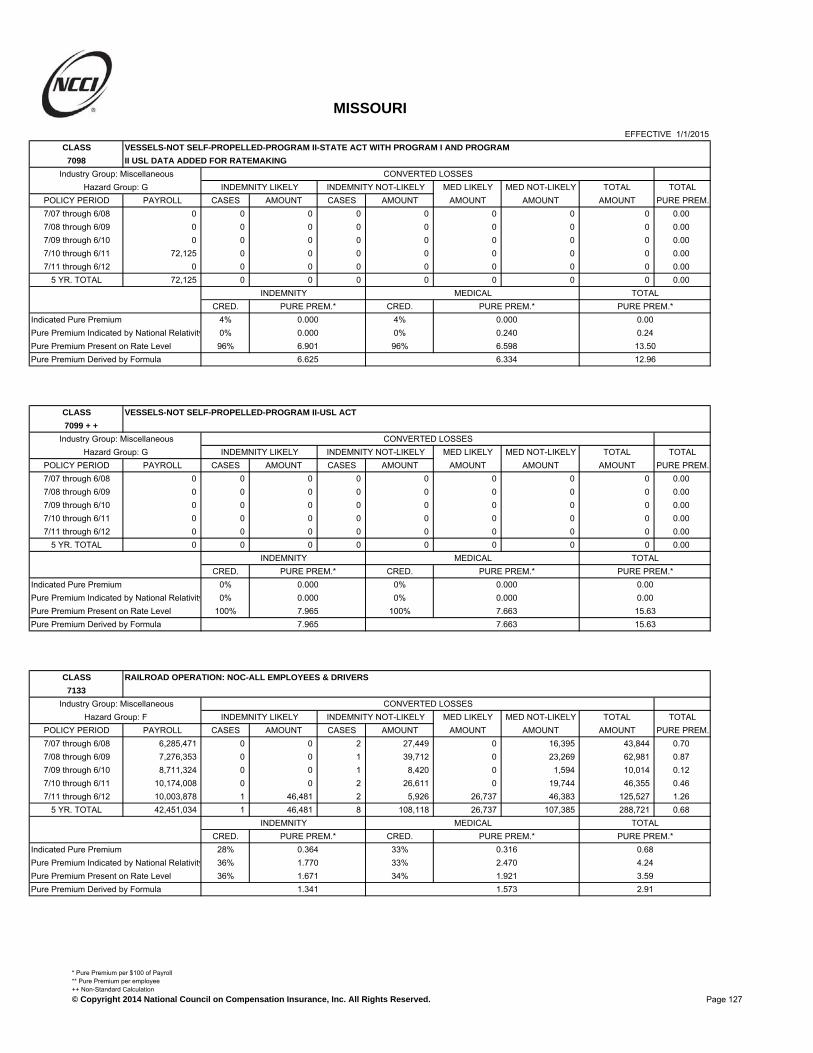
MISSOURI
EFFECTIVE 1/1/2015CLASS VESSELS-NOT SELF-PROPELLED-PROGRAM II-STATE ACT WITH PROGRAM I AND PROGRAM
7098 II USL DATA ADDED FOR RATEMAKING
Industry Group: Miscellaneous CONVERTED LOSSESHazard Group: G INDEMNITY LIKELY INDEMNITY NOT-LIKELY MED LIKELY MED NOT-LIKELY TOTAL TOTAL
POLICY PERIOD PAYROLL CASES AMOUNT CASES AMOUNT AMOUNT AMOUNT AMOUNT PURE PREM.7/07 through 6/08 0 0 0 0 0 0 0 0 0.007/08 through 6/09 0 0 0 0 0 0 0 0 0.007/09 through 6/10 0 0 0 0 0 0 0 0 0.007/10 through 6/11 72,125 0 0 0 0 0 0 0 0.007/11 through 6/12 0 0 0 0 0 0 0 0 0.00
5 YR. TOTAL 72,125 0 0 0 0 0 0 0 0.00INDEMNITY MEDICAL TOTAL
CRED. PURE PREM.* CRED. PURE PREM.* PURE PREM.*Indicated Pure Premium 4% 0.000 4% 0.000 0.00Pure Premium Indicated by National Relativity 0% 0.000 0% 0.240 0.24Pure Premium Present on Rate Level 96% 6.901 96% 6.598 13.50Pure Premium Derived by Formula 6.625 6.334 12.96
CLASS VESSELS-NOT SELF-PROPELLED-PROGRAM II-USL ACT
7099 + +
Industry Group: Miscellaneous CONVERTED LOSSESHazard Group: G INDEMNITY LIKELY INDEMNITY NOT-LIKELY MED LIKELY MED NOT-LIKELY TOTAL TOTAL
POLICY PERIOD PAYROLL CASES AMOUNT CASES AMOUNT AMOUNT AMOUNT AMOUNT PURE PREM.7/07 through 6/08 0 0 0 0 0 0 0 0 0.007/08 through 6/09 0 0 0 0 0 0 0 0 0.007/09 through 6/10 0 0 0 0 0 0 0 0 0.007/10 through 6/11 0 0 0 0 0 0 0 0 0.007/11 through 6/12 0 0 0 0 0 0 0 0 0.00
5 YR. TOTAL 0 0 0 0 0 0 0 0 0.00INDEMNITY MEDICAL TOTAL
CRED. PURE PREM.* CRED. PURE PREM.* PURE PREM.*Indicated Pure Premium 0% 0.000 0% 0.000 0.00Pure Premium Indicated by National Relativity 0% 0.000 0% 0.000 0.00Pure Premium Present on Rate Level 100% 7.965 100% 7.663 15.63Pure Premium Derived by Formula 7.965 7.663 15.63
CLASS RAILROAD OPERATION: NOC-ALL EMPLOYEES & DRIVERS
7133
Industry Group: Miscellaneous CONVERTED LOSSESHazard Group: F INDEMNITY LIKELY INDEMNITY NOT-LIKELY MED LIKELY MED NOT-LIKELY TOTAL TOTAL
POLICY PERIOD PAYROLL CASES AMOUNT CASES AMOUNT AMOUNT AMOUNT AMOUNT PURE PREM.7/07 through 6/08 6,285,471 0 0 2 27,449 0 16,395 43,844 0.707/08 through 6/09 7,276,353 0 0 1 39,712 0 23,269 62,981 0.877/09 through 6/10 8,711,324 0 0 1 8,420 0 1,594 10,014 0.127/10 through 6/11 10,174,008 0 0 2 26,611 0 19,744 46,355 0.467/11 through 6/12 10,003,878 1 46,481 2 5,926 26,737 46,383 125,527 1.26
5 YR. TOTAL 42,451,034 1 46,481 8 108,118 26,737 107,385 288,721 0.68INDEMNITY MEDICAL TOTAL
CRED. PURE PREM.* CRED. PURE PREM.* PURE PREM.*Indicated Pure Premium 28% 0.364 33% 0.316 0.68Pure Premium Indicated by National Relativity 36% 1.770 33% 2.470 4.24Pure Premium Present on Rate Level 36% 1.671 34% 1.921 3.59Pure Premium Derived by Formula 1.341 1.573 2.91
Page 127
* Pure Premium per $100 of Payroll** Pure Premium per employee++ Non-Standard Calculation© Copyright 2014 National Council on Compensation Insurance, Inc. All Rights Reserved.
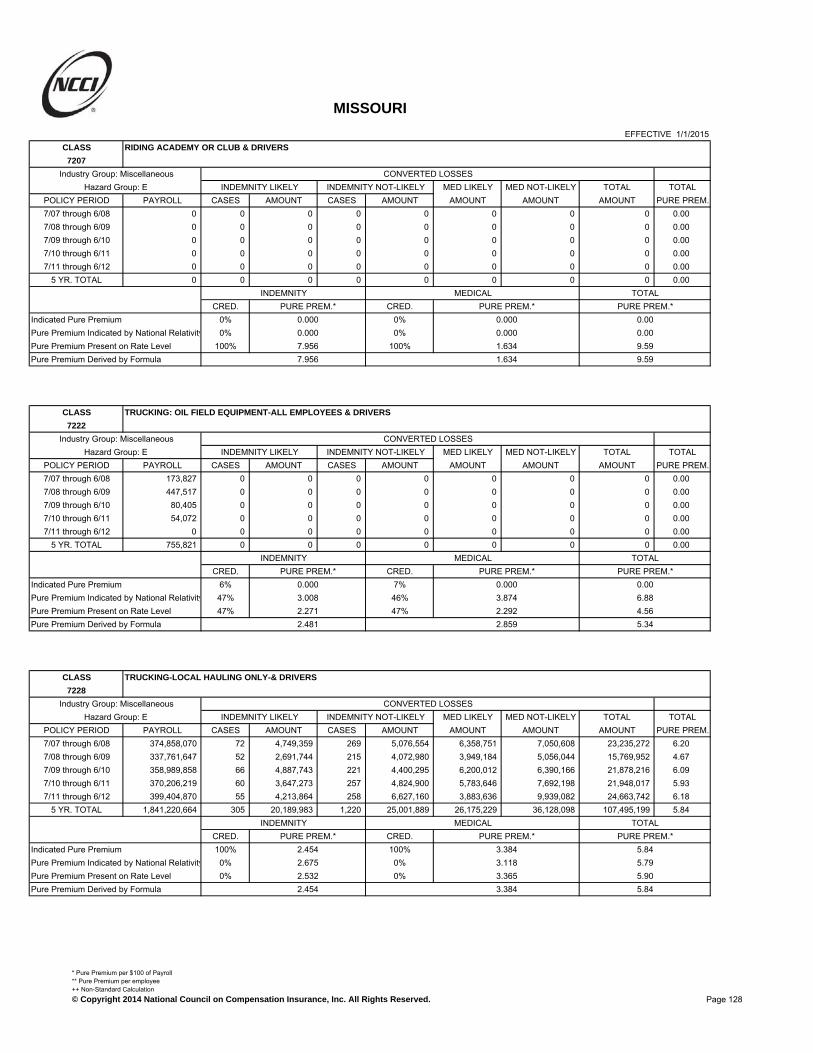
MISSOURI
EFFECTIVE 1/1/2015CLASS RIDING ACADEMY OR CLUB & DRIVERS
7207
Industry Group: Miscellaneous CONVERTED LOSSESHazard Group: E INDEMNITY LIKELY INDEMNITY NOT-LIKELY MED LIKELY MED NOT-LIKELY TOTAL TOTAL
POLICY PERIOD PAYROLL CASES AMOUNT CASES AMOUNT AMOUNT AMOUNT AMOUNT PURE PREM.7/07 through 6/08 0 0 0 0 0 0 0 0 0.007/08 through 6/09 0 0 0 0 0 0 0 0 0.007/09 through 6/10 0 0 0 0 0 0 0 0 0.007/10 through 6/11 0 0 0 0 0 0 0 0 0.007/11 through 6/12 0 0 0 0 0 0 0 0 0.00
5 YR. TOTAL 0 0 0 0 0 0 0 0 0.00INDEMNITY MEDICAL TOTAL
CRED. PURE PREM.* CRED. PURE PREM.* PURE PREM.*Indicated Pure Premium 0% 0.000 0% 0.000 0.00Pure Premium Indicated by National Relativity 0% 0.000 0% 0.000 0.00Pure Premium Present on Rate Level 100% 7.956 100% 1.634 9.59Pure Premium Derived by Formula 7.956 1.634 9.59
CLASS TRUCKING: OIL FIELD EQUIPMENT-ALL EMPLOYEES & DRIVERS
7222
Industry Group: Miscellaneous CONVERTED LOSSESHazard Group: E INDEMNITY LIKELY INDEMNITY NOT-LIKELY MED LIKELY MED NOT-LIKELY TOTAL TOTAL
POLICY PERIOD PAYROLL CASES AMOUNT CASES AMOUNT AMOUNT AMOUNT AMOUNT PURE PREM.7/07 through 6/08 173,827 0 0 0 0 0 0 0 0.007/08 through 6/09 447,517 0 0 0 0 0 0 0 0.007/09 through 6/10 80,405 0 0 0 0 0 0 0 0.007/10 through 6/11 54,072 0 0 0 0 0 0 0 0.007/11 through 6/12 0 0 0 0 0 0 0 0 0.00
5 YR. TOTAL 755,821 0 0 0 0 0 0 0 0.00INDEMNITY MEDICAL TOTAL
CRED. PURE PREM.* CRED. PURE PREM.* PURE PREM.*Indicated Pure Premium 6% 0.000 7% 0.000 0.00Pure Premium Indicated by National Relativity 47% 3.008 46% 3.874 6.88Pure Premium Present on Rate Level 47% 2.271 47% 2.292 4.56Pure Premium Derived by Formula 2.481 2.859 5.34
CLASS TRUCKING-LOCAL HAULING ONLY-& DRIVERS
7228
Industry Group: Miscellaneous CONVERTED LOSSESHazard Group: E INDEMNITY LIKELY INDEMNITY NOT-LIKELY MED LIKELY MED NOT-LIKELY TOTAL TOTAL
POLICY PERIOD PAYROLL CASES AMOUNT CASES AMOUNT AMOUNT AMOUNT AMOUNT PURE PREM.7/07 through 6/08 374,858,070 72 4,749,359 269 5,076,554 6,358,751 7,050,608 23,235,272 6.207/08 through 6/09 337,761,647 52 2,691,744 215 4,072,980 3,949,184 5,056,044 15,769,952 4.677/09 through 6/10 358,989,858 66 4,887,743 221 4,400,295 6,200,012 6,390,166 21,878,216 6.097/10 through 6/11 370,206,219 60 3,647,273 257 4,824,900 5,783,646 7,692,198 21,948,017 5.937/11 through 6/12 399,404,870 55 4,213,864 258 6,627,160 3,883,636 9,939,082 24,663,742 6.18
5 YR. TOTAL 1,841,220,664 305 20,189,983 1,220 25,001,889 26,175,229 36,128,098 107,495,199 5.84INDEMNITY MEDICAL TOTAL
CRED. PURE PREM.* CRED. PURE PREM.* PURE PREM.*Indicated Pure Premium 100% 2.454 100% 3.384 5.84Pure Premium Indicated by National Relativity 0% 2.675 0% 3.118 5.79Pure Premium Present on Rate Level 0% 2.532 0% 3.365 5.90Pure Premium Derived by Formula 2.454 3.384 5.84
Page 128
* Pure Premium per $100 of Payroll** Pure Premium per employee++ Non-Standard Calculation© Copyright 2014 National Council on Compensation Insurance, Inc. All Rights Reserved.
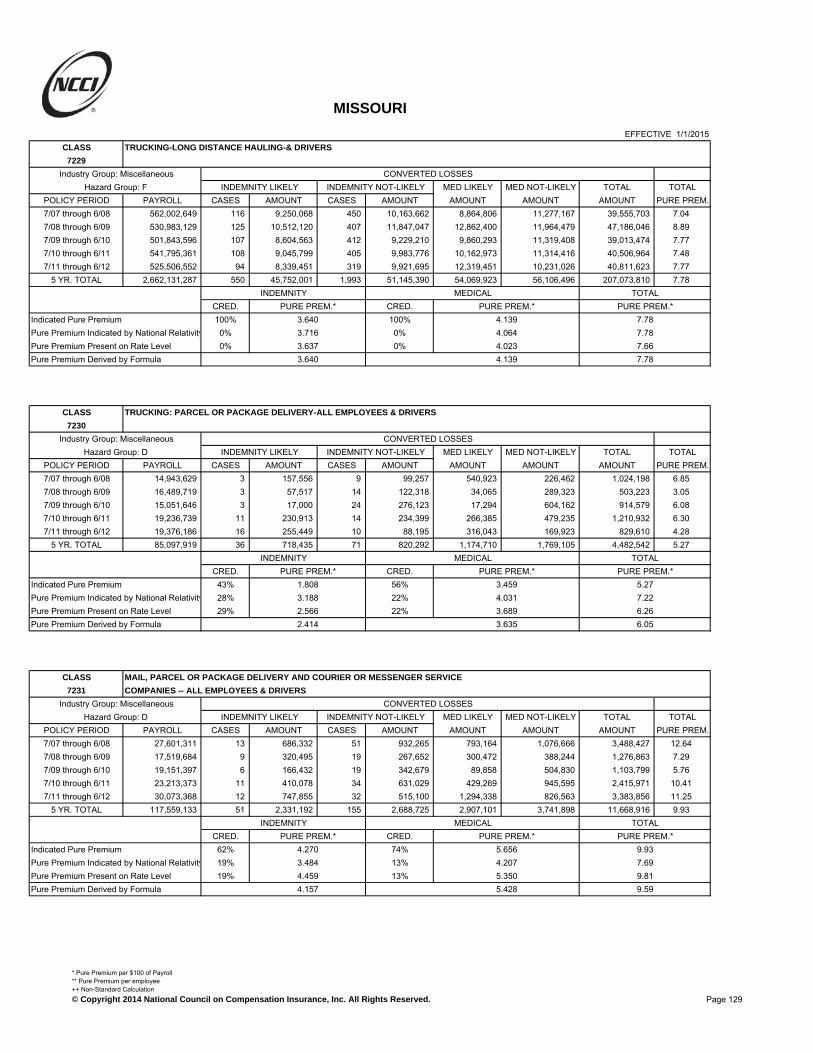
MISSOURI
EFFECTIVE 1/1/2015CLASS TRUCKING-LONG DISTANCE HAULING-& DRIVERS
7229
Industry Group: Miscellaneous CONVERTED LOSSESHazard Group: F INDEMNITY LIKELY INDEMNITY NOT-LIKELY MED LIKELY MED NOT-LIKELY TOTAL TOTAL
POLICY PERIOD PAYROLL CASES AMOUNT CASES AMOUNT AMOUNT AMOUNT AMOUNT PURE PREM.7/07 through 6/08 562,002,649 116 9,250,068 450 10,163,662 8,864,806 11,277,167 39,555,703 7.047/08 through 6/09 530,983,129 125 10,512,120 407 11,847,047 12,862,400 11,964,479 47,186,046 8.897/09 through 6/10 501,843,596 107 8,604,563 412 9,229,210 9,860,293 11,319,408 39,013,474 7.777/10 through 6/11 541,795,361 108 9,045,799 405 9,983,776 10,162,973 11,314,416 40,506,964 7.487/11 through 6/12 525,506,552 94 8,339,451 319 9,921,695 12,319,451 10,231,026 40,811,623 7.77
5 YR. TOTAL 2,662,131,287 550 45,752,001 1,993 51,145,390 54,069,923 56,106,496 207,073,810 7.78INDEMNITY MEDICAL TOTAL
CRED. PURE PREM.* CRED. PURE PREM.* PURE PREM.*Indicated Pure Premium 100% 3.640 100% 4.139 7.78Pure Premium Indicated by National Relativity 0% 3.716 0% 4.064 7.78Pure Premium Present on Rate Level 0% 3.637 0% 4.023 7.66Pure Premium Derived by Formula 3.640 4.139 7.78
CLASS TRUCKING: PARCEL OR PACKAGE DELIVERY-ALL EMPLOYEES & DRIVERS
7230
Industry Group: Miscellaneous CONVERTED LOSSESHazard Group: D INDEMNITY LIKELY INDEMNITY NOT-LIKELY MED LIKELY MED NOT-LIKELY TOTAL TOTAL
POLICY PERIOD PAYROLL CASES AMOUNT CASES AMOUNT AMOUNT AMOUNT AMOUNT PURE PREM.7/07 through 6/08 14,943,629 3 157,556 9 99,257 540,923 226,462 1,024,198 6.857/08 through 6/09 16,489,719 3 57,517 14 122,318 34,065 289,323 503,223 3.057/09 through 6/10 15,051,646 3 17,000 24 276,123 17,294 604,162 914,579 6.087/10 through 6/11 19,236,739 11 230,913 14 234,399 266,385 479,235 1,210,932 6.307/11 through 6/12 19,376,186 16 255,449 10 88,195 316,043 169,923 829,610 4.28
5 YR. TOTAL 85,097,919 36 718,435 71 820,292 1,174,710 1,769,105 4,482,542 5.27INDEMNITY MEDICAL TOTAL
CRED. PURE PREM.* CRED. PURE PREM.* PURE PREM.*Indicated Pure Premium 43% 1.808 56% 3.459 5.27Pure Premium Indicated by National Relativity 28% 3.188 22% 4.031 7.22Pure Premium Present on Rate Level 29% 2.566 22% 3.689 6.26Pure Premium Derived by Formula 2.414 3.635 6.05
CLASS MAIL, PARCEL OR PACKAGE DELIVERY AND COURIER OR MESSENGER SERVICE
7231 COMPANIES -- ALL EMPLOYEES & DRIVERS
Industry Group: Miscellaneous CONVERTED LOSSESHazard Group: D INDEMNITY LIKELY INDEMNITY NOT-LIKELY MED LIKELY MED NOT-LIKELY TOTAL TOTAL
POLICY PERIOD PAYROLL CASES AMOUNT CASES AMOUNT AMOUNT AMOUNT AMOUNT PURE PREM.7/07 through 6/08 27,601,311 13 686,332 51 932,265 793,164 1,076,666 3,488,427 12.647/08 through 6/09 17,519,684 9 320,495 19 267,652 300,472 388,244 1,276,863 7.297/09 through 6/10 19,151,397 6 166,432 19 342,679 89,858 504,830 1,103,799 5.767/10 through 6/11 23,213,373 11 410,078 34 631,029 429,269 945,595 2,415,971 10.417/11 through 6/12 30,073,368 12 747,855 32 515,100 1,294,338 826,563 3,383,856 11.25
5 YR. TOTAL 117,559,133 51 2,331,192 155 2,688,725 2,907,101 3,741,898 11,668,916 9.93INDEMNITY MEDICAL TOTAL
CRED. PURE PREM.* CRED. PURE PREM.* PURE PREM.*Indicated Pure Premium 62% 4.270 74% 5.656 9.93Pure Premium Indicated by National Relativity 19% 3.484 13% 4.207 7.69Pure Premium Present on Rate Level 19% 4.459 13% 5.350 9.81Pure Premium Derived by Formula 4.157 5.428 9.59
Page 129
* Pure Premium per $100 of Payroll** Pure Premium per employee++ Non-Standard Calculation© Copyright 2014 National Council on Compensation Insurance, Inc. All Rights Reserved.

MISSOURI
EFFECTIVE 1/1/2015CLASS TRUCKING: MAIL PARCEL OR PACKAGE DELIVERY-UNDER CONTRACT WITH THE U.S.
7232 POSTAL SERVICE-ALL EMPLOYEES & DRIVERS
Industry Group: Miscellaneous CONVERTED LOSSESHazard Group: F INDEMNITY LIKELY INDEMNITY NOT-LIKELY MED LIKELY MED NOT-LIKELY TOTAL TOTAL
POLICY PERIOD PAYROLL CASES AMOUNT CASES AMOUNT AMOUNT AMOUNT AMOUNT PURE PREM.7/07 through 6/08 25,840,575 7 953,151 16 531,511 1,962,964 500,792 3,948,418 15.287/08 through 6/09 23,509,285 2 195,970 8 108,862 642,214 236,789 1,183,835 5.047/09 through 6/10 24,831,545 2 215,080 11 204,478 272,866 423,347 1,115,771 4.497/10 through 6/11 23,587,177 2 152,419 17 304,431 127,446 322,786 907,082 3.857/11 through 6/12 22,842,728 6 537,833 10 216,072 591,169 454,768 1,799,842 7.88
5 YR. TOTAL 120,611,310 19 2,054,453 62 1,365,354 3,596,659 1,938,482 8,954,948 7.42INDEMNITY MEDICAL TOTAL
CRED. PURE PREM.* CRED. PURE PREM.* PURE PREM.*Indicated Pure Premium 52% 2.835 66% 4.589 7.42Pure Premium Indicated by National Relativity 24% 3.687 17% 3.645 7.33Pure Premium Present on Rate Level 24% 2.892 17% 3.888 6.78Pure Premium Derived by Formula 3.053 4.309 7.36
CLASS TRUCKING-HAULING EXPLOSIVES OR AMMUNITION-ALL EMPLOYEES & DRIVERS
7250
Industry Group: Miscellaneous CONVERTED LOSSESHazard Group: G INDEMNITY LIKELY INDEMNITY NOT-LIKELY MED LIKELY MED NOT-LIKELY TOTAL TOTAL
POLICY PERIOD PAYROLL CASES AMOUNT CASES AMOUNT AMOUNT AMOUNT AMOUNT PURE PREM.7/07 through 6/08 7,698,739 0 0 3 103,918 0 132,509 236,427 3.077/08 through 6/09 8,360,480 1 103,887 7 181,934 34,185 283,554 603,560 7.227/09 through 6/10 4,037,132 1 257,830 2 32,304 453,556 50,602 794,292 19.687/10 through 6/11 8,527,798 1 49,913 3 127,335 28,494 116,820 322,562 3.787/11 through 6/12 8,274,828 2 193,548 3 495,581 1,194,526 754,457 2,638,112 31.88
5 YR. TOTAL 36,898,977 5 605,178 18 941,072 1,710,761 1,337,942 4,594,953 12.45INDEMNITY MEDICAL TOTAL
CRED. PURE PREM.* CRED. PURE PREM.* PURE PREM.*Indicated Pure Premium 37% 4.190 42% 8.262 12.45Pure Premium Indicated by National Relativity 0% 0.000 0% 0.000 0.00Pure Premium Present on Rate Level 63% 3.969 58% 4.168 8.14Pure Premium Derived by Formula 4.051 5.887 9.94
CLASS DREDGING-ALL TYPES-PROGRAM I
7333 + +
Industry Group: Miscellaneous CONVERTED LOSSESHazard Group: G INDEMNITY LIKELY INDEMNITY NOT-LIKELY MED LIKELY MED NOT-LIKELY TOTAL TOTAL
POLICY PERIOD PAYROLL CASES AMOUNT CASES AMOUNT AMOUNT AMOUNT AMOUNT PURE PREM.7/07 through 6/08 0 0 0 0 0 0 0 0 0.007/08 through 6/09 0 0 0 0 0 0 0 0 0.007/09 through 6/10 0 0 0 0 0 0 0 0 0.007/10 through 6/11 0 0 0 0 0 0 0 0 0.007/11 through 6/12 0 0 0 0 0 0 0 0 0.00
5 YR. TOTAL 0 0 0 0 0 0 0 0 0.00INDEMNITY MEDICAL TOTAL
CRED. PURE PREM.* CRED. PURE PREM.* PURE PREM.*Indicated Pure Premium 0% 0.000 0% 0.000 0.00Pure Premium Indicated by National Relativity 0% 0.000 0% 0.000 0.00Pure Premium Present on Rate Level 100% 1.933 100% 1.033 2.97Pure Premium Derived by Formula 1.933 1.033 2.97
Page 130
* Pure Premium per $100 of Payroll** Pure Premium per employee++ Non-Standard Calculation© Copyright 2014 National Council on Compensation Insurance, Inc. All Rights Reserved.

MISSOURI
EFFECTIVE 1/1/2015CLASS DREDGING-ALL TYPES-PROGRAM II-STATE ACT WITH PROGRAM I AND PROGRAM II USL
7335 DATA ADDED FOR RATEMAKING
Industry Group: Miscellaneous CONVERTED LOSSESHazard Group: G INDEMNITY LIKELY INDEMNITY NOT-LIKELY MED LIKELY MED NOT-LIKELY TOTAL TOTAL
POLICY PERIOD PAYROLL CASES AMOUNT CASES AMOUNT AMOUNT AMOUNT AMOUNT PURE PREM.7/07 through 6/08 351,255 0 0 0 0 0 0 0 0.007/08 through 6/09 71,393 0 0 0 0 0 0 0 0.007/09 through 6/10 75,943 0 0 0 0 0 0 0 0.007/10 through 6/11 217,657 0 0 0 0 0 0 0 0.007/11 through 6/12 93,103 0 0 0 0 0 0 0 0.00
5 YR. TOTAL 809,351 0 0 0 0 0 0 0 0.00INDEMNITY MEDICAL TOTAL
CRED. PURE PREM.* CRED. PURE PREM.* PURE PREM.*Indicated Pure Premium 6% 0.000 5% 0.000 0.00Pure Premium Indicated by National Relativity 10% 0.234 11% 0.343 0.58Pure Premium Present on Rate Level 84% 2.146 84% 1.147 3.29Pure Premium Derived by Formula 1.826 1.001 2.83
CLASS DREDGING-ALL TYPES-PROGRAM II-USL ACT
7337 + +
Industry Group: Miscellaneous CONVERTED LOSSESHazard Group: G INDEMNITY LIKELY INDEMNITY NOT-LIKELY MED LIKELY MED NOT-LIKELY TOTAL TOTAL
POLICY PERIOD PAYROLL CASES AMOUNT CASES AMOUNT AMOUNT AMOUNT AMOUNT PURE PREM.7/07 through 6/08 0 0 0 0 0 0 0 0 0.007/08 through 6/09 0 0 0 0 0 0 0 0 0.007/09 through 6/10 0 0 0 0 0 0 0 0 0.007/10 through 6/11 0 0 0 0 0 0 0 0 0.007/11 through 6/12 0 0 0 0 0 0 0 0 0.00
5 YR. TOTAL 0 0 0 0 0 0 0 0 0.00INDEMNITY MEDICAL TOTAL
CRED. PURE PREM.* CRED. PURE PREM.* PURE PREM.*Indicated Pure Premium 0% 0.000 0% 0.000 0.00Pure Premium Indicated by National Relativity 0% 0.000 0% 0.000 0.00Pure Premium Present on Rate Level 100% 3.583 100% 1.756 5.34Pure Premium Derived by Formula 3.583 1.756 5.34
CLASS FREIGHT HANDLING NOC
7360
Industry Group: Miscellaneous CONVERTED LOSSESHazard Group: E INDEMNITY LIKELY INDEMNITY NOT-LIKELY MED LIKELY MED NOT-LIKELY TOTAL TOTAL
POLICY PERIOD PAYROLL CASES AMOUNT CASES AMOUNT AMOUNT AMOUNT AMOUNT PURE PREM.7/07 through 6/08 8,612,360 2 690,792 9 196,136 114,561 186,595 1,188,084 13.807/08 through 6/09 13,144,261 3 51,140 9 115,742 51,991 249,783 468,656 3.577/09 through 6/10 9,898,460 2 25,042 18 356,993 24,105 753,804 1,159,944 11.727/10 through 6/11 12,054,511 4 132,132 13 220,039 136,064 246,259 734,494 6.097/11 through 6/12 13,718,061 4 249,756 11 57,638 194,842 115,611 617,847 4.50
5 YR. TOTAL 57,427,653 15 1,148,862 60 946,548 521,563 1,552,052 4,169,025 7.26INDEMNITY MEDICAL TOTAL
CRED. PURE PREM.* CRED. PURE PREM.* PURE PREM.*Indicated Pure Premium 38% 3.649 45% 3.611 7.26Pure Premium Indicated by National Relativity 31% 1.834 27% 2.869 4.70Pure Premium Present on Rate Level 31% 2.670 28% 3.184 5.85Pure Premium Derived by Formula 2.783 3.291 6.07
Page 131
* Pure Premium per $100 of Payroll** Pure Premium per employee++ Non-Standard Calculation© Copyright 2014 National Council on Compensation Insurance, Inc. All Rights Reserved.

MISSOURI
EFFECTIVE 1/1/2015CLASS TAXICAB CO.: ALL OTHER EMPLOYEES & DRIVERS
7370
Industry Group: Miscellaneous CONVERTED LOSSESHazard Group: C INDEMNITY LIKELY INDEMNITY NOT-LIKELY MED LIKELY MED NOT-LIKELY TOTAL TOTAL
POLICY PERIOD PAYROLL CASES AMOUNT CASES AMOUNT AMOUNT AMOUNT AMOUNT PURE PREM.7/07 through 6/08 25,006,240 13 209,874 19 240,070 363,446 334,816 1,148,206 4.597/08 through 6/09 9,102,076 1 2,281 17 100,781 1,503 217,772 322,337 3.547/09 through 6/10 13,494,744 6 285,136 11 150,173 152,548 220,370 808,227 5.997/10 through 6/11 10,607,472 4 20,656 5 8,524 27,136 20,503 76,819 0.727/11 through 6/12 10,029,119 7 84,069 5 45,450 108,259 65,643 303,421 3.03
5 YR. TOTAL 68,239,651 31 602,016 57 544,998 652,892 859,104 2,659,010 3.90INDEMNITY MEDICAL TOTAL
CRED. PURE PREM.* CRED. PURE PREM.* PURE PREM.*Indicated Pure Premium 34% 1.681 45% 2.216 3.90Pure Premium Indicated by National Relativity 33% 1.732 27% 2.659 4.39Pure Premium Present on Rate Level 33% 1.717 28% 2.611 4.33Pure Premium Derived by Formula 1.710 2.446 4.16
CLASS DRIVERS, CHAUFFEURS, MESSENGERS AND THEIR HELPERS NOC-COMMERCIAL
7380
Industry Group: Miscellaneous CONVERTED LOSSESHazard Group: D INDEMNITY LIKELY INDEMNITY NOT-LIKELY MED LIKELY MED NOT-LIKELY TOTAL TOTAL
POLICY PERIOD PAYROLL CASES AMOUNT CASES AMOUNT AMOUNT AMOUNT AMOUNT PURE PREM.7/07 through 6/08 392,505,988 70 2,500,180 235 2,906,206 3,576,296 5,563,041 14,545,723 3.717/08 through 6/09 389,292,436 56 1,669,338 237 3,287,706 1,880,540 5,247,598 12,085,182 3.107/09 through 6/10 389,212,845 61 2,857,898 270 5,095,277 3,013,470 6,795,749 17,762,394 4.567/10 through 6/11 398,887,438 92 3,997,103 218 3,471,635 4,749,988 5,368,143 17,586,869 4.417/11 through 6/12 399,834,347 56 3,093,921 226 4,033,345 3,583,880 6,915,461 17,626,607 4.41
5 YR. TOTAL 1,969,733,054 335 14,118,440 1,186 18,794,169 16,804,174 29,889,992 79,606,775 4.04INDEMNITY MEDICAL TOTAL
CRED. PURE PREM.* CRED. PURE PREM.* PURE PREM.*Indicated Pure Premium 100% 1.671 100% 2.371 4.04Pure Premium Indicated by National Relativity 0% 1.867 0% 2.524 4.39Pure Premium Present on Rate Level 0% 1.638 0% 2.291 3.93Pure Premium Derived by Formula 1.671 2.371 4.04
CLASS BUS CO.: ALL OTHER EMPLOYEES & DRIVERS
7382
Industry Group: Miscellaneous CONVERTED LOSSESHazard Group: C INDEMNITY LIKELY INDEMNITY NOT-LIKELY MED LIKELY MED NOT-LIKELY TOTAL TOTAL
POLICY PERIOD PAYROLL CASES AMOUNT CASES AMOUNT AMOUNT AMOUNT AMOUNT PURE PREM.7/07 through 6/08 131,058,106 53 615,432 81 802,582 768,765 1,527,677 3,714,456 2.837/08 through 6/09 119,024,999 53 389,129 116 997,166 408,029 1,861,098 3,655,422 3.077/09 through 6/10 113,487,325 51 638,357 96 1,024,123 526,199 2,072,428 4,261,107 3.767/10 through 6/11 105,840,985 46 849,776 80 776,329 748,705 1,459,500 3,834,310 3.627/11 through 6/12 105,363,040 49 1,220,434 78 683,345 1,949,729 1,527,162 5,380,670 5.11
5 YR. TOTAL 574,774,455 252 3,713,128 451 4,283,545 4,401,427 8,447,865 20,845,965 3.63INDEMNITY MEDICAL TOTAL
CRED. PURE PREM.* CRED. PURE PREM.* PURE PREM.*Indicated Pure Premium 72% 1.391 97% 2.236 3.63Pure Premium Indicated by National Relativity 14% 1.400 1% 2.387 3.79Pure Premium Present on Rate Level 14% 1.343 2% 2.130 3.47Pure Premium Derived by Formula 1.386 2.235 3.62
Page 132
* Pure Premium per $100 of Payroll** Pure Premium per employee++ Non-Standard Calculation© Copyright 2014 National Council on Compensation Insurance, Inc. All Rights Reserved.

MISSOURI
EFFECTIVE 1/1/2015CLASS BEER OR ALE DEALER-WHOLESALE & DRIVERS
7390
Industry Group: Goods and Services CONVERTED LOSSESHazard Group: C INDEMNITY LIKELY INDEMNITY NOT-LIKELY MED LIKELY MED NOT-LIKELY TOTAL TOTAL
POLICY PERIOD PAYROLL CASES AMOUNT CASES AMOUNT AMOUNT AMOUNT AMOUNT PURE PREM.7/07 through 6/08 31,057,913 13 355,473 60 798,305 353,723 965,172 2,472,673 7.967/08 through 6/09 32,195,385 6 124,941 58 818,585 88,334 1,026,899 2,058,759 6.407/09 through 6/10 32,492,278 14 658,847 67 1,033,727 990,573 1,242,319 3,925,466 12.087/10 through 6/11 30,954,309 15 866,652 44 698,425 940,555 1,016,695 3,522,327 11.387/11 through 6/12 27,021,375 13 396,868 26 543,983 378,656 672,283 1,991,790 7.37
5 YR. TOTAL 153,721,260 61 2,402,781 255 3,893,025 2,751,841 4,923,368 13,971,015 9.09INDEMNITY MEDICAL TOTAL
CRED. PURE PREM.* CRED. PURE PREM.* PURE PREM.*Indicated Pure Premium 63% 4.096 76% 4.993 9.09Pure Premium Indicated by National Relativity 18% 1.942 12% 2.732 4.67Pure Premium Present on Rate Level 19% 3.462 12% 4.166 7.63Pure Premium Derived by Formula 3.588 4.622 8.21
CLASS DIVING, SALVAGE, WRECKING-MARINE-PROGRAM I
7394 + +
Industry Group: Miscellaneous CONVERTED LOSSESHazard Group: G INDEMNITY LIKELY INDEMNITY NOT-LIKELY MED LIKELY MED NOT-LIKELY TOTAL TOTAL
POLICY PERIOD PAYROLL CASES AMOUNT CASES AMOUNT AMOUNT AMOUNT AMOUNT PURE PREM.7/07 through 6/08 0 0 0 0 0 0 0 0 0.007/08 through 6/09 0 0 0 0 0 0 0 0 0.007/09 through 6/10 0 0 0 0 0 0 0 0 0.007/10 through 6/11 0 0 0 0 0 0 0 0 0.007/11 through 6/12 0 0 0 0 0 0 0 0 0.00
5 YR. TOTAL 0 0 0 0 0 0 0 0 0.00INDEMNITY MEDICAL TOTAL
CRED. PURE PREM.* CRED. PURE PREM.* PURE PREM.*Indicated Pure Premium 0% 0.000 0% 0.000 0.00Pure Premium Indicated by National Relativity 0% 0.000 0% 0.000 0.00Pure Premium Present on Rate Level 100% 4.952 100% 2.828 7.78Pure Premium Derived by Formula 4.952 2.828 7.78
CLASS DIVING, SALVAGE, WRECKING-MARINE-PROGRAM II-STATE ACT WITH PROGRAM I AND
7395 PROGRAM II USL DATA ADDED FOR RATEMAKING
Industry Group: Miscellaneous CONVERTED LOSSESHazard Group: G INDEMNITY LIKELY INDEMNITY NOT-LIKELY MED LIKELY MED NOT-LIKELY TOTAL TOTAL
POLICY PERIOD PAYROLL CASES AMOUNT CASES AMOUNT AMOUNT AMOUNT AMOUNT PURE PREM.7/07 through 6/08 158,470 0 0 0 0 0 0 0 0.007/08 through 6/09 81,963 0 0 0 0 0 0 0 0.007/09 through 6/10 148,424 0 0 0 0 0 0 0 0.007/10 through 6/11 107,081 0 0 0 0 0 0 0 0.007/11 through 6/12 90,631 0 0 0 0 0 0 0 0.00
5 YR. TOTAL 586,569 0 0 0 0 0 0 0 0.00INDEMNITY MEDICAL TOTAL
CRED. PURE PREM.* CRED. PURE PREM.* PURE PREM.*Indicated Pure Premium 8% 0.000 7% 0.000 0.00Pure Premium Indicated by National Relativity 19% 1.187 20% 1.711 2.90Pure Premium Present on Rate Level 73% 5.500 73% 3.142 8.64Pure Premium Derived by Formula 4.241 2.636 6.88
Page 133
* Pure Premium per $100 of Payroll** Pure Premium per employee++ Non-Standard Calculation© Copyright 2014 National Council on Compensation Insurance, Inc. All Rights Reserved.

MISSOURI
EFFECTIVE 1/1/2015CLASS DIVING, SALVAGE, WRECKING-MARINE-PROGRAM II-USL ACT
7398 + +
Industry Group: Miscellaneous CONVERTED LOSSESHazard Group: G INDEMNITY LIKELY INDEMNITY NOT-LIKELY MED LIKELY MED NOT-LIKELY TOTAL TOTAL
POLICY PERIOD PAYROLL CASES AMOUNT CASES AMOUNT AMOUNT AMOUNT AMOUNT PURE PREM.7/07 through 6/08 0 0 0 0 0 0 0 0 0.007/08 through 6/09 0 0 0 0 0 0 0 0 0.007/09 through 6/10 0 0 0 0 0 0 0 0 0.007/10 through 6/11 0 0 0 0 0 0 0 0 0.007/11 through 6/12 0 0 0 0 0 0 0 0 0.00
5 YR. TOTAL 0 0 0 0 0 0 0 0 0.00INDEMNITY MEDICAL TOTAL
CRED. PURE PREM.* CRED. PURE PREM.* PURE PREM.*Indicated Pure Premium 0% 0.000 0% 0.000 0.00Pure Premium Indicated by National Relativity 0% 0.000 0% 0.000 0.00Pure Premium Present on Rate Level 100% 10.788 100% 4.478 15.27Pure Premium Derived by Formula 10.788 4.478 15.27
CLASS AVIATION-AIR TRAFFIC CONTROLLERS UNDER CONTRACT WITH THE FAA
7402
Industry Group: Office and Clerical CONVERTED LOSSESHazard Group: C INDEMNITY LIKELY INDEMNITY NOT-LIKELY MED LIKELY MED NOT-LIKELY TOTAL TOTAL
POLICY PERIOD PAYROLL CASES AMOUNT CASES AMOUNT AMOUNT AMOUNT AMOUNT PURE PREM.7/07 through 6/08 0 0 0 0 0 0 0 0 0.007/08 through 6/09 138,975 0 0 0 0 0 0 0 0.007/09 through 6/10 1,071,380 0 0 0 0 0 0 0 0.007/10 through 6/11 881,924 0 0 0 0 0 0 0 0.007/11 through 6/12 866,378 0 0 0 0 0 0 0 0.00
5 YR. TOTAL 2,958,657 0 0 0 0 0 0 0 0.00INDEMNITY MEDICAL TOTAL
CRED. PURE PREM.* CRED. PURE PREM.* PURE PREM.*Indicated Pure Premium 3% 0.000 4% 0.000 0.00Pure Premium Indicated by National Relativity 0% 0.000 0% 0.002 0.00Pure Premium Present on Rate Level 97% 0.061 96% 0.096 0.16Pure Premium Derived by Formula 0.059 0.092 0.15
CLASS AVIATION: ALL OTHER EMPLOYEES & DRIVERS
7403
Industry Group: Miscellaneous CONVERTED LOSSESHazard Group: E INDEMNITY LIKELY INDEMNITY NOT-LIKELY MED LIKELY MED NOT-LIKELY TOTAL TOTAL
POLICY PERIOD PAYROLL CASES AMOUNT CASES AMOUNT AMOUNT AMOUNT AMOUNT PURE PREM.7/07 through 6/08 200,173,415 25 659,984 156 1,724,983 704,878 3,281,894 6,371,739 3.187/08 through 6/09 169,138,154 20 871,236 163 2,323,451 954,892 3,494,700 7,644,279 4.527/09 through 6/10 146,168,022 26 965,494 161 2,881,247 1,128,144 4,068,634 9,043,519 6.197/10 through 6/11 130,026,384 28 924,046 143 2,418,700 797,086 3,157,582 7,297,414 5.617/11 through 6/12 138,652,194 12 624,861 129 2,018,112 869,209 3,089,498 6,601,680 4.76
5 YR. TOTAL 784,158,169 111 4,045,621 752 11,366,493 4,454,209 17,092,308 36,958,631 4.71INDEMNITY MEDICAL TOTAL
CRED. PURE PREM.* CRED. PURE PREM.* PURE PREM.*Indicated Pure Premium 94% 1.965 100% 2.748 4.71Pure Premium Indicated by National Relativity 3% 1.393 0% 2.155 3.55Pure Premium Present on Rate Level 3% 1.907 0% 2.660 4.57Pure Premium Derived by Formula 1.946 2.748 4.69
Page 134
* Pure Premium per $100 of Payroll** Pure Premium per employee++ Non-Standard Calculation© Copyright 2014 National Council on Compensation Insurance, Inc. All Rights Reserved.

MISSOURI
EFFECTIVE 1/1/2015CLASS AVIATION: AIR CARRIER - SCHEDULED, COMMUTER OR SUPPLEMENTAL - FLYING CREW
7405
Industry Group: Miscellaneous CONVERTED LOSSESHazard Group: E INDEMNITY LIKELY INDEMNITY NOT-LIKELY MED LIKELY MED NOT-LIKELY TOTAL TOTAL
POLICY PERIOD PAYROLL CASES AMOUNT CASES AMOUNT AMOUNT AMOUNT AMOUNT PURE PREM.7/07 through 6/08 156,317,316 3 28,520 34 289,074 91,990 401,986 811,570 0.527/08 through 6/09 137,521,184 5 291,798 32 513,991 231,647 842,086 1,879,522 1.377/09 through 6/10 124,385,402 6 173,325 32 196,018 362,717 380,150 1,112,210 0.897/10 through 6/11 120,319,568 2 17,396 28 499,097 50,426 498,139 1,065,058 0.897/11 through 6/12 123,067,758 3 290,817 18 135,117 570,872 227,425 1,224,231 1.00
5 YR. TOTAL 661,611,228 19 801,856 144 1,633,297 1,307,652 2,349,786 6,092,591 0.92INDEMNITY MEDICAL TOTAL
CRED. PURE PREM.* CRED. PURE PREM.* PURE PREM.*Indicated Pure Premium 47% 0.368 57% 0.553 0.92Pure Premium Indicated by National Relativity 26% 0.440 21% 0.560 1.00Pure Premium Present on Rate Level 27% 0.406 22% 0.489 0.90Pure Premium Derived by Formula 0.397 0.540 0.94
CLASS AVIATION: STUNT FLYING, RACING, OR PARACHUTE JUMPING FLYING CREW
7420
Industry Group: Miscellaneous CONVERTED LOSSESHazard Group: G INDEMNITY LIKELY INDEMNITY NOT-LIKELY MED LIKELY MED NOT-LIKELY TOTAL TOTAL
POLICY PERIOD PAYROLL CASES AMOUNT CASES AMOUNT AMOUNT AMOUNT AMOUNT PURE PREM.7/07 through 6/08 105,158 0 0 0 0 0 0 0 0.007/08 through 6/09 89,509 0 0 0 0 0 0 0 0.007/09 through 6/10 47,520 0 0 0 0 0 0 0 0.007/10 through 6/11 56,520 0 0 0 0 0 0 0 0.007/11 through 6/12 128,160 0 0 0 0 0 0 0 0.00
5 YR. TOTAL 426,867 0 0 0 0 0 0 0 0.00INDEMNITY MEDICAL TOTAL
CRED. PURE PREM.* CRED. PURE PREM.* PURE PREM.*Indicated Pure Premium 9% 0.000 7% 0.000 0.00Pure Premium Indicated by National Relativity 19% 4.101 20% 2.386 6.49Pure Premium Present on Rate Level 72% 11.440 73% 3.621 15.06Pure Premium Derived by Formula 9.016 3.121 12.14
CLASS AVIATION - TRANSPORTATION OF PERSONNEL IN CONDUCT OF EMPLOYER'S BUSINESS -
7421 FLYING CREW
Industry Group: Miscellaneous CONVERTED LOSSESHazard Group: F INDEMNITY LIKELY INDEMNITY NOT-LIKELY MED LIKELY MED NOT-LIKELY TOTAL TOTAL
POLICY PERIOD PAYROLL CASES AMOUNT CASES AMOUNT AMOUNT AMOUNT AMOUNT PURE PREM.7/07 through 6/08 17,566,282 0 0 1 49,264 0 66,804 116,068 0.667/08 through 6/09 23,593,473 0 0 1 6,454 0 6,944 13,398 0.067/09 through 6/10 21,687,324 0 0 0 0 0 26,019 26,019 0.127/10 through 6/11 23,152,816 0 0 4 72,188 0 78,072 150,260 0.657/11 through 6/12 22,793,858 0 0 0 0 0 328 328 0.00
5 YR. TOTAL 108,793,753 0 0 6 127,906 0 178,167 306,073 0.28INDEMNITY MEDICAL TOTAL
CRED. PURE PREM.* CRED. PURE PREM.* PURE PREM.*Indicated Pure Premium 26% 0.118 28% 0.164 0.28Pure Premium Indicated by National Relativity 37% 0.357 36% 0.436 0.79Pure Premium Present on Rate Level 37% 0.547 36% 0.489 1.04Pure Premium Derived by Formula 0.365 0.379 0.74
Page 135
* Pure Premium per $100 of Payroll** Pure Premium per employee++ Non-Standard Calculation© Copyright 2014 National Council on Compensation Insurance, Inc. All Rights Reserved.

MISSOURI
EFFECTIVE 1/1/2015CLASS AVIATION:NOC - OTHER THAN HELICOPTERS - FLYING CREW
7422
Industry Group: Miscellaneous CONVERTED LOSSESHazard Group: G INDEMNITY LIKELY INDEMNITY NOT-LIKELY MED LIKELY MED NOT-LIKELY TOTAL TOTAL
POLICY PERIOD PAYROLL CASES AMOUNT CASES AMOUNT AMOUNT AMOUNT AMOUNT PURE PREM.7/07 through 6/08 8,921,819 4 194,838 1 2,606 145,068 7,135 349,647 3.927/08 through 6/09 13,478,005 0 0 4 9,402 0 50,586 59,988 0.457/09 through 6/10 13,000,788 0 0 3 60,784 0 159,319 220,103 1.697/10 through 6/11 13,414,685 3 141,192 7 332,559 215,197 753,156 1,442,104 10.757/11 through 6/12 9,397,619 0 0 4 153,285 0 151,164 304,449 3.24
5 YR. TOTAL 58,212,916 7 336,030 19 558,636 360,265 1,121,360 2,376,291 4.08INDEMNITY MEDICAL TOTAL
CRED. PURE PREM.* CRED. PURE PREM.* PURE PREM.*Indicated Pure Premium 26% 1.537 33% 2.545 4.08Pure Premium Indicated by National Relativity 37% 0.621 33% 0.931 1.55Pure Premium Present on Rate Level 37% 1.028 34% 1.399 2.43Pure Premium Derived by Formula 1.010 1.623 2.63
CLASS AVIATION: HELICOPTERS - FLYING CREW
7425
Industry Group: Miscellaneous CONVERTED LOSSESHazard Group: G INDEMNITY LIKELY INDEMNITY NOT-LIKELY MED LIKELY MED NOT-LIKELY TOTAL TOTAL
POLICY PERIOD PAYROLL CASES AMOUNT CASES AMOUNT AMOUNT AMOUNT AMOUNT PURE PREM.7/07 through 6/08 19,883,894 1 80,555 4 26,773 61,481 28,092 196,901 0.997/08 through 6/09 21,571,682 0 0 5 65,133 0 115,396 180,529 0.847/09 through 6/10 21,172,043 0 0 5 131,824 0 310,159 441,983 2.097/10 through 6/11 29,128,391 1 207,020 3 58,269 452,889 84,988 803,166 2.767/11 through 6/12 24,655,959 2 815,852 4 1,937,939 251,433 415,086 3,420,310 13.87
5 YR. TOTAL 116,411,969 4 1,103,427 21 2,219,938 765,803 953,721 5,042,889 4.33INDEMNITY MEDICAL TOTAL
CRED. PURE PREM.* CRED. PURE PREM.* PURE PREM.*Indicated Pure Premium 36% 2.855 40% 1.477 4.33Pure Premium Indicated by National Relativity 32% 1.713 30% 1.309 3.02Pure Premium Present on Rate Level 32% 1.211 30% 1.165 2.38Pure Premium Derived by Formula 1.963 1.333 3.30
CLASS AVIATION: AIR CHARTER OR AIR TAXI - FLYING CREW
7431
Industry Group: Miscellaneous CONVERTED LOSSESHazard Group: G INDEMNITY LIKELY INDEMNITY NOT-LIKELY MED LIKELY MED NOT-LIKELY TOTAL TOTAL
POLICY PERIOD PAYROLL CASES AMOUNT CASES AMOUNT AMOUNT AMOUNT AMOUNT PURE PREM.7/07 through 6/08 13,448,331 0 0 3 312,969 0 0 312,969 2.337/08 through 6/09 10,481,904 0 0 0 0 0 0 0 0.007/09 through 6/10 10,185,707 0 0 0 0 0 0 0 0.007/10 through 6/11 10,378,871 0 0 0 0 0 2,041 2,041 0.027/11 through 6/12 12,099,502 0 0 0 0 0 104 104 0.00
5 YR. TOTAL 56,594,315 0 0 3 312,969 0 2,145 315,114 0.56INDEMNITY MEDICAL TOTAL
CRED. PURE PREM.* CRED. PURE PREM.* PURE PREM.*Indicated Pure Premium 22% 0.553 20% 0.004 0.56Pure Premium Indicated by National Relativity 39% 0.397 40% 0.503 0.90Pure Premium Present on Rate Level 39% 0.737 40% 0.403 1.14Pure Premium Derived by Formula 0.564 0.363 0.93
Page 136
* Pure Premium per $100 of Payroll** Pure Premium per employee++ Non-Standard Calculation© Copyright 2014 National Council on Compensation Insurance, Inc. All Rights Reserved.

MISSOURI
EFFECTIVE 1/1/2015CLASS GAS COMPANY: GAS CO.-NATURAL GAS-LOCAL DISTRIBUTION & DRIVERS
7502
Industry Group: Miscellaneous CONVERTED LOSSESHazard Group: E INDEMNITY LIKELY INDEMNITY NOT-LIKELY MED LIKELY MED NOT-LIKELY TOTAL TOTAL
POLICY PERIOD PAYROLL CASES AMOUNT CASES AMOUNT AMOUNT AMOUNT AMOUNT PURE PREM.7/07 through 6/08 27,083,453 3 52,836 21 660,217 93,887 870,777 1,677,717 6.207/08 through 6/09 32,167,543 3 33,034 23 335,926 33,507 388,348 790,815 2.467/09 through 6/10 32,253,872 2 107,047 24 395,025 57,374 547,495 1,106,941 3.437/10 through 6/11 33,718,030 4 242,703 21 341,895 206,303 384,676 1,175,577 3.497/11 through 6/12 37,419,550 8 1,071,959 20 375,915 974,164 413,203 2,835,241 7.58
5 YR. TOTAL 162,642,448 20 1,507,579 109 2,108,978 1,365,235 2,604,499 7,586,291 4.67INDEMNITY MEDICAL TOTAL
CRED. PURE PREM.* CRED. PURE PREM.* PURE PREM.*Indicated Pure Premium 48% 2.224 58% 2.441 4.67Pure Premium Indicated by National Relativity 26% 0.800 21% 1.266 2.07Pure Premium Present on Rate Level 26% 1.751 21% 2.086 3.84Pure Premium Derived by Formula 1.731 2.120 3.85
CLASS OIL OR GAS PIPELINE OPERATION & DRIVERS
7515
Industry Group: Miscellaneous CONVERTED LOSSESHazard Group: G INDEMNITY LIKELY INDEMNITY NOT-LIKELY MED LIKELY MED NOT-LIKELY TOTAL TOTAL
POLICY PERIOD PAYROLL CASES AMOUNT CASES AMOUNT AMOUNT AMOUNT AMOUNT PURE PREM.7/07 through 6/08 19,826,227 0 0 1 1,990 0 40,099 42,089 0.217/08 through 6/09 19,594,142 2 187,539 2 13,223 552,930 9,785 763,477 3.907/09 through 6/10 18,774,493 0 0 2 806 0 15,348 16,154 0.097/10 through 6/11 22,280,661 1 32,696 4 22,478 26,716 50,752 132,642 0.607/11 through 6/12 24,615,481 0 0 2 31,804 0 65,865 97,669 0.40
5 YR. TOTAL 105,091,004 3 220,235 11 70,301 579,646 181,849 1,052,031 1.00INDEMNITY MEDICAL TOTAL
CRED. PURE PREM.* CRED. PURE PREM.* PURE PREM.*Indicated Pure Premium 22% 0.276 35% 0.725 1.00Pure Premium Indicated by National Relativity 39% 0.395 32% 0.676 1.07Pure Premium Present on Rate Level 39% 0.379 33% 0.892 1.27Pure Premium Derived by Formula 0.363 0.764 1.13
CLASS WATERWORKS OPERATION & DRIVERS
7520
Industry Group: Miscellaneous CONVERTED LOSSESHazard Group: C INDEMNITY LIKELY INDEMNITY NOT-LIKELY MED LIKELY MED NOT-LIKELY TOTAL TOTAL
POLICY PERIOD PAYROLL CASES AMOUNT CASES AMOUNT AMOUNT AMOUNT AMOUNT PURE PREM.7/07 through 6/08 83,652,293 9 710,316 50 644,433 1,291,360 1,097,231 3,743,340 4.487/08 through 6/09 84,856,535 9 178,899 51 947,544 315,978 1,390,794 2,833,215 3.347/09 through 6/10 86,035,890 12 576,699 60 859,410 316,236 1,292,091 3,044,436 3.547/10 through 6/11 87,842,070 14 707,769 46 1,093,154 727,390 1,715,903 4,244,216 4.837/11 through 6/12 82,889,852 10 518,810 38 1,392,463 303,258 1,081,282 3,295,813 3.98
5 YR. TOTAL 425,276,640 54 2,692,493 245 4,937,004 2,954,222 6,577,301 17,161,020 4.04INDEMNITY MEDICAL TOTAL
CRED. PURE PREM.* CRED. PURE PREM.* PURE PREM.*Indicated Pure Premium 67% 1.794 91% 2.241 4.04Pure Premium Indicated by National Relativity 16% 1.140 4% 1.802 2.94Pure Premium Present on Rate Level 17% 1.526 5% 2.466 3.99Pure Premium Derived by Formula 1.644 2.235 3.88
Page 137
* Pure Premium per $100 of Payroll** Pure Premium per employee++ Non-Standard Calculation© Copyright 2014 National Council on Compensation Insurance, Inc. All Rights Reserved.
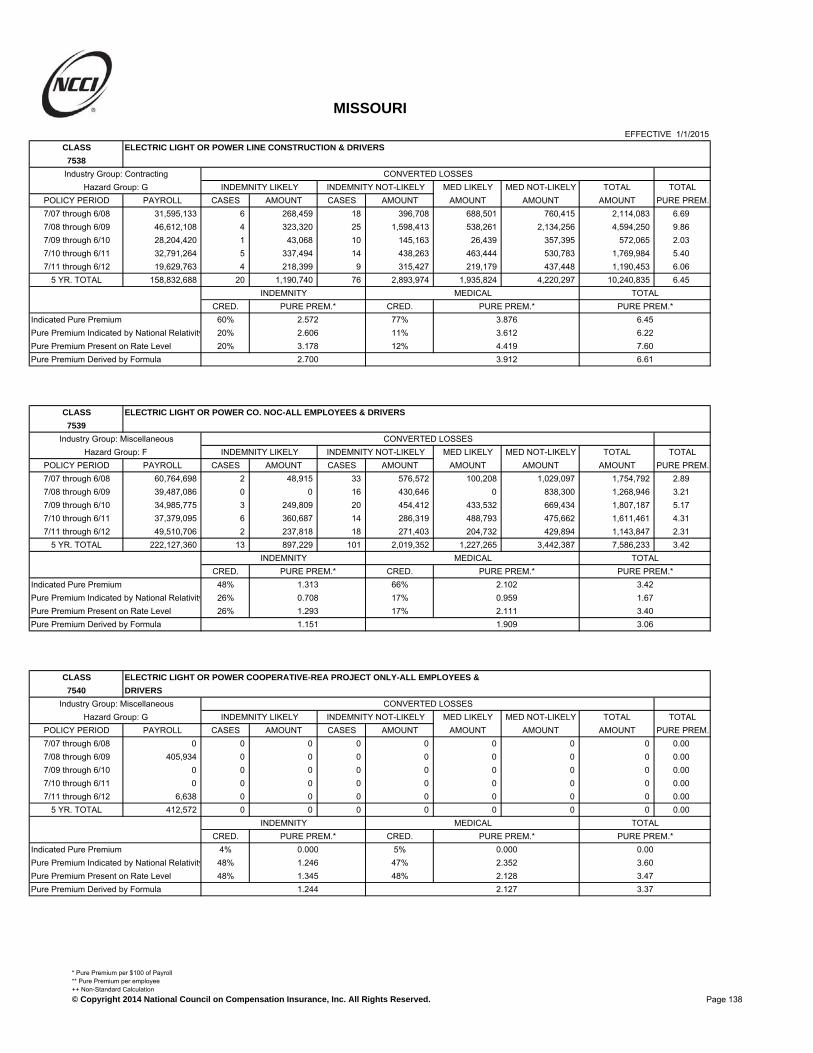
MISSOURI
EFFECTIVE 1/1/2015CLASS ELECTRIC LIGHT OR POWER LINE CONSTRUCTION & DRIVERS
7538
Industry Group: Contracting CONVERTED LOSSESHazard Group: G INDEMNITY LIKELY INDEMNITY NOT-LIKELY MED LIKELY MED NOT-LIKELY TOTAL TOTAL
POLICY PERIOD PAYROLL CASES AMOUNT CASES AMOUNT AMOUNT AMOUNT AMOUNT PURE PREM.7/07 through 6/08 31,595,133 6 268,459 18 396,708 688,501 760,415 2,114,083 6.697/08 through 6/09 46,612,108 4 323,320 25 1,598,413 538,261 2,134,256 4,594,250 9.867/09 through 6/10 28,204,420 1 43,068 10 145,163 26,439 357,395 572,065 2.037/10 through 6/11 32,791,264 5 337,494 14 438,263 463,444 530,783 1,769,984 5.407/11 through 6/12 19,629,763 4 218,399 9 315,427 219,179 437,448 1,190,453 6.06
5 YR. TOTAL 158,832,688 20 1,190,740 76 2,893,974 1,935,824 4,220,297 10,240,835 6.45INDEMNITY MEDICAL TOTAL
CRED. PURE PREM.* CRED. PURE PREM.* PURE PREM.*Indicated Pure Premium 60% 2.572 77% 3.876 6.45Pure Premium Indicated by National Relativity 20% 2.606 11% 3.612 6.22Pure Premium Present on Rate Level 20% 3.178 12% 4.419 7.60Pure Premium Derived by Formula 2.700 3.912 6.61
CLASS ELECTRIC LIGHT OR POWER CO. NOC-ALL EMPLOYEES & DRIVERS
7539
Industry Group: Miscellaneous CONVERTED LOSSESHazard Group: F INDEMNITY LIKELY INDEMNITY NOT-LIKELY MED LIKELY MED NOT-LIKELY TOTAL TOTAL
POLICY PERIOD PAYROLL CASES AMOUNT CASES AMOUNT AMOUNT AMOUNT AMOUNT PURE PREM.7/07 through 6/08 60,764,698 2 48,915 33 576,572 100,208 1,029,097 1,754,792 2.897/08 through 6/09 39,487,086 0 0 16 430,646 0 838,300 1,268,946 3.217/09 through 6/10 34,985,775 3 249,809 20 454,412 433,532 669,434 1,807,187 5.177/10 through 6/11 37,379,095 6 360,687 14 286,319 488,793 475,662 1,611,461 4.317/11 through 6/12 49,510,706 2 237,818 18 271,403 204,732 429,894 1,143,847 2.31
5 YR. TOTAL 222,127,360 13 897,229 101 2,019,352 1,227,265 3,442,387 7,586,233 3.42INDEMNITY MEDICAL TOTAL
CRED. PURE PREM.* CRED. PURE PREM.* PURE PREM.*Indicated Pure Premium 48% 1.313 66% 2.102 3.42Pure Premium Indicated by National Relativity 26% 0.708 17% 0.959 1.67Pure Premium Present on Rate Level 26% 1.293 17% 2.111 3.40Pure Premium Derived by Formula 1.151 1.909 3.06
CLASS ELECTRIC LIGHT OR POWER COOPERATIVE-REA PROJECT ONLY-ALL EMPLOYEES &
7540 DRIVERS
Industry Group: Miscellaneous CONVERTED LOSSESHazard Group: G INDEMNITY LIKELY INDEMNITY NOT-LIKELY MED LIKELY MED NOT-LIKELY TOTAL TOTAL
POLICY PERIOD PAYROLL CASES AMOUNT CASES AMOUNT AMOUNT AMOUNT AMOUNT PURE PREM.7/07 through 6/08 0 0 0 0 0 0 0 0 0.007/08 through 6/09 405,934 0 0 0 0 0 0 0 0.007/09 through 6/10 0 0 0 0 0 0 0 0 0.007/10 through 6/11 0 0 0 0 0 0 0 0 0.007/11 through 6/12 6,638 0 0 0 0 0 0 0 0.00
5 YR. TOTAL 412,572 0 0 0 0 0 0 0 0.00INDEMNITY MEDICAL TOTAL
CRED. PURE PREM.* CRED. PURE PREM.* PURE PREM.*Indicated Pure Premium 4% 0.000 5% 0.000 0.00Pure Premium Indicated by National Relativity 48% 1.246 47% 2.352 3.60Pure Premium Present on Rate Level 48% 1.345 48% 2.128 3.47Pure Premium Derived by Formula 1.244 2.127 3.37
Page 138
* Pure Premium per $100 of Payroll** Pure Premium per employee++ Non-Standard Calculation© Copyright 2014 National Council on Compensation Insurance, Inc. All Rights Reserved.

MISSOURI
EFFECTIVE 1/1/2015CLASS SEWAGE DISPOSAL PLANT OPERATION & DRIVERS
7580
Industry Group: Miscellaneous CONVERTED LOSSESHazard Group: E INDEMNITY LIKELY INDEMNITY NOT-LIKELY MED LIKELY MED NOT-LIKELY TOTAL TOTAL
POLICY PERIOD PAYROLL CASES AMOUNT CASES AMOUNT AMOUNT AMOUNT AMOUNT PURE PREM.7/07 through 6/08 28,406,359 4 176,303 12 215,832 368,687 327,181 1,088,003 3.837/08 through 6/09 29,348,001 0 0 8 92,426 0 166,928 259,354 0.887/09 through 6/10 29,158,930 1 221,598 6 66,866 89,210 168,477 546,151 1.877/10 through 6/11 31,116,586 1 24,416 12 138,284 30,800 330,418 523,918 1.687/11 through 6/12 29,943,923 0 0 8 240,563 0 469,755 710,318 2.37
5 YR. TOTAL 147,973,799 6 422,317 46 753,971 488,697 1,462,759 3,127,744 2.11INDEMNITY MEDICAL TOTAL
CRED. PURE PREM.* CRED. PURE PREM.* PURE PREM.*Indicated Pure Premium 37% 0.795 47% 1.319 2.11Pure Premium Indicated by National Relativity 31% 1.074 26% 1.523 2.60Pure Premium Present on Rate Level 32% 0.990 27% 1.339 2.33Pure Premium Derived by Formula 0.944 1.377 2.32
CLASS GARBAGE WORKS
7590
Industry Group: Miscellaneous CONVERTED LOSSESHazard Group: D INDEMNITY LIKELY INDEMNITY NOT-LIKELY MED LIKELY MED NOT-LIKELY TOTAL TOTAL
POLICY PERIOD PAYROLL CASES AMOUNT CASES AMOUNT AMOUNT AMOUNT AMOUNT PURE PREM.7/07 through 6/08 9,169,827 1 13,394 2 45,398 0 88,980 147,772 1.617/08 through 6/09 8,787,468 0 0 2 58,163 0 92,788 150,951 1.727/09 through 6/10 5,677,960 0 0 3 30,253 0 53,598 83,851 1.487/10 through 6/11 5,002,103 1 7,082 5 122,043 6,143 316,525 451,793 9.037/11 through 6/12 5,950,748 2 9,066 2 29,951 25,144 71,537 135,698 2.28
5 YR. TOTAL 34,588,106 4 29,542 14 285,808 31,287 623,428 970,065 2.81INDEMNITY MEDICAL TOTAL
CRED. PURE PREM.* CRED. PURE PREM.* PURE PREM.*Indicated Pure Premium 24% 0.912 32% 1.893 2.81Pure Premium Indicated by National Relativity 38% 1.283 34% 1.683 2.97Pure Premium Present on Rate Level 38% 1.435 34% 2.235 3.67Pure Premium Derived by Formula 1.252 1.938 3.19
CLASS TELECOMMUNICATIONS CO. - CABLE TV OR SATELLITE - ALL OTHER EMPLOYEES &
7600 DRIVERS
Industry Group: Miscellaneous CONVERTED LOSSESHazard Group: E INDEMNITY LIKELY INDEMNITY NOT-LIKELY MED LIKELY MED NOT-LIKELY TOTAL TOTAL
POLICY PERIOD PAYROLL CASES AMOUNT CASES AMOUNT AMOUNT AMOUNT AMOUNT PURE PREM.7/07 through 6/08 174,962,341 16 395,139 88 1,052,701 374,401 2,029,953 3,852,194 2.207/08 through 6/09 166,196,982 14 743,716 59 1,275,734 934,923 1,663,002 4,617,375 2.787/09 through 6/10 170,839,127 18 736,865 75 1,278,984 828,931 2,234,191 5,078,971 2.977/10 through 6/11 212,004,151 22 998,159 84 1,794,837 1,120,147 2,757,581 6,670,724 3.157/11 through 6/12 337,644,176 26 1,731,332 109 3,461,506 2,221,626 4,126,938 11,541,402 3.42
5 YR. TOTAL 1,061,646,777 96 4,605,211 415 8,863,762 5,480,028 12,811,665 31,760,666 2.99INDEMNITY MEDICAL TOTAL
CRED. PURE PREM.* CRED. PURE PREM.* PURE PREM.*Indicated Pure Premium 86% 1.269 100% 1.723 2.99Pure Premium Indicated by National Relativity 7% 1.456 0% 1.968 3.42Pure Premium Present on Rate Level 7% 1.134 0% 1.645 2.78Pure Premium Derived by Formula 1.273 1.723 3.00
Page 139
* Pure Premium per $100 of Payroll** Pure Premium per employee++ Non-Standard Calculation© Copyright 2014 National Council on Compensation Insurance, Inc. All Rights Reserved.
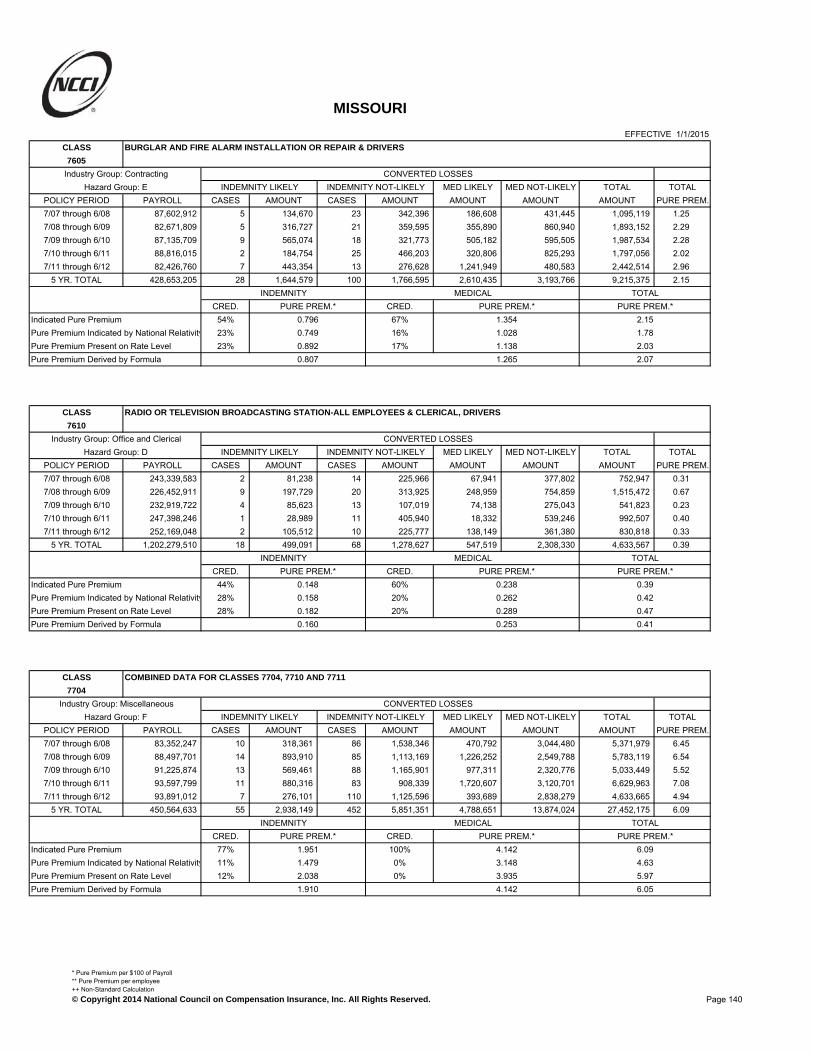
MISSOURI
EFFECTIVE 1/1/2015CLASS BURGLAR AND FIRE ALARM INSTALLATION OR REPAIR & DRIVERS
7605
Industry Group: Contracting CONVERTED LOSSESHazard Group: E INDEMNITY LIKELY INDEMNITY NOT-LIKELY MED LIKELY MED NOT-LIKELY TOTAL TOTAL
POLICY PERIOD PAYROLL CASES AMOUNT CASES AMOUNT AMOUNT AMOUNT AMOUNT PURE PREM.7/07 through 6/08 87,602,912 5 134,670 23 342,396 186,608 431,445 1,095,119 1.257/08 through 6/09 82,671,809 5 316,727 21 359,595 355,890 860,940 1,893,152 2.297/09 through 6/10 87,135,709 9 565,074 18 321,773 505,182 595,505 1,987,534 2.287/10 through 6/11 88,816,015 2 184,754 25 466,203 320,806 825,293 1,797,056 2.027/11 through 6/12 82,426,760 7 443,354 13 276,628 1,241,949 480,583 2,442,514 2.96
5 YR. TOTAL 428,653,205 28 1,644,579 100 1,766,595 2,610,435 3,193,766 9,215,375 2.15INDEMNITY MEDICAL TOTAL
CRED. PURE PREM.* CRED. PURE PREM.* PURE PREM.*Indicated Pure Premium 54% 0.796 67% 1.354 2.15Pure Premium Indicated by National Relativity 23% 0.749 16% 1.028 1.78Pure Premium Present on Rate Level 23% 0.892 17% 1.138 2.03Pure Premium Derived by Formula 0.807 1.265 2.07
CLASS RADIO OR TELEVISION BROADCASTING STATION-ALL EMPLOYEES & CLERICAL, DRIVERS
7610
Industry Group: Office and Clerical CONVERTED LOSSESHazard Group: D INDEMNITY LIKELY INDEMNITY NOT-LIKELY MED LIKELY MED NOT-LIKELY TOTAL TOTAL
POLICY PERIOD PAYROLL CASES AMOUNT CASES AMOUNT AMOUNT AMOUNT AMOUNT PURE PREM.7/07 through 6/08 243,339,583 2 81,238 14 225,966 67,941 377,802 752,947 0.317/08 through 6/09 226,452,911 9 197,729 20 313,925 248,959 754,859 1,515,472 0.677/09 through 6/10 232,919,722 4 85,623 13 107,019 74,138 275,043 541,823 0.237/10 through 6/11 247,398,246 1 28,989 11 405,940 18,332 539,246 992,507 0.407/11 through 6/12 252,169,048 2 105,512 10 225,777 138,149 361,380 830,818 0.33
5 YR. TOTAL 1,202,279,510 18 499,091 68 1,278,627 547,519 2,308,330 4,633,567 0.39INDEMNITY MEDICAL TOTAL
CRED. PURE PREM.* CRED. PURE PREM.* PURE PREM.*Indicated Pure Premium 44% 0.148 60% 0.238 0.39Pure Premium Indicated by National Relativity 28% 0.158 20% 0.262 0.42Pure Premium Present on Rate Level 28% 0.182 20% 0.289 0.47Pure Premium Derived by Formula 0.160 0.253 0.41
CLASS COMBINED DATA FOR CLASSES 7704, 7710 AND 7711
7704
Industry Group: Miscellaneous CONVERTED LOSSESHazard Group: F INDEMNITY LIKELY INDEMNITY NOT-LIKELY MED LIKELY MED NOT-LIKELY TOTAL TOTAL
POLICY PERIOD PAYROLL CASES AMOUNT CASES AMOUNT AMOUNT AMOUNT AMOUNT PURE PREM.7/07 through 6/08 83,352,247 10 318,361 86 1,538,346 470,792 3,044,480 5,371,979 6.457/08 through 6/09 88,497,701 14 893,910 85 1,113,169 1,226,252 2,549,788 5,783,119 6.547/09 through 6/10 91,225,874 13 569,461 88 1,165,901 977,311 2,320,776 5,033,449 5.527/10 through 6/11 93,597,799 11 880,316 83 908,339 1,720,607 3,120,701 6,629,963 7.087/11 through 6/12 93,891,012 7 276,101 110 1,125,596 393,689 2,838,279 4,633,665 4.94
5 YR. TOTAL 450,564,633 55 2,938,149 452 5,851,351 4,788,651 13,874,024 27,452,175 6.09INDEMNITY MEDICAL TOTAL
CRED. PURE PREM.* CRED. PURE PREM.* PURE PREM.*Indicated Pure Premium 77% 1.951 100% 4.142 6.09Pure Premium Indicated by National Relativity 11% 1.479 0% 3.148 4.63Pure Premium Present on Rate Level 12% 2.038 0% 3.935 5.97Pure Premium Derived by Formula 1.910 4.142 6.05
Page 140
* Pure Premium per $100 of Payroll** Pure Premium per employee++ Non-Standard Calculation© Copyright 2014 National Council on Compensation Insurance, Inc. All Rights Reserved.

MISSOURI
EFFECTIVE 1/1/2015CLASS AMBULANCE SERVICE COMPANIES AND EMS (EMERGENCY MEDICAL SERVICE) PROVIDERS
7705 & DRIVERS
Industry Group: Miscellaneous CONVERTED LOSSESHazard Group: D INDEMNITY LIKELY INDEMNITY NOT-LIKELY MED LIKELY MED NOT-LIKELY TOTAL TOTAL
POLICY PERIOD PAYROLL CASES AMOUNT CASES AMOUNT AMOUNT AMOUNT AMOUNT PURE PREM.7/07 through 6/08 54,898,675 2 43,019 30 489,913 53,597 703,489 1,290,018 2.357/08 through 6/09 77,318,783 14 524,613 55 531,183 692,872 1,050,996 2,799,664 3.627/09 through 6/10 80,825,761 17 645,567 62 724,215 632,941 1,414,076 3,416,799 4.237/10 through 6/11 75,344,377 12 496,541 40 502,487 548,607 697,753 2,245,388 2.987/11 through 6/12 88,603,661 14 867,668 48 374,266 1,249,505 742,478 3,233,917 3.65
5 YR. TOTAL 376,991,257 59 2,577,408 235 2,622,064 3,177,522 4,608,792 12,985,786 3.44INDEMNITY MEDICAL TOTAL
CRED. PURE PREM.* CRED. PURE PREM.* PURE PREM.*Indicated Pure Premium 68% 1.379 85% 2.065 3.44Pure Premium Indicated by National Relativity 16% 2.612 7% 3.607 6.22Pure Premium Present on Rate Level 16% 1.804 8% 2.306 4.11Pure Premium Derived by Formula 1.644 2.192 3.84
CLASS FIREFIGHTERS & DRIVERS
7710 + +
Industry Group: Miscellaneous CONVERTED LOSSESHazard Group: F INDEMNITY LIKELY INDEMNITY NOT-LIKELY MED LIKELY MED NOT-LIKELY TOTAL TOTAL
POLICY PERIOD PAYROLL CASES AMOUNT CASES AMOUNT AMOUNT AMOUNT AMOUNT PURE PREM.7/07 through 6/08 0 0 0 0 0 0 0 0 0.007/08 through 6/09 0 0 0 0 0 0 0 0 0.007/09 through 6/10 0 0 0 0 0 0 0 0 0.007/10 through 6/11 0 0 0 0 0 0 0 0 0.007/11 through 6/12 0 0 0 0 0 0 0 0 0.00
5 YR. TOTAL 0 0 0 0 0 0 0 0 0.00INDEMNITY MEDICAL TOTAL
CRED. PURE PREM.* CRED. PURE PREM.* PURE PREM.*Indicated Pure Premium 0% 0.000 0% 0.000 0.00Pure Premium Indicated by National Relativity 50% 1.791 50% 2.404 4.20Pure Premium Present on Rate Level 50% 2.038 50% 3.935 5.97Pure Premium Derived by Formula 1.915 3.170 5.09
CLASS FIREFIGHTERS & DRIVERS - VOLUNTEER
7711 + +
Industry Group: Miscellaneous CONVERTED LOSSESHazard Group: F INDEMNITY LIKELY INDEMNITY NOT-LIKELY MED LIKELY MED NOT-LIKELY TOTAL TOTAL
POLICY PERIOD PAYROLL CASES AMOUNT CASES AMOUNT AMOUNT AMOUNT AMOUNT PURE PREM.7/07 through 6/08 0 0 0 0 0 0 0 0 0.007/08 through 6/09 0 0 0 0 0 0 0 0 0.007/09 through 6/10 0 0 0 0 0 0 0 0 0.007/10 through 6/11 0 0 0 0 0 0 0 0 0.007/11 through 6/12 0 0 0 0 0 0 0 0 0.00
5 YR. TOTAL 0 0 0 0 0 0 0 0 0.00INDEMNITY MEDICAL TOTAL
CRED. PURE PREM.* CRED. PURE PREM.* PURE PREM.*Indicated Pure Premium 0% 0.000 0% 0.000 0.00Pure Premium Indicated by National Relativity 0% 0.000 0% 0.000 0.00Pure Premium Present on Rate Level 100% 2.038 100% 3.935 5.97Pure Premium Derived by Formula 2.038 3.935 5.97
Page 141
* Pure Premium per $100 of Payroll** Pure Premium per employee++ Non-Standard Calculation© Copyright 2014 National Council on Compensation Insurance, Inc. All Rights Reserved.
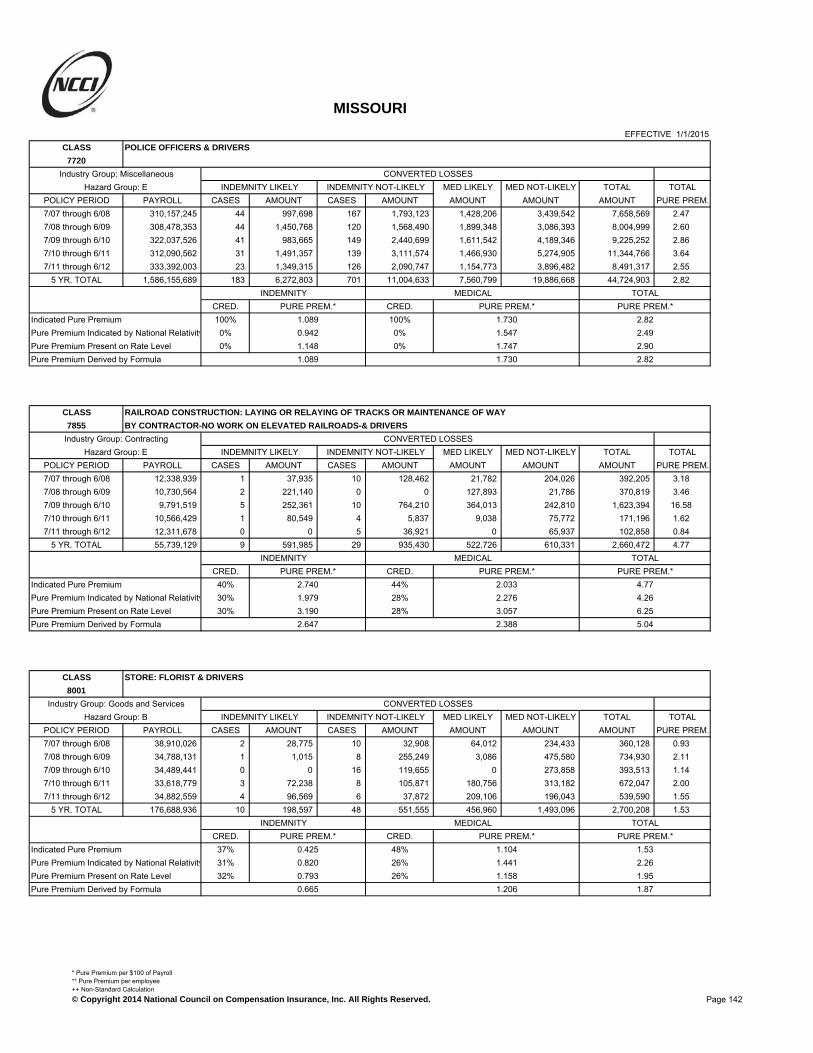
MISSOURI
EFFECTIVE 1/1/2015CLASS POLICE OFFICERS & DRIVERS
7720
Industry Group: Miscellaneous CONVERTED LOSSESHazard Group: E INDEMNITY LIKELY INDEMNITY NOT-LIKELY MED LIKELY MED NOT-LIKELY TOTAL TOTAL
POLICY PERIOD PAYROLL CASES AMOUNT CASES AMOUNT AMOUNT AMOUNT AMOUNT PURE PREM.7/07 through 6/08 310,157,245 44 997,698 167 1,793,123 1,428,206 3,439,542 7,658,569 2.477/08 through 6/09 308,478,353 44 1,450,768 120 1,568,490 1,899,348 3,086,393 8,004,999 2.607/09 through 6/10 322,037,526 41 983,665 149 2,440,699 1,611,542 4,189,346 9,225,252 2.867/10 through 6/11 312,090,562 31 1,491,357 139 3,111,574 1,466,930 5,274,905 11,344,766 3.647/11 through 6/12 333,392,003 23 1,349,315 126 2,090,747 1,154,773 3,896,482 8,491,317 2.55
5 YR. TOTAL 1,586,155,689 183 6,272,803 701 11,004,633 7,560,799 19,886,668 44,724,903 2.82INDEMNITY MEDICAL TOTAL
CRED. PURE PREM.* CRED. PURE PREM.* PURE PREM.*Indicated Pure Premium 100% 1.089 100% 1.730 2.82Pure Premium Indicated by National Relativity 0% 0.942 0% 1.547 2.49Pure Premium Present on Rate Level 0% 1.148 0% 1.747 2.90Pure Premium Derived by Formula 1.089 1.730 2.82
CLASS RAILROAD CONSTRUCTION: LAYING OR RELAYING OF TRACKS OR MAINTENANCE OF WAY
7855 BY CONTRACTOR-NO WORK ON ELEVATED RAILROADS-& DRIVERS
Industry Group: Contracting CONVERTED LOSSESHazard Group: E INDEMNITY LIKELY INDEMNITY NOT-LIKELY MED LIKELY MED NOT-LIKELY TOTAL TOTAL
POLICY PERIOD PAYROLL CASES AMOUNT CASES AMOUNT AMOUNT AMOUNT AMOUNT PURE PREM.7/07 through 6/08 12,338,939 1 37,935 10 128,462 21,782 204,026 392,205 3.187/08 through 6/09 10,730,564 2 221,140 0 0 127,893 21,786 370,819 3.467/09 through 6/10 9,791,519 5 252,361 10 764,210 364,013 242,810 1,623,394 16.587/10 through 6/11 10,566,429 1 80,549 4 5,837 9,038 75,772 171,196 1.627/11 through 6/12 12,311,678 0 0 5 36,921 0 65,937 102,858 0.84
5 YR. TOTAL 55,739,129 9 591,985 29 935,430 522,726 610,331 2,660,472 4.77INDEMNITY MEDICAL TOTAL
CRED. PURE PREM.* CRED. PURE PREM.* PURE PREM.*Indicated Pure Premium 40% 2.740 44% 2.033 4.77Pure Premium Indicated by National Relativity 30% 1.979 28% 2.276 4.26Pure Premium Present on Rate Level 30% 3.190 28% 3.057 6.25Pure Premium Derived by Formula 2.647 2.388 5.04
CLASS STORE: FLORIST & DRIVERS
8001
Industry Group: Goods and Services CONVERTED LOSSESHazard Group: B INDEMNITY LIKELY INDEMNITY NOT-LIKELY MED LIKELY MED NOT-LIKELY TOTAL TOTAL
POLICY PERIOD PAYROLL CASES AMOUNT CASES AMOUNT AMOUNT AMOUNT AMOUNT PURE PREM.7/07 through 6/08 38,910,026 2 28,775 10 32,908 64,012 234,433 360,128 0.937/08 through 6/09 34,788,131 1 1,015 8 255,249 3,086 475,580 734,930 2.117/09 through 6/10 34,489,441 0 0 16 119,655 0 273,858 393,513 1.147/10 through 6/11 33,618,779 3 72,238 8 105,871 180,756 313,182 672,047 2.007/11 through 6/12 34,882,559 4 96,569 6 37,872 209,106 196,043 539,590 1.55
5 YR. TOTAL 176,688,936 10 198,597 48 551,555 456,960 1,493,096 2,700,208 1.53INDEMNITY MEDICAL TOTAL
CRED. PURE PREM.* CRED. PURE PREM.* PURE PREM.*Indicated Pure Premium 37% 0.425 48% 1.104 1.53Pure Premium Indicated by National Relativity 31% 0.820 26% 1.441 2.26Pure Premium Present on Rate Level 32% 0.793 26% 1.158 1.95Pure Premium Derived by Formula 0.665 1.206 1.87
Page 142
* Pure Premium per $100 of Payroll** Pure Premium per employee++ Non-Standard Calculation© Copyright 2014 National Council on Compensation Insurance, Inc. All Rights Reserved.

MISSOURI
EFFECTIVE 1/1/2015CLASS AUTOMOBILE RENTAL CO.: ALL OTHER EMPLOYEES & COUNTER PERSONNEL, DRIVERS
8002
Industry Group: Goods and Services CONVERTED LOSSESHazard Group: C INDEMNITY LIKELY INDEMNITY NOT-LIKELY MED LIKELY MED NOT-LIKELY TOTAL TOTAL
POLICY PERIOD PAYROLL CASES AMOUNT CASES AMOUNT AMOUNT AMOUNT AMOUNT PURE PREM.7/07 through 6/08 46,900,501 6 103,688 26 274,335 104,209 438,161 920,393 1.967/08 through 6/09 37,240,651 7 130,769 17 156,174 151,329 263,652 701,924 1.897/09 through 6/10 38,909,473 9 122,802 16 102,258 142,309 300,115 667,484 1.727/10 through 6/11 50,949,849 3 44,024 14 140,763 92,818 395,665 673,270 1.327/11 through 6/12 54,753,164 6 107,009 20 110,118 422,904 332,289 972,320 1.78
5 YR. TOTAL 228,753,638 31 508,292 93 783,648 913,569 1,729,882 3,935,391 1.72INDEMNITY MEDICAL TOTAL
CRED. PURE PREM.* CRED. PURE PREM.* PURE PREM.*Indicated Pure Premium 39% 0.565 53% 1.156 1.72Pure Premium Indicated by National Relativity 30% 0.597 23% 1.389 1.99Pure Premium Present on Rate Level 31% 0.713 24% 1.159 1.87Pure Premium Derived by Formula 0.620 1.210 1.83
CLASS GASOLINE STATION: SELF-SERVICE AND CONVENIENCE/GROCERY-RETAIL
8006
Industry Group: Goods and Services CONVERTED LOSSESHazard Group: C INDEMNITY LIKELY INDEMNITY NOT-LIKELY MED LIKELY MED NOT-LIKELY TOTAL TOTAL
POLICY PERIOD PAYROLL CASES AMOUNT CASES AMOUNT AMOUNT AMOUNT AMOUNT PURE PREM.7/07 through 6/08 188,973,212 23 670,973 118 1,233,743 672,437 1,724,397 4,301,550 2.287/08 through 6/09 194,268,149 28 843,258 88 549,663 1,006,098 1,674,616 4,073,635 2.107/09 through 6/10 192,003,287 27 481,264 107 532,760 971,145 1,462,781 3,447,950 1.807/10 through 6/11 206,744,797 34 518,905 124 742,258 1,009,928 1,630,442 3,901,533 1.897/11 through 6/12 208,021,554 19 461,900 89 553,517 864,148 1,593,678 3,473,243 1.67
5 YR. TOTAL 990,010,999 131 2,976,300 526 3,611,941 4,523,756 8,085,914 19,197,911 1.94INDEMNITY MEDICAL TOTAL
CRED. PURE PREM.* CRED. PURE PREM.* PURE PREM.*Indicated Pure Premium 74% 0.665 100% 1.274 1.94Pure Premium Indicated by National Relativity 13% 0.757 0% 1.395 2.15Pure Premium Present on Rate Level 13% 0.832 0% 1.365 2.20Pure Premium Derived by Formula 0.699 1.274 1.97
CLASS STORE: CLOTHING, WEARING APPAREL OR DRY GOODS-RETAIL
8008
Industry Group: Goods and Services CONVERTED LOSSESHazard Group: B INDEMNITY LIKELY INDEMNITY NOT-LIKELY MED LIKELY MED NOT-LIKELY TOTAL TOTAL
POLICY PERIOD PAYROLL CASES AMOUNT CASES AMOUNT AMOUNT AMOUNT AMOUNT PURE PREM.7/07 through 6/08 300,434,122 8 86,427 60 433,043 169,957 1,326,267 2,015,694 0.677/08 through 6/09 285,087,063 12 605,434 57 609,083 515,920 1,692,946 3,423,383 1.207/09 through 6/10 307,083,632 17 545,435 56 480,574 1,295,058 1,447,998 3,769,065 1.237/10 through 6/11 314,188,634 12 288,958 69 763,498 326,897 2,229,809 3,609,162 1.157/11 through 6/12 335,192,934 14 526,616 58 559,586 411,794 1,576,384 3,074,380 0.92
5 YR. TOTAL 1,541,986,385 63 2,052,870 300 2,845,784 2,719,626 8,273,404 15,891,684 1.03INDEMNITY MEDICAL TOTAL
CRED. PURE PREM.* CRED. PURE PREM.* PURE PREM.*Indicated Pure Premium 60% 0.318 93% 0.713 1.03Pure Premium Indicated by National Relativity 20% 0.409 3% 0.811 1.22Pure Premium Present on Rate Level 20% 0.312 4% 0.698 1.01Pure Premium Derived by Formula 0.335 0.715 1.05
Page 143
* Pure Premium per $100 of Payroll** Pure Premium per employee++ Non-Standard Calculation© Copyright 2014 National Council on Compensation Insurance, Inc. All Rights Reserved.
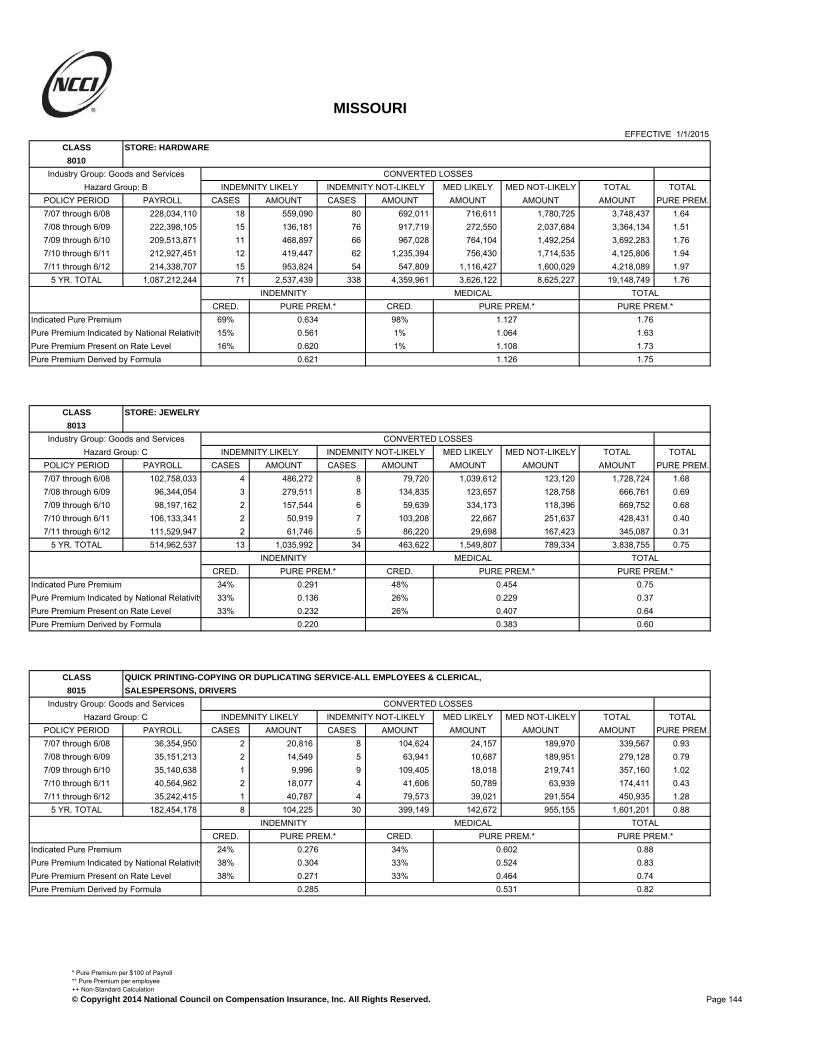
MISSOURI
EFFECTIVE 1/1/2015CLASS STORE: HARDWARE
8010
Industry Group: Goods and Services CONVERTED LOSSESHazard Group: B INDEMNITY LIKELY INDEMNITY NOT-LIKELY MED LIKELY MED NOT-LIKELY TOTAL TOTAL
POLICY PERIOD PAYROLL CASES AMOUNT CASES AMOUNT AMOUNT AMOUNT AMOUNT PURE PREM.7/07 through 6/08 228,034,110 18 559,090 80 692,011 716,611 1,780,725 3,748,437 1.647/08 through 6/09 222,398,105 15 136,181 76 917,719 272,550 2,037,684 3,364,134 1.517/09 through 6/10 209,513,871 11 468,897 66 967,028 764,104 1,492,254 3,692,283 1.767/10 through 6/11 212,927,451 12 419,447 62 1,235,394 756,430 1,714,535 4,125,806 1.947/11 through 6/12 214,338,707 15 953,824 54 547,809 1,116,427 1,600,029 4,218,089 1.97
5 YR. TOTAL 1,087,212,244 71 2,537,439 338 4,359,961 3,626,122 8,625,227 19,148,749 1.76INDEMNITY MEDICAL TOTAL
CRED. PURE PREM.* CRED. PURE PREM.* PURE PREM.*Indicated Pure Premium 69% 0.634 98% 1.127 1.76Pure Premium Indicated by National Relativity 15% 0.561 1% 1.064 1.63Pure Premium Present on Rate Level 16% 0.620 1% 1.108 1.73Pure Premium Derived by Formula 0.621 1.126 1.75
CLASS STORE: JEWELRY
8013
Industry Group: Goods and Services CONVERTED LOSSESHazard Group: C INDEMNITY LIKELY INDEMNITY NOT-LIKELY MED LIKELY MED NOT-LIKELY TOTAL TOTAL
POLICY PERIOD PAYROLL CASES AMOUNT CASES AMOUNT AMOUNT AMOUNT AMOUNT PURE PREM.7/07 through 6/08 102,758,033 4 486,272 8 79,720 1,039,612 123,120 1,728,724 1.687/08 through 6/09 96,344,054 3 279,511 8 134,835 123,657 128,758 666,761 0.697/09 through 6/10 98,197,162 2 157,544 6 59,639 334,173 118,396 669,752 0.687/10 through 6/11 106,133,341 2 50,919 7 103,208 22,667 251,637 428,431 0.407/11 through 6/12 111,529,947 2 61,746 5 86,220 29,698 167,423 345,087 0.31
5 YR. TOTAL 514,962,537 13 1,035,992 34 463,622 1,549,807 789,334 3,838,755 0.75INDEMNITY MEDICAL TOTAL
CRED. PURE PREM.* CRED. PURE PREM.* PURE PREM.*Indicated Pure Premium 34% 0.291 48% 0.454 0.75Pure Premium Indicated by National Relativity 33% 0.136 26% 0.229 0.37Pure Premium Present on Rate Level 33% 0.232 26% 0.407 0.64Pure Premium Derived by Formula 0.220 0.383 0.60
CLASS QUICK PRINTING-COPYING OR DUPLICATING SERVICE-ALL EMPLOYEES & CLERICAL,
8015 SALESPERSONS, DRIVERS
Industry Group: Goods and Services CONVERTED LOSSESHazard Group: C INDEMNITY LIKELY INDEMNITY NOT-LIKELY MED LIKELY MED NOT-LIKELY TOTAL TOTAL
POLICY PERIOD PAYROLL CASES AMOUNT CASES AMOUNT AMOUNT AMOUNT AMOUNT PURE PREM.7/07 through 6/08 36,354,950 2 20,816 8 104,624 24,157 189,970 339,567 0.937/08 through 6/09 35,151,213 2 14,549 5 63,941 10,687 189,951 279,128 0.797/09 through 6/10 35,140,638 1 9,996 9 109,405 18,018 219,741 357,160 1.027/10 through 6/11 40,564,962 2 18,077 4 41,606 50,789 63,939 174,411 0.437/11 through 6/12 35,242,415 1 40,787 4 79,573 39,021 291,554 450,935 1.28
5 YR. TOTAL 182,454,178 8 104,225 30 399,149 142,672 955,155 1,601,201 0.88INDEMNITY MEDICAL TOTAL
CRED. PURE PREM.* CRED. PURE PREM.* PURE PREM.*Indicated Pure Premium 24% 0.276 34% 0.602 0.88Pure Premium Indicated by National Relativity 38% 0.304 33% 0.524 0.83Pure Premium Present on Rate Level 38% 0.271 33% 0.464 0.74Pure Premium Derived by Formula 0.285 0.531 0.82
Page 144
* Pure Premium per $100 of Payroll** Pure Premium per employee++ Non-Standard Calculation© Copyright 2014 National Council on Compensation Insurance, Inc. All Rights Reserved.

MISSOURI
EFFECTIVE 1/1/2015CLASS STORE: RETAIL NOC
8017
Industry Group: Goods and Services CONVERTED LOSSESHazard Group: B INDEMNITY LIKELY INDEMNITY NOT-LIKELY MED LIKELY MED NOT-LIKELY TOTAL TOTAL
POLICY PERIOD PAYROLL CASES AMOUNT CASES AMOUNT AMOUNT AMOUNT AMOUNT PURE PREM.7/07 through 6/08 1,784,499,304 111 2,995,415 511 4,577,699 5,051,928 10,385,758 23,010,800 1.297/08 through 6/09 1,779,723,295 115 2,968,963 513 5,376,940 3,291,303 13,135,874 24,773,080 1.397/09 through 6/10 1,807,598,944 107 2,689,096 537 5,589,982 3,105,718 14,383,397 25,768,193 1.437/10 through 6/11 1,831,770,277 103 3,613,625 519 5,450,254 4,875,092 13,745,794 27,684,765 1.517/11 through 6/12 1,833,272,222 61 1,911,975 466 5,689,790 2,588,291 15,934,980 26,125,036 1.43
5 YR. TOTAL 9,036,864,042 497 14,179,074 2,546 26,684,665 18,912,332 67,585,803 127,361,874 1.41INDEMNITY MEDICAL TOTAL
CRED. PURE PREM.* CRED. PURE PREM.* PURE PREM.*Indicated Pure Premium 100% 0.452 100% 0.957 1.41Pure Premium Indicated by National Relativity 0% 0.482 0% 0.968 1.45Pure Premium Present on Rate Level 0% 0.441 0% 0.922 1.36Pure Premium Derived by Formula 0.452 0.957 1.41
CLASS STORE: WHOLESALE NOC
8018
Industry Group: Goods and Services CONVERTED LOSSESHazard Group: B INDEMNITY LIKELY INDEMNITY NOT-LIKELY MED LIKELY MED NOT-LIKELY TOTAL TOTAL
POLICY PERIOD PAYROLL CASES AMOUNT CASES AMOUNT AMOUNT AMOUNT AMOUNT PURE PREM.7/07 through 6/08 391,271,581 47 928,739 205 1,538,209 1,330,655 3,408,744 7,206,347 1.847/08 through 6/09 366,410,426 33 1,325,892 162 1,401,222 1,761,330 3,721,652 8,210,096 2.247/09 through 6/10 401,520,634 53 1,095,417 182 1,917,251 1,324,533 4,303,638 8,640,839 2.157/10 through 6/11 439,905,298 37 1,560,621 195 2,398,402 1,811,324 4,678,383 10,448,730 2.387/11 through 6/12 425,465,021 38 1,196,833 199 2,201,974 1,325,659 5,194,771 9,919,237 2.33
5 YR. TOTAL 2,024,572,960 208 6,107,502 943 9,457,058 7,553,501 21,307,188 44,425,249 2.20INDEMNITY MEDICAL TOTAL
CRED. PURE PREM.* CRED. PURE PREM.* PURE PREM.*Indicated Pure Premium 97% 0.769 100% 1.426 2.20Pure Premium Indicated by National Relativity 1% 0.944 0% 1.572 2.52Pure Premium Present on Rate Level 2% 0.783 0% 1.441 2.22Pure Premium Derived by Formula 0.771 1.426 2.20
CLASS STORE: MEAT, FISH OR POULTRY DEALER-WHOLESALE
8021
Industry Group: Goods and Services CONVERTED LOSSESHazard Group: C INDEMNITY LIKELY INDEMNITY NOT-LIKELY MED LIKELY MED NOT-LIKELY TOTAL TOTAL
POLICY PERIOD PAYROLL CASES AMOUNT CASES AMOUNT AMOUNT AMOUNT AMOUNT PURE PREM.7/07 through 6/08 30,856,679 5 65,948 31 275,992 53,112 511,143 906,195 2.947/08 through 6/09 37,291,908 1 35,393 26 351,262 19,345 640,888 1,046,888 2.817/09 through 6/10 32,246,194 2 152,748 16 153,367 18,235 469,541 793,891 2.467/10 through 6/11 32,196,391 1 881 23 276,007 0 588,168 865,056 2.697/11 through 6/12 34,730,943 2 56,601 25 729,993 23,029 987,436 1,797,059 5.17
5 YR. TOTAL 167,322,115 11 311,571 121 1,786,621 113,721 3,197,176 5,409,089 3.23INDEMNITY MEDICAL TOTAL
CRED. PURE PREM.* CRED. PURE PREM.* PURE PREM.*Indicated Pure Premium 36% 1.254 51% 1.979 3.23Pure Premium Indicated by National Relativity 32% 0.904 24% 1.830 2.73Pure Premium Present on Rate Level 32% 0.774 25% 1.440 2.21Pure Premium Derived by Formula 0.988 1.808 2.80
Page 145
* Pure Premium per $100 of Payroll** Pure Premium per employee++ Non-Standard Calculation© Copyright 2014 National Council on Compensation Insurance, Inc. All Rights Reserved.

MISSOURI
EFFECTIVE 1/1/2015CLASS STORE: MEAT, FISH OR POULTRY-RETAIL
8031
Industry Group: Goods and Services CONVERTED LOSSESHazard Group: C INDEMNITY LIKELY INDEMNITY NOT-LIKELY MED LIKELY MED NOT-LIKELY TOTAL TOTAL
POLICY PERIOD PAYROLL CASES AMOUNT CASES AMOUNT AMOUNT AMOUNT AMOUNT PURE PREM.7/07 through 6/08 13,299,705 1 21,417 11 70,430 10,743 142,007 244,597 1.847/08 through 6/09 13,308,084 0 0 11 67,539 0 240,835 308,374 2.327/09 through 6/10 13,020,188 1 6,049 7 40,597 6,167 110,260 163,073 1.257/10 through 6/11 12,461,407 0 0 5 51,696 0 91,149 142,845 1.157/11 through 6/12 12,424,656 0 0 4 19,166 0 109,332 128,498 1.03
5 YR. TOTAL 64,514,040 2 27,466 38 249,428 16,910 693,583 987,387 1.53INDEMNITY MEDICAL TOTAL
CRED. PURE PREM.* CRED. PURE PREM.* PURE PREM.*Indicated Pure Premium 24% 0.429 35% 1.101 1.53Pure Premium Indicated by National Relativity 38% 0.793 32% 1.781 2.57Pure Premium Present on Rate Level 38% 0.731 33% 1.415 2.15Pure Premium Derived by Formula 0.682 1.422 2.10
CLASS STORE: CLOTHING, WEARING APPAREL OR DRY GOODS-WHOLESALE
8032
Industry Group: Goods and Services CONVERTED LOSSESHazard Group: B INDEMNITY LIKELY INDEMNITY NOT-LIKELY MED LIKELY MED NOT-LIKELY TOTAL TOTAL
POLICY PERIOD PAYROLL CASES AMOUNT CASES AMOUNT AMOUNT AMOUNT AMOUNT PURE PREM.7/07 through 6/08 19,197,480 1 20,128 12 98,748 10,350 141,983 271,209 1.417/08 through 6/09 24,536,962 1 6,768 10 82,280 7,013 164,964 261,025 1.067/09 through 6/10 24,037,076 2 97,279 5 54,979 342,727 141,802 636,787 2.657/10 through 6/11 25,679,483 2 66,431 15 153,303 85,228 298,732 603,694 2.357/11 through 6/12 23,591,404 2 20,901 8 136,112 12,776 233,736 403,525 1.71
5 YR. TOTAL 117,042,405 8 211,507 50 525,422 458,094 981,217 2,176,240 1.86INDEMNITY MEDICAL TOTAL
CRED. PURE PREM.* CRED. PURE PREM.* PURE PREM.*Indicated Pure Premium 29% 0.630 41% 1.230 1.86Pure Premium Indicated by National Relativity 35% 0.673 29% 1.302 1.98Pure Premium Present on Rate Level 36% 0.693 30% 1.188 1.88Pure Premium Derived by Formula 0.668 1.238 1.91
CLASS STORE: MEAT, GROCERY AND PROVISION STORES COMBINED-RETAIL NOC
8033
Industry Group: Goods and Services CONVERTED LOSSESHazard Group: C INDEMNITY LIKELY INDEMNITY NOT-LIKELY MED LIKELY MED NOT-LIKELY TOTAL TOTAL
POLICY PERIOD PAYROLL CASES AMOUNT CASES AMOUNT AMOUNT AMOUNT AMOUNT PURE PREM.7/07 through 6/08 410,777,532 39 861,500 190 1,614,538 1,576,648 4,174,904 8,227,590 2.007/08 through 6/09 440,571,913 26 568,177 171 1,248,875 782,439 3,863,655 6,463,146 1.477/09 through 6/10 484,732,517 39 1,654,582 175 1,417,738 1,803,414 4,392,329 9,268,063 1.917/10 through 6/11 492,806,943 29 981,602 201 2,383,569 1,569,208 4,638,669 9,573,048 1.947/11 through 6/12 501,725,264 24 863,909 192 1,844,502 1,949,613 5,859,652 10,517,676 2.10
5 YR. TOTAL 2,330,614,169 157 4,929,770 929 8,509,222 7,681,322 22,929,209 44,049,523 1.89INDEMNITY MEDICAL TOTAL
CRED. PURE PREM.* CRED. PURE PREM.* PURE PREM.*Indicated Pure Premium 90% 0.577 100% 1.313 1.89Pure Premium Indicated by National Relativity 5% 0.662 0% 1.317 1.98Pure Premium Present on Rate Level 5% 0.574 0% 1.246 1.82Pure Premium Derived by Formula 0.581 1.313 1.89
Page 146
* Pure Premium per $100 of Payroll** Pure Premium per employee++ Non-Standard Calculation© Copyright 2014 National Council on Compensation Insurance, Inc. All Rights Reserved.

MISSOURI
EFFECTIVE 1/1/2015CLASS STORE: GROCERY - WHOLESALE
8034
Industry Group: Goods and Services CONVERTED LOSSESHazard Group: C INDEMNITY LIKELY INDEMNITY NOT-LIKELY MED LIKELY MED NOT-LIKELY TOTAL TOTAL
POLICY PERIOD PAYROLL CASES AMOUNT CASES AMOUNT AMOUNT AMOUNT AMOUNT PURE PREM.7/07 through 6/08 13,018,529 1 18,883 2 12,805 8,602 26,981 67,271 0.527/08 through 6/09 13,275,601 0 0 8 103,042 0 113,792 216,834 1.637/09 through 6/10 15,404,566 5 251,446 11 98,086 234,828 212,849 797,209 5.187/10 through 6/11 6,540,112 0 0 3 43,557 0 24,217 67,774 1.047/11 through 6/12 15,638,643 0 0 2 23,137 0 46,631 69,768 0.45
5 YR. TOTAL 63,877,451 6 270,329 26 280,627 243,430 424,470 1,218,856 1.91INDEMNITY MEDICAL TOTAL
CRED. PURE PREM.* CRED. PURE PREM.* PURE PREM.*Indicated Pure Premium 26% 0.863 33% 1.046 1.91Pure Premium Indicated by National Relativity 37% 1.211 33% 1.198 2.41Pure Premium Present on Rate Level 37% 0.891 34% 1.281 2.17Pure Premium Derived by Formula 1.002 1.176 2.18
CLASS STORE - SUPERSTORES AND WAREHOUSE CLUBS
8037
Industry Group: Goods and Services CONVERTED LOSSESHazard Group: B INDEMNITY LIKELY INDEMNITY NOT-LIKELY MED LIKELY MED NOT-LIKELY TOTAL TOTAL
POLICY PERIOD PAYROLL CASES AMOUNT CASES AMOUNT AMOUNT AMOUNT AMOUNT PURE PREM.7/07 through 6/08 0 0 0 0 0 0 0 0 0.007/08 through 6/09 0 0 0 0 0 0 0 0 0.007/09 through 6/10 0 0 0 0 0 0 0 0 0.007/10 through 6/11 738,209 0 0 0 0 0 337 337 0.057/11 through 6/12 2,815,672 0 0 2 553 0 40,116 40,669 1.45
5 YR. TOTAL 3,553,881 0 0 2 553 0 40,453 41,006 1.15INDEMNITY MEDICAL TOTAL
CRED. PURE PREM.* CRED. PURE PREM.* PURE PREM.*Indicated Pure Premium 6% 0.016 9% 1.138 1.15Pure Premium Indicated by National Relativity 0% 0.000 0% 0.000 0.00Pure Premium Present on Rate Level 94% 0.471 91% 0.893 1.36Pure Premium Derived by Formula 0.444 0.915 1.36
CLASS STORE: DEPARTMENT-RETAIL
8039
Industry Group: Goods and Services CONVERTED LOSSESHazard Group: B INDEMNITY LIKELY INDEMNITY NOT-LIKELY MED LIKELY MED NOT-LIKELY TOTAL TOTAL
POLICY PERIOD PAYROLL CASES AMOUNT CASES AMOUNT AMOUNT AMOUNT AMOUNT PURE PREM.7/07 through 6/08 150,698,617 13 177,661 41 466,419 335,071 1,070,642 2,049,793 1.367/08 through 6/09 140,797,115 9 158,406 29 206,953 362,953 803,673 1,531,985 1.097/09 through 6/10 146,239,659 10 153,582 38 446,679 208,042 1,052,849 1,861,152 1.277/10 through 6/11 143,576,828 14 174,806 36 357,260 331,045 978,933 1,842,044 1.287/11 through 6/12 138,087,960 4 105,609 31 310,400 67,673 1,085,251 1,568,933 1.14
5 YR. TOTAL 719,400,179 50 770,064 175 1,787,711 1,304,784 4,991,348 8,853,907 1.23INDEMNITY MEDICAL TOTAL
CRED. PURE PREM.* CRED. PURE PREM.* PURE PREM.*Indicated Pure Premium 51% 0.356 78% 0.875 1.23Pure Premium Indicated by National Relativity 24% 0.529 11% 1.148 1.68Pure Premium Present on Rate Level 25% 0.450 11% 0.951 1.40Pure Premium Derived by Formula 0.421 0.913 1.33
Page 147
* Pure Premium per $100 of Payroll** Pure Premium per employee++ Non-Standard Calculation© Copyright 2014 National Council on Compensation Insurance, Inc. All Rights Reserved.
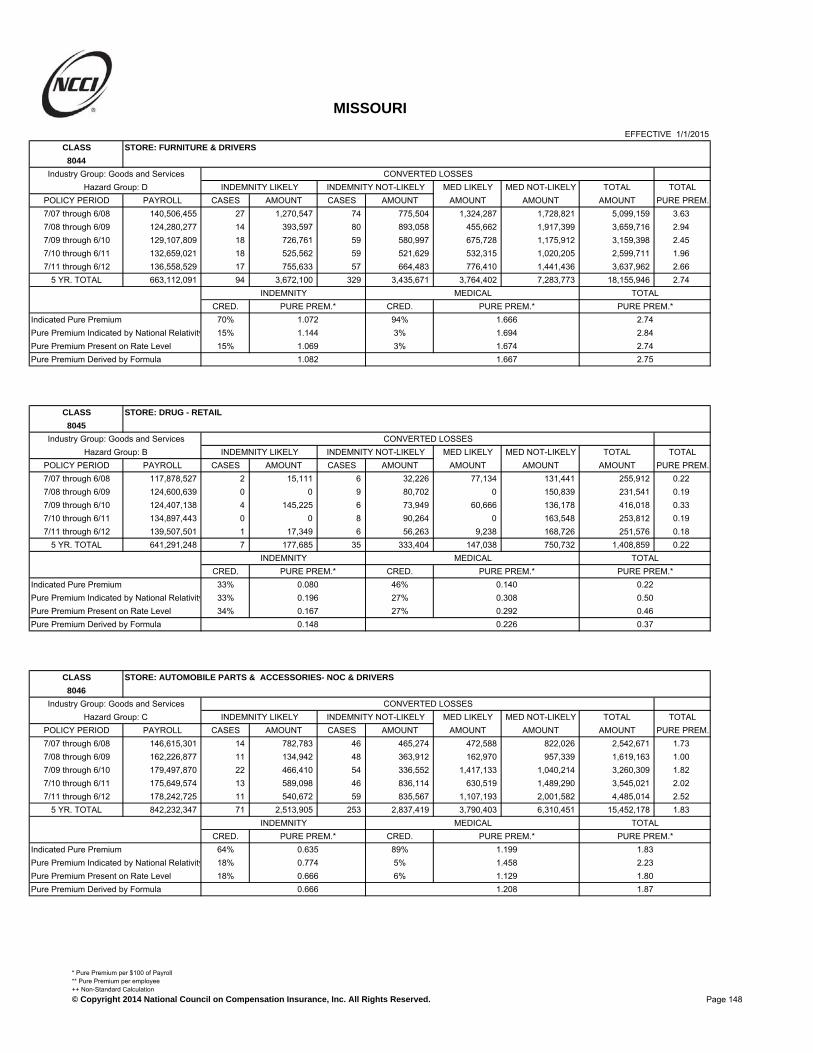
MISSOURI
EFFECTIVE 1/1/2015CLASS STORE: FURNITURE & DRIVERS
8044
Industry Group: Goods and Services CONVERTED LOSSESHazard Group: D INDEMNITY LIKELY INDEMNITY NOT-LIKELY MED LIKELY MED NOT-LIKELY TOTAL TOTAL
POLICY PERIOD PAYROLL CASES AMOUNT CASES AMOUNT AMOUNT AMOUNT AMOUNT PURE PREM.7/07 through 6/08 140,506,455 27 1,270,547 74 775,504 1,324,287 1,728,821 5,099,159 3.637/08 through 6/09 124,280,277 14 393,597 80 893,058 455,662 1,917,399 3,659,716 2.947/09 through 6/10 129,107,809 18 726,761 59 580,997 675,728 1,175,912 3,159,398 2.457/10 through 6/11 132,659,021 18 525,562 59 521,629 532,315 1,020,205 2,599,711 1.967/11 through 6/12 136,558,529 17 755,633 57 664,483 776,410 1,441,436 3,637,962 2.66
5 YR. TOTAL 663,112,091 94 3,672,100 329 3,435,671 3,764,402 7,283,773 18,155,946 2.74INDEMNITY MEDICAL TOTAL
CRED. PURE PREM.* CRED. PURE PREM.* PURE PREM.*Indicated Pure Premium 70% 1.072 94% 1.666 2.74Pure Premium Indicated by National Relativity 15% 1.144 3% 1.694 2.84Pure Premium Present on Rate Level 15% 1.069 3% 1.674 2.74Pure Premium Derived by Formula 1.082 1.667 2.75
CLASS STORE: DRUG - RETAIL
8045
Industry Group: Goods and Services CONVERTED LOSSESHazard Group: B INDEMNITY LIKELY INDEMNITY NOT-LIKELY MED LIKELY MED NOT-LIKELY TOTAL TOTAL
POLICY PERIOD PAYROLL CASES AMOUNT CASES AMOUNT AMOUNT AMOUNT AMOUNT PURE PREM.7/07 through 6/08 117,878,527 2 15,111 6 32,226 77,134 131,441 255,912 0.227/08 through 6/09 124,600,639 0 0 9 80,702 0 150,839 231,541 0.197/09 through 6/10 124,407,138 4 145,225 6 73,949 60,666 136,178 416,018 0.337/10 through 6/11 134,897,443 0 0 8 90,264 0 163,548 253,812 0.197/11 through 6/12 139,507,501 1 17,349 6 56,263 9,238 168,726 251,576 0.18
5 YR. TOTAL 641,291,248 7 177,685 35 333,404 147,038 750,732 1,408,859 0.22INDEMNITY MEDICAL TOTAL
CRED. PURE PREM.* CRED. PURE PREM.* PURE PREM.*Indicated Pure Premium 33% 0.080 46% 0.140 0.22Pure Premium Indicated by National Relativity 33% 0.196 27% 0.308 0.50Pure Premium Present on Rate Level 34% 0.167 27% 0.292 0.46Pure Premium Derived by Formula 0.148 0.226 0.37
CLASS STORE: AUTOMOBILE PARTS & ACCESSORIES- NOC & DRIVERS
8046
Industry Group: Goods and Services CONVERTED LOSSESHazard Group: C INDEMNITY LIKELY INDEMNITY NOT-LIKELY MED LIKELY MED NOT-LIKELY TOTAL TOTAL
POLICY PERIOD PAYROLL CASES AMOUNT CASES AMOUNT AMOUNT AMOUNT AMOUNT PURE PREM.7/07 through 6/08 146,615,301 14 782,783 46 465,274 472,588 822,026 2,542,671 1.737/08 through 6/09 162,226,877 11 134,942 48 363,912 162,970 957,339 1,619,163 1.007/09 through 6/10 179,497,870 22 466,410 54 336,552 1,417,133 1,040,214 3,260,309 1.827/10 through 6/11 175,649,574 13 589,098 46 836,114 630,519 1,489,290 3,545,021 2.027/11 through 6/12 178,242,725 11 540,672 59 835,567 1,107,193 2,001,582 4,485,014 2.52
5 YR. TOTAL 842,232,347 71 2,513,905 253 2,837,419 3,790,403 6,310,451 15,452,178 1.83INDEMNITY MEDICAL TOTAL
CRED. PURE PREM.* CRED. PURE PREM.* PURE PREM.*Indicated Pure Premium 64% 0.635 89% 1.199 1.83Pure Premium Indicated by National Relativity 18% 0.774 5% 1.458 2.23Pure Premium Present on Rate Level 18% 0.666 6% 1.129 1.80Pure Premium Derived by Formula 0.666 1.208 1.87
Page 148
* Pure Premium per $100 of Payroll** Pure Premium per employee++ Non-Standard Calculation© Copyright 2014 National Council on Compensation Insurance, Inc. All Rights Reserved.
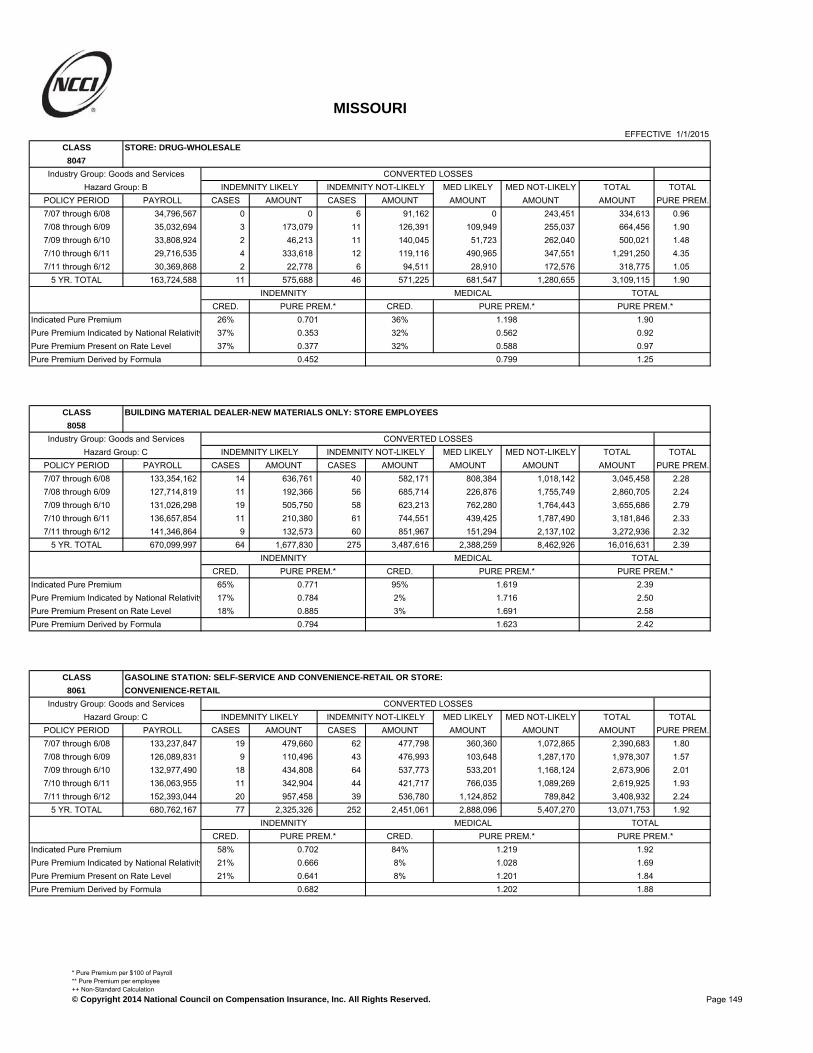
MISSOURI
EFFECTIVE 1/1/2015CLASS STORE: DRUG-WHOLESALE
8047
Industry Group: Goods and Services CONVERTED LOSSESHazard Group: B INDEMNITY LIKELY INDEMNITY NOT-LIKELY MED LIKELY MED NOT-LIKELY TOTAL TOTAL
POLICY PERIOD PAYROLL CASES AMOUNT CASES AMOUNT AMOUNT AMOUNT AMOUNT PURE PREM.7/07 through 6/08 34,796,567 0 0 6 91,162 0 243,451 334,613 0.967/08 through 6/09 35,032,694 3 173,079 11 126,391 109,949 255,037 664,456 1.907/09 through 6/10 33,808,924 2 46,213 11 140,045 51,723 262,040 500,021 1.487/10 through 6/11 29,716,535 4 333,618 12 119,116 490,965 347,551 1,291,250 4.357/11 through 6/12 30,369,868 2 22,778 6 94,511 28,910 172,576 318,775 1.05
5 YR. TOTAL 163,724,588 11 575,688 46 571,225 681,547 1,280,655 3,109,115 1.90INDEMNITY MEDICAL TOTAL
CRED. PURE PREM.* CRED. PURE PREM.* PURE PREM.*Indicated Pure Premium 26% 0.701 36% 1.198 1.90Pure Premium Indicated by National Relativity 37% 0.353 32% 0.562 0.92Pure Premium Present on Rate Level 37% 0.377 32% 0.588 0.97Pure Premium Derived by Formula 0.452 0.799 1.25
CLASS BUILDING MATERIAL DEALER-NEW MATERIALS ONLY: STORE EMPLOYEES
8058
Industry Group: Goods and Services CONVERTED LOSSESHazard Group: C INDEMNITY LIKELY INDEMNITY NOT-LIKELY MED LIKELY MED NOT-LIKELY TOTAL TOTAL
POLICY PERIOD PAYROLL CASES AMOUNT CASES AMOUNT AMOUNT AMOUNT AMOUNT PURE PREM.7/07 through 6/08 133,354,162 14 636,761 40 582,171 808,384 1,018,142 3,045,458 2.287/08 through 6/09 127,714,819 11 192,366 56 685,714 226,876 1,755,749 2,860,705 2.247/09 through 6/10 131,026,298 19 505,750 58 623,213 762,280 1,764,443 3,655,686 2.797/10 through 6/11 136,657,854 11 210,380 61 744,551 439,425 1,787,490 3,181,846 2.337/11 through 6/12 141,346,864 9 132,573 60 851,967 151,294 2,137,102 3,272,936 2.32
5 YR. TOTAL 670,099,997 64 1,677,830 275 3,487,616 2,388,259 8,462,926 16,016,631 2.39INDEMNITY MEDICAL TOTAL
CRED. PURE PREM.* CRED. PURE PREM.* PURE PREM.*Indicated Pure Premium 65% 0.771 95% 1.619 2.39Pure Premium Indicated by National Relativity 17% 0.784 2% 1.716 2.50Pure Premium Present on Rate Level 18% 0.885 3% 1.691 2.58Pure Premium Derived by Formula 0.794 1.623 2.42
CLASS GASOLINE STATION: SELF-SERVICE AND CONVENIENCE-RETAIL OR STORE:
8061 CONVENIENCE-RETAIL
Industry Group: Goods and Services CONVERTED LOSSESHazard Group: C INDEMNITY LIKELY INDEMNITY NOT-LIKELY MED LIKELY MED NOT-LIKELY TOTAL TOTAL
POLICY PERIOD PAYROLL CASES AMOUNT CASES AMOUNT AMOUNT AMOUNT AMOUNT PURE PREM.7/07 through 6/08 133,237,847 19 479,660 62 477,798 360,360 1,072,865 2,390,683 1.807/08 through 6/09 126,089,831 9 110,496 43 476,993 103,648 1,287,170 1,978,307 1.577/09 through 6/10 132,977,490 18 434,808 64 537,773 533,201 1,168,124 2,673,906 2.017/10 through 6/11 136,063,955 11 342,904 44 421,717 766,035 1,089,269 2,619,925 1.937/11 through 6/12 152,393,044 20 957,458 39 536,780 1,124,852 789,842 3,408,932 2.24
5 YR. TOTAL 680,762,167 77 2,325,326 252 2,451,061 2,888,096 5,407,270 13,071,753 1.92INDEMNITY MEDICAL TOTAL
CRED. PURE PREM.* CRED. PURE PREM.* PURE PREM.*Indicated Pure Premium 58% 0.702 84% 1.219 1.92Pure Premium Indicated by National Relativity 21% 0.666 8% 1.028 1.69Pure Premium Present on Rate Level 21% 0.641 8% 1.201 1.84Pure Premium Derived by Formula 0.682 1.202 1.88
Page 149
* Pure Premium per $100 of Payroll** Pure Premium per employee++ Non-Standard Calculation© Copyright 2014 National Council on Compensation Insurance, Inc. All Rights Reserved.

MISSOURI
EFFECTIVE 1/1/2015CLASS STORE: BOOK, RECORD, COMPACT DISC, SOFTWARE, VIDEO OR AUDIO CASSETTE RETAIL
8072
Industry Group: Goods and Services CONVERTED LOSSESHazard Group: B INDEMNITY LIKELY INDEMNITY NOT-LIKELY MED LIKELY MED NOT-LIKELY TOTAL TOTAL
POLICY PERIOD PAYROLL CASES AMOUNT CASES AMOUNT AMOUNT AMOUNT AMOUNT PURE PREM.7/07 through 6/08 44,552,923 0 0 9 25,484 0 45,527 71,011 0.167/08 through 6/09 30,060,278 2 56,503 7 115,447 37,328 177,798 387,076 1.297/09 through 6/10 34,796,393 0 0 3 111,796 0 167,696 279,492 0.807/10 through 6/11 33,652,559 2 57,700 2 9,567 46,398 35,847 149,512 0.447/11 through 6/12 32,148,904 0 0 7 105,418 0 132,079 237,497 0.74
5 YR. TOTAL 175,211,057 4 114,203 28 367,712 83,726 558,947 1,124,588 0.64INDEMNITY MEDICAL TOTAL
CRED. PURE PREM.* CRED. PURE PREM.* PURE PREM.*Indicated Pure Premium 23% 0.275 34% 0.367 0.64Pure Premium Indicated by National Relativity 38% 0.236 33% 0.509 0.75Pure Premium Present on Rate Level 39% 0.248 33% 0.486 0.73Pure Premium Derived by Formula 0.250 0.453 0.70
CLASS SEED MERCHANT
8102
Industry Group: Goods and Services CONVERTED LOSSESHazard Group: B INDEMNITY LIKELY INDEMNITY NOT-LIKELY MED LIKELY MED NOT-LIKELY TOTAL TOTAL
POLICY PERIOD PAYROLL CASES AMOUNT CASES AMOUNT AMOUNT AMOUNT AMOUNT PURE PREM.7/07 through 6/08 12,111,160 0 0 6 114,212 0 232,192 346,404 2.867/08 through 6/09 12,426,119 0 0 9 81,677 0 208,898 290,575 2.347/09 through 6/10 13,460,989 1 31,393 6 104,145 94,505 231,642 461,685 3.437/10 through 6/11 11,435,161 1 855 5 18,062 0 43,398 62,315 0.557/11 through 6/12 13,323,409 0 0 3 64,815 0 87,790 152,605 1.15
5 YR. TOTAL 62,756,838 2 32,248 29 382,911 94,505 803,920 1,313,584 2.09INDEMNITY MEDICAL TOTAL
CRED. PURE PREM.* CRED. PURE PREM.* PURE PREM.*Indicated Pure Premium 23% 0.662 35% 1.432 2.09Pure Premium Indicated by National Relativity 38% 0.586 32% 1.252 1.84Pure Premium Present on Rate Level 39% 0.723 33% 1.517 2.24Pure Premium Derived by Formula 0.657 1.402 2.06
CLASS WOOL MERCHANT
8103
Industry Group: Goods and Services CONVERTED LOSSESHazard Group: D INDEMNITY LIKELY INDEMNITY NOT-LIKELY MED LIKELY MED NOT-LIKELY TOTAL TOTAL
POLICY PERIOD PAYROLL CASES AMOUNT CASES AMOUNT AMOUNT AMOUNT AMOUNT PURE PREM.7/07 through 6/08 3,032,730 0 0 0 0 0 1,339 1,339 0.047/08 through 6/09 2,519,860 0 0 3 90,564 0 110,712 201,276 7.997/09 through 6/10 2,462,355 0 0 0 0 0 1,314 1,314 0.057/10 through 6/11 2,690,365 0 0 1 2,507 0 1,906 4,413 0.167/11 through 6/12 3,016,435 0 0 0 0 0 11,089 11,089 0.37
5 YR. TOTAL 13,721,745 0 0 4 93,071 0 126,360 219,431 1.60INDEMNITY MEDICAL TOTAL
CRED. PURE PREM.* CRED. PURE PREM.* PURE PREM.*Indicated Pure Premium 15% 0.678 19% 0.921 1.60Pure Premium Indicated by National Relativity 23% 0.683 24% 1.942 2.63Pure Premium Present on Rate Level 62% 1.152 57% 1.557 2.71Pure Premium Derived by Formula 0.973 1.529 2.50
Page 150
* Pure Premium per $100 of Payroll** Pure Premium per employee++ Non-Standard Calculation© Copyright 2014 National Council on Compensation Insurance, Inc. All Rights Reserved.

MISSOURI
EFFECTIVE 1/1/2015CLASS STORE: HIDE DEALER
8105
Industry Group: Goods and Services CONVERTED LOSSESHazard Group: B INDEMNITY LIKELY INDEMNITY NOT-LIKELY MED LIKELY MED NOT-LIKELY TOTAL TOTAL
POLICY PERIOD PAYROLL CASES AMOUNT CASES AMOUNT AMOUNT AMOUNT AMOUNT PURE PREM.7/07 through 6/08 277,541 0 0 0 0 0 0 0 0.007/08 through 6/09 273,718 0 0 0 0 0 0 0 0.007/09 through 6/10 443,760 0 0 0 0 0 0 0 0.007/10 through 6/11 0 0 0 0 0 0 0 0 0.007/11 through 6/12 0 0 0 0 0 0 0 0 0.00
5 YR. TOTAL 995,019 0 0 0 0 0 0 0 0.00INDEMNITY MEDICAL TOTAL
CRED. PURE PREM.* CRED. PURE PREM.* PURE PREM.*Indicated Pure Premium 5% 0.000 6% 0.000 0.00Pure Premium Indicated by National Relativity 15% 0.832 16% 1.368 2.20Pure Premium Present on Rate Level 80% 0.969 78% 1.347 2.32Pure Premium Derived by Formula 0.900 1.270 2.17
CLASS IRON OR STEEL MERCHANT & DRIVERS
8106
Industry Group: Goods and Services CONVERTED LOSSESHazard Group: E INDEMNITY LIKELY INDEMNITY NOT-LIKELY MED LIKELY MED NOT-LIKELY TOTAL TOTAL
POLICY PERIOD PAYROLL CASES AMOUNT CASES AMOUNT AMOUNT AMOUNT AMOUNT PURE PREM.7/07 through 6/08 44,052,984 7 564,500 29 394,088 471,858 791,843 2,222,289 5.057/08 through 6/09 35,375,320 7 198,327 20 241,814 172,115 384,214 996,470 2.827/09 through 6/10 33,275,697 1 12,984 37 655,819 7,514 918,163 1,594,480 4.797/10 through 6/11 35,020,269 5 210,271 28 355,457 242,026 609,765 1,417,519 4.057/11 through 6/12 34,064,392 5 371,333 27 362,203 268,191 603,302 1,605,029 4.71
5 YR. TOTAL 181,788,662 25 1,357,415 141 2,009,381 1,161,704 3,307,287 7,835,787 4.31INDEMNITY MEDICAL TOTAL
CRED. PURE PREM.* CRED. PURE PREM.* PURE PREM.*Indicated Pure Premium 50% 1.852 68% 2.458 4.31Pure Premium Indicated by National Relativity 25% 1.628 16% 2.618 4.25Pure Premium Present on Rate Level 25% 1.699 16% 2.706 4.41Pure Premium Derived by Formula 1.758 2.523 4.28
CLASS MACHINERY DEALER NOC-STORE OR YARD-& DRIVERS
8107
Industry Group: Goods and Services CONVERTED LOSSESHazard Group: E INDEMNITY LIKELY INDEMNITY NOT-LIKELY MED LIKELY MED NOT-LIKELY TOTAL TOTAL
POLICY PERIOD PAYROLL CASES AMOUNT CASES AMOUNT AMOUNT AMOUNT AMOUNT PURE PREM.7/07 through 6/08 133,163,335 10 753,096 75 1,205,040 1,242,699 2,498,887 5,699,722 4.287/08 through 6/09 121,446,413 5 298,888 49 782,569 382,186 1,139,811 2,603,454 2.147/09 through 6/10 119,337,203 9 213,397 48 844,299 348,703 1,505,529 2,911,928 2.447/10 through 6/11 131,044,275 9 492,735 49 837,621 518,093 1,410,665 3,259,114 2.497/11 through 6/12 135,531,344 5 519,174 36 807,213 526,644 1,639,481 3,492,512 2.58
5 YR. TOTAL 640,522,570 38 2,277,290 257 4,476,742 3,018,325 8,194,373 17,966,730 2.81INDEMNITY MEDICAL TOTAL
CRED. PURE PREM.* CRED. PURE PREM.* PURE PREM.*Indicated Pure Premium 71% 1.054 94% 1.751 2.81Pure Premium Indicated by National Relativity 14% 1.198 3% 1.805 3.00Pure Premium Present on Rate Level 15% 1.131 3% 1.699 2.83Pure Premium Derived by Formula 1.086 1.751 2.84
Page 151
* Pure Premium per $100 of Payroll** Pure Premium per employee++ Non-Standard Calculation© Copyright 2014 National Council on Compensation Insurance, Inc. All Rights Reserved.

MISSOURI
EFFECTIVE 1/1/2015CLASS PLUMBERS SUPPLIES DEALER & DRIVERS
8111
Industry Group: Goods and Services CONVERTED LOSSESHazard Group: C INDEMNITY LIKELY INDEMNITY NOT-LIKELY MED LIKELY MED NOT-LIKELY TOTAL TOTAL
POLICY PERIOD PAYROLL CASES AMOUNT CASES AMOUNT AMOUNT AMOUNT AMOUNT PURE PREM.7/07 through 6/08 42,195,303 4 163,320 12 118,407 227,938 282,705 792,370 1.887/08 through 6/09 38,583,860 1 12,719 9 154,243 91,177 306,470 564,609 1.467/09 through 6/10 36,211,586 2 52,681 13 153,196 66,207 248,884 520,968 1.447/10 through 6/11 42,279,682 2 29,131 6 68,376 28,307 170,591 296,405 0.707/11 through 6/12 52,360,048 1 243,860 10 148,567 319,602 271,737 983,766 1.88
5 YR. TOTAL 211,630,479 10 501,711 50 642,789 733,231 1,280,387 3,158,118 1.49INDEMNITY MEDICAL TOTAL
CRED. PURE PREM.* CRED. PURE PREM.* PURE PREM.*Indicated Pure Premium 38% 0.541 52% 0.951 1.49Pure Premium Indicated by National Relativity 31% 0.875 24% 1.405 2.28Pure Premium Present on Rate Level 31% 0.705 24% 1.177 1.88Pure Premium Derived by Formula 0.695 1.114 1.81
CLASS FARM MACHINERY DEALER-ALL OPERATIONS & DRIVERS
8116
Industry Group: Goods and Services CONVERTED LOSSESHazard Group: C INDEMNITY LIKELY INDEMNITY NOT-LIKELY MED LIKELY MED NOT-LIKELY TOTAL TOTAL
POLICY PERIOD PAYROLL CASES AMOUNT CASES AMOUNT AMOUNT AMOUNT AMOUNT PURE PREM.7/07 through 6/08 59,381,421 4 160,658 25 184,608 862,860 519,288 1,727,414 2.917/08 through 6/09 62,960,165 7 406,901 37 333,888 1,020,376 691,462 2,452,627 3.907/09 through 6/10 66,167,288 4 71,322 40 546,306 111,204 1,461,357 2,190,189 3.317/10 through 6/11 69,171,009 3 397,664 38 530,534 466,892 999,966 2,395,056 3.467/11 through 6/12 67,195,671 4 120,636 27 380,850 178,817 666,047 1,346,350 2.00
5 YR. TOTAL 324,875,554 22 1,157,181 167 1,976,186 2,640,149 4,338,120 10,111,636 3.11INDEMNITY MEDICAL TOTAL
CRED. PURE PREM.* CRED. PURE PREM.* PURE PREM.*Indicated Pure Premium 52% 0.964 80% 2.148 3.11Pure Premium Indicated by National Relativity 24% 0.902 10% 1.590 2.49Pure Premium Present on Rate Level 24% 1.016 10% 2.242 3.26Pure Premium Derived by Formula 0.962 2.102 3.06
CLASS ICE MFG. OR DISTRIBUTION & DRIVERS
8203
Industry Group: Manufacturing CONVERTED LOSSESHazard Group: C INDEMNITY LIKELY INDEMNITY NOT-LIKELY MED LIKELY MED NOT-LIKELY TOTAL TOTAL
POLICY PERIOD PAYROLL CASES AMOUNT CASES AMOUNT AMOUNT AMOUNT AMOUNT PURE PREM.7/07 through 6/08 5,666,217 3 85,733 6 56,821 132,840 111,632 387,026 6.837/08 through 6/09 5,468,730 1 25,525 2 22,591 6,160 50,961 105,237 1.937/09 through 6/10 5,778,300 2 9,629 9 69,287 8,286 84,704 171,906 2.987/10 through 6/11 6,069,721 1 78 5 96,996 482 218,103 315,659 5.207/11 through 6/12 6,836,102 1 117,037 9 93,137 85,901 106,312 402,387 5.89
5 YR. TOTAL 29,819,070 8 238,002 31 338,832 233,669 571,712 1,382,215 4.64INDEMNITY MEDICAL TOTAL
CRED. PURE PREM.* CRED. PURE PREM.* PURE PREM.*Indicated Pure Premium 26% 1.934 34% 2.701 4.64Pure Premium Indicated by National Relativity 37% 2.236 33% 3.452 5.69Pure Premium Present on Rate Level 37% 1.909 33% 2.909 4.82Pure Premium Derived by Formula 2.036 3.017 5.05
Page 152
* Pure Premium per $100 of Payroll** Pure Premium per employee++ Non-Standard Calculation© Copyright 2014 National Council on Compensation Insurance, Inc. All Rights Reserved.

MISSOURI
EFFECTIVE 1/1/2015CLASS BUILDING MATERIAL YARD & LOCAL MANAGERS, DRIVERS
8204
Industry Group: Goods and Services CONVERTED LOSSESHazard Group: E INDEMNITY LIKELY INDEMNITY NOT-LIKELY MED LIKELY MED NOT-LIKELY TOTAL TOTAL
POLICY PERIOD PAYROLL CASES AMOUNT CASES AMOUNT AMOUNT AMOUNT AMOUNT PURE PREM.7/07 through 6/08 1,103,290 0 0 1 929 0 8,536 9,465 0.867/08 through 6/09 1,432,403 0 0 0 0 0 1,574 1,574 0.117/09 through 6/10 1,741,852 0 0 0 0 0 1,014 1,014 0.067/10 through 6/11 1,692,966 0 0 0 0 0 5,219 5,219 0.317/11 through 6/12 1,784,134 0 0 0 0 0 509 509 0.03
5 YR. TOTAL 7,754,645 0 0 1 929 0 16,852 17,781 0.23INDEMNITY MEDICAL TOTAL
CRED. PURE PREM.* CRED. PURE PREM.* PURE PREM.*Indicated Pure Premium 12% 0.012 15% 0.217 0.23Pure Premium Indicated by National Relativity 44% 1.143 42% 1.662 2.81Pure Premium Present on Rate Level 44% 1.151 43% 1.549 2.70Pure Premium Derived by Formula 1.011 1.397 2.41
CLASS VEGETABLE PACKING & DRIVERS
8209
Industry Group: Goods and Services CONVERTED LOSSESHazard Group: C INDEMNITY LIKELY INDEMNITY NOT-LIKELY MED LIKELY MED NOT-LIKELY TOTAL TOTAL
POLICY PERIOD PAYROLL CASES AMOUNT CASES AMOUNT AMOUNT AMOUNT AMOUNT PURE PREM.7/07 through 6/08 25,986 0 0 0 0 0 0 0 0.007/08 through 6/09 85,164 0 0 0 0 0 0 0 0.007/09 through 6/10 232,363 0 0 1 1,429 0 110 1,539 0.667/10 through 6/11 161,612 0 0 3 45,634 0 82,703 128,337 79.417/11 through 6/12 217,586 0 0 0 0 0 1,114 1,114 0.51
5 YR. TOTAL 722,711 0 0 4 47,063 0 83,927 130,990 18.13INDEMNITY MEDICAL TOTAL
CRED. PURE PREM.* CRED. PURE PREM.* PURE PREM.*Indicated Pure Premium 5% 6.512 7% 11.613 18.13Pure Premium Indicated by National Relativity 47% 1.254 46% 2.239 3.49Pure Premium Present on Rate Level 48% 1.489 47% 2.438 3.93Pure Premium Derived by Formula 1.630 2.989 4.62
CLASS FEED, FERTILIZER, HAY, OR GRAIN DEALER & LOCAL MANAGERS, DRIVERS - NO MFG
8215
Industry Group: Goods and Services CONVERTED LOSSESHazard Group: E INDEMNITY LIKELY INDEMNITY NOT-LIKELY MED LIKELY MED NOT-LIKELY TOTAL TOTAL
POLICY PERIOD PAYROLL CASES AMOUNT CASES AMOUNT AMOUNT AMOUNT AMOUNT PURE PREM.7/07 through 6/08 62,600,261 9 310,667 28 263,293 513,745 662,011 1,749,716 2.807/08 through 6/09 69,824,806 15 752,018 29 388,134 686,484 786,374 2,613,010 3.747/09 through 6/10 72,489,468 4 171,176 51 1,742,989 1,195,260 2,665,370 5,774,795 7.977/10 through 6/11 76,639,695 10 1,655,308 38 698,741 1,120,609 1,554,852 5,029,510 6.567/11 through 6/12 88,145,211 5 375,001 35 607,560 858,792 1,190,129 3,031,482 3.44
5 YR. TOTAL 369,699,441 43 3,264,170 181 3,700,717 4,374,890 6,858,736 18,198,513 4.92INDEMNITY MEDICAL TOTAL
CRED. PURE PREM.* CRED. PURE PREM.* PURE PREM.*Indicated Pure Premium 63% 1.884 95% 3.039 4.92Pure Premium Indicated by National Relativity 18% 1.363 2% 2.038 3.40Pure Premium Present on Rate Level 19% 1.467 3% 3.061 4.53Pure Premium Derived by Formula 1.711 3.020 4.73
Page 153
* Pure Premium per $100 of Payroll** Pure Premium per employee++ Non-Standard Calculation© Copyright 2014 National Council on Compensation Insurance, Inc. All Rights Reserved.

MISSOURI
EFFECTIVE 1/1/2015CLASS CONSTRUCTION OR ERECTION PERMANENT YARD
8227
Industry Group: Contracting CONVERTED LOSSESHazard Group: G INDEMNITY LIKELY INDEMNITY NOT-LIKELY MED LIKELY MED NOT-LIKELY TOTAL TOTAL
POLICY PERIOD PAYROLL CASES AMOUNT CASES AMOUNT AMOUNT AMOUNT AMOUNT PURE PREM.7/07 through 6/08 110,843,998 11 714,437 30 305,587 2,064,636 541,195 3,625,855 3.277/08 through 6/09 103,866,867 1 50,242 34 588,951 53,340 1,144,055 1,836,588 1.777/09 through 6/10 87,970,511 4 318,136 26 945,193 507,704 1,054,772 2,825,805 3.217/10 through 6/11 86,111,678 10 928,618 40 1,173,106 1,750,247 2,058,658 5,910,629 6.867/11 through 6/12 84,170,585 7 514,004 24 516,262 504,029 886,587 2,420,882 2.88
5 YR. TOTAL 472,963,639 33 2,525,437 154 3,529,099 4,879,956 5,685,267 16,619,759 3.51INDEMNITY MEDICAL TOTAL
CRED. PURE PREM.* CRED. PURE PREM.* PURE PREM.*Indicated Pure Premium 68% 1.280 93% 2.234 3.51Pure Premium Indicated by National Relativity 16% 1.562 3% 2.273 3.84Pure Premium Present on Rate Level 16% 1.454 4% 2.330 3.78Pure Premium Derived by Formula 1.353 2.239 3.59
CLASS LUMBERYARD NEW MATERIALS ONLY: ALL OTHER EMPLOYEES & YARD, WAREHOUSE,
8232 DRIVERS
Industry Group: Goods and Services CONVERTED LOSSESHazard Group: E INDEMNITY LIKELY INDEMNITY NOT-LIKELY MED LIKELY MED NOT-LIKELY TOTAL TOTAL
POLICY PERIOD PAYROLL CASES AMOUNT CASES AMOUNT AMOUNT AMOUNT AMOUNT PURE PREM.7/07 through 6/08 239,314,025 40 2,594,455 182 3,016,233 3,634,089 5,849,763 15,094,540 6.317/08 through 6/09 207,707,372 33 1,741,975 181 2,986,060 1,860,914 4,675,496 11,264,445 5.427/09 through 6/10 202,576,768 37 2,356,455 150 3,205,095 4,102,184 4,783,910 14,447,644 7.137/10 through 6/11 210,714,235 46 3,025,585 152 3,099,942 4,410,699 5,307,744 15,843,970 7.527/11 through 6/12 211,968,832 34 1,715,902 155 2,616,269 2,341,690 4,553,064 11,226,925 5.30
5 YR. TOTAL 1,072,281,232 190 11,434,372 820 14,923,599 16,349,576 25,169,977 67,877,524 6.33INDEMNITY MEDICAL TOTAL
CRED. PURE PREM.* CRED. PURE PREM.* PURE PREM.*Indicated Pure Premium 100% 2.458 100% 3.872 6.33Pure Premium Indicated by National Relativity 0% 1.643 0% 2.551 4.19Pure Premium Present on Rate Level 0% 2.430 0% 3.444 5.87Pure Premium Derived by Formula 2.458 3.872 6.33
CLASS COAL MERCHANT & LOCAL MANAGERS, DRIVERS
8233
Industry Group: Goods and Services CONVERTED LOSSESHazard Group: E INDEMNITY LIKELY INDEMNITY NOT-LIKELY MED LIKELY MED NOT-LIKELY TOTAL TOTAL
POLICY PERIOD PAYROLL CASES AMOUNT CASES AMOUNT AMOUNT AMOUNT AMOUNT PURE PREM.7/07 through 6/08 0 0 0 0 0 0 0 0 0.007/08 through 6/09 0 0 0 0 0 0 0 0 0.007/09 through 6/10 710,590 0 0 0 0 0 0 0 0.007/10 through 6/11 437,720 0 0 0 0 0 0 0 0.007/11 through 6/12 1,094,051 0 0 0 0 0 10,816 10,816 0.99
5 YR. TOTAL 2,242,361 0 0 0 0 0 10,816 10,816 0.48INDEMNITY MEDICAL TOTAL
CRED. PURE PREM.* CRED. PURE PREM.* PURE PREM.*Indicated Pure Premium 9% 0.000 9% 0.482 0.48Pure Premium Indicated by National Relativity 45% 1.365 45% 1.308 2.67Pure Premium Present on Rate Level 46% 1.665 46% 1.403 3.07Pure Premium Derived by Formula 1.380 1.277 2.66
Page 154
* Pure Premium per $100 of Payroll** Pure Premium per employee++ Non-Standard Calculation© Copyright 2014 National Council on Compensation Insurance, Inc. All Rights Reserved.

MISSOURI
EFFECTIVE 1/1/2015CLASS SASH, DOOR OR ASSEMBLED MILLWORK DEALER & DRIVERS
8235
Industry Group: Goods and Services CONVERTED LOSSESHazard Group: C INDEMNITY LIKELY INDEMNITY NOT-LIKELY MED LIKELY MED NOT-LIKELY TOTAL TOTAL
POLICY PERIOD PAYROLL CASES AMOUNT CASES AMOUNT AMOUNT AMOUNT AMOUNT PURE PREM.7/07 through 6/08 16,186,419 1 2,767 11 155,118 0 309,680 467,565 2.897/08 through 6/09 11,790,475 1 9,115 10 129,606 1,531 197,636 337,888 2.877/09 through 6/10 10,452,925 0 0 2 34,460 0 33,862 68,322 0.657/10 through 6/11 11,138,718 2 81,041 9 59,254 44,738 139,964 324,997 2.927/11 through 6/12 10,797,499 2 114,811 7 133,740 80,479 214,369 543,399 5.03
5 YR. TOTAL 60,366,036 6 207,734 39 512,178 126,748 895,511 1,742,171 2.89INDEMNITY MEDICAL TOTAL
CRED. PURE PREM.* CRED. PURE PREM.* PURE PREM.*Indicated Pure Premium 29% 1.193 39% 1.693 2.89Pure Premium Indicated by National Relativity 35% 1.470 30% 2.292 3.76Pure Premium Present on Rate Level 36% 1.285 31% 2.013 3.30Pure Premium Derived by Formula 1.323 1.972 3.30
CLASS JUNK DEALER & DRIVERS
8263
Industry Group: Goods and Services CONVERTED LOSSESHazard Group: D INDEMNITY LIKELY INDEMNITY NOT-LIKELY MED LIKELY MED NOT-LIKELY TOTAL TOTAL
POLICY PERIOD PAYROLL CASES AMOUNT CASES AMOUNT AMOUNT AMOUNT AMOUNT PURE PREM.7/07 through 6/08 2,670,061 1 1,070 3 13,411 0 37,391 51,872 1.947/08 through 6/09 3,756,203 0 0 4 13,227 0 84,751 97,978 2.617/09 through 6/10 5,024,253 2 113,004 6 23,495 46,818 57,443 240,760 4.797/10 through 6/11 2,463,605 0 0 6 197,682 0 148,646 346,328 14.067/11 through 6/12 2,847,362 0 0 0 0 0 9,781 9,781 0.34
5 YR. TOTAL 16,761,484 3 114,074 19 247,815 46,818 338,012 746,719 4.46INDEMNITY MEDICAL TOTAL
CRED. PURE PREM.* CRED. PURE PREM.* PURE PREM.*Indicated Pure Premium 24% 2.159 31% 2.296 4.46Pure Premium Indicated by National Relativity 38% 2.219 34% 5.508 7.73Pure Premium Present on Rate Level 38% 2.888 35% 4.200 7.09Pure Premium Derived by Formula 2.459 4.054 6.51
CLASS BOTTLE DEALER-USED & DRIVERS
8264
Industry Group: Goods and Services CONVERTED LOSSESHazard Group: E INDEMNITY LIKELY INDEMNITY NOT-LIKELY MED LIKELY MED NOT-LIKELY TOTAL TOTAL
POLICY PERIOD PAYROLL CASES AMOUNT CASES AMOUNT AMOUNT AMOUNT AMOUNT PURE PREM.7/07 through 6/08 11,450,322 3 504,170 15 204,328 352,209 353,723 1,414,430 12.357/08 through 6/09 11,993,198 2 51,743 6 45,109 195,674 150,335 442,861 3.697/09 through 6/10 10,321,399 1 2,640 6 19,098 845 112,477 135,060 1.317/10 through 6/11 14,343,194 2 195,694 19 295,256 141,884 563,302 1,196,136 8.347/11 through 6/12 20,100,897 1 133,514 14 229,788 197,700 442,919 1,003,921 4.99
5 YR. TOTAL 68,209,010 9 887,761 60 793,579 888,312 1,622,756 4,192,408 6.15INDEMNITY MEDICAL TOTAL
CRED. PURE PREM.* CRED. PURE PREM.* PURE PREM.*Indicated Pure Premium 38% 2.465 50% 3.681 6.15Pure Premium Indicated by National Relativity 31% 1.975 25% 3.342 5.32Pure Premium Present on Rate Level 31% 2.220 25% 3.279 5.50Pure Premium Derived by Formula 2.237 3.496 5.73
Page 155
* Pure Premium per $100 of Payroll** Pure Premium per employee++ Non-Standard Calculation© Copyright 2014 National Council on Compensation Insurance, Inc. All Rights Reserved.

MISSOURI
EFFECTIVE 1/1/2015CLASS IRON OR STEEL SCRAP DEALER & DRIVERS
8265
Industry Group: Goods and Services CONVERTED LOSSESHazard Group: F INDEMNITY LIKELY INDEMNITY NOT-LIKELY MED LIKELY MED NOT-LIKELY TOTAL TOTAL
POLICY PERIOD PAYROLL CASES AMOUNT CASES AMOUNT AMOUNT AMOUNT AMOUNT PURE PREM.7/07 through 6/08 40,690,998 8 1,071,052 31 926,042 1,126,564 1,218,562 4,342,220 10.677/08 through 6/09 30,184,866 8 92,454 14 352,073 242,388 650,478 1,337,393 4.437/09 through 6/10 32,381,633 3 139,732 28 309,173 809,211 781,861 2,039,977 6.307/10 through 6/11 40,354,479 7 601,635 29 529,049 680,584 1,628,927 3,440,195 8.537/11 through 6/12 39,262,997 10 386,470 26 1,465,809 617,826 1,265,177 3,735,282 9.51
5 YR. TOTAL 182,874,973 36 2,291,343 128 3,582,146 3,476,573 5,545,005 14,895,067 8.15INDEMNITY MEDICAL TOTAL
CRED. PURE PREM.* CRED. PURE PREM.* PURE PREM.*Indicated Pure Premium 61% 3.212 84% 4.933 8.15Pure Premium Indicated by National Relativity 19% 1.992 8% 3.538 5.53Pure Premium Present on Rate Level 20% 2.688 8% 4.580 7.27Pure Premium Derived by Formula 2.875 4.793 7.67
CLASS STABLE OR BREEDING FARM & DRIVERS
8279
Industry Group: Goods and Services CONVERTED LOSSESHazard Group: F INDEMNITY LIKELY INDEMNITY NOT-LIKELY MED LIKELY MED NOT-LIKELY TOTAL TOTAL
POLICY PERIOD PAYROLL CASES AMOUNT CASES AMOUNT AMOUNT AMOUNT AMOUNT PURE PREM.7/07 through 6/08 4,120,086 0 0 6 20,937 0 55,511 76,448 1.867/08 through 6/09 5,703,591 0 0 3 14,234 0 39,536 53,770 0.947/09 through 6/10 6,099,437 0 0 5 24,708 0 88,366 113,074 1.857/10 through 6/11 6,248,117 2 51,538 8 117,644 81,927 212,027 463,136 7.417/11 through 6/12 5,363,625 0 0 5 50,061 0 287,592 337,653 6.30
5 YR. TOTAL 27,534,856 2 51,538 27 227,584 81,927 683,032 1,044,081 3.79INDEMNITY MEDICAL TOTAL
CRED. PURE PREM.* CRED. PURE PREM.* PURE PREM.*Indicated Pure Premium 24% 1.014 35% 2.778 3.79Pure Premium Indicated by National Relativity 38% 2.075 32% 3.990 6.07Pure Premium Present on Rate Level 38% 1.804 33% 3.424 5.23Pure Premium Derived by Formula 1.717 3.379 5.10
CLASS LIVESTOCK DEALER OR COMMISSION MERCHANT & SALESPERSONS, DRIVERS
8288
Industry Group: Goods and Services CONVERTED LOSSESHazard Group: E INDEMNITY LIKELY INDEMNITY NOT-LIKELY MED LIKELY MED NOT-LIKELY TOTAL TOTAL
POLICY PERIOD PAYROLL CASES AMOUNT CASES AMOUNT AMOUNT AMOUNT AMOUNT PURE PREM.7/07 through 6/08 11,870,446 1 13,061 15 111,659 74,989 296,985 496,694 4.197/08 through 6/09 12,141,691 3 49,833 21 182,912 286,493 712,759 1,231,997 10.157/09 through 6/10 12,733,555 3 60,305 21 244,665 80,519 638,835 1,024,324 8.047/10 through 6/11 14,310,983 3 75,585 18 94,946 137,648 623,875 932,054 6.517/11 through 6/12 14,860,341 1 5,304 21 984,019 14,691 715,805 1,719,819 11.57
5 YR. TOTAL 65,917,016 11 204,088 96 1,618,201 594,340 2,988,259 5,404,888 8.20INDEMNITY MEDICAL TOTAL
CRED. PURE PREM.* CRED. PURE PREM.* PURE PREM.*Indicated Pure Premium 35% 2.765 58% 5.435 8.20Pure Premium Indicated by National Relativity 32% 1.888 21% 4.400 6.29Pure Premium Present on Rate Level 33% 1.887 21% 5.048 6.94Pure Premium Derived by Formula 2.195 5.136 7.33
Page 156
* Pure Premium per $100 of Payroll** Pure Premium per employee++ Non-Standard Calculation© Copyright 2014 National Council on Compensation Insurance, Inc. All Rights Reserved.

MISSOURI
EFFECTIVE 1/1/2015CLASS STORAGE WAREHOUSE-COLD
8291
Industry Group: Goods and Services CONVERTED LOSSESHazard Group: D INDEMNITY LIKELY INDEMNITY NOT-LIKELY MED LIKELY MED NOT-LIKELY TOTAL TOTAL
POLICY PERIOD PAYROLL CASES AMOUNT CASES AMOUNT AMOUNT AMOUNT AMOUNT PURE PREM.7/07 through 6/08 20,995,615 0 0 10 196,356 0 472,304 668,660 3.197/08 through 6/09 16,584,786 1 41,317 3 34,790 33,950 163,162 273,219 1.657/09 through 6/10 18,312,437 3 104,922 10 128,036 69,900 239,527 542,385 2.967/10 through 6/11 16,247,751 2 121,112 11 163,232 145,422 243,023 672,789 4.147/11 through 6/12 17,221,309 1 17,388 6 125,062 20,316 173,443 336,209 1.95
5 YR. TOTAL 89,361,898 7 284,739 40 647,476 269,588 1,291,459 2,493,262 2.79INDEMNITY MEDICAL TOTAL
CRED. PURE PREM.* CRED. PURE PREM.* PURE PREM.*Indicated Pure Premium 34% 1.043 47% 1.747 2.79Pure Premium Indicated by National Relativity 33% 1.442 26% 2.219 3.66Pure Premium Present on Rate Level 33% 1.340 27% 2.205 3.55Pure Premium Derived by Formula 1.273 1.993 3.27
CLASS STORAGE WAREHOUSE NOC
8292
Industry Group: Goods and Services CONVERTED LOSSESHazard Group: C INDEMNITY LIKELY INDEMNITY NOT-LIKELY MED LIKELY MED NOT-LIKELY TOTAL TOTAL
POLICY PERIOD PAYROLL CASES AMOUNT CASES AMOUNT AMOUNT AMOUNT AMOUNT PURE PREM.7/07 through 6/08 122,012,635 24 569,224 107 1,033,111 707,778 2,065,430 4,375,543 3.597/08 through 6/09 102,904,637 12 519,816 64 679,264 780,409 1,209,466 3,188,955 3.107/09 through 6/10 98,011,682 17 542,627 76 767,296 563,187 1,861,412 3,734,522 3.817/10 through 6/11 94,602,810 9 1,383,026 72 768,839 680,823 1,194,225 4,026,913 4.267/11 through 6/12 97,431,742 10 215,241 67 853,473 113,854 1,363,247 2,545,815 2.61
5 YR. TOTAL 514,963,506 72 3,229,934 386 4,101,983 2,846,051 7,693,780 17,871,748 3.47INDEMNITY MEDICAL TOTAL
CRED. PURE PREM.* CRED. PURE PREM.* PURE PREM.*Indicated Pure Premium 71% 1.424 97% 2.047 3.47Pure Premium Indicated by National Relativity 14% 1.202 1% 1.991 3.19Pure Premium Present on Rate Level 15% 1.411 2% 2.324 3.74Pure Premium Derived by Formula 1.391 2.052 3.44
CLASS STORAGE WAREHOUSE-FURNITURE & DRIVERS
8293
Industry Group: Goods and Services CONVERTED LOSSESHazard Group: E INDEMNITY LIKELY INDEMNITY NOT-LIKELY MED LIKELY MED NOT-LIKELY TOTAL TOTAL
POLICY PERIOD PAYROLL CASES AMOUNT CASES AMOUNT AMOUNT AMOUNT AMOUNT PURE PREM.7/07 through 6/08 151,605,250 55 4,089,113 175 3,181,416 3,704,102 4,472,943 15,447,574 10.197/08 through 6/09 104,420,751 36 2,909,042 119 2,061,142 2,704,992 2,830,423 10,505,599 10.067/09 through 6/10 112,044,229 31 1,886,042 127 2,431,070 1,868,157 3,746,872 9,932,141 8.867/10 through 6/11 106,992,906 29 2,118,540 124 2,143,070 2,400,479 3,116,961 9,779,050 9.147/11 through 6/12 96,509,005 18 1,451,560 105 1,826,736 2,024,912 3,155,299 8,458,507 8.77
5 YR. TOTAL 571,572,141 169 12,454,297 650 11,643,434 12,702,642 17,322,498 54,122,871 9.47INDEMNITY MEDICAL TOTAL
CRED. PURE PREM.* CRED. PURE PREM.* PURE PREM.*Indicated Pure Premium 100% 4.216 100% 5.253 9.47Pure Premium Indicated by National Relativity 0% 3.356 0% 4.734 8.09Pure Premium Present on Rate Level 0% 3.958 0% 4.612 8.57Pure Premium Derived by Formula 4.216 5.253 9.47
Page 157
* Pure Premium per $100 of Payroll** Pure Premium per employee++ Non-Standard Calculation© Copyright 2014 National Council on Compensation Insurance, Inc. All Rights Reserved.

MISSOURI
EFFECTIVE 1/1/2015CLASS GRAIN ELEVATOR OPERATION & LOCAL MANAGERS, DRIVERS
8304
Industry Group: Goods and Services CONVERTED LOSSESHazard Group: E INDEMNITY LIKELY INDEMNITY NOT-LIKELY MED LIKELY MED NOT-LIKELY TOTAL TOTAL
POLICY PERIOD PAYROLL CASES AMOUNT CASES AMOUNT AMOUNT AMOUNT AMOUNT PURE PREM.7/07 through 6/08 17,291,217 2 3,042 13 674,014 1,396 319,161 997,613 5.777/08 through 6/09 22,276,072 2 56,744 10 119,405 30,852 1,121,712 1,328,713 5.977/09 through 6/10 17,488,594 3 98,210 11 371,145 382,667 587,214 1,439,236 8.237/10 through 6/11 19,481,024 2 59,161 5 90,199 51,479 157,386 358,225 1.847/11 through 6/12 23,218,894 1 9,547 4 78,200 3,700 197,888 289,335 1.25
5 YR. TOTAL 99,755,801 10 226,704 43 1,332,963 470,094 2,383,361 4,413,122 4.42INDEMNITY MEDICAL TOTAL
CRED. PURE PREM.* CRED. PURE PREM.* PURE PREM.*Indicated Pure Premium 47% 1.563 55% 2.860 4.42Pure Premium Indicated by National Relativity 26% 1.953 22% 3.163 5.12Pure Premium Present on Rate Level 27% 2.612 23% 2.875 5.49Pure Premium Derived by Formula 1.948 2.930 4.88
CLASS GASOLINE DEALER & DRIVERS
8350
Industry Group: Goods and Services CONVERTED LOSSESHazard Group: F INDEMNITY LIKELY INDEMNITY NOT-LIKELY MED LIKELY MED NOT-LIKELY TOTAL TOTAL
POLICY PERIOD PAYROLL CASES AMOUNT CASES AMOUNT AMOUNT AMOUNT AMOUNT PURE PREM.7/07 through 6/08 58,870,184 10 358,993 44 926,720 348,372 828,921 2,463,006 4.187/08 through 6/09 60,308,225 7 197,343 41 561,182 284,538 974,070 2,017,133 3.357/09 through 6/10 63,319,836 8 316,842 34 758,930 233,788 1,155,685 2,465,245 3.897/10 through 6/11 59,415,842 13 462,319 37 1,009,926 659,588 1,592,638 3,724,471 6.277/11 through 6/12 58,976,463 5 1,337,523 26 1,087,943 1,272,049 670,422 4,367,937 7.41
5 YR. TOTAL 300,890,550 43 2,673,020 182 4,344,701 2,798,335 5,221,736 15,037,792 5.00INDEMNITY MEDICAL TOTAL
CRED. PURE PREM.* CRED. PURE PREM.* PURE PREM.*Indicated Pure Premium 71% 2.332 88% 2.665 5.00Pure Premium Indicated by National Relativity 14% 2.357 6% 2.975 5.33Pure Premium Present on Rate Level 15% 2.436 6% 3.109 5.55Pure Premium Derived by Formula 2.351 2.710 5.06
CLASS GAS DEALER - LPG & SALESPERSONS, DRIVERS
8353
Industry Group: Goods and Services CONVERTED LOSSESHazard Group: E INDEMNITY LIKELY INDEMNITY NOT-LIKELY MED LIKELY MED NOT-LIKELY TOTAL TOTAL
POLICY PERIOD PAYROLL CASES AMOUNT CASES AMOUNT AMOUNT AMOUNT AMOUNT PURE PREM.7/07 through 6/08 25,396,713 3 207,973 20 345,948 639,900 514,148 1,707,969 6.737/08 through 6/09 24,040,266 2 104,378 18 461,221 187,500 400,050 1,153,149 4.807/09 through 6/10 22,085,078 1 3,898 10 373,031 10,602 590,067 977,598 4.437/10 through 6/11 25,041,858 4 960,962 8 76,514 175,827 267,605 1,480,908 5.917/11 through 6/12 24,084,354 0 0 16 217,730 0 499,827 717,557 2.98
5 YR. TOTAL 120,648,269 10 1,277,211 72 1,474,444 1,013,829 2,271,697 6,037,181 5.00INDEMNITY MEDICAL TOTAL
CRED. PURE PREM.* CRED. PURE PREM.* PURE PREM.*Indicated Pure Premium 46% 2.281 55% 2.723 5.00Pure Premium Indicated by National Relativity 27% 1.333 22% 2.257 3.59Pure Premium Present on Rate Level 27% 2.022 23% 2.425 4.45Pure Premium Derived by Formula 1.955 2.552 4.51
Page 158
* Pure Premium per $100 of Payroll** Pure Premium per employee++ Non-Standard Calculation© Copyright 2014 National Council on Compensation Insurance, Inc. All Rights Reserved.

MISSOURI
EFFECTIVE 1/1/2015CLASS TRUCKING: MECHANICS AND GARAGE EMPLOYEES
8370
Industry Group: Goods and Services CONVERTED LOSSESHazard Group: E INDEMNITY LIKELY INDEMNITY NOT-LIKELY MED LIKELY MED NOT-LIKELY TOTAL TOTAL
POLICY PERIOD PAYROLL CASES AMOUNT CASES AMOUNT AMOUNT AMOUNT AMOUNT PURE PREM.7/07 through 6/08 31,836,433 7 405,694 22 251,910 960,063 410,477 2,028,144 6.377/08 through 6/09 25,243,170 1 21,786 23 828,726 0 439,760 1,290,272 5.117/09 through 6/10 33,315,628 6 848,731 11 150,998 677,595 197,513 1,874,837 5.637/10 through 6/11 33,844,205 1 125,769 18 146,963 363,117 294,781 930,630 2.757/11 through 6/12 31,733,670 2 103,261 17 345,822 88,775 483,643 1,021,501 3.22
5 YR. TOTAL 155,973,106 17 1,505,241 91 1,724,419 2,089,550 1,826,174 7,145,384 4.58INDEMNITY MEDICAL TOTAL
CRED. PURE PREM.* CRED. PURE PREM.* PURE PREM.*Indicated Pure Premium 50% 2.071 55% 2.511 4.58Pure Premium Indicated by National Relativity 19% 2.907 20% 0.856 3.76Pure Premium Present on Rate Level 31% 1.979 25% 1.817 3.80Pure Premium Derived by Formula 2.201 2.007 4.21
CLASS GASOLINE STATION:SELF-SERVICE ONLY-RETAIL
8381
Industry Group: Goods and Services CONVERTED LOSSESHazard Group: D INDEMNITY LIKELY INDEMNITY NOT-LIKELY MED LIKELY MED NOT-LIKELY TOTAL TOTAL
POLICY PERIOD PAYROLL CASES AMOUNT CASES AMOUNT AMOUNT AMOUNT AMOUNT PURE PREM.7/07 through 6/08 42,992,290 3 22,778 20 141,738 10,703 644,826 820,045 1.917/08 through 6/09 42,587,493 5 282,523 18 49,114 60,444 328,488 720,569 1.697/09 through 6/10 42,901,134 5 84,069 16 135,097 143,826 357,354 720,346 1.687/10 through 6/11 41,605,547 4 229,118 20 128,887 499,856 415,614 1,273,475 3.067/11 through 6/12 40,830,257 3 139,551 15 362,939 315,485 1,108,616 1,926,591 4.72
5 YR. TOTAL 210,916,721 20 758,039 89 817,775 1,030,314 2,854,898 5,461,026 2.59INDEMNITY MEDICAL TOTAL
CRED. PURE PREM.* CRED. PURE PREM.* PURE PREM.*Indicated Pure Premium 35% 0.747 53% 1.842 2.59Pure Premium Indicated by National Relativity 32% 0.633 23% 1.212 1.85Pure Premium Present on Rate Level 33% 0.600 24% 1.250 1.85Pure Premium Derived by Formula 0.662 1.555 2.22
CLASS BUS CO.: GARAGE EMPLOYEES
8385
Industry Group: Goods and Services CONVERTED LOSSESHazard Group: E INDEMNITY LIKELY INDEMNITY NOT-LIKELY MED LIKELY MED NOT-LIKELY TOTAL TOTAL
POLICY PERIOD PAYROLL CASES AMOUNT CASES AMOUNT AMOUNT AMOUNT AMOUNT PURE PREM.7/07 through 6/08 41,866,264 9 262,224 13 170,103 446,757 303,274 1,182,358 2.827/08 through 6/09 41,885,530 3 22,607 24 523,658 18,030 801,189 1,365,484 3.267/09 through 6/10 40,410,145 1 3,101 17 270,465 2,038 484,525 760,129 1.887/10 through 6/11 39,239,081 4 148,379 22 327,716 173,758 624,213 1,274,066 3.257/11 through 6/12 40,689,639 1 24,374 6 197,728 23,509 248,091 493,702 1.21
5 YR. TOTAL 204,090,659 18 460,685 82 1,489,670 664,092 2,461,292 5,075,739 2.49INDEMNITY MEDICAL TOTAL
CRED. PURE PREM.* CRED. PURE PREM.* PURE PREM.*Indicated Pure Premium 41% 0.956 57% 1.531 2.49Pure Premium Indicated by National Relativity 29% 0.826 21% 1.387 2.21Pure Premium Present on Rate Level 30% 0.926 22% 1.510 2.44Pure Premium Derived by Formula 0.909 1.496 2.41
Page 159
* Pure Premium per $100 of Payroll** Pure Premium per employee++ Non-Standard Calculation© Copyright 2014 National Council on Compensation Insurance, Inc. All Rights Reserved.

MISSOURI
EFFECTIVE 1/1/2015CLASS AUTOMOBILE SERVICE STATION-&DRIVERS
8387
Industry Group: Goods and Services CONVERTED LOSSESHazard Group: D INDEMNITY LIKELY INDEMNITY NOT-LIKELY MED LIKELY MED NOT-LIKELY TOTAL TOTAL
POLICY PERIOD PAYROLL CASES AMOUNT CASES AMOUNT AMOUNT AMOUNT AMOUNT PURE PREM.7/07 through 6/08 149,379,140 23 1,266,362 76 653,521 1,432,692 1,386,563 4,739,138 3.177/08 through 6/09 140,037,578 17 819,728 70 673,932 1,188,454 1,405,963 4,088,077 2.927/09 through 6/10 148,471,094 22 932,661 81 1,017,438 922,025 1,936,948 4,809,072 3.247/10 through 6/11 150,489,811 21 879,153 78 1,727,461 1,450,397 2,005,273 6,062,284 4.037/11 through 6/12 155,186,101 21 995,776 71 872,843 1,591,358 1,932,128 5,392,105 3.47
5 YR. TOTAL 743,563,724 104 4,893,680 376 4,945,195 6,584,926 8,666,875 25,090,676 3.37INDEMNITY MEDICAL TOTAL
CRED. PURE PREM.* CRED. PURE PREM.* PURE PREM.*Indicated Pure Premium 78% 1.323 100% 2.051 3.37Pure Premium Indicated by National Relativity 11% 1.016 0% 1.521 2.54Pure Premium Present on Rate Level 11% 1.258 0% 1.878 3.14Pure Premium Derived by Formula 1.282 2.051 3.33
CLASS AUTOMOBILE REPAIR SHOP & PARTS DEPARTMENT EMPLOYEES, DRIVERS
8391
Industry Group: Goods and Services CONVERTED LOSSESHazard Group: D INDEMNITY LIKELY INDEMNITY NOT-LIKELY MED LIKELY MED NOT-LIKELY TOTAL TOTAL
POLICY PERIOD PAYROLL CASES AMOUNT CASES AMOUNT AMOUNT AMOUNT AMOUNT PURE PREM.7/07 through 6/08 583,407,153 60 2,831,375 251 3,832,130 2,994,077 7,306,792 16,964,374 2.917/08 through 6/09 563,338,008 35 1,540,599 222 3,177,436 2,659,965 5,660,112 13,038,112 2.327/09 through 6/10 576,160,569 42 2,048,596 212 2,600,806 3,852,952 5,253,197 13,755,551 2.397/10 through 6/11 612,007,490 46 2,362,865 240 3,394,388 3,222,649 4,994,852 13,974,754 2.287/11 through 6/12 636,412,041 40 1,722,096 238 4,997,055 1,878,029 6,438,117 15,035,297 2.36
5 YR. TOTAL 2,971,325,261 223 10,505,531 1,163 18,001,815 14,607,672 29,653,070 72,768,088 2.45INDEMNITY MEDICAL TOTAL
CRED. PURE PREM.* CRED. PURE PREM.* PURE PREM.*Indicated Pure Premium 100% 0.959 100% 1.490 2.45Pure Premium Indicated by National Relativity 0% 1.032 0% 1.574 2.61Pure Premium Present on Rate Level 0% 0.933 0% 1.466 2.40Pure Premium Derived by Formula 0.959 1.490 2.45
CLASS AUTOMOBILE STORAGE GARAGE, PARKING LOT OR PARKING STATION, VALET SERVICE,
8392 CASHIERS OR COUNTER PERSONNEL & DRIVERS
Industry Group: Goods and Services CONVERTED LOSSESHazard Group: C INDEMNITY LIKELY INDEMNITY NOT-LIKELY MED LIKELY MED NOT-LIKELY TOTAL TOTAL
POLICY PERIOD PAYROLL CASES AMOUNT CASES AMOUNT AMOUNT AMOUNT AMOUNT PURE PREM.7/07 through 6/08 31,959,115 7 117,924 27 208,246 183,266 295,600 805,036 2.527/08 through 6/09 31,344,075 2 42,766 24 338,506 29,553 550,623 961,448 3.077/09 through 6/10 31,924,220 5 106,119 17 232,518 133,674 642,108 1,114,419 3.497/10 through 6/11 32,447,262 7 126,731 14 180,764 211,288 308,943 827,726 2.557/11 through 6/12 35,919,870 2 45,102 17 269,686 34,383 510,932 860,103 2.39
5 YR. TOTAL 163,594,542 23 438,642 99 1,229,720 592,164 2,308,206 4,568,732 2.79INDEMNITY MEDICAL TOTAL
CRED. PURE PREM.* CRED. PURE PREM.* PURE PREM.*Indicated Pure Premium 38% 1.020 53% 1.773 2.79Pure Premium Indicated by National Relativity 31% 0.619 23% 1.238 1.86Pure Premium Present on Rate Level 31% 0.929 24% 1.573 2.50Pure Premium Derived by Formula 0.867 1.602 2.47
Page 160
* Pure Premium per $100 of Payroll** Pure Premium per employee++ Non-Standard Calculation© Copyright 2014 National Council on Compensation Insurance, Inc. All Rights Reserved.
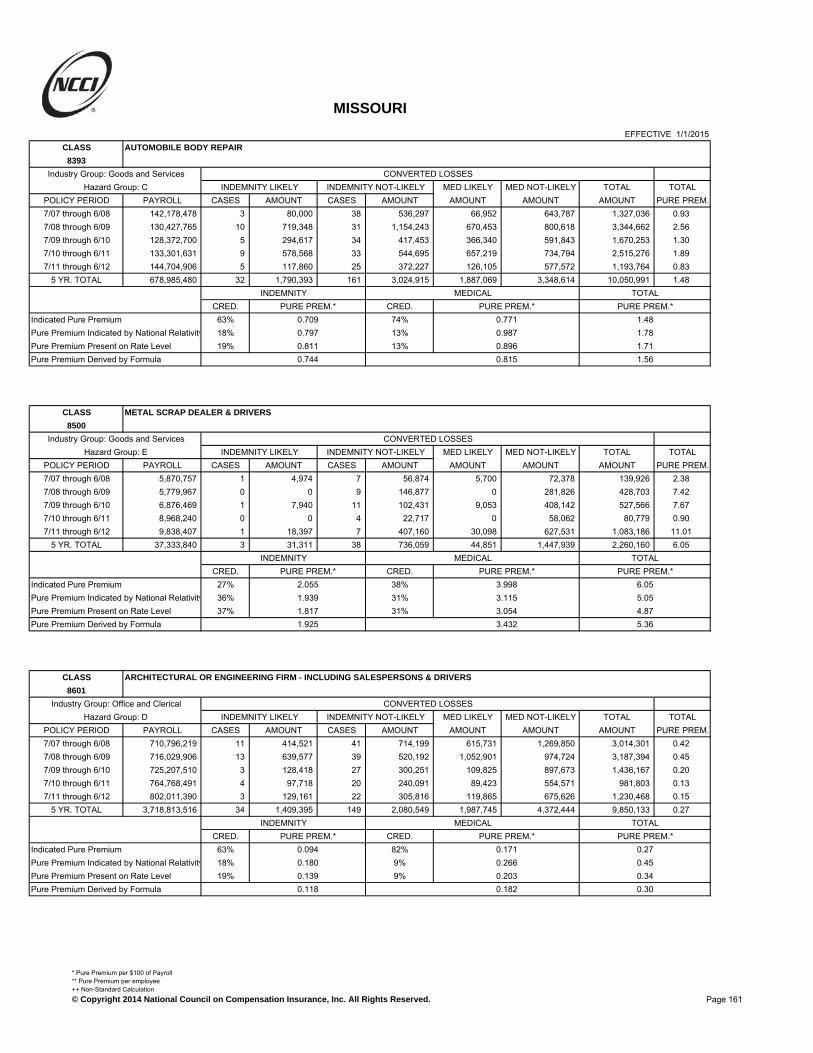
MISSOURI
EFFECTIVE 1/1/2015CLASS AUTOMOBILE BODY REPAIR
8393
Industry Group: Goods and Services CONVERTED LOSSESHazard Group: C INDEMNITY LIKELY INDEMNITY NOT-LIKELY MED LIKELY MED NOT-LIKELY TOTAL TOTAL
POLICY PERIOD PAYROLL CASES AMOUNT CASES AMOUNT AMOUNT AMOUNT AMOUNT PURE PREM.7/07 through 6/08 142,178,478 3 80,000 38 536,297 66,952 643,787 1,327,036 0.937/08 through 6/09 130,427,765 10 719,348 31 1,154,243 670,453 800,618 3,344,662 2.567/09 through 6/10 128,372,700 5 294,617 34 417,453 366,340 591,843 1,670,253 1.307/10 through 6/11 133,301,631 9 578,568 33 544,695 657,219 734,794 2,515,276 1.897/11 through 6/12 144,704,906 5 117,860 25 372,227 126,105 577,572 1,193,764 0.83
5 YR. TOTAL 678,985,480 32 1,790,393 161 3,024,915 1,887,069 3,348,614 10,050,991 1.48INDEMNITY MEDICAL TOTAL
CRED. PURE PREM.* CRED. PURE PREM.* PURE PREM.*Indicated Pure Premium 63% 0.709 74% 0.771 1.48Pure Premium Indicated by National Relativity 18% 0.797 13% 0.987 1.78Pure Premium Present on Rate Level 19% 0.811 13% 0.896 1.71Pure Premium Derived by Formula 0.744 0.815 1.56
CLASS METAL SCRAP DEALER & DRIVERS
8500
Industry Group: Goods and Services CONVERTED LOSSESHazard Group: E INDEMNITY LIKELY INDEMNITY NOT-LIKELY MED LIKELY MED NOT-LIKELY TOTAL TOTAL
POLICY PERIOD PAYROLL CASES AMOUNT CASES AMOUNT AMOUNT AMOUNT AMOUNT PURE PREM.7/07 through 6/08 5,870,757 1 4,974 7 56,874 5,700 72,378 139,926 2.387/08 through 6/09 5,779,967 0 0 9 146,877 0 281,826 428,703 7.427/09 through 6/10 6,876,469 1 7,940 11 102,431 9,053 408,142 527,566 7.677/10 through 6/11 8,968,240 0 0 4 22,717 0 58,062 80,779 0.907/11 through 6/12 9,838,407 1 18,397 7 407,160 30,098 627,531 1,083,186 11.01
5 YR. TOTAL 37,333,840 3 31,311 38 736,059 44,851 1,447,939 2,260,160 6.05INDEMNITY MEDICAL TOTAL
CRED. PURE PREM.* CRED. PURE PREM.* PURE PREM.*Indicated Pure Premium 27% 2.055 38% 3.998 6.05Pure Premium Indicated by National Relativity 36% 1.939 31% 3.115 5.05Pure Premium Present on Rate Level 37% 1.817 31% 3.054 4.87Pure Premium Derived by Formula 1.925 3.432 5.36
CLASS ARCHITECTURAL OR ENGINEERING FIRM - INCLUDING SALESPERSONS & DRIVERS
8601
Industry Group: Office and Clerical CONVERTED LOSSESHazard Group: D INDEMNITY LIKELY INDEMNITY NOT-LIKELY MED LIKELY MED NOT-LIKELY TOTAL TOTAL
POLICY PERIOD PAYROLL CASES AMOUNT CASES AMOUNT AMOUNT AMOUNT AMOUNT PURE PREM.7/07 through 6/08 710,796,219 11 414,521 41 714,199 615,731 1,269,850 3,014,301 0.427/08 through 6/09 716,029,906 13 639,577 39 520,192 1,052,901 974,724 3,187,394 0.457/09 through 6/10 725,207,510 3 128,418 27 300,251 109,825 897,673 1,436,167 0.207/10 through 6/11 764,768,491 4 97,718 20 240,091 89,423 554,571 981,803 0.137/11 through 6/12 802,011,390 3 129,161 22 305,816 119,865 675,626 1,230,468 0.15
5 YR. TOTAL 3,718,813,516 34 1,409,395 149 2,080,549 1,987,745 4,372,444 9,850,133 0.27INDEMNITY MEDICAL TOTAL
CRED. PURE PREM.* CRED. PURE PREM.* PURE PREM.*Indicated Pure Premium 63% 0.094 82% 0.171 0.27Pure Premium Indicated by National Relativity 18% 0.180 9% 0.266 0.45Pure Premium Present on Rate Level 19% 0.139 9% 0.203 0.34Pure Premium Derived by Formula 0.118 0.182 0.30
Page 161
* Pure Premium per $100 of Payroll** Pure Premium per employee++ Non-Standard Calculation© Copyright 2014 National Council on Compensation Insurance, Inc. All Rights Reserved.

MISSOURI
EFFECTIVE 1/1/2015CLASS SURVEYORS, TIMBER CRUISERS, OIL OR GAS GEOLOGISTS OR SCOUTS, & DRIVERS
8602
Industry Group: Office and Clerical CONVERTED LOSSESHazard Group: D INDEMNITY LIKELY INDEMNITY NOT-LIKELY MED LIKELY MED NOT-LIKELY TOTAL TOTAL
POLICY PERIOD PAYROLL CASES AMOUNT CASES AMOUNT AMOUNT AMOUNT AMOUNT PURE PREM.7/07 through 6/08 0 0 0 0 0 0 0 0 0.007/08 through 6/09 0 0 0 0 0 0 0 0 0.007/09 through 6/10 2,848,851 0 0 0 0 0 1,245 1,245 0.047/10 through 6/11 12,476,813 0 0 0 0 0 772 772 0.017/11 through 6/12 11,289,286 0 0 0 0 0 13,021 13,021 0.12
5 YR. TOTAL 26,614,950 0 0 0 0 0 15,038 15,038 0.06INDEMNITY MEDICAL TOTAL
CRED. PURE PREM.* CRED. PURE PREM.* PURE PREM.*Indicated Pure Premium 9% 0.000 12% 0.057 0.06Pure Premium Indicated by National Relativity 39% 0.558 41% 0.777 1.34Pure Premium Present on Rate Level 52% 0.158 47% 0.212 0.37Pure Premium Derived by Formula 0.300 0.425 0.73
CLASS ARCHITECTURAL OR ENGINEERING FIRM - CLERICAL
8603
Industry Group: Office and Clerical CONVERTED LOSSESHazard Group: C INDEMNITY LIKELY INDEMNITY NOT-LIKELY MED LIKELY MED NOT-LIKELY TOTAL TOTAL
POLICY PERIOD PAYROLL CASES AMOUNT CASES AMOUNT AMOUNT AMOUNT AMOUNT PURE PREM.7/07 through 6/08 0 0 0 0 0 0 0 0 0.007/08 through 6/09 0 0 0 0 0 0 0 0 0.007/09 through 6/10 90,405,520 0 0 0 0 0 0 0 0.007/10 through 6/11 255,242,807 0 0 1 10,179 0 47,041 57,220 0.027/11 through 6/12 258,419,147 0 0 1 51,619 0 47,394 99,013 0.04
5 YR. TOTAL 604,067,474 0 0 2 61,798 0 94,435 156,233 0.03INDEMNITY MEDICAL TOTAL
CRED. PURE PREM.* CRED. PURE PREM.* PURE PREM.*Indicated Pure Premium 20% 0.010 26% 0.016 0.03Pure Premium Indicated by National Relativity 25% 0.024 26% 0.049 0.07Pure Premium Present on Rate Level 55% 0.048 48% 0.072 0.12Pure Premium Derived by Formula 0.034 0.051 0.09
CLASS GEOPHYSICAL EXPLORATION - ALL EMPLOYEES & DRIVERS
8606
Industry Group: Goods and Services CONVERTED LOSSESHazard Group: F INDEMNITY LIKELY INDEMNITY NOT-LIKELY MED LIKELY MED NOT-LIKELY TOTAL TOTAL
POLICY PERIOD PAYROLL CASES AMOUNT CASES AMOUNT AMOUNT AMOUNT AMOUNT PURE PREM.7/07 through 6/08 446,509 0 0 0 0 0 0 0 0.007/08 through 6/09 320,210 0 0 0 0 0 0 0 0.007/09 through 6/10 266,256 0 0 0 0 0 496 496 0.197/10 through 6/11 194,492 0 0 0 0 0 0 0 0.007/11 through 6/12 82,146 0 0 0 0 0 0 0 0.00
5 YR. TOTAL 1,309,613 0 0 0 0 0 496 496 0.04INDEMNITY MEDICAL TOTAL
CRED. PURE PREM.* CRED. PURE PREM.* PURE PREM.*Indicated Pure Premium 6% 0.000 7% 0.038 0.04Pure Premium Indicated by National Relativity 40% 1.244 42% 1.741 2.99Pure Premium Present on Rate Level 54% 1.157 51% 1.335 2.49Pure Premium Derived by Formula 1.122 1.415 2.54
Page 162
* Pure Premium per $100 of Payroll** Pure Premium per employee++ Non-Standard Calculation© Copyright 2014 National Council on Compensation Insurance, Inc. All Rights Reserved.

MISSOURI
EFFECTIVE 1/1/2015CLASS STEVEDORING: TALLIERS AND CHECKING CLERKS ENGAGED IN CONNECTION WITH
8719 STEVEDORE WORK
Industry Group: Goods and Services CONVERTED LOSSESHazard Group: G INDEMNITY LIKELY INDEMNITY NOT-LIKELY MED LIKELY MED NOT-LIKELY TOTAL TOTAL
POLICY PERIOD PAYROLL CASES AMOUNT CASES AMOUNT AMOUNT AMOUNT AMOUNT PURE PREM.7/07 through 6/08 25,070 0 0 0 0 0 0 0 0.007/08 through 6/09 0 0 0 0 0 0 0 0 0.007/09 through 6/10 61,430 0 0 0 0 0 0 0 0.007/10 through 6/11 133,097 0 0 0 0 0 0 0 0.007/11 through 6/12 164,834 0 0 0 0 0 0 0 0.00
5 YR. TOTAL 384,431 0 0 0 0 0 0 0 0.00INDEMNITY MEDICAL TOTAL
CRED. PURE PREM.* CRED. PURE PREM.* PURE PREM.*Indicated Pure Premium 4% 0.000 5% 0.000 0.00Pure Premium Indicated by National Relativity 26% 1.245 27% 1.939 3.18Pure Premium Present on Rate Level 70% 1.306 68% 1.945 3.25Pure Premium Derived by Formula 1.238 1.846 3.08
CLASS INSPECTION OF RISKS FOR INSURANCE OR EVALUATION PURPOSES NOC
8720
Industry Group: Goods and Services CONVERTED LOSSESHazard Group: E INDEMNITY LIKELY INDEMNITY NOT-LIKELY MED LIKELY MED NOT-LIKELY TOTAL TOTAL
POLICY PERIOD PAYROLL CASES AMOUNT CASES AMOUNT AMOUNT AMOUNT AMOUNT PURE PREM.7/07 through 6/08 63,122,064 5 116,541 9 389,475 105,981 758,562 1,370,559 2.177/08 through 6/09 59,159,468 2 7,555 3 17,255 2,660 70,808 98,278 0.177/09 through 6/10 62,768,128 4 419,821 10 338,956 741,491 634,207 2,134,475 3.407/10 through 6/11 67,514,998 2 86,241 12 470,344 59,980 788,414 1,404,979 2.087/11 through 6/12 79,588,148 4 295,145 13 337,438 309,369 537,009 1,478,961 1.86
5 YR. TOTAL 332,152,806 17 925,303 47 1,553,468 1,219,481 2,789,000 6,487,252 1.95INDEMNITY MEDICAL TOTAL
CRED. PURE PREM.* CRED. PURE PREM.* PURE PREM.*Indicated Pure Premium 43% 0.746 58% 1.207 1.95Pure Premium Indicated by National Relativity 28% 0.628 21% 0.829 1.46Pure Premium Present on Rate Level 29% 0.632 21% 0.993 1.63Pure Premium Derived by Formula 0.680 1.083 1.76
CLASS REAL ESTATE APPRAISAL COMPANIES-OUTSIDE EMPLOYEES
8721
Industry Group: Office and Clerical CONVERTED LOSSESHazard Group: E INDEMNITY LIKELY INDEMNITY NOT-LIKELY MED LIKELY MED NOT-LIKELY TOTAL TOTAL
POLICY PERIOD PAYROLL CASES AMOUNT CASES AMOUNT AMOUNT AMOUNT AMOUNT PURE PREM.7/07 through 6/08 17,309,902 0 0 0 0 0 4,708 4,708 0.037/08 through 6/09 17,155,379 0 0 1 11,185 0 35,919 47,104 0.277/09 through 6/10 16,809,106 1 38,517 1 54,843 13,874 41,742 148,976 0.897/10 through 6/11 19,402,970 0 0 1 5,009 0 10,345 15,354 0.087/11 through 6/12 23,027,242 0 0 1 13,909 0 13,151 27,060 0.12
5 YR. TOTAL 93,704,599 1 38,517 4 84,946 13,874 105,865 243,202 0.26INDEMNITY MEDICAL TOTAL
CRED. PURE PREM.* CRED. PURE PREM.* PURE PREM.*Indicated Pure Premium 13% 0.132 17% 0.128 0.26Pure Premium Indicated by National Relativity 32% 0.108 34% 0.225 0.33Pure Premium Present on Rate Level 55% 0.107 49% 0.161 0.27Pure Premium Derived by Formula 0.111 0.177 0.29
Page 163
* Pure Premium per $100 of Payroll** Pure Premium per employee++ Non-Standard Calculation© Copyright 2014 National Council on Compensation Insurance, Inc. All Rights Reserved.
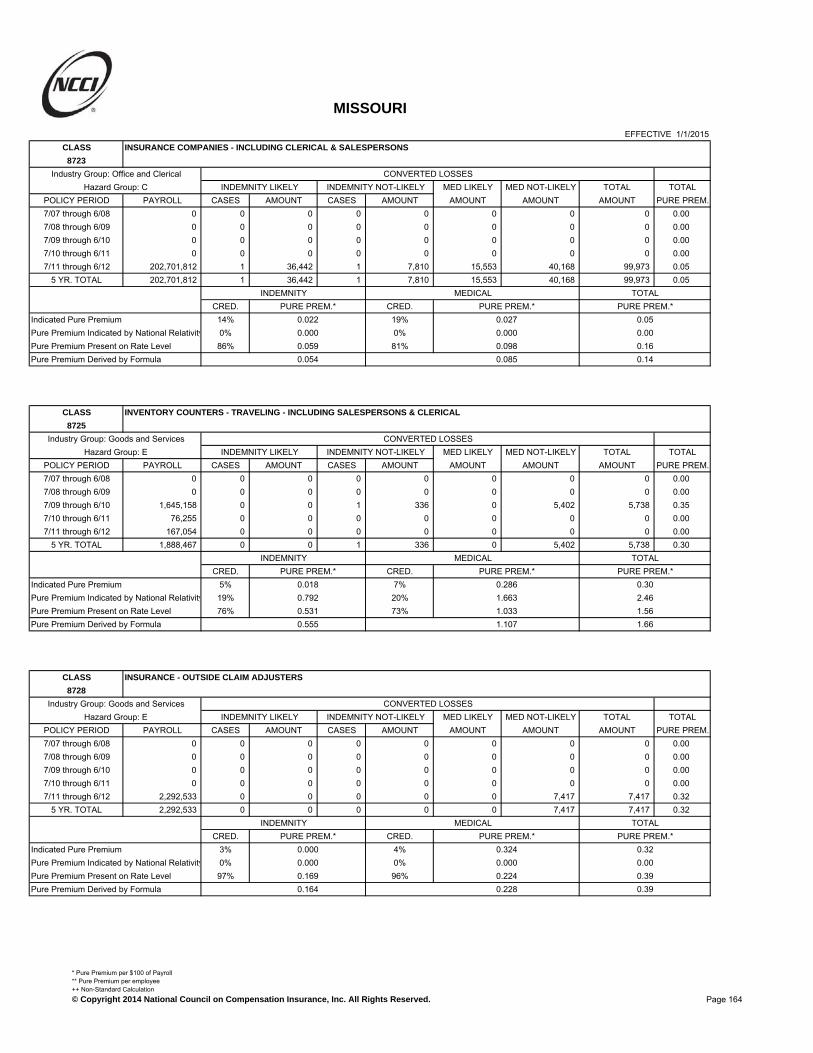
MISSOURI
EFFECTIVE 1/1/2015CLASS INSURANCE COMPANIES - INCLUDING CLERICAL & SALESPERSONS
8723
Industry Group: Office and Clerical CONVERTED LOSSESHazard Group: C INDEMNITY LIKELY INDEMNITY NOT-LIKELY MED LIKELY MED NOT-LIKELY TOTAL TOTAL
POLICY PERIOD PAYROLL CASES AMOUNT CASES AMOUNT AMOUNT AMOUNT AMOUNT PURE PREM.7/07 through 6/08 0 0 0 0 0 0 0 0 0.007/08 through 6/09 0 0 0 0 0 0 0 0 0.007/09 through 6/10 0 0 0 0 0 0 0 0 0.007/10 through 6/11 0 0 0 0 0 0 0 0 0.007/11 through 6/12 202,701,812 1 36,442 1 7,810 15,553 40,168 99,973 0.05
5 YR. TOTAL 202,701,812 1 36,442 1 7,810 15,553 40,168 99,973 0.05INDEMNITY MEDICAL TOTAL
CRED. PURE PREM.* CRED. PURE PREM.* PURE PREM.*Indicated Pure Premium 14% 0.022 19% 0.027 0.05Pure Premium Indicated by National Relativity 0% 0.000 0% 0.000 0.00Pure Premium Present on Rate Level 86% 0.059 81% 0.098 0.16Pure Premium Derived by Formula 0.054 0.085 0.14
CLASS INVENTORY COUNTERS - TRAVELING - INCLUDING SALESPERSONS & CLERICAL
8725
Industry Group: Goods and Services CONVERTED LOSSESHazard Group: E INDEMNITY LIKELY INDEMNITY NOT-LIKELY MED LIKELY MED NOT-LIKELY TOTAL TOTAL
POLICY PERIOD PAYROLL CASES AMOUNT CASES AMOUNT AMOUNT AMOUNT AMOUNT PURE PREM.7/07 through 6/08 0 0 0 0 0 0 0 0 0.007/08 through 6/09 0 0 0 0 0 0 0 0 0.007/09 through 6/10 1,645,158 0 0 1 336 0 5,402 5,738 0.357/10 through 6/11 76,255 0 0 0 0 0 0 0 0.007/11 through 6/12 167,054 0 0 0 0 0 0 0 0.00
5 YR. TOTAL 1,888,467 0 0 1 336 0 5,402 5,738 0.30INDEMNITY MEDICAL TOTAL
CRED. PURE PREM.* CRED. PURE PREM.* PURE PREM.*Indicated Pure Premium 5% 0.018 7% 0.286 0.30Pure Premium Indicated by National Relativity 19% 0.792 20% 1.663 2.46Pure Premium Present on Rate Level 76% 0.531 73% 1.033 1.56Pure Premium Derived by Formula 0.555 1.107 1.66
CLASS INSURANCE - OUTSIDE CLAIM ADJUSTERS
8728
Industry Group: Goods and Services CONVERTED LOSSESHazard Group: E INDEMNITY LIKELY INDEMNITY NOT-LIKELY MED LIKELY MED NOT-LIKELY TOTAL TOTAL
POLICY PERIOD PAYROLL CASES AMOUNT CASES AMOUNT AMOUNT AMOUNT AMOUNT PURE PREM.7/07 through 6/08 0 0 0 0 0 0 0 0 0.007/08 through 6/09 0 0 0 0 0 0 0 0 0.007/09 through 6/10 0 0 0 0 0 0 0 0 0.007/10 through 6/11 0 0 0 0 0 0 0 0 0.007/11 through 6/12 2,292,533 0 0 0 0 0 7,417 7,417 0.32
5 YR. TOTAL 2,292,533 0 0 0 0 0 7,417 7,417 0.32INDEMNITY MEDICAL TOTAL
CRED. PURE PREM.* CRED. PURE PREM.* PURE PREM.*Indicated Pure Premium 3% 0.000 4% 0.324 0.32Pure Premium Indicated by National Relativity 0% 0.000 0% 0.000 0.00Pure Premium Present on Rate Level 97% 0.169 96% 0.224 0.39Pure Premium Derived by Formula 0.164 0.228 0.39
Page 164
* Pure Premium per $100 of Payroll** Pure Premium per employee++ Non-Standard Calculation© Copyright 2014 National Council on Compensation Insurance, Inc. All Rights Reserved.

MISSOURI
EFFECTIVE 1/1/2015CLASS SALESPERSONS OR COLLECTORS-OUTSIDE
8742
Industry Group: Office and Clerical CONVERTED LOSSESHazard Group: E INDEMNITY LIKELY INDEMNITY NOT-LIKELY MED LIKELY MED NOT-LIKELY TOTAL TOTAL
POLICY PERIOD PAYROLL CASES AMOUNT CASES AMOUNT AMOUNT AMOUNT AMOUNT PURE PREM.7/07 through 6/08 5,113,873,137 74 2,607,477 234 4,297,637 3,423,601 6,600,519 16,929,234 0.337/08 through 6/09 4,854,521,556 69 2,442,842 213 5,243,844 4,498,817 7,846,648 20,032,151 0.417/09 through 6/10 4,925,294,248 72 4,390,067 166 3,497,541 5,411,204 4,986,702 18,285,514 0.377/10 through 6/11 5,190,114,608 66 3,384,199 178 4,252,240 4,410,481 5,801,672 17,848,592 0.347/11 through 6/12 5,367,956,372 52 2,525,473 157 3,415,607 3,364,887 7,111,833 16,417,800 0.31
5 YR. TOTAL 25,451,759,921 333 15,350,058 948 20,706,869 21,108,990 32,347,374 89,513,291 0.35INDEMNITY MEDICAL TOTAL
CRED. PURE PREM.* CRED. PURE PREM.* PURE PREM.*Indicated Pure Premium 100% 0.142 100% 0.210 0.35Pure Premium Indicated by National Relativity 0% 0.117 0% 0.190 0.31Pure Premium Present on Rate Level 0% 0.155 0% 0.206 0.36Pure Premium Derived by Formula 0.142 0.210 0.35
CLASS NEWS AGENT OR DISTRIBUTOR OF MAGAZINES OR OTHER PERIODICALS-NOT RETAIL
8745 DEALER-& SALESPERSONS, DRIVERS
Industry Group: Goods and Services CONVERTED LOSSESHazard Group: D INDEMNITY LIKELY INDEMNITY NOT-LIKELY MED LIKELY MED NOT-LIKELY TOTAL TOTAL
POLICY PERIOD PAYROLL CASES AMOUNT CASES AMOUNT AMOUNT AMOUNT AMOUNT PURE PREM.7/07 through 6/08 6,571,866 0 0 10 64,249 0 149,389 213,638 3.257/08 through 6/09 4,170,481 3 29,240 0 0 21,017 8,655 58,912 1.417/09 through 6/10 4,083,705 2 19,936 2 13,319 7,394 24,728 65,377 1.607/10 through 6/11 2,399,771 0 0 1 49,629 0 79,467 129,096 5.387/11 through 6/12 1,924,935 0 0 3 206,714 0 330,238 536,952 27.90
5 YR. TOTAL 19,150,758 5 49,176 16 333,911 28,411 592,477 1,003,975 5.24INDEMNITY MEDICAL TOTAL
CRED. PURE PREM.* CRED. PURE PREM.* PURE PREM.*Indicated Pure Premium 20% 2.000 31% 3.242 5.24Pure Premium Indicated by National Relativity 40% 1.302 34% 2.821 4.12Pure Premium Present on Rate Level 40% 1.563 35% 3.665 5.23Pure Premium Derived by Formula 1.546 3.247 4.79
CLASS AUTOMOBILE SALESPERSONS
8748
Industry Group: Office and Clerical CONVERTED LOSSESHazard Group: D INDEMNITY LIKELY INDEMNITY NOT-LIKELY MED LIKELY MED NOT-LIKELY TOTAL TOTAL
POLICY PERIOD PAYROLL CASES AMOUNT CASES AMOUNT AMOUNT AMOUNT AMOUNT PURE PREM.7/07 through 6/08 213,515,698 6 113,727 18 364,587 151,169 588,546 1,218,029 0.577/08 through 6/09 198,034,839 5 131,892 23 358,072 161,859 605,671 1,257,494 0.647/09 through 6/10 212,190,622 9 327,059 16 229,075 298,996 395,442 1,250,572 0.597/10 through 6/11 224,579,793 8 390,670 13 185,270 773,385 445,286 1,794,611 0.807/11 through 6/12 246,407,239 5 179,703 16 203,336 230,187 356,274 969,500 0.39
5 YR. TOTAL 1,094,728,191 33 1,143,051 86 1,340,340 1,615,596 2,391,219 6,490,206 0.59INDEMNITY MEDICAL TOTAL
CRED. PURE PREM.* CRED. PURE PREM.* PURE PREM.*Indicated Pure Premium 48% 0.227 63% 0.366 0.59Pure Premium Indicated by National Relativity 26% 0.248 18% 0.381 0.63Pure Premium Present on Rate Level 26% 0.238 19% 0.354 0.59Pure Premium Derived by Formula 0.235 0.366 0.60
Page 165
* Pure Premium per $100 of Payroll** Pure Premium per employee++ Non-Standard Calculation© Copyright 2014 National Council on Compensation Insurance, Inc. All Rights Reserved.

MISSOURI
EFFECTIVE 1/1/2015CLASS LABOR UNION-ALL EMPLOYEES
8755
Industry Group: Office and Clerical CONVERTED LOSSESHazard Group: E INDEMNITY LIKELY INDEMNITY NOT-LIKELY MED LIKELY MED NOT-LIKELY TOTAL TOTAL
POLICY PERIOD PAYROLL CASES AMOUNT CASES AMOUNT AMOUNT AMOUNT AMOUNT PURE PREM.7/07 through 6/08 63,264,723 1 171,867 3 141,590 409,150 170,512 893,119 1.417/08 through 6/09 66,016,305 1 26,408 3 121,999 13,613 81,464 243,484 0.377/09 through 6/10 69,174,431 1 140,146 6 577,439 722,147 660,282 2,100,014 3.047/10 through 6/11 65,194,123 1 147,459 2 274,478 727,528 64,187 1,213,652 1.867/11 through 6/12 57,071,250 1 59,693 0 0 35,507 4,753 99,953 0.18
5 YR. TOTAL 320,720,832 5 545,573 14 1,115,506 1,907,945 981,198 4,550,222 1.42INDEMNITY MEDICAL TOTAL
CRED. PURE PREM.* CRED. PURE PREM.* PURE PREM.*Indicated Pure Premium 25% 0.518 35% 0.901 1.42Pure Premium Indicated by National Relativity 37% 0.137 32% 0.278 0.42Pure Premium Present on Rate Level 38% 0.168 33% 0.276 0.44Pure Premium Derived by Formula 0.244 0.495 0.74
CLASS MAILING OR ADDRESSING COMPANY OR LETTER SERVICE SHOP - CLERICAL STAFF
8799
Industry Group: Office and Clerical CONVERTED LOSSESHazard Group: C INDEMNITY LIKELY INDEMNITY NOT-LIKELY MED LIKELY MED NOT-LIKELY TOTAL TOTAL
POLICY PERIOD PAYROLL CASES AMOUNT CASES AMOUNT AMOUNT AMOUNT AMOUNT PURE PREM.7/07 through 6/08 324,602 0 0 0 0 0 0 0 0.007/08 through 6/09 4,316,623 0 0 3 6,081 0 19,609 25,690 0.607/09 through 6/10 20,300,449 1 16,305 2 52,728 45,170 82,646 196,849 0.977/10 through 6/11 18,256,003 0 0 0 0 0 4,309 4,309 0.027/11 through 6/12 21,944,346 0 0 2 38,522 0 76,308 114,830 0.52
5 YR. TOTAL 65,142,023 1 16,305 7 97,331 45,170 182,872 341,678 0.52INDEMNITY MEDICAL TOTAL
CRED. PURE PREM.* CRED. PURE PREM.* PURE PREM.*Indicated Pure Premium 17% 0.174 23% 0.350 0.52Pure Premium Indicated by National Relativity 29% 0.122 30% 0.290 0.41Pure Premium Present on Rate Level 54% 0.313 47% 0.464 0.78Pure Premium Derived by Formula 0.234 0.386 0.62
CLASS MAILING OR ADDRESSING COMPANY OR LETTER SERVICE SHOP
8800
Industry Group: Office and Clerical CONVERTED LOSSESHazard Group: A INDEMNITY LIKELY INDEMNITY NOT-LIKELY MED LIKELY MED NOT-LIKELY TOTAL TOTAL
POLICY PERIOD PAYROLL CASES AMOUNT CASES AMOUNT AMOUNT AMOUNT AMOUNT PURE PREM.7/07 through 6/08 65,534,047 2 86,635 30 239,445 154,247 449,203 929,530 1.427/08 through 6/09 39,867,037 2 80,830 17 135,253 38,052 272,042 526,177 1.327/09 through 6/10 28,899,835 2 23,120 9 137,512 16,421 192,542 369,595 1.287/10 through 6/11 41,212,440 2 35,224 14 87,421 30,069 167,558 320,272 0.787/11 through 6/12 41,221,062 2 127,777 10 174,832 130,824 318,830 752,263 1.83
5 YR. TOTAL 216,734,421 10 353,586 80 774,463 369,613 1,400,175 2,897,837 1.34INDEMNITY MEDICAL TOTAL
CRED. PURE PREM.* CRED. PURE PREM.* PURE PREM.*Indicated Pure Premium 33% 0.520 48% 0.817 1.34Pure Premium Indicated by National Relativity 33% 0.458 26% 0.799 1.26Pure Premium Present on Rate Level 34% 0.495 26% 0.890 1.39Pure Premium Derived by Formula 0.491 0.831 1.32
Page 166
* Pure Premium per $100 of Payroll** Pure Premium per employee++ Non-Standard Calculation© Copyright 2014 National Council on Compensation Insurance, Inc. All Rights Reserved.

MISSOURI
EFFECTIVE 1/1/2015CLASS AUDITOR, ACCOUNTANT, OR COMPUTER SYSTEM DESIGNER OR PROGRAMMER - TRAVELING
8803
Industry Group: Office and Clerical CONVERTED LOSSESHazard Group: E INDEMNITY LIKELY INDEMNITY NOT-LIKELY MED LIKELY MED NOT-LIKELY TOTAL TOTAL
POLICY PERIOD PAYROLL CASES AMOUNT CASES AMOUNT AMOUNT AMOUNT AMOUNT PURE PREM.7/07 through 6/08 1,129,552,746 5 60,378 16 206,367 135,584 307,515 709,844 0.067/08 through 6/09 1,163,701,620 2 44,506 9 176,396 45,232 348,270 614,404 0.057/09 through 6/10 1,128,951,276 4 237,769 10 146,197 440,224 322,770 1,146,960 0.107/10 through 6/11 1,194,580,062 0 0 3 59,431 0 86,911 146,342 0.017/11 through 6/12 1,312,721,307 2 218,094 10 193,592 466,702 316,329 1,194,717 0.09
5 YR. TOTAL 5,929,507,011 13 560,747 48 781,983 1,087,742 1,381,795 3,812,267 0.07INDEMNITY MEDICAL TOTAL
CRED. PURE PREM.* CRED. PURE PREM.* PURE PREM.*Indicated Pure Premium 39% 0.023 51% 0.042 0.07Pure Premium Indicated by National Relativity 30% 0.026 24% 0.043 0.07Pure Premium Present on Rate Level 31% 0.027 25% 0.038 0.07Pure Premium Derived by Formula 0.025 0.041 0.07
CLASS CLERICAL OFFICE EMPLOYEES NOC
8810
Industry Group: Office and Clerical CONVERTED LOSSESHazard Group: C INDEMNITY LIKELY INDEMNITY NOT-LIKELY MED LIKELY MED NOT-LIKELY TOTAL TOTAL
POLICY PERIOD PAYROLL CASES AMOUNT CASES AMOUNT AMOUNT AMOUNT AMOUNT PURE PREM.7/07 through 6/08 22,113,620,718 171 5,057,650 717 9,140,763 5,696,880 16,025,515 35,920,808 0.167/08 through 6/09 22,190,431,627 161 5,501,864 542 7,255,483 6,687,011 15,836,215 35,280,573 0.167/09 through 6/10 21,933,612,975 150 4,251,018 592 8,841,418 5,481,620 17,143,651 35,717,707 0.167/10 through 6/11 22,902,650,268 122 4,005,334 463 7,550,460 4,705,258 15,580,712 31,841,764 0.147/11 through 6/12 22,905,684,604 129 4,420,434 441 8,190,823 6,201,151 14,964,993 33,777,401 0.15
5 YR. TOTAL 112,046,000,192 733 23,236,300 2,755 40,978,947 28,771,920 79,551,086 172,538,253 0.15INDEMNITY MEDICAL TOTAL
CRED. PURE PREM.* CRED. PURE PREM.* PURE PREM.*Indicated Pure Premium 100% 0.057 100% 0.097 0.15Pure Premium Indicated by National Relativity 0% 0.054 0% 0.102 0.16Pure Premium Present on Rate Level 0% 0.059 0% 0.098 0.16Pure Premium Derived by Formula 0.057 0.097 0.15
CLASS ATTORNEY-ALL EMPLOYEES & CLERICAL, MESSENGERS, DRIVERS
8820
Industry Group: Office and Clerical CONVERTED LOSSESHazard Group: D INDEMNITY LIKELY INDEMNITY NOT-LIKELY MED LIKELY MED NOT-LIKELY TOTAL TOTAL
POLICY PERIOD PAYROLL CASES AMOUNT CASES AMOUNT AMOUNT AMOUNT AMOUNT PURE PREM.7/07 through 6/08 1,046,013,839 11 244,316 14 210,610 251,456 454,703 1,161,085 0.117/08 through 6/09 1,040,597,717 6 253,309 34 556,578 434,740 791,767 2,036,394 0.207/09 through 6/10 1,017,438,876 4 105,176 37 785,485 79,299 870,939 1,840,899 0.187/10 through 6/11 1,071,919,691 3 110,980 24 494,785 141,456 646,312 1,393,533 0.137/11 through 6/12 1,090,367,583 4 212,165 23 390,667 934,128 660,217 2,197,177 0.20
5 YR. TOTAL 5,266,337,706 28 925,946 132 2,438,125 1,841,079 3,423,938 8,629,088 0.16INDEMNITY MEDICAL TOTAL
CRED. PURE PREM.* CRED. PURE PREM.* PURE PREM.*Indicated Pure Premium 57% 0.064 68% 0.100 0.16Pure Premium Indicated by National Relativity 21% 0.053 16% 0.095 0.15Pure Premium Present on Rate Level 22% 0.076 16% 0.091 0.17Pure Premium Derived by Formula 0.064 0.098 0.16
Page 167
* Pure Premium per $100 of Payroll** Pure Premium per employee++ Non-Standard Calculation© Copyright 2014 National Council on Compensation Insurance, Inc. All Rights Reserved.

MISSOURI
EFFECTIVE 1/1/2015CLASS RETIREMENT LIVING CENTERS: HEALTH CARE EMPLOYEES
8824
Industry Group: Goods and Services CONVERTED LOSSESHazard Group: B INDEMNITY LIKELY INDEMNITY NOT-LIKELY MED LIKELY MED NOT-LIKELY TOTAL TOTAL
POLICY PERIOD PAYROLL CASES AMOUNT CASES AMOUNT AMOUNT AMOUNT AMOUNT PURE PREM.7/07 through 6/08 58,120,944 11 307,108 35 177,507 301,249 547,554 1,333,418 2.297/08 through 6/09 58,743,314 15 468,186 30 214,130 746,203 481,182 1,909,701 3.257/09 through 6/10 52,706,264 9 94,969 31 342,158 77,975 681,215 1,196,317 2.277/10 through 6/11 64,362,756 11 363,321 27 223,914 482,451 448,203 1,517,889 2.367/11 through 6/12 58,607,839 8 219,770 31 285,694 111,749 679,108 1,296,321 2.21
5 YR. TOTAL 292,541,117 54 1,453,354 154 1,243,403 1,719,627 2,837,262 7,253,646 2.48INDEMNITY MEDICAL TOTAL
CRED. PURE PREM.* CRED. PURE PREM.* PURE PREM.*Indicated Pure Premium 50% 0.922 69% 1.558 2.48Pure Premium Indicated by National Relativity 25% 1.103 15% 2.092 3.20Pure Premium Present on Rate Level 25% 1.037 16% 1.705 2.74Pure Premium Derived by Formula 0.996 1.662 2.66
CLASS RETIREMENT LIVING CENTERS: FOOD SERVICE EMPLOYEES
8825
Industry Group: Goods and Services CONVERTED LOSSESHazard Group: A INDEMNITY LIKELY INDEMNITY NOT-LIKELY MED LIKELY MED NOT-LIKELY TOTAL TOTAL
POLICY PERIOD PAYROLL CASES AMOUNT CASES AMOUNT AMOUNT AMOUNT AMOUNT PURE PREM.7/07 through 6/08 26,481,868 3 18,362 15 140,628 27,182 187,232 373,404 1.417/08 through 6/09 27,961,856 4 67,580 15 64,863 31,113 128,178 291,734 1.047/09 through 6/10 26,876,250 2 78,384 18 76,302 179,516 262,833 597,035 2.227/10 through 6/11 27,874,347 0 0 7 37,605 0 145,266 182,871 0.667/11 through 6/12 28,615,130 5 115,132 7 49,122 147,144 175,204 486,602 1.70
5 YR. TOTAL 137,809,451 14 279,458 62 368,520 384,955 898,713 1,931,646 1.40INDEMNITY MEDICAL TOTAL
CRED. PURE PREM.* CRED. PURE PREM.* PURE PREM.*Indicated Pure Premium 30% 0.470 44% 0.931 1.40Pure Premium Indicated by National Relativity 35% 0.574 28% 1.168 1.74Pure Premium Present on Rate Level 35% 0.594 28% 1.218 1.81Pure Premium Derived by Formula 0.550 1.078 1.63
CLASS RETIREMENT LIVING CENTERS: ALL OTHER EMPLOYEES, SALESPERSONS & DRIVERS
8826
Industry Group: Goods and Services CONVERTED LOSSESHazard Group: C INDEMNITY LIKELY INDEMNITY NOT-LIKELY MED LIKELY MED NOT-LIKELY TOTAL TOTAL
POLICY PERIOD PAYROLL CASES AMOUNT CASES AMOUNT AMOUNT AMOUNT AMOUNT PURE PREM.7/07 through 6/08 40,221,765 2 35,587 20 108,417 36,699 269,711 450,414 1.127/08 through 6/09 40,877,328 5 74,968 12 124,472 103,400 415,031 717,871 1.767/09 through 6/10 42,484,849 4 100,435 13 70,813 804,258 249,884 1,225,390 2.887/10 through 6/11 47,652,927 3 492,287 13 79,783 242,773 315,573 1,130,416 2.377/11 through 6/12 47,596,802 5 114,633 16 169,170 94,051 349,553 727,407 1.53
5 YR. TOTAL 218,833,671 19 817,910 74 552,655 1,281,181 1,599,752 4,251,498 1.94INDEMNITY MEDICAL TOTAL
CRED. PURE PREM.* CRED. PURE PREM.* PURE PREM.*Indicated Pure Premium 39% 0.626 57% 1.316 1.94Pure Premium Indicated by National Relativity 30% 0.830 21% 1.520 2.35Pure Premium Present on Rate Level 31% 0.757 22% 1.428 2.19Pure Premium Derived by Formula 0.728 1.383 2.11
Page 168
* Pure Premium per $100 of Payroll** Pure Premium per employee++ Non-Standard Calculation© Copyright 2014 National Council on Compensation Insurance, Inc. All Rights Reserved.
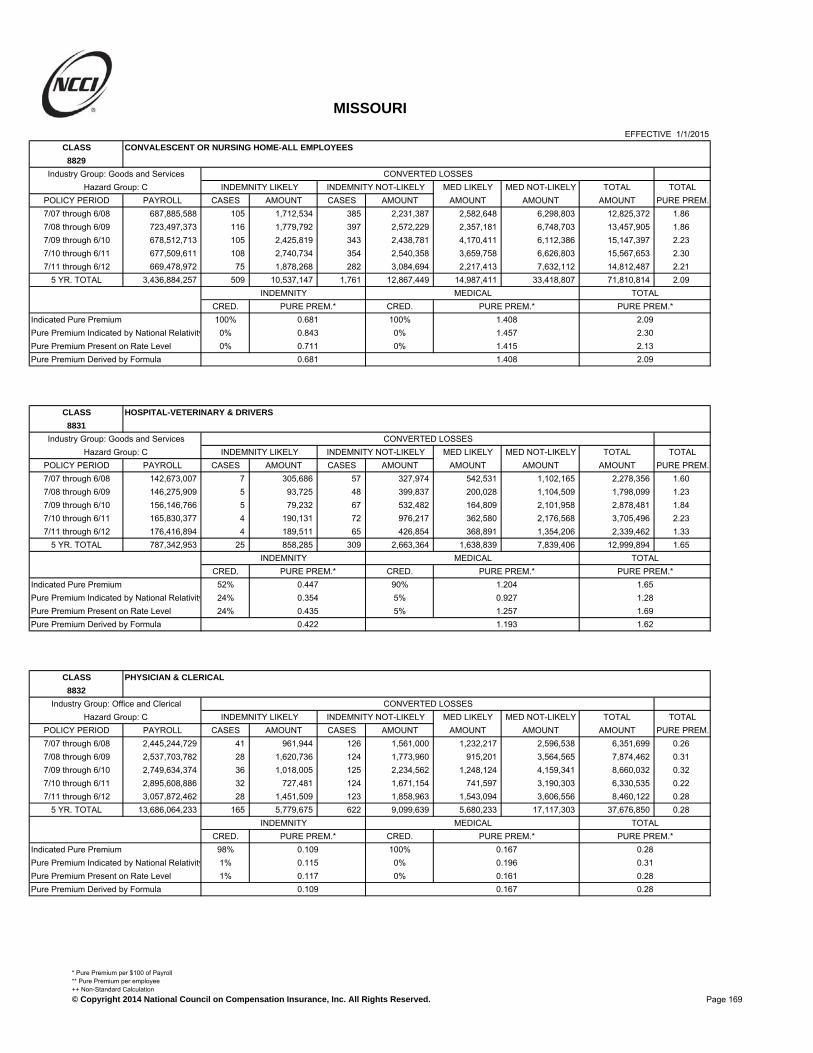
MISSOURI
EFFECTIVE 1/1/2015CLASS CONVALESCENT OR NURSING HOME-ALL EMPLOYEES
8829
Industry Group: Goods and Services CONVERTED LOSSESHazard Group: C INDEMNITY LIKELY INDEMNITY NOT-LIKELY MED LIKELY MED NOT-LIKELY TOTAL TOTAL
POLICY PERIOD PAYROLL CASES AMOUNT CASES AMOUNT AMOUNT AMOUNT AMOUNT PURE PREM.7/07 through 6/08 687,885,588 105 1,712,534 385 2,231,387 2,582,648 6,298,803 12,825,372 1.867/08 through 6/09 723,497,373 116 1,779,792 397 2,572,229 2,357,181 6,748,703 13,457,905 1.867/09 through 6/10 678,512,713 105 2,425,819 343 2,438,781 4,170,411 6,112,386 15,147,397 2.237/10 through 6/11 677,509,611 108 2,740,734 354 2,540,358 3,659,758 6,626,803 15,567,653 2.307/11 through 6/12 669,478,972 75 1,878,268 282 3,084,694 2,217,413 7,632,112 14,812,487 2.21
5 YR. TOTAL 3,436,884,257 509 10,537,147 1,761 12,867,449 14,987,411 33,418,807 71,810,814 2.09INDEMNITY MEDICAL TOTAL
CRED. PURE PREM.* CRED. PURE PREM.* PURE PREM.*Indicated Pure Premium 100% 0.681 100% 1.408 2.09Pure Premium Indicated by National Relativity 0% 0.843 0% 1.457 2.30Pure Premium Present on Rate Level 0% 0.711 0% 1.415 2.13Pure Premium Derived by Formula 0.681 1.408 2.09
CLASS HOSPITAL-VETERINARY & DRIVERS
8831
Industry Group: Goods and Services CONVERTED LOSSESHazard Group: C INDEMNITY LIKELY INDEMNITY NOT-LIKELY MED LIKELY MED NOT-LIKELY TOTAL TOTAL
POLICY PERIOD PAYROLL CASES AMOUNT CASES AMOUNT AMOUNT AMOUNT AMOUNT PURE PREM.7/07 through 6/08 142,673,007 7 305,686 57 327,974 542,531 1,102,165 2,278,356 1.607/08 through 6/09 146,275,909 5 93,725 48 399,837 200,028 1,104,509 1,798,099 1.237/09 through 6/10 156,146,766 5 79,232 67 532,482 164,809 2,101,958 2,878,481 1.847/10 through 6/11 165,830,377 4 190,131 72 976,217 362,580 2,176,568 3,705,496 2.237/11 through 6/12 176,416,894 4 189,511 65 426,854 368,891 1,354,206 2,339,462 1.33
5 YR. TOTAL 787,342,953 25 858,285 309 2,663,364 1,638,839 7,839,406 12,999,894 1.65INDEMNITY MEDICAL TOTAL
CRED. PURE PREM.* CRED. PURE PREM.* PURE PREM.*Indicated Pure Premium 52% 0.447 90% 1.204 1.65Pure Premium Indicated by National Relativity 24% 0.354 5% 0.927 1.28Pure Premium Present on Rate Level 24% 0.435 5% 1.257 1.69Pure Premium Derived by Formula 0.422 1.193 1.62
CLASS PHYSICIAN & CLERICAL
8832
Industry Group: Office and Clerical CONVERTED LOSSESHazard Group: C INDEMNITY LIKELY INDEMNITY NOT-LIKELY MED LIKELY MED NOT-LIKELY TOTAL TOTAL
POLICY PERIOD PAYROLL CASES AMOUNT CASES AMOUNT AMOUNT AMOUNT AMOUNT PURE PREM.7/07 through 6/08 2,445,244,729 41 961,944 126 1,561,000 1,232,217 2,596,538 6,351,699 0.267/08 through 6/09 2,537,703,782 28 1,620,736 124 1,773,960 915,201 3,564,565 7,874,462 0.317/09 through 6/10 2,749,634,374 36 1,018,005 125 2,234,562 1,248,124 4,159,341 8,660,032 0.327/10 through 6/11 2,895,608,886 32 727,481 124 1,671,154 741,597 3,190,303 6,330,535 0.227/11 through 6/12 3,057,872,462 28 1,451,509 123 1,858,963 1,543,094 3,606,556 8,460,122 0.28
5 YR. TOTAL 13,686,064,233 165 5,779,675 622 9,099,639 5,680,233 17,117,303 37,676,850 0.28INDEMNITY MEDICAL TOTAL
CRED. PURE PREM.* CRED. PURE PREM.* PURE PREM.*Indicated Pure Premium 98% 0.109 100% 0.167 0.28Pure Premium Indicated by National Relativity 1% 0.115 0% 0.196 0.31Pure Premium Present on Rate Level 1% 0.117 0% 0.161 0.28Pure Premium Derived by Formula 0.109 0.167 0.28
Page 169
* Pure Premium per $100 of Payroll** Pure Premium per employee++ Non-Standard Calculation© Copyright 2014 National Council on Compensation Insurance, Inc. All Rights Reserved.

MISSOURI
EFFECTIVE 1/1/2015CLASS HOSPITAL: PROFESSIONAL EMPLOYEES
8833
Industry Group: Office and Clerical CONVERTED LOSSESHazard Group: C INDEMNITY LIKELY INDEMNITY NOT-LIKELY MED LIKELY MED NOT-LIKELY TOTAL TOTAL
POLICY PERIOD PAYROLL CASES AMOUNT CASES AMOUNT AMOUNT AMOUNT AMOUNT PURE PREM.7/07 through 6/08 1,248,565,667 48 1,564,002 198 1,572,052 2,710,822 4,333,321 10,180,197 0.827/08 through 6/09 1,310,243,831 40 1,832,832 209 2,048,634 2,790,953 5,564,283 12,236,702 0.937/09 through 6/10 1,362,008,959 61 2,018,628 229 2,091,588 2,419,004 5,898,592 12,427,812 0.917/10 through 6/11 1,389,182,131 66 2,143,918 254 2,306,173 3,096,768 6,601,964 14,148,823 1.027/11 through 6/12 1,429,358,196 50 1,874,266 207 2,530,056 2,843,084 7,154,373 14,401,779 1.01
5 YR. TOTAL 6,739,358,784 265 9,433,646 1,097 10,548,503 13,860,631 29,552,533 63,395,313 0.94INDEMNITY MEDICAL TOTAL
CRED. PURE PREM.* CRED. PURE PREM.* PURE PREM.*Indicated Pure Premium 100% 0.296 100% 0.644 0.94Pure Premium Indicated by National Relativity 0% 0.375 0% 0.627 1.00Pure Premium Present on Rate Level 0% 0.308 0% 0.614 0.92Pure Premium Derived by Formula 0.296 0.644 0.94
CLASS HOME, PUBLIC, AND TRAVELING HEALTHCARE--ALL EMPLOYEES
8835
Industry Group: Goods and Services CONVERTED LOSSESHazard Group: C INDEMNITY LIKELY INDEMNITY NOT-LIKELY MED LIKELY MED NOT-LIKELY TOTAL TOTAL
POLICY PERIOD PAYROLL CASES AMOUNT CASES AMOUNT AMOUNT AMOUNT AMOUNT PURE PREM.7/07 through 6/08 311,104,096 39 1,120,354 129 890,891 1,296,629 2,010,232 5,318,106 1.717/08 through 6/09 369,477,683 43 956,091 180 2,033,501 1,363,601 3,530,133 7,883,326 2.137/09 through 6/10 401,429,293 65 1,857,281 161 1,361,178 3,080,162 3,233,558 9,532,179 2.387/10 through 6/11 437,521,441 51 1,278,405 191 1,692,284 1,531,874 2,948,380 7,450,943 1.707/11 through 6/12 448,699,413 47 1,732,740 188 2,249,907 3,267,467 5,247,418 12,497,532 2.79
5 YR. TOTAL 1,968,231,926 245 6,944,871 849 8,227,761 10,539,733 16,969,721 42,682,086 2.17INDEMNITY MEDICAL TOTAL
CRED. PURE PREM.* CRED. PURE PREM.* PURE PREM.*Indicated Pure Premium 96% 0.771 100% 1.398 2.17Pure Premium Indicated by National Relativity 2% 0.853 0% 1.264 2.12Pure Premium Present on Rate Level 2% 0.788 0% 1.342 2.13Pure Premium Derived by Formula 0.773 1.398 2.17
CLASS BANKS AND TRUST COMPANIES - ALL EMPLOYEES, SALESPERSONS, DRIVERS & CLERICAL
8855
Industry Group: Office and Clerical CONVERTED LOSSESHazard Group: C INDEMNITY LIKELY INDEMNITY NOT-LIKELY MED LIKELY MED NOT-LIKELY TOTAL TOTAL
POLICY PERIOD PAYROLL CASES AMOUNT CASES AMOUNT AMOUNT AMOUNT AMOUNT PURE PREM.7/07 through 6/08 0 0 0 0 0 0 0 0 0.007/08 through 6/09 0 0 0 0 0 0 0 0 0.007/09 through 6/10 0 0 0 0 0 0 0 0 0.007/10 through 6/11 0 0 0 0 0 0 0 0 0.007/11 through 6/12 955,677,237 5 203,612 23 405,093 183,229 808,724 1,600,658 0.17
5 YR. TOTAL 955,677,237 5 203,612 23 405,093 183,229 808,724 1,600,658 0.17INDEMNITY MEDICAL TOTAL
CRED. PURE PREM.* CRED. PURE PREM.* PURE PREM.*Indicated Pure Premium 26% 0.064 36% 0.104 0.17Pure Premium Indicated by National Relativity 27% 0.093 28% 0.182 0.28Pure Premium Present on Rate Level 47% 0.059 36% 0.098 0.16Pure Premium Derived by Formula 0.069 0.124 0.19
Page 170
* Pure Premium per $100 of Payroll** Pure Premium per employee++ Non-Standard Calculation© Copyright 2014 National Council on Compensation Insurance, Inc. All Rights Reserved.

MISSOURI
EFFECTIVE 1/1/2015CLASS CHECK CASHING ESTABLISHMENTS - ALL EMPLOYEES, SALESPERSONS, DRIVERS &
8856 CLERICAL
Industry Group: Office and Clerical CONVERTED LOSSESHazard Group: C INDEMNITY LIKELY INDEMNITY NOT-LIKELY MED LIKELY MED NOT-LIKELY TOTAL TOTAL
POLICY PERIOD PAYROLL CASES AMOUNT CASES AMOUNT AMOUNT AMOUNT AMOUNT PURE PREM.7/07 through 6/08 0 0 0 0 0 0 0 0 0.007/08 through 6/09 0 0 0 0 0 0 0 0 0.007/09 through 6/10 0 0 0 0 0 0 0 0 0.007/10 through 6/11 0 0 0 0 0 0 0 0 0.007/11 through 6/12 7,047,906 0 0 0 0 0 5,616 5,616 0.08
5 YR. TOTAL 7,047,906 0 0 0 0 0 5,616 5,616 0.08INDEMNITY MEDICAL TOTAL
CRED. PURE PREM.* CRED. PURE PREM.* PURE PREM.*Indicated Pure Premium 4% 0.000 5% 0.080 0.08Pure Premium Indicated by National Relativity 0% 0.000 0% 0.000 0.00Pure Premium Present on Rate Level 96% 0.059 95% 0.098 0.16Pure Premium Derived by Formula 0.057 0.097 0.15
CLASS CHARITABLE OR WELFARE ORGANIZATION-PROFESSIONAL EMPLOYEES & CLERICAL
8861
Industry Group: Office and Clerical CONVERTED LOSSESHazard Group: C INDEMNITY LIKELY INDEMNITY NOT-LIKELY MED LIKELY MED NOT-LIKELY TOTAL TOTAL
POLICY PERIOD PAYROLL CASES AMOUNT CASES AMOUNT AMOUNT AMOUNT AMOUNT PURE PREM.7/07 through 6/08 336,449,804 26 721,935 94 772,397 1,718,819 1,712,360 4,925,511 1.467/08 through 6/09 361,815,127 29 615,605 120 931,411 1,268,013 2,958,297 5,773,326 1.607/09 through 6/10 374,791,718 26 779,646 92 1,122,086 1,151,064 2,816,115 5,868,911 1.577/10 through 6/11 404,288,157 27 692,365 119 960,779 621,408 2,465,272 4,739,824 1.177/11 through 6/12 426,214,922 29 808,067 130 1,363,840 1,340,354 3,079,147 6,591,408 1.55
5 YR. TOTAL 1,903,559,728 137 3,617,618 555 5,150,513 6,099,658 13,031,191 27,898,980 1.47INDEMNITY MEDICAL TOTAL
CRED. PURE PREM.* CRED. PURE PREM.* PURE PREM.*Indicated Pure Premium 73% 0.461 100% 1.005 1.47Pure Premium Indicated by National Relativity 13% 0.272 0% 0.506 0.78Pure Premium Present on Rate Level 14% 0.403 0% 0.924 1.33Pure Premium Derived by Formula 0.428 1.005 1.43
CLASS COLLEGE: PROFESSIONAL EMPLOYEES & CLERICAL
8868
Industry Group: Office and Clerical CONVERTED LOSSESHazard Group: B INDEMNITY LIKELY INDEMNITY NOT-LIKELY MED LIKELY MED NOT-LIKELY TOTAL TOTAL
POLICY PERIOD PAYROLL CASES AMOUNT CASES AMOUNT AMOUNT AMOUNT AMOUNT PURE PREM.7/07 through 6/08 2,949,105,170 32 553,898 188 1,777,537 1,123,210 5,147,184 8,601,829 0.297/08 through 6/09 3,040,022,382 38 1,522,567 183 1,899,019 2,245,977 5,225,624 10,893,187 0.367/09 through 6/10 3,126,700,105 37 1,440,199 203 2,312,533 2,285,701 5,263,637 11,302,070 0.367/10 through 6/11 3,201,104,171 45 1,815,374 187 2,214,958 2,327,416 5,762,646 12,120,394 0.387/11 through 6/12 3,248,145,457 32 922,666 184 2,614,529 2,151,219 5,920,423 11,608,837 0.36
5 YR. TOTAL 15,565,077,285 184 6,254,704 945 10,818,576 10,133,523 27,319,514 54,526,317 0.35INDEMNITY MEDICAL TOTAL
CRED. PURE PREM.* CRED. PURE PREM.* PURE PREM.*Indicated Pure Premium 100% 0.110 100% 0.241 0.35Pure Premium Indicated by National Relativity 0% 0.113 0% 0.256 0.37Pure Premium Present on Rate Level 0% 0.106 0% 0.226 0.33Pure Premium Derived by Formula 0.110 0.241 0.35
Page 171
* Pure Premium per $100 of Payroll** Pure Premium per employee++ Non-Standard Calculation© Copyright 2014 National Council on Compensation Insurance, Inc. All Rights Reserved.

MISSOURI
EFFECTIVE 1/1/2015CLASS CHILD CARE CENTER - ALL EMPLOYEES INCLUDING CLERICAL, SALESPERSONS &
8869 DRIVERS
Industry Group: Office and Clerical CONVERTED LOSSESHazard Group: B INDEMNITY LIKELY INDEMNITY NOT-LIKELY MED LIKELY MED NOT-LIKELY TOTAL TOTAL
POLICY PERIOD PAYROLL CASES AMOUNT CASES AMOUNT AMOUNT AMOUNT AMOUNT PURE PREM.7/07 through 6/08 222,464,960 10 218,441 52 371,851 376,970 807,796 1,775,058 0.807/08 through 6/09 238,226,024 12 244,096 60 433,584 367,716 1,110,082 2,155,478 0.907/09 through 6/10 257,534,790 11 136,299 71 460,002 111,363 1,252,386 1,960,050 0.767/10 through 6/11 268,348,728 13 257,426 76 692,099 552,430 1,779,788 3,281,743 1.227/11 through 6/12 277,043,001 11 307,328 58 626,604 337,315 1,431,729 2,702,976 0.98
5 YR. TOTAL 1,263,617,503 57 1,163,590 317 2,584,140 1,745,794 6,381,781 11,875,305 0.94INDEMNITY MEDICAL TOTAL
CRED. PURE PREM.* CRED. PURE PREM.* PURE PREM.*Indicated Pure Premium 54% 0.297 87% 0.643 0.94Pure Premium Indicated by National Relativity 23% 0.330 6% 0.767 1.10Pure Premium Present on Rate Level 23% 0.285 7% 0.691 0.98Pure Premium Derived by Formula 0.302 0.654 0.96
CLASS CLERICAL TELECOMMUTER EMPLOYEES
8871
Industry Group: Office and Clerical CONVERTED LOSSESHazard Group: B INDEMNITY LIKELY INDEMNITY NOT-LIKELY MED LIKELY MED NOT-LIKELY TOTAL TOTAL
POLICY PERIOD PAYROLL CASES AMOUNT CASES AMOUNT AMOUNT AMOUNT AMOUNT PURE PREM.7/07 through 6/08 38,697,331 0 0 0 0 0 2,373 2,373 0.017/08 through 6/09 44,263,855 0 0 0 0 0 849 849 0.007/09 through 6/10 56,945,964 0 0 1 12,775 0 33,402 46,177 0.087/10 through 6/11 75,974,499 1 978 0 0 5,289 13,063 19,330 0.037/11 through 6/12 88,034,889 0 0 0 0 0 4,779 4,779 0.01
5 YR. TOTAL 303,916,538 1 978 1 12,775 5,289 54,466 73,508 0.03INDEMNITY MEDICAL TOTAL
CRED. PURE PREM.* CRED. PURE PREM.* PURE PREM.*Indicated Pure Premium 15% 0.005 20% 0.020 0.03Pure Premium Indicated by National Relativity 38% 0.041 40% 0.064 0.11Pure Premium Present on Rate Level 47% 0.051 40% 0.069 0.12Pure Premium Derived by Formula 0.040 0.057 0.10
CLASS TELECOMMUNICATIONS CO.: OFFICE OR EXCHANGE EMPLOYEES & CLERICAL
8901
Industry Group: Office and Clerical CONVERTED LOSSESHazard Group: D INDEMNITY LIKELY INDEMNITY NOT-LIKELY MED LIKELY MED NOT-LIKELY TOTAL TOTAL
POLICY PERIOD PAYROLL CASES AMOUNT CASES AMOUNT AMOUNT AMOUNT AMOUNT PURE PREM.7/07 through 6/08 818,113,842 5 127,598 16 822,655 79,059 381,297 1,410,609 0.177/08 through 6/09 920,035,120 7 537,652 16 268,224 707,682 328,079 1,841,637 0.207/09 through 6/10 911,588,446 7 103,401 19 554,835 75,865 658,286 1,392,387 0.157/10 through 6/11 960,147,717 5 169,969 16 285,665 54,800 294,822 805,256 0.087/11 through 6/12 990,721,008 8 422,719 26 417,961 396,196 606,389 1,843,265 0.19
5 YR. TOTAL 4,600,606,133 32 1,361,339 93 2,349,340 1,313,602 2,268,873 7,293,154 0.16INDEMNITY MEDICAL TOTAL
CRED. PURE PREM.* CRED. PURE PREM.* PURE PREM.*Indicated Pure Premium 53% 0.081 60% 0.078 0.16Pure Premium Indicated by National Relativity 23% 0.084 20% 0.122 0.21Pure Premium Present on Rate Level 24% 0.075 20% 0.074 0.15Pure Premium Derived by Formula 0.080 0.086 0.17
Page 172
* Pure Premium per $100 of Payroll** Pure Premium per employee++ Non-Standard Calculation© Copyright 2014 National Council on Compensation Insurance, Inc. All Rights Reserved.

MISSOURI
EFFECTIVE 1/1/2015CLASS BUILDING OR PROPERTY MANAGEMENT - PROPERTY MANAGERS AND LEASING AGENTS &
9012 CLERICAL, SALESPERSONS
Industry Group: Office and Clerical CONVERTED LOSSESHazard Group: D INDEMNITY LIKELY INDEMNITY NOT-LIKELY MED LIKELY MED NOT-LIKELY TOTAL TOTAL
POLICY PERIOD PAYROLL CASES AMOUNT CASES AMOUNT AMOUNT AMOUNT AMOUNT PURE PREM.7/07 through 6/08 259,890,214 13 313,773 51 564,892 207,699 1,306,573 2,392,937 0.927/08 through 6/09 261,450,706 10 340,494 30 475,378 451,957 936,479 2,204,308 0.847/09 through 6/10 262,287,137 13 442,616 46 809,535 450,001 1,251,760 2,953,912 1.137/10 through 6/11 269,729,344 15 470,844 48 1,133,498 1,201,418 1,871,293 4,677,053 1.737/11 through 6/12 324,163,434 12 530,841 46 1,037,259 590,477 1,568,675 3,727,252 1.15
5 YR. TOTAL 1,377,520,835 63 2,098,568 221 4,020,562 2,901,552 6,934,780 15,955,462 1.16INDEMNITY MEDICAL TOTAL
CRED. PURE PREM.* CRED. PURE PREM.* PURE PREM.*Indicated Pure Premium 65% 0.444 87% 0.714 1.16Pure Premium Indicated by National Relativity 17% 0.433 6% 0.684 1.12Pure Premium Present on Rate Level 18% 0.418 7% 0.636 1.05Pure Premium Derived by Formula 0.437 0.707 1.14
CLASS JANITORIAL SERVICES BY CONTRACTORS - NO WINDOW CLEANING ABOVE GROUND LEVEL
9014 & DRIVERS
Industry Group: Goods and Services CONVERTED LOSSESHazard Group: C INDEMNITY LIKELY INDEMNITY NOT-LIKELY MED LIKELY MED NOT-LIKELY TOTAL TOTAL
POLICY PERIOD PAYROLL CASES AMOUNT CASES AMOUNT AMOUNT AMOUNT AMOUNT PURE PREM.7/07 through 6/08 316,698,018 38 832,488 179 1,639,864 1,276,405 3,239,371 6,988,128 2.217/08 through 6/09 402,065,085 41 1,033,187 200 1,910,474 1,653,463 4,092,574 8,689,698 2.167/09 through 6/10 328,478,985 51 1,547,788 166 1,716,940 2,096,469 3,388,596 8,749,793 2.667/10 through 6/11 351,385,846 65 1,948,712 163 1,367,451 2,162,692 3,126,717 8,605,572 2.457/11 through 6/12 358,335,892 55 1,392,135 141 1,379,597 2,144,329 3,553,889 8,469,950 2.36
5 YR. TOTAL 1,756,963,826 250 6,754,310 849 8,014,326 9,333,358 17,401,147 41,503,141 2.36INDEMNITY MEDICAL TOTAL
CRED. PURE PREM.* CRED. PURE PREM.* PURE PREM.*Indicated Pure Premium 99% 0.841 100% 1.522 2.36Pure Premium Indicated by National Relativity 0% 1.034 0% 1.770 2.80Pure Premium Present on Rate Level 1% 0.954 0% 1.710 2.66Pure Premium Derived by Formula 0.842 1.522 2.36
CLASS BUILDING OR PROPERTY MANAGEMENT - ALL OTHER EMPLOYEES
9015
Industry Group: Goods and Services CONVERTED LOSSESHazard Group: C INDEMNITY LIKELY INDEMNITY NOT-LIKELY MED LIKELY MED NOT-LIKELY TOTAL TOTAL
POLICY PERIOD PAYROLL CASES AMOUNT CASES AMOUNT AMOUNT AMOUNT AMOUNT PURE PREM.7/07 through 6/08 295,925,568 32 1,531,155 169 1,938,845 2,254,984 3,700,266 9,425,250 3.197/08 through 6/09 304,472,537 28 2,176,139 165 2,506,293 2,283,067 4,354,673 11,320,172 3.727/09 through 6/10 312,600,293 43 1,615,783 146 2,055,171 2,193,835 3,641,878 9,506,667 3.047/10 through 6/11 306,110,174 29 949,211 144 1,862,670 1,124,047 3,805,316 7,741,244 2.537/11 through 6/12 313,441,605 24 788,201 119 2,084,365 807,203 4,193,821 7,873,590 2.51
5 YR. TOTAL 1,532,550,177 156 7,060,489 743 10,447,344 8,663,136 19,695,954 45,866,923 2.99INDEMNITY MEDICAL TOTAL
CRED. PURE PREM.* CRED. PURE PREM.* PURE PREM.*Indicated Pure Premium 100% 1.142 100% 1.850 2.99Pure Premium Indicated by National Relativity 0% 1.196 0% 1.878 3.07Pure Premium Present on Rate Level 0% 1.191 0% 1.943 3.13Pure Premium Derived by Formula 1.142 1.850 2.99
Page 173
* Pure Premium per $100 of Payroll** Pure Premium per employee++ Non-Standard Calculation© Copyright 2014 National Council on Compensation Insurance, Inc. All Rights Reserved.

MISSOURI
EFFECTIVE 1/1/2015CLASS AMUSEMENT PARK OR EXHIBITION OPERATION AND DRIVERS
9016
Industry Group: Goods and Services CONVERTED LOSSESHazard Group: C INDEMNITY LIKELY INDEMNITY NOT-LIKELY MED LIKELY MED NOT-LIKELY TOTAL TOTAL
POLICY PERIOD PAYROLL CASES AMOUNT CASES AMOUNT AMOUNT AMOUNT AMOUNT PURE PREM.7/07 through 6/08 23,574,396 5 158,800 19 176,841 701,475 468,442 1,505,558 6.397/08 through 6/09 25,156,082 3 45,144 16 132,830 107,396 646,020 931,390 3.707/09 through 6/10 25,377,452 2 21,231 6 36,698 49,998 332,546 440,473 1.747/10 through 6/11 25,640,290 0 0 19 149,781 0 350,513 500,294 1.957/11 through 6/12 27,954,185 3 83,729 17 179,868 98,185 514,129 875,911 3.13
5 YR. TOTAL 127,702,405 13 308,904 77 676,018 957,054 2,311,650 4,253,626 3.33INDEMNITY MEDICAL TOTAL
CRED. PURE PREM.* CRED. PURE PREM.* PURE PREM.*Indicated Pure Premium 33% 0.771 55% 2.560 3.33Pure Premium Indicated by National Relativity 33% 0.702 22% 1.553 2.26Pure Premium Present on Rate Level 34% 0.811 23% 2.232 3.04Pure Premium Derived by Formula 0.762 2.263 3.03
CLASS BRIDGE OR VEHICULAR TUNNEL OPERATION & DRIVERS
9019
Industry Group: Miscellaneous CONVERTED LOSSESHazard Group: E INDEMNITY LIKELY INDEMNITY NOT-LIKELY MED LIKELY MED NOT-LIKELY TOTAL TOTAL
POLICY PERIOD PAYROLL CASES AMOUNT CASES AMOUNT AMOUNT AMOUNT AMOUNT PURE PREM.7/07 through 6/08 245,308 0 0 0 0 0 0 0 0.007/08 through 6/09 239,378 0 0 0 0 0 0 0 0.007/09 through 6/10 243,163 0 0 0 0 0 0 0 0.007/10 through 6/11 224,884 0 0 0 0 0 0 0 0.007/11 through 6/12 270,400 0 0 0 0 0 0 0 0.00
5 YR. TOTAL 1,223,133 0 0 0 0 0 0 0 0.00INDEMNITY MEDICAL TOTAL
CRED. PURE PREM.* CRED. PURE PREM.* PURE PREM.*Indicated Pure Premium 5% 0.000 6% 0.000 0.00Pure Premium Indicated by National Relativity 23% 0.505 24% 1.453 1.96Pure Premium Present on Rate Level 72% 0.693 70% 0.899 1.59Pure Premium Derived by Formula 0.615 0.978 1.59
CLASS HOUSING AUTHORITY & CLERICAL, SALESPERSONS, DRIVERS
9033
Industry Group: Goods and Services CONVERTED LOSSESHazard Group: C INDEMNITY LIKELY INDEMNITY NOT-LIKELY MED LIKELY MED NOT-LIKELY TOTAL TOTAL
POLICY PERIOD PAYROLL CASES AMOUNT CASES AMOUNT AMOUNT AMOUNT AMOUNT PURE PREM.7/07 through 6/08 33,343,510 0 0 5 39,584 0 125,851 165,435 0.507/08 through 6/09 35,474,100 2 110,540 14 162,660 205,615 215,966 694,781 1.967/09 through 6/10 35,202,516 1 61,871 10 94,783 53,085 117,238 326,977 0.937/10 through 6/11 36,195,998 3 161,956 16 94,996 97,823 246,116 600,891 1.667/11 through 6/12 34,915,098 0 0 3 78,391 0 98,302 176,693 0.51
5 YR. TOTAL 175,131,222 6 334,367 48 470,414 356,523 803,473 1,964,777 1.12INDEMNITY MEDICAL TOTAL
CRED. PURE PREM.* CRED. PURE PREM.* PURE PREM.*Indicated Pure Premium 35% 0.460 46% 0.662 1.12Pure Premium Indicated by National Relativity 32% 0.861 27% 1.342 2.20Pure Premium Present on Rate Level 33% 0.730 27% 1.030 1.76Pure Premium Derived by Formula 0.677 0.945 1.62
Page 174
* Pure Premium per $100 of Payroll** Pure Premium per employee++ Non-Standard Calculation© Copyright 2014 National Council on Compensation Insurance, Inc. All Rights Reserved.

MISSOURI
EFFECTIVE 1/1/2015CLASS HOSPITAL: ALL OTHER EMPLOYEES
9040
Industry Group: Goods and Services CONVERTED LOSSESHazard Group: B INDEMNITY LIKELY INDEMNITY NOT-LIKELY MED LIKELY MED NOT-LIKELY TOTAL TOTAL
POLICY PERIOD PAYROLL CASES AMOUNT CASES AMOUNT AMOUNT AMOUNT AMOUNT PURE PREM.7/07 through 6/08 81,320,014 12 356,432 64 544,375 836,255 1,793,345 3,530,407 4.347/08 through 6/09 87,519,048 14 460,510 42 375,042 662,608 1,299,688 2,797,848 3.207/09 through 6/10 88,647,693 13 306,758 36 348,964 507,141 1,599,771 2,762,634 3.127/10 through 6/11 92,166,679 13 391,680 45 448,528 813,091 1,167,104 2,820,403 3.067/11 through 6/12 93,229,545 13 440,664 52 863,482 976,455 2,423,313 4,703,914 5.05
5 YR. TOTAL 442,882,979 65 1,956,044 239 2,580,391 3,795,550 8,283,221 16,615,206 3.75INDEMNITY MEDICAL TOTAL
CRED. PURE PREM.* CRED. PURE PREM.* PURE PREM.*Indicated Pure Premium 58% 1.024 93% 2.727 3.75Pure Premium Indicated by National Relativity 21% 1.161 3% 2.208 3.37Pure Premium Present on Rate Level 21% 1.014 4% 2.385 3.40Pure Premium Derived by Formula 1.051 2.698 3.75
CLASS CASINO GAMBLING-HOTEL-ALL EMPLOYEES & CLERICAL, SALESPERSONS, DRIVERS
9044
Industry Group: Goods and Services CONVERTED LOSSESHazard Group: B INDEMNITY LIKELY INDEMNITY NOT-LIKELY MED LIKELY MED NOT-LIKELY TOTAL TOTAL
POLICY PERIOD PAYROLL CASES AMOUNT CASES AMOUNT AMOUNT AMOUNT AMOUNT PURE PREM.7/07 through 6/08 231,995,006 15 299,539 56 631,338 654,041 1,339,454 2,924,372 1.267/08 through 6/09 246,087,738 18 379,824 60 612,588 534,025 1,230,668 2,757,105 1.127/09 through 6/10 231,872,161 12 161,123 48 689,270 120,024 1,266,569 2,236,986 0.977/10 through 6/11 225,958,346 14 235,908 45 846,752 196,407 1,541,422 2,820,489 1.257/11 through 6/12 164,652,485 7 179,786 41 290,576 212,637 688,151 1,371,150 0.83
5 YR. TOTAL 1,100,565,736 66 1,256,180 250 3,070,524 1,717,134 6,066,264 12,110,102 1.10INDEMNITY MEDICAL TOTAL
CRED. PURE PREM.* CRED. PURE PREM.* PURE PREM.*Indicated Pure Premium 58% 0.393 86% 0.707 1.10Pure Premium Indicated by National Relativity 21% 0.527 7% 0.980 1.51Pure Premium Present on Rate Level 21% 0.408 7% 0.804 1.21Pure Premium Derived by Formula 0.424 0.733 1.16
CLASS HOTEL: ALL OTHER EMPLOYEES & SALESPERSONS, DRIVERS
9052
Industry Group: Goods and Services CONVERTED LOSSESHazard Group: B INDEMNITY LIKELY INDEMNITY NOT-LIKELY MED LIKELY MED NOT-LIKELY TOTAL TOTAL
POLICY PERIOD PAYROLL CASES AMOUNT CASES AMOUNT AMOUNT AMOUNT AMOUNT PURE PREM.7/07 through 6/08 329,840,455 38 748,178 184 1,464,982 1,155,640 2,924,056 6,292,856 1.917/08 through 6/09 326,524,441 37 597,571 130 1,081,955 725,606 2,671,428 5,076,560 1.557/09 through 6/10 313,634,032 45 662,869 146 1,350,521 815,549 3,642,365 6,471,304 2.067/10 through 6/11 331,975,020 45 941,886 129 1,247,016 1,120,484 2,971,161 6,280,547 1.897/11 through 6/12 351,233,395 36 821,825 146 1,088,085 1,197,962 2,555,378 5,663,250 1.61
5 YR. TOTAL 1,653,207,343 201 3,772,329 735 6,232,559 5,015,241 14,764,388 29,784,517 1.80INDEMNITY MEDICAL TOTAL
CRED. PURE PREM.* CRED. PURE PREM.* PURE PREM.*Indicated Pure Premium 83% 0.605 100% 1.196 1.80Pure Premium Indicated by National Relativity 8% 0.764 0% 1.445 2.21Pure Premium Present on Rate Level 9% 0.657 0% 1.270 1.93Pure Premium Derived by Formula 0.622 1.196 1.82
Page 175
* Pure Premium per $100 of Payroll** Pure Premium per employee++ Non-Standard Calculation© Copyright 2014 National Council on Compensation Insurance, Inc. All Rights Reserved.

MISSOURI
EFFECTIVE 1/1/2015CLASS HOTEL: RESTAURANT EMPLOYEES
9058
Industry Group: Goods and Services CONVERTED LOSSESHazard Group: A INDEMNITY LIKELY INDEMNITY NOT-LIKELY MED LIKELY MED NOT-LIKELY TOTAL TOTAL
POLICY PERIOD PAYROLL CASES AMOUNT CASES AMOUNT AMOUNT AMOUNT AMOUNT PURE PREM.7/07 through 6/08 103,619,974 18 493,362 40 501,469 440,960 755,652 2,191,443 2.127/08 through 6/09 88,556,888 8 68,152 33 284,407 148,934 551,860 1,053,353 1.197/09 through 6/10 87,716,409 9 143,143 35 421,386 191,890 667,861 1,424,280 1.627/10 through 6/11 90,698,734 8 89,519 35 386,813 101,713 872,085 1,450,130 1.607/11 through 6/12 91,224,008 6 310,822 31 521,229 328,878 1,212,421 2,373,350 2.60
5 YR. TOTAL 461,816,013 49 1,104,998 174 2,115,304 1,212,375 4,059,879 8,492,556 1.84INDEMNITY MEDICAL TOTAL
CRED. PURE PREM.* CRED. PURE PREM.* PURE PREM.*Indicated Pure Premium 47% 0.697 67% 1.142 1.84Pure Premium Indicated by National Relativity 26% 0.487 16% 0.957 1.44Pure Premium Present on Rate Level 27% 0.574 17% 1.029 1.60Pure Premium Derived by Formula 0.609 1.093 1.70
CLASS CLUB - COUNTRY, GOLF, FISHING, OR YACHT - ALL EMPLOYEES & CLERICAL,
9060 SALESPERSONS, DRIVERS
Industry Group: Goods and Services CONVERTED LOSSESHazard Group: B INDEMNITY LIKELY INDEMNITY NOT-LIKELY MED LIKELY MED NOT-LIKELY TOTAL TOTAL
POLICY PERIOD PAYROLL CASES AMOUNT CASES AMOUNT AMOUNT AMOUNT AMOUNT PURE PREM.7/07 through 6/08 136,303,229 9 153,703 39 281,384 394,049 1,055,587 1,884,723 1.387/08 through 6/09 132,562,057 5 167,767 37 245,375 125,597 802,963 1,341,702 1.017/09 through 6/10 128,315,809 6 239,392 28 131,210 229,047 438,402 1,038,051 0.817/10 through 6/11 128,556,581 4 132,222 34 507,489 75,143 1,024,769 1,739,623 1.357/11 through 6/12 130,016,076 4 577,310 25 273,644 544,882 901,930 2,297,766 1.77
5 YR. TOTAL 655,753,752 28 1,270,394 163 1,439,102 1,368,718 4,223,651 8,301,865 1.27INDEMNITY MEDICAL TOTAL
CRED. PURE PREM.* CRED. PURE PREM.* PURE PREM.*Indicated Pure Premium 50% 0.413 71% 0.853 1.27Pure Premium Indicated by National Relativity 25% 0.496 14% 0.979 1.48Pure Premium Present on Rate Level 25% 0.471 15% 0.837 1.31Pure Premium Derived by Formula 0.448 0.868 1.32
CLASS CLUB NOC & CLERICAL
9061
Industry Group: Goods and Services CONVERTED LOSSESHazard Group: A INDEMNITY LIKELY INDEMNITY NOT-LIKELY MED LIKELY MED NOT-LIKELY TOTAL TOTAL
POLICY PERIOD PAYROLL CASES AMOUNT CASES AMOUNT AMOUNT AMOUNT AMOUNT PURE PREM.7/07 through 6/08 29,610,186 3 271,446 9 27,945 239,811 146,498 685,700 2.327/08 through 6/09 30,118,717 1 36,535 7 14,182 82,332 50,797 183,846 0.617/09 through 6/10 30,975,745 2 25,554 11 100,114 51,888 202,175 379,731 1.237/10 through 6/11 30,480,253 1 40,788 15 270,937 46,664 326,213 684,602 2.257/11 through 6/12 30,725,439 4 219,286 16 292,211 243,248 484,641 1,239,386 4.03
5 YR. TOTAL 151,910,340 11 593,609 58 705,389 663,943 1,210,324 3,173,265 2.09INDEMNITY MEDICAL TOTAL
CRED. PURE PREM.* CRED. PURE PREM.* PURE PREM.*Indicated Pure Premium 29% 0.855 42% 1.234 2.09Pure Premium Indicated by National Relativity 35% 0.414 29% 0.789 1.20Pure Premium Present on Rate Level 36% 0.512 29% 0.949 1.46Pure Premium Derived by Formula 0.577 1.022 1.60
Page 176
* Pure Premium per $100 of Payroll** Pure Premium per employee++ Non-Standard Calculation© Copyright 2014 National Council on Compensation Insurance, Inc. All Rights Reserved.

MISSOURI
EFFECTIVE 1/1/2015CLASS CASINO GAMBLING-ALL EMPLOYEES & CLERICAL, SALESPERSONS, DRIVERS
9062
Industry Group: Goods and Services CONVERTED LOSSESHazard Group: A INDEMNITY LIKELY INDEMNITY NOT-LIKELY MED LIKELY MED NOT-LIKELY TOTAL TOTAL
POLICY PERIOD PAYROLL CASES AMOUNT CASES AMOUNT AMOUNT AMOUNT AMOUNT PURE PREM.7/07 through 6/08 57,511,505 6 132,699 29 215,003 148,239 385,883 881,824 1.537/08 through 6/09 18,516,854 0 0 6 63,050 0 120,316 183,366 0.997/09 through 6/10 30,250,756 1 3,657 10 39,366 8,098 218,905 270,026 0.897/10 through 6/11 35,828,300 3 144,238 6 16,182 286,474 126,144 573,038 1.607/11 through 6/12 65,879,283 5 89,682 8 790,387 236,614 338,163 1,454,846 2.21
5 YR. TOTAL 207,986,698 15 370,276 59 1,123,988 679,425 1,189,411 3,363,100 1.62INDEMNITY MEDICAL TOTAL
CRED. PURE PREM.* CRED. PURE PREM.* PURE PREM.*Indicated Pure Premium 34% 0.718 49% 0.899 1.62Pure Premium Indicated by National Relativity 33% 0.471 25% 1.006 1.48Pure Premium Present on Rate Level 33% 0.553 26% 1.013 1.57Pure Premium Derived by Formula 0.582 0.955 1.54
CLASS YMCA, YWCA, YMHA OR YWHA, INSTITUTION - ALL EMPLOYEES & CLERICAL
9063
Industry Group: Goods and Services CONVERTED LOSSESHazard Group: B INDEMNITY LIKELY INDEMNITY NOT-LIKELY MED LIKELY MED NOT-LIKELY TOTAL TOTAL
POLICY PERIOD PAYROLL CASES AMOUNT CASES AMOUNT AMOUNT AMOUNT AMOUNT PURE PREM.7/07 through 6/08 133,112,799 9 242,413 29 168,602 342,279 492,358 1,245,652 0.947/08 through 6/09 130,806,691 3 65,937 25 157,333 149,721 533,316 906,307 0.697/09 through 6/10 136,729,240 4 57,332 33 305,534 91,286 1,048,942 1,503,094 1.107/10 through 6/11 137,567,907 6 95,706 38 248,537 59,230 693,067 1,096,540 0.807/11 through 6/12 156,644,427 6 202,834 31 410,351 744,458 1,153,289 2,510,932 1.60
5 YR. TOTAL 694,861,064 28 664,222 156 1,290,357 1,386,974 3,920,972 7,262,525 1.05INDEMNITY MEDICAL TOTAL
CRED. PURE PREM.* CRED. PURE PREM.* PURE PREM.*Indicated Pure Premium 41% 0.281 66% 0.764 1.05Pure Premium Indicated by National Relativity 29% 0.305 17% 0.695 1.00Pure Premium Present on Rate Level 30% 0.270 17% 0.644 0.91Pure Premium Derived by Formula 0.285 0.732 1.02
CLASS RESTAURANT NOC
9082
Industry Group: Goods and Services CONVERTED LOSSESHazard Group: A INDEMNITY LIKELY INDEMNITY NOT-LIKELY MED LIKELY MED NOT-LIKELY TOTAL TOTAL
POLICY PERIOD PAYROLL CASES AMOUNT CASES AMOUNT AMOUNT AMOUNT AMOUNT PURE PREM.7/07 through 6/08 1,212,994,466 93 1,725,871 544 3,260,791 3,194,416 7,999,303 16,180,381 1.337/08 through 6/09 1,211,974,447 95 2,214,080 508 3,261,899 3,392,770 7,910,234 16,778,983 1.397/09 through 6/10 1,282,139,700 70 1,340,841 529 3,542,031 1,577,737 9,058,937 15,519,546 1.217/10 through 6/11 1,286,233,955 64 1,597,803 489 3,630,897 2,035,501 8,989,829 16,254,030 1.267/11 through 6/12 1,302,752,123 72 1,595,396 469 3,578,642 2,304,150 9,184,761 16,662,949 1.28
5 YR. TOTAL 6,296,094,691 394 8,473,991 2,539 17,274,260 12,504,574 43,143,064 81,395,889 1.29INDEMNITY MEDICAL TOTAL
CRED. PURE PREM.* CRED. PURE PREM.* PURE PREM.*Indicated Pure Premium 100% 0.409 100% 0.884 1.29Pure Premium Indicated by National Relativity 0% 0.427 0% 0.910 1.34Pure Premium Present on Rate Level 0% 0.427 0% 0.945 1.37Pure Premium Derived by Formula 0.409 0.884 1.29
Page 177
* Pure Premium per $100 of Payroll** Pure Premium per employee++ Non-Standard Calculation© Copyright 2014 National Council on Compensation Insurance, Inc. All Rights Reserved.

MISSOURI
EFFECTIVE 1/1/2015CLASS RESTAURANT: FAST FOOD
9083
Industry Group: Goods and Services CONVERTED LOSSESHazard Group: A INDEMNITY LIKELY INDEMNITY NOT-LIKELY MED LIKELY MED NOT-LIKELY TOTAL TOTAL
POLICY PERIOD PAYROLL CASES AMOUNT CASES AMOUNT AMOUNT AMOUNT AMOUNT PURE PREM.7/07 through 6/08 777,117,985 62 1,058,518 322 1,741,117 2,344,494 5,088,531 10,232,660 1.327/08 through 6/09 772,063,415 72 1,378,915 283 1,128,970 1,962,642 4,108,929 8,579,456 1.117/09 through 6/10 789,526,009 62 1,386,822 253 1,319,142 1,944,277 4,205,239 8,855,480 1.127/10 through 6/11 827,947,235 64 1,135,967 293 1,520,015 1,713,450 4,539,768 8,909,200 1.087/11 through 6/12 876,832,533 53 1,046,301 285 1,792,674 1,655,951 5,126,824 9,621,750 1.10
5 YR. TOTAL 4,043,487,177 313 6,006,523 1,436 7,501,918 9,620,814 23,069,291 46,198,546 1.14INDEMNITY MEDICAL TOTAL
CRED. PURE PREM.* CRED. PURE PREM.* PURE PREM.*Indicated Pure Premium 94% 0.334 100% 0.808 1.14Pure Premium Indicated by National Relativity 3% 0.435 0% 0.942 1.38Pure Premium Present on Rate Level 3% 0.365 0% 0.873 1.24Pure Premium Derived by Formula 0.338 0.808 1.15
CLASS BAR, DISCOTHEQUE, LOUNGE, NIGHT CLUB OR TAVERN
9084
Industry Group: Goods and Services CONVERTED LOSSESHazard Group: C INDEMNITY LIKELY INDEMNITY NOT-LIKELY MED LIKELY MED NOT-LIKELY TOTAL TOTAL
POLICY PERIOD PAYROLL CASES AMOUNT CASES AMOUNT AMOUNT AMOUNT AMOUNT PURE PREM.7/07 through 6/08 38,741,849 3 44,846 10 59,282 18,377 257,778 380,283 0.987/08 through 6/09 40,357,238 0 0 15 79,362 0 250,531 329,893 0.827/09 through 6/10 43,187,046 1 60,960 16 176,731 39,664 500,376 777,731 1.807/10 through 6/11 44,563,178 3 64,004 14 84,556 107,430 306,036 562,026 1.267/11 through 6/12 47,330,355 3 212,115 17 256,706 431,140 440,373 1,340,334 2.83
5 YR. TOTAL 214,179,666 10 381,925 72 656,637 596,611 1,755,094 3,390,267 1.58INDEMNITY MEDICAL TOTAL
CRED. PURE PREM.* CRED. PURE PREM.* PURE PREM.*Indicated Pure Premium 31% 0.485 48% 1.098 1.58Pure Premium Indicated by National Relativity 34% 0.466 26% 1.050 1.52Pure Premium Present on Rate Level 35% 0.426 26% 0.946 1.37Pure Premium Derived by Formula 0.458 1.046 1.50
CLASS BILLIARD HALL
9089
Industry Group: Goods and Services CONVERTED LOSSESHazard Group: B INDEMNITY LIKELY INDEMNITY NOT-LIKELY MED LIKELY MED NOT-LIKELY TOTAL TOTAL
POLICY PERIOD PAYROLL CASES AMOUNT CASES AMOUNT AMOUNT AMOUNT AMOUNT PURE PREM.7/07 through 6/08 511,987 0 0 0 0 0 790 790 0.157/08 through 6/09 358,978 0 0 0 0 0 0 0 0.007/09 through 6/10 365,308 1 14,585 0 0 3,758 0 18,343 5.027/10 through 6/11 346,550 0 0 0 0 0 0 0 0.007/11 through 6/12 545,224 1 17,450 0 0 11,035 288 28,773 5.28
5 YR. TOTAL 2,128,047 2 32,035 0 0 14,793 1,078 47,906 2.25INDEMNITY MEDICAL TOTAL
CRED. PURE PREM.* CRED. PURE PREM.* PURE PREM.*Indicated Pure Premium 5% 1.505 7% 0.746 2.25Pure Premium Indicated by National Relativity 18% 0.360 19% 1.588 1.95Pure Premium Present on Rate Level 77% 0.461 74% 0.696 1.16Pure Premium Derived by Formula 0.495 0.869 1.36
Page 178
* Pure Premium per $100 of Payroll** Pure Premium per employee++ Non-Standard Calculation© Copyright 2014 National Council on Compensation Insurance, Inc. All Rights Reserved.
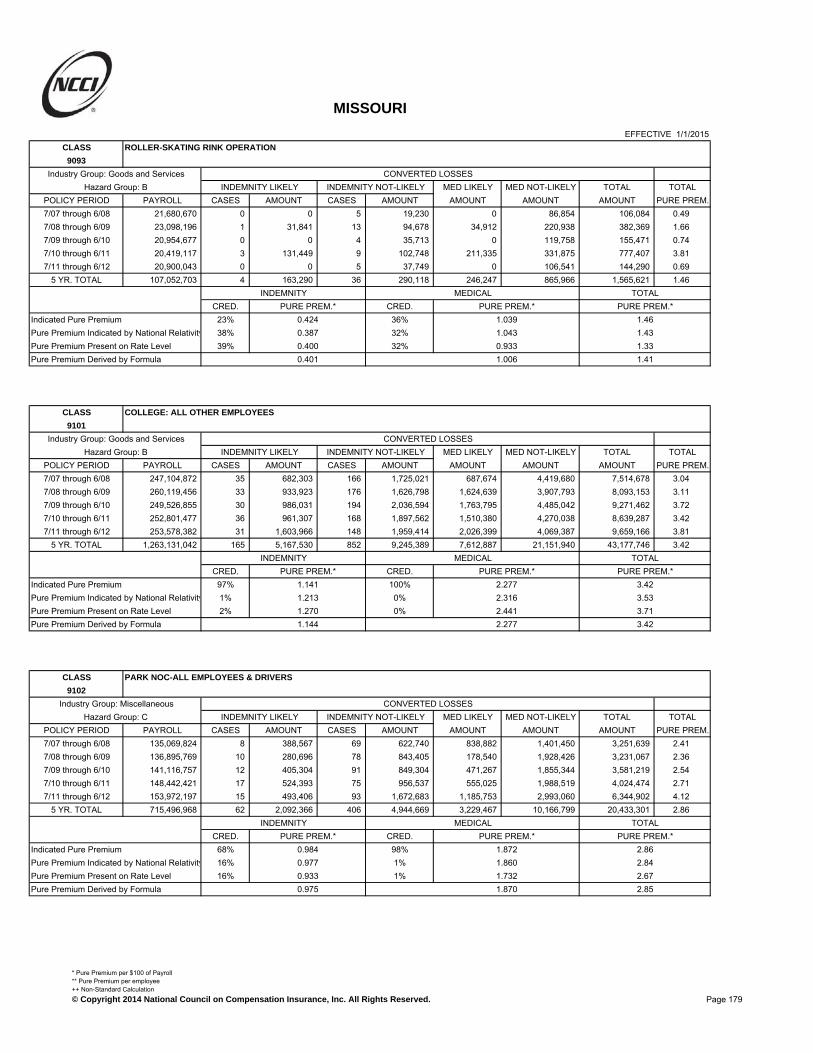
MISSOURI
EFFECTIVE 1/1/2015CLASS ROLLER-SKATING RINK OPERATION
9093
Industry Group: Goods and Services CONVERTED LOSSESHazard Group: B INDEMNITY LIKELY INDEMNITY NOT-LIKELY MED LIKELY MED NOT-LIKELY TOTAL TOTAL
POLICY PERIOD PAYROLL CASES AMOUNT CASES AMOUNT AMOUNT AMOUNT AMOUNT PURE PREM.7/07 through 6/08 21,680,670 0 0 5 19,230 0 86,854 106,084 0.497/08 through 6/09 23,098,196 1 31,841 13 94,678 34,912 220,938 382,369 1.667/09 through 6/10 20,954,677 0 0 4 35,713 0 119,758 155,471 0.747/10 through 6/11 20,419,117 3 131,449 9 102,748 211,335 331,875 777,407 3.817/11 through 6/12 20,900,043 0 0 5 37,749 0 106,541 144,290 0.69
5 YR. TOTAL 107,052,703 4 163,290 36 290,118 246,247 865,966 1,565,621 1.46INDEMNITY MEDICAL TOTAL
CRED. PURE PREM.* CRED. PURE PREM.* PURE PREM.*Indicated Pure Premium 23% 0.424 36% 1.039 1.46Pure Premium Indicated by National Relativity 38% 0.387 32% 1.043 1.43Pure Premium Present on Rate Level 39% 0.400 32% 0.933 1.33Pure Premium Derived by Formula 0.401 1.006 1.41
CLASS COLLEGE: ALL OTHER EMPLOYEES
9101
Industry Group: Goods and Services CONVERTED LOSSESHazard Group: B INDEMNITY LIKELY INDEMNITY NOT-LIKELY MED LIKELY MED NOT-LIKELY TOTAL TOTAL
POLICY PERIOD PAYROLL CASES AMOUNT CASES AMOUNT AMOUNT AMOUNT AMOUNT PURE PREM.7/07 through 6/08 247,104,872 35 682,303 166 1,725,021 687,674 4,419,680 7,514,678 3.047/08 through 6/09 260,119,456 33 933,923 176 1,626,798 1,624,639 3,907,793 8,093,153 3.117/09 through 6/10 249,526,855 30 986,031 194 2,036,594 1,763,795 4,485,042 9,271,462 3.727/10 through 6/11 252,801,477 36 961,307 168 1,897,562 1,510,380 4,270,038 8,639,287 3.427/11 through 6/12 253,578,382 31 1,603,966 148 1,959,414 2,026,399 4,069,387 9,659,166 3.81
5 YR. TOTAL 1,263,131,042 165 5,167,530 852 9,245,389 7,612,887 21,151,940 43,177,746 3.42INDEMNITY MEDICAL TOTAL
CRED. PURE PREM.* CRED. PURE PREM.* PURE PREM.*Indicated Pure Premium 97% 1.141 100% 2.277 3.42Pure Premium Indicated by National Relativity 1% 1.213 0% 2.316 3.53Pure Premium Present on Rate Level 2% 1.270 0% 2.441 3.71Pure Premium Derived by Formula 1.144 2.277 3.42
CLASS PARK NOC-ALL EMPLOYEES & DRIVERS
9102
Industry Group: Miscellaneous CONVERTED LOSSESHazard Group: C INDEMNITY LIKELY INDEMNITY NOT-LIKELY MED LIKELY MED NOT-LIKELY TOTAL TOTAL
POLICY PERIOD PAYROLL CASES AMOUNT CASES AMOUNT AMOUNT AMOUNT AMOUNT PURE PREM.7/07 through 6/08 135,069,824 8 388,567 69 622,740 838,882 1,401,450 3,251,639 2.417/08 through 6/09 136,895,769 10 280,696 78 843,405 178,540 1,928,426 3,231,067 2.367/09 through 6/10 141,116,757 12 405,304 91 849,304 471,267 1,855,344 3,581,219 2.547/10 through 6/11 148,442,421 17 524,393 75 956,537 555,025 1,988,519 4,024,474 2.717/11 through 6/12 153,972,197 15 493,406 93 1,672,683 1,185,753 2,993,060 6,344,902 4.12
5 YR. TOTAL 715,496,968 62 2,092,366 406 4,944,669 3,229,467 10,166,799 20,433,301 2.86INDEMNITY MEDICAL TOTAL
CRED. PURE PREM.* CRED. PURE PREM.* PURE PREM.*Indicated Pure Premium 68% 0.984 98% 1.872 2.86Pure Premium Indicated by National Relativity 16% 0.977 1% 1.860 2.84Pure Premium Present on Rate Level 16% 0.933 1% 1.732 2.67Pure Premium Derived by Formula 0.975 1.870 2.85
Page 179
* Pure Premium per $100 of Payroll** Pure Premium per employee++ Non-Standard Calculation© Copyright 2014 National Council on Compensation Insurance, Inc. All Rights Reserved.

MISSOURI
EFFECTIVE 1/1/2015CLASS CHARITABLE OR WELFARE ORGANIZATION-ALL OTHER EMPLOYEES & DRIVERS
9110
Industry Group: Goods and Services CONVERTED LOSSESHazard Group: C INDEMNITY LIKELY INDEMNITY NOT-LIKELY MED LIKELY MED NOT-LIKELY TOTAL TOTAL
POLICY PERIOD PAYROLL CASES AMOUNT CASES AMOUNT AMOUNT AMOUNT AMOUNT PURE PREM.7/07 through 6/08 52,703,757 9 182,941 32 312,802 265,149 1,040,635 1,801,527 3.427/08 through 6/09 56,647,502 5 49,108 54 284,436 52,581 1,185,204 1,571,329 2.777/09 through 6/10 64,405,022 10 144,101 62 365,239 260,775 1,152,816 1,922,931 2.997/10 through 6/11 70,993,963 9 203,517 55 1,024,243 299,965 1,431,690 2,959,415 4.177/11 through 6/12 69,817,600 7 331,363 47 590,519 381,887 1,421,343 2,725,112 3.90
5 YR. TOTAL 314,567,844 40 911,030 250 2,577,239 1,260,357 6,231,688 10,980,314 3.49INDEMNITY MEDICAL TOTAL
CRED. PURE PREM.* CRED. PURE PREM.* PURE PREM.*Indicated Pure Premium 51% 1.109 78% 2.382 3.49Pure Premium Indicated by National Relativity 24% 0.526 11% 0.957 1.48Pure Premium Present on Rate Level 25% 1.016 11% 2.205 3.22Pure Premium Derived by Formula 0.946 2.206 3.15
CLASS THEATER NOC: ALL OTHER EMPLOYEES
9154
Industry Group: Miscellaneous CONVERTED LOSSESHazard Group: C INDEMNITY LIKELY INDEMNITY NOT-LIKELY MED LIKELY MED NOT-LIKELY TOTAL TOTAL
POLICY PERIOD PAYROLL CASES AMOUNT CASES AMOUNT AMOUNT AMOUNT AMOUNT PURE PREM.7/07 through 6/08 71,507,174 4 26,063 21 149,221 45,139 397,918 618,341 0.877/08 through 6/09 73,204,133 2 88,784 21 155,623 109,697 644,382 998,486 1.367/09 through 6/10 71,318,178 2 106,935 19 360,732 240,559 842,707 1,550,933 2.187/10 through 6/11 75,721,755 2 67,012 19 800,261 27,358 691,106 1,585,737 2.097/11 through 6/12 80,373,879 2 35,192 24 222,269 237,018 614,350 1,108,829 1.38
5 YR. TOTAL 372,125,119 12 323,986 104 1,688,106 659,771 3,190,463 5,862,326 1.58INDEMNITY MEDICAL TOTAL
CRED. PURE PREM.* CRED. PURE PREM.* PURE PREM.*Indicated Pure Premium 43% 0.541 62% 1.035 1.58Pure Premium Indicated by National Relativity 28% 0.573 19% 1.056 1.63Pure Premium Present on Rate Level 29% 0.579 19% 1.086 1.67Pure Premium Derived by Formula 0.561 1.049 1.61
CLASS THEATER NOC: PLAYERS, ENTERTAINERS OR MUSICIANS
9156
Industry Group: Office and Clerical CONVERTED LOSSESHazard Group: D INDEMNITY LIKELY INDEMNITY NOT-LIKELY MED LIKELY MED NOT-LIKELY TOTAL TOTAL
POLICY PERIOD PAYROLL CASES AMOUNT CASES AMOUNT AMOUNT AMOUNT AMOUNT PURE PREM.7/07 through 6/08 40,046,600 1 35,071 10 104,020 23,046 295,351 457,488 1.147/08 through 6/09 35,839,278 1 23,892 13 307,682 2,976 463,316 797,866 2.237/09 through 6/10 36,157,984 2 90,345 15 170,877 7,572 497,718 766,512 2.127/10 through 6/11 34,965,574 3 224,382 14 200,068 137,681 381,807 943,938 2.707/11 through 6/12 34,909,936 3 112,196 10 128,193 38,227 349,811 628,427 1.80
5 YR. TOTAL 181,919,372 10 485,886 62 910,840 209,502 1,988,003 3,594,231 1.98INDEMNITY MEDICAL TOTAL
CRED. PURE PREM.* CRED. PURE PREM.* PURE PREM.*Indicated Pure Premium 35% 0.768 49% 1.208 1.98Pure Premium Indicated by National Relativity 32% 0.751 25% 1.353 2.10Pure Premium Present on Rate Level 33% 0.646 26% 1.137 1.78Pure Premium Derived by Formula 0.722 1.226 1.95
Page 180
* Pure Premium per $100 of Payroll** Pure Premium per employee++ Non-Standard Calculation© Copyright 2014 National Council on Compensation Insurance, Inc. All Rights Reserved.

MISSOURI
EFFECTIVE 1/1/2015CLASS JANITORIAL SERVICES BY CONTRACTORS - INCLUDES WINDOW CLEANING ABOVE GROUND
9170 LEVEL & DRIVERS
Industry Group: Goods and Services CONVERTED LOSSESHazard Group: G INDEMNITY LIKELY INDEMNITY NOT-LIKELY MED LIKELY MED NOT-LIKELY TOTAL TOTAL
POLICY PERIOD PAYROLL CASES AMOUNT CASES AMOUNT AMOUNT AMOUNT AMOUNT PURE PREM.7/07 through 6/08 6,273,196 1 44,709 6 75,063 51,395 103,388 274,555 4.387/08 through 6/09 3,724,422 0 0 2 8,553 0 32,114 40,667 1.097/09 through 6/10 5,082,647 0 0 5 94,606 0 190,881 285,487 5.627/10 through 6/11 6,479,199 1 6,382 15 202,039 1,286 882,355 1,092,062 16.867/11 through 6/12 5,121,057 1 156,855 4 55,651 964,591 103,219 1,280,316 25.00
5 YR. TOTAL 26,680,521 3 207,946 32 435,912 1,017,272 1,311,957 2,973,087 11.14INDEMNITY MEDICAL TOTAL
CRED. PURE PREM.* CRED. PURE PREM.* PURE PREM.*Indicated Pure Premium 25% 2.413 36% 8.730 11.14Pure Premium Indicated by National Relativity 37% 2.557 32% 5.059 7.62Pure Premium Present on Rate Level 38% 2.070 32% 3.847 5.92Pure Premium Derived by Formula 2.336 5.993 8.33
CLASS ATHLETIC SPORTS OR PARK: NONCONTACT SPORTS
9178
Industry Group: Miscellaneous CONVERTED LOSSESHazard Group: A INDEMNITY LIKELY INDEMNITY NOT-LIKELY MED LIKELY MED NOT-LIKELY TOTAL TOTAL
POLICY PERIOD PAYROLL CASES AMOUNT CASES AMOUNT AMOUNT AMOUNT AMOUNT PURE PREM.7/07 through 6/08 6,789,982 0 0 4 65,414 0 532,760 598,174 8.817/08 through 6/09 7,053,682 1 24,042 5 55,487 0 390,454 469,983 6.667/09 through 6/10 11,151,270 0 0 5 73,567 0 798,184 871,751 7.827/10 through 6/11 6,528,684 3 85,785 7 73,780 93,009 868,052 1,120,626 17.177/11 through 6/12 6,675,810 0 0 6 255,505 0 463,271 718,776 10.77
5 YR. TOTAL 38,199,428 4 109,827 27 523,753 93,009 3,052,721 3,779,310 9.89INDEMNITY MEDICAL TOTAL
CRED. PURE PREM.* CRED. PURE PREM.* PURE PREM.*Indicated Pure Premium 31% 1.659 57% 8.235 9.89Pure Premium Indicated by National Relativity 0% 0.000 0% 0.000 0.00Pure Premium Present on Rate Level 69% 2.468 43% 8.450 10.92Pure Premium Derived by Formula 2.217 8.327 10.54
CLASS ATHLETIC SPORTS OR PARK: CONTACT SPORTS
9179
Industry Group: Miscellaneous CONVERTED LOSSESHazard Group: B INDEMNITY LIKELY INDEMNITY NOT-LIKELY MED LIKELY MED NOT-LIKELY TOTAL TOTAL
POLICY PERIOD PAYROLL CASES AMOUNT CASES AMOUNT AMOUNT AMOUNT AMOUNT PURE PREM.7/07 through 6/08 4,740,929 9 397,880 7 118,368 44,082 604,652 1,164,982 24.577/08 through 6/09 9,996,773 12 462,756 33 445,756 37,065 1,824,625 2,770,202 27.717/09 through 6/10 14,675,955 19 449,578 38 475,466 54,072 1,268,150 2,247,266 15.317/10 through 6/11 12,111,952 10 339,118 30 381,727 33,550 1,649,411 2,403,806 19.857/11 through 6/12 11,471,984 5 163,552 13 154,363 23,673 1,004,347 1,345,935 11.73
5 YR. TOTAL 52,997,593 55 1,812,884 121 1,575,680 192,442 6,351,185 9,932,191 18.74INDEMNITY MEDICAL TOTAL
CRED. PURE PREM.* CRED. PURE PREM.* PURE PREM.*Indicated Pure Premium 50% 6.394 76% 12.347 18.74Pure Premium Indicated by National Relativity 0% 0.000 0% 0.000 0.00Pure Premium Present on Rate Level 50% 5.991 24% 12.601 18.59Pure Premium Derived by Formula 6.193 12.408 18.60
Page 181
* Pure Premium per $100 of Payroll** Pure Premium per employee++ Non-Standard Calculation© Copyright 2014 National Council on Compensation Insurance, Inc. All Rights Reserved.
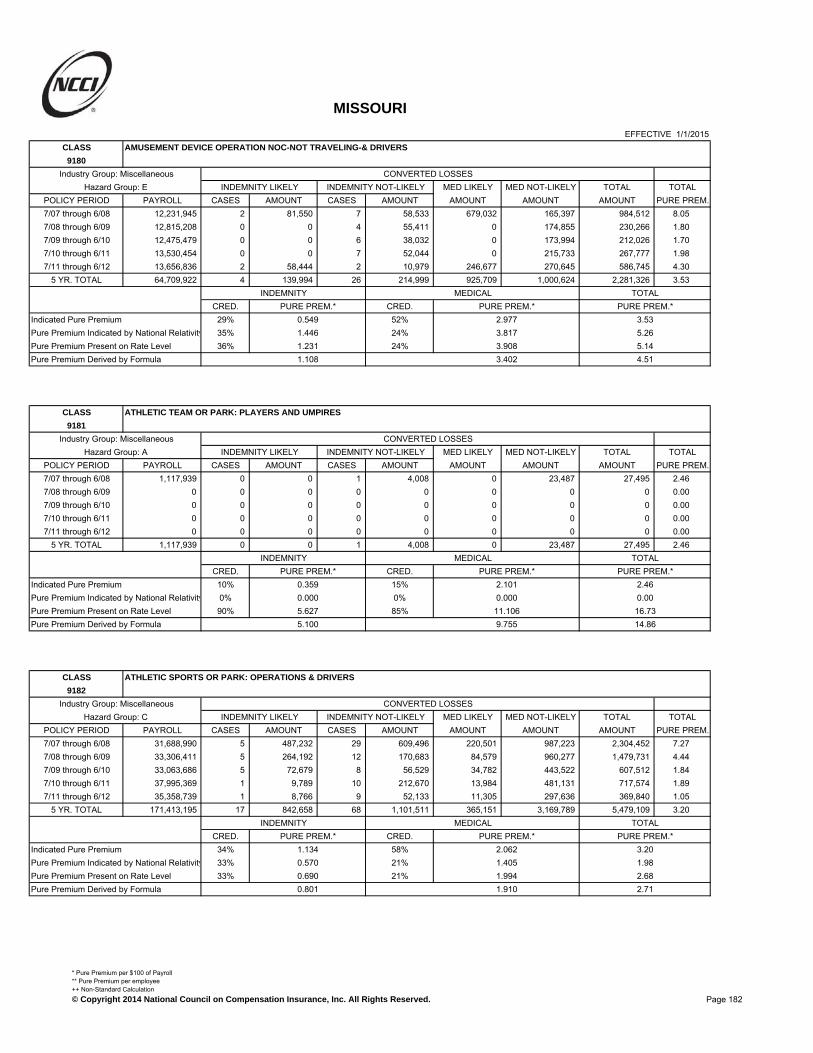
MISSOURI
EFFECTIVE 1/1/2015CLASS AMUSEMENT DEVICE OPERATION NOC-NOT TRAVELING-& DRIVERS
9180
Industry Group: Miscellaneous CONVERTED LOSSESHazard Group: E INDEMNITY LIKELY INDEMNITY NOT-LIKELY MED LIKELY MED NOT-LIKELY TOTAL TOTAL
POLICY PERIOD PAYROLL CASES AMOUNT CASES AMOUNT AMOUNT AMOUNT AMOUNT PURE PREM.7/07 through 6/08 12,231,945 2 81,550 7 58,533 679,032 165,397 984,512 8.057/08 through 6/09 12,815,208 0 0 4 55,411 0 174,855 230,266 1.807/09 through 6/10 12,475,479 0 0 6 38,032 0 173,994 212,026 1.707/10 through 6/11 13,530,454 0 0 7 52,044 0 215,733 267,777 1.987/11 through 6/12 13,656,836 2 58,444 2 10,979 246,677 270,645 586,745 4.30
5 YR. TOTAL 64,709,922 4 139,994 26 214,999 925,709 1,000,624 2,281,326 3.53INDEMNITY MEDICAL TOTAL
CRED. PURE PREM.* CRED. PURE PREM.* PURE PREM.*Indicated Pure Premium 29% 0.549 52% 2.977 3.53Pure Premium Indicated by National Relativity 35% 1.446 24% 3.817 5.26Pure Premium Present on Rate Level 36% 1.231 24% 3.908 5.14Pure Premium Derived by Formula 1.108 3.402 4.51
CLASS ATHLETIC TEAM OR PARK: PLAYERS AND UMPIRES
9181
Industry Group: Miscellaneous CONVERTED LOSSESHazard Group: A INDEMNITY LIKELY INDEMNITY NOT-LIKELY MED LIKELY MED NOT-LIKELY TOTAL TOTAL
POLICY PERIOD PAYROLL CASES AMOUNT CASES AMOUNT AMOUNT AMOUNT AMOUNT PURE PREM.7/07 through 6/08 1,117,939 0 0 1 4,008 0 23,487 27,495 2.467/08 through 6/09 0 0 0 0 0 0 0 0 0.007/09 through 6/10 0 0 0 0 0 0 0 0 0.007/10 through 6/11 0 0 0 0 0 0 0 0 0.007/11 through 6/12 0 0 0 0 0 0 0 0 0.00
5 YR. TOTAL 1,117,939 0 0 1 4,008 0 23,487 27,495 2.46INDEMNITY MEDICAL TOTAL
CRED. PURE PREM.* CRED. PURE PREM.* PURE PREM.*Indicated Pure Premium 10% 0.359 15% 2.101 2.46Pure Premium Indicated by National Relativity 0% 0.000 0% 0.000 0.00Pure Premium Present on Rate Level 90% 5.627 85% 11.106 16.73Pure Premium Derived by Formula 5.100 9.755 14.86
CLASS ATHLETIC SPORTS OR PARK: OPERATIONS & DRIVERS
9182
Industry Group: Miscellaneous CONVERTED LOSSESHazard Group: C INDEMNITY LIKELY INDEMNITY NOT-LIKELY MED LIKELY MED NOT-LIKELY TOTAL TOTAL
POLICY PERIOD PAYROLL CASES AMOUNT CASES AMOUNT AMOUNT AMOUNT AMOUNT PURE PREM.7/07 through 6/08 31,688,990 5 487,232 29 609,496 220,501 987,223 2,304,452 7.277/08 through 6/09 33,306,411 5 264,192 12 170,683 84,579 960,277 1,479,731 4.447/09 through 6/10 33,063,686 5 72,679 8 56,529 34,782 443,522 607,512 1.847/10 through 6/11 37,995,369 1 9,789 10 212,670 13,984 481,131 717,574 1.897/11 through 6/12 35,358,739 1 8,766 9 52,133 11,305 297,636 369,840 1.05
5 YR. TOTAL 171,413,195 17 842,658 68 1,101,511 365,151 3,169,789 5,479,109 3.20INDEMNITY MEDICAL TOTAL
CRED. PURE PREM.* CRED. PURE PREM.* PURE PREM.*Indicated Pure Premium 34% 1.134 58% 2.062 3.20Pure Premium Indicated by National Relativity 33% 0.570 21% 1.405 1.98Pure Premium Present on Rate Level 33% 0.690 21% 1.994 2.68Pure Premium Derived by Formula 0.801 1.910 2.71
Page 182
* Pure Premium per $100 of Payroll** Pure Premium per employee++ Non-Standard Calculation© Copyright 2014 National Council on Compensation Insurance, Inc. All Rights Reserved.

MISSOURI
EFFECTIVE 1/1/2015CLASS CARNIVAL, CIRCUS OR AMUSEMENT DEVICE OPERATOR-TRAVELING-ALL EMPLOYEES &
9186 DRIVERS
Industry Group: Miscellaneous CONVERTED LOSSESHazard Group: F INDEMNITY LIKELY INDEMNITY NOT-LIKELY MED LIKELY MED NOT-LIKELY TOTAL TOTAL
POLICY PERIOD PAYROLL CASES AMOUNT CASES AMOUNT AMOUNT AMOUNT AMOUNT PURE PREM.7/07 through 6/08 1,692,367 0 0 0 0 0 9,477 9,477 0.567/08 through 6/09 2,086,593 0 0 2 98,142 0 295,984 394,126 18.897/09 through 6/10 2,312,335 1 55,563 1 10,281 31,343 18,040 115,227 4.987/10 through 6/11 2,161,403 2 182,299 1 4,044 424,122 54,393 664,858 30.767/11 through 6/12 2,747,270 1 194,318 2 39,292 224,899 105,314 563,823 20.52
5 YR. TOTAL 10,999,968 4 432,180 6 151,759 680,364 483,208 1,747,511 15.89INDEMNITY MEDICAL TOTAL
CRED. PURE PREM.* CRED. PURE PREM.* PURE PREM.*Indicated Pure Premium 20% 5.309 33% 10.578 15.89Pure Premium Indicated by National Relativity 40% 3.234 33% 7.677 10.91Pure Premium Present on Rate Level 40% 2.846 34% 7.343 10.19Pure Premium Derived by Formula 3.494 8.521 12.02
CLASS CEMETERY OPERATIONS & DRIVERS
9220
Industry Group: Goods and Services CONVERTED LOSSESHazard Group: D INDEMNITY LIKELY INDEMNITY NOT-LIKELY MED LIKELY MED NOT-LIKELY TOTAL TOTAL
POLICY PERIOD PAYROLL CASES AMOUNT CASES AMOUNT AMOUNT AMOUNT AMOUNT PURE PREM.7/07 through 6/08 13,489,120 3 95,853 9 108,810 82,955 197,235 484,853 3.597/08 through 6/09 13,667,198 3 326,104 10 68,667 589,122 180,286 1,164,179 8.527/09 through 6/10 13,433,584 2 16,011 14 152,800 6,271 809,566 984,648 7.337/10 through 6/11 13,513,198 1 116,012 7 84,936 105,465 136,011 442,424 3.277/11 through 6/12 13,774,771 0 0 15 211,718 0 442,978 654,696 4.75
5 YR. TOTAL 67,877,871 9 553,980 55 626,931 783,813 1,766,076 3,730,800 5.50INDEMNITY MEDICAL TOTAL
CRED. PURE PREM.* CRED. PURE PREM.* PURE PREM.*Indicated Pure Premium 34% 1.740 49% 3.757 5.50Pure Premium Indicated by National Relativity 33% 1.929 25% 3.097 5.03Pure Premium Present on Rate Level 33% 1.736 26% 3.217 4.95Pure Premium Derived by Formula 1.801 3.452 5.25
CLASS STREET CLEANING & DRIVERS
9402
Industry Group: Miscellaneous CONVERTED LOSSESHazard Group: E INDEMNITY LIKELY INDEMNITY NOT-LIKELY MED LIKELY MED NOT-LIKELY TOTAL TOTAL
POLICY PERIOD PAYROLL CASES AMOUNT CASES AMOUNT AMOUNT AMOUNT AMOUNT PURE PREM.7/07 through 6/08 18,134,743 3 124,108 2 71,067 189,059 82,024 466,258 2.577/08 through 6/09 20,172,629 6 134,782 9 162,555 123,601 227,805 648,743 3.227/09 through 6/10 24,239,044 2 57,852 12 305,425 51,843 509,690 924,810 3.827/10 through 6/11 22,550,797 4 79,918 16 151,927 54,749 226,029 512,623 2.277/11 through 6/12 25,196,732 2 220,384 11 238,090 90,191 598,955 1,147,620 4.56
5 YR. TOTAL 110,293,945 17 617,044 50 929,064 509,443 1,644,503 3,700,054 3.36INDEMNITY MEDICAL TOTAL
CRED. PURE PREM.* CRED. PURE PREM.* PURE PREM.*Indicated Pure Premium 41% 1.402 49% 1.953 3.36Pure Premium Indicated by National Relativity 29% 2.028 25% 2.705 4.73Pure Premium Present on Rate Level 30% 1.687 26% 2.022 3.71Pure Premium Derived by Formula 1.669 2.159 3.83
Page 183
* Pure Premium per $100 of Payroll** Pure Premium per employee++ Non-Standard Calculation© Copyright 2014 National Council on Compensation Insurance, Inc. All Rights Reserved.

MISSOURI
EFFECTIVE 1/1/2015CLASS GARBAGE, ASHES OR REFUSE COLLECTION & DRIVERS
9403
Industry Group: Miscellaneous CONVERTED LOSSESHazard Group: F INDEMNITY LIKELY INDEMNITY NOT-LIKELY MED LIKELY MED NOT-LIKELY TOTAL TOTAL
POLICY PERIOD PAYROLL CASES AMOUNT CASES AMOUNT AMOUNT AMOUNT AMOUNT PURE PREM.7/07 through 6/08 104,560,986 22 1,477,102 93 1,305,078 1,877,105 3,091,764 7,751,049 7.417/08 through 6/09 110,217,216 27 1,277,624 91 1,797,318 1,224,925 3,131,428 7,431,295 6.747/09 through 6/10 99,347,217 14 756,553 75 1,305,667 1,242,027 2,516,921 5,821,168 5.867/10 through 6/11 108,878,961 15 628,380 91 1,181,071 493,396 2,734,236 5,037,083 4.637/11 through 6/12 104,164,817 15 941,514 73 1,511,884 955,758 2,449,502 5,858,658 5.62
5 YR. TOTAL 527,169,197 93 5,081,173 423 7,101,018 5,793,211 13,923,851 31,899,253 6.05INDEMNITY MEDICAL TOTAL
CRED. PURE PREM.* CRED. PURE PREM.* PURE PREM.*Indicated Pure Premium 97% 2.311 100% 3.740 6.05Pure Premium Indicated by National Relativity 1% 2.770 0% 3.978 6.75Pure Premium Present on Rate Level 2% 3.110 0% 4.182 7.29Pure Premium Derived by Formula 2.332 3.740 6.07
CLASS MUNICIPAL, TOWNSHIP, COUNTY OR STATE EMPLOYEE NOC
9410
Industry Group: Goods and Services CONVERTED LOSSESHazard Group: C INDEMNITY LIKELY INDEMNITY NOT-LIKELY MED LIKELY MED NOT-LIKELY TOTAL TOTAL
POLICY PERIOD PAYROLL CASES AMOUNT CASES AMOUNT AMOUNT AMOUNT AMOUNT PURE PREM.7/07 through 6/08 18,360,225 4 78,521 18 184,873 164,435 315,574 743,403 4.057/08 through 6/09 18,220,202 3 86,764 13 113,140 197,995 259,328 657,227 3.617/09 through 6/10 17,464,235 3 109,380 13 102,057 312,363 339,104 862,904 4.947/10 through 6/11 17,070,708 0 0 14 192,939 0 381,119 574,058 3.367/11 through 6/12 17,651,338 1 13,415 12 93,169 26,901 480,626 614,111 3.48
5 YR. TOTAL 88,766,708 11 288,080 70 686,178 701,694 1,775,751 3,451,703 3.89INDEMNITY MEDICAL TOTAL
CRED. PURE PREM.* CRED. PURE PREM.* PURE PREM.*Indicated Pure Premium 33% 1.098 48% 2.791 3.89Pure Premium Indicated by National Relativity 33% 0.736 26% 1.118 1.85Pure Premium Present on Rate Level 34% 1.216 26% 2.361 3.58Pure Premium Derived by Formula 1.019 2.244 3.26
CLASS PAINTING: SHOP ONLY & DRIVERS
9501
Industry Group: Manufacturing CONVERTED LOSSESHazard Group: D INDEMNITY LIKELY INDEMNITY NOT-LIKELY MED LIKELY MED NOT-LIKELY TOTAL TOTAL
POLICY PERIOD PAYROLL CASES AMOUNT CASES AMOUNT AMOUNT AMOUNT AMOUNT PURE PREM.7/07 through 6/08 18,598,441 2 77,171 9 79,547 415,072 149,689 721,479 3.887/08 through 6/09 14,480,184 0 0 3 41,847 0 62,599 104,446 0.727/09 through 6/10 16,609,612 1 73,804 7 16,860 77,510 64,850 233,024 1.407/10 through 6/11 18,336,412 0 0 10 167,415 0 306,970 474,385 2.597/11 through 6/12 19,311,628 3 29,912 5 45,604 22,908 95,483 193,907 1.00
5 YR. TOTAL 87,336,277 6 180,887 34 351,273 515,490 679,591 1,727,241 1.98INDEMNITY MEDICAL TOTAL
CRED. PURE PREM.* CRED. PURE PREM.* PURE PREM.*Indicated Pure Premium 30% 0.609 43% 1.368 1.98Pure Premium Indicated by National Relativity 35% 1.127 28% 1.866 2.99Pure Premium Present on Rate Level 35% 0.961 29% 1.718 2.68Pure Premium Derived by Formula 0.914 1.609 2.52
Page 184
* Pure Premium per $100 of Payroll** Pure Premium per employee++ Non-Standard Calculation© Copyright 2014 National Council on Compensation Insurance, Inc. All Rights Reserved.

MISSOURI
EFFECTIVE 1/1/2015CLASS PAINTING: AUTOMOBILE OR CARRIAGE BODIES
9505
Industry Group: Manufacturing CONVERTED LOSSESHazard Group: D INDEMNITY LIKELY INDEMNITY NOT-LIKELY MED LIKELY MED NOT-LIKELY TOTAL TOTAL
POLICY PERIOD PAYROLL CASES AMOUNT CASES AMOUNT AMOUNT AMOUNT AMOUNT PURE PREM.7/07 through 6/08 5,674,263 1 57,060 1 18,778 0 28,016 103,854 1.837/08 through 6/09 3,120,320 0 0 1 1,536 0 3,954 5,490 0.187/09 through 6/10 2,907,676 0 0 1 12,737 0 0 12,737 0.447/10 through 6/11 2,970,537 0 0 1 26,039 0 53,584 79,623 2.687/11 through 6/12 3,618,070 0 0 1 32,557 0 40,862 73,419 2.03
5 YR. TOTAL 18,290,866 1 57,060 5 91,647 0 126,416 275,123 1.50INDEMNITY MEDICAL TOTAL
CRED. PURE PREM.* CRED. PURE PREM.* PURE PREM.*Indicated Pure Premium 16% 0.813 21% 0.691 1.50Pure Premium Indicated by National Relativity 42% 1.463 39% 1.966 3.43Pure Premium Present on Rate Level 42% 0.945 40% 1.343 2.29Pure Premium Derived by Formula 1.141 1.449 2.59
CLASS ELECTRONIC EQUIPMENT - INSTALLATION, SERVICE, OR REPAIR - SHOP AND OUTSIDE
9516 & DRIVERS
Industry Group: Goods and Services CONVERTED LOSSESHazard Group: E INDEMNITY LIKELY INDEMNITY NOT-LIKELY MED LIKELY MED NOT-LIKELY TOTAL TOTAL
POLICY PERIOD PAYROLL CASES AMOUNT CASES AMOUNT AMOUNT AMOUNT AMOUNT PURE PREM.7/07 through 6/08 53,394,758 14 532,579 40 854,040 608,730 1,783,741 3,779,090 7.087/08 through 6/09 54,126,610 9 457,727 34 408,815 472,513 942,493 2,281,548 4.227/09 through 6/10 65,248,082 12 411,515 79 1,112,667 569,732 1,553,840 3,647,754 5.597/10 through 6/11 61,566,036 5 163,690 58 831,668 298,082 1,212,692 2,506,132 4.077/11 through 6/12 65,533,434 8 610,132 47 785,276 601,873 1,220,995 3,218,276 4.91
5 YR. TOTAL 299,868,920 48 2,175,643 258 3,992,466 2,550,930 6,713,761 15,432,800 5.15INDEMNITY MEDICAL TOTAL
CRED. PURE PREM.* CRED. PURE PREM.* PURE PREM.*Indicated Pure Premium 64% 2.057 84% 3.090 5.15Pure Premium Indicated by National Relativity 18% 1.826 8% 2.567 4.39Pure Premium Present on Rate Level 18% 1.890 8% 2.796 4.69Pure Premium Derived by Formula 1.985 3.025 5.01
CLASS HOUSEHOLD AND COMMERCIAL APPLIANCES-ELECTRICAL-INSTALLATION, SERVICE OR
9519 REPAIR & DRIVERS
Industry Group: Goods and Services CONVERTED LOSSESHazard Group: E INDEMNITY LIKELY INDEMNITY NOT-LIKELY MED LIKELY MED NOT-LIKELY TOTAL TOTAL
POLICY PERIOD PAYROLL CASES AMOUNT CASES AMOUNT AMOUNT AMOUNT AMOUNT PURE PREM.7/07 through 6/08 38,356,451 2 65,491 11 307,381 198,407 477,172 1,048,451 2.737/08 through 6/09 37,973,683 4 178,900 10 190,431 156,609 359,288 885,228 2.337/09 through 6/10 38,850,280 7 478,815 28 629,186 889,174 925,900 2,923,075 7.527/10 through 6/11 39,526,556 3 27,220 23 256,931 34,632 437,177 755,960 1.917/11 through 6/12 39,927,701 3 204,888 22 485,020 228,329 818,162 1,736,399 4.35
5 YR. TOTAL 194,634,671 19 955,314 94 1,868,949 1,507,151 3,017,699 7,349,113 3.78INDEMNITY MEDICAL TOTAL
CRED. PURE PREM.* CRED. PURE PREM.* PURE PREM.*Indicated Pure Premium 51% 1.451 65% 2.325 3.78Pure Premium Indicated by National Relativity 24% 1.565 17% 2.209 3.77Pure Premium Present on Rate Level 25% 1.636 18% 2.278 3.91Pure Premium Derived by Formula 1.525 2.297 3.82
Page 185
* Pure Premium per $100 of Payroll** Pure Premium per employee++ Non-Standard Calculation© Copyright 2014 National Council on Compensation Insurance, Inc. All Rights Reserved.

MISSOURI
EFFECTIVE 1/1/2015CLASS HOUSE FURNISHINGS INSTALLATION NOC & UPHOLSTERING
9521
Industry Group: Manufacturing CONVERTED LOSSESHazard Group: E INDEMNITY LIKELY INDEMNITY NOT-LIKELY MED LIKELY MED NOT-LIKELY TOTAL TOTAL
POLICY PERIOD PAYROLL CASES AMOUNT CASES AMOUNT AMOUNT AMOUNT AMOUNT PURE PREM.7/07 through 6/08 9,252,518 3 71,971 2 313,367 70,966 398,835 855,139 9.247/08 through 6/09 9,255,783 0 0 5 83,342 0 89,019 172,361 1.867/09 through 6/10 9,364,430 1 7,345 5 97,956 13,210 190,530 309,041 3.307/10 through 6/11 8,354,087 0 0 3 7,115 0 30,378 37,493 0.457/11 through 6/12 9,632,634 2 108,519 5 129,465 134,017 195,167 567,168 5.89
5 YR. TOTAL 45,859,452 6 187,835 20 631,245 218,193 903,929 1,941,202 4.23INDEMNITY MEDICAL TOTAL
CRED. PURE PREM.* CRED. PURE PREM.* PURE PREM.*Indicated Pure Premium 28% 1.786 34% 2.447 4.23Pure Premium Indicated by National Relativity 36% 1.659 33% 2.181 3.84Pure Premium Present on Rate Level 36% 1.552 33% 1.829 3.38Pure Premium Derived by Formula 1.656 2.155 3.81
CLASS UPHOLSTERING
9522
Industry Group: Manufacturing CONVERTED LOSSESHazard Group: C INDEMNITY LIKELY INDEMNITY NOT-LIKELY MED LIKELY MED NOT-LIKELY TOTAL TOTAL
POLICY PERIOD PAYROLL CASES AMOUNT CASES AMOUNT AMOUNT AMOUNT AMOUNT PURE PREM.7/07 through 6/08 7,611,828 0 0 3 58,962 0 69,040 128,002 1.687/08 through 6/09 12,727,280 2 57,659 3 28,971 5,597 107,679 199,906 1.577/09 through 6/10 24,659,898 0 0 2 3,488 0 32,286 35,774 0.157/10 through 6/11 25,230,976 1 59,667 10 212,865 74,026 233,791 580,349 2.307/11 through 6/12 25,910,376 0 0 14 325,231 0 471,384 796,615 3.07
5 YR. TOTAL 96,140,358 3 117,326 32 629,517 79,623 914,180 1,740,646 1.81INDEMNITY MEDICAL TOTAL
CRED. PURE PREM.* CRED. PURE PREM.* PURE PREM.*Indicated Pure Premium 29% 0.777 40% 1.034 1.81Pure Premium Indicated by National Relativity 35% 0.738 30% 1.124 1.86Pure Premium Present on Rate Level 36% 0.834 30% 1.356 2.19Pure Premium Derived by Formula 0.784 1.158 1.94
CLASS MOBILE CRANE AND HOISTING SERVICE CONTRACTORS-NOC-ALL OPERATIONS-INCLUDING
9534 YARD EMPLOYEES AND DRIVERS
Industry Group: Contracting CONVERTED LOSSESHazard Group: F INDEMNITY LIKELY INDEMNITY NOT-LIKELY MED LIKELY MED NOT-LIKELY TOTAL TOTAL
POLICY PERIOD PAYROLL CASES AMOUNT CASES AMOUNT AMOUNT AMOUNT AMOUNT PURE PREM.7/07 through 6/08 14,228,477 0 0 6 96,265 0 151,960 248,225 1.757/08 through 6/09 10,714,860 0 0 1 33,036 0 64,690 97,726 0.917/09 through 6/10 8,681,678 0 0 2 23,554 0 10,670 34,224 0.397/10 through 6/11 10,370,959 2 67,398 6 201,126 25,209 317,096 610,829 5.897/11 through 6/12 12,315,891 4 487,671 7 142,827 822,856 164,638 1,617,992 13.14
5 YR. TOTAL 56,311,865 6 555,069 22 496,808 848,065 709,054 2,608,996 4.63INDEMNITY MEDICAL TOTAL
CRED. PURE PREM.* CRED. PURE PREM.* PURE PREM.*Indicated Pure Premium 31% 1.868 37% 2.765 4.63Pure Premium Indicated by National Relativity 34% 1.729 31% 2.212 3.94Pure Premium Present on Rate Level 35% 1.687 32% 1.959 3.65Pure Premium Derived by Formula 1.757 2.336 4.09
Page 186
* Pure Premium per $100 of Payroll** Pure Premium per employee++ Non-Standard Calculation© Copyright 2014 National Council on Compensation Insurance, Inc. All Rights Reserved.

MISSOURI
EFFECTIVE 1/1/2015CLASS SIGN INSTALLATION, MAINTENANCE, REPAIR OR REMOVAL & DRIVERS
9554
Industry Group: Contracting CONVERTED LOSSESHazard Group: F INDEMNITY LIKELY INDEMNITY NOT-LIKELY MED LIKELY MED NOT-LIKELY TOTAL TOTAL
POLICY PERIOD PAYROLL CASES AMOUNT CASES AMOUNT AMOUNT AMOUNT AMOUNT PURE PREM.7/07 through 6/08 14,673,348 5 224,888 22 389,532 288,169 1,184,539 2,087,128 14.227/08 through 6/09 13,172,611 7 369,996 20 724,310 481,046 1,193,019 2,768,371 21.027/09 through 6/10 12,939,846 2 174,284 12 489,528 90,787 1,006,627 1,761,226 13.617/10 through 6/11 13,997,658 2 112,577 11 202,620 129,509 490,726 935,432 6.687/11 through 6/12 16,350,670 1 85,160 12 198,632 165,845 485,736 935,373 5.72
5 YR. TOTAL 71,134,133 17 966,905 77 2,004,622 1,155,356 4,360,647 8,487,530 11.93INDEMNITY MEDICAL TOTAL
CRED. PURE PREM.* CRED. PURE PREM.* PURE PREM.*Indicated Pure Premium 50% 4.177 68% 7.754 11.93Pure Premium Indicated by National Relativity 25% 3.548 16% 5.512 9.06Pure Premium Present on Rate Level 25% 4.495 16% 7.075 11.57Pure Premium Derived by Formula 4.099 7.287 11.39
CLASS BARBERSHOP, BEAUTY PARLOR OR HAIR STYLING SALON
9586
Industry Group: Goods and Services CONVERTED LOSSESHazard Group: A INDEMNITY LIKELY INDEMNITY NOT-LIKELY MED LIKELY MED NOT-LIKELY TOTAL TOTAL
POLICY PERIOD PAYROLL CASES AMOUNT CASES AMOUNT AMOUNT AMOUNT AMOUNT PURE PREM.7/07 through 6/08 124,115,401 9 378,042 28 227,499 311,409 285,487 1,202,437 0.977/08 through 6/09 131,471,708 5 83,439 20 330,996 54,063 371,269 839,767 0.647/09 through 6/10 121,363,801 6 131,361 25 245,459 149,519 451,815 978,154 0.817/10 through 6/11 125,311,506 1 9,374 10 76,978 5,442 396,498 488,292 0.397/11 through 6/12 127,444,875 1 77,426 22 199,387 56,324 520,917 854,054 0.67
5 YR. TOTAL 629,707,291 22 679,642 105 1,080,319 576,757 2,025,986 4,362,704 0.69INDEMNITY MEDICAL TOTAL
CRED. PURE PREM.* CRED. PURE PREM.* PURE PREM.*Indicated Pure Premium 41% 0.279 54% 0.413 0.69Pure Premium Indicated by National Relativity 29% 0.251 23% 0.418 0.67Pure Premium Present on Rate Level 30% 0.300 23% 0.446 0.75Pure Premium Derived by Formula 0.277 0.422 0.70
CLASS TAXIDERMIST
9600
Industry Group: Manufacturing CONVERTED LOSSESHazard Group: B INDEMNITY LIKELY INDEMNITY NOT-LIKELY MED LIKELY MED NOT-LIKELY TOTAL TOTAL
POLICY PERIOD PAYROLL CASES AMOUNT CASES AMOUNT AMOUNT AMOUNT AMOUNT PURE PREM.7/07 through 6/08 636,029 0 0 0 0 0 0 0 0.007/08 through 6/09 497,710 0 0 0 0 0 0 0 0.007/09 through 6/10 432,475 0 0 0 0 0 0 0 0.007/10 through 6/11 362,100 0 0 0 0 0 0 0 0.007/11 through 6/12 308,528 0 0 0 0 0 0 0 0.00
5 YR. TOTAL 2,236,842 0 0 0 0 0 0 0 0.00INDEMNITY MEDICAL TOTAL
CRED. PURE PREM.* CRED. PURE PREM.* PURE PREM.*Indicated Pure Premium 7% 0.000 8% 0.000 0.00Pure Premium Indicated by National Relativity 21% 0.906 22% 1.731 2.64Pure Premium Present on Rate Level 72% 0.819 70% 1.017 1.84Pure Premium Derived by Formula 0.780 1.093 1.87
Page 187
* Pure Premium per $100 of Payroll** Pure Premium per employee++ Non-Standard Calculation© Copyright 2014 National Council on Compensation Insurance, Inc. All Rights Reserved.

MISSOURI
EFFECTIVE 1/1/2015CLASS FUNERAL DIRECTOR & DRIVERS
9620
Industry Group: Goods and Services CONVERTED LOSSESHazard Group: D INDEMNITY LIKELY INDEMNITY NOT-LIKELY MED LIKELY MED NOT-LIKELY TOTAL TOTAL
POLICY PERIOD PAYROLL CASES AMOUNT CASES AMOUNT AMOUNT AMOUNT AMOUNT PURE PREM.7/07 through 6/08 45,207,036 2 11,996 8 104,546 8,373 193,557 318,472 0.717/08 through 6/09 48,937,547 2 32,208 7 226,619 46,010 458,943 763,780 1.567/09 through 6/10 47,207,161 2 297,625 9 141,364 543,499 165,137 1,147,625 2.437/10 through 6/11 48,951,998 1 17,683 8 298,491 20,760 412,723 749,657 1.537/11 through 6/12 51,335,849 2 110,865 3 61,891 89,232 106,991 368,979 0.72
5 YR. TOTAL 241,639,591 9 470,377 35 832,911 707,874 1,337,351 3,348,513 1.39INDEMNITY MEDICAL TOTAL
CRED. PURE PREM.* CRED. PURE PREM.* PURE PREM.*Indicated Pure Premium 32% 0.539 46% 0.846 1.39Pure Premium Indicated by National Relativity 34% 0.366 27% 0.694 1.06Pure Premium Present on Rate Level 34% 0.409 27% 0.746 1.16Pure Premium Derived by Formula 0.436 0.778 1.21
Page 188
* Pure Premium per $100 of Payroll** Pure Premium per employee++ Non-Standard Calculation© Copyright 2014 National Council on Compensation Insurance, Inc. All Rights Reserved.

MISSOURIF-CLASS
EFFECTIVE 1/1/2015CLASS BOAT BUILDING-OR REPAIR & DRIVERS-COVERAGE UNDER U.S. ACT
6824
Industry Group: F-Class CONVERTED LOSSESHazard Group: F INDEMNITY LIKELY INDEMNITY NOT-LIKELY MED LIKELY MED NOT-LIKELY TOTAL TOTAL
POLICY PERIOD PAYROLL CASES AMOUNT CASES AMOUNT AMOUNT AMOUNT AMOUNT PURE PREM.1/07 through 12/07 1,295,021 0 0 0 0 0 0 0 0.001/08 through 12/08 726,148 0 0 0 0 0 0 0 0.001/09 through 12/09 0 0 0 0 0 0 0 0 0.001/10 through 12/10 5,400 0 0 0 0 0 0 0 0.001/11 through 12/11 595,572 0 0 0 0 0 0 0 0.00
5 YR. TOTAL 2,622,141 0 0 0 0 0 0 0 0.00INDEMNITY MEDICAL TOTAL
CRED. PURE PREM.* CRED. PURE PREM.* PURE PREM.*Indicated Pure Premium 7% 0.000 11% 0.000 0.00Pure Premium Indicated by National Relativity 42% 2.581 44% 4.067 6.65Pure Premium Present on Rate Level 51% 2.345 45% 3.769 6.11Pure Premium Derived by Formula 2.280 3.486 5.77
CLASS SHIP BUILDING - IRON OR STEEL - & DRIVERS - COVERAGE UNDER U.S. ACT
6825
Industry Group: F-Class CONVERTED LOSSESHazard Group: G INDEMNITY LIKELY INDEMNITY NOT-LIKELY MED LIKELY MED NOT-LIKELY TOTAL TOTAL
POLICY PERIOD PAYROLL CASES AMOUNT CASES AMOUNT AMOUNT AMOUNT AMOUNT PURE PREM.1/07 through 12/07 25,287,599 7 356,329 1 2,861 532,120 55,607 946,917 3.741/08 through 12/08 26,037,060 10 244,649 1 17,497 438,114 60,950 761,210 2.921/09 through 12/09 25,601,709 6 245,690 4 91,596 509,598 178,946 1,025,830 4.011/10 through 12/10 30,677,897 7 165,336 8 92,527 177,203 268,062 703,128 2.291/11 through 12/11 32,361,388 13 583,688 6 107,486 591,343 247,469 1,529,986 4.73
5 YR. TOTAL 139,965,653 43 1,595,692 20 311,967 2,248,378 811,034 4,967,071 3.55INDEMNITY MEDICAL TOTAL
CRED. PURE PREM.* CRED. PURE PREM.* PURE PREM.*Indicated Pure Premium 28% 1.363 44% 2.186 3.55Pure Premium Indicated by National Relativity 0% 0.000 0% 0.000 0.00Pure Premium Present on Rate Level 72% 1.352 56% 2.341 3.69Pure Premium Derived by Formula 1.355 2.273 3.63
CLASS MARINA & DRIVERS: COVERAGE UNDER U.S. ACT
6826
Industry Group: F-Class CONVERTED LOSSESHazard Group: E INDEMNITY LIKELY INDEMNITY NOT-LIKELY MED LIKELY MED NOT-LIKELY TOTAL TOTAL
POLICY PERIOD PAYROLL CASES AMOUNT CASES AMOUNT AMOUNT AMOUNT AMOUNT PURE PREM.1/07 through 12/07 12,594 0 0 0 0 0 0 0 0.001/08 through 12/08 0 0 0 0 0 0 0 0 0.001/09 through 12/09 55,293 0 0 0 0 0 0 0 0.001/10 through 12/10 48,174 0 0 0 0 0 0 0 0.001/11 through 12/11 48,774 0 0 0 0 0 0 0 0.00
5 YR. TOTAL 164,835 0 0 0 0 0 0 0 0.00INDEMNITY MEDICAL TOTAL
CRED. PURE PREM.* CRED. PURE PREM.* PURE PREM.*Indicated Pure Premium 2% 0.000 3% 0.000 0.00Pure Premium Indicated by National Relativity 19% 5.653 20% 2.711 8.36Pure Premium Present on Rate Level 79% 1.475 77% 2.324 3.80Pure Premium Derived by Formula 2.239 2.332 4.57
Page 189
* Pure Premium per $100 of Payroll** Pure Premium per employee++ Non-Standard Calculation© Copyright 2014 National Council on Compensation Insurance, Inc. All Rights Reserved.

MISSOURIF-CLASS
EFFECTIVE 1/1/2015CLASS SHIP REPAIR OR CONVERSION-ALL OPERATIONS & DRIVERS-COVERAGE UNDER U.S. ACT
6872
Industry Group: F-Class CONVERTED LOSSESHazard Group: G INDEMNITY LIKELY INDEMNITY NOT-LIKELY MED LIKELY MED NOT-LIKELY TOTAL TOTAL
POLICY PERIOD PAYROLL CASES AMOUNT CASES AMOUNT AMOUNT AMOUNT AMOUNT PURE PREM.1/07 through 12/07 4,289,676 2 24,644 10 547,007 39,335 510,293 1,121,279 26.141/08 through 12/08 4,795,433 3 798,185 4 86,471 992,526 66,774 1,943,956 40.541/09 through 12/09 4,143,222 0 0 0 0 0 0 0 0.001/10 through 12/10 1,621,631 0 0 2 82,218 0 116,381 198,599 12.251/11 through 12/11 1,134,136 0 0 1 4,639 0 3,769 8,408 0.74
5 YR. TOTAL 15,984,098 5 822,829 17 720,335 1,031,861 697,217 3,272,242 20.47INDEMNITY MEDICAL TOTAL
CRED. PURE PREM.* CRED. PURE PREM.* PURE PREM.*Indicated Pure Premium 22% 9.654 30% 10.817 20.47Pure Premium Indicated by National Relativity 39% 3.268 35% 4.049 7.32Pure Premium Present on Rate Level 39% 6.386 35% 7.712 14.10Pure Premium Derived by Formula 5.889 7.361 13.25
CLASS PAINTING: SHIP HULLS-COVERAGE UNDER U.S. ACT
6874
Industry Group: F-Class CONVERTED LOSSESHazard Group: G INDEMNITY LIKELY INDEMNITY NOT-LIKELY MED LIKELY MED NOT-LIKELY TOTAL TOTAL
POLICY PERIOD PAYROLL CASES AMOUNT CASES AMOUNT AMOUNT AMOUNT AMOUNT PURE PREM.1/07 through 12/07 0 0 0 0 0 0 0 0 0.001/08 through 12/08 0 0 0 0 0 0 0 0 0.001/09 through 12/09 0 0 0 0 0 0 0 0 0.001/10 through 12/10 0 0 0 0 0 0 0 0 0.001/11 through 12/11 100 0 0 0 0 0 0 0 0.00
5 YR. TOTAL 100 0 0 0 0 0 0 0 0.00INDEMNITY MEDICAL TOTAL
CRED. PURE PREM.* CRED. PURE PREM.* PURE PREM.*Indicated Pure Premium 0% 0.000 0% 0.000 0.00Pure Premium Indicated by National Relativity 22% 5.580 23% 6.110 11.69Pure Premium Present on Rate Level 78% 6.699 77% 8.975 15.67Pure Premium Derived by Formula 6.453 8.316 14.77
CLASS STEVEDORING NOC
7309
Industry Group: F-Class CONVERTED LOSSESHazard Group: G INDEMNITY LIKELY INDEMNITY NOT-LIKELY MED LIKELY MED NOT-LIKELY TOTAL TOTAL
POLICY PERIOD PAYROLL CASES AMOUNT CASES AMOUNT AMOUNT AMOUNT AMOUNT PURE PREM.1/07 through 12/07 463,063 0 0 0 0 0 1,161 1,161 0.251/08 through 12/08 676,182 0 0 1 14,802 0 14,625 29,427 4.351/09 through 12/09 581,109 0 0 1 36,825 0 30,381 67,206 11.571/10 through 12/10 641,326 0 0 0 0 0 0 0 0.001/11 through 12/11 602,368 0 0 0 0 0 0 0 0.00
5 YR. TOTAL 2,964,048 0 0 2 51,627 0 46,167 97,794 3.30INDEMNITY MEDICAL TOTAL
CRED. PURE PREM.* CRED. PURE PREM.* PURE PREM.*Indicated Pure Premium 11% 1.742 15% 1.558 3.30Pure Premium Indicated by National Relativity 41% 7.394 42% 8.259 15.65Pure Premium Present on Rate Level 48% 5.753 43% 7.185 12.94Pure Premium Derived by Formula 5.985 6.792 12.78
Page 190
* Pure Premium per $100 of Payroll** Pure Premium per employee++ Non-Standard Calculation© Copyright 2014 National Council on Compensation Insurance, Inc. All Rights Reserved.
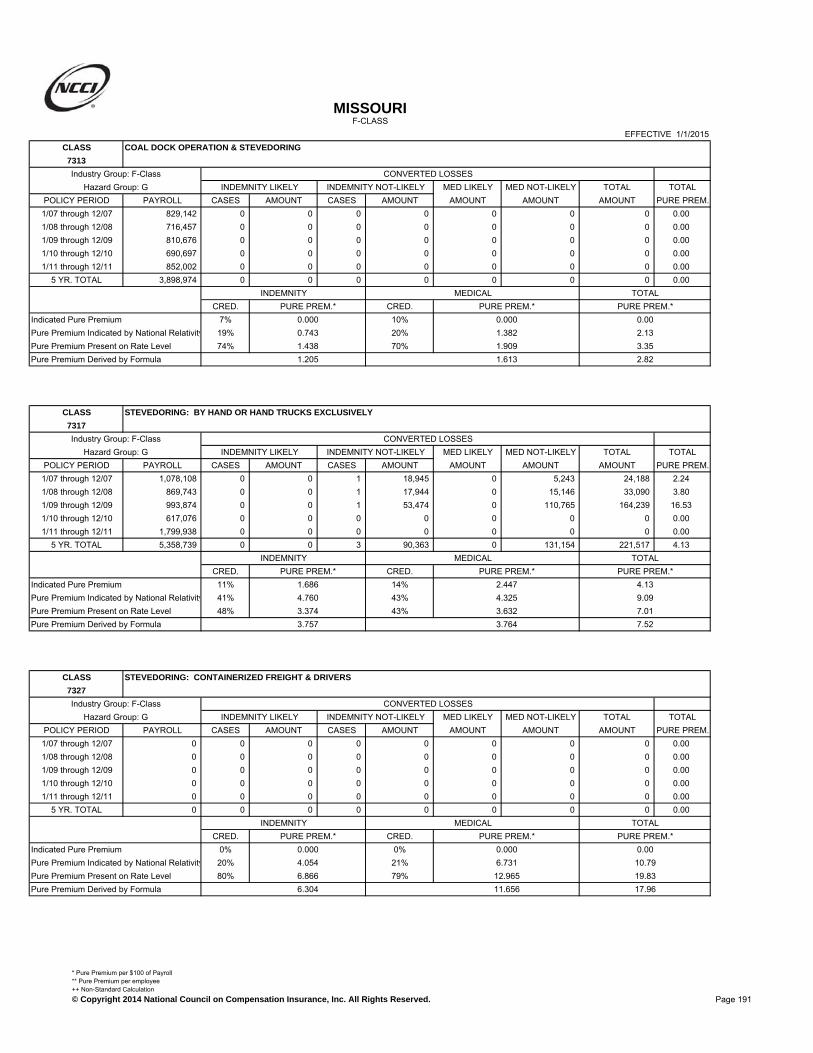
MISSOURIF-CLASS
EFFECTIVE 1/1/2015CLASS COAL DOCK OPERATION & STEVEDORING
7313
Industry Group: F-Class CONVERTED LOSSESHazard Group: G INDEMNITY LIKELY INDEMNITY NOT-LIKELY MED LIKELY MED NOT-LIKELY TOTAL TOTAL
POLICY PERIOD PAYROLL CASES AMOUNT CASES AMOUNT AMOUNT AMOUNT AMOUNT PURE PREM.1/07 through 12/07 829,142 0 0 0 0 0 0 0 0.001/08 through 12/08 716,457 0 0 0 0 0 0 0 0.001/09 through 12/09 810,676 0 0 0 0 0 0 0 0.001/10 through 12/10 690,697 0 0 0 0 0 0 0 0.001/11 through 12/11 852,002 0 0 0 0 0 0 0 0.00
5 YR. TOTAL 3,898,974 0 0 0 0 0 0 0 0.00INDEMNITY MEDICAL TOTAL
CRED. PURE PREM.* CRED. PURE PREM.* PURE PREM.*Indicated Pure Premium 7% 0.000 10% 0.000 0.00Pure Premium Indicated by National Relativity 19% 0.743 20% 1.382 2.13Pure Premium Present on Rate Level 74% 1.438 70% 1.909 3.35Pure Premium Derived by Formula 1.205 1.613 2.82
CLASS STEVEDORING: BY HAND OR HAND TRUCKS EXCLUSIVELY
7317
Industry Group: F-Class CONVERTED LOSSESHazard Group: G INDEMNITY LIKELY INDEMNITY NOT-LIKELY MED LIKELY MED NOT-LIKELY TOTAL TOTAL
POLICY PERIOD PAYROLL CASES AMOUNT CASES AMOUNT AMOUNT AMOUNT AMOUNT PURE PREM.1/07 through 12/07 1,078,108 0 0 1 18,945 0 5,243 24,188 2.241/08 through 12/08 869,743 0 0 1 17,944 0 15,146 33,090 3.801/09 through 12/09 993,874 0 0 1 53,474 0 110,765 164,239 16.531/10 through 12/10 617,076 0 0 0 0 0 0 0 0.001/11 through 12/11 1,799,938 0 0 0 0 0 0 0 0.00
5 YR. TOTAL 5,358,739 0 0 3 90,363 0 131,154 221,517 4.13INDEMNITY MEDICAL TOTAL
CRED. PURE PREM.* CRED. PURE PREM.* PURE PREM.*Indicated Pure Premium 11% 1.686 14% 2.447 4.13Pure Premium Indicated by National Relativity 41% 4.760 43% 4.325 9.09Pure Premium Present on Rate Level 48% 3.374 43% 3.632 7.01Pure Premium Derived by Formula 3.757 3.764 7.52
CLASS STEVEDORING: CONTAINERIZED FREIGHT & DRIVERS
7327
Industry Group: F-Class CONVERTED LOSSESHazard Group: G INDEMNITY LIKELY INDEMNITY NOT-LIKELY MED LIKELY MED NOT-LIKELY TOTAL TOTAL
POLICY PERIOD PAYROLL CASES AMOUNT CASES AMOUNT AMOUNT AMOUNT AMOUNT PURE PREM.1/07 through 12/07 0 0 0 0 0 0 0 0 0.001/08 through 12/08 0 0 0 0 0 0 0 0 0.001/09 through 12/09 0 0 0 0 0 0 0 0 0.001/10 through 12/10 0 0 0 0 0 0 0 0 0.001/11 through 12/11 0 0 0 0 0 0 0 0 0.00
5 YR. TOTAL 0 0 0 0 0 0 0 0 0.00INDEMNITY MEDICAL TOTAL
CRED. PURE PREM.* CRED. PURE PREM.* PURE PREM.*Indicated Pure Premium 0% 0.000 0% 0.000 0.00Pure Premium Indicated by National Relativity 20% 4.054 21% 6.731 10.79Pure Premium Present on Rate Level 80% 6.866 79% 12.965 19.83Pure Premium Derived by Formula 6.304 11.656 17.96
Page 191
* Pure Premium per $100 of Payroll** Pure Premium per employee++ Non-Standard Calculation© Copyright 2014 National Council on Compensation Insurance, Inc. All Rights Reserved.

MISSOURIF-CLASS
EFFECTIVE 1/1/2015CLASS FREIGHT HANDLING NOC-COVERAGE UNDER U.S. ACT
7350
Industry Group: F-Class CONVERTED LOSSESHazard Group: F INDEMNITY LIKELY INDEMNITY NOT-LIKELY MED LIKELY MED NOT-LIKELY TOTAL TOTAL
POLICY PERIOD PAYROLL CASES AMOUNT CASES AMOUNT AMOUNT AMOUNT AMOUNT PURE PREM.1/07 through 12/07 1,887,063 0 0 1 4,880 0 48,878 53,758 2.851/08 through 12/08 5,105 0 0 0 0 0 0 0 0.001/09 through 12/09 2,176 0 0 0 0 0 0 0 0.001/10 through 12/10 0 0 0 0 0 0 0 0 0.001/11 through 12/11 0 0 0 0 0 0 0 0 0.00
5 YR. TOTAL 1,894,344 0 0 1 4,880 0 48,878 53,758 2.84INDEMNITY MEDICAL TOTAL
CRED. PURE PREM.* CRED. PURE PREM.* PURE PREM.*Indicated Pure Premium 7% 0.258 10% 2.580 2.84Pure Premium Indicated by National Relativity 28% 4.648 30% 5.680 10.33Pure Premium Present on Rate Level 65% 3.450 60% 4.186 7.64Pure Premium Derived by Formula 3.562 4.474 8.04
CLASS STEVEDORING: TALLIERS AND CHECKING CLERKS ENGAGED IN CONNECTION WITH
8709 STEVEDORE WORK
Industry Group: F-Class CONVERTED LOSSESHazard Group: G INDEMNITY LIKELY INDEMNITY NOT-LIKELY MED LIKELY MED NOT-LIKELY TOTAL TOTAL
POLICY PERIOD PAYROLL CASES AMOUNT CASES AMOUNT AMOUNT AMOUNT AMOUNT PURE PREM.1/07 through 12/07 214,773 0 0 0 0 0 0 0 0.001/08 through 12/08 126,066 0 0 0 0 0 0 0 0.001/09 through 12/09 114,674 0 0 0 0 0 716 716 0.621/10 through 12/10 69,808 0 0 0 0 0 0 0 0.001/11 through 12/11 84,600 0 0 0 0 0 0 0 0.00
5 YR. TOTAL 609,921 0 0 0 0 0 716 716 0.12INDEMNITY MEDICAL TOTAL
CRED. PURE PREM.* CRED. PURE PREM.* PURE PREM.*Indicated Pure Premium 3% 0.000 5% 0.117 0.12Pure Premium Indicated by National Relativity 20% 1.270 21% 1.647 2.92Pure Premium Present on Rate Level 77% 1.641 74% 2.523 4.16Pure Premium Derived by Formula 1.518 2.219 3.74
CLASS STEAMSHIP LINE OR AGENCY-PORT EMPLOYEES: SUPERINTENDENTS, CAPTAINS,
8726 ENGINEERS, STEWARDS OR THEIR ASSISTANTS, PAY CLERKS
Industry Group: F-Class CONVERTED LOSSESHazard Group: E INDEMNITY LIKELY INDEMNITY NOT-LIKELY MED LIKELY MED NOT-LIKELY TOTAL TOTAL
POLICY PERIOD PAYROLL CASES AMOUNT CASES AMOUNT AMOUNT AMOUNT AMOUNT PURE PREM.1/07 through 12/07 101,423 0 0 0 0 0 0 0 0.001/08 through 12/08 100,500 0 0 0 0 0 0 0 0.001/09 through 12/09 0 0 0 0 0 0 0 0 0.001/10 through 12/10 0 0 0 0 0 0 0 0 0.001/11 through 12/11 107,554 0 0 0 0 0 0 0 0.00
5 YR. TOTAL 309,477 0 0 0 0 0 0 0 0.00INDEMNITY MEDICAL TOTAL
CRED. PURE PREM.* CRED. PURE PREM.* PURE PREM.*Indicated Pure Premium 2% 0.000 3% 0.000 0.00Pure Premium Indicated by National Relativity 23% 1.970 24% 1.438 3.41Pure Premium Present on Rate Level 75% 0.948 73% 1.365 2.31Pure Premium Derived by Formula 1.164 1.342 2.51
Page 192
* Pure Premium per $100 of Payroll** Pure Premium per employee++ Non-Standard Calculation© Copyright 2014 National Council on Compensation Insurance, Inc. All Rights Reserved.

MISSOURIF-CLASS
EFFECTIVE 1/1/2015CLASS UNITED STATES ARMED SERVICE RISK-ALL EMPLOYEES & DRIVERS
9077
Industry Group: F-Class CONVERTED LOSSESHazard Group: C INDEMNITY LIKELY INDEMNITY NOT-LIKELY MED LIKELY MED NOT-LIKELY TOTAL TOTAL
POLICY PERIOD PAYROLL CASES AMOUNT CASES AMOUNT AMOUNT AMOUNT AMOUNT PURE PREM.1/07 through 12/07 0 0 0 0 0 0 0 0 0.001/08 through 12/08 0 0 0 0 0 0 0 0 0.001/09 through 12/09 0 0 0 0 0 0 0 0 0.001/10 through 12/10 0 0 0 0 0 0 0 0 0.001/11 through 12/11 0 0 0 0 0 0 0 0 0.00
5 YR. TOTAL 0 0 0 0 0 0 0 0 0.00INDEMNITY MEDICAL TOTAL
CRED. PURE PREM.* CRED. PURE PREM.* PURE PREM.*Indicated Pure Premium 0% 0.000 0% 0.000 0.00Pure Premium Indicated by National Relativity 6% 0.324 6% 2.186 2.51Pure Premium Present on Rate Level 94% 0.959 94% 1.161 2.12Pure Premium Derived by Formula 0.921 1.223 2.14
Page 193
* Pure Premium per $100 of Payroll** Pure Premium per employee++ Non-Standard Calculation© Copyright 2014 National Council on Compensation Insurance, Inc. All Rights Reserved.

Class Current Proposed PercentCode 01/01/14 01/01/15 Change
0005 3.43 3.46 0.9%0008 1.96 2.11 7.7%0016 5.43 5.71 5.2%0034 2.34 2.21 -5.6%0035 2.13 2.00 -6.1%0036 7.11 6.43 -9.6%0037 3.93 4.18 6.4%0042 6.52 7.03 7.8%0050 6.22 5.50 -11.6%0059 0.14 0.13 -7.1%0065 0.04 0.04 0.0%0066 0.04 0.04 0.0%0067 0.04 0.04 0.0%0079 5.94 6.42 8.1%0083 4.77 4.40 -7.8%0106 9.15 8.38 -8.4%0113 4.93 5.71 15.8%0170 3.67 3.12 -15.0%0251 4.13 3.90 -5.6%0400 6.89 6.58 -4.5%0401 8.51 8.87 4.2%0771 0.42 0.44 4.8%0790 8.81 10.39 17.9%0908 137.00 146.00 6.6%0913 406.00 373.00 -8.1%0917 4.50 4.37 -2.9%1005 6.55 4.58 -30.1%1016 20.63 13.67 -33.7%1164 5.26 4.69 -10.8%1165 4.59 4.36 -5.0%1320 3.53 2.76 -21.8%1322 9.16 8.76 -4.4%1430 6.72 5.52 -17.9%1438 6.52 7.56 16.0%1452 3.72 4.03 8.3%1463 12.84 12.11 -5.7%1472 3.81 4.41 15.7%1624 3.19 3.67 15.0%1642 4.87 4.10 -15.8%1654 8.22 7.69 -6.4%1655 2.97 2.32 -21.9%1699 3.38 3.11 -8.0%1701 3.61 3.38 -6.4%1710 7.39 5.77 -21.9%
Missouri
Change in NCCI Including Trend Loss Costs
© Copyright 2014 National Council on Compensation Insurance, Inc. All Rights Reserved.

Class Current Proposed PercentCode 01/01/14 01/01/15 Change
Missouri
Change in NCCI Including Trend Loss Costs
1741 3.28 2.76 -15.9%1747 2.34 2.19 -6.4%1748 4.41 5.11 15.9%1803 6.91 7.43 7.5%1852 2.67 2.67 0.0%1853 2.50 2.35 -6.0%1860 2.07 2.27 9.7%1924 4.67 3.76 -19.5%1925 4.99 4.04 -19.0%2002 2.38 2.04 -14.3%2003 3.45 3.58 3.8%2014 4.34 3.87 -10.8%2016 2.30 2.52 9.6%2021 2.70 2.29 -15.2%2039 2.44 2.31 -5.3%2041 3.07 2.94 -4.2%2065 3.53 2.99 -15.3%2070 5.22 5.62 7.7%2081 7.83 6.54 -16.5%2089 4.65 4.31 -7.3%2095 3.46 3.16 -8.7%2105 2.97 3.04 2.4%2110 2.13 2.03 -4.7%2111 2.22 2.21 -0.5%2112 2.91 3.27 12.4%2114 1.89 2.17 14.8%2121 1.52 1.48 -2.6%2130 2.51 2.14 -14.7%2131 2.78 2.61 -6.1%2143 2.66 2.33 -12.4%2157 6.10 6.13 0.5%2172 2.15 2.04 -5.1%2174 3.18 3.38 6.3%2211 7.33 8.50 16.0%2220 2.28 2.23 -2.2%2286 2.18 1.99 -8.7%2288 3.55 4.11 15.8%2300 2.43 2.40 -1.2%2302 2.03 1.89 -6.9%2305 3.41 3.77 10.6%2352 6.80 6.77 -0.4%2361 1.77 1.90 7.3%2362 1.95 1.62 -16.9%2380 2.84 2.78 -2.1%
© Copyright 2014 National Council on Compensation Insurance, Inc. All Rights Reserved.
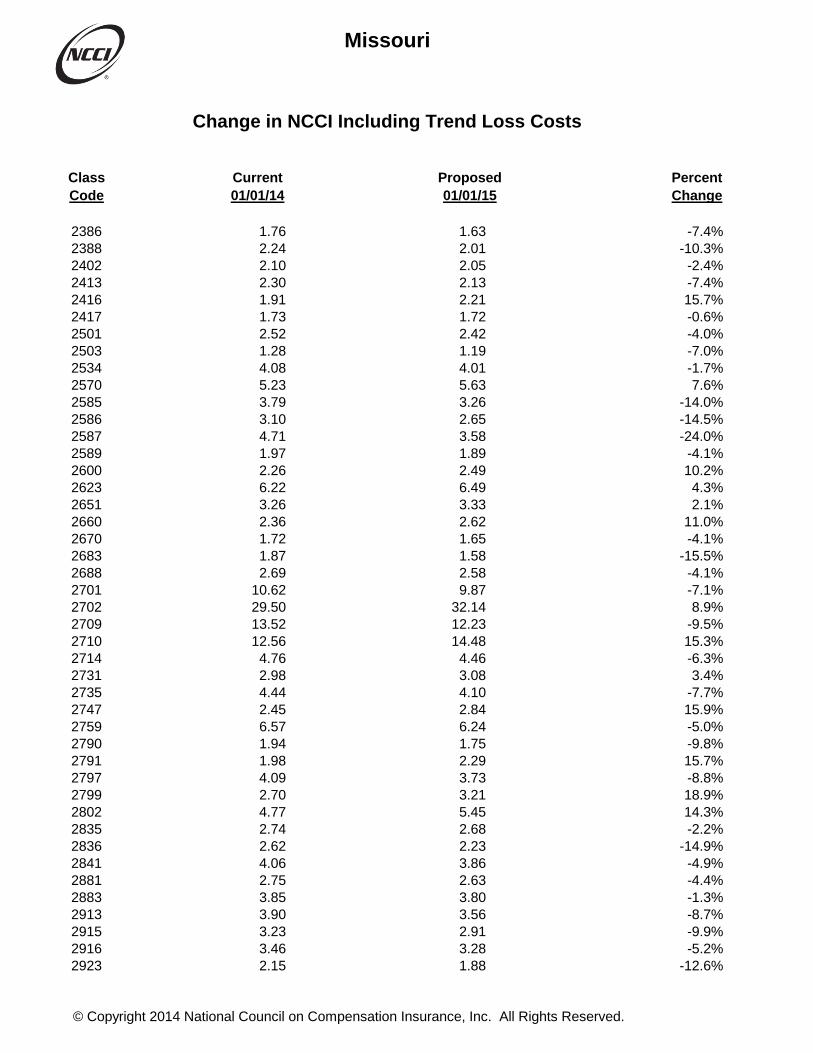
Class Current Proposed PercentCode 01/01/14 01/01/15 Change
Missouri
Change in NCCI Including Trend Loss Costs
2386 1.76 1.63 -7.4%2388 2.24 2.01 -10.3%2402 2.10 2.05 -2.4%2413 2.30 2.13 -7.4%2416 1.91 2.21 15.7%2417 1.73 1.72 -0.6%2501 2.52 2.42 -4.0%2503 1.28 1.19 -7.0%2534 4.08 4.01 -1.7%2570 5.23 5.63 7.6%2585 3.79 3.26 -14.0%2586 3.10 2.65 -14.5%2587 4.71 3.58 -24.0%2589 1.97 1.89 -4.1%2600 2.26 2.49 10.2%2623 6.22 6.49 4.3%2651 3.26 3.33 2.1%2660 2.36 2.62 11.0%2670 1.72 1.65 -4.1%2683 1.87 1.58 -15.5%2688 2.69 2.58 -4.1%2701 10.62 9.87 -7.1%2702 29.50 32.14 8.9%2709 13.52 12.23 -9.5%2710 12.56 14.48 15.3%2714 4.76 4.46 -6.3%2731 2.98 3.08 3.4%2735 4.44 4.10 -7.7%2747 2.45 2.84 15.9%2759 6.57 6.24 -5.0%2790 1.94 1.75 -9.8%2791 1.98 2.29 15.7%2797 4.09 3.73 -8.8%2799 2.70 3.21 18.9%2802 4.77 5.45 14.3%2835 2.74 2.68 -2.2%2836 2.62 2.23 -14.9%2841 4.06 3.86 -4.9%2881 2.75 2.63 -4.4%2883 3.85 3.80 -1.3%2913 3.90 3.56 -8.7%2915 3.23 2.91 -9.9%2916 3.46 3.28 -5.2%2923 2.15 1.88 -12.6%
© Copyright 2014 National Council on Compensation Insurance, Inc. All Rights Reserved.

Class Current Proposed PercentCode 01/01/14 01/01/15 Change
Missouri
Change in NCCI Including Trend Loss Costs
2942 5.52 5.04 -8.7%2960 7.41 8.19 10.5%3004 2.50 2.47 -1.2%3018 3.78 4.21 11.4%3022 3.89 3.93 1.0%3027 2.97 2.72 -8.4%3028 4.95 4.46 -9.9%3030 7.01 6.25 -10.8%3040 8.19 7.66 -6.5%3041 4.11 4.66 13.4%3042 4.67 5.41 15.8%3064 5.28 5.16 -2.3%3076 2.73 2.60 -4.8%3081 4.61 4.35 -5.6%3082 6.35 4.87 -23.3%3085 5.85 6.34 8.4%3110 4.56 5.00 9.6%3111 2.48 2.49 0.4%3113 2.28 2.04 -10.5%3114 2.76 2.70 -2.2%3118 2.23 2.14 -4.0%3119 2.70 2.45 -9.3%3122 2.21 1.83 -17.2%3126 2.29 1.87 -18.3%3131 1.64 1.56 -4.9%3132 3.88 3.65 -5.9%3145 2.67 2.61 -2.2%3146 3.00 2.83 -5.7%3169 3.42 2.72 -20.5%3175 3.98 4.42 11.1%3179 3.08 2.87 -6.8%3180 2.02 1.90 -5.9%3188 2.21 1.99 -10.0%3220 2.12 1.98 -6.6%3223 4.50 5.09 13.1%3224 3.21 3.48 8.4%3227 3.19 3.08 -3.4%3240 2.06 2.11 2.4%3241 3.56 3.91 9.8%3255 1.94 2.04 5.2%3257 3.14 3.05 -2.9%3270 4.64 5.25 13.1%3300 4.42 4.13 -6.6%3303 2.43 2.81 15.6%
© Copyright 2014 National Council on Compensation Insurance, Inc. All Rights Reserved.

Class Current Proposed PercentCode 01/01/14 01/01/15 Change
Missouri
Change in NCCI Including Trend Loss Costs
3307 5.73 5.15 -10.1%3315 3.65 3.49 -4.4%3334 2.78 2.60 -6.5%3336 2.85 2.75 -3.5%3365 8.26 6.88 -16.7%3372 3.46 3.18 -8.1%3373 7.66 7.45 -2.7%3383 1.50 1.48 -1.3%3385 0.79 0.72 -8.9%3400 4.06 3.78 -6.9%3507 3.96 3.41 -13.9%3515 2.05 2.05 0.0%3548 1.89 1.58 -16.4%3559 2.56 2.80 9.4%3574 1.24 1.16 -6.5%3581 1.67 1.54 -7.8%3612 2.05 1.98 -3.4%3620 4.12 4.11 -0.2%3629 1.58 1.58 0.0%3632 3.47 3.33 -4.0%3634 1.49 1.41 -5.4%3635 3.19 3.16 -0.9%3638 4.05 3.09 -23.7%3642 1.36 1.26 -7.4%3643 3.09 2.62 -15.2%3647 3.07 2.92 -4.9%3648 1.76 1.68 -4.5%3681 1.10 0.97 -11.8%3685 1.18 1.18 0.0%3719 2.91 3.46 18.9%3724 4.63 4.84 4.5%3726 6.33 5.87 -7.3%3803 2.43 2.60 7.0%3807 2.56 2.28 -10.9%3808 3.85 3.89 1.0%3821 5.12 4.97 -2.9%3822 8.04 6.40 -20.4%3824 4.84 5.57 15.1%3826 0.96 0.93 -3.1%3827 2.00 2.27 13.5%3830 0.77 0.72 -6.5%3851 7.50 7.34 -2.1%3865 1.73 1.58 -8.7%3881 4.64 4.78 3.0%
© Copyright 2014 National Council on Compensation Insurance, Inc. All Rights Reserved.

Class Current Proposed PercentCode 01/01/14 01/01/15 Change
Missouri
Change in NCCI Including Trend Loss Costs
4000 4.96 4.91 -1.0%4018 4.49 4.49 0.0%4021 5.27 5.56 5.5%4034 6.17 6.97 13.0%4036 1.99 1.92 -3.5%4038 4.14 4.64 12.1%4053 2.69 2.23 -17.1%4061 5.23 4.76 -9.0%4062 2.03 1.81 -10.8%4101 3.16 3.21 1.6%4109 1.34 1.29 -3.7%4110 3.40 3.11 -8.5%4111 3.81 3.28 -13.9%4113 1.55 1.51 -2.6%4114 3.31 3.33 0.6%4130 4.13 4.40 6.5%4131 3.46 3.04 -12.1%4133 2.29 1.99 -13.1%4149 1.12 0.93 -17.0%4206 3.33 3.13 -6.0%4207 1.43 1.55 8.4%4239 2.79 2.72 -2.5%4240 2.24 2.12 -5.4%4243 2.69 2.39 -11.2%4244 4.12 3.78 -8.3%4250 1.45 1.58 9.0%4251 4.00 4.01 0.2%4263 4.17 3.94 -5.5%4273 2.78 2.57 -7.6%4279 3.17 2.98 -6.0%4282 2.42 2.24 -7.4%4283 3.68 2.80 -23.9%4299 2.31 2.31 0.0%4304 4.48 4.87 8.7%4307 2.35 2.05 -12.8%4351 1.21 1.07 -11.6%4352 1.79 1.63 -8.9%4360 1.08 0.93 -13.9%4361 1.03 0.98 -4.9%4410 3.87 3.88 0.3%4420 4.26 3.92 -8.0%4431 1.43 1.38 -3.5%4432 1.77 1.59 -10.2%4439 2.16 2.45 13.4%
© Copyright 2014 National Council on Compensation Insurance, Inc. All Rights Reserved.

Class Current Proposed PercentCode 01/01/14 01/01/15 Change
Missouri
Change in NCCI Including Trend Loss Costs
4452 2.84 2.80 -1.4%4459 2.34 2.28 -2.6%4470 2.45 2.11 -13.9%4484 3.05 2.74 -10.2%4493 3.01 3.49 15.9%4511 0.40 0.36 -10.0%4557 2.38 2.54 6.7%4558 1.66 1.55 -6.6%4568 3.24 3.75 15.7%4581 1.15 0.94 -18.3%4583 4.66 4.49 -3.6%4597 0.96 1.07 11.5%4611 1.06 0.94 -11.3%4635 2.81 2.57 -8.5%4653 1.96 1.92 -2.0%4665 9.79 9.33 -4.7%4670 5.68 6.58 15.8%4683 2.79 3.23 15.8%4686 1.98 2.29 15.7%4692 0.62 0.57 -8.1%4693 0.63 0.61 -3.2%4703 3.00 2.49 -17.0%4716 4.47 4.23 -5.4%4717 1.80 2.04 13.3%4720 2.21 1.92 -13.1%4740 1.15 1.09 -5.2%4741 2.51 2.20 -12.4%4751 2.76 2.65 -4.0%4771 2.40 2.48 3.3%4777 4.32 4.27 -1.2%4825 0.82 0.80 -2.4%4828 2.29 2.27 -0.9%4829 1.08 1.12 3.7%4902 4.18 3.84 -8.1%4923 1.39 1.46 5.0%4940 1.82 1.92 5.5%5020 4.97 4.24 -14.7%5022 6.95 7.40 6.5%5037 25.76 23.76 -7.8%5040 21.83 18.74 -14.2%5057 7.40 6.66 -10.0%5059 39.17 30.95 -21.0%5067 8.97 10.67 19.0%5069 30.21 25.22 -16.5%
© Copyright 2014 National Council on Compensation Insurance, Inc. All Rights Reserved.
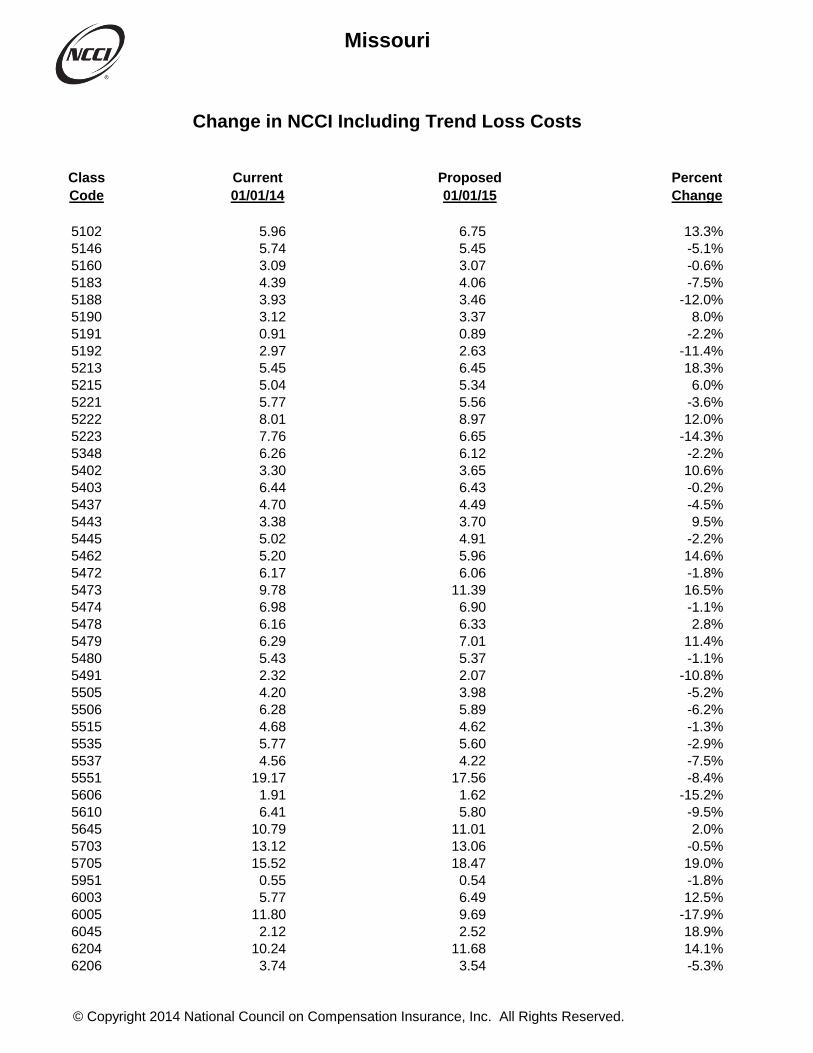
Class Current Proposed PercentCode 01/01/14 01/01/15 Change
Missouri
Change in NCCI Including Trend Loss Costs
5102 5.96 6.75 13.3%5146 5.74 5.45 -5.1%5160 3.09 3.07 -0.6%5183 4.39 4.06 -7.5%5188 3.93 3.46 -12.0%5190 3.12 3.37 8.0%5191 0.91 0.89 -2.2%5192 2.97 2.63 -11.4%5213 5.45 6.45 18.3%5215 5.04 5.34 6.0%5221 5.77 5.56 -3.6%5222 8.01 8.97 12.0%5223 7.76 6.65 -14.3%5348 6.26 6.12 -2.2%5402 3.30 3.65 10.6%5403 6.44 6.43 -0.2%5437 4.70 4.49 -4.5%5443 3.38 3.70 9.5%5445 5.02 4.91 -2.2%5462 5.20 5.96 14.6%5472 6.17 6.06 -1.8%5473 9.78 11.39 16.5%5474 6.98 6.90 -1.1%5478 6.16 6.33 2.8%5479 6.29 7.01 11.4%5480 5.43 5.37 -1.1%5491 2.32 2.07 -10.8%5505 4.20 3.98 -5.2%5506 6.28 5.89 -6.2%5515 4.68 4.62 -1.3%5535 5.77 5.60 -2.9%5537 4.56 4.22 -7.5%5551 19.17 17.56 -8.4%5606 1.91 1.62 -15.2%5610 6.41 5.80 -9.5%5645 10.79 11.01 2.0%5703 13.12 13.06 -0.5%5705 15.52 18.47 19.0%5951 0.55 0.54 -1.8%6003 5.77 6.49 12.5%6005 11.80 9.69 -17.9%6045 2.12 2.52 18.9%6204 10.24 11.68 14.1%6206 3.74 3.54 -5.3%
© Copyright 2014 National Council on Compensation Insurance, Inc. All Rights Reserved.
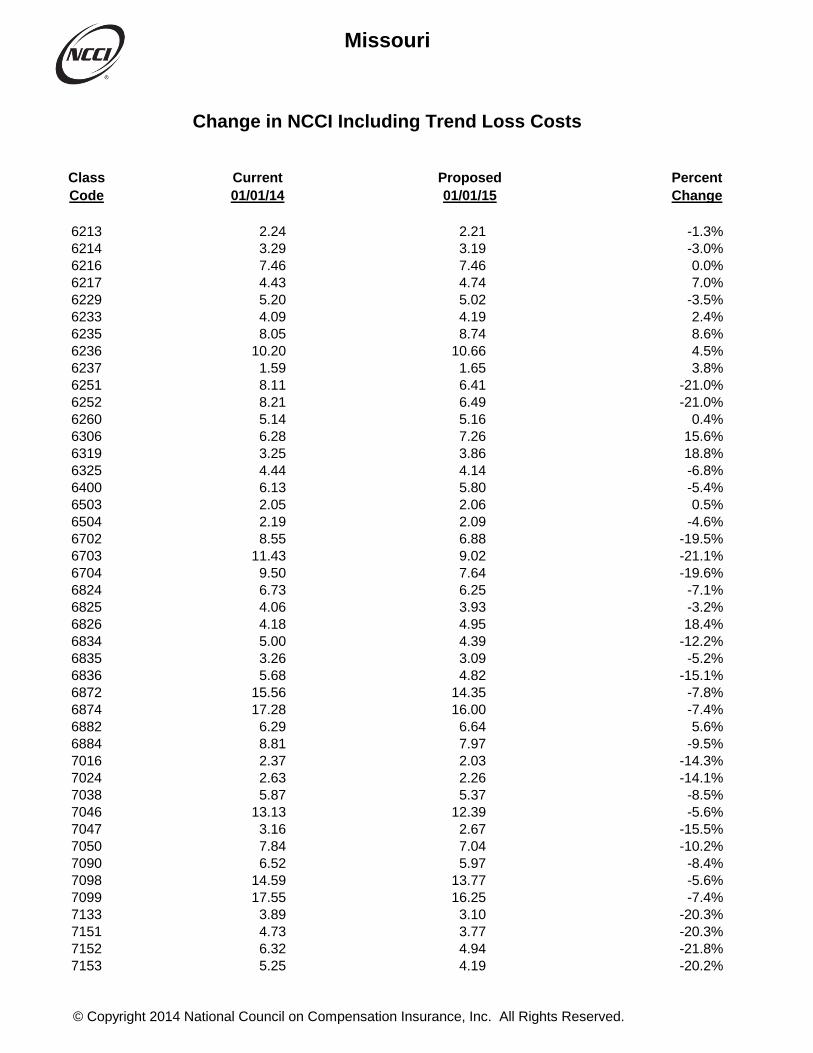
Class Current Proposed PercentCode 01/01/14 01/01/15 Change
Missouri
Change in NCCI Including Trend Loss Costs
6213 2.24 2.21 -1.3%6214 3.29 3.19 -3.0%6216 7.46 7.46 0.0%6217 4.43 4.74 7.0%6229 5.20 5.02 -3.5%6233 4.09 4.19 2.4%6235 8.05 8.74 8.6%6236 10.20 10.66 4.5%6237 1.59 1.65 3.8%6251 8.11 6.41 -21.0%6252 8.21 6.49 -21.0%6260 5.14 5.16 0.4%6306 6.28 7.26 15.6%6319 3.25 3.86 18.8%6325 4.44 4.14 -6.8%6400 6.13 5.80 -5.4%6503 2.05 2.06 0.5%6504 2.19 2.09 -4.6%6702 8.55 6.88 -19.5%6703 11.43 9.02 -21.1%6704 9.50 7.64 -19.6%6824 6.73 6.25 -7.1%6825 4.06 3.93 -3.2%6826 4.18 4.95 18.4%6834 5.00 4.39 -12.2%6835 3.26 3.09 -5.2%6836 5.68 4.82 -15.1%6872 15.56 14.35 -7.8%6874 17.28 16.00 -7.4%6882 6.29 6.64 5.6%6884 8.81 7.97 -9.5%7016 2.37 2.03 -14.3%7024 2.63 2.26 -14.1%7038 5.87 5.37 -8.5%7046 13.13 12.39 -5.6%7047 3.16 2.67 -15.5%7050 7.84 7.04 -10.2%7090 6.52 5.97 -8.4%7098 14.59 13.77 -5.6%7099 17.55 16.25 -7.4%7133 3.89 3.10 -20.3%7151 4.73 3.77 -20.3%7152 6.32 4.94 -21.8%7153 5.25 4.19 -20.2%
© Copyright 2014 National Council on Compensation Insurance, Inc. All Rights Reserved.

Class Current Proposed PercentCode 01/01/14 01/01/15 Change
Missouri
Change in NCCI Including Trend Loss Costs
7207 10.23 10.20 -0.3%7222 4.94 5.67 14.8%7228 6.40 6.20 -3.1%7229 8.29 8.27 -0.2%7230 6.79 6.43 -5.3%7231 10.63 10.18 -4.2%7232 7.36 7.83 6.4%7250 8.81 10.39 17.9%7309 14.28 13.84 -3.1%7313 3.69 3.05 -17.3%7317 7.74 8.14 5.2%7327 21.79 19.45 -10.7%7333 3.19 2.71 -15.0%7335 3.54 3.01 -15.0%7337 4.26 3.55 -16.7%7350 8.43 8.71 3.3%7360 6.34 6.46 1.9%7370 4.70 4.42 -6.0%7380 4.26 4.30 0.9%7382 3.77 3.84 1.9%7390 8.09 8.40 3.8%7394 8.37 6.58 -21.4%7395 9.30 7.31 -21.4%7398 11.19 8.63 -22.9%7402 0.18 0.16 -11.1%7403 4.96 4.99 0.6%7405 0.97 1.00 3.1%7420 16.12 12.90 -20.0%7421 1.12 0.88 -21.4%7422 2.63 2.80 6.5%7425 2.57 3.03 17.9%7431 1.23 0.99 -19.5%7445 0.52 0.54 3.8%7453 0.66 0.53 -19.7%7502 4.16 4.09 -1.7%7515 1.39 1.20 -13.7%7520 4.34 4.12 -5.1%7538 9.40 8.13 -13.5%7539 3.70 3.25 -12.2%7540 3.77 3.58 -5.0%7580 2.53 2.46 -2.8%7590 3.99 3.39 -15.0%7600 3.02 3.19 5.6%7605 2.51 2.55 1.6%
© Copyright 2014 National Council on Compensation Insurance, Inc. All Rights Reserved.
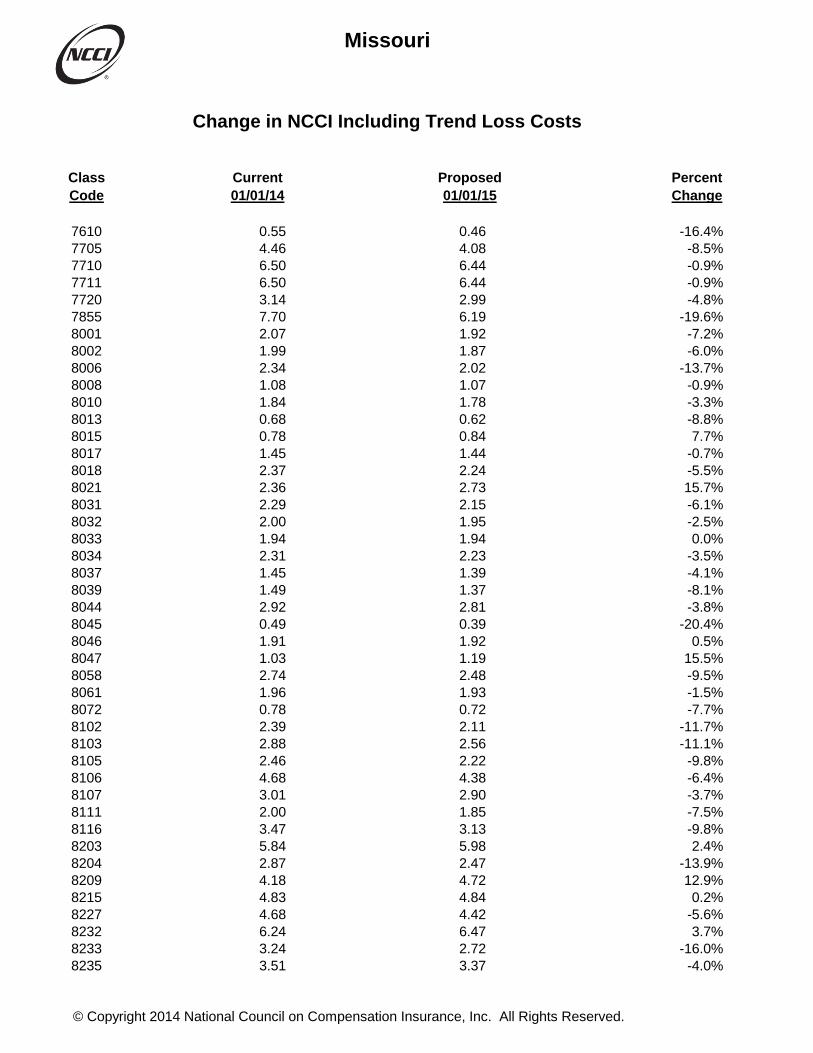
Class Current Proposed PercentCode 01/01/14 01/01/15 Change
Missouri
Change in NCCI Including Trend Loss Costs
7610 0.55 0.46 -16.4%7705 4.46 4.08 -8.5%7710 6.50 6.44 -0.9%7711 6.50 6.44 -0.9%7720 3.14 2.99 -4.8%7855 7.70 6.19 -19.6%8001 2.07 1.92 -7.2%8002 1.99 1.87 -6.0%8006 2.34 2.02 -13.7%8008 1.08 1.07 -0.9%8010 1.84 1.78 -3.3%8013 0.68 0.62 -8.8%8015 0.78 0.84 7.7%8017 1.45 1.44 -0.7%8018 2.37 2.24 -5.5%8021 2.36 2.73 15.7%8031 2.29 2.15 -6.1%8032 2.00 1.95 -2.5%8033 1.94 1.94 0.0%8034 2.31 2.23 -3.5%8037 1.45 1.39 -4.1%8039 1.49 1.37 -8.1%8044 2.92 2.81 -3.8%8045 0.49 0.39 -20.4%8046 1.91 1.92 0.5%8047 1.03 1.19 15.5%8058 2.74 2.48 -9.5%8061 1.96 1.93 -1.5%8072 0.78 0.72 -7.7%8102 2.39 2.11 -11.7%8103 2.88 2.56 -11.1%8105 2.46 2.22 -9.8%8106 4.68 4.38 -6.4%8107 3.01 2.90 -3.7%8111 2.00 1.85 -7.5%8116 3.47 3.13 -9.8%8203 5.84 5.98 2.4%8204 2.87 2.47 -13.9%8209 4.18 4.72 12.9%8215 4.83 4.84 0.2%8227 4.68 4.42 -5.6%8232 6.24 6.47 3.7%8233 3.24 2.72 -16.0%8235 3.51 3.37 -4.0%
© Copyright 2014 National Council on Compensation Insurance, Inc. All Rights Reserved.
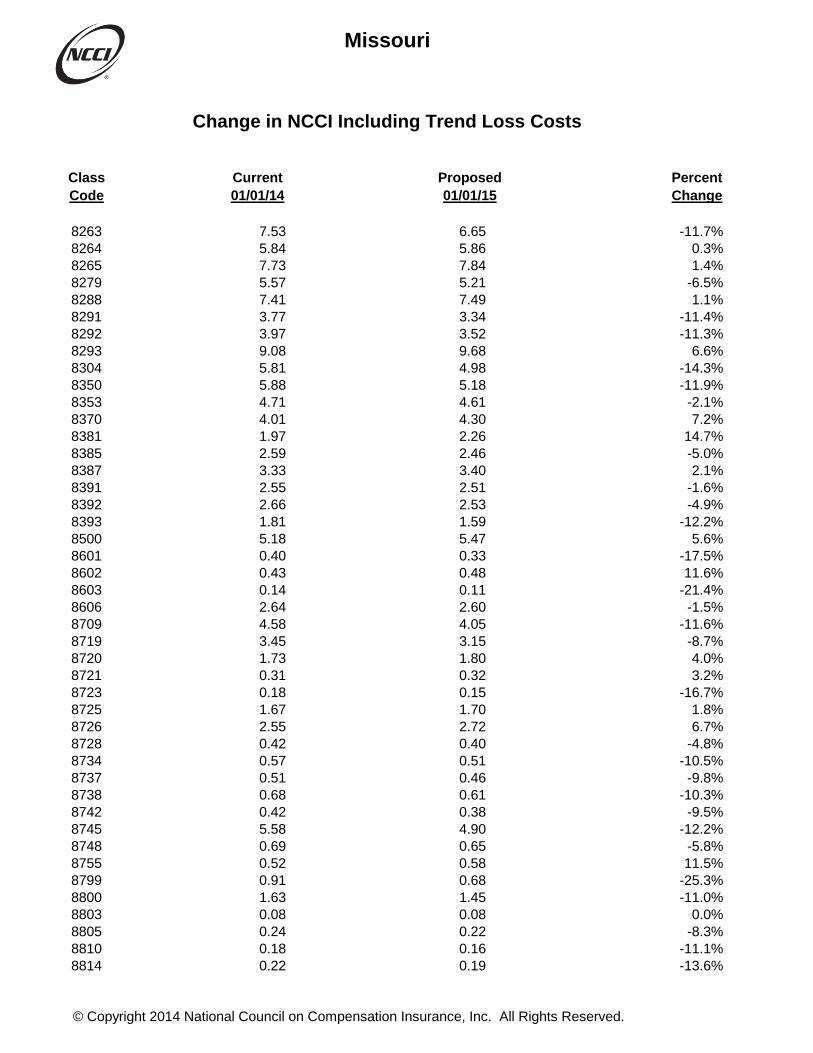
Class Current Proposed PercentCode 01/01/14 01/01/15 Change
Missouri
Change in NCCI Including Trend Loss Costs
8263 7.53 6.65 -11.7%8264 5.84 5.86 0.3%8265 7.73 7.84 1.4%8279 5.57 5.21 -6.5%8288 7.41 7.49 1.1%8291 3.77 3.34 -11.4%8292 3.97 3.52 -11.3%8293 9.08 9.68 6.6%8304 5.81 4.98 -14.3%8350 5.88 5.18 -11.9%8353 4.71 4.61 -2.1%8370 4.01 4.30 7.2%8381 1.97 2.26 14.7%8385 2.59 2.46 -5.0%8387 3.33 3.40 2.1%8391 2.55 2.51 -1.6%8392 2.66 2.53 -4.9%8393 1.81 1.59 -12.2%8500 5.18 5.47 5.6%8601 0.40 0.33 -17.5%8602 0.43 0.48 11.6%8603 0.14 0.11 -21.4%8606 2.64 2.60 -1.5%8709 4.58 4.05 -11.6%8719 3.45 3.15 -8.7%8720 1.73 1.80 4.0%8721 0.31 0.32 3.2%8723 0.18 0.15 -16.7%8725 1.67 1.70 1.8%8726 2.55 2.72 6.7%8728 0.42 0.40 -4.8%8734 0.57 0.51 -10.5%8737 0.51 0.46 -9.8%8738 0.68 0.61 -10.3%8742 0.42 0.38 -9.5%8745 5.58 4.90 -12.2%8748 0.69 0.65 -5.8%8755 0.52 0.58 11.5%8799 0.91 0.68 -25.3%8800 1.63 1.45 -11.0%8803 0.08 0.08 0.0%8805 0.24 0.22 -8.3%8810 0.18 0.16 -11.1%8814 0.22 0.19 -13.6%
© Copyright 2014 National Council on Compensation Insurance, Inc. All Rights Reserved.

Class Current Proposed PercentCode 01/01/14 01/01/15 Change
Missouri
Change in NCCI Including Trend Loss Costs
8815 0.29 0.25 -13.8%8820 0.20 0.17 -15.0%8824 2.92 2.72 -6.8%8825 1.93 1.66 -14.0%8826 2.33 2.16 -7.3%8829 2.27 2.14 -5.7%8831 1.81 1.65 -8.8%8832 0.33 0.30 -9.1%8833 1.08 1.03 -4.6%8835 2.27 2.22 -2.2%8855 0.18 0.20 11.1%8856 0.18 0.16 -11.1%8861 1.56 1.57 0.6%8868 0.39 0.38 -2.6%8869 1.15 1.05 -8.7%8871 0.14 0.11 -21.4%8901 0.17 0.19 11.8%9012 1.24 1.25 0.8%9014 2.83 2.42 -14.5%9015 3.33 3.06 -8.1%9016 3.25 3.09 -4.9%9019 1.73 1.69 -2.3%9033 1.87 1.66 -11.2%9040 3.63 3.83 5.5%9044 1.29 1.18 -8.5%9052 2.05 1.85 -9.8%9058 1.71 1.74 1.8%9060 1.39 1.35 -2.9%9061 1.55 1.63 5.2%9062 1.67 1.57 -6.0%9063 0.98 1.04 6.1%9077 2.35 2.32 -1.3%9082 1.46 1.32 -9.6%9083 1.32 1.17 -11.4%9084 1.46 1.54 5.5%9089 1.23 1.40 13.8%9093 1.42 1.44 1.4%9101 3.95 3.50 -11.4%9102 2.90 3.03 4.5%9110 3.43 3.22 -6.1%9154 1.81 1.71 -5.5%9156 2.09 2.13 1.9%9170 6.30 7.30 15.9%9178 11.94 11.20 -6.2%
© Copyright 2014 National Council on Compensation Insurance, Inc. All Rights Reserved.
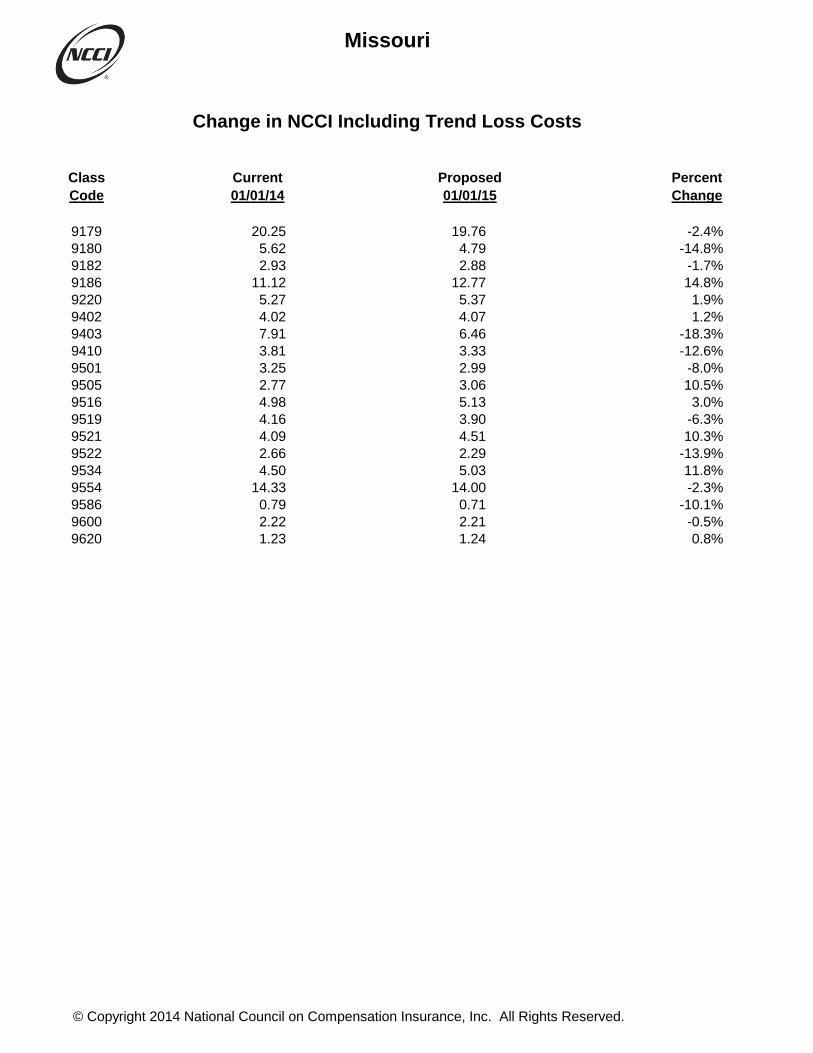
Class Current Proposed PercentCode 01/01/14 01/01/15 Change
Missouri
Change in NCCI Including Trend Loss Costs
9179 20.25 19.76 -2.4%9180 5.62 4.79 -14.8%9182 2.93 2.88 -1.7%9186 11.12 12.77 14.8%9220 5.27 5.37 1.9%9402 4.02 4.07 1.2%9403 7.91 6.46 -18.3%9410 3.81 3.33 -12.6%9501 3.25 2.99 -8.0%9505 2.77 3.06 10.5%9516 4.98 5.13 3.0%9519 4.16 3.90 -6.3%9521 4.09 4.51 10.3%9522 2.66 2.29 -13.9%9534 4.50 5.03 11.8%9554 14.33 14.00 -2.3%9586 0.79 0.71 -10.1%9600 2.22 2.21 -0.5%9620 1.23 1.24 0.8%
© Copyright 2014 National Council on Compensation Insurance, Inc. All Rights Reserved.