filing at a glance - rate review home...
TRANSCRIPT
Filing at a Glance
Company: TVHP
Product Name: Q3 2016 TVHP Large Group Rating Program Filing
State: VermontGMCB
TOI: ML02 Multi-Line - Other
Sub-TOI: ML02.000 Multi-Line - Other
Filing Type: GMCB Trend / Admin Charge
Date Submitted: 02/22/2016
SERFF Tr Num: BCVT-130457790
SERFF Status: Assigned
State Tr Num:
State Status:
Co Tr Num:
ImplementationDate Requested:
On Approval
Author(s): Pam Young, Jude Daye, Martine Brisson-Lemieux, Paul Shultz
Reviewer(s): Thomas Crompton (primary), David Dillon, Judith Henkin, Jacqueline Lee
Disposition Date:
Disposition Status:
Implementation Date:
State Filing Description:
SERFF Tracking #: BCVT-130457790 State Tracking #: Company Tracking #:
State: VermontGMCB Filing Company: TVHP
TOI/Sub-TOI: ML02 Multi-Line - Other/ML02.000 Multi-Line - Other
Product Name: Q3 2016 TVHP Large Group Rating Program Filing
Project Name/Number: /
PDF Pipeline for SERFF Tracking Number BCVT-130457790 Generated 02/23/2016 07:14 AM
General Information
Company and Contact
Project Name: Status of Filing in Domicile:
Project Number: Date Approved in Domicile:
Requested Filing Mode: Review & Approval Domicile Status Comments:
Explanation for Combination/Other: Market Type: Group
Submission Type: New Submission Group Market Size: Large
Group Market Type: Other Explanation for Other Group Market Type: Trend/Admin/Factor
Overall Rate Impact: Filing Status Changed: 02/23/2016
State Status Changed:
Deemer Date: Created By: Jude Daye
Submitted By: Jude Daye Corresponding Filing Tracking Number:
Filing Description:
February 19, 2016
Judith Henkin, Esq.Health Policy DirectorGreen Mountain Care Board89 Main Street, Third Floor, City CenterMontpelier, Vermont 05620
Subject:The Vermont Health Plan - NAIC # 95696 Q3 2016 Large Group Rating Program Filing
Dear Ms. Henkin:
Attached for the Green Mountain Care Board’s review and approval is The Vermont Health Plan’s Q3 2016 Large GroupRating Program Filing. As directed by the Board, this filing combines the various factor filings for large group ratingcomponents (trend, large claims, benefit relativity, administrative fees and contribution to reserve, and the formula itself) into asingle filing.
Please let me know if we can answer any questions or provide further information during your review.
Sincerely,
Ruth Greene
cc:Tom Crompton/GMCBPaul Schultz/BCBSVT Martine Brisson-Lemieux/BCBSVT
Filing Contact InformationJude Daye, Executive Assistant [email protected]
445 Industrial Lane
Montpelier, VT 05601
802-371-3244 [Phone]
SERFF Tracking #: BCVT-130457790 State Tracking #: Company Tracking #:
State: VermontGMCB Filing Company: TVHP
TOI/Sub-TOI: ML02 Multi-Line - Other/ML02.000 Multi-Line - Other
Product Name: Q3 2016 TVHP Large Group Rating Program Filing
Project Name/Number: /
PDF Pipeline for SERFF Tracking Number BCVT-130457790 Generated 02/23/2016 07:14 AM
Filing Fees
Filing Company InformationTVHP
PO BOX 186
Montpelier, VT 05601
(802) 371-3450 ext. [Phone]
CoCode: 95696
Group Code:
Group Name:
FEIN Number: 03-0354356
State of Domicile: Vermont
Company Type: HMO
State ID Number:
Fee Required? No
Retaliatory? No
Fee Explanation:
SERFF Tracking #: BCVT-130457790 State Tracking #: Company Tracking #:
State: VermontGMCB Filing Company: TVHP
TOI/Sub-TOI: ML02 Multi-Line - Other/ML02.000 Multi-Line - Other
Product Name: Q3 2016 TVHP Large Group Rating Program Filing
Project Name/Number: /
PDF Pipeline for SERFF Tracking Number BCVT-130457790 Generated 02/23/2016 07:14 AM
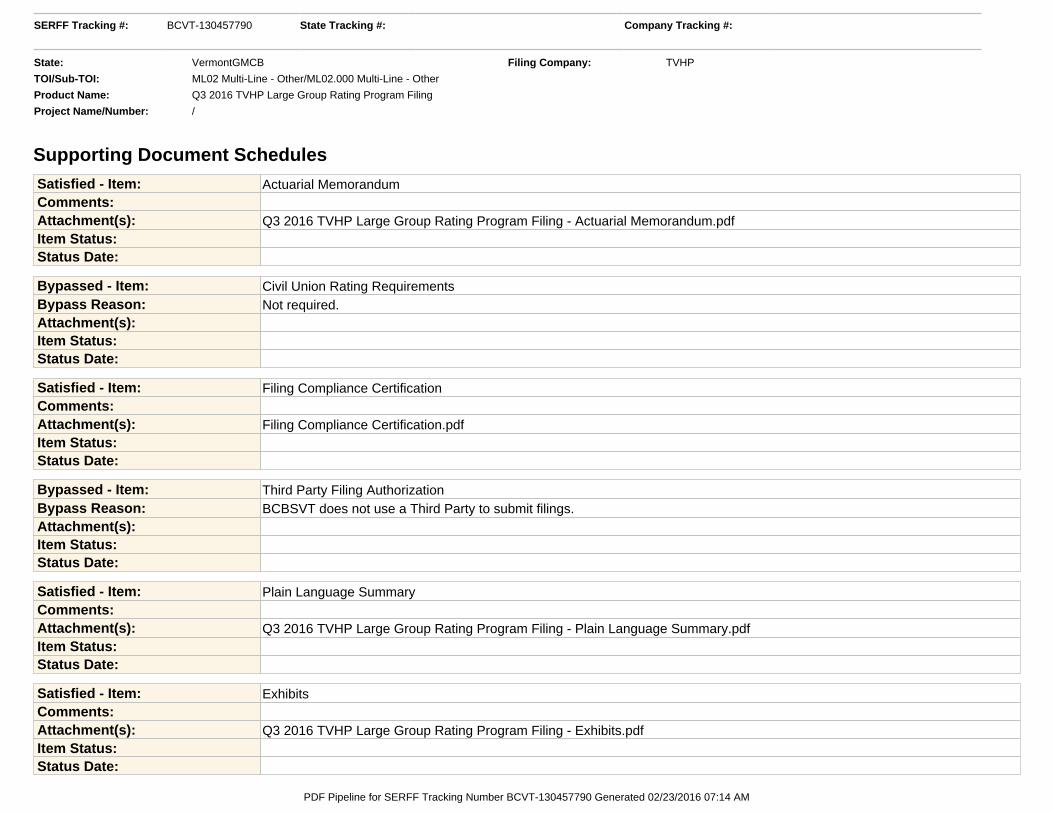
Supporting Document Schedules Satisfied - Item: Actuarial MemorandumComments:Attachment(s): Q3 2016 TVHP Large Group Rating Program Filing - Actuarial Memorandum.pdfItem Status:Status Date:
Bypassed - Item: Civil Union Rating RequirementsBypass Reason: Not required.Attachment(s):Item Status:Status Date:
Satisfied - Item: Filing Compliance CertificationComments:Attachment(s): Filing Compliance Certification.pdfItem Status:Status Date:
Bypassed - Item: Third Party Filing AuthorizationBypass Reason: BCBSVT does not use a Third Party to submit filings.Attachment(s):Item Status:Status Date:
Satisfied - Item: Plain Language SummaryComments:Attachment(s): Q3 2016 TVHP Large Group Rating Program Filing - Plain Language Summary.pdfItem Status:Status Date:
Satisfied - Item: ExhibitsComments:Attachment(s): Q3 2016 TVHP Large Group Rating Program Filing - Exhibits.pdfItem Status:Status Date:
SERFF Tracking #: BCVT-130457790 State Tracking #: Company Tracking #:
State: VermontGMCB Filing Company: TVHP
TOI/Sub-TOI: ML02 Multi-Line - Other/ML02.000 Multi-Line - Other
Product Name: Q3 2016 TVHP Large Group Rating Program Filing
Project Name/Number: /
PDF Pipeline for SERFF Tracking Number BCVT-130457790 Generated 02/23/2016 07:14 AM

The Vermont Health Plan Q3 2016 Large Group Rating Program Filing
Actuarial Memorandum
1
Table of Contents
1. PURPOSE ........................................................................................................................................... 2
2. OVERVIEW AND RATE IMPACT ................................................................................................. 2
2.1. Overview ......................................................................................................................................... 2
2.2. Impact of Formula and Factor Changes .................................................................................... 2
3. FORMULA DESCRIPTION .............................................................................................................. 3
4. FACTORS APPLICABLE TO ALL LARGE GROUPS ................................................................. 5
4.1. Large Claims Factors ................................................................................................................... 5
4.2. Trend Factors ............................................................................................................................... 7
4.3. Benefit Relativity Factors ........................................................................................................ 15
4.4. Manual Rate ................................................................................................................................. 19
4.5. Administrative Charges ............................................................................................................ 20
4.6. Net Cost of Reinsurance ........................................................................................................... 22
4.7. Pharmacy Rebates ..................................................................................................................... 22
4.8. Contribution to Reserve ........................................................................................................... 22
4.9. State Mandates and Assessments ........................................................................................... 23
4.10. Federal Assessments ............................................................................................................. 24
5. FACTORS APPLICABLE ONLY TO SPECIFIC PRODUCTS................................................. 25
5.1. Risk and Administrative Charges for Experience Refund Eligible products ................ 25
6. ACTUARIAL OPINION .................................................................................................................. 26
The Vermont Health Plan Q3 2016 Large Group Rating Program Filing
Actuarial Memorandum
2
1. Purpose
The Vermont Health Plan (TVHP) performs large group rating on a case-by-case basis. Rating is accomplished through a formulaic approach that blends recent group experience with a manual rate according to a credibility formula. Formula results may be adjusted for underwriting judgment and/or management decisions. This filing establishes the formula, manual rate, and accompanying factors that will be used for renewals beginning upon approval of this filing, most notably January 2017 renewals. Once approved, this filing will be used for large group renewals prepared for business under the jurisdiction of the Green Mountain Care Board (GMCB) until superseded by a subsequent filing. This filing will apply beginning with rates communicated 10 business days after the date of its approval, and continuing until 10 business days after the date of approval of the next TVHP Large Group Rating Program Filing. The term “communicated,” for this purpose, means a written proposal delivered to a large group account.
2. Overview and Rate Impact 2.1. Overview This filing includes a description of the renewal formula and the development of each of the factors used in it. TVHP projects that about 15,500 members (7,800 subscribers) in 67 groups will be impacted by this filing. We will describe in detail the formula used in the renewals. The formula has been modified from the currently approved version (BCVT-129912021). The changes, described in detail below, pertain to the handling of the changes in pharmacy contracts. We will then detail the factors applicable to Large Groups. The factors included in the build-up of the projected claims cost include the Large Claims Factors, Trend Factors, Benefit Relativities, and the Manual Rate. In addition to the projected claims cost, we will explain the calculation of administrative charges, the net cost of reinsurance, contribution to reserve, and State and Federal Assessments, all of which are included in the rate development. Finally, we will discuss factors applicable only to specific products. We offer an Experience Refund Eligible product for which risk charges and settlement administration changes apply. 2.2. Impact of Formula and Factor Changes To compute the impact of changes to the rating formula and the various factors in this filing on large group premium rates, we produce two renewals for each of the 67 large groups we expect to enroll in 2017. The first renewal uses the approved factors currently in force (BCVT-129912021) with an effective date of January 1, 2016. The rates in these renewals are used as a baseline for the comparison with the rates produced by the new factors. The second renewal uses the same experience period as the first but has an effective date of January 1, 2017 and uses the factors and formulas detailed in this filing. The new trend factors are applied for 12 months to represent an additional year of trend with the new trend assumption.
The Vermont Health Plan Q3 2016 Large Group Rating Program Filing
Actuarial Memorandum
3
The result of comparing the renewals across all 67 large groups is an average 4.3 percent rate increase. Reasons for the rate increase can be attributed to two main causes: changes in the rating formula and filed factors, and changes mandated due to the Affordable Care Act (ACA). The largest component of the increase due to changes in the filed factors is the additional year of trend applied to the experience and manual claims. The trend is responsible for a 6.7 percent increase in projected claims, which results in a 5.9 percent increase in premium. Administrative charges are increasing by 7.3 percent, which increases required premium by 0.4 percent. We are requesting a 2.0 percent contribution to reserve (0.5 percent for Cost Plus groups), which represents a 0.9 percent increase in premium. The average rate increase from all changes to the formula and factors is 7.4 percent. Changes in federal programs under the ACA work to reduce the average rate increase by 2.9 percent. There are two major components of this decrease. In 2017, the transitional reinsurance program expires. This program costs $27 per member per year in 2016. The federal insurer fee is assessed to insured groups and goes to pay for some provisions of the ACA. The Consolidated Appropriation Act of 2016 temporarily suspended this fee for 2017. We estimate the fee is 2.7 percent of premium in 2016 and 2.5 percent of premium when it returns in 2018. The elimination of these fees in 2017 results in the decrease to the average premium required. 3. Formula Description Benefit-Adjusted Projected Single Claims Rate A sample calculation of this quantity can be found as Exhibit 1A. For each case, we start the rating with at least a twelve month experience period with two months of runout1. We determine a pooling point based on the size of the case during the experience period and split the experience period claims (line A) into amounts above (line B) and below (referred to as Capped Claims, line C) the pooling point. We apply completion factors (line D) developed from the monthly financial reporting process to Capped Claims to produce Completed Capped Claims (line E). We multiply the claims under the pooling point by the pooling factor (line F, described in section 4.1) to calculate the expected claims above the pooling point (line G). The expected claims above the pooling limit are added to the Completed Capped Claims to produce large-claim-adjusted experience period claims. We then multiply these claims by an adjustment factor (line H) to reflect structural changes in the benefit plan from the experience period to the rating period. This is to adjust for such things as mandated benefit changes, contractual provision changes, etc., that, in the judgment of the underwriter, are necessary to make the experience appropriate for the estimation of the expected claims in the rating period. We divide the result (line I) by the number of member months during the experience period (line J) to produce Adjusted Experience Period Claims per member per month (line K). The Adjusted Experience Period Claims per member per month (PMPM) is then divided by a seasonally-adjusted benefit relativity value to neutralize any effect of seasonality and benefits on the paid claims. To determine this factor, we first determine a benefit relativity factor for
1 For first year renewals, where twelve months of experience is not available, we generally use claims incurred in nine
months with no runout.
The Vermont Health Plan Q3 2016 Large Group Rating Program Filing
Actuarial Memorandum
4
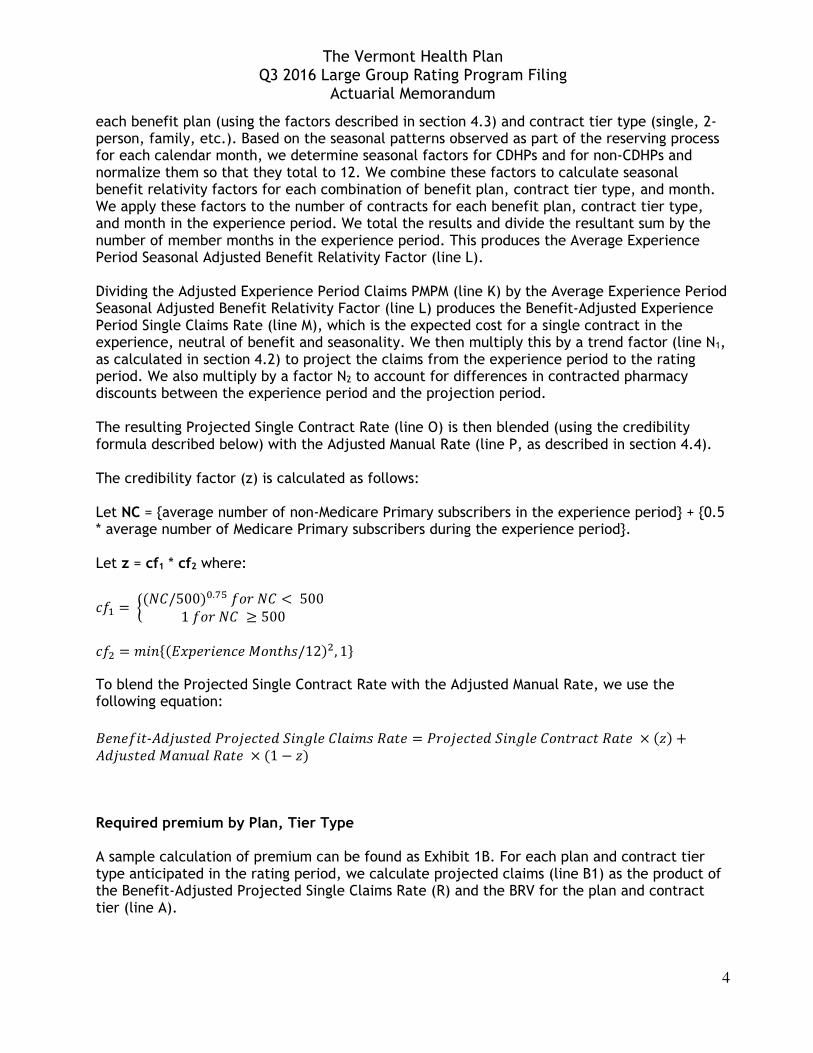
each benefit plan (using the factors described in section 4.3) and contract tier type (single, 2-person, family, etc.). Based on the seasonal patterns observed as part of the reserving process for each calendar month, we determine seasonal factors for CDHPs and for non-CDHPs and normalize them so that they total to 12. We combine these factors to calculate seasonal benefit relativity factors for each combination of benefit plan, contract tier type, and month. We apply these factors to the number of contracts for each benefit plan, contract tier type, and month in the experience period. We total the results and divide the resultant sum by the number of member months in the experience period. This produces the Average Experience Period Seasonal Adjusted Benefit Relativity Factor (line L). Dividing the Adjusted Experience Period Claims PMPM (line K) by the Average Experience Period Seasonal Adjusted Benefit Relativity Factor (line L) produces the Benefit-Adjusted Experience Period Single Claims Rate (line M), which is the expected cost for a single contract in the experience, neutral of benefit and seasonality. We then multiply this by a trend factor (line N1, as calculated in section 4.2) to project the claims from the experience period to the rating period. We also multiply by a factor N2 to account for differences in contracted pharmacy discounts between the experience period and the projection period. The resulting Projected Single Contract Rate (line O) is then blended (using the credibility formula described below) with the Adjusted Manual Rate (line P, as described in section 4.4). The credibility factor (z) is calculated as follows: Let NC = {average number of non-Medicare Primary subscribers in the experience period} + {0.5 * average number of Medicare Primary subscribers during the experience period}. Let z = cf1 * cf2 where:
��� = �(�/500)�.������ < 500
1���� ≥ 500
��� = ����(���������� ��!ℎ#/12)�, 1& To blend the Projected Single Contract Rate with the Adjusted Manual Rate, we use the following equation:
'�����!-)*+,#!�*-��+��!�*.��/0�01��#21!� = -��+��!�*.��/0���!�1�!21!� × (4) +)*+,#!�* 1�,1021!� × (1 − 4) Required premium by Plan, Tier Type A sample calculation of premium can be found as Exhibit 1B. For each plan and contract tier type anticipated in the rating period, we calculate projected claims (line B1) as the product of the Benefit-Adjusted Projected Single Claims Rate (R) and the BRV for the plan and contract tier (line A).
The Vermont Health Plan Q3 2016 Large Group Rating Program Filing
Actuarial Memorandum
5
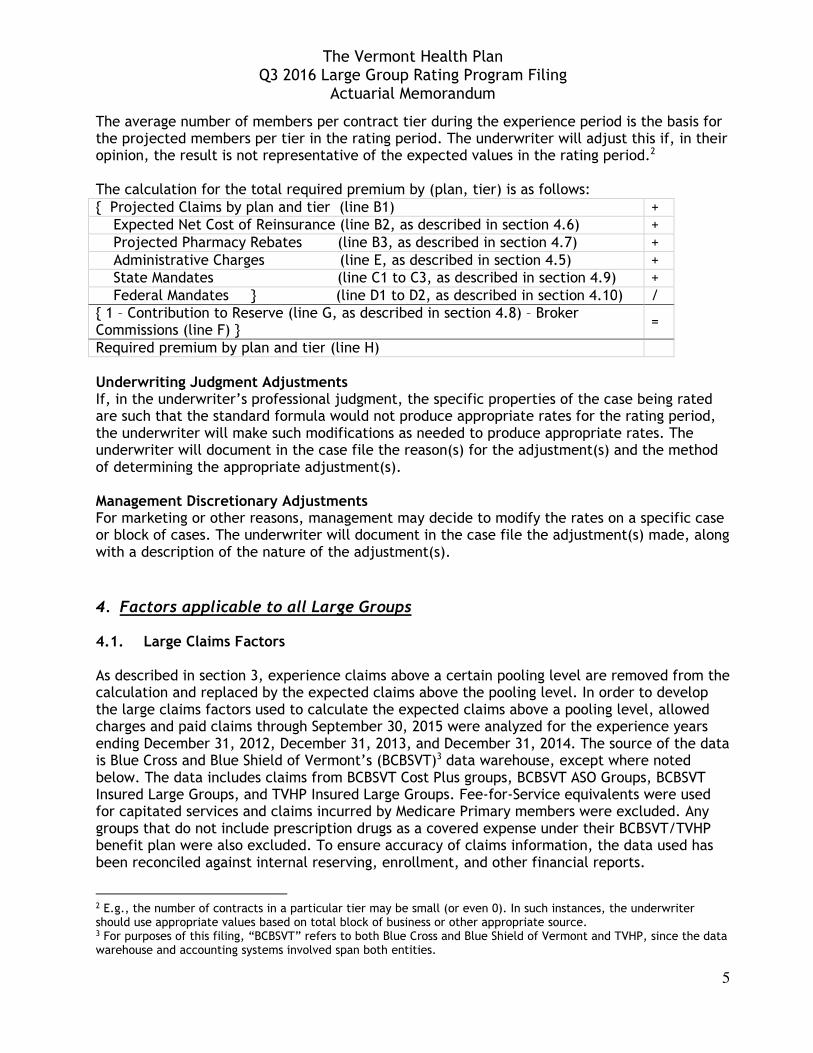
The average number of members per contract tier during the experience period is the basis for the projected members per tier in the rating period. The underwriter will adjust this if, in their opinion, the result is not representative of the expected values in the rating period.2 The calculation for the total required premium by (plan, tier) is as follows: { Projected Claims by plan and tier (line B1) + Expected Net Cost of Reinsurance (line B2, as described in section 4.6) + Projected Pharmacy Rebates (line B3, as described in section 4.7) + Administrative Charges (line E, as described in section 4.5) + State Mandates (line C1 to C3, as described in section 4.9) + Federal Mandates } (line D1 to D2, as described in section 4.10) / { 1 – Contribution to Reserve (line G, as described in section 4.8) – Broker Commissions (line F) }
=
Required premium by plan and tier (line H) Underwriting Judgment Adjustments If, in the underwriter’s professional judgment, the specific properties of the case being rated are such that the standard formula would not produce appropriate rates for the rating period, the underwriter will make such modifications as needed to produce appropriate rates. The underwriter will document in the case file the reason(s) for the adjustment(s) and the method of determining the appropriate adjustment(s). Management Discretionary Adjustments For marketing or other reasons, management may decide to modify the rates on a specific case or block of cases. The underwriter will document in the case file the adjustment(s) made, along with a description of the nature of the adjustment(s). 4. Factors applicable to all Large Groups 4.1. Large Claims Factors
As described in section 3, experience claims above a certain pooling level are removed from the calculation and replaced by the expected claims above the pooling level. In order to develop the large claims factors used to calculate the expected claims above a pooling level, allowed charges and paid claims through September 30, 2015 were analyzed for the experience years ending December 31, 2012, December 31, 2013, and December 31, 2014. The source of the data is Blue Cross and Blue Shield of Vermont’s (BCBSVT)3 data warehouse, except where noted below. The data includes claims from BCBSVT Cost Plus groups, BCBSVT ASO Groups, BCBSVT Insured Large Groups, and TVHP Insured Large Groups. Fee-for-Service equivalents were used for capitated services and claims incurred by Medicare Primary members were excluded. Any groups that do not include prescription drugs as a covered expense under their BCBSVT/TVHP benefit plan were also excluded. To ensure accuracy of claims information, the data used has been reconciled against internal reserving, enrollment, and other financial reports.
2 E.g., the number of contracts in a particular tier may be small (or even 0). In such instances, the underwriter should use appropriate values based on total block of business or other appropriate source. 3 For purposes of this filing, “BCBSVT” refers to both Blue Cross and Blue Shield of Vermont and TVHP, since the data warehouse and accounting systems involved span both entities.
The Vermont Health Plan Q3 2016 Large Group Rating Program Filing
Actuarial Memorandum
6
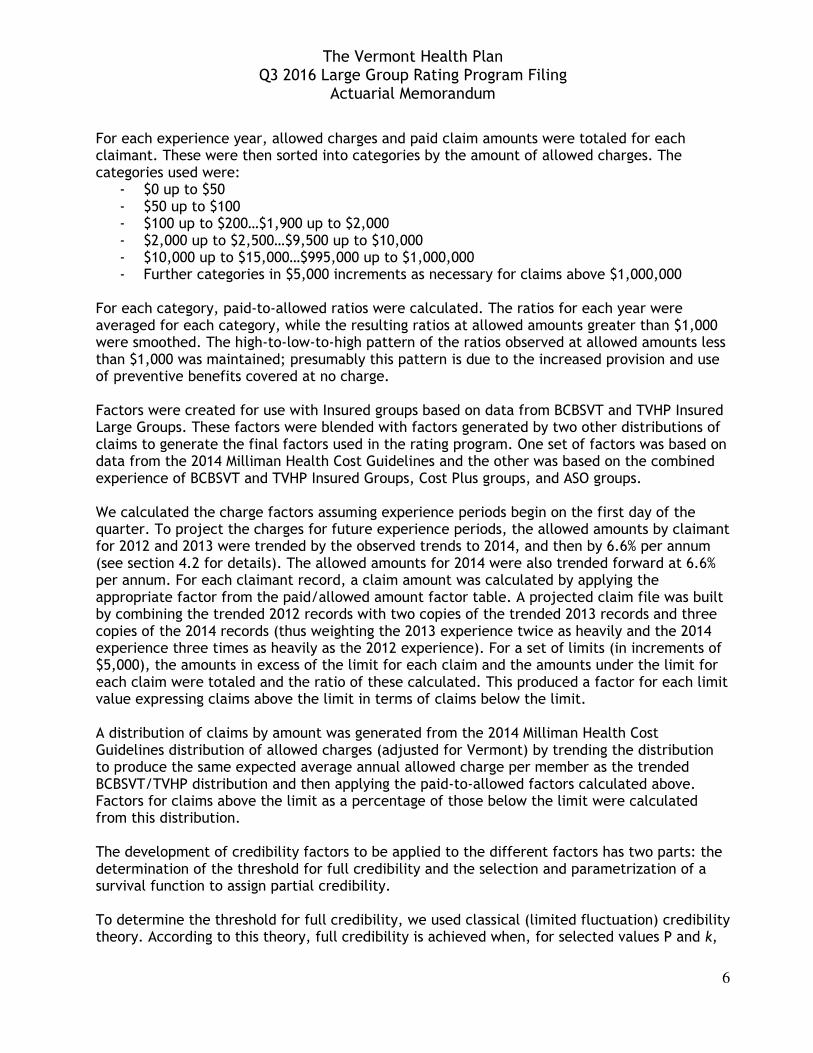
For each experience year, allowed charges and paid claim amounts were totaled for each claimant. These were then sorted into categories by the amount of allowed charges. The categories used were:
- $0 up to $50 - $50 up to $100 - $100 up to $200…$1,900 up to $2,000 - $2,000 up to $2,500…$9,500 up to $10,000 - $10,000 up to $15,000…$995,000 up to $1,000,000 - Further categories in $5,000 increments as necessary for claims above $1,000,000
For each category, paid-to-allowed ratios were calculated. The ratios for each year were averaged for each category, while the resulting ratios at allowed amounts greater than $1,000 were smoothed. The high-to-low-to-high pattern of the ratios observed at allowed amounts less than $1,000 was maintained; presumably this pattern is due to the increased provision and use of preventive benefits covered at no charge. Factors were created for use with Insured groups based on data from BCBSVT and TVHP Insured Large Groups. These factors were blended with factors generated by two other distributions of claims to generate the final factors used in the rating program. One set of factors was based on data from the 2014 Milliman Health Cost Guidelines and the other was based on the combined experience of BCBSVT and TVHP Insured Groups, Cost Plus groups, and ASO groups. We calculated the charge factors assuming experience periods begin on the first day of the quarter. To project the charges for future experience periods, the allowed amounts by claimant for 2012 and 2013 were trended by the observed trends to 2014, and then by 6.6% per annum (see section 4.2 for details). The allowed amounts for 2014 were also trended forward at 6.6% per annum. For each claimant record, a claim amount was calculated by applying the appropriate factor from the paid/allowed amount factor table. A projected claim file was built by combining the trended 2012 records with two copies of the trended 2013 records and three copies of the 2014 records (thus weighting the 2013 experience twice as heavily and the 2014 experience three times as heavily as the 2012 experience). For a set of limits (in increments of $5,000), the amounts in excess of the limit for each claim and the amounts under the limit for each claim were totaled and the ratio of these calculated. This produced a factor for each limit value expressing claims above the limit in terms of claims below the limit. A distribution of claims by amount was generated from the 2014 Milliman Health Cost Guidelines distribution of allowed charges (adjusted for Vermont) by trending the distribution to produce the same expected average annual allowed charge per member as the trended BCBSVT/TVHP distribution and then applying the paid-to-allowed factors calculated above. Factors for claims above the limit as a percentage of those below the limit were calculated from this distribution. The development of credibility factors to be applied to the different factors has two parts: the determination of the threshold for full credibility and the selection and parametrization of a survival function to assign partial credibility. To determine the threshold for full credibility, we used classical (limited fluctuation) credibility theory. According to this theory, full credibility is achieved when, for selected values P and k,
The Vermont Health Plan Q3 2016 Large Group Rating Program Filing
Actuarial Memorandum
7
the probability that the sample mean differs from its expected value by less than a fraction k of the expected mean is equal to P. Formulaically, for a given distribution X, the number of observations of X required for full credibility is:
�� ∗ 89:(;)(<(;))= , where �� = >?@A B� and yp is the (1+P)/2 percentile of the standard normal
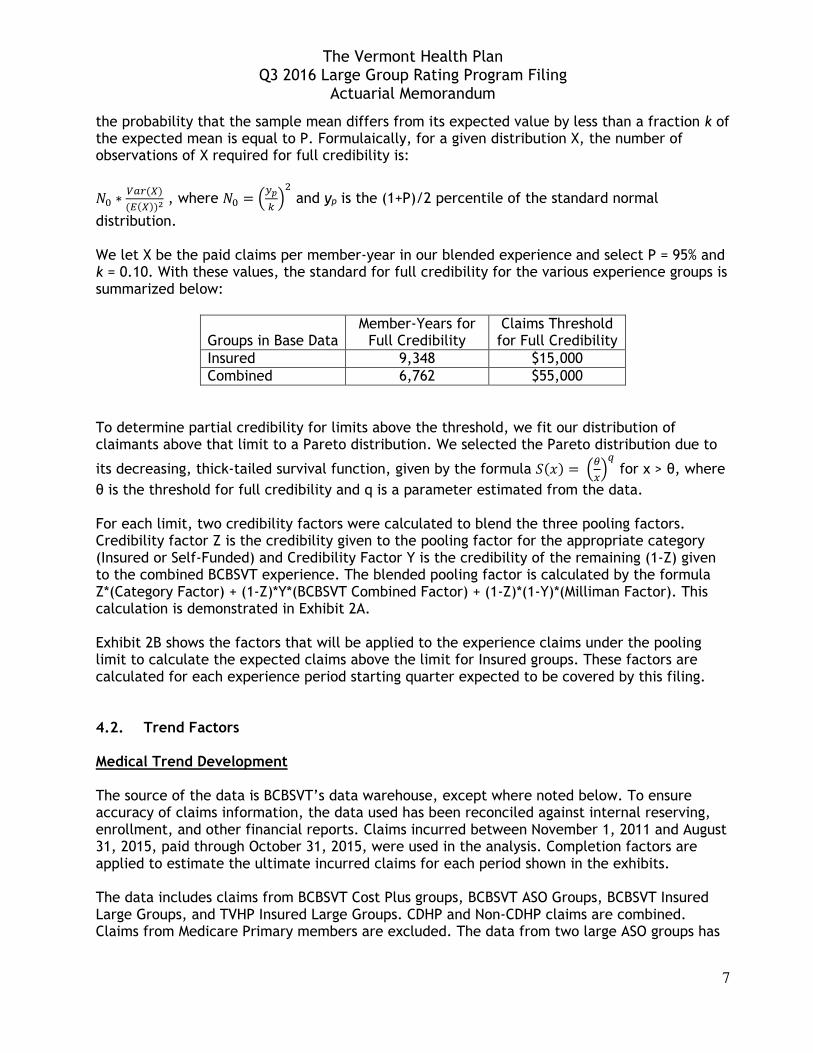
distribution. We let X be the paid claims per member-year in our blended experience and select P = 95% and k = 0.10. With these values, the standard for full credibility for the various experience groups is summarized below:
Groups in Base Data Member-Years for Full Credibility
Claims Threshold for Full Credibility
Insured 9,348 $15,000 Combined 6,762 $55,000
To determine partial credibility for limits above the threshold, we fit our distribution of claimants above that limit to a Pareto distribution. We selected the Pareto distribution due to
its decreasing, thick-tailed survival function, given by the formula .(�) = >CDBE for x > θ, where
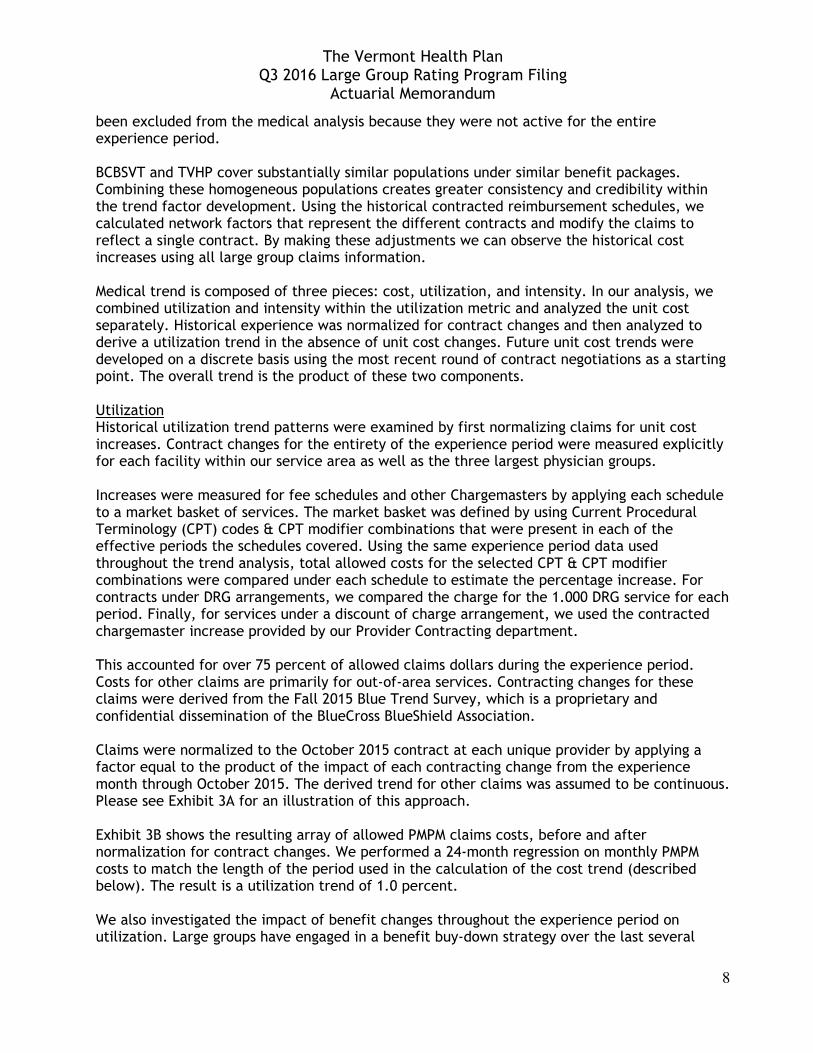
θ is the threshold for full credibility and q is a parameter estimated from the data. For each limit, two credibility factors were calculated to blend the three pooling factors. Credibility factor Z is the credibility given to the pooling factor for the appropriate category (Insured or Self-Funded) and Credibility Factor Y is the credibility of the remaining (1-Z) given to the combined BCBSVT experience. The blended pooling factor is calculated by the formula Z*(Category Factor) + (1-Z)*Y*(BCBSVT Combined Factor) + (1-Z)*(1-Y)*(Milliman Factor). This calculation is demonstrated in Exhibit 2A. Exhibit 2B shows the factors that will be applied to the experience claims under the pooling limit to calculate the expected claims above the limit for Insured groups. These factors are calculated for each experience period starting quarter expected to be covered by this filing. 4.2. Trend Factors Medical Trend Development The source of the data is BCBSVT’s data warehouse, except where noted below. To ensure accuracy of claims information, the data used has been reconciled against internal reserving, enrollment, and other financial reports. Claims incurred between November 1, 2011 and August 31, 2015, paid through October 31, 2015, were used in the analysis. Completion factors are applied to estimate the ultimate incurred claims for each period shown in the exhibits. The data includes claims from BCBSVT Cost Plus groups, BCBSVT ASO Groups, BCBSVT Insured Large Groups, and TVHP Insured Large Groups. CDHP and Non-CDHP claims are combined. Claims from Medicare Primary members are excluded. The data from two large ASO groups has
The Vermont Health Plan Q3 2016 Large Group Rating Program Filing
Actuarial Memorandum
8
been excluded from the medical analysis because they were not active for the entire experience period. BCBSVT and TVHP cover substantially similar populations under similar benefit packages. Combining these homogeneous populations creates greater consistency and credibility within the trend factor development. Using the historical contracted reimbursement schedules, we calculated network factors that represent the different contracts and modify the claims to reflect a single contract. By making these adjustments we can observe the historical cost increases using all large group claims information. Medical trend is composed of three pieces: cost, utilization, and intensity. In our analysis, we combined utilization and intensity within the utilization metric and analyzed the unit cost separately. Historical experience was normalized for contract changes and then analyzed to derive a utilization trend in the absence of unit cost changes. Future unit cost trends were developed on a discrete basis using the most recent round of contract negotiations as a starting point. The overall trend is the product of these two components. Utilization Historical utilization trend patterns were examined by first normalizing claims for unit cost increases. Contract changes for the entirety of the experience period were measured explicitly for each facility within our service area as well as the three largest physician groups. Increases were measured for fee schedules and other Chargemasters by applying each schedule to a market basket of services. The market basket was defined by using Current Procedural Terminology (CPT) codes & CPT modifier combinations that were present in each of the effective periods the schedules covered. Using the same experience period data used throughout the trend analysis, total allowed costs for the selected CPT & CPT modifier combinations were compared under each schedule to estimate the percentage increase. For contracts under DRG arrangements, we compared the charge for the 1.000 DRG service for each period. Finally, for services under a discount of charge arrangement, we used the contracted chargemaster increase provided by our Provider Contracting department. This accounted for over 75 percent of allowed claims dollars during the experience period. Costs for other claims are primarily for out-of-area services. Contracting changes for these claims were derived from the Fall 2015 Blue Trend Survey, which is a proprietary and confidential dissemination of the BlueCross BlueShield Association. Claims were normalized to the October 2015 contract at each unique provider by applying a factor equal to the product of the impact of each contracting change from the experience month through October 2015. The derived trend for other claims was assumed to be continuous. Please see Exhibit 3A for an illustration of this approach. Exhibit 3B shows the resulting array of allowed PMPM claims costs, before and after normalization for contract changes. We performed a 24-month regression on monthly PMPM costs to match the length of the period used in the calculation of the cost trend (described below). The result is a utilization trend of 1.0 percent. We also investigated the impact of benefit changes throughout the experience period on utilization. Large groups have engaged in a benefit buy-down strategy over the last several

The Vermont Health Plan Q3 2016 Large Group Rating Program Filing
Actuarial Memorandum
9
years as a means of limiting rate increases. This manifests itself in a lower actuarial value over time and a dampening effect on trend due to decreases in induced utilization, as shown in the table below:
Year Ending Paid-to-Allowed
Ratio Induced Utilization
Percent Change
October 2012 90.8% 1.040 August 2013 90.3% 1.032 -0.8%
August 2014 89.7% 1.023 -0.8%
August 2015 89.6% 1.022 -0.2% To account for the impact of the benefit buy-downs in the trend, we normalized claims to the mix of benefits present during the year ending August 2015. We did this by using a factor for each month equal to the ratio of the induced utilization for benefits present in the year ending August 2015 to the induced utilization for benefits present in the year ending that particular month. Exhibit 3C shows that utilization trend is 1.3% when accounting for benefit changes. The concept of induced utilization is discussed further in section 4.3. Unit Cost Unit cost trends were largely derived from observations of recent contracting and provider budgetary changes. During the year ended July 2015, roughly 53 percent of total claims dollars were provided by Vermont facilities and providers impacted by the hospital budget review process of the Green Mountain Care Board (GMCB). We have assumed that the GMCB would approve hospital budgets for October 1, 2016 and October 1, 2017 that support identical commercial increases as that approved for October 1, 2015. While the GMCB, through increased oversight, has limited the overall increase of hospital budgets in recent years, the cost shift from Medicare and Medicaid has accelerated, driving commercial increases higher. We have little reason to believe that the cost shift will not continue at current levels. Based upon that assumption, Provider Contracting and Actuarial worked together to assess the impact such an increase would have on contract negotiations for BCBSVT Managed Care, BCBSVT Unmanaged Care, and TVHP Managed Care contracts. Similarly, we assumed for other providers within the BCBSVT service area that overall 2016 and 2017 budget increases would be identical to those implemented during calendar 2015. Again, Provider Contracting and Actuarial worked together to assess the impact these increases would have on contracts for BCBSVT Managed Care, BCBSVT Unmanaged Care, and TVHP Managed Care contracts. Finally, unit cost increases for providers outside the BCBSVT service area were derived from the Fall 2015 Blue Trend Survey, which is a proprietary and confidential dissemination of the BlueCross BlueShield Association. For marketing reasons, Provider Contracting has been negotiating different unit cost increases for each of the three contracts. To reflect this, we calculated three different cost trends, one for each contract.
The Vermont Health Plan Q3 2016 Large Group Rating Program Filing
Actuarial Memorandum
10
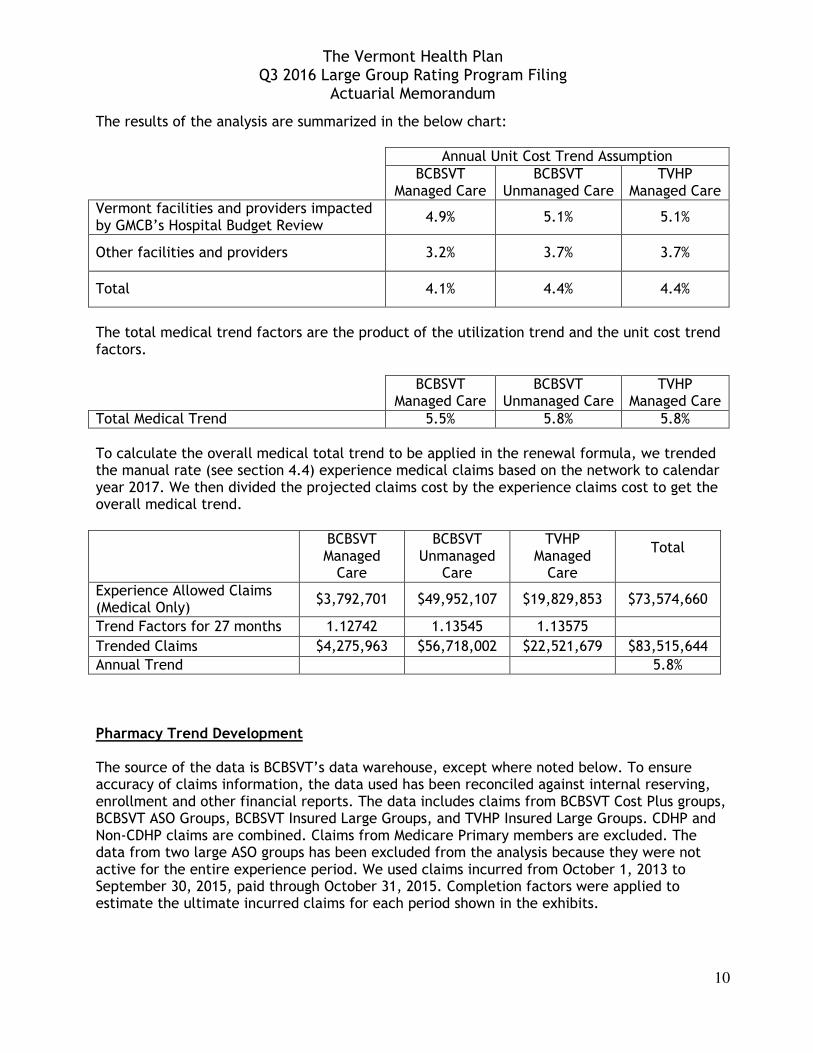
The results of the analysis are summarized in the below chart: Annual Unit Cost Trend Assumption BCBSVT
Managed Care BCBSVT
Unmanaged Care TVHP
Managed Care Vermont facilities and providers impacted by GMCB’s Hospital Budget Review
4.9% 5.1% 5.1%
Other facilities and providers 3.2% 3.7% 3.7%
Total 4.1% 4.4% 4.4%
The total medical trend factors are the product of the utilization trend and the unit cost trend factors. BCBSVT
Managed Care BCBSVT
Unmanaged Care TVHP
Managed Care Total Medical Trend 5.5% 5.8% 5.8% To calculate the overall medical total trend to be applied in the renewal formula, we trended the manual rate (see section 4.4) experience medical claims based on the network to calendar year 2017. We then divided the projected claims cost by the experience claims cost to get the overall medical trend. BCBSVT
Managed Care
BCBSVT Unmanaged
Care
TVHP Managed Care
Total
Experience Allowed Claims (Medical Only)
$3,792,701 $49,952,107 $19,829,853 $73,574,660
Trend Factors for 27 months 1.12742 1.13545 1.13575
Trended Claims $4,275,963 $56,718,002 $22,521,679 $83,515,644
Annual Trend 5.8% Pharmacy Trend Development The source of the data is BCBSVT’s data warehouse, except where noted below. To ensure accuracy of claims information, the data used has been reconciled against internal reserving, enrollment and other financial reports. The data includes claims from BCBSVT Cost Plus groups, BCBSVT ASO Groups, BCBSVT Insured Large Groups, and TVHP Insured Large Groups. CDHP and Non-CDHP claims are combined. Claims from Medicare Primary members are excluded. The data from two large ASO groups has been excluded from the analysis because they were not active for the entire experience period. We used claims incurred from October 1, 2013 to September 30, 2015, paid through October 31, 2015. Completion factors were applied to estimate the ultimate incurred claims for each period shown in the exhibits.
The Vermont Health Plan Q3 2016 Large Group Rating Program Filing
Actuarial Memorandum
11
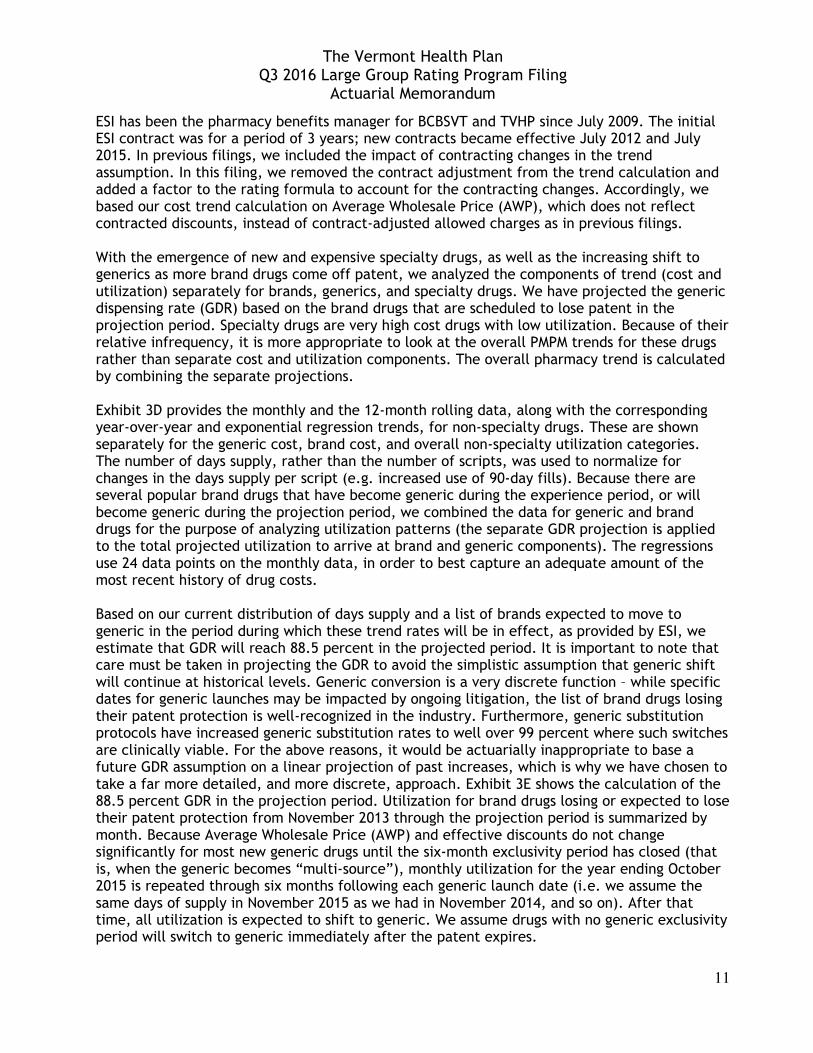
ESI has been the pharmacy benefits manager for BCBSVT and TVHP since July 2009. The initial ESI contract was for a period of 3 years; new contracts became effective July 2012 and July 2015. In previous filings, we included the impact of contracting changes in the trend assumption. In this filing, we removed the contract adjustment from the trend calculation and added a factor to the rating formula to account for the contracting changes. Accordingly, we based our cost trend calculation on Average Wholesale Price (AWP), which does not reflect contracted discounts, instead of contract-adjusted allowed charges as in previous filings. With the emergence of new and expensive specialty drugs, as well as the increasing shift to generics as more brand drugs come off patent, we analyzed the components of trend (cost and utilization) separately for brands, generics, and specialty drugs. We have projected the generic dispensing rate (GDR) based on the brand drugs that are scheduled to lose patent in the projection period. Specialty drugs are very high cost drugs with low utilization. Because of their relative infrequency, it is more appropriate to look at the overall PMPM trends for these drugs rather than separate cost and utilization components. The overall pharmacy trend is calculated by combining the separate projections. Exhibit 3D provides the monthly and the 12-month rolling data, along with the corresponding year-over-year and exponential regression trends, for non-specialty drugs. These are shown separately for the generic cost, brand cost, and overall non-specialty utilization categories. The number of days supply, rather than the number of scripts, was used to normalize for changes in the days supply per script (e.g. increased use of 90-day fills). Because there are several popular brand drugs that have become generic during the experience period, or will become generic during the projection period, we combined the data for generic and brand drugs for the purpose of analyzing utilization patterns (the separate GDR projection is applied to the total projected utilization to arrive at brand and generic components). The regressions use 24 data points on the monthly data, in order to best capture an adequate amount of the most recent history of drug costs. Based on our current distribution of days supply and a list of brands expected to move to generic in the period during which these trend rates will be in effect, as provided by ESI, we estimate that GDR will reach 88.5 percent in the projected period. It is important to note that care must be taken in projecting the GDR to avoid the simplistic assumption that generic shift will continue at historical levels. Generic conversion is a very discrete function – while specific dates for generic launches may be impacted by ongoing litigation, the list of brand drugs losing their patent protection is well-recognized in the industry. Furthermore, generic substitution protocols have increased generic substitution rates to well over 99 percent where such switches are clinically viable. For the above reasons, it would be actuarially inappropriate to base a future GDR assumption on a linear projection of past increases, which is why we have chosen to take a far more detailed, and more discrete, approach. Exhibit 3E shows the calculation of the 88.5 percent GDR in the projection period. Utilization for brand drugs losing or expected to lose their patent protection from November 2013 through the projection period is summarized by month. Because Average Wholesale Price (AWP) and effective discounts do not change significantly for most new generic drugs until the six-month exclusivity period has closed (that is, when the generic becomes “multi-source”), monthly utilization for the year ending October 2015 is repeated through six months following each generic launch date (i.e. we assume the same days of supply in November 2015 as we had in November 2014, and so on). After that time, all utilization is expected to shift to generic. We assume drugs with no generic exclusivity period will switch to generic immediately after the patent expires.
The Vermont Health Plan Q3 2016 Large Group Rating Program Filing
Actuarial Memorandum
12
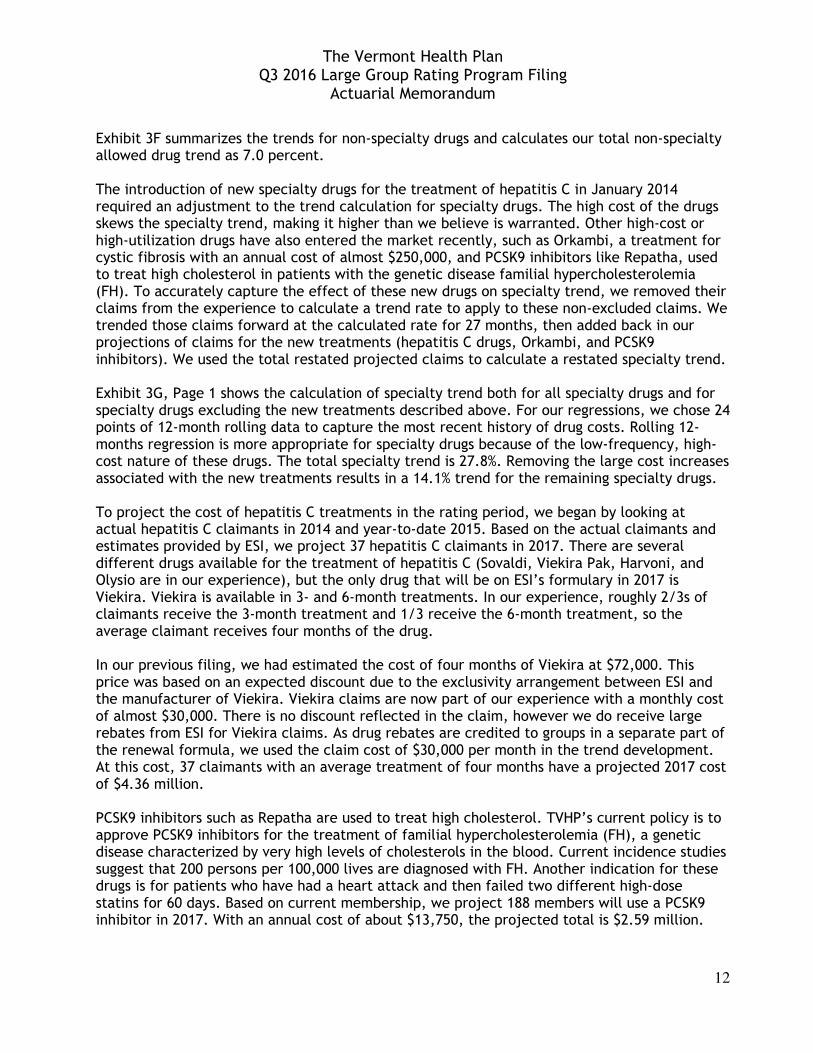
Exhibit 3F summarizes the trends for non-specialty drugs and calculates our total non-specialty allowed drug trend as 7.0 percent. The introduction of new specialty drugs for the treatment of hepatitis C in January 2014 required an adjustment to the trend calculation for specialty drugs. The high cost of the drugs skews the specialty trend, making it higher than we believe is warranted. Other high-cost or high-utilization drugs have also entered the market recently, such as Orkambi, a treatment for cystic fibrosis with an annual cost of almost $250,000, and PCSK9 inhibitors like Repatha, used to treat high cholesterol in patients with the genetic disease familial hypercholesterolemia (FH). To accurately capture the effect of these new drugs on specialty trend, we removed their claims from the experience to calculate a trend rate to apply to these non-excluded claims. We trended those claims forward at the calculated rate for 27 months, then added back in our projections of claims for the new treatments (hepatitis C drugs, Orkambi, and PCSK9 inhibitors). We used the total restated projected claims to calculate a restated specialty trend. Exhibit 3G, Page 1 shows the calculation of specialty trend both for all specialty drugs and for specialty drugs excluding the new treatments described above. For our regressions, we chose 24 points of 12-month rolling data to capture the most recent history of drug costs. Rolling 12-months regression is more appropriate for specialty drugs because of the low-frequency, high-cost nature of these drugs. The total specialty trend is 27.8%. Removing the large cost increases associated with the new treatments results in a 14.1% trend for the remaining specialty drugs. To project the cost of hepatitis C treatments in the rating period, we began by looking at actual hepatitis C claimants in 2014 and year-to-date 2015. Based on the actual claimants and estimates provided by ESI, we project 37 hepatitis C claimants in 2017. There are several different drugs available for the treatment of hepatitis C (Sovaldi, Viekira Pak, Harvoni, and Olysio are in our experience), but the only drug that will be on ESI’s formulary in 2017 is Viekira. Viekira is available in 3- and 6-month treatments. In our experience, roughly 2/3s of claimants receive the 3-month treatment and 1/3 receive the 6-month treatment, so the average claimant receives four months of the drug. In our previous filing, we had estimated the cost of four months of Viekira at $72,000. This price was based on an expected discount due to the exclusivity arrangement between ESI and the manufacturer of Viekira. Viekira claims are now part of our experience with a monthly cost of almost $30,000. There is no discount reflected in the claim, however we do receive large rebates from ESI for Viekira claims. As drug rebates are credited to groups in a separate part of the renewal formula, we used the claim cost of $30,000 per month in the trend development. At this cost, 37 claimants with an average treatment of four months have a projected 2017 cost of $4.36 million. PCSK9 inhibitors such as Repatha are used to treat high cholesterol. TVHP’s current policy is to approve PCSK9 inhibitors for the treatment of familial hypercholesterolemia (FH), a genetic disease characterized by very high levels of cholesterols in the blood. Current incidence studies suggest that 200 persons per 100,000 lives are diagnosed with FH. Another indication for these drugs is for patients who have had a heart attack and then failed two different high-dose statins for 60 days. Based on current membership, we project 188 members will use a PCSK9 inhibitor in 2017. With an annual cost of about $13,750, the projected total is $2.59 million.
The Vermont Health Plan Q3 2016 Large Group Rating Program Filing
Actuarial Memorandum
13
Orkambi is a drug used in the treatment of cystic fibrosis. In particular, it is used to treat a specific mutation of the disease that is found in roughly 50 percent of cystic fibrosis patients. Orkambi is prescribed to patients age 12 and older. We assumed that 50 percent of our members diagnosed with cystic fibrosis who are at least age 12 will take Orkambi. Orkambi has an annual cost of $247,000 and we project 10 members will use it. The projected cost for those members is $2.47 million. One final adjustment to the projected specialty claims deals with a class of drugs called biosimilars. Biosimilars are functionally equivalent to biologic drugs, which are produced in a lab using recombinant DNA technology. Biosimilars have a lower cost than their equivalent biologic drugs. Humira, a biologic, was our highest cost drug in 2014. The FDA has recently approved a biosimilar for Humira that will be available sometime in 2016 (pending patent lawsuits from Humira’s manufacturer). For the 2017 projection period, we anticipate the cost of the biosimilar will be 10 percent less than the cost of Humira, which will result in a $430,000 reduction in claims due to members switching from Humira to the biosimilar.
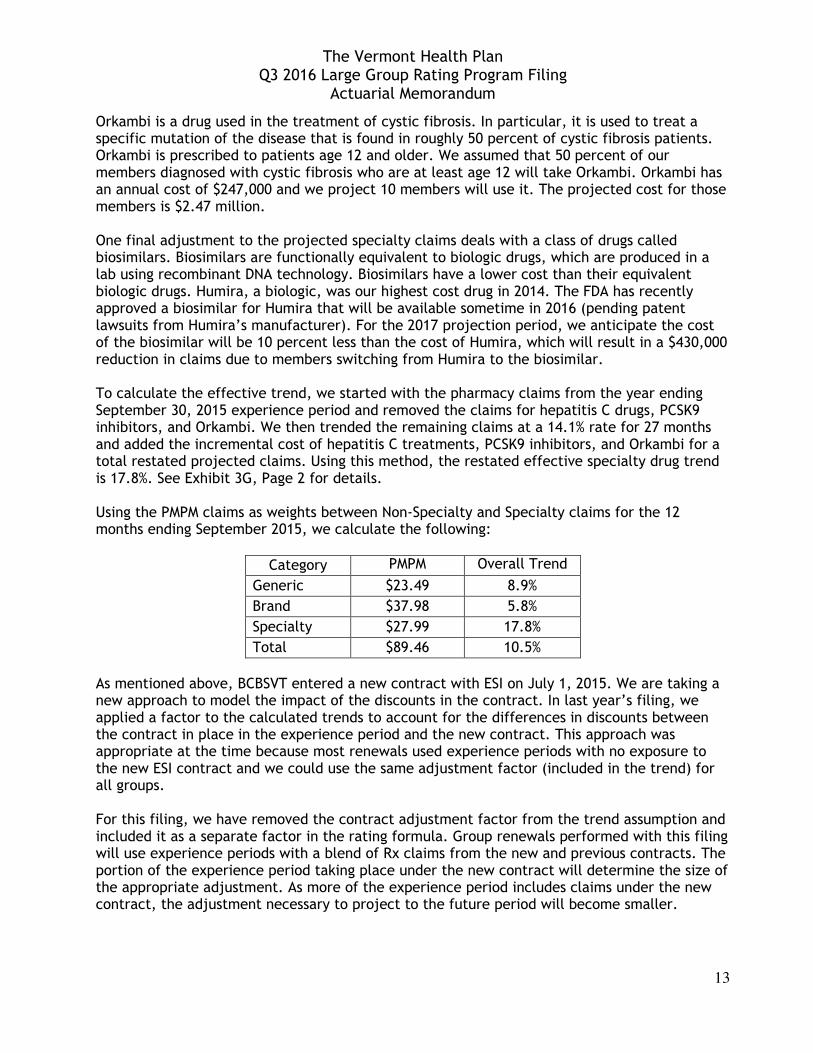
To calculate the effective trend, we started with the pharmacy claims from the year ending September 30, 2015 experience period and removed the claims for hepatitis C drugs, PCSK9 inhibitors, and Orkambi. We then trended the remaining claims at a 14.1% rate for 27 months and added the incremental cost of hepatitis C treatments, PCSK9 inhibitors, and Orkambi for a total restated projected claims. Using this method, the restated effective specialty drug trend is 17.8%. See Exhibit 3G, Page 2 for details. Using the PMPM claims as weights between Non-Specialty and Specialty claims for the 12 months ending September 2015, we calculate the following:
Category PMPM Overall Trend
Generic $23.49 8.9%
Brand $37.98 5.8%
Specialty $27.99 17.8%
Total $89.46 10.5%
As mentioned above, BCBSVT entered a new contract with ESI on July 1, 2015. We are taking a new approach to model the impact of the discounts in the contract. In last year’s filing, we applied a factor to the calculated trends to account for the differences in discounts between the contract in place in the experience period and the new contract. This approach was appropriate at the time because most renewals used experience periods with no exposure to the new ESI contract and we could use the same adjustment factor (included in the trend) for all groups. For this filing, we have removed the contract adjustment factor from the trend assumption and included it as a separate factor in the rating formula. Group renewals performed with this filing will use experience periods with a blend of Rx claims from the new and previous contracts. The portion of the experience period taking place under the new contract will determine the size of the appropriate adjustment. As more of the experience period includes claims under the new contract, the adjustment necessary to project to the future period will become smaller.
The Vermont Health Plan Q3 2016 Large Group Rating Program Filing
Actuarial Memorandum
14
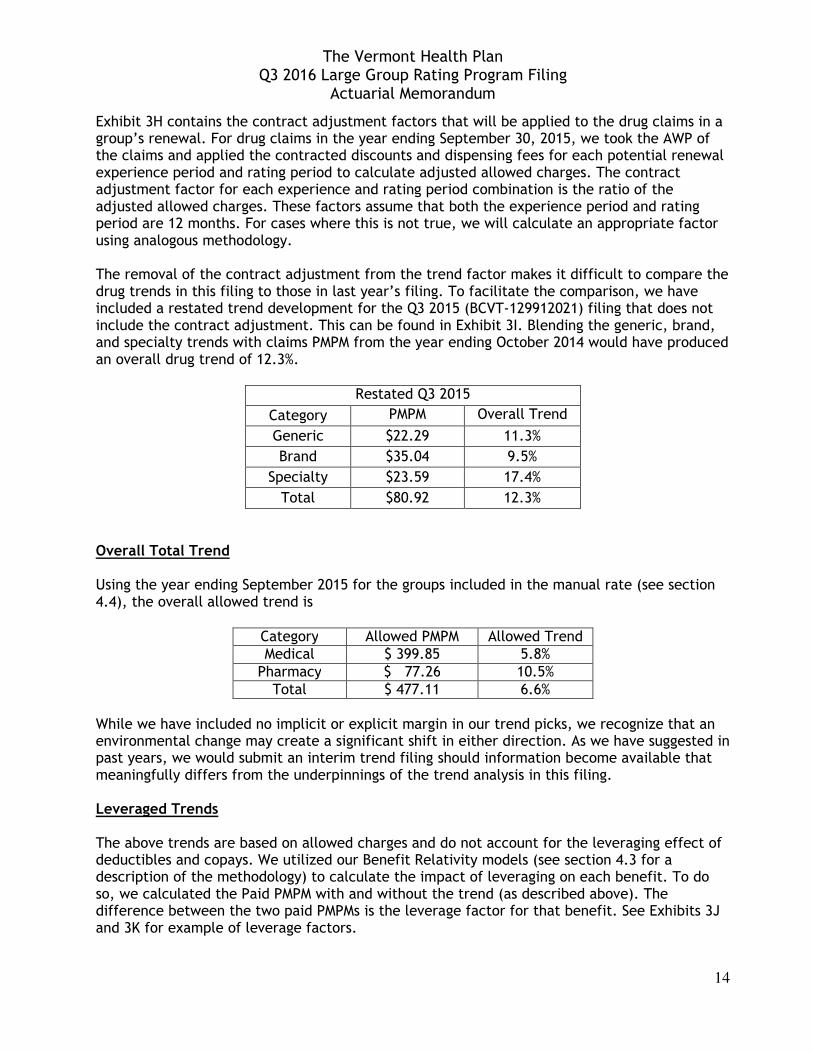
Exhibit 3H contains the contract adjustment factors that will be applied to the drug claims in a group’s renewal. For drug claims in the year ending September 30, 2015, we took the AWP of the claims and applied the contracted discounts and dispensing fees for each potential renewal experience period and rating period to calculate adjusted allowed charges. The contract adjustment factor for each experience and rating period combination is the ratio of the adjusted allowed charges. These factors assume that both the experience period and rating period are 12 months. For cases where this is not true, we will calculate an appropriate factor using analogous methodology. The removal of the contract adjustment from the trend factor makes it difficult to compare the drug trends in this filing to those in last year’s filing. To facilitate the comparison, we have included a restated trend development for the Q3 2015 (BCVT-129912021) filing that does not include the contract adjustment. This can be found in Exhibit 3I. Blending the generic, brand, and specialty trends with claims PMPM from the year ending October 2014 would have produced an overall drug trend of 12.3%.
Restated Q3 2015
Category PMPM Overall Trend
Generic $22.29 11.3%
Brand $35.04 9.5%
Specialty $23.59 17.4%
Total $80.92 12.3%
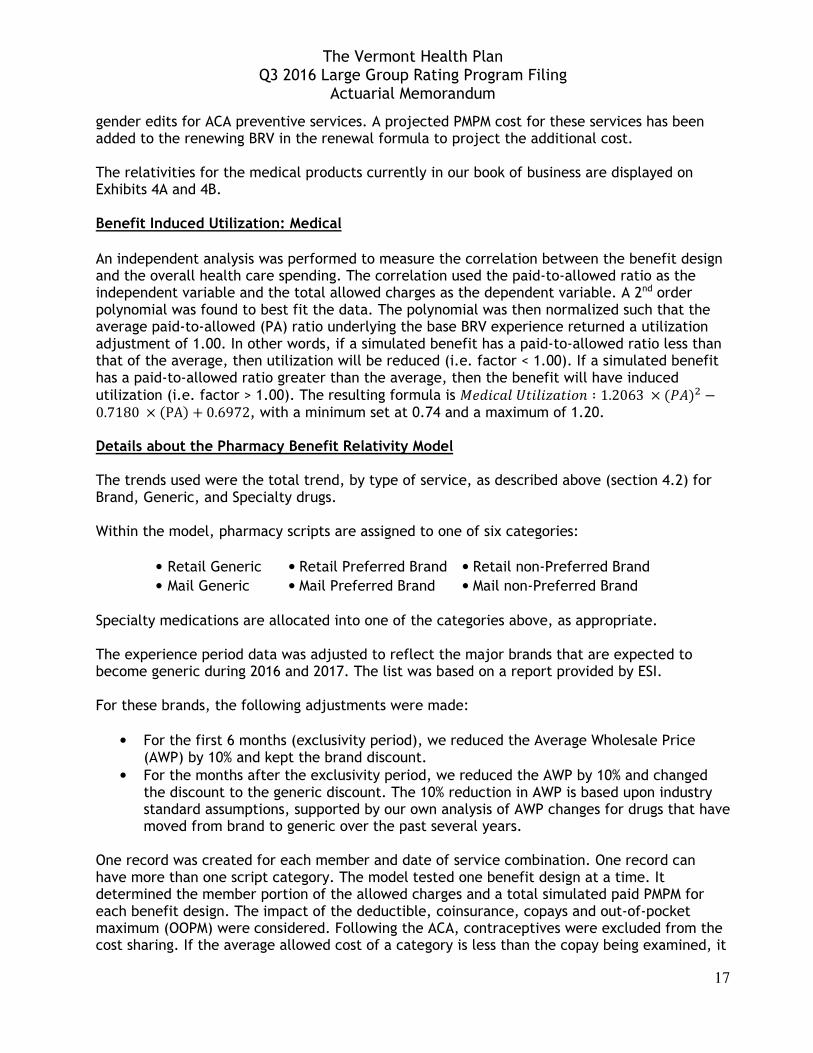
Overall Total Trend Using the year ending September 2015 for the groups included in the manual rate (see section 4.4), the overall allowed trend is
Category Allowed PMPM Allowed Trend Medical $ 399.85 5.8% Pharmacy $ 77.26 10.5% Total $ 477.11 6.6%
While we have included no implicit or explicit margin in our trend picks, we recognize that an environmental change may create a significant shift in either direction. As we have suggested in past years, we would submit an interim trend filing should information become available that meaningfully differs from the underpinnings of the trend analysis in this filing. Leveraged Trends The above trends are based on allowed charges and do not account for the leveraging effect of deductibles and copays. We utilized our Benefit Relativity models (see section 4.3 for a description of the methodology) to calculate the impact of leveraging on each benefit. To do so, we calculated the Paid PMPM with and without the trend (as described above). The difference between the two paid PMPMs is the leverage factor for that benefit. See Exhibits 3J and 3K for example of leverage factors.

The Vermont Health Plan Q3 2016 Large Group Rating Program Filing
Actuarial Memorandum
15
Applying the leverage factors for benefits present in the year ending September 2015 for the groups included in the manual rate, we calculate the following paid trends:
Category Paid PMPM Paid Trend Medical $ 319.15 6.7% Pharmacy $ 62.97 11.9% Total $ 382.13 7.6%
4.3. Benefit Relativity Factors
Overview To determine standardized premium rate relationships, also called relativities, we have created models that simulate the impact of member benefits for all types of plans. The models determine the allowed charges for the completed 12 months of claims included in the study and “re-adjudicate” the claims, thereby simulating the impact of member cost sharing for a given benefit plan. Claims data is from BCBSVT’s data warehouse. All claim and enrollment data comes from the BCBSVT’s data warehouse except where noted below. To ensure accuracy, the claims data used has been reconciled against internal reserving, enrollment and other financial reports. The starting point of the analysis is allowed charges as determined by the BCBSVT claims adjudication system. The claims data includes benefit codes that enable us to identify the services and benefit structures (copays, deductibles, and coinsurance). For each benefit plan of interest, the models produced the simulated PMPM values of the benefits. The PMPM for each plan was then divided by the manual rate, as calculated in section 4.4 but without adjustment for changes in the pharmacy contract, to produce its relativity. Relativities are included for medical only plans, Rx only plans, and integrated CDHP plans. Incurred allowed charges from August 2014 to July 2015, paid through October 2015, were used. The allowed charges were trended to July 1, 2017, which is the midpoint of the 12-month period that begins January 1, 2017. The majority of the business that will be renewed using these relativity factors has a January 1 renewal date; the rating formula adjusts the trend for non-January renewals (see section 4.4). The data includes claims from BCBSVT Cost Plus Groups, BCBSVT ASO Groups, BCBSVT Insured Large Groups, and TVHP Insured Large Groups. CDHP and Non-CDHP claims are combined. Claims from Medicare Primary members are excluded. We also excluded groups that have special benefits. This predominantly refers to groups that have specific reimbursement with particular providers outside of BCBSVT’s contracts and/or claims processing function. For the 67 large groups impacted by this filing, the total medical and Rx allowed charges PMPM, trended to the 12-month period beginning January 1, 2017, is $550.50. This is an increase of 5.4% over the $522.13 calculated in the previous filing, slightly less than our approved trend of 6.1% from the previous filing. Details about the Medical Benefit Relativity Model

The Vermont Health Plan Q3 2016 Large Group Rating Program Filing
Actuarial Memorandum
16
The trends used were the total medical trend, by type of service. Cost trends were calculated by the discrete unit cost trend method above, while the same utilization trends were used for all types of service (see section 4.2). Using the contracted reimbursement schedule, we calculated network factors that represent the different network contracts. Using these factors, we can include all claims in each of the three networks by adjusting each claim to the basis of a single network. This enables us to combine all the experience for each plan design. The claims were categorized according to how benefits are paid, and one record was generated for each member, date of service, and type of service. Each record was then assigned a cost share (deductible/coinsurance, copay, covered in full) for each plan available. The plan designs modeled are:
• BlueCare Lo Options (LO) • Open Access (OAP) • BlueCare (HMO) • Consumer Driven Health Plan (CDHP)
For all products, claims for preventive mandated benefits were assigned a “covered in full” cost share, independently of the product that is being modeled. The model tested one benefit design at a time. It determined the member portion of the allowed charges, and from this, a total simulated paid PMPM for each benefit design. The impact of the office copay, deductible, coinsurance, out-of-pocket maximum, and preventive mandated benefits were all considered. If the average allowed cost of a category was less than the copay being examined, it was assumed that the member paid the full cost of the service. OAP plans have two levels of benefits, preferred and non-preferred. The Preferred benefit levels are applied to providers in the BlueCard© network and the non-preferred benefits are applied to non-participating providers. In the administration of this benefit, there is no overlap between the preferred and non-preferred deductible and coinsurance. For CDHP, LO, and HMO plans, the same overall benefits are applied to the preferred and non- preferred networks. The underlying benefits in the experience have different splits between preferred and non-preferred networks as part of the “freedom” of the benefit. The “freedom” represents the portion of providers in the service area that participate in the network. We use BRVs in two places in the rating formula described in section 3. The Average Experience Period Seasonal Adjusted Benefit Relativity Factor (line L in Exhibit 1A) is calculated using BRVs for the benefits in the experience period, while the Projected Claims for the rating period (line B1 in Exhibit 1B) uses BRVs for the benefits in the rating period. Beginning in 2016, TVHP has modified its medical claims policy to provide coverage for additional services including circumcision, digital breast tomosynthesis, and the removal of
The Vermont Health Plan Q3 2016 Large Group Rating Program Filing
Actuarial Memorandum
17
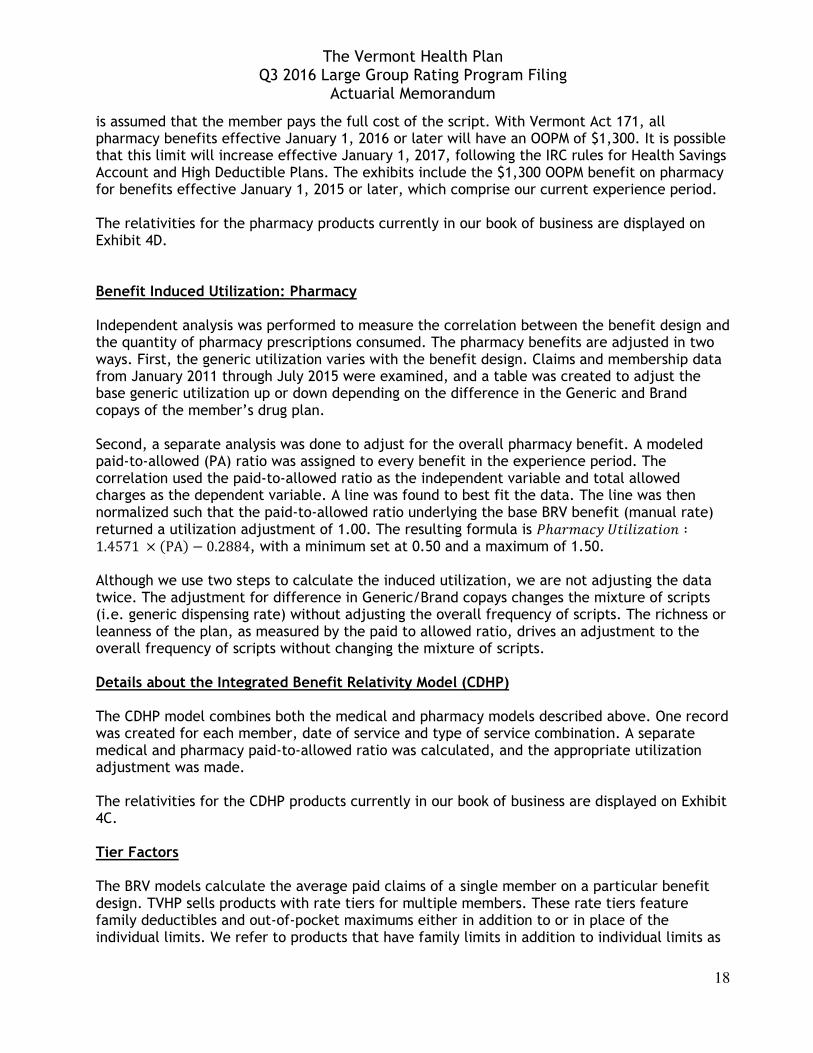
gender edits for ACA preventive services. A projected PMPM cost for these services has been added to the renewing BRV in the renewal formula to project the additional cost. The relativities for the medical products currently in our book of business are displayed on Exhibits 4A and 4B. Benefit Induced Utilization: Medical An independent analysis was performed to measure the correlation between the benefit design and the overall health care spending. The correlation used the paid-to-allowed ratio as the independent variable and the total allowed charges as the dependent variable. A 2nd order polynomial was found to best fit the data. The polynomial was then normalized such that the average paid-to-allowed (PA) ratio underlying the base BRV experience returned a utilization adjustment of 1.00. In other words, if a simulated benefit has a paid-to-allowed ratio less than that of the average, then utilization will be reduced (i.e. factor < 1.00). If a simulated benefit has a paid-to-allowed ratio greater than the average, then the benefit will have induced utilization (i.e. factor > 1.00). The resulting formula is �*��10F!�0�41!��� ∶ 1.2063 × (-))� −0.7180 × (PA) + 0.6972, with a minimum set at 0.74 and a maximum of 1.20. Details about the Pharmacy Benefit Relativity Model The trends used were the total trend, by type of service, as described above (section 4.2) for Brand, Generic, and Specialty drugs. Within the model, pharmacy scripts are assigned to one of six categories:
• Retail Generic • Retail Preferred Brand • Retail non-Preferred Brand
• Mail Generic • Mail Preferred Brand • Mail non-Preferred Brand Specialty medications are allocated into one of the categories above, as appropriate. The experience period data was adjusted to reflect the major brands that are expected to become generic during 2016 and 2017. The list was based on a report provided by ESI. For these brands, the following adjustments were made:
• For the first 6 months (exclusivity period), we reduced the Average Wholesale Price (AWP) by 10% and kept the brand discount.
• For the months after the exclusivity period, we reduced the AWP by 10% and changed the discount to the generic discount. The 10% reduction in AWP is based upon industry standard assumptions, supported by our own analysis of AWP changes for drugs that have moved from brand to generic over the past several years.
One record was created for each member and date of service combination. One record can have more than one script category. The model tested one benefit design at a time. It determined the member portion of the allowed charges and a total simulated paid PMPM for each benefit design. The impact of the deductible, coinsurance, copays and out-of-pocket maximum (OOPM) were considered. Following the ACA, contraceptives were excluded from the cost sharing. If the average allowed cost of a category is less than the copay being examined, it
The Vermont Health Plan Q3 2016 Large Group Rating Program Filing
Actuarial Memorandum
18
is assumed that the member pays the full cost of the script. With Vermont Act 171, all pharmacy benefits effective January 1, 2016 or later will have an OOPM of $1,300. It is possible that this limit will increase effective January 1, 2017, following the IRC rules for Health Savings Account and High Deductible Plans. The exhibits include the $1,300 OOPM benefit on pharmacy for benefits effective January 1, 2015 or later, which comprise our current experience period. The relativities for the pharmacy products currently in our book of business are displayed on Exhibit 4D. Benefit Induced Utilization: Pharmacy Independent analysis was performed to measure the correlation between the benefit design and the quantity of pharmacy prescriptions consumed. The pharmacy benefits are adjusted in two ways. First, the generic utilization varies with the benefit design. Claims and membership data from January 2011 through July 2015 were examined, and a table was created to adjust the base generic utilization up or down depending on the difference in the Generic and Brand copays of the member’s drug plan. Second, a separate analysis was done to adjust for the overall pharmacy benefit. A modeled paid-to-allowed (PA) ratio was assigned to every benefit in the experience period. The correlation used the paid-to-allowed ratio as the independent variable and total allowed charges as the dependent variable. A line was found to best fit the data. The line was then normalized such that the paid-to-allowed ratio underlying the base BRV benefit (manual rate) returned a utilization adjustment of 1.00. The resulting formula is -ℎ1��1�OF!�0�41!��� ∶1.4571 × (PA) − 0.2884, with a minimum set at 0.50 and a maximum of 1.50. Although we use two steps to calculate the induced utilization, we are not adjusting the data twice. The adjustment for difference in Generic/Brand copays changes the mixture of scripts (i.e. generic dispensing rate) without adjusting the overall frequency of scripts. The richness or leanness of the plan, as measured by the paid to allowed ratio, drives an adjustment to the overall frequency of scripts without changing the mixture of scripts. Details about the Integrated Benefit Relativity Model (CDHP) The CDHP model combines both the medical and pharmacy models described above. One record was created for each member, date of service and type of service combination. A separate medical and pharmacy paid-to-allowed ratio was calculated, and the appropriate utilization adjustment was made. The relativities for the CDHP products currently in our book of business are displayed on Exhibit 4C. Tier Factors The BRV models calculate the average paid claims of a single member on a particular benefit design. TVHP sells products with rate tiers for multiple members. These rate tiers feature family deductibles and out-of-pocket maximums either in addition to or in place of the individual limits. We refer to products that have family limits in addition to individual limits as
The Vermont Health Plan Q3 2016 Large Group Rating Program Filing
Actuarial Memorandum
19
Stacked and to products with only family limits as Aggregate. For products renewing after January 1, 2016, members on Aggregate plans are subject to the federal maximum allowed individual out-of-pocket, even if the aggregate out-of-pocket maximum is higher. We refer to these plans as Hybrid. To price benefits for rate tiers with multiple members, we calculated tier factors to apply to the BRV for the benefit. We used the BRV models to calculate member paid amounts for each member in the model and used every combination of members to create “families” in the following categories:
• One Adult • Two Adults • One Adult and One Child, … , One Adult and Seven Children • Two Adults and One Child, … , Two Adults and Seven Children
For each category of family, we calculated the average plan paid amount subject to the family cost sharing. Then we combined the categories of families into rate tiers using the proportion of each category in the experience period membership as a weight. The ratio of plan paid amount for each rate tier to the single rate tier is the tier factor. For Aggregate and Hybrid factors, we grouped products together into three ranges of out-of-pocket maximums and calculated tier factors for each range. We calculated different factors for products with separate medical and drug benefits and for products with integrated benefits (CDHPs). The tier factors calculated for each range and type of benefit are shown in Exhibit 4E. 4.4. Manual Rate
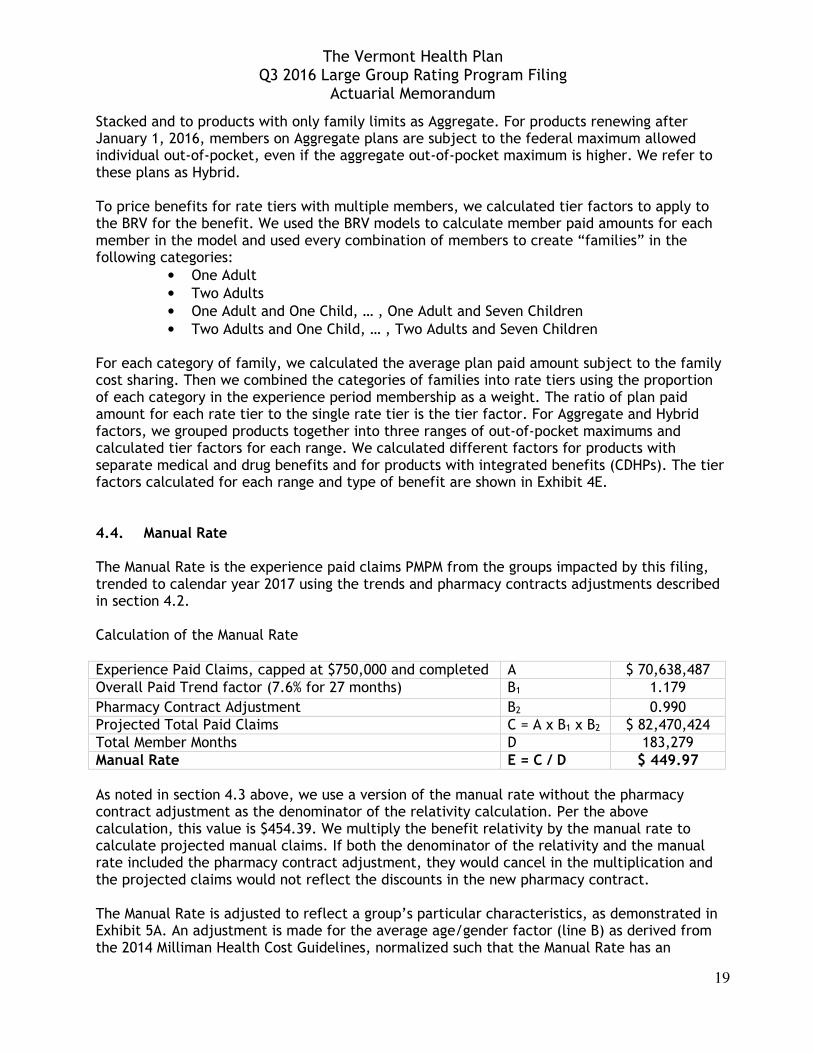
The Manual Rate is the experience paid claims PMPM from the groups impacted by this filing, trended to calendar year 2017 using the trends and pharmacy contracts adjustments described in section 4.2.
Calculation of the Manual Rate
Experience Paid Claims, capped at $750,000 and completed A $ 70,638,487 Overall Paid Trend factor (7.6% for 27 months) B1 1.179
Pharmacy Contract Adjustment B2 0.990 Projected Total Paid Claims C = A x B1 x B2 $ 82,470,424 Total Member Months D 183,279 Manual Rate E = C / D $ 449.97
As noted in section 4.3 above, we use a version of the manual rate without the pharmacy contract adjustment as the denominator of the relativity calculation. Per the above calculation, this value is $454.39. We multiply the benefit relativity by the manual rate to calculate projected manual claims. If both the denominator of the relativity and the manual rate included the pharmacy contract adjustment, they would cancel in the multiplication and the projected claims would not reflect the discounts in the new pharmacy contract. The Manual Rate is adjusted to reflect a group’s particular characteristics, as demonstrated in Exhibit 5A. An adjustment is made for the average age/gender factor (line B) as derived from the 2014 Milliman Health Cost Guidelines, normalized such that the Manual Rate has an
The Vermont Health Plan Q3 2016 Large Group Rating Program Filing
Actuarial Memorandum
20
age/gender factor of one. The case’s industry factor (line C) is developed based on the SIC and a standard table that has been updated based on BCBSVT experience data from October 2014 through September 2015 to reflect relationships between industries. See Exhibit 5B for the schedule of industry factors. These have also been normalized such that the Manual Rate has a factor of one. For groups with a projection period other than calendar year 2017, the manual rate will be adjusted for trend to reflect the group’s projection period (line D) and the additional impact of pharmacy contract changes (line E). Finally, a contract conversion factor (line F) is calculated based on member distribution and tier factors in order to convert from a PMPM to a single rate basis (necessary because the Adjusted Manual Rate is blended with the Projected Single Contract Rate, which is not on a PMPM basis).
4.5. Administrative Charges
The sources of actual expense data in this filing are BCBSVT’s data warehouse and accounting records. The Experience Base period for this filing is November 2014 to October 2015. Actual BCBSVT administrative expenses for the Experience Base period are compiled on a GAAP reporting basis. During 2015, BCBSVT completed a comprehensive cost accounting study. Allocations to specific lines of business on a GAAP reporting basis were updated for the results of this study, beginning in 2015. In order to normalize experience period data to the same allocation methodology, 2014 expenses were reallocated according to the results of the cost accounting study. Exhibit 6A provides a reconciliation of the Experience Base period to restated GAAP financial report data. Experience Base of Actual Expenses Administrative expenses are allocated under BCBSVT’s cost accounting system to lines of business. For the Group business segment (Insured and Cost Plus combined), this cost accounting data by cost center is then allocated into Cost Categories for purposes of determining administrative charges for each specific BCBSVT group account, given that account’s characteristics.4 The Group Cost Categories include: Account − those expenses that are allocated to specific group accounts on a per group account basis. Billing Group − those expenses that are allocated on a per billing group basis (i.e., reflecting the number of separate billing entities within a group account). Member – those expenses that are allocated on a per member basis. For each of the Group Cost Categories described above, the respective number of unit months during the Experience Base period is tabulated for the Insured Large Group (both BCBSVT and TVHP) and Cost Plus business segments. These segments are combined in this filing for marketing considerations. The unit months include the number of account months, number of billing group months, and number of member months.
4 PUPM costs for Cost Plus members having Medicare Supplement plans are set equal to the corresponding values for conventionally funded Medicare Supplement members. The resulting costs are removed from the Cost Plus cost accounting charges before dividing by the (non-Medicare Supplement) Cost Plus units.
The Vermont Health Plan Q3 2016 Large Group Rating Program Filing
Actuarial Memorandum
21
Fees paid to our vendor GHI for the electronic processing of Medicare Supplement claims are not being assigned correctly to all members whose claims go through the GHI system. These members are in the following product categories: Individual Medicare Supplement, Group Medicare Secondary, Cost Plus Medicare Supplement, Cost Plus Medicare Secondary, and TVHP MediGap Blue. They are currently only booked to Individual Medicare Supplement and TVHP Medigap Blue. The GHI fees are reallocated to the appropriate product categories using membership as a weight. This reclassification is reflected in Exhibit 6A. Other reclassifications reflected in the exhibit include the removal of federal fees (these are added to premium rates separately; see section 4.10) and fees paid to our vendor Health Equity for the administration of Health Savings Accounts and Health Reimbursement Accounts linked to our insurance products (participation in this service is options and we assign these fees to groups who select the service). Using the adjusted Experience Base administrative expenses and unit months, per unit per month (PUPM) values are calculated. For the group segments included in this filing, there are three such PUPM values − one for each of the Cost Categories indicated above. The Experience Base administrative expenses PUPM are shown in Exhibit 6C. Projection Factors Actual administrative costs PUPM from the Experience Base period are projected to each of the rating periods. Projection factors are based on a 2.14 percent annual trend and are shown in Exhibit 6B. These projection factors are intended to make reasonable but modest provision for increases in overall operating costs PUPM. Note that there are no known extraordinary or mandate-related costs at this time which require separate provision for the rating periods involved in this filing. We are assuming that personnel costs (wages and benefits) will increase by 3 percent, the budgeted wage increase for 2016, over the projection period. Other operating costs are assumed to remain flat. We have calculated that 78.5% of our administrative costs are for salaries and benefits. We are therefore increasing our projected administrative expenses by the weighted average of 2.4 percent per annum. An examination of historical administrative charges shows a decreasing trend in recent years, driven primarily by membership increases. For 2017, we project total membership will decrease. We calculated PMPM admin charges with experience period enrollment and projected January 2016 enrollment and found they increased by 2.2 percent with the reduced January 2016 enrollment. We assumed that variable costs represent half of the increase, and therefore applied an increase of 1.1 percent to the base PUPM charges to account for the reduction in membership. Charges for Group Accounts The Administrative Charge PUPM figures shown in Exhibit 6C are the values to be applied on an account by account basis, along with each group account’s corresponding unit count, to
The Vermont Health Plan Q3 2016 Large Group Rating Program Filing
Actuarial Memorandum
22
produce account-specific administrative charges. These amounts will then be expressed as equivalent PMPM amounts for each group account. Amounts for special items or unique services not part of TVHP’s standard scope of administrative services (e.g., special booklets, certificates, or reports) are to be determined and applied separately on an account-specific basis. Commissions based on the commission scale applicable to the account are not reflected in the schedule of admin charges in Exhibit 6C; they are to be calculated and applied separately.
4.6. Net Cost of Reinsurance
TVHP has purchased reinsurance for claims in excess of $750,000 for 2016, and expects to purchase similar reinsurance in future years with limits approximately equal to the 2016 limit increased by trend. We estimate that the target loss ratio for the reinsurance is approximately 75%, which implies a cost of reinsurance of approximately 33% of claims above the reinsurance limit. For each pricing period starting quarter, we determined an annual cost of reinsurance for the trended reinsurance limit by multiplying the expected annual claims cost above the limit by 33%. Dividing this by 12 produces the PMPM cost of reinsurance. The table of these PMPM’s, based on pricing period starting quarter, is shown in the table below.
Pricing Period Starting Quarter
Q2 2016 Q3 2016 Q4 2016 Q1 2017 Q2 2017 Q3 2017
$1.28 $1.28 $1.32 $1.32 $1.36 $1.37
4.7. Pharmacy Rebates
Pharmacy rebates are calculated by taking the experience period rebates and trending them using the Brand Cost trend (from Exhibit 3D). Pharmacy rebates are paid with an average six-month delay from the time of the original claims. For months in the experience for which we do not have detailed rebate information, an estimated rebate amount is included in the calculation.
4.8. Contribution to Reserve The administrative charges developed are for administrative expenses only, and contain no provision for reserve contribution. A contribution to reserves is required in order to maintain an adequate level of surplus. Surplus is a critical consumer protection that allows providers to continue to receive payments and subscribers to receive needed care in the event of unforeseen adverse events that may otherwise impact TVHP’s ability to pay claims. We believe that the levels established in the table below represent an adequate, yet not excessive, contribution to reserves. Furthermore, they allow us to maintain Risk-Based Capital (RBC) levels that are within our established, moderate target range.
Line of Business Contribution to Reserve
TVHP Insured Groups 2% of premium
The Vermont Health Plan Q3 2016 Large Group Rating Program Filing
Actuarial Memorandum
23
Exhibit 7A provides support for our filed contribution to reserves. A contribution to reserves of 1.3 percent is required merely to maintain RBC levels in light of premium increases due to medical trend. In other words, should all other assumptions in this and subsequent filings come to fruition and medical trend hold constant at current levels, the company would eventually become insolvent due to medical trend alone with a contribution to reserves of less than 1.3 percent. There are many reasons why an adequate contribution to reserves should exceed the minimum required to keep pace with trend. While best estimate assumptions are by definition expected to lead to equal likelihood of gains and losses, unexpected events or periods of sustained losses may lead to financial deterioration of sufficient magnitude to render a company insolvent. This is the basic tenet of classical ruin theory. There are many examples of risk to surplus. The underwriting cycle is typically 24-30 months in duration, meaning that rate deficiencies may persist for an extended period in an increasing trend environment. Regulatory action can have a meaningful impact on surplus when required rate increases are not approved. Finally, unusual events such as a new specialty drug may create a one-time shock to capital. Maintaining an adequate RBC level is critical for any insurer. Consequences of low RBC include reduced flexibility in responding to customer needs, a need for greater conservatism and higher margins in rates in order to avoid further deterioration, and a reduced ability to attract or retain business or to handle membership growth. Stability is particularly important in times of unprecedented change, such as the continuing evolution of Vermont Health Connect and the health care reform environment. TVHP must remain financially strong in order to continue to provide Vermonters with outstanding member experiences, responsible cost management and access to high value care. We are therefore filing for a 2 percent contribution to reserve for Insured Groups, which provides appropriate margin above the minimum needed to keep pace with trend to help ensure continued financial stability should a significant adverse event occur. 4.9. State Mandates and Assessments
Vermont Vaccine Purchasing Program Payments The Vermont Vaccine Purchasing Program5 offers health care providers state-supplied vaccines at no charge by collecting payments from Health plans, insurers, and other payers. The program’s assessment is a PMPM for each Vermont resident. The approved assessment for 2016 is $0.58 for Adults and $10.73 for Children. We will use these rates until new rates are approved. New Hampshire Purchasing Program Payments The New Hampshire Purchasing Program6 offers health care providers state-supplied vaccines at no charge by collecting payments from Health plans, insurers, and other payers. The
5 http://healthvermont.info/hc/imm/VaccinePurchasingPoolPilotProgram.aspx 6 http://www.nhvaccine.org/nhvaccine.nsf/pages/home.html
The Vermont Health Plan Q3 2016 Large Group Rating Program Filing
Actuarial Memorandum
24
assessment for 2016 is $9.95 for each child that is a New Hampshire resident. We will use this rate until a new rate is approved. Health Care Claims Tax The Health Care Claims Tax of 0.999 percent applies to all claims or capitations incurred by members with Vermont zip codes. We used the percentage of current members with Vermont zip codes to estimate the percentage of rating period claims expected to be incurred by Vermont members.
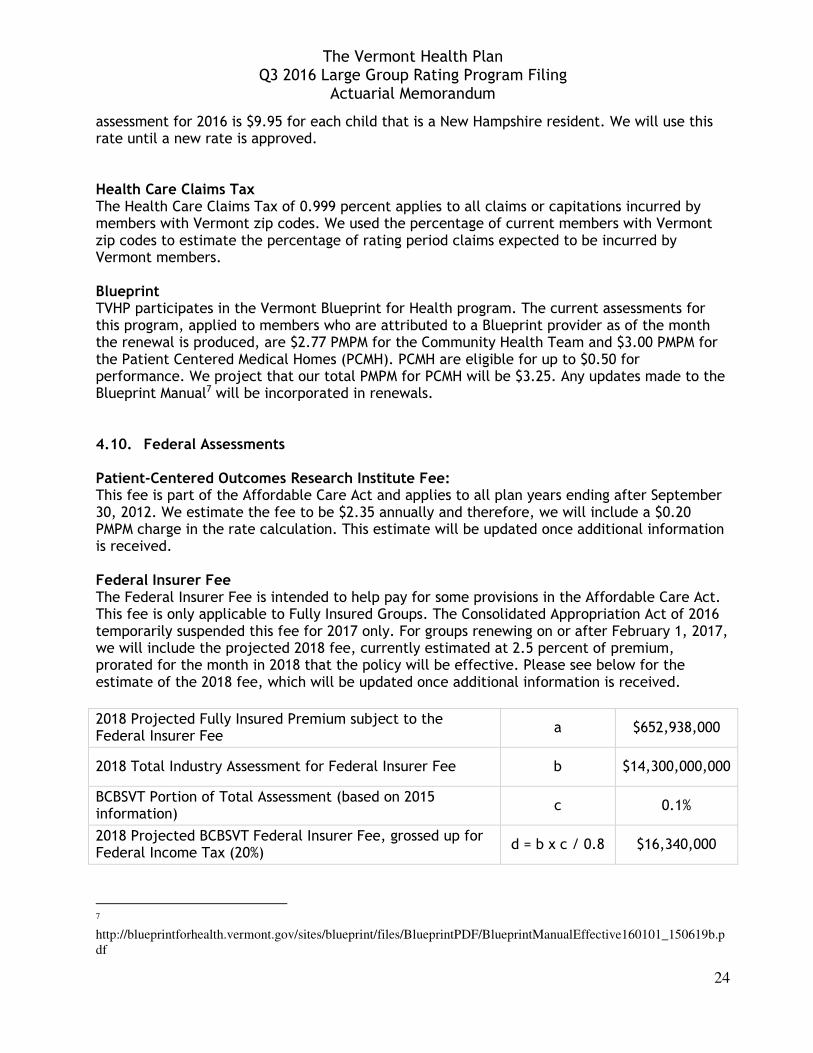
Blueprint TVHP participates in the Vermont Blueprint for Health program. The current assessments for this program, applied to members who are attributed to a Blueprint provider as of the month the renewal is produced, are $2.77 PMPM for the Community Health Team and $3.00 PMPM for the Patient Centered Medical Homes (PCMH). PCMH are eligible for up to $0.50 for performance. We project that our total PMPM for PCMH will be $3.25. Any updates made to the Blueprint Manual7 will be incorporated in renewals. 4.10. Federal Assessments Patient-Centered Outcomes Research Institute Fee: This fee is part of the Affordable Care Act and applies to all plan years ending after September 30, 2012. We estimate the fee to be $2.35 annually and therefore, we will include a $0.20 PMPM charge in the rate calculation. This estimate will be updated once additional information is received. Federal Insurer Fee The Federal Insurer Fee is intended to help pay for some provisions in the Affordable Care Act. This fee is only applicable to Fully Insured Groups. The Consolidated Appropriation Act of 2016 temporarily suspended this fee for 2017 only. For groups renewing on or after February 1, 2017, we will include the projected 2018 fee, currently estimated at 2.5 percent of premium, prorated for the month in 2018 that the policy will be effective. Please see below for the estimate of the 2018 fee, which will be updated once additional information is received.
2018 Projected Fully Insured Premium subject to the Federal Insurer Fee
a $652,938,000
2018 Total Industry Assessment for Federal Insurer Fee b $14,300,000,000
BCBSVT Portion of Total Assessment (based on 2015 information)
c 0.1%
2018 Projected BCBSVT Federal Insurer Fee, grossed up for Federal Income Tax (20%)
d = b x c / 0.8 $16,340,000
7
http://blueprintforhealth.vermont.gov/sites/blueprint/files/BlueprintPDF/BlueprintManualEffective160101_150619b.p
df
The Vermont Health Plan Q3 2016 Large Group Rating Program Filing
Actuarial Memorandum
25
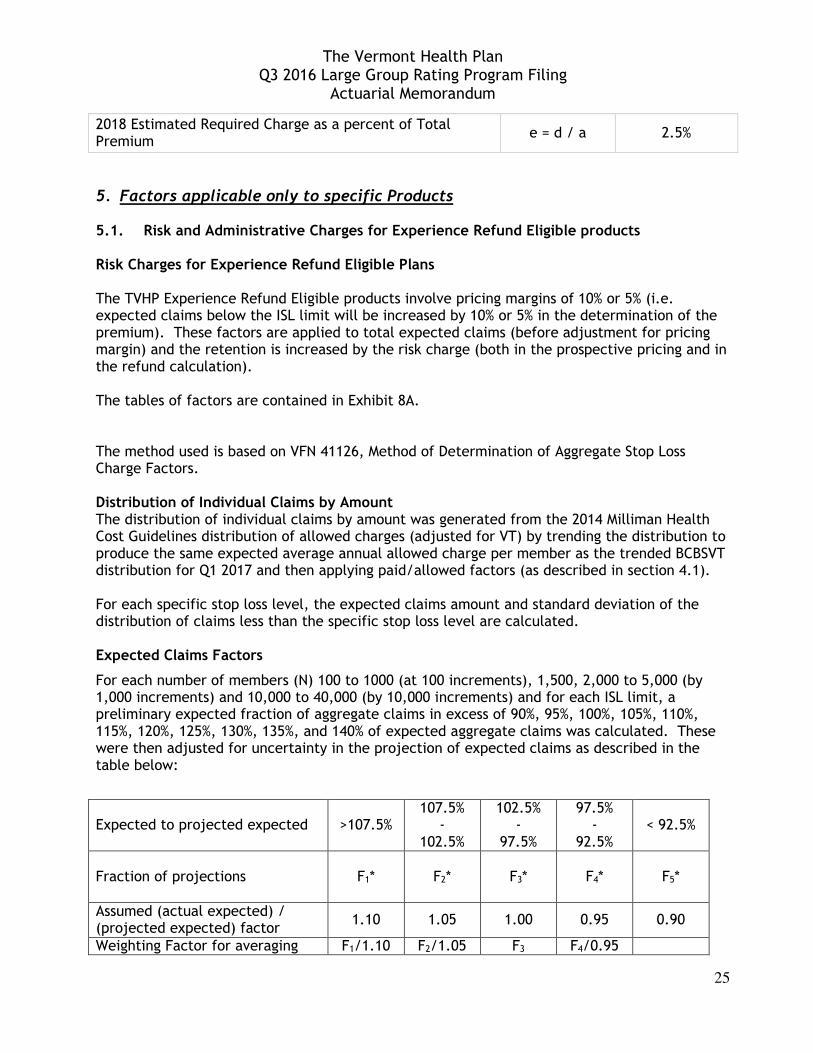
2018 Estimated Required Charge as a percent of Total Premium
e = d / a 2.5%
5. Factors applicable only to specific Products
5.1. Risk and Administrative Charges for Experience Refund Eligible products Risk Charges for Experience Refund Eligible Plans The TVHP Experience Refund Eligible products involve pricing margins of 10% or 5% (i.e. expected claims below the ISL limit will be increased by 10% or 5% in the determination of the premium). These factors are applied to total expected claims (before adjustment for pricing margin) and the retention is increased by the risk charge (both in the prospective pricing and in the refund calculation). The tables of factors are contained in Exhibit 8A. The method used is based on VFN 41126, Method of Determination of Aggregate Stop Loss Charge Factors. Distribution of Individual Claims by Amount The distribution of individual claims by amount was generated from the 2014 Milliman Health Cost Guidelines distribution of allowed charges (adjusted for VT) by trending the distribution to produce the same expected average annual allowed charge per member as the trended BCBSVT distribution for Q1 2017 and then applying paid/allowed factors (as described in section 4.1). For each specific stop loss level, the expected claims amount and standard deviation of the distribution of claims less than the specific stop loss level are calculated. Expected Claims Factors
For each number of members (N) 100 to 1000 (at 100 increments), 1,500, 2,000 to 5,000 (by 1,000 increments) and 10,000 to 40,000 (by 10,000 increments) and for each ISL limit, a preliminary expected fraction of aggregate claims in excess of 90%, 95%, 100%, 105%, 110%, 115%, 120%, 125%, 130%, 135%, and 140% of expected aggregate claims was calculated. These were then adjusted for uncertainty in the projection of expected claims as described in the table below:
Expected to projected expected
>107.5% 107.5%
- 102.5%
102.5% -
97.5%
97.5% -
92.5%
< 92.5%
Fraction of projections
F1* F2* F3* F4* F5*
Assumed (actual expected) / (projected expected) factor
1.10 1.05 1.00 0.95 0.90
Weighting Factor for averaging F1/1.10 F2/1.05 F3 F4/0.95

The Vermont Health Plan Q3 2016 Large Group Rating Program Filing
Actuarial Memorandum
26
F5/0.9
* Estimated for distribution
If the expected number of members (N) in the rating period is not one of the values in either table, the value is determined by interpolating linearly between the entries in the table for the numbers of members immediately below and above N. Settlement Administration Charge An administration charge equal to a settlement administration charge, offset by an investment income credit, will be added to the group’s administrative charges (described in section 4.5).
1. Settlement Administration Charge: An additional administrative charge of $1,700 will be included to offset the costs of administering the retrospective arrangement. This amount is based on the 2016 settlement administration charge of $1,665 increased by 2.1 percent trend to reflect the assumed increase for the direct staff cost.
2. Investment Income Adjustment: A credit of 0.2 percent of the margin will be applied
to the settlement administrative charge to reflect investment income earned on the margin.
6. Actuarial Opinion The purpose of this filing is to establish the formula, manual rate and accompanying factors that will be used for renewals of The Vermont Health Plan large group plans. This filing is not intended to be used for other purposes. The data used in this analysis has been reviewed for reasonableness and consistency; however, it has not been audited. It is my opinion that the rating formula and factors presented in this filing are reasonable, and have been prepared in accordance with applicable Actuarial Standards of Practice. The formula and factors will produce premium rates that are reasonable in relation to the benefits provided, and will not be excessive, deficient or unfairly discriminatory. I am a Fellow of the Society of Actuaries and a Member of the American Academy of Actuaries, and I meet the Academy’s Qualification Standards to render this opinion.
___________________________ Paul A Schultz, F.S.A., M.A.A.A. February 19, 2016
The Vermont Health Plan Q3 2016 Large Group Rating Program Filing
Plain Language Summary
The Vermont Health Plan (TVHP) is committed to the health of Vermonters, outstanding member experiences and responsible cost management for all of the people whose lives we touch. By pooling the populations covered by our products, we protect individuals from the unaffordable and potentially ruinous costs associated with significant illnesses or injuries. Our products promote preventive care, health maintenance, and health improvement, and we have in place strong utilization management programs that support members who require medical care and assure that they have access to high value care while avoiding unnecessary costs. TVHP also works with providers to dampen cost increases through reimbursement strategies that include incentives to both provide and properly manage care. TVHP’s vision is a transformed health care system in which every Vermonter has health care coverage, and receives timely, effective, affordable care. None of this work is possible unless TVHP remains financially strong, and that requires that we be allowed to charge rates that cover the medical expenses of the populations it serves. TVHP performs large group premium rating on a case-by-case basis. Rating is accomplished through a formulaic approach that blends recent group claims experience with a manual rate according to a credibility formula. This filing establishes the rating formula, manual rate and accompanying factors that will be used for large group renewals beginning upon approval of this filing, most notably January 2017 renewals. The filing describes in detail the formula used in the renewals, along with each of the factors included in that formula. These include large claims pooling factors, medical and pharmacy trends, and benefit relativities, along with the development of the manual rate. In addition, the filing details the calculation of administrative charges, the net cost of reinsurance, contribution to reserve, and state and federal assessments, all of which are included in the rate development. Finally, the filing discusses certain factors applicable only to specific products. Key results include the following:
• TVHP is proposing paid trends of 6.7 percent for medical claims and 11.9 percent for pharmacy claims, for a total combined trend of 7.6 percent.
• Administrative charges on a per member per month basis for the groups impacted by this filing have increased by 7.3 percent from the previous filing.
• We are proposing a contribution to member reserves of 2 percent for insured groups. • Our proposed manual rate, the projected average calendar year 2017 paid claims per
member per month for groups impacted by this filing, is $449.97. • There are an estimated 2,200 contracts (4,100 members) currently enrolled in one of
25 TVHP large group plans.
Our proposed medical trend is higher than what was approved in our most recent large group rating program filing, 6.2 percent. Utilization trends are beginning to accelerate after a period of historically low or flat trends. The pharmacy trend is also higher than the 10.0 percent approved in the previous filing. In that filing, the trend included an adjustment for future discounts according to our contract with our pharmacy benefits manager, ESI. In this filing, we have moved that adjustment to a different part of the rating formula. If we had
The Vermont Health Plan Q3 2016 Large Group Rating Program Filing
Plain Language Summary
excluded that adjustment from the pharmacy trend in the previous filing, the trend rate would have been 13.5 percent. Administrative charges have increased by 7.3 percent on a per member per month basis from the previous filing, which increases premium by 0.4 percent. TVHP is using a new cost allocation that resulted from a comprehensive cost accounting study. The new allocation increased administrative expenses allocated to large group business. A contribution to reserves is required in order to maintain an adequate level of surplus. Surplus is a critical consumer protection that allows subscribers to receive needed care and providers to continue to receive payments in the event of unforeseen adverse events that may otherwise impact TVHP’s ability to pay claims. We believe that the levels established in this filing represent an adequate, yet not excessive, contribution to reserves. We have changed our large group rating formula from the time of previous filing by removing the adjustment for contracted pharmacy discounts from the trend calculation and including it as a separate factor. There were no other material changes. Other factors, including large claim pooling charges and benefit relativities, have been updated but by their nature have neither an inflationary nor deflationary impact on rates across our entire book of business.

The Vermont Health Plan
Q3 2016 Large Group Rating Program Filing
Sample Calculation
Exhibit 1A
Benefit-Adjusted Projected Single Claims Rate:
Experience Period Paid Claims $987,000 A
Experience Period Claims Amount above $70,000 Pooling Limit $53,000 B
Capped Claims $934,000 C = A — B
Completion Factor 1.011 D
Completed Capped Claims $940,000 E = C x D
Pooling Charge Factor 0.198 F
Expected Claims above $70,000 Pooling Limit $190,000 G = E x F
Experience Adjustment Factor 1.000 H
Adjusted Experience Period Claims $1,130,000 I = (E + G) x H
Experience Period Member Months 3,270 J
Adjusted Experience Period Claims PMPM $345.57 K = I ÷ J
Average Experience Period Seasonal Adjusted Benefit Relativity Factor 0.770 L
Benefit-Adjusted Experience Period Single Claims Rate $448.91 M = K ÷ L
Trend 7.2% per annum for 18 months 1.110 N1
Pharmacy Contract Adjustment 0.990 N2
Projected Single Contract Rate $493.27 O = M x N1 x N2
Adjusted Manual Rate $666.30 P
Credibility factor 31% Q
Benefit-Adjusted Projected Single Claims Rate $612.81 R = (O x Q) + { P x ( 1 — Q)}
Credibility Calculation
Active Contract Months 1,164 a
Medicare Primary Contract Months 180 b
Months of Experience 12 c
NC 104.5 d = (a + 0.5 * b) / c
CF1 0.30911 e = (d / 500) ^ 0.75
CF2 1 f = (c / 12) ^ 2
Z 0.30911 g = e * f

The Vermont Health Plan
Q3 2016 Large Group Rating Program Filing
Example Calculation of Required Premium by Product and Tier
Illustrative Only
Exhibit 1B
From Exhibit 1A : Benefit-Adjusted Projected Single Claims Rate (R) $612.81
Plan A Single 2-Person Family
Medicare
Secondary
Members per contract 1.000 2.000 3.938 1.000
BRV: A 0.929 1.859 2.593 0.777
Projected Claims: B1 = A x R $569.49 $1,138.97 $1,588.87 $476.09
Net Cost of Reinsurance: B2 $1.50 $3.00 $5.91 $0.00
Projected Rx Rebate: B3 -$4.00 -$8.00 -$15.75 -$4.00
State Mandates and Assessments
Vaccines for Vemonters C1 $2.50 $5.00 $9.85 $2.50
Blue Print for Health C2 $2.50 $5.00 $9.85 $2.50
Health Care Claims Tax C3 = 0.999% * B1 $5.69 $11.38 $15.87 $4.76
Federal Mandates and Assements
PCORI D1 $0.19 $0.39 $0.76 $0.19
Federal Insurer Fee D2 0.00%
Administrative Charge E $25.00 $50.00 $98.45 $25.00
Commission (% premium) F 3.00%
Contribution to Reserve G 2.00%
Required Premium: $634.60 $1,269.20 $1,803.99 $533.73
Plan B Single 2-Person Family
Medicare
Secondary
Members per contract 1.000 2.000 3.938 1.000
BRV: A 1.023 2.046 2.854 0.810
Projected Claims: B1 = A x S $626.91 $1,253.81 $1,749.07 $496.50
Net Cost of Reinsurance: B2 $1.50 $3.00 $5.91 $0.00
Projected Rx Rebate: B3 -$4.00 -$8.00 -$15.75 -$4.00
State Mandates and Assessments
Vaccines for Vemonters C1 $2.50 $5.00 $9.85 $2.50
Blue Print for Health C2 $2.50 $5.00 $9.85 $2.50
Health Care Claims Tax C3 = 0.999% * B1 $6.26 $12.53 $17.47 $4.96
Federal Mandates and Assements
PCORI D1 $0.19 $0.39 $0.76 $0.19
Federal Insurer Fee D2 0.00%
Administrative Charge E $25.00 $50.00 $98.45 $25.00
Commission (% premium) F 3.00%
Contribution to Reserve G 2.00%
Required Premium: $695.64 $1,391.29 $1,974.31 $555.42
H = [ ∑(Bi) + ∑(Ci) + D1 + E ] /
(1 - F - G - D2)
H = [ ∑(Bi) + ∑(Ci) + D1 + E ] /
(1 - F - G - D2)
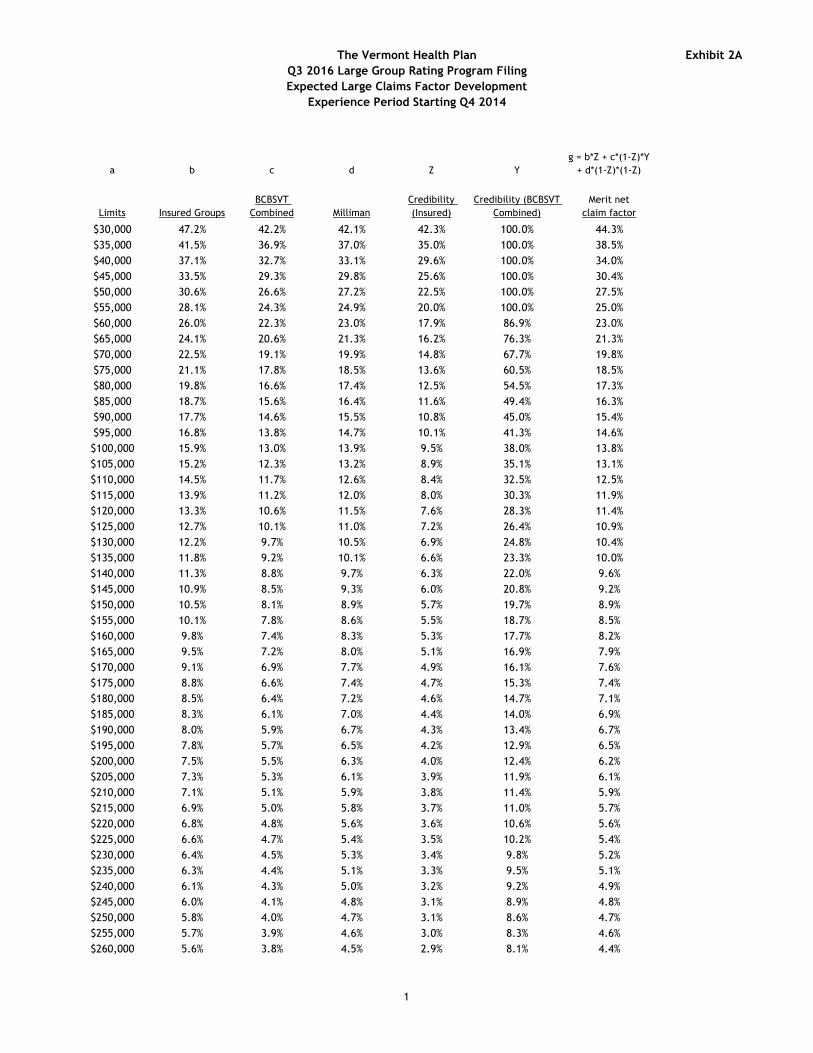
The Vermont Health Plan
Q3 2016 Large Group Rating Program Filing
Expected Large Claims Factor Development
Experience Period Starting Q4 2014
Exhibit 2A
a b c d Z Y
g = b*Z + c*(1-Z)*Y
+ d*(1-Z)*(1-Z)
Limits Insured Groups
BCBSVT
Combined Milliman
Credibility
(Insured)
Credibility (BCBSVT
Combined)
Merit net
claim factor
$30,000 47.2% 42.2% 42.1% 42.3% 100.0% 44.3%
$35,000 41.5% 36.9% 37.0% 35.0% 100.0% 38.5%
$40,000 37.1% 32.7% 33.1% 29.6% 100.0% 34.0%
$45,000 33.5% 29.3% 29.8% 25.6% 100.0% 30.4%
$50,000 30.6% 26.6% 27.2% 22.5% 100.0% 27.5%
$55,000 28.1% 24.3% 24.9% 20.0% 100.0% 25.0%
$60,000 26.0% 22.3% 23.0% 17.9% 86.9% 23.0%
$65,000 24.1% 20.6% 21.3% 16.2% 76.3% 21.3%
$70,000 22.5% 19.1% 19.9% 14.8% 67.7% 19.8%
$75,000 21.1% 17.8% 18.5% 13.6% 60.5% 18.5%
$80,000 19.8% 16.6% 17.4% 12.5% 54.5% 17.3%
$85,000 18.7% 15.6% 16.4% 11.6% 49.4% 16.3%
$90,000 17.7% 14.6% 15.5% 10.8% 45.0% 15.4%
$95,000 16.8% 13.8% 14.7% 10.1% 41.3% 14.6%
$100,000 15.9% 13.0% 13.9% 9.5% 38.0% 13.8%
$105,000 15.2% 12.3% 13.2% 8.9% 35.1% 13.1%
$110,000 14.5% 11.7% 12.6% 8.4% 32.5% 12.5%
$115,000 13.9% 11.2% 12.0% 8.0% 30.3% 11.9%
$120,000 13.3% 10.6% 11.5% 7.6% 28.3% 11.4%
$125,000 12.7% 10.1% 11.0% 7.2% 26.4% 10.9%
$130,000 12.2% 9.7% 10.5% 6.9% 24.8% 10.4%
$135,000 11.8% 9.2% 10.1% 6.6% 23.3% 10.0%
$140,000 11.3% 8.8% 9.7% 6.3% 22.0% 9.6%
$145,000 10.9% 8.5% 9.3% 6.0% 20.8% 9.2%
$150,000 10.5% 8.1% 8.9% 5.7% 19.7% 8.9%
$155,000 10.1% 7.8% 8.6% 5.5% 18.7% 8.5%
$160,000 9.8% 7.4% 8.3% 5.3% 17.7% 8.2%
$165,000 9.5% 7.2% 8.0% 5.1% 16.9% 7.9%
$170,000 9.1% 6.9% 7.7% 4.9% 16.1% 7.6%
$175,000 8.8% 6.6% 7.4% 4.7% 15.3% 7.4%
$180,000 8.5% 6.4% 7.2% 4.6% 14.7% 7.1%
$185,000 8.3% 6.1% 7.0% 4.4% 14.0% 6.9%
$190,000 8.0% 5.9% 6.7% 4.3% 13.4% 6.7%
$195,000 7.8% 5.7% 6.5% 4.2% 12.9% 6.5%
$200,000 7.5% 5.5% 6.3% 4.0% 12.4% 6.2%
$205,000 7.3% 5.3% 6.1% 3.9% 11.9% 6.1%
$210,000 7.1% 5.1% 5.9% 3.8% 11.4% 5.9%
$215,000 6.9% 5.0% 5.8% 3.7% 11.0% 5.7%
$220,000 6.8% 4.8% 5.6% 3.6% 10.6% 5.6%
$225,000 6.6% 4.7% 5.4% 3.5% 10.2% 5.4%
$230,000 6.4% 4.5% 5.3% 3.4% 9.8% 5.2%
$235,000 6.3% 4.4% 5.1% 3.3% 9.5% 5.1%
$240,000 6.1% 4.3% 5.0% 3.2% 9.2% 4.9%
$245,000 6.0% 4.1% 4.8% 3.1% 8.9% 4.8%
$250,000 5.8% 4.0% 4.7% 3.1% 8.6% 4.7%
$255,000 5.7% 3.9% 4.6% 3.0% 8.3% 4.6%
$260,000 5.6% 3.8% 4.5% 2.9% 8.1% 4.4%
1
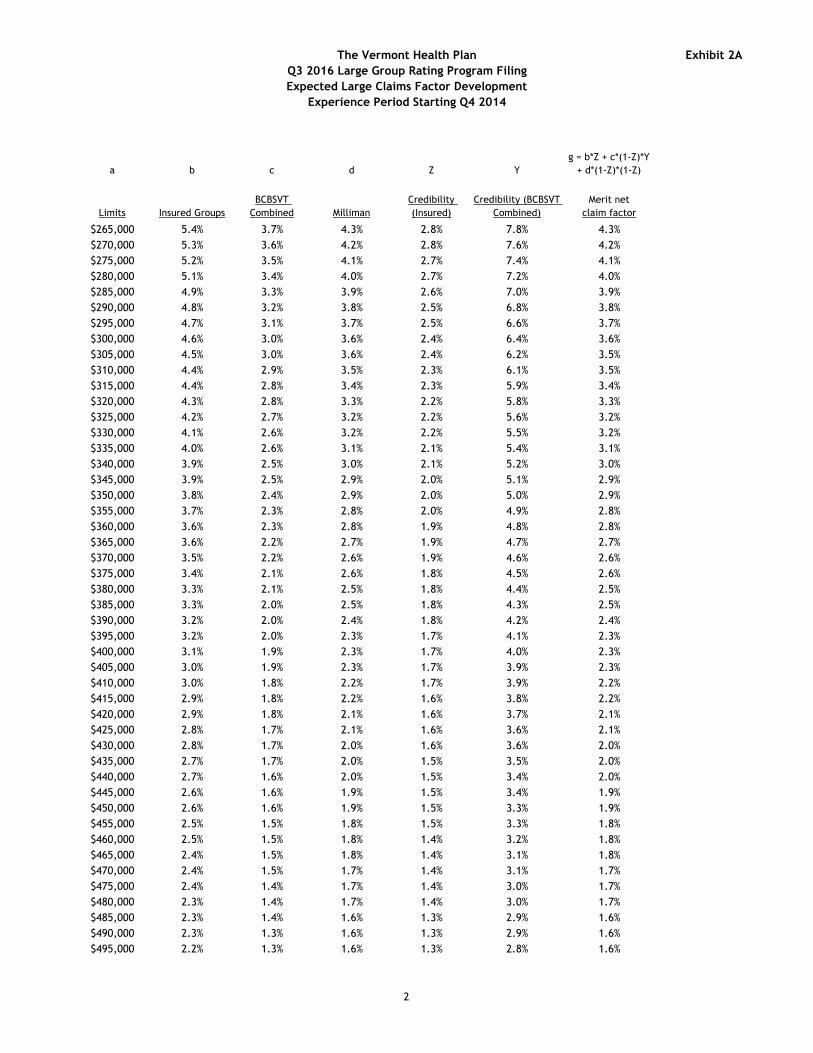
The Vermont Health Plan
Q3 2016 Large Group Rating Program Filing
Expected Large Claims Factor Development
Experience Period Starting Q4 2014
Exhibit 2A
a b c d Z Y
g = b*Z + c*(1-Z)*Y
+ d*(1-Z)*(1-Z)
Limits Insured Groups
BCBSVT
Combined Milliman
Credibility
(Insured)
Credibility (BCBSVT
Combined)
Merit net
claim factor
$265,000 5.4% 3.7% 4.3% 2.8% 7.8% 4.3%
$270,000 5.3% 3.6% 4.2% 2.8% 7.6% 4.2%
$275,000 5.2% 3.5% 4.1% 2.7% 7.4% 4.1%
$280,000 5.1% 3.4% 4.0% 2.7% 7.2% 4.0%
$285,000 4.9% 3.3% 3.9% 2.6% 7.0% 3.9%
$290,000 4.8% 3.2% 3.8% 2.5% 6.8% 3.8%
$295,000 4.7% 3.1% 3.7% 2.5% 6.6% 3.7%
$300,000 4.6% 3.0% 3.6% 2.4% 6.4% 3.6%
$305,000 4.5% 3.0% 3.6% 2.4% 6.2% 3.5%
$310,000 4.4% 2.9% 3.5% 2.3% 6.1% 3.5%
$315,000 4.4% 2.8% 3.4% 2.3% 5.9% 3.4%
$320,000 4.3% 2.8% 3.3% 2.2% 5.8% 3.3%
$325,000 4.2% 2.7% 3.2% 2.2% 5.6% 3.2%
$330,000 4.1% 2.6% 3.2% 2.2% 5.5% 3.2%
$335,000 4.0% 2.6% 3.1% 2.1% 5.4% 3.1%
$340,000 3.9% 2.5% 3.0% 2.1% 5.2% 3.0%
$345,000 3.9% 2.5% 2.9% 2.0% 5.1% 2.9%
$350,000 3.8% 2.4% 2.9% 2.0% 5.0% 2.9%
$355,000 3.7% 2.3% 2.8% 2.0% 4.9% 2.8%
$360,000 3.6% 2.3% 2.8% 1.9% 4.8% 2.8%
$365,000 3.6% 2.2% 2.7% 1.9% 4.7% 2.7%
$370,000 3.5% 2.2% 2.6% 1.9% 4.6% 2.6%
$375,000 3.4% 2.1% 2.6% 1.8% 4.5% 2.6%
$380,000 3.3% 2.1% 2.5% 1.8% 4.4% 2.5%
$385,000 3.3% 2.0% 2.5% 1.8% 4.3% 2.5%
$390,000 3.2% 2.0% 2.4% 1.8% 4.2% 2.4%
$395,000 3.2% 2.0% 2.3% 1.7% 4.1% 2.3%
$400,000 3.1% 1.9% 2.3% 1.7% 4.0% 2.3%
$405,000 3.0% 1.9% 2.3% 1.7% 3.9% 2.3%
$410,000 3.0% 1.8% 2.2% 1.7% 3.9% 2.2%
$415,000 2.9% 1.8% 2.2% 1.6% 3.8% 2.2%
$420,000 2.9% 1.8% 2.1% 1.6% 3.7% 2.1%
$425,000 2.8% 1.7% 2.1% 1.6% 3.6% 2.1%
$430,000 2.8% 1.7% 2.0% 1.6% 3.6% 2.0%
$435,000 2.7% 1.7% 2.0% 1.5% 3.5% 2.0%
$440,000 2.7% 1.6% 2.0% 1.5% 3.4% 2.0%
$445,000 2.6% 1.6% 1.9% 1.5% 3.4% 1.9%
$450,000 2.6% 1.6% 1.9% 1.5% 3.3% 1.9%
$455,000 2.5% 1.5% 1.8% 1.5% 3.3% 1.8%
$460,000 2.5% 1.5% 1.8% 1.4% 3.2% 1.8%
$465,000 2.4% 1.5% 1.8% 1.4% 3.1% 1.8%
$470,000 2.4% 1.5% 1.7% 1.4% 3.1% 1.7%
$475,000 2.4% 1.4% 1.7% 1.4% 3.0% 1.7%
$480,000 2.3% 1.4% 1.7% 1.4% 3.0% 1.7%
$485,000 2.3% 1.4% 1.6% 1.3% 2.9% 1.6%
$490,000 2.3% 1.3% 1.6% 1.3% 2.9% 1.6%
$495,000 2.2% 1.3% 1.6% 1.3% 2.8% 1.6%
2
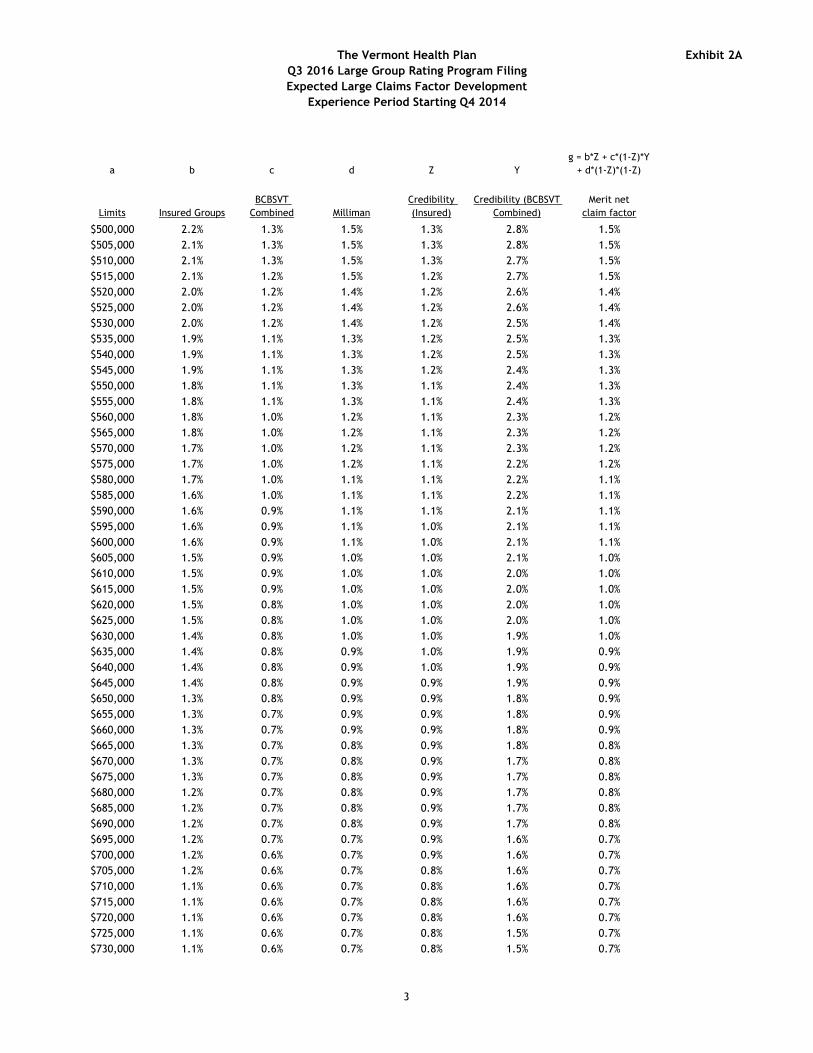
The Vermont Health Plan
Q3 2016 Large Group Rating Program Filing
Expected Large Claims Factor Development
Experience Period Starting Q4 2014
Exhibit 2A
a b c d Z Y
g = b*Z + c*(1-Z)*Y
+ d*(1-Z)*(1-Z)
Limits Insured Groups
BCBSVT
Combined Milliman
Credibility
(Insured)
Credibility (BCBSVT
Combined)
Merit net
claim factor
$500,000 2.2% 1.3% 1.5% 1.3% 2.8% 1.5%
$505,000 2.1% 1.3% 1.5% 1.3% 2.8% 1.5%
$510,000 2.1% 1.3% 1.5% 1.3% 2.7% 1.5%
$515,000 2.1% 1.2% 1.5% 1.2% 2.7% 1.5%
$520,000 2.0% 1.2% 1.4% 1.2% 2.6% 1.4%
$525,000 2.0% 1.2% 1.4% 1.2% 2.6% 1.4%
$530,000 2.0% 1.2% 1.4% 1.2% 2.5% 1.4%
$535,000 1.9% 1.1% 1.3% 1.2% 2.5% 1.3%
$540,000 1.9% 1.1% 1.3% 1.2% 2.5% 1.3%
$545,000 1.9% 1.1% 1.3% 1.2% 2.4% 1.3%
$550,000 1.8% 1.1% 1.3% 1.1% 2.4% 1.3%
$555,000 1.8% 1.1% 1.3% 1.1% 2.4% 1.3%
$560,000 1.8% 1.0% 1.2% 1.1% 2.3% 1.2%
$565,000 1.8% 1.0% 1.2% 1.1% 2.3% 1.2%
$570,000 1.7% 1.0% 1.2% 1.1% 2.3% 1.2%
$575,000 1.7% 1.0% 1.2% 1.1% 2.2% 1.2%
$580,000 1.7% 1.0% 1.1% 1.1% 2.2% 1.1%
$585,000 1.6% 1.0% 1.1% 1.1% 2.2% 1.1%
$590,000 1.6% 0.9% 1.1% 1.1% 2.1% 1.1%
$595,000 1.6% 0.9% 1.1% 1.0% 2.1% 1.1%
$600,000 1.6% 0.9% 1.1% 1.0% 2.1% 1.1%
$605,000 1.5% 0.9% 1.0% 1.0% 2.1% 1.0%
$610,000 1.5% 0.9% 1.0% 1.0% 2.0% 1.0%
$615,000 1.5% 0.9% 1.0% 1.0% 2.0% 1.0%
$620,000 1.5% 0.8% 1.0% 1.0% 2.0% 1.0%
$625,000 1.5% 0.8% 1.0% 1.0% 2.0% 1.0%
$630,000 1.4% 0.8% 1.0% 1.0% 1.9% 1.0%
$635,000 1.4% 0.8% 0.9% 1.0% 1.9% 0.9%
$640,000 1.4% 0.8% 0.9% 1.0% 1.9% 0.9%
$645,000 1.4% 0.8% 0.9% 0.9% 1.9% 0.9%
$650,000 1.3% 0.8% 0.9% 0.9% 1.8% 0.9%
$655,000 1.3% 0.7% 0.9% 0.9% 1.8% 0.9%
$660,000 1.3% 0.7% 0.9% 0.9% 1.8% 0.9%
$665,000 1.3% 0.7% 0.8% 0.9% 1.8% 0.8%
$670,000 1.3% 0.7% 0.8% 0.9% 1.7% 0.8%
$675,000 1.3% 0.7% 0.8% 0.9% 1.7% 0.8%
$680,000 1.2% 0.7% 0.8% 0.9% 1.7% 0.8%
$685,000 1.2% 0.7% 0.8% 0.9% 1.7% 0.8%
$690,000 1.2% 0.7% 0.8% 0.9% 1.7% 0.8%
$695,000 1.2% 0.7% 0.7% 0.9% 1.6% 0.7%
$700,000 1.2% 0.6% 0.7% 0.9% 1.6% 0.7%
$705,000 1.2% 0.6% 0.7% 0.8% 1.6% 0.7%
$710,000 1.1% 0.6% 0.7% 0.8% 1.6% 0.7%
$715,000 1.1% 0.6% 0.7% 0.8% 1.6% 0.7%
$720,000 1.1% 0.6% 0.7% 0.8% 1.6% 0.7%
$725,000 1.1% 0.6% 0.7% 0.8% 1.5% 0.7%
$730,000 1.1% 0.6% 0.7% 0.8% 1.5% 0.7%
3
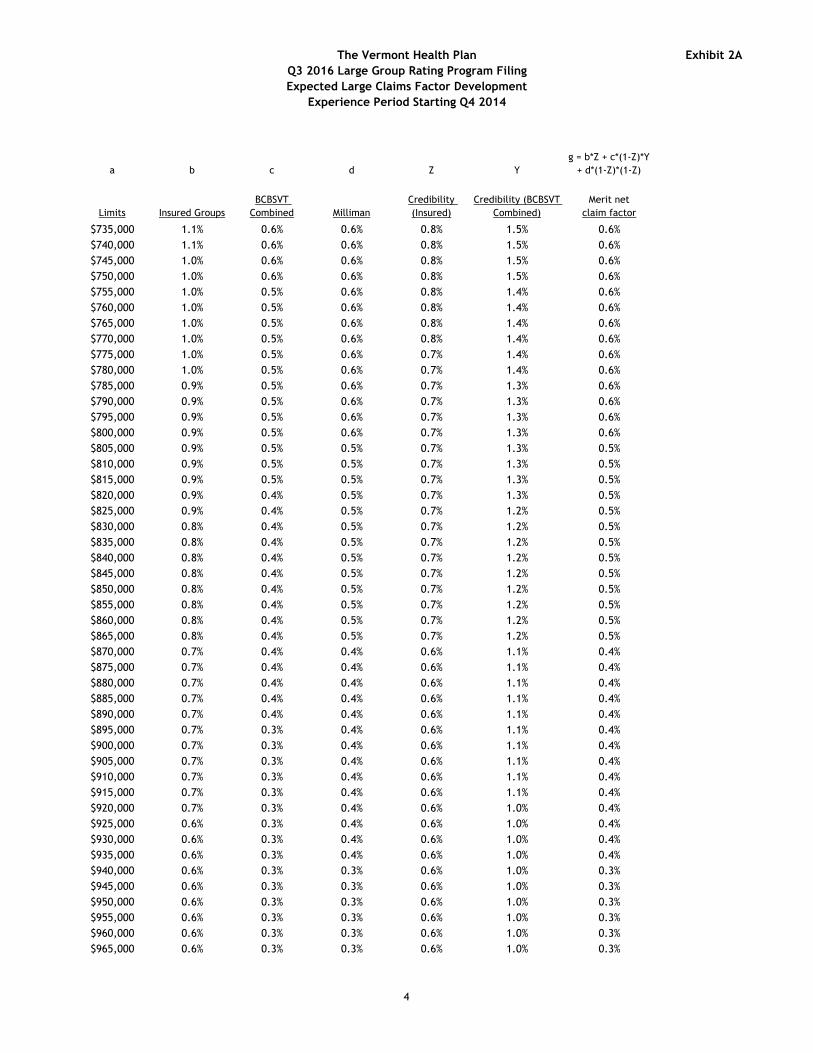
The Vermont Health Plan
Q3 2016 Large Group Rating Program Filing
Expected Large Claims Factor Development
Experience Period Starting Q4 2014
Exhibit 2A
a b c d Z Y
g = b*Z + c*(1-Z)*Y
+ d*(1-Z)*(1-Z)
Limits Insured Groups
BCBSVT
Combined Milliman
Credibility
(Insured)
Credibility (BCBSVT
Combined)
Merit net
claim factor
$735,000 1.1% 0.6% 0.6% 0.8% 1.5% 0.6%
$740,000 1.1% 0.6% 0.6% 0.8% 1.5% 0.6%
$745,000 1.0% 0.6% 0.6% 0.8% 1.5% 0.6%
$750,000 1.0% 0.6% 0.6% 0.8% 1.5% 0.6%
$755,000 1.0% 0.5% 0.6% 0.8% 1.4% 0.6%
$760,000 1.0% 0.5% 0.6% 0.8% 1.4% 0.6%
$765,000 1.0% 0.5% 0.6% 0.8% 1.4% 0.6%
$770,000 1.0% 0.5% 0.6% 0.8% 1.4% 0.6%
$775,000 1.0% 0.5% 0.6% 0.7% 1.4% 0.6%
$780,000 1.0% 0.5% 0.6% 0.7% 1.4% 0.6%
$785,000 0.9% 0.5% 0.6% 0.7% 1.3% 0.6%
$790,000 0.9% 0.5% 0.6% 0.7% 1.3% 0.6%
$795,000 0.9% 0.5% 0.6% 0.7% 1.3% 0.6%
$800,000 0.9% 0.5% 0.6% 0.7% 1.3% 0.6%
$805,000 0.9% 0.5% 0.5% 0.7% 1.3% 0.5%
$810,000 0.9% 0.5% 0.5% 0.7% 1.3% 0.5%
$815,000 0.9% 0.5% 0.5% 0.7% 1.3% 0.5%
$820,000 0.9% 0.4% 0.5% 0.7% 1.3% 0.5%
$825,000 0.9% 0.4% 0.5% 0.7% 1.2% 0.5%
$830,000 0.8% 0.4% 0.5% 0.7% 1.2% 0.5%
$835,000 0.8% 0.4% 0.5% 0.7% 1.2% 0.5%
$840,000 0.8% 0.4% 0.5% 0.7% 1.2% 0.5%
$845,000 0.8% 0.4% 0.5% 0.7% 1.2% 0.5%
$850,000 0.8% 0.4% 0.5% 0.7% 1.2% 0.5%
$855,000 0.8% 0.4% 0.5% 0.7% 1.2% 0.5%
$860,000 0.8% 0.4% 0.5% 0.7% 1.2% 0.5%
$865,000 0.8% 0.4% 0.5% 0.7% 1.2% 0.5%
$870,000 0.7% 0.4% 0.4% 0.6% 1.1% 0.4%
$875,000 0.7% 0.4% 0.4% 0.6% 1.1% 0.4%
$880,000 0.7% 0.4% 0.4% 0.6% 1.1% 0.4%
$885,000 0.7% 0.4% 0.4% 0.6% 1.1% 0.4%
$890,000 0.7% 0.4% 0.4% 0.6% 1.1% 0.4%
$895,000 0.7% 0.3% 0.4% 0.6% 1.1% 0.4%
$900,000 0.7% 0.3% 0.4% 0.6% 1.1% 0.4%
$905,000 0.7% 0.3% 0.4% 0.6% 1.1% 0.4%
$910,000 0.7% 0.3% 0.4% 0.6% 1.1% 0.4%
$915,000 0.7% 0.3% 0.4% 0.6% 1.1% 0.4%
$920,000 0.7% 0.3% 0.4% 0.6% 1.0% 0.4%
$925,000 0.6% 0.3% 0.4% 0.6% 1.0% 0.4%
$930,000 0.6% 0.3% 0.4% 0.6% 1.0% 0.4%
$935,000 0.6% 0.3% 0.4% 0.6% 1.0% 0.4%
$940,000 0.6% 0.3% 0.3% 0.6% 1.0% 0.3%
$945,000 0.6% 0.3% 0.3% 0.6% 1.0% 0.3%
$950,000 0.6% 0.3% 0.3% 0.6% 1.0% 0.3%
$955,000 0.6% 0.3% 0.3% 0.6% 1.0% 0.3%
$960,000 0.6% 0.3% 0.3% 0.6% 1.0% 0.3%
$965,000 0.6% 0.3% 0.3% 0.6% 1.0% 0.3%
4
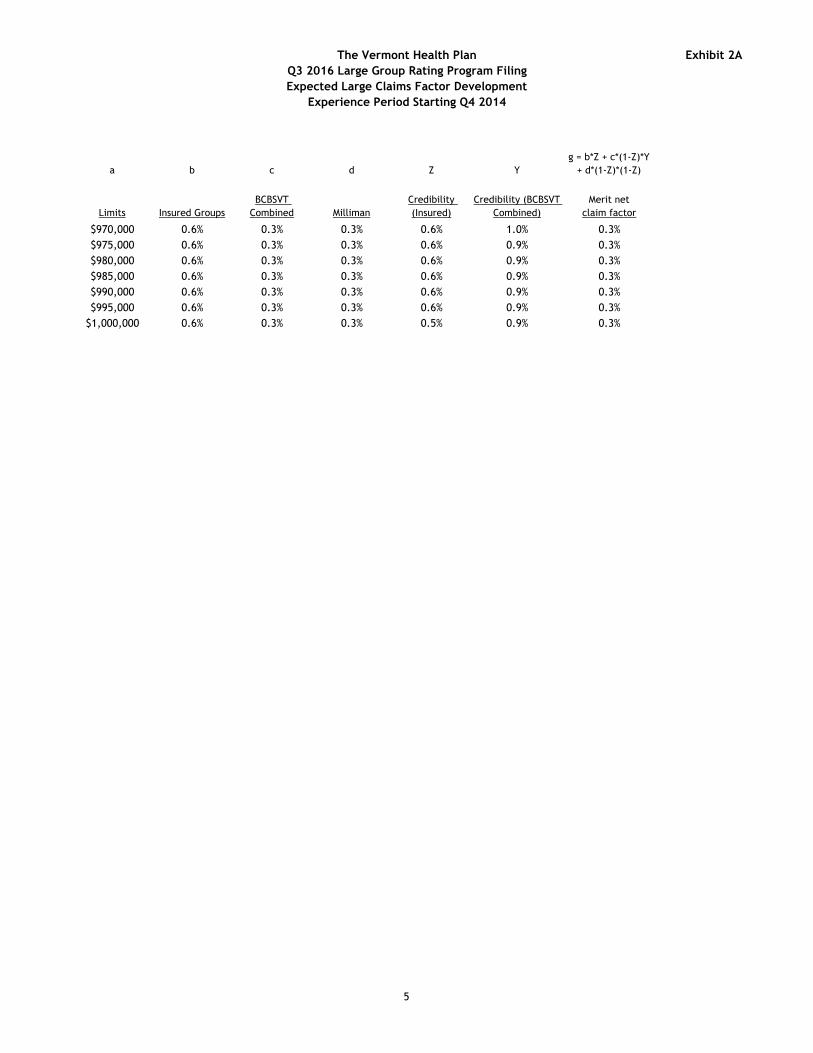
The Vermont Health Plan
Q3 2016 Large Group Rating Program Filing
Expected Large Claims Factor Development
Experience Period Starting Q4 2014
Exhibit 2A
a b c d Z Y
g = b*Z + c*(1-Z)*Y
+ d*(1-Z)*(1-Z)
Limits Insured Groups
BCBSVT
Combined Milliman
Credibility
(Insured)
Credibility (BCBSVT
Combined)
Merit net
claim factor
$970,000 0.6% 0.3% 0.3% 0.6% 1.0% 0.3%
$975,000 0.6% 0.3% 0.3% 0.6% 0.9% 0.3%
$980,000 0.6% 0.3% 0.3% 0.6% 0.9% 0.3%
$985,000 0.6% 0.3% 0.3% 0.6% 0.9% 0.3%
$990,000 0.6% 0.3% 0.3% 0.6% 0.9% 0.3%
$995,000 0.6% 0.3% 0.3% 0.6% 0.9% 0.3%
$1,000,000 0.6% 0.3% 0.3% 0.5% 0.9% 0.3%
5
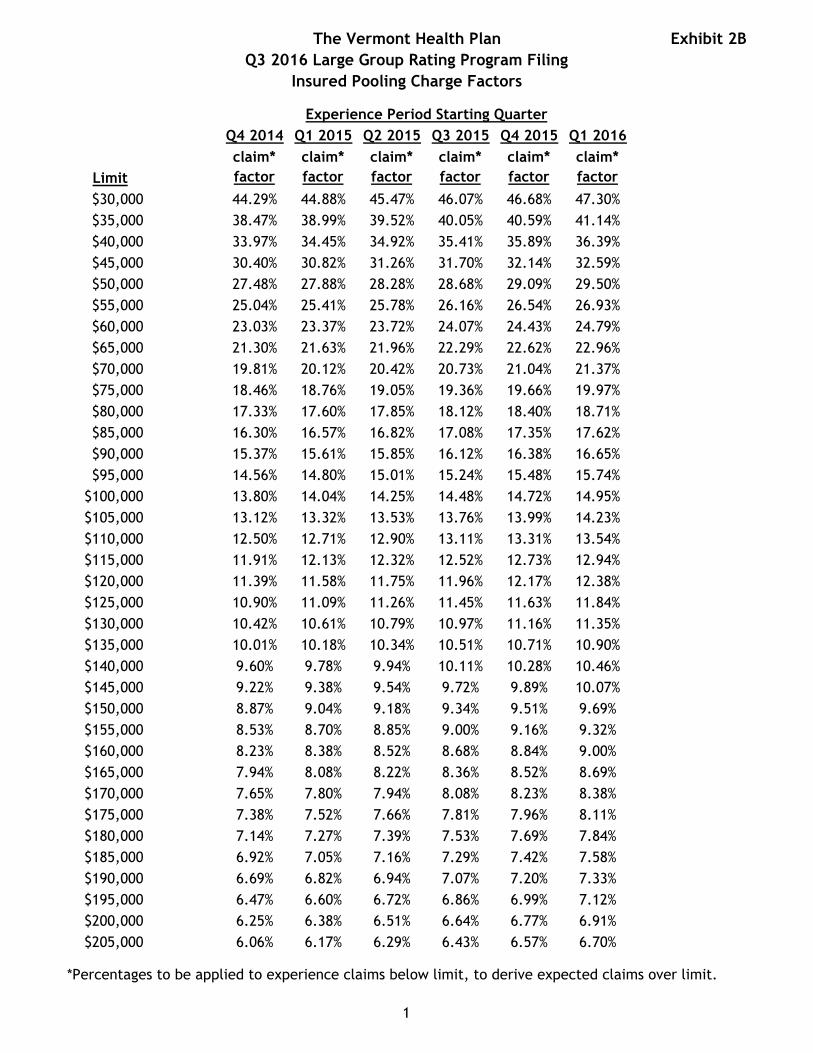
The Vermont Health Plan
Q3 2016 Large Group Rating Program Filing
Insured Pooling Charge Factors
Exhibit 2B
Q4 2014 Q1 2015 Q2 2015 Q3 2015 Q4 2015 Q1 2016
Limit
claim*
factor
claim*
factor
claim*
factor
claim*
factor
claim*
factor
claim*
factor
$30,000 44.29% 44.88% 45.47% 46.07% 46.68% 47.30%
$35,000 38.47% 38.99% 39.52% 40.05% 40.59% 41.14%
$40,000 33.97% 34.45% 34.92% 35.41% 35.89% 36.39%
$45,000 30.40% 30.82% 31.26% 31.70% 32.14% 32.59%
$50,000 27.48% 27.88% 28.28% 28.68% 29.09% 29.50%
$55,000 25.04% 25.41% 25.78% 26.16% 26.54% 26.93%
$60,000 23.03% 23.37% 23.72% 24.07% 24.43% 24.79%
$65,000 21.30% 21.63% 21.96% 22.29% 22.62% 22.96%
$70,000 19.81% 20.12% 20.42% 20.73% 21.04% 21.37%
$75,000 18.46% 18.76% 19.05% 19.36% 19.66% 19.97%
$80,000 17.33% 17.60% 17.85% 18.12% 18.40% 18.71%
$85,000 16.30% 16.57% 16.82% 17.08% 17.35% 17.62%
$90,000 15.37% 15.61% 15.85% 16.12% 16.38% 16.65%
$95,000 14.56% 14.80% 15.01% 15.24% 15.48% 15.74%
$100,000 13.80% 14.04% 14.25% 14.48% 14.72% 14.95%
$105,000 13.12% 13.32% 13.53% 13.76% 13.99% 14.23%
$110,000 12.50% 12.71% 12.90% 13.11% 13.31% 13.54%
$115,000 11.91% 12.13% 12.32% 12.52% 12.73% 12.94%
$120,000 11.39% 11.58% 11.75% 11.96% 12.17% 12.38%
$125,000 10.90% 11.09% 11.26% 11.45% 11.63% 11.84%
$130,000 10.42% 10.61% 10.79% 10.97% 11.16% 11.35%
$135,000 10.01% 10.18% 10.34% 10.51% 10.71% 10.90%
$140,000 9.60% 9.78% 9.94% 10.11% 10.28% 10.46%
$145,000 9.22% 9.38% 9.54% 9.72% 9.89% 10.07%
$150,000 8.87% 9.04% 9.18% 9.34% 9.51% 9.69%
$155,000 8.53% 8.70% 8.85% 9.00% 9.16% 9.32%
$160,000 8.23% 8.38% 8.52% 8.68% 8.84% 9.00%
$165,000 7.94% 8.08% 8.22% 8.36% 8.52% 8.69%
$170,000 7.65% 7.80% 7.94% 8.08% 8.23% 8.38%
$175,000 7.38% 7.52% 7.66% 7.81% 7.96% 8.11%
$180,000 7.14% 7.27% 7.39% 7.53% 7.69% 7.84%
$185,000 6.92% 7.05% 7.16% 7.29% 7.42% 7.58%
$190,000 6.69% 6.82% 6.94% 7.07% 7.20% 7.33%
$195,000 6.47% 6.60% 6.72% 6.86% 6.99% 7.12%
$200,000 6.25% 6.38% 6.51% 6.64% 6.77% 6.91%
$205,000 6.06% 6.17% 6.29% 6.43% 6.57% 6.70%
Experience Period Starting Quarter
*Percentages to be applied to experience claims below limit, to derive expected claims over limit.
1
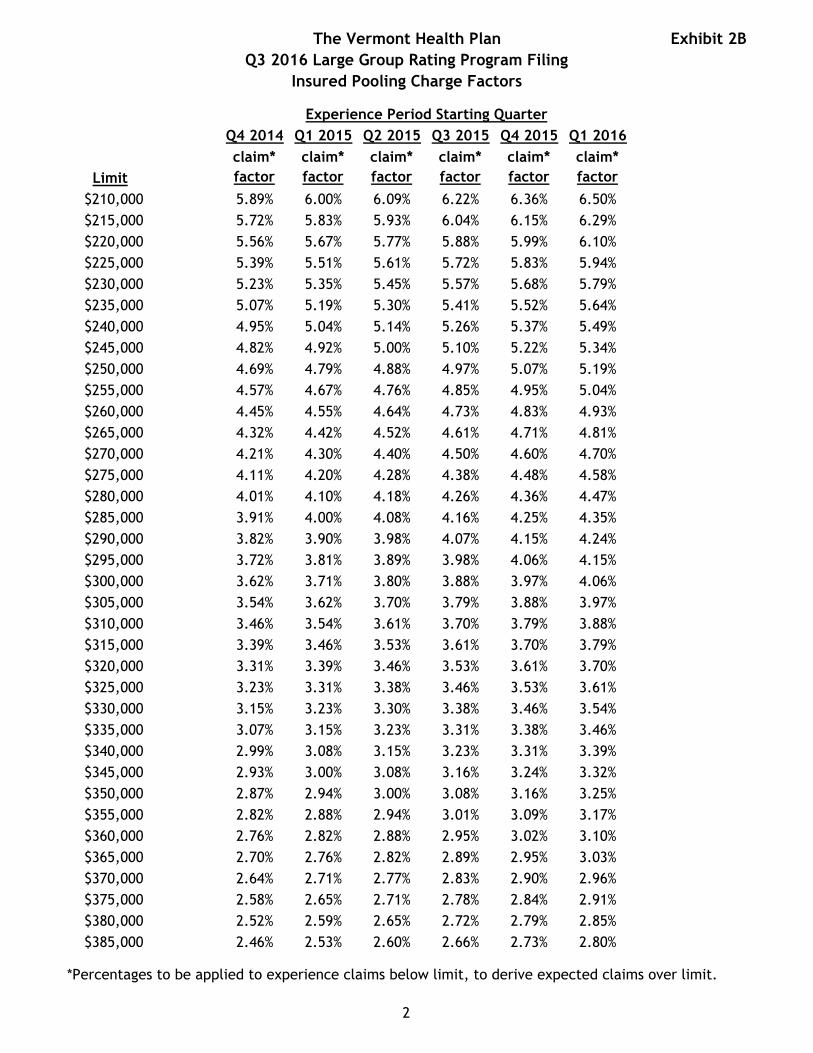
The Vermont Health Plan
Q3 2016 Large Group Rating Program Filing
Insured Pooling Charge Factors
Exhibit 2B
Q4 2014 Q1 2015 Q2 2015 Q3 2015 Q4 2015 Q1 2016
Limit
claim*
factor
claim*
factor
claim*
factor
claim*
factor
claim*
factor
claim*
factor
Experience Period Starting Quarter
$210,000 5.89% 6.00% 6.09% 6.22% 6.36% 6.50%
$215,000 5.72% 5.83% 5.93% 6.04% 6.15% 6.29%
$220,000 5.56% 5.67% 5.77% 5.88% 5.99% 6.10%
$225,000 5.39% 5.51% 5.61% 5.72% 5.83% 5.94%
$230,000 5.23% 5.35% 5.45% 5.57% 5.68% 5.79%
$235,000 5.07% 5.19% 5.30% 5.41% 5.52% 5.64%
$240,000 4.95% 5.04% 5.14% 5.26% 5.37% 5.49%
$245,000 4.82% 4.92% 5.00% 5.10% 5.22% 5.34%
$250,000 4.69% 4.79% 4.88% 4.97% 5.07% 5.19%
$255,000 4.57% 4.67% 4.76% 4.85% 4.95% 5.04%
$260,000 4.45% 4.55% 4.64% 4.73% 4.83% 4.93%
$265,000 4.32% 4.42% 4.52% 4.61% 4.71% 4.81%
$270,000 4.21% 4.30% 4.40% 4.50% 4.60% 4.70%
$275,000 4.11% 4.20% 4.28% 4.38% 4.48% 4.58%
$280,000 4.01% 4.10% 4.18% 4.26% 4.36% 4.47%
$285,000 3.91% 4.00% 4.08% 4.16% 4.25% 4.35%
$290,000 3.82% 3.90% 3.98% 4.07% 4.15% 4.24%
$295,000 3.72% 3.81% 3.89% 3.98% 4.06% 4.15%
$300,000 3.62% 3.71% 3.80% 3.88% 3.97% 4.06%
$305,000 3.54% 3.62% 3.70% 3.79% 3.88% 3.97%
$310,000 3.46% 3.54% 3.61% 3.70% 3.79% 3.88%
$315,000 3.39% 3.46% 3.53% 3.61% 3.70% 3.79%
$320,000 3.31% 3.39% 3.46% 3.53% 3.61% 3.70%
$325,000 3.23% 3.31% 3.38% 3.46% 3.53% 3.61%
$330,000 3.15% 3.23% 3.30% 3.38% 3.46% 3.54%
$335,000 3.07% 3.15% 3.23% 3.31% 3.38% 3.46%
$340,000 2.99% 3.08% 3.15% 3.23% 3.31% 3.39%
$345,000 2.93% 3.00% 3.08% 3.16% 3.24% 3.32%
$350,000 2.87% 2.94% 3.00% 3.08% 3.16% 3.25%
$355,000 2.82% 2.88% 2.94% 3.01% 3.09% 3.17%
$360,000 2.76% 2.82% 2.88% 2.95% 3.02% 3.10%
$365,000 2.70% 2.76% 2.82% 2.89% 2.95% 3.03%
$370,000 2.64% 2.71% 2.77% 2.83% 2.90% 2.96%
$375,000 2.58% 2.65% 2.71% 2.78% 2.84% 2.91%
$380,000 2.52% 2.59% 2.65% 2.72% 2.79% 2.85%
$385,000 2.46% 2.53% 2.60% 2.66% 2.73% 2.80%
*Percentages to be applied to experience claims below limit, to derive expected claims over limit.
2

The Vermont Health Plan
Q3 2016 Large Group Rating Program Filing
Insured Pooling Charge Factors
Exhibit 2B
Q4 2014 Q1 2015 Q2 2015 Q3 2015 Q4 2015 Q1 2016
Limit
claim*
factor
claim*
factor
claim*
factor
claim*
factor
claim*
factor
claim*
factor
Experience Period Starting Quarter
$390,000 2.40% 2.47% 2.54% 2.61% 2.68% 2.74%
$395,000 2.34% 2.42% 2.48% 2.55% 2.62% 2.69%
$400,000 2.30% 2.36% 2.43% 2.50% 2.57% 2.64%
$405,000 2.25% 2.31% 2.37% 2.44% 2.51% 2.58%
$410,000 2.21% 2.26% 2.31% 2.38% 2.46% 2.53%
$415,000 2.17% 2.22% 2.27% 2.33% 2.40% 2.47%
$420,000 2.13% 2.18% 2.23% 2.28% 2.35% 2.42%
$425,000 2.09% 2.14% 2.19% 2.24% 2.30% 2.37%
$430,000 2.04% 2.10% 2.15% 2.20% 2.26% 2.31%
$435,000 2.00% 2.06% 2.11% 2.16% 2.22% 2.27%
$440,000 1.96% 2.02% 2.07% 2.12% 2.18% 2.23%
$445,000 1.92% 1.98% 2.03% 2.08% 2.14% 2.20%
$450,000 1.88% 1.94% 1.99% 2.05% 2.10% 2.16%
$455,000 1.84% 1.90% 1.95% 2.01% 2.06% 2.12%
$460,000 1.80% 1.85% 1.91% 1.97% 2.02% 2.08%
$465,000 1.76% 1.81% 1.87% 1.93% 1.98% 2.04%
$470,000 1.73% 1.77% 1.83% 1.89% 1.95% 2.00%
$475,000 1.70% 1.74% 1.79% 1.85% 1.91% 1.97%
$480,000 1.67% 1.71% 1.75% 1.81% 1.87% 1.93%
$485,000 1.64% 1.68% 1.72% 1.77% 1.83% 1.89%
$490,000 1.61% 1.65% 1.69% 1.74% 1.79% 1.85%
$495,000 1.58% 1.62% 1.66% 1.71% 1.75% 1.81%
$500,000 1.55% 1.59% 1.64% 1.68% 1.73% 1.77%
$505,000 1.51% 1.56% 1.61% 1.65% 1.70% 1.74%
$510,000 1.48% 1.53% 1.58% 1.62% 1.67% 1.72%
$515,000 1.45% 1.50% 1.55% 1.59% 1.64% 1.69%
$520,000 1.42% 1.47% 1.52% 1.57% 1.61% 1.66%
$525,000 1.39% 1.44% 1.49% 1.54% 1.58% 1.63%
$530,000 1.36% 1.41% 1.46% 1.51% 1.56% 1.60%
$535,000 1.34% 1.38% 1.43% 1.48% 1.53% 1.58%
$540,000 1.32% 1.36% 1.40% 1.45% 1.50% 1.55%
$545,000 1.30% 1.34% 1.37% 1.42% 1.47% 1.52%
$550,000 1.28% 1.31% 1.35% 1.39% 1.44% 1.49%
$555,000 1.25% 1.29% 1.33% 1.36% 1.41% 1.46%
$560,000 1.23% 1.27% 1.31% 1.34% 1.39% 1.44%
$565,000 1.21% 1.25% 1.28% 1.32% 1.36% 1.41%
*Percentages to be applied to experience claims below limit, to derive expected claims over limit.
3
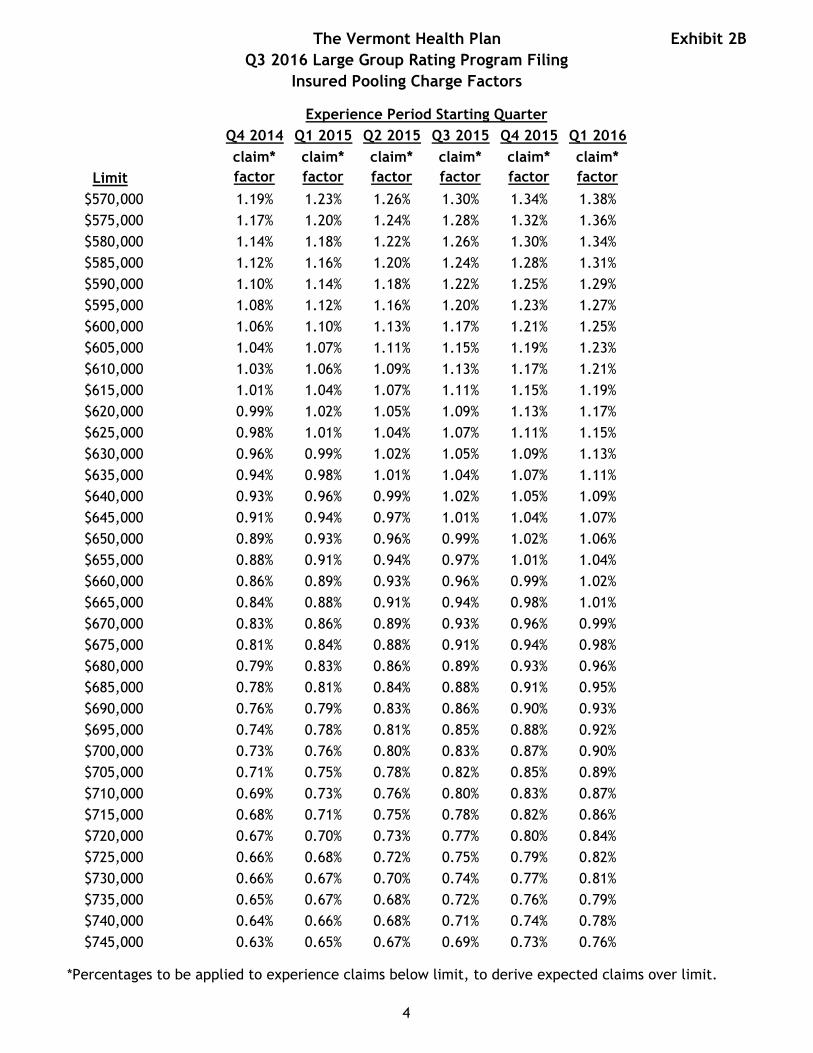
The Vermont Health Plan
Q3 2016 Large Group Rating Program Filing
Insured Pooling Charge Factors
Exhibit 2B
Q4 2014 Q1 2015 Q2 2015 Q3 2015 Q4 2015 Q1 2016
Limit
claim*
factor
claim*
factor
claim*
factor
claim*
factor
claim*
factor
claim*
factor
Experience Period Starting Quarter
$570,000 1.19% 1.23% 1.26% 1.30% 1.34% 1.38%
$575,000 1.17% 1.20% 1.24% 1.28% 1.32% 1.36%
$580,000 1.14% 1.18% 1.22% 1.26% 1.30% 1.34%
$585,000 1.12% 1.16% 1.20% 1.24% 1.28% 1.31%
$590,000 1.10% 1.14% 1.18% 1.22% 1.25% 1.29%
$595,000 1.08% 1.12% 1.16% 1.20% 1.23% 1.27%
$600,000 1.06% 1.10% 1.13% 1.17% 1.21% 1.25%
$605,000 1.04% 1.07% 1.11% 1.15% 1.19% 1.23%
$610,000 1.03% 1.06% 1.09% 1.13% 1.17% 1.21%
$615,000 1.01% 1.04% 1.07% 1.11% 1.15% 1.19%
$620,000 0.99% 1.02% 1.05% 1.09% 1.13% 1.17%
$625,000 0.98% 1.01% 1.04% 1.07% 1.11% 1.15%
$630,000 0.96% 0.99% 1.02% 1.05% 1.09% 1.13%
$635,000 0.94% 0.98% 1.01% 1.04% 1.07% 1.11%
$640,000 0.93% 0.96% 0.99% 1.02% 1.05% 1.09%
$645,000 0.91% 0.94% 0.97% 1.01% 1.04% 1.07%
$650,000 0.89% 0.93% 0.96% 0.99% 1.02% 1.06%
$655,000 0.88% 0.91% 0.94% 0.97% 1.01% 1.04%
$660,000 0.86% 0.89% 0.93% 0.96% 0.99% 1.02%
$665,000 0.84% 0.88% 0.91% 0.94% 0.98% 1.01%
$670,000 0.83% 0.86% 0.89% 0.93% 0.96% 0.99%
$675,000 0.81% 0.84% 0.88% 0.91% 0.94% 0.98%
$680,000 0.79% 0.83% 0.86% 0.89% 0.93% 0.96%
$685,000 0.78% 0.81% 0.84% 0.88% 0.91% 0.95%
$690,000 0.76% 0.79% 0.83% 0.86% 0.90% 0.93%
$695,000 0.74% 0.78% 0.81% 0.85% 0.88% 0.92%
$700,000 0.73% 0.76% 0.80% 0.83% 0.87% 0.90%
$705,000 0.71% 0.75% 0.78% 0.82% 0.85% 0.89%
$710,000 0.69% 0.73% 0.76% 0.80% 0.83% 0.87%
$715,000 0.68% 0.71% 0.75% 0.78% 0.82% 0.86%
$720,000 0.67% 0.70% 0.73% 0.77% 0.80% 0.84%
$725,000 0.66% 0.68% 0.72% 0.75% 0.79% 0.82%
$730,000 0.66% 0.67% 0.70% 0.74% 0.77% 0.81%
$735,000 0.65% 0.67% 0.68% 0.72% 0.76% 0.79%
$740,000 0.64% 0.66% 0.68% 0.71% 0.74% 0.78%
$745,000 0.63% 0.65% 0.67% 0.69% 0.73% 0.76%
*Percentages to be applied to experience claims below limit, to derive expected claims over limit.
4
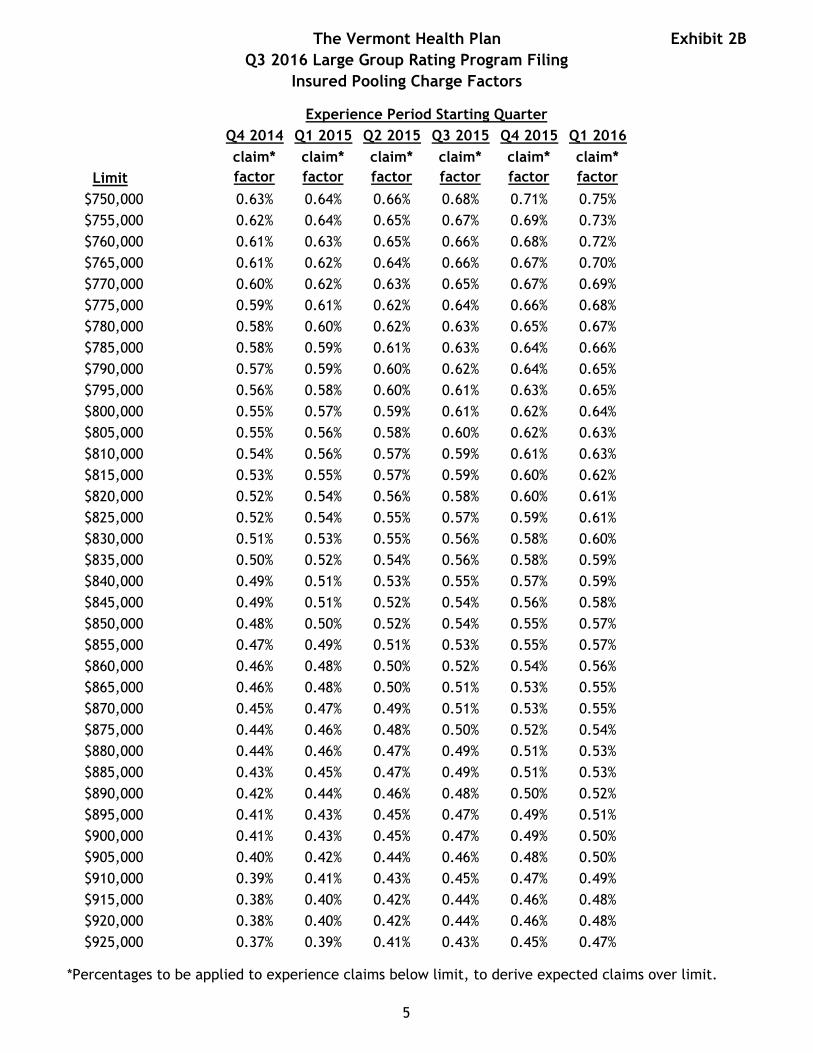
The Vermont Health Plan
Q3 2016 Large Group Rating Program Filing
Insured Pooling Charge Factors
Exhibit 2B
Q4 2014 Q1 2015 Q2 2015 Q3 2015 Q4 2015 Q1 2016
Limit
claim*
factor
claim*
factor
claim*
factor
claim*
factor
claim*
factor
claim*
factor
Experience Period Starting Quarter
$750,000 0.63% 0.64% 0.66% 0.68% 0.71% 0.75%
$755,000 0.62% 0.64% 0.65% 0.67% 0.69% 0.73%
$760,000 0.61% 0.63% 0.65% 0.66% 0.68% 0.72%
$765,000 0.61% 0.62% 0.64% 0.66% 0.67% 0.70%
$770,000 0.60% 0.62% 0.63% 0.65% 0.67% 0.69%
$775,000 0.59% 0.61% 0.62% 0.64% 0.66% 0.68%
$780,000 0.58% 0.60% 0.62% 0.63% 0.65% 0.67%
$785,000 0.58% 0.59% 0.61% 0.63% 0.64% 0.66%
$790,000 0.57% 0.59% 0.60% 0.62% 0.64% 0.65%
$795,000 0.56% 0.58% 0.60% 0.61% 0.63% 0.65%
$800,000 0.55% 0.57% 0.59% 0.61% 0.62% 0.64%
$805,000 0.55% 0.56% 0.58% 0.60% 0.62% 0.63%
$810,000 0.54% 0.56% 0.57% 0.59% 0.61% 0.63%
$815,000 0.53% 0.55% 0.57% 0.59% 0.60% 0.62%
$820,000 0.52% 0.54% 0.56% 0.58% 0.60% 0.61%
$825,000 0.52% 0.54% 0.55% 0.57% 0.59% 0.61%
$830,000 0.51% 0.53% 0.55% 0.56% 0.58% 0.60%
$835,000 0.50% 0.52% 0.54% 0.56% 0.58% 0.59%
$840,000 0.49% 0.51% 0.53% 0.55% 0.57% 0.59%
$845,000 0.49% 0.51% 0.52% 0.54% 0.56% 0.58%
$850,000 0.48% 0.50% 0.52% 0.54% 0.55% 0.57%
$855,000 0.47% 0.49% 0.51% 0.53% 0.55% 0.57%
$860,000 0.46% 0.48% 0.50% 0.52% 0.54% 0.56%
$865,000 0.46% 0.48% 0.50% 0.51% 0.53% 0.55%
$870,000 0.45% 0.47% 0.49% 0.51% 0.53% 0.55%
$875,000 0.44% 0.46% 0.48% 0.50% 0.52% 0.54%
$880,000 0.44% 0.46% 0.47% 0.49% 0.51% 0.53%
$885,000 0.43% 0.45% 0.47% 0.49% 0.51% 0.53%
$890,000 0.42% 0.44% 0.46% 0.48% 0.50% 0.52%
$895,000 0.41% 0.43% 0.45% 0.47% 0.49% 0.51%
$900,000 0.41% 0.43% 0.45% 0.47% 0.49% 0.50%
$905,000 0.40% 0.42% 0.44% 0.46% 0.48% 0.50%
$910,000 0.39% 0.41% 0.43% 0.45% 0.47% 0.49%
$915,000 0.38% 0.40% 0.42% 0.44% 0.46% 0.48%
$920,000 0.38% 0.40% 0.42% 0.44% 0.46% 0.48%
$925,000 0.37% 0.39% 0.41% 0.43% 0.45% 0.47%
*Percentages to be applied to experience claims below limit, to derive expected claims over limit.
5
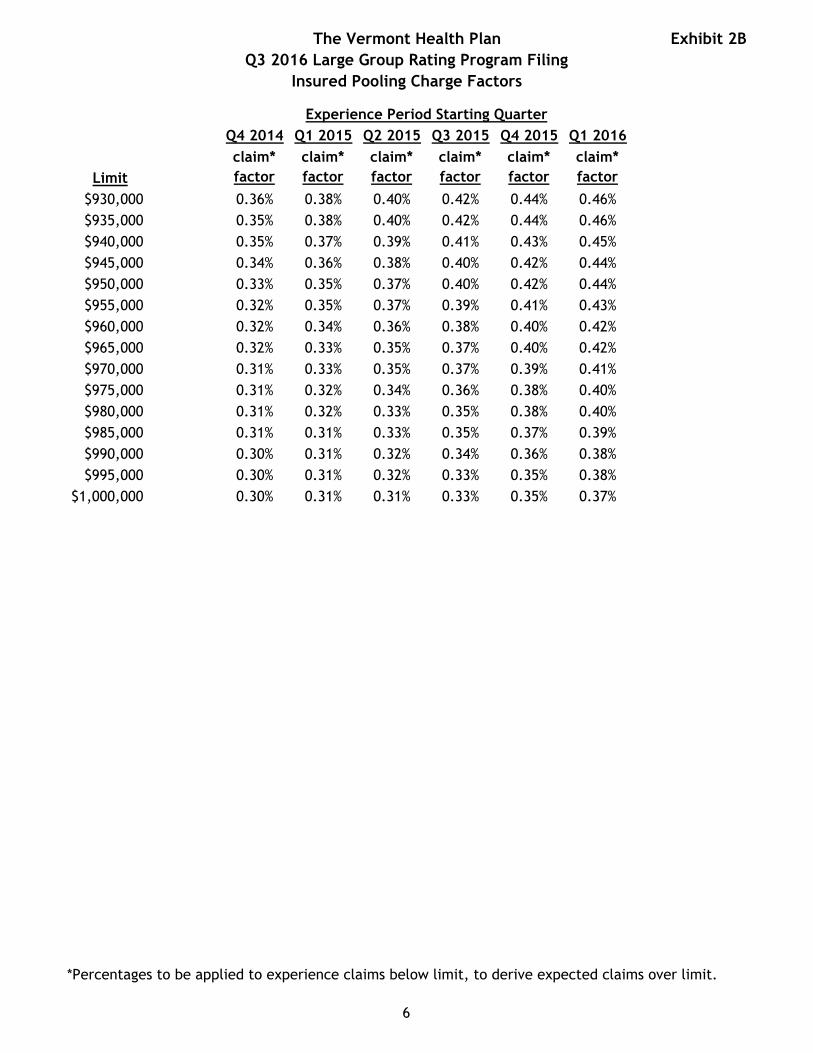
The Vermont Health Plan
Q3 2016 Large Group Rating Program Filing
Insured Pooling Charge Factors
Exhibit 2B
Q4 2014 Q1 2015 Q2 2015 Q3 2015 Q4 2015 Q1 2016
Limit
claim*
factor
claim*
factor
claim*
factor
claim*
factor
claim*
factor
claim*
factor
Experience Period Starting Quarter
$930,000 0.36% 0.38% 0.40% 0.42% 0.44% 0.46%
$935,000 0.35% 0.38% 0.40% 0.42% 0.44% 0.46%
$940,000 0.35% 0.37% 0.39% 0.41% 0.43% 0.45%
$945,000 0.34% 0.36% 0.38% 0.40% 0.42% 0.44%
$950,000 0.33% 0.35% 0.37% 0.40% 0.42% 0.44%
$955,000 0.32% 0.35% 0.37% 0.39% 0.41% 0.43%
$960,000 0.32% 0.34% 0.36% 0.38% 0.40% 0.42%
$965,000 0.32% 0.33% 0.35% 0.37% 0.40% 0.42%
$970,000 0.31% 0.33% 0.35% 0.37% 0.39% 0.41%
$975,000 0.31% 0.32% 0.34% 0.36% 0.38% 0.40%
$980,000 0.31% 0.32% 0.33% 0.35% 0.38% 0.40%
$985,000 0.31% 0.31% 0.33% 0.35% 0.37% 0.39%
$990,000 0.30% 0.31% 0.32% 0.34% 0.36% 0.38%
$995,000 0.30% 0.31% 0.32% 0.33% 0.35% 0.38%
$1,000,000 0.30% 0.31% 0.31% 0.33% 0.35% 0.37%
*Percentages to be applied to experience claims below limit, to derive expected claims over limit.
6
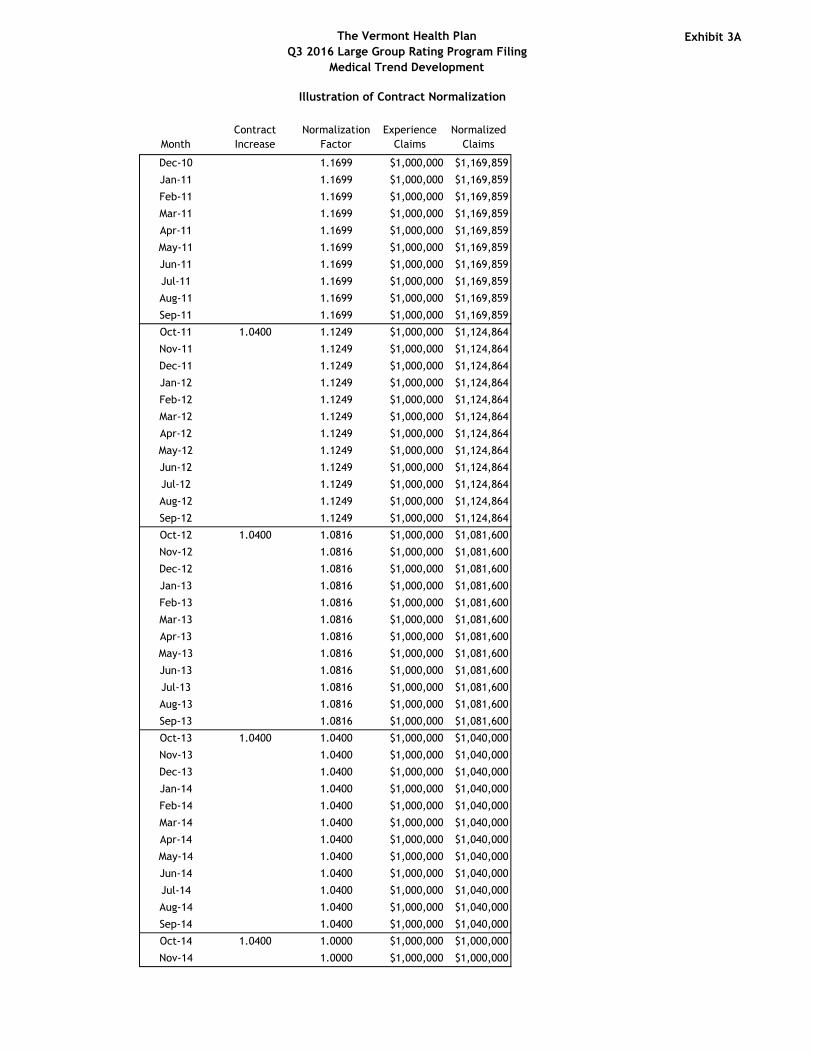
The Vermont Health Plan
Q3 2016 Large Group Rating Program Filing
Medical Trend Development
Exhibit 3A
Illustration of Contract Normalization
Month
Contract
Increase
Normalization
Factor
Experience
Claims
Normalized
Claims
Dec-10 1.1699 $1,000,000 $1,169,859
Jan-11 1.1699 $1,000,000 $1,169,859
Feb-11 1.1699 $1,000,000 $1,169,859
Mar-11 1.1699 $1,000,000 $1,169,859
Apr-11 1.1699 $1,000,000 $1,169,859
May-11 1.1699 $1,000,000 $1,169,859
Jun-11 1.1699 $1,000,000 $1,169,859
Jul-11 1.1699 $1,000,000 $1,169,859
Aug-11 1.1699 $1,000,000 $1,169,859
Sep-11 1.1699 $1,000,000 $1,169,859
Oct-11 1.0400 1.1249 $1,000,000 $1,124,864
Nov-11 1.1249 $1,000,000 $1,124,864
Dec-11 1.1249 $1,000,000 $1,124,864
Jan-12 1.1249 $1,000,000 $1,124,864
Feb-12 1.1249 $1,000,000 $1,124,864
Mar-12 1.1249 $1,000,000 $1,124,864
Apr-12 1.1249 $1,000,000 $1,124,864
May-12 1.1249 $1,000,000 $1,124,864
Jun-12 1.1249 $1,000,000 $1,124,864
Jul-12 1.1249 $1,000,000 $1,124,864
Aug-12 1.1249 $1,000,000 $1,124,864
Sep-12 1.1249 $1,000,000 $1,124,864
Oct-12 1.0400 1.0816 $1,000,000 $1,081,600
Nov-12 1.0816 $1,000,000 $1,081,600
Dec-12 1.0816 $1,000,000 $1,081,600
Jan-13 1.0816 $1,000,000 $1,081,600
Feb-13 1.0816 $1,000,000 $1,081,600
Mar-13 1.0816 $1,000,000 $1,081,600
Apr-13 1.0816 $1,000,000 $1,081,600
May-13 1.0816 $1,000,000 $1,081,600
Jun-13 1.0816 $1,000,000 $1,081,600
Jul-13 1.0816 $1,000,000 $1,081,600
Aug-13 1.0816 $1,000,000 $1,081,600
Sep-13 1.0816 $1,000,000 $1,081,600
Oct-13 1.0400 1.0400 $1,000,000 $1,040,000
Nov-13 1.0400 $1,000,000 $1,040,000
Dec-13 1.0400 $1,000,000 $1,040,000
Jan-14 1.0400 $1,000,000 $1,040,000
Feb-14 1.0400 $1,000,000 $1,040,000
Mar-14 1.0400 $1,000,000 $1,040,000
Apr-14 1.0400 $1,000,000 $1,040,000
May-14 1.0400 $1,000,000 $1,040,000
Jun-14 1.0400 $1,000,000 $1,040,000
Jul-14 1.0400 $1,000,000 $1,040,000
Aug-14 1.0400 $1,000,000 $1,040,000
Sep-14 1.0400 $1,000,000 $1,040,000
Oct-14 1.0400 1.0000 $1,000,000 $1,000,000
Nov-14 1.0000 $1,000,000 $1,000,000
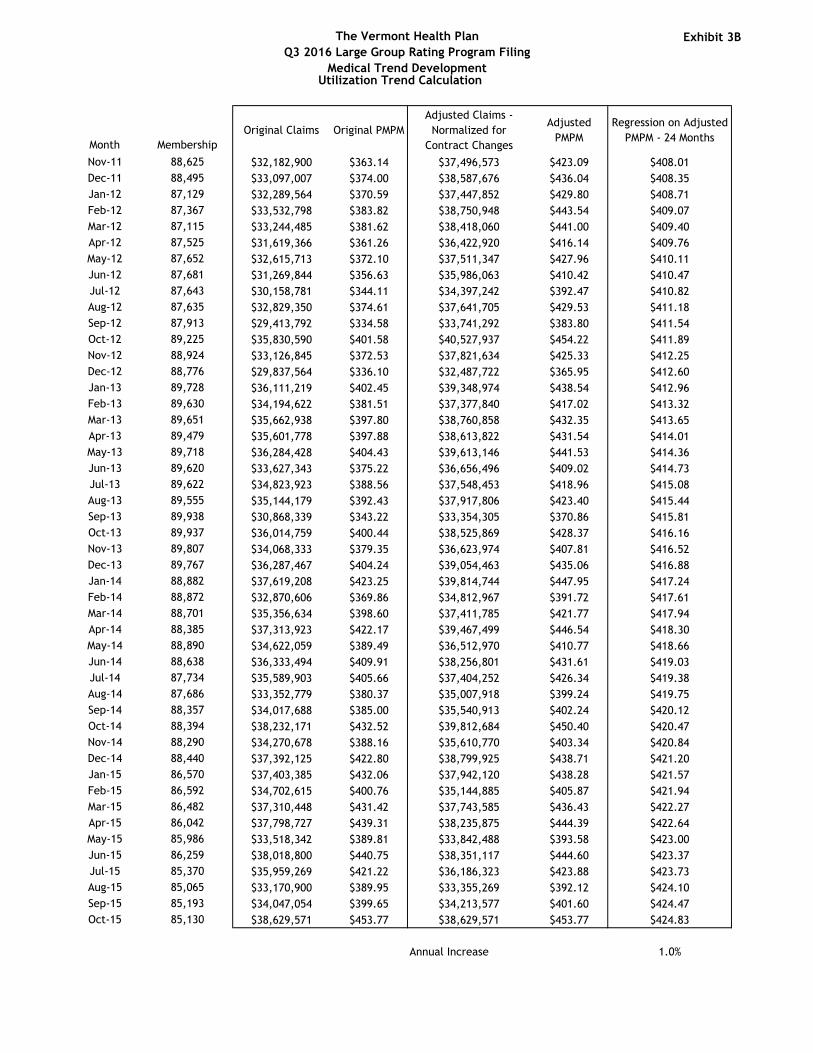
The Vermont Health Plan
Q3 2016 Large Group Rating Program Filing
Medical Trend Development
Exhibit 3B
Utilization Trend Calculation
Month Membership
Original Claims Original PMPM
Adjusted Claims -
Normalized for
Contract Changes
Adjusted
PMPM
Regression on Adjusted
PMPM - 24 Months
Nov-11 88,625 $32,182,900 $363.14 $37,496,573 $423.09 $408.01
Dec-11 88,495 $33,097,007 $374.00 $38,587,676 $436.04 $408.35
Jan-12 87,129 $32,289,564 $370.59 $37,447,852 $429.80 $408.71
Feb-12 87,367 $33,532,798 $383.82 $38,750,948 $443.54 $409.07
Mar-12 87,115 $33,244,485 $381.62 $38,418,060 $441.00 $409.40
Apr-12 87,525 $31,619,366 $361.26 $36,422,920 $416.14 $409.76
May-12 87,652 $32,615,713 $372.10 $37,511,347 $427.96 $410.11
Jun-12 87,681 $31,269,844 $356.63 $35,986,063 $410.42 $410.47
Jul-12 87,643 $30,158,781 $344.11 $34,397,242 $392.47 $410.82
Aug-12 87,635 $32,829,350 $374.61 $37,641,705 $429.53 $411.18
Sep-12 87,913 $29,413,792 $334.58 $33,741,292 $383.80 $411.54
Oct-12 89,225 $35,830,590 $401.58 $40,527,937 $454.22 $411.89
Nov-12 88,924 $33,126,845 $372.53 $37,821,634 $425.33 $412.25
Dec-12 88,776 $29,837,564 $336.10 $32,487,722 $365.95 $412.60
Jan-13 89,728 $36,111,219 $402.45 $39,348,974 $438.54 $412.96
Feb-13 89,630 $34,194,622 $381.51 $37,377,840 $417.02 $413.32
Mar-13 89,651 $35,662,938 $397.80 $38,760,858 $432.35 $413.65
Apr-13 89,479 $35,601,778 $397.88 $38,613,822 $431.54 $414.01
May-13 89,718 $36,284,428 $404.43 $39,613,146 $441.53 $414.36
Jun-13 89,620 $33,627,343 $375.22 $36,656,496 $409.02 $414.73
Jul-13 89,622 $34,823,923 $388.56 $37,548,453 $418.96 $415.08
Aug-13 89,555 $35,144,179 $392.43 $37,917,806 $423.40 $415.44
Sep-13 89,938 $30,868,339 $343.22 $33,354,305 $370.86 $415.81
Oct-13 89,937 $36,014,759 $400.44 $38,525,869 $428.37 $416.16
Nov-13 89,807 $34,068,333 $379.35 $36,623,974 $407.81 $416.52
Dec-13 89,767 $36,287,467 $404.24 $39,054,463 $435.06 $416.88
Jan-14 88,882 $37,619,208 $423.25 $39,814,744 $447.95 $417.24
Feb-14 88,872 $32,870,606 $369.86 $34,812,967 $391.72 $417.61
Mar-14 88,701 $35,356,634 $398.60 $37,411,785 $421.77 $417.94
Apr-14 88,385 $37,313,923 $422.17 $39,467,499 $446.54 $418.30
May-14 88,890 $34,622,059 $389.49 $36,512,970 $410.77 $418.66
Jun-14 88,638 $36,333,494 $409.91 $38,256,801 $431.61 $419.03
Jul-14 87,734 $35,589,903 $405.66 $37,404,252 $426.34 $419.38
Aug-14 87,686 $33,352,779 $380.37 $35,007,918 $399.24 $419.75
Sep-14 88,357 $34,017,688 $385.00 $35,540,913 $402.24 $420.12
Oct-14 88,394 $38,232,171 $432.52 $39,812,684 $450.40 $420.47
Nov-14 88,290 $34,270,678 $388.16 $35,610,770 $403.34 $420.84
Dec-14 88,440 $37,392,125 $422.80 $38,799,925 $438.71 $421.20
Jan-15 86,570 $37,403,385 $432.06 $37,942,120 $438.28 $421.57
Feb-15 86,592 $34,702,615 $400.76 $35,144,885 $405.87 $421.94
Mar-15 86,482 $37,310,448 $431.42 $37,743,585 $436.43 $422.27
Apr-15 86,042 $37,798,727 $439.31 $38,235,875 $444.39 $422.64
May-15 85,986 $33,518,342 $389.81 $33,842,488 $393.58 $423.00
Jun-15 86,259 $38,018,800 $440.75 $38,351,117 $444.60 $423.37
Jul-15 85,370 $35,959,269 $421.22 $36,186,323 $423.88 $423.73
Aug-15 85,065 $33,170,900 $389.95 $33,355,269 $392.12 $424.10
Sep-15 85,193 $34,047,054 $399.65 $34,213,577 $401.60 $424.47
Oct-15 85,130 $38,629,571 $453.77 $38,629,571 $453.77 $424.83
Annual Increase 1.0%
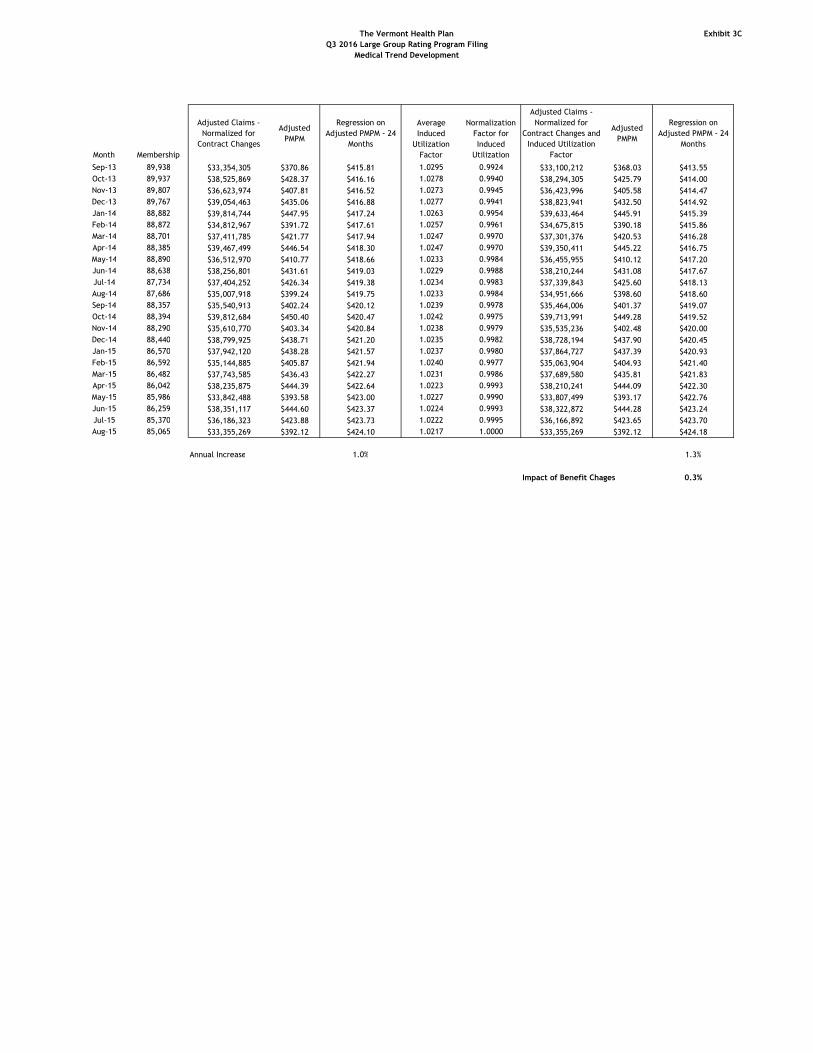
The Vermont Health Plan
Q3 2016 Large Group Rating Program Filing
Medical Trend Development
Exhibit 3C
Month Membership
Adjusted Claims -
Normalized for
Contract Changes
Adjusted
PMPM
Regression on
Adjusted PMPM - 24
Months
Average
Induced
Utilization
Factor
Normalization
Factor for
Induced
Utilization
Adjusted Claims -
Normalized for
Contract Changes and
Induced Utilization
Factor
Adjusted
PMPM
Regression on
Adjusted PMPM - 24
Months
Sep-13 89,938 $33,354,305 $370.86 $415.81 1.0295 0.9924 $33,100,212 $368.03 $413.55
Oct-13 89,937 $38,525,869 $428.37 $416.16 1.0278 0.9940 $38,294,305 $425.79 $414.00
Nov-13 89,807 $36,623,974 $407.81 $416.52 1.0273 0.9945 $36,423,996 $405.58 $414.47
Dec-13 89,767 $39,054,463 $435.06 $416.88 1.0277 0.9941 $38,823,941 $432.50 $414.92
Jan-14 88,882 $39,814,744 $447.95 $417.24 1.0263 0.9954 $39,633,464 $445.91 $415.39
Feb-14 88,872 $34,812,967 $391.72 $417.61 1.0257 0.9961 $34,675,815 $390.18 $415.86
Mar-14 88,701 $37,411,785 $421.77 $417.94 1.0247 0.9970 $37,301,376 $420.53 $416.28
Apr-14 88,385 $39,467,499 $446.54 $418.30 1.0247 0.9970 $39,350,411 $445.22 $416.75
May-14 88,890 $36,512,970 $410.77 $418.66 1.0233 0.9984 $36,455,955 $410.12 $417.20
Jun-14 88,638 $38,256,801 $431.61 $419.03 1.0229 0.9988 $38,210,244 $431.08 $417.67
Jul-14 87,734 $37,404,252 $426.34 $419.38 1.0234 0.9983 $37,339,843 $425.60 $418.13
Aug-14 87,686 $35,007,918 $399.24 $419.75 1.0233 0.9984 $34,951,666 $398.60 $418.60
Sep-14 88,357 $35,540,913 $402.24 $420.12 1.0239 0.9978 $35,464,006 $401.37 $419.07
Oct-14 88,394 $39,812,684 $450.40 $420.47 1.0242 0.9975 $39,713,991 $449.28 $419.52
Nov-14 88,290 $35,610,770 $403.34 $420.84 1.0238 0.9979 $35,535,236 $402.48 $420.00
Dec-14 88,440 $38,799,925 $438.71 $421.20 1.0235 0.9982 $38,728,194 $437.90 $420.45
Jan-15 86,570 $37,942,120 $438.28 $421.57 1.0237 0.9980 $37,864,727 $437.39 $420.93
Feb-15 86,592 $35,144,885 $405.87 $421.94 1.0240 0.9977 $35,063,904 $404.93 $421.40
Mar-15 86,482 $37,743,585 $436.43 $422.27 1.0231 0.9986 $37,689,580 $435.81 $421.83
Apr-15 86,042 $38,235,875 $444.39 $422.64 1.0223 0.9993 $38,210,241 $444.09 $422.30
May-15 85,986 $33,842,488 $393.58 $423.00 1.0227 0.9990 $33,807,499 $393.17 $422.76
Jun-15 86,259 $38,351,117 $444.60 $423.37 1.0224 0.9993 $38,322,872 $444.28 $423.24
Jul-15 85,370 $36,186,323 $423.88 $423.73 1.0222 0.9995 $36,166,892 $423.65 $423.70
Aug-15 85,065 $33,355,269 $392.12 $424.10 1.0217 1.0000 $33,355,269 $392.12 $424.18
Annual Increase 1.0% 1.3%
Impact of Benefit Chages 0.3%
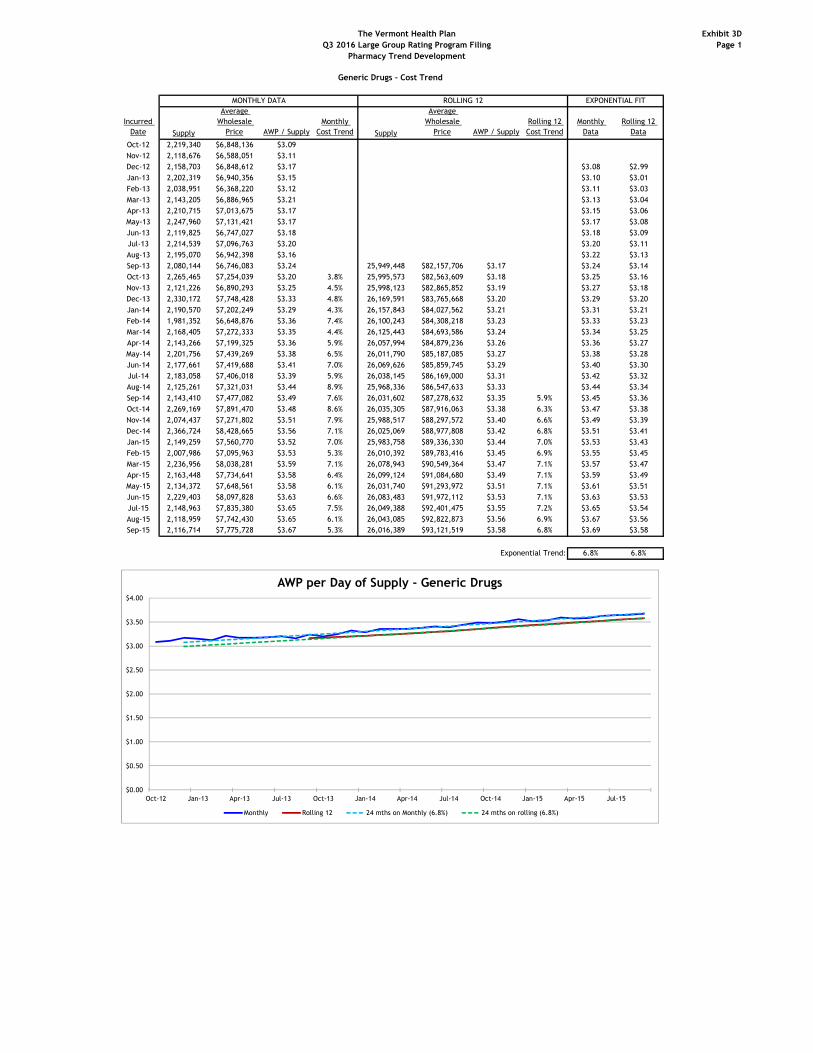
The Vermont Health Plan
Q3 2016 Large Group Rating Program Filing
Pharmacy Trend Development
Exhibit 3D
Page 1
Generic Drugs - Cost Trend
Incurred
Date Supply
Average
Wholesale
Price AWP / Supply
Monthly
Cost Trend Supply
Average
Wholesale
Price AWP / Supply
Rolling 12
Cost Trend
Monthly
Data
Rolling 12
Data
Oct-12 2,219,340 $6,848,136 $3.09
Nov-12 2,118,676 $6,588,051 $3.11
Dec-12 2,158,703 $6,848,612 $3.17 $3.08 $2.99
Jan-13 2,202,319 $6,940,356 $3.15 $3.10 $3.01
Feb-13 2,038,951 $6,368,220 $3.12 $3.11 $3.03
Mar-13 2,143,205 $6,886,965 $3.21 $3.13 $3.04
Apr-13 2,210,715 $7,013,675 $3.17 $3.15 $3.06
May-13 2,247,960 $7,131,421 $3.17 $3.17 $3.08
Jun-13 2,119,825 $6,747,027 $3.18 $3.18 $3.09
Jul-13 2,214,539 $7,096,763 $3.20 $3.20 $3.11
Aug-13 2,195,070 $6,942,398 $3.16 $3.22 $3.13
Sep-13 2,080,144 $6,746,083 $3.24 25,949,448 $82,157,706 $3.17 $3.24 $3.14
Oct-13 2,265,465 $7,254,039 $3.20 3.8% 25,995,573 $82,563,609 $3.18 $3.25 $3.16
Nov-13 2,121,226 $6,890,293 $3.25 4.5% 25,998,123 $82,865,852 $3.19 $3.27 $3.18
Dec-13 2,330,172 $7,748,428 $3.33 4.8% 26,169,591 $83,765,668 $3.20 $3.29 $3.20
Jan-14 2,190,570 $7,202,249 $3.29 4.3% 26,157,843 $84,027,562 $3.21 $3.31 $3.21
Feb-14 1,981,352 $6,648,876 $3.36 7.4% 26,100,243 $84,308,218 $3.23 $3.33 $3.23
Mar-14 2,168,405 $7,272,333 $3.35 4.4% 26,125,443 $84,693,586 $3.24 $3.34 $3.25
Apr-14 2,143,266 $7,199,325 $3.36 5.9% 26,057,994 $84,879,236 $3.26 $3.36 $3.27
May-14 2,201,756 $7,439,269 $3.38 6.5% 26,011,790 $85,187,085 $3.27 $3.38 $3.28
Jun-14 2,177,661 $7,419,688 $3.41 7.0% 26,069,626 $85,859,745 $3.29 $3.40 $3.30
Jul-14 2,183,058 $7,406,018 $3.39 5.9% 26,038,145 $86,169,000 $3.31 $3.42 $3.32
Aug-14 2,125,261 $7,321,031 $3.44 8.9% 25,968,336 $86,547,633 $3.33 $3.44 $3.34
Sep-14 2,143,410 $7,477,082 $3.49 7.6% 26,031,602 $87,278,632 $3.35 5.9% $3.45 $3.36
Oct-14 2,269,169 $7,891,470 $3.48 8.6% 26,035,305 $87,916,063 $3.38 6.3% $3.47 $3.38
Nov-14 2,074,437 $7,271,802 $3.51 7.9% 25,988,517 $88,297,572 $3.40 6.6% $3.49 $3.39
Dec-14 2,366,724 $8,428,665 $3.56 7.1% 26,025,069 $88,977,808 $3.42 6.8% $3.51 $3.41
Jan-15 2,149,259 $7,560,770 $3.52 7.0% 25,983,758 $89,336,330 $3.44 7.0% $3.53 $3.43
Feb-15 2,007,986 $7,095,963 $3.53 5.3% 26,010,392 $89,783,416 $3.45 6.9% $3.55 $3.45
Mar-15 2,236,956 $8,038,281 $3.59 7.1% 26,078,943 $90,549,364 $3.47 7.1% $3.57 $3.47
Apr-15 2,163,448 $7,734,641 $3.58 6.4% 26,099,124 $91,084,680 $3.49 7.1% $3.59 $3.49
May-15 2,134,372 $7,648,561 $3.58 6.1% 26,031,740 $91,293,972 $3.51 7.1% $3.61 $3.51
Jun-15 2,229,403 $8,097,828 $3.63 6.6% 26,083,483 $91,972,112 $3.53 7.1% $3.63 $3.53
Jul-15 2,148,963 $7,835,380 $3.65 7.5% 26,049,388 $92,401,475 $3.55 7.2% $3.65 $3.54
Aug-15 2,118,959 $7,742,430 $3.65 6.1% 26,043,085 $92,822,873 $3.56 6.9% $3.67 $3.56
Sep-15 2,116,714 $7,775,728 $3.67 5.3% 26,016,389 $93,121,519 $3.58 6.8% $3.69 $3.58
Exponential Trend: 6.8% 6.8%
MONTHLY DATA ROLLING 12 EXPONENTIAL FIT
$0.00
$0.50
$1.00
$1.50
$2.00
$2.50
$3.00
$3.50
$4.00
Oct-12 Jan-13 Apr-13 Jul-13 Oct-13 Jan-14 Apr-14 Jul-14 Oct-14 Jan-15 Apr-15 Jul-15
AWP per Day of Supply - Generic Drugs
Monthly Rolling 12 24 mths on Monthly (6.8%) 24 mths on rolling (6.8%)
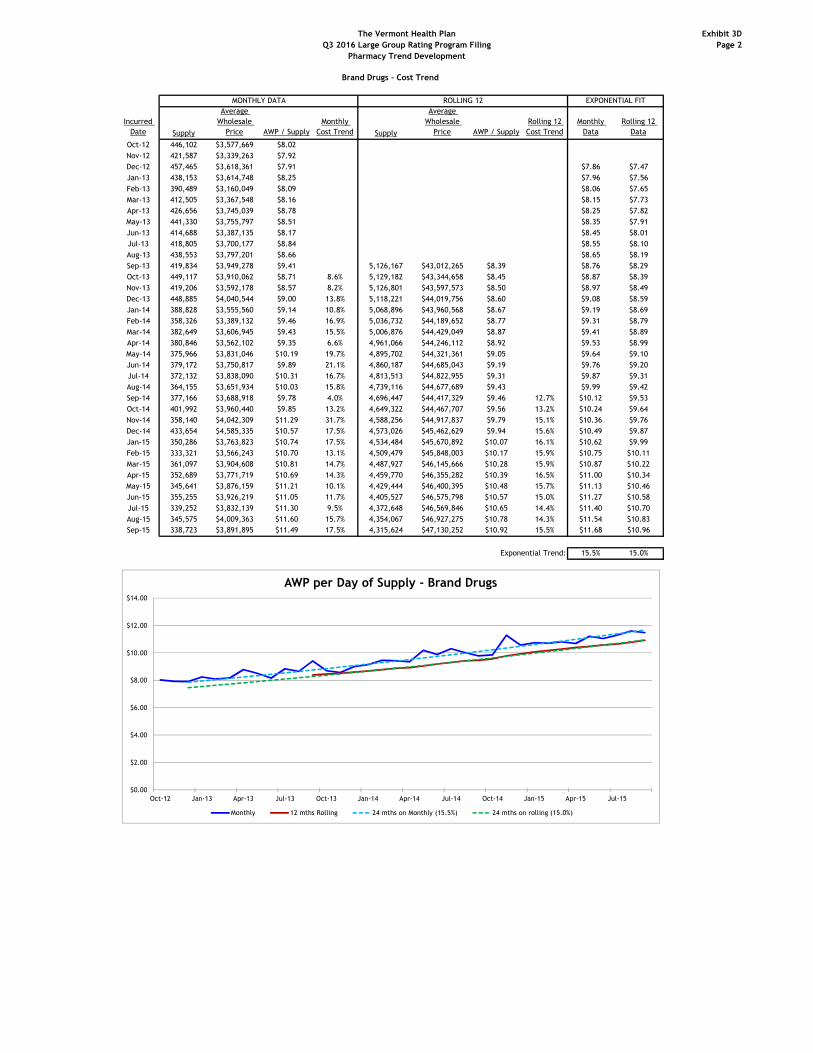
The Vermont Health Plan
Q3 2016 Large Group Rating Program Filing
Pharmacy Trend Development
Exhibit 3D
Page 2
Brand Drugs - Cost Trend
Incurred
Date Supply
Average
Wholesale
Price AWP / Supply
Monthly
Cost Trend Supply
Average
Wholesale
Price AWP / Supply
Rolling 12
Cost Trend
Monthly
Data
Rolling 12
Data
Oct-12 446,102 $3,577,669 $8.02
Nov-12 421,587 $3,339,263 $7.92
Dec-12 457,465 $3,618,361 $7.91 $7.86 $7.47
Jan-13 438,153 $3,614,748 $8.25 $7.96 $7.56
Feb-13 390,489 $3,160,049 $8.09 $8.06 $7.65
Mar-13 412,505 $3,367,548 $8.16 $8.15 $7.73
Apr-13 426,656 $3,745,039 $8.78 $8.25 $7.82
May-13 441,330 $3,755,797 $8.51 $8.35 $7.91
Jun-13 414,688 $3,387,135 $8.17 $8.45 $8.01
Jul-13 418,805 $3,700,177 $8.84 $8.55 $8.10
Aug-13 438,553 $3,797,201 $8.66 $8.65 $8.19
Sep-13 419,834 $3,949,278 $9.41 5,126,167 $43,012,265 $8.39 $8.76 $8.29
Oct-13 449,117 $3,910,062 $8.71 8.6% 5,129,182 $43,344,658 $8.45 $8.87 $8.39
Nov-13 419,206 $3,592,178 $8.57 8.2% 5,126,801 $43,597,573 $8.50 $8.97 $8.49
Dec-13 448,885 $4,040,544 $9.00 13.8% 5,118,221 $44,019,756 $8.60 $9.08 $8.59
Jan-14 388,828 $3,555,560 $9.14 10.8% 5,068,896 $43,960,568 $8.67 $9.19 $8.69
Feb-14 358,326 $3,389,132 $9.46 16.9% 5,036,732 $44,189,652 $8.77 $9.31 $8.79
Mar-14 382,649 $3,606,945 $9.43 15.5% 5,006,876 $44,429,049 $8.87 $9.41 $8.89
Apr-14 380,846 $3,562,102 $9.35 6.6% 4,961,066 $44,246,112 $8.92 $9.53 $8.99
May-14 375,966 $3,831,046 $10.19 19.7% 4,895,702 $44,321,361 $9.05 $9.64 $9.10
Jun-14 379,172 $3,750,817 $9.89 21.1% 4,860,187 $44,685,043 $9.19 $9.76 $9.20
Jul-14 372,132 $3,838,090 $10.31 16.7% 4,813,513 $44,822,955 $9.31 $9.87 $9.31
Aug-14 364,155 $3,651,934 $10.03 15.8% 4,739,116 $44,677,689 $9.43 $9.99 $9.42
Sep-14 377,166 $3,688,918 $9.78 4.0% 4,696,447 $44,417,329 $9.46 12.7% $10.12 $9.53
Oct-14 401,992 $3,960,440 $9.85 13.2% 4,649,322 $44,467,707 $9.56 13.2% $10.24 $9.64
Nov-14 358,140 $4,042,309 $11.29 31.7% 4,588,256 $44,917,837 $9.79 15.1% $10.36 $9.76
Dec-14 433,654 $4,585,335 $10.57 17.5% 4,573,026 $45,462,629 $9.94 15.6% $10.49 $9.87
Jan-15 350,286 $3,763,823 $10.74 17.5% 4,534,484 $45,670,892 $10.07 16.1% $10.62 $9.99
Feb-15 333,321 $3,566,243 $10.70 13.1% 4,509,479 $45,848,003 $10.17 15.9% $10.75 $10.11
Mar-15 361,097 $3,904,608 $10.81 14.7% 4,487,927 $46,145,666 $10.28 15.9% $10.87 $10.22
Apr-15 352,689 $3,771,719 $10.69 14.3% 4,459,770 $46,355,282 $10.39 16.5% $11.00 $10.34
May-15 345,641 $3,876,159 $11.21 10.1% 4,429,444 $46,400,395 $10.48 15.7% $11.13 $10.46
Jun-15 355,255 $3,926,219 $11.05 11.7% 4,405,527 $46,575,798 $10.57 15.0% $11.27 $10.58
Jul-15 339,252 $3,832,139 $11.30 9.5% 4,372,648 $46,569,846 $10.65 14.4% $11.40 $10.70
Aug-15 345,575 $4,009,363 $11.60 15.7% 4,354,067 $46,927,275 $10.78 14.3% $11.54 $10.83
Sep-15 338,723 $3,891,895 $11.49 17.5% 4,315,624 $47,130,252 $10.92 15.5% $11.68 $10.96
Exponential Trend: 15.5% 15.0%
MONTHLY DATA ROLLING 12 EXPONENTIAL FIT
$0.00
$2.00
$4.00
$6.00
$8.00
$10.00
$12.00
$14.00
Oct-12 Jan-13 Apr-13 Jul-13 Oct-13 Jan-14 Apr-14 Jul-14 Oct-14 Jan-15 Apr-15 Jul-15
AWP per Day of Supply - Brand Drugs
Monthly 12 mths Rolling 24 mths on Monthly (15.5%) 24 mths on rolling (15.0%)
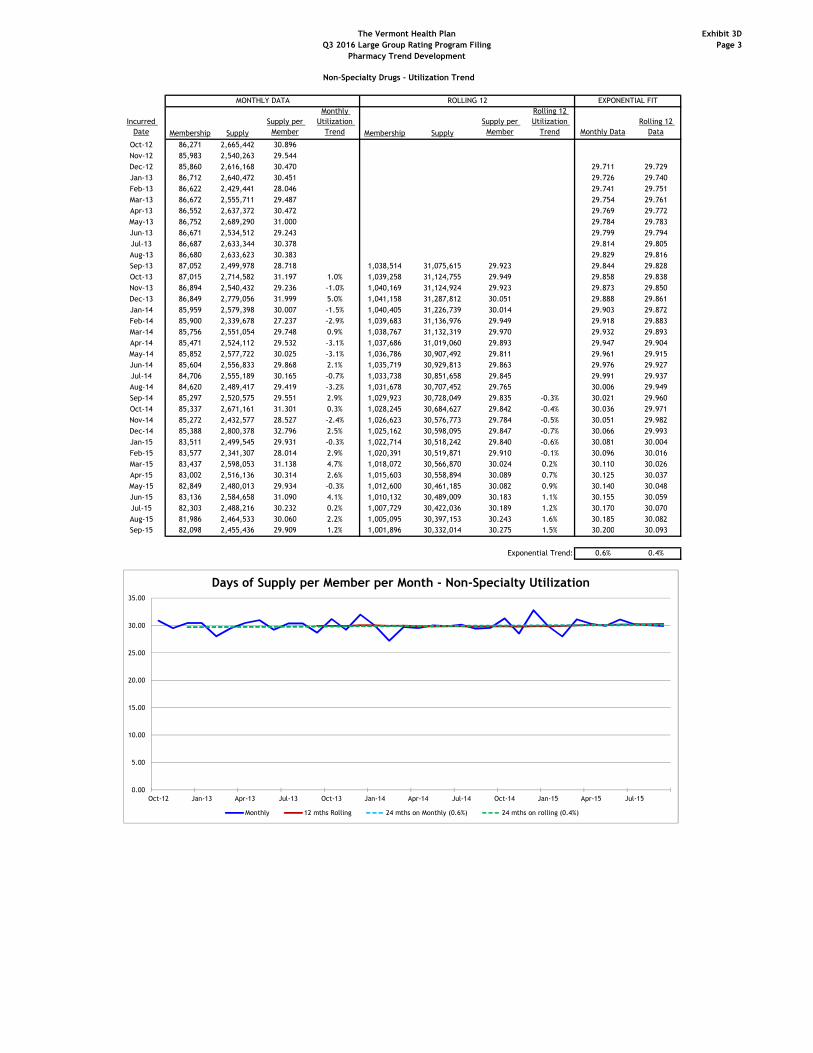
The Vermont Health Plan
Q3 2016 Large Group Rating Program Filing
Pharmacy Trend Development
Exhibit 3D
Page 3
Non-Specialty Drugs - Utilization Trend
Incurred
Date Membership Supply
Supply per
Member
Monthly
Utilization
Trend Membership Supply
Supply per
Member
Rolling 12
Utilization
Trend Monthly Data
Rolling 12
Data
Oct-12 86,271 2,665,442 30.896
Nov-12 85,983 2,540,263 29.544
Dec-12 85,860 2,616,168 30.470 29.711 29.729
Jan-13 86,712 2,640,472 30.451 29.726 29.740
Feb-13 86,622 2,429,441 28.046 29.741 29.751
Mar-13 86,672 2,555,711 29.487 29.754 29.761
Apr-13 86,552 2,637,372 30.472 29.769 29.772
May-13 86,752 2,689,290 31.000 29.784 29.783
Jun-13 86,671 2,534,512 29.243 29.799 29.794
Jul-13 86,687 2,633,344 30.378 29.814 29.805
Aug-13 86,680 2,633,623 30.383 29.829 29.816
Sep-13 87,052 2,499,978 28.718 1,038,514 31,075,615 29.923 29.844 29.828
Oct-13 87,015 2,714,582 31.197 1.0% 1,039,258 31,124,755 29.949 29.858 29.838
Nov-13 86,894 2,540,432 29.236 -1.0% 1,040,169 31,124,924 29.923 29.873 29.850
Dec-13 86,849 2,779,056 31.999 5.0% 1,041,158 31,287,812 30.051 29.888 29.861
Jan-14 85,959 2,579,398 30.007 -1.5% 1,040,405 31,226,739 30.014 29.903 29.872
Feb-14 85,900 2,339,678 27.237 -2.9% 1,039,683 31,136,976 29.949 29.918 29.883
Mar-14 85,756 2,551,054 29.748 0.9% 1,038,767 31,132,319 29.970 29.932 29.893
Apr-14 85,471 2,524,112 29.532 -3.1% 1,037,686 31,019,060 29.893 29.947 29.904
May-14 85,852 2,577,722 30.025 -3.1% 1,036,786 30,907,492 29.811 29.961 29.915
Jun-14 85,604 2,556,833 29.868 2.1% 1,035,719 30,929,813 29.863 29.976 29.927
Jul-14 84,706 2,555,189 30.165 -0.7% 1,033,738 30,851,658 29.845 29.991 29.937
Aug-14 84,620 2,489,417 29.419 -3.2% 1,031,678 30,707,452 29.765 30.006 29.949
Sep-14 85,297 2,520,575 29.551 2.9% 1,029,923 30,728,049 29.835 -0.3% 30.021 29.960
Oct-14 85,337 2,671,161 31.301 0.3% 1,028,245 30,684,627 29.842 -0.4% 30.036 29.971
Nov-14 85,272 2,432,577 28.527 -2.4% 1,026,623 30,576,773 29.784 -0.5% 30.051 29.982
Dec-14 85,388 2,800,378 32.796 2.5% 1,025,162 30,598,095 29.847 -0.7% 30.066 29.993
Jan-15 83,511 2,499,545 29.931 -0.3% 1,022,714 30,518,242 29.840 -0.6% 30.081 30.004
Feb-15 83,577 2,341,307 28.014 2.9% 1,020,391 30,519,871 29.910 -0.1% 30.096 30.016
Mar-15 83,437 2,598,053 31.138 4.7% 1,018,072 30,566,870 30.024 0.2% 30.110 30.026
Apr-15 83,002 2,516,136 30.314 2.6% 1,015,603 30,558,894 30.089 0.7% 30.125 30.037
May-15 82,849 2,480,013 29.934 -0.3% 1,012,600 30,461,185 30.082 0.9% 30.140 30.048
Jun-15 83,136 2,584,658 31.090 4.1% 1,010,132 30,489,009 30.183 1.1% 30.155 30.059
Jul-15 82,303 2,488,216 30.232 0.2% 1,007,729 30,422,036 30.189 1.2% 30.170 30.070
Aug-15 81,986 2,464,533 30.060 2.2% 1,005,095 30,397,153 30.243 1.6% 30.185 30.082
Sep-15 82,098 2,455,436 29.909 1.2% 1,001,896 30,332,014 30.275 1.5% 30.200 30.093
Exponential Trend: 0.6% 0.4%
MONTHLY DATA ROLLING 12 EXPONENTIAL FIT
0.00
5.00
10.00
15.00
20.00
25.00
30.00
35.00
Oct-12 Jan-13 Apr-13 Jul-13 Oct-13 Jan-14 Apr-14 Jul-14 Oct-14 Jan-15 Apr-15 Jul-15
Days of Supply per Member per Month - Non-Specialty Utilization
Monthly 12 mths Rolling 24 mths on Monthly (0.6%) 24 mths on rolling (0.4%)

The Vermont Health Plan
Q3 2016 Large Group Rating Program Filing
Pharmacy Trend Development
Exhibit 3E
Month
Generic
Supply
Brand
Supply
Total Non-
Specialty
Supply Monthly Rolling 12
Nov-13 2,121,226 419,206 2,540,432 83.5%
Dec-13 2,330,172 448,885 2,779,056 83.8%
Jan-14 2,190,570 388,828 2,579,398 84.9%
Feb-14 1,981,352 358,326 2,339,678 84.7%
Mar-14 2,168,405 382,649 2,551,054 85.0%
Apr-14 2,143,266 380,846 2,524,112 84.9%
May-14 2,201,756 375,966 2,577,722 85.4%
Jun-14 2,177,661 379,172 2,556,833 85.2%
Jul-14 2,183,058 372,132 2,555,189 85.4%
Aug-14 2,125,261 364,155 2,489,417 85.4%
Sep-14 2,143,410 377,166 2,520,575 85.0%
Oct-14 2,269,169 401,992 2,671,161 85.0% 84.8%
Nov-14 2,074,437 358,140 2,432,577 85.3% 85.0%
Dec-14 2,366,724 433,654 2,800,378 84.5% 85.1%
Jan-15 2,149,259 350,286 2,499,545 86.0% 85.1%
Feb-15 2,007,986 333,321 2,341,307 85.8% 85.2%
Mar-15 2,236,956 361,097 2,598,053 86.1% 85.3%
Apr-15 2,163,448 352,689 2,516,136 86.0% 85.4%
May-15 2,134,372 345,641 2,480,013 86.1% 85.5%
Jun-15 2,229,403 355,255 2,584,658 86.3% 85.6%
Jul-15 2,148,963 339,252 2,488,216 86.4% 85.6%
Aug-15 2,118,959 345,575 2,464,533 86.0% 85.7%
Sep-15 2,116,714 338,723 2,455,436 86.2% 85.8%
Oct-15 2,313,245 382,030 2,695,276 85.8% 85.8%
Nov-15 2,097,548 334,214 2,431,762 86.3% 85.9%
Dec-15 2,391,731 409,697 2,801,428 85.4% 86.0%
Jan-16 2,165,232 333,576 2,498,807 86.7% 86.1%
Feb-16 2,019,812 320,030 2,339,842 86.3% 86.1%
Mar-16 2,250,298 348,339 2,598,638 86.6% 86.1%
Apr-16 2,175,536 340,615 2,516,151 86.5% 86.2%
May-16 2,161,947 320,339 2,482,285 87.1% 86.3%
Jun-16 2,258,590 326,336 2,584,926 87.4% 86.4%
Jul-16 2,175,253 312,688 2,487,940 87.4% 86.5%
Aug-16 2,144,538 320,246 2,464,784 87.0% 86.5%
Sep-16 2,142,775 312,360 2,455,136 87.3% 86.6%
Oct-16 2,347,186 347,243 2,694,430 87.1% 86.7%
Nov-16 2,120,832 310,930 2,431,762 87.2% 86.8%
Dec-16 2,440,669 360,758 2,801,428 87.1% 87.0%
Jan-17 2,206,621 292,187 2,498,807 88.3% 87.1%
Feb-17 2,063,242 276,599 2,339,842 88.2% 87.3%
Mar-17 2,293,923 304,715 2,598,638 88.3% 87.4%
Apr-17 2,223,160 292,991 2,516,151 88.4% 87.6%
May-17 2,191,578 290,707 2,482,285 88.3% 87.7%
Jun-17 2,289,170 295,755 2,584,926 88.6% 87.8%
Jul-17 2,208,401 279,540 2,487,940 88.8% 87.9%
Aug-17 2,180,859 283,925 2,464,784 88.5% 88.0%
Sep-17 2,180,474 274,662 2,455,136 88.8% 88.1%
Oct-17 2,389,049 305,380 2,694,430 88.7% 88.2%
Nov-17 2,158,777 272,985 2,431,762 88.8% 88.4%
Dec-17 2,468,861 332,567 2,801,428 88.1% 88.5%
Generic Dispensing Rate
Generic Dispensing Rate Development
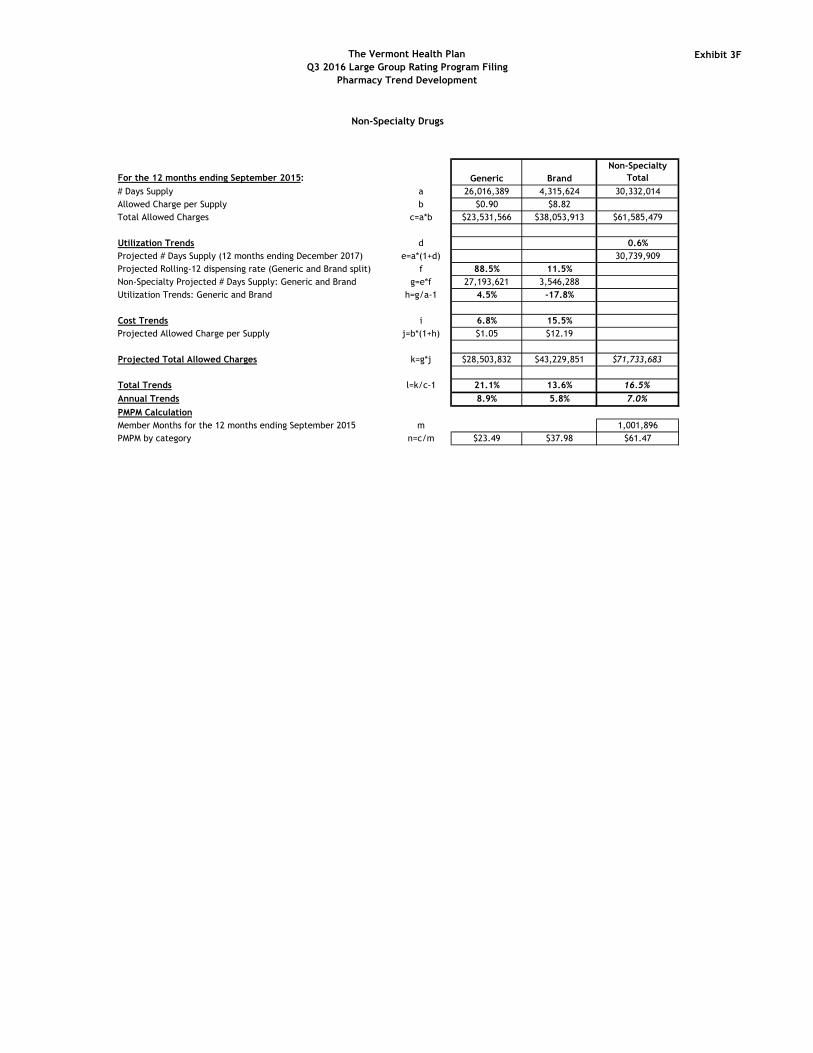
The Vermont Health Plan
Q3 2016 Large Group Rating Program Filing
Pharmacy Trend Development
Exhibit 3F
For the 12 months ending September 2015: Generic Brand
Non-Specialty
Total
# Days Supply a 26,016,389 4,315,624 30,332,014
Allowed Charge per Supply b $0.90 $8.82
Total Allowed Charges c=a*b $23,531,566 $38,053,913 $61,585,479
Utilization Trends d 0.6%
Projected # Days Supply (12 months ending December 2017) e=a*(1+d) 30,739,909
Projected Rolling-12 dispensing rate (Generic and Brand split) f 88.5% 11.5%
Non-Specialty Projected # Days Supply: Generic and Brand g=e*f 27,193,621 3,546,288
Utilization Trends: Generic and Brand h=g/a-1 4.5% -17.8%
Cost Trends i 6.8% 15.5%
Projected Allowed Charge per Supply j=b*(1+h) $1.05 $12.19
Projected Total Allowed Charges k=g*j $28,503,832 $43,229,851 $71,733,683
Total Trends l=k/c-1 21.1% 13.6% 16.5%
Annual Trends 8.9% 5.8% 7.0%
PMPM Calculation
Member Months for the 12 months ending September 2015 m 1,001,896
PMPM by category n=c/m $23.49 $37.98 $61.47
Non-Specialty Drugs

The Vermont Health Plan
Q3 2016 Large Group Rating Program Filing
Pharmacy Trend Development
Exhibit 3G
Page 1
Specialty Drug Trend
Incurred
Date Members
New
Treatment1
Allowed
Charges
All Other
Specialty
Allowed
Charges
Total Specialty
Drug Allowed
Charges
Total Specialty
PMPM
All Other
Specialty
PMPM Members
New Treatment
Allowed
Charges
All Other
Specialty
Allowed
Charges
Total Specialty
Drug Allowed
Charges
Total
Specialty
PMPM
All Other
Specialty PMPM
Total
Specialty
Specialty
Excluding
New
Treatments
10/1/2012 86,271 $ - $ 1,505,878 1,505,878$ $17.46 $17.46
11/1/2012 85,983 $ - $ 1,497,064 1,497,064$ $17.41 $17.41
12/1/2012 85,860 $ - $ 1,527,220 1,527,220$ $17.79 $17.79
1/1/2013 86,712 $ - $ 1,493,867 1,493,867$ $17.23 $17.23
2/1/2013 86,622 $ - $ 1,415,184 1,415,184$ $16.34 $16.34
3/1/2013 86,672 $ - $ 1,489,138 1,489,138$ $17.18 $17.18
4/1/2013 86,552 $ - $ 1,618,704 1,618,704$ $18.70 $18.70
5/1/2013 86,752 $ - $ 1,573,817 1,573,817$ $18.14 $18.14
6/1/2013 86,671 $ - $ 1,566,916 1,566,916$ $18.08 $18.08
7/1/2013 86,687 $ - $ 1,693,604 1,693,604$ $19.54 $19.54
8/1/2013 86,680 $ - $ 1,692,508 1,692,508$ $19.53 $19.53
9/1/2013 87,052 $ - $ 1,584,272 1,584,272$ $18.20 $18.20 1,038,514 $ - $ 18,658,173 18,658,173$ $17.97 $17.97 $17.82 $18.25
10/1/2013 87,015 $ - $ 1,752,765 1,752,765$ $20.14 $20.14 1,039,258 $ - $ 18,905,060 18,905,060$ $18.19 $18.19 $18.19 $18.45
11/1/2013 86,894 $ - $ 1,530,146 1,530,146$ $17.61 $17.61 1,040,169 $ - $ 18,938,141 18,938,141$ $18.21 $18.21 $18.57 $18.65
12/1/2013 86,849 $ - $ 1,797,360 1,797,360$ $20.70 $20.70 1,041,158 $ - $ 19,208,282 19,208,282$ $18.45 $18.45 $18.95 $18.86
1/1/2014 85,959 $ - $ 1,836,677 1,836,677$ $21.37 $21.37 1,040,405 $ - $ 19,551,092 19,551,092$ $18.79 $18.79 $19.34 $19.07
2/1/2014 85,900 $ 58,805 $ 1,708,263 1,767,068$ $20.57 $19.89 1,039,683 $ 58,805 $ 19,844,170 19,902,975$ $19.14 $19.09 $19.75 $19.28
3/1/2014 85,756 $ 309,526 $ 1,819,370 2,128,896$ $24.83 $21.22 1,038,767 $ 368,330 $ 20,174,402 20,542,733$ $19.78 $19.42 $20.13 $19.48
4/1/2014 85,471 $ 473,044 $ 1,994,507 2,467,551$ $28.87 $23.34 1,037,686 $ 841,375 $ 20,550,205 21,391,580$ $20.61 $19.80 $20.55 $19.70
5/1/2014 85,852 $ 508,886 $ 1,943,887 2,452,773$ $28.57 $22.64 1,036,786 $ 1,350,260 $ 20,920,274 22,270,535$ $21.48 $20.18 $20.97 $19.91
6/1/2014 85,604 $ 175,732 $ 1,985,356 2,161,088$ $25.25 $23.19 1,035,719 $ 1,525,993 $ 21,338,714 22,864,707$ $22.08 $20.60 $21.41 $20.14
7/1/2014 84,706 $ 235,888 $ 1,863,233 2,099,121$ $24.78 $22.00 1,033,738 $ 1,761,881 $ 21,508,342 23,270,223$ $22.51 $20.81 $21.84 $20.36
8/1/2014 84,620 $ 202,641 $ 1,862,185 2,064,826$ $24.40 $22.01 1,031,678 $ 1,964,522 $ 21,678,020 23,642,542$ $22.92 $21.01 $22.30 $20.59
9/1/2014 85,297 $ 148,707 $ 1,786,129 1,934,837$ $22.68 $20.94 1,029,923 $ 2,113,229 $ 21,879,877 23,993,106$ $23.30 $21.24 $22.77 $20.82
10/1/2014 85,337 $ 89,229 $ 1,867,573 1,956,802$ $22.93 $21.88 1,028,245 $ 2,202,458 $ 21,994,685 24,197,143$ $23.53 $21.39 $23.23 $21.05
11/1/2014 85,272 $ 158,372 $ 1,754,877 1,913,249$ $22.44 $20.58 1,026,623 $ 2,360,830 $ 22,219,417 24,580,247$ $23.94 $21.64 $23.72 $21.28
12/1/2014 85,388 $ 350,260 $ 2,012,552 2,362,812$ $27.67 $23.57 1,025,162 $ 2,711,090 $ 22,434,608 25,145,698$ $24.53 $21.88 $24.20 $21.52
1/1/2015 83,511 $ 347,681 $ 1,782,561 2,130,242$ $25.51 $21.35 1,022,714 $ 3,058,771 $ 22,380,492 25,439,263$ $24.87 $21.88 $24.71 $21.76
2/1/2015 83,577 $ 552,579 $ 1,725,389 2,277,969$ $27.26 $20.64 1,020,391 $ 3,552,546 $ 22,397,618 25,950,164$ $25.43 $21.95 $25.23 $22.00
3/1/2015 83,437 $ 665,773 $ 2,080,362 2,746,136$ $32.91 $24.93 1,018,072 $ 3,908,794 $ 22,658,611 26,567,404$ $26.10 $22.26 $25.71 $22.23
4/1/2015 83,002 $ 789,142 $ 1,908,256 2,697,398$ $32.50 $22.99 1,015,603 $ 4,224,892 $ 22,572,360 26,797,251$ $26.39 $22.23 $26.25 $22.48
5/1/2015 82,849 $ 476,559 $ 2,347,878 2,824,436$ $34.09 $28.34 1,012,600 $ 4,192,564 $ 22,976,350 27,168,915$ $26.83 $22.69 $26.78 $22.72
6/1/2015 83,136 $ 480,412 $ 2,019,718 2,500,129$ $30.07 $24.29 1,010,132 $ 4,497,244 $ 23,010,713 27,507,956$ $27.23 $22.78 $27.35 $22.98
7/1/2015 82,303 $ 345,033 $ 1,952,477 2,297,510$ $27.92 $23.72 1,007,729 $ 4,606,388 $ 23,099,957 27,706,345$ $27.49 $22.92 $27.90 $23.23
8/1/2015 81,986 $ 266,277 $ 1,909,461 2,175,738$ $26.54 $23.29 1,005,095 $ 4,670,025 $ 23,147,232 27,817,257$ $27.68 $23.03 $28.49 $23.49
9/1/2015 82,098 $ 86,779 $ 2,072,414 2,159,194$ $26.30 $25.24 1,001,896 $ 4,608,097 $ 23,433,517 28,041,614$ $27.99 $23.39 $29.09 $23.76
1. New treatments are hepatitis C drugs, PCSK9 inhibitors, and Orkambi Exponential Trend: 27.8% 14.1%
EXPONENTIAL FITPMPMMONTHLY DATA ROLLING 12 PMPM
$0.00
$5.00
$10.00
$15.00
$20.00
$25.00
$30.00
$35.00
$40.00
10/1/2012 1/1/2013 4/1/2013 7/1/2013 10/1/2013 1/1/2014 4/1/2014 7/1/2014 10/1/2014 1/1/2015 4/1/2015 7/1/2015
Allowed Cost per Member per Month - Specialty Drugs
Total Specialty PMPM All Other Specialty PMPM Total Specialty, 24 mths on Rolling 12 (27.8%) All Other Specialty, 24 mths on Rolling 12 (14.1%)
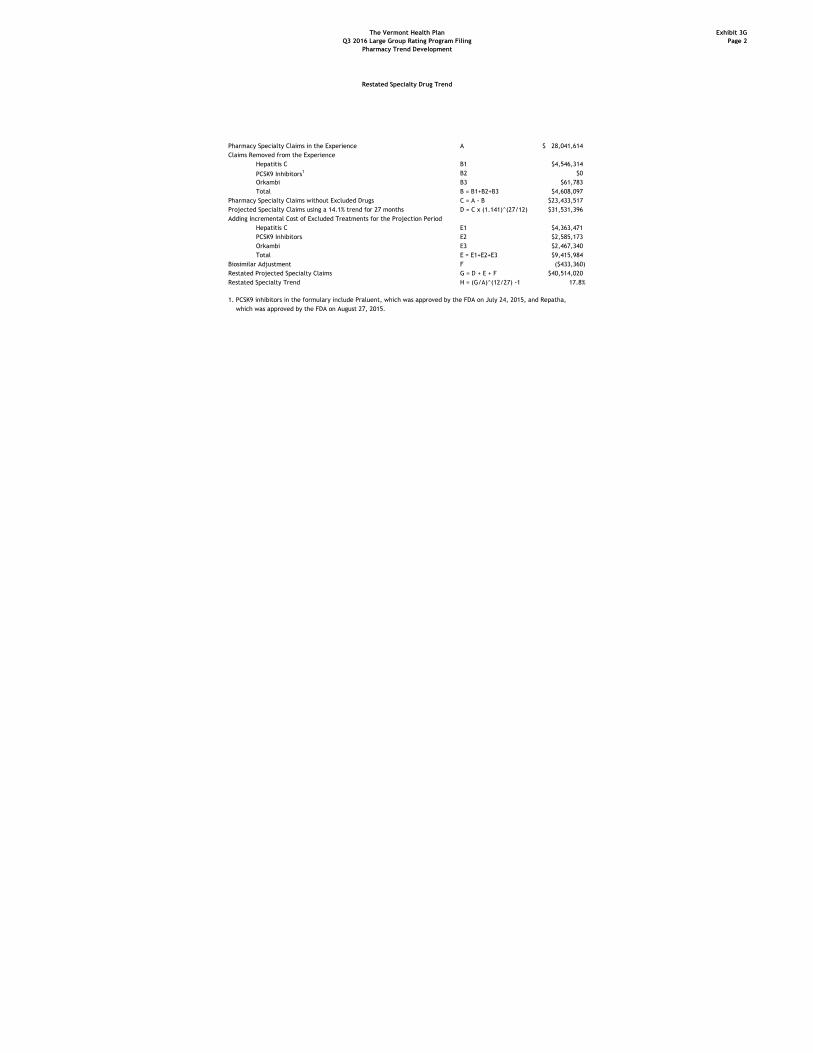
The Vermont Health Plan
Q3 2016 Large Group Rating Program Filing
Pharmacy Trend Development
Exhibit 3G
Page 2
Restated Specialty Drug Trend
Pharmacy Specialty Claims in the Experience A 28,041,614$
Claims Removed from the Experience
Hepatitis C B1 $4,546,314
PCSK9 Inhibitors1 B2 $0
Orkambi B3 $61,783
Total B = B1+B2+B3 $4,608,097
Pharmacy Specialty Claims without Excluded Drugs C = A - B $23,433,517
Projected Specialty Claims using a 14.1% trend for 27 months D = C x (1.141)^(27/12) $31,531,396
Adding Incremental Cost of Excluded Treatments for the Projection Period
Hepatitis C E1 $4,363,471
PCSK9 Inhibitors E2 $2,585,173
Orkambi E3 $2,467,340
Total E = E1+E2+E3 $9,415,984
Biosimilar Adjustment F ($433,360)
Restated Projected Specialty Claims G = D + E + F $40,514,020
Restated Specialty Trend H = (G/A)^(12/27) -1 17.8%
1. PCSK9 inhibitors in the formulary include Praluent, which was approved by the FDA on July 24, 2015, and Repatha,
which was approved by the FDA on August 27, 2015.
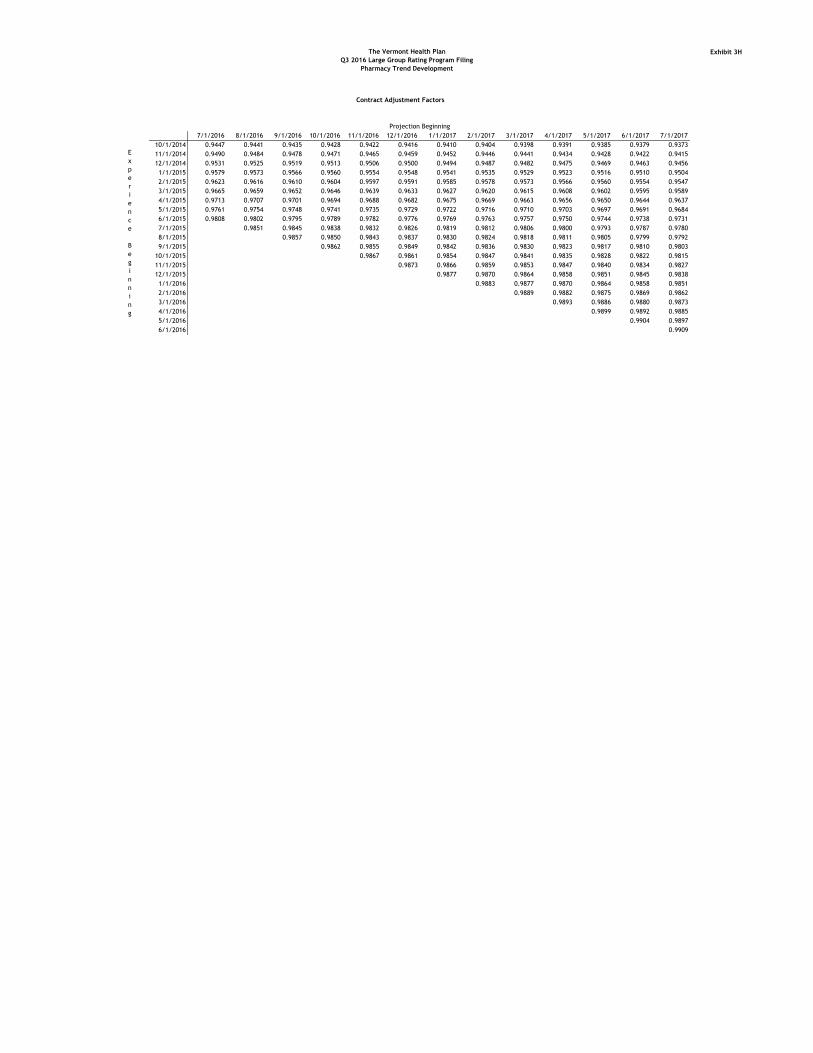
The Vermont Health Plan
Q3 2016 Large Group Rating Program Filing
Pharmacy Trend Development
Exhibit 3H
Contract Adjustment Factors
7/1/2016 8/1/2016 9/1/2016 10/1/2016 11/1/2016 12/1/2016 1/1/2017 2/1/2017 3/1/2017 4/1/2017 5/1/2017 6/1/2017 7/1/2017
10/1/2014 0.9447 0.9441 0.9435 0.9428 0.9422 0.9416 0.9410 0.9404 0.9398 0.9391 0.9385 0.9379 0.9373
11/1/2014 0.9490 0.9484 0.9478 0.9471 0.9465 0.9459 0.9452 0.9446 0.9441 0.9434 0.9428 0.9422 0.9415
12/1/2014 0.9531 0.9525 0.9519 0.9513 0.9506 0.9500 0.9494 0.9487 0.9482 0.9475 0.9469 0.9463 0.9456
1/1/2015 0.9579 0.9573 0.9566 0.9560 0.9554 0.9548 0.9541 0.9535 0.9529 0.9523 0.9516 0.9510 0.9504
2/1/2015 0.9623 0.9616 0.9610 0.9604 0.9597 0.9591 0.9585 0.9578 0.9573 0.9566 0.9560 0.9554 0.9547
3/1/2015 0.9665 0.9659 0.9652 0.9646 0.9639 0.9633 0.9627 0.9620 0.9615 0.9608 0.9602 0.9595 0.9589
4/1/2015 0.9713 0.9707 0.9701 0.9694 0.9688 0.9682 0.9675 0.9669 0.9663 0.9656 0.9650 0.9644 0.9637
5/1/2015 0.9761 0.9754 0.9748 0.9741 0.9735 0.9729 0.9722 0.9716 0.9710 0.9703 0.9697 0.9691 0.9684
6/1/2015 0.9808 0.9802 0.9795 0.9789 0.9782 0.9776 0.9769 0.9763 0.9757 0.9750 0.9744 0.9738 0.9731
7/1/2015 0.9851 0.9845 0.9838 0.9832 0.9826 0.9819 0.9812 0.9806 0.9800 0.9793 0.9787 0.9780
8/1/2015 0.9857 0.9850 0.9843 0.9837 0.9830 0.9824 0.9818 0.9811 0.9805 0.9799 0.9792
9/1/2015 0.9862 0.9855 0.9849 0.9842 0.9836 0.9830 0.9823 0.9817 0.9810 0.9803
10/1/2015 0.9867 0.9861 0.9854 0.9847 0.9841 0.9835 0.9828 0.9822 0.9815
11/1/2015 0.9873 0.9866 0.9859 0.9853 0.9847 0.9840 0.9834 0.9827
12/1/2015 0.9877 0.9870 0.9864 0.9858 0.9851 0.9845 0.9838
1/1/2016 0.9883 0.9877 0.9870 0.9864 0.9858 0.9851
2/1/2016 0.9889 0.9882 0.9875 0.9869 0.9862
3/1/2016 0.9893 0.9886 0.9880 0.9873
4/1/2016 0.9899 0.9892 0.9885
5/1/2016 0.9904 0.9897
6/1/2016 0.9909
Projection Beginning
E
x
p
e
r
i
e
n
c
e
B
e
g
i
n
n
i
n
g
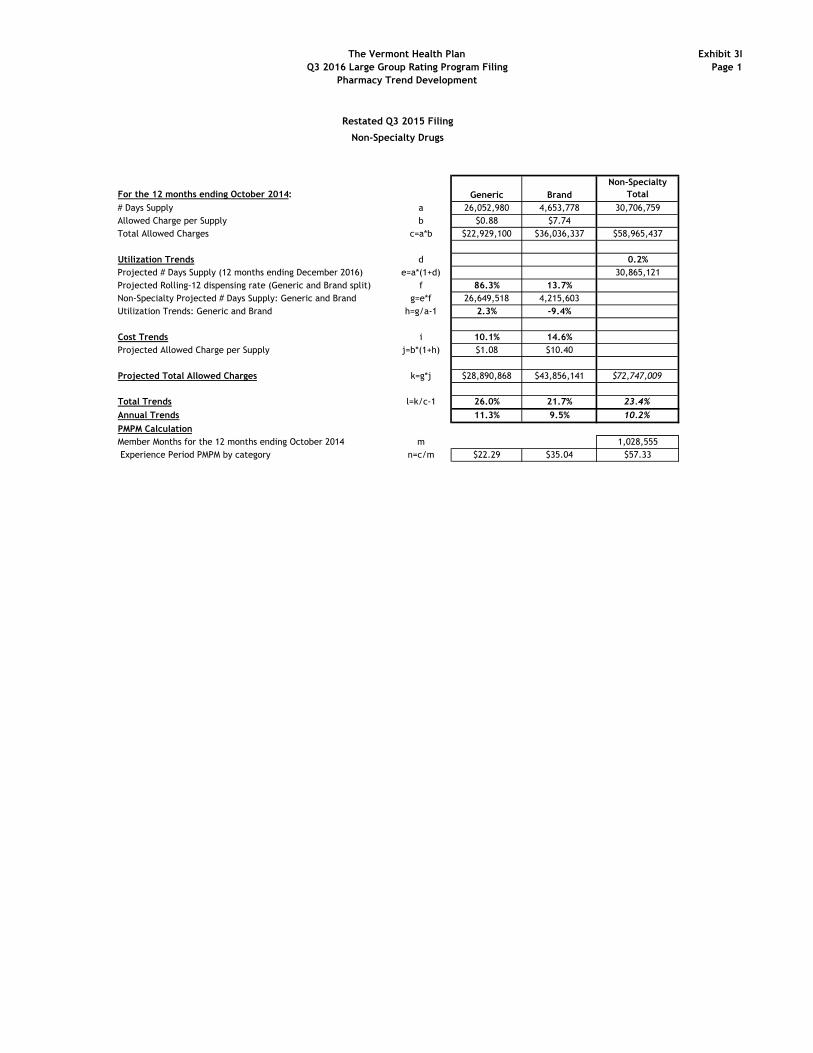
The Vermont Health Plan
Q3 2016 Large Group Rating Program Filing
Pharmacy Trend Development
Exhibit 3I
Page 1
For the 12 months ending October 2014: Generic Brand
Non-Specialty
Total
# Days Supply a 26,052,980 4,653,778 30,706,759
Allowed Charge per Supply b $0.88 $7.74
Total Allowed Charges c=a*b $22,929,100 $36,036,337 $58,965,437
Utilization Trends d 0.2%
Projected # Days Supply (12 months ending December 2016) e=a*(1+d) 30,865,121
Projected Rolling-12 dispensing rate (Generic and Brand split) f 86.3% 13.7%
Non-Specialty Projected # Days Supply: Generic and Brand g=e*f 26,649,518 4,215,603
Utilization Trends: Generic and Brand h=g/a-1 2.3% -9.4%
Cost Trends i 10.1% 14.6%
Projected Allowed Charge per Supply j=b*(1+h) $1.08 $10.40
Projected Total Allowed Charges k=g*j $28,890,868 $43,856,141 $72,747,009
Total Trends l=k/c-1 26.0% 21.7% 23.4%
Annual Trends 11.3% 9.5% 10.2%
PMPM Calculation
Member Months for the 12 months ending October 2014 m 1,028,555
Experience Period PMPM by category n=c/m $22.29 $35.04 $57.33
Non-Specialty Drugs
Restated Q3 2015 Filing
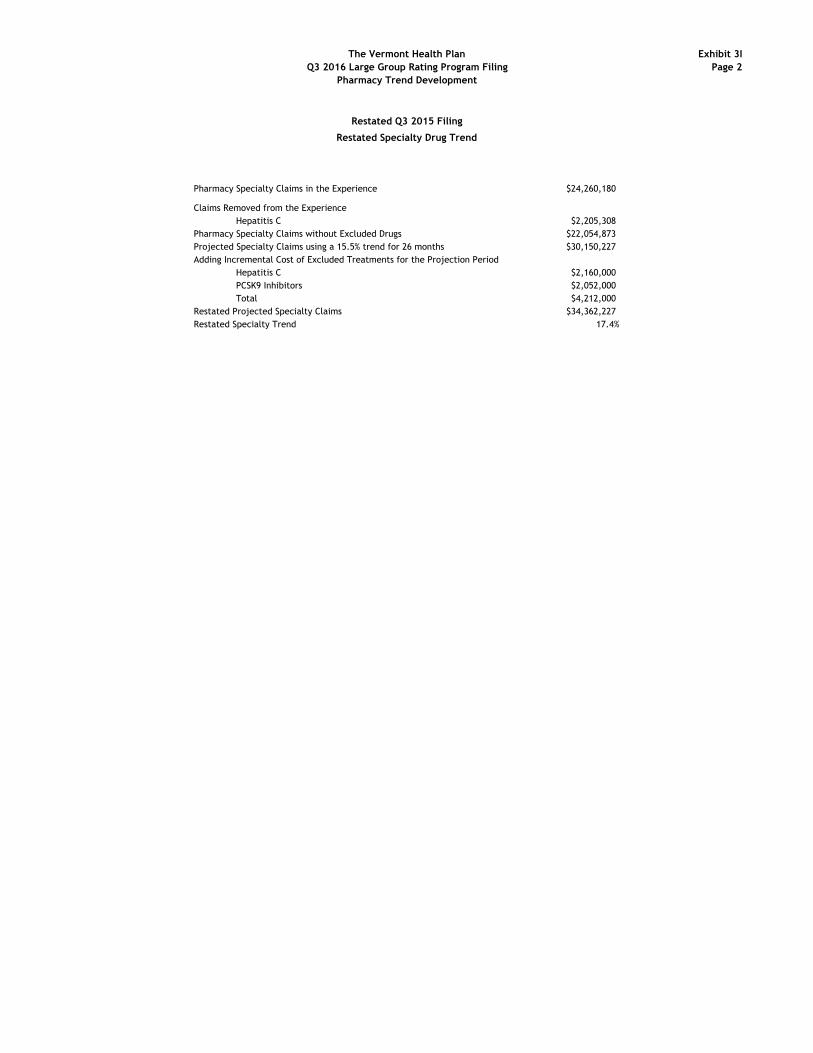
The Vermont Health Plan
Q3 2016 Large Group Rating Program Filing
Pharmacy Trend Development
Exhibit 3I
Page 2
Restated Q3 2015 Filing
Restated Specialty Drug Trend
Pharmacy Specialty Claims in the Experience $24,260,180
Claims Removed from the Experience
Hepatitis C $2,205,308
Pharmacy Specialty Claims without Excluded Drugs $22,054,873
Projected Specialty Claims using a 15.5% trend for 26 months $30,150,227
Adding Incremental Cost of Excluded Treatments for the Projection Period
Hepatitis C $2,160,000
PCSK9 Inhibitors $2,052,000
Total $4,212,000
Restated Projected Specialty Claims $34,362,227
Restated Specialty Trend 17.4%

The Vermont Health Plan
Q3 2016 Large Group Rating Program Filing
Medical Trend Development
Exhibit 3J
BlueCare LO Options (LO) and Open Access (OAP) Medical Plans
index Product Deductible Coinsurance Out-of-
Office
Copay
Specialist
CopayER1 Copay AMB
Copay
Deductible Coinsurance Out-of-
Leveraging
Factor
1 LO $2,500 0% $2,500 1.0%
2 LO $3,000 0% $3,000 1.1%
3 OAP $500 20% $1,850 $20 $20 $100 $1,000 40% $3,900 0.5%
4 OAP $2,000 20% $4,600 $30 $30 $100 $4,000 40% $9,200 1.0%
5 OAP $3,000 0% $4,100 $30 $30 $100 $6,000 30% $8,200 1.0%
6 OAP $3,000 20% $5,100 $30 $30 $100 $5,000 40% $10,000 1.1%
7 OAP $3,000 20% $5,300 $30 $30 $100 $5,000 40% $10,600 1.1%
1. ER Copay: the displayed member copay goes toward the facility allowed charges. Associated physician and ancillary charges are the covered at 100%.
2. For the BCLO product, Office and Specialist Copay can be under the deductible.
3. BCLO does not have Out-of-Network benefits.
BlueCare (HMO) Medical Plans
index Product Inpatient
Care
Deductible2
Outpatient
Surgery
Copay
Combined
Inpatient /
Outpatient
Deductible2
Office
Copay
Specialist
CopayER3 Copay AMB
Copay
Out-of-
Leveraging
Factor
1 HMO $250 $100 $10 $20 $50 $0 $6,850 0.1%
2 HMO $0 $0 $20 $30 $250 $0 $6,850 0.2%
3 HMO $2,000 $1,000 $20 $30 $50 $50 $6,850 0.3%
4 HMO $3,000 $20 $30 $100 $50 $6,850 0.5%
5 HMO $750 $20 $30 $50 $50 $6,850 0.3%
6 HMO $250 $100 $25 $40 $100 $50 $6,850 0.3%
7 HMO $500 $200 $25 $40 $150 $50 $6,850 0.3%
8 HMO $500 $200 $25 $40 $50 $0 $6,850 0.3%
1. All HMO Plans have a DME rider benefit of: $0 deductible, 20% coinsurance, built into the relativity.
2. Maximum of 2/yr per family
3. ER Copay: the displayed member copay goes toward the facility allowed charges. Associated physician and ancillary charges are the covered at 100%.
4. HMO Plans do not have Out-of-Network benefits.
Consumer Driven Health Plans (CDHP's)
index Product Deductible Coinsurance Out-of-
RX OOPM
Limit3
Wellness
Rx1
Drugs After
Deductible2
Diabetic
Supplies
Medical Rx
1 CDHP $1,500 0% $1,500 $1,300 N/A N/A SAAO 0.8% 1.6%
2 CDHP $2,500 0% $2,500 $1,300 N/A N/A SAAO 1.0% 1.9%
3 CDHP $3,000 0% $3,000 $1,300 N/A N/A SAAO 1.1% 1.9%
4 CDHP $4,000 0% $4,000 $1,300 0% N/A SAAO 1.3% 1.3%
5 CDHP $5,000 0% $5,000 $1,300 N/A N/A SAAO 1.4% 2.2%
6 CDHP $6,450 0% $6,450 $1,300 N/A N/A SAAO 1.6% 2.2%
1. Wellness Rx: if applicable, cost sharing rules apply before the deductible is satisfied.
2. All other drugs are subject to deductible. Once the deductible is met, drugs are subject to the Drugs
3. The Rx OOPM Limit is as described in Vermont Act 171.
Preferred Benefits Standard Benefits
Leveraging Factor
In-Network
In-Network

The Vermont Health Plan
Q3 2016 Large Group Rating Program Filing
Pharmacy Trend Development
Exhibit 3K
Benefit Leveraging Factors
Index Type DeductibleRetail
Generic
Retail
Preferred
Brand
Retail Non-
Preferred
Brand
Mail Order
Generic
Mail Order
Preferred
Brand
Mail Order
Non-
Preferred
Brand
OOPMDiabetic
Supplies
Leveraging
Factor
1 CM1 $100 $5 40% 60% $10 40% 60% $1,300 SAAO 1.4%
2 COI $0 50% 50% 50% 50% 50% 50% $1,300 SAAO 1.2%
3 COP $0 $5 $20 $35 $10 $40 $70 $1,300 SAAO 0.8%
4 COP $0 $5 $20 $45 $10 $40 $90 $1,300 100% 0.7%
5 COP $0 $5 $30 $50 $10 $60 $100 $1,300 SAAO 1.0%
6 COP $0 $10 $20 $40 $20 $40 $80 $1,300 SAAO 1.1%
7 COP $0 $10 $25 $40 $20 $50 $80 $1,300 100% 1.0%
8 COP $0 $10 $25 $40 $20 $50 $80 $1,300 SAAO 1.1%
9 COP $0 $10 $25 $50 $20 $50 $100 $1,300 SAAO 1.2%
10 COP $0 $10 $25 $60 $20 $50 $120 $1,300 SAAO 1.2%
11 COP $0 $10 $30 $50 $20 $60 $100 $1,300 100% 1.1%
12 COP $0 $10 $30 $50 $20 $60 $100 $1,300 SAAO 1.2%
13 COP $0 $10 $35 $60 $20 $70 $120 $1,300 SAAO 1.3%
14 COP $0 $15 $25 $40 $30 $50 $80 $1,300 100% 1.1%
15 COP $0 $15 $25 $40 $30 $50 $80 $1,300 SAAO 1.2%
16 COP $0 $15 $30 $45 $30 $60 $90 $1,300 SAAO 1.3%
17 COP $0 $20 $40 $60 $40 $80 $120 $1,300 SAAO 1.5%
18 COP $50 $5 $10 $25 $10 $20 $50 $1,300 SAAO 0.8%
19 COP $50 $10 $20 $35 $20 $40 $70 $1,300 SAAO 1.2%
20 COP $50 $10 $25 $35 $20 $50 $70 $1,300 SAAO 1.2%
21 COP $50 $10 $30 $50 $20 $60 $100 $1,300 SAAO 1.4%
22 COP $50 $15 $25 $40 $30 $50 $80 $1,300 SAAO 1.3%
23 COP $100 $5 $20 $40 $10 $40 $80 $1,300 SAAO 1.2%
24 COP $100 $10 $15 $30 $20 $30 $60 $1,300 SAAO 1.2%
25 COP $100 $10 $20 $40 $20 $40 $80 $1,300 SAAO 1.3%
26 COP $100 $10 $25 $45 $20 $50 $90 $1,300 SAAO 1.4%
27 COP $100 $10 $30 $50 $20 $60 $100 $1,300 100% 1.3%
28 COP $100 $10 $30 $50 $20 $60 $100 $1,300 SAAO 1.5%
29 COP $100 $15 $40 $60 $30 $80 $120 $1,300 SAAO 1.7%
30 COP $150 $10 $20 $40 $20 $40 $80 $1,300 SAAO 1.4%
* Type: COI = coinsurance; COP = copay; CM1 = combined
* Diabetic: If "100%" then Diabetic medications and supplies are covered at 100% of allowed charges;
If "SAAO" then Diabetic medications and supplies are subject to cost sharing same as any other prescription drug.
Copay ($) / Coinsurance (%)
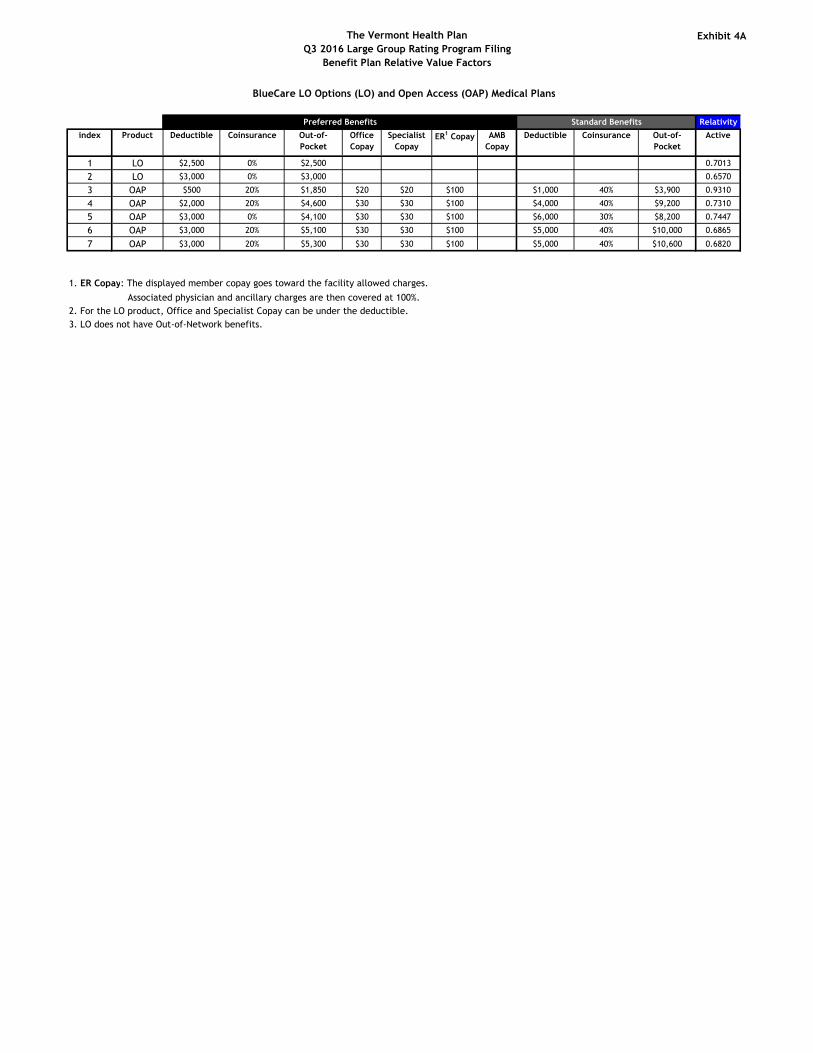
The Vermont Health Plan
Q3 2016 Large Group Rating Program Filing
Benefit Plan Relative Value Factors
Exhibit 4A
BlueCare LO Options (LO) and Open Access (OAP) Medical Plans
Relativity
index Product Deductible Coinsurance Out-of-
Office
Copay
Specialist
CopayER1 Copay AMB
Copay
Deductible Coinsurance Out-of-
Active
1 LO $2,500 0% $2,500 0.7013
2 LO $3,000 0% $3,000 0.6570
3 OAP $500 20% $1,850 $20 $20 $100 $1,000 40% $3,900 0.9310
4 OAP $2,000 20% $4,600 $30 $30 $100 $4,000 40% $9,200 0.7310
5 OAP $3,000 0% $4,100 $30 $30 $100 $6,000 30% $8,200 0.7447
6 OAP $3,000 20% $5,100 $30 $30 $100 $5,000 40% $10,000 0.6865
7 OAP $3,000 20% $5,300 $30 $30 $100 $5,000 40% $10,600 0.6820
1. ER Copay: The displayed member copay goes toward the facility allowed charges.
Associated physician and ancillary charges are then covered at 100%.
2. For the LO product, Office and Specialist Copay can be under the deductible.
3. LO does not have Out-of-Network benefits.
Preferred Benefits Standard Benefits
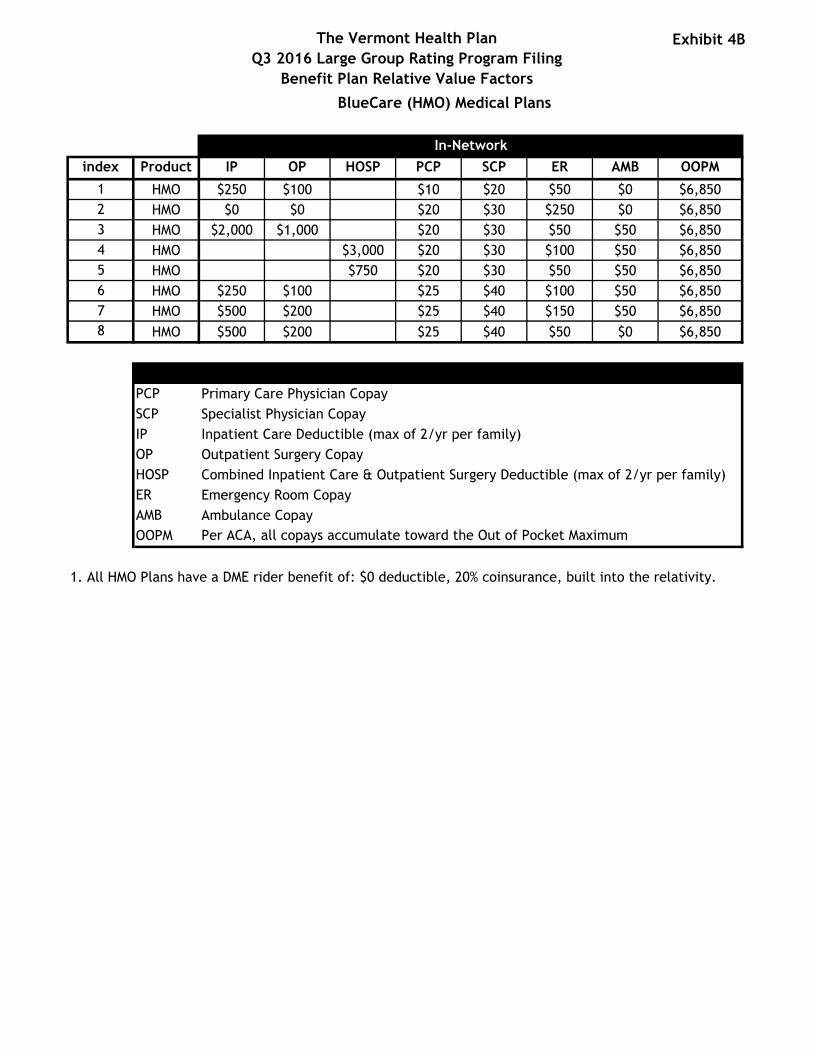
The Vermont Health Plan
Q3 2016 Large Group Rating Program Filing
Benefit Plan Relative Value Factors
Exhibit 4B
BlueCare (HMO) Medical Plans
index Product IP OP HOSP PCP SCP ER AMB OOPM
1 HMO $250 $100 $10 $20 $50 $0 $6,850
2 HMO $0 $0 $20 $30 $250 $0 $6,850
3 HMO $2,000 $1,000 $20 $30 $50 $50 $6,850
4 HMO $3,000 $20 $30 $100 $50 $6,850
5 HMO $750 $20 $30 $50 $50 $6,850
6 HMO $250 $100 $25 $40 $100 $50 $6,850
7 HMO $500 $200 $25 $40 $150 $50 $6,850
8 HMO $500 $200 $25 $40 $50 $0 $6,850
PCP Primary Care Physician Copay
SCP Specialist Physician Copay
IP Inpatient Care Deductible (max of 2/yr per family)
OP Outpatient Surgery Copay
HOSP Combined Inpatient Care & Outpatient Surgery Deductible (max of 2/yr per family)
ER Emergency Room Copay
AMB Ambulance Copay
OOPM Per ACA, all copays accumulate toward the Out of Pocket Maximum
1. All HMO Plans have a DME rider benefit of: $0 deductible, 20% coinsurance, built into the relativity.
In-Network
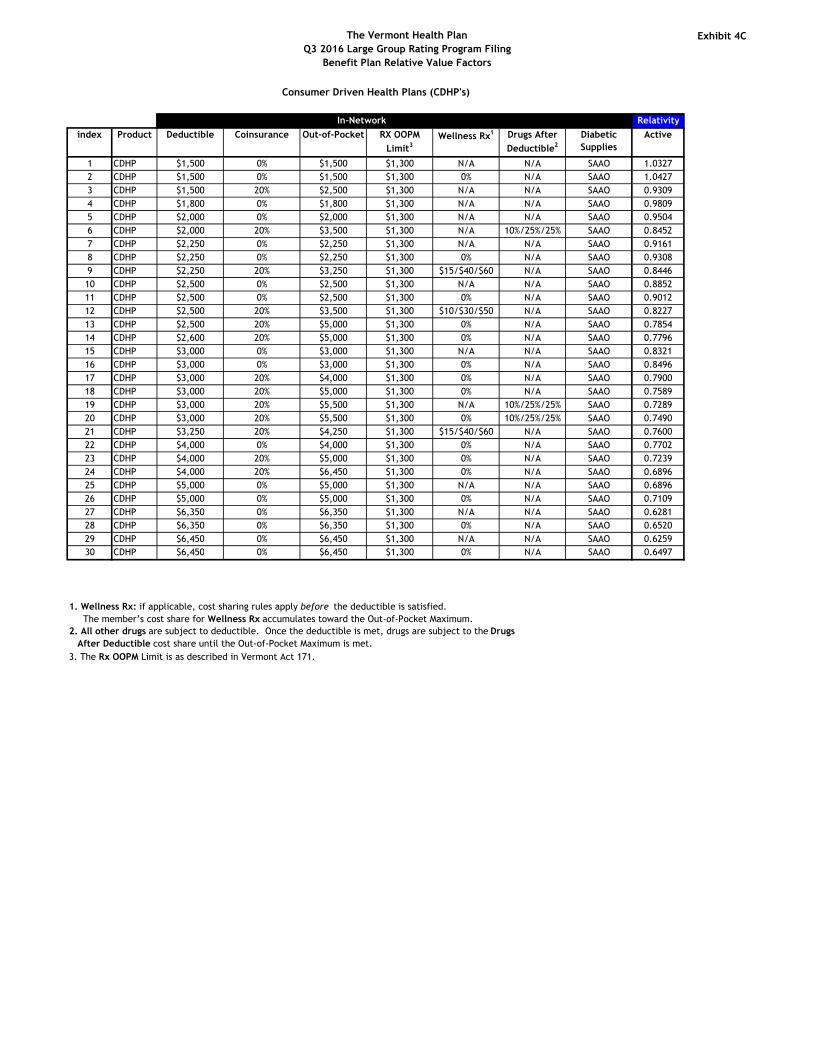
The Vermont Health Plan
Q3 2016 Large Group Rating Program Filing
Benefit Plan Relative Value Factors
Exhibit 4C
Consumer Driven Health Plans (CDHP's)
Relativity
index Product Deductible Coinsurance Out-of-Pocket RX OOPM
Limit3Wellness Rx1 Drugs After
Deductible2
Diabetic
Supplies
Active
1 CDHP $1,500 0% $1,500 $1,300 N/A N/A SAAO 1.0327
2 CDHP $1,500 0% $1,500 $1,300 0% N/A SAAO 1.0427
3 CDHP $1,500 20% $2,500 $1,300 N/A N/A SAAO 0.9309
4 CDHP $1,800 0% $1,800 $1,300 N/A N/A SAAO 0.9809
5 CDHP $2,000 0% $2,000 $1,300 N/A N/A SAAO 0.9504
6 CDHP $2,000 20% $3,500 $1,300 N/A 10%/25%/25% SAAO 0.8452
7 CDHP $2,250 0% $2,250 $1,300 N/A N/A SAAO 0.9161
8 CDHP $2,250 0% $2,250 $1,300 0% N/A SAAO 0.9308
9 CDHP $2,250 20% $3,250 $1,300 $15/$40/$60 N/A SAAO 0.8446
10 CDHP $2,500 0% $2,500 $1,300 N/A N/A SAAO 0.8852
11 CDHP $2,500 0% $2,500 $1,300 0% N/A SAAO 0.9012
12 CDHP $2,500 20% $3,500 $1,300 $10/$30/$50 N/A SAAO 0.8227
13 CDHP $2,500 20% $5,000 $1,300 0% N/A SAAO 0.7854
14 CDHP $2,600 20% $5,000 $1,300 0% N/A SAAO 0.7796
15 CDHP $3,000 0% $3,000 $1,300 N/A N/A SAAO 0.8321
16 CDHP $3,000 0% $3,000 $1,300 0% N/A SAAO 0.8496
17 CDHP $3,000 20% $4,000 $1,300 0% N/A SAAO 0.7900
18 CDHP $3,000 20% $5,000 $1,300 0% N/A SAAO 0.7589
19 CDHP $3,000 20% $5,500 $1,300 N/A 10%/25%/25% SAAO 0.7289
20 CDHP $3,000 20% $5,500 $1,300 0% 10%/25%/25% SAAO 0.7490
21 CDHP $3,250 20% $4,250 $1,300 $15/$40/$60 N/A SAAO 0.7600
22 CDHP $4,000 0% $4,000 $1,300 0% N/A SAAO 0.7702
23 CDHP $4,000 20% $5,000 $1,300 0% N/A SAAO 0.7239
24 CDHP $4,000 20% $6,450 $1,300 0% N/A SAAO 0.6896
25 CDHP $5,000 0% $5,000 $1,300 N/A N/A SAAO 0.6896
26 CDHP $5,000 0% $5,000 $1,300 0% N/A SAAO 0.7109
27 CDHP $6,350 0% $6,350 $1,300 N/A N/A SAAO 0.6281
28 CDHP $6,350 0% $6,350 $1,300 0% N/A SAAO 0.6520
29 CDHP $6,450 0% $6,450 $1,300 N/A N/A SAAO 0.6259
30 CDHP $6,450 0% $6,450 $1,300 0% N/A SAAO 0.6497
3. The Rx OOPM Limit is as described in Vermont Act 171.
In-Network
1. Wellness Rx: if applicable, cost sharing rules apply before the deductible is satisfied.
The member’s cost share for Wellness Rx accumulates toward the Out-of-Pocket Maximum.
2. All other drugs are subject to deductible. Once the deductible is met, drugs are subject to the Drugs
After Deductible cost share until the Out-of-Pocket Maximum is met.
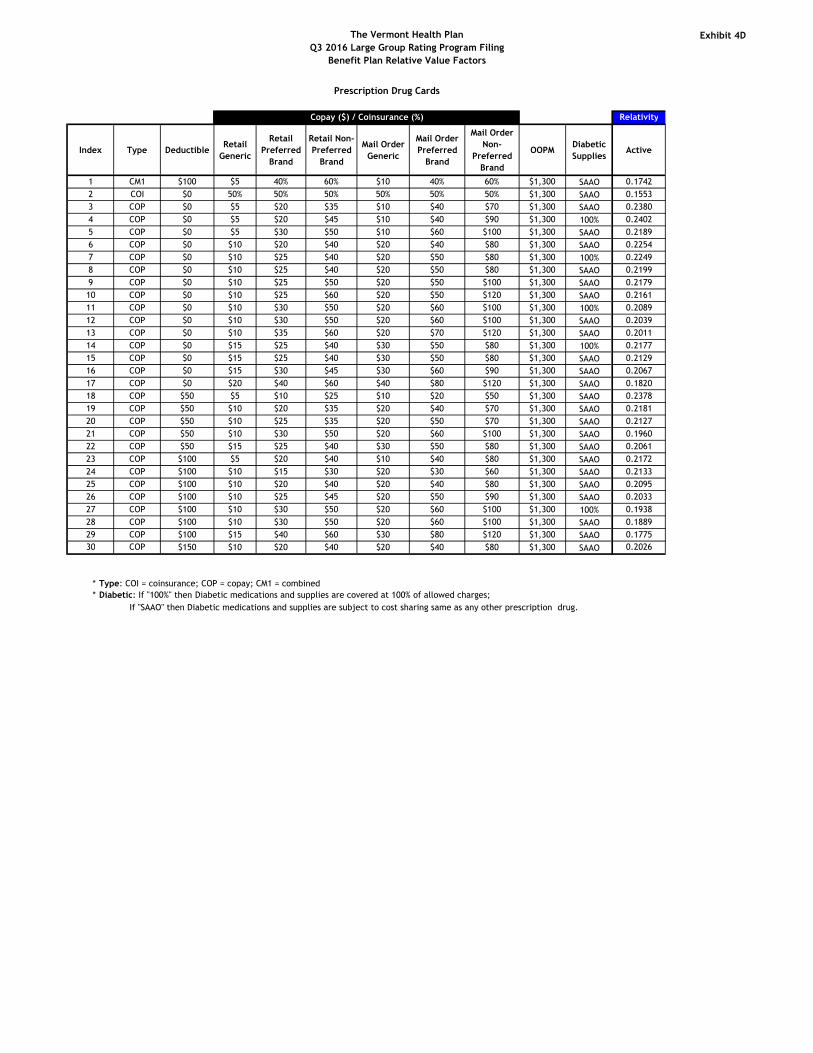
The Vermont Health Plan
Q3 2016 Large Group Rating Program Filing
Benefit Plan Relative Value Factors
Exhibit 4D
Prescription Drug Cards
Relativity
Index Type DeductibleRetail
Generic
Retail
Preferred
Brand
Retail Non-
Preferred
Brand
Mail Order
Generic
Mail Order
Preferred
Brand
Mail Order
Non-
Preferred
Brand
OOPMDiabetic
SuppliesActive
1 CM1 $100 $5 40% 60% $10 40% 60% $1,300 SAAO 0.1742
2 COI $0 50% 50% 50% 50% 50% 50% $1,300 SAAO 0.1553
3 COP $0 $5 $20 $35 $10 $40 $70 $1,300 SAAO 0.2380
4 COP $0 $5 $20 $45 $10 $40 $90 $1,300 100% 0.2402
5 COP $0 $5 $30 $50 $10 $60 $100 $1,300 SAAO 0.2189
6 COP $0 $10 $20 $40 $20 $40 $80 $1,300 SAAO 0.2254
7 COP $0 $10 $25 $40 $20 $50 $80 $1,300 100% 0.2249
8 COP $0 $10 $25 $40 $20 $50 $80 $1,300 SAAO 0.2199
9 COP $0 $10 $25 $50 $20 $50 $100 $1,300 SAAO 0.2179
10 COP $0 $10 $25 $60 $20 $50 $120 $1,300 SAAO 0.2161
11 COP $0 $10 $30 $50 $20 $60 $100 $1,300 100% 0.2089
12 COP $0 $10 $30 $50 $20 $60 $100 $1,300 SAAO 0.2039
13 COP $0 $10 $35 $60 $20 $70 $120 $1,300 SAAO 0.2011
14 COP $0 $15 $25 $40 $30 $50 $80 $1,300 100% 0.2177
15 COP $0 $15 $25 $40 $30 $50 $80 $1,300 SAAO 0.2129
16 COP $0 $15 $30 $45 $30 $60 $90 $1,300 SAAO 0.2067
17 COP $0 $20 $40 $60 $40 $80 $120 $1,300 SAAO 0.1820
18 COP $50 $5 $10 $25 $10 $20 $50 $1,300 SAAO 0.2378
19 COP $50 $10 $20 $35 $20 $40 $70 $1,300 SAAO 0.2181
20 COP $50 $10 $25 $35 $20 $50 $70 $1,300 SAAO 0.2127
21 COP $50 $10 $30 $50 $20 $60 $100 $1,300 SAAO 0.1960
22 COP $50 $15 $25 $40 $30 $50 $80 $1,300 SAAO 0.2061
23 COP $100 $5 $20 $40 $10 $40 $80 $1,300 SAAO 0.2172
24 COP $100 $10 $15 $30 $20 $30 $60 $1,300 SAAO 0.2133
25 COP $100 $10 $20 $40 $20 $40 $80 $1,300 SAAO 0.2095
26 COP $100 $10 $25 $45 $20 $50 $90 $1,300 SAAO 0.2033
27 COP $100 $10 $30 $50 $20 $60 $100 $1,300 100% 0.1938
28 COP $100 $10 $30 $50 $20 $60 $100 $1,300 SAAO 0.1889
29 COP $100 $15 $40 $60 $30 $80 $120 $1,300 SAAO 0.1775
30 COP $150 $10 $20 $40 $20 $40 $80 $1,300 SAAO 0.2026
* Type: COI = coinsurance; COP = copay; CM1 = combined
* Diabetic: If "100%" then Diabetic medications and supplies are covered at 100% of allowed charges;
If "SAAO" then Diabetic medications and supplies are subject to cost sharing same as any other prescription drug.
Copay ($) / Coinsurance (%)
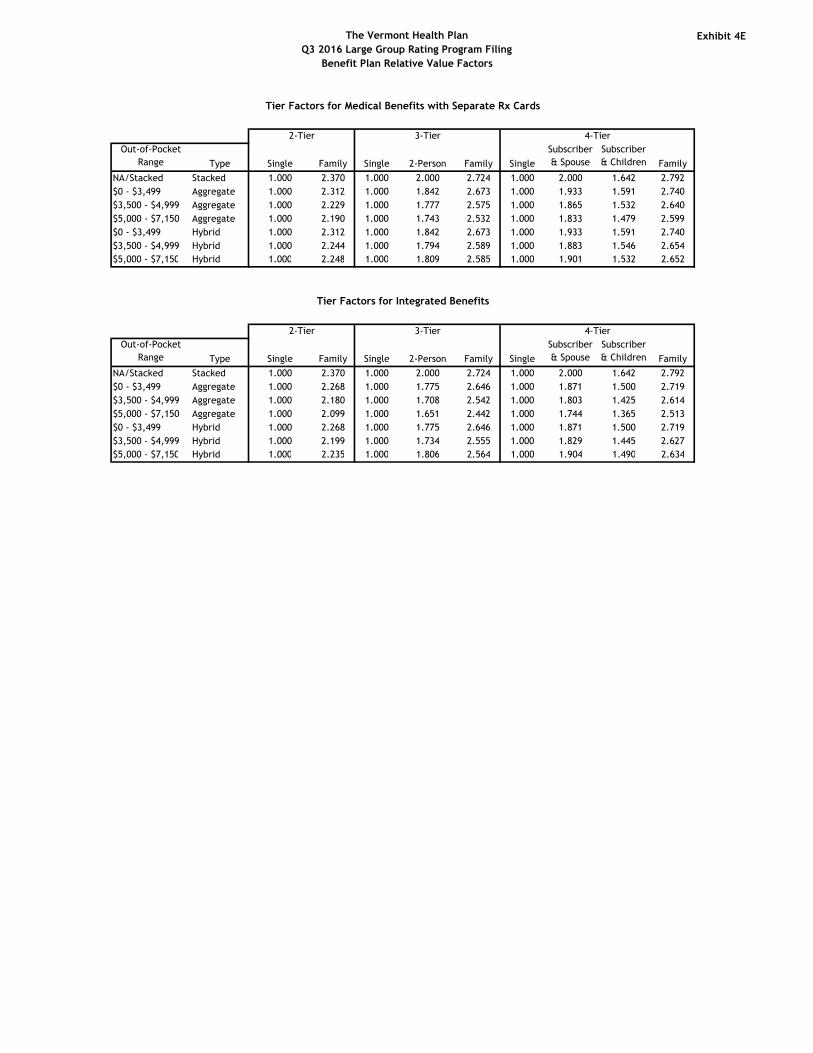
The Vermont Health Plan
Q3 2016 Large Group Rating Program Filing
Benefit Plan Relative Value Factors
Exhibit 4E
Tier Factors for Medical Benefits with Separate Rx Cards
Out-of-Pocket
Range Type Single Family Single 2-Person Family Single
Subscriber
& Spouse
Subscriber
& Children Family
NA/Stacked Stacked 1.000 2.370 1.000 2.000 2.724 1.000 2.000 1.642 2.792
$0 - $3,499 Aggregate 1.000 2.312 1.000 1.842 2.673 1.000 1.933 1.591 2.740
$3,500 - $4,999 Aggregate 1.000 2.229 1.000 1.777 2.575 1.000 1.865 1.532 2.640
$5,000 - $7,150 Aggregate 1.000 2.190 1.000 1.743 2.532 1.000 1.833 1.479 2.599
$0 - $3,499 Hybrid 1.000 2.312 1.000 1.842 2.673 1.000 1.933 1.591 2.740
$3,500 - $4,999 Hybrid 1.000 2.244 1.000 1.794 2.589 1.000 1.883 1.546 2.654
$5,000 - $7,150 Hybrid 1.000 2.248 1.000 1.809 2.585 1.000 1.901 1.532 2.652
Tier Factors for Integrated Benefits
Out-of-Pocket
Range Type Single Family Single 2-Person Family Single
Subscriber
& Spouse
Subscriber
& Children Family
NA/Stacked Stacked 1.000 2.370 1.000 2.000 2.724 1.000 2.000 1.642 2.792
$0 - $3,499 Aggregate 1.000 2.268 1.000 1.775 2.646 1.000 1.871 1.500 2.719
$3,500 - $4,999 Aggregate 1.000 2.180 1.000 1.708 2.542 1.000 1.803 1.425 2.614
$5,000 - $7,150 Aggregate 1.000 2.099 1.000 1.651 2.442 1.000 1.744 1.365 2.513
$0 - $3,499 Hybrid 1.000 2.268 1.000 1.775 2.646 1.000 1.871 1.500 2.719
$3,500 - $4,999 Hybrid 1.000 2.199 1.000 1.734 2.555 1.000 1.829 1.445 2.627
$5,000 - $7,150 Hybrid 1.000 2.235 1.000 1.806 2.564 1.000 1.904 1.490 2.634
2-Tier 3-Tier 4-Tier
2-Tier 3-Tier 4-Tier

The Vermont Health Plan
Q3 2016 Large Group Rating Program Filing
Example of Manual Rate Adjustment
Exhibit 5A
Manual Rate $449.97
Average Age/Gender Factor 1.000
Average Industry Factor 1.000
Projection Period 3/1/2017
Trend Factor 7.60%
Group Information
Age/Gender Factor 1.100
Industry Factor 1.050
Projection Period 3/1/2017
Contract Conversion Contract Distribution Members Tier Factor "Contract Tiers"
Single 25 25 1 25
Two-Person 25 50 2 50
Family 50 197 2.79 139.5
100 272 214.5
Manual Rate A $449.97
Adjustment for Age/Gender B = 1.1 / 1 1.1000
Adjustment for Industry C = 1.05 / 1 1.0500
Adjustment for Trend D = 7.6% for 2 months 1.0123
Pharmacy Contract Adjustment E = 0.9988
Contract Conversion Factor F = 214.5 / 272 1.2681

The Vermont Health Plan
Q3 2016 Large Group Rating Program FilingExhibit 5B
Industry Factors
2-Digit Normalized
SIC Code Industry Description Factor
01 Agricultural Production - Crops 0.975
02 Agricultural Production - Livestock And Animal Specialties 0.982
07 Agricultural Services 0.975
08 Forestry 0.981
09 Fishing, Hunting And Trapping 1.060
10 Metal Mining 1.116
12 Coal Mining 1.124
13 Oil And Gas Extraction 1.028
14 Mining And Quarrying Of Nonmetallic Minerals, Except Fuels 1.093
15 Building Cnstrctn - General Contractors & Operative Builders 0.995
16 Heavy Cnstrctn, Except Building Construction - Contractors 0.989
17 Construction - Special Trade Contractors 0.990
20 Food And Kindred Products 0.943
21 Tobacco Products 1.007
22 Textile Mill Products 0.959
23 Apparel, Finished Prdcts From Fabrics & Similar Materials 0.972
24 Lumber And Wood Products, Except Furniture 1.006
25 Furniture And Fixtures 0.959
26 Paper And Allied Products 0.969
27 Printing, Publishing And Allied Industries 0.950
28 Chemicals And Allied Products 0.999
29 Petroleum Refining And Related Industries 0.999
30 Rubber And Miscellaneous Plastic Products 0.955
31 Leather And Leather Products 0.985
32 Stone, Clay, Glass, And Concrete Products 0.993
33 Primary Metal Industries 0.978
34 Fabricated Metal Prdcts, Except Machinery & Transport Eqpmnt 0.958
35 Industrial And Commercial Machinery And Computer Equipment 0.955
36 Electronic, Elctrcl Eqpmnt & Cmpnts, Excpt Computer Eqpmnt 0.940
37 Transportation Equipment 0.987
38 Mesr/Anlyz/Cntrl Instrmnts; Photo/Med/Opt Gds; Watchs/Clocks 0.939
39 Miscellaneous Manufacturing Industries 0.953
40 Railroad Transportation 0.999
41 Local, Suburban Transit & Interurbn Hgwy Passenger Transport 1.041
42 Motor Freight Transportation 1.042
43 United States Postal Service 0.967
44 Water Transportation 1.020
45 Transportation By Air 0.965
46 Pipelines, Except Natural Gas 0.983
47 Transportation Services 0.947
48 Communications 0.922
49 Electric, Gas And Sanitary Services 0.991
50 Wholesale Trade - Durable Goods 0.970
51 Wholesale Trade - Nondurable Goods 0.959
52 Building Matrials, Hrdwr, Garden Supply & Mobile Home Dealrs 0.958
53 General Merchandise Stores 0.958
54 Food Stores 0.960
55 Automotive Dealers And Gasoline Service Stations 1.034
56 Apparel And Accessory Stores 0.959
57 Home Furniture, Furnishings And Equipment Stores 0.951
58 Eating And Drinking Places 1.086
59 Miscellaneous Retail 0.990
60 Depository Institutions 0.943
61 Nondepository Credit Institutions 0.913
62 Security & Commodity Brokers, Dealers, Exchanges & Services 0.943
63 Insurance Carriers 0.967
64 Insurance Agents, Brokers And Service 0.967
65 Real Estate 0.991
67 Holding And Other Investment Offices 0.943
70 Hotels, Rooming Houses, Camps, And Other Lodging Places 1.034
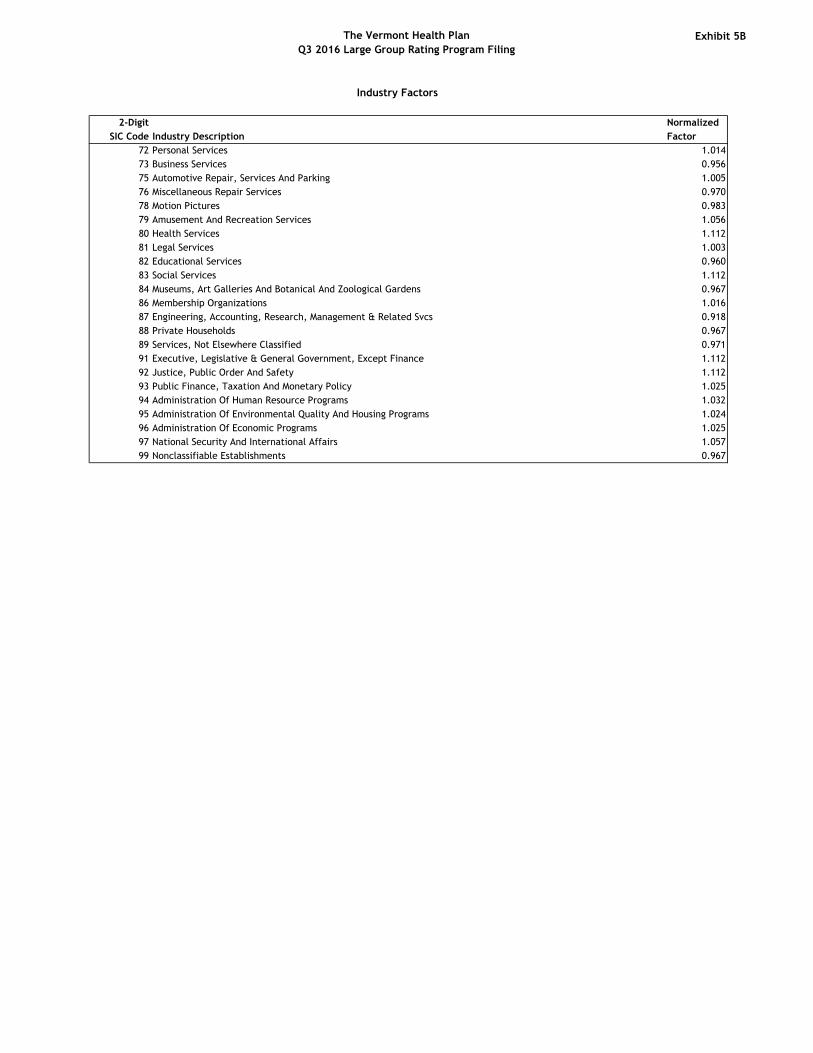
The Vermont Health Plan
Q3 2016 Large Group Rating Program FilingExhibit 5B
Industry Factors
2-Digit Normalized
SIC Code Industry Description Factor
72 Personal Services 1.014
73 Business Services 0.956
75 Automotive Repair, Services And Parking 1.005
76 Miscellaneous Repair Services 0.970
78 Motion Pictures 0.983
79 Amusement And Recreation Services 1.056
80 Health Services 1.112
81 Legal Services 1.003
82 Educational Services 0.960
83 Social Services 1.112
84 Museums, Art Galleries And Botanical And Zoological Gardens 0.967
86 Membership Organizations 1.016
87 Engineering, Accounting, Research, Management & Related Svcs 0.918
88 Private Households 0.967
89 Services, Not Elsewhere Classified 0.971
91 Executive, Legislative & General Government, Except Finance 1.112
92 Justice, Public Order And Safety 1.112
93 Public Finance, Taxation And Monetary Policy 1.025
94 Administration Of Human Resource Programs 1.032
95 Administration Of Environmental Quality And Housing Programs 1.024
96 Administration Of Economic Programs 1.025
97 National Security And International Affairs 1.057
99 Nonclassifiable Establishments 0.967
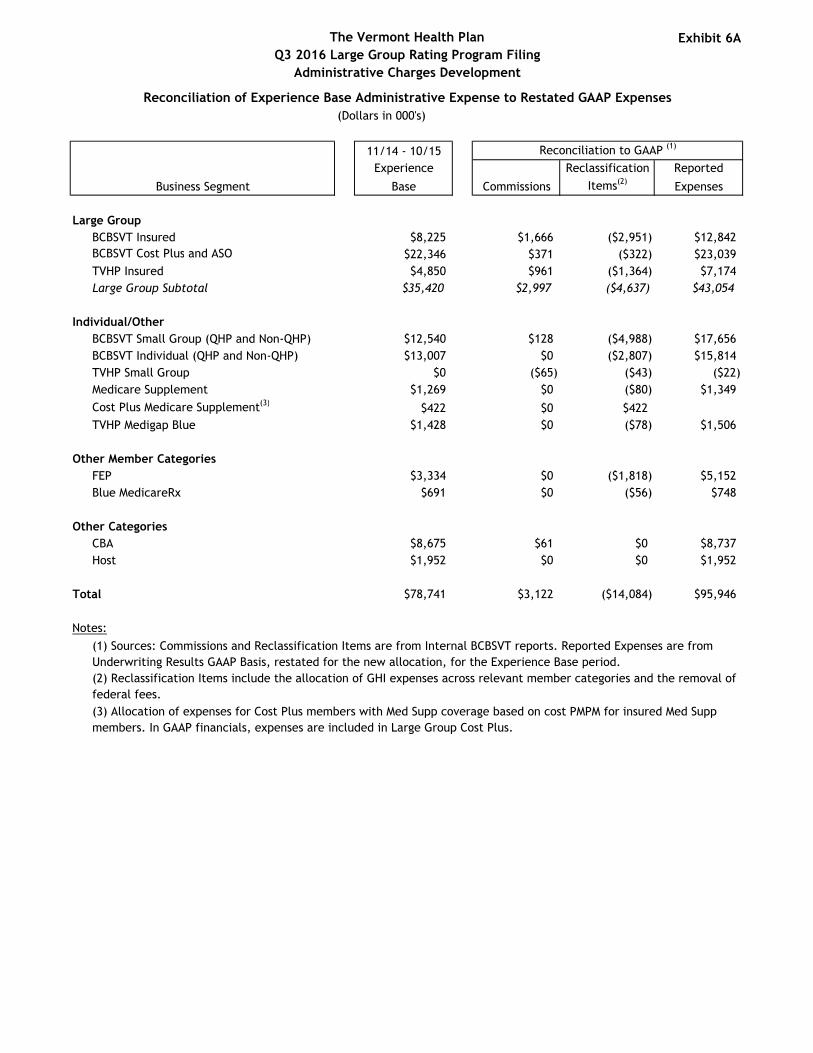
The Vermont Health Plan
Q3 2016 Large Group Rating Program Filing
Administrative Charges Development
Exhibit 6A
11/14 - 10/15 Reconciliation to GAAP (1)
Experience Reclassification Reported
Business Segment Base Commissions Items(2)Expenses
Large Group
BCBSVT Insured $8,225 $1,666 ($2,951) $12,842
BCBSVT Cost Plus and ASO $22,346 $371 ($322) $23,039
TVHP Insured $4,850 $961 ($1,364) $7,174
Large Group Subtotal $35,420 $2,997 ($4,637) $43,054
Individual/Other
BCBSVT Small Group (QHP and Non-QHP) $12,540 $128 ($4,988) $17,656
BCBSVT Individual (QHP and Non-QHP) $13,007 $0 ($2,807) $15,814
TVHP Small Group $0 ($65) ($43) ($22)
Medicare Supplement $1,269 $0 ($80) $1,349
Cost Plus Medicare Supplement(3)$422 $0 $422
TVHP Medigap Blue $1,428 $0 ($78) $1,506
Other Member Categories
FEP $3,334 $0 ($1,818) $5,152
Blue MedicareRx $691 $0 ($56) $748
Other Categories
CBA $8,675 $61 $0 $8,737
Host $1,952 $0 $0 $1,952
Total $78,741 $3,122 ($14,084) $95,946
Notes:
(3) Allocation of expenses for Cost Plus members with Med Supp coverage based on cost PMPM for insured Med Supp
members. In GAAP financials, expenses are included in Large Group Cost Plus.
Reconciliation of Experience Base Administrative Expense to Restated GAAP Expenses
(Dollars in 000's)
(1) Sources: Commissions and Reclassification Items are from Internal BCBSVT reports. Reported Expenses are from
Underwriting Results GAAP Basis, restated for the new allocation, for the Experience Base period.
(2) Reclassification Items include the allocation of GHI expenses across relevant member categories and the removal of
federal fees.
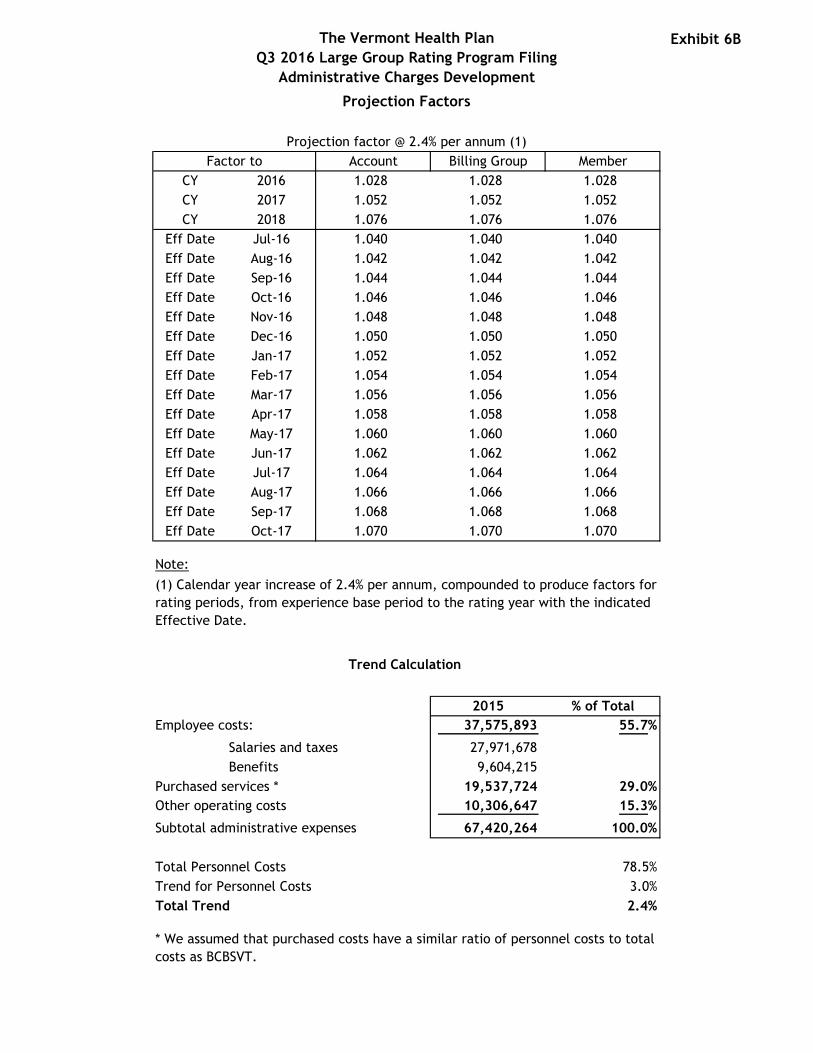
The Vermont Health Plan
Q3 2016 Large Group Rating Program Filing
Administrative Charges Development
Exhibit 6B
Projection factor @ 2.4% per annum (1)
Account Billing Group Member
CY 2016 1.028 1.028 1.028
CY 2017 1.052 1.052 1.052
CY 2018 1.076 1.076 1.076
Eff Date Jul-16 1.040 1.040 1.040
Eff Date Aug-16 1.042 1.042 1.042
Eff Date Sep-16 1.044 1.044 1.044
Eff Date Oct-16 1.046 1.046 1.046
Eff Date Nov-16 1.048 1.048 1.048
Eff Date Dec-16 1.050 1.050 1.050
Eff Date Jan-17 1.052 1.052 1.052
Eff Date Feb-17 1.054 1.054 1.054
Eff Date Mar-17 1.056 1.056 1.056
Eff Date Apr-17 1.058 1.058 1.058
Eff Date May-17 1.060 1.060 1.060
Eff Date Jun-17 1.062 1.062 1.062
Eff Date Jul-17 1.064 1.064 1.064
Eff Date Aug-17 1.066 1.066 1.066
Eff Date Sep-17 1.068 1.068 1.068
Eff Date Oct-17 1.070 1.070 1.070
Note:
Trend Calculation
2015 % of Total
Employee costs: 37,575,893 55.7%
Salaries and taxes 27,971,678
Benefits 9,604,215
Purchased services * 19,537,724 29.0%
Other operating costs 10,306,647 15.3%
Subtotal administrative expenses 67,420,264 100.0%
Total Personnel Costs 78.5%
Trend for Personnel Costs 3.0%
Total Trend 2.4%
(1) Calendar year increase of 2.4% per annum, compounded to produce factors for
rating periods, from experience base period to the rating year with the indicated
Effective Date.
Projection Factors
Factor to
* We assumed that purchased costs have a similar ratio of personnel costs to total
costs as BCBSVT.
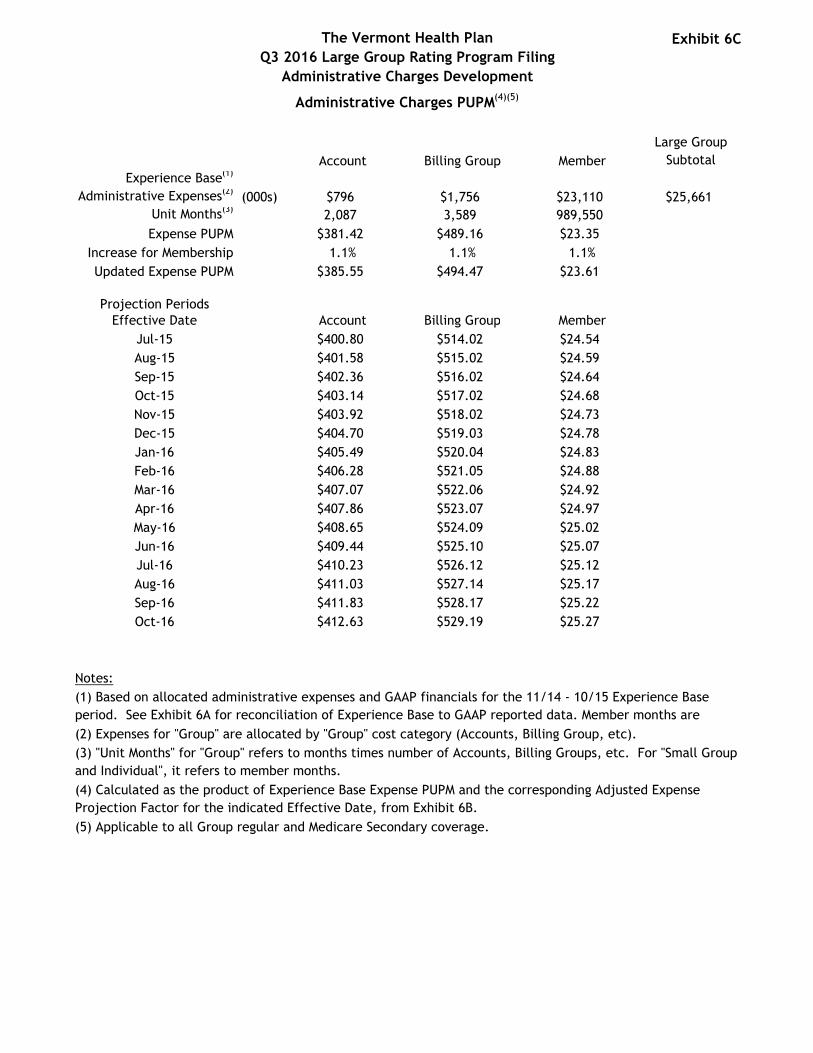
The Vermont Health Plan
Q3 2016 Large Group Rating Program Filing
Administrative Charges Development
Exhibit 6C
Account Billing Group Member
Large Group
Subtotal
Experience Base(1)
Administrative Expenses(2)(000s) $796 $1,756 $23,110 $25,661
Unit Months(3)2,087 3,589 989,550
Expense PUPM $381.42 $489.16 $23.35
Increase for Membership 1.1% 1.1% 1.1%
Updated Expense PUPM $385.55 $494.47 $23.61
Projection PeriodsEffective Date Account Billing Group Member
Jul-15 $400.80 $514.02 $24.54
Aug-15 $401.58 $515.02 $24.59
Sep-15 $402.36 $516.02 $24.64
Oct-15 $403.14 $517.02 $24.68
Nov-15 $403.92 $518.02 $24.73
Dec-15 $404.70 $519.03 $24.78
Jan-16 $405.49 $520.04 $24.83
Feb-16 $406.28 $521.05 $24.88
Mar-16 $407.07 $522.06 $24.92
Apr-16 $407.86 $523.07 $24.97
May-16 $408.65 $524.09 $25.02
Jun-16 $409.44 $525.10 $25.07
Jul-16 $410.23 $526.12 $25.12
Aug-16 $411.03 $527.14 $25.17
Sep-16 $411.83 $528.17 $25.22
Oct-16 $412.63 $529.19 $25.27
Notes:
(2) Expenses for "Group" are allocated by "Group" cost category (Accounts, Billing Group, etc).
(5) Applicable to all Group regular and Medicare Secondary coverage.
(4) Calculated as the product of Experience Base Expense PUPM and the corresponding Adjusted Expense
Projection Factor for the indicated Effective Date, from Exhibit 6B.
Administrative Charges PUPM(4)(5)
(1) Based on allocated administrative expenses and GAAP financials for the 11/14 - 10/15 Experience Base
period. See Exhibit 6A for reconciliation of Experience Base to GAAP reported data. Member months are
restated.
(3) "Unit Months" for "Group" refers to months times number of Accounts, Billing Groups, etc. For "Small Group
and Individual", it refers to member months.
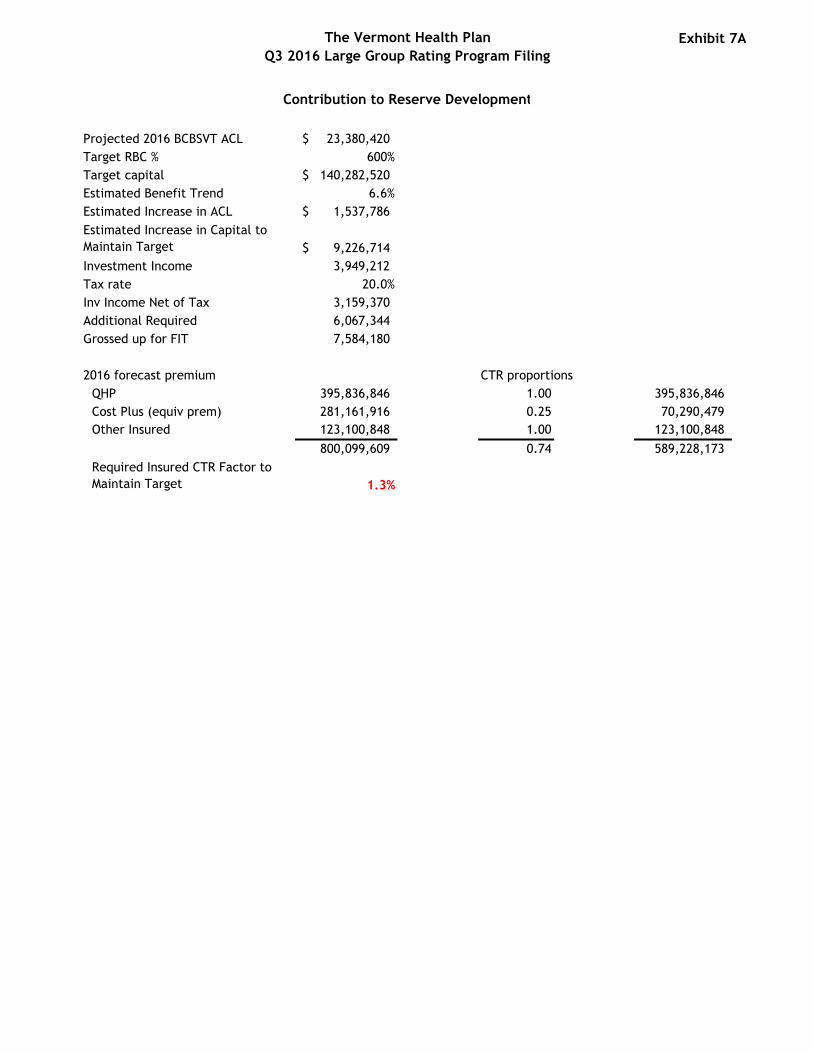
The Vermont Health Plan
Q3 2016 Large Group Rating Program Filing
Exhibit 7A
Contribution to Reserve Development
Projected 2016 BCBSVT ACL 23,380,420$
Target RBC % 600%
Target capital 140,282,520$
Estimated Benefit Trend 6.6%
Estimated Increase in ACL 1,537,786$
Estimated Increase in Capital to
Maintain Target 9,226,714$
Investment Income 3,949,212
Tax rate 20.0%
Inv Income Net of Tax 3,159,370
Additional Required 6,067,344
Grossed up for FIT 7,584,180
2016 forecast premium CTR proportions
QHP 395,836,846 1.00 395,836,846
Cost Plus (equiv prem) 281,161,916 0.25 70,290,479
Other Insured 123,100,848 1.00 123,100,848
800,099,609 0.74 589,228,173
Required Insured CTR Factor to
Maintain Target 1.3%
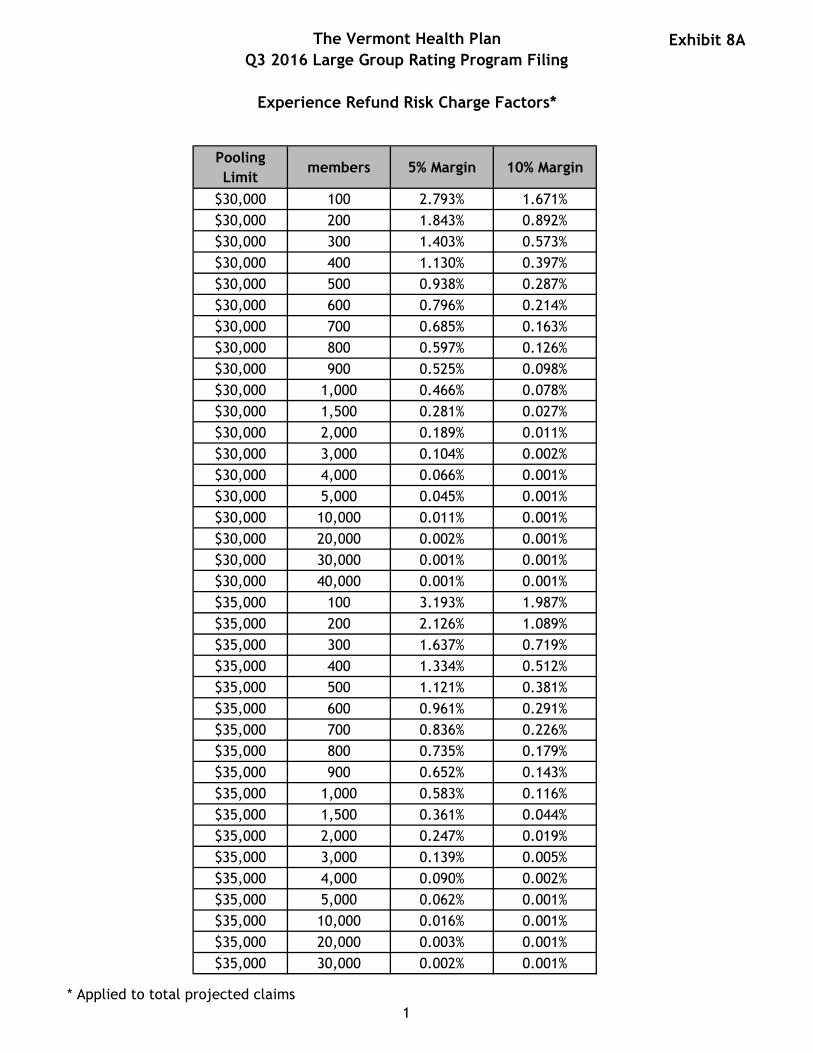
The Vermont Health Plan
Q3 2016 Large Group Rating Program Filing
Experience Refund Risk Charge Factors*
Exhibit 8A
Pooling
Limitmembers 5% Margin 10% Margin
$30,000 100 2.793% 1.671%
$30,000 200 1.843% 0.892%
$30,000 300 1.403% 0.573%
$30,000 400 1.130% 0.397%
$30,000 500 0.938% 0.287%
$30,000 600 0.796% 0.214%
$30,000 700 0.685% 0.163%
$30,000 800 0.597% 0.126%
$30,000 900 0.525% 0.098%
$30,000 1,000 0.466% 0.078%
$30,000 1,500 0.281% 0.027%
$30,000 2,000 0.189% 0.011%
$30,000 3,000 0.104% 0.002%
$30,000 4,000 0.066% 0.001%
$30,000 5,000 0.045% 0.001%
$30,000 10,000 0.011% 0.001%
$30,000 20,000 0.002% 0.001%
$30,000 30,000 0.001% 0.001%
$30,000 40,000 0.001% 0.001%
$35,000 100 3.193% 1.987%
$35,000 200 2.126% 1.089%
$35,000 300 1.637% 0.719%
$35,000 400 1.334% 0.512%
$35,000 500 1.121% 0.381%
$35,000 600 0.961% 0.291%
$35,000 700 0.836% 0.226%
$35,000 800 0.735% 0.179%
$35,000 900 0.652% 0.143%
$35,000 1,000 0.583% 0.116%
$35,000 1,500 0.361% 0.044%
$35,000 2,000 0.247% 0.019%
$35,000 3,000 0.139% 0.005%
$35,000 4,000 0.090% 0.002%
$35,000 5,000 0.062% 0.001%
$35,000 10,000 0.016% 0.001%
$35,000 20,000 0.003% 0.001%
$35,000 30,000 0.002% 0.001%
* Applied to total projected claims
1

The Vermont Health Plan
Q3 2016 Large Group Rating Program Filing
Experience Refund Risk Charge Factors*
Exhibit 8A
Pooling
Limitmembers 5% Margin 10% Margin
$35,000 40,000 0.001% 0.001%
$40,000 100 3.409% 2.151%
$40,000 200 2.276% 1.190%
$40,000 300 1.759% 0.792%
$40,000 400 1.439% 0.569%
$40,000 500 1.214% 0.427%
$40,000 600 1.045% 0.329%
$40,000 700 0.912% 0.258%
$40,000 800 0.804% 0.206%
$40,000 900 0.716% 0.166%
$40,000 1,000 0.641% 0.135%
$40,000 1,500 0.402% 0.053%
$40,000 2,000 0.277% 0.024%
$40,000 3,000 0.156% 0.006%
$40,000 4,000 0.102% 0.002%
$40,000 5,000 0.071% 0.001%
$40,000 10,000 0.019% 0.001%
$40,000 20,000 0.004% 0.001%
$40,000 30,000 0.002% 0.001%
$40,000 40,000 0.002% 0.001%
$45,000 100 3.622% 2.316%
$45,000 200 2.424% 1.292%
$45,000 300 1.880% 0.868%
$45,000 400 1.544% 0.629%
$45,000 500 1.307% 0.475%
$45,000 600 1.129% 0.369%
$45,000 700 0.989% 0.292%
$45,000 800 0.875% 0.234%
$45,000 900 0.781% 0.190%
$45,000 1,000 0.702% 0.156%
$45,000 1,500 0.445% 0.064%
$45,000 2,000 0.308% 0.029%
$45,000 3,000 0.175% 0.008%
$45,000 4,000 0.114% 0.003%
$45,000 5,000 0.081% 0.001%
$45,000 10,000 0.022% 0.001%
$45,000 20,000 0.004% 0.001%
* Applied to total projected claims
2
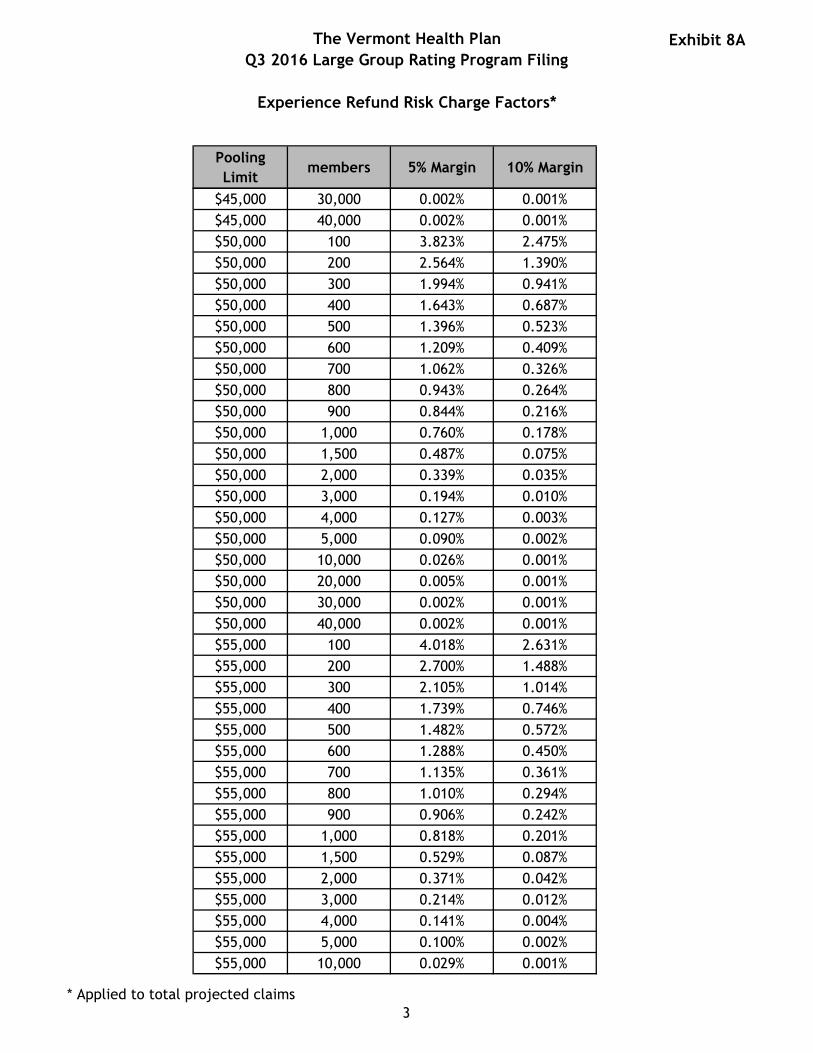
The Vermont Health Plan
Q3 2016 Large Group Rating Program Filing
Experience Refund Risk Charge Factors*
Exhibit 8A
Pooling
Limitmembers 5% Margin 10% Margin
$45,000 30,000 0.002% 0.001%
$45,000 40,000 0.002% 0.001%
$50,000 100 3.823% 2.475%
$50,000 200 2.564% 1.390%
$50,000 300 1.994% 0.941%
$50,000 400 1.643% 0.687%
$50,000 500 1.396% 0.523%
$50,000 600 1.209% 0.409%
$50,000 700 1.062% 0.326%
$50,000 800 0.943% 0.264%
$50,000 900 0.844% 0.216%
$50,000 1,000 0.760% 0.178%
$50,000 1,500 0.487% 0.075%
$50,000 2,000 0.339% 0.035%
$50,000 3,000 0.194% 0.010%
$50,000 4,000 0.127% 0.003%
$50,000 5,000 0.090% 0.002%
$50,000 10,000 0.026% 0.001%
$50,000 20,000 0.005% 0.001%
$50,000 30,000 0.002% 0.001%
$50,000 40,000 0.002% 0.001%
$55,000 100 4.018% 2.631%
$55,000 200 2.700% 1.488%
$55,000 300 2.105% 1.014%
$55,000 400 1.739% 0.746%
$55,000 500 1.482% 0.572%
$55,000 600 1.288% 0.450%
$55,000 700 1.135% 0.361%
$55,000 800 1.010% 0.294%
$55,000 900 0.906% 0.242%
$55,000 1,000 0.818% 0.201%
$55,000 1,500 0.529% 0.087%
$55,000 2,000 0.371% 0.042%
$55,000 3,000 0.214% 0.012%
$55,000 4,000 0.141% 0.004%
$55,000 5,000 0.100% 0.002%
$55,000 10,000 0.029% 0.001%
* Applied to total projected claims
3
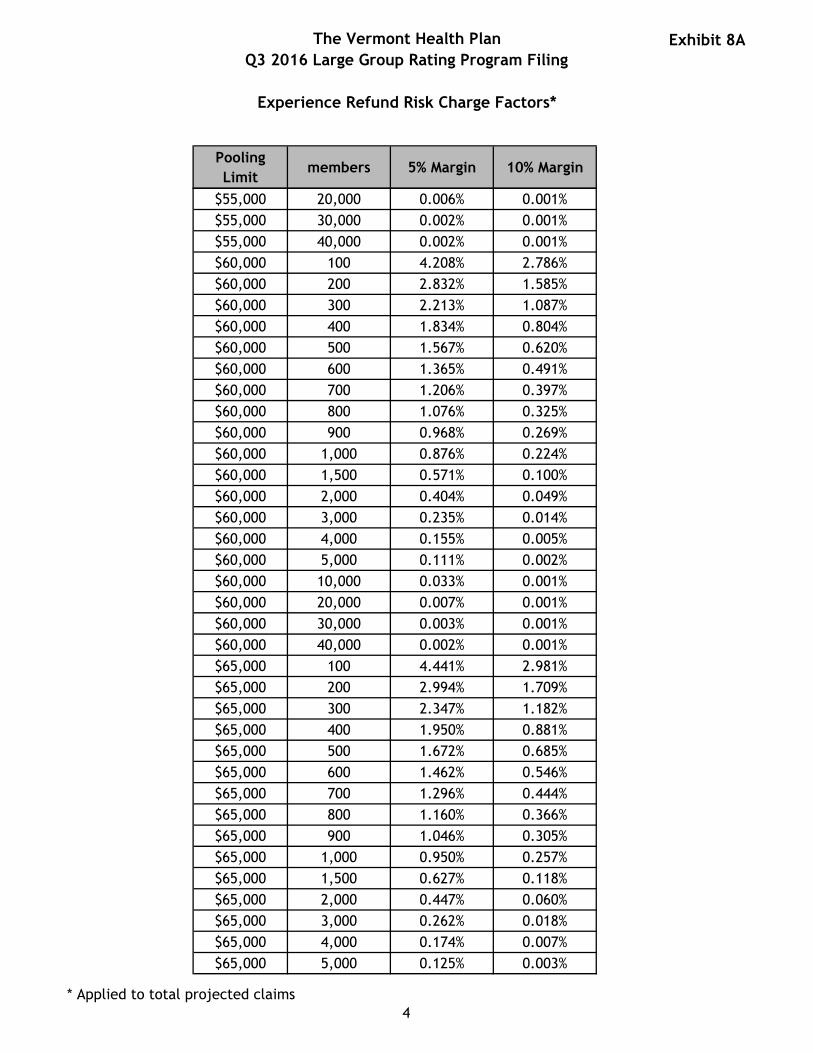
The Vermont Health Plan
Q3 2016 Large Group Rating Program Filing
Experience Refund Risk Charge Factors*
Exhibit 8A
Pooling
Limitmembers 5% Margin 10% Margin
$55,000 20,000 0.006% 0.001%
$55,000 30,000 0.002% 0.001%
$55,000 40,000 0.002% 0.001%
$60,000 100 4.208% 2.786%
$60,000 200 2.832% 1.585%
$60,000 300 2.213% 1.087%
$60,000 400 1.834% 0.804%
$60,000 500 1.567% 0.620%
$60,000 600 1.365% 0.491%
$60,000 700 1.206% 0.397%
$60,000 800 1.076% 0.325%
$60,000 900 0.968% 0.269%
$60,000 1,000 0.876% 0.224%
$60,000 1,500 0.571% 0.100%
$60,000 2,000 0.404% 0.049%
$60,000 3,000 0.235% 0.014%
$60,000 4,000 0.155% 0.005%
$60,000 5,000 0.111% 0.002%
$60,000 10,000 0.033% 0.001%
$60,000 20,000 0.007% 0.001%
$60,000 30,000 0.003% 0.001%
$60,000 40,000 0.002% 0.001%
$65,000 100 4.441% 2.981%
$65,000 200 2.994% 1.709%
$65,000 300 2.347% 1.182%
$65,000 400 1.950% 0.881%
$65,000 500 1.672% 0.685%
$65,000 600 1.462% 0.546%
$65,000 700 1.296% 0.444%
$65,000 800 1.160% 0.366%
$65,000 900 1.046% 0.305%
$65,000 1,000 0.950% 0.257%
$65,000 1,500 0.627% 0.118%
$65,000 2,000 0.447% 0.060%
$65,000 3,000 0.262% 0.018%
$65,000 4,000 0.174% 0.007%
$65,000 5,000 0.125% 0.003%
* Applied to total projected claims
4

The Vermont Health Plan
Q3 2016 Large Group Rating Program Filing
Experience Refund Risk Charge Factors*
Exhibit 8A
Pooling
Limitmembers 5% Margin 10% Margin
$65,000 10,000 0.039% 0.001%
$65,000 20,000 0.008% 0.001%
$65,000 30,000 0.003% 0.001%
$65,000 40,000 0.002% 0.001%
$70,000 100 4.646% 3.153%
$70,000 200 3.137% 1.819%
$70,000 300 2.464% 1.265%
$70,000 400 2.053% 0.949%
$70,000 500 1.765% 0.742%
$70,000 600 1.547% 0.596%
$70,000 700 1.375% 0.487%
$70,000 800 1.234% 0.404%
$70,000 900 1.116% 0.339%
$70,000 1,000 1.015% 0.286%
$70,000 1,500 0.677% 0.135%
$70,000 2,000 0.486% 0.070%
$70,000 3,000 0.288% 0.022%
$70,000 4,000 0.192% 0.008%
$70,000 5,000 0.138% 0.004%
$70,000 10,000 0.044% 0.001%
$70,000 20,000 0.009% 0.001%
$70,000 30,000 0.003% 0.001%
$70,000 40,000 0.002% 0.001%
$75,000 100 4.811% 3.291%
$75,000 200 3.252% 1.907%
$75,000 300 2.557% 1.331%
$75,000 400 2.134% 1.003%
$75,000 500 1.838% 0.788%
$75,000 600 1.614% 0.635%
$75,000 700 1.437% 0.521%
$75,000 800 1.292% 0.434%
$75,000 900 1.170% 0.365%
$75,000 1,000 1.067% 0.310%
$75,000 1,500 0.717% 0.149%
$75,000 2,000 0.517% 0.079%
$75,000 3,000 0.308% 0.026%
$75,000 4,000 0.206% 0.010%
* Applied to total projected claims
5

The Vermont Health Plan
Q3 2016 Large Group Rating Program Filing
Experience Refund Risk Charge Factors*
Exhibit 8A
Pooling
Limitmembers 5% Margin 10% Margin
$75,000 5,000 0.149% 0.004%
$75,000 10,000 0.048% 0.001%
$75,000 20,000 0.011% 0.001%
$75,000 30,000 0.004% 0.001%
$75,000 40,000 0.002% 0.001%
$80,000 100 5.023% 3.474%
$80,000 200 3.399% 2.023%
$80,000 300 2.678% 1.421%
$80,000 400 2.240% 1.076%
$80,000 500 1.933% 0.850%
$80,000 600 1.702% 0.689%
$80,000 700 1.519% 0.569%
$80,000 800 1.369% 0.476%
$80,000 900 1.243% 0.403%
$80,000 1,000 1.136% 0.344%
$80,000 1,500 0.770% 0.169%
$80,000 2,000 0.560% 0.091%
$80,000 3,000 0.337% 0.031%
$80,000 4,000 0.227% 0.012%
$80,000 5,000 0.164% 0.006%
$80,000 10,000 0.054% 0.001%
$80,000 20,000 0.012% 0.001%
$80,000 30,000 0.004% 0.001%
$80,000 40,000 0.002% 0.001%
$85,000 100 5.240% 3.662%
$85,000 200 3.549% 2.144%
$85,000 300 2.801% 1.513%
$85,000 400 2.347% 1.152%
$85,000 500 2.031% 0.915%
$85,000 600 1.792% 0.745%
$85,000 700 1.603% 0.619%
$85,000 800 1.447% 0.520%
$85,000 900 1.317% 0.442%
$85,000 1,000 1.206% 0.379%
$85,000 1,500 0.826% 0.191%
$85,000 2,000 0.605% 0.105%
$85,000 3,000 0.368% 0.037%
* Applied to total projected claims
6
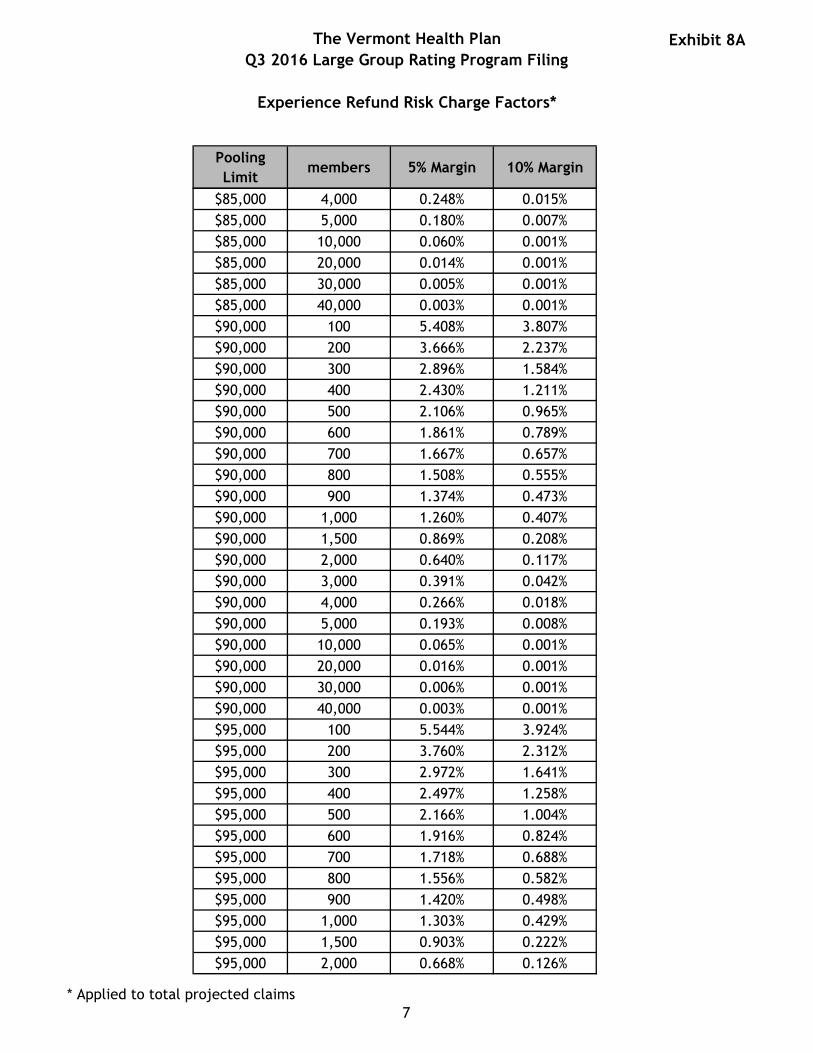
The Vermont Health Plan
Q3 2016 Large Group Rating Program Filing
Experience Refund Risk Charge Factors*
Exhibit 8A
Pooling
Limitmembers 5% Margin 10% Margin
$85,000 4,000 0.248% 0.015%
$85,000 5,000 0.180% 0.007%
$85,000 10,000 0.060% 0.001%
$85,000 20,000 0.014% 0.001%
$85,000 30,000 0.005% 0.001%
$85,000 40,000 0.003% 0.001%
$90,000 100 5.408% 3.807%
$90,000 200 3.666% 2.237%
$90,000 300 2.896% 1.584%
$90,000 400 2.430% 1.211%
$90,000 500 2.106% 0.965%
$90,000 600 1.861% 0.789%
$90,000 700 1.667% 0.657%
$90,000 800 1.508% 0.555%
$90,000 900 1.374% 0.473%
$90,000 1,000 1.260% 0.407%
$90,000 1,500 0.869% 0.208%
$90,000 2,000 0.640% 0.117%
$90,000 3,000 0.391% 0.042%
$90,000 4,000 0.266% 0.018%
$90,000 5,000 0.193% 0.008%
$90,000 10,000 0.065% 0.001%
$90,000 20,000 0.016% 0.001%
$90,000 30,000 0.006% 0.001%
$90,000 40,000 0.003% 0.001%
$95,000 100 5.544% 3.924%
$95,000 200 3.760% 2.312%
$95,000 300 2.972% 1.641%
$95,000 400 2.497% 1.258%
$95,000 500 2.166% 1.004%
$95,000 600 1.916% 0.824%
$95,000 700 1.718% 0.688%
$95,000 800 1.556% 0.582%
$95,000 900 1.420% 0.498%
$95,000 1,000 1.303% 0.429%
$95,000 1,500 0.903% 0.222%
$95,000 2,000 0.668% 0.126%
* Applied to total projected claims
7

The Vermont Health Plan
Q3 2016 Large Group Rating Program Filing
Experience Refund Risk Charge Factors*
Exhibit 8A
Pooling
Limitmembers 5% Margin 10% Margin
$95,000 3,000 0.411% 0.047%
$95,000 4,000 0.280% 0.020%
$95,000 5,000 0.204% 0.009%
$95,000 10,000 0.069% 0.001%
$95,000 20,000 0.017% 0.001%
$95,000 30,000 0.006% 0.001%
$95,000 40,000 0.003% 0.001%
$100,000 100 5.680% 4.041%
$100,000 200 3.854% 2.387%
$100,000 300 3.049% 1.698%
$100,000 400 2.563% 1.305%
$100,000 500 2.225% 1.044%
$100,000 600 1.971% 0.858%
$100,000 700 1.769% 0.719%
$100,000 800 1.604% 0.609%
$100,000 900 1.465% 0.522%
$100,000 1,000 1.346% 0.451%
$100,000 1,500 0.937% 0.237%
$100,000 2,000 0.696% 0.135%
$100,000 3,000 0.430% 0.051%
$100,000 4,000 0.294% 0.022%
$100,000 5,000 0.215% 0.010%
$100,000 10,000 0.074% 0.001%
$100,000 20,000 0.019% 0.001%
$100,000 30,000 0.007% 0.001%
$100,000 40,000 0.003% 0.001%
$105,000 100 5.812% 4.155%
$105,000 200 3.944% 2.460%
$105,000 300 3.122% 1.754%
$105,000 400 2.627% 1.350%
$105,000 500 2.283% 1.084%
$105,000 600 2.024% 0.893%
$105,000 700 1.819% 0.749%
$105,000 800 1.650% 0.637%
$105,000 900 1.509% 0.547%
$105,000 1,000 1.388% 0.474%
$105,000 1,500 0.970% 0.251%
* Applied to total projected claims
8
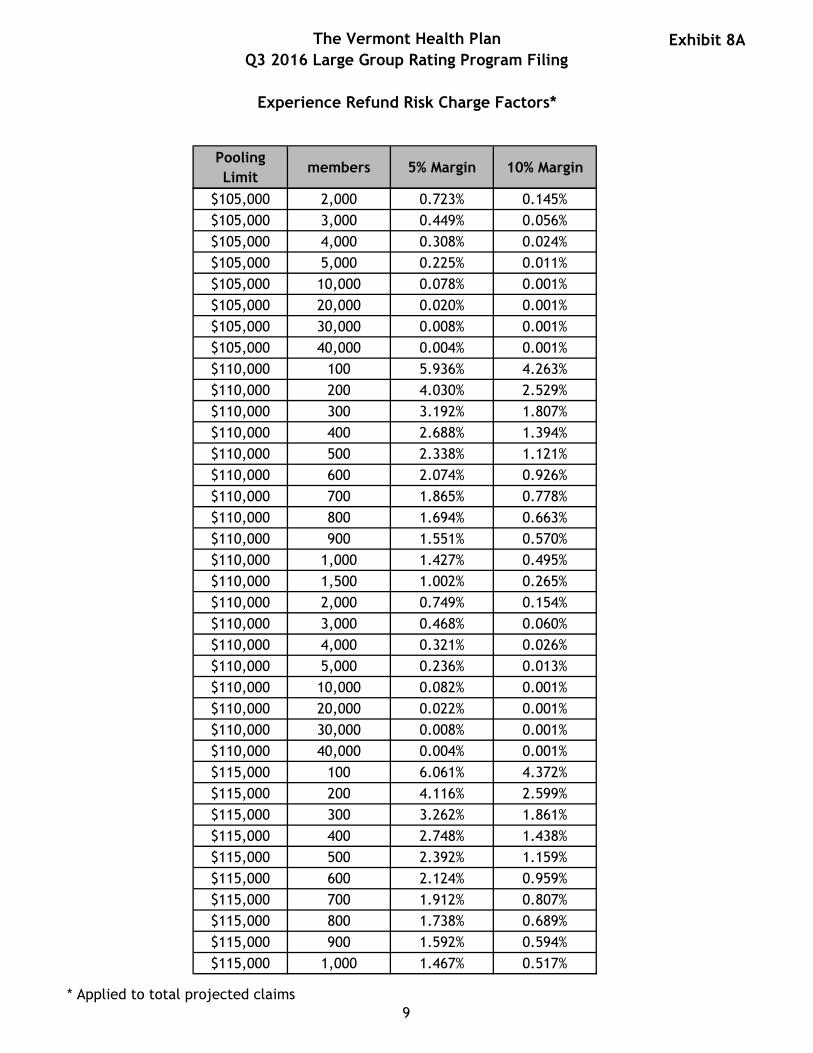
The Vermont Health Plan
Q3 2016 Large Group Rating Program Filing
Experience Refund Risk Charge Factors*
Exhibit 8A
Pooling
Limitmembers 5% Margin 10% Margin
$105,000 2,000 0.723% 0.145%
$105,000 3,000 0.449% 0.056%
$105,000 4,000 0.308% 0.024%
$105,000 5,000 0.225% 0.011%
$105,000 10,000 0.078% 0.001%
$105,000 20,000 0.020% 0.001%
$105,000 30,000 0.008% 0.001%
$105,000 40,000 0.004% 0.001%
$110,000 100 5.936% 4.263%
$110,000 200 4.030% 2.529%
$110,000 300 3.192% 1.807%
$110,000 400 2.688% 1.394%
$110,000 500 2.338% 1.121%
$110,000 600 2.074% 0.926%
$110,000 700 1.865% 0.778%
$110,000 800 1.694% 0.663%
$110,000 900 1.551% 0.570%
$110,000 1,000 1.427% 0.495%
$110,000 1,500 1.002% 0.265%
$110,000 2,000 0.749% 0.154%
$110,000 3,000 0.468% 0.060%
$110,000 4,000 0.321% 0.026%
$110,000 5,000 0.236% 0.013%
$110,000 10,000 0.082% 0.001%
$110,000 20,000 0.022% 0.001%
$110,000 30,000 0.008% 0.001%
$110,000 40,000 0.004% 0.001%
$115,000 100 6.061% 4.372%
$115,000 200 4.116% 2.599%
$115,000 300 3.262% 1.861%
$115,000 400 2.748% 1.438%
$115,000 500 2.392% 1.159%
$115,000 600 2.124% 0.959%
$115,000 700 1.912% 0.807%
$115,000 800 1.738% 0.689%
$115,000 900 1.592% 0.594%
$115,000 1,000 1.467% 0.517%
* Applied to total projected claims
9

The Vermont Health Plan
Q3 2016 Large Group Rating Program Filing
Experience Refund Risk Charge Factors*
Exhibit 8A
Pooling
Limitmembers 5% Margin 10% Margin
$115,000 1,500 1.034% 0.279%
$115,000 2,000 0.776% 0.164%
$115,000 3,000 0.487% 0.065%
$115,000 4,000 0.335% 0.029%
$115,000 5,000 0.246% 0.014%
$115,000 10,000 0.086% 0.001%
$115,000 20,000 0.023% 0.001%
$115,000 30,000 0.009% 0.001%
$115,000 40,000 0.004% 0.001%
$120,000 100 6.183% 4.478%
$120,000 200 4.200% 2.668%
$120,000 300 3.330% 1.913%
$120,000 400 2.807% 1.482%
$120,000 500 2.445% 1.196%
$120,000 600 2.173% 0.991%
$120,000 700 1.958% 0.836%
$120,000 800 1.781% 0.715%
$120,000 900 1.633% 0.618%
$120,000 1,000 1.506% 0.538%
$120,000 1,500 1.065% 0.293%
$120,000 2,000 0.802% 0.173%
$120,000 3,000 0.505% 0.070%
$120,000 4,000 0.349% 0.031%
$120,000 5,000 0.257% 0.015%
$120,000 10,000 0.091% 0.002%
$120,000 20,000 0.025% 0.001%
$120,000 30,000 0.009% 0.001%
$120,000 40,000 0.005% 0.001%
$125,000 100 6.295% 4.577%
$125,000 200 4.277% 2.731%
$125,000 300 3.393% 1.962%
$125,000 400 2.862% 1.522%
$125,000 500 2.495% 1.231%
$125,000 600 2.218% 1.022%
$125,000 700 2.000% 0.864%
$125,000 800 1.821% 0.740%
$125,000 900 1.670% 0.640%
* Applied to total projected claims
10
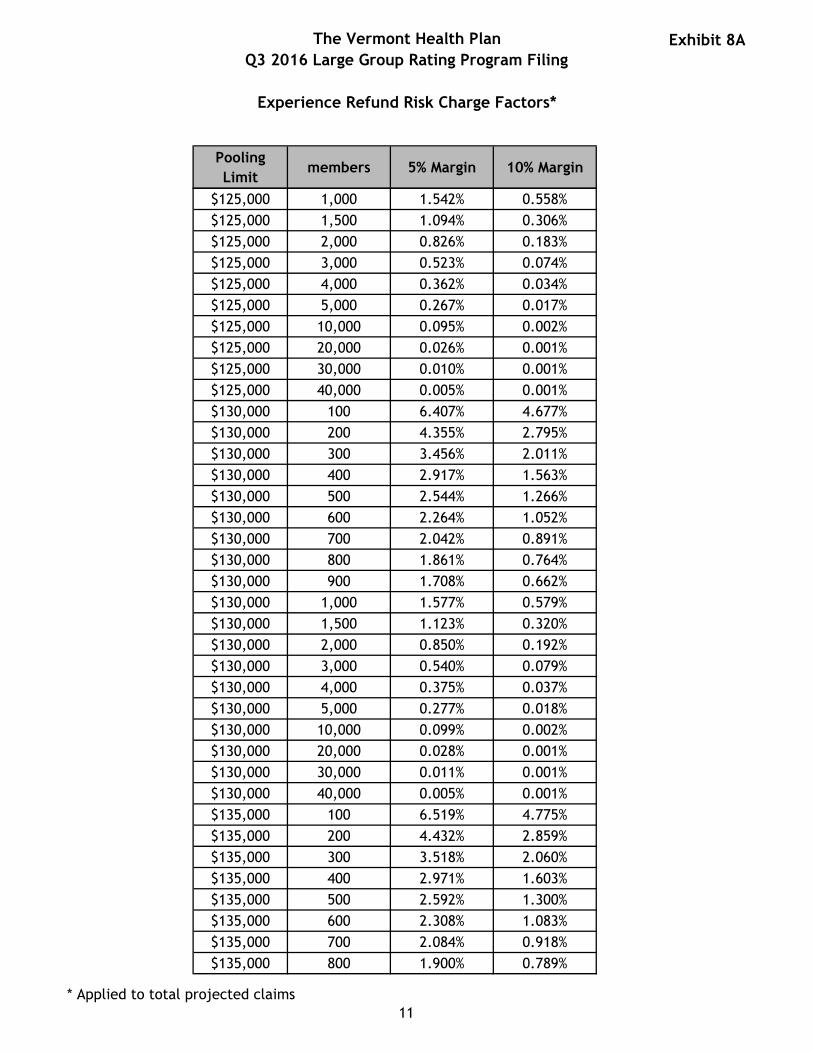
The Vermont Health Plan
Q3 2016 Large Group Rating Program Filing
Experience Refund Risk Charge Factors*
Exhibit 8A
Pooling
Limitmembers 5% Margin 10% Margin
$125,000 1,000 1.542% 0.558%
$125,000 1,500 1.094% 0.306%
$125,000 2,000 0.826% 0.183%
$125,000 3,000 0.523% 0.074%
$125,000 4,000 0.362% 0.034%
$125,000 5,000 0.267% 0.017%
$125,000 10,000 0.095% 0.002%
$125,000 20,000 0.026% 0.001%
$125,000 30,000 0.010% 0.001%
$125,000 40,000 0.005% 0.001%
$130,000 100 6.407% 4.677%
$130,000 200 4.355% 2.795%
$130,000 300 3.456% 2.011%
$130,000 400 2.917% 1.563%
$130,000 500 2.544% 1.266%
$130,000 600 2.264% 1.052%
$130,000 700 2.042% 0.891%
$130,000 800 1.861% 0.764%
$130,000 900 1.708% 0.662%
$130,000 1,000 1.577% 0.579%
$130,000 1,500 1.123% 0.320%
$130,000 2,000 0.850% 0.192%
$130,000 3,000 0.540% 0.079%
$130,000 4,000 0.375% 0.037%
$130,000 5,000 0.277% 0.018%
$130,000 10,000 0.099% 0.002%
$130,000 20,000 0.028% 0.001%
$130,000 30,000 0.011% 0.001%
$130,000 40,000 0.005% 0.001%
$135,000 100 6.519% 4.775%
$135,000 200 4.432% 2.859%
$135,000 300 3.518% 2.060%
$135,000 400 2.971% 1.603%
$135,000 500 2.592% 1.300%
$135,000 600 2.308% 1.083%
$135,000 700 2.084% 0.918%
$135,000 800 1.900% 0.789%
* Applied to total projected claims
11
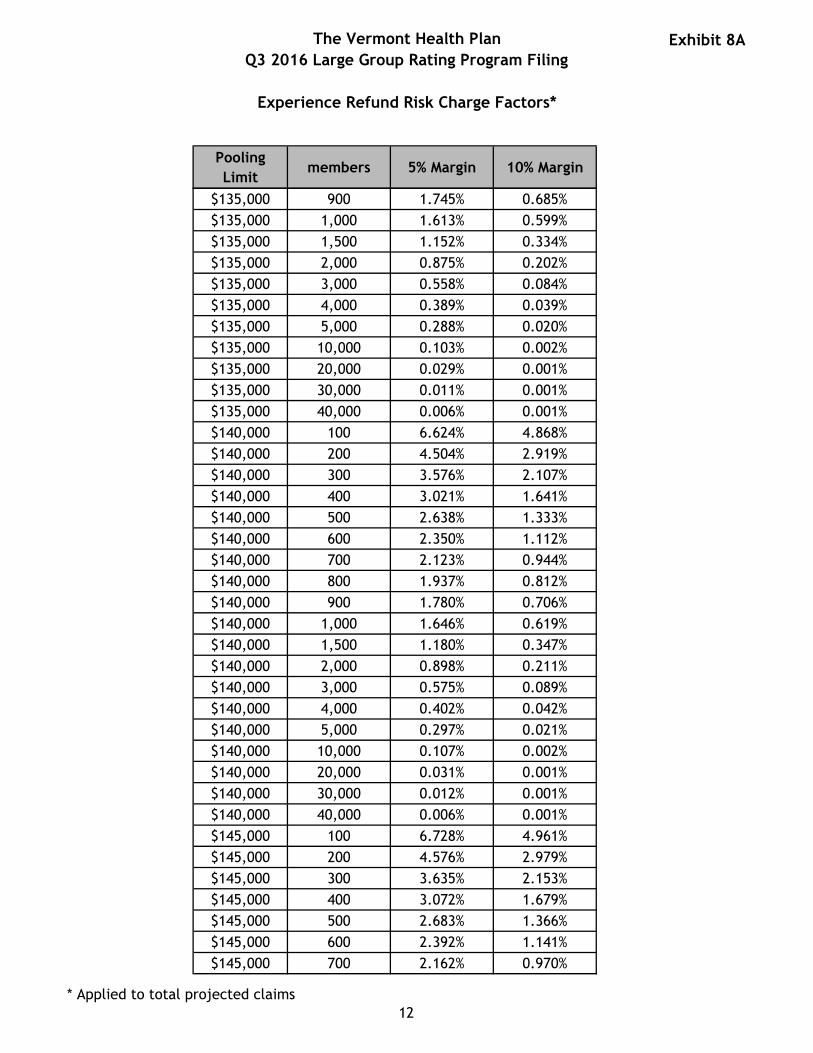
The Vermont Health Plan
Q3 2016 Large Group Rating Program Filing
Experience Refund Risk Charge Factors*
Exhibit 8A
Pooling
Limitmembers 5% Margin 10% Margin
$135,000 900 1.745% 0.685%
$135,000 1,000 1.613% 0.599%
$135,000 1,500 1.152% 0.334%
$135,000 2,000 0.875% 0.202%
$135,000 3,000 0.558% 0.084%
$135,000 4,000 0.389% 0.039%
$135,000 5,000 0.288% 0.020%
$135,000 10,000 0.103% 0.002%
$135,000 20,000 0.029% 0.001%
$135,000 30,000 0.011% 0.001%
$135,000 40,000 0.006% 0.001%
$140,000 100 6.624% 4.868%
$140,000 200 4.504% 2.919%
$140,000 300 3.576% 2.107%
$140,000 400 3.021% 1.641%
$140,000 500 2.638% 1.333%
$140,000 600 2.350% 1.112%
$140,000 700 2.123% 0.944%
$140,000 800 1.937% 0.812%
$140,000 900 1.780% 0.706%
$140,000 1,000 1.646% 0.619%
$140,000 1,500 1.180% 0.347%
$140,000 2,000 0.898% 0.211%
$140,000 3,000 0.575% 0.089%
$140,000 4,000 0.402% 0.042%
$140,000 5,000 0.297% 0.021%
$140,000 10,000 0.107% 0.002%
$140,000 20,000 0.031% 0.001%
$140,000 30,000 0.012% 0.001%
$140,000 40,000 0.006% 0.001%
$145,000 100 6.728% 4.961%
$145,000 200 4.576% 2.979%
$145,000 300 3.635% 2.153%
$145,000 400 3.072% 1.679%
$145,000 500 2.683% 1.366%
$145,000 600 2.392% 1.141%
$145,000 700 2.162% 0.970%
* Applied to total projected claims
12

The Vermont Health Plan
Q3 2016 Large Group Rating Program Filing
Experience Refund Risk Charge Factors*
Exhibit 8A
Pooling
Limitmembers 5% Margin 10% Margin
$145,000 800 1.974% 0.836%
$145,000 900 1.815% 0.727%
$145,000 1,000 1.679% 0.638%
$145,000 1,500 1.207% 0.360%
$145,000 2,000 0.921% 0.220%
$145,000 3,000 0.592% 0.094%
$145,000 4,000 0.414% 0.045%
$145,000 5,000 0.308% 0.023%
$145,000 10,000 0.111% 0.002%
$145,000 20,000 0.032% 0.001%
$145,000 30,000 0.013% 0.001%
$145,000 40,000 0.006% 0.001%
$150,000 100 6.832% 5.054%
$150,000 200 4.648% 3.039%
$150,000 300 3.693% 2.199%
$150,000 400 3.122% 1.718%
$150,000 500 2.729% 1.399%
$150,000 600 2.434% 1.170%
$150,000 700 2.201% 0.996%
$150,000 800 2.010% 0.859%
$150,000 900 1.850% 0.749%
$150,000 1,000 1.712% 0.658%
$150,000 1,500 1.234% 0.373%
$150,000 2,000 0.944% 0.230%
$150,000 3,000 0.609% 0.099%
$150,000 4,000 0.428% 0.048%
$150,000 5,000 0.318% 0.025%
$150,000 10,000 0.115% 0.002%
$150,000 20,000 0.034% 0.001%
$150,000 30,000 0.013% 0.001%
$150,000 40,000 0.007% 0.001%
$155,000 100 6.930% 5.142%
$155,000 200 4.715% 3.096%
$155,000 300 3.748% 2.243%
$155,000 400 3.170% 1.754%
$155,000 500 2.771% 1.430%
$155,000 600 2.473% 1.197%
* Applied to total projected claims
13
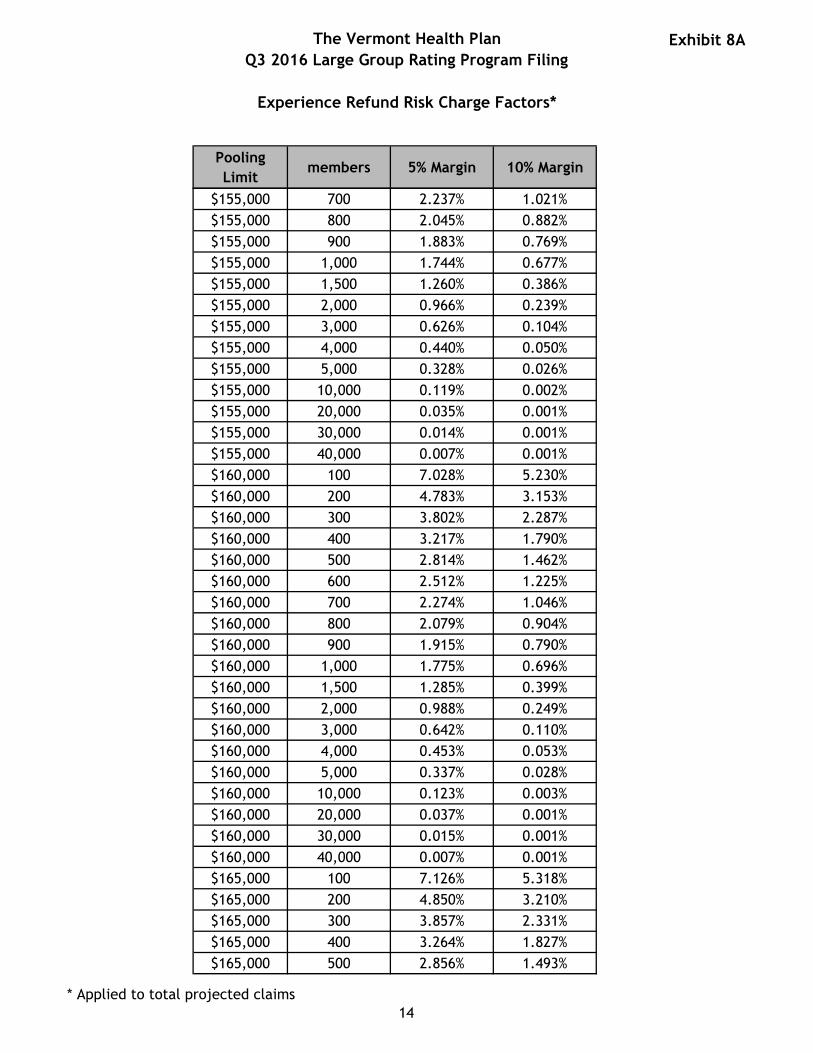
The Vermont Health Plan
Q3 2016 Large Group Rating Program Filing
Experience Refund Risk Charge Factors*
Exhibit 8A
Pooling
Limitmembers 5% Margin 10% Margin
$155,000 700 2.237% 1.021%
$155,000 800 2.045% 0.882%
$155,000 900 1.883% 0.769%
$155,000 1,000 1.744% 0.677%
$155,000 1,500 1.260% 0.386%
$155,000 2,000 0.966% 0.239%
$155,000 3,000 0.626% 0.104%
$155,000 4,000 0.440% 0.050%
$155,000 5,000 0.328% 0.026%
$155,000 10,000 0.119% 0.002%
$155,000 20,000 0.035% 0.001%
$155,000 30,000 0.014% 0.001%
$155,000 40,000 0.007% 0.001%
$160,000 100 7.028% 5.230%
$160,000 200 4.783% 3.153%
$160,000 300 3.802% 2.287%
$160,000 400 3.217% 1.790%
$160,000 500 2.814% 1.462%
$160,000 600 2.512% 1.225%
$160,000 700 2.274% 1.046%
$160,000 800 2.079% 0.904%
$160,000 900 1.915% 0.790%
$160,000 1,000 1.775% 0.696%
$160,000 1,500 1.285% 0.399%
$160,000 2,000 0.988% 0.249%
$160,000 3,000 0.642% 0.110%
$160,000 4,000 0.453% 0.053%
$160,000 5,000 0.337% 0.028%
$160,000 10,000 0.123% 0.003%
$160,000 20,000 0.037% 0.001%
$160,000 30,000 0.015% 0.001%
$160,000 40,000 0.007% 0.001%
$165,000 100 7.126% 5.318%
$165,000 200 4.850% 3.210%
$165,000 300 3.857% 2.331%
$165,000 400 3.264% 1.827%
$165,000 500 2.856% 1.493%
* Applied to total projected claims
14

The Vermont Health Plan
Q3 2016 Large Group Rating Program Filing
Experience Refund Risk Charge Factors*
Exhibit 8A
Pooling
Limitmembers 5% Margin 10% Margin
$165,000 600 2.551% 1.253%
$165,000 700 2.310% 1.070%
$165,000 800 2.113% 0.927%
$165,000 900 1.948% 0.811%
$165,000 1,000 1.806% 0.715%
$165,000 1,500 1.311% 0.413%
$165,000 2,000 1.009% 0.258%
$165,000 3,000 0.658% 0.115%
$165,000 4,000 0.465% 0.056%
$165,000 5,000 0.347% 0.030%
$165,000 10,000 0.127% 0.003%
$165,000 20,000 0.038% 0.001%
$165,000 30,000 0.016% 0.001%
$165,000 40,000 0.008% 0.001%
$170,000 100 7.221% 5.403%
$170,000 200 4.916% 3.266%
$170,000 300 3.910% 2.374%
$170,000 400 3.310% 1.863%
$170,000 500 2.897% 1.524%
$170,000 600 2.589% 1.280%
$170,000 700 2.346% 1.095%
$170,000 800 2.147% 0.949%
$170,000 900 1.979% 0.831%
$170,000 1,000 1.836% 0.733%
$170,000 1,500 1.336% 0.426%
$170,000 2,000 1.031% 0.268%
$170,000 3,000 0.675% 0.120%
$170,000 4,000 0.478% 0.060%
$170,000 5,000 0.357% 0.032%
$170,000 10,000 0.132% 0.003%
$170,000 20,000 0.040% 0.001%
$170,000 30,000 0.016% 0.001%
$170,000 40,000 0.008% 0.001%
$175,000 100 7.316% 5.489%
$175,000 200 4.981% 3.322%
$175,000 300 3.962% 2.417%
$175,000 400 3.356% 1.898%
* Applied to total projected claims
15
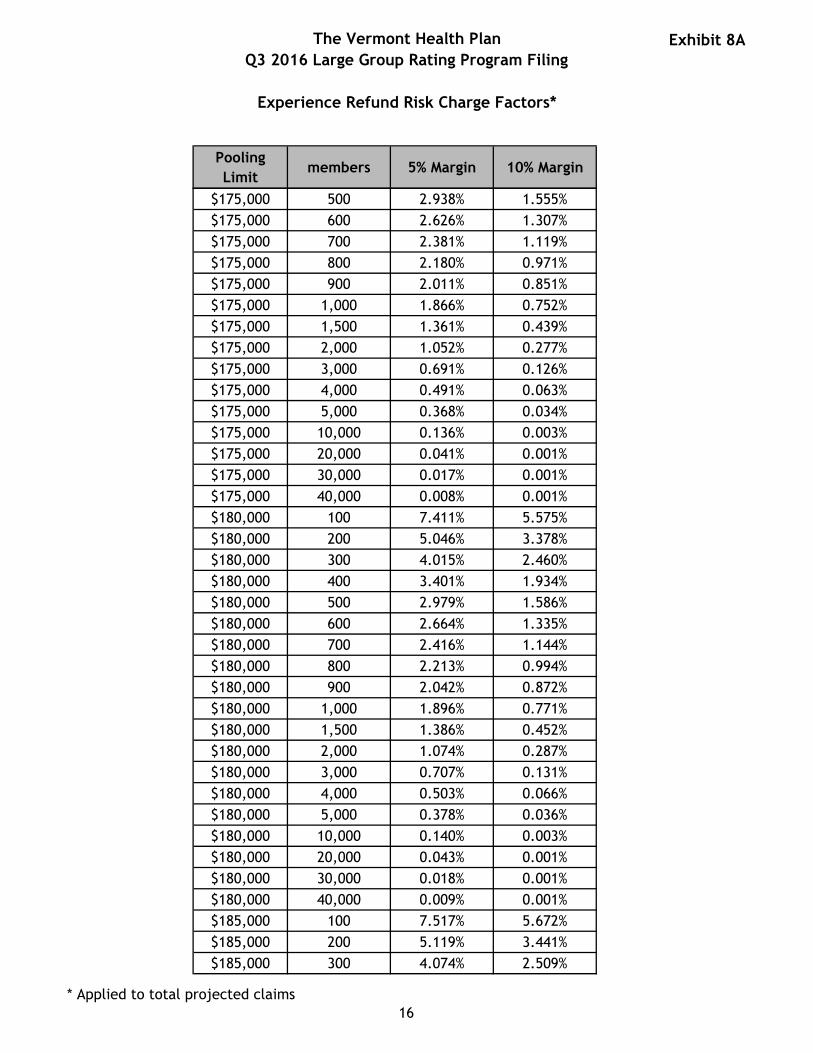
The Vermont Health Plan
Q3 2016 Large Group Rating Program Filing
Experience Refund Risk Charge Factors*
Exhibit 8A
Pooling
Limitmembers 5% Margin 10% Margin
$175,000 500 2.938% 1.555%
$175,000 600 2.626% 1.307%
$175,000 700 2.381% 1.119%
$175,000 800 2.180% 0.971%
$175,000 900 2.011% 0.851%
$175,000 1,000 1.866% 0.752%
$175,000 1,500 1.361% 0.439%
$175,000 2,000 1.052% 0.277%
$175,000 3,000 0.691% 0.126%
$175,000 4,000 0.491% 0.063%
$175,000 5,000 0.368% 0.034%
$175,000 10,000 0.136% 0.003%
$175,000 20,000 0.041% 0.001%
$175,000 30,000 0.017% 0.001%
$175,000 40,000 0.008% 0.001%
$180,000 100 7.411% 5.575%
$180,000 200 5.046% 3.378%
$180,000 300 4.015% 2.460%
$180,000 400 3.401% 1.934%
$180,000 500 2.979% 1.586%
$180,000 600 2.664% 1.335%
$180,000 700 2.416% 1.144%
$180,000 800 2.213% 0.994%
$180,000 900 2.042% 0.872%
$180,000 1,000 1.896% 0.771%
$180,000 1,500 1.386% 0.452%
$180,000 2,000 1.074% 0.287%
$180,000 3,000 0.707% 0.131%
$180,000 4,000 0.503% 0.066%
$180,000 5,000 0.378% 0.036%
$180,000 10,000 0.140% 0.003%
$180,000 20,000 0.043% 0.001%
$180,000 30,000 0.018% 0.001%
$180,000 40,000 0.009% 0.001%
$185,000 100 7.517% 5.672%
$185,000 200 5.119% 3.441%
$185,000 300 4.074% 2.509%
* Applied to total projected claims
16
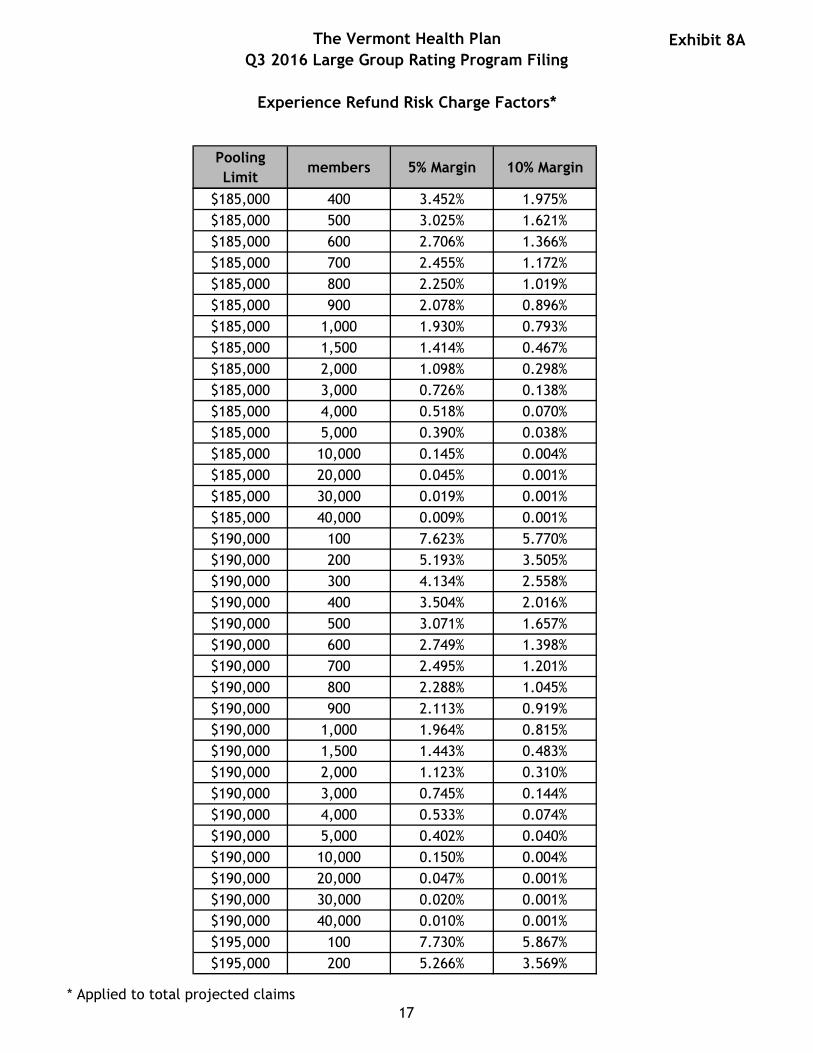
The Vermont Health Plan
Q3 2016 Large Group Rating Program Filing
Experience Refund Risk Charge Factors*
Exhibit 8A
Pooling
Limitmembers 5% Margin 10% Margin
$185,000 400 3.452% 1.975%
$185,000 500 3.025% 1.621%
$185,000 600 2.706% 1.366%
$185,000 700 2.455% 1.172%
$185,000 800 2.250% 1.019%
$185,000 900 2.078% 0.896%
$185,000 1,000 1.930% 0.793%
$185,000 1,500 1.414% 0.467%
$185,000 2,000 1.098% 0.298%
$185,000 3,000 0.726% 0.138%
$185,000 4,000 0.518% 0.070%
$185,000 5,000 0.390% 0.038%
$185,000 10,000 0.145% 0.004%
$185,000 20,000 0.045% 0.001%
$185,000 30,000 0.019% 0.001%
$185,000 40,000 0.009% 0.001%
$190,000 100 7.623% 5.770%
$190,000 200 5.193% 3.505%
$190,000 300 4.134% 2.558%
$190,000 400 3.504% 2.016%
$190,000 500 3.071% 1.657%
$190,000 600 2.749% 1.398%
$190,000 700 2.495% 1.201%
$190,000 800 2.288% 1.045%
$190,000 900 2.113% 0.919%
$190,000 1,000 1.964% 0.815%
$190,000 1,500 1.443% 0.483%
$190,000 2,000 1.123% 0.310%
$190,000 3,000 0.745% 0.144%
$190,000 4,000 0.533% 0.074%
$190,000 5,000 0.402% 0.040%
$190,000 10,000 0.150% 0.004%
$190,000 20,000 0.047% 0.001%
$190,000 30,000 0.020% 0.001%
$190,000 40,000 0.010% 0.001%
$195,000 100 7.730% 5.867%
$195,000 200 5.266% 3.569%
* Applied to total projected claims
17
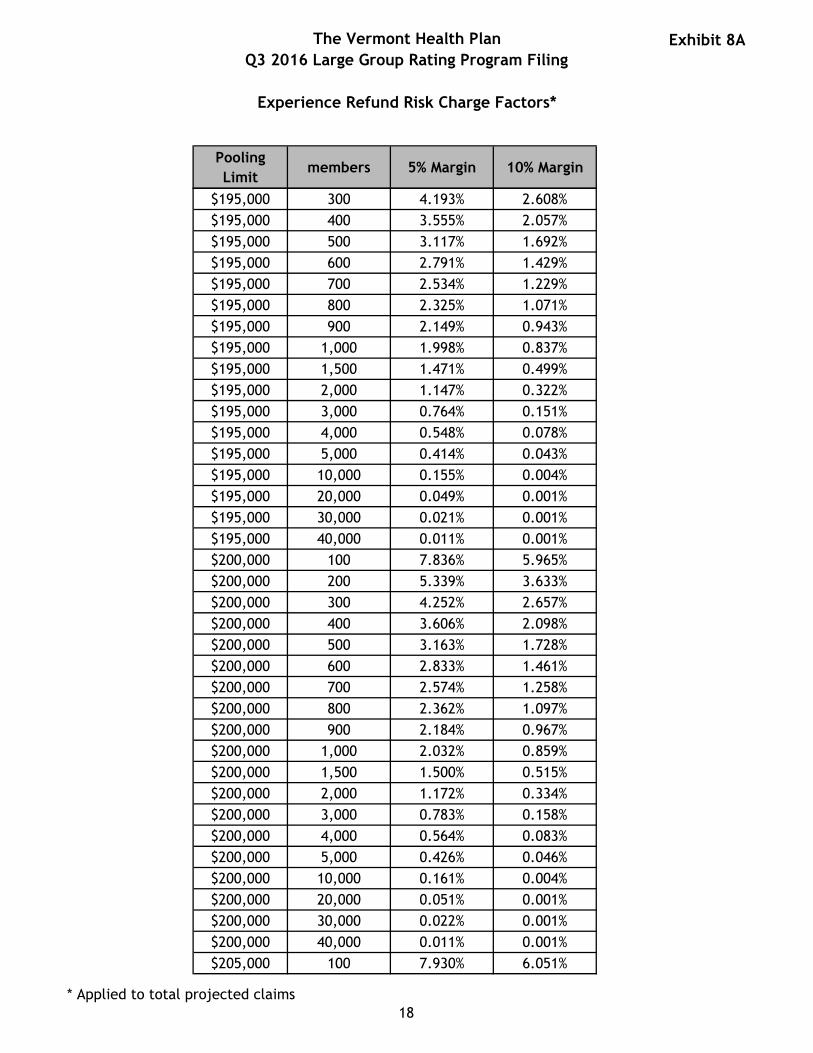
The Vermont Health Plan
Q3 2016 Large Group Rating Program Filing
Experience Refund Risk Charge Factors*
Exhibit 8A
Pooling
Limitmembers 5% Margin 10% Margin
$195,000 300 4.193% 2.608%
$195,000 400 3.555% 2.057%
$195,000 500 3.117% 1.692%
$195,000 600 2.791% 1.429%
$195,000 700 2.534% 1.229%
$195,000 800 2.325% 1.071%
$195,000 900 2.149% 0.943%
$195,000 1,000 1.998% 0.837%
$195,000 1,500 1.471% 0.499%
$195,000 2,000 1.147% 0.322%
$195,000 3,000 0.764% 0.151%
$195,000 4,000 0.548% 0.078%
$195,000 5,000 0.414% 0.043%
$195,000 10,000 0.155% 0.004%
$195,000 20,000 0.049% 0.001%
$195,000 30,000 0.021% 0.001%
$195,000 40,000 0.011% 0.001%
$200,000 100 7.836% 5.965%
$200,000 200 5.339% 3.633%
$200,000 300 4.252% 2.657%
$200,000 400 3.606% 2.098%
$200,000 500 3.163% 1.728%
$200,000 600 2.833% 1.461%
$200,000 700 2.574% 1.258%
$200,000 800 2.362% 1.097%
$200,000 900 2.184% 0.967%
$200,000 1,000 2.032% 0.859%
$200,000 1,500 1.500% 0.515%
$200,000 2,000 1.172% 0.334%
$200,000 3,000 0.783% 0.158%
$200,000 4,000 0.564% 0.083%
$200,000 5,000 0.426% 0.046%
$200,000 10,000 0.161% 0.004%
$200,000 20,000 0.051% 0.001%
$200,000 30,000 0.022% 0.001%
$200,000 40,000 0.011% 0.001%
$205,000 100 7.930% 6.051%
* Applied to total projected claims
18

The Vermont Health Plan
Q3 2016 Large Group Rating Program Filing
Experience Refund Risk Charge Factors*
Exhibit 8A
Pooling
Limitmembers 5% Margin 10% Margin
$205,000 200 5.404% 3.689%
$205,000 300 4.304% 2.701%
$205,000 400 3.651% 2.135%
$205,000 500 3.204% 1.759%
$205,000 600 2.870% 1.489%
$205,000 700 2.609% 1.283%
$205,000 800 2.395% 1.120%
$205,000 900 2.215% 0.988%
$205,000 1,000 2.061% 0.879%
$205,000 1,500 1.524% 0.529%
$205,000 2,000 1.194% 0.344%
$205,000 3,000 0.800% 0.165%
$205,000 4,000 0.577% 0.086%
$205,000 5,000 0.437% 0.048%
$205,000 10,000 0.165% 0.005%
$205,000 20,000 0.053% 0.001%
$205,000 30,000 0.023% 0.001%
$205,000 40,000 0.012% 0.001%
$210,000 100 8.018% 6.132%
$210,000 200 5.464% 3.742%
$210,000 300 4.353% 2.742%
$210,000 400 3.693% 2.169%
$210,000 500 3.242% 1.789%
$210,000 600 2.905% 1.515%
$210,000 700 2.641% 1.307%
$210,000 800 2.425% 1.142%
$210,000 900 2.244% 1.008%
$210,000 1,000 2.089% 0.897%
$210,000 1,500 1.548% 0.542%
$210,000 2,000 1.214% 0.354%
$210,000 3,000 0.816% 0.171%
$210,000 4,000 0.590% 0.090%
$210,000 5,000 0.447% 0.051%
$210,000 10,000 0.170% 0.005%
$210,000 20,000 0.055% 0.001%
$210,000 30,000 0.024% 0.001%
$210,000 40,000 0.012% 0.001%
* Applied to total projected claims
19

The Vermont Health Plan
Q3 2016 Large Group Rating Program Filing
Experience Refund Risk Charge Factors*
Exhibit 8A
Pooling
Limitmembers 5% Margin 10% Margin
$215,000 100 8.106% 6.213%
$215,000 200 5.525% 3.795%
$215,000 300 4.402% 2.783%
$215,000 400 3.736% 2.203%
$215,000 500 3.279% 1.819%
$215,000 600 2.940% 1.542%
$215,000 700 2.673% 1.331%
$215,000 800 2.456% 1.164%
$215,000 900 2.273% 1.028%
$215,000 1,000 2.117% 0.916%
$215,000 1,500 1.571% 0.555%
$215,000 2,000 1.234% 0.364%
$215,000 3,000 0.832% 0.177%
$215,000 4,000 0.603% 0.094%
$215,000 5,000 0.458% 0.053%
$215,000 10,000 0.174% 0.005%
$215,000 20,000 0.056% 0.001%
$215,000 30,000 0.025% 0.001%
$215,000 40,000 0.013% 0.001%
$220,000 100 8.194% 6.294%
$220,000 200 5.585% 3.848%
$220,000 300 4.451% 2.824%
$220,000 400 3.778% 2.237%
$220,000 500 3.317% 1.848%
$220,000 600 2.975% 1.568%
$220,000 700 2.706% 1.354%
$220,000 800 2.486% 1.186%
$220,000 900 2.302% 1.048%
$220,000 1,000 2.145% 0.934%
$220,000 1,500 1.594% 0.569%
$220,000 2,000 1.254% 0.374%
$220,000 3,000 0.848% 0.183%
$220,000 4,000 0.615% 0.098%
$220,000 5,000 0.468% 0.056%
$220,000 10,000 0.179% 0.006%
$220,000 20,000 0.058% 0.001%
$220,000 30,000 0.026% 0.001%
* Applied to total projected claims
20

The Vermont Health Plan
Q3 2016 Large Group Rating Program Filing
Experience Refund Risk Charge Factors*
Exhibit 8A
Pooling
Limitmembers 5% Margin 10% Margin
$220,000 40,000 0.013% 0.001%
$225,000 100 8.281% 6.375%
$225,000 200 5.646% 3.901%
$225,000 300 4.499% 2.866%
$225,000 400 3.820% 2.272%
$225,000 500 3.355% 1.878%
$225,000 600 3.009% 1.594%
$225,000 700 2.738% 1.378%
$225,000 800 2.516% 1.207%
$225,000 900 2.331% 1.068%
$225,000 1,000 2.172% 0.953%
$225,000 1,500 1.617% 0.582%
$225,000 2,000 1.275% 0.384%
$225,000 3,000 0.864% 0.189%
$225,000 4,000 0.628% 0.102%
$225,000 5,000 0.479% 0.058%
$225,000 10,000 0.184% 0.006%
$225,000 20,000 0.060% 0.001%
$225,000 30,000 0.027% 0.001%
$225,000 40,000 0.014% 0.001%
$230,000 100 8.369% 6.456%
$230,000 200 5.706% 3.955%
$230,000 300 4.548% 2.907%
$230,000 400 3.862% 2.306%
$230,000 500 3.393% 1.908%
$230,000 600 3.044% 1.621%
$230,000 700 2.770% 1.402%
$230,000 800 2.547% 1.229%
$230,000 900 2.360% 1.088%
$230,000 1,000 2.200% 0.972%
$230,000 1,500 1.641% 0.596%
$230,000 2,000 1.295% 0.395%
$230,000 3,000 0.880% 0.195%
$230,000 4,000 0.641% 0.106%
$230,000 5,000 0.489% 0.061%
$230,000 10,000 0.188% 0.007%
$230,000 20,000 0.062% 0.001%
* Applied to total projected claims
21

The Vermont Health Plan
Q3 2016 Large Group Rating Program Filing
Experience Refund Risk Charge Factors*
Exhibit 8A
Pooling
Limitmembers 5% Margin 10% Margin
$230,000 30,000 0.028% 0.001%
$230,000 40,000 0.014% 0.001%
$235,000 100 8.450% 6.530%
$235,000 200 5.762% 4.003%
$235,000 300 4.593% 2.945%
$235,000 400 3.900% 2.337%
$235,000 500 3.427% 1.935%
$235,000 600 3.075% 1.645%
$235,000 700 2.799% 1.424%
$235,000 800 2.575% 1.249%
$235,000 900 2.386% 1.107%
$235,000 1,000 2.225% 0.989%
$235,000 1,500 1.662% 0.608%
$235,000 2,000 1.313% 0.404%
$235,000 3,000 0.895% 0.201%
$235,000 4,000 0.653% 0.110%
$235,000 5,000 0.499% 0.063%
$235,000 10,000 0.193% 0.007%
$235,000 20,000 0.064% 0.001%
$235,000 30,000 0.029% 0.001%
$235,000 40,000 0.015% 0.001%
$240,000 100 8.514% 6.589%
$240,000 200 5.806% 4.042%
$240,000 300 4.628% 2.975%
$240,000 400 3.931% 2.362%
$240,000 500 3.454% 1.957%
$240,000 600 3.100% 1.664%
$240,000 700 2.823% 1.441%
$240,000 800 2.597% 1.265%
$240,000 900 2.407% 1.122%
$240,000 1,000 2.245% 1.002%
$240,000 1,500 1.678% 0.618%
$240,000 2,000 1.328% 0.412%
$240,000 3,000 0.906% 0.206%
$240,000 4,000 0.663% 0.113%
$240,000 5,000 0.507% 0.065%
$240,000 10,000 0.196% 0.007%
* Applied to total projected claims
22

The Vermont Health Plan
Q3 2016 Large Group Rating Program Filing
Experience Refund Risk Charge Factors*
Exhibit 8A
Pooling
Limitmembers 5% Margin 10% Margin
$240,000 20,000 0.065% 0.001%
$240,000 30,000 0.030% 0.001%
$240,000 40,000 0.015% 0.001%
$245,000 100 8.578% 6.648%
$245,000 200 5.850% 4.081%
$245,000 300 4.664% 3.005%
$245,000 400 3.961% 2.387%
$245,000 500 3.482% 1.978%
$245,000 600 3.125% 1.683%
$245,000 700 2.846% 1.459%
$245,000 800 2.618% 1.281%
$245,000 900 2.428% 1.136%
$245,000 1,000 2.265% 1.016%
$245,000 1,500 1.695% 0.628%
$245,000 2,000 1.343% 0.419%
$245,000 3,000 0.918% 0.211%
$245,000 4,000 0.672% 0.116%
$245,000 5,000 0.514% 0.067%
$245,000 10,000 0.200% 0.007%
$245,000 20,000 0.066% 0.001%
$245,000 30,000 0.030% 0.001%
$245,000 40,000 0.016% 0.001%
$250,000 100 8.641% 6.707%
$250,000 200 5.894% 4.120%
$250,000 300 4.699% 3.035%
$250,000 400 3.992% 2.413%
$250,000 500 3.509% 2.000%
$250,000 600 3.150% 1.703%
$250,000 700 2.869% 1.476%
$250,000 800 2.640% 1.297%
$250,000 900 2.449% 1.151%
$250,000 1,000 2.285% 1.030%
$250,000 1,500 1.712% 0.638%
$250,000 2,000 1.357% 0.427%
$250,000 3,000 0.930% 0.215%
$250,000 4,000 0.682% 0.119%
$250,000 5,000 0.522% 0.069%
* Applied to total projected claims
23

The Vermont Health Plan
Q3 2016 Large Group Rating Program Filing
Experience Refund Risk Charge Factors*
Exhibit 8A
Pooling
Limitmembers 5% Margin 10% Margin
$250,000 10,000 0.203% 0.008%
$250,000 20,000 0.068% 0.001%
$250,000 30,000 0.031% 0.001%
$250,000 40,000 0.016% 0.001%
$255,000 100 8.705% 6.767%
$255,000 200 5.938% 4.159%
$255,000 300 4.735% 3.065%
$255,000 400 4.023% 2.438%
$255,000 500 3.536% 2.022%
$255,000 600 3.176% 1.722%
$255,000 700 2.893% 1.494%
$255,000 800 2.662% 1.313%
$255,000 900 2.470% 1.166%
$255,000 1,000 2.305% 1.043%
$255,000 1,500 1.729% 0.648%
$255,000 2,000 1.372% 0.435%
$255,000 3,000 0.941% 0.220%
$255,000 4,000 0.691% 0.122%
$255,000 5,000 0.530% 0.071%
$255,000 10,000 0.207% 0.008%
$255,000 20,000 0.069% 0.001%
$255,000 30,000 0.032% 0.001%
$255,000 40,000 0.017% 0.001%
$260,000 100 8.770% 6.826%
$260,000 200 5.982% 4.197%
$260,000 300 4.770% 3.095%
$260,000 400 4.053% 2.463%
$260,000 500 3.564% 2.044%
$260,000 600 3.201% 1.741%
$260,000 700 2.916% 1.511%
$260,000 800 2.684% 1.329%
$260,000 900 2.490% 1.180%
$260,000 1,000 2.324% 1.057%
$260,000 1,500 1.745% 0.658%
$260,000 2,000 1.386% 0.442%
$260,000 3,000 0.953% 0.225%
$260,000 4,000 0.701% 0.125%
* Applied to total projected claims
24

The Vermont Health Plan
Q3 2016 Large Group Rating Program Filing
Experience Refund Risk Charge Factors*
Exhibit 8A
Pooling
Limitmembers 5% Margin 10% Margin
$260,000 5,000 0.538% 0.074%
$260,000 10,000 0.210% 0.008%
$260,000 20,000 0.071% 0.001%
$260,000 30,000 0.033% 0.001%
$260,000 40,000 0.017% 0.001%
$265,000 100 8.834% 6.885%
$265,000 200 6.026% 4.236%
$265,000 300 4.806% 3.125%
$265,000 400 4.084% 2.488%
$265,000 500 3.591% 2.065%
$265,000 600 3.226% 1.761%
$265,000 700 2.939% 1.529%
$265,000 800 2.706% 1.345%
$265,000 900 2.511% 1.195%
$265,000 1,000 2.344% 1.071%
$265,000 1,500 1.762% 0.668%
$265,000 2,000 1.401% 0.450%
$265,000 3,000 0.965% 0.230%
$265,000 4,000 0.710% 0.128%
$265,000 5,000 0.546% 0.076%
$265,000 10,000 0.214% 0.009%
$265,000 20,000 0.072% 0.001%
$265,000 30,000 0.033% 0.001%
$265,000 40,000 0.018% 0.001%
$270,000 100 8.898% 6.944%
$270,000 200 6.070% 4.275%
$270,000 300 4.841% 3.155%
$270,000 400 4.114% 2.513%
$270,000 500 3.618% 2.087%
$270,000 600 3.251% 1.780%
$270,000 700 2.963% 1.546%
$270,000 800 2.728% 1.361%
$270,000 900 2.532% 1.210%
$270,000 1,000 2.364% 1.084%
$270,000 1,500 1.779% 0.678%
$270,000 2,000 1.416% 0.458%
$270,000 3,000 0.976% 0.235%
* Applied to total projected claims
25

The Vermont Health Plan
Q3 2016 Large Group Rating Program Filing
Experience Refund Risk Charge Factors*
Exhibit 8A
Pooling
Limitmembers 5% Margin 10% Margin
$270,000 4,000 0.720% 0.132%
$270,000 5,000 0.554% 0.078%
$270,000 10,000 0.218% 0.009%
$270,000 20,000 0.074% 0.001%
$270,000 30,000 0.034% 0.001%
$270,000 40,000 0.018% 0.001%
$275,000 100 8.954% 6.996%
$275,000 200 6.109% 4.310%
$275,000 300 4.873% 3.182%
$275,000 400 4.141% 2.535%
$275,000 500 3.642% 2.106%
$275,000 600 3.273% 1.797%
$275,000 700 2.983% 1.561%
$275,000 800 2.747% 1.375%
$275,000 900 2.550% 1.223%
$275,000 1,000 2.382% 1.096%
$275,000 1,500 1.793% 0.687%
$275,000 2,000 1.428% 0.465%
$275,000 3,000 0.987% 0.239%
$275,000 4,000 0.728% 0.135%
$275,000 5,000 0.561% 0.080%
$275,000 10,000 0.221% 0.009%
$275,000 20,000 0.075% 0.001%
$275,000 30,000 0.035% 0.001%
$275,000 40,000 0.019% 0.001%
$280,000 100 9.008% 7.047%
$280,000 200 6.146% 4.343%
$280,000 300 4.903% 3.208%
$280,000 400 4.167% 2.557%
$280,000 500 3.666% 2.125%
$280,000 600 3.294% 1.814%
$280,000 700 3.003% 1.577%
$280,000 800 2.766% 1.389%
$280,000 900 2.568% 1.236%
$280,000 1,000 2.398% 1.108%
$280,000 1,500 1.807% 0.696%
$280,000 2,000 1.441% 0.472%
* Applied to total projected claims
26
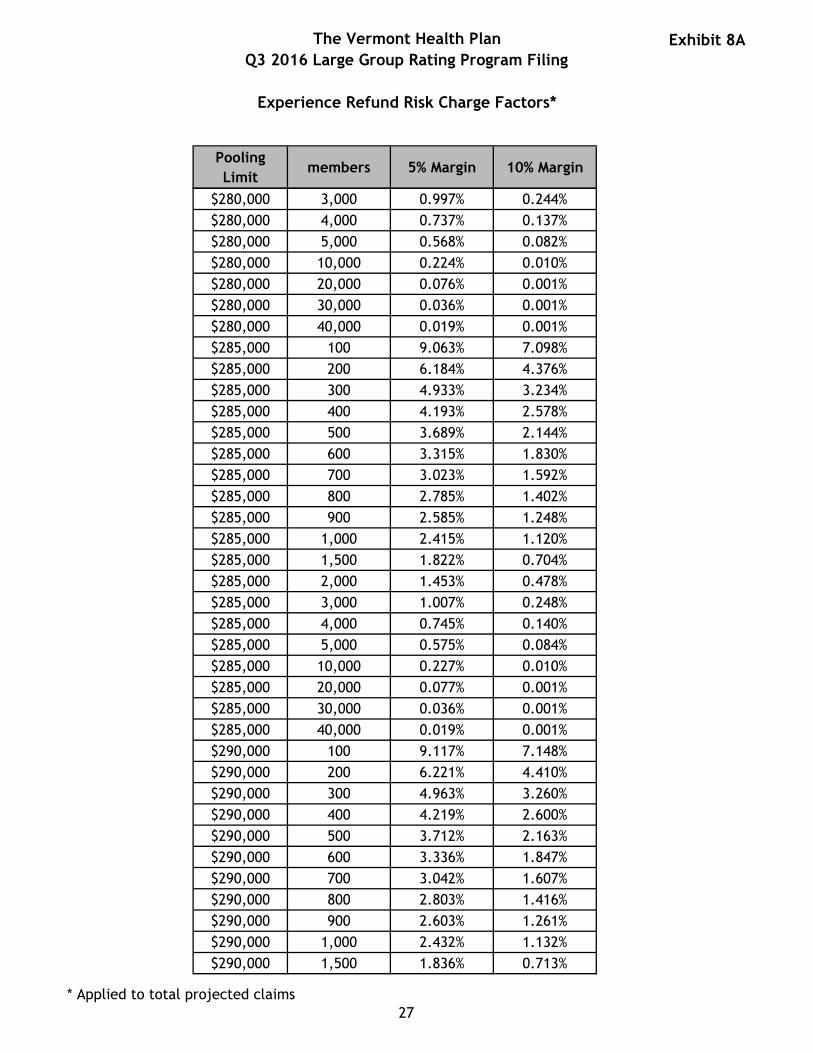
The Vermont Health Plan
Q3 2016 Large Group Rating Program Filing
Experience Refund Risk Charge Factors*
Exhibit 8A
Pooling
Limitmembers 5% Margin 10% Margin
$280,000 3,000 0.997% 0.244%
$280,000 4,000 0.737% 0.137%
$280,000 5,000 0.568% 0.082%
$280,000 10,000 0.224% 0.010%
$280,000 20,000 0.076% 0.001%
$280,000 30,000 0.036% 0.001%
$280,000 40,000 0.019% 0.001%
$285,000 100 9.063% 7.098%
$285,000 200 6.184% 4.376%
$285,000 300 4.933% 3.234%
$285,000 400 4.193% 2.578%
$285,000 500 3.689% 2.144%
$285,000 600 3.315% 1.830%
$285,000 700 3.023% 1.592%
$285,000 800 2.785% 1.402%
$285,000 900 2.585% 1.248%
$285,000 1,000 2.415% 1.120%
$285,000 1,500 1.822% 0.704%
$285,000 2,000 1.453% 0.478%
$285,000 3,000 1.007% 0.248%
$285,000 4,000 0.745% 0.140%
$285,000 5,000 0.575% 0.084%
$285,000 10,000 0.227% 0.010%
$285,000 20,000 0.077% 0.001%
$285,000 30,000 0.036% 0.001%
$285,000 40,000 0.019% 0.001%
$290,000 100 9.117% 7.148%
$290,000 200 6.221% 4.410%
$290,000 300 4.963% 3.260%
$290,000 400 4.219% 2.600%
$290,000 500 3.712% 2.163%
$290,000 600 3.336% 1.847%
$290,000 700 3.042% 1.607%
$290,000 800 2.803% 1.416%
$290,000 900 2.603% 1.261%
$290,000 1,000 2.432% 1.132%
$290,000 1,500 1.836% 0.713%
* Applied to total projected claims
27

The Vermont Health Plan
Q3 2016 Large Group Rating Program Filing
Experience Refund Risk Charge Factors*
Exhibit 8A
Pooling
Limitmembers 5% Margin 10% Margin
$290,000 2,000 1.466% 0.485%
$290,000 3,000 1.017% 0.252%
$290,000 4,000 0.753% 0.143%
$290,000 5,000 0.582% 0.086%
$290,000 10,000 0.231% 0.011%
$290,000 20,000 0.079% 0.001%
$290,000 30,000 0.037% 0.001%
$290,000 40,000 0.020% 0.001%
$295,000 100 9.172% 7.199%
$295,000 200 6.259% 4.443%
$295,000 300 4.993% 3.286%
$295,000 400 4.245% 2.622%
$295,000 500 3.735% 2.181%
$295,000 600 3.358% 1.864%
$295,000 700 3.062% 1.622%
$295,000 800 2.822% 1.430%
$295,000 900 2.621% 1.274%
$295,000 1,000 2.449% 1.144%
$295,000 1,500 1.850% 0.722%
$295,000 2,000 1.478% 0.492%
$295,000 3,000 1.027% 0.257%
$295,000 4,000 0.761% 0.146%
$295,000 5,000 0.589% 0.088%
$295,000 10,000 0.234% 0.011%
$295,000 20,000 0.080% 0.001%
$295,000 30,000 0.038% 0.001%
$295,000 40,000 0.020% 0.001%
$300,000 100 9.226% 7.250%
$300,000 200 6.297% 4.477%
$300,000 300 5.024% 3.312%
$300,000 400 4.271% 2.643%
$300,000 500 3.759% 2.200%
$300,000 600 3.379% 1.880%
$300,000 700 3.082% 1.637%
$300,000 800 2.840% 1.444%
$300,000 900 2.638% 1.287%
$300,000 1,000 2.466% 1.156%
* Applied to total projected claims
28
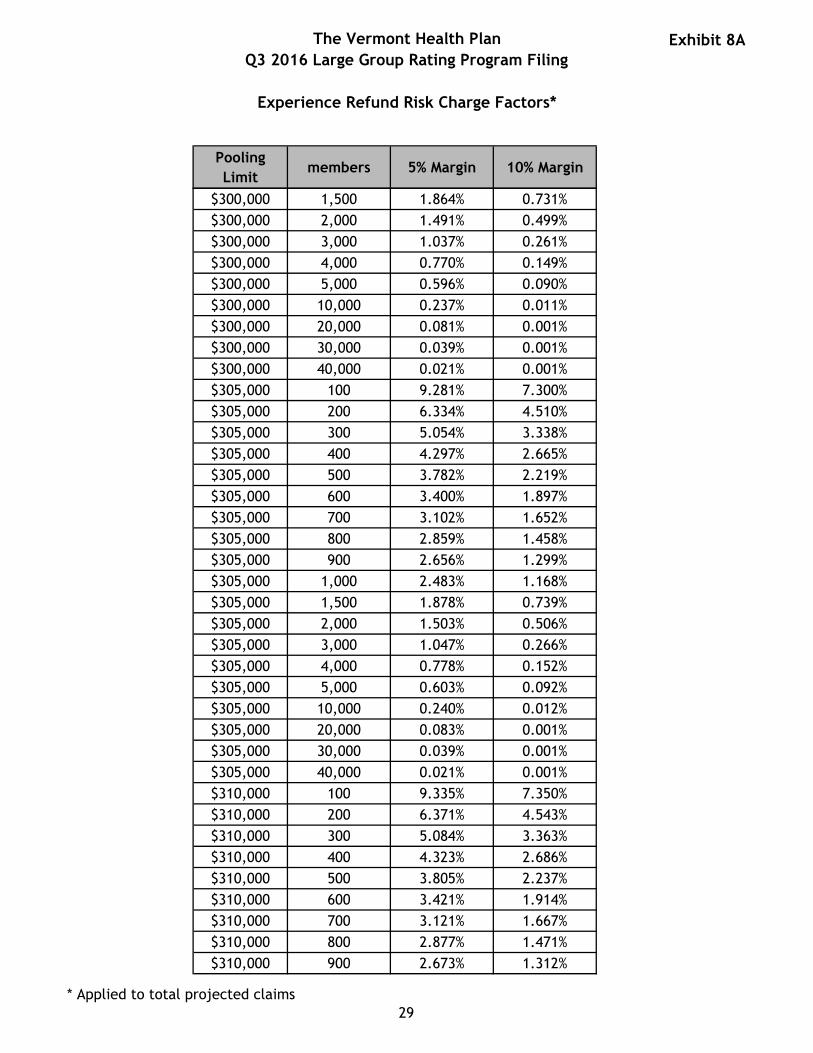
The Vermont Health Plan
Q3 2016 Large Group Rating Program Filing
Experience Refund Risk Charge Factors*
Exhibit 8A
Pooling
Limitmembers 5% Margin 10% Margin
$300,000 1,500 1.864% 0.731%
$300,000 2,000 1.491% 0.499%
$300,000 3,000 1.037% 0.261%
$300,000 4,000 0.770% 0.149%
$300,000 5,000 0.596% 0.090%
$300,000 10,000 0.237% 0.011%
$300,000 20,000 0.081% 0.001%
$300,000 30,000 0.039% 0.001%
$300,000 40,000 0.021% 0.001%
$305,000 100 9.281% 7.300%
$305,000 200 6.334% 4.510%
$305,000 300 5.054% 3.338%
$305,000 400 4.297% 2.665%
$305,000 500 3.782% 2.219%
$305,000 600 3.400% 1.897%
$305,000 700 3.102% 1.652%
$305,000 800 2.859% 1.458%
$305,000 900 2.656% 1.299%
$305,000 1,000 2.483% 1.168%
$305,000 1,500 1.878% 0.739%
$305,000 2,000 1.503% 0.506%
$305,000 3,000 1.047% 0.266%
$305,000 4,000 0.778% 0.152%
$305,000 5,000 0.603% 0.092%
$305,000 10,000 0.240% 0.012%
$305,000 20,000 0.083% 0.001%
$305,000 30,000 0.039% 0.001%
$305,000 40,000 0.021% 0.001%
$310,000 100 9.335% 7.350%
$310,000 200 6.371% 4.543%
$310,000 300 5.084% 3.363%
$310,000 400 4.323% 2.686%
$310,000 500 3.805% 2.237%
$310,000 600 3.421% 1.914%
$310,000 700 3.121% 1.667%
$310,000 800 2.877% 1.471%
$310,000 900 2.673% 1.312%
* Applied to total projected claims
29

The Vermont Health Plan
Q3 2016 Large Group Rating Program Filing
Experience Refund Risk Charge Factors*
Exhibit 8A
Pooling
Limitmembers 5% Margin 10% Margin
$310,000 1,000 2.499% 1.179%
$310,000 1,500 1.892% 0.748%
$310,000 2,000 1.515% 0.512%
$310,000 3,000 1.057% 0.270%
$310,000 4,000 0.786% 0.155%
$310,000 5,000 0.609% 0.094%
$310,000 10,000 0.244% 0.012%
$310,000 20,000 0.084% 0.001%
$310,000 30,000 0.040% 0.001%
$310,000 40,000 0.022% 0.001%
$315,000 100 9.384% 7.396%
$315,000 200 6.405% 4.573%
$315,000 300 5.111% 3.387%
$315,000 400 4.346% 2.706%
$315,000 500 3.826% 2.254%
$315,000 600 3.440% 1.929%
$315,000 700 3.139% 1.681%
$315,000 800 2.894% 1.484%
$315,000 900 2.689% 1.324%
$315,000 1,000 2.514% 1.190%
$315,000 1,500 1.905% 0.756%
$315,000 2,000 1.527% 0.519%
$315,000 3,000 1.066% 0.274%
$315,000 4,000 0.794% 0.158%
$315,000 5,000 0.616% 0.096%
$315,000 10,000 0.247% 0.012%
$315,000 20,000 0.085% 0.001%
$315,000 30,000 0.041% 0.001%
$315,000 40,000 0.022% 0.001%
$320,000 100 9.434% 7.443%
$320,000 200 6.439% 4.604%
$320,000 300 5.138% 3.411%
$320,000 400 4.370% 2.726%
$320,000 500 3.847% 2.272%
$320,000 600 3.459% 1.944%
$320,000 700 3.157% 1.694%
$320,000 800 2.911% 1.497%
* Applied to total projected claims
30

The Vermont Health Plan
Q3 2016 Large Group Rating Program Filing
Experience Refund Risk Charge Factors*
Exhibit 8A
Pooling
Limitmembers 5% Margin 10% Margin
$320,000 900 2.705% 1.335%
$320,000 1,000 2.530% 1.201%
$320,000 1,500 1.918% 0.764%
$320,000 2,000 1.538% 0.525%
$320,000 3,000 1.076% 0.278%
$320,000 4,000 0.802% 0.161%
$320,000 5,000 0.622% 0.098%
$320,000 10,000 0.250% 0.013%
$320,000 20,000 0.086% 0.001%
$320,000 30,000 0.041% 0.001%
$320,000 40,000 0.022% 0.001%
$325,000 100 9.483% 7.489%
$325,000 200 6.473% 4.635%
$325,000 300 5.166% 3.434%
$325,000 400 4.394% 2.746%
$325,000 500 3.868% 2.289%
$325,000 600 3.479% 1.959%
$325,000 700 3.175% 1.708%
$325,000 800 2.928% 1.509%
$325,000 900 2.721% 1.347%
$325,000 1,000 2.545% 1.212%
$325,000 1,500 1.931% 0.772%
$325,000 2,000 1.549% 0.531%
$325,000 3,000 1.085% 0.282%
$325,000 4,000 0.809% 0.163%
$325,000 5,000 0.629% 0.100%
$325,000 10,000 0.253% 0.013%
$325,000 20,000 0.088% 0.001%
$325,000 30,000 0.042% 0.001%
$325,000 40,000 0.023% 0.001%
$330,000 100 9.532% 7.535%
$330,000 200 6.507% 4.665%
$330,000 300 5.193% 3.458%
$330,000 400 4.417% 2.765%
$330,000 500 3.889% 2.306%
$330,000 600 3.498% 1.975%
$330,000 700 3.193% 1.722%
* Applied to total projected claims
31
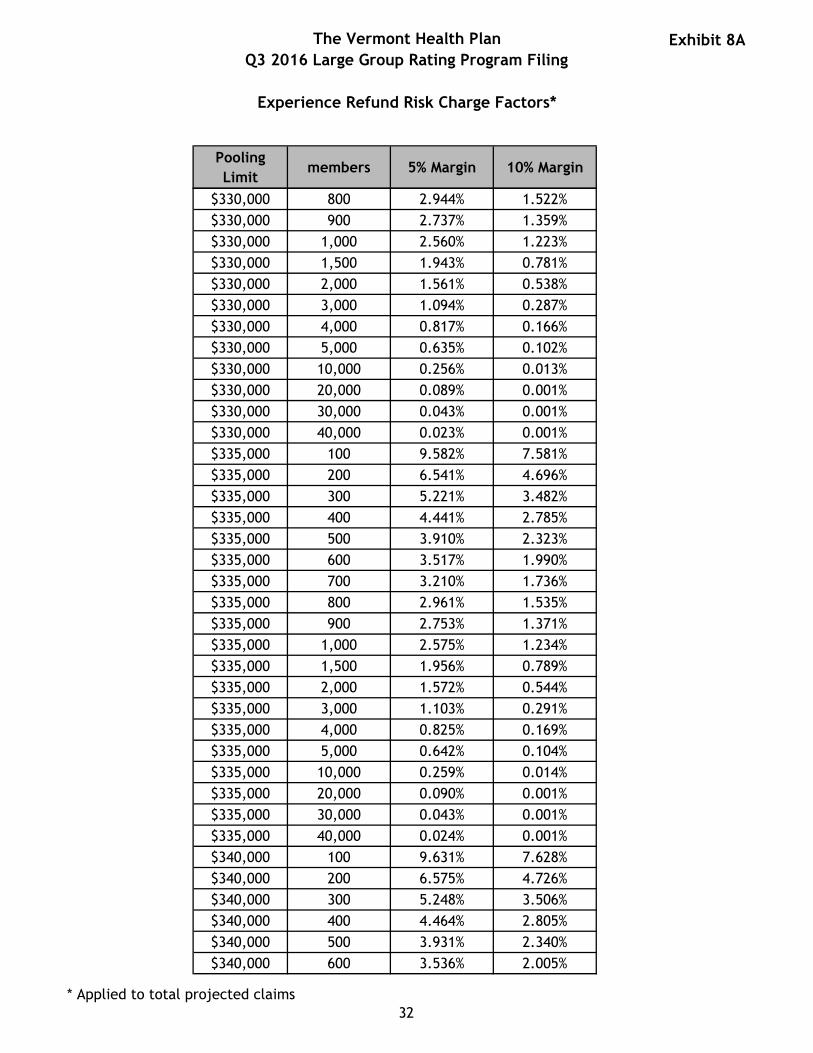
The Vermont Health Plan
Q3 2016 Large Group Rating Program Filing
Experience Refund Risk Charge Factors*
Exhibit 8A
Pooling
Limitmembers 5% Margin 10% Margin
$330,000 800 2.944% 1.522%
$330,000 900 2.737% 1.359%
$330,000 1,000 2.560% 1.223%
$330,000 1,500 1.943% 0.781%
$330,000 2,000 1.561% 0.538%
$330,000 3,000 1.094% 0.287%
$330,000 4,000 0.817% 0.166%
$330,000 5,000 0.635% 0.102%
$330,000 10,000 0.256% 0.013%
$330,000 20,000 0.089% 0.001%
$330,000 30,000 0.043% 0.001%
$330,000 40,000 0.023% 0.001%
$335,000 100 9.582% 7.581%
$335,000 200 6.541% 4.696%
$335,000 300 5.221% 3.482%
$335,000 400 4.441% 2.785%
$335,000 500 3.910% 2.323%
$335,000 600 3.517% 1.990%
$335,000 700 3.210% 1.736%
$335,000 800 2.961% 1.535%
$335,000 900 2.753% 1.371%
$335,000 1,000 2.575% 1.234%
$335,000 1,500 1.956% 0.789%
$335,000 2,000 1.572% 0.544%
$335,000 3,000 1.103% 0.291%
$335,000 4,000 0.825% 0.169%
$335,000 5,000 0.642% 0.104%
$335,000 10,000 0.259% 0.014%
$335,000 20,000 0.090% 0.001%
$335,000 30,000 0.043% 0.001%
$335,000 40,000 0.024% 0.001%
$340,000 100 9.631% 7.628%
$340,000 200 6.575% 4.726%
$340,000 300 5.248% 3.506%
$340,000 400 4.464% 2.805%
$340,000 500 3.931% 2.340%
$340,000 600 3.536% 2.005%
* Applied to total projected claims
32

The Vermont Health Plan
Q3 2016 Large Group Rating Program Filing
Experience Refund Risk Charge Factors*
Exhibit 8A
Pooling
Limitmembers 5% Margin 10% Margin
$340,000 700 3.228% 1.750%
$340,000 800 2.978% 1.547%
$340,000 900 2.769% 1.382%
$340,000 1,000 2.590% 1.245%
$340,000 1,500 1.969% 0.797%
$340,000 2,000 1.583% 0.551%
$340,000 3,000 1.112% 0.295%
$340,000 4,000 0.832% 0.172%
$340,000 5,000 0.648% 0.106%
$340,000 10,000 0.262% 0.014%
$340,000 20,000 0.091% 0.001%
$340,000 30,000 0.044% 0.001%
$340,000 40,000 0.024% 0.001%
$345,000 100 9.681% 7.674%
$345,000 200 6.610% 4.757%
$345,000 300 5.276% 3.530%
$345,000 400 4.488% 2.825%
$345,000 500 3.952% 2.358%
$345,000 600 3.556% 2.021%
$345,000 700 3.246% 1.764%
$345,000 800 2.995% 1.560%
$345,000 900 2.785% 1.394%
$345,000 1,000 2.606% 1.256%
$345,000 1,500 1.982% 0.805%
$345,000 2,000 1.594% 0.557%
$345,000 3,000 1.122% 0.299%
$345,000 4,000 0.840% 0.175%
$345,000 5,000 0.655% 0.108%
$345,000 10,000 0.265% 0.015%
$345,000 20,000 0.093% 0.002%
$345,000 30,000 0.045% 0.001%
$345,000 40,000 0.025% 0.001%
$350,000 100 9.733% 7.723%
$350,000 200 6.645% 4.789%
$350,000 300 5.304% 3.555%
$350,000 400 4.513% 2.846%
$350,000 500 3.974% 2.376%
* Applied to total projected claims
33

The Vermont Health Plan
Q3 2016 Large Group Rating Program Filing
Experience Refund Risk Charge Factors*
Exhibit 8A
Pooling
Limitmembers 5% Margin 10% Margin
$350,000 600 3.576% 2.037%
$350,000 700 3.265% 1.778%
$350,000 800 3.012% 1.574%
$350,000 900 2.802% 1.407%
$350,000 1,000 2.622% 1.267%
$350,000 1,500 1.995% 0.814%
$350,000 2,000 1.606% 0.564%
$350,000 3,000 1.131% 0.304%
$350,000 4,000 0.848% 0.178%
$350,000 5,000 0.662% 0.110%
$350,000 10,000 0.269% 0.015%
$350,000 20,000 0.094% 0.002%
$350,000 30,000 0.046% 0.001%
$350,000 40,000 0.025% 0.001%
$355,000 100 9.786% 7.773%
$355,000 200 6.682% 4.823%
$355,000 300 5.334% 3.581%
$355,000 400 4.538% 2.868%
$355,000 500 3.997% 2.395%
$355,000 600 3.597% 2.054%
$355,000 700 3.284% 1.794%
$355,000 800 3.031% 1.588%
$355,000 900 2.819% 1.420%
$355,000 1,000 2.638% 1.280%
$355,000 1,500 2.009% 0.823%
$355,000 2,000 1.619% 0.571%
$355,000 3,000 1.142% 0.309%
$355,000 4,000 0.857% 0.181%
$355,000 5,000 0.669% 0.112%
$355,000 10,000 0.272% 0.016%
$355,000 20,000 0.095% 0.002%
$355,000 30,000 0.046% 0.001%
$355,000 40,000 0.026% 0.001%
$360,000 100 9.840% 7.824%
$360,000 200 6.719% 4.856%
$360,000 300 5.364% 3.607%
$360,000 400 4.564% 2.890%
* Applied to total projected claims
34
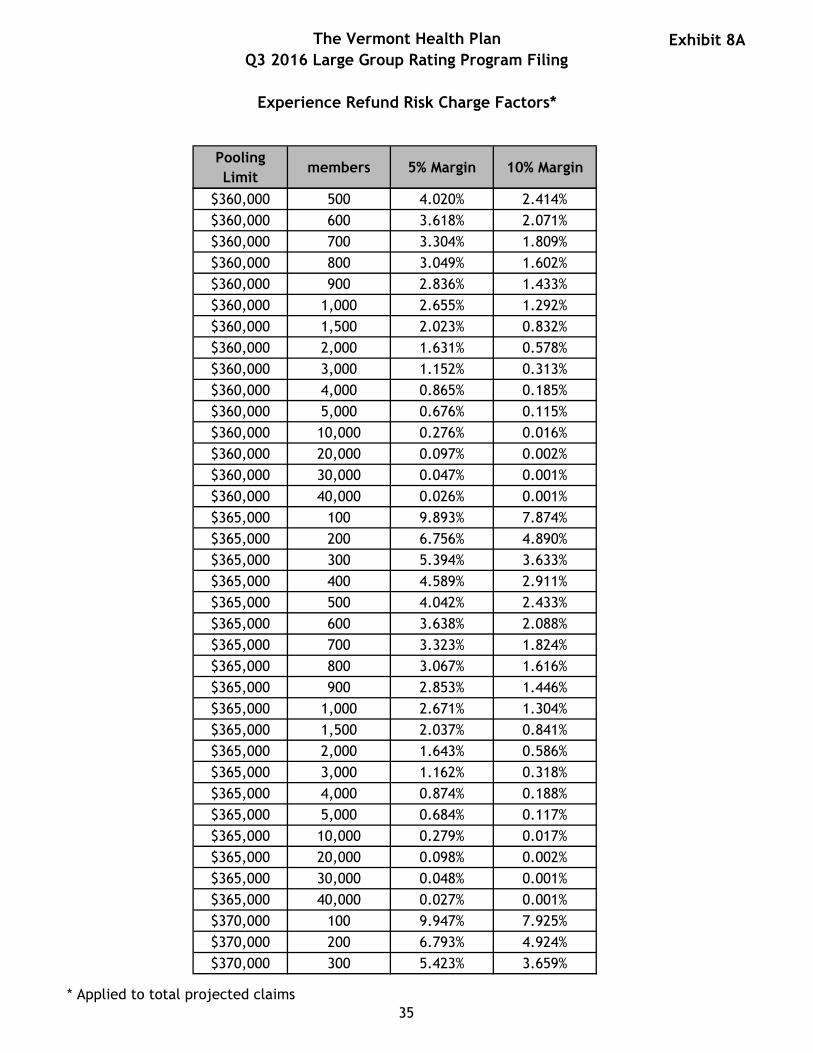
The Vermont Health Plan
Q3 2016 Large Group Rating Program Filing
Experience Refund Risk Charge Factors*
Exhibit 8A
Pooling
Limitmembers 5% Margin 10% Margin
$360,000 500 4.020% 2.414%
$360,000 600 3.618% 2.071%
$360,000 700 3.304% 1.809%
$360,000 800 3.049% 1.602%
$360,000 900 2.836% 1.433%
$360,000 1,000 2.655% 1.292%
$360,000 1,500 2.023% 0.832%
$360,000 2,000 1.631% 0.578%
$360,000 3,000 1.152% 0.313%
$360,000 4,000 0.865% 0.185%
$360,000 5,000 0.676% 0.115%
$360,000 10,000 0.276% 0.016%
$360,000 20,000 0.097% 0.002%
$360,000 30,000 0.047% 0.001%
$360,000 40,000 0.026% 0.001%
$365,000 100 9.893% 7.874%
$365,000 200 6.756% 4.890%
$365,000 300 5.394% 3.633%
$365,000 400 4.589% 2.911%
$365,000 500 4.042% 2.433%
$365,000 600 3.638% 2.088%
$365,000 700 3.323% 1.824%
$365,000 800 3.067% 1.616%
$365,000 900 2.853% 1.446%
$365,000 1,000 2.671% 1.304%
$365,000 1,500 2.037% 0.841%
$365,000 2,000 1.643% 0.586%
$365,000 3,000 1.162% 0.318%
$365,000 4,000 0.874% 0.188%
$365,000 5,000 0.684% 0.117%
$365,000 10,000 0.279% 0.017%
$365,000 20,000 0.098% 0.002%
$365,000 30,000 0.048% 0.001%
$365,000 40,000 0.027% 0.001%
$370,000 100 9.947% 7.925%
$370,000 200 6.793% 4.924%
$370,000 300 5.423% 3.659%
* Applied to total projected claims
35

The Vermont Health Plan
Q3 2016 Large Group Rating Program Filing
Experience Refund Risk Charge Factors*
Exhibit 8A
Pooling
Limitmembers 5% Margin 10% Margin
$370,000 400 4.615% 2.933%
$370,000 500 4.065% 2.452%
$370,000 600 3.659% 2.105%
$370,000 700 3.342% 1.840%
$370,000 800 3.085% 1.630%
$370,000 900 2.871% 1.459%
$370,000 1,000 2.688% 1.316%
$370,000 1,500 2.051% 0.850%
$370,000 2,000 1.656% 0.593%
$370,000 3,000 1.172% 0.323%
$370,000 4,000 0.883% 0.192%
$370,000 5,000 0.691% 0.119%
$370,000 10,000 0.283% 0.017%
$370,000 20,000 0.100% 0.002%
$370,000 30,000 0.049% 0.001%
$370,000 40,000 0.027% 0.001%
$375,000 100 10.001% 7.976%
$375,000 200 6.830% 4.957%
$375,000 300 5.453% 3.686%
$375,000 400 4.641% 2.955%
$375,000 500 4.088% 2.471%
$375,000 600 3.680% 2.122%
$375,000 700 3.362% 1.855%
$375,000 800 3.103% 1.644%
$375,000 900 2.888% 1.472%
$375,000 1,000 2.704% 1.328%
$375,000 1,500 2.065% 0.860%
$375,000 2,000 1.668% 0.600%
$375,000 3,000 1.182% 0.328%
$375,000 4,000 0.891% 0.195%
$375,000 5,000 0.698% 0.122%
$375,000 10,000 0.287% 0.018%
$375,000 20,000 0.101% 0.002%
$375,000 30,000 0.050% 0.001%
$375,000 40,000 0.028% 0.001%
$380,000 100 10.055% 8.026%
$380,000 200 6.867% 4.991%
* Applied to total projected claims
36
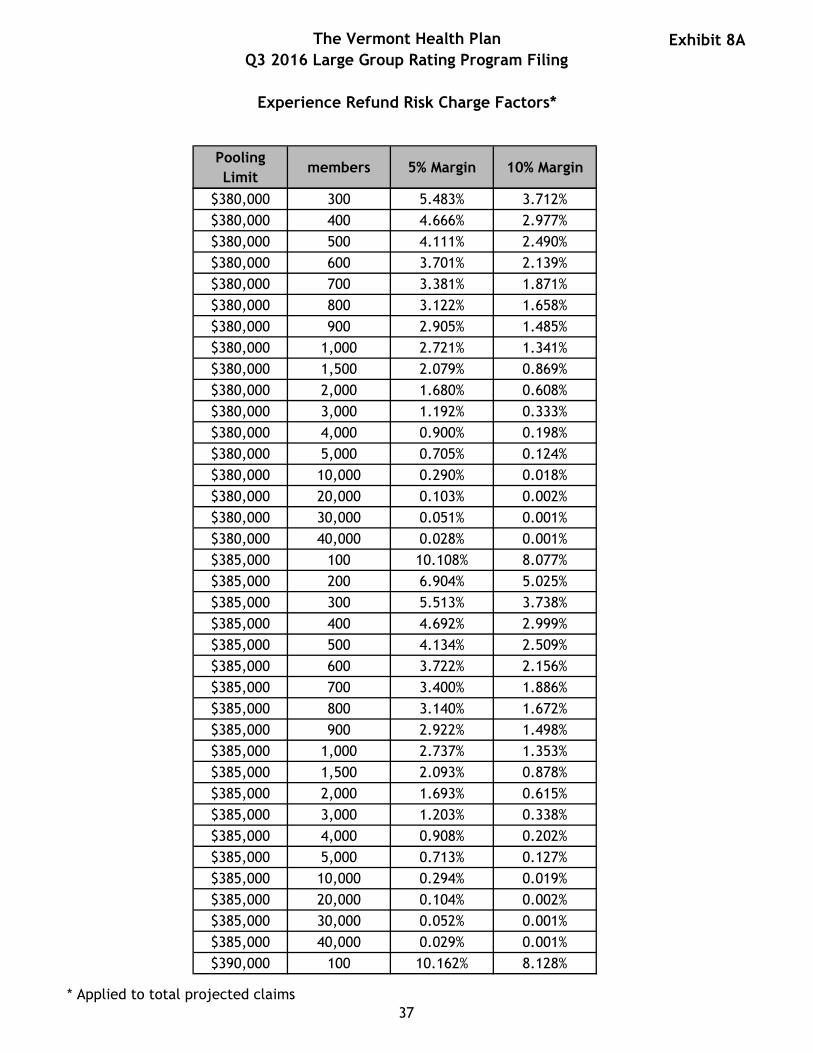
The Vermont Health Plan
Q3 2016 Large Group Rating Program Filing
Experience Refund Risk Charge Factors*
Exhibit 8A
Pooling
Limitmembers 5% Margin 10% Margin
$380,000 300 5.483% 3.712%
$380,000 400 4.666% 2.977%
$380,000 500 4.111% 2.490%
$380,000 600 3.701% 2.139%
$380,000 700 3.381% 1.871%
$380,000 800 3.122% 1.658%
$380,000 900 2.905% 1.485%
$380,000 1,000 2.721% 1.341%
$380,000 1,500 2.079% 0.869%
$380,000 2,000 1.680% 0.608%
$380,000 3,000 1.192% 0.333%
$380,000 4,000 0.900% 0.198%
$380,000 5,000 0.705% 0.124%
$380,000 10,000 0.290% 0.018%
$380,000 20,000 0.103% 0.002%
$380,000 30,000 0.051% 0.001%
$380,000 40,000 0.028% 0.001%
$385,000 100 10.108% 8.077%
$385,000 200 6.904% 5.025%
$385,000 300 5.513% 3.738%
$385,000 400 4.692% 2.999%
$385,000 500 4.134% 2.509%
$385,000 600 3.722% 2.156%
$385,000 700 3.400% 1.886%
$385,000 800 3.140% 1.672%
$385,000 900 2.922% 1.498%
$385,000 1,000 2.737% 1.353%
$385,000 1,500 2.093% 0.878%
$385,000 2,000 1.693% 0.615%
$385,000 3,000 1.203% 0.338%
$385,000 4,000 0.908% 0.202%
$385,000 5,000 0.713% 0.127%
$385,000 10,000 0.294% 0.019%
$385,000 20,000 0.104% 0.002%
$385,000 30,000 0.052% 0.001%
$385,000 40,000 0.029% 0.001%
$390,000 100 10.162% 8.128%
* Applied to total projected claims
37

The Vermont Health Plan
Q3 2016 Large Group Rating Program Filing
Experience Refund Risk Charge Factors*
Exhibit 8A
Pooling
Limitmembers 5% Margin 10% Margin
$390,000 200 6.941% 5.058%
$390,000 300 5.542% 3.764%
$390,000 400 4.717% 3.021%
$390,000 500 4.157% 2.528%
$390,000 600 3.743% 2.173%
$390,000 700 3.420% 1.901%
$390,000 800 3.158% 1.687%
$390,000 900 2.940% 1.511%
$390,000 1,000 2.753% 1.365%
$390,000 1,500 2.106% 0.887%
$390,000 2,000 1.705% 0.622%
$390,000 3,000 1.213% 0.343%
$390,000 4,000 0.917% 0.205%
$390,000 5,000 0.720% 0.129%
$390,000 10,000 0.298% 0.019%
$390,000 20,000 0.106% 0.002%
$390,000 30,000 0.052% 0.001%
$390,000 40,000 0.029% 0.001%
$395,000 100 10.211% 8.174%
$395,000 200 6.975% 5.089%
$395,000 300 5.569% 3.788%
$395,000 400 4.741% 3.041%
$395,000 500 4.177% 2.546%
$395,000 600 3.762% 2.188%
$395,000 700 3.437% 1.916%
$395,000 800 3.175% 1.699%
$395,000 900 2.955% 1.523%
$395,000 1,000 2.768% 1.376%
$395,000 1,500 2.119% 0.896%
$395,000 2,000 1.716% 0.629%
$395,000 3,000 1.222% 0.347%
$395,000 4,000 0.925% 0.209%
$395,000 5,000 0.727% 0.132%
$395,000 10,000 0.301% 0.020%
$395,000 20,000 0.107% 0.002%
$395,000 30,000 0.053% 0.001%
$395,000 40,000 0.030% 0.001%
* Applied to total projected claims
38

The Vermont Health Plan
Q3 2016 Large Group Rating Program Filing
Experience Refund Risk Charge Factors*
Exhibit 8A
Pooling
Limitmembers 5% Margin 10% Margin
$400,000 100 10.254% 8.215%
$400,000 200 7.005% 5.116%
$400,000 300 5.593% 3.810%
$400,000 400 4.761% 3.059%
$400,000 500 4.196% 2.561%
$400,000 600 3.778% 2.202%
$400,000 700 3.453% 1.928%
$400,000 800 3.189% 1.711%
$400,000 900 2.969% 1.534%
$400,000 1,000 2.782% 1.386%
$400,000 1,500 2.130% 0.903%
$400,000 2,000 1.726% 0.635%
$400,000 3,000 1.230% 0.351%
$400,000 4,000 0.932% 0.211%
$400,000 5,000 0.733% 0.134%
$400,000 10,000 0.304% 0.020%
$400,000 20,000 0.108% 0.002%
$400,000 30,000 0.054% 0.001%
$400,000 40,000 0.030% 0.001%
$405,000 100 10.297% 8.255%
$405,000 200 7.034% 5.143%
$405,000 300 5.617% 3.831%
$405,000 400 4.782% 3.077%
$405,000 500 4.214% 2.576%
$405,000 600 3.795% 2.216%
$405,000 700 3.468% 1.940%
$405,000 800 3.204% 1.722%
$405,000 900 2.983% 1.544%
$405,000 1,000 2.795% 1.396%
$405,000 1,500 2.141% 0.911%
$405,000 2,000 1.736% 0.641%
$405,000 3,000 1.238% 0.355%
$405,000 4,000 0.939% 0.214%
$405,000 5,000 0.739% 0.136%
$405,000 10,000 0.307% 0.021%
$405,000 20,000 0.110% 0.002%
$405,000 30,000 0.055% 0.001%
* Applied to total projected claims
39
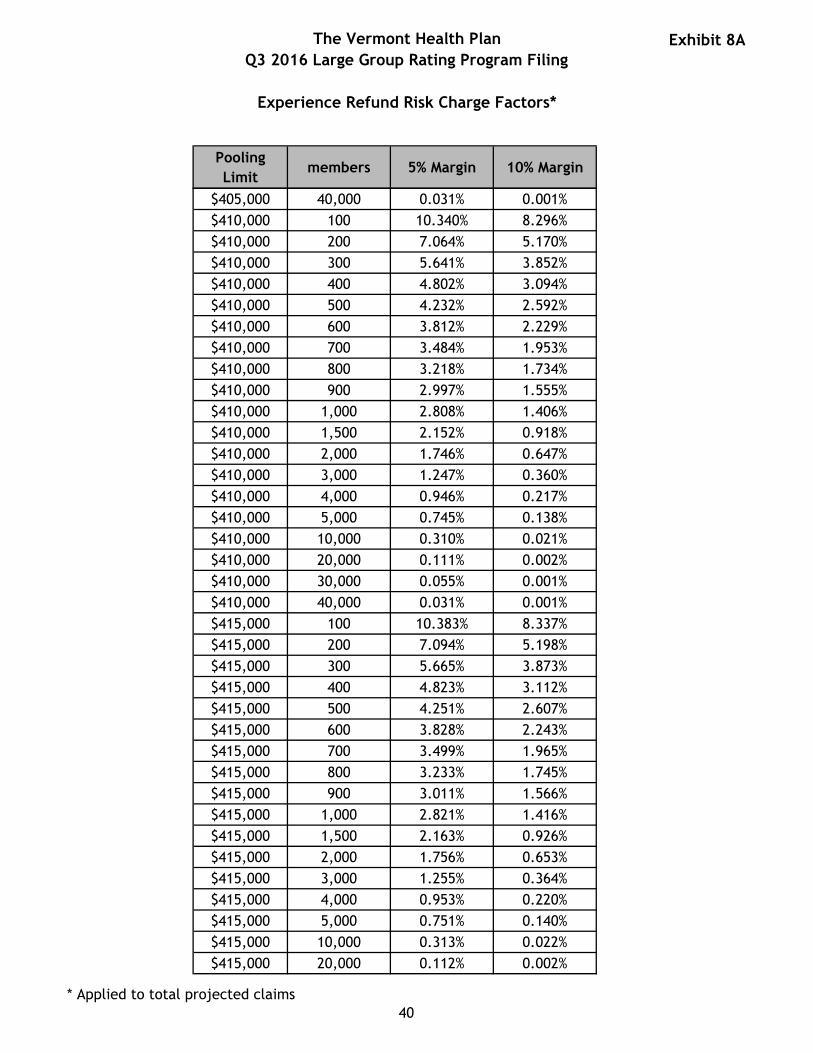
The Vermont Health Plan
Q3 2016 Large Group Rating Program Filing
Experience Refund Risk Charge Factors*
Exhibit 8A
Pooling
Limitmembers 5% Margin 10% Margin
$405,000 40,000 0.031% 0.001%
$410,000 100 10.340% 8.296%
$410,000 200 7.064% 5.170%
$410,000 300 5.641% 3.852%
$410,000 400 4.802% 3.094%
$410,000 500 4.232% 2.592%
$410,000 600 3.812% 2.229%
$410,000 700 3.484% 1.953%
$410,000 800 3.218% 1.734%
$410,000 900 2.997% 1.555%
$410,000 1,000 2.808% 1.406%
$410,000 1,500 2.152% 0.918%
$410,000 2,000 1.746% 0.647%
$410,000 3,000 1.247% 0.360%
$410,000 4,000 0.946% 0.217%
$410,000 5,000 0.745% 0.138%
$410,000 10,000 0.310% 0.021%
$410,000 20,000 0.111% 0.002%
$410,000 30,000 0.055% 0.001%
$410,000 40,000 0.031% 0.001%
$415,000 100 10.383% 8.337%
$415,000 200 7.094% 5.198%
$415,000 300 5.665% 3.873%
$415,000 400 4.823% 3.112%
$415,000 500 4.251% 2.607%
$415,000 600 3.828% 2.243%
$415,000 700 3.499% 1.965%
$415,000 800 3.233% 1.745%
$415,000 900 3.011% 1.566%
$415,000 1,000 2.821% 1.416%
$415,000 1,500 2.163% 0.926%
$415,000 2,000 1.756% 0.653%
$415,000 3,000 1.255% 0.364%
$415,000 4,000 0.953% 0.220%
$415,000 5,000 0.751% 0.140%
$415,000 10,000 0.313% 0.022%
$415,000 20,000 0.112% 0.002%
* Applied to total projected claims
40
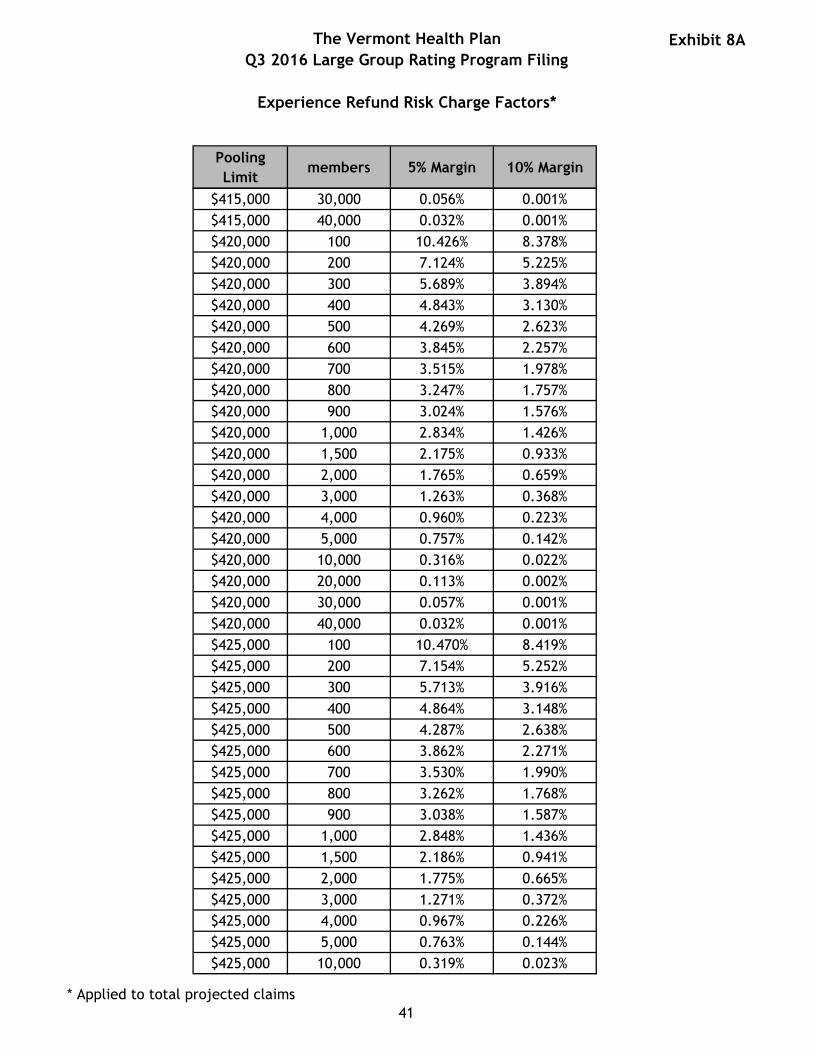
The Vermont Health Plan
Q3 2016 Large Group Rating Program Filing
Experience Refund Risk Charge Factors*
Exhibit 8A
Pooling
Limitmembers 5% Margin 10% Margin
$415,000 30,000 0.056% 0.001%
$415,000 40,000 0.032% 0.001%
$420,000 100 10.426% 8.378%
$420,000 200 7.124% 5.225%
$420,000 300 5.689% 3.894%
$420,000 400 4.843% 3.130%
$420,000 500 4.269% 2.623%
$420,000 600 3.845% 2.257%
$420,000 700 3.515% 1.978%
$420,000 800 3.247% 1.757%
$420,000 900 3.024% 1.576%
$420,000 1,000 2.834% 1.426%
$420,000 1,500 2.175% 0.933%
$420,000 2,000 1.765% 0.659%
$420,000 3,000 1.263% 0.368%
$420,000 4,000 0.960% 0.223%
$420,000 5,000 0.757% 0.142%
$420,000 10,000 0.316% 0.022%
$420,000 20,000 0.113% 0.002%
$420,000 30,000 0.057% 0.001%
$420,000 40,000 0.032% 0.001%
$425,000 100 10.470% 8.419%
$425,000 200 7.154% 5.252%
$425,000 300 5.713% 3.916%
$425,000 400 4.864% 3.148%
$425,000 500 4.287% 2.638%
$425,000 600 3.862% 2.271%
$425,000 700 3.530% 1.990%
$425,000 800 3.262% 1.768%
$425,000 900 3.038% 1.587%
$425,000 1,000 2.848% 1.436%
$425,000 1,500 2.186% 0.941%
$425,000 2,000 1.775% 0.665%
$425,000 3,000 1.271% 0.372%
$425,000 4,000 0.967% 0.226%
$425,000 5,000 0.763% 0.144%
$425,000 10,000 0.319% 0.023%
* Applied to total projected claims
41
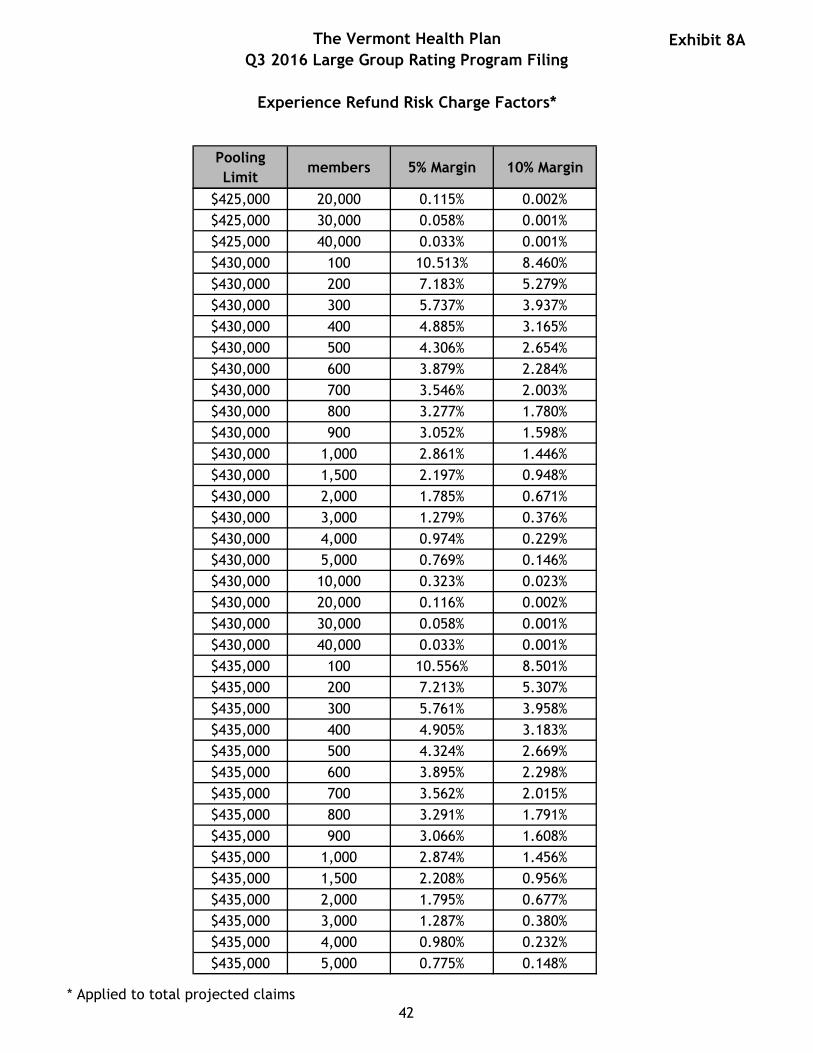
The Vermont Health Plan
Q3 2016 Large Group Rating Program Filing
Experience Refund Risk Charge Factors*
Exhibit 8A
Pooling
Limitmembers 5% Margin 10% Margin
$425,000 20,000 0.115% 0.002%
$425,000 30,000 0.058% 0.001%
$425,000 40,000 0.033% 0.001%
$430,000 100 10.513% 8.460%
$430,000 200 7.183% 5.279%
$430,000 300 5.737% 3.937%
$430,000 400 4.885% 3.165%
$430,000 500 4.306% 2.654%
$430,000 600 3.879% 2.284%
$430,000 700 3.546% 2.003%
$430,000 800 3.277% 1.780%
$430,000 900 3.052% 1.598%
$430,000 1,000 2.861% 1.446%
$430,000 1,500 2.197% 0.948%
$430,000 2,000 1.785% 0.671%
$430,000 3,000 1.279% 0.376%
$430,000 4,000 0.974% 0.229%
$430,000 5,000 0.769% 0.146%
$430,000 10,000 0.323% 0.023%
$430,000 20,000 0.116% 0.002%
$430,000 30,000 0.058% 0.001%
$430,000 40,000 0.033% 0.001%
$435,000 100 10.556% 8.501%
$435,000 200 7.213% 5.307%
$435,000 300 5.761% 3.958%
$435,000 400 4.905% 3.183%
$435,000 500 4.324% 2.669%
$435,000 600 3.895% 2.298%
$435,000 700 3.562% 2.015%
$435,000 800 3.291% 1.791%
$435,000 900 3.066% 1.608%
$435,000 1,000 2.874% 1.456%
$435,000 1,500 2.208% 0.956%
$435,000 2,000 1.795% 0.677%
$435,000 3,000 1.287% 0.380%
$435,000 4,000 0.980% 0.232%
$435,000 5,000 0.775% 0.148%
* Applied to total projected claims
42

The Vermont Health Plan
Q3 2016 Large Group Rating Program Filing
Experience Refund Risk Charge Factors*
Exhibit 8A
Pooling
Limitmembers 5% Margin 10% Margin
$435,000 10,000 0.326% 0.024%
$435,000 20,000 0.117% 0.002%
$435,000 30,000 0.059% 0.001%
$435,000 40,000 0.034% 0.001%
$440,000 100 10.599% 8.542%
$440,000 200 7.243% 5.334%
$440,000 300 5.785% 3.980%
$440,000 400 4.926% 3.201%
$440,000 500 4.342% 2.685%
$440,000 600 3.912% 2.312%
$440,000 700 3.577% 2.028%
$440,000 800 3.306% 1.803%
$440,000 900 3.080% 1.619%
$440,000 1,000 2.887% 1.465%
$440,000 1,500 2.219% 0.963%
$440,000 2,000 1.805% 0.683%
$440,000 3,000 1.296% 0.384%
$440,000 4,000 0.987% 0.235%
$440,000 5,000 0.781% 0.151%
$440,000 10,000 0.329% 0.024%
$440,000 20,000 0.118% 0.002%
$440,000 30,000 0.060% 0.001%
$440,000 40,000 0.034% 0.001%
$445,000 100 10.643% 8.583%
$445,000 200 7.273% 5.361%
$445,000 300 5.809% 4.001%
$445,000 400 4.946% 3.219%
$445,000 500 4.361% 2.700%
$445,000 600 3.929% 2.326%
$445,000 700 3.593% 2.040%
$445,000 800 3.320% 1.814%
$445,000 900 3.093% 1.630%
$445,000 1,000 2.900% 1.475%
$445,000 1,500 2.230% 0.971%
$445,000 2,000 1.815% 0.689%
$445,000 3,000 1.304% 0.388%
$445,000 4,000 0.994% 0.238%
* Applied to total projected claims
43

The Vermont Health Plan
Q3 2016 Large Group Rating Program Filing
Experience Refund Risk Charge Factors*
Exhibit 8A
Pooling
Limitmembers 5% Margin 10% Margin
$445,000 5,000 0.787% 0.153%
$445,000 10,000 0.332% 0.025%
$445,000 20,000 0.120% 0.002%
$445,000 30,000 0.060% 0.001%
$445,000 40,000 0.035% 0.001%
$450,000 100 10.686% 8.624%
$450,000 200 7.303% 5.389%
$450,000 300 5.833% 4.022%
$450,000 400 4.967% 3.237%
$450,000 500 4.379% 2.716%
$450,000 600 3.946% 2.340%
$450,000 700 3.608% 2.053%
$450,000 800 3.335% 1.826%
$450,000 900 3.107% 1.640%
$450,000 1,000 2.913% 1.485%
$450,000 1,500 2.241% 0.978%
$450,000 2,000 1.824% 0.695%
$450,000 3,000 1.312% 0.393%
$450,000 4,000 1.001% 0.241%
$450,000 5,000 0.793% 0.155%
$450,000 10,000 0.335% 0.025%
$450,000 20,000 0.121% 0.002%
$450,000 30,000 0.061% 0.001%
$450,000 40,000 0.035% 0.001%
$455,000 100 10.729% 8.665%
$455,000 200 7.332% 5.416%
$455,000 300 5.857% 4.044%
$455,000 400 4.988% 3.255%
$455,000 500 4.397% 2.731%
$455,000 600 3.962% 2.353%
$455,000 700 3.624% 2.065%
$455,000 800 3.349% 1.837%
$455,000 900 3.121% 1.651%
$455,000 1,000 2.926% 1.495%
$455,000 1,500 2.252% 0.986%
$455,000 2,000 1.834% 0.701%
$455,000 3,000 1.320% 0.397%
* Applied to total projected claims
44

The Vermont Health Plan
Q3 2016 Large Group Rating Program Filing
Experience Refund Risk Charge Factors*
Exhibit 8A
Pooling
Limitmembers 5% Margin 10% Margin
$455,000 4,000 1.008% 0.244%
$455,000 5,000 0.799% 0.157%
$455,000 10,000 0.338% 0.026%
$455,000 20,000 0.122% 0.002%
$455,000 30,000 0.062% 0.001%
$455,000 40,000 0.036% 0.001%
$460,000 100 10.769% 8.703%
$460,000 200 7.360% 5.441%
$460,000 300 5.879% 4.063%
$460,000 400 5.007% 3.271%
$460,000 500 4.414% 2.745%
$460,000 600 3.978% 2.366%
$460,000 700 3.638% 2.077%
$460,000 800 3.363% 1.848%
$460,000 900 3.134% 1.661%
$460,000 1,000 2.939% 1.505%
$460,000 1,500 2.262% 0.993%
$460,000 2,000 1.843% 0.707%
$460,000 3,000 1.328% 0.401%
$460,000 4,000 1.015% 0.247%
$460,000 5,000 0.805% 0.159%
$460,000 10,000 0.341% 0.026%
$460,000 20,000 0.124% 0.002%
$460,000 30,000 0.063% 0.001%
$460,000 40,000 0.036% 0.001%
$465,000 100 10.801% 8.733%
$465,000 200 7.382% 5.462%
$465,000 300 5.897% 4.079%
$465,000 400 5.022% 3.284%
$465,000 500 4.428% 2.757%
$465,000 600 3.990% 2.377%
$465,000 700 3.650% 2.087%
$465,000 800 3.374% 1.857%
$465,000 900 3.144% 1.669%
$465,000 1,000 2.948% 1.512%
$465,000 1,500 2.270% 0.999%
$465,000 2,000 1.851% 0.711%
* Applied to total projected claims
45

The Vermont Health Plan
Q3 2016 Large Group Rating Program Filing
Experience Refund Risk Charge Factors*
Exhibit 8A
Pooling
Limitmembers 5% Margin 10% Margin
$465,000 3,000 1.334% 0.404%
$465,000 4,000 1.020% 0.249%
$465,000 5,000 0.809% 0.161%
$465,000 10,000 0.344% 0.027%
$465,000 20,000 0.125% 0.002%
$465,000 30,000 0.063% 0.001%
$465,000 40,000 0.036% 0.001%
$470,000 100 10.834% 8.764%
$470,000 200 7.405% 5.482%
$470,000 300 5.915% 4.095%
$470,000 400 5.037% 3.298%
$470,000 500 4.442% 2.769%
$470,000 600 4.003% 2.387%
$470,000 700 3.661% 2.096%
$470,000 800 3.385% 1.865%
$470,000 900 3.154% 1.677%
$470,000 1,000 2.958% 1.520%
$470,000 1,500 2.279% 1.004%
$470,000 2,000 1.858% 0.716%
$470,000 3,000 1.340% 0.407%
$470,000 4,000 1.025% 0.251%
$470,000 5,000 0.814% 0.163%
$470,000 10,000 0.346% 0.027%
$470,000 20,000 0.126% 0.002%
$470,000 30,000 0.064% 0.001%
$470,000 40,000 0.037% 0.001%
$475,000 100 10.866% 8.795%
$475,000 200 7.427% 5.503%
$475,000 300 5.933% 4.112%
$475,000 400 5.053% 3.311%
$475,000 500 4.456% 2.780%
$475,000 600 4.015% 2.397%
$475,000 700 3.673% 2.105%
$475,000 800 3.396% 1.874%
$475,000 900 3.165% 1.685%
$475,000 1,000 2.968% 1.527%
$475,000 1,500 2.287% 1.010%
* Applied to total projected claims
46

The Vermont Health Plan
Q3 2016 Large Group Rating Program Filing
Experience Refund Risk Charge Factors*
Exhibit 8A
Pooling
Limitmembers 5% Margin 10% Margin
$475,000 2,000 1.865% 0.721%
$475,000 3,000 1.346% 0.410%
$475,000 4,000 1.031% 0.253%
$475,000 5,000 0.818% 0.164%
$475,000 10,000 0.348% 0.027%
$475,000 20,000 0.127% 0.002%
$475,000 30,000 0.064% 0.001%
$475,000 40,000 0.037% 0.001%
$480,000 100 10.899% 8.826%
$480,000 200 7.450% 5.523%
$480,000 300 5.951% 4.128%
$480,000 400 5.068% 3.325%
$480,000 500 4.469% 2.792%
$480,000 600 4.028% 2.408%
$480,000 700 3.684% 2.115%
$480,000 800 3.406% 1.883%
$480,000 900 3.175% 1.693%
$480,000 1,000 2.978% 1.535%
$480,000 1,500 2.295% 1.016%
$480,000 2,000 1.873% 0.725%
$480,000 3,000 1.352% 0.413%
$480,000 4,000 1.036% 0.256%
$480,000 5,000 0.823% 0.166%
$480,000 10,000 0.351% 0.028%
$480,000 20,000 0.128% 0.003%
$480,000 30,000 0.065% 0.001%
$480,000 40,000 0.038% 0.001%
$485,000 100 10.931% 8.857%
$485,000 200 7.472% 5.544%
$485,000 300 5.969% 4.144%
$485,000 400 5.084% 3.338%
$485,000 500 4.483% 2.804%
$485,000 600 4.040% 2.418%
$485,000 700 3.696% 2.124%
$485,000 800 3.417% 1.891%
$485,000 900 3.185% 1.701%
$485,000 1,000 2.988% 1.542%
* Applied to total projected claims
47

The Vermont Health Plan
Q3 2016 Large Group Rating Program Filing
Experience Refund Risk Charge Factors*
Exhibit 8A
Pooling
Limitmembers 5% Margin 10% Margin
$485,000 1,500 2.304% 1.021%
$485,000 2,000 1.880% 0.730%
$485,000 3,000 1.358% 0.417%
$485,000 4,000 1.041% 0.258%
$485,000 5,000 0.827% 0.168%
$485,000 10,000 0.353% 0.028%
$485,000 20,000 0.129% 0.003%
$485,000 30,000 0.066% 0.001%
$485,000 40,000 0.038% 0.001%
$490,000 100 10.964% 8.888%
$490,000 200 7.494% 5.565%
$490,000 300 5.987% 4.160%
$490,000 400 5.099% 3.352%
$490,000 500 4.497% 2.816%
$490,000 600 4.053% 2.429%
$490,000 700 3.708% 2.134%
$490,000 800 3.428% 1.900%
$490,000 900 3.196% 1.709%
$490,000 1,000 2.998% 1.550%
$490,000 1,500 2.312% 1.027%
$490,000 2,000 1.887% 0.734%
$490,000 3,000 1.365% 0.420%
$490,000 4,000 1.047% 0.260%
$490,000 5,000 0.832% 0.169%
$490,000 10,000 0.356% 0.029%
$490,000 20,000 0.130% 0.003%
$490,000 30,000 0.066% 0.001%
$490,000 40,000 0.038% 0.001%
$495,000 100 10.996% 8.918%
$495,000 200 7.517% 5.585%
$495,000 300 6.005% 4.176%
$495,000 400 5.115% 3.365%
$495,000 500 4.511% 2.827%
$495,000 600 4.066% 2.439%
$495,000 700 3.719% 2.143%
$495,000 800 3.439% 1.909%
$495,000 900 3.206% 1.717%
* Applied to total projected claims
48

The Vermont Health Plan
Q3 2016 Large Group Rating Program Filing
Experience Refund Risk Charge Factors*
Exhibit 8A
Pooling
Limitmembers 5% Margin 10% Margin
$495,000 1,000 3.007% 1.557%
$495,000 1,500 2.320% 1.033%
$495,000 2,000 1.895% 0.739%
$495,000 3,000 1.371% 0.423%
$495,000 4,000 1.052% 0.263%
$495,000 5,000 0.837% 0.171%
$495,000 10,000 0.358% 0.029%
$495,000 20,000 0.131% 0.003%
$495,000 30,000 0.067% 0.001%
$495,000 40,000 0.039% 0.001%
$500,000 100 11.029% 8.949%
$500,000 200 7.539% 5.606%
$500,000 300 6.023% 4.192%
$500,000 400 5.130% 3.379%
$500,000 500 4.524% 2.839%
$500,000 600 4.078% 2.450%
$500,000 700 3.731% 2.153%
$500,000 800 3.450% 1.917%
$500,000 900 3.216% 1.725%
$500,000 1,000 3.017% 1.565%
$500,000 1,500 2.328% 1.039%
$500,000 2,000 1.902% 0.744%
$500,000 3,000 1.377% 0.426%
$500,000 4,000 1.057% 0.265%
$500,000 5,000 0.841% 0.173%
$500,000 10,000 0.361% 0.030%
$500,000 20,000 0.132% 0.003%
$500,000 30,000 0.067% 0.001%
$500,000 40,000 0.039% 0.001%
$505,000 100 11.061% 8.980%
$505,000 200 7.562% 5.626%
$505,000 300 6.041% 4.208%
$505,000 400 5.146% 3.392%
$505,000 500 4.538% 2.851%
$505,000 600 4.091% 2.460%
$505,000 700 3.743% 2.162%
$505,000 800 3.461% 1.926%
* Applied to total projected claims
49

The Vermont Health Plan
Q3 2016 Large Group Rating Program Filing
Experience Refund Risk Charge Factors*
Exhibit 8A
Pooling
Limitmembers 5% Margin 10% Margin
$505,000 900 3.227% 1.733%
$505,000 1,000 3.027% 1.572%
$505,000 1,500 2.337% 1.044%
$505,000 2,000 1.909% 0.748%
$505,000 3,000 1.383% 0.430%
$505,000 4,000 1.062% 0.267%
$505,000 5,000 0.846% 0.175%
$505,000 10,000 0.363% 0.030%
$505,000 20,000 0.133% 0.003%
$505,000 30,000 0.068% 0.001%
$505,000 40,000 0.039% 0.001%
$510,000 100 11.094% 9.011%
$510,000 200 7.584% 5.647%
$510,000 300 6.059% 4.224%
$510,000 400 5.161% 3.406%
$510,000 500 4.552% 2.862%
$510,000 600 4.103% 2.471%
$510,000 700 3.754% 2.172%
$510,000 800 3.472% 1.935%
$510,000 900 3.237% 1.741%
$510,000 1,000 3.037% 1.580%
$510,000 1,500 2.345% 1.050%
$510,000 2,000 1.917% 0.753%
$510,000 3,000 1.389% 0.433%
$510,000 4,000 1.068% 0.270%
$510,000 5,000 0.850% 0.176%
$510,000 10,000 0.365% 0.030%
$510,000 20,000 0.134% 0.003%
$510,000 30,000 0.069% 0.001%
$510,000 40,000 0.040% 0.001%
$515,000 100 11.126% 9.042%
$515,000 200 7.606% 5.668%
$515,000 300 6.077% 4.240%
$515,000 400 5.177% 3.419%
$515,000 500 4.566% 2.874%
$515,000 600 4.116% 2.481%
$515,000 700 3.766% 2.181%
* Applied to total projected claims
50

The Vermont Health Plan
Q3 2016 Large Group Rating Program Filing
Experience Refund Risk Charge Factors*
Exhibit 8A
Pooling
Limitmembers 5% Margin 10% Margin
$515,000 800 3.483% 1.944%
$515,000 900 3.247% 1.749%
$515,000 1,000 3.047% 1.588%
$515,000 1,500 2.353% 1.056%
$515,000 2,000 1.924% 0.758%
$515,000 3,000 1.395% 0.436%
$515,000 4,000 1.073% 0.272%
$515,000 5,000 0.855% 0.178%
$515,000 10,000 0.368% 0.031%
$515,000 20,000 0.135% 0.003%
$515,000 30,000 0.069% 0.001%
$515,000 40,000 0.040% 0.001%
$520,000 100 11.158% 9.073%
$520,000 200 7.629% 5.688%
$520,000 300 6.095% 4.257%
$520,000 400 5.192% 3.433%
$520,000 500 4.579% 2.886%
$520,000 600 4.128% 2.491%
$520,000 700 3.777% 2.191%
$520,000 800 3.494% 1.952%
$520,000 900 3.258% 1.758%
$520,000 1,000 3.057% 1.595%
$520,000 1,500 2.361% 1.062%
$520,000 2,000 1.931% 0.762%
$520,000 3,000 1.401% 0.439%
$520,000 4,000 1.078% 0.275%
$520,000 5,000 0.859% 0.180%
$520,000 10,000 0.370% 0.031%
$520,000 20,000 0.136% 0.003%
$520,000 30,000 0.070% 0.001%
$520,000 40,000 0.041% 0.001%
$525,000 100 11.191% 9.104%
$525,000 200 7.651% 5.709%
$525,000 300 6.114% 4.273%
$525,000 400 5.208% 3.446%
$525,000 500 4.593% 2.898%
$525,000 600 4.141% 2.502%
* Applied to total projected claims
51

The Vermont Health Plan
Q3 2016 Large Group Rating Program Filing
Experience Refund Risk Charge Factors*
Exhibit 8A
Pooling
Limitmembers 5% Margin 10% Margin
$525,000 700 3.789% 2.200%
$525,000 800 3.505% 1.961%
$525,000 900 3.268% 1.766%
$525,000 1,000 3.066% 1.603%
$525,000 1,500 2.370% 1.067%
$525,000 2,000 1.939% 0.767%
$525,000 3,000 1.407% 0.443%
$525,000 4,000 1.083% 0.277%
$525,000 5,000 0.864% 0.182%
$525,000 10,000 0.373% 0.032%
$525,000 20,000 0.137% 0.003%
$525,000 30,000 0.070% 0.001%
$525,000 40,000 0.041% 0.001%
$530,000 100 11.223% 9.135%
$530,000 200 7.674% 5.730%
$530,000 300 6.132% 4.289%
$530,000 400 5.223% 3.460%
$530,000 500 4.607% 2.909%
$530,000 600 4.153% 2.512%
$530,000 700 3.801% 2.210%
$530,000 800 3.515% 1.970%
$530,000 900 3.278% 1.774%
$530,000 1,000 3.076% 1.610%
$530,000 1,500 2.378% 1.073%
$530,000 2,000 1.946% 0.772%
$530,000 3,000 1.414% 0.446%
$530,000 4,000 1.089% 0.279%
$530,000 5,000 0.869% 0.183%
$530,000 10,000 0.375% 0.032%
$530,000 20,000 0.138% 0.003%
$530,000 30,000 0.071% 0.001%
$530,000 40,000 0.041% 0.001%
$535,000 100 11.256% 9.165%
$535,000 200 7.696% 5.750%
$535,000 300 6.149% 4.305%
$535,000 400 5.238% 3.473%
$535,000 500 4.621% 2.921%
* Applied to total projected claims
52

The Vermont Health Plan
Q3 2016 Large Group Rating Program Filing
Experience Refund Risk Charge Factors*
Exhibit 8A
Pooling
Limitmembers 5% Margin 10% Margin
$535,000 600 4.166% 2.523%
$535,000 700 3.812% 2.219%
$535,000 800 3.526% 1.978%
$535,000 900 3.288% 1.782%
$535,000 1,000 3.086% 1.618%
$535,000 1,500 2.386% 1.079%
$535,000 2,000 1.953% 0.776%
$535,000 3,000 1.420% 0.449%
$535,000 4,000 1.094% 0.282%
$535,000 5,000 0.873% 0.185%
$535,000 10,000 0.378% 0.033%
$535,000 20,000 0.139% 0.003%
$535,000 30,000 0.072% 0.001%
$535,000 40,000 0.042% 0.001%
$540,000 100 11.286% 9.194%
$540,000 200 7.717% 5.769%
$540,000 300 6.166% 4.320%
$540,000 400 5.253% 3.486%
$540,000 500 4.633% 2.932%
$540,000 600 4.178% 2.533%
$540,000 700 3.823% 2.228%
$540,000 800 3.536% 1.987%
$540,000 900 3.298% 1.789%
$540,000 1,000 3.095% 1.625%
$540,000 1,500 2.394% 1.084%
$540,000 2,000 1.960% 0.781%
$540,000 3,000 1.425% 0.452%
$540,000 4,000 1.099% 0.284%
$540,000 5,000 0.878% 0.187%
$540,000 10,000 0.380% 0.033%
$540,000 20,000 0.140% 0.003%
$540,000 30,000 0.072% 0.001%
$540,000 40,000 0.042% 0.001%
$545,000 100 11.316% 9.223%
$545,000 200 7.738% 5.789%
$545,000 300 6.183% 4.335%
$545,000 400 5.267% 3.498%
* Applied to total projected claims
53

The Vermont Health Plan
Q3 2016 Large Group Rating Program Filing
Experience Refund Risk Charge Factors*
Exhibit 8A
Pooling
Limitmembers 5% Margin 10% Margin
$545,000 500 4.646% 2.943%
$545,000 600 4.189% 2.543%
$545,000 700 3.834% 2.237%
$545,000 800 3.546% 1.995%
$545,000 900 3.308% 1.797%
$545,000 1,000 3.104% 1.632%
$545,000 1,500 2.401% 1.090%
$545,000 2,000 1.967% 0.785%
$545,000 3,000 1.431% 0.455%
$545,000 4,000 1.104% 0.286%
$545,000 5,000 0.882% 0.189%
$545,000 10,000 0.383% 0.034%
$545,000 20,000 0.141% 0.003%
$545,000 30,000 0.073% 0.001%
$545,000 40,000 0.043% 0.001%
$550,000 100 11.346% 9.252%
$550,000 200 7.759% 5.808%
$550,000 300 6.200% 4.350%
$550,000 400 5.282% 3.511%
$550,000 500 4.659% 2.954%
$550,000 600 4.201% 2.552%
$550,000 700 3.845% 2.246%
$550,000 800 3.557% 2.003%
$550,000 900 3.317% 1.805%
$550,000 1,000 3.113% 1.639%
$550,000 1,500 2.409% 1.095%
$550,000 2,000 1.974% 0.790%
$550,000 3,000 1.437% 0.458%
$550,000 4,000 1.109% 0.289%
$550,000 5,000 0.886% 0.190%
$550,000 10,000 0.385% 0.034%
$550,000 20,000 0.142% 0.003%
$550,000 30,000 0.073% 0.001%
$550,000 40,000 0.043% 0.001%
$555,000 100 11.376% 9.281%
$555,000 200 7.779% 5.827%
$555,000 300 6.217% 4.365%
* Applied to total projected claims
54

The Vermont Health Plan
Q3 2016 Large Group Rating Program Filing
Experience Refund Risk Charge Factors*
Exhibit 8A
Pooling
Limitmembers 5% Margin 10% Margin
$555,000 400 5.296% 3.524%
$555,000 500 4.672% 2.965%
$555,000 600 4.212% 2.562%
$555,000 700 3.855% 2.255%
$555,000 800 3.567% 2.011%
$555,000 900 3.327% 1.812%
$555,000 1,000 3.122% 1.646%
$555,000 1,500 2.417% 1.101%
$555,000 2,000 1.980% 0.794%
$555,000 3,000 1.443% 0.462%
$555,000 4,000 1.114% 0.291%
$555,000 5,000 0.891% 0.192%
$555,000 10,000 0.387% 0.035%
$555,000 20,000 0.143% 0.003%
$555,000 30,000 0.074% 0.001%
$555,000 40,000 0.043% 0.001%
$560,000 100 11.407% 9.310%
$560,000 200 7.800% 5.847%
$560,000 300 6.233% 4.380%
$560,000 400 5.310% 3.536%
$560,000 500 4.685% 2.976%
$560,000 600 4.224% 2.572%
$560,000 700 3.866% 2.264%
$560,000 800 3.577% 2.019%
$560,000 900 3.336% 1.820%
$560,000 1,000 3.132% 1.653%
$560,000 1,500 2.424% 1.106%
$560,000 2,000 1.987% 0.798%
$560,000 3,000 1.448% 0.465%
$560,000 4,000 1.119% 0.293%
$560,000 5,000 0.895% 0.194%
$560,000 10,000 0.390% 0.035%
$560,000 20,000 0.144% 0.003%
$560,000 30,000 0.074% 0.001%
$560,000 40,000 0.044% 0.001%
$565,000 100 11.437% 9.338%
$565,000 200 7.821% 5.866%
* Applied to total projected claims
55

The Vermont Health Plan
Q3 2016 Large Group Rating Program Filing
Experience Refund Risk Charge Factors*
Exhibit 8A
Pooling
Limitmembers 5% Margin 10% Margin
$565,000 300 6.250% 4.396%
$565,000 400 5.325% 3.549%
$565,000 500 4.697% 2.987%
$565,000 600 4.236% 2.582%
$565,000 700 3.877% 2.273%
$565,000 800 3.587% 2.028%
$565,000 900 3.346% 1.828%
$565,000 1,000 3.141% 1.660%
$565,000 1,500 2.432% 1.112%
$565,000 2,000 1.994% 0.803%
$565,000 3,000 1.454% 0.468%
$565,000 4,000 1.124% 0.295%
$565,000 5,000 0.899% 0.196%
$565,000 10,000 0.392% 0.036%
$565,000 20,000 0.145% 0.003%
$565,000 30,000 0.075% 0.001%
$565,000 40,000 0.044% 0.001%
$570,000 100 11.467% 9.367%
$570,000 200 7.842% 5.885%
$570,000 300 6.267% 4.411%
$570,000 400 5.339% 3.562%
$570,000 500 4.710% 2.998%
$570,000 600 4.247% 2.592%
$570,000 700 3.888% 2.282%
$570,000 800 3.597% 2.036%
$570,000 900 3.355% 1.835%
$570,000 1,000 3.150% 1.668%
$570,000 1,500 2.440% 1.117%
$570,000 2,000 2.001% 0.807%
$570,000 3,000 1.460% 0.471%
$570,000 4,000 1.129% 0.298%
$570,000 5,000 0.904% 0.197%
$570,000 10,000 0.394% 0.036%
$570,000 20,000 0.146% 0.003%
$570,000 30,000 0.076% 0.001%
$570,000 40,000 0.045% 0.001%
$575,000 100 11.497% 9.396%
* Applied to total projected claims
56

The Vermont Health Plan
Q3 2016 Large Group Rating Program Filing
Experience Refund Risk Charge Factors*
Exhibit 8A
Pooling
Limitmembers 5% Margin 10% Margin
$575,000 200 7.863% 5.905%
$575,000 300 6.284% 4.426%
$575,000 400 5.353% 3.574%
$575,000 500 4.723% 3.009%
$575,000 600 4.259% 2.602%
$575,000 700 3.898% 2.291%
$575,000 800 3.607% 2.044%
$575,000 900 3.365% 1.843%
$575,000 1,000 3.159% 1.675%
$575,000 1,500 2.447% 1.123%
$575,000 2,000 2.008% 0.812%
$575,000 3,000 1.465% 0.474%
$575,000 4,000 1.134% 0.300%
$575,000 5,000 0.908% 0.199%
$575,000 10,000 0.397% 0.037%
$575,000 20,000 0.147% 0.003%
$575,000 30,000 0.076% 0.001%
$575,000 40,000 0.045% 0.001%
$580,000 100 11.527% 9.425%
$580,000 200 7.884% 5.924%
$580,000 300 6.300% 4.441%
$580,000 400 5.368% 3.587%
$580,000 500 4.736% 3.020%
$580,000 600 4.271% 2.611%
$580,000 700 3.909% 2.300%
$580,000 800 3.617% 2.052%
$580,000 900 3.375% 1.850%
$580,000 1,000 3.168% 1.682%
$580,000 1,500 2.455% 1.128%
$580,000 2,000 2.014% 0.816%
$580,000 3,000 1.471% 0.477%
$580,000 4,000 1.139% 0.302%
$580,000 5,000 0.912% 0.201%
$580,000 10,000 0.399% 0.037%
$580,000 20,000 0.148% 0.003%
$580,000 30,000 0.077% 0.001%
$580,000 40,000 0.045% 0.001%
* Applied to total projected claims
57

The Vermont Health Plan
Q3 2016 Large Group Rating Program Filing
Experience Refund Risk Charge Factors*
Exhibit 8A
Pooling
Limitmembers 5% Margin 10% Margin
$585,000 100 11.558% 9.454%
$585,000 200 7.905% 5.943%
$585,000 300 6.317% 4.456%
$585,000 400 5.382% 3.600%
$585,000 500 4.749% 3.031%
$585,000 600 4.282% 2.621%
$585,000 700 3.920% 2.309%
$585,000 800 3.627% 2.061%
$585,000 900 3.384% 1.858%
$585,000 1,000 3.177% 1.689%
$585,000 1,500 2.463% 1.134%
$585,000 2,000 2.021% 0.821%
$585,000 3,000 1.477% 0.480%
$585,000 4,000 1.144% 0.305%
$585,000 5,000 0.917% 0.203%
$585,000 10,000 0.402% 0.038%
$585,000 20,000 0.149% 0.003%
$585,000 30,000 0.077% 0.001%
$585,000 40,000 0.046% 0.001%
$590,000 100 11.588% 9.483%
$590,000 200 7.925% 5.963%
$590,000 300 6.334% 4.471%
$590,000 400 5.397% 3.613%
$590,000 500 4.761% 3.043%
$590,000 600 4.294% 2.631%
$590,000 700 3.931% 2.318%
$590,000 800 3.638% 2.069%
$590,000 900 3.394% 1.866%
$590,000 1,000 3.186% 1.696%
$590,000 1,500 2.470% 1.139%
$590,000 2,000 2.028% 0.825%
$590,000 3,000 1.483% 0.484%
$590,000 4,000 1.149% 0.307%
$590,000 5,000 0.921% 0.204%
$590,000 10,000 0.404% 0.038%
$590,000 20,000 0.150% 0.004%
$590,000 30,000 0.078% 0.001%
* Applied to total projected claims
58
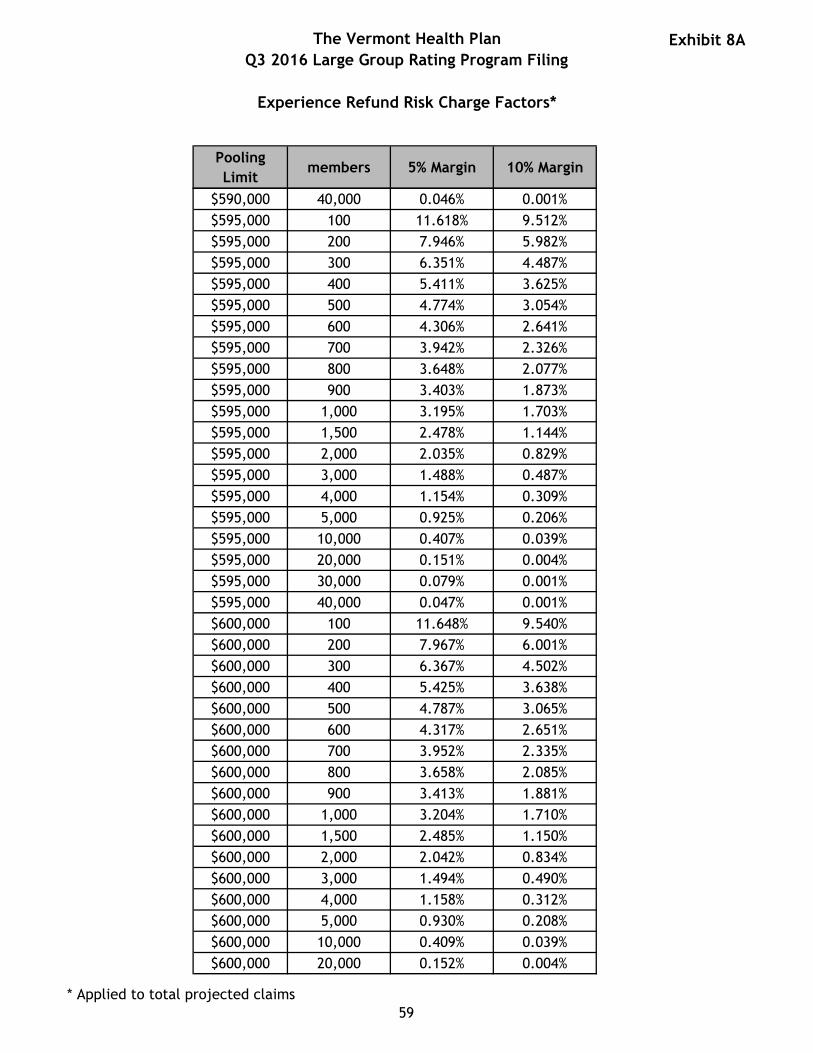
The Vermont Health Plan
Q3 2016 Large Group Rating Program Filing
Experience Refund Risk Charge Factors*
Exhibit 8A
Pooling
Limitmembers 5% Margin 10% Margin
$590,000 40,000 0.046% 0.001%
$595,000 100 11.618% 9.512%
$595,000 200 7.946% 5.982%
$595,000 300 6.351% 4.487%
$595,000 400 5.411% 3.625%
$595,000 500 4.774% 3.054%
$595,000 600 4.306% 2.641%
$595,000 700 3.942% 2.326%
$595,000 800 3.648% 2.077%
$595,000 900 3.403% 1.873%
$595,000 1,000 3.195% 1.703%
$595,000 1,500 2.478% 1.144%
$595,000 2,000 2.035% 0.829%
$595,000 3,000 1.488% 0.487%
$595,000 4,000 1.154% 0.309%
$595,000 5,000 0.925% 0.206%
$595,000 10,000 0.407% 0.039%
$595,000 20,000 0.151% 0.004%
$595,000 30,000 0.079% 0.001%
$595,000 40,000 0.047% 0.001%
$600,000 100 11.648% 9.540%
$600,000 200 7.967% 6.001%
$600,000 300 6.367% 4.502%
$600,000 400 5.425% 3.638%
$600,000 500 4.787% 3.065%
$600,000 600 4.317% 2.651%
$600,000 700 3.952% 2.335%
$600,000 800 3.658% 2.085%
$600,000 900 3.413% 1.881%
$600,000 1,000 3.204% 1.710%
$600,000 1,500 2.485% 1.150%
$600,000 2,000 2.042% 0.834%
$600,000 3,000 1.494% 0.490%
$600,000 4,000 1.158% 0.312%
$600,000 5,000 0.930% 0.208%
$600,000 10,000 0.409% 0.039%
$600,000 20,000 0.152% 0.004%
* Applied to total projected claims
59
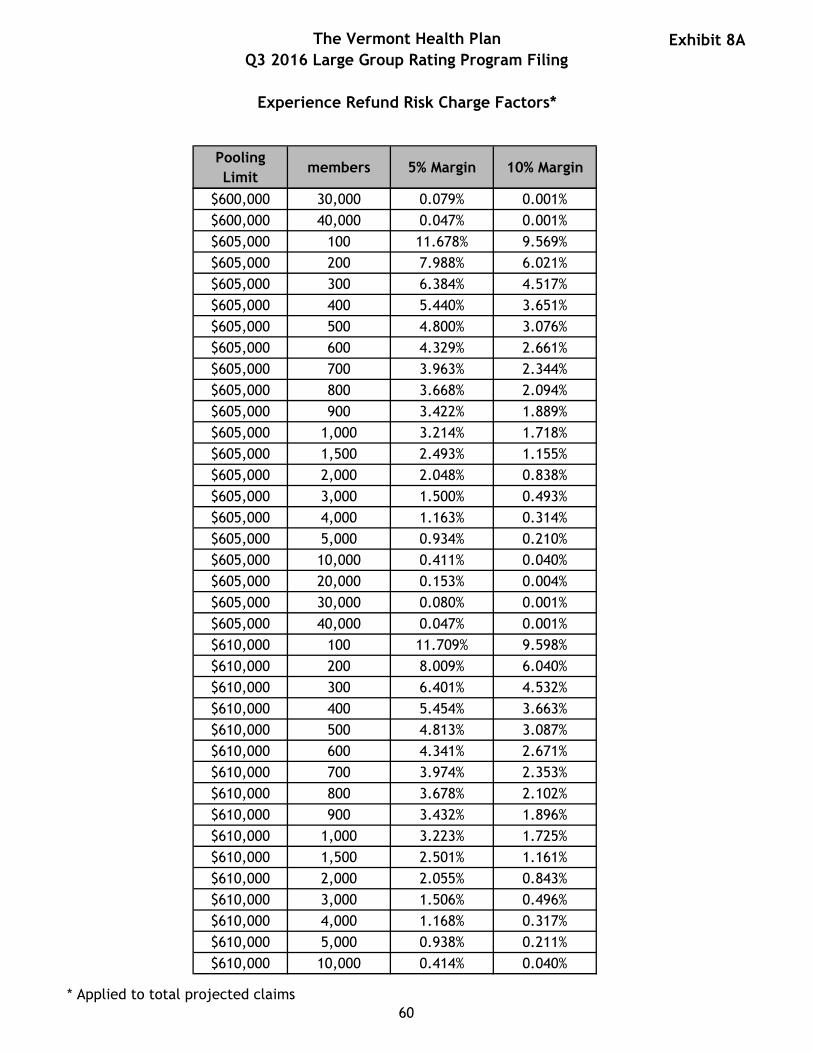
The Vermont Health Plan
Q3 2016 Large Group Rating Program Filing
Experience Refund Risk Charge Factors*
Exhibit 8A
Pooling
Limitmembers 5% Margin 10% Margin
$600,000 30,000 0.079% 0.001%
$600,000 40,000 0.047% 0.001%
$605,000 100 11.678% 9.569%
$605,000 200 7.988% 6.021%
$605,000 300 6.384% 4.517%
$605,000 400 5.440% 3.651%
$605,000 500 4.800% 3.076%
$605,000 600 4.329% 2.661%
$605,000 700 3.963% 2.344%
$605,000 800 3.668% 2.094%
$605,000 900 3.422% 1.889%
$605,000 1,000 3.214% 1.718%
$605,000 1,500 2.493% 1.155%
$605,000 2,000 2.048% 0.838%
$605,000 3,000 1.500% 0.493%
$605,000 4,000 1.163% 0.314%
$605,000 5,000 0.934% 0.210%
$605,000 10,000 0.411% 0.040%
$605,000 20,000 0.153% 0.004%
$605,000 30,000 0.080% 0.001%
$605,000 40,000 0.047% 0.001%
$610,000 100 11.709% 9.598%
$610,000 200 8.009% 6.040%
$610,000 300 6.401% 4.532%
$610,000 400 5.454% 3.663%
$610,000 500 4.813% 3.087%
$610,000 600 4.341% 2.671%
$610,000 700 3.974% 2.353%
$610,000 800 3.678% 2.102%
$610,000 900 3.432% 1.896%
$610,000 1,000 3.223% 1.725%
$610,000 1,500 2.501% 1.161%
$610,000 2,000 2.055% 0.843%
$610,000 3,000 1.506% 0.496%
$610,000 4,000 1.168% 0.317%
$610,000 5,000 0.938% 0.211%
$610,000 10,000 0.414% 0.040%
* Applied to total projected claims
60

The Vermont Health Plan
Q3 2016 Large Group Rating Program Filing
Experience Refund Risk Charge Factors*
Exhibit 8A
Pooling
Limitmembers 5% Margin 10% Margin
$610,000 20,000 0.154% 0.004%
$610,000 30,000 0.080% 0.001%
$610,000 40,000 0.048% 0.001%
$615,000 100 11.734% 9.623%
$615,000 200 8.026% 6.057%
$615,000 300 6.415% 4.545%
$615,000 400 5.466% 3.674%
$615,000 500 4.823% 3.096%
$615,000 600 4.350% 2.679%
$615,000 700 3.983% 2.361%
$615,000 800 3.686% 2.109%
$615,000 900 3.440% 1.903%
$615,000 1,000 3.230% 1.731%
$615,000 1,500 2.507% 1.166%
$615,000 2,000 2.061% 0.847%
$615,000 3,000 1.510% 0.499%
$615,000 4,000 1.173% 0.319%
$615,000 5,000 0.942% 0.213%
$615,000 10,000 0.416% 0.040%
$615,000 20,000 0.155% 0.004%
$615,000 30,000 0.081% 0.001%
$615,000 40,000 0.048% 0.001%
$620,000 100 11.758% 9.646%
$620,000 200 8.043% 6.072%
$620,000 300 6.429% 4.557%
$620,000 400 5.478% 3.684%
$620,000 500 4.834% 3.105%
$620,000 600 4.360% 2.687%
$620,000 700 3.992% 2.368%
$620,000 800 3.695% 2.115%
$620,000 900 3.448% 1.909%
$620,000 1,000 3.238% 1.737%
$620,000 1,500 2.513% 1.170%
$620,000 2,000 2.066% 0.850%
$620,000 3,000 1.515% 0.502%
$620,000 4,000 1.177% 0.320%
$620,000 5,000 0.946% 0.214%
* Applied to total projected claims
61

The Vermont Health Plan
Q3 2016 Large Group Rating Program Filing
Experience Refund Risk Charge Factors*
Exhibit 8A
Pooling
Limitmembers 5% Margin 10% Margin
$620,000 10,000 0.418% 0.041%
$620,000 20,000 0.156% 0.004%
$620,000 30,000 0.081% 0.001%
$620,000 40,000 0.048% 0.001%
$625,000 100 11.782% 9.669%
$625,000 200 8.060% 6.088%
$625,000 300 6.442% 4.569%
$625,000 400 5.489% 3.695%
$625,000 500 4.844% 3.114%
$625,000 600 4.369% 2.695%
$625,000 700 4.000% 2.375%
$625,000 800 3.703% 2.122%
$625,000 900 3.455% 1.915%
$625,000 1,000 3.245% 1.742%
$625,000 1,500 2.519% 1.174%
$625,000 2,000 2.072% 0.854%
$625,000 3,000 1.519% 0.504%
$625,000 4,000 1.181% 0.322%
$625,000 5,000 0.949% 0.216%
$625,000 10,000 0.420% 0.041%
$625,000 20,000 0.157% 0.004%
$625,000 30,000 0.082% 0.001%
$625,000 40,000 0.049% 0.001%
$630,000 100 11.806% 9.692%
$630,000 200 8.076% 6.103%
$630,000 300 6.455% 4.581%
$630,000 400 5.501% 3.705%
$630,000 500 4.854% 3.123%
$630,000 600 4.378% 2.703%
$630,000 700 4.009% 2.383%
$630,000 800 3.711% 2.129%
$630,000 900 3.463% 1.921%
$630,000 1,000 3.252% 1.748%
$630,000 1,500 2.525% 1.179%
$630,000 2,000 2.077% 0.857%
$630,000 3,000 1.524% 0.507%
$630,000 4,000 1.185% 0.324%
* Applied to total projected claims
62

The Vermont Health Plan
Q3 2016 Large Group Rating Program Filing
Experience Refund Risk Charge Factors*
Exhibit 8A
Pooling
Limitmembers 5% Margin 10% Margin
$630,000 5,000 0.953% 0.217%
$630,000 10,000 0.422% 0.042%
$630,000 20,000 0.157% 0.004%
$630,000 30,000 0.082% 0.001%
$630,000 40,000 0.049% 0.001%
$635,000 100 11.831% 9.715%
$635,000 200 8.093% 6.119%
$635,000 300 6.469% 4.594%
$635,000 400 5.512% 3.715%
$635,000 500 4.864% 3.132%
$635,000 600 4.388% 2.711%
$635,000 700 4.018% 2.390%
$635,000 800 3.719% 2.135%
$635,000 900 3.470% 1.927%
$635,000 1,000 3.259% 1.754%
$635,000 1,500 2.532% 1.183%
$635,000 2,000 2.083% 0.861%
$635,000 3,000 1.529% 0.509%
$635,000 4,000 1.189% 0.326%
$635,000 5,000 0.956% 0.219%
$635,000 10,000 0.424% 0.042%
$635,000 20,000 0.158% 0.004%
$635,000 30,000 0.083% 0.001%
$635,000 40,000 0.049% 0.001%
$640,000 100 11.855% 9.738%
$640,000 200 8.110% 6.134%
$640,000 300 6.482% 4.606%
$640,000 400 5.524% 3.725%
$640,000 500 4.875% 3.141%
$640,000 600 4.397% 2.719%
$640,000 700 4.026% 2.397%
$640,000 800 3.727% 2.142%
$640,000 900 3.478% 1.934%
$640,000 1,000 3.267% 1.760%
$640,000 1,500 2.538% 1.188%
$640,000 2,000 2.088% 0.865%
$640,000 3,000 1.533% 0.512%
* Applied to total projected claims
63

The Vermont Health Plan
Q3 2016 Large Group Rating Program Filing
Experience Refund Risk Charge Factors*
Exhibit 8A
Pooling
Limitmembers 5% Margin 10% Margin
$640,000 4,000 1.193% 0.328%
$640,000 5,000 0.960% 0.220%
$640,000 10,000 0.426% 0.043%
$640,000 20,000 0.159% 0.004%
$640,000 30,000 0.083% 0.001%
$640,000 40,000 0.050% 0.001%
$645,000 100 11.879% 9.761%
$645,000 200 8.127% 6.150%
$645,000 300 6.496% 4.618%
$645,000 400 5.535% 3.735%
$645,000 500 4.885% 3.149%
$645,000 600 4.406% 2.727%
$645,000 700 4.035% 2.404%
$645,000 800 3.735% 2.148%
$645,000 900 3.486% 1.940%
$645,000 1,000 3.274% 1.765%
$645,000 1,500 2.544% 1.192%
$645,000 2,000 2.093% 0.868%
$645,000 3,000 1.538% 0.514%
$645,000 4,000 1.197% 0.330%
$645,000 5,000 0.963% 0.222%
$645,000 10,000 0.428% 0.043%
$645,000 20,000 0.160% 0.004%
$645,000 30,000 0.084% 0.001%
$645,000 40,000 0.050% 0.001%
$650,000 100 11.903% 9.785%
$650,000 200 8.143% 6.165%
$650,000 300 6.509% 4.630%
$650,000 400 5.547% 3.746%
$650,000 500 4.895% 3.158%
$650,000 600 4.416% 2.735%
$650,000 700 4.043% 2.411%
$650,000 800 3.743% 2.155%
$650,000 900 3.493% 1.946%
$650,000 1,000 3.281% 1.771%
$650,000 1,500 2.550% 1.196%
$650,000 2,000 2.099% 0.872%
* Applied to total projected claims
64

The Vermont Health Plan
Q3 2016 Large Group Rating Program Filing
Experience Refund Risk Charge Factors*
Exhibit 8A
Pooling
Limitmembers 5% Margin 10% Margin
$650,000 3,000 1.542% 0.517%
$650,000 4,000 1.200% 0.332%
$650,000 5,000 0.967% 0.223%
$650,000 10,000 0.430% 0.043%
$650,000 20,000 0.161% 0.004%
$650,000 30,000 0.084% 0.001%
$650,000 40,000 0.050% 0.001%
$655,000 100 11.927% 9.808%
$655,000 200 8.160% 6.181%
$655,000 300 6.523% 4.642%
$655,000 400 5.558% 3.756%
$655,000 500 4.905% 3.167%
$655,000 600 4.425% 2.743%
$655,000 700 4.052% 2.419%
$655,000 800 3.751% 2.162%
$655,000 900 3.501% 1.952%
$655,000 1,000 3.288% 1.777%
$655,000 1,500 2.556% 1.201%
$655,000 2,000 2.104% 0.875%
$655,000 3,000 1.547% 0.520%
$655,000 4,000 1.204% 0.334%
$655,000 5,000 0.970% 0.225%
$655,000 10,000 0.432% 0.044%
$655,000 20,000 0.162% 0.004%
$655,000 30,000 0.085% 0.001%
$655,000 40,000 0.051% 0.001%
$660,000 100 11.951% 9.831%
$660,000 200 8.177% 6.196%
$660,000 300 6.536% 4.655%
$660,000 400 5.570% 3.766%
$660,000 500 4.916% 3.176%
$660,000 600 4.434% 2.750%
$660,000 700 4.061% 2.426%
$660,000 800 3.759% 2.168%
$660,000 900 3.509% 1.958%
$660,000 1,000 3.296% 1.783%
$660,000 1,500 2.562% 1.205%
* Applied to total projected claims
65

The Vermont Health Plan
Q3 2016 Large Group Rating Program Filing
Experience Refund Risk Charge Factors*
Exhibit 8A
Pooling
Limitmembers 5% Margin 10% Margin
$660,000 2,000 2.110% 0.879%
$660,000 3,000 1.551% 0.522%
$660,000 4,000 1.208% 0.336%
$660,000 5,000 0.974% 0.226%
$660,000 10,000 0.434% 0.044%
$660,000 20,000 0.163% 0.004%
$660,000 30,000 0.085% 0.001%
$660,000 40,000 0.051% 0.001%
$665,000 100 11.976% 9.854%
$665,000 200 8.193% 6.212%
$665,000 300 6.549% 4.667%
$665,000 400 5.581% 3.776%
$665,000 500 4.926% 3.185%
$665,000 600 4.444% 2.758%
$665,000 700 4.069% 2.433%
$665,000 800 3.767% 2.175%
$665,000 900 3.516% 1.964%
$665,000 1,000 3.303% 1.788%
$665,000 1,500 2.568% 1.210%
$665,000 2,000 2.115% 0.883%
$665,000 3,000 1.556% 0.525%
$665,000 4,000 1.212% 0.338%
$665,000 5,000 0.977% 0.228%
$665,000 10,000 0.436% 0.045%
$665,000 20,000 0.163% 0.004%
$665,000 30,000 0.086% 0.001%
$665,000 40,000 0.051% 0.001%
$670,000 100 12.000% 9.877%
$670,000 200 8.210% 6.228%
$670,000 300 6.563% 4.679%
$670,000 400 5.593% 3.787%
$670,000 500 4.936% 3.194%
$670,000 600 4.453% 2.766%
$670,000 700 4.078% 2.440%
$670,000 800 3.775% 2.182%
$670,000 900 3.524% 1.971%
$670,000 1,000 3.310% 1.794%
* Applied to total projected claims
66

The Vermont Health Plan
Q3 2016 Large Group Rating Program Filing
Experience Refund Risk Charge Factors*
Exhibit 8A
Pooling
Limitmembers 5% Margin 10% Margin
$670,000 1,500 2.574% 1.214%
$670,000 2,000 2.120% 0.886%
$670,000 3,000 1.561% 0.527%
$670,000 4,000 1.216% 0.340%
$670,000 5,000 0.981% 0.229%
$670,000 10,000 0.438% 0.045%
$670,000 20,000 0.164% 0.004%
$670,000 30,000 0.086% 0.001%
$670,000 40,000 0.052% 0.001%
$675,000 100 12.024% 9.901%
$675,000 200 8.227% 6.243%
$675,000 300 6.576% 4.691%
$675,000 400 5.604% 3.797%
$675,000 500 4.946% 3.203%
$675,000 600 4.462% 2.774%
$675,000 700 4.087% 2.447%
$675,000 800 3.783% 2.188%
$675,000 900 3.531% 1.977%
$675,000 1,000 3.318% 1.800%
$675,000 1,500 2.580% 1.219%
$675,000 2,000 2.126% 0.890%
$675,000 3,000 1.565% 0.530%
$675,000 4,000 1.220% 0.342%
$675,000 5,000 0.984% 0.231%
$675,000 10,000 0.440% 0.046%
$675,000 20,000 0.165% 0.004%
$675,000 30,000 0.087% 0.001%
$675,000 40,000 0.052% 0.001%
$680,000 100 12.048% 9.924%
$680,000 200 8.244% 6.259%
$680,000 300 6.590% 4.703%
$680,000 400 5.616% 3.807%
$680,000 500 4.957% 3.212%
$680,000 600 4.472% 2.782%
$680,000 700 4.095% 2.455%
$680,000 800 3.791% 2.195%
$680,000 900 3.539% 1.983%
* Applied to total projected claims
67

The Vermont Health Plan
Q3 2016 Large Group Rating Program Filing
Experience Refund Risk Charge Factors*
Exhibit 8A
Pooling
Limitmembers 5% Margin 10% Margin
$680,000 1,000 3.325% 1.806%
$680,000 1,500 2.586% 1.223%
$680,000 2,000 2.131% 0.894%
$680,000 3,000 1.570% 0.533%
$680,000 4,000 1.224% 0.344%
$680,000 5,000 0.988% 0.232%
$680,000 10,000 0.442% 0.046%
$680,000 20,000 0.166% 0.004%
$680,000 30,000 0.087% 0.001%
$680,000 40,000 0.052% 0.001%
$685,000 100 12.072% 9.947%
$685,000 200 8.260% 6.274%
$685,000 300 6.603% 4.716%
$685,000 400 5.628% 3.817%
$685,000 500 4.967% 3.221%
$685,000 600 4.481% 2.790%
$685,000 700 4.104% 2.462%
$685,000 800 3.799% 2.202%
$685,000 900 3.547% 1.989%
$685,000 1,000 3.332% 1.812%
$685,000 1,500 2.592% 1.228%
$685,000 2,000 2.137% 0.897%
$685,000 3,000 1.574% 0.535%
$685,000 4,000 1.228% 0.346%
$685,000 5,000 0.991% 0.234%
$685,000 10,000 0.444% 0.047%
$685,000 20,000 0.167% 0.005%
$685,000 30,000 0.088% 0.001%
$685,000 40,000 0.053% 0.001%
$690,000 100 12.101% 9.975%
$690,000 200 8.280% 6.293%
$690,000 300 6.619% 4.730%
$690,000 400 5.641% 3.830%
$690,000 500 4.979% 3.232%
$690,000 600 4.492% 2.800%
$690,000 700 4.114% 2.471%
$690,000 800 3.809% 2.210%
* Applied to total projected claims
68
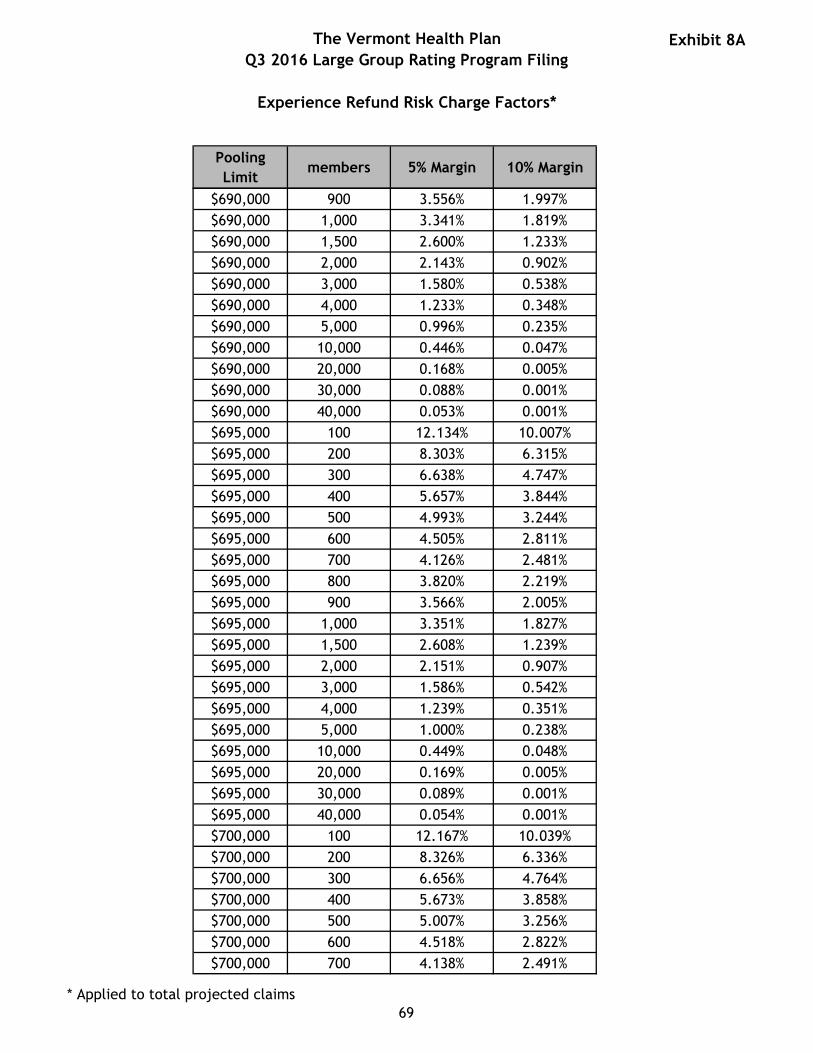
The Vermont Health Plan
Q3 2016 Large Group Rating Program Filing
Experience Refund Risk Charge Factors*
Exhibit 8A
Pooling
Limitmembers 5% Margin 10% Margin
$690,000 900 3.556% 1.997%
$690,000 1,000 3.341% 1.819%
$690,000 1,500 2.600% 1.233%
$690,000 2,000 2.143% 0.902%
$690,000 3,000 1.580% 0.538%
$690,000 4,000 1.233% 0.348%
$690,000 5,000 0.996% 0.235%
$690,000 10,000 0.446% 0.047%
$690,000 20,000 0.168% 0.005%
$690,000 30,000 0.088% 0.001%
$690,000 40,000 0.053% 0.001%
$695,000 100 12.134% 10.007%
$695,000 200 8.303% 6.315%
$695,000 300 6.638% 4.747%
$695,000 400 5.657% 3.844%
$695,000 500 4.993% 3.244%
$695,000 600 4.505% 2.811%
$695,000 700 4.126% 2.481%
$695,000 800 3.820% 2.219%
$695,000 900 3.566% 2.005%
$695,000 1,000 3.351% 1.827%
$695,000 1,500 2.608% 1.239%
$695,000 2,000 2.151% 0.907%
$695,000 3,000 1.586% 0.542%
$695,000 4,000 1.239% 0.351%
$695,000 5,000 1.000% 0.238%
$695,000 10,000 0.449% 0.048%
$695,000 20,000 0.169% 0.005%
$695,000 30,000 0.089% 0.001%
$695,000 40,000 0.054% 0.001%
$700,000 100 12.167% 10.039%
$700,000 200 8.326% 6.336%
$700,000 300 6.656% 4.764%
$700,000 400 5.673% 3.858%
$700,000 500 5.007% 3.256%
$700,000 600 4.518% 2.822%
$700,000 700 4.138% 2.491%
* Applied to total projected claims
69
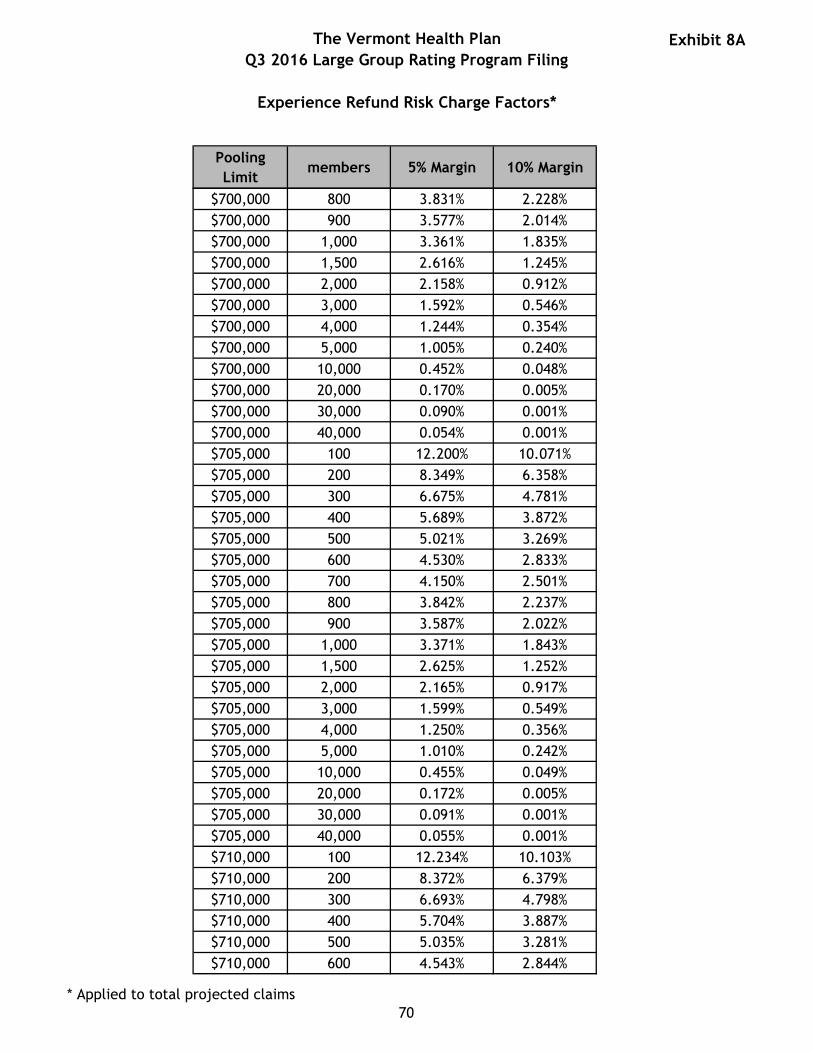
The Vermont Health Plan
Q3 2016 Large Group Rating Program Filing
Experience Refund Risk Charge Factors*
Exhibit 8A
Pooling
Limitmembers 5% Margin 10% Margin
$700,000 800 3.831% 2.228%
$700,000 900 3.577% 2.014%
$700,000 1,000 3.361% 1.835%
$700,000 1,500 2.616% 1.245%
$700,000 2,000 2.158% 0.912%
$700,000 3,000 1.592% 0.546%
$700,000 4,000 1.244% 0.354%
$700,000 5,000 1.005% 0.240%
$700,000 10,000 0.452% 0.048%
$700,000 20,000 0.170% 0.005%
$700,000 30,000 0.090% 0.001%
$700,000 40,000 0.054% 0.001%
$705,000 100 12.200% 10.071%
$705,000 200 8.349% 6.358%
$705,000 300 6.675% 4.781%
$705,000 400 5.689% 3.872%
$705,000 500 5.021% 3.269%
$705,000 600 4.530% 2.833%
$705,000 700 4.150% 2.501%
$705,000 800 3.842% 2.237%
$705,000 900 3.587% 2.022%
$705,000 1,000 3.371% 1.843%
$705,000 1,500 2.625% 1.252%
$705,000 2,000 2.165% 0.917%
$705,000 3,000 1.599% 0.549%
$705,000 4,000 1.250% 0.356%
$705,000 5,000 1.010% 0.242%
$705,000 10,000 0.455% 0.049%
$705,000 20,000 0.172% 0.005%
$705,000 30,000 0.091% 0.001%
$705,000 40,000 0.055% 0.001%
$710,000 100 12.234% 10.103%
$710,000 200 8.372% 6.379%
$710,000 300 6.693% 4.798%
$710,000 400 5.704% 3.887%
$710,000 500 5.035% 3.281%
$710,000 600 4.543% 2.844%
* Applied to total projected claims
70
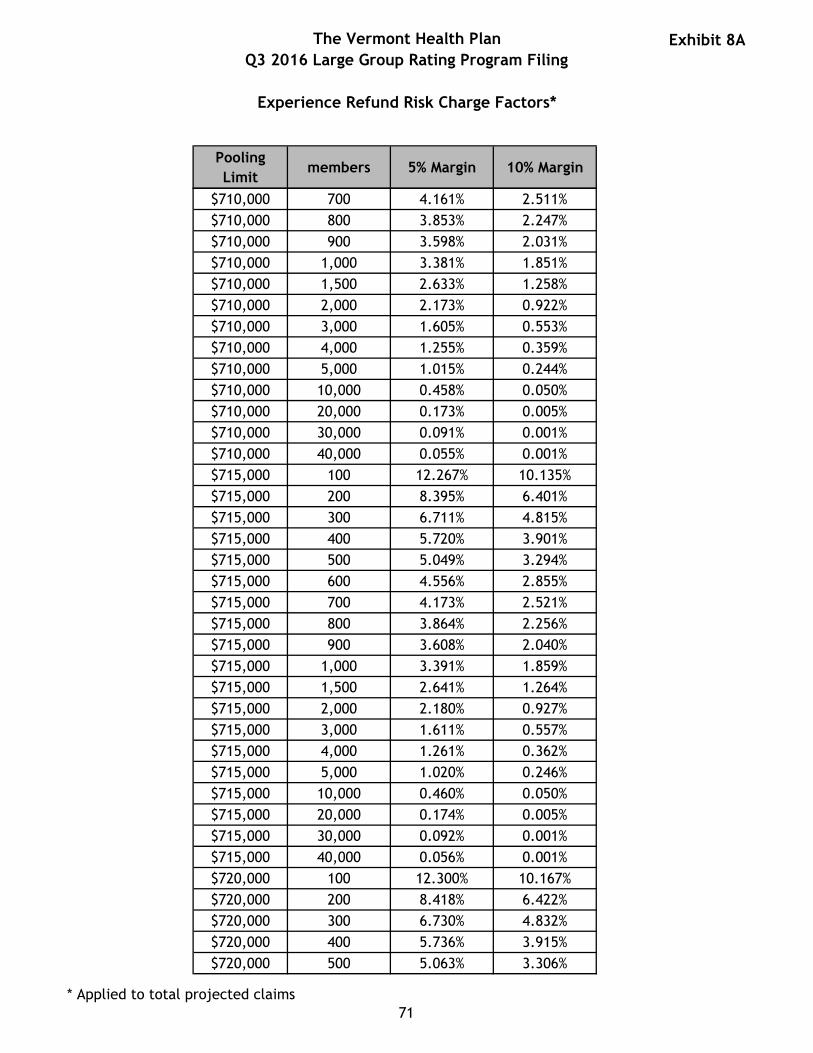
The Vermont Health Plan
Q3 2016 Large Group Rating Program Filing
Experience Refund Risk Charge Factors*
Exhibit 8A
Pooling
Limitmembers 5% Margin 10% Margin
$710,000 700 4.161% 2.511%
$710,000 800 3.853% 2.247%
$710,000 900 3.598% 2.031%
$710,000 1,000 3.381% 1.851%
$710,000 1,500 2.633% 1.258%
$710,000 2,000 2.173% 0.922%
$710,000 3,000 1.605% 0.553%
$710,000 4,000 1.255% 0.359%
$710,000 5,000 1.015% 0.244%
$710,000 10,000 0.458% 0.050%
$710,000 20,000 0.173% 0.005%
$710,000 30,000 0.091% 0.001%
$710,000 40,000 0.055% 0.001%
$715,000 100 12.267% 10.135%
$715,000 200 8.395% 6.401%
$715,000 300 6.711% 4.815%
$715,000 400 5.720% 3.901%
$715,000 500 5.049% 3.294%
$715,000 600 4.556% 2.855%
$715,000 700 4.173% 2.521%
$715,000 800 3.864% 2.256%
$715,000 900 3.608% 2.040%
$715,000 1,000 3.391% 1.859%
$715,000 1,500 2.641% 1.264%
$715,000 2,000 2.180% 0.927%
$715,000 3,000 1.611% 0.557%
$715,000 4,000 1.261% 0.362%
$715,000 5,000 1.020% 0.246%
$715,000 10,000 0.460% 0.050%
$715,000 20,000 0.174% 0.005%
$715,000 30,000 0.092% 0.001%
$715,000 40,000 0.056% 0.001%
$720,000 100 12.300% 10.167%
$720,000 200 8.418% 6.422%
$720,000 300 6.730% 4.832%
$720,000 400 5.736% 3.915%
$720,000 500 5.063% 3.306%
* Applied to total projected claims
71

The Vermont Health Plan
Q3 2016 Large Group Rating Program Filing
Experience Refund Risk Charge Factors*
Exhibit 8A
Pooling
Limitmembers 5% Margin 10% Margin
$720,000 600 4.569% 2.866%
$720,000 700 4.185% 2.531%
$720,000 800 3.876% 2.265%
$720,000 900 3.619% 2.048%
$720,000 1,000 3.401% 1.867%
$720,000 1,500 2.650% 1.270%
$720,000 2,000 2.188% 0.932%
$720,000 3,000 1.618% 0.561%
$720,000 4,000 1.266% 0.365%
$720,000 5,000 1.025% 0.248%
$720,000 10,000 0.463% 0.051%
$720,000 20,000 0.175% 0.005%
$720,000 30,000 0.093% 0.001%
$720,000 40,000 0.056% 0.001%
$725,000 100 12.333% 10.199%
$725,000 200 8.440% 6.444%
$725,000 300 6.748% 4.849%
$725,000 400 5.752% 3.929%
$725,000 500 5.077% 3.318%
$725,000 600 4.582% 2.877%
$725,000 700 4.197% 2.541%
$725,000 800 3.887% 2.274%
$725,000 900 3.629% 2.057%
$725,000 1,000 3.410% 1.875%
$725,000 1,500 2.658% 1.276%
$725,000 2,000 2.195% 0.937%
$725,000 3,000 1.624% 0.564%
$725,000 4,000 1.272% 0.368%
$725,000 5,000 1.030% 0.251%
$725,000 10,000 0.466% 0.052%
$725,000 20,000 0.177% 0.005%
$725,000 30,000 0.094% 0.002%
$725,000 40,000 0.057% 0.001%
$730,000 100 12.366% 10.231%
$730,000 200 8.463% 6.465%
$730,000 300 6.767% 4.866%
$730,000 400 5.768% 3.943%
* Applied to total projected claims
72

The Vermont Health Plan
Q3 2016 Large Group Rating Program Filing
Experience Refund Risk Charge Factors*
Exhibit 8A
Pooling
Limitmembers 5% Margin 10% Margin
$730,000 500 5.091% 3.331%
$730,000 600 4.594% 2.888%
$730,000 700 4.209% 2.551%
$730,000 800 3.898% 2.284%
$730,000 900 3.640% 2.065%
$730,000 1,000 3.420% 1.883%
$730,000 1,500 2.666% 1.283%
$730,000 2,000 2.203% 0.942%
$730,000 3,000 1.630% 0.568%
$730,000 4,000 1.278% 0.370%
$730,000 5,000 1.035% 0.253%
$730,000 10,000 0.469% 0.052%
$730,000 20,000 0.178% 0.005%
$730,000 30,000 0.094% 0.002%
$730,000 40,000 0.057% 0.001%
$735,000 100 12.399% 10.263%
$735,000 200 8.486% 6.487%
$735,000 300 6.785% 4.883%
$735,000 400 5.783% 3.958%
$735,000 500 5.105% 3.343%
$735,000 600 4.607% 2.900%
$735,000 700 4.220% 2.561%
$735,000 800 3.909% 2.293%
$735,000 900 3.650% 2.074%
$735,000 1,000 3.430% 1.891%
$735,000 1,500 2.675% 1.289%
$735,000 2,000 2.210% 0.948%
$735,000 3,000 1.637% 0.572%
$735,000 4,000 1.283% 0.373%
$735,000 5,000 1.040% 0.255%
$735,000 10,000 0.472% 0.053%
$735,000 20,000 0.179% 0.005%
$735,000 30,000 0.095% 0.002%
$735,000 40,000 0.058% 0.001%
$740,000 100 12.432% 10.295%
$740,000 200 8.509% 6.509%
$740,000 300 6.803% 4.900%
* Applied to total projected claims
73

The Vermont Health Plan
Q3 2016 Large Group Rating Program Filing
Experience Refund Risk Charge Factors*
Exhibit 8A
Pooling
Limitmembers 5% Margin 10% Margin
$740,000 400 5.799% 3.972%
$740,000 500 5.119% 3.356%
$740,000 600 4.620% 2.911%
$740,000 700 4.232% 2.571%
$740,000 800 3.920% 2.302%
$740,000 900 3.660% 2.083%
$740,000 1,000 3.440% 1.899%
$740,000 1,500 2.683% 1.295%
$740,000 2,000 2.217% 0.953%
$740,000 3,000 1.643% 0.575%
$740,000 4,000 1.289% 0.376%
$740,000 5,000 1.045% 0.257%
$740,000 10,000 0.475% 0.054%
$740,000 20,000 0.180% 0.005%
$740,000 30,000 0.096% 0.002%
$740,000 40,000 0.058% 0.001%
$745,000 100 12.465% 10.327%
$745,000 200 8.532% 6.530%
$745,000 300 6.822% 4.917%
$745,000 400 5.815% 3.986%
$745,000 500 5.133% 3.368%
$745,000 600 4.633% 2.922%
$745,000 700 4.244% 2.582%
$745,000 800 3.931% 2.312%
$745,000 900 3.671% 2.091%
$745,000 1,000 3.450% 1.907%
$745,000 1,500 2.691% 1.301%
$745,000 2,000 2.225% 0.958%
$745,000 3,000 1.649% 0.579%
$745,000 4,000 1.294% 0.379%
$745,000 5,000 1.050% 0.259%
$745,000 10,000 0.478% 0.055%
$745,000 20,000 0.182% 0.006%
$745,000 30,000 0.097% 0.002%
$745,000 40,000 0.059% 0.001%
$750,000 100 12.498% 10.359%
$750,000 200 8.555% 6.552%
* Applied to total projected claims
74

The Vermont Health Plan
Q3 2016 Large Group Rating Program Filing
Experience Refund Risk Charge Factors*
Exhibit 8A
Pooling
Limitmembers 5% Margin 10% Margin
$750,000 300 6.840% 4.934%
$750,000 400 5.831% 4.001%
$750,000 500 5.147% 3.380%
$750,000 600 4.645% 2.933%
$750,000 700 4.256% 2.592%
$750,000 800 3.942% 2.321%
$750,000 900 3.681% 2.100%
$750,000 1,000 3.460% 1.915%
$750,000 1,500 2.700% 1.308%
$750,000 2,000 2.232% 0.963%
$750,000 3,000 1.656% 0.583%
$750,000 4,000 1.300% 0.382%
$750,000 5,000 1.055% 0.262%
$750,000 10,000 0.481% 0.055%
$750,000 20,000 0.183% 0.006%
$750,000 30,000 0.097% 0.002%
$750,000 40,000 0.059% 0.001%
$755,000 100 12.532% 10.391%
$755,000 200 8.578% 6.573%
$755,000 300 6.859% 4.951%
$755,000 400 5.847% 4.015%
$755,000 500 5.162% 3.393%
$755,000 600 4.658% 2.944%
$755,000 700 4.268% 2.602%
$755,000 800 3.953% 2.330%
$755,000 900 3.692% 2.109%
$755,000 1,000 3.470% 1.923%
$755,000 1,500 2.708% 1.314%
$755,000 2,000 2.240% 0.968%
$755,000 3,000 1.662% 0.587%
$755,000 4,000 1.305% 0.385%
$755,000 5,000 1.059% 0.264%
$755,000 10,000 0.484% 0.056%
$755,000 20,000 0.184% 0.006%
$755,000 30,000 0.098% 0.002%
$755,000 40,000 0.060% 0.001%
$760,000 100 12.565% 10.423%
* Applied to total projected claims
75

The Vermont Health Plan
Q3 2016 Large Group Rating Program Filing
Experience Refund Risk Charge Factors*
Exhibit 8A
Pooling
Limitmembers 5% Margin 10% Margin
$760,000 200 8.601% 6.595%
$760,000 300 6.877% 4.968%
$760,000 400 5.862% 4.029%
$760,000 500 5.176% 3.405%
$760,000 600 4.671% 2.955%
$760,000 700 4.280% 2.612%
$760,000 800 3.964% 2.340%
$760,000 900 3.702% 2.117%
$760,000 1,000 3.480% 1.932%
$760,000 1,500 2.716% 1.320%
$760,000 2,000 2.247% 0.973%
$760,000 3,000 1.668% 0.590%
$760,000 4,000 1.311% 0.387%
$760,000 5,000 1.064% 0.266%
$760,000 10,000 0.487% 0.057%
$760,000 20,000 0.186% 0.006%
$760,000 30,000 0.099% 0.002%
$760,000 40,000 0.060% 0.001%
$765,000 100 12.598% 10.455%
$765,000 200 8.624% 6.617%
$765,000 300 6.896% 4.985%
$765,000 400 5.878% 4.043%
$765,000 500 5.190% 3.418%
$765,000 600 4.684% 2.966%
$765,000 700 4.291% 2.622%
$765,000 800 3.975% 2.349%
$765,000 900 3.713% 2.126%
$765,000 1,000 3.490% 1.940%
$765,000 1,500 2.725% 1.326%
$765,000 2,000 2.254% 0.978%
$765,000 3,000 1.674% 0.594%
$765,000 4,000 1.316% 0.390%
$765,000 5,000 1.069% 0.268%
$765,000 10,000 0.489% 0.057%
$765,000 20,000 0.187% 0.006%
$765,000 30,000 0.100% 0.002%
$765,000 40,000 0.061% 0.001%
* Applied to total projected claims
76

The Vermont Health Plan
Q3 2016 Large Group Rating Program Filing
Experience Refund Risk Charge Factors*
Exhibit 8A
Pooling
Limitmembers 5% Margin 10% Margin
$770,000 100 12.631% 10.487%
$770,000 200 8.647% 6.638%
$770,000 300 6.914% 5.002%
$770,000 400 5.894% 4.058%
$770,000 500 5.204% 3.430%
$770,000 600 4.697% 2.977%
$770,000 700 4.303% 2.632%
$770,000 800 3.986% 2.358%
$770,000 900 3.723% 2.135%
$770,000 1,000 3.500% 1.948%
$770,000 1,500 2.733% 1.333%
$770,000 2,000 2.262% 0.984%
$770,000 3,000 1.681% 0.598%
$770,000 4,000 1.322% 0.393%
$770,000 5,000 1.074% 0.270%
$770,000 10,000 0.492% 0.058%
$770,000 20,000 0.188% 0.006%
$770,000 30,000 0.100% 0.002%
$770,000 40,000 0.061% 0.001%
$775,000 100 12.664% 10.519%
$775,000 200 8.670% 6.660%
$775,000 300 6.933% 5.019%
$775,000 400 5.910% 4.072%
$775,000 500 5.218% 3.443%
$775,000 600 4.709% 2.989%
$775,000 700 4.315% 2.642%
$775,000 800 3.997% 2.368%
$775,000 900 3.734% 2.143%
$775,000 1,000 3.510% 1.956%
$775,000 1,500 2.741% 1.339%
$775,000 2,000 2.269% 0.989%
$775,000 3,000 1.687% 0.602%
$775,000 4,000 1.327% 0.396%
$775,000 5,000 1.079% 0.273%
$775,000 10,000 0.495% 0.059%
$775,000 20,000 0.189% 0.006%
$775,000 30,000 0.101% 0.002%
* Applied to total projected claims
77
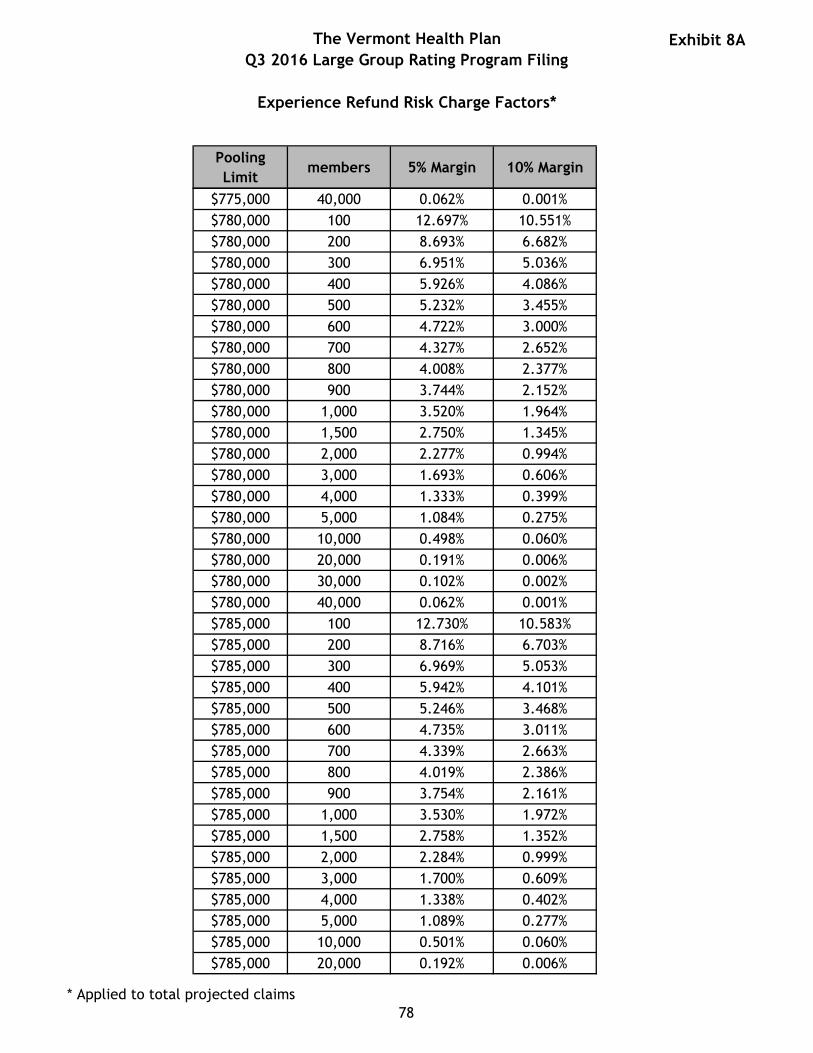
The Vermont Health Plan
Q3 2016 Large Group Rating Program Filing
Experience Refund Risk Charge Factors*
Exhibit 8A
Pooling
Limitmembers 5% Margin 10% Margin
$775,000 40,000 0.062% 0.001%
$780,000 100 12.697% 10.551%
$780,000 200 8.693% 6.682%
$780,000 300 6.951% 5.036%
$780,000 400 5.926% 4.086%
$780,000 500 5.232% 3.455%
$780,000 600 4.722% 3.000%
$780,000 700 4.327% 2.652%
$780,000 800 4.008% 2.377%
$780,000 900 3.744% 2.152%
$780,000 1,000 3.520% 1.964%
$780,000 1,500 2.750% 1.345%
$780,000 2,000 2.277% 0.994%
$780,000 3,000 1.693% 0.606%
$780,000 4,000 1.333% 0.399%
$780,000 5,000 1.084% 0.275%
$780,000 10,000 0.498% 0.060%
$780,000 20,000 0.191% 0.006%
$780,000 30,000 0.102% 0.002%
$780,000 40,000 0.062% 0.001%
$785,000 100 12.730% 10.583%
$785,000 200 8.716% 6.703%
$785,000 300 6.969% 5.053%
$785,000 400 5.942% 4.101%
$785,000 500 5.246% 3.468%
$785,000 600 4.735% 3.011%
$785,000 700 4.339% 2.663%
$785,000 800 4.019% 2.386%
$785,000 900 3.754% 2.161%
$785,000 1,000 3.530% 1.972%
$785,000 1,500 2.758% 1.352%
$785,000 2,000 2.284% 0.999%
$785,000 3,000 1.700% 0.609%
$785,000 4,000 1.338% 0.402%
$785,000 5,000 1.089% 0.277%
$785,000 10,000 0.501% 0.060%
$785,000 20,000 0.192% 0.006%
* Applied to total projected claims
78

The Vermont Health Plan
Q3 2016 Large Group Rating Program Filing
Experience Refund Risk Charge Factors*
Exhibit 8A
Pooling
Limitmembers 5% Margin 10% Margin
$785,000 30,000 0.103% 0.002%
$785,000 40,000 0.063% 0.001%
$790,000 100 12.763% 10.615%
$790,000 200 8.739% 6.725%
$790,000 300 6.988% 5.070%
$790,000 400 5.957% 4.115%
$790,000 500 5.260% 3.480%
$790,000 600 4.748% 3.022%
$790,000 700 4.350% 2.673%
$790,000 800 4.030% 2.396%
$790,000 900 3.765% 2.169%
$790,000 1,000 3.540% 1.980%
$790,000 1,500 2.766% 1.358%
$790,000 2,000 2.291% 1.004%
$790,000 3,000 1.706% 0.613%
$790,000 4,000 1.344% 0.405%
$790,000 5,000 1.094% 0.279%
$790,000 10,000 0.504% 0.061%
$790,000 20,000 0.193% 0.006%
$790,000 30,000 0.103% 0.002%
$790,000 40,000 0.063% 0.001%
$795,000 100 12.797% 10.647%
$795,000 200 8.761% 6.747%
$795,000 300 7.006% 5.087%
$795,000 400 5.973% 4.129%
$795,000 500 5.274% 3.493%
$795,000 600 4.760% 3.033%
$795,000 700 4.362% 2.683%
$795,000 800 4.041% 2.405%
$795,000 900 3.775% 2.178%
$795,000 1,000 3.550% 1.988%
$795,000 1,500 2.774% 1.364%
$795,000 2,000 2.299% 1.009%
$795,000 3,000 1.712% 0.617%
$795,000 4,000 1.349% 0.408%
$795,000 5,000 1.099% 0.282%
$795,000 10,000 0.507% 0.062%
* Applied to total projected claims
79
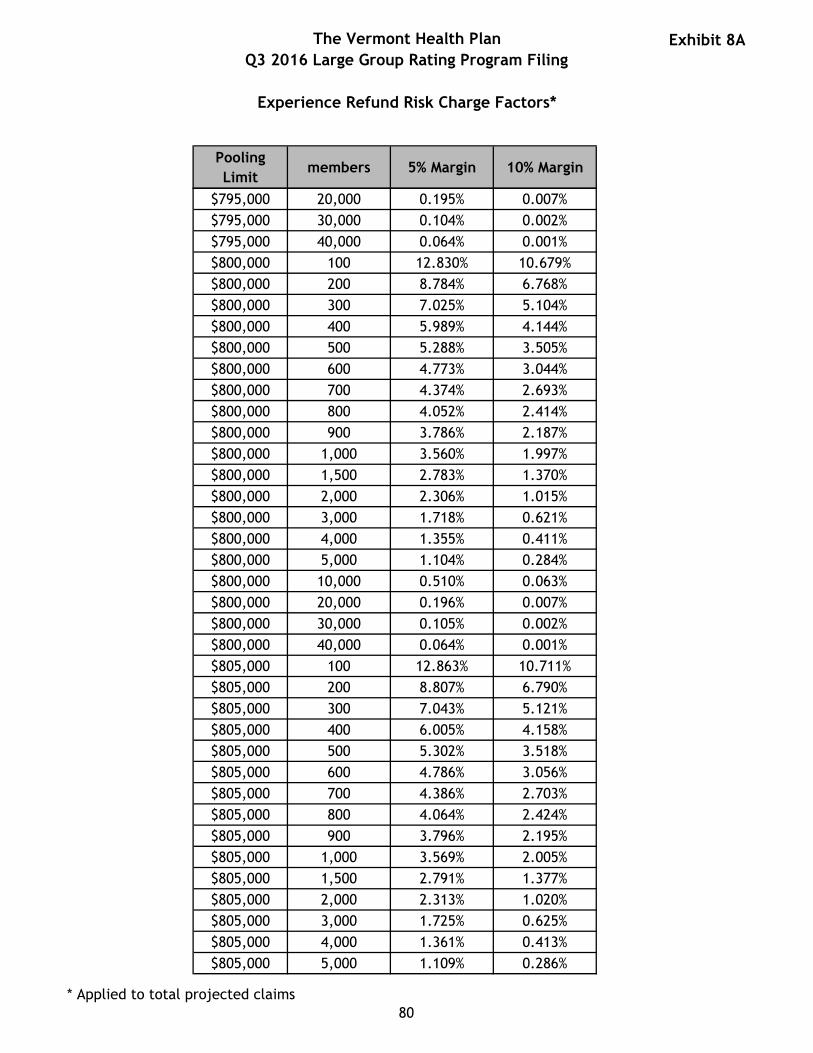
The Vermont Health Plan
Q3 2016 Large Group Rating Program Filing
Experience Refund Risk Charge Factors*
Exhibit 8A
Pooling
Limitmembers 5% Margin 10% Margin
$795,000 20,000 0.195% 0.007%
$795,000 30,000 0.104% 0.002%
$795,000 40,000 0.064% 0.001%
$800,000 100 12.830% 10.679%
$800,000 200 8.784% 6.768%
$800,000 300 7.025% 5.104%
$800,000 400 5.989% 4.144%
$800,000 500 5.288% 3.505%
$800,000 600 4.773% 3.044%
$800,000 700 4.374% 2.693%
$800,000 800 4.052% 2.414%
$800,000 900 3.786% 2.187%
$800,000 1,000 3.560% 1.997%
$800,000 1,500 2.783% 1.370%
$800,000 2,000 2.306% 1.015%
$800,000 3,000 1.718% 0.621%
$800,000 4,000 1.355% 0.411%
$800,000 5,000 1.104% 0.284%
$800,000 10,000 0.510% 0.063%
$800,000 20,000 0.196% 0.007%
$800,000 30,000 0.105% 0.002%
$800,000 40,000 0.064% 0.001%
$805,000 100 12.863% 10.711%
$805,000 200 8.807% 6.790%
$805,000 300 7.043% 5.121%
$805,000 400 6.005% 4.158%
$805,000 500 5.302% 3.518%
$805,000 600 4.786% 3.056%
$805,000 700 4.386% 2.703%
$805,000 800 4.064% 2.424%
$805,000 900 3.796% 2.195%
$805,000 1,000 3.569% 2.005%
$805,000 1,500 2.791% 1.377%
$805,000 2,000 2.313% 1.020%
$805,000 3,000 1.725% 0.625%
$805,000 4,000 1.361% 0.413%
$805,000 5,000 1.109% 0.286%
* Applied to total projected claims
80

The Vermont Health Plan
Q3 2016 Large Group Rating Program Filing
Experience Refund Risk Charge Factors*
Exhibit 8A
Pooling
Limitmembers 5% Margin 10% Margin
$805,000 10,000 0.513% 0.063%
$805,000 20,000 0.197% 0.007%
$805,000 30,000 0.106% 0.002%
$805,000 40,000 0.065% 0.001%
$810,000 100 12.896% 10.743%
$810,000 200 8.830% 6.812%
$810,000 300 7.062% 5.138%
$810,000 400 6.021% 4.172%
$810,000 500 5.316% 3.530%
$810,000 600 4.799% 3.067%
$810,000 700 4.398% 2.713%
$810,000 800 4.075% 2.433%
$810,000 900 3.807% 2.204%
$810,000 1,000 3.579% 2.013%
$810,000 1,500 2.799% 1.383%
$810,000 2,000 2.321% 1.025%
$810,000 3,000 1.731% 0.628%
$810,000 4,000 1.366% 0.416%
$810,000 5,000 1.114% 0.289%
$810,000 10,000 0.516% 0.064%
$810,000 20,000 0.199% 0.007%
$810,000 30,000 0.107% 0.002%
$810,000 40,000 0.065% 0.001%
$815,000 100 12.929% 10.775%
$815,000 200 8.853% 6.833%
$815,000 300 7.080% 5.155%
$815,000 400 6.037% 4.187%
$815,000 500 5.330% 3.543%
$815,000 600 4.812% 3.078%
$815,000 700 4.410% 2.723%
$815,000 800 4.086% 2.442%
$815,000 900 3.817% 2.213%
$815,000 1,000 3.589% 2.021%
$815,000 1,500 2.808% 1.389%
$815,000 2,000 2.328% 1.030%
$815,000 3,000 1.737% 0.632%
$815,000 4,000 1.372% 0.419%
* Applied to total projected claims
81

The Vermont Health Plan
Q3 2016 Large Group Rating Program Filing
Experience Refund Risk Charge Factors*
Exhibit 8A
Pooling
Limitmembers 5% Margin 10% Margin
$815,000 5,000 1.119% 0.291%
$815,000 10,000 0.519% 0.065%
$815,000 20,000 0.200% 0.007%
$815,000 30,000 0.107% 0.002%
$815,000 40,000 0.066% 0.001%
$820,000 100 12.962% 10.808%
$820,000 200 8.876% 6.855%
$820,000 300 7.099% 5.172%
$820,000 400 6.052% 4.201%
$820,000 500 5.344% 3.555%
$820,000 600 4.824% 3.089%
$820,000 700 4.421% 2.734%
$820,000 800 4.097% 2.452%
$820,000 900 3.827% 2.221%
$820,000 1,000 3.599% 2.029%
$820,000 1,500 2.816% 1.396%
$820,000 2,000 2.336% 1.035%
$820,000 3,000 1.743% 0.636%
$820,000 4,000 1.377% 0.422%
$820,000 5,000 1.124% 0.293%
$820,000 10,000 0.522% 0.066%
$820,000 20,000 0.201% 0.007%
$820,000 30,000 0.108% 0.002%
$820,000 40,000 0.066% 0.001%
$825,000 100 12.992% 10.836%
$825,000 200 8.897% 6.874%
$825,000 300 7.115% 5.188%
$825,000 400 6.066% 4.214%
$825,000 500 5.357% 3.566%
$825,000 600 4.836% 3.099%
$825,000 700 4.432% 2.743%
$825,000 800 4.106% 2.460%
$825,000 900 3.837% 2.229%
$825,000 1,000 3.608% 2.036%
$825,000 1,500 2.823% 1.401%
$825,000 2,000 2.342% 1.040%
$825,000 3,000 1.749% 0.639%
* Applied to total projected claims
82
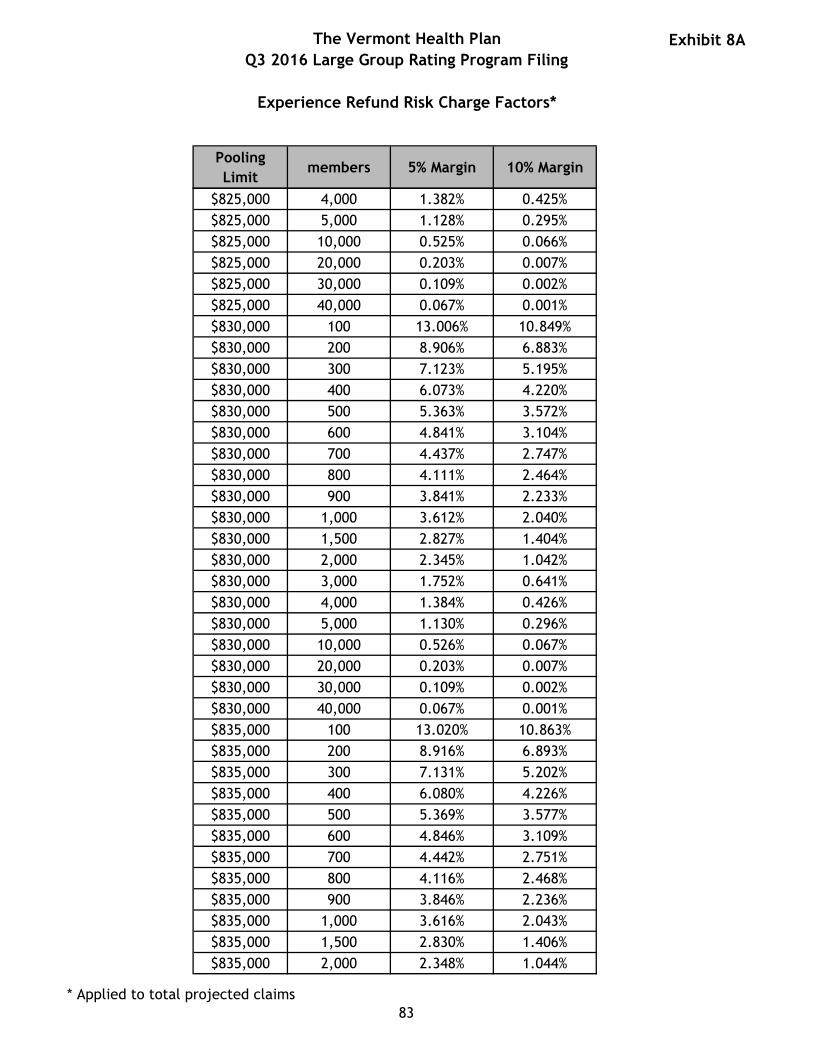
The Vermont Health Plan
Q3 2016 Large Group Rating Program Filing
Experience Refund Risk Charge Factors*
Exhibit 8A
Pooling
Limitmembers 5% Margin 10% Margin
$825,000 4,000 1.382% 0.425%
$825,000 5,000 1.128% 0.295%
$825,000 10,000 0.525% 0.066%
$825,000 20,000 0.203% 0.007%
$825,000 30,000 0.109% 0.002%
$825,000 40,000 0.067% 0.001%
$830,000 100 13.006% 10.849%
$830,000 200 8.906% 6.883%
$830,000 300 7.123% 5.195%
$830,000 400 6.073% 4.220%
$830,000 500 5.363% 3.572%
$830,000 600 4.841% 3.104%
$830,000 700 4.437% 2.747%
$830,000 800 4.111% 2.464%
$830,000 900 3.841% 2.233%
$830,000 1,000 3.612% 2.040%
$830,000 1,500 2.827% 1.404%
$830,000 2,000 2.345% 1.042%
$830,000 3,000 1.752% 0.641%
$830,000 4,000 1.384% 0.426%
$830,000 5,000 1.130% 0.296%
$830,000 10,000 0.526% 0.067%
$830,000 20,000 0.203% 0.007%
$830,000 30,000 0.109% 0.002%
$830,000 40,000 0.067% 0.001%
$835,000 100 13.020% 10.863%
$835,000 200 8.916% 6.893%
$835,000 300 7.131% 5.202%
$835,000 400 6.080% 4.226%
$835,000 500 5.369% 3.577%
$835,000 600 4.846% 3.109%
$835,000 700 4.442% 2.751%
$835,000 800 4.116% 2.468%
$835,000 900 3.846% 2.236%
$835,000 1,000 3.616% 2.043%
$835,000 1,500 2.830% 1.406%
$835,000 2,000 2.348% 1.044%
* Applied to total projected claims
83

The Vermont Health Plan
Q3 2016 Large Group Rating Program Filing
Experience Refund Risk Charge Factors*
Exhibit 8A
Pooling
Limitmembers 5% Margin 10% Margin
$835,000 3,000 1.754% 0.643%
$835,000 4,000 1.387% 0.427%
$835,000 5,000 1.132% 0.297%
$835,000 10,000 0.527% 0.067%
$835,000 20,000 0.204% 0.007%
$835,000 30,000 0.109% 0.002%
$835,000 40,000 0.067% 0.001%
$840,000 100 13.034% 10.877%
$840,000 200 8.926% 6.902%
$840,000 300 7.139% 5.209%
$840,000 400 6.086% 4.232%
$840,000 500 5.375% 3.582%
$840,000 600 4.852% 3.113%
$840,000 700 4.447% 2.756%
$840,000 800 4.120% 2.472%
$840,000 900 3.850% 2.240%
$840,000 1,000 3.621% 2.047%
$840,000 1,500 2.834% 1.409%
$840,000 2,000 2.351% 1.047%
$840,000 3,000 1.757% 0.644%
$840,000 4,000 1.389% 0.429%
$840,000 5,000 1.134% 0.298%
$840,000 10,000 0.528% 0.067%
$840,000 20,000 0.204% 0.007%
$840,000 30,000 0.110% 0.002%
$840,000 40,000 0.068% 0.001%
$845,000 100 13.048% 10.890%
$845,000 200 8.936% 6.911%
$845,000 300 7.146% 5.217%
$845,000 400 6.093% 4.238%
$845,000 500 5.381% 3.588%
$845,000 600 4.857% 3.118%
$845,000 700 4.452% 2.760%
$845,000 800 4.125% 2.476%
$845,000 900 3.854% 2.244%
$845,000 1,000 3.625% 2.050%
$845,000 1,500 2.837% 1.412%
* Applied to total projected claims
84

The Vermont Health Plan
Q3 2016 Large Group Rating Program Filing
Experience Refund Risk Charge Factors*
Exhibit 8A
Pooling
Limitmembers 5% Margin 10% Margin
$845,000 2,000 2.354% 1.049%
$845,000 3,000 1.759% 0.646%
$845,000 4,000 1.391% 0.430%
$845,000 5,000 1.136% 0.299%
$845,000 10,000 0.530% 0.068%
$845,000 20,000 0.205% 0.007%
$845,000 30,000 0.110% 0.002%
$845,000 40,000 0.068% 0.001%
$850,000 100 13.062% 10.904%
$850,000 200 8.945% 6.920%
$850,000 300 7.154% 5.224%
$850,000 400 6.100% 4.244%
$850,000 500 5.387% 3.593%
$850,000 600 4.863% 3.123%
$850,000 700 4.457% 2.764%
$850,000 800 4.130% 2.480%
$850,000 900 3.859% 2.248%
$850,000 1,000 3.629% 2.054%
$850,000 1,500 2.841% 1.415%
$850,000 2,000 2.358% 1.051%
$850,000 3,000 1.762% 0.648%
$850,000 4,000 1.394% 0.431%
$850,000 5,000 1.138% 0.300%
$850,000 10,000 0.531% 0.068%
$850,000 20,000 0.205% 0.007%
$850,000 30,000 0.110% 0.002%
$850,000 40,000 0.068% 0.001%
$855,000 100 13.076% 10.918%
$855,000 200 8.955% 6.929%
$855,000 300 7.162% 5.231%
$855,000 400 6.107% 4.250%
$855,000 500 5.393% 3.598%
$855,000 600 4.868% 3.128%
$855,000 700 4.462% 2.769%
$855,000 800 4.135% 2.484%
$855,000 900 3.863% 2.251%
$855,000 1,000 3.633% 2.057%
* Applied to total projected claims
85

The Vermont Health Plan
Q3 2016 Large Group Rating Program Filing
Experience Refund Risk Charge Factors*
Exhibit 8A
Pooling
Limitmembers 5% Margin 10% Margin
$855,000 1,500 2.844% 1.417%
$855,000 2,000 2.361% 1.053%
$855,000 3,000 1.765% 0.649%
$855,000 4,000 1.396% 0.432%
$855,000 5,000 1.141% 0.301%
$855,000 10,000 0.532% 0.068%
$855,000 20,000 0.206% 0.008%
$855,000 30,000 0.111% 0.002%
$855,000 40,000 0.068% 0.001%
$860,000 100 13.090% 10.931%
$860,000 200 8.965% 6.939%
$860,000 300 7.170% 5.238%
$860,000 400 6.113% 4.256%
$860,000 500 5.398% 3.604%
$860,000 600 4.874% 3.132%
$860,000 700 4.467% 2.773%
$860,000 800 4.139% 2.488%
$860,000 900 3.868% 2.255%
$860,000 1,000 3.637% 2.060%
$860,000 1,500 2.848% 1.420%
$860,000 2,000 2.364% 1.055%
$860,000 3,000 1.767% 0.651%
$860,000 4,000 1.398% 0.434%
$860,000 5,000 1.143% 0.302%
$860,000 10,000 0.534% 0.069%
$860,000 20,000 0.207% 0.008%
$860,000 30,000 0.111% 0.002%
$860,000 40,000 0.069% 0.001%
$865,000 100 13.104% 10.945%
$865,000 200 8.975% 6.948%
$865,000 300 7.178% 5.246%
$865,000 400 6.120% 4.262%
$865,000 500 5.404% 3.609%
$865,000 600 4.879% 3.137%
$865,000 700 4.472% 2.777%
$865,000 800 4.144% 2.492%
$865,000 900 3.872% 2.259%
* Applied to total projected claims
86

The Vermont Health Plan
Q3 2016 Large Group Rating Program Filing
Experience Refund Risk Charge Factors*
Exhibit 8A
Pooling
Limitmembers 5% Margin 10% Margin
$865,000 1,000 3.642% 2.064%
$865,000 1,500 2.851% 1.423%
$865,000 2,000 2.367% 1.058%
$865,000 3,000 1.770% 0.652%
$865,000 4,000 1.401% 0.435%
$865,000 5,000 1.145% 0.303%
$865,000 10,000 0.535% 0.069%
$865,000 20,000 0.207% 0.008%
$865,000 30,000 0.112% 0.002%
$865,000 40,000 0.069% 0.001%
$870,000 100 13.118% 10.959%
$870,000 200 8.984% 6.957%
$870,000 300 7.186% 5.253%
$870,000 400 6.127% 4.269%
$870,000 500 5.410% 3.614%
$870,000 600 4.884% 3.142%
$870,000 700 4.477% 2.781%
$870,000 800 4.149% 2.496%
$870,000 900 3.876% 2.262%
$870,000 1,000 3.646% 2.067%
$870,000 1,500 2.855% 1.425%
$870,000 2,000 2.370% 1.060%
$870,000 3,000 1.773% 0.654%
$870,000 4,000 1.403% 0.436%
$870,000 5,000 1.147% 0.304%
$870,000 10,000 0.536% 0.069%
$870,000 20,000 0.208% 0.008%
$870,000 30,000 0.112% 0.002%
$870,000 40,000 0.069% 0.001%
$875,000 100 13.132% 10.972%
$875,000 200 8.994% 6.966%
$875,000 300 7.193% 5.260%
$875,000 400 6.134% 4.275%
$875,000 500 5.416% 3.620%
$875,000 600 4.890% 3.147%
$875,000 700 4.482% 2.786%
$875,000 800 4.153% 2.500%
* Applied to total projected claims
87

The Vermont Health Plan
Q3 2016 Large Group Rating Program Filing
Experience Refund Risk Charge Factors*
Exhibit 8A
Pooling
Limitmembers 5% Margin 10% Margin
$875,000 900 3.881% 2.266%
$875,000 1,000 3.650% 2.071%
$875,000 1,500 2.858% 1.428%
$875,000 2,000 2.373% 1.062%
$875,000 3,000 1.775% 0.656%
$875,000 4,000 1.405% 0.437%
$875,000 5,000 1.149% 0.305%
$875,000 10,000 0.537% 0.070%
$875,000 20,000 0.208% 0.008%
$875,000 30,000 0.112% 0.002%
$875,000 40,000 0.069% 0.001%
$880,000 100 13.147% 10.986%
$880,000 200 9.004% 6.976%
$880,000 300 7.201% 5.267%
$880,000 400 6.140% 4.281%
$880,000 500 5.422% 3.625%
$880,000 600 4.895% 3.151%
$880,000 700 4.487% 2.790%
$880,000 800 4.158% 2.504%
$880,000 900 3.885% 2.270%
$880,000 1,000 3.654% 2.074%
$880,000 1,500 2.862% 1.431%
$880,000 2,000 2.376% 1.064%
$880,000 3,000 1.778% 0.657%
$880,000 4,000 1.408% 0.439%
$880,000 5,000 1.151% 0.306%
$880,000 10,000 0.539% 0.070%
$880,000 20,000 0.209% 0.008%
$880,000 30,000 0.113% 0.002%
$880,000 40,000 0.069% 0.001%
$885,000 100 13.161% 10.999%
$885,000 200 9.014% 6.985%
$885,000 300 7.209% 5.275%
$885,000 400 6.147% 4.287%
$885,000 500 5.428% 3.630%
$885,000 600 4.901% 3.156%
$885,000 700 4.492% 2.794%
* Applied to total projected claims
88
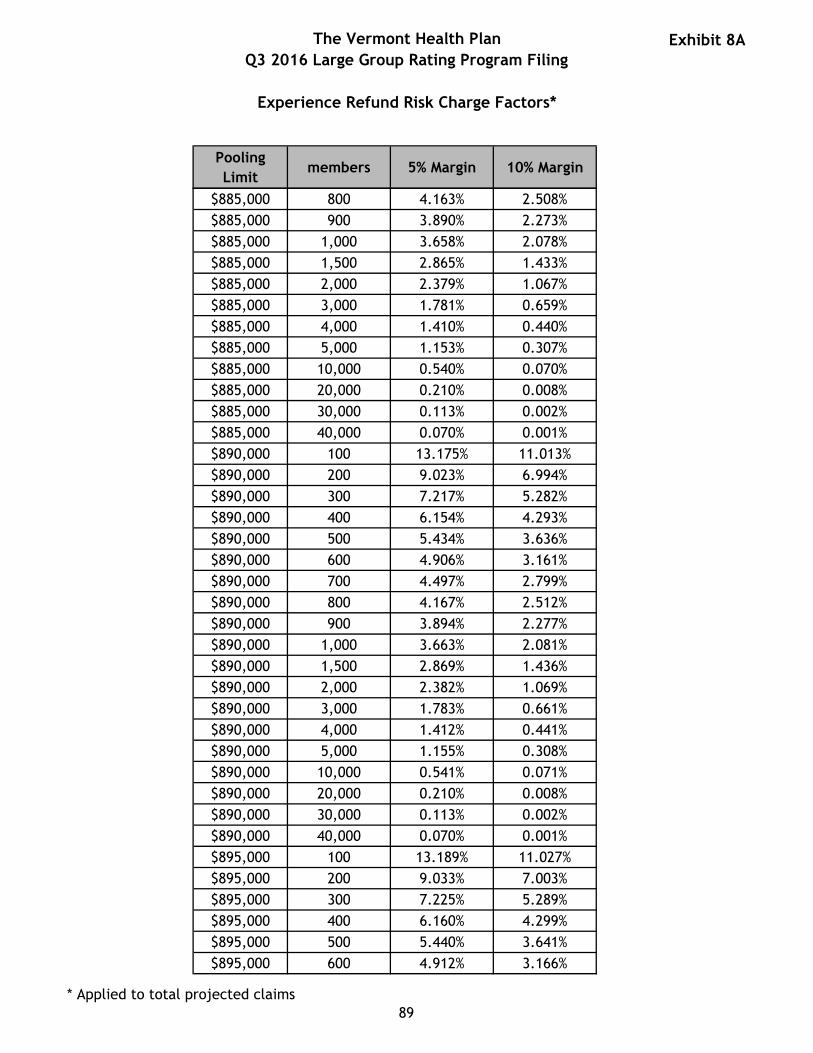
The Vermont Health Plan
Q3 2016 Large Group Rating Program Filing
Experience Refund Risk Charge Factors*
Exhibit 8A
Pooling
Limitmembers 5% Margin 10% Margin
$885,000 800 4.163% 2.508%
$885,000 900 3.890% 2.273%
$885,000 1,000 3.658% 2.078%
$885,000 1,500 2.865% 1.433%
$885,000 2,000 2.379% 1.067%
$885,000 3,000 1.781% 0.659%
$885,000 4,000 1.410% 0.440%
$885,000 5,000 1.153% 0.307%
$885,000 10,000 0.540% 0.070%
$885,000 20,000 0.210% 0.008%
$885,000 30,000 0.113% 0.002%
$885,000 40,000 0.070% 0.001%
$890,000 100 13.175% 11.013%
$890,000 200 9.023% 6.994%
$890,000 300 7.217% 5.282%
$890,000 400 6.154% 4.293%
$890,000 500 5.434% 3.636%
$890,000 600 4.906% 3.161%
$890,000 700 4.497% 2.799%
$890,000 800 4.167% 2.512%
$890,000 900 3.894% 2.277%
$890,000 1,000 3.663% 2.081%
$890,000 1,500 2.869% 1.436%
$890,000 2,000 2.382% 1.069%
$890,000 3,000 1.783% 0.661%
$890,000 4,000 1.412% 0.441%
$890,000 5,000 1.155% 0.308%
$890,000 10,000 0.541% 0.071%
$890,000 20,000 0.210% 0.008%
$890,000 30,000 0.113% 0.002%
$890,000 40,000 0.070% 0.001%
$895,000 100 13.189% 11.027%
$895,000 200 9.033% 7.003%
$895,000 300 7.225% 5.289%
$895,000 400 6.160% 4.299%
$895,000 500 5.440% 3.641%
$895,000 600 4.912% 3.166%
* Applied to total projected claims
89

The Vermont Health Plan
Q3 2016 Large Group Rating Program Filing
Experience Refund Risk Charge Factors*
Exhibit 8A
Pooling
Limitmembers 5% Margin 10% Margin
$895,000 700 4.502% 2.803%
$895,000 800 4.172% 2.516%
$895,000 900 3.899% 2.281%
$895,000 1,000 3.667% 2.085%
$895,000 1,500 2.872% 1.439%
$895,000 2,000 2.386% 1.071%
$895,000 3,000 1.786% 0.662%
$895,000 4,000 1.415% 0.443%
$895,000 5,000 1.157% 0.309%
$895,000 10,000 0.543% 0.071%
$895,000 20,000 0.211% 0.008%
$895,000 30,000 0.114% 0.002%
$895,000 40,000 0.070% 0.001%
$900,000 100 13.203% 11.040%
$900,000 200 9.043% 7.012%
$900,000 300 7.233% 5.296%
$900,000 400 6.167% 4.305%
$900,000 500 5.446% 3.646%
$900,000 600 4.917% 3.170%
$900,000 700 4.507% 2.807%
$900,000 800 4.177% 2.520%
$900,000 900 3.903% 2.285%
$900,000 1,000 3.671% 2.088%
$900,000 1,500 2.876% 1.441%
$900,000 2,000 2.389% 1.073%
$900,000 3,000 1.789% 0.664%
$900,000 4,000 1.417% 0.444%
$900,000 5,000 1.159% 0.310%
$900,000 10,000 0.544% 0.071%
$900,000 20,000 0.211% 0.008%
$900,000 30,000 0.114% 0.002%
$900,000 40,000 0.070% 0.001%
$905,000 100 13.217% 11.054%
$905,000 200 9.053% 7.022%
$905,000 300 7.241% 5.304%
$905,000 400 6.174% 4.311%
$905,000 500 5.452% 3.652%
* Applied to total projected claims
90

The Vermont Health Plan
Q3 2016 Large Group Rating Program Filing
Experience Refund Risk Charge Factors*
Exhibit 8A
Pooling
Limitmembers 5% Margin 10% Margin
$905,000 600 4.922% 3.175%
$905,000 700 4.512% 2.812%
$905,000 800 4.181% 2.524%
$905,000 900 3.907% 2.288%
$905,000 1,000 3.675% 2.092%
$905,000 1,500 2.879% 1.444%
$905,000 2,000 2.392% 1.075%
$905,000 3,000 1.791% 0.665%
$905,000 4,000 1.419% 0.445%
$905,000 5,000 1.162% 0.311%
$905,000 10,000 0.545% 0.072%
$905,000 20,000 0.212% 0.008%
$905,000 30,000 0.114% 0.002%
$905,000 40,000 0.071% 0.001%
$910,000 100 13.231% 11.068%
$910,000 200 9.062% 7.031%
$910,000 300 7.248% 5.311%
$910,000 400 6.181% 4.317%
$910,000 500 5.458% 3.657%
$910,000 600 4.928% 3.180%
$910,000 700 4.517% 2.816%
$910,000 800 4.186% 2.528%
$910,000 900 3.912% 2.292%
$910,000 1,000 3.679% 2.095%
$910,000 1,500 2.883% 1.447%
$910,000 2,000 2.395% 1.078%
$910,000 3,000 1.794% 0.667%
$910,000 4,000 1.422% 0.446%
$910,000 5,000 1.164% 0.312%
$910,000 10,000 0.546% 0.072%
$910,000 20,000 0.212% 0.008%
$910,000 30,000 0.115% 0.002%
$910,000 40,000 0.071% 0.001%
$915,000 100 13.245% 11.081%
$915,000 200 9.072% 7.040%
$915,000 300 7.256% 5.318%
$915,000 400 6.187% 4.324%
* Applied to total projected claims
91

The Vermont Health Plan
Q3 2016 Large Group Rating Program Filing
Experience Refund Risk Charge Factors*
Exhibit 8A
Pooling
Limitmembers 5% Margin 10% Margin
$915,000 500 5.464% 3.662%
$915,000 600 4.933% 3.185%
$915,000 700 4.522% 2.820%
$915,000 800 4.191% 2.532%
$915,000 900 3.916% 2.296%
$915,000 1,000 3.684% 2.099%
$915,000 1,500 2.886% 1.449%
$915,000 2,000 2.398% 1.080%
$915,000 3,000 1.796% 0.669%
$915,000 4,000 1.424% 0.448%
$915,000 5,000 1.166% 0.313%
$915,000 10,000 0.548% 0.073%
$915,000 20,000 0.213% 0.008%
$915,000 30,000 0.115% 0.002%
$915,000 40,000 0.071% 0.001%
$920,000 100 13.259% 11.095%
$920,000 200 9.082% 7.049%
$920,000 300 7.264% 5.326%
$920,000 400 6.194% 4.330%
$920,000 500 5.470% 3.668%
$920,000 600 4.939% 3.189%
$920,000 700 4.527% 2.825%
$920,000 800 4.195% 2.536%
$920,000 900 3.921% 2.299%
$920,000 1,000 3.688% 2.102%
$920,000 1,500 2.890% 1.452%
$920,000 2,000 2.401% 1.082%
$920,000 3,000 1.799% 0.670%
$920,000 4,000 1.426% 0.449%
$920,000 5,000 1.168% 0.314%
$920,000 10,000 0.549% 0.073%
$920,000 20,000 0.214% 0.008%
$920,000 30,000 0.115% 0.002%
$920,000 40,000 0.071% 0.001%
$925,000 100 13.273% 11.109%
$925,000 200 9.092% 7.059%
$925,000 300 7.272% 5.333%
* Applied to total projected claims
92

The Vermont Health Plan
Q3 2016 Large Group Rating Program Filing
Experience Refund Risk Charge Factors*
Exhibit 8A
Pooling
Limitmembers 5% Margin 10% Margin
$925,000 400 6.201% 4.336%
$925,000 500 5.476% 3.673%
$925,000 600 4.944% 3.194%
$925,000 700 4.532% 2.829%
$925,000 800 4.200% 2.540%
$925,000 900 3.925% 2.303%
$925,000 1,000 3.692% 2.106%
$925,000 1,500 2.893% 1.455%
$925,000 2,000 2.404% 1.084%
$925,000 3,000 1.802% 0.672%
$925,000 4,000 1.429% 0.450%
$925,000 5,000 1.170% 0.315%
$925,000 10,000 0.550% 0.073%
$925,000 20,000 0.214% 0.008%
$925,000 30,000 0.116% 0.002%
$925,000 40,000 0.072% 0.001%
$930,000 100 13.287% 11.122%
$930,000 200 9.101% 7.068%
$930,000 300 7.280% 5.340%
$930,000 400 6.208% 4.342%
$930,000 500 5.482% 3.678%
$930,000 600 4.950% 3.199%
$930,000 700 4.537% 2.833%
$930,000 800 4.205% 2.544%
$930,000 900 3.930% 2.307%
$930,000 1,000 3.696% 2.109%
$930,000 1,500 2.897% 1.457%
$930,000 2,000 2.407% 1.087%
$930,000 3,000 1.804% 0.674%
$930,000 4,000 1.431% 0.451%
$930,000 5,000 1.172% 0.316%
$930,000 10,000 0.552% 0.074%
$930,000 20,000 0.215% 0.008%
$930,000 30,000 0.116% 0.002%
$930,000 40,000 0.072% 0.001%
$935,000 100 13.301% 11.136%
$935,000 200 9.111% 7.077%
* Applied to total projected claims
93
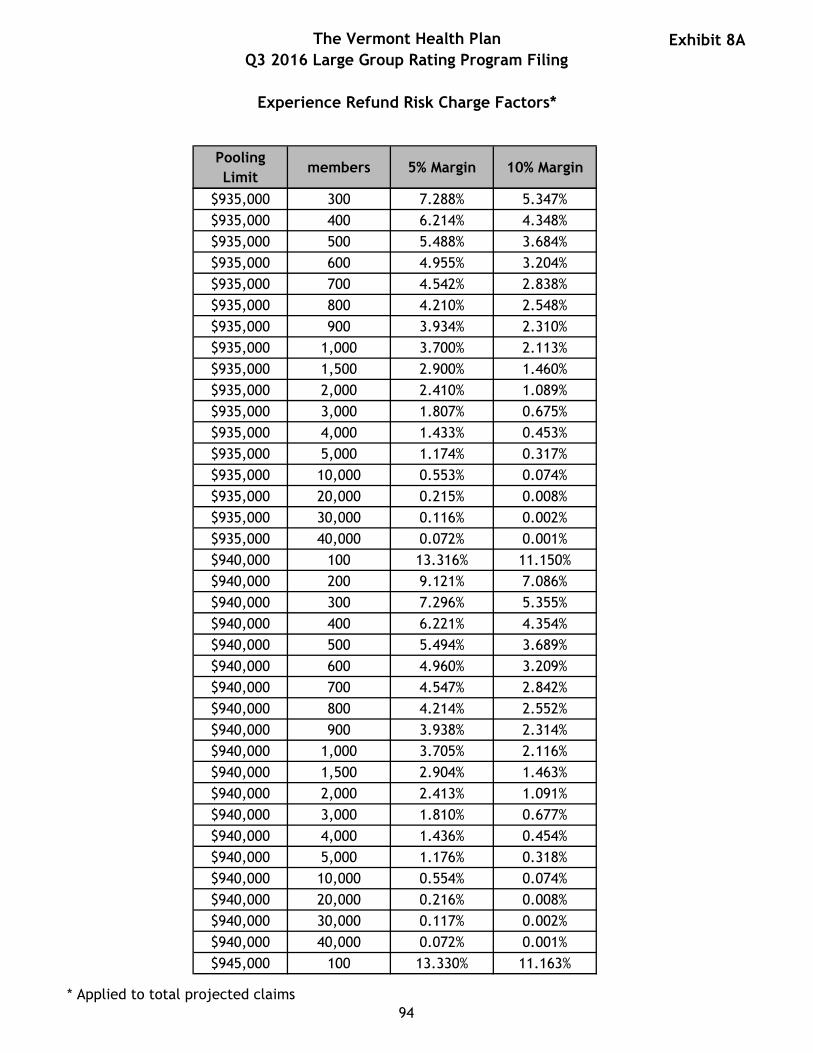
The Vermont Health Plan
Q3 2016 Large Group Rating Program Filing
Experience Refund Risk Charge Factors*
Exhibit 8A
Pooling
Limitmembers 5% Margin 10% Margin
$935,000 300 7.288% 5.347%
$935,000 400 6.214% 4.348%
$935,000 500 5.488% 3.684%
$935,000 600 4.955% 3.204%
$935,000 700 4.542% 2.838%
$935,000 800 4.210% 2.548%
$935,000 900 3.934% 2.310%
$935,000 1,000 3.700% 2.113%
$935,000 1,500 2.900% 1.460%
$935,000 2,000 2.410% 1.089%
$935,000 3,000 1.807% 0.675%
$935,000 4,000 1.433% 0.453%
$935,000 5,000 1.174% 0.317%
$935,000 10,000 0.553% 0.074%
$935,000 20,000 0.215% 0.008%
$935,000 30,000 0.116% 0.002%
$935,000 40,000 0.072% 0.001%
$940,000 100 13.316% 11.150%
$940,000 200 9.121% 7.086%
$940,000 300 7.296% 5.355%
$940,000 400 6.221% 4.354%
$940,000 500 5.494% 3.689%
$940,000 600 4.960% 3.209%
$940,000 700 4.547% 2.842%
$940,000 800 4.214% 2.552%
$940,000 900 3.938% 2.314%
$940,000 1,000 3.705% 2.116%
$940,000 1,500 2.904% 1.463%
$940,000 2,000 2.413% 1.091%
$940,000 3,000 1.810% 0.677%
$940,000 4,000 1.436% 0.454%
$940,000 5,000 1.176% 0.318%
$940,000 10,000 0.554% 0.074%
$940,000 20,000 0.216% 0.008%
$940,000 30,000 0.117% 0.002%
$940,000 40,000 0.072% 0.001%
$945,000 100 13.330% 11.163%
* Applied to total projected claims
94
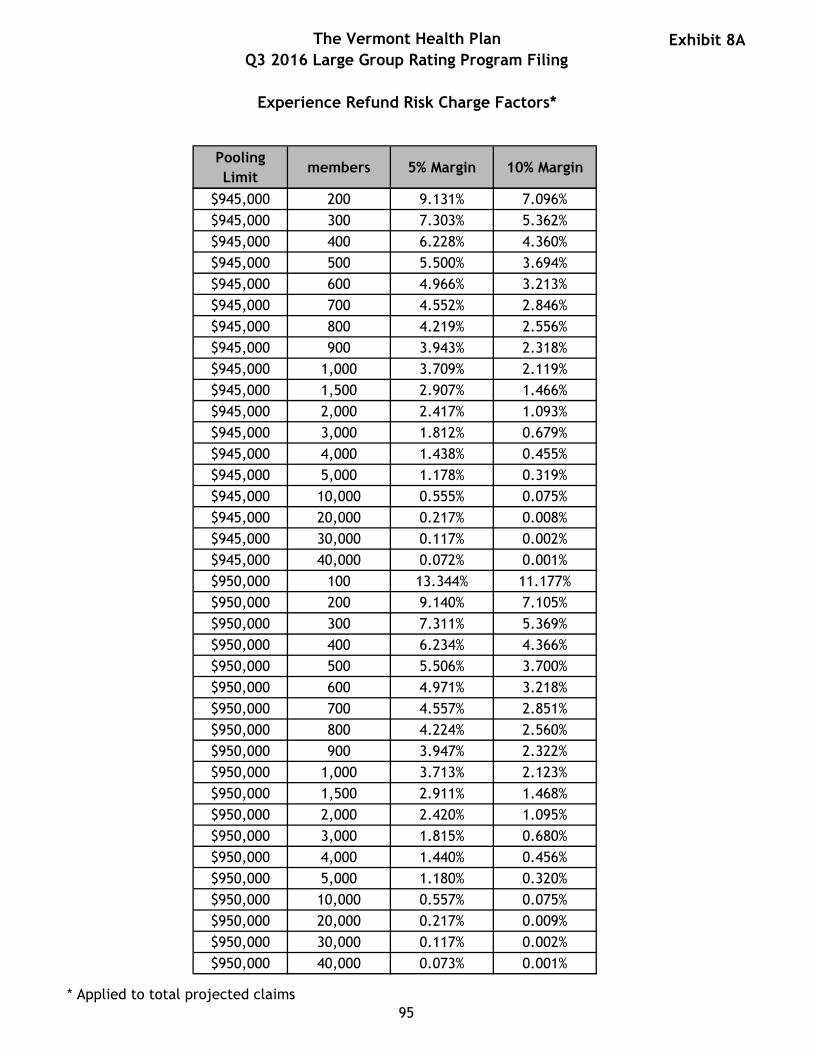
The Vermont Health Plan
Q3 2016 Large Group Rating Program Filing
Experience Refund Risk Charge Factors*
Exhibit 8A
Pooling
Limitmembers 5% Margin 10% Margin
$945,000 200 9.131% 7.096%
$945,000 300 7.303% 5.362%
$945,000 400 6.228% 4.360%
$945,000 500 5.500% 3.694%
$945,000 600 4.966% 3.213%
$945,000 700 4.552% 2.846%
$945,000 800 4.219% 2.556%
$945,000 900 3.943% 2.318%
$945,000 1,000 3.709% 2.119%
$945,000 1,500 2.907% 1.466%
$945,000 2,000 2.417% 1.093%
$945,000 3,000 1.812% 0.679%
$945,000 4,000 1.438% 0.455%
$945,000 5,000 1.178% 0.319%
$945,000 10,000 0.555% 0.075%
$945,000 20,000 0.217% 0.008%
$945,000 30,000 0.117% 0.002%
$945,000 40,000 0.072% 0.001%
$950,000 100 13.344% 11.177%
$950,000 200 9.140% 7.105%
$950,000 300 7.311% 5.369%
$950,000 400 6.234% 4.366%
$950,000 500 5.506% 3.700%
$950,000 600 4.971% 3.218%
$950,000 700 4.557% 2.851%
$950,000 800 4.224% 2.560%
$950,000 900 3.947% 2.322%
$950,000 1,000 3.713% 2.123%
$950,000 1,500 2.911% 1.468%
$950,000 2,000 2.420% 1.095%
$950,000 3,000 1.815% 0.680%
$950,000 4,000 1.440% 0.456%
$950,000 5,000 1.180% 0.320%
$950,000 10,000 0.557% 0.075%
$950,000 20,000 0.217% 0.009%
$950,000 30,000 0.117% 0.002%
$950,000 40,000 0.073% 0.001%
* Applied to total projected claims
95

The Vermont Health Plan
Q3 2016 Large Group Rating Program Filing
Experience Refund Risk Charge Factors*
Exhibit 8A
Pooling
Limitmembers 5% Margin 10% Margin
$955,000 100 13.358% 11.191%
$955,000 200 9.150% 7.114%
$955,000 300 7.319% 5.376%
$955,000 400 6.241% 4.373%
$955,000 500 5.512% 3.705%
$955,000 600 4.977% 3.223%
$955,000 700 4.562% 2.855%
$955,000 800 4.228% 2.563%
$955,000 900 3.952% 2.325%
$955,000 1,000 3.717% 2.126%
$955,000 1,500 2.914% 1.471%
$955,000 2,000 2.423% 1.098%
$955,000 3,000 1.818% 0.682%
$955,000 4,000 1.443% 0.458%
$955,000 5,000 1.182% 0.321%
$955,000 10,000 0.558% 0.075%
$955,000 20,000 0.218% 0.009%
$955,000 30,000 0.118% 0.002%
$955,000 40,000 0.073% 0.001%
$960,000 100 13.372% 11.204%
$960,000 200 9.160% 7.123%
$960,000 300 7.327% 5.384%
$960,000 400 6.248% 4.379%
$960,000 500 5.518% 3.710%
$960,000 600 4.982% 3.228%
$960,000 700 4.567% 2.859%
$960,000 800 4.233% 2.567%
$960,000 900 3.956% 2.329%
$960,000 1,000 3.721% 2.130%
$960,000 1,500 2.918% 1.474%
$960,000 2,000 2.426% 1.100%
$960,000 3,000 1.820% 0.684%
$960,000 4,000 1.445% 0.459%
$960,000 5,000 1.185% 0.322%
$960,000 10,000 0.559% 0.076%
$960,000 20,000 0.218% 0.009%
$960,000 30,000 0.118% 0.002%
* Applied to total projected claims
96

The Vermont Health Plan
Q3 2016 Large Group Rating Program Filing
Experience Refund Risk Charge Factors*
Exhibit 8A
Pooling
Limitmembers 5% Margin 10% Margin
$960,000 40,000 0.073% 0.001%
$965,000 100 13.386% 11.218%
$965,000 200 9.170% 7.133%
$965,000 300 7.335% 5.391%
$965,000 400 6.255% 4.385%
$965,000 500 5.524% 3.716%
$965,000 600 4.988% 3.232%
$965,000 700 4.572% 2.864%
$965,000 800 4.238% 2.571%
$965,000 900 3.961% 2.333%
$965,000 1,000 3.726% 2.133%
$965,000 1,500 2.921% 1.476%
$965,000 2,000 2.429% 1.102%
$965,000 3,000 1.823% 0.685%
$965,000 4,000 1.447% 0.460%
$965,000 5,000 1.187% 0.323%
$965,000 10,000 0.561% 0.076%
$965,000 20,000 0.219% 0.009%
$965,000 30,000 0.118% 0.002%
$965,000 40,000 0.073% 0.001%
$970,000 100 13.400% 11.231%
$970,000 200 9.179% 7.142%
$970,000 300 7.343% 5.398%
$970,000 400 6.261% 4.391%
$970,000 500 5.530% 3.721%
$970,000 600 4.993% 3.237%
$970,000 700 4.577% 2.868%
$970,000 800 4.242% 2.575%
$970,000 900 3.965% 2.336%
$970,000 1,000 3.730% 2.137%
$970,000 1,500 2.925% 1.479%
$970,000 2,000 2.432% 1.104%
$970,000 3,000 1.826% 0.687%
$970,000 4,000 1.450% 0.462%
$970,000 5,000 1.189% 0.324%
$970,000 10,000 0.562% 0.076%
$970,000 20,000 0.220% 0.009%
* Applied to total projected claims
97

The Vermont Health Plan
Q3 2016 Large Group Rating Program Filing
Experience Refund Risk Charge Factors*
Exhibit 8A
Pooling
Limitmembers 5% Margin 10% Margin
$970,000 30,000 0.119% 0.002%
$970,000 40,000 0.074% 0.001%
$975,000 100 13.414% 11.245%
$975,000 200 9.189% 7.151%
$975,000 300 7.351% 5.406%
$975,000 400 6.268% 4.397%
$975,000 500 5.536% 3.726%
$975,000 600 4.998% 3.242%
$975,000 700 4.582% 2.873%
$975,000 800 4.247% 2.579%
$975,000 900 3.969% 2.340%
$975,000 1,000 3.734% 2.140%
$975,000 1,500 2.928% 1.482%
$975,000 2,000 2.435% 1.107%
$975,000 3,000 1.828% 0.689%
$975,000 4,000 1.452% 0.463%
$975,000 5,000 1.191% 0.325%
$975,000 10,000 0.563% 0.077%
$975,000 20,000 0.220% 0.009%
$975,000 30,000 0.119% 0.002%
$975,000 40,000 0.074% 0.001%
$980,000 100 13.428% 11.259%
$980,000 200 9.199% 7.160%
$980,000 300 7.358% 5.413%
$980,000 400 6.275% 4.403%
$980,000 500 5.542% 3.732%
$980,000 600 5.004% 3.247%
$980,000 700 4.587% 2.877%
$980,000 800 4.252% 2.583%
$980,000 900 3.974% 2.344%
$980,000 1,000 3.738% 2.144%
$980,000 1,500 2.932% 1.484%
$980,000 2,000 2.438% 1.109%
$980,000 3,000 1.831% 0.690%
$980,000 4,000 1.454% 0.464%
$980,000 5,000 1.193% 0.326%
$980,000 10,000 0.565% 0.077%
* Applied to total projected claims
98

The Vermont Health Plan
Q3 2016 Large Group Rating Program Filing
Experience Refund Risk Charge Factors*
Exhibit 8A
Pooling
Limitmembers 5% Margin 10% Margin
$980,000 20,000 0.221% 0.009%
$980,000 30,000 0.119% 0.002%
$980,000 40,000 0.074% 0.001%
$985,000 100 13.442% 11.272%
$985,000 200 9.209% 7.170%
$985,000 300 7.366% 5.420%
$985,000 400 6.282% 4.409%
$985,000 500 5.548% 3.737%
$985,000 600 5.009% 3.252%
$985,000 700 4.592% 2.881%
$985,000 800 4.256% 2.587%
$985,000 900 3.978% 2.348%
$985,000 1,000 3.742% 2.147%
$985,000 1,500 2.935% 1.487%
$985,000 2,000 2.441% 1.111%
$985,000 3,000 1.833% 0.692%
$985,000 4,000 1.457% 0.465%
$985,000 5,000 1.195% 0.327%
$985,000 10,000 0.566% 0.078%
$985,000 20,000 0.221% 0.009%
$985,000 30,000 0.120% 0.002%
$985,000 40,000 0.074% 0.001%
$990,000 100 13.457% 11.286%
$990,000 200 9.219% 7.179%
$990,000 300 7.374% 5.427%
$990,000 400 6.288% 4.415%
$990,000 500 5.554% 3.742%
$990,000 600 5.015% 3.256%
$990,000 700 4.597% 2.886%
$990,000 800 4.261% 2.591%
$990,000 900 3.983% 2.351%
$990,000 1,000 3.747% 2.151%
$990,000 1,500 2.939% 1.490%
$990,000 2,000 2.444% 1.113%
$990,000 3,000 1.836% 0.693%
$990,000 4,000 1.459% 0.467%
$990,000 5,000 1.197% 0.328%
* Applied to total projected claims
99

The Vermont Health Plan
Q3 2016 Large Group Rating Program Filing
Experience Refund Risk Charge Factors*
Exhibit 8A
Pooling
Limitmembers 5% Margin 10% Margin
$990,000 10,000 0.567% 0.078%
$990,000 20,000 0.222% 0.009%
$990,000 30,000 0.120% 0.002%
$990,000 40,000 0.075% 0.001%
$995,000 100 13.471% 11.300%
$995,000 200 9.228% 7.188%
$995,000 300 7.382% 5.435%
$995,000 400 6.295% 4.422%
$995,000 500 5.560% 3.748%
$995,000 600 5.020% 3.261%
$995,000 700 4.602% 2.890%
$995,000 800 4.266% 2.595%
$995,000 900 3.987% 2.355%
$995,000 1,000 3.751% 2.154%
$995,000 1,500 2.942% 1.492%
$995,000 2,000 2.448% 1.115%
$995,000 3,000 1.839% 0.695%
$995,000 4,000 1.461% 0.468%
$995,000 5,000 1.199% 0.329%
$995,000 10,000 0.568% 0.078%
$995,000 20,000 0.223% 0.009%
$995,000 30,000 0.121% 0.002%
$995,000 40,000 0.075% 0.001%
$1,000,000 100 13.485% 11.313%
$1,000,000 200 9.238% 7.197%
$1,000,000 300 7.390% 5.442%
$1,000,000 400 6.302% 4.428%
$1,000,000 500 5.566% 3.753%
$1,000,000 600 5.026% 3.266%
$1,000,000 700 4.607% 2.894%
$1,000,000 800 4.270% 2.599%
$1,000,000 900 3.991% 2.359%
$1,000,000 1,000 3.755% 2.158%
$1,000,000 1,500 2.946% 1.495%
$1,000,000 2,000 2.451% 1.118%
$1,000,000 3,000 1.841% 0.697%
$1,000,000 4,000 1.464% 0.469%
* Applied to total projected claims
100
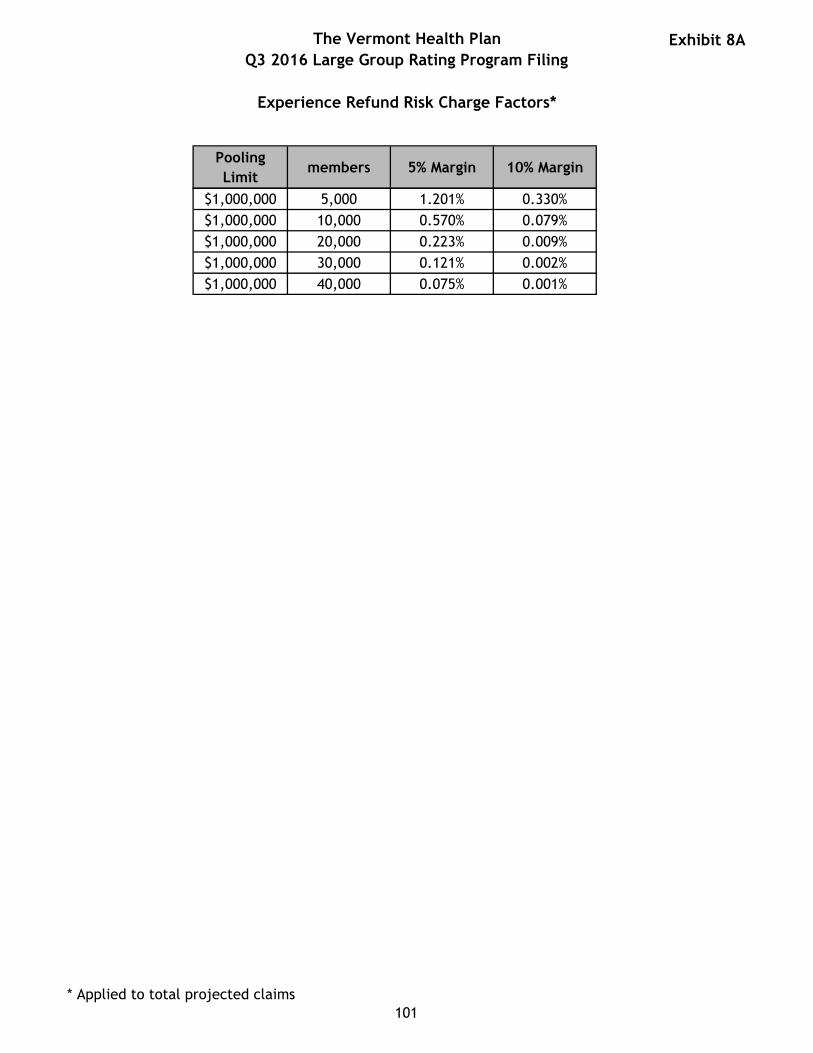
The Vermont Health Plan
Q3 2016 Large Group Rating Program Filing
Experience Refund Risk Charge Factors*
Exhibit 8A
Pooling
Limitmembers 5% Margin 10% Margin
$1,000,000 5,000 1.201% 0.330%
$1,000,000 10,000 0.570% 0.079%
$1,000,000 20,000 0.223% 0.009%
$1,000,000 30,000 0.121% 0.002%
$1,000,000 40,000 0.075% 0.001%
* Applied to total projected claims
101