final draft report habitat/final... · 2007-12-20 · final draft report economic analysis of...
TRANSCRIPT

B E R K E L E Y 2501 Ninth St., Suite 200Berkeley, CA 94710-2515www .epsys.com
Phone: 510-841-9190Fax: 510-841-9208
S A C R A M E N T OPhone: 916-649-8010Fax: 916-649-2070
D E N V E RPhone: 303-623-3557
Fax: 303-623-9049
FINAL DRAFT REPORT
ECONOMIC ANALYSIS OF CRITICAL HABITAT
DESIGNATION FOR THE CALIFORNIA GNATCATCHER
Prepared for:
Division of Economics
U.S. Fish and Wildlife Service
4401 N. Fairfax Drive
Arlington, VA 22203
Prepared by:
Economic & Planning Systems, Inc.
Under subcontract to:
Industrial Economics, Incorporated
2067 Massachusetts Avenue
Cambridge, MA 02140
February 24, 2004
EPS #12594

TABLE OF CONTENTS
PAGE
EXECUTIVE SUMMARY AND REPORT ORGANIZATION . . . . . . . . . . . . . . . . . . . . . . . . . . . . . . 1
Introduction . . . . . . . . . . . . . . . . . . . . . . . . . . . . . . . . . . . . . . . . . . . . . . . . . . . . . . . . 1
Organization of Report . . . . . . . . . . . . . . . . . . . . . . . . . . . . . . . . . . . . . . . . . . . . . . . 2
Critical Habitat Designation . . . . . . . . . . . . . . . . . . . . . . . . . . . . . . . . . . . . . . . . . . . 2
Summary of Framework and Approach . . . . . . . . . . . . . . . . . . . . . . . . . . . . . . . . 4
General Analytic Steps . . . . . . . . . . . . . . . . . . . . . . . . . . . . . . . . . . . . . . . . . . . . . . . 6
Key Findings . . . . . . . . . . . . . . . . . . . . . . . . . . . . . . . . . . . . . . . . . . . . . . . . . . . . . . . . 7
I. INTRODUCTION & BACKGROUND . . . . . . . . . . . . . . . . . . . . . . . . . . . . . . . . . . . . . . 24
Species Description and Distribution . . . . . . . . . . . . . . . . . . . . . . . . . . . . . . . . . . 25
Proposed Critical Habitat Designation . . . . . . . . . . . . . . . . . . . . . . . . . . . . . . . . . 25
Framework for the Analysis . . . . . . . . . . . . . . . . . . . . . . . . . . . . . . . . . . . . . . . . . . 31
Creation of Habitat Conservation Plans . . . . . . . . . . . . . . . . . . . . . . . . . . . . . . . . 39
Other State and Local Laws . . . . . . . . . . . . . . . . . . . . . . . . . . . . . . . . . . . . . . . . . . 41
Time Delays and Regulatory Uncertainty . . . . . . . . . . . . . . . . . . . . . . . . . . . . . . 42
References . . . . . . . . . . . . . . . . . . . . . . . . . . . . . . . . . . . . . . . . . . . . . . . . . . . . . . . . . 47
Potentially Affected Activities . . . . . . . . . . . . . . . . . . . . . . . . . . . . . . . . . . . . . . . . 49
II. REGULATORY BACKGROUND . . . . . . . . . . . . . . . . . . . . . . . . . . . . . . . . . . . . . . . . . . 51
Baseline in Areas Proposed for Critical Habitat . . . . . . . . . . . . . . . . . . . . . . . . . 52
Baseline in Areas Proposed for Exclusion . . . . . . . . . . . . . . . . . . . . . . . . . . . . . . 63
Potential Future Baseline Regulations . . . . . . . . . . . . . . . . . . . . . . . . . . . . . . . . . 70
Western Riverside County Multi-Species Habitat Conservation Plan . . . . . . 71
Southern Orange County HCP/NCCP . . . . . . . . . . . . . . . . . . . . . . . . . . . . . . . . . 71
Northern San Diego County Multiple Habitat Conservation Plan . . . . . . . . . 72
North County Subarea Plan to the MSCP . . . . . . . . . . . . . . . . . . . . . . . . . . . . . . 72
City of Palos Verdes HCP/NCCP . . . . . . . . . . . . . . . . . . . . . . . . . . . . . . . . . . . . . 73
Other Future Regional HCPs . . . . . . . . . . . . . . . . . . . . . . . . . . . . . . . . . . . . . . . . . 73

TABLE OF CONTENTS (continued)
PAGE
III. DESIGNATION IMPACT ON PRIVATE LAND DEVELOPMENT . . . . . . . . . . . . . . . . . . . 74
Analytical Approach and Methodology . . . . . . . . . . . . . . . . . . . . . . . . . . . . . . . . 74
Projected Land Development with a Federal Nexus . . . . . . . . . . . . . . . . . . . . . 77
Regulatory Baseline and Section 7 Compliance . . . . . . . . . . . . . . . . . . . . . . . . . 82
Significance for Regional Real Estate Market . . . . . . . . . . . . . . . . . . . . . . . . . . . 88
Estimated Project Modification Costs . . . . . . . . . . . . . . . . . . . . . . . . . . . . . . . . . . 91
Estimated Administrative Consultation Costs . . . . . . . . . . . . . . . . . . . . . . . . . . 96
Summary of Private Land Development Impacts . . . . . . . . . . . . . . . . . . . . . . . 98
IV. IMPA CT OF PROPOSED DESIGNATION ON PUBLIC LAND DEVELOPMENT . . . . . . . . 99
Transportation and Road Construction . . . . . . . . . . . . . . . . . . . . . . . . . . . . . . . . 99
Local and Regional Water Projects . . . . . . . . . . . . . . . . . . . . . . . . . . . . . . . . . . . 109
Municipal Power Supply . . . . . . . . . . . . . . . . . . . . . . . . . . . . . . . . . . . . . . . . . . . 113
Federal Land Management . . . . . . . . . . . . . . . . . . . . . . . . . . . . . . . . . . . . . . . . . 117
Bureau of Land Management . . . . . . . . . . . . . . . . . . . . . . . . . . . . . . . . . . . . . . . . 119
Federal Emergency Management Options . . . . . . . . . . . . . . . . . . . . . . . . . . . . 120
Military Property and Operations . . . . . . . . . . . . . . . . . . . . . . . . . . . . . . . . . . . . 121
Habitat Conservation Plans . . . . . . . . . . . . . . . . . . . . . . . . . . . . . . . . . . . . . . . . . 128
Reinitiation of Section 7 Consultations . . . . . . . . . . . . . . . . . . . . . . . . . . . . . . . . 129
Tribal Lands . . . . . . . . . . . . . . . . . . . . . . . . . . . . . . . . . . . . . . . . . . . . . . . . . . . . . . 130
V. OTHER ECONOMIC EFFECTS . . . . . . . . . . . . . . . . . . . . . . . . . . . . . . . . . . . . . . . . . . 131
Time Delay . . . . . . . . . . . . . . . . . . . . . . . . . . . . . . . . . . . . . . . . . . . . . . . . . . . . . . . 131
Uncertainty/Stigma . . . . . . . . . . . . . . . . . . . . . . . . . . . . . . . . . . . . . . . . . . . . . . . . 134
CEQA-Related Indirect Costs . . . . . . . . . . . . . . . . . . . . . . . . . . . . . . . . . . . . . . . 138
VI. SMA LL BUSINESS REGULATORY ENFORCEM ENT ACT . . . . . . . . . . . . . . . . . . . . . . 141
VII. ENERGY IMPA CT ANA LYSIS . . . . . . . . . . . . . . . . . . . . . . . . . . . . . . . . . . . . . . . . . . . 155
Section 7 Effect on Energy Distribution Costs . . . . . . . . . . . . . . . . . . . . . . . . . . 156

TABLE OF CONTENTS (continued)
PAGE
VIII. UNFUNDED MANDA TES ANA LYSIS . . . . . . . . . . . . . . . . . . . . . . . . . . . . . . . . . . . . . 159
IX. POTENTIAL BENEFITS OF PROPOSED CRITICAL HABITAT . . . . . . . . . . . . . . . . . . . . 165
Abbreviation and Acronym Index . . . . . . . . . . . . . . . . . . . . . . . . . . . . . . . . . . . . . . . . . . . . 4
APPENDICES
A. Demographic Projections and Methodology
B. U.S. Army Corps Jurisdiction Assumptions, Methodology, and GIS Analysis
C. Summary of Selected Section 7 Biological Opinions
D. Real Estate Market Data and Land Value Calculations
E. Project Modification Cost Calculations for Private Land Development
F. Consultation Cost Model
G. Project Modification Cost Calculations for Public Land Development
H. Time Delay Calculations
I. Small Business Regulatory Effect Analysis Calculations
J. Benefits

LIST OF TABLES AND FIGURES
PAGE
Table 1: Estimated Costs of the Proposed Designation by Unit . . . . . . . . . . . . . . . 8
Table 2: Estimated Costs for Areas Proposed for Designation and Exclusion . . . 9
Table 3: Administrative and Project Modification Costs by Project Type . . . . . . 10
Table 4: Caveats to the Econom ic Analysis . . . . . . . . . . . . . . . . . . . . . . . . . . . . . . . 11
Table 5: Approximate Proposed Critical Habitat, Essential Areas, andExcluded Areas . . . . . . . . . . . . . . . . . . . . . . . . . . . . . . . . . . . . . . . . . . . . . . . 27
Table 6: Proposed Critical Habitat Acreage by City and Land Ownership . . . . 29
Table 7: Summary of Baseline Regulations . . . . . . . . . . . . . . . . . . . . . . . . . . . . . . . . 64
Table 8: Calculation of Projected Growth Acres with a Federal Nexus . . . . . . . . 78
Table 9: Projected Growth Acres by County . . . . . . . . . . . . . . . . . . . . . . . . . . . . . . 80
Table 10: Calculation of Mitigation Acres Associated with Section 7 . . . . . . . . . . 83
Table 11: Average Coastal Sage Scrub Mitigation Ratios by County . . . . . . . . . . . 87
Table 12: Regional Significance of Acres Impacted by Section 7 . . . . . . . . . . . . . . . 90
Table 13: Private Land Development Project Modification Costs . . . . . . . . . . . . . 93
Table 14: Residential and Commercial Market Data . . . . . . . . . . . . . . . . . . . . . . . . . 94
Table 15: Coastal Sage Scrub Mitigation Bank Prices . . . . . . . . . . . . . . . . . . . . . . . . 95
Table 16: Private Land Development Costs . . . . . . . . . . . . . . . . . . . . . . . . . . . . . . . . 97
Table 17: Public Land Development Costs . . . . . . . . . . . . . . . . . . . . . . . . . . . . . . . . 100
Table 18: Biological Opinions for the Gnatcatcher at Camp Pendleton . . . . . . . . 123
Table 19: Cost of Section 7 Time Delays . . . . . . . . . . . . . . . . . . . . . . . . . . . . . . . . . . 134
Table 20: Upper-End Mitigation Ratios . . . . . . . . . . . . . . . . . . . . . . . . . . . . . . . . . . . 136
Table 21: Upper-End Mitigation – Section 7 Project Modification Costs forPrivate Land Development . . . . . . . . . . . . . . . . . . . . . . . . . . . . . . . . . . . . 138
Table 22: Estimated Annual Number of Small Businesses Affected byCritical Habitat Designation . . . . . . . . . . . . . . . . . . . . . . . . . . . . . . . . . . . 143

Table 23: Estimated Annual Number of Small Governments Affected byCritical Habitat Designation . . . . . . . . . . . . . . . . . . . . . . . . . . . . . . . . . . . 144
Table 24: Estimated Annual Effects on Small Businesses inLand Development & Real Estate Industry (SIC Code 6552) . . . . . . . . 145
Table 25: Estimated Annual Effects on Small Governments . . . . . . . . . . . . . . . . . 153
Table 26: Energy Impact Analysis Summary . . . . . . . . . . . . . . . . . . . . . . . . . . . . . . 158
Table 27: Unfunded Mandate Reform Act (UMRA) Calculation Summary . . . . 161
Table 28: Physical/Biological Improvements Expected to Result fromImplementation of Section 7 of the Act . . . . . . . . . . . . . . . . . . . . . . . . . . 168
Table 29: Species Likely to Benefit From Coastal Sage Scrub ProtectionMeasures Associated with Critical Habitat Designation forthe Gnatcatcher . . . . . . . . . . . . . . . . . . . . . . . . . . . . . . . . . . . . . . . . . . . . . . 173
FIGURES
Figure 1: Proposed Critical Habitat Units . . . . . . . . . . . . . . . . . . . . . . . . . . . . . . . . . . 3
Figure 2: Total Cost Distribution by Development Type . . . . . . . . . . . . . . . . . . . . . 12
PAGE
LIST OF TABLES AND FIGURES (continued)

ABBREVIATION AND ACRONYM INDEX
Act The Endangered Species Act of 1973, as amended
ANF Angeles National Forest
BIA Bureau of Indian Affairs
BLM Bureau of Land Management
BOR Bureau of Reclamation
BO Biological Opinion
Caltrans California Department of Transportation
CEQA California Environmental Quality Act
CH Critical Habitat
CHD Critical Habitat Designation
CNF Cleveland National Forest
CSS Coastal Sage Scrub
DEM digital elevation model
DFG California Department of Fish and Game
DoD Department of Defense
EIR/EIS Environmental Impact Report/Environmental Impact Statement
EPS Economic & Planning Systems, Inc.
EUA Existing Use Area (under the Central/Coastal HCP/NCCP)
Fallbrook U.S. Naval Weapons Station Seal Beach, Detachment Fallbrook
FEMA Federal Emergency Management Agency
FHWA Federal Highway Administration
GIS Geographic Information Systems
HCP Habitat Conservation Plan
HLP Habitat Loss Permit
INRMP Integrated Natural Resource Management Plan
KV kilovolt
MCAS Marine Corps Air Station
MHCP Multiple Habitat Conservation Plan (northern San Diego County)
MHPA Multiple-Habitat Planning Area (under the MSCP)
MSCP Multiple Species Conservation Plan (San Diego County)
MSHCP Multiple-Species Habitat Conservation Plan (western Riverside
County)
MWD Metropolitan Water District
NCCP Natural Community Conservation Plan

NRPPA North Ranch Policy Plan Area (under the Central/Coastal
HCP/NCCP)
PCEs primary constituent elements
RTP Regional Transportation Plan
SAIA Sikes Act Improvement Act
SANDAG San Diego Association of Governments Service
SBNF San Bernardino National Forest
SBREFA Small Business Regulatory Enforcement Fairness Act
SCAG Southern California Association of Governments
SCE Southern California Edison
SCGC Southern California Gas Company
SDG&E San Diego Gas & Electric
the Service United States Fish & Wildlife Service
SLA Special Linkage Area (under the Central/Coastal HCP/NCCP)
TCA Transportation Corridor Agency
UMRA Unfunded Mandate Reform Act
USACE United States Army Corps of Engineers
USFS U.S. Forest Service
USGS U.S. Geological Survey
USMC U.S. Marine Corps
ABBREVIATION AND ACRONYM INDEX (continued)

Final Draft ReportEconomic Analysis of Critical Habitat Designation for California Gnatcatcher
February 24, 2004
1
EXECUTIVE SUMMARY AND REPORT ORGANIZATION1
INTRODUCTION
The purpose of this report is to identify and analyze the potential economic effects of
the proposed designation of critical habitat (CH) for the coastal California Gnatcatcher
(Polioptila californica californica), hereafter referred to as the gnatcatcher. The U.S. Fish6
and Wildlife Service proposed CH for the gnatcatcher on April 24, 2003 for
approximately 495,795 acres of land in Los Angeles, Orange, Riverside, San Bernardino,
and San Diego counties in California. This report has been prepared by Economic &
Planning Systems, Inc. (EPS), under subcontract to Industrial Economics, Inc., for the
U.S. Fish and Wildlife Service's Division of Economics.11
Section 4(b)(2) of the Endangered Species Act (the Act) requires the U.S. Fish and
Wildlife Service (Service) to designate CH on the basis of the best scientific data
available, after taking into consideration the economic effect, and any other relevant
effect, of specifying any particular area as CH. The Secretary of the Interior may16
exclude areas from critical habitat designation (CHD) if the benefits of exclusion
outweigh the benefits of including the areas within CH, provided the exclusion will not
result in extinction of the species.
The focus of this economic analysis is on section 7 of the Act, which requires Federal21
agencies to insure that any action authorized, funded, or carried out is not likely to
jeopardize the continued existence of any endangered or threatened species or result in
the destruction or adverse modification of CH. Federal agencies are required to consult
with the Service whenever they propose an action that may affect a listed species or its
designated CH. 26
The Service published a determination of threatened status for the gnatcatcher on
March 30, 1993 (58 FR 16742). On October 24, 2000, the Service published a Final Rule
designating approximately 514,000 acres as CH(65 FR 63680). In response to a number
of lawsuits filed subsequent to the designation, the Service requested a remand of the31

Final Draft ReportEconomic Analysis of Critical Habitat Designation for California Gnatcatcher
February 24, 2004
2
designation, which the U.S. District Court for the Central District of California granted
on June 11, 2002. The Court ordered the Service to complete a new proposed rule by
April 11, 2003, and held that the designation should remain in place until a new, final
regulation becomes effective.
ORGANIZATION OF REPORT36
This report is organized into six chapters. Following the Executive Summary, Chapter I
provides an introduction to this report, describes the species and its habitat, and lays
out the framework and methodology for the analysis. Chapter II describes the relevant
regulatory context, and its relationship to coastal sage scrub (CSS) habitat. Chapter III
focuses on the economic impact of section 7 on private development activities. Chapter41
IV addresses the effects of section 7 on public land development activities. Chapter V
evaluates other categories of economic impact, including delay, uncertainty, and
indirect effects. Chapter VI presents the Small Business Regulatory Enforcement Act
analysis, Chapter VII presents the Energy Industry Effects analysis, Chapter VIII
presents an Unfunded Mandate Reform Act (UMRA) analysis, and Chapter IX46
discusses the benefits of the proposed CHD.
CRITICAL HABITAT DESIGNATION
On April 24, 2003, the Service published a proposed rule in the Federal Register
outlining its proposal to designate CH for the gnatcatcher. The proposed rule
delineated 13 CH units in six counties in California – San Diego, Riverside, San51
Bernardino, Orange, Los Angeles, and Ventura. The proposed designation consists of
approximately 495,795 total acres, which include 431,785 acres (87 percent) private land,
45,380 acres (9 percent) Federal land, and 18,630 acres (4 percent) State or local land.
The proposed rule also identified an additional 264,280 acres of “essential” gnatcatcher
habitat that was proposed for exclusion from final CH boundaries because of either56
existing special management considerations, or an evaluation of economic and other
relevant impacts. Proposed CH boundaries are shown in Figure 1.

�������
�������
�����������
������
�����
�������
������
������
�����
������
�������
������
������������
��� �����������������������������
��������������
�������������
�����������
�
�� � �� �����
��������������������������������������������� �������������!������� ��
������������������� ���������� ������ !"�����#�$�$���������%�&$������ !"�������$���'������%$�(

Final Draft ReportEconomic Analysis of Critical Habitat Designation for California Gnatcatcher
February 24, 2004
4
SUMMARY OF FRAMEWORK AND APPROACH
This Draft Economic Analysis, provides an estimate of the economic effects of the
designation of CH, as proposed on April 24, 2003, for the gnatcatcher. These effects
include direct costs that result from compliance with section 7 of the Act, such as
administrative costs of completing informal and formal consultations with the Service66
and the project modification costs occurring as a result of these activities. This analysis
also evaluates indirect effects of the designation, such as costs of project delays and
regulatory uncertainty, and costs associated with changes in implementation of other
laws such as the California Environmental Quality Act (CEQA).
71
This analysis does not consider any costs that would occur in the absence of the
designation, such as other land use regulation by Federal, State, or local governments.
The one exception to this statement is the total cost associated with section 7, which
may result either from the listing of the species (the jeopardy standard) or from the
designation itself (the adverse modification standard). Because it can be difficult to pre-76
determine the standard that drives a section 7 consultation, all costs related to the
implementation of section 7 are included in the total cost estimates presented in this
document.
The direct compliance costs mentioned above represent a reasonable approximation of81
how society as a whole will be affected by the designation when compliance activity is
not expected to significantly affect housing or other markets. This analysis evaluated
the estimated impacts in relation to the regional housing market to determine whether
an analysis of changes in consumer and producer surplus within the market for new
homes would be appropriate.86
Other economic effects considered in the analysis include the benefits of the designation
and distributional impacts on small entities, the energy industry, and local/tribal
governments and private industry in accordance with the UMRA. Potential benefits of
the designation are discussed qualitatively.91
This analysis estimates the economic effects of the proposed designation through 2025,
beginning on the publication date of the proposed rule.
This analysis differs significantly from the economic analysis completed in September
2000 in support of the Service’s original CHD for the gnatcatcher. Major differences are96
described below.

Final Draft ReportEconomic Analysis of Critical Habitat Designation for California Gnatcatcher
February 24, 2004
5
• Both analyses apply a baseline approach that compares the “world without
critical habitat” to the “world with critical habitat.” However, the earlier
analysis assumed that all costs associated with the listing of the species,101
including impacts resulting co-extensively from the jeopardy provision of
section 7, were part of the baseline. This analysis acknowledges that given the
similarity in regulatory definitions between the terms “jeopardy” and “adverse
modification,” in practice it can be difficult to pre-determine the standard that
drives a section 7 consultation. In order to ensure that no costs of CH are106
omitted, this analysis includes all section 7 costs, including those resulting solely
or co-extensively from the jeopardy standard. As a result, this analysis likely
overstates the costs associated with the proposed designation.
• Because the Service asserted that no project modifications would be requested111
beyond those implemented to avoid jeopardy, the 2000 economic analysis found
that the designation would not result in project modification costs attributable to
CH. This analysis quantifies the costs of project modifications associated with
both the jeopardy and adverse modification standards.
116
• Both analyses identify potential additional costs associated with section 7
administrative activities, project delays, and regulatory uncertainty. These
impacts were discussed qualitatively in the 2000 analysis and are quantified in
this analysis.
121
• This analysis also considers potential indirect effects of the designation resulting
from the triggering of additional requirements under CEQA, and it addresses
potential impacts to the regional economy and the housing market.
• This analysis relies on a broader range of information/data obtained from a126
number of different sources.
• The 2000 economic analysis reflected the final designation of 513,650 acres (i.e.,
areas proposed but ultimately excluded from the final designation were not
considered in the final economic analysis). This analysis considers potential131
impacts resulting from the designation of 495,795 acres that are proposed for
inclusion in the final designation, as well as 264,280 acres that are proposed for
exclusion from the final rule.

Final Draft ReportEconomic Analysis of Critical Habitat Designation for California Gnatcatcher
February 24, 2004
6
GENERAL ANALYTIC STEPS
This report relies on a sequential methodology and focuses on distilling the salient and136
relevant aspects of potential economic impacts of the designation. These are the steps
followed in this analysis:
• Describing current and projected economic activity within and around the
proposed CH area;141
• Identifying whether such activities are likely to involve a Federal nexus;
• For activities with a Federal nexus, evaluating the likelihood that these activities
will require consultations under section 7 of the Act and, in turn, result in any146
modifications to projects.
• Estimating the direct costs of expected section 7 consultations, project
modifications and other economic impacts associated with the designation;
151
• Estimating the likelihood that current or future activities may require additional
compliance with other Federal, State, and local laws as a result of new
information provided by the designation;
• Estimating the likelihood that projects will be delayed by the consultation156
process or other regulatory requirements triggered by the designation;
• Estimating the likelihood that economic activity will be affected by regulatory
uncertainty, and/or property values affected;
161
• Estimating the indirect costs of the designation, as reflected in the cost of
compliance with State and local laws, project delays, regulatory uncertainty, and
effects on property values;
• Estimating the potential fraction of total section 7 costs that likely would not166
have occurred but for CHD (i.e., attributable solely to the designation);
• Assessing the extent to which CHD will create costs for small businesses as a
result of modifications or delays to projects;
171

Final Draft ReportEconomic Analysis of Critical Habitat Designation for California Gnatcatcher
February 24, 2004
1
Costs have been calculated using a 12 percent discount rate for private development projects and a 7
percent discount rate for public pro jects.
7
• Assessing the effects of administrative costs and project modifications on the
supply, distribution, and use of energy; and
• Determining the benefits that may be associated with CHD.
176
As noted above, this analysis considers both the efficiency effects and distributional
effects that could result from this designation. It begins by considering direct
compliance costs associated with the designation, as well as potential indirect effects,
such as those effects associated with compliance with other Federal, State, and local
laws, project delays, and impacts to property values. As necessary, regional economic181
impacts are described, as are impacts on significantly affected markets. Impacts on
small entities and the energy industry are discussed separately, in Chapter VI and
Chapter VII, respectively. Impacts to local/Tribal governments and private industry
are discussed in Chapter VIII, in accordance with UMRA. Potential benefits of critical
habitat are discussed qualitatively, in Chapter IX.186
KEY FINDINGS
This section summarizes the economic costs associated with section 7 implementation in
areas proposed for gnatcatcher CH. Summary descriptions of key findings – including
total costs, costs by unit, and costs by project type – are provided below. Summaries of
total estimated section 7 costs by proposed Unit are presented in Table 1.1 Table 2191
provides a comparison of total section 7 costs for areas proposed for designation versus
areas proposed for exclusion – these results are discussed briefly in the relevant unit
summaries, below (a more detailed summary of combined analytical results for areas
proposed for designation and exclusion is presented in Appendix H). Table 3
summarizes administrative and project modification costs by activity. Table 4196
summarizes key assumptions employed in this analysis and the likely direction of bias
each assumption represents. Figure 2 shows total cost distribution by project type.

Table 1Estimated Costs of the Proposed Designation by Unit (1)
Proposed Project Modification Administrative Delay Uncertainty TotalCH Unit Costs Costs (2) Costs Costs Cost Percent
Unit 1 $2,230,500 $387,500 $63,300 $1,333,000 $4,014,400 0.4%
Unit 2 $2,027,500 $281,500 $55,500 $1,168,600 $3,533,100 0.4%
Unit 3 $6,329,300 $532,500 $188,100 $3,959,300 $11,009,200 1.2%
Unit 4 $2,448,900 $266,700 $200 $3,300 $2,719,100 0.3%
Unit 5 $6,978,600 $709,000 $277,600 $5,841,900 $13,807,000 1.5%
Unit 6 $85,111,800 $966,100 $173,200 $2,817,900 $89,068,900 9.7%
Unit 7 $4,883,800 $83,200 $19,600 $319,700 $5,306,400 0.6%
Unit 8 $332,700 $116,400 $0 $0 $449,100 0.0%
Unit 9 $38,074,200 $392,500 $254,200 $3,950,100 $42,671,000 4.7%
Unit 10 $435,551,700 $3,069,900 $2,213,000 $19,072,900 $459,907,500 50.2%
Unit 11 $90,433,200 $297,300 $233,000 $2,400,900 $93,364,400 10.2%
Unit 12 $3,649,200 $64,900 $44,000 $271,800 $4,029,800 0.4%
Unit 13 $168,719,000 $1,723,800 $2,156,400 $12,858,000 $185,457,200 20.3%
Total Cost $846,770,400 $8,891,400 $5,678,200 $53,997,300 $915,337,200 100%
Annualized Cost (3) $105,461,200 $1,022,500 -- (4) $6,995,900 $113,479,600 --
All dollar values have been rounded to the nearest hundred; summed totals may not add exactly.(1) Assumes discount rates of 12% for private development projects and 7% for public development projects.(2) Average administrative consultation costs (low and high) were allocated among units in proportion to the number of projected growth acres
in each unit with a Federal nexus (see Table 8).(3) Represents the annual amount that is equivalent to the Total Costs, when distributed over a 23-year period. Annualized costs for Project Modification
and Administrative cost categories were calculated using discount rates of 12 and 7 percent for private and public development projects, respectively. Reported annualized costs for Uncertainty totals are an overestimate of the actual cost because private/public cost categories could not be differentiated in the unit summary format. A 12 percent discount rate was therefore applied universally to this cost category, rather than selectively applying a 7 percent discount rate to the public projects.
(4) Delay costs are assumed to occur in Year 1 only, and were therefore removed from the calculation of annualized costs (which assume equal distribution through 2025).The reported annualized value for 'Total Costs' is an estimate of annual costs Years 2-23; annual costs in Year 1 would be equal to this amount plus the full delay costs (approximately $119 million).
Economic & Planning Systems, Inc. 2/26/2004 H:\12594gnatcatcher\Report\DEA_Feb2004\EmailTables_Feb2004.xls

Table 2Estimated Section 7 Costs for Areas Proposed for Designation and Exclusion
Proposed Total (3)CH Unit
Unit 1 $4,014,400 $70,687,500 $74,701,900
Unit 2 $3,533,100 $0 $3,533,100
Unit 3 $11,009,200 $0 $11,009,200
Unit 4 $2,719,100 $0 $2,719,100
Unit 5 $13,807,000 $3,669,600 $17,476,600
Unit 6 $89,068,900 $395,100 $89,464,000
Unit 7 $5,306,400 $6,841,600 $12,148,000
Unit 8 $449,100 $0 $449,100
Unit 9 $42,671,000 $0 $42,671,000
Unit 10 $459,907,500 $0 $459,907,500
Unit 11 $93,364,400 $0 $93,364,400
Unit 12 $4,029,800 $0 $4,029,800
Unit 13 $185,457,200 $0 $185,457,200
Project-Specific HCPs (4) $0 $141,500 $141,500
Total Cost $915,337,200 $81,735,300 $997,072,400
Annualized Cost (5) $113,479,600 $10,788,100 $124,267,700
All dollar values have been rounded to the nearest hundred; summed totals may not add exactly.(1) Summary of economic cost calculations -- including project modification, administrative, time delay, and uncertainty costs --
for areas proposed for critical habitat designation on April 24, 2003 (see Table 1). Assumes 12% discount rate.(2) The Proposed Rule published on April 24, 2003 proposed that a number of areas containing essential habitat not be designated
(under section 3(5)(a)) or be excluded from critical habitat designation (under section 4(b)(2)) of the Act. This analysis evaluates the economic cost of designating these areas, however, to allow the Service to consider "economic and any other relevant impacts" in deciding whether to exclude these areas in the final designation. These values are equal to "Total" costs minus costs of "Areas Proposed for Critical Habitat." It is important to note these costs do not represent areas that have been proposed for critical habitat designation.
(3) This analysis evaluates the potential economic costs if the Service designated critical habitat for all areas proposed for both designation and exclusion. A summary table for this separate cost model is included as Appendix H.
(4) Because the location of all existing project-specific HCPs was not known, this item is reported individually.(5) Represents the annual amount that is equivalent to the Total Costs, when distributed over a 23-year period (2003-2025).
Assumes a discount rate of 12 percent (private/public costs could not be separated in the Unit Summary table)
Proposed for Critical Habitat (1)
Proposed for Exclusion (2)
Economic & Planning Systems, Inc. 2/26/2004 H:\12594gnatcatcher\Report\DEA_Feb2004\EmailTables_Feb2004.xls

Table 3Administrative and Project Modification Costs by Project Type for the Proposed Designation (1)
Project/Consultation RelevantCH Unit(s)
Private Land Development AllCSS mitigation requirements $709,957,400 -- --Other project modifications $32,854,500 -- --
Subtotal, Private Land Development $742,811,900 $5,720,900 $748,532,800
Public Land Development Transportation and Road Construction
Caltrans District 7 8,9,12,13 $369,200 -- --Caltrans District 8 10-11 $42,301,400 -- --Caltrans District 11 1-5 $23,500 -- --Caltrans District 12 6,7,9 $443,800 -- --Subtotal, Caltrans $43,137,900 $1,691,000 $44,828,900
Transportation Corridor Agency 6 $35,085,000 $18,100 $35,103,100
Municipal Water SupplyRegional Infrastructure All $6,628,600 $115,700 $6,744,300Flood Control All $153,300 $66,900 $220,200
Municipal Power Supply All $11,535,900 $52,100 $11,588,000
Federal Land ManagementAngeles National Forest 11-13 $196,000 $52,400 $248,400Cleveland National Forest 1,2,4-6,9-10 $203,800 $339,500 $543,300San Bernardino National Forest 11 $49,000 $47,200 $96,200Bureau of Land Management All $25,800 $58,700 $84,500
Federal Emergency Management Activities All -- $385,700 $385,700
Military OperationsCamp Pendleton (non-training areas) 6 $4,833,300 $177,700 $5,011,000Fallbrook 4 $2,110,000 $114,500 $2,224,500El Toro 7 -- $14,600 $14,600
Future Habitat Conservation Plans (HCPs) All -- $36,500 $36,500
Reinitiated Section 7 Consultations All -- $0 $0
Subtotal, Public Land Development $103,958,500 $3,170,500 $107,129,200
Total Costs $846,770,400 $8,891,400 $855,662,000
Annualized Cost (2) $105,461,200 $1,022,500 $106,483,700
All dollar values have been rounded to the nearest hundred; summed totals may not add exactly.(1) Assumes discount rates of 12% for private development projects and 7% for public development projects. (2) Represents the annual amount that is equivalent to the Total Costs, when distributed over a 23-year period and assuming the discounts rates in footnote (1).
Project Modification CostsAdministrative
CostsTotal
Economic & Planning Systems, Inc. 2/26/2004 H:\12594gnatcatcher\Report\DEA_Feb2004\EmailTables_Feb2004.xls

Final Draft ReportEconomic Analysis of Critical Habitat Designation for California Gnatcatcher
February 24, 2004
11
Table 4. Caveats to the Economic Analysis206
Key Assumption Effect on Cost
Estimate
69 percent of projected private development will have a Federal nexus through U.S.
Army Corps of Engineers section 404 permitting.+/-
The section 7 biological opinions summarized in Appendix C express on-site set-211
aside, off-site preservation, and restoration ratios that are representative of future
section 7 consultations.
+/-
The California Environmental Quality Act (CEQA) is a baseline regulation in San
Diego and Orange counties, where it requires baseline mitigation for CSS impacts at
a 2:1 ratio.216
+/-
The 4(d) Special Rule is a baseline regulation in San Diego County, Orange County,
and Rancho Palos Verdes (Unit 8). CSS impacts from projects that qualify for 4(d)
Rule approval will be regulated through the 4(d) Rule and not through section 7.
-
All estimated project modifications (and costs) are assumed to be attributable
entirely to the gnatcatcher, even when other endangered species or environmental221
considerations may be present.
+
- : This assumption may result in an underestimate of real costs.
+ : This assumption may result in an overestimate of real costs.
+/- : This assumption has an unknown effect on estimates.
226

Economic & Planning Systems, Inc. 2/26/2004 H:\12594gnatcatcher\Report\DEA_Feb2004\EmailTables_Feb2004.xls
Figure 2. Total Cost Distribution
FEMA0%
Private Devel. -- Mitigation77%
Private Devel. -- Other Proj.Mods.4%
Private Devel. -- Admin.1%
Caltrans5%
TCA4%
Regional Water Infrastructure1%
BOR0%
Municipal Power Supply1%
Military Operations1%
Future HCPs0%
Uncertainty5%
Delay1%
Federal Land Management0%

Final Draft ReportEconomic Analysis of Critical Habitat Designation for California Gnatcatcher
February 24, 2004
2
CSS is the primary habitat type associated with the gnatcatcher, and is the most predom inant habitat
in the proposed designation. Because the link between CSS, the gnatcatcher, and its habitat is well
established in both biological and regulatory terms, this analysis evaluates CSS development as a
proxy for regulation under the Act, when appropriate.
3The term “mitigation” is given a specific meaning within the regulations that support the Act – it is
typically used to describe measures taken in response to provisions of section 10, and is not generally
used in the context of section 7. Nonetheless, this analysis uses the terms “mitigation” and
“mitigation ratio” broadly to refer to habitat compensation measures and mechanisms negotiated
through the section 7 process, in part due to the widepread use of these terms in the context of other
land use regulations prevalent in southern California (i.e., regional HCPs, CEQ A, etc.). In this
analysis, “mitigation” is used to describe the suite of land-based project m odifications that applicants
often implement in association with section 7 consultations, including “conservation measures” that
Federal Action Agencies and/or project applicants can take to avoid jeopardy.. The term "mitigation
ratio" is used to describe the relationship between acres developed and acres preserved in the context
of historical and projected future, section 7 consultation outcomes. In practice, the Service addresses
each project individually, and does not rely on fixed mitigation ratios to determine the amount of
habitat preservation required.
13
TOTAL ECONOMIC IMPACT
The total future potential economic impact from section 7 consultations associated with
the gnatcatcher listing and proposed CHD is estimated to be $915 million through the231
year 2025, or $113 million per year on an annualized basis. This is an estimate of the
“co-extensive” cost of both the listing and proposed CHD for the gnatcatcher under
section 7; no attempt was made to estimate the economic impact solely attributable to
the proposed CHD. The year 2025 was selected as the appropriate timeframe for
analysis because 2025 is the last year for which the Southern California Association of236
Governments (SCAG) provides demographic projections. The bulk of this impact –
over 77 percent – results from the on- or off-site preservation or restoration of CSS
habitat2 as a result of section 7 consultations (referred to as “CSS mitigation”) in
association with private development projects.3 Estimates of CSS mitigation associated
with section 7 consultations deduct mitigation likely to be required through pre-existing241
regulations (such as the 4(d) Special Rule and the California Environmental Quality Act,
for example), and costs therefore represent “net” mitigation costs attributable solely to
section 7. The components of this total economic impact are further described below.

Final Draft ReportEconomic Analysis of Critical Habitat Designation for California Gnatcatcher
February 24, 2004
14
Economic Impact by Proposed Critical Habitat Unit246
Unit 1. This unit encompasses approximately 25,100 acres in San Diego County, and
includes the San Diego National Wildlife Refuge as well as several areas without
approved subarea plans under the Multiple Species Conservation Plan (MSCP).
Although a moderate amount of development is projected in this unit given its size,
pre-existing baseline regulations through the 4(d) Special Rule and California251
Environmental Quality Act (CEQA) significantly limit the project modification costs
attributable to section 7. Total section 7 costs are estimated at approximately $4 million.
If areas proposed for exclusion are designated as CH, the additional section 7 cost is
estimated to be approximately $71 million, or more than a 18-fold increase in total costs.
The additional projected cost is associated almost entirely with CSS mitigation for256
development in the City of Poway, where minimal baseline conditions are assumed to
apply.
Unit 2. This unit includes approximately 16,000 acres in and around the upper San
Diego River drainage and Cleveland National Forest. A moderate amount of growth is261
projected within the unit, though the presence of 4(d) Rule and CEQA baseline
requirements result in a small amount of future estimated CSS mitigation associated
with section 7. Total costs for proposed CH are approximately $3.5 million. No areas in
Unit 2 have been proposed for exclusion.
266
Unit 3. Unit 3 includes approximately 32,000 acres within the proposed North San
Diego County Multiple Habitat Conservation Plan (MHCP) planning area. A large
amount of growth is projected within this unit relative to its size, though the presence
of 4(d) Rule and CEQA baseline considerations result in relatively few acres mitigated
in association with the section 7 consultation process. The total estimated economic271
costs for this unit are approximately $11 million. It is worth noting that if the MHCP is
approved, a significant portion of future development in CSS habitat would be
regulated by the MHCP and would not be attributable to section 7. No areas in Unit 3
have been proposed for exclusion.
276

Final Draft ReportEconomic Analysis of Critical Habitat Designation for California Gnatcatcher
February 24, 2004
4An evaluation of the im pact of CH D on military readiness is beyond the scope of this analysis.
15
Unit 4. Unit 4 encompasses approximately 8,700 acres within U.S. Naval Weapons
Station Seal Beach, Detachment Fallbrook (Fallbrook). Almost no future development is
projected by the San Diego Association of Governments (SANDAG) within this unit. 281
Construction of weapons storage facilities and other infrastructure is expected to result
in section 7 costs of approximately $2.7 million through 2025. No areas in Unit 4 have
been proposed for exclusion.
Unit 5. Approximately 35,000 acres of CH have been proposed for Unit 5, which286
includes the North County subarea of the MSCP for unincorporated San Diego County.
A large amount of growth is projected in this unit relative to its size, although 4(d) Rule
and CEQA baseline regulations result in a relatively small number of acres mitigated in
association with section 7 consultation. Total section 7 costs for this unit are
approximately $13.8 million. The Pala Band of Mission Indians Reservation has been291
proposed for exclusion, and would add approximately 7,700 acres to Unit 5 if it were
designated as CH. The estimated economic cost associated with the Pala Reservation
would result in additional section 7 costs of approximately $3.7 million through 2025,
primarily associated with housing and infrastructure construction involving Bureau of
Indian Affairs (BIA) funds.296
Unit 6. Approximately 44,000 acres of CH have been proposed for Unit 6, which
includes the Southern Natural Community Conservation Plan (NCCP) Subregion of
Orange County, as well as habitat linkages to Units 3 and 4, and non-training areas in
Camp Pendleton, in San Diego County. Significant growth is projected in this unit. 301
Though the 4(d) Rule constitutes a regulatory baseline in both San Diego and Orange
counties, this analysis assumes that one or more large-scale, proposed development
projects in southern Orange County will take place that will not qualify for 4(d)
approval (baseline requirements under CEQA is still assumed, however). The resulting
economic cost estimate is approximately $89 million through 2025. If mission-essential306
training areas at Camp Pendleton, which have been proposed for exclusion, are
designated as CH in Unit 6, this analysis estimates that additional section 7 costs would
be approximately $400,000.4

Final Draft ReportEconomic Analysis of Critical Habitat Designation for California Gnatcatcher
February 24, 2004
16
Unit 7. Unit 7 encompasses approximately 5,800 acres, which includes the El Toro311
Reuse Area, the Irvine Ranch Land Reserve, and Existing Use Areas (EUAs) within the
Orange County Central/Coastal NCCP planning area. Only Planned Activities covered
by the NCCP are allowed within El Toro and the Irvine Ranch. Limited private
development is projected within EUAs. The resulting costs are estimated at
approximately $5.3 million, which takes into account CEQA as the only applicable316
baseline regulation. All remaining reserve areas under the NCCP, totaling over 35,000
acres, have been proposed for exclusion. Although a very large land area, the proposal
of these reserves as CH would result in an estimated additional cost of only $6.8
million, because little private development is anticipated, and nearly all future projects
would be addressed by the NCCP (which would constitute a baseline regulation).321
Unit 8. Critical habitat (CH) has been proposed for approximately 7,200 acres in Unit 8
within the Palos Verdes Peninsula in Los Angeles County, including the City of Rancho
Palos Verdes Multiple Species Habitat Conservation Plan (MSHCP). This analysis
estimates minimal future section 7 costs – approximately $450,000 through 2025 – due326
both to low projected growth and the presence of the 4(d) Rule as a baseline regulation.
No areas in Unit 8 have been proposed for exclusion.
Unit 9. This unit includes approximately 22,600 acres in northern Orange, eastern Los
Angeles, and parts of western Riverside and San Bernardino counties. Moderate331
growth is projected within the unit, though the fact that CEQA regulation in northern
Orange County constitutes the only baseline consideration results in significant total
costs relative to the unit’s size. Total costs are estimated at approximately $43 million
through 2025. No areas in Unit 9 have been proposed for exclusion.
336
Unit 10. Unit 10 is the largest proposed unit, encompassing over 176,000 acres
throughout western Riverside County. The unit lies entirely within the proposed
planning area of the Riverside County MSHCP. Based on very large projected growth
estimates, the absence of any baseline regulations, and the size of the unit, this analysis
concludes that section 7 costs in Unit 10 are approximately $460 million through 2025 –341
over 50 percent of the total cost estimate for all units. It is worth noting that although

Final Draft ReportEconomic Analysis of Critical Habitat Designation for California Gnatcatcher
February 24, 2004
17
no baseline regulations were identified, if the MSHCP is approved, a significant portion
of future development in CSS habitat would be regulated by the Plan and would not be346
attributable to section 7. No areas in Unit 10 have been proposed for exclusion.
Unit 11. Approximately 15,000 acres of CH have been proposed for Unit 11 in
southwestern San Bernardino County. A significant amount of growth is projected
relative to the size of the unit, and the absence of any baseline regulations means that all351
future project modifications are attributable to section 7. The estimated future section 7
costs associated with the proposed designation is approximately $93 million, which
represents about 10 percent of total costs for all units. No areas in Unit 11 have been
proposed for exclusion.
356
Unit 12. This unit encompasses approximately 3,900 acres in eastern Los Angeles
County. Although this analysis identified no applicable baseline regulations, a
relatively small amount of growth is projected in this unit. Total section 7 costs are
estimated at approximately $4 million. No areas in Unit 12 have been proposed for
exclusion.361
Unit 13. Unit 13 is the second largest unit, encompassing more than 103,000 acres in
western Los Angeles and Ventura counties. Based on large projected growth estimates,
the absence of any baseline regulations, and the size of the unit, this analysis concludes
that section 7 costs in Unit 13 are approximately $185 million – over 20 percent of the366
total cost estimate for all units. No areas in Unit 13 have been proposed for exclusion.
Economic Impact by Project Type
The discussion below addresses project modification and administrative costs for future371
projects anticipated within proposed CH boundaries (indirect costs due to delay or
uncertainty are not included here). The costs described below are summarized in
Table 3.
Private Land Development. The total section 7 cost related to projected private land376
development is estimated at approximately $749 million through 2025, which
represents roughly 82 percent of total estimated costs. This total includes estimates of

Final Draft ReportEconomic Analysis of Critical Habitat Designation for California Gnatcatcher
February 24, 2004
18
(1) project modification costs related to mitigating future development of CSS habitat
through on-site set-aside, off-site preservation, and restoration; (2) project modification
costs related to biological monitoring, fencing, and education programs; and (3)381
administrative costs incurred through section 7 consultation. These costs are assumed
to be associated with an estimated 866 future private development projects that will
involve a Federal nexus through the United States Army Corps of Engineers (USACE).
The largest component of total cost is the estimated loss in land value for acres set-aside
through the section 7 process, and therefore permanently removed from developable386
land supply.
This analysis estimates that about 12,500 acres of CSS habitat will be set-aside through
2025 as a result of section 7 consultations associated with projected land development.
This represents approximately 1.7 percent of total projected land development in the391
six-county region over the same period. This percentage is not considered a regionally
significant reduction in future development opportunities and is not expected to affect
regional real estate market prices. As a result, the primary burden of section 7
regulation for private land development is expected to fall on the regulated landowners
rather than consumers at large. 396
Transportation and Road Construction. Future transportation projects include road
construction by California Department of Transportation (Caltrans) Districts 7, 8, 11,
and 12, and the Transportation Corridor Agency (TCA). Total costs for the four
Caltrans districts are estimated at approximately $45 million, or roughly 5 percent of401
total costs. This analysis estimates that all Caltrans districts combined will participate
in 191 formal consultations resulting in project modification costs, though construction
in Riverside and San Bernardino counties is expected to result in significantly higher
section 7 costs that any other district. The TCA’s proposed SR-241 Foothill-South toll
road is estimated to result in an estimated section 7 cost of approximately $35 million,406
based on an average of two potential development scenarios.
Municipal Water Supply. This analysis estimates that the Metropolitan Water District
(MWD) and the San Diego County Water Authority will engage in 13 future regional
water infrastructure projects requiring section 7 consultation. This analysis estimates411
that the Bureau of Reclamation (BOR) will participate in 12 informal section 7

Final Draft ReportEconomic Analysis of Critical Habitat Designation for California Gnatcatcher
February 24, 2004
19
consultations and three formal consultations involving a combination of local water
reuse and flood control projects. This analysis assumes that local-level utility projects,
such as those carried out by local retail water agencies, are associated with urban
development, and related section 7 costs are therefore captured in the private416
development section. Combined regional water projects are estimated to result in total
section 7 costs of approximately $7 million.
Municipal Power Supply. This analysis estimates that the Southern California Gas
Company, San Diego Gas and Electric, and Southern California Edison will require six421
total future section 7 consultations for regional gas and electric infrastructure projects
through 2025. Though very little project-specific information was available, this
analysis estimates that total section 7 costs will be approximately $11.6 million.
Federal Land Management. Angeles National Forest, Cleveland National Forest, San426
Bernardino National Forest, and the Bureau of Land Management will all engage in
land management projects (fire prevention, prescribed burns, etc.) that are expected to
require section 7 consultation. These agencies collectively estimated a total of 3
technical assistance calls, 81 informal consultations, and 50 formal consultations. These
consultations and associated project modifications are estimated to result in a total431
section 7 cost of approximately $1 million through 2025.
Federal Emergency Management. By the nature of its activities, the Federal Emergency
Management Agency (FEMA) is not able to provide estimates of future planned
projects. Based on historical projects, FEMA estimates it will participate in436
approximately 75 informal and 30 formal consultations through 2025, most likely
related to flood control and fire prevention activities. This analysis estimates that
administrative consultation costs for these activities will be approximately $386,000. No
information was provided that allowed quantification of project modification costs.
441
Military Operations. Military lands proposed for CHD include parts of United States
Marine Corps (USMC) Camp Pendleton (non-training areas only), the U.S. Navy’s
Naval Weapons Station Seal Beach, Detachment Fallbrook (Fallbrook), and the U.S.
446

Final Draft ReportEconomic Analysis of Critical Habitat Designation for California Gnatcatcher
February 24, 2004
20
Navy’s El Toro Reuse Area. Based on previous section 7 consultation history and costs,
this analysis estimates 37 formal consultations for Camp Pendleton through 2025,
resulting in total costs of approximately $5 million.
Fallbrook staff estimate that future construction of storage facilities for explosive451
ordnance will result in approximately 16 formal section 7 consultations, and will result
in total costs of approximately $2.2 million.
Finally, one road construction project is anticipated with the El Toro Reuse Area, a U.S.
Navy parcel currently managed as a reserve to the Central/Coastal Orange County456
NCCP. This project is a Planned Activity under the NCCP, however, and has already
been mitigated in full, so no section 7 project modification costs are anticipated. The
estimated administrative cost of the single consultation is $14,600.
Existing Habitat Conservation Plans. All existing project-specific habitat conservation461
plans (HCP) that address the gnatcatcher either do not meet the definition of CH (under
section 3(5)(a)) or have been proposed for exclusion (under section 4(b)(2)). If these
HCPs were designated as CH, each would require an internal consultation between the
Service’s section 7 and section 10 branches to insure the plan is consistent with section 7
requirements. This analysis assumes that 28 HCPs would require internal, informal466
consultations, and that costs would be borne entirely by the Service. In addition, future
projects with a Federal nexus within HCPs that are designated as CH would require
section 7 consultation. This analysis assumes that any mitigation requirements for such
projects would be determined by the HCP, so only administrative costs are estimated.
Based on previous consultation rates for such projects, this analysis estimates 8471
additional formal section 7 consultations would be required. The total estimated costs
for these 28 informal and 8 formal consultations is approximately $142,000. These costs
are shown in Table 2 (column 2), but not in Table 1 or Table 3, because all existing
HCPs have been proposed for exclusion.
476
Future Habitat Conservation Plans. In order to be approved, any future HCP that
addresses the gnatcatcher or includes land designated as CH will require an internal
consultation between the Service’s section 7 and section 10 branches to insure the plan
is consistent with section 7 requirements. These consultations will be informal. This

Final Draft ReportEconomic Analysis of Critical Habitat Designation for California Gnatcatcher
February 24, 2004
21
analysis identified 16 planned or proposed HCPs, all of which are assumed will reach481
completion and require consultation by the Service. The estimated administrative cost
of these consultations is estimated at approximately $37,000, which would be borne
entirely by the Service.
Reinitiated Consultations. No information regarding the number of previous section 7
consultations that will require reinitiation following the designation of CH was486
identified. Public comment is specifically requested for this issue.
Time Delay. Private development projects could be delayed due to restrictions on land
development activities during specific periods of the year. Section 7 regulation
associated with the gnatcatcher will require projects not to conduct habitat-disturbing491
land development activities during the breeding season, a six-month period from
February 15 to August 15. It is assumed that all land development projects expected to
occur in the 12 months following CHD will be delayed by 6 months. It is also assumed
that projects further away from development will be able to plan habitat disturbing
land development activities outside the breeding season and will not experience any496
additional time delays. The analysis finds that the economic costs associated with
section 7 time delays experienced by private development projects will be
approximately $5.7 million.
Uncertainty/Stigma. Uncertainty effects may result due to the case-by-case nature of501
section 7 consultations and the corresponding uncertainty associated with the scope and
level of project modifications. The economic cost associated with uncertainty is likely to
lie somewhere between zero and the additional cost associated with an upper-end set of
mitigation requirements associated with section 7. Once known factors such as clear
differences in habitat quality and the presence of other species are accounted for, the506
remaining uncertainty appears to be in the plus-or-minus 25 percent range based on a
review of “effective” mitigation ratios from biological opinions (BOs) provided by the
Service. The analysis estimates an uncertainty cost of about $54 million, or roughly 6
percent of total costs. Stigma represents another form of uncertainty, and while real, is
likely to be arbitraged away as the true uncertainty over project modifications becomes511
apparent.

Final Draft ReportEconomic Analysis of Critical Habitat Designation for California Gnatcatcher
February 24, 2004
22
CEQA Indirect Costs. This analysis evaluates the possibility that CHD might result in
additional costs to project applicants through lead agencies’ administration of CEQA. 516
CH may result in additional indirect costs if (1) lead agencies are compelled to require
additional habitat mitigation based on new information provided by the designation,
(2) the required level of CEQA review is elevated, or (3) applicants incur additional
expense to address CH in preparing CEQA documentation. Though in some cases CH
can result in one or more of these cost effects, this analysis concludes that none of these521
indirect effects is likely due to CHD for the gnatcatcher. Due to the presence of a
number of pre-existing regulations, public processes, and information sources that
address the gnatcatcher, it is not likely that this CHD will provide lead agencies with
new information, or compel them to change how they apply and enforce CEQA
regulations. 526
Effects on Small Businesses and Governments. As required by the Small Business
Regulatory Enforcement Fairness Act of 1996, this analysis evaluated the effects of the
proposed rule on small businesses and governments. The analysis concluded that
potentially affected entities would be limited to small businesses in the land531
development and real estate industry (SIC 6552) and small governments. The analysis
estimated that 1.1 percent of small businesses and 6 percent of small governments
would be affected annually. A comparison of annual per-business gross revenue
estimates with per-business section 7 costs determined that those small businesses
affected by the proposed designation would experience a reduction in annual revenues536
of approximately 1.5 percent. Affected small governments would experience effects
equal to approximately 0.02 percent of their gross annual revenue.
Effects on the Energy Industry. Following guidance from the OMB, this analysis
evaluated the effect of the proposed designation on the energy industry. The analysis541
screened all OMB criteria, and concluded that the only relevant consideration was
whether the proposed rule would result in an increase in energy distribution costs
greater than one percent. After comparing annualized section 7 costs with reported
annual distribution costs for the three major energy utilities in southern California, this
analysis concluded that the annual section 7 costs represent only 0.14 percent of annual 546
distribution costs. Because this is well below the one-percent significance threshold,

Final Draft ReportEconomic Analysis of Critical Habitat Designation for California Gnatcatcher
February 24, 2004
23
this analysis concludes the proposed designation would not have a significant effect on
the energy industry.
551
Unfunded Mandate Reform Act. UMRA guidance requires that a written statement be
prepared if annualized effects to either non-Federal (State/local/Tribal) governments or
the private sector exceed $100 million. This analysis estimates that average annual costs
for non-Federal governments will be approximately $7.9 million, and annual costs for
the private sector will be approximately $112 million. Because annual private sector556
costs were estimated to exceed $100 million, this analysis provides an evaluation of
relevant criteria to help the Service prepare a written statement; this analysis does not
provide an official written statement as required by UMRA. This analysis concludes
that the annual effect to the private sector represents approximately 0.008 percent of
National Gross Domestic Product (GDP), and less than 0.07 percent of total California561
Gross State Product (GSP) or California GSP for private industries. Consistent with
OMB screening criteria, the proposed rule is unlikely to result in a significant effect on
the national economy, or on a particular geographic region or economic sector.
Benefits. Potential benefits of the proposed CHD include improved ecosystem health566
and water quality, educational benefits, increased support for existing conservation
efforts and amenity/ open space-driven land and development value increases.
However, insufficient data is available to accurately monetize the ecological and
economic benefits of this CHD.
571
Key Assumptions
The following table presents the key assumptions of this economic analysis, as well as
the potential direction of the bias introduced by each assumption.
576

Final Draft ReportEconomic Analysis of Critical Habitat Designation for California Gnatcatcher
February 24, 2004
24
I. INTRODUCTION AND BACKGROUND
On April 24, 2003, the U.S. Fish and Wildlife Service (the Service) proposed designating
critical habitat (CH) for the coastal California gnatcatcher (Polioptila californica
californica), hereafter referred to as the gnatcatcher, on approximately 495,475 acres of581
land in Los Angeles, Orange, Riverside, San Bernardino, San Diego, and Ventura
counties, California. The purpose of this report is to identify and analyze the potential
economic effects that would result from this designation. This report was prepared by
Economic & Planning Systems, Inc. (EPS), under subcontract to Industrial Economics,
Inc., under contract to the Service's Division of Economics.586
Section 4(b)(2) of the Endangered Species Act (the Act) requires that the Service base
the designation of CH upon the best scientific and commercial data available, after
taking into consideration the economic impact and any other relevant impact of
specifying any particular area as CH. The Service may exclude areas from critical591
habitat designation (CHD) when the benefits of exclusion outweigh the benefits of
including the areas within CH, provided the exclusion will not result in extinction of
the species.
Upon the listing of a species, section 7(a)(2) of the Act requires Federal agencies to596
consult with the Service in order to ensure that activities they fund, authorize, permit,
or carry out are not likely to jeopardize the continued existence of the species. The
Service defines jeopardy as any action that would appreciably reduce the likelihood of
both the survival and recovery of the species. For designated CH, section 7(a)(2) also
requires Federal agencies to consult with the Service to ensure that activities they fund,601
authorize, permit, or carry out do not result in destruction or adverse modification of
CH. Adverse modification of CH is construed as any direct or indirect alteration that
appreciably diminishes the value of CH for conservation of a listed species.

Final Draft ReportEconomic Analysis of Critical Habitat Designation for California Gnatcatcher
February 24, 2004
5 U.S. Fish an d Wild life Service, Endangered and Threatened Wildlife and Plants; Designation of Critical Habitat
for the Coastal California Gnatcatcher (Polioptila californica californica) and Determination of Distinct Vertebrate
Population Segment for the California Gnatcatcher (Poliopt ila californica), Ap ril 24, 2003 (68 FR 20228).
25
SPECIES DESCRIPTION AND DISTRIBUTION606
A brief description of the gnatcatcher, is provided below. Refer to the proposed rule for
a more complete description of the species, its associated habitat types, and relevant
citations.5
The gnatcatcher is a long-tailed member of the old-world warbler and gnatcatcher611
family (Sylviidae) characterized by dark blue-gray plumage above and grayish white
below, mostly black tail, and distinctive white eye-ring. The male population is further
distinguished by a black cap, which is absent during the winter. The U.S. population of
the gnatcatcher is restricted to coastal southern California from Ventura and San
Bernardino counties to the north, to the U.S.-Mexico border to the south. The616
gnatcatcher typically occurs in or near sage scrub habitat, which is a broad category of
vegetation that includes various sage scrub communities. Refer to the proposed rule for
a detailed description of each type of sage scrub community.
PROPOSED CRITICAL HABITAT DESIGNATION
On March 30, 1993, the gnatcatcher was listed as a threatened species pursuant to the621
Act (58 FR 16742). When a species is listed as threatened or endangered, the Act
stipulates that the Service must also "to the maximum extent prudent and
determinable…designate critical habitat." On October 24, 2000, the Service published a
Final Rule designating approximately 514,000 acres as CH for the gnatcatcher (65 FR
63680). The Service prepared an economic analysis of the original CHD prior to626
publication of the Final Rule. As described in the Executive Summary, the assumptions
and methodology employed in this analysis differ significantly from those employed in
the original.
Final Draft ReportEconomic Analysis of Critical Habitat Designation for California Gnatcatcher
February 24, 2004
26
In response to a number of lawsuits filed subsequent to the designation and economic631
analysis, the Service requested a voluntary remand of the designation, which the U.S.
District Court for the Central District of California granted on June 11, 2002. The Court
ordered the Service to complete a new proposed rule by April 11, 2003, and held that
the designation should remain in place until a new, final regulation becomes effective.
636
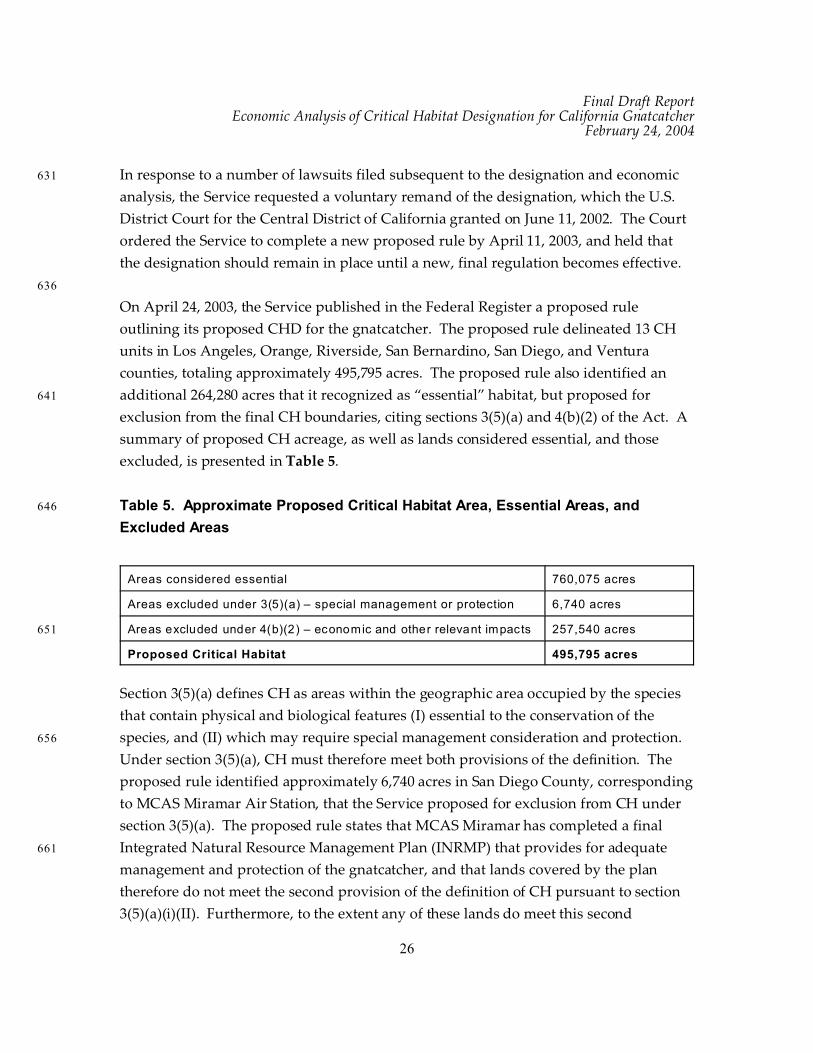
On April 24, 2003, the Service published in the Federal Register a proposed rule
outlining its proposed CHD for the gnatcatcher. The proposed rule delineated 13 CH
units in Los Angeles, Orange, Riverside, San Bernardino, San Diego, and Ventura
counties, totaling approximately 495,795 acres. The proposed rule also identified an
additional 264,280 acres that it recognized as “essential” habitat, but proposed for641
exclusion from the final CH boundaries, citing sections 3(5)(a) and 4(b)(2) of the Act. A
summary of proposed CH acreage, as well as lands considered essential, and those
excluded, is presented in Table 5.
Table 5. Approximate Proposed Critical Habitat Area, Essential Areas, and646
Excluded Areas
Areas considered essential 760,075 acres
Areas excluded under 3(5)(a) – special management or protection 6,740 acres
Areas excluded under 4(b)(2) – economic and other relevant impacts651 257,540 acres
Proposed Critical Habitat 495,795 acres
Section 3(5)(a) defines CH as areas within the geographic area occupied by the species
that contain physical and biological features (I) essential to the conservation of the
species, and (II) which may require special management consideration and protection. 656
Under section 3(5)(a), CH must therefore meet both provisions of the definition. The
proposed rule identified approximately 6,740 acres in San Diego County, corresponding
to MCAS Miramar Air Station, that the Service proposed for exclusion from CH under
section 3(5)(a). The proposed rule states that MCAS Miramar has completed a final
Integrated Natural Resource Management Plan (INRMP) that provides for adequate661
management and protection of the gnatcatcher, and that lands covered by the plan
therefore do not meet the second provision of the definition of CH pursuant to section
3(5)(a)(i)(II). Furthermore, to the extent any of these lands do meet this second

Final Draft ReportEconomic Analysis of Critical Habitat Designation for California Gnatcatcher
February 24, 2004
27
provision of the definition, the proposed rule states that it is additionally appropriate to
exclude these areas from CH pursuant to the “other relevant impacts” provisions of666
section 4(b)(2), as described below.
Section 4(b)(2) of the Act stipulates that CH shall be designated on the basis of the best
available scientific data after taking into consideration the economic impact, and any
other relevant impact, of specifying any particular area as CH. An area may be671
excluded from CH if it is determined that the benefits of exclusion outweigh the
benefits of specifying the area as CH. The proposed rule identified 257,540 total acres
that the Service proposes for exclusion based on a determination that the benefits of
exclusion outweigh the benefits of designating those areas as CH. Areas proposed for
exclusion include mission-essential training areas on Marine Corps Base Camp676
Pendleton, reserve lands in the San Diego Multiple Species Conservation Program
(MSCP) and the Orange County Central-Coastal NCCP/HCP, Tribal lands of the Pala
Band of Mission Indians, and lands covered by individual completed and approved
HCPs that address the gnatcatcher.
681
The primary focus of this document is to evaluate and report the likely economic impact
of the proposed CHD, which in this case is limited to the 13 proposed CH units
described below. However, to ensure that the Service is able to fully consider the
economic and any other relevant impacts in deciding to exclude certain biologically
essential areas under section 4(b)(2), this analysis will also evaluate the likely economic686
impact were CH to be designated for areas currently proposed for exclusion in the
proposed rule.
PROPOSED CRITICAL HABITAT UNITS691
Section 3 (5)(a) of the Act defines CH as "the specific areas within the geographic area
occupied by a species…on which are found those physical or biological features…
essential to the conservation of the species and…specific areas outside the geographic
area occupied by a species…upon a determination that such areas are essential for the
conservation of the species." In order to delineate potential CH boundaries, the Service696
must first use the "best available scientific information" to identify those physical and

Final Draft ReportEconomic Analysis of Critical Habitat Designation for California Gnatcatcher
February 24, 2004
28
biological features — or primary constituent elements (PCEs) — that are essential to the
conservation of the species. PCEs for the gnatcatcher include various types of sage
scrub communities as discussed above. The Service used PCEs, distribution and
occurrence data, and occurrence ranking criteria to delineate habitat areas essential for701
the conservation of the species. A more complete discussion of gnatcatcher
occurrences, land ownership within each unit, specific PCEs, and factors considered in
delineating CH can be found in the proposed rule.
Each of the 13 proposed CH units is described briefly below. Table 6 also summarizes706
the approximate area of proposed CH by county and land ownership. Refer to the
proposed rule for a more complete description of each unit.
• Unit 1 encompasses approximately 25,100 acres of land within the MSCP
planning area. The proposed unit contains lands essential to the conservation of711
the gnatcatcher within the cities of Chula Vista, El Cajon, and Santee; major
amendment areas within the San Diego County subarea plan; the Otay-
Sweetwater Unit of the San Diego National Wildlife Refuge Complex; and water
district lands owned by Sweetwater Authority and Otay Water District. This unit
contains core populations of the species, sage scrub and areas providing716
connectivity between core populations and sage scrub.
• Unit 2 encompasses approximately 16,075 acres in the upper San Diego River
drainage. This unit also contains a core population of the species, and includes
lands that serve as a corridor connecting the adjacent core population on721
Cleveland National Forest lands to populations located in Unit 1.
• Unit 3 encompasses approximately 32,465 acres of land within the North San
Diego County MHCP planning area in northwestern San Diego County.
Included are lands within the cities of Carlsbad, Encinitas, Escondido, Oceanside,726
San Marcos, Solana Beach, and Vista. This unit provides connectivity among core
populations in Units 1, 5 and 6.

Final Draft ReportEconomic Analysis of Critical Habitat Designation for California Gnatcatcher
February 24, 2004
29
Table 6. Proposed Critical Habitat Acreage by County and Land Ownership731
County Federal* Local/State Private Total
Los Angeles 6,825 acres 2,010 acres 68,900 acres 77,735 acres
Orange 1,045 acres 4,535 acres 48,580 acres 54,160 acres
Riverside736 10,740 acres 8,740 acres 150,465 acres 169,945 acres
San Bernardino 830 acres 1,590 acres 20,890 acres 23,310 acres
San Diego 25,940 acres 1,755 acres 97,110 acres 124,805 acres
Ventura 0 0 45,840 acres 45,840 acres
Total 45,380 acres 18,630 acres 431,785 acres 495,795 acres
*Federa l lands include Bureau of Land Managem ent, Department of Defense, National Forest,741
Tribal, and Fish and W ildlife Service lands.
• Unit 4 encompasses approximately 8,690 acres of land on Fallbrook Naval
Weapons Station in northern San Diego County. This unit contains core
gnatcatcher population supporting adjacent populations in Units 5, 6, and 10.746
The northern boundary of this unit also functions as an essential linkage
connecting coastal populations with inland populations in San Diego and
Riverside counties.
• Unit 5 encompasses approximately 34,705 acres of land within the planning area751
for the North County Subarea of the MSCP for San Diego County. This unit
contains several gnatcatcher populations and intervening linkage areas of sage
scrub. This unit constitutes the primary inland linkage along the I-15 corridor
between San Diego populations and those in southwestern Riverside County
(Unit 10).756
• Unit 6 encompasses approximately 44,340 acres of land within the planning area
for the Southern NCCP Subregion of Orange County. This unit contains some of
the largest, most robust populations known, as well as essential regional
populations. This unit also provides primary linkage for core populations in761
Units 3, 4, and 7. Proposed CH in Camp Pendleton is limited to lands outside
training area boundaries, and includes a coastal corridor linking populations in

Final Draft ReportEconomic Analysis of Critical Habitat Designation for California Gnatcatcher
February 24, 2004
30
San Diego and southern Orange counties, Wire Mountain and De Luz housing
areas, and State Park lease lands (San Onofre State Beach).
766
• Unit 7 encompasses approximately 5,775 acres of land within the Orange County
Central/Coastal NCCP planning area. This unit includes core gnatcatcher
populations and sage scrub habitat within select Existing Use Areas (EUAs),
portions of the Irving Ranch Land Reserve, and the designated reserve
(panhandle portion) of the El Toro Reuse Area.771
• Unit 8 encompasses approximately 7,160 acres of land within and adjacent to
the subregional planning area for the Palos Verdes Peninsula in Los Angeles
County, including the City of Rancho Palos Verdes MSHCP area. This unit also
includes a core population of gnatcatcher and essential sage scrub habitat.776
• Unit 9 encompasses approximately 22,595 acres of land in East Los Angeles
County. The unit contains core populations and also provides primary
connectivity between core gnatcatcher populations and sage scrub habitat in
Units 7, 10, and 12.781
• Unit 10 encompasses approximately 176,720 acres within the proposed planning
area for the Western Riverside County MSHCP. These areas include core
populations and CSS habitat that provides connectivity between core
populations within Riverside County and to populations in San Diego, San786
Bernardino, Orange, and Los Angeles counties. Lands proposed as CH within
Unit 10 are generally encompassed by the proposed Criteria Area (from which
the future preserve area will be delineated), designated as part of the ongoing
MSHCP process.
791
• Unit 11 encompasses approximately 14,990 acres of land along the foothills of
the San Gabriel Mountains in San Bernardino County. This unit contains
populations that persist in complex habitat assemblages not found in other
proposed Units.
796

Final Draft ReportEconomic Analysis of Critical Habitat Designation for California Gnatcatcher
February 24, 2004
6 This analysis considers the effects of the regulatory action as proposed in the Federal Register on
April 24, 2003 (68 Federal Register 20228, April 24, 2003).
7 16 U.S.C. § 1533(b)(2).
8 Executive Order 12866, “Regulatory Planning and Review,” September 30, 1993; Executive Order
13211, “Actions Concerning Regulations That Significantly Affect Energy Supply, Distribution, orUse," May 18, 2001; 5 U.S.C. §§ 601 et seq; and Pub Law No. 104-121; and 2 U.S.C. §§658-658g and1501-1571.
31
• Unit 12 encompasses approximately 3,890 acres of land in eastern Los Angeles
County. This unit functions as an archipelago of persistent populations toward
the northern end of the range of the species, and is a likely source population for
the pairs that are reported from the foothills of the San Gabriel mountains north
of the Los Angeles basin.801
• Unit 13 encompasses approximately 103,290 acres of land in eastern Ventura and
western Los Angeles counties. It includes the only known breeding population
of the gnatcatcher in Ventura County, and constitutes the northern and western
distributional extreme of its current range.806
FRAMEWORK FOR THE ANALYSIS
The primary purpose of this analysis is to estimate the economic impact that will result
from the designation of CH for the gnatcatcher.6 This information is intended to assist811
the Secretary in making decisions about whether the benefits of excluding particular
areas from the designation outweigh the benefits of including those areas in the
designation.7 In addition, this information allows the Service to address the
requirements of Executive Orders 12866 and 13211, the Regulatory Flexibility Act
(RFA), as amended by the Small Business Regulatory Enforcement Fairness Act816
(SBREFA), and the UMRA.8
This chapter provides the framework for this analysis. First, it defines the economic
effects considered in the analysis. Second, it establishes the baseline against which
these effects are measured. Third, it describes the measurement of direct compliance821
costs, which include costs associated with, and generated as a result of, section 7
consultations. Fourth, it identifies potential indirect economic effects of the rule

Final Draft ReportEconomic Analysis of Critical Habitat Designation for California Gnatcatcher
February 24, 2004
32
resulting from (1) compliance with other parts of the Act potentially triggered by CH,
(2) compliance with other laws, and (3) time delays and regulatory uncertainty. Fifth, it
discusses the need for an economic assessment of the benefits of CHD. Finally, the826
section concludes by discussing the time frame for the analysis and the general steps
followed in the analysis.
Types of Economic Effects Considered
831
This economic analysis considers both the economic efficiency and distributional effects
that may result from the designation. In the case of CHD, economic efficiency effects
generally reflect the “opportunity costs” associated with the commitment of resources
required to comply with the Act. For example, if the activities that can take place on a
parcel of private land are limited as a result of a designation, and thus the market value836
of the land reduced, this reduction in value represents one measure of opportunity cost
or change in economic efficiency. Similarly, the costs incurred by a Federal action
agency to consult with the Service under section 7 represent opportunity costs of the
designation.
841
This analysis also addresses how the impacts of the designation are distributed,
including an assessment of any local or regional economic impacts of the designation
and the potential effects of the designation on small entities, the energy industry, or
governments. This information can be used by decision-makers to assess whether the
effects of the designation might unduly burden a particular group or economic sector.846
For example, while the designation may have a relatively small impact when measured
in terms of changes in economic efficiency, individuals employed in a particular sector
of the economy in the geographic area of the designation may experience relatively
greater effects. The difference between economic efficiency effects and distributional851
effects, as well as their application in this analysis, are discussed in greater detail below.
856

Final Draft ReportEconomic Analysis of Critical Habitat Designation for California Gnatcatcher
February 24, 2004
9 Executive Order 12866, “Regulatory Planning and Review,” September 30, 1993; U.S. Office of
Management and Budget, “Draft 2003 Report to Congress on the Costs and Benefits of FederalRegulations; Notice,” 68 Federal Register 5492, February 3, 2003; and U.S. Office of Management andBudget, “Appendix 4: Guidelines to Standardize Measure of Costs and Benefits and the Format ofAccounting Statements,” in Report to Congress on the Costs and Benefits of Federal Regulations, March 22,2000.
10 For additional information on the definition of “surplus” and an explanation of consumer and
producer surplus in the context of regulatory analysis, see Gramlich, Edward M ., A Guide toBenefit-Cost Analysis (2nd Ed.), Prospect Heights, Illinois: Waveland Press, Inc., 1990; and U.S.Environmental Protection Agency, Guidelines for Preparing Econom ic Analyses, EPA 240-R-00-003,Septem ber 2000, available at http://yosemite.epa.gov/ee/epa/eed .nsf/ webpages/Guidelines.html.
33
Efficiency Effects
At the guidance of the Office of Management and Budget (OMB) and in compliance
with Executive Order 12866 “Regulatory Planning and Review,” Federal agencies861
measure changes in economic efficiency in order to understand how society, as a whole,
will be affected by a regulatory action.9 In the context of this regulatory action, these
efficiency effects represent the opportunity cost of resources used or benefits foregone
by society as a result of CHD. Economists generally characterize opportunity costs in
terms of changes in producer and consumer surpluses in affected markets.10866
In some instances, compliance costs may provide a reasonable approximation for the
efficiency effects associated with a regulatory action. For example, a landowner or
manager may need to enter into a consultation with the Service to ensure that a
particular activity will not adversely modify CH. The effort required for the871
consultation represents an economic opportunity cost, because the landowner or
manager’s time and effort would have been spent in an alternative activity had the
parcel not been included in the designation. When compliance activity is not expected
to significantly affect markets -- that is, not result in a shift in the quantity of a good or
service provided at a given price, or in the quantity of a good or service demanded876
given a change in price -- the measurement of compliance costs can provide a
reasonable estimate of the change in economic efficiency.
Where a designation is expected to significantly impact a market, it may be necessary to
estimate changes in producer and consumer surpluses. For example, a designation that881
precludes the development of large areas of land may shift the price and quantity of

Final Draft ReportEconomic Analysis of Critical Habitat Designation for California Gnatcatcher
February 24, 2004
11 Office of Management and Budget, “Draft 2003 Report to Congress on the Costs and Benefits of
Federal Regulations; Notice” 68 Federal Register 5492, February 3, 2003.
12 5 U.S.C. § 601 et seq.
34
housing supplied in a region. In this case, changes in economic efficiency can be
measured by considering changes in producer and consumer surplus in the real estate
market.
886
This analysis begins by measuring reasonably foreseeable compliance costs resulting
from the designation. As noted above, in some cases, compliance costs can provide a
reasonable estimate of changes in economic efficiency. However, if the designation is
expected to significantly impact markets, the analysis will consider potential changes in
consumer and/or producer surplus in affected markets.891
Distributional and Regional Economic Effects
Measurements of changes in economic efficiency focus on the net impact of the
regulation, without consideration for how certain economic sectors or groups of people896
are affected. Thus, a discussion of efficiency effects alone may miss important
distributional considerations concerning groups that may be disproportionately
affected. OMB encourages Federal agencies to consider distributional effects separately
from efficiency effects.11 This analysis considers several types of distributional effects,
including impacts on small entities; impacts on energy supply distribution and use;901
impacts on governments; and regional economic impacts. It is important to note that
these are fundamentally different measures of economic impact than efficiency effects,
and thus cannot be added to or compared with estimates of changes in economic
efficiency.
906
Impacts on Small Entities, Energy Supply, Distribution and Use, and Governments
This analysis considers how small entities, including small businesses, organizations,
and governments, as defined by the RFA, might be affected by CHD.12 In addition, in
response to Executive Order 13211 “Actions Concerning Regulations That Significantly911

Final Draft ReportEconomic Analysis of Critical Habitat Designation for California Gnatcatcher
February 24, 2004
13 Executive Order 13211, “Actions Concerning Regulations That Significantly Affect Energy Supply,
Distribution, or Use,” May 18, 2001.
14 2 U.S.C. §§658-658g and 1501-1571.
35
Affect Energy Supply, Distribution, or Use,” this analysis considers the impacts of CH
on the energy industry and its customers.13 Finally, in accordance with UMRA, this
analysis considers the effects of the regulatory action on State, local, and tribal
governments and the private sector.14
916
Regional Economic Effects
Regional economic impact analysis provides an assessment of the potential localized
effects of CHD. Specifically, regional economic impact analysis produces a quantitative
estimate of the potential magnitude of the initial change in the regional economy921
resulting from a regulatory action. Regional economic impacts are commonly measured
using regional input/output models. These models rely on multipliers that
mathematically represent the relationship between a change in one sector of the
economy (e.g., hydroelectric power generation) and the effect of that change on
economic output, income, or employment in other local industries (e.g., manufacturers926
relying on the electricity generated). These economic data provide a quantitative
estimate of the magnitude of shifts of jobs and revenues in the local economy.
The use of regional input/output models in an analysis of the impacts of CH can
overstate the long-term impacts of a regulatory change. Most importantly, these931
models provide a static view of the economy of a region. That is, they measure the
initial impact of a regulatory change on an economy but do not consider long-term
adjustments that the economy will make in response to this change. For example, these
models provide estimates of the number of jobs lost as a result of a regulatory change,
but do not consider re-employment of these individuals over time. In addition, the flow936
of goods and services across the regional boundaries defined in the model may change
as a result of the designation, compensating for a potential decrease in economic
activity within the region.
941

Final Draft ReportEconomic Analysis of Critical Habitat Designation for California Gnatcatcher
February 24, 2004
15 U.S. Office of Management and “Draft 2003 Report to Congress on the Costs and Benefits of
Federal Regulations; Notice,” 68 Federal Register 5492, February 3, 2003; and U.S. Office ofManagement and Budget, “Appendix 4: Guidelines to Standardize Measure of Costs and Benefits andthe Format of Accounting Statements,” in Report to Congress on the Costs and Benefits of FederalRegulations, March 22, 2000.
16An evaluation of every local land use regulation that could potentially address development of
gnatcatcher habitat was beyond the scope of available resources for this analysis. This analysisconsidered only those local land use regulations that were specifically identified by the Service. Inomitting potential local regulations that may in fact constitute a regulatory baseline, this analysis ismore likely to overestimate than underestimate the actual cost of the proposed designation.
17 Certain regulations that provide baseline protection for the species and its habitat may also be the
source of indirect costs resulting from new information provided by the designation.
36
Despite these and other limitations, in certain circumstances, regional economic impact
analysis may provide useful information about the scale and scope of localized impacts.
It is important to remember that measures of regional economic effects generally reflect
shifts in resource use rather than efficiency losses. These types of distributional effects,
therefore, should be reported separately from efficiency effects (i.e., not summed). In946
addition, measures of regional economic impact cannot be compared with estimates of
efficiency effects.
Defining the Baseline
951
OMB guidelines for conducting economic analysis of environmental regulation direct
Federal agencies to measure the costs of a regulatory action against a baseline.15 In its
guidance, OMB states, the "baseline should be the best assessment of the way the world
would look absent the proposed action" (i.e., absent the designation of CH). In other
words, the baseline includes the currently existing regulatory and socio-economic956
burden imposed on landowners and managers potentially affected by the designation
of CH. The baseline burden may include, for example:
• Local zoning laws16;
• State natural resource laws; 961
• Enforceable management plans and best management practices applied by other
State and Federal agencies;
• Federal, State, and local protections already in place in the same geographic area
for other (Federal and State) listed species;17 and/or

Final Draft ReportEconomic Analysis of Critical Habitat Designation for California Gnatcatcher
February 24, 2004
37
• Statutory protections provided for the species by the Act that exist in the966
absence of designated CH.
This analysis also assumes that any costs already incurred or agreed upon as a result of
the original CHD in October 2000 are part of the baseline. Existing baseline laws,
regulations, and policies are described in greater detail in Chapter II of this analysis. 971
This analysis describes impacts that are expected to occur above and beyond the
baseline. In other words, it measures the costs of compliance with the Act that would
not occur in the absence of the currently proposed CH. Importantly, economic impacts
associated with sections 9 and 10 of the Act, with a few exceptions, are considered to be976
part of the regulatory baseline and thus are not addressed in this report. These costs are
considered to be part of the baseline, because they remain unaffected by the designation
of CH.
Direct Compliance Costs Associated With Section 7 of the Act981
The measurement of direct compliance costs focuses on the implementation of section 7
of the Act. This section requires Federal agencies to consult with the Service to ensure
that any action authorized, funded, or carried out will not likely jeopardize the
continued existence of any endangered or threatened species or result in the destruction986
or adverse modification of CH. The administrative costs of these consultations, along
with the costs of project modifications resulting from these consultations, represent the
direct compliance costs of designating CH.
This analysis does not differentiate between consultations that result from the listing of991
the species (i.e., the jeopardy standard) and consultations that result from the presence
of CH (i.e., the adverse modification standard). Consultations resulting from the listing
of the species, or project modifications meant specifically to protect to the species as
opposed to its habitat, may occur even in the absence of CH. However, in 2001, the U.S.
10th Circuit Court of Appeals instructed the Service to conduct a full analysis of all of996
the economic impacts of CHD, regardless of whether those impacts are attributable

Final Draft ReportEconomic Analysis of Critical Habitat Designation for California Gnatcatcher
February 24, 2004
18 New Mexico Cattle Growers Ass'n v. U.S.F.W.S., 248 F.3d 1277 (10th Cir. 2001).
38
co-extensively to other causes.18 Given the similarity in regulatory definitions between
the terms “jeopardy” and “adverse modification,” in practice it can be difficult to
pre-determine the standard that drives a section 7 consultation. Consequently, in an
effort to ensure that this economic analysis complies with the instructions of the 10th1001
Circuit as well as to ensure that no costs of the proposed designation are omitted, the
potential effects associated with all section 7 impacts in or near proposed CH are fully
considered. In doing so, the analysis ensures that any critical habitat impacts that are
co-extensive with the listing of the species are not overlooked. As a result, this analysis
likely overstates the regulatory effects under section 7 attributable to the proposed1006
designation of critical habitat.
Indirect Costs
The designation may, under certain circumstances, affect actions that do not have a1011
Federal nexus and thus are not subject to the provisions of section 7 under the Act. The
potential exists for several types of such indirect effects: three examples are discussed in
this section. First, some landowners may voluntarily elect to complete a habitat
conservation plan (HCP) in response to having their land designated as critical habitat.
Second, some State laws may require landowners and managers to consider the effects1016
of their actions on sensitive species and habitat. Thus, designation of critical habitat
could trigger additional regulatory burden due to new information provided by the
designation. Third, the consultation process may result in time delays for upcoming or
ongoing projects, and the designation may foster regulatory uncertainty for prospective
projects. If such additional efforts would not have occurred in the absence of critical1021
habitat (i.e., “but for” critical habitat), then they are considered by this analysis to be an
impact of the designation. The three most common categories of indirect effects are
discussed further below.
1026

Final Draft ReportEconomic Analysis of Critical Habitat Designation for California Gnatcatcher
February 24, 2004
19 U.S. Fish and Wildlife Service, “Endangered Species and Habitat Conservation Planning.”
From: http://endangered.fws.gov/hcp/, as viewed on August 6, 2002. Sections 9 and 10 of the Actdo not apply to plants.20
See Industrial Economics, Incorporated, Draft Econom ic Analysis of CHD for the Nine Bexar CountyTexas Invertebrate Species, prepared for the U.S. Fish and Wildlife Service, October 2002.
39
CREATION OF HABITAT CONSERVATION PLANS
Under section 10(a)(1)(B) of the Act, a non-Federal entity (i.e., a landowner or local
government) may develop an HCP for an endangered animal species in order to meet1031
the conditions for issuance of an incidental take permit in connection with the
development and management of a property.19 The HCP intends to counterbalance
potential harmful effects that a proposed activity may have on a species, while allowing
the otherwise lawful activity to proceed. As such, the purpose of the habitat
conservation planning process is to ensure that the effects of incidental take are1036
adequately minimized and mitigated. Thus, HCPs are developed to ensure compliance
with section 9 of the Act and to meet the requirements of section 10 of the Act. HCPs
are not necessarily precipitated by a CHD.
However, a connection may exist between the creation of HCPs and the costs these1041
plans impose and CHD. The Service, being a Federal entity, must formally consider
whether an HCP will jeopardize a listed species or adversely modify its designated
critical habitat before approving the plan. This review process may be a direct impact
under section 7 of the Act. However, in certain circumstances, the effort involved in
creating the HCP and associated conservation actions may also generate indirect effects1046
associated with CHD. For example, in one past instance, landowners preemptively
developed HCPs in an effort to avoid having their property designated as critical
habitat.20 In this case, the effort involved in creating the HCP and undertaking
associated conservation actions were considered to be an effect of designation.
1051
The following scenarios regarding HCP creation provide general guidance regarding
the degree to which associated costs should be considered within the context of a
critical habitat economic analysis:
• In cases in which an HCP existed prior to a proposed designation, the costs of1056
developing the HCP and the added costs of management imposed by the HCP

Final Draft ReportEconomic Analysis of Critical Habitat Designation for California Gnatcatcher
February 24, 2004
21 Project modification costs associated with the jeopardy standard are not considered for the
following reason. Section 10(a)(2)(B) of the Act requires that for the issuance of an incidental takepermit, the HCP m ust assure that “the taking will not appreciably reduce the likelihood of survivaland recovery of the species in the wild.” A ccording to the Service’s Habitat Conservation Planning andIncidental Take Permit Processing Handbook, “the wording of this criterion is identical to the “jeopardy”definition under the section 7 regulations (50 CFR Part 402.02)...Congress was explicit about this link,stating in the Conference Report on the 1982 ESA amendments that the Services will determinewhether or not to grant a permit, “in part, by using the same standard as found in section 7(a)(2) ofthe ESA, as defined by the [Services’] regulations.’” (U.S. Department of the Interior and U.S.Department of Comm erce, Habitat Conservation Planning and Incidental Take Permit ProcessingHandbook, November 4, 1996). As a result, during the HCP process, actions undertaken to meet thejeopardy provision of section 7 are also required under section 10 of the Act and are thereforeconsidered to be part of the baseline of this economic analysis.
40
should not be considered in the analysis of the effects of the designation. These
costs are appropriately considered to be part of the regulatory baseline, because
their creation was driven by the listing of the species and the need to avoid
“take,” which is prohibited under section 9 of the Act. However, in cases where1061
designated critical habitat overlaps with completed HCPs, the economic analysis
will need to consider the cost to the Service to re-consult on the plan’s impact to
critical habitat and whether or not this process may result in additional
conservation actions.
1066
• In cases in which an HCP is proposed, or reasonably foreseeable absent CHD,
the administrative costs associated with the required internal section 7
consultation should be included in the economic analysis of total section 7 costs,
because the Service will need to consider the effects of the plan on designated
critical habitat. In addition, if, as a result of the designation, additional project1071
modifications will be recommended by the Service and incorporated into the
HCP in order to avoid adversely modifying critical habitat, the costs of these
project modifications should also be included in the economic analysis of critical
habitat.21
1076
• In cases in which development of one or more HCPs can be documented as
being precipitated by CHD (i.e., to avoid designation or to reduce the costs of
the designation), the costs of development of the HCP and the added costs of

Final Draft ReportEconomic Analysis of Critical Habitat Designation for California Gnatcatcher
February 24, 2004
22 Article 19 of CEQA provides a list of categorical exemptions, which are descriptions of types of
projects that usually do not have a significant effect on the environment (e.g., replacement orreconstruction of existing facili ties, actions taken by regulatory agencies as authorized by Statelaw or local ordinance to assure the maintenance, restoration, or enhancement of a naturalresource.) (http://ceres.ca.gov/ceqa/flowchart/exemptions/ categorical.html, as viewed on April21, 2003 .)
41
management imposed by the HCP should be included in the critical habitat
economic analysis. In such cases the analysis should be presented with1081
appropriate caveats as to the uncertainty regarding the extent to which the HCP
would have existed absent CHD.
OTHER STATE AND LOCAL LAWS
Under certain circumstances, CHD may provide new information to a community about1086
the sensitive ecological nature of a geographic region, potentially triggering additional
economic impacts under other State or local laws. In cases where these costs would not
have been triggered “but for” CHD, they are included in this economic analysis.
For example, CEQA requires that lead agencies -- public agencies responsible for project1091
approval -- consider the environmental effects of proposed projects that are considered
discretionary in nature and not categorically or statutorily exempt. Among other
effects, the CEQA statutes specifically require lead agencies to consider a project’s
effects on rare or endangered plant and animal communities. To approve qualifying
projects, lead agencies must require applicants, who are not “categorically exempt,” to1096
mitigate effects to less than significant levels for projects that are not granted a
“statement of overriding considerations.”22
In some instances, CHD can have an indirect effect on CEQA- related requirements.
This is most likely to occur in areas where the Federal designation provides clearer1101
information on the importance of particular areas as habitat for a listed species. In
addition, applicants who were “categorically exempt” from preparing an
Environmental Impact Report under CEQA may no longer be exempt once critical

Final Draft ReportEconomic Analysis of Critical Habitat Designation for California Gnatcatcher
February 24, 2004
42
habitat is designated. In cases where the designation triggers the CEQA significance
test or results in a reduction of categorically exempt activities, associated costs are1106
considered to be an indirect effect of the designation.
In these and other cases in which costs are incurred by landowners and managers
above and beyond what would be required under State or local law and policy in the
absence of the designation, these costs are considered to be an indirect effect of the1111
designation. As such, these economic effects are reported in the analysis.
TIME DELAYS AND REGULATORY UNCERTAINTY
In addition to the indirect effects of compliance with other laws triggered by the
designation, project proponents, land managers and landowners may face additional1116
indirect impacts. These can include costs due to project delays associated with the
consultation process or compliance with other regulations, or, in the case of land
location within or adjacent to the designation, loss in property values due to regulatory
uncertainty, and loss (or gain) in property values resulting from public perceptions
regarding the effects of critical habitat. These categories of potential effects are1121
described in greater detail below.
Time Delays
Both public and private entities may experience incremental time delays for projects1126
and other activities due to requirements associated with the section 7 consultation
process and/or compliance with other laws triggered by the designation. The need to
conduct a section 7 consultation will not necessarily delay a project, as often the
consultation may be coordinated with the existing baseline regulatory approval process.
However, depending on the schedule of the consultation, a project may experience1131
additional delays, resulting in an unanticipated extension in the time needed to fully
realize returns from the planned activity. To the extent that delays result from the
designation, they are considered in the analysis. Specifically, the analysis considers
costs associated with any incremental time delays associated with section 7 consultation
or other requirements triggered by the designation above and beyond project delays1136
resulting from baseline regulatory processes.

Final Draft ReportEconomic Analysis of Critical Habitat Designation for California Gnatcatcher
February 24, 2004
23 Designated critical habitat may also reduce such costs in the sense that boundaries are legally
defined in the rule, which in some cases, clarifies the importance of specific land parcels.
43
Regulatory Uncertainty
The Service conducts each section 7 consultation on a case-by-case basis and issues a BO
on formal consultations based on species-specific and site-specific information. As a1141
result, government agencies and affiliated private parties who need to consult with the
Service under section 7 may face uncertainty concerning whether project modifications
will be recommended by the Service and what the nature of these modifications will be.
This uncertainty may diminish as consultations are completed and additional
information becomes available on the effects of critical habitat on specific activities. 1146
However, a degree of regulatory uncertainty may persist. In some cases, this
uncertainty may be incorporated by the project proponent into the costs of completing a
proposed activity. For example, mining companies uncertain about potential
restrictions to their activities in designated areas of critical habitat may lease mining
rights at a reduced rate. Additionally, landowners may incur costs determining1151
whether their property constitutes critical habitat.23 They may retain outside experts or
legal counsel to better understand their responsibilities with regard to critical habitat.
Where appropriate, the analysis considers the potential costs associated with regulatory
uncertainty.
1156
Stigma
In some cases, the public may perceive that CHD may result in incremental changes to
private property values, above and beyond those associated with anticipated project
modifications and regulatory uncertainty described above. That is, the public may1161
perceive that, all else being equal, a property that is designated as critical habitat will
have lower market value than an identical property that is not within the boundaries of
critical habitat. Public attitudes about the limits and costs that critical habitat may
impose can cause real economic effects to the owners of property, regardless of whether
such limits are actually imposed.1166

Final Draft ReportEconomic Analysis of Critical Habitat Designation for California Gnatcatcher
February 24, 2004
24 Executive Order 12866, “Regulatory Planning and Review,” September 30, 1993.
25 U.S. Office of Management and Budget, “Draft 2003 Report to Congress on the Costs and
Benefits of Federal Regulations; Notice,” 68 Federal Register 5492, February 3, 2003; and U.S. Officeof Management and Budget, “Appendix 4: Guidelines to Standardize Measure of Costs andBenefits and the Format of Accounting Statements,” in Report to Congress on the Costs and Benefitsof Federal Regulations, March 22, 2000.
44
Conversely, the direction of property value effects resulting from critical habitat may be
positive rather than negative. For example, property owners may believe that CHD will
increase property values, if they believe that such designation will slow sprawling
development in a given community (i.e., protect the rural character of an area) o1171
increase water quality of neighborhood streams and rivers. This perception alone may
result in real increases in land values, even in cases where the economic analysis
predicts no additional requirements on activities taking place in the area. In either case,
as the public becomes aware of the true regulatory burden imposed by critical habitat,
the impact of the designation on property markets should decrease. This analysis1176
considers the implications of public perceptions related to critical habitat on private
property values within the proposed designation.
Benefits
1181
The published economics literature has documented that real social welfare benefits can
result from the conservation and recovery of endangered and threatened species. Such
benefits have also been ascribed to preservation of open space and biodiversity, both of
which are associated with species conservation. Likewise, regional economies and
communities can benefit from the preservation of healthy populations of endangered1186
and threatened species, and the habitat on which these species depend. Finally, in some
cases the preservation of open space may result in increased property values, either to
on-site or adjacent parcels, due to the amenity value associated with owning property
next to permanently protected open space.
1191
In Executive Order 12866, OMB directs Federal agencies to provide an assessment of
costs and benefits of a proposed regulatory action.24 However, in its guidance for
implementing Executive Order 12866, OMB acknowledges that often, it may not be
feasible to monetize, or even quantify, the benefits of environmental regulations.25

Final Draft ReportEconomic Analysis of Critical Habitat Designation for California Gnatcatcher
February 24, 2004
45
Where benefits cannot be quantified, OMB directs agencies to describe the benefits of a1196
proposed regulation qualitatively. This report provides insight into the potential
economic benefits of CHD based on information obtained in the course of developing
the economic analysis. It is not intended to provide a complete analysis of all of the
benefits that could result from the designation. Given these limitations, the Service believes
that the benefits of CHD are best expressed in biological terms that can be weighed against the1201
expected cost impacts of the rulemaking.
Analytic Time Frame
The analysis examines activities taking place both within and adjacent to the proposed1206
designation. It estimates impacts based on activities that are “reasonably foreseeable,"
including, but not limited to, activities that are currently authorized, permitted, or
funded, or for which proposed plans are currently available to the public. Accordingly,
the analysis bases estimates on activities that are likely to occur through the year 2025,
beginning on the day that the current proposed rule becomes available to the public. 1211
As discussed in Chapter III, official regional demographic projections for the majority
of counties included in the proposed designation are available only through 2025.
Because EPS did not have adequate data to provide reliable forecasts beyond 2025 for
the majority of the proposed designation, this timeframe was deemed the most
appropriate for the analysis. 1216
General Analytic Steps
This report relies on a sequential methodology and focuses on distilling the salient and
relevant aspects of potential economic impacts of the proposed designation. The steps1221
followed in this analysis consist of:
• Describing current and projected economic activity within and around the
proposed critical habitat area;
1226
• Identifying whether such activities are likely to involve a Federal nexus;

Final Draft ReportEconomic Analysis of Critical Habitat Designation for California Gnatcatcher
February 24, 2004
46
• For activities with a Federal nexus, evaluating the likelihood that these activities
will require consultations under section 7 of the Act and, in turn, result in any
modifications to projects;1231
• Estimating the direct costs of expected section 7 consultations, project
modifications and other economic impacts associated with the designation;
• Estimating the likelihood that current or future activities may require additional1236
compliance with other Federal, State, and local laws as a result of new
information provided by the proposed designation;
• Estimating the likelihood that projects will be delayed by the consultation
process or other regulatory requirements triggered by the designation;1241
• Estimating the likelihood that economic activity will be affected by regulatory
uncertainty, and/or property values affected;
• Estimating the indirect costs of the designation, as reflected in the cost of1246
compliance with State and local laws, project delays, regulatory uncertainty, and
effects on property values;
• Assessing the extent to which CHD will create costs for small businesses as a
result of modifications or delays to projects; 1251
• Assessing the effects of administrative costs and project modifications on the
supply, distribution, and use of energy; and
• Determining the benefits that may be associated with CHD.1256

Final Draft ReportEconomic Analysis of Critical Habitat Designation for California Gnatcatcher
February 24, 2004
47
As noted above, this analysis considers both the efficiency effects and distributional
effects that could result from this designation. It begins by considering direct
compliance costs associated with the designation, as well as potential indirect effects,
such as those effects associated with compliance with other Federal, State, and local1261
laws, project delays, and impacts to property values. As necessary, regional economic
impacts are described, as are impacts on significantly affected markets. Impacts on
small entities and energy production and consumption are discussed separately, in
Chapter VII. Potential benefits of critical habitat are discussed qualitatively, in Chapter
VIII.1266
REFERENCES
Publications
1271
CEQA, Article 19. http://ceres.ca.gov/ceqa/flowchart/exemptions/ categorical.html, as
viewed on April 21, 2003.
Gramlich, Edward M., A Guide to Benefit-Cost Analysis (2nd Ed.), Prospect Heights,
Illinois: Waveland Press, Inc., 1990.1276
Industrial Economics, Incorporated, Draft Economic Analysis of Critical Habitat
Designation for the Nine Bexar County Texas Invertebrate Species, prepared for the
U.S. Fish and Wildlife Service, October 2002.
1281
U.S. Department of the Interior and U.S. Department of Commerce, Habitat Conservation
Planning and Incidental Take Permit Processing Handbook, November 4, 1996.
U.S. Environmental Protection Agency, Guidelines for Preparing Economic Analyses, EPA
240-R-00-003, September 2000.1286
U.S. Fish and Wildlife Service, “Endangered Species and Habitat Conservation
Planning.” From: http://endangered.fws.gov/hcp/, as viewed on August 6, 2002.

Final Draft ReportEconomic Analysis of Critical Habitat Designation for California Gnatcatcher
February 24, 2004
48
U.S. Office of Management and Budget, “Appendix 4: Guidelines to Standardize1291
Measure of Costs and Benefits and the Format of Accounting Statements,” in
Report to Congress on the Costs and Benefits of Federal Regulations, March 22, 2000.
U.S. Office of Management and Budget, “Draft 2003 Report to Congress on the Costs
and Benefits of Federal Regulations; Notice,” 68 Federal Register 5492, February 3,1296
2003.
Legislation
2 U.S.C. §§658-658g and 1501-15711301
5 U.S.C. §§ et seq; and Pub Law No. 104-121.
5 U.S.C. § 601 et seq.
1306
50 CFR Part 402.02.
Executive Order 12866, “Regulatory Planning and Review,” September 30, 1993.
Executive Order 13211, “Actions Concerning Regulations That Significantly Affect1311
Energy Supply, Distribution, or Use," May 18, 2001.
New Mexico Cattle Growers Assn. v. U.S.F.W.S., 248 F.3d 1277 (10th Cir. 2001).
1316

Final Draft ReportEconomic Analysis of Critical Habitat Designation for California Gnatcatcher
February 24, 2004
49
POTENTIALLY AFFECTED ACTIVITIES
Any activities on Federal lands that may affect the gnatcatcher or its CH, as well as any
activities on State or private lands that require Federal agency approval or oversight,
would be subject to section 7 consultation. In particular, the proposed rule identified
the following activities that, when funded, authorized, or carried out by a Federal1321
agency, may affect the gnatcatcher or its CH:
1. Development on private lands requiring permits from Federal agencies, such as
authorization from the United States Army Corps of Engineers (USACE)
pursuant to section 404 of the Clean Water Act, or a section 10(a)(1)(B) permit
from the Service, or some other Federal action that includes Federal funding that1326
will subject the action to the section 7 consultation process (e.g., from the Federal
Highway Administration, Federal Emergency Management Agency, or the
Department of Housing and Urban Development);
2. Military activities of the Department of Defense on its lands or lands under its
jurisdiction;1331
3. The release or authorization of release of biological control agents by the U.S.
Department of Agriculture;
4. Regulation of activities affecting point source pollution discharges into waters of
the United States by the Environmental Protection Agency under section 402 of
the Clean Water Act;1336
5. Construction of communication sites licensed by the Federal Communications
Commission (FCC); and
6. Authorization of Federal grants or loans.
Final Draft ReportEconomic Analysis of Critical Habitat Designation for California Gnatcatcher
February 24, 2004
50
After reviewing the above listed activities, and conducting interviews with the relevant
Federal agencies, the following activities were identified that may affect the gnatcatcher1341
or its habitat, and will be the foci of this analysis:
1. Private development requiring USACE permitting under the Clean Water
Act;
2. Transportation projects by Caltrans and the TCA that either require USACE
section 404 authorization or receive Federal funding (e.g., FHWA funds);1346
3. Construction of regional municipal water infrastructure by the San Diego
County Water Authority (SDCWA) and the MWD that involves USACE section
404 authorization;
4. Flood control and water treatment projects that receive funds from the BOR;
5. Construction of regional gas and electricity infrastructure by SDG&E, SCE, and1351
the SCGC that involves Federal Energy Regulatory Commission (FERC)
approval or USACE section 404 authorization;
6. Land management practices (e.g., fire prevention) by the USFS and Bureau of
Land Management (BLM);
7. Emergency management actions by FEMA;1356
8. Military operations and land management by the USMC and U.S. Navy; and
9. Internal section 7 consultations required by the Service to approve existing and
future Habitat Conservation Plans that address the gnatcatcher.

Final Draft ReportEconomic Analysis of Critical Habitat Designation for California Gnatcatcher
February 24, 2004
26
In attempting to define the baseline regulatory environment, this analysis also considered RiversideCounty’s local grading permit application requirem ent. Through this process, perm it applicants arerequired to perform a habitat assessment if the County alerts them that their property “may containvegetation...which could support the [gnatcatcher].” Negative survey results allow applicants toreceive grading permits, while positive survey results require them to perform additional surveysand engage the Service, if necessary. The survey requirement is a purely informational procedure,and thus does not provide any additional protection to the species or its habitat. The costsassociated with the preliminary habitat assessment may overlap with similar activities undertakenduring a biological assessment as part of a section 7 consultation. However, the reduction in section7 administrative costs resulting from this baseline requirement is assumed to be negligible. Therefore, this analysis does not attempt to net out the baseline costs of surveying that result fromRiverside County’s grading permit approval process.
51
II. REGULATORY BACKGROUND1361
This chapter describes the existing regulatory environment relevant to gnatcatcher and
CSS habitat in California. As described, a number of existing regulations and
regulatory regimes require agencies and applicants to consider the impacts of their
actions or projects on CSS, and thus gnatcatcher habitat, and to mitigate those impacts1366
independent of section 7. In other words, in the “world without section 7,” project
applicants would be required to mitigate CSS impacts under these baseline regulations
and regulatory regimes. As discussed in Chapter I, the costs associated with such
mitigation requirements are therefore appropriately considered as baseline, and are not
attributed to project modification requirements under section 7.1371
The relevant baseline regulations identified as part of this analysis include:26
1. Section 4(d) Special Rule,
2. CEQA,
3. Project-Specific Habitat Conservation Plans,1376
4. Regional Habitat Conservation Plans, and
5. Integrated Natural Resource Management Plans.

Final Draft ReportEconomic Analysis of Critical Habitat Designation for California Gnatcatcher
February 24, 2004
27Although all of the areas proposed for designation in Unit 1 lie within the planning area of the
MSCP, only the Otay-Sweetwater Unit of the San Diego National Wildlife Refuge Complex (SDNWR)
is officially enrolled in the MSCP. The MSCP is not considered a baseline regulation for the SDNWR
because it is a federally ow ned refuge – this analysis assumes that future projects would be purely
Federal in nature and any project modifications would be negotiated through the section 7
consultation process. The M SCP is not considered a baseline regulation for the remaining areas in
Unit 1 because these areas are not within the boundaries of approved sub-area plans.
52
This analysis evaluates the economic impact of critical habitat in areas proposed for
designation as well as in areas proposed for exclusion. As described in Chapter I, areas1381
proposed for exclusion include lands within a variety of existing project-specific HCP
reserves, lands in approved regional HCP planning areas (i.e., the MSCP and Orange
County Central/Coastal NCCP/HCP), areas covered by an existing INRMP (MCAS
Miramar), and lands excluded due to a consideration of economic and other relevant
impacts (i.e., mission-essential training areas at Camp Pendleton and Tribal lands of the1386
Pala Band of Mission Indians).
The following discussion is divided into three sections: the first describes baseline
regulations relevant to lands proposed for designation (i.e., regulations 1 and 2, listed
above); the second describes baseline regulations relevant to lands proposed for
exclusion (i.e., regulations 1-5, listed above); and the third describes ongoing regulatory1391
processes that could potentially constitute baseline regulations, if approved. Table 5
provides a schematic summary of where and to what extent each of these regulations
applies.
BASELINE IN AREAS PROPOSED FOR CRITICAL HABITAT
The following discussion addresses project-specific HCPs, the Orange County1396
Central/Coastal NCCP/HCP, the 4(d) Special Rule, and CEQA, which this analysis
considers to be a complete list of all baseline regulations that apply to lands proposed
for CHD. As discussed in the next section, some of these regulations may also
constitute baseline conditions for areas proposed for exclusion.27

Final Draft ReportEconomic Analysis of Critical Habitat Designation for California Gnatcatcher
February 24, 2004
28 Participating landowners are the San Joaquin Hills Transportation Corridor Agency, theFoothill/Eastern Transportation Corridor Agency, the Orange County Fire Authority, the OrangeCounty Flood Control District, the Regents of the University of California, the Santiago CountyWater District, the Irvine Ranch Water District, the Metropolitan Water District of SouthernCalifornia, Southern California Edison, M.H. Sherman Company, Chandis Security Company,Sherman Foundation, and The Irvine Company.
53
ORANGE COUNTY CENTRAL/COASTAL NCCP/HCP1401
This analysis assumes that no future section 7 project modification costs will be incurred by
Participating Landowners in the Plan. Any future section 7 consultations required for projects
with a Federal nexus that are carried out by non-participating landowners in EUAs may result
in project modification costs attributable to section 7. Two additional section 7 consultations are
anticipated within the El Toro Reuse Area and the Irvine Ranch Land Reserve, which would1406
result in administrative section 7 costs only.
Background
The Central/Coastal Orange County NCCP/HCP is a regional HCP that was approved
and adopted on July 17, 1996. Regional HCPs generally encompass larger planning
areas than project-specific HCPs and are designed to provide systematic processes for1411
granting incidental take to a broad range of future projects or activities. This plan
reflects conservation measures committed to by the County of Orange, cities within
Orange County, and Participating Landowners, and approved by the Service.
Participating landowners are agencies or entities that participated in the development
of the plan and contributed land and/or funds for administration, management, or1416
reserve creation.28 The plan established a defined reserve system, composed of both
public land and private land dedicated by participating landowners, parts of which –
the El Toro Reuse Area and the Irvine Ranch Land Reserve – have been proposed for
CHD in Unit 7. The plan also established several classes of “non-reserve supplemental
habitat areas,” including Special Linkage Areas (SLAs), EUAs, and the North Ranch1421
Policy Plan Area (NRPPA). Several EUAs have also been proposed for critical habitat
as part of Unit 7.
The Central/Coastal HCP/NCCP is a conservation plan that provides conservation
measures to minimize and mitigate the impacts of take resulting from planned activities1426
by participating landowners. By contributing land or money through the plan

Final Draft ReportEconomic Analysis of Critical Habitat Designation for California Gnatcatcher
February 24, 2004
29 Section 8.3.5(e) of the Implementation Agreement for the Central/Coastal HCP/NC CP stipulatesthat “in the event that a CH determination is made for any CSS Species [such as theGnatcatcher]…no additional mitigation in the form of land or financial compensation shall berequired of any Participating Landowner in connection with Planned Activities through thesection 7 consultation process under FESA or otherwise.”
54
development process, participating landowners received assurances that they had
satisfied their mitigation requirements for future “take” occurring as a result of planned
activities. These assurances also apply to planned activities within the reserves, as
described below. In accordance with its “No Surprises” policy, and consistent with the1431
plan’s goal of conserving habitat essential to the gnatcatcher within the HCP’s
boundaries, the Service assured Participating Landowners that any future CHD would
not require additional mitigation by participating landowners for activities covered by
the plan.29
Application to Economic Cost Calculation1436
This analysis assumes that no section 7 project modification costs will be incurred for
planned activities by participating landowners within the Central/Coastal HCP plan
area (and thus within proposed CH unit 7). As described below, certain activities by
non-participating landowners that have a Federal nexus may result in project
modification costs. All future projects with a Federal nexus within Unit 7, including1441
those by participating landowners, will incur administrative section 7 consultation
costs. Consultations for activities by participating landowners are assumed to be
streamlined informal consultations. The estimated administrative cost of these
anticipated section 7 consultations is shown in Appendix Table A-9. The assumptions
within each planning areas are as follows: 1446
C El Toro Reuse Area: The only Planned Activity with a Federal nexus is the
proposed construction of Alton Parkway by the County of Orange through the
southeast corner of the El Toro parcel. As a planned activity in an established
reserve area, CSS impacts for this project have already been mitigated in full,1451
and the project applicants would incur only administrative section 7 costs.

Final Draft ReportEconomic Analysis of Critical Habitat Designation for California Gnatcatcher
February 24, 2004
55
C Irvine Ranch Land Reserve: The only Planned Activities with a Federal nexus
are potential future trail construction projects throughout the reserve that may
require USACE section 404 authorization; other land uses are prohibited by a1456
conservation easement, which is considered a baseline regulation that is not
attributed to section 7. Service staff have indicated they do not expect these
projects to require section 7 consultation because the Irvine Company has made
extensive efforts to collaborate with the Service and to design all its projects in
reserve areas to avoid impacts to CSS and gnatcatcher habitat. As a conservative1461
measure (i.e., to more likely overestimate than underestimate economic
impacts), this analysis assumes that future trail construction will lead to one
informal section 7 consultation. As a planned activity, CSS impacts for this
project have already been mitigated in full, so the project applicant would incur
only administrative consultation costs.1466
C Existing Use Areas: CH has been proposed for approximately 3,200 acres that
have been established as EUAs in the Orange County NCCP/HCP. EUAs are
private land owned by non-participating landowners. Current land uses are
allowed, but any future changes in land use would require consultation with the1471
Service (under section 7 or section 10). Incidental take has not been authorized
for any EUAs. Any future development with a Federal nexus would require
section 7 consultations with the Service, and may incur administrative and
project modification costs.
SECTION 4(D) SPECIAL RULE1476
This analysis assumes that the 4(d) Rule constitutes a regulatory baseline for qualifying projects
in southern Orange County, the City of Rancho Palos Verdes (Los Angeles County), and San
Diego County, outside the San Diego National Wildlife Refuge. Future projects in these areas
that have a Federal nexus would incur administrative section 7 costs, but would not incur
project modification costs attributable to section 7. Future projects with a Federal nexus that are1481
carried out only by a Federal agency, or do not meet 4(d) Special Rule qualifying criteria, will be
processed entirely through section 7, and all administrative and project modification costs will be
attributable to section 7 and/or other baseline regulations.

Final Draft ReportEconomic Analysis of Critical Habitat Designation for California Gnatcatcher
February 24, 2004
56
Background1486
In December 1993, following the listing of the gnatcatcher as a Federally threatened
species, the Service issued a Special Rule under section 4(d) of the Act (hereafter, the
4(d) Rule). The 4(d) Rule exempts from the take prohibitions of section 9 of the
Endangered Species Act incidental take of gnatcatchers resulting from projects in local
jurisdictions that have voluntarily enrolled lands in the NCCP program, and that are1491
actively developing NCCPs that address the gnatcatcher and CSS. It allows these
jurisdictions to approve projects that will alter CSS habitat by issuing Habitat Loss
Permits (HLPs). If the Service concludes the project is consistent with the 4(d)
guidelines, the HLP allows an applicant to remove a specified amount of CSS without
having to obtain an incidental take permit through section 10(a) of the Act for any1496
associated take of the gnatcatcher.
As discussed in more detail below, projects with a Federal nexus must still consult
under section 7 to obtain incidental take authorization, though any required CSS
mitigation is processed according to 4(d) Rule standards. When the HCP/NCCP is1501
ultimately approved, all ensuing CSS impacts will be processed through the approved
plan and the 4(d) Rule no longer applies.
For a project to be approved under the 4(d) Rule, the local jurisdiction must insure, with
the Service’s approval, that each HLP it issues meets all of the following criteria:1506
C The habitat loss does not exceed five (5) percent of the total available CSS at the
time the 4(d) Rule took effect.
C The habitat loss will not preclude connectivity between areas of high habitat
value.1511
C The habitat loss will not preclude or prevent the preparation of the sub-regional
NCCP.
C Habitat loss has been minimized and mitigated to the maximum extent
practicable.
C The habitat loss will not jeopardize the continued existence of the coastal1516
California gnatcatcher.

Final Draft ReportEconomic Analysis of Critical Habitat Designation for California Gnatcatcher
February 24, 2004
57
C Any take is incidental to the pursuit of otherwise lawful activities.
Participating Areas
Currently, San Diego County, southern Orange County, and the City of Rancho Palos
Verdes (Los Angeles County) are the only areas within the proposed CH boundaries1521
that are enrolled in the 4(d) Rule program and are authorized to issue HLPs. The
remaining counties and jurisdictions either have approved NCCPs/HCPs in place
(central/coastal Orange), have chosen not to participate in the 4(d) Rule by declining to
enroll lands in the NCCP program (Riverside County), or are not actively pursuing
regional HCP/NCCPs that address the gnatcatcher and CSS (northern Orange, San1526
Bernardino, Los Angeles, and Ventura counties). Within San Diego County, projects in
the SDNWR (Unit 1) are assumed to involve only Federal agencies on Federal land –
these projects would be processed entirely through section 7, and the 4(d) Rule would
not constitute a baseline regulation.
The 4(D) Rule and Section 71531
The 4(d) Rule is intended primarily to obviate the need for private entities to seek
individual section 10(a) permits when their projects are likely to result in the take of
gnatcatchers and the local jurisdictions in which the proposed project is located are
actively engaged in the NCCP process. Projects with a Federal nexus that may affect
the gnatcatcher but still comply with the 4(d) Rule criteria listed above will require1536
independent section 7 consultation, and the Service would authorize any incidental take
through issuance of a BO. Based on input from the Service, and on an independent
review of selected BOs for projects in the 4(d) Rule area, CSS mitigation incorporated
into projects that go through the section 7 process is equivalent to mitigation typically
required for HLP issuance under the 4(d) Rule. Furthermore, loss of CSS habitat1541
identified in the section 7 process is deducted from the enrolled jurisdiction’s five-
percent allotment as established by the 4(d) Rule, including CSS take authorized for
Federal projects only (i.e., those with no third party applicant).
These facts demonstrate that (1) applicants with a Federal nexus would incur the same1546
mitigation costs under the 4(d) Rule if they were not required to consult under section
7, and (2) both the Service and local agencies in 4(d) Rule areas track incidental take of
CSS permitted through section 7 consultation with reference to levels established by the

Final Draft ReportEconomic Analysis of Critical Habitat Designation for California Gnatcatcher
February 24, 2004
58
4(d) Rule. In other words, in the “world without section 7,” projects with a Federal
nexus would be required to mitigate CSS impacts under the 4(d) Rule, and the overall1551
amount of habitat loss would be the same (five percent). This analysis therefore
considers the 4(d) Rule a baseline regulation in San Diego County, southern Orange
County, and the City of Rancho Palos Verdes, and project modification costs for CSS
impacts are not considered attributable to section 7. All projects with a Federal nexus in
4(d) Rule areas will incur administrative section 7 consultation costs.1556
Projects Without 4(d) Rule Baseline Protection
It is important to note that not all future projects within the 4(d) Rule area will meet all
five criteria listed above. Any project that does not meet all of the criteria is entirely
exempt from the 4(d) Rule process, and those exempt projects with a Federal nexus
would require independent section 7 consultation. All administrative and project1561
modification costs of any such project would be entirely attributable to section 7.
According to Service and local agency staff, no proposed projects have been denied 4(d)
Rule approval in Orange County or the City of Palos Verdes, though some have had to
agree to project redesigns in order to secure approval. A small number of projects in
San Diego County have been denied 4(d) approval, though Service staff estimates that1566
greater than 95 percent of projects seeking 4(d) approval are successful. In general, the
only projects that are likely to be denied 4(d) approval are very large, identifiable ones.
In San Diego and Orange counties, these projects are also likely to be regulated under
the requirements of CEQA, as described further below.
CALIFORNIA ENVIRONMENTAL QUALITY ACT1571
This analysis assumes that lead agencies’ enforcement of CEQA regulations in San Diego and
Orange counties constitutes a regulatory baseline for projects not already covered by the 4(d)
Rule. However, CSS mitigation required through the CEQA process may not be as onerous or
consistently applied as typical project modifications under section 7 – in such cases, the
difference between CSS mitigation associated with section 7 and that associated with CEQA1576
would be attributable to section 7. In contrast, all project modification costs for projects with a
Federal nexus in Riverside, San Bernardino, Los Angeles and Ventura counties are assumed to
be attributable to section 7. CEQA is not considered a baseline regulation for purely Federal

Final Draft ReportEconomic Analysis of Critical Habitat Designation for California Gnatcatcher
February 24, 2004
30Much case law has been devoted to clarifying the definitions of “project” and “discretionary”since CEQA ’s adoption in 1970. In general, a project is defined as “any activity that has thepotential for a direct physical change or a reasonably foreseeable indirect physical change to theenvironment.” A discretionary project is one that requires an exercise of judgement ordeliberation on the part of a public agency (as opposed to a “ministerial” project subject toautomatic approval). A list of categorical exemptions can be found in the CEQA Guidelines (14C.C.R. 15301 et seq), and a list of statutory exemptions can be found in the CEQA Statutes (Pub.Res. Code 21080 et seq).
31 A p p en d ix G of t h e C EQ A Gu id elin es (14 C.C.R. 15000 et seq) requ ires lead agen cies to issue a“m an d atory find ing of sign ifican ce” w he n p erform ing an Initial Stu d y if a p roject has th ep ote n tia l to “ ...red u ce th e n u m ber or rest r ict th e ran ge of a rare or en d an gered p lan t o r an im al.”
32Unlike the National Environm ental Policy A ct (NEPA), which is considered purely aninformational act, CEQA requires lead agencies to ensure applicants mitigate their projects to a“less than significant” level. A lead agency m ay consider the adverse environmental effects of aproject “acceptable,” and issue a statement of overriding considerations if it finds anddemonstrates that the “...specific economic, legal, social, technological, or other benefits of aproposed project outweigh the unavoidable adverse environm ental effects” (14 C.C.R. 15093).
59
projects with no third party applicants. All future projects with a Federal nexus will require
administrative section 7 consultation costs.1581
Background
CEQA requires that lead agencies – public agencies responsible for project approval –
consider the environmental effects of proposed private projects that are considered
“discretionary” in nature, and that are not categorically or statutorily exempt.30 Among
other effects, the CEQA statutes specifically require lead agencies to consider a project’s1586
effects on rare or endangered plant and animal communities.31 To approve qualifying
projects, lead agencies must require applicants to mitigate effects to “less than
significant” levels for projects that are not granted a “statement of overriding
considerations.”32 In certain cases, therefore, it is possible that a lead agency’s
enforcement of CEQA regulations will result in mitigation for impacts to rare or1591
endangered species’ habitat independent of section 7 or section 10 requirements. In
these cases that involve a Federal nexus, CEQA enforcement of CSS mitigation would
constitute a baseline regulation, and associated costs would not appropriately be
attributable to section 7. For a discussion of potential indirect economic effects due to
lead agencies’ enforcement of CEQA guidelines, refer to Chapters I and IV. 1596

Final Draft ReportEconomic Analysis of Critical Habitat Designation for California Gnatcatcher
February 24, 2004
33The California legislature passed the NCCP A ct in 1991, designed in part to establish a proactivemechanism to preserve CSS habitat in southern California and to potentially avert the need to listthe gnatcatcher under the Endangered Species A ct. Since then, a number of cities and counties insouthern California have voluntarily enrolled lands in the NCCP program. Once enrolled, CEQAGuidelines require lead agencies to consider whether a project would “conflict with theprovisions of an adopted...Natural Comm unity Conservation Plan” in performing an InitialStudy (Appendix G, 14 C .C.R. 15000 et seq.).
60
Regional Difference in CEQA Implementation
The California Department of Fish and Game (DFG) has officially assigned CSS habitat
a sensitivity ranking, recognizing it as a “very threatened” (S2.1) habitat type on its list
of “Sensitivity of Top Priority Rare Natural Communities in Southern California”.1601
Though this official recognition may compel certain lead agencies to pay special
attention to CSS impacts, and possibly require mitigation accordingly, it does not legally
require lead agencies to do so. CEQA implementation and enforcement is therefore
entirely at the discretion of the lead agency with respect to CSS mitigation. As a result,
CEQA provides effective baseline mitigation for CSS habitat in certain regions, and1606
does not in others, depending on the likelihood the region’s local lead agencies require
CSS mitigation. Research conducted during the course of this analysis indicates that the
following regions address CSS under CEQA as follows:
C San Diego and Orange Counties. According to DFG staff, nearly all lead1611
agencies in San Diego and Orange counties currently require mitigation for CSS
impacts as part of their administration of the CEQA process. This is likely due
to either the fact that (1) lead agencies voluntarily require CSS mitigation under
CEQA, and/or (2) these regions contain lands enrolled in the NCCP process
through the NCCP Act of 1991, and CEQA enforcement therefore specifically1616
requires consideration of impacts to CSS.33 As discussed previously, the 4(d)
Rule constitutes a baseline requirement in San Diego County and southern
Orange County. This analysis assumes that CEQA constitutes a baseline
requirement for CSS mitigation in areas in Orange County outside 4(d) Rule
jurisdiction (e.g., EUAs) , and when projects in either county do not qualify for1621
4(d) approval.

Final Draft ReportEconomic Analysis of Critical Habitat Designation for California Gnatcatcher
February 24, 2004
34 Personal comm unication with Jeff Drongensen, Senior Environmental Scientist, Inland DesertDistrict, California Department of Fish and Game, on March 3, 2003.
35 Personal com m u nicat ion w ith Don Chad w ick and Morgan Weh t je , Senior Environm enta lScien tis ts , Sou th Coa st D ist r ict, C alifor n ia D ep ar tm en t o f Fish an d Gam e, on Feb ru ary 28 an dM arch 3, 2003.
61
C Riverside and San Bernardino Counties. DFG staff indicates that lead agencies
in Riverside and San Bernardino counties have not historically required CSS1626
mitigation as part of the CEQA process.34 This analysis assumes that CEQA
does not constitute a baseline requirement for CSS mitigation in these counties.
C Los Angeles and Ventura Counties. According to DFG staff, lead agencies in
Los Angeles and Ventura counties have not historically exhibited a clear pattern,1631
requiring CSS mitigation under CEQA in certain cases and not requiring it in
others.35 This analysis assumes that CEQA does not constitute a baseline
requirement for CSS mitigation in these counties.
Level of CSS Mitigation Required Under CEQA
The level of CSS mitigation required under CEQA is an important factor in determining1636
the incremental cost of section 7 above CEQA baseline requirements. Service staff has
indicated that in areas where lead agencies have required CSS mitigation under CEQA,
those mitigation standards have typically been similar to project modifications resulting
from section 7 consultations for the gnatcatcher. DFG staff has concurred that, on
average, mitigation requirements under CEQA are similar to the on-site measures that1641
typically result from section 7 consultations. However, overall the mitigation
requirements of CEQA may not be as onerous and consistently applied as those under
section 7 due to the following factors:
1. Large projects under CEQA may be able to proceed with “statements of1646
overriding considerations,” an option not available under section 7;and
2. The CEQA mitigation requirements are generally based on a different set of
considerations than those under section 7. Specifically, CEQA mitigation
requirements are focused on CSS rather than the gnatcatcher per se and thus1651

Final Draft ReportEconomic Analysis of Critical Habitat Designation for California Gnatcatcher
February 24, 2004
62
may ignore factors such as jeopardy or the preservation of key habitat areas
(e.g., “stepping-stones”).
Due to the foregoing considerations, this analysis assumes that in areas where lead
agencies have traditionally required CSS mitigation under CEQA (and other baseline1656
standards are assumed not to apply), section 7 consultation may generate slightly
greater project modification costs than those that would have been required under
CEQA. In other words, in the “world without section 7,” all projects in San Diego and
Orange counties not addressed by the 4(d) Rule would be required to mitigate CSS
impacts under CEQA to a slightly lower degree than would be required under section1661
7.
DFG staff have indicated that, on average, it encourages local lead agencies that enforce
CSS mitigation under CEQA to employ a 2-to-1 mitigation ratio. While the actual ratio
implemented for any particular project may vary, this is considered a reasonable1666
estimate of baseline CSS mitigation standards under CEQA in San Diego and Orange
counties. Therefore, this analysis considers the difference between this 2-to-1 baseline
standard and the mitigation levels typically resulting from section 7 to be attributable
entirely to section 7 – that this increment represents the “net” CSS mitigation ratio
attributable to section 7. Furthermore, because both the Service and the DFG suggest1671
that additional project modification costs incurred as a result of section 7 generally take
the form of project redesign/avoidance, the cost of the additional section 7 mitigation
will be calculated assuming it represents an on-site set-aside requirement (as opposed
to off-site preservation or restoration).
1676
Finally, any project with a Federal nexus within proposed CH will incur administrative
section 7 consultation costs.

Final Draft ReportEconomic Analysis of Critical Habitat Designation for California Gnatcatcher
February 24, 2004
63
BASELINE IN AREAS PROPOSED FOR EXCLUSION
This section evaluates baseline regulations that would apply if critical habitat were
designated in areas that have currently been proposed for exclusion. As described in1681
Chapter I, areas proposed for exclusion include approved project-specific HCPs that
address the gnatcatcher, areas within the MSCP and Orange County Central/Coastal
NCCP/HCP planning areas, MCAS Miramar, mission-critical training areas at Camp
Pendleton, and Tribal lands owned by the Pala Band of Mission Indians. The 4(d) Rule
and CEQA also apply to some of the areas proposed for exclusion; in contrast, several1686
other baseline regulations – most notably the two approved regional HCPs and INRMP
for MCAS Miramar – apply only to areas that have been proposed for exclusion. Table
7 provides a summary of each baseline regulation’s applicability.
CEQA would constitute a regulatory baseline for areas proposed for exclusion that are1691
considered “non-reserve supplemental habitat areas” within the Orange County
Central/Coastal NCCP/HCP (see below for a more detailed discussion of these areas).
Regulatory baseline conditions for all other areas that have been proposed for exclusion
are addressed either through approved HCPs (project-specific or regional) or military
INRMPs. No regulatory baseline has been identified for Tribal lands of the Pala Band1696
of Mission Indians. The 4(d) Rule does not constitute a regulatory baseline for any
lands proposed for exclusion (all lands in San Diego and Orange counties would be
addressed by either approved HCPs, CEQA, or INRMPs; Federal activities on military
and/or Tribal land would not qualify for 4(d) approval). A discussion of regulatory
conditions related to approved HCPs is provided below.1701
PROJECT-SPECIFIC HABITAT CONSERVATION PLANS
If critical habitat were designated in established project-specific HCP reserve areas, no section 7
project modification costs would be incurred. Projects with a Federal nexus could require
administrative section 7 consultation costs, though future projects within established HCP
reserves are considered unlikely. Finally, each HCP would require one internal, informal1706
consultation by the Service if CH were designated.

Table 7Summary of Baseline Regulations that Address the Gnatcatcher and Coastal Sage Scrub
RegionSmall-scale MSCP 4(d) Rule Central/ CEQA INRMP Admin. Project
HCPs Coastal NCCP Modification
Areas Proposed for DesignationSan Diego County
Unit 1Cities of Chula Vista, El Cajon, and Santee -- -- X -- P -- Yes Some (2)(3)County MSCP major amendment areas -- -- X -- P -- Yes Some (2)(3)San Diego National Wildlife Refuge -- -- -- -- -- -- Yes YesWater district lands -- -- X -- P -- Yes Some (2)(3)
Fallbrook Naval Weapons Station (Unit 4) -- -- -- -- -- -- Yes YesRemainder of County (Units 2, 3, & 5) -- -- X -- P -- Yes Some (2)(3)
Orange CountySouthern Orange County -- -- X -- P -- Yes Some (2)(3)Northern Orange County -- -- -- -- X -- Yes Some (3)Central/Coastal Orange (HCP/NCCP)
EUAs -- -- -- -- X -- Yes Some (3)El Toro and Irvine Ranch Reserves -- -- -- X P -- Yes No
Riverside County -- -- -- -- -- -- Yes Yes
San Bernardino County -- -- -- -- -- -- Yes Yes
Los Angeles CountyCity of Rancho Palos Verdes -- -- X -- -- -- Yes No (4)Remainder of County -- -- -- -- -- -- Yes Yes
Ventura County -- -- -- -- -- -- Yes Yes
Areas Proposed for Exclusion
San Diego CountyMultiple Species Conservation Plan (MSCP)
Cities of San Diego & La Mesa; SD County -- X -- -- -- -- Yes NoCity of Poway -- -- -- -- X -- Yes Some (3)
MCAS Miramar -- -- -- -- -- X Yes NoUSMC Camp Pendleton (training areas) -- -- -- -- -- -- Yes YesPala Band of Mission Indians Reservation -- -- -- -- -- -- Yes Yes
Orange CountyCentral/Coastal Orange (HCP/NCCP)
Reserves -- -- -- X -- -- Yes No
Approved Project-specific HCPs (all Units) X -- -- -- -- -- Yes No
Notes:X : For the purposes of this analysis, this baseline regulation is treated as the primary determinant of CSS mitigation requirements in this region.P : For the purposes of this analysis, this baseline regulation applies in this region but is not the primary determinant of the CSS mitigation requirement.-- : This baseline regulation is assumed not to apply to this region.
(1) Answer to question: "For projects with a Federal nexus, will there be costs attributable to section 7?"(2) : The 4(d) Rule is the primary baseline requirement with respect to CSS mitigation. CEQA requirements are considered a
baseline regulation when a project does not qualify for 4(d) Rule consideration. (3) : Project modification costs above the "CEQA baseline" are attributable to section 7.(4) : According to City staff, no projects in Rancho Palos Verdes have been denied 4(d) approval.
Section 7 Costs (1)Applicable Baseline Regulation
Economic & Planning Systems, Inc. 2/26/2004 H:\12594gnatcatcher\Report\DEA_Feb2004\EmailTables_Feb2004.xls

Final Draft ReportEconomic Analysis of Critical Habitat Designation for California Gnatcatcher
February 24, 2004
65
Background1711
An HCP is a conservation plan provided for in section 10(a) of the Act that identifies
conservation measures an applicant will undertake to minimize and mitigate the
impacts of “take” on a listed species. In return for committing to develop an HCP
consistent with the statutory criteria of section 10, the applicant is granted an
“incidental take permit” for the species. An HCP must be approved by the Service and1716
applied within a specified geographic area.
The project-specific HCPs that have been proposed for exclusion are limited to reserve
areas identified in approved HCPs that address the gnatcatcher. For some HCPs the
Service has not proposed critical habitat because the approved HCP already establishes1721
adequate management for the species (in which case the areas do not meet the
definition of critical habitat under section 3(5)(a)); other HCPs have been proposed for
exclusion based on the Service’s determination that the benefits of exclusion outweigh
the benefits of inclusion (in which case they have been proposed for exclusion under
section 4(b)(2)).1726
Any future projects that take place within these reserve areas will be regulated by the
terms and conditions of the HCP and its implementing agreement, which would
therefore constitute a regulatory baseline if critical habitat were to be designated on
these lands. The section 10(a) permits associated with these HCPs authorize a range of
activities, including incidental take for discrete development projects as well as a1731
variety of ongoing and planned activities by a particular applicant. In all cases, the
associated HCPs specify reserve areas to be preserved as mitigation for expected take.
Through the terms of these project-specific HCPs, land has already been acquired for
these reserves (either through fee-title or conservation easement) and reserve
management established.1736
Application to Economic Cost Calculation
In general, approved HCPs contain assurances to the applicant that activities covered
by the HCP will not require additional mitigation or project modifications above those
already negotiated as part of the HCP. As a result, if critical habitat were to be
designated within these project-specific HCP reserve areas, future section 7 costs would1741

Final Draft ReportEconomic Analysis of Critical Habitat Designation for California Gnatcatcher
February 24, 2004
66
be limited to (1) the administrative cost of section 7 consultations for future projects
with a Federal nexus, and (2) the administrative cost of an internal consultation (for
each HCP) by the Service to insure the HCPs are consistent with the adverse
modification standard. This analysis assumes that land use activities consistent with
and inside project-specific HCPs would not accrue added project modification costs as a1746
result of CH.
SAN DIEGO MULTIPLE SPECIES CONSERVATION PLAN
If CH were designated in areas proposed for exclusion that are within approved MSCP sub-area
plans, this analysis concludes that the CHD would not result in any additional project
modification costs for projects that require section 7 consultation within the sub-area boundaries1751
of San Diego County or the cities of San Diego or La Mesa. In contrast, projects with a Federal
nexus in the City of Poway’s sub-area plan would incur projects modification costs attributable
to section 7. Finally, all costs for Federal projects with no third party applicants as well as all
administrative consultation costs for projects with a Federal nexus in the MSCP are attributable
to section 7.1756
Background
A regional HCP generally encompasses a larger planning area than a project-specific
HCP and is designed to provide a systematic process for granting incidental take to a
broad range of future projects or activities. The MSCP is a regional HCP/NCCP that
encompasses a 582,000-acre planning area in San Diego County. The City of San Diego1761
was the lead agency for the Plan, and the City’s subarea plan – the first approved under
the MSCP – was approved in July 1997. The plan area is divided into jurisdictional sub-
areas for administration. Four jurisdictions currently have approved sub-area plans –
San Diego County, and the cities of San Diego, Poway, and La Mesa. Additional sub-
area plans are proposed or pending for the northeast County (MSCP North), the Otay1766
Water District, and the cities of Chula Vista, Santee, Coronado, Del Mar, and El Cajon.
Because these sub-area plans have not officially been adopted, however, this analysis
does not consider them participating jurisdictions in the MSCP.
1771

Final Draft ReportEconomic Analysis of Critical Habitat Designation for California Gnatcatcher
February 24, 2004
67
The MSCP provides for the creation of a 172,000-acre habitat preserve, which will be
established over time within the boundaries of a multiple habitat planning area
(MHPA), within the larger MSCP planning area. Each approved sub-area plan defines
the MHPA boundaries within its plan area and establishes a mechanism by which
future development within the plan area will contribute to the establishment of1776
preserves inside the MHPA. Each sub-area plan also defines the types of future land
uses that will be permitted in each jurisdiction’s preserve.
The MSCP and Section 7
Proposed CH Unit 1 contains land within all four approved MSCP sub-area plans, as
well as land within proposed or pending sub-area plans. All areas proposed for1781
designation are within the MHPA and consist of land that is either already preserved,
or is intended for preservation.
In issuing local permits for development, jurisdictions with approved sub-area plans
are required to comply with and enforce the terms of the MSCP, including requiring1786
CSS mitigation consistent with the MSCP. Private development projects – either with or
without a Federal nexus – that need local agency approvals must therefore negotiate
CSS mitigation with local implementing agencies independent of section 7 consultation.
In other words, in the “world without section 7,” project applicants would be required
to mitigate impacts to CSS habitat in a manner consistent with the terms and conditions1791
of the MSCP for all projects inside approved sub-area plan areas. Federal projects with
no third party applicants must always consult purely through section 7, and the MSCP
is not considered a baseline regulation for these activities.
Applicability to San Diego County, San Diego City, and La Mesa
Based on input from Service staff and an independent review of selected section 7 BOs1796
addressing impacts to the gnatcatcher for projects within approved sub-area plan
jurisdictions, this analysis assumes that section 7 consultation will not require any
additional project modifications (e.g., mitigation) over and above what is already
required by the relevant sub-area plan. Typically, the section 7 consultation for projects
within the MSCP area consists of a letter of concurrence from the Service that an1801
applicant has appropriately mitigated according to the standards of the approved sub-
area plan. This analysis therefore assumes that projects with a Federal nexus that are

Final Draft ReportEconomic Analysis of Critical Habitat Designation for California Gnatcatcher
February 24, 2004
68
proposed in areas covered by approved sub-area plans will incur only administrative
informal section 7 consultation costs, and will not incur any project modification costs
attributable to section 7.1806
Applicability to Poway
The City of Poway’s approved sub-area plan provides one exception to the general
assumption above. Unlike other jurisdictions with approved sub-area plans, the City of
Poway does not require project applicants to participate in the MSCP process.
Individual applicants have the option of pursuing an independent section 71811
consultation (assuming there is a Federal nexus) or an independent section 10 incidental
take permit (assuming there is not Federal nexus). In reality, it is very likely that most
future applicants, particularly those whose projects lack a Federal nexus, will choose to
participate in the City’s HCP, in recognition of the greater regulatory certainty and
faster permit approval process, rather than pursuing individual consultation with the1816
Service. Nevertheless, in order to be more likely to overestimate than underestimate
section 7 economic impacts, this analysis conservatively assumes that all future
applicants with a Federal nexus within the City of Poway’s jurisdiction will decide to
pursue independent section 7 consultation. In such cases, all administrative and project
modification costs will be attributable to section 7.1821
CENTRAL/COASTAL ORANGE COUNTY HABITAT CONSERVATION PLAN
The proposed rule identified approximately 35,000 acres of NCCP reserve lands that either do
not meet the definition of critical habitat or have been proposed for exclusion under section
4(b)(2). The only future projects allowed in these reserves are Planned Projects under the NCCP.
This analysis did not identify any Planned Projects with a Federal nexus in the reserve areas1826
proposed for exclusion, so no section 7 costs are anticipated.
The Orange County Central/Coastal NCCP/HCP includes both lands that have been
proposed for CHD and lands that do not meet the definition of critical habitat (under
section 3(5)(a)) or have been proposed for exclusion under section 4(b)(2). As described 1831

Final Draft ReportEconomic Analysis of Critical Habitat Designation for California Gnatcatcher
February 24, 2004
36
Since the NCCP has been enacted, USACE has not initiated any section 7 consultations covering
the gnatcatcher for Planned Activities in the HCP reserve areas. Based on this consultation
record, this analysis assumes that the USACE w ill not initiate future consultations for Planned
Activities in the reserve areas.
69
above, the Irvine Ranch Reserve, the El Toro Reuse Area, and certain EUAs have been
proposed for designation. The proposed rule also identifies approximately 35,000 acres
of habitat reserves that have been proposed for exclusion. 1836
The only projects allowed in the Reserve area are Planned Projects by Participating
Landowners. The Implementing Agreement for the HCP specifically states that CH will
not result in any additional mitigation or costs for Planned Projects under the HCP.
Therefore, the only section 7 costs would be administrative consultation costs for1841
Planned Projects with a Federal nexus. This analysis did not identify any Planned
Projects within the reserve areas proposed for exclusion that would involve a Federal
nexus.36 This analysis therefore assumes there will be not be any administrative or
project modification costs associated with these areas.
INTEGRATED NATURAL RESOURCE MANAGEMENT PLANS1846
The Sikes Act Improvement Act (SAIA) of 1997 requires Department of Defense (DoD)
military installations to develop INRMP to provide for the conservation, protection, and
management of wildlife resources. Military areas proposed for exclusion include
USMC Camp Pendleton (mission-essential training areas), and MCAS Miramar.
Although mandatory, an INRMP must reflect the mutual agreement of the DoD and the1851
Department of Interior, acting through the Service. A completed INRMP that meets the
requirements of SAIA must provide for, among other things, the following:
C Fish and wildlife management, land management, forest management, and fish-
and wildlife oriented recreation;1856
C Fish and wildlife enhancement or modifications,
C Integration of, and consistency among, the various activities conducted under
the plan; and

Final Draft ReportEconomic Analysis of Critical Habitat Designation for California Gnatcatcher
February 24, 2004
70
C Establishment of specific natural resource management goals and objectives and
time frames for proposed action.1861
Given the above, a completed INRMP can provide a baseline set of requirements for the
protection of the gnatcatcher and/or CSS if completed and approved. In other words, in
the “world without section 7,” future projects or activities on DoD military installations
would mitigate for impacts to the gnatcatcher and/or CSS. The costs associated with1866
such mitigation requirements are appropriately considered as baseline, and are not
attributed to project modification requirements under section 7. However, CHD may
provide additional requirements over and above those specified in an existing INRMP.
Consequently, although a completed INRMP constitutes a baseline requirement, the
designation of CH may result in consultations and/or project modifications above and1871
beyond those already specified in the INRMP. These incremental costs are evaluated
separately for the three military installations included in the gnatcatcher CH that have
INRMPs (Pendleton, Miramar, and Fallbrook).
POTENTIAL FUTURE BASELINE REGULATIONS
The discussion above describes regional HCPs that have been approved and officially1876
adopted, and can therefore be considered "baseline" regulations. In contrast, this
analysis does not consider regional HCPs that are currently under development as part
of the baseline, as they have yet to be officially approved or adopted. As described
below, however, a number of regional HCPs that will address the gnatcatcher are
currently under development, and are expected to be completed in the near term. The1881
approval of one or all of these HCPs would impose an additional layer of land use
regulation specifically focused on CSS and gnatcatcher habitat, which would be applied
independent of section 7. In turn, such approved HCPs could therefore significantly
reduce the "net" cost burden attributable to section 7.
1886
Following is a brief description of four regional HCPs that could potentially be
completed in the near term, including a preliminary evaluation of relevant baseline
considerations, based on the most current information publicly available. A complete

Final Draft ReportEconomic Analysis of Critical Habitat Designation for California Gnatcatcher
February 24, 2004
71
analysis of the regulatory baseline effects of each of these plans can not be developed1891
until the plans are officially approved and adopted.
WESTERN RIVERSIDE COUNTY MULTI-SPECIES HABITAT
CONSERVATION PLAN
Western Riverside County is actively developing a regional HCP. Service staff expect1896
that the plan will be approved as early as Fall of 2003. Take authorization will apply to
all projects in the planning area, and all projects will contribute to establishing a
500,000-acre reserve (including 153,000 acres of private land to be acquired through
mitigation). No specific parcels have been identified as reserves, though the 153,000
acres will be acquired from within the "MSHCP Criteria Area." The Plan establishes an1901
incentive system to encourage private landowners in the Criteria Area to contribute
land to the reserve.
Preliminary estimates suggest that the proposed Unit 10 lies entirely within the MSHCP
planning area. If the MSHCP is approved in its current form, take authorization and1906
CSS mitigation would therefore be regulated through the MSHCP. Future projects with
a Federal nexus would require consultation, but project modification costs would not be
attributable to section 7. As discussed in the Executive Summary, this analysis
estimates that economic costs for Unit 10 constitute approximately 50 percent of the
total section 7 costs. Approval of the NCCP would shift a significant portion of the1911
estimated costs from section 7 to the NCCP.
SOUTHERN ORANGE COUNTY HCP/NCCP
As part of the Southern Orange County Coordinated Planning Process, southern
Orange County is actively developing an HCP/NCCP that will address the gnatcatcher
and CSS. No specific information is available regarding the status or expected1916
completion date of this regional HCP/NCCP.
Research indicates that the NCCP will likely cover approximately 91,000 acres in
southern Orange County. Preliminary estimates suggest that all portions of proposed
Unit 6 that are within Orange County lie within the proposed NCCP planning area. If

Final Draft ReportEconomic Analysis of Critical Habitat Designation for California Gnatcatcher
February 24, 2004
72
approved, all future incidental take of CSS habitat will be regulated by the NCCP, and1921
future project modification costs will not be attributable to section 7. As discussed in
the Executive Summary, this analysis estimates that future projects in Unit 6 account for
approximately 9 percent of the total cost estimate. Approval of the NCCP would shift
the portion of the cost burden related to projects in southern Orange County from
section 7 to the NCCP. These estimates take into account baseline conditions under the1926
4(d) Rule and CEQA
NORTHERN SAN DIEGO COUNTY MULTIPLE HABITAT
CONSERVATION PLAN
Northern San Diego County governments are currently developing a regional HCP that
will address the gnatcatcher and CSS. The public comment period on the Draft EIR/EIS1931
closed in April 2002, and public comment on the majority of draft subarea plans was
completed in 2001. The plan is expected to be adopted sometime in 2003.
The HCP will authorize incidental take of CSS habitat (but will not authorize
purposeful take of gnatcatcher individuals), and will establish differential mitigation1936
standards inside/outside "Focused Planning Areas" (potential future reserves areas).
Preliminary estimates indicate that proposed Unit 3 lies within the MHCP planning
area. If approved, future CSS take would therefore be mitigated through the Plan, and
project modification costs would not be attributed to section 7. As discussed in the
Executive Summary, this analysis estimates that economic costs in Unit 3 constitute1941
approximately one percent of total section 7 costs. Approval of the HCP would shift a
portion of these costs from section 7 to the HCP.
NORTH COUNTY SUBAREA PLAN TO THE MSCP
The County of San Diego is currently developing a subarea plan to the MSCP that will
apply to unincorporated areas in the northern County. If approved, CSS mitigation1946
within the subarea plan boundaries would be regulated under standards consistent
with the MSCP (and therefore section 7). Preliminary estimates suggest that proposed
Unit 5 lies within the planned subarea boundaries. If approved, future CSS mitigation

Final Draft ReportEconomic Analysis of Critical Habitat Designation for California Gnatcatcher
February 24, 2004
73
would therefore not be attributed to section 7. As discussed in the Executive Summary,
this analysis estimates that economic costs in Unit 5 constitute approximately one1951
percent of total section 7 costs. Approval of the HCP would shift a portion of these
costs from section 7 to the HCP.
CITY OF PALOS VERDES HCP/NCCP
No specific information was obtained regarding the status, scope, or expected
completion date of this Plan. However, because Palos Verdes currently processes CSS1956
take through the 4(d) Rule, they must, by definition, be actively pursuing an NCCP that
addresses the gnatcatcher and CSS. Proposed Unit 8 would likely be included in the
future NCCP planning area, and future CSS mitigation would be regulated according to
the NCCP. As discussed in the Executive Summary, this analysis estimates that
economic costs in Unit 8 constitute less than one percent of total section 7 costs. 1961
Approval of the HCP would shift a portion of these costs from section 7 to the HCP.
OTHER FUTURE REGIONAL HCPS
In addition to the regional HCPs discussed above, EPS understands that at least two
other regional HCPs have been proposed to address the gnatcatcher and CSS -- San
Bernardino Valley MSHCP and the Matrix NCCP Subregion of (northern) Orange1966
County. The planning areas for these HCPs would correspond with proposed Unit 11
and Unit 7, respectively. Preliminary indications suggest, however, that negotiations
have stalled for these plans, and that they therefore might not be considered
"reasonably foreseeable" within the context of this analysis.

Final Draft ReportEconomic Analysis of Critical Habitat Designation for California Gnatcatcher
February 24, 2004
74
III. DESIGNATION IMPACT ON PRIVATE LAND1971
DEVELOPMENT
This chapter evaluates the economic impact of section 7 and the proposed CHD on
private real estate development activities and markets. Specifically, it focuses on the
effect of section 7 and CH on the supply and demand for land used in residential and
commercial real estate development. Chapter IV addresses the economic impact of1976
section 7 and the proposed CHD public sector projects and activities. The indirect
effects of CH, such as the potential for increased uncertainty, project delay, and
additional CEQA-related costs, are estimated separately in Chapter V.
An overview of our general methodology and approach for evaluating the economic1981
impact of section 7 and the proposed CHD on private development is provided below
followed by a presentation of the analysis and estimated total economic costs.
ANALYTICAL APPROACH AND METHODOLOGY
Potential modifications to land use projects stemming from section 7 and the
designation of CH can affect landowners, consumers, and real estate markets in general. 1986
The total economic impact will depend on the scope and intensity of section 7
consultations and project modifications, the pre-existing regulatory framework in the
region, and the nature of regional land and real estate markets. In order to accurately
account for all of these factors, and to estimate the corresponding economic impacts,
this evaluation employs a series of methodological tasks, as described below (as noted1991
above, indirect effects such as time delay, uncertainty, and CEQA effects are estimated
separately in Chapter V).

Final Draft ReportEconomic Analysis of Critical Habitat Designation for California Gnatcatcher
February 24, 2004
75
1. Determine Overlap between CHD and Land Development with Federal Nexus
1996
The first step in evaluating the effect of section 7 on private land development is to
identify the amount, type and location of land included in the proposed designation.
The effect on private development only includes projects on land that can be developed
during the timeframe being considered that are also likely to have a Federal nexus. For
example, the analysis excludes non-developable areas such as parks and other2001
permanent open space (the effect of CH on public activities and major infrastructure
projects is evaluated separately in Chapter IV).
2. Identify Mitigation Associated with Section 7 and Baseline Requirements
2006
The actual effects of section 7 on applicable land development projects ultimately
depend on the type and level of project modifications likely to result from section 7
consultations. Thus, the second step is to estimate the expected modifications to land
use projects associated with section 7, including on-site land set-asides, habitat
restoration, and off-site mitigation. This step includes the subtraction of the2011
requirements associated with pre-existing regulations or land use restrictions, including
state, local, or regional laws and agreements (see Chapter II for the “baseline”
regulations relevant to the gnatcatcher).
3. Evaluate Effects on Regional Real Estate Market and associated Cost Incidence2016
The third step is to determine the significance of the additional section 7-related land
use project modifications relative to regional real estate demand and supply dynamics,
and the resulting regulatory cost incidence. The incidence or burden of the project
modification and other compliance costs will ultimately depend on their scope and2021
intensity and the nature of the regional real estate markets. The cost incidence either
falls primarily on individually affected landowners or on consumers of real estate
products (e.g., homes and commercial buildings).

Final Draft ReportEconomic Analysis of Critical Habitat Designation for California Gnatcatcher
February 24, 2004
76
The economic impacts are likely to extend beyond the regulated landowners and affect2026
the real estate market, real estate consumers, and the regional economy if: (1) the
amount of land set-aside (e.g., not developed as a result of section 7 is high relative to
the total developable land in the region, and/or (2) other compliance costs are high
relative to real estate development value and cover a significant proportion of
developable land. In these cases, landowners and developers pass on the costs to real2031
estate consumers in the form of higher prices.
Conversely, if project modification costs are low and/or section 7 only affects a small
fraction of the total developable land supply in a region, then the economic effects are
likely to be limited to the sub-set of individual landowners and/or projects with a2036
Federal nexus. In this case, the regulated landowners will not be able to pass on their
increased costs to consumers and their development projects will either relocate to
other available sites or proceed with a reduced land value.
4. Estimate Economic Impacts2041
The fourth step involves taking the data and conclusions from the first through third
steps and estimating the potential economic costs associated with section 7. The
approach to economic cost estimation is different depending on the cost incidence. If
the project modification requirements do not affect the overall regional real estate2046
market dynamics due to the limited scale of the designation, cost impacts are borne by
the regulated landowners and reduced land values are estimated. The economic costs
are estimated based on the loss in land value associated with required on-site set-asides,
increased mitigation costs, and other project modifications incurred by individual
landowners/developers. 2051
If, however, the scale and intensity of the CHD is sufficient to affect regional real estate
dynamics, regulatory requirements will primarily affect consumers through some mix
of increased real estate prices and reduced real estate production. Producers or
landowners will also be affected although those with land outside of the designation 2056

Final Draft ReportEconomic Analysis of Critical Habitat Designation for California Gnatcatcher
February 24, 2004
37 Consu m er surp lu s is the d ifference betw een the to ta l va lue consu m ers rece ive from a par t icu largood and the total am ou nt th ey p ay for that good . W hen the p rice of a good goes u p , consu m ersu rp lus falls s ince a p ort ion of the consu m ers fal l ou t of the m arket al together an d the rem aind erp ay a h igher p rice. Producer surplus, alternatively, is the difference between the total marketvalue associated with a particular level of output and the total market costs associated withsupplying that level of output.
77
area will actually gain from the reduced supply and corresponding price increase. The
total economic effect is measured through the change in producer and consumer2061
surplus, a measure of social welfare.37
PROJECTED LAND DEVELOPMENT WITH A FEDERAL NEXUS
A total of about 41,517 acres out of the 495,795 acres proposed for designation are expected to
overlap with projected land development through 2025 with a Federal nexus.
2066
Following the methodology outlined above, this section estimates the number of acres
of projected development within proposed CH that will involve a Federal nexus. This
calculation starts with the total number of acres within the proposed CH area and
deducts from this the amount of land that is unlikely to be affected by the designation
(e.g., there is no nexus, or it would not be developed in any case). A summary of this2071
calculation is provided in Table 8 and further described below.
PRIMARY DATA AND TIME HORIZON
The estimated number of acres of private development potentially affected by CH is
based on the designation boundary maps provided by the Service and regional
demographic projections by census tract. Specifically, Geographic Information Systems2076
(GIS)-level maps of the proposed CH boundaries were correlated with census-tract-
level land use projections provided by the Southern California Association of
Governments (SCAG), and the San Diego Association of Governments (SANDAG).
2081

Table 8Calculation of Projected Growth Acres with a Federal Nexus
Critical HabitatUnit
Unit 1 25,100 12,868 1,684 1,162
Unit 2 16,075 13,902 1,821 1,256
Unit 3 32,465 27,241 6,769 4,670
Unit 4 8,690 11 6 4
Unit 5 34,705 27,889 6,864 4,736
Unit 6 44,340 34,027 4,909 3,387
Unit 7 5,775 4,468 117 81
Unit 8 7,160 6,991 80 55
Unit 9 22,595 17,595 1,498 1,034
Unit 10 176,720 164,085 22,650 15,628
Unit 11 14,990 12,581 4,502 3,106
Unit 12 3,890 2,032 213 147
Unit 13 103,290 101,983 9,057 6,250
Total 495,795 425,674 60,170 41,517
(1) Excludes proposed acres occupied by parks and other public lands not subject to private development.(2) Total projected growth for portions of all census tracts within each unit that were proposed for critical habitat designation. For census tracts partially covered by critical habitat, growth acres within critical habitat were estimated assuming even distribution of projected growth throughout all developable areas in the census tract.(3) Assumes 69 percent of acres in each unit have a Federal nexus though the USACE as described in Chapter III and Appendix B.
in CH (2025) [2] Federal Nexus (3)Growth Acres
Projected GrowthAcres with a
Total ProjectedTotal AcresProposed
for CH
Proposed CH Acres Available
for Development (1)
Economic & Planning Systems, Inc. 2/26/2004 H:\12594gnatcatcher\Report\DEA_Feb2004\EmailTables_Feb2004.xls

Final Draft ReportEconomic Analysis of Critical Habitat Designation for California Gnatcatcher
February 24, 2004
79
SCAG and SANDAG are quasi-governmental agencies responsible for providing
official demographic projections for the counties of Los Angeles, Ventura, Riverside,
San Bernardino, and Orange counties, and San Diego County, respectively.2086
The timeframe for this analysis is 2025, which corresponds to the time frame for the
regional demographic and economic projections provided by SCAG (rather than 2030 as
provided by SANDAG). Because EPS does not have adequate data to provide reliable
forecasts beyond 2025 for five out of the six counties included in this analysis, the SCAG2091
time horizon was deemed most appropriate. The land use projections are calculated as
undeveloped acres slated for residential, retail, office, or industrial development.
SANDAG provides acreage estimates for these land use categories while SCAG data
were converted to an acreage format based on assumptions regarding employees and
households per acre. These calculations are further described in Appendix A. A2096
summary of projected land development for each County based on SCAG and
SANDAG data is shown in Table 9.
PROJECTED GROWTH IN PROPOSED CRITICAL HABITAT
Prior to screening which census tracts intersect with proposed CH, land areas identified
as parks, permanent open space, and other publicly owned areas are removed from the2101
analysis of private real estate development. This analysis assumes future private
development will not occur in these areas. The potential for public land development
activities on publicly owned lands is addressed in Chapter IV. As shown in Table 8,
approximately 426,000 acres of proposed CH remain available for private development.
2106
A GIS analysis was performed to identify all census tracts that intersect the remaining
proposed CH acres. For census tracts that were partially covered by CH, projected
growth was assumed to be evenly distributed throughout all land available for
development in that census tract. The amount of growth projected within CH was then
2111

Table 9Projected Growth Acres by County
County Source TotalResidential Office Industrial Retail
San Diego County SANDAG 252,614 871 6,701 5,063 265,248
Orange County SCAG 11,917 27,430 19,698 8,815 67,860
Riverside County SCAG 46,236 87,041 52,517 33,494 219,288
San Bernardino County SCAG 35,350 31,578 21,737 11,602 100,266
Los Angeles County SCAG 71,871 27,670 -33,101 7,462 73,902
Ventura County SCAG 4,737 7,204 4,307 2,416 18,663
Total 422,724 181,795 71,858 68,852 745,229
Sources: SCAG; SANDAG; Economic & Planning Systems, Inc.
Projected Growth Acres in County by 2025
Economic & Planning Systems, Inc. 2/26/2004 H:\12594gnatcatcher\Report\DEA_Feb2004\EmailTables_Feb2004.xls

Final Draft ReportEconomic Analysis of Critical Habitat Designation for California Gnatcatcher
February 24, 2004
81
estimated according to the amount of land available for development in CH, relative to
the amount available in that census tract as a whole. Census tracts were grouped
according to CH unit, and projected growth was summed by development type2116
(residential, office, etc.). As summarized in Table 8, approximately 60,000 acres of
growth are projected in proposed CH through 2025.
FEDERAL NEXUS ASSUMPTIONS
Based on input from the Service and the development community, as well as a review
of historical section 7 consultations involving the gnatcatcher, this analysis assumes that2121
the primary Federal nexus for future private development activities is the issuance of
section 404(b) permits by USACE. Under section 404(b) of the Clean Water Act, the
USACE regulates development in jurisdictional “waters of the U.S.,” which are often
defined broadly and potentially encapsulate a large amount of future development.
2126
A GIS analysis was performed to estimate the approximate percentage of land proposed
for CH that the USACE would consider “waters of the U.S.” The GIS analysis
compared the relationship between United States Geological Survey (USGS) “blue line”
stream networks and “waters of the U.S.,” as identified by the USACE in a detailed
survey of the San Jacinto/Santa Margarita drainage basin in Riverside County. A digital2131
elevation model was used to estimate the prevalence of “waters of the U.S.” relative to
slope classes and “blue line” stream coverage. Results of this “pilot area study” were
then applied to slope classes and “blue line” streams throughout the entire proposed
CH area. This analysis estimates that approximately 0.03 percent of the total land area
proposed for CH contains “waters of the U.S..” Detailed calculations and a summary2136
report are presented in Appendix B.
This analysis recognizes that, in practice, the Service considers the entire project area
when evaluating species and habitat impacts, rather than only that portion of the site
containing “waters of the U.S.” (i.e., the Service’s “action area” is often larger than the2141
USACE’s “scope of analysis”). This analysis assumes an average future project size of
300 acres, based on a review of previous private development projects that have
required section 7 consultation for the gnatcatcher. A GIS analysis using a 300-acre grid
system determined that approximately 69 percent of land within proposed CH would

Final Draft ReportEconomic Analysis of Critical Habitat Designation for California Gnatcatcher
February 24, 2004
82
be subject to a Federal nexus through the USACE. Detailed calculations and a summary2146
report are also presented in Appendix B. As shown in Table 8, this analysis estimates
that 41,517 acres of projected growth with a Federal nexus will occur within proposed
CH through 2025.
REGULATORY BASELINE AND SECTION 7 COMPLIANCE
Subtracting the baseline regulatory requirements, a total of about 25,233 acres of projected land2151
development through 2025 will face additional regulation under section 7. Regulatory
requirements will include the set-aside of about 12,500 acres on-site, off-site preservation of
about 8,000 acres, and restoration of about 2,800 acres, among others.
Land developers in California often implement a variety of measures designed to off-set2156
or mitigate impacts to sensitive biological resources. As discussed in Chapter II, the
amount and type of mitigation associated with CSS, the gnatcatchers’ predominant
habitat, will be determined both through the section 7 process and through enforcement
of a number of baseline regulations that predate the designation of CH. Thus, this
analysis distinguishes between the CSS mitigation clearly required due to regulatory2161
provisions other than section 7 and the incremental CSS mitigation likely to occur in
association with section 7 consultation alone.
As summarized in Table 10, this analysis estimates that approximately 41,500 acres of
future private land development through 2025 will require section 7 consultation due to2166
a Federal nexus through the USACE. Projected growth acres in CH that are subject to
CSS mitigation under the 4(d) Rule are subtracted, leaving approximately 25,000 acres
growth acres estimated to be subject to some form of habitat mitigation (e.g. on-site and
off-site habitat set-aside and/or restoration) related solely to section 7. Finally, an
estimated 12,485 acres, out of the 25,000 acres, will be removed from the private2171
development pipeline as a result of the on-site habitat set-aside resulting from section 7
consultations. This estimate of “net” acres subject to mitigation solely in association
with section 7 consultation, and the typical project modifications arising from that

Table 10Calculation of Mitigation Acres Associated with Section 7
Critical Habitat On-Site Off-Site CSSUnit Set-Aside Preservation Restoration
Unit 1 1,162 72 4 0 0
Unit 2 1,256 58 3 0 0
Unit 3 4,670 215 12 0 0
Unit 4 4 0 0 0 0
Unit 5 4,736 292 16 0 0
Unit 6 3,387 426 275 0 0
Unit 7 81 100 64 0 0
Unit 8 55 0 0 0 0
Unit 9 1,034 951 482 0 265
Unit 10 15,628 14,376 7,745 7,982 42
Unit 11 3,106 2,858 2,086 0 215
Unit 12 147 135 41 0 68
Unit 13 6,250 5,750 1,757 0 2,207
Totals 41,517 25,233 12,485 7,983 2,798
(1) From Table 8.(2) Excludes projected growth acres in areas covered by the 4(d) Rule. (3) Calculated by applying "net" section 7 mitigation ratios to "Projected Growth Acres Affected by Section 7." These values reflect mitigation implemented through the section 7 process, and do not include acres mitigated through CEQA. See Appendix E for detailed calculations
Estimated CSS Mitigation Acres (3)Projected GrowthAcres with a
Federal Nexus (1)
Projected GrowthAcres Affected by Section 7 (2)
Economic & Planning Systems, Inc. 2/26/2004 H:\12414\Report\EmailTables_Feb2004.xls

Final Draft ReportEconomic Analysis of Critical Habitat Designation for California Gnatcatcher
February 24, 2004
38Several baseline regulations are also relevant to calculating the “net” section 7 effect in the areas
proposed for exclusion. Specifically, private development will not occur in reserve areas alreadyestablished under project-specific HCP agreements. In addition, approved MSCP subarea plans(i.e. San Diego County and the cities of San Diego and La Mesa) are expected to result in CSSmitigation requirements identical to section 7 , so the “net” m itigation ratio associated withsection 7 would be zero. The only exception is the approved subarea plan within the City ofPoway where it is conservatively assumed that future applicants would choose to pursueindependent section 7 consultation rather than participate in the city’s HCP.
84
consultation, serve as the basis for determining the effect on regional real estate market
dynamics and calculating the total costs by unit. The derivation of these estimates are
further described below.
REGULATORY BASELINE REQUIREMENTS2181
To determine the “net” level of CSS mitigation attributable to section 7, the private land
development projections were adjusted to account for the following baseline
requirements:38
C Central/Coastal Orange County NCCP (Unit 7): The NCCP contains areas for
which mitigation has already been secured (e.g., the El Toro Reuse Area and the2186
Irvine Ranch Reserve) and areas for which mitigation must be negotiated
independently. The reserve areas covered by the plan have already been
mitigated in full, so the “net” mitigation associated with section 7 is zero. In
contrast, future development in EUAs is not covered by the NCCP, so all project
modifications (e.g., mitigation) in these areas will be associated with section 7.2191
C 4(d) Rule (Units 1-6, 8): All areas outside the jurisdiction of approved
HCPs/NCCPs in Units 1 through 6 and all of Unit 8 are subject to regulation
under the 4(d) Rule. CSS mitigation for projects that meet all 4(d) Rule criteria is
assumed to be consistent with section 7 and attributable to the 4(d) Rule. Thus,
for these projects the “net” mitigation ratio associated with section 7 is zero. 2196
However, this analysis assumes that 5 percent of future projects in 4(d) Rule
areas in San Diego County (Units 1-5) fail to meet 4(d) criteria and are therefore
subject to mitigation associated with section 7.
Final Draft ReportEconomic Analysis of Critical Habitat Designation for California Gnatcatcher
February 24, 2004
85
For Unit 6 (Orange County), the Service’s records indicate that no past projects
have been denied approval under the 4(d) Rule. However, this analysis assumes2201
that all residential growth projected in the vicinity of the proposed Foothill-
South toll road will not qualify for 4(d) approval, and will be addressed by
section 7 and other baseline regulations. The scale of this proposed
development makes 4(d) approval unlikely. Finally, staff from the City of
Rancho Palos Verdes (Unit 8) indicate that all future projects will meet the2206
requirements of 4(d), resulting in no additional section 7-related mitigation
costs.
C CEQA (Units 1-6, 7, 9): As described in Chapter II, this analysis assumes that
CEQA constitutes a baseline requirement only in San Diego and Orange
counties. Specifically, based on input from Service and DFG staff, lead agencies2211
in San Diego and Orange counties are assumed to require 2-to-1 mitigation for
CSS impacts under CEQA. Any difference between mitigation standards
associated with section 7 and this 2-to-1 baseline is considered the “net”
mitigation ratio for that county that is attributable to section 7. Lead agencies in
Riverside, San Bernardino, Los Angeles, and Ventura counties are assumed not2216
to require CSS mitigation under CEQA, so no baseline condition exists in these
counties.
MITIGATION STANDARDS
The economic impact of CHD on private sector land development will be directly
linked to the type and level of CSS mitigation likely to be associated with future section2221
7 consultations. Thus, this analysis reviewed a number of historical section 7 BOs to
generate county-specific estimates of typical “effective mitigation ratios” following
implementation of the conservation measures described in each BO. The majority of
BOs reviewed were issued following the designation of gnatcatcher CH in 2000, so the
resulting mitigation standards provide an accurate estimate of section 7 consideration of2226
both jeopardy and adverse modification standards. A detailed summary of each of the
BOs is presented in Appendix C.

Final Draft ReportEconomic Analysis of Critical Habitat Designation for California Gnatcatcher
February 24, 2004
39
The net effect of the presence of other Federally-listed species in the proposed critical habitatareas for the gnatcatcher is that the number of consultations conducted for the gnatcatcher aloneis likely to be smaller than w ould be expected in the absence of these species. Indeed, most pastconsultations on the gnatcatcher have involved at least one or two other species per consultation. Thus, the cost of a consultation that involves the gnatcatcher may not be fully attributable to thepresence of this species or its habitat. Nonetheless, because consultations must consider projectrelated effects to each listed species separately, a certain amount of research and time will bespent on the gnatcatcher regardless of the presence of other species. In order to present aconservative estimate of the economic impacts associated with the implementation of section 7,this analysis assumes that all future section 7 consultations within the extant boundaries of theproposed critical habitat are fully attributable to the presence of the gnatcatcher and its habitat.
40Baseline mitigation under CEQA typically occurs via on-site set-aside requirements. When
possible, the 2-to-1 CEQA baseline is thus subtracted from the relevant on-site section 7 ratio tocalculate the “net” on-site set-aside ratio. In the case of San Diego County, however, the section 7on-site set-aside ratio was less than 2 (i.e., 0.77-to-1). In this case, the CEQA baseline w assubtracted from the total section 7 m itigation ratio (2.06-to-1), yielding a “net” ratio of 0.06-to-1. This “net” ratio w as applied as an on-site ratio throughout the subsequent calculations.
86
While an attempt was made to obtain BOs that represent a range of development
types and a diverse geographic distribution, it is not possible to collect a discrete2231
sample that is perfectly representative of all future projects. In particular, fewer BOs
were provided for certain geographic areas than for others, and many of the reviewed
BOs involve impacts to breeding gnatcatcher pairs and/or multiple listed species. In
such cases, the calculated “effective mitigation ratios” may overestimate the actual
amount of future mitigation in areas that do not contain breeding pairs or than2236
contain only the gnatcatcher and/or its habitat.39 While the average “effective
mitigation ratios” calculated from these sample BOs are generally considered
representative of likely future section 7 outcomes, these potential sources of error are
nonetheless worthy of mention. It is also worth noting that applying these mitigation
ratios to future projects is more likely to overestimate than underestimate actual2241
section 7 costs attributable to the gnatcatcher.
Table 11 summarizes the resulting CSS mitigation ratios—divided among on-site set-
aside, off-site preservation, and restoration—and sorted by county. The reported ratios
represent the ultimate level of CSS mitigation that is enforced in each county, and thus2246
reflect a combination of pre-existing baseline requirements and section 7 consultations.
The “net” mitigation ratio associated with section 7 deducts the typical mitigation
standards that would apply under CEQA independent of section 7 (in Orange and San
Diego counties only).40

Table 11Average Coastal Sage Scrub Mitigation Ratios by County
CountyOn-site Off-site Restoration Total
San Diego 0.77 1.28 0.01 2.06 0.06 (2) (3)(SD Military) 0.00 2.00 0.00 2.00 same as "Reported Ratios"
Riverside 1.14 1.22 0.00 2.37 same as "Reported Ratios"
San Bernardino 2.70 0.00 0.40 3.10 same as "Reported Ratios"
Orange 3.82 0.00 0.00 3.82 1.82 (2)
Los Angeles 0.44 0.00 0.93 1.37 same as "Reported Ratios"
Ventura (3) N/A N/A N/A N/A same as Los Angeles
Average, All Counties 1.26 1.04 0.08 2.39
(1) Ratio reflects the number of implemented mitigation acres for every acre of CSS habitat disturbed, as determined from the selected Biological Opinions summarized in Table C-1.(2) This "net" ratio reflects deduction of assumed CEQA 2-to-1 baseline mitigation ratio.(3) This ratio is applied to subsequent calculations as "on-site set-aside," which yields the most conservative cost estimate.(4) No biological opinions were obtained from Ventura. Los Angeles ratios were used as a proxy.N/A = Not available
Reported Mitigation Ratios (1) "Net" Section 7Mitigation Ratios
Economic & Planning Systems, Inc. 2/26/2004 H:\12594gnatcatcher\Report\DEA_Feb2004\EmailTables_Feb2004.xls

Final Draft ReportEconomic Analysis of Critical Habitat Designation for California Gnatcatcher
February 24, 2004
88
NET AREA AFFECTED BY SECTION 7
The “net” mitigation ratios described above were applied to the projected growth acres
with a Federal nexus to calculate project modifications and conservation measures (e.g.,
“mitigation”) attributable to section 7. Detailed calculations by development type are2256
shown in Appendix E, with a summary of projected mitigation acres associated with
section 7 provided in Table 10. As shown, projected “net” CSS mitigation associated
with section 7 is estimated to include approximately 12,500 acres of on-site set-aside,
8,000 acres of off-site preservation, and 2,800 acres of restoration.
SIGNIFICANCE FOR REGIONAL REAL ESTATE MARKET2261
The scale and intensity of the additional project modification requirements associated with
section 7 and CHD are not sufficient to affect regional real estate market dynamics. As a result,
the cost burden of project modifications falls on the regulated landowners.
The cost incidence or economic burden of land development project modifications2266
stemming from section 7 will be determined by their impact on the regional real estate
market (i.e., on overall real estate production and prices). If project modification
requirements are expected to significantly constrain development opportunities in a
regional real estate market, the economic burden will be felt by consumers as well as
landowners and developers. This is most likely to occur in regions where development2271
opportunities are already limited and project modifications and associated on-site set-
aside requirements affect a significant proportion of remaining developable land.
Conversely, if project modifications due to section 7 represent a relatively insignificant
component of total market supply, then the economic burden will be felt primarily by
individual landowners / developers rather than consumers at large.2276
To determine the significance of section 7-related project modifications for regional real
estate markets, the lost development potential associated with the project modifications
should be compared to the total regional development potential. Specifically, on-site
land set-aside requirements should be compared with the total supply of developable2281

Final Draft ReportEconomic Analysis of Critical Habitat Designation for California Gnatcatcher
February 24, 2004
41 Off-site set-aside requirements are not included in this analysis as they are assumed to besatisfied by the large amount of non-developable CH land.
89
land in the region.41 In reality, accurate estimates of total regional development
potential are not readily available. Consequently, for the purposes of this analysis,
projected acres of growth through 2025 in the five counties covering the CHD are used
as proxy for regional market supply.
2286
A comparison of the total acres of on-site habitat set-aside stemming from section 7
consultations with the total projected acres of growth through 2025 for each county is
provided in Table 12. As shown, the estimated habitat set-aside represents
approximately 1.7 percent of future growth in the six counties through 2025. San Diego
County, Orange County, and Los Angeles County are the lowest at 0.01 percent, 0.82291
percent, and 1.7 percent, respectively; San Bernardino County and Riverside County,
both with ample developable land, follow with 2.4 percent and 3.4 percent, respectively;
and Ventura County is the highest, with 4.2 percent. If the areas proposed for exclusion
from CHD are included, the estimated habitat set-aside as a percent of future growth in
the six counties increases by less than 0.1 percent. This marginal difference is due to the2296
fact that most of the excluded areas are already covered by existing baseline
regulations.
It is important to note that the 1.7 percent estimate provided above represents an over-
estimate of the section 7 effect on regional development opportunities. The following2301
factors suggest that the section 7-related on-site habitat set-aside will actually represent
a much smaller proportion of the regional real estate market.
1. Regional land supply is greater than projected demand through 2025. The
above estimate relies on projected land consumption through 2025 as a proxy for2306
long-term supply. In reality, the long-term land supply is greater than demand
through 2025 because many of the communities within the six-county area are
expected to reach build-out significantly beyond that date.

Table 12Regional Significance of Acres Impacted by Section 7
County Acres Residential Office Industrial Retail Total Set-Aside
On-site (1)
San Diego County 252,614 871 6,701 5,063 265,248 37 0.01%
Orange County 11,917 27,430 19,698 8,815 67,860 566 0.8%
Riverside County 46,236 87,041 52,517 33,494 219,288 7,444 3.4%
San Bernardino County 35,350 31,578 21,737 11,602 100,266 2,391 2.4%
Los Angeles County 71,871 27,670 -33,101 7,462 73,902 1,258 1.7%
Ventura County 4,737 7,204 4,307 2,416 18,663 790 4.2%
Total 422,724 181,795 71,858 68,852 745,229 12,485 1.7%
(1) The total on-site set-aside acreage for each Unit (total residential, office, industrial, and retail, as shown in Appendix E) was allocated among the counties composing that Unit according to the relative proportion of proposed CH available for development (see Table 8).
Sources: SCAG; SANDAG; Economic & Planning Systems, Inc.
County Growth
Projected Growth Acres in County by 2025 Acres Set-asideas % of Projected
Economic & Planning Systems, Inc. 2/26/2004 H:\12594gnatcatcher\Report\DEA_Feb2004\EmailTables_Feb2004.xls

Final Draft ReportEconomic Analysis of Critical Habitat Designation for California Gnatcatcher
February 24, 2004
91
2. Developers will adjust to reduced land supply by increasing density. The
above estimate assumes that development in areas unaffected by CHD cannot
occur at higher densities. In practice, densification and revitalization of under-
utilized “in-fill” sites can continue to provide significant development2316
opportunities in land constrained markets.
3. Developers will integrate on-site habitat set-asides into project design. The
above analysis assumes that the set-aside acres represent a 1-to-1 reduction in
development capacity. In reality, many developers will incorporate habitat2321
reserve acres into their project design, thereby minimizing the impact on total
project size. In addition, habitat reserves often serve as an open space amenity
that can enhance the value of the remaining developable areas.
Given the factors described above, and the fact that 1.7 percent is itself a relatively small2326
component of real estate supply, the project modifications associated with section 7 are
not expected to have a significant impact on the dynamics of the regional real estate
market. Hence, housing prices in each county are not expected to be affected, and
regulated landowners will bear the cost incidence associated with section 7 and CHD.
Some projects will be distributed to other parts of the respective counties, while other2331
projects may proceed with higher mitigation costs and lower land values.
ESTIMATED PROJECT MODIFICATION COSTS
“Co-extensive” project modification costs associated with the listing and proposed CHD are
estimated to be approximately $743 million through 2025. These costs will be borne by regulated2336
landowners and experienced through lower land values. These estimates do not include
consideration of any potential increases in land values associated with the amenity values of open
space. Landowners outside of CH may experience increased land values as some growth is
distributed towards their land.
2341
The cost of section 7 was estimated by calculating:
1. the loss in land value for acres set-aside under “net” section 7 requirements,
2. the cost of acquiring off-site mitigation acres under “net” section 7 requirements,

Final Draft ReportEconomic Analysis of Critical Habitat Designation for California Gnatcatcher
February 24, 2004
92
3. the cost of restoring CSS habitat under “net” section 7 requirements, and 2346
4. the costs to implementing other project modifications (biological monitoring,
exclusionary fencing, etc.) for each project.
These costs are described further below, and are summarized for each proposed CH
unit in Table 13. Detailed time-series calculations are presented in Appendix E. Costs2351
were calculated assuming proposed development is distributed evenly through 2025,
and assuming a discount rate of 12 percent to account for the opportunity cost of
investment decisions in the private real estate development market.
Residential, commercial, and market data for each of the six counties were used to2356
estimate the cost, or lost value, of on-site set-aside acres. A summary of raw market
data is presented in Table 14. Appendix D shows assumptions and detailed
calculations of how these data were used to develop per-acre estimates of residual land
values for each development type. The residual land value is an estimate of the value of
a raw, unimproved parcel with no infrastructure. This measure is appropriate because2361
a developer seeking project entitlement will not invest money in infrastructure or other
improvements on land designated as a habitat set-aside through the consultation
process.
The analysis also collected market data from a number of private CSS mitigation banks2366
in relevant counties (no private mitigation banks exist in Los Angeles or Ventura
counties) to determine average off-site mitigation prices by county. A summary of
these data and the estimated averages by county are presented in Table 15. To estimate
restoration costs, this analysis assumes an average per-acre cost of $30,000 across the
entire proposed CH area. 2371
Finally, based on a review of the section 7 BOs summarized in Appendix C, this
analysis estimates that each future private development project will incur costs related
to full-time biological monitoring during construction activities, the construction of
exclusionary fencing to protect adjacent gnatcatcher individuals and habitat, and the2376
development and implementation of an employee education program. This analysis

Table 13Private Land Development Project Modification Costs
Critical Habitat On-Site Off-Site CSS Other Project TotalUnit Set-Aside Preservation Restoration Modifications
Unit 1 $472,600 $0 $0 $919,400 $1,392,000
Unit 2 $414,300 $0 $0 $994,100 $1,408,400
Unit 3 $1,403,700 $0 $0 $3,696,000 $5,099,700
Unit 4 $1,200 $0 $0 $3,100 $4,300
Unit 5 $2,071,200 $0 $0 $3,748,100 $5,819,300
Unit 6 $40,541,500 $0 $0 $2,680,500 $43,222,000
Unit 7 $4,600,200 $0 $0 $64,000 $4,664,300
Unit 8 $0 $0 $0 $43,800 $43,800
Unit 9 $33,519,600 $2,000 $2,669,000 $818,100 $37,008,700
Unit 10 $334,138,600 $42,861,400 $422,900 $12,367,400 $389,790,400
Unit 11 $80,919,300 $0 $3,110,500 $2,458,300 $86,488,100
Unit 12 $2,491,200 $0 $878,500 $116,200 $3,485,900
Unit 13 $122,056,200 $0 $37,383,400 $4,945,500 $164,385,100
Total $622,629,600 $42,863,500 $44,464,300 $32,854,500 $742,811,800
All dollar values have been rounded to the nearest hundred; summed totals may not add exactly.(1) Assumes a discount rate of 12%.
Project Modification Costs (1)
Economic & Planning Systems, Inc. 2/26/2004 H:\12594gnatcatcher\Report\DEA_Feb2004\EmailTables_Feb2004.xls

Table 14Residential and Commercial Market Data
County/Region
Office (2) Industrial (3) Retail
Los Angeles $394,230 $193 $43 $144
Riverside (4) $250,923 $125 $41 $108
San Bernardino (5) $202,240 $125 $41 $108
Orange $464,304 $220 $59 $142
San Diego $410,435 $195 $65 $124
Ventura (6) $415,458 $175 $69 N/A
N/A: Not Available(1) 2002 sales prices are reported by RAND in 1998 dollars. These values were adjusted to 2002 dollars assuming a 3% annual inflation rate.
(3) Reported sales price for suburban space between 100,000 and 250,000 square feet.(4) & (5) Commercial Sales Price for these counties come from the sales price of Inland Empire.(6) Retail data for Ventura County was not available, so data for Los Angeles was used as a proxy.
Average Residential Sales Price (1)
Commercial Sales Price ($/SqFt)
(2) Weighted average, class A space outside central business district. Rates for San Diego are CBD space.
Source: RAND; Marcus & Millichap Retail Research Report, November 2002; Economic & Planning Systems, Inc.
Economic & Planning Systems, Inc. 2/26/2004 H:\12594gnatcatcher\Report\DEA_Feb2004\EmailTables_Feb2004.xls

Table 15Coastal Sage Scrub Mitigation Bank Prices
Average PriceLow High
Riverside $6,500 $9,500
San Diego $17,125 $19,750
Orange $75,000 $78,333
Average, All Counties $28,846 $31,692
Per Acre Cost
Notes: no approved CSS mitigation banks are located in Los Angeles or Ventura counties.
Source: personal communication with various mitigation bank personnel, February 2003.
Economic & Planning Systems, Inc. 2/26/2004 H:\12594gnatcatcher\Report\DEA_Feb2004\EmailTables_Feb2004.xls

Final Draft ReportEconomic Analysis of Critical Habitat Designation for California Gnatcatcher
February 24, 2004
42
Based on query of USACE consultation database through January 15, 2003, provided by MichaelJewel, Acting Chief, Regulatory Branch, USACE Los Angeles D istrict.
96
assumes that a single full-time biological consultant will be employed for one year at an
annual cost of $85,000, that exclusionary fencing will cost approximately $18,000 per
project, and that developing an employee education program will cost $10,000 per2386
project.
Based on records provided by the USACE, there have been approximately 88 section 7
consultations for private development projects involving gnatcatcher CH since October
24, 2000, when the Service designated CH for approximately 514,000 acres.42 Adjusting
this rate to the current proposed designation of 495,795 acres yields an average annual2391
rate of 37.6 consultations per year, or 866 future section 7 consultations through 2025.
This analysis assumes that each of these consultations will involve implementation of
the additional project modifications described above, resulting in total project
modification costs of approximately $743 million, as summarized in Table 13.
ESTIMATED ADMINISTRATIVE CONSULTATION COSTS2396
Administrative consultation costs are estimated to be approximately $5.7 million through 2025.
As described above, this analysis assumes that 866 future private residential projects
will require section 7 consultation through 2025, based on a historical consultation rate.
Each of these is expected to be a formal consultation, and consultations are assumed to2401
be distributed evenly through 2025. Table 16 shows the estimated administrative costs
for these consultations. These costs were estimated using the consultation cost model
described and shown in Appendix F. Total costs were calculated by multiplying the
number of consultations by the average cost per participant. Because this calculated
value essentially represents the administrative costs assuming all consultations2406
occurred in Year 1, it was adjusted to reflect a discount rate of 12 percent.

Table 16Private Land Development Costs
Critical Habitat Project Administrative TotalUnit Modification Costs Costs (2)
Unit 1 $1,392,026 $160,097 $1,552,123
Unit 2 $1,408,444 $173,110 $1,581,554
Unit 3 $5,099,691 $643,577 $5,743,268
Unit 4 $4,267 $538 $4,804
Unit 5 $5,819,257 $652,654 $6,471,911
Unit 6 $43,222,017 $466,755 $43,688,772
Unit 7 $4,664,263 $11,148 $4,675,412
Unit 8 $43,756 $7,619 $51,376
Unit 9 $37,008,671 $142,456 $37,151,127
Unit 10 $389,790,380 $2,153,533 $391,943,914
Unit 11 $86,488,072 $428,058 $86,916,129
Unit 12 $3,485,931 $20,237 $3,506,168
Unit 13 $164,385,059 $861,162 $165,246,220
Total $742,811,835 $5,720,944 $748,532,779
(1) Assumes a discount rate of 12%. (2) Average administrative consultation costs (of low and high) were allocated among units in proportion to the number of projected growth acres in each unit with a Federal nexus (see Table 8).
Total Section 7 Costs (1)
Economic & Planning Systems, Inc. 2/26/2004 H:\12414\Report\EmailTables_Feb2004.xls

Final Draft ReportEconomic Analysis of Critical Habitat Designation for California Gnatcatcher
February 24, 2004
98
SUMMARY OF PRIVATE LAND DEVELOPMENT IMPACTS2411
Total “co-extensive” costs associated with section 7 regulation of private development in
proposed CH are estimated to be approximately $749 million through 2025.
Table 16 summarizes the estimated project modification, administrative, and total costs
due to section 7 regulation of private development in proposed CH for the gnatcatcher. 2416
The bulk of these costs are borne by regulated landowners. As shown in Table 13, the
bulk of these costs (approximately $623 million) are primarily associated with the loss in
development value of land required for on-site set-aside. This impact is a result of the
on-site set-aside of approximately 12,500 acres, which represents about 1.7 percent of2421
total projected development within the six-county region through 2025. This degree if
impact is assumed not to affect the dynamics of the regional real estate market, housing
prices are not expected to be affected, and regulated landowners will bear the cost
incidence associated with section 7 regulation.
2426

Final Draft ReportEconomic Analysis of Critical Habitat Designation for California Gnatcatcher
February 24, 2004
43
The public agency officials contacted for this analysis provided data and analysis for thecombined CH areas proposed for inclusion and exclusion. The estimates provided in the text onareas proposed for inclusion only are scaled down based on the proportional reduction in CHacres. The estimates for the combined inclusion and exclusion CH areas are provided in Table 5.
44
The project modification costs calculated in Tables G-1 through G-19 were based on public agencyinterviews conducted prior to publication of the proposed rule. Agencies were asked to estimateimpacts assuming all known CSS was proposed as CH. The impact estimates summarized in Table 3and Table 17 were calculated by multiplying the estimates in Appendix G by the project-specificacreage-adjustm ent factors indicated in each Appendix table.
99
IV. IMPACT OF DESIGNATION ON PUBLIC LAND
DEVELOPMENT
This chapter evaluates the economic impact of the proposed CHD on public projects
and activities, such as major utility or infrastructure projects, that have a Federal nexus.
The discussion includes a description of the activity, how the activity would be affected,2431
and a calculation of the associated costs due to section 7.43
A summary of administrative and project modification costs for public projects and
activities is shown in Table 17 – again, these estimates are of “co-extensive” section 7
costs, attributable to both the listing and the proposed designation. Detailed
calculations of project modifications and costs by agency/project are presented in2436
Appendix G.44 The consultation cost model is provided in Appendix F. The estimated
project modification costs summarized in the text below were calculated using a
discount rate of 7 percent, which is consistent with OMB guidelines.
TRANSPORTATION AND ROAD CONSTRUCTION
This analysis used data from the California Department of Transportation (Caltrans)2441
regarding future road construction projects within the proposed CH area. Though
Caltrans is a State agency and its projects do not necessarily require section 7
consultation, many of its projects receive funding from the Federal Highway
Administration (FHWA) and many impact “waters of the United States” under USACE
2446

Table 17Public Land Development Costs
Critical Habitat Project Modification Administrative TotalUnit Costs (2) Costs (3)
Unit 1 $838,500 $88,700 $927,200
Unit 2 $619,100 $95,900 $715,000
Unit 3 $1,229,600 $356,700 $1,586,200
Unit 4 $2,444,600 $300 $2,444,900
Unit 5 $1,159,300 $361,700 $1,521,000
Unit 6 $41,889,800 $258,700 $42,148,400
Unit 7 $219,500 $6,200 $225,700
Unit 8 $288,900 $4,200 $293,200
Unit 9 $1,065,600 $78,900 $1,144,500
Unit 10 $45,761,300 $1,193,500 $46,954,800
Unit 11 $3,945,200 $237,200 $4,182,400
Unit 12 $163,200 $11,200 $174,400
Unit 13 $4,334,000 $477,200 $4,811,200
Total $103,958,600 $3,170,500 $107,129,000
All dollar values have been rounded to the nearest hundred; summed totals may not add exactly.
(1) Assumes a discount rate of 7%. (2) Project modification costs were allocated among units assuming area-weighted distribution among 'relevant units,' as indicated in Table 3.(3) Average administrative consultation costs (of low and high) were allocated among units in proportion to the number of projected growth acres in each unit with a Federal nexus (see Table 8).
Total Section 7 Costs, Scenario A (1)
Economic & Planning Systems, Inc. 2/26/2004 H:\12414\Report\EmailTables_Feb2004.xls

Final Draft ReportEconomic Analysis of Critical Habitat Designation for California Gnatcatcher
February 24, 2004
101
jurisdiction, both of which constitute Federal nexuses under section 7. The four
Caltrans regulatory districts that overlap with proposed gnatcatcher CH include;
District 7 (Los Angeles County), District 8 (Riverside County), District 11 (San Diego2451
County), and District 12 (Orange County).
In general, Caltrans personnel were unable to provide detailed estimates of future
projects that will require section 7 consultations. Consequently, the project
modification costs estimated in the following sections are based on a variety of2456
information provided by each Caltrans districts. In contrast, future administrative costs
due to section 7 consultations are based on aggregated information for all four districts
from the USACE. Specifically, the USACE estimates that there have been 20 section 7
consultations since the original gnatcatcher CHD in October 2000 that have addressed
transportation projects with impacts to the gnatcatcher or its habitat. After accounting2461
for the reduced size of the proposed CHD, this consultation history yields an average
rate of 5.6 transportation consultations per year for the four Caltrans Districts that
overlap the proposed gnatcatcher CH. Over 23 years, the USACE is therefore expected
to have to initiate 129 formal section 7 consultations for transportation projects within
the proposed gnatcatcher CH. The total estimated administrative cost (average of low2466
and high estimates) due to future section 7 consultations is $1.7 million, as summarized
in Table 3. Section 7 project modification costs have been estimated separately for each
Caltrans district, as described below.
CALTRANS DISTRICT 7 (LOS ANGELES AND VENTURA COUNTIES)
According to a preliminary estimate provided by Caltrans District 7 staff,2471
approximately six (6) acres of CSS will be impacted by planned or proposed projects
through 2025, and that CSS mitigation costs would be approximately $117,000 per acre
disturbed. Caltrans was unable to provide information regarding the number or timing
of projects contributing to this impact estimate, however. For the purposes of
estimating a total project modification cost, this analysis assumes that Caltrans will2476
consult on six separate projects, each of which will impact one acre of CSS, and each
spaced evenly through 2025 (one every four years, beginning in 2003). As shown in
Table 3, this results in a total project modification cost estimate of $369,200.

Final Draft ReportEconomic Analysis of Critical Habitat Designation for California Gnatcatcher
February 24, 2004
45 Personal communication with Paul Gonzales, Senior Environmental Planner, Caltrans District8, on January 30, 2003.
46 Personal communication with Joe Monaco, Senior Project Manager, Dudek & Associates, onFebruary 10, 2003.
102
CALTRANS DISTRICT 8 (RIVERSIDE AND SAN BERNARDINO COUNTIES)
According to Caltrans District 8 personnel, estimated impacts to CSS habitat as a result2481
of future transportation projects were developed as part of the ongoing Western
Riverside MSHCP.45 After reviewing the available supporting data, the biological
consulting firm to the MSHCP estimated that approximately 750 acres of CSS habitat
would be disturbed by future transportation projects in western Riverside County.46
While some of these impacts may be associated with “long term” projects beyond the2486
2025 time horizon, this analysis conservatively assumes that all projects will occur prior
to 2025. Caltrans personnel recommended assuming that all projects would involve a
Federal nexus, either as a result of FHWA funding or USACE section 404 permitting
requirements.
2491
The MSHCP data is limited to future projects in Riverside County, and does not include
CSS impacts related to projects in San Bernardino County and Caltrans personnel could
not provide additional information regarding projects in San Bernardino County.
Consequently, this analysis assumes that future CSS impacts in San Bernardino due to
transportation construction projects will be proportional to projected urban2496
development within proposed CH area, based on Riverside data. Specifically, dividing
750 acres of future CSS impacts in Riverside County (Unit 10) by 22,650 acres of
projected growth in CH, as summarized in Table 8, yields a factor of 33 acres of CSS
impact for every 1,000 acres of projected growth. Applying this factor to the 4,502 acres
proposed in San Bernardino County (Unit 11) yields an estimate of 149 acres of CSS2501
impact, or a total estimate of 900 acres for Caltrans District 8.
According to Caltrans personnel, previous projects in gnatcatcher habitat requiring
section 7 consultation have mitigated direct impacts at ratios between 2-to-1 and 3-to-1,
and have mitigated indirect impacts (e.g., noise, lighting, “growth inducing effects”) at2506

Final Draft ReportEconomic Analysis of Critical Habitat Designation for California Gnatcatcher
February 24, 2004
47 Personal communication with Scott Quinnell, Environmental Planner, Caltrans District 8, onFebruary 10, 2003.
48 Personal communication with Charles Stoll, Deputy Director of Environmental Planning, andBruce April , Environmental Stewardship Branch Chief, February 6 , 2003.
49 Personal communication with Kim Kawada, Manager of Transportation Planning, and StevenBouchard, SANDAG, February 11, 2003.
103
a 1-to-1 ratio.47 Caltrans has typically mitigated through private mitigation banks, and
has recently paid approximately $32,000 per acre, including land and management
costs. Assuming an overall mitigation ratio of 3-to-1, a per-acre mitigation cost of
$32,000 per acre, and impacts to the 900 acres are spread evenly through 2025, the net
present value of project modification costs is approximately $42 million, as shown in2511
Table 3. As mentioned in Chapter II, if the western Riverside MSHCP is approved,
mitigation costs associated with future Caltrans activities in Riverside County will be
attributable to the MSHCP and not to section 7.
CALTRANS DISTRICT 11 (SAN DIEGO COUNTY)
According to Caltrans District 11 personnel, the best source of information regarding2516
planned or proposed transportation projects and impacts to CSS habitat is SANDAG’s
2030 Regional Transportation Plan (RTP).48 The RTP identifies all planned or proposed
new road construction projects, road widenings and improvements, light rail transit
construction, and high-speed coastal rail construction in San Diego County through
2030. SANDAG personnel researched the supporting RTP data and estimated that2521
approximately 143 acres of CSS habitat would be developed through 2030.49
The 143-acre estimate of impacted CSS habitat includes proposed road development
through Camp Pendleton associated with the Transportation Corridor Agencies’
(TCA’s) proposed Foothill-South toll road. This proposed toll road is one of only two2526
new road construction projects proposed in the County and is located entirely within
the proposed CH area. Consequently, it is likely that a significant amount of the total
143-acre CSS is due to this project. Specifically, based on the estimated CSS impact per
linear road mile for the Foothill-South toll road, and the length of this road in the
County, EPS estimates that approximately 50 percent of the 143-acre CSS impact is due2531

Final Draft ReportEconomic Analysis of Critical Habitat Designation for California Gnatcatcher
February 24, 2004
50This estimate of projected growth in CH is derived by running the private land development model
described in Chapter III assuming all “essential habitat,” including areas proposed for exclusion, are infact designated as CH. For certain counties these estimates therefore differ from those summarized inTable 8.
104
to this project. The economic impact on the toll road due to CHD is estimated
separately below since it is not a Caltans project. Consequently, approximately 72 out
of the 143 acres CSS impact is attributable to Caltrans projects.
This analysis assumes a typical net mitigation ratio of 0.06 -to-1 based on conservation2536
measures described in historical BOs, and after accounting for CEQA baseline
requirements, as shown in Table 11. For every habitat acre preserved off site, Caltrans
estimates land acquisitions costs of approximately $20,000, average supporting costs
(e.g., appraisals, surveys, administration) of $6,000, and average on-going maintenance
costs of $6,000, resulting in a total average cost of $32,000 per off-site acre. As shown in2541
Table 3, the total net present value of these “net” off-site habitat acquisition costs,
assuming a 7 percent discount rate and equal acres mitigated each year through 2025, is
approximately $24,000.
CALTRANS DISTRICT 12 (ORANGE COUNTY)
Caltrans District 12 staff were unable to provide estimates of future projects or likely2546
impacts to CSS through 2025. As a proxy, this analysis assumes that the relationship
between road construction activity and urban growth in Orange County is similar to
that in neighboring San Diego County. As described above, approximately 72 acres of
CSS impact are estimated in San Diego County, which is associated with approximately
35,000 acres of projected growth in Units 1 through 5 (San Diego County).50 This results2551
in a factor of approximately 2 acres of CSS impact for every 1,000 acres of projected
development. Applying this factor to the 11,486 acres of projected development in
Units 6, 7, and 9 (Orange County) yields a total estimate of 24 acres of CSS impact.
This analysis assumes that CSS in Orange County is mitigated at 1.82-to-1.0, as shown in2556
Table 11; the per-acre cost for off-site mitigation is $32,000, as shown in Table 15; and
projects are evenly distributed through 2025. The total estimated section 7 project
modification cost is approximately $444,000, as shown in Table 3.

Final Draft ReportEconomic Analysis of Critical Habitat Designation for California Gnatcatcher
February 24, 2004
51 EPS contacted the TCA to obtain information to evaluate the economic impacts of proposedCH , but no inform ation was provided before com pletion of this draft analysis.
105
TRANSPORTATION CORRIDOR AGENCY TOLL ROAD
2561
Background
The TCA is a multi-jurisdictional agency with joint powers authority that currently
owns and operates several toll roads in southern California. The TCA has proposed to
expand the SR-241 toll road (Foothill-North) from its current terminus at the Oso
Parkway, south to Interstate 5 near San Clemente (the proposed Foothill-South2566
extension). The proposed alternatives for this road all lie within proposed CH Unit 6,
which straddles southern Orange County and northern San Diego County (San Onofre
State Beach Park). This project involves a Federal nexus through the USACE. Several
of the proposed alignments currently under review transect significant portions of
proposed gnatcatcher CHD. Much of this habitat is also occupied by a number of other2571
State and/or federally listed endangered and/or threatened species, and includes
designated CH for other species.
The TCA is engaged in active planning for this project, and is currently in the process of
preparing a joint draft Environmental Impact Report/Environmental Impact Statement2576
(EIR/EIS), which is expected to be completed in the 3rd quarter 2003. As the project is
still in the early environmental review phase, very little information is publicly
available regarding the details of various proposed alignments, including estimates of
potential impacts to CSS.51 The presence of multiple listed species and their habitat, the
existence of a number of complex land use regulations in southern Orange County2581
(CEQA/NEPA, the 4(d) Rule, local zoning restrictions, CESA, section 7, etc.), as well as
general local concerns about growth and development in the region, further complicate
this project. The public review, comment, and approval process is expected to be time-
consuming and politically contentious, and the ultimate outcome is impossible to
predict at this time. 2586
Whatever alignment is ultimately constructed will have a significant impact on local,
and possibly regional, traffic flow. In turn, future differences in traffic flows and
volumes can have a variety of economic outcomes, including opportunity costs of labor,

Final Draft ReportEconomic Analysis of Critical Habitat Designation for California Gnatcatcher
February 24, 2004
106
efficiency of goods delivery, and growth-inducing effects, among other factors. In2591
addition, TCA points out that because the “Far East Alignment” has been included in
the County’s RTP, many local jurisdictions have incorporated this project in their future
growth plans and projections.
Given the politically-charged climate surrounding this project, which involves a2596
complex interplay of public opinion, multiple species issues, and pre-existing land use
regulations other than section 7, this analysis does not consider the ultimate selection of
a particular alignment to be dependent on section 7. This analysis therefore does not
consider the various economic effects of the alignment selected – other than CSS
mitigation – to be attributable to section 7 regulations associated with the gnatcatcher. 2601
In reality, a portion of the future section 7 costs will be attributable to other listed
species, though this analysis assumes all section 7 costs are due to the gnatcatcher.
Alternatives Considered
According to TCA’s website, the EIR/EIS will evaluate six alternatives for Foothill-
South. This analysis focuses on two scenarios – the “Far East Corridor” and a2606
combination of the “Arterial Improvements” and “I-5 Improvements” alternatives. The
Far East Corridor was selected because it represents TCA’s preferred alternative, has
been included in the County’s RTP, and appears to intersect more undisturbed habitat
than any other alternative. The Arterial and I-5 Improvements alternatives were
selected because the combined scenario appears to disturb the least amount of CSS of all2611
alignments that still achieve the objective of providing a connection between Foothill-
North and the I-5 (as opposed to the I-5 widening alternative alone). In that respect,
these two scenarios represent good approximations of “high-impact” and “low-impact”
case studies. The two cost estimates bracket a reasonable range of expected costs, while
the average of the two can be considered a “best guess” of total costs, given the current2616
state of uncertainty over final project approval.

Final Draft ReportEconomic Analysis of Critical Habitat Designation for California Gnatcatcher
February 24, 2004
52 This assumed right-of-way width was selected based on input from Caltrans District 11 staffregarding the average width of new highway construction.
107
Impact of Designation by Toll Road Alternative
Far East Corridor
The Far East Corridor is TCA’s preferred alternative, and will provide the highest2621
future roadway capacity between Oso Parkway and I-5 of all the alternatives under
consideration. According to an article published in the Los Angeles Times, this
proposed alternative consists of 16 miles of new road construction. As summarized in
Table G-5, EPS estimated potential impacts to CSS by assuming all 16 new road miles
intersect CSS habitat, and that the average right-of-way width is 300 feet – resulting in a2626
total estimate of 583 acres of CSS impacts.52
While section 7 consultation will likely result in project modifications to minimize and
mitigate this impact, both the 4(d) Special Rule and CEQA constitute baseline
regulations for CSS mitigation in southern Orange County, as described in Chapter II. 2631
This analysis assumes that the scope of this project would make it ineligible for
approval under the 4(d) Special Rule. According to the DFG, lead agencies in Orange
County have historically required CSS mitigation at an average ratio of approximately
2-to-1. As discussed in Chapter III, EPS’ review of historical section 7 BOs in Orange
County identified an average effective mitigation ratio of approximately 3.8-to-1,2636
meaning that the net CSS mitigation ratio above the CEQA baseline is approximately
1.8-to-1 (Table 11).
This analysis assumes that all impacted CSS acres will be mitigated through purchase of
off-site preservation credits at a private mitigation bank. As described previously, EPS’
review of mitigation banks in Orange County determined an average price per-acre of2641
approximately $78,000. According to TCA’s website, the Foothill-South project is
expected to be constructed between 2005 and 2008. The net present value of the
estimated mitigation costs incurred over this time period is approximately $61.4 million,
as shown in Table G-5. The estimated administrative costs of the single formal
consultation is $18,100, as calculated in Appendix F and summarized in Table 3. 2646

Final Draft ReportEconomic Analysis of Critical Habitat Designation for California Gnatcatcher
February 24, 2004
53 These estimates were made based on review of proposed alignments, highway maps ofsouthern Orange County, and aerial photographs overlayed with gnatcatcher biological andhabitat data.
108
Arterial and I-5 Improvements Alternatives
According to TCA’s website, the Arterial Improvements alternative consists of
widening Antonio Parkway and Avenida La Pata and installing “smart street”
technologies on Ortega Highway, Camino Las Ramblas, and Avenida Pico. The I-5
Improvements alternative involves adding additional lanes between the SR-4052651
intersection and Cristianitos Road near Camp Pendleton. As summarized in Table G-6,
EPS estimates that approximately 10.4 miles of arterial roads will require widening,
approximately 9.4 miles of arterial roads will be constructed with smart street
technology, and approximately 4.5 total miles of I-5 will be widened in areas where CSS
is present.53 This analysis assumes that arterial and I-5 widening will consist of2656
installing two new lanes (10 ft. each), and the expanded right-of-way (ROW) will extend
an additional 10 feet on either side of the new lanes, for a total expanded ROW of 40
feet. It is also assumed that installation of smart street technology will increase the
ROW by 10 feet. All habitat traversed by these road miles is assumed to be CSS,
mitigable under section 7.2661
As described for the Far East Corridor, this analysis assumes an effective CSS mitigation
ratio above CEQA baseline of 1.8-to-1, and an off-site mitigation cost of $78,000 per acre
in Orange County. As shown in Table G-6, the estimated project modification cost of
the Arterial and I-5 Improvement scenario is approximately $8.8 million. The estimated2666
administrative costs of the single formal consultation is $18,100, as calculated in
Appendix F and summarized in Table 1.
Total Economic Cost of Designation on Toll Road
Given the uncertainty surrounding which alignment will ultimately be constructed, this
analysis presents the section 7 cost of the TCA’s proposed Foothill-South toll road as a2671
an average of the two potential outcomes described above. Because these two cost
estimates are assumed to bracket the potential section 7 costs of all the proposed
alignments that meet project objectives, their average represents a reasonable

Final Draft ReportEconomic Analysis of Critical Habitat Designation for California Gnatcatcher
February 24, 2004
54 Personal communication with Karl Seckel, Assistant Manager, Municipal Water District ofOrange County, and Dan Ferons, Chief Engineer, Santa Margarita Water District, on January 30,2003.
109
approximation of the likely economic outcome. The average section 7 project
modification cost is $35.1 million. 2676
PRIVATE ROADS
Private road development would require section 7 consultation for future projects with
a Federal nexus. This analysis assumes that the vast majority of future road
construction by private parties will be associated with the forms of private land
development (residential, commercial, industrial, etc.) addressed in Chapter 3. All road2681
construction associated with these future projects will be incorporated in the project
description, and any required project modifications required because of road-based
impacts to CSS will be addressed in the BO for the project as a whole. This analysis
therefore assumes that no additional private road construction projects will require
section 7 consultation, and that there will be no additional economic cost. 2686
LOCAL AND REGIONAL WATER PROJECTS
The Metropolitan Water District of Southern California (MWD) is responsible for
constructing and maintaining the water delivery system to the majority of southern
California water users, with the exception of San Diego County. In general, the MWD
provides “regional” water delivery infrastructure, while the local “retail” water districts2691
are responsible for constructing and maintaining municipal water infrastructure to end-
users on a local scale. In San Diego County the SDCWA provides water delivery
infrastructure between the MWD network and the local distribution systems.
Local water agencies indicate that the vast majority of construction projects undertaken2696
by local retail agencies occur in association with, and as a result of, new residential
development.54 This analysis assumes that the section 7 consultations required for
residential development projects will also address and cover the cost of any new water

Final Draft ReportEconomic Analysis of Critical Habitat Designation for California Gnatcatcher
February 24, 2004
55 According to SDCWA staff, the SDCWA may undertake projects that are not listed in theMaster Plan. Staff also pointed out, however, that CSS-impact estimates may include habitatacreage that is not considered suitable for the gnatcatcher. On the whole, the SDCW A thereforeconsiders the estimates provided as accurate an approximation of future CSS impacts as iscurrently available.
110
(or other utility) infrastructure that is specifically associated with those projects (see
Chapter II). This analysis therefore concludes that no additional section 7 consultations2701
will be required for construction projects by local retail water agencies beyond those
that serve and are paid for by new development.
This analysis assumed that CSS impacts related to regional water supply activities
would be associated with 13 future formal consultations, based on information
provided by the utilities and acreage adjustments reflecting the amount of CSS2706
proposed for CHD. The estimated administrative cost of these consultations is
approximately $116,000, as shown in Table 3.
SAN DIEGO COUNTY WATER AUTHORITY
The SDCWA has recently completed a 25-year Water Facilities Master Plan, which
outlines planned or proposed projects likely to occur within that timeframe. SDCWA2711
staff estimate that approximately ten (10) future projects will require section 7
consultation, eight of which will result in impacts to CSS habitat.55 As summarized in
Table G-7, the SDCWA provided estimates of the potential impacts of each project
(permanent vs. temporary), and the likely timing of each project. EPS assumed that CSS
impacts were evenly distributed throughout the indicated timeframe, and applied2716
“net”CSS mitigation ratios of 2-to-1 and 1.2-to-1 (permanent and temporary,
respectively), which take into account baseline CEQA mitigation in San Diego County.
Based on SDCWA input, EPS also assumed both off-site mitigation and restoration will
cost approximately $15,000 per acre, resulting in a total project modification cost
estimate of approximately $538,000, when adjusted to CSS acreage proposed for CH. 2721

Final Draft ReportEconomic Analysis of Critical Habitat Designation for California Gnatcatcher
February 24, 2004
56See footnote 52.
111
METROPOLITAN WATER DISTRICT OF SOUTHERN CALIFORNIA
MWD staff were unable to provide estimates of future projects or CSS acres impacted
within proposed CHD. As a proxy, this analysis assumes that the relationship between
regional water infrastructure and projected urban growth for the counties served by the2726
MWD is the same as it is for San Diego County. As discussed above, the SDCWA
authority anticipates 10 future consultations impacting a total of 146 acres of CSS
through 2025. Approximately 35,000 acres of future growth is projected in Units 1
through 5, yielding a ratio of 4.2 CSS acres for every 1,000 acres of projected growth.56
Applying this factor to the estimated 48,000 acres of projected growth in the remaining2731
CH units yields an estimate of 199 acres of impact. This analysis assumes that these
impacts will be associated with 14 future formal section 7 consultations, based on a rate
of one consultation for every 14.6 acres of CSS impact.
This analysis assumes that future CSS impacts will be mitigated at a 2.1-to-1 ratio and at
a per-acre cost of approximately $48,000. These estimates represent the average ratio2736
and cost, respectively, for counties other than San Diego, taking into account CEQA
baseline in Orange County. Assuming future impacts are distributed evenly through
2025, the total estimated cost of section 7 project modifications is approximately $6.1
million, when adjusted for CSS acres actually proposed for CH.
BUREAU OF RECLAMATION2741
The Bureau of Reclamation (BOR) develops and maintains water projects such as dams,
canals, irrigation systems and water reclamation. BOR personnel indicated that
previous section 7 consultations involving the gnatcatcher have generally fallen into
two categories – relatively small-scale water reuse project initiated by local water
agencies that involve BOR funds, and larger-scale water delivery infrastructure projects2746
that involve BOR funds and oversight. Based on historical and anticipated project
frequencies, BOR staff suggested assuming that each five years the BOR will initiate
four section 7 consultations for small-scale reuse projects, and one consultation for a

Final Draft ReportEconomic Analysis of Critical Habitat Designation for California Gnatcatcher
February 24, 2004
112
large-scale infrastructure project. This analysis assumes that three of the small-scale
reuse projects will require informal consultations, and the remaining two projects will2751
require formal consultation, including the preparation of a BO. Based on this
frequency, and adjusting for the amount of CSS acreage actually proposed for CHD, this
analysis estimates that the BOR will initiate 12 informal consultations and 3 formal
consultations through 2025.
2756
Typical section 7 project modifications and costs differ for the two types of projects
described above. According to BOR staff, the small-scale reuse projects usually occur in
San Diego County and tend to be located in already developed areas or along existing
rights of way. These projects therefore often disturb very little CSS habitat, if any
(which is why many only require informal consultation). Based on consultation with2761
BOR staff, this analysis assumes that each reuse project will impact 0.5 acres of CSS
habitat, for which the applicant will mitigate through off-site preservation at standard
San Diego mitigation ratios and acquisition costs. BOR staff also indicated that these
applicants must comply with the MSCP and CEQA regulations, as appropriate.
2766
As mentioned above, the BOR anticipates being involved in approximately one large-
scale infrastructure project every five years, which could occur in any of the six counties
proposed for critical habitat. The BOR suggested using the San Sevaine Creek Water
Project section 7 consultation to develop assumptions of future project modifications
and costs. As described in the summary of the BO (see Appendix C), this project2771
involved the construction/ replacement of a levee, a debris basin, and over 13 miles of
flood control channels. The project impacted 64 acres of gnatcatcher habitat, and is
assumed to be representative of future large-scale flood control projects. This analysis
applies a “net” section 7 ratio of 0.06-to-1 to all projects requiring formal consultation,
which takes into account baseline CEQA mitigation in San Diego County.2776
As shown in Table 15, the average price for CSS mitigation credits across the proposed
CH area is approximately $32,000 per acre. As shown in Table 3 , the net present value
of project modifications for the “large-scale” consultations is approximately $153,000.
The total estimated administrative cost for three formal consultations and twelve2781
informal consultations is $67,000, as calculated in Appendix F and summarized in Table
3.
Final Draft ReportEconomic Analysis of Critical Habitat Designation for California Gnatcatcher
February 24, 2004
113
MUNICIPAL POWER SUPPLY
Regional-scale gas and electric service to southern California residents within the
proposed CH boundaries is provided primarily by three companies – San Diego Gas &2786
Electric (SDG&E), the Southern California Gas Company (SCGC), and Southern
California Edison (SCE). SDG&E and the SCGC are owned by the same parent
company, Sempra Energy. SDG&E provides gas and electric service to residents of San
Diego County while SCGC provides natural gas service to southern California residents
outside San Diego County. SCE provides electricity service to southern California2791
residents outside San Diego County. Both companies own and operate a large network
of utility infrastructure, including power generating stations, substations, transmission
lines, and natural gas pipelines.
As with municipal water supply (see above), the analysis assumes that new gas and2796
electric infrastructure at the local scale will be associated with new private
development. As such, the section 7 consultations required for those private
development projects with a Federal nexus will incorporate and address the associated
local-serving gas and electric infrastructure. No additional section 7 costs are estimated
for these local-scale developments. Regional-scale gas and electric infrastructure would2801
not be addressed by the section 7 consultations for private developments, however. An
evaluation of section 7 costs associated with regional projects planned or proposed by
SDG&E, the SCGC, and SCE is provided below. This analysis assumes a total of six
future formal consultations for the municipal power supply projects described below.
This estimate is based on projected consultation rates provided by the major utility2806
companies. Total estimated administrative costs are approximately $52,000, as shown
in Table 3.
SOUTHERN CALIFORNIA EDISON
SCE delivers electricity to over 4.8 million customers throughout much of southern and
central California, including parts of Ventura, Los Angeles, San Bernardino, western2811
Riverside, and northern Orange counties. SCE owns and operates power generating
stations and substations as well as a large network of transmission lines.

Final Draft ReportEconomic Analysis of Critical Habitat Designation for California Gnatcatcher
February 24, 2004
57 Personal comm unication with Dan Pearson, Manager, Land Services & Environm ental Affairs,Southern California Edison, February 10, 2003.
58 Mr. Pearson qualified this assumption by stating that if the Service requires mitigation forindirect effects (e .g., mitigation for the growth inducing effects of providing electricityinfrastructure to an area), that the mitigation costs would escalate exponentially. He stated thatSCE would strongly oppose any effort by the Service to require mitigation for anything otherthan direct impacts to habitat.
59These estimates represent the average ratio and cost, respectively, for counties other than San
Diego, taking into account CEQA baseline in Orange County.
114
SCE personnel estimate that approximately four future projects will require section 7
consultation due to the gnatcatcher.57 Due to the competitive nature of the electricity2816
industry and the difficulty in forecasting infrastructure projects in the long-term, SCE
staff were not able to provide project-specific detail. In general, one new 500-kilovolt
(KV) substation and two new 500-KV transmission lines are expected within the next 10
years, and an additional “large-scale” project is expected by 2020 based on historical
infrastructure construction cycles. Federal nexus would be in the form of Federal2821
Energy Regulatory Commission approval of the new transmission line(s), USACE
section 404(b) regulation, or the need to traverse BLM, United States Forest Service
(USFS), or other federal land for one or more of the projects. SCE staff estimated that
the substation would be located entirely within one county (location undisclosed),
while one 500-KV line would traverse two counties and one would traverse three2826
counties (route undisclosed).
SCE personnel estimated that approximately 250 acres of CSS habitat would be
disturbed by the four projects, and suggested that EPS assume mitigation ratios
consistent with other linear utility projects, and mitigation costs consistent with private2831
mitigation banks in the southern California region.58 EPS assumed the four projects will
be constructed in years 3, 6, 9, and 15, and CSS impacts are evenly distributed among
the projects. Assuming a 1.5-to-1 mitigation ratio for 250 acres,59 and an average
mitigation price of $48,000 per acre (an average of prices in mitigation banks outside
San Diego County), total estimated project modification costs are approximately $72836
million, when adjusted for acreage proposed for CHD.

Final Draft ReportEconomic Analysis of Critical Habitat Designation for California Gnatcatcher
February 24, 2004
60 Personal communication with Don Haines, Manager, Land Planning & Natural ResourcesGroup, Sempra Energy, February 13, 2003. Mr. Haines cited the uncertainty of capitalimprovement projects and the energy m arket through 2025, as well as the commitment of staffresources that would be required to develop an estimate, in declining to provide information.
61
See footnote 52.115
SAN DIEGO GAS & ELECTRIC
While it is possible that future construction, operation, and/or maintenance activities2841
conducted by either SDG&E or the SCGC may result in section 7 consultations
involving the gnatcatcher, Sempra Energy personnel declined to provide any
information regarding the likelihood of future consultations or estimates of any
resulting costs.60 According to staff at the California Public Utilities Commission,
SDG&E has conceptualized construction of a 500-KV transmission line sometime in the2846
timeframe of this analysis that could potentially intersect proposed gnatcatcher CH.
CUPC staff called this potential line the “Imperial Valley-to-Miguel line,” which they
said might parallel the US-Mexico border just south of San Diego. No additional
project-specific information was provided, however.
2851
Though SDG&E staff were unable to provide estimates of future projects or
modification costs, this analysis assumes that the relationship between regional
electricity infrastructure and projected urban growth is the same for San Diego County
as for remaining counties proposed for CH. As discussed above, SCE anticipates four
future consultations impacting a total of 250 acres of CSS through 2025. Approximately2856
48,000 acres of future growth is projected in proposed units outside San Diego, yielding
a ratio of 5.2 CSS acres for every 1,000 acres of projected growth. Applying this factor to
the estimated 35,000 acres of projected growth in San Diego County yields an estimate
of 183 acres of impact.61
2861
This analysis assumes that future CSS impacts will be mitigated at a net 0.06-to-1 ratio
and at a per-acre cost of $19,750 (the average ratio and cost, respectively, for San Diego
County). Assuming future impacts are distributed evenly through 2025, the total
estimated cost of section 7 project modifications is approximately $70,000, when
adjusted for acres proposed for CH. 2866

Final Draft ReportEconomic Analysis of Critical Habitat Designation for California Gnatcatcher
February 24, 2004
62 Personal communication with Don Haines, Manager, Land Planning & Natural ResourcesGroup, Sempra Energy, February 13, 2003. Mr. Haines cited the uncertainty of capitalimprovement projects and the energy m arket through 2025, as well as the commitment of staffresources that would be required to develop an estimate, in declining to provide information.
116
It is worth noting that many of SDG&E’s operational activities are addressed in its
“Subregional Natural Community Conservation Plan,” which was approved by the
Service in 1995 and therefore constitutes a “regulatory baseline” for covered activities.
In approving the plan, the Service issued a 50-year section 10(a) permit covering the2871
installation, use, maintenance, and repair of the existing gas and electric system and
typical expansions to that system. Because the 50-year permit establishes mitigation
requirements for all covered activities under the plan, any potential section 7 costs
would be limited to administrative consultation costs, and project modification costs for
activities not covered in the plan. 2876
SOUTHERN CALIFORNIA GAS
As mentioned above, Sempra Energy personnel declined to provide any information
regarding the likelihood of future consultations or estimates of any resulting costs.62 In
order to provide an estimate of future project modification costs, this analysis assumes
that future CSS impacts resulting from SCGC regional infrastructure projects will be2881
roughly proportional to those estimated for electricity infrastructure projects conducted
by SCE. This analysis uses SCE as a proxy because SCE and SCGC have similar service
territories (southern California outside San Diego County), and both are involved in the
construction of “linear” regional utility infrastructure.
2886
The SCE company website indicates that SCE’s service territory encompasses
approximately 50,000 square miles. As described above, electric utility projects through
2025 built to serve this territory are estimated to impact approximately 250 acres of CSS
habitat. The SCGC website indicates its service territory is approximately 23,000 square
miles. Assuming habitat impacts due to infrastructure construction are proportional to2891
service territory size, this analysis estimates that SCGC infrastructure projects through
2025 will result in impacts to approximately 115 acres of CSS habitat. Applying the
same scaling factor to SCE’s anticipated four consultations yields an estimate that SCGC
will be involved in two projects through 2025 that require formal section 7 consultation.

Final Draft ReportEconomic Analysis of Critical Habitat Designation for California Gnatcatcher
February 24, 2004
63 Personal communication with Forest Biologist, Bill Brown, Angeles National Forest January 30,2003.
117
To estimate the cost associated with these utility projects, this analysis assumes that2896
section 7 project modifications will include off-site mitigation at a 2.11-to-1 ratio, and
that per-acre CSS acquisition costs will be approximately $55,000. These assumptions
correspond to the average “net” mitigation ratio and costs for counties other than San
Diego, as shown in Table 11 and Table 15, respectively. The estimated project
modification cost for these projects is approximately $4.4 million, after adjusting for2901
acreage proposed for CH.
FEDERAL LAND MANAGEMENT
Future activities on Federal land constitute a section 7 Federal nexus. Categories of
Federal land proposed for gnatcatcher CH include land owned or managed by the USFS
and BLM. USFS activities likely to require section 7 consultation primarily consist of2906
protecting CSS habitat during prescribed burns conducted as part of fire
control/prevention programs. The BLM anticipates a number of future section 7
consultations involving the gnatcatcher, but is unable to predict the specific projects
that will require consultation.
U.S. FOREST SERVICE LAND2911
Angeles National Forest
The Angeles National Forest (ANF) estimates that one informal consultation will occur
each year for prescribed burns and that numerous phone calls and field visits may be
necessary.63 In 2002, one informal consultation was required for a joint prescribed burn
with the County due to the presence of coastal sage scrub. This analysis estimates 232916
informal consultations through 2025 associated with prescribed burns in the ANF.
ANF staff estimated that project modifications required to protect CSS adjacent to burn
areas typically result in an additional cost of approximately $10,000 for every 100 acres
of CSS habitat protected. ANF personnel indicated that there are approximately 4,0002921
acres of CSS remaining within the ANF.

Final Draft ReportEconomic Analysis of Critical Habitat Designation for California Gnatcatcher
February 24, 2004
64 Personal comm unication with Forest Biologist, Kirsten Winter, Cleveland N ational ForestJanuary 28, 2003. Ms. Winter was interviewed again on June 18, 2003 to confirm this estimate inlight of the recently com pleted program matic section 7 BO for the 4 Southern California Forests. Ms. Winter stated that the programm atic BO specifically did not address future activities such asprescribed burns, and that given the amount of CSS habitat in the AN F, she believed her originalestim ate remained accurate.
118
Estimating project modification costs for future prescribed burns is difficult given
uncertainties inherent in fire management practices. However, in order to be more
likely to overestimate than underestimate costs, this analysis assumes that all 4,000
acres of CSS will require protection as a result of the 23 prescribed burns anticipated2926
through 2025. As shown in Table 3, the total estimated project modification cost for
these future prescribed burns is approximately $196,000. The estimated administrative
cost of the 23 informal consultations is approximately $52,000, as calculated in
Appendix F and summarized in Table 3.
Cleveland National Forest2931
The Cleveland National Forest (CNF) estimates that two to three formal consultations
and three informal consultations a year may be required through 2025 due primarily to
protecting coastal sage scrub during prescribed burns.64 In 2001, the CNF was involved
in three section 7 consultations regarding grazing, a prescribed burn, and the forest
management plan due to the presence of coastal sage scrub. This analysis assumes 412936
informal consultations and 41 formal consultations through 2025, after adjusting for
acreage actually proposed for CHD, half of which will require Biological Assessments.
Based on previous consultations, the CNF estimated that formal consultations for
prescribed burns would add an additional $10,000 for every 100 acres of coastal sage2941
scrub requiring protection. While CNF staff indicated that an extra $4,000 may be
required if an in-house species survey is required, this analysis assumes these costs are
represented in the cost of preparing Biological Assessments. Staff estimated that
approximately 20,000 acres of CSS is present within the CNF.
2946
Estimating project modification costs for future prescribed burns is difficult given
uncertainties inherent in fire management practices. However, in order to be more
likely to overestimate than underestimate costs, this analysis assumes that all 20,000
acres of CSS will require protection as a result of the 41 prescribed burns anticipated

Final Draft ReportEconomic Analysis of Critical Habitat Designation for California Gnatcatcher
February 24, 2004
65 Personal comm unication with Forest Biologist, Steve Loe, San Bernardino National ForestFebruary 13, 2003. 66 Personal communication with Wildlife Biologist, Joel Schultz, January 27, 2003 and EndangeredSpecies Specialist, Ed Lorentzen January 29, 2003.
119
through 2025. As shown in Table 3, the total estimated project modification costs for2951
these future prescribed burns is approximately $204,000. The estimated administrative
cost of the informal and formal consultations is approximately $340,000, as calculated in
Appendix F and summarized in Table 3.
San Bernardino National Forest
The San Bernardino National Forest (SBNF) estimated that three to five formal2956
consultations and three to five informal consultations may be required through 2025
due primarily to protecting coastal sage scrub during prescribed burns.65 This analysis
assumes that five informal and five formal consultations will be required through 2025.
Staff indicated that approximately 1,000 acres of CSS habitat is present in the SBNF, and2961
that the costs to protect CSS during prescribed burns are similar to those of the other
National Forests ($100 per acre of CSS protected). Assuming that all 1,000 acres will
require protection through 2025, the total estimated project modification cost is
approximately $49,000 as shown in Table 3. The estimated administrative cost of 5
informal and 5 formal section 7 consultations is approximately $47,000, as summarized2966
in Table 3.
BUREAU OF LAND MANAGEMENT
The BLM estimated that it will participate in approximately 4 formal and 12 informal
section 7 consultations through 2025. Three technical assistance calls were also
estimated over the same time period.66 2971
The BLM has been involved in several formal and informal consultations involving the
gnatcatcher, though only one formal consultation was recent enough to have records
available on project modification costs. In that consultation, the BLM was required to
mitigate construction and maintenance activities on four acres of CSS habitat through2976
off-site acquisition of CSS at a 2-to-1 ratio, maintenance outside the breeding season,

Final Draft ReportEconomic Analysis of Critical Habitat Designation for California Gnatcatcher
February 24, 2004
67 Personal communication with FEMA Program Manager, Chris Barkley, URS Corporation(contracted with FEMA to handle technical support), February 2, 2003
120
redirection of roads around habitat areas, and closure of trails leading through
gnatcatcher habitat. The BLM was able to acquire CSS habitat off site at $1,500 per acre.
BLM staff were unable to provide any estimates of likely habitat impacts for future2981
projects requiring section 7 consultation. In the absence of any additional supporting
data, EPS assumed that future consultations are similar in size, scope, and cost to the
single BLM historical consultation described above (i.e., each requiring 4 acres of 2-to-1
mitigation at $1,500 per acre). The estimated net present value of project modifications
associated with future consultations is $26,000. The estimated administrative cost of 42986
formal consultations, 12 informal consultations, and 3 technical assistance calls is
$59,000, as calculated in Appendix F and summarized in Table 3.
FEDERAL EMERGENCY MANAGEMENT ACTIONS
The Federal Emergency Management Agency (FEMA) has engaged in formal and
informal consultations for construction, prescribed burns, and flood prevention. FEMA2991
personnel estimate that 30 formal consultations and 75 informal consultations involving
the gnatcatcher will be required through 2025.67
FEMA staff estimated that formal consultations will require preconstruction surveys,
avoidance of construction activities during breeding season, and avoidance of CSS2996
habitat when possible. FEMA staff were unable to provide estimates regarding likely
impacts due to future projects or the extent of avoidance required. Due to the lack of
available information, this analysis assumes that the future project modification costs
will be limited to preconstruction survey costs, and that these costs are captured by
consultation cost model estimates for Biological Assessments. The estimated3001
administrative cost of future consultations is approximately $386,000, as calculated in
Appendix F and summarized in Table 3.

Final Draft ReportEconomic Analysis of Critical Habitat Designation for California Gnatcatcher
February 24, 2004
68The economic cost estimates do not account for the potential effect of CHD, if any, on military
readiness. Such an estimate is beyond the scope of this analysis.
121
MILITARY PROPERTY AND OPERATIONS
This section estimates potential section 7 economic costs associated with military base
property and operations in areas proposed as critical habitat and areas proposed for3006
exclusion.68
MARINE CORPS BASE CAMP PENDLETON
Some areas within Marine Corps Base Camp Pendleton have been proposed for CH
while mission-essential training areas have been proposed for exclusion. This section
first addresses the economic costs associated with those areas proposed for CH. The3011
economic cost of designating mission-essential training areas is evaluated separately
below to assist with weighing the benefits of exclusion against the benefits of inclusion.
Description of Areas Proposed and Areas Proposed for Exclusion
The Marine Corps Base Camp Pendleton has approximately 16,471 acres of proposed
CH. Of this amount, approximately 3,546 acres represent lands leased to the State of3016
California for use as a State Park (i.e., San Onofre State Beach). The remaining 12,925
acres are located within or adjacent to existing developed or urbanized areas of the
Base, including Marine Corps housing and other base support-related land uses. The
proposed CH does not include military training areas, although these areas are known
to include essential gnatcatcher habitat. The Service has proposed for exclusion all3021
mission-essential training areas that contain essential gnatcatcher habitat, citing section
4(b)(2) of the Act.
Consultation Background
The current INRMP for Camp Pendelton was completed in October 2001. Although the
INRMP meets the requirements of the SAIA, the Service has expressed concern that the3026
document possesses a number of inadequacies with regard to resource and ecosystem

Final Draft ReportEconomic Analysis of Critical Habitat Designation for California Gnatcatcher
February 24, 2004
69 See USFWS letter to the Lupe Amas, Commanding General of Marine Corpse Base CampPendelton, October 19th, 2001 (FWS-M CBCP-2317.1)
70Cam p Pendleton m aintains a 20-acre CSS Restoration bank located near the O’Neil Heightshousing area in the south east portion of the Base. Approximately 7.7 surplus acres currentlyremain.
122
management.69 Consequently, for the purposes of estimating the economic costs of
CHD, this analysis assumes that the INRMP does not serve as a baseline regulatory
requirement for the gnatcatcher. This is a conservative approach (e.g., more likely to
overestimate than underestimate actual costs) because in reality the INRMP does3031
articulate guidelines and protection measures for gnatcatcher habitat, as do existing
biological opinions.70
A summary of the consultation history for the gnatcatcher on Camp Pendleton is
provided in Table 18. As shown, there have been a total of 17 biological opinions
issued for the gnatcatcher since 1995, 13 of which pertain to activities outside the3036
military training area boundaries. In addition, the Service is currently involved in a
programmatic section 7 consultation with Camp Pendleton regarding numerous
activities that are ongoing or expected to occur within the upland areas, the primary
location for training activities. Once completed, this document will provide further
protection for gnatcatcher habitat.3041
Estimated Economic Costs
Because the analysis assumes that the existing INRMP and BOs provide no baseline
protection for the gnatcatcher, all future consultation and project modifications costs are
attributable entirely to section 7. Camp Pendleton staff provided no information
regarding future projects that may require section 7 consultation, so future cost3046
estimates are based on the historical consultation rates as calculated in Table 18. As
shown, the non-training areas average about 1.6 consultations and $428,800 in CSS
mitigation/restoration costs per year (or 37 consultations through 2025). Assuming
these costs will be incurred at the same rate over the next 23 years, the estimated net

Table 18Biological Opinions for the Gnatcatcher at Pendleton (1995 to Present)
Location / Project Name Service Date of EstimatedProject # BO Permanent Temporary Cost (1)
Non-Training AreasSan Onofre Sewage Effluent 1-6-95-F-25 3/30/1995 0 0.3 $11,400Bridge Retrofit - Interstate 5 1-6-96-F-31 8/15/1996 0 1.08 $41,040Santa Margarita Sewage Effluent 1-6-96-F-36 10/21/1996 26.3 0.8 $2,029,200Slope Stabilization at SDGE Talega Substation1-6-98-F-27 9/8/1998 0 3.5 $133,000DeLuz Housing 1-6-98-F-38 11/23/1998 3.93 0 $298,680Ammunition Handling Facility 1-6-99-F-30 4/19/1999 2.57 1.07 $235,980Santa Margarita River Levee 1-6-95-F-02-R10 7/19/1999 1.65 0 $125,400PPM Burn at San Mateo 1-6-00-F-34 5/12/2000 5.0 0 $380,000Las Flores Estancia 1-6-01-F-910.2 2/2/2001 0.74 0 $56,240SDGE Talega Substation Expansion 1-6-02-F-1988.2 12/10/2001 0 0 $0SDGE Access Road 1-6-02-F-2464.2 1/31/2002 0 0 $0San Onofre Housing Firebreak 1-6-02-F-2869.1 5/23/2002 0.77 0 $58,520San Mateo BEQ Parking 1-6-02-F-2729.3 5/30/2002 2.21 0 $167,960
Subtotal 0 43.17 6.75 $3,537,420Amount Per Year 0.00 5.23 0.82 $428,778
Training AreasNorthern Power Line 1-6-99-F-45 6/28/1999 0.0013 0.148 $5,723SFPP Petroleum Pipeline 1-6-99-F-54 8/23/1999 0 0 $0Electrical Towers M3-T3 1-6-99-F-76 10/28/1999 0.17 0.12 $17,480Range 314 Road Upgrade 1-6-03-F-3001.3 1/10/2003 3.5 0 $266,000Biological Assessment of Upland Habitat on-going - - -
Subtotal 0 3.6713 0.268 $289,203Amount Per Year 0.00 0.45 0.03 $35,055
(1) Assumes a 2:1 total mitigation requirement for permanent impacts, 1:1 restoration for temporary impacts, and a cost of $ per mitigated or restored acre. Does not represent actual amount paid.
Source: US Fish & Wildlife Service; Fallbrook Naval Weapons Station; Economic & Planning Systems, Inc.
Acres of CSS Impact
Economic & Planning Systems, Inc. 2/26/2004 H:\12594gnatcatcher\Report\DEA_Feb2004\EmailTables_Feb2004.xls

Final Draft ReportEconomic Analysis of Critical Habitat Designation for California Gnatcatcher
February 24, 2004
71 Conversation with Service staff on March 6th, 2001.
124
present value of project modification costs is $4,833,000, as shown in Table G-17 and
Table 3. These estimates assume a CSS mitigation/restoration cost of $38,000 based on
information provided by the Fallbrook Naval Weapons Station. The estimated
administrative cost of the 37 future formal section 7 consultations is $178,000, as3056
calculated in Appendix F and summarized in Table 3.
Using the methodology described for non-training areas, mission-essential training
areas will average about 0.6 consultations and $35,100 in CSS mitigation/restoration
costs per year (or 14 consultations through 2025). Assuming these costs will be
incurred at the same rate over the next 23 years, the estimated net present value of3061
project modification costs is $395,000, as shown in Table G-17. The estimated
administrative cost of 14 future section 7 consultations is $67,000. Because training
areas have been proposed for exclusion, these administrative and project modification
cost estimates are not included in the total economic impact summary provided in
Table 3 or in totals calculated in Appendix F. These value are included in the Unit3066
summaries provided in Table 2 (“Proposed for Exclusion” column).
MARINE CORPS AIR STATION MIRAMAR
Background
The Marine Corps Air Station (MCAS) Miramar contains approximately 2,524 acres of
essential habitat that have been proposed for exclusion. Thus, the cost estimates3071
provided herein are designed to provide information for weighing the benefits of
exclusion against the benefits of inclusion, and are not included in the total cost
summary in Table 3.
The current INRMP for Miramar was completed in May 2000 and is well regarded by3076
the Service.71 In addition, MCAS has completed two other documents that articulate
standards and obligations for the protection of CSS and the gnatcatcher. These include:
(1) a BO/Conference Opinion for the Realignment of Naval Air Station Miramar to
Marine Corps Air Station Miramar completed in April 11, 1996, and (2) Implementation,
Maintenance and Monitoring of Coastal Sage Scrub Restoration on Marine Corps Air3081

Final Draft ReportEconomic Analysis of Critical Habitat Designation for California Gnatcatcher
February 24, 2004
125
Station Miramar, completed on December 8, 1999. The standards and commitments
outlined in these documents include, but are not limited to, the following:
C A commitment to develop and implement land management practices consistent
with the guidelines that established for other sub-area plans through the3086
Multiple Specials Conservation Program (MSCP) adopted by a number of San
Diego County jurisdictions.
C Mitigation at a 2-to-1 replacement ratio for the authorized destruction of suitable
gnatcatcher habitat and at a 1-to-1 ratio for other CSS. The unauthorized3091
destruction of CSS habitat will be mitigated or restored at a 5-to-1 ratio.
C Limit of land-use activities disruptive to gnatcatcher habitat to the non-breeding
season.
3096
C A commitment and detailed plan to restore, manage, and maintain
approximately 87.5 acres of abandoned agricultural fields to a permanent CSS
plant community.
EPS has identified a total of five BOs related in part or in whole to the gnatcatcher and3101
CSS habitat on Miramar since 1993, which equates to an average of approximately 0.5
consultations per year. These BOs, which articulate conservation measures that require
continued management on Miramar, include the following:
1. BO on the proposed maintenance, improvements, and use of existing roads, lots,3106
driveways, and loading docks at Miramar (1-66-99-F-64) completed in August
1999.
2. BO on Nobel Drive/I-805 Interchange and Extension project San Diego County
(1-6-97-F-30) completed on August 1, 1997.3111
3. BO / Conference Opinion for the realignment of Naval Air Station Miramar to
Marine Corps Air Station Miramar completed on April 11, 1996.

Final Draft ReportEconomic Analysis of Critical Habitat Designation for California Gnatcatcher
February 24, 2004
72 Personal communication with Robert Knight, Station Biologist and Jan Larson, Director ofEnvironmental Operations March 6, 2003.
73 Fallbrook staff also provided information on projects currently undergoing section 7consultation and estim ated conservation fund allocations expected to be expended on the CAG N. These data were not considered relevant to a consideration of future section 7 costs for theCAGN.
126
4. BO for the Fiesta Island Replacement Project/North Sludge Processing Facility3116
and West Miramar Landfill Overburden Disposal (1-6-94-F-37) completed on
September 29, 1994 (an amendment to this opinion was completed on January
12, 1995).
5. BO on Nave Family Housing at Eucalyptus Hills San Diego County, (1-6-93-F-
33) completed on November 12, 1993.3121
Estimated Economic Costs
As described above, the Miramar INRMP, past BOs, and other documents represent a
strong set of existing commitments, standards and obligations for the protection and
mitigation of CSS and gnatcatcher habitat. Consequently, this analysis assumes these
documents constitute a regulatory baseline for future measures designed to protect3126
gnatcatcher habitat, such as CSS mitigation or restoration. In other words, these
mitigation costs will be incurred independent of future section 7 consultations.
However, this economic analysis assumes that the administrative costs associated with
future section 7 consultations are attributed to designation. Thus, at an average of 0.5
gnatcatcher-related consultations per year, there will be 12 estimated consultations over3131
the next 23 years with a total administrative cost of $58,000.
U.S. NAVAL WEAPONS STATION SEAL BEACH, DETACHMENT FALLBROOK
The Naval Weapons Station Seal Beach, Detachment Fallbrook (Fallbrook) is a facility
operated by the U.S. Navy that is charged primarily with storing and replenishing
military ordnance; no training activities occur on site. CH has been proposed for3136
Fallbrook as part of critical habitat Unit 4, which overlaps the eastern portion of Camp
Pendleton; no areas within Fallbrook have been proposed for exclusion. Fallbrook staff
estimate that approximately 16 formal consultations for the CAGN will be necessary
through 2025.72 Future projects include:73

Final Draft ReportEconomic Analysis of Critical Habitat Designation for California Gnatcatcher
February 24, 2004
74 Personal communication with Gordon Brown, Remedial Project Manager on February 3, 2003,and Robert Palmer, Biological Consultant on January 2, 2003.
127
C Widening of Ammunition Road and installation of fencing in the 1st quarter3141
2004, which is expected to disturb 20 acres of CSS.
C Construction of up to 10 magazines (earth-covered storage vaults for explosive
ordnance) between 5 and 25 years out, each disturbing a maximum of 5 acres of
habitat.
C One future road construction project every 5 years, each with an assumed ROW3146
coverage of approximately 6.7 acres, 50 percent of which (3.3 acres) is assumed
to contain CSS.
C Construction of one warehouse building in year 15, which is expected to disturb
approximately 5 acres of CSS.
3151
Based on previous section 7 consultation experience, Fallbrook personnel suggested
assuming future impacts to CSS would be mitigated through on-site restoration at a 1-
to-1 ratio at a cost of $38,000 per acre. As shown in Table 3, the total estimated cost of
section 7 project modifications is $2.1 million. The total estimated administrative cost of
the 16 formal consultations is $115,000.3156
EL TORO REUSE AREA
The El Toro Reuse Area is a former military installation that the U.S. Navy currently
manages as a reserve area for the Central/Coastal Orange County HCP/NCCP. CH has
been proposed for El Toro as part of Unit 6; no areas within El Toro have been proposed
for exclusion. El Toro staff estimate that, at most, one project requiring formal3161
consultation for the CAGN will be necessary through 2025.74 This possible consultation
would address construction of the Alton Parkway, which could affect up to 4,000 acres
of CSS habitat. As discussed in Chapter II, this project is a Planned Activity under the
Central/Coastal Orange County HCP/NCCP, and CSS mitigation has already been
addressed by the Plan, so no section 7 project modification costs are anticipated. The3166
required formal section 7 consultation will result in administrative costs of $14,600, as
shown in Appendix F and Table 3.
Final Draft ReportEconomic Analysis of Critical Habitat Designation for California Gnatcatcher
February 24, 2004
128
HABITAT CONSERVATION PLANS
EXISTING CONSERVATION PLANS
All established reserve areas within existing, approved project-specific HCPs that3171
adequately address the gnatcatcher have been proposed for exclusion. This section
evaluates the economic impact were these reserve areas to be designated as critical
habitat, in order to allow the Service to weight the costs of inclusion with the costs of
exclusion.
3176
This analysis was unable to estimate accurately the number of future activities that have
been authorized under existing project-specific HCPs that would involve a Federal
nexus. Furthermore, neither the Service’s nor the USACE’s section 7 consultation
record consistently specifies whether a particular consultation involves a project
authorized by an existing HCP, or is within the plan area of a project-specific HCP,3181
which makes it difficult to estimate a historical consultation rate. The Service’s
consultation record (2000-2003) appears to indicate, however, that at least one informal
and one formal consultation were completed in 2000 for proposed developments within
a project-specific HCP boundary.
3186
Assuming this rate of one formal and one informal consultation every three years, this
analysis estimates approximately eight formal and eight informal section 7
consultations would be required through 2025 for future projects in existing HCP
reserves. In addition, based on a review of Service records, this analysis assumes that
28 existing HCPs would require internal, reinitiated section 7 consultations. This3191
analysis assumes each of these would be informal consultations, and all costs would be
borne entirely by the Service. Estimated administrative costs of the 8 formal and 36
informal section 7 consultations are $142,000, as shown at the bottom of Table 2, in the
“Proposed for Exclusion” column.
3196
FUTURE HABITAT CONSERVATION PLANS
Any future HCP that addresses the gnatcatcher or includes lands designated as CH will
result in an internal section 7 consultation between the Service’s Habitat Conservation
Branch and its section 7 branch. Each consultation is assumed to be approximated by

Final Draft ReportEconomic Analysis of Critical Habitat Designation for California Gnatcatcher
February 24, 2004
129
an informal consultation, and will result in administrative costs that will be borne solely3201
by the Service.
Based on research conducted during the course of this analysis, at least 16 regional and
project-specific HCPs are planned or proposed that will address the gnatcatcher and
CSS. While it is not certain at this point that every one of these proposed plans will
reach completion and be adopted, this analysis assumes that all 16 are “reasonably3206
foreseeable” within the scope of this analysis. One informal section 7 consultation is
assumed to be required for each of the following planned HCPs:
C Chula Vista subarea plan to MSCP3211
C Otay Water District subarea plan to MSCP
C East County subarea plan to MSCP
C North County subarea plan to MSCP
C Joint Water Agencies Subregional Plan
C San Diego County MHCOSP3216
C Western Riverside County MSHCP
C Palos Verdes HCP/NCCP
C San Bernardino Valley MSHCP (planned)
C Bonelli Water Park HCP, San Dimas (planned)
C Newport Benning Ranch HCP, Coastal Orange3221
C Southern California Edison HCP
C Southern Orange County NCCP
C SD Water Districts HCP(s)
C SD County Water Authority
The estimated administrative cost of informal section 7 consultations for these 163226
assumed future HCPs is approximately $37,000, as shown in Appendix F and Table 3.
REINITIATION OF SECTION 7 CONSULTATIONS
No information was available regarding the number of future consultations that may
require reinitiation as a result of the proposed CHD.

Final Draft ReportEconomic Analysis of Critical Habitat Designation for California Gnatcatcher
February 24, 2004
75Personal communication, Ted Griswald, February 24, 2003.
76Personal comm unication, Robert Smith, Pala Tribal Chairman, and Lenore Volturno, Pala Tribal
Environmental Protection Agency, March 10, 2003.
130
TRIBAL LANDS3231
The Pala Band of Mission Indians is a federally recognized sovereign Nation, which
owns and occupies a 13,000-acre reservation in northern San Diego County. All Tribal
lands on the Pala reservation that contain essential gnatcatcher habitat have been
proposed for exclusion under section 4(b)(2). This analysis evaluates the economic3236
impacts if the essential habitat within the Pala reservation were proposed for CHD.
According to the Pala tribe’s attorney, virtually all decisions made by the Pala Tribal
Government can require section 7 consultation, either because the decision involves the
use of Federal funds (e.g., United States Department of Housing and Urban
Development housing grants) or because the decision requires approval by the Bureau3241
of Indian Affairs (e.g., project approval by the Pala Environmental Protection Agency).75
Pala tribal representatives anticipate that approximately 60 housing projects (one
private residence per project) and five community development projects (gymnasium,
medical clinic, recycling facility, etc.) will require section 7 consultation for the3246
gnatcatcher through 2025.76 This analysis assumes that each housing project will
require informal consultation, and the community facility projects will require formal
consultation. Based on input from tribal representatives, this analysis assumes that
each housing project will disturb one acre of land and that each community project will
disturb five acres. GIS-based calculations indicate that approximately 26 percent of the3251
reservation is within proposed CH, resulting in an estimate of approximately 22 acres of
CSS disturbed.
Assuming the housing projects are evenly distributed through 2025, and one
community project is constructed every five years, starting in Year 1, the estimated total3256
section 7 project modification cost is $433,000, and the estimated administrative cost of
the 60 informal and 5 formal consultations is approximately $256,000. These costs are
included in the Unit 5 cost summary shown in Table 2 for areas proposed for
exclusion.

Final Draft ReportEconomic Analysis of Critical Habitat Designation for California Gnatcatcher
February 24, 2004
131
V. OTHER ECONOMIC EFFECTS3261
This chapter evaluates the other economic effects of CHD on private land development
activities. It focuses on the designations potential to result in project delays, increase
costs due to regulatory uncertainty, and/or trigger other regulatory requirements such
as CEQA.3266
TIME DELAY
CH designation of the gnatcatcher adds an additional layer of regulatory requirement
to private land development projects. This requirement may include the conduct of
section 7 technical assistance, informal, and/or formal consultation for projects with a
Federal nexus. The need to conduct section 7 consultations in and of themselves does3271
not automatically delay private development projects as these consultations can
generally be coordinated with existing baseline regulatory processes and do not
necessarily increase the time to obtain approvals. CHD could, however, cause time
delays to some private land development projects through requirements not to conduct
certain land development activities (e.g., grading and clearing) during specific periods3276
of the year.
Section 7 and CHD for the gnatcatcher will require projects not to conduct habitat-
disturbing land development activities during the breeding season of the gnatcatcher, a
six and one-half month period from February 15 to August 31. Depending on the3281
timing of the final designation of critical habitat, this requirement may delay some
projects that would have begun construction during this period. Projects that might
have begun shortly before the start of the breeding season might also be delayed to
avoid the costly process of starting, stopping, and re-starting construction activities.
Private development projects further down the path of development are not expected to3286
be affected. It is assumed that most private development projects can time their habitat-
disturbing land development activities to avoid the six month non-breeding period.
The following assumptions were made to estimate the economic cost of time delay
associated with the CHD breeding season requirements:3291

Final Draft ReportEconomic Analysis of Critical Habitat Designation for California Gnatcatcher
February 24, 2004
132
C Projects expected to begin more than 12 months after CHD are not expected to
face any additional delay due to section 7, as land development activities can be
planned around the gnatcatcher breeding season.
C Section 7 will delay all private land development projects slated to begin3296
development in the 12 months following designation.
C The average delay to projects slated to occur in the next 12 months is 6 months.
C Private land development will occur at a constant rate over the next 23 years.3301
C The land value loss associated with this delay can be estimated by applying the
appropriate discount rate – a measure of the time value of money. As discussed
in Chapter 3, the private land developer annual discount rate is about 12
percent, though an alternative annual three percent social discount rate is also3306
considered. These discount rates are halved to calculate the time loss associated
with a six-month delay.
Table 19 summarizes the results of the economic cost of time delay by unit, with a more
detailed summary provide in Appendix I. As shown, about 12,700 acres of private land3311
development with a Federal nexus is expected to occur in CH over the next 23 years
(projected land development affected by section 7 minus required on-site set-aside). Of
this, one-twenty third (1/23), or 554 acres, are expected to be developed in the first 12
months after designation and are expected to be delayed by an average of 6 months.
Assuming a 12 percent discount rate, this time delay results in a total land value loss of3316
approximately $5.7 million.

Table 19Cost of Section 7 Time Delays
Unit Developable Acres Acres Land Value of Value Impactwith nexus in CH Delayed Delayed Acres of Delay
through 2025 (2) (3) (4)(1)
Unit 1 68 3 $1,055,700 $63,300
Unit 2 55 2 $925,500 $55,500
Unit 3 203 9 $3,135,600 $188,100
Unit 4 0 0 $2,600 $200
Unit 5 276 12 $4,626,600 $277,600
Unit 6 151 7 $2,886,200 $173,200
Unit 7 35 2 $327,500 $19,600
Unit 8 0 0 $0 $0
Unit 9 469 20 $4,236,600 $254,200
Unit 10 6,631 288 $36,883,300 $2,213,000
Unit 11 772 34 $3,882,900 $233,000
Unit 12 94 4 $733,500 $44,000
Unit 13 3,993 174 $35,940,000 $2,156,400
Totals 12,747 554 $94,636,000 $5,678,200
All dollar values have been rounded to the nearest hundred; summed totals may not add exactly.(1) See Table 10. Equals 'Projected Growth Acres Affected by Section 7' minus 'On-site Set-aside' requirements.(2) First year of land development after CHD is conservatively assumed to be delayed by six months due to lack of time to plan to avoid breeding season. Acres delay represents developed acres divided by 23, the number of years of the projection.(3) Represents value of raw, entitled land ready for development. Based on 'Residual Value of Vacant Gross Acre' estimated in Table D-1.(4) Based on 6 percent discount rate, as delay lasts six months (i.e., one-half of 12% annual discount rate).
Economic & Planning Systems, Inc. 2/26/2004 H:\12594gnat\EmailTables_Feb2004.xls
Final Draft ReportEconomic Analysis of Critical Habitat Designation for California Gnatcatcher
February 24, 2004
134
UNCERTAINTY/STIGMA3321
UNCERTAINTY
Developers face uncertainty over the required project modifications due to CHD. The
outcome of section 7 consultations are by their nature uncertain. The Service conducts
each consultation on a case-by-case basis and issues BOs and recommends project
modifications based on species-specific and site-specific considerations. While some3326
differences in recommended project modifications are clearly linked to habitat quality
and other determinable factors, an element of uncertainty remains. The costs estimated
in Chapter III considered the economic costs associated with the average expected
project modifications. While these represent the average economic costs, costs for
individual landowners/ developers will fluctuate above and below this level. 3331
The economic effects of this uncertainty depend on the degree to which developers are
risk-averse. If developers are only mildly risk averse, they will discount the value of
potential land purchases at close to the average project modification cost. If, however,
they are significantly risk averse, the element of uncertainty introduced by CHD will3336
result in a further discounting of the land value. The quantity of discount will never,
however, exceed the level of discount associated with a likely upper-end estimate of the
project modification cost. On average, the level of discount is likely to fall between the
discount associated with the average project modification cost and the likely upper-end
project modification cost. This analysis estimates a likely upper-end project3341
modification scenario and assumes the average economic cost associated with
uncertainty will be the mid-point between the upper-end and average project
modification cost.
A review of the relevant past BOs provided by the Service and summarized in3346
Appendix C implies that a reasonable upper-end scenario involves mitigation ratios 25
percent above the average (see Table 20). This estimate was derived based on Counties
where more than one BO was available with outliers removed. The outliers do not
reflect uncertainty, but rather reflect differences in habitat quality or the inclusion of
3351

Table 20Upper-End Mitigation Ratios
County Avg. High Percent Difference
San Diego 2.06 2.35 114%
Riverside 1.93 2.46 127%
Orange 3.82 4.64 121%
(1) From Table 11.Highest ratio for each region from BOs summarized in Table C-1. Outliers, such as the 4.55:1 on-site ratio forRiverside County were excluded. Such outliers are likely connected to specific, identifiable differences inhabitat quality or include mitigation for other species. As a result, the average and high ratios are adjusted.
Sources: USFWS, Carlsbad Office; Economic & Planning Systems, Inc.
Economic & Planning Systems, Inc. 2/26/2004 H:\12594gnatcatcher\Report\DEA_Feb2004\EmailTables_Feb2004.xls

Final Draft ReportEconomic Analysis of Critical Habitat Designation for California Gnatcatcher
February 24, 2004
77 A 25 percent increase in the m itigation cost ratio does not increase land set-aside by 25 percent. As a result, the costs increase by less than 25 percent.
136
other mitigation requirements beyond those associated with CSS and the gnatcatcher.
As shown, increases above the average mitigation ratio were 14, 21, and 27 percent,
respectively, for San Diego, Orange, and Riverside counties.3356
The 25 percent increment was applied to the average mitigation ratios estimated in
Chapter III (see Table 11). On-site, off-site and restoration mitigation requirements
were all increased by 25 percent. The overall average mitigation ratio for all counties
increased from 2.39 to 2.99. As a result, the overall land value loss increases by about 153361
percent, from approximately $743 million to $851 million (see Table 13 and Table 21,
respectively).77 Costs associated with on-site set-asides, off-site preservation, and
restoration costs all increase, though on-site set asides represent the majority of the
project modification cost. Administrative costs do not change based on the uncertainty
calculations.3366
The additional economic cost associated with uncertainty (i.e., cost above and beyond
that associated with the average project modification scenario) lies somewhere between
a zero and 15 percent increase. Taking a mid-point, an estimate of the uncertainty effect
of CHD on directly affected private landowners is that it increases costs by3371
approximately 7.5 percent above the estimated average project modification costs. As a
result, the increased land value loss is estimated at approximately $54 million, as shown
in Table 1.
STIGMA3376
The uncertainty costs estimated above do not include stigma-related effects. Stigma
effects are a form of uncertainty that relate less to actual fluctuations in project
modifications and more to perceived fluctuations when there is limited information on
actual outcomes. Stigma effects last for a limited time period as increasing levels of
information erode the perceived fluctuations, replacing them with a more accurate3381
assessment of the actual uncertainty. They also tend to last only as long as the “fastest
learners” remain unclear about the actual uncertainty associated with CHD. In a
situation where some market actors are clear about the effects and are able to

Table 21Upper End Mitigation - Section 7 Project Modification Costs for Private Land Development (1)
Critical Other Project TotalHabitat On-Site Off-Site CSS ModificationUnit Set-Aside Preservation Restoration Costs (3)
Unit 1 $3,138,700 $0 $0 $919,400 $4,058,100
Unit 2 $2,751,400 $0 $0 $994,100 $3,745,600
Unit 3 $9,322,400 $0 $0 $3,696,000 $13,018,300
Unit 4 $7,800 $0 $0 $3,100 $10,900
Unit 5 $13,754,900 $0 $0 $3,748,100 $17,503,000
Unit 6 $46,177,300 $0 $0 $2,680,500 $48,857,800
Unit 7 $5,239,700 $0 $0 $64,000 $5,303,700
Unit 8 $0 $0 $0 $43,800 $43,800
Unit 9 $38,238,000 $2,759,600 $3,093,100 $818,100 $44,908,800
Unit 10 $367,849,000 $47,272,700 $447,100 $12,367,400 $427,936,200
Unit 11 $85,543,200 $0 $3,288,300 $2,458,300 $91,289,800
Unit 12 $2,893,000 $0 $1,020,200 $116,200 $4,029,400
Unit 13 $141,742,700 $0 $43,412,900 $4,945,500 $190,101,100
Total, All Units: $716,658,100 $50,032,300 $51,261,600 $32,854,500 $850,806,500
All dollar values have been rounded to the nearest hundred; summed totals may not add exactly.(1) Assumes discount rate of 12.0%.(2) Results of land development model described in Chapter III, using 'High' mitigation ratios summarized in Table 20.(3) 'Other Project Modification Costs' are assumed not to change based on uncertainty factors, and are the same as reported in Table 13.
Estimated Mitigation Costs (2)
Economic & Planning Systems, Inc. 2/26/2004 H:\12594gnatcatcher\Report\DEA_Feb2004\EmailTables_Feb2004.xls

Final Draft ReportEconomic Analysis of Critical Habitat Designation for California Gnatcatcher
February 24, 2004
138
appropriately discount the land values, while others incorporate a stigma and discount
the land further, arbitrage is likely to occur. The “fastest learners” will buy the land
from others, gradually increasing the land price until it reaches the value of land
associated with actual uncertainty discounting only. 3391
The previous designation of critical habitat for the gnatcatcher brings with it a history of
knowledge concerning the types of project modifications required. As a result, the
knowledge of the actual level of uncertainty is greater than in many other CHD cases.
Furthermore, as noted above, the stigma effect primarily results in a land value3396
distribution to the “fastest-learners” from others, all on the same site. The only actual
stigma costs are the transaction costs associated with arbitrage (e.g., buying and selling
of land, to the extent it occurs) and the investment made in understanding the project
modification requirements. As a result, stigma impacts from the gnatcatcher CHD are
expected to be short-lived and relatively minor and are not quantified as part of this3401
analysis.
CEQA-RELATED INDIRECT COSTS
As described in Chapter II, CEQA is a California state statute that requires state and
local agencies (known here as “lead agencies”) to identify the significant environmental
impacts of their actions and to avoid or mitigate those impacts, if feasible. It is possible3406
that CH could provide new information regarding the location of sensitive habitat areas
to lead agencies (typically a county/city community development or planning
department in the case of land development projects), which could result in additional
costs to the project applicant. Because neither CEQA nor the Endangered Species Act
specifically requires lead agencies to address Federally-designated CH, these potential3411
effects are considered indirect effects, and potentially include one or more of the
following:
1. The lead agency may be more likely to require mitigation for habitat loss as part
of the CEQA process.3416

Final Draft ReportEconomic Analysis of Critical Habitat Designation for California Gnatcatcher
February 24, 2004
139
2. Projects that would have submitted either a mitigated negative declaration or a3421
negative declaration under CEQA prior to CHD must now complete an EIR
because of assumed unavoidable impacts to an environmental resource of
critical concern.
3. The project applicant may incur additional costs in considering/addressing3426
designated CH in the context of preparing required CEQA documentation
(negative declaration, EIR, etc.)
CEQA statutes specifically require lead agencies to consider a project’s effect on rare or
endangered plant and animal communities. However, in the case of the gnatcatcher, it3431
is unlikely that CHD will alert many lead agencies to the presence of CSS that they did
not already recognize. The assumption that lead agencies are currently aware of the
presence and significance of CSS is based on the following regulations and
observations, all of which predate the proposed CHD:
3436
• The State legislature officially recognized CSS as a sensitive habitat type in the
1991 NCCP Act.
• The DFG has also officially recognized CSS as a “threatened” habitat type,
assigning it an S1.2 ranking on the “Sensitivity of Top Priority Rare Natural3441
Comminutes in Southern California” list, and unofficially encourages lead
agencies to require 2-to-1 mitigation, as discussed in Chapter II. Again, the S1.2
ranking for CSS predates the gnatcatcher listing.
• Two approved regional NCCPs and a number of regional NCCPs currently3446
under development reflect an effort by many local/regional planning agencies to
address the effects of land development on CSS habitat.
• Despite the CHD for the gnatcatcher in 2000 and the requirements under CEQA,
which included units in Riverside and San Bernardino counties, local lead3451
agencies in these counties do not currently require CSS mitigation under CEQA,
as discussed in Chapter II.

Final Draft ReportEconomic Analysis of Critical Habitat Designation for California Gnatcatcher
February 24, 2004
78 Personal communication with senior staff from RBF Consulting (San Jose, CA), EDAW(Sacramento, CA) and HT Harvey & Associates (Watsonville, CA), February 24-28, 2003.
140
Given the historically widespread, well-publicized nature of CSS as a sensitive habitat
type, as well as the previous designation, it appears that lead agencies are unlikely to3456
require additional CSS mitigation or change CEQA reporting protocol due to the CHD.
Both DFG and Service staff confirmed this conclusion and were not aware of any
specific examples in which CEQA reporting or mitigation requirements were expanded
due to CH.
3461
This analysis also concludes that CHD will not result in additional costs during the
preparation of CEQA documentation. A series of consultants who specialize in EIRs
were asked whether the presence of CH on a project site added to the cost of preparing
the EIR and seeing it through public hearings as part of the project's entitlement
process. The consensus view in the consultant community is that CHD adds no3466
measurable CEQA-related cost for the project applicant.78 Two primary reasons for this
are described below.
First, where listed species are present on the project site, the EIR's biological component
will be required to discuss and evaluate habitat impacts. This requirement is3471
unchanged after federal CHD. Second, where species are not present on the project site,
CEQA directs the EIR to inventory the important natural resources on the project site
and characterize project impacts to important habitat types. CEQA makes no reference
to critical habitat, and methods used by EIR biologists are unlikely to change if CH is
designated. In fact, according to State officials, State agency oversight of the quality and3476
completeness of a project EIR concentrates wholly on the biological values of habitat in
proximity to the project and on potential project impacts to that habitat, and not on the
property’s status as federally designated CH.

Final Draft ReportEconomic Analysis of Critical Habitat Designation for California Gnatcatcher
February 24, 2004
79 5 U.S.C. 601 et. seq.
80 Thus, for a regulatory flexibility analysis to be required, impacts must exceed a threshold for“significant impact” and a threshold for a “substantial number of small entities.” See 5 U.S.C. 605(b).
141
VI. SMALL BUSINESS REGULATORY ENFORCEMENT ACT
3481
POTENTIAL IMPACTS ON SMALL BUSINESS
Under the Regulatory Flexibility Act (as amended by the Small Business Regulatory
Enforcement Fairness Act (SBREFA) of 1996), whenever a Federal agency is required to
publish a notice of rulemaking for any proposed or final rule, it must prepare and make3486
available for public comments a regulatory flexibility analysis that describes the effect
of the rule on small entities (i.e., small businesses, small organizations, and small
government jurisdictions).79 However, no regulatory flexibility analysis is required if
the head of an agency certifies that the rule will not have a significant economic impact
on a substantial number of small entities.80 SBREFA amended the Regulatory Flexibility3491
Act to require Federal agencies to provide a statement of the factual basis for certifying
that a rule will not have significant economic impact on a substantial number of small
entities. Accordingly, the following represents a screening level analysis of the
potential effects of CHD on small entities to assist the Secretary in making this
certification.3496
This analysis estimates the number of small entities potentially affected by the CHD for
the gnatcatcher in counties supporting CH areas. It also estimates the level of effect the
designation will have on small entities. For both estimates, this analysis conservatively
examines the total estimated section 7 costs calculated in earlier sections of this report.3501
Federal courts and Congress have indicated that a Regulatory Flexibility Act/SBREFA
analysis should be limited to direct and indirect impacts on entities subject to the
requirements of the regulation. As such, entities indirectly impacted by the gnatcatcher
listing and CHD, and, therefore, not directly regulated by the listing or CHD, are not3506
considered in this screening analysis.

Final Draft ReportEconomic Analysis of Critical Habitat Designation for California Gnatcatcher
February 24, 2004
142
This analysis begins by identifying all formal and informal consultation activities
generated by the proposed rule that may involve small entities (business or
governments). The analysis then estimates the number of small entities that are3511
potentially affected. Finally, the level of impact on those entities is examined. As
specified in the proposed rule, certain “essential” conservation lands have been
proposed for exclusion from CHD. In order to evaluate the economic and other
relevant impacts of excluding these areas from CH, this analysis performs the
calculations described above for both areas. The “Proposed” column in Tables 223516
through 24 represents an estimate of the effect(s) on small businesses if CH is
designated only for those areas currently proposed; the “Prop. & Excluded” column
represents an estimate of the effect(s) if CH is designated for all areas, including those
currently proposed for exclusion.
3521
IDENTIFICATION OF ACTIVITIES THAT MAY INVOLVE SMALL ENTITIES
Chapters III and IV of this report identify land use activities that are within the
proposed CHD for the gnatcatcher and potentially impacted by section 7
implementation (i.e., requiring consultations or project modifications) under the “with3526
section 7” scenario.
Of the projects that are potentially affected by section 7 implementation for the
gnatcatcher, some do not have third party involvement (i.e., only the action agency and
the Service are expected to be involved). Thus, small entities should not be affected by3531
section 7 implementation for affected projects with the following agencies:
C Forest Service (prescribed burns)
C Bureau of Land Management (fire break projects)
C FEMA (construction, prescribed burn, and flood prevention)3536
C Marine Corps (various base operations and maintenance activities)
C Navy (construction and maintenance of base infrastructure)

Table 22Estimated Annual Number of Small Businesses Affected by Critical Habitat Designation
2,953 2,953
3,313 3,313
89% 89%
34 51
1.1% 1.7%
Sources: Dun and Bradstreet; Economic & Planning Systems, Inc.
Land Development SIC 6552Prop. & ExcludedProposed
Annual percentage of small businesses affected (number of small businesses affected) / (total number of small businesses)
Number of small businesses in industry within study area
38
Total number of all businesses in industry
Percent of businesses that are small (number of small businesses) / (total number of businesses)
Industry Name
Annual number of small businesses affected (number of affected businesses ) * (percent of small businesses)
58
Annual number of affected businesses in the industry (equal to the number of annual consultations)
Economic & Planning Systems, Inc. 2/26/2004 H:\12594gnatcatcher\Report\DEA_Feb2004\EmailTables_Feb2004.xls

Table 23Estimated Annual Number of Small Governments Affected by Critical Habitat Designation
24 28
76 80
32% 35%
1.5 2.5
6% 9%
Sources: 2001 California County Profiles , California Department of Finance; Economic & Planning Systems, Inc.
Proposed Prop. & ExcludedSmall Governments
75
Industry Name
Annual number of affected governments (equal to the annual number consultations)
Annual number of small governments affected (Number of affected governments) * (Percent of small governments)
Annual percentage of small governments affected (Number of small governments affected) / (Total number of small governments)
Total number of all governments
Percent of governments that are small (Number of small governments) / (Total number of governments)
Number of small governments in industry within study area
Economic & Planning Systems, Inc. 2/26/2004 H:\12594gnatcatcher\Report\DEA_Feb2004\EmailTables_Feb2004.xls

Table 24Estimated Annual Effects on Small Businesses in Land Development and Real Estate Industry
Land Development
SIC 6552
"Small Businesses"
SIC 6552
Land Development
SIC 6552
"Small Businesses"
SIC 6552
300 27 300 27
$10.26 $10.26 $10.26 $10.26
2 2 2 2
$67,016,615 $6,000,000 $67,016,615 $6,000,000
$988,028 $88,458 $678,156 $60,715
1.5% 1.5% 1.0% 1.0%
Proposed & Excluded
Per-business Annual Gross Revenue [(project size x 43560sf x land value/sf)/project duration]
Per-business Cost
Per-business Effect (per-business cost/annual gross revenue)
Proposed
(1) This is calculated by taking the average of improved residential, office, industrial and retail land values for the six counties presented in Table D-1, D-2 and D3. Without the specific knowledge of where and what type of land-use development a small business will undertake, it is deemed appropriate to take gross average of improved land value for all land-use types. Although land values may differ significantly across the six counties, because they are proportional to both the gross revenue and the section 7 related costs, the average land value does not take geographic differences into account.
(2) Assuming that the required land-use zoning exists, land development projects take one to two years to complete (this process involves obtaining necessary permits, entitlements, etc.) To be conservative, this analysis assumes that each of the future private development projects will take about 2 years to complete.
Industry Name
Project Size (acres)
Improved Land Value/SF (1)
Project Duration (2)
Economic & Planning Systems, Inc. 2/26/2004 H:\12594gnatcatcher\Report\DEA_Feb2004\EmailTables_Feb2004.xls

Final Draft ReportEconomic Analysis of Critical Habitat Designation for California Gnatcatcher
February 24, 2004
146
In addition, major infrastructure and utility projects are potentially affected by section 7
implementation. These projects are expected to involve large public agencies and
corporations such as TCA, MWD, SDCWA, SDG&E, SCGC, and SCE, which exceed the
Small Business Administration’s annual sales threshold for small utility corporations or3551
population threshold for small governments. Therefore they do not fit the category of
small entities.
C FHWA (construction and maintenance of state highways)
C USACE (expansion of SR-241 toll road; construction and maintenance of regional3556
utility infrastructure)
C BOR (construction/replacement of levee, basin, and flood control channels)
C Federal Energy Regulatory Commission (construction of utility infrastructure)
C Bureau of Land Management (construction of utility infrastructure )
C Forest Service (construction of utility infrastructure)3561
After excluding these two sets of agencies and consultations noted above from the total
universe of impacts identified in the body of the analysis, one action agency and 311
associated consultations remain. This subset represents the action agency and
consultations that may produce significant impacts on small entities. Specifically, these
actions feature activities that do not occur exclusively on Federal lands and may involve3566
costly project modifications due to section 7 implementation:
C USACE (private land development)
DESCRIPTION OF AFFECTED ENTITIES3571
This section describes the industries most likely to be affected by section 7
implementation for the gnatcatcher. More information about the affected projects can
be found in Chapters III and IV of this report.
3576
Land Development and Real Estate (SIC 6552)
The Small Business Administration defines small businesses within the land
development and real estate industry as having less than $6 million in average annual
receipts (also referred to as sales or revenues). Projects permitted by USACE that3581

Final Draft ReportEconomic Analysis of Critical Habitat Designation for California Gnatcatcher
February 24, 2004
81 U.S.C § 601.
82 This estimate is based on the past consultation history provided by the U.S. Fish and W ildlifeService. This analysis assumes that the past consultation rate will remain constant throughout thenext 23-year period .
147
involve section 7 consultations for gnatcatcher species may affect small businesses
under SIC code 6552. In order to determine whether or not small businesses in the land
development and real estate industry are affected by USACE projects, the $6 million
threshold must be considered in the analysis.
3586
Significant levels of Federal agency review and permitting are often required for land
development projects by public and private entities. This analysis assumes that the
primary Federal nexus for future private development activities is the issuance of
section 404(b) permits by USACE under the Clean Water Act for impacts to “waters of
the U.S.” If the project is located within proposed CH, the nexus through a 404(b)3591
permit from the ACOE would trigger a section 7 consultation with the Service.
As discussed in Chapter III, past consultation history provided by the USACE serves as
a basis for estimating the number of future private development projects that would
involve the gnatcatcher. It is estimated that 866 formal consultations will take place3596
involving businesses in the land development and real estate industry over the next 23-
year period.
Activities Funded by Small Governments
3601
The SBREFA defines a “small governmental jurisdiction” as “governments of counties
with a population of less than fifty thousand.”81 This analysis assumes that the counties
and cities in the study area will be involved in approximately 12.5 percent of the future
private development projects.82 County and/or city governments may get involved in
future private developments, and therefore section 7 consultations, through various3606
permits, local utilities and infrastructures. All small governments for cities and
counties that have a population that is less than 50,000 persons within the total study
area constitute the universe of small governments in this analysis. It is estimated that
about 108 out of the 866 formal consultations for future private development will
involve cities and counties in the study area over the next 23-year period. 3611

Final Draft ReportEconomic Analysis of Critical Habitat Designation for California Gnatcatcher
February 24, 2004
83 Dun Market Identifiers, File 516: Dun and Bradstreet, February 2003.
148
ESTIMATED NUMBER OF AFFECTED ENTITIES THAT ARE SMALL
To be conservative, (i.e., more likely to overstate impacts than understate them), this
analysis assumes that each of the consultations in a given year is undertaken by a
unique small entity, so the number of businesses/governments affected annually is3616
equal to the total annual number of consultations (both formal and informal). This
analysis also limits the universe of potentially affected entities to include only those
within the counties in which CH units lie; this interpretation produces a more
conservative analysis than including all entities nationwide.
3621
Activities of the Army Corps of Engineers and Effects on the Land Development and
Real Estate Industry (SIC 6552)
First, the number of affected small businesses for the land development and real estate
industry is estimated. As shown in Table 22, the following calculations are used to3626
arrive at this estimate:
C Estimate the annual number of businesses within the study area affected by
section 7 implementation (assumed to be equal to the number of annual
consultations). Thirty-eight formal consultations are estimated annually for USACE3631
projects that are likely to affect businesses in the land development and real estate
industry (866 total consultations over 23 years).
C Calculate the percent of businesses in the affected industry that are likely to be
small. This is calculated by dividing the total number of small businesses in the3636
study area for the SIC code (using the annual sales thresholds from the Small
Business Administration described in the previous section ) by the total number of
businesses in the study area that fall under the same SIC code.83 The analysis shows
that 89 percent of the land development and real estate (SIC 6552) businesses within
the study area are small.3641

Final Draft ReportEconomic Analysis of Critical Habitat Designation for California Gnatcatcher
February 24, 2004
84 Population count for the study area was obtained from California County Profiles – A Companionto the 2000 C alifornia Statistical Abstract, California Department of Finance, 2002. All cities andcounties within the study area that have a total population less than or equal to 50,000 persons wasconsidered small (according to Small Business Administration guidelines).
149
C Calculate the number of affected small businesses. This is calculated by
multiplying the percent of small businesses in the affected industry by the total
number of annual consultations. According to this calculation, 34 small businesses3646
in the land development and real estate industry are expected to be affected
annually.
C Calculate the percent of small businesses likely to be affected by CH. This is done
by dividing the number of affected small businesses by the total number of small3651
businesses in the study area. This analysis reveals that approximately one percent
of all the small businesses in the study area for the land development and real estate
industry are likely to be affected by gnatcatcher consultation activities.
Activities of the Army Corps of Engineers and Effects on Small Governments3656
First, the number of affected small governments in the study area is estimated.84 As
shown in Table 23, the following calculations are used to arrive at this estimate:
C Estimate the annual number of governments within the study area affected by
section 7 implementation (assumed to be equal to the annual number of 3661
consultations). Five formal consultations are estimated annually for USACE
activities that would involve government entities in the study area.
C Calculate the percent of governments in the study area that are likely to be small.
This is calculated by dividing the number of small governments by the total number3666
of governments in the study area. The analysis shows that 32 percent of the
governments within the study area are small.
C Calculate the number of affected small governments in the study area. This is
calculated by multiplying the percent of small governments by the total number of3671
annual consultations. This analysis shows that less than 1.5 unique small
government(s) in the study area are affected annually.

Final Draft ReportEconomic Analysis of Critical Habitat Designation for California Gnatcatcher
February 24, 2004
150
C Calculate the percent of small governments likely to be affected by CH. This is
done by dividing the number of affected small governments in the study area by3676
the total number of small governments in the study area. This analysis reveals that
six percent of the small governments in the study area are likely to be affected by
gnatcatcher consultation activities.
ESTIMATED EFFECTS ON SMALL ENTITIES3681
Activities of USACE and Effects on the Land Development and Real Estate
Industry (SIC 6552)
As concluded in the previous section, less than one percent of small businesses (123686
businesses) in the land development and real estate industry in the study area is
expected to be affected by section 7 consultation activities. Costs of CHD to small
businesses consist of the administrative cost of participating in section 7 consultations
and the cost of project modifications. To be conservative, this analysis assumes that the
small businesses undertaking future development projects own the land that is to be3691
developed. In other words, a developer will bear all the costs involved in a consultation
including on-site mitigation cost in the form of a reduced land value. In reality,
however, a developer may purchase raw land from an individual landowner at a
reduced price due to the costs (actual or perceived) associated with the designation. In
this case, potential mitigation costs would likely be reflected in the selling price of the3696
land, and therefore be incurred by the landowner.
In order to estimate the level of effect the designation may have on the 12 affected small
businesses in the land development and real estate industry, this analysis calculates a
per-business annual gross revenue of the affected small businesses in the industry and3701
compares the cost to per-business cost of engaging in section 7 consultation. Steps
taken to arrive at the estimate are described below and summarized in Table 24:
• Calculate the per-business revenue. As discussed in Chapter III, each of the
future private land development projects in the study area is assumed to be 3003706
acres in size. This analysis makes the conservative assumption that an affected
small business undertakes only one development project at a given time. As such,

Final Draft ReportEconomic Analysis of Critical Habitat Designation for California Gnatcatcher
February 24, 2004
85 As shown in Table 1, the majority of section 7-related costs for private land development
projects com e from project modifications involve setting aside on-site and purchasing off-sitemitigation land, and these mitigation measures are directly correlated to project size.
151
gross annual revenue of an affected small business is calculated by dividing the total
revenue generated by selling a 300-acre parcel of developed land by the number of
years taken to complete the project (see Table 24 for the illustration and details of3711
the calculation). This calculation yields an average annual per-business gross
revenue of approximately $67 million for the entire land development and real
estate industry. Despite the conservative assumption made, this annual gross
revenue is $61 million higher than the small business threshold of $6 million for the
industry. This illustrates the reality that a small business is not likely to undertake a3716
project of such magnitude. As shown in Table 24 (“Proposed,” column 2), this
analysis assumes that project size is proportional to annual gross revenue, and that
small businesses with revenues of $6 million will be associated with projects around
27 acres in size.
3721
C Calculate the per-business cost. This consists of third-party administrative and
project modification costs of participating in a section 7 consultation. The average
per-business cost for the entire land development and real estate industry is
calculated by dividing the total consultation and project modification costs for
future private development projects (Table 3) by the total number of consultations. 3726
As shown in Table 24 (“Proposed,” column 1), this calculation yields a per-business
cost of approximately $990,000. Although project modification costs will vary across
regions due to differences in land values, average project modification cost is used
to derive the per-business cost because this section examines impact on small
businesses in the entire study area. As shown in Table 24 (“Proposed,” column 2),3731
the estimated per-business cost for businesses with annual revenues of $6 million or
less (and therefore defined as “small”) is approximately $88,000, because project size
is also assumed to be proportional to section 7 consultation costs.85

Final Draft ReportEconomic Analysis of Critical Habitat Designation for California Gnatcatcher
February 24, 2004
86 The 24 small governm ents in the study area have a wide range of revenue from $1 million to $75million. Because the specifics of small governments likely to be affected by future section 7consultation activities are unknown, the analysis uses the median to represent the per-governmentrevenue.
152
C Estimate the level of effect on small businesses. This is calculated by taking the3736
per-business cost and dividing it by the per-business revenue. As presented in
Table 25 (“Proposed”), this calculation estimates an impact equivalent to
approximately 1.5 percent (1.5%) of the annual per-business revenue for the affected
small businesses in the industry.
3741
Activities of the Army Corps of Engineers, and Effects on Small Governments
As concluded in the previous section, approximately six percent of small governments
in the study area are estimated to be affected by section 7 consultation activities. Costs
of CHD to small governments are expected to be limited to the administrative costs of
participating in section 7 consultations, because private developers are likely to bear the3746
cost of project modifications. The following steps describe the methodology used to
estimate the effect of section 7 consultation activities on directly affected small
governments in the study area (see Table 23):
C Calculate the per-government costs. This consists of the cost to a third party of3751
participating in a section 7 consultation. The average per-government cost of
participating in section 7 consultations for future development projects is estimated
to be approximately $3,500. This estimate is derived by dividing total consultation
costs for the small governments by the total number of consultations.
3756
C Determine the per-government revenue for the small governments in the study
area. This is derived by listing the revenues of all 24 small governments in the study
area in ascending order and taking the mid-point—i.e., the median. 86
C Estimate the level of effect on small governments. This is calculated by taking the3761
per-government cost and dividing it by the median revenue to determine the
percent of revenue represented by the per-government cost of a consultation. As
presented in Table 25, small governments are likely to experience impacts equal to
less than one percent of their median revenue.
3766

Table 25Estimated Annual Effects on Small Governments
Median revenue of all affected small governments[1] $16,800,428
Per-government cost $3,500
Per-government effect (per-government cost/median revenue) 0.02%
[1] The median is calculated based on 1999 Cities Annual Report, California State Controller, and City of Rancho Santa Margarita Financial Transactions Report accessed at http://www.cityofrsm.org/rsm_website /citiesfinanrpt.asp, March 2003. These are represented in 2002 dollars.
Economic & Planning Systems, Inc. 2/26/2004 H:\12594gnatcatcher\Report\DEA_Feb2004\EmailTables_Feb2004.xls

Final Draft ReportEconomic Analysis of Critical Habitat Designation for California Gnatcatcher
February 24, 2004
87Although a reduced impact may be counterintuitive given an increase in the assumed size of the
designation, this result can be explained by the fact that the relative increase in annual affected smallentities (18 vs. 12, or a 50 percent increase) is greater than the relative increase in total privatedevelopment project modification costs ($748 m illion vs. $727 million, or a 3 percent increase). Agreater total cost is therefore allocated among an even greater number of businesses, resulting in asmaller estimated per-business cost.
154
SUMMARY
3771
Section 7 implementations for the gnatcatcher are likely to affect small businesses in the
land development and real estate industry (SIC 6552) as well as small governments in
the study area. According to the calculations above, about 34 small businesses in the
land development and real estate industry would be affected annually, which
represents approximately one percent of the total number of small businesses in the3776
industry for the study area. These affected small businesses are likely to experience
impacts equivalent to about 1.5 percent of their per-business annual gross revenue. For
the small governments in the study area, approximately 1.5 agencies are likely to be
affected annually, which represent about six percent of the total number of small
governments in the study area. Affected small governments are likely to experience3781
impacts equivalent to less than one percent of the median revenue of small
governments in the study area.
Finally, as shown in Tables 23 through 25 (“Proposed & Excluded” column), CHD in
areas currently proposed for exclusion would annually impact seventeen (17) additional3786
small businesses in the land development and real estate industries, or 51 small
businesses affected in total. This analysis estimates that each of these 51 small
businesses would experience an economic effect equal to approximately one percent of
its annual gross revenue. This estimate is approximately two-thirds of the per-business
impact estimated for the small businesses within proposed critical habitat alone.87 For3791
the small governments, approximately two additional agencies are likely to be affected
annually, or 7 total small governments each year. However, the level of impact on
affected small governments is estimated to remain the same.

Final Draft ReportEconomic Analysis of Critical Habitat Designation for California Gnatcatcher
February 24, 2004
88
Memorandum For Heads of Executive Department Agencies, and Independent RegulatoryAgencies, Guidance For Implem enting E.O. 13211, —01-27, Office of M anagement and Budget,July 13, 2001, http://www .whitehouse.gov/om b/mem oranda/m 01-27.html
89
Id.
155
VII. ENERGY IMPACT ANALYSIS3796
Pursuant to Executive Order No. 13211, “Actions Concerning Regulations that
Significantly Affect Energy Supply, Distribution, or Use,” issued May 18, 2001, Federal
agencies must prepare and submit a “Statement of Energy Effects” for all “significant
energy actions.” The purpose of this requirement is to ensure that all Federal agencies3801
“appropriately weigh and consider the effects of the Federal Government’s regulations
on the supply, distribution, and use of energy.”88 The Office of Management and
Budget has provided guidance for implementing this executive order that outlines nine
outcomes that may constitute “a significant adverse effect” when compared without the
regulatory action under consideration: 3806
• Reductions in crude oil supply in excess of 10,000 barrels per day;
• Reductions in fuel production in excess of 4,000 barrels per day;
• Reductions in coal production in excess of 5 million tons per year;
• Reductions in natural gas production in excess of 25 million mcf3811
• Reductions in electricity production in excess of 1 billion kilowatt-hours per year or
in excess of 500 megawatts of installed capacity;
• Increases in energy use required by the regulatory action that exceed the thresholds
above;
• Increases in the cost of energy production in excess of one percent;3816
• Increases in the cost of energy distribution in excess of one percent; or
• Other similarly adverse outcomes.89
•
Research conducted during the course of this analysis did not reveal any instances in
which the proposed designation was anticipated to affect the construction of any new3821
power-generating facilities, or the operation of any existing facilities. Furthermore, the
proposed designation is not expected to affect crude oil supply or increases in energy
use. This analysis therefore concludes that the effects of the proposed designation on

Final Draft ReportEconomic Analysis of Critical Habitat Designation for California Gnatcatcher
February 24, 2004
156
the energy industry will be limited to increases in the cost of delivering energy to end
users due to additional costs incurred through the section 7 consultation process. The3826
proposed designation is not expected to affect energy production, use, or supply. As a
result, only one screening criterion is relevant to this energy impact analysis – potential
increases in the cost of energy distribution in excess of one percent. Below, we analyze
whether the electricity and natural gas industries are likely to experience “a significant
adverse effect” as a result of section 7 implementation for the gnatcatcher. 3831
SECTION 7 EFFECT ON ENERGY DISTRIBUTION COSTS
The annualized section 7 costs borne by the energy industry within proposed CH represent 0.143836
percent of annual distribution costs, which is well below the one-percent significance threshold
established by the OMB. This analysis therefore concludes that section 7 regulation under the
proposed designation will not result in a “significant adverse effect” to the energy industry.
This section evaluates whether the estimated section 7 administrative and project3841
modification costs that will be borne by the energy industry represent greater than one
percent of current energy distribution costs. The estimated administrative and project
modification costs for agencies involved with municipal power supply are summarized
in Table 3; project modification costs are calculated in Appendix G. This section
compares these costs (on an annualized basis) to expenses incurred by the energy 3846
industry to operate, maintain, and improve its gas and electric distribution systems in
2001 to determine whether the one percent “significance threshold” has been exceeded.
A summary of data sources and calculations is shown in Table 26.
3851
As described in Chapter IV, this analysis identifies three regional energy companies
with future projects that will likely require section 7 consultation – SCE, SDG&E, and
SCGC. Regional electricity supply is delivered by SDG&E (San Diego County) and SCE
(remainder of proposed critical habitat area); regional natural gas supply is delivered by
SDG&E (San Diego County) and the SCGC (remainder of proposed critical habitat area).3856

Final Draft ReportEconomic Analysis of Critical Habitat Designation for California Gnatcatcher
February 24, 2004
90This includes approxim ately $390 m illion in capital im provement costs incurred in 2001 to
support the energy distribution system(s). EPS was unable to find any historical information toestimate average annual capital improvem ent costs, so these values are assumed to berepresentative. The CPUC – the state agency responsible for regulating energy rates – instructedEPS to use these figures, which represent official submittals by the energy companies to supporttheir rate increase applications.
157
As shown in Table 3, this analysis estimates that these three companies will incur
section 7 administrative and project modification costs of approximately $12 million
through 2025. This is equivalent to an annualized cost of approximately $1 million over
23 years, assuming a discount rate of 7 percent.
3861
To estimate annual distribution costs, EPS obtained General Rate Case applications
submitted by each of the three companies to the California Public Utilities Commission
(CPUC) in 2002. The CPUC is responsible for authorizing utility rate increases, which it
evaluates on the basis of cost/revenue data and projections submitted by each utility
company in its General Rate Case application. According to CPUC staff, the most3866
recent applications were submitted in 2002, and contain official company statements of
2001 O&M and annual capital improvement expenditures made to support the
gas/electric distribution system(s). As summarized in Table 26, total distribution costs
for these three companies in 2001 were approximately $754 million.90
3871
Based on the annual distribution costs described above, section 7 regulation following
the proposed designation would have to result in costs to the energy industry greater
than $7.54 million per year for the impact to be considered a “significant adverse
effect.” As described above, the estimated annualized cost of the proposed designation
on the energy industry is approximately $1.5 million – or 14 percent of the significance3876
threshold based on distribution costs. This analysis therefore concludes that the
proposed designation of critical habitat for the gnatcatcher will not result in a
significant adverse effect on the energy industry.

Table 26Energy Impact Analysis Summary
Item/Value TotalSCE SDG&E SCGC SDG&E
Distribution Costs (2001):O&M Costs (1) 218,821,000 $53,152,000 $82,532,000 $9,964,000 $364,469,000Annual Capital Improvements (1) N/A $237,557,000 $127,438,000 $24,879,000 $389,874,000Total Distribution Costs 218,821,000 $290,709,000 $209,970,000 $34,843,000 $754,343,000
Estimated threshold for a "Significant Adverse Effect:" (2) -- -- -- $7,543,430
Estimated Impact of Designation (3) -- -- -- -- $11,588,000
Annualized Impact (4) -- -- -- -- $1,028,017
Annualized Impact as Percent of Distribution Costs 0.14%
Annualized Impact as Percent of Significance Threshold: -- -- -- 14%
(1) From General Rate Case Applications to the California Public Utilities Commission (Application numbers 02-05-004 [SCE], 02-12-027 [SCGC], and 02-12-028 [SDG&E]) filed in 2002, based on 2001 data. These include only those costs related to operating, maintaining, and construction the energy distribution system.
(2) A "significant adverse effect" is defined as a increase in the cost of energy distribution in excess of one percent. (3) From Table 3.(4) Represents the annual amount that is equivalent to the total impact estimate, when distributed over a 23-year period assuming a 7% discount rate.
and assuming a 7% discount rate.
SCE -- Southern California EdisonSDG&E -- San Diego Gas & ElectricSCGC -- Southern California Gas Company
Electricity Natural Gas
Economic & Planning Systems, Inc. 2/26/2004 H:\12594gnatcatcher\Report\DEA_Feb2004\EmailTables_Feb2004.xls

Final Draft ReportEconomic Analysis of Critical Habitat Designation for California Gnatcatcher
February 24, 2004
91 2 USC 1532.
92 UM RA includes several other requirements that may pertain to this rulemaking. Section 203
requires the Service to develop a Small Government Agency Plan for any rule that may significantlyor uniquely affect small governments, regardless of whether the rule exceeds the $100 millionthresholds (i.e., thresholds for governments or the public sector) (2 USC 1533). In addition, section204 requires the Service to develop an effective process that allows for meaningful and timely inputduring regulatory development by State, local, and tribal governments (2 USC 1534). The Service’scompliance with these requirements is addressed separately from this analysis.
93
2 USC 1532.
159
VIII. UN FUN DED MAN DATES AN ALYSIS
Title II of the UMRA of 1995 requires Federal agencies to assess the effects of their
regulatory actions on State, local, and tribal governments and the private sector. Under3886
section 202 of the UMRA, the Service must prepare a written statement, including a
cost-benefit analysis, for significant regulatory actions that include a Federal mandate
resulting in the expenditure by State, local, and tribal governments, in the aggregate, or
by the private sector, of $100 million or more in any one year.91 Federal rules are
exempt from the UMRA requirements if: (1) the rule implements requirements3891
specifically set forth in law; or (2) compliance with the rule is voluntary for State and
local governmental entities. Although CHD is required by the Act, the Secretary has
discretion in designating specific geographic areas. Therefore, these two criteria are not
met.
3896
If a written statement is needed, section 205 of UMRA requires the Service to identify
and consider a reasonable number of regulatory alternatives.92 The Service must adopt
the least costly, most cost-effective or least burdensome alternative that achieves the
objectives of the rule, unless the Secretary publishes an explanation why that alternative
was not adopted. These requirements apply to both proposed and final rules.3901
This analysis first determines whether a written statement is required, based on the
criteria set forth by UMRA. If such a statement is needed, section 202 of UMRA
provides specific direction regarding the contents of the cost-benefit analysis that must
accompany such a statement.93 This analysis describes and discusses each of the types3906
of costs that must be addressed.

Final Draft ReportEconomic Analysis of Critical Habitat Designation for California Gnatcatcher
February 24, 2004
94
Although the analysis categorized regional utility projects as “public” projects due to the public-nature of utility infrastructure provision (as opposed to private real estate development), themajority of large utility companies addressed in this report (e.g., MWD, SDG&E, SCE, and SCGC)are privately held companies. Section 7 costs are therefore appropriately attributable to the
private sector. 95
Had it been possible to determine the year in which consultations and associated projectmodifications would take place, the annualized expenditure method would not be necessary. Theactual costs are likely to vary unevenly from year to year, as fiscal and market conditions change,with som e years receiving a greater share of the costs than others.
160
Significant Regulatory Action Under UMRA
As shown in Table 27, the total estimated section 7 cost for State, local, and tribal3911
governments is approximately $89 million. This estimate includes section 7 project
modification and administrative costs for all public projects, except regional utility
projects (e.g., water, power, etc.).94 The total estimated section 7 cost for the private
sector is approximately $826 million, which includes project modification,
administrative, delay, and uncertainty costs for all private development projects, as well3916
as project modification and administrative costs for regional utility projects.
Annualized costs are estimated to be approximately $7.9 million for State, local, and
tribal governments, and approximately $112 million for the private sector in the first
year following CHD. In general, this analysis relies on annualized expenditures instead3921
of a multi-year series of costs because most costs estimated in this document are
uncertain with regard to timing; one exception, however, are delay costs, which are
expected to occur entirely in Year 1.95 In order to estimate the maximum single-year
annualized private sector expenditures, this analysis used cost estimates for Year 1,
which include annualized costs for cost categories other than delay ($106.4 million),3926
plus the full delay cost estimate ($5.7 million).
Based on the criteria set forth by UMRA, CHD for the gnatcatcher may result in
expenditures by the private sector of more than $100 million annually. Therefore, a
written statement is required.3931

Table 27Unfundated Mandates Reform Act (UMRA) Calculation Summary
Measure Non-Federal Private Governments (1) Sector (2)
Total Cost $88,796,900 $826,540,600
Requirement for Written UMRA Statement (3)
Annualized Cost (4) $7,877,500 $112,029,100
Percent of $100M Threshold 8% 112%
Effect on State/National Economy (5)
Percent of National GDP (6) 0.001% 0.008%
Percent of California GSP (7) 0.01% 0.06%
Percent of GSP, State & Local Gov't (8) 0.08% --
Percent of GSP, Private Industries (9) -- 0.07%
(1) Includes project modification and administrative costs for all public projects, except regional utility (e.g., water, power) projects.(2) Includes project modification, administrative, delay, and uncertainty costs for all private development projects, plus project modification and administrative costs for regional infrastructure projects.(3) UMRA guidelines require that a written statement be prepared if aggregate expenditures by State, local, or tribal governments, or expenditures by the private sector, in any one year exceed $100 million.(4) Assumes a discount rate of 7 percent for non-Federal governments and 12 percent for the private sector. For the private sector, the 'Max. Year Annualized Cost' was calculated by (a) calculating the annualized cost of all private sector costs minus delay costs, and (b) adding the full delay cost to the annualized subtotal in (a). This calculation reflects an estimate of annualized costs in Year 1, which is expected to be the most expensive year for the private sector because all delay costs are experienced in this year. (5) Evaluates the estimated Total Costs of the proposed rule relative to leading State and National economic indicators.(6) The FY 2002 National GDP was $10,446.2 billion, as reported by the U.S. Bureau of Economic Analysis (BEA).(7) The FY 2000 California Gross State Product (GSP) was $1,344.623 billion, as reported by the BEA.(8) The FY 2000 GSP for State and local governments was $109.023 billion, as reported by the BEA.(9) The FY 2000 GSP for private industries was $1,203.513 billion, as reported by the BEA.
Sources: Economic & Planning Systems; Bureau of Economic Analysis
Economic & Planning Systems, Inc. 2/26/2004 H:\12594gnatcatcher\Report\DEA_Feb2004\EmailTables_Feb2004.xls

Final Draft ReportEconomic Analysis of Critical Habitat Designation for California Gnatcatcher
February 24, 2004
162
Written Statement Requirements
3936
Section 202 of UMRA provides a list of the items that must be included in the written
statement accompanying the rule. The components of the written statement must:
I. Identify the authorizing legislation;
II. Provide a qualitative and quantitative analysis of costs and benefits,3941
including the impacts on State, local, and tribal governments and on the
private sector, and the impacts on health, safety, and the environment;
III. Estimate, to the extent possible, future compliance costs and
disproportionate budgetary effects on particular geographic regions or types
of entities;3946
IV. Discuss effects on the national economy (e.g., effects on productivity,
economic growth, full employment, creation of productive jobs, and
international competitiveness); and,
V. Describe the Service’s consultations with elected officials.
This purpose of the remainder of this section is to provide the Service with the3951
economic information required to complete a written statement under UMRA. This
section is not meant to be the actual statement, nor does it provide information on
all of the issues (e.g., information about the Service’s consideration of comments
provided by State, local, or tribal governments) that must be addressed by the
Service.3956
1. Authorizing Legislation. Section 4(a)(3)(A) of the Act requires the Secretary, to
the extent prudent and determinable, to designate critical habitat at the time the
species is listed. Section 4(b)(2) requires CHDs to be made on the basis of the best
3961

Final Draft ReportEconomic Analysis of Critical Habitat Designation for California Gnatcatcher
February 24, 2004
96 16 USC 1533.
97 2 USC 1532.
98 Sally Katz, Administrator, Office of Information and Regulatory Affairs, Office of Management and
Budget, Memorandum: Guidance for Implementing Title II of S.1., March 31, 1995.
163
scientific evidence available, taking into consideration the economic impact of the
designation and any other relevant impacts.96
3966
2. Costs and Benefits. The costs associated with the proposed designation of
critical habitat for the gnatcatcher are described in the executive summary, as well
as Chapters III through V. Chapter III and Chapter V focus on the effects on
private landowners, the group that is likely to experience the majority of the impact
from this designation. Chapter IV provides detailed information about impacts to3971
public sector entities. The benefits of the designation are addressed qualitatively, in
Chapter VIII. Impacts to health, safety, and the environment are beyond the scope
of this analysis and will be addressed by the Service.
UMRA also requires an analysis of the exten t to w hich th e costs to Sta te, local, and3976
tribal governments may be paid with Federal assistan ce.97 [placeholder - FWS to
prov ide informat ion about financial assistance opt ions for governments]
3. Compliance costs and disproportionate budgetary effects. The magnitude and
likelihood of compliance costs resulting from the designation are d iscussed3981
extensively in Chapters III and IV. These costs are presented by region and by
agency in th e Executive Summary. In addition, Chapter VI examines the
d istributional impacts to small entities, and Chapter VII considers the effects of the
designation on th e energy industry.
3986
4. Effect on the national economy. UMRA directs the Service to consid er th e effect
of the proposed gnatcatcher d esignation on the national econom y (i.e., the
macroeconomic effects of the ru le). According to OMB, economic imp acts of less
than 0.25 to 0.5 percen t of the Gross Domestic Prod uct (GDP) are unlikely to resu lt
in measurable effects to the national econom y, unless the effects are focused on a3991
particular geographic region or economic sector.98 As shown in Table 27, the total

Final Draft ReportEconomic Analysis of Critical Habitat Designation for California Gnatcatcher
February 24, 2004
164
estimated section 7 costs for State, local, and tribal governments rep resent
approximately 0.001 percent of the National GDP, and estimated costs for the
private sector rep resen t approximately 0.008 percen t of th e N ation al GDP.
3996
To evalu ate th e effect of the proposed ru le on sub-regions or d istinct econom ic
sectors, this an alysis also com pared estimated section 7 costs to the total Californ ia
Gross State Produ ct (GSP), as well as the “State and Local Governm ent” and
“Private Industr ies” GSP industry segments. As show n in Table 27, this an alysis
revealed that total section 7 costs within both the State/ local/ tribal and pr ivate4001
sector categories represent less than 0.08 percent of all econom ic ind icators. Because
these percentages fall well below the 0.25 to 0.5 percent threshold recomm ended by
the OMB, th is an alysis concludes that the proposed designation will not resu lt in a
significant effect on th e national econom y, or on a particular geographic region or
econom ic sector. 4006
5. Consultations with elected officials. The consultations w ith representatives of
State, local, and tribal governments w ill be described in greater detail by the Service.

Final Draft ReportEconomic Analysis of Critical Habitat Designation for California Gnatcatcher
February 24, 2004
165
XI. POTENTIAL BENEFITS OF PROPOSED CRITICAL4011
HABITAT
The published economics literature has documented that real social welfare benefits
can result from the conservation and recovery of endangered and threatened4016
species (Bishop (1978, 1980), Brookshire and Eubanks (1983), Boyle and Bishop
(1986), Hageman (1985), Samples et al. (1986), Stoll and Johnson (1984)). Such
benefits have also been ascribed to preservation of open space and biodiversity,
both of which are associated with species conservation (see examples in Pearce and
Moran (1994) and Fausold and Lilieholm (1999)). Likewise, regional economies and4021
communities can benefit from the preservation of healthy populations of
endangered and threatened species, and the habitat on which these species depend
(ECONorthwest [2002]).
However, a purpose of the Act is to provide for the conservation of endangered and4026
threatened species. Thus, the benefits of actions taken under the Act are primarily
measured in terms of the value placed by the public on species preservation (e.g.,
avoidance of extinction, and/or an increase in a species’ population). Such social
welfare values may reflect both use and non-use (i.e., existence) values. For
example, use values might include the potential for recreational use of a species4031
(e.g., bird viewing opportunities) should recovery be achieved. Non-use values are
not derived from direct use of the species, but instead reflect the utility the public
derives from knowledge that a species continues to exist.
In addition, as a result of actions taken to preserve endangered and threatened4036
species, various other benefits may accrue to the public. Such benefits may be a
direct result of modifications to projects made following section 7 consultation, or
may be collateral to such actions. For example, a section 7 consultation may result
in the conservation of buffer strips along streams, in order to reduce sedimentation
due to construction activities. A reduction in sediment load may directly benefit4041
water quality, while the presence of buffer strips may also provide the collateral
benefits of preserving habitat for terrestrial species and enhancing nearby
residential property values (e.g., preservation of open space).

Final Draft ReportEconomic Analysis of Critical Habitat Designation for California Gnatcatcher
February 24, 2004
166
The remainder of this chapter describes the categories of benefits resulting from4046
implementation of section 7 of the Act in the context of areas affected by the proposed
designation. First, it qualitatively describes the types of benefits likely to result from
section 7 protections. Then, it addresses both the benefits associated with species
preservation as well as habitat protection.
4051
As discussed below, it is not feasible to fully describe and accurately monetize the
benefits of this designation in the context of this economic analysis. The discussion
presented in this report provides insight into the potential benefits of the designation
based on information obtained in the course of developing the economic analysis. It
is not intended to provide a complete analysis of the benefits that could result from4056
section 7 of the Act. Given these limitations, the Service believes that the benefits of critical
habitat designation are best expressed in biological terms that can be weighed against the
expected cost impacts of the rulemaking.
Categories of Benefits4061
Implementation of section 7 of the Act is expected to substantially increase the
probability of conservation for the gnatcatcher. Such implementation includes both the
jeopardy provisions afforded by the listing as well as the adverse modification
provisions provided by the designation. Specifically, the section 7 consultations that4066
address the gnatcatcher will assure that actions taken by Federal agencies do not
jeopardize the continued existence of the species or adversely modify its habitat. Note
that these measures are separate and distinct from the section 9 “take” provisions of the
Act, which also provide protection to this species.
4071
The benefits of critical habitat designation can therefore be placed into two broad
categories: (1) those associated with the primary goal of species conservation and (2)
those that derive mainly from the habitat protection required to achieve this primary
goal. In the case of the gnatcatcher, habitat is generally restricted to coastal southern
California and typically occurs in or near coastal sage scrub (CSS), which is a broad4076

Final Draft ReportEconomic Analysis of Critical Habitat Designation for California Gnatcatcher
February 24, 2004
99 Refer to the Proposed Rule for a detailed description of each type of sage scrub community
167
category of vegetation that includes a variety of sage scrub communities.99
Environmental benefits associated with recovery of the gnatcatcher and protection of
its habitat may include:
• Preservation of open space resulting from acquisition of mitigation lands;4081
• Improved stability of native flora/fauna communities resulting from
removal of exotic species among coastal sage scrub habitat;
• Decreased habitat loss resulting from habitat protection, restoration, and4086
enhancement projects including revegetation; and
• Improved quality and decreased destruction of coastal sage scrub habitat
resulting from restoration activity on marginal coastal sage scrub habitat
acres.4091
Table 28 details those activities expected to generate section 7 consultations leading
to project modifications associated with the proposed critical habitat for the
gnatcatcher, organized by the category of physical/biological improvement expected
to result from the project modification. For example, of the approximately 311 formal4096
consultations anticipated, it is expected that the majority of these will result in project
modifications providing for decreased habitat loss. These ecological and
environmental benefits are expected to result from consultations regarding private
development, transportation projects, utility projects, and Federal land management
spread across the 13 proposed critical habitat units.4101

Final Draft ReportEconomic Analysis of Critical Habitat Designation for California Gnatcatcher
February 24, 2004
168
Table 28
Physical/Biological Improvements Expected to Result from Implementation of Section 7 of the Act
Physical/Biological Improvement Land Use Activity Expected Project Modification Critical Habitat Units Number of Expected Consultations
with project modificationsa
Restoration of CSS habitat4106
Decreased habitat loss for gnatcatcher
Improved survival rates of gnatcatcher
4111Preservation of open space
Improved survival for other species
found within gnatcatcher habitat
4116Improved stability of native flora/ fauna
communities
Increased public awareness
Private
Development
Transportation
Projects
Utility Projects/
O&M
Federal Land
Management
On-site set-aside
Off-site preservation
Restoration of CSS habitat
Timing restrictions (e.g., construction
outside breeding season)
Biological monitoring & construction
practices (surveys, fencing, etc.)
Shield lighting away from habitat
Landscape with native vegetation
Education programs (employee & public)
Cowbird trapping program
Unit 1
Unit 2
Unit 3
Unit 4
Unit 5
Unit 6
Unit 7
Unit 8
Unit 9
Unit 10
Unit 11
Unit 12
33916145850446710000
Decreased habitat loss4121
Expansion of coastal sage scrub
habitat (post-burn re-colonization)
Federal Land
Management
Protecting CSS habitat during prescribed
burns
Unit 13 253
a This analysis assumes that any benefits from section 7 of the Act stem from the application of project modifications. Therefore, this analysis assumes that the projected number of4126consultations recommending project modifications most accurately represents the level of protection the gnatcatcher may receive as a result of section 7 implementation.

Final Draft ReportEconomic Analysis of Critical Habitat Designation for California Gnatcatcher
169
The physical/biological improvements implied by Table 28 may in turn provide for a
variety of economic benefits. For example, the conservation of open space in areas
previously planned for development may enhance the value of property located outside
of critical habitat and adjacent to the open space. The discussion below provides4131
qualitative descriptions of the economic benefits associated with these environmental
improvements. While it is possible to estimate the number of projects that will generate
consultations requiring project modifications, as well as the number of acres set aside as
project mitigation, existing data do not allow for complete monetization of the
ecological or economic implications of these modifications. 4136
Benefits Associated with Species Conservation
The primary benefit of designating critical habitat is to increase the chance of
conservation for the gnatcatcher. Quantifying the benefits associated with improved4141
chance of conservation requires an assessment of the public’s value for the designation
of critical habitat for species such as the gnatcatcher. This may include both a use and
non-use (i.e., existence value) component.
Use Value4146
The value that the public holds for conservation of the gnatcatcher and its habitat may
include a direct use component related to viewing opportunities. Some bird species are
sought by recreational bird watchers. Thus, individuals may value species preservation
to the extent that it increases the probability of future sightings. When large numbers of4151
birding enthusiasts visit an area to see one or more species, the regional economy can
also benefit (Manion et al., 2000). Several economic studies have considered the
economic benefit that accrues to birdwatchers. However, data do not exist to allow for
estimation of the number of additional bird viewing trips, or improved trips, that will
result from actions taken to protect the gnatcatcher under section 7. Thus, it is not4156
possible to monetize this category of benefit.

Final Draft ReportEconomic Analysis of Critical Habitat Designation for California Gnatcatcher
170
Existence Value
4161
Existence value reflects the utility the public derives from knowledge that a species
continues to exist. A number of published studies have demonstrated that the public
holds values for endangered and threatened species separate and distinct from any
expected direct use of these species (i.e. willingness to pay to simply ensure that a
species will continue to exist). These studies include Boyle and Bishop (1987), 4166
Elkstrand and Loomis (1998), Kotchen and Reiling (2000), and Loomis and White (1996).
There is little doubt that the gnatcatcher provides intrinsic values, and that these values
will be enhanced by its survival and conservation.
This analysis attempts to assess the benefits of protections afforded the gnatcatcher as a4171
result of designating an additional unit of critical habitat. The existing economics
literature does not provide quantitative estimates of these benefits. Instead, the data
provided by the literature may be indicative of the value the public places on the
protection of sensitive bird species in general, but do not represent the specific values
sought by this economic analysis. To accurately quantify the existence value benefits4176
for the gnatcatcher as described above would require information regarding the
public’s marginal willingness to pay for an incremental unit of critical habitat, in terms
of the increased probability of conservation or increase in abundance of the species.
Benefits Associated with Habitat Protection4181
Open Space Preservation and Real Estate Effects
Section 7 consultations may result in less dense development and/or on-site set asides of
land at a project site located within critical habitat. The portions of the site that might4186
otherwise have been developed represent a cost of the designation. However, that cost
in terms of development value foregone is off-set, to some degree, based on enhanced
property value for homes located on larger lots or near open space. The net effect of on-
site project modifications on land values is considered in Chapter III.
4191
Additional benefits of open space preservation are likely to result from off-site
preservation. Section 7 applicants and third parties are sometimes advised to mitigate
for developing habitat acres by purchasing a specified quantity of compensatory acres
at an off-site location. For private development of CSS habitat, off-site mitigation
usually includes purchase of credits at a private mitigation bank. Thus preservation of4196
these acres represent a public benefit in terms of the value that the public places on the

Final Draft ReportEconomic Analysis of Critical Habitat Designation for California Gnatcatcher
100 These figures do not include acres for which CSS mitigation is required due to baseline regulations
other than section 7.101
Furthermore, one study (Correll et al (1978)) found that by integrating open space into a housingdevelopment during the initial conceptual phase (i.e., purchased prior to construction), the positive effecton property values in the adjacent neighborhood is greater, than when land is acquired and conserved as
an afterthought.
171
existence of undisturbed, open space. Off-site land preservation may also enhance
property values of homes located outside of critical habitat and near the mitigation
banks. As shown in Table 10, approximately 7,982 acres in unit 10 are expected to be
preserved off-site as a result of section 7 consultations.1004201
As noted in Chapter III, this report assumes that land mitigation set-asides will not
interfere with the demand for housing in the areas affected by critical habitat (i.e.,
development will not be precluded, but rather displaced). Therefore, it is possible that
displaced development attributable to critical habitat may result in (a) an increase in4206
development density elsewhere (i.e., a net gain in surplus associated with open space
preservation) or (b) an increase in low density development outside of critical habitat
(i.e., no net gain in surplus). To the extent that displaced development occurs in
existing urbanized areas or at higher densities, a net gain in open space may be
realized. Where low density development is simply displaced to alternative locations4211
outside of critical habitat, no net gain in open space is expected.
Various studies have documented the positive affect of environmental amenities,
including open space, on the value of nearby residential and commercial properties
(Thibodeau and Ostro (1981), Nelson (1985), Lacy (1990), Garrod and Willis (1992), 4216
Bockstael (1996), Geoghegan (1998), Acharya and Bennet, 2001)). The enhancement of
real estate values depends on, among other things, the proximity of homes to open
space, the existing supply of conserved land, and local development pressure. Future
project modifications involving the purchase of off-site mitigation lands in and around
the proposed critical habitat units are likely to occur in areas of significant development4221
pressure. Future residential and commercial growth in these areas will lead to a
reduction in the supply of open space within developing communities, which will likely
increase the value of existing and acquired open space, based on its relative scarcity.
A review of the economics literature demonstrates that increasing the quantity of open4226
space (i.e., greenbelts, wetlands, wildlife corridors, and riparian areas) in a community
can lead to enhanced residential property values.101 To calculate the benefits of
additional open space, additional data are required. Fo example, as noted above, the
value of open space in a community depends upon a number of factors. Information on

Final Draft ReportEconomic Analysis of Critical Habitat Designation for California Gnatcatcher
102 Non-native species that commonly threaten coastal sage scrub habitat include artichoke thistle(Cynara cardunculus), European annual grasses (e.g., Bromus spp., Avena spp., Schismus spp.),and mustards (e.g., Brassica spp.).
172
the extent of existing open space in communities affected by the proposed critical4231
habitat would need to be compared with the existing levels of open space in
communities assessed by the hedonic literature. As discussed above, information is not
available regarding the extent of open space within the areas of the designation relative
to the extent of open space in areas outside of the proposed designation (i.e., locations
that absorb the “displaced development” attributable to critical habitat). Various other4236
data would be required to make a defensible transfer of “open space value” as
identified in the literature to a community or neighborhood impacted by the
designation of critical habitat (e.g., median price of homes, available housing stock,
demand for housing, etc).
4241
Benefit to Other Species
The habitat protection measures recommended for the gnatcatcher generally encompass
stretches of CSS, which incidently provides ancillary benefits to other species that
cohabit these areas throughout California. That is, protecting the primary constituent4246
elements for the gnatcather through future project modifications will lead to habitat
improvement benefits for other threatened and endangered flora and fauna. Table 29
provides a list of other species included in historic section 7 consultations with the
gnatcatcher and that are found in or around CSS habitat. Each one of these organisms
may in turn provide some level of direct or indirect benefit to the public (e.g., existence4251
value) and/or local economies. Conservation recommendations that may benefit other
species include:
1. Exclusionary fencing, which restricts domestic pets from sensitive habitat areas;
2. Redirecting of city lights to avoid illuminating habitat area for predators;4256
3. Timing restrictions to prevent land grading during breeding season (between
February 15 and August 15);
4. Cowbird trapping to capture and remove non-native, predator bird species
known to disturb the gnatcatcher and other sensitive bird species in coastal sage
scrub habitat; and4261
5. Exotic species control which requires applicants to re-vegetate with native plant
communities and to eradicate nonnative species, thereby improving the stability
of native flora and fauna communities.102

Final Draft ReportEconomic Analysis of Critical Habitat Designation for California Gnatcatcher
173
Table 29. Species Likely to Benefit From Coastal Sage Scrub Protection Measures
Associated with Critical Habitat Designation for the Gnatcatcher4266
Riverside fairy shrimp Orcutt's spineflower
Palos Verde Blue Butterfly slender-horned spineflower
Delhi sands flower loving fly Laguna Beach live-forever
Pacific pocket mouse Santa Ana River woolly star
San Diego Thornmint4271 willowy monardella
San Diego ambrosia spreading navarretia
Del Mar Manzanita California Orcutt grass
San Jacinto Valley crownscale Lyon's pentachaeta
Encinitas baccharis Otay mesa mint
Thread-leaved brodieae4276 big-leaved crown beard
Vail Lake ceanothus
These project modifications contribute generally to the maintenance of biodiversity and
collectively act to protect CSS habitat. The purchase of mitigation lands (as described
above) will also contribute to the preservation of this ecosystem. While these benefits4281
can be described qualitatively, existing data are not available to monetize these changes.
Recreational Benefits
Protecting critical habitat for the gnatcatcher may result in preservation of habitat4286
suitable for low-impact recreational uses, such as hiking, picnicking, and bird-watching.
Project modifications involving the purchase of mitigation lands by residential
developers sometimes allow for the limited trail use. In other circumstances, however,
mitigation set-asides include fencing and restrict the development of recreational
facilities (e.g., benches, picnic tables), thereby reducing potential recreational benefits. 4291
However, preservation of natural areas as parks or preserves for both species
conservation and public enjoyment may provide public benefits. Monetization of these
benefits, however, would require data on the number of additional trips or increased
quality of trips resulting from the designation. Such data are not currently available.
4296
Final Draft ReportEconomic Analysis of Critical Habitat Designation for California Gnatcatcher
103 Note that in some cases restoration is recom mended to mitigate for “temporary project im pacts” (i.e .,
excavation of CSS to install a pipeline and then revegetation after installation). This does not represent anet benefit to other species, because the species are no better off following restoration.
174
Other Benefits
Additional benefits of designating critical habitat for the gnatcatcher may include the4301
following:
Coastal Sage Scrub (CSS) Restoration. On-site restoration of otherwise degraded
habitat may be recommended through section 7 consultation.103 Frequently, CSS
restoration is associated with purchase of on-site mitigation lands in order to convert4306
marginal habitat into suitable habitat for the gnatcatcher and other species that depend
on CSS. Restoration of marginal habitat may represent a benefit to other species in
terms of improved possibility of conservation. Based on our analysis, approximately
3,000 acres of on-site set-asides are expected to benefit from active restoration, primarily
in Units 8 through 13. 4311
Educational/informational benefits. Both the gnatcatcher and other species that
inhabit CSS habitat will likely benefit from employee and public education programs
designed to improve understanding of how to protect these areas. To the extent that
these educational programs improved best management practices (e.g., keeping4316
equipment staging areas out of the habitat, minimizing potential for spills, etc) and/or
increase awareness of issues related to habitat preservation and concern for endangered
species in general, species that inhabit other habitat types may also experience benefits.
At this time sufficient information does not exist to quantify or monetize these benefits.
4321

APPENDIX A
DEMOGRAPHIC PROJECTIONS AND METHODOLOGY

Final Draft ReportEconomic Analysis of Critical Habitat Designation for California Gnatcatcher
Final Draft ReportEconomic Analysis of Critical Habitat Designation for California Gnatcatcher
104 SCA G provided em ploym ent estimates that combined industry classifications into Retail,Service, and O ther. These broad categories did not correspond to the Em ployment Densityreport. By applying EDD percent of employment in each industry, EPS w as able to createestimates for employm ent that were consistent w ith SCAG’s employm ent density report.
1H:\12594gnatcatcher\Report\DEA _Feb2004\CAG N_D EA_Feb2004.wpd
APPENDIX A: DEMOGRAPHIC PROJECTIONS AND METHODOLOGY
The estimates for employment-related developed acres in the five SCAG counties
derive from three separate variables: (1) employment estimates (derived from SCAG4331
employment projections), (2) employee distribution among landuses (taken from SCAG
employment density report), and (3) employees per acre factor (taken from SCAG
employment density report).
Employment estimates are based on the SCAG total employment projections by place of4336
work for 2000 and 2025.104 The State of California Economic Development Department
(EDD) provides an estimate of the distribution of employment among industry
categories in 2000. Applying these percentages to the SCAG employment estimates at
the census tract level, provides an estimate of employment per industry category.
Appendix Table A-1 shows the distribution of employment by industry in each county.4341
Within each industry, the landuse requirements vary. SCAG provided a distribution of
landuses by industry in “Employment Density Study Summary Report” (October 31,
2001). Appendix Table A-2 shows the distribution of landuses among the nine industry
categories surveyed in the report. These industry categories match exactly with the4346
employment by industry estimates discussed above.
In “Employment Density Study Summary Report” (October 31, 2001), SCAG provides
an estimate for the number of employees per acre in each landuse category. As stated
in the report, “the most appropriate factors are the regional employment density4351
factors.” Therefore, the weighted average regional factors were applied to each county,
rather than distinct county estimates. Appendix Table A-3 shows the employment
densities employed for each land use category.

Final Draft ReportEconomic Analysis of Critical Habitat Designation for California Gnatcatcher
Final Draft ReportEconomic Analysis of Critical Habitat Designation for California Gnatcatcher
2H:\12594gnatcatcher\Report\DEA _Feb2004\CAG N_D EA_Feb2004.wpd
By applying the employees per acre of landuse factor to the estimated number of4356
employees in each landuse, EPS arrived at an estimate for acres developed for
employment purposes in 2000 and 2025.
EPS made an additional estimate for residential development based on common
residential development densities throughout California, as shown in Appendix Table4361
A-4. Combining the residential acreage and employment acreage estimates provided
the total developed land estimates.
In heavily populated urban areas, landuse patterns differ from the surrounding county.
Agriculture and Open Space are not logically situated in urban areas. EPS assumed that4366
in the most heavily populated areas employment attributable to these landuses would
shift to the “All Other” landuses category.

Appendix Table A-1Distribution of Employment by Industry in Each County
Industry Riverside San Bernardino Los Angeles
Farming 3.73% 0.73% 0.19%Mining 0.09% 0.13% 0.10%Construction 10.08% 5.87% 3.21%Manufacturing 11.45% 13.10% 15.37%Transportation & Public Utilities 2.98% 6.73% 5.98%Wholesale Trade 3.67% 5.72% 6.63%Retail Trade 20.04% 19.50% 15.55%Finance, Insurance, & Real Estate 3.22% 3.11% 5.64%Service 26.71% 25.22% 33.08%Government 18.03% 19.89% 14.25%
Total Employment 100.00% 100.00% 100.00%
Economic & Planning Systems, Inc. 2/26/2004 H:\12594gnatcatcher\Report\DEA_Feb2004\EmailTables_Feb2004.xls

Appendix Table A-2Distribution of Employees per Land Use Category
Land Use Category Mining Construction Manufacturing TCU Wholesale Retail FIRE Services GovernmentTrade Trade
Commercial1 Regional Retail 0% 0% 0% 0% 0% 4% 1% 1% 0%2 Other Retail/Svc 11% 14% 8% 14% 14% 49% 27% 22% 11%3 Low-Rise Office 10% 6% 5% 8% 9% 6% 19% 11% 11%4 High-Rise Office 24% 2% 2% 3% 2% 2% 11% 5% 3%5 Hotel/ Motel 1% 0% 0% 2% 1% 1% 2% 2% 0%6 Misc. Commercial 0% 1% 0% 2% 1% 1% 1% 1% 3%
Industrial7 R&D/Flex Space 1% 1% 2% 1% 2% 1% 1% 1% 0%8 Light Manufacturing 13% 27% 50% 22% 37% 7% 5% 9% 6%9 Heavy Manufacturing 0% 0% 0% 0% 0% 0% 0% 0% 0%
10 Warehouse 1% 1% 5% 5% 5% 1% 0% 1% 0%11 Misc. Industrial 6% 2% 1% 2% 2% 0% 0% 0% 1%
Public/Other12 Government Offices 0% 1% 1% 6% 0% 0% 1% 1% 25%13 Primary/Secondary School 1% 1% 0% 0% 0% 1% 0% 4% 1%14 Colleges and Universities 0% 0% 0% 0% 0% 0% 0% 1% 1%15 Transportation 1% 1% 2% 9% 1% 1% 0% 1% 1%16 Utilities 0% 1% 1% 1% 1% 0% 1% 0% 1%17 Other Institutional 1% 1% 0% 1% 1% 1% 1% 2% 7%18 Hospitals 0% 0% 0% 0% 0% 0% 1% 4% 0%19 Agriculture 3% 1% 2% 1% 2% 1% 1% 1% 1%20 Open Space 5% 6% 5% 5% 6% 5% 5% 6% 5%21 All Other 9% 3% 4% 4% 3% 4% 4% 4% 11%22 Residential 14% 32% 11% 13% 14% 16% 18% 23% 13%
Economic & Planning Systems, Inc. 2/26/2004 H:\12594gnatcatcher\Report\DEA_Feb2004\EmailTables_Feb2004.xls

Appendix Table A-3Employment Density per Land Use Category
Land Use Category Weighted Average
Commercial1 Regional Retail 19.712 Other Retail/Svc 21.983 Low-Rise Office 43.954 High-Rise Office 175.495 Hotel/ Motel 33.076 Misc. Commercial 13.4
Industrial7 R&D/Flex Space 20.538 Light Manufacturing 17.839 Heavy Manufacturing 31.14
10 Warehouse 11.411 Misc. Industrial 2.41
Public/Other12 Government Offices 51.6713 Primary/Secondary School 5.6514 Colleges and Universities 6.9315 Transportation 4.8816 Utilities 1.8617 Other Institutional 15.218 Hospitals 37.719 Agriculture 0.3420 Open Space 0.1221 All Other 3.4822 Residential 1.4
Economic & Planning Systems, Inc. 2/26/2004 H:\12594gnatcatcher\Report\DEA_Feb2004\EmailTables_Feb2004.xls

Appendix Table A-4Residential Development Density Assumptions
Type Units per Acre
Multi-Family Development 35Single-Family Development 7
Economic & Planning Systems, Inc. 2/26/2004 H:\12594gnatcatcher\Report\DEA_Feb2004\EmailTables_Feb2004.xls

APPENDIX BU.S. ARMY CORPS JURISDICTION ASSUMPTIONS,
METHODOLOGY, AND GIS ANALYSIS
SOURCE: ELLIS GEOSPATIAL

Final Draft ReportEconomic Analysis of Critical Habitat Designation for California Gnatcatcher
Final Draft ReportEconomic Analysis of Critical Habitat Designation for California Gnatcatcher
1H:\12594gnatcatcher\Report\DEA _Feb2004\CAG N_D EA_Feb2004.wpd
APPENDIX B: U.S. ARMY CORPS JURISDICTIONASSUMPTIONS, METHODOLOGY, AND GIS ANALYSIS
GIS EVALUATION OF GNATCATCHER HABITAT UNITS, SCAG AND SANDAG4386
EXECUTIVE SUMMARY
Three major objectives were successfully completed across SCAG and SANDAG using GIS
technology:
• Determination of acreage and spatial relationships between habitat units (HU), census4391
tracts, parks, and military bases
• Determination of probable extent of wetlands and waters within HUs
• Impact of wetlands and “waters of the US” on 300- and 100-acre development tracts4396
fully or partially within HUs
The GIS analysis defined how much HU acreage was in each census tract and how
much of the HU was covered with park and/or military. The analysis also provided
statistics on the total amount of park and military within census tracts with HU. In4401
addition, how much land was available for development (outside of HU, parks, and
military) was also calculated to support the economic analysis.
For those development tracts that intersect a HU, 69% of 300-acre tracts and 60% of 100-
acre tracts will also intersect a Corps-defined, waters of the US. This is valid for large4406
samples of tracts but the map derived in this study cannot be applied to individual
tracts. The GIS models 2.74% of the HU area as covered with wetlands while 0.03% are
covered with waters of the US.

Final Draft ReportEconomic Analysis of Critical Habitat Designation for California Gnatcatcher
Final Draft ReportEconomic Analysis of Critical Habitat Designation for California Gnatcatcher
2H:\12594gnatcatcher\Report\DEA _Feb2004\CAG N_D EA_Feb2004.wpd
INTRODUCTION4411
GIS provided essential information on the spatial distribution and intersection of the
various features of interest in SCAG and SANDAG. These features of interest included:
• Gnatcatcher HUs
• Census Tracts4416
• Slope and Elevation
• Wetlands and Waters of the U.S.
• 300- and 100-Acre Development Tract Grids
• Parks and Military Bases
4421
The objectives of the GIS study included:
• Determining how much area HUs occupy in a Census Tract
• Determining how much Park and Military cover HUs in a Census Tract
• Extrapolating the Corps of Engineers wetlands and “waters of the U.S.” findings4426
from a Pilot Study in Riverside County to the rest of SCAG and SANDAG
• Documenting slope and elevation similarities and differences
• Evaluating the impact of Corps wetlands and waters of the US on 300- and 100-
acre development tracts
• Determining how much Park and Military acreage is within each Census Tract4431
DATA
The data used in the study were provided by EPS and Fish & Wildlife, Carlsbad office.
These GIS layers were received in different map projections and datums - all the layers
were georectified to UTM, NAD-27, Zone 11 and integrated into ESRI's premier natural
resource software, ArcInfo, at HJW GeoSpatial in Oakland. The layers included:4436
• Gnatcatcher HUs
• Census Tracts for SCAG and SANDAG
• California Blue Lines (drainage)
• USGS Digital Elevation Models (DEM's) as 7.5' Quads4441
• Parks for SANDAG (downloaded from SANDAG's GIS - layer 14)

Final Draft ReportEconomic Analysis of Critical Habitat Designation for California Gnatcatcher
Final Draft ReportEconomic Analysis of Critical Habitat Designation for California Gnatcatcher
3H:\12594gnatcatcher\Report\DEA _Feb2004\CAG N_D EA_Feb2004.wpd
• Parks from Fish & Wildlife for SCAG
• Military Bases (with some parks) from MapInfo
• Corps of Engineers Pilot Study wetlands and Waters of the U.S., portions of
Riverside County (see Lichvar and others, 2002)4446
• County Boundaries
• Color Landsat TM image of Southern California (30 m pixels - from HJW)
• 300 Acre and 100 Acre Grid (developed by HJW)
Excel speadsheets were supplied by EPS with 2000, 2025, and 2000-2025 change4451
development statistics. These data were linked to the GIS census tract data as attributes.
METHODOLOGY
GIS was used to integrate the mapping layers and development data across SANDAG
and SCAG. Interactive manipulations were done to determine areas, intersections of
lines with polygons and polygons with polygons between different layers, and4456
relationship of different features to slope and elevation.
ESRI's ArcInfo GIS was used for the vector (line and polygon) analysis while Leica's
ERDAS image processing software was used for raster and grid (satellite imagery and
DEM) analysis. The primary data analysis was done with UNIX servers and4461
workstations. The GIS ArcInfo coverages were routinely transferred from the UNIX
workstations to NT and XP systems for viewing with ESRI's ArcView 3.x software and
integration with the Corps of Engineers Pilot Study in Riverside County that provided
ArcView shapefiles of wetlands and waters of the U.S.
4466
As the data were being loaded, considerable time was spent on designing the analysis
and formatting the data to answer the questions being posed by EPS. The study was
largely focused on determining spatial relationships of different features (census tracts,
parks, military bases, waters of the U.S., etc.) with HUs. During the conclusion of the
study, however, more general questions were asked about the distribution of parks and4471
military bases within census tracts that required modifying the established GIS work
processes.

Final Draft ReportEconomic Analysis of Critical Habitat Designation for California Gnatcatcher
Final Draft ReportEconomic Analysis of Critical Habitat Designation for California Gnatcatcher
4H:\12594gnatcatcher\Report\DEA _Feb2004\CAG N_D EA_Feb2004.wpd
The DEM's from the USGS were mosaicked and projected into UTM NAD-27. The4476
elevation model was sliced at 2500' to visually determine how much HU was above
2500' (Figure 1). The HUs were checked for integrity and reasonable shapes/locations
by superimposing them over an enhanced Landsat TM image of the SCAG and
SANDAG area (Figure 2). The satellite image also was used effectively to check the
integrity and reasonable shapes/locations of parks and military bases and to evaluate4481
the accuracy of the California blue lines and the dense drainage network developed by
the Corps of Engineers in the Pilot Area.
Park and military base polygons were obtained from different sources - duplication was
edited. SANDAG's parks were available via a download from their GIS site (layer 14) -4486
this layer was exceptionally accurate. SCAG's parks came in several layers from Fish &
Wildlife in Carlsbad, California. A MapInfo "Parks" layer contained mostly military
bases and proved very useful for the analysis of SANDAG (Figure 3).
The different map layers had varying degrees of accuracy and precision (see Figure 4). 4491
When the layers were superimposed, offsets and slivers could be seen along the
margins of some of the polygons. When layers were combined, these erroneous slivers
would become individual polygons that provided acreage amounts either in or out of
the HU, park, or military base. To minimize the effect of slivers and reduce the number
of polygons, polygons with areas <0.1 acre were largely eliminated from the database4496
provided to EPS.
Spatial dimensions (area and intersection) of overlapping polygons and lines could be
accurately calculated because all the GIS layers were in one map projection and datum,
the layers were relatively accurate, and the polygons and lines were correctly formatted4501
and attributed.
RESULTS
Three major objectives were successfully completed across SCAG and SANDAG using
GIS technology:
4506
• Determination of acreage and spatial relationships between HUs, census tracts,
parks, and military bases

Final Draft ReportEconomic Analysis of Critical Habitat Designation for California Gnatcatcher
Final Draft ReportEconomic Analysis of Critical Habitat Designation for California Gnatcatcher
5H:\12594gnatcatcher\Report\DEA _Feb2004\CAG N_D EA_Feb2004.wpd
Determination of probable extent of wetlands and waters within HUs
Impact of wetlands and “waters of the US” on 300- and 100-acre development tracts4511
fully or partially within HUs
Habitat Units in relation to Census Tracts, Parks, and Military Bases
Polygons for census tracts, parks, and military were spatially layered with HUs to
determine acreage amounts within overlap zones (Table 1). The initial calculation was
to locate those census tracts that had HU acreage within their boundary and calculate4516
the total HU acreage. Then we queried the GIS about the characteristics of the HU –
was it covered by park (and by how many acres), was it covered by military (and by
how many acres), and was it covered by both park and military (and by how many
acres)? If the HU was not covered by park or military, the total HU acreage within the
census tract was considered at risk.4521
Toward the end of the analysis, the focus shifted from HU-centric queries to more
general questions (Table 1). Queries were made about how much total park was in a
census tract and how much of the census tract was not in park and available for
development? If the census tract overlapped with military, the GIS was queried for4526
how much military acreage was in the tract, how much military acreage was coincident
with park acreage, and how much further was acreage available for development
reduced due to military (Table 1 and Figure 4)?

Final Draft ReportEconomic Analysis of Critical Habitat Designation for California Gnatcatcher
Final Draft ReportEconomic Analysis of Critical Habitat Designation for California Gnatcatcher
6H:\12594gnatcatcher\Report\DEA _Feb2004\CAG N_D EA_Feb2004.wpd
Table 1. Sample of GIS calculations derived from Census Tracts, HU, Parks, and Military4531
Polygons
(Left side of one Spreadsheet – see next page for continuation of rows 1-9, 198-207)
4536

Final Draft ReportEconomic Analysis of Critical Habitat Designation for California Gnatcatcher
Final Draft ReportEconomic Analysis of Critical Habitat Designation for California Gnatcatcher
7H:\12594gnatcatcher\Report\DEA _Feb2004\CAG N_D EA_Feb2004.wpd
(Right side of above Spreadsheet)

Final Draft ReportEconomic Analysis of Critical Habitat Designation for California Gnatcatcher
Final Draft ReportEconomic Analysis of Critical Habitat Designation for California Gnatcatcher
8H:\12594gnatcatcher\Report\DEA _Feb2004\CAG N_D EA_Feb2004.wpd
Extrapolation of Corps Pilot Area, Wetlands and Waters of the USA findings4541
for HU 10 to rest of HUs across SCAG and SANDAG
The Corps of Engineers completed a wetlands and waters of the US study of San
Jacinto and portions of Santa Margarita watersheds, Riverside County in
November 2002 (Lichvar and others, 2002). Their report documented their
methodology, aquatic resources, and map units. Most importantly for this study,4546
their report provided digital ArcView GIS 3.x shapefiles – these were reprojected
and integrated with the gnatcatcher project’s mapping layers.
The GIS statistics developed within the Pilot Area were compared to the rest of
SCAG and SANDAG to determine how similar the Pilot Area was to the rest of4551
the gnatcatcher project area. If the geomorphic parameters were similar, then
extrapolating statistics from the Pilot Area to the rest of SCAG and SANDAG
could be justified.
Lichvar and others’ (2002) report contained data and information useful for this4556
study on p. 27, 28 (Table 8), and 31 (Table 10). They interpreted and digitized
“first order, ephemeral, and intermittent streams” from aerial photography and
noted that this category of streams are “typically up to 10 feet wide.” They also
digitized streams farther downslope – second and third order Stahler streams
and noted these as having “narrow width...” due to “...human influences that4561
caused down cutting in the channel.” They noted that their methodology
resulted in more streams compared with the USGS 7.5 minute quadrangle map
(Lichvar and others, 2002, p. 15).
Our gnatcatcher HU GIS study focused on the Corps mapping that was within HU 104566
(Figure 5). Acreage within each wetland class were determined (Table 2). The USGS
DEM was used to subdivide the slopes into 0-5, 6-15 and >16% (Figure 6). The length of
the Corps-digitized drainage (waters of the US) within HU10 was calculated using the
GIS (Table 3). In addition, the length of the State of California “blue lines” streams
within HU10 were determined (Table 2). By multiplying the Corps-defined waters of4571
the US length by the width (10’ for 3 meters), an acreage was determined (Table 3).

Final Draft ReportEconomic Analysis of Critical Habitat Designation for California Gnatcatcher
9H:\12594gnatcatcher\Report\DEA _Feb2004\CAG N_D EA_Feb2004.wpd5
Table 2. Wetlands Acreage by class for Corps Pilot Area
Wetlands Data
HU Acreage in Pilot Area4576
Class Acreage %
1 1603 54
2 56 2
3 268 9
44581 172 6
5 27 1
6 835 28
Total 2961
Table 3: Example of Using GIS to Derive Acreage and % Area for Three Classes of Slope in4586
the Corps of Engineers Pilot Area, Riverside County
DETAILS
HU acreage in Pilot Area
Slope Acres %
AREA4591 0-5 20,377 19
6-15 39,927 37
>16 47,836 44
TOTAL 10,81404596
Slope Acres %
CA BLUE LINES 0-5 151,329 37
6-15 150,014 37
>16 104,631 26
4601
TOTAL length 405,974
TOTAL area (assume 3m wide) 1,217,922 m2 5 acres
CORPS DEFINED Slope Acres %
W OF US (m apped)4606 0-5 281,951 14
6-15 735,051 37
>16 962,636 49
TOTAL length 1,979,638
TOTAL area (assume 3m wide)4611 5,938,914 m2 24 acres
(taken from data sheet delivered to EPS)

Final Draft ReportEconomic Analysis of Critical Habitat Designation for California Gnatcatcher
10H:\12594gnatcatcher\Report\DEA _Feb2004\CAG N_D EA_Feb2004.wpd5
After the Pilot Area was analyzed, the rest of the SCAG and SANDAG area was
evaluated for slope and CA blue line measurements. The slope and CA blue line data
for HUs in the “rest of the area” were relatively similar to that measured in the Pilot4616
Area. This similarity encourages extrapolation of the wetlands and waters of the US
from the Pilot Area to the rest of the area (see also Figure 5). Adjustments can be made
to the factors and assumptions used in the extrapolation, as the procedure is further
analyzed.
A summary of some of the observations and assumptions that came out of this4621
extrapolation is shown in Table 4. To determine the total HU acreage covered or
intersected by wetlands and waters of the US, the pilot study and “rest of the area”
acreages/percentages were summed (Table 5).

Final Draft ReportEconomic Analysis of Critical Habitat Designation for California Gnatcatcher
11H:\12594gnatcatcher\Report\DEA _Feb2004\CAG N_D EA_Feb2004.wpd5
Table 4. Some Observations and Assumptions
4626
1. HU in rest of area 5.43 x size of HU in Pilot Area.
2. HU in rest of area has lower average elevation (~1200’) compared to Pilot Area
(~1800’)
3. HU in rest of area has 7.35 x the length of CA blue line drainage compared with Pilot
Area4631
a. Probably because terrain is steeper on average in HUs outside of Pilot Area
4. Corps-defined W of US for area outside of Pilot Area estimated by multiplying Pilot
Area stream s by 7.35 (based on CA Blue Line ratio).
5. Area for Corps-defined W of US derived from length of mapped streams by
multiplying by 3m (p. 15 of Nov. 2002 report – Planning Level Delineation - San4636
Jacinto and portions of Santa Margarita W atersheds – states that the digitized lines of
1st order, ephemeral, and intermittent streams “…are typically up to 10 feet wide…”
6. Area for CA Blue Lines not substantiated…… used 3m based on Corps’ observation
above for their interpreted streams as place holder in analysis.
7. ~7% of the blue line drainage in the Pilot Area is not duplicated by the Corps’ W of US4641
mapping effort – based on visual inspection. Added 3 acres from CA blue line total to
W of US total.
8. Add the Pilot Area Totals to the extrapolated outside of the Pilot Area Totals to arrive
at solutions for different questions.
9. 300 acre tracts intersect m ore drainages on a % basis than 100 acre tracts . This4646
study summed tracts that were fully and partially contained within a HU.
The Corps Pilot Study enables acreage of wetlands and waters of the US across SCAG
and SANDAG to be approximated using GIS technology (Table 5).

Final Draft ReportEconomic Analysis of Critical Habitat Designation for California Gnatcatcher
12H:\12594gnatcatcher\Report\DEA _Feb2004\CAG N_D EA_Feb2004.wpd5
Table 5. Summary of GIS Study for Wetlands and Waters of the US4651
HU Area Covered/Intersected by Wetlands/Waters of the US in SCAG/SANDAG
BY HABITAT UNITS
Corps Corps
% of HUs Class of W etlands % W etland
4656 1.47% Class 1 100%
0.05% Class 2 67-98%
2.74% of HUs are wetlands 0.25% Class 3 32-66%
0.16% Class 4 2-32%
0.03% Class 5 <2%
4661 0.80% Class 6 uplands
0.3% of HUs have Corps-defined W of US (1st order, ephemeral, intermittent streams) with %
of CA Blue Line
BY DEVELOPMENT TRACTS4666
55% of full/partial 300 acre tracts intersect CA blue line drainage
69% of full/partial 300 acre tracts intersect Corps-defined W of US
46% of full/partial 100 acre tracts intersect CA blue line drainage
60% of full/partial 100 acre tracts intersect Corps-defined W of US
(taken from data sheet delivered to EPS)4671
Impact of Wetlands and Waters of the US on 300- and 100-acre development tracts in
HUs
Starting at the SE corner, a 300- and 100-acre grid was generated by the GIS (Figure 7).
Within the Pilot Area, the intersection of both CA blue line drainage (from USGS 7.5’4676
maps) and the Corps more dense digitized drainage with the grid cells was determined.
The analysis was completed for both cells fully contained within the HU and those that
partially covered the HU (Figure 8).

Final Draft ReportEconomic Analysis of Critical Habitat Designation for California Gnatcatcher
13H:\12594gnatcatcher\Report\DEA _Feb2004\CAG N_D EA_Feb2004.wpd5
The process developed in the Pilot Area was extrapolated to the rest of SCAG and4681
SANDAG. The pilot area and rest of area measurements were summed for the overall
statistics (Table 5). Statistics for both full and partial grid cells were compiled. This
study combined the statistics derived from full and partial grid cells (Table 5)
For those development tracts that overlap with a HU, 69% of 300-acre tracts and 60% of4686
100-acre tracts will intersect a Corps-defined, waters of the US. This is valid for large
samples of tracts, but the map develop for this project by the GIS (portions shown in
Figure 7 and 8) cannot be applied to individual tracts as the grid’s arbitrary starting
point will determine which cells intersect the drainage.
CONCLUSION4691
GIS effectively generated statistics on features of interest that can be used to support
economic modeling. Taking the time to understand what will be asked of the GIS and
to design and plan the GIS framework prior to processing was critical. Remote sensing
(satellite and airborne) provided an excellent and cost-effective QC tool for checking the
accuracy and integrity of different map layers and for interpreting waters of the US and4696
wetlands in the Pilot Area.
REFERENCES
Lichvar, R., G. Gustina, M. Ericsson, 2002, Planning Level Delineation and Geospatial
Characterization of Aquatic Resources for San Jacinto and Portions of Santa
Margarita Watersheds, Riverside County, CA. U.S. Army Corps of Engineers4701
Engineering and Research Development Center (ERDC), Cold Regions Research and
Engineering Laboratory (CRREL), Hanover, NH. Final Report to the Riverside
County Flood Control District and U.S. Army Corps of Engineers, Los Angeles
District, Regulatory Branch, the U.S. Environmental Protection Agency, Region IX.
Digital ArcView 3.2 GIS shapefiles provided of wetlands and waters of the U.S.4706
provided.
Ellis GeoSpatial Excel Spreadsheets “wetlands_wofus_hu2”, “sand_hu_county_park3”,
“ventura_hu_county_park3”, and “scag_hu_county_park3” delivered to EPS 20 Feb
- 3 Mar 2003.

Final Draft ReportEconomic Analysis of Critical Habitat Designation for California Gnatcatcher
14H:\12594gnatcatcher\Report\DEA _Feb2004\CAG N_D EA_Feb2004.wpd5
ACKNOWLEDGMENTS4711
Hugh Dodd of HJW GeoSpatial, and the technology base at HJW GeoSpatial, enabled
this GIS Project to be successfully undertaken and completed. Jason Tundermann and
Christine McMillan of EPS, and Stacy Love of Fish & Wildlife, Carlsbad provided timely
guidance and data.
4716

APPENDIX C
SUMMARY OF SELECTED SECTION 7
BIOLOGICAL OPINIONS

Table C-1Selected Section 7 Formal Consultations
No. Project Project Project Action Applicant Date Consultation Date BO City/Name Type Description Agency Initiated Issued County
1 Padova Padua Hills Housing 125 single-family units on 112 ac site USACE Pomona College 12/20/2000 4/5/2001 Claremont/ 62.5 ac of CH to be graded, incl. Los Angeles26.5 ac of CSS
2 Sycamore Creek Housing 1,733 units, school, 4 parks, fire station, USACE Sycamore Creek 8/25/2000 1/31/2001 UnincorporatedDevelopment commercial area, major roadway, trails, Associates, L.P. Riverside
detention basin, sewer lines/lift station,on 722 acres
3 Blackmore Housing 172 single family homes on 64.4 acres 4/8/2002 10/21/2002 MurietaDevelopment within 102 acre project site RiversideProject
4 Walnut Hills Housing/ 268 SF units & 18 hole golf course on USACE Standard Pacific 4/18/2002 (reinit.) 8/7/2002 Walnut/ Golf Course 551 ac site, incl. 89.41 ac CSS. Homes Los Angeles
Economic & Planning Systems, Inc. 2/26/2004 H:\12594gnatcatcher\Report\DEA_Feb2004\EmailTables_Feb2004.xls

Table C-1Selected Section 7 Formal Consultations
No. Project Project Project Action Applicant Date Consultation Date BO City/Name Type Description Agency Initiated Issued County
5 Spring Mtn. Ranch Housing/ 785 ac master-planned community USACE Eastbridge 3/1/2002 9/13/2002 UnincorporatedSpecific Plan Land Fill incl. elem school, commercial, water Partners L.P. Riverside
treatment facility, water tanks, & 177 aclandfill
Also incl. 129 ac in CAGN CH
6 Arroyo Trabuco Golf Course 18-hole golf course on 230 ac project USACE DMB San Juan 4/18/2001 6/11/2002 Mission ViejoGolf Course site including range, clubhouse, and Golf Associates Orange
extension of existing hiking trails (agent is RanchoMission Viejo)
7 Brookfield Homes/ Housing/ 695 SF and MF homes on 126 ac; USACE Brookfield Homes 2/6/2002 5/15/2002 San MarcosUniversity Commons Road extension/realignment of San Elijo Road San Diego
Extension of Melrose Dr.; Developmentof 2.1 ac commercial, 12.8 ac lightindustrial, and 26-33 ac of private rec'luse. Includes 138.1 ac open space.
Economic & Planning Systems, Inc. 2/26/2004 H:\12594gnatcatcher\Report\DEA_Feb2004\EmailTables_Feb2004.xls

Table C-1Selected Section 7 Formal Consultations
No. Project Project Project Action Applicant Date Consultation Date BO City/Name Type Description Agency Initiated Issued County
8 Calavera Hills Housing Maximum of 781 units on 300 ac., incl USACE McMillan 8/7/2001 3/14/2002 San MarcosPhase II local infrastructure (3.5 miles local roads Land Development San Diego
, sewer, storm, and water)
9 La Sierra Avenue & Road Grading & widening of 2.13 miles of USACE Riverside County 11/20/2000 5/31/2001 RiversideEl Sobrante Road two roads (no additional lanes; not Transportation RiversideImprovement Project growth inducing) Department
10 La Estrella/Nutmeg Road Construction of 0.49 miles of new 4-lane USACE Lennar 3/21/2002 8/23/2002 MurrietaStreet Extension road (88' ROW) and 0.57 total miles of Communities Riverside
new 2-lane roads (46'-66' ROW) to serveLennar's Greer Ranch development.Project includes 6 new detention basins(0.21-1.3 ac) and one 9'X13' culvert.
177 ac of CH w/ PCEs remain onsite
11 Rancho Potrero Road Construct 2.6 mile (28' wide) road on USACE County of Orange 5/9/2001 8/23/2002 UnincorporatedLeadership Academy existing unpaved roads and trails, incl. Probation Dept Orange County(Access Road) replacing 2 existing culverts and (Santa Ana Mtn)
constructing 2 new culverts
12 Hunte Parkway Road 1.67 miles of 6-lane arterial roadway USACE 4/26/2002 10/7/2002 Chula VistaProject connecting Olympic and Eastlake San Diego
Parkways to Otay Ranch (Village 11)
Economic & Planning Systems, Inc. 2/26/2004 H:\12594gnatcatcher\Report\DEA_Feb2004\EmailTables_Feb2004.xls

Table C-1Selected Section 7 Formal Consultations
No. Project Project Project Action Applicant Date Consultation Date BO City/Name Type Description Agency Initiated Issued County
13 SR-125 South Road Construction of approximately 12.5 mi. FHWA Caltrans 2/26/1999of new 4-lane controlled access hwy. San Diegobetween SR-905 and SR-54.
14 Realignment/ Road Realign existing SR-133 from I-405 to FHWA Caltrans 6/8/1999 3/4/2000 UnincorporatedWidening of Laguna SR-73, and widen road to 4 lanes. OrangeCanyon Rd, SR-133 Project includes variable-width median,
split-grade configuration, 8-ft bike lanes,and 4 detention basins.
15 Moreno-Lakeside Water 4.85 mi underground pipeline (50-60" di.) USACE SD County 1/8/2001 6/8/2002 Lakeside/SanteePipeline requiring construction corridors b/t 60 Water Authority San Diego
and 110 ft. Includes pumping station (50' X 100') & flow control facility (0.59 ac)
16 San Sevaine Creek Water/ Reinitiation of consultation (based on new BOR San Bernardino 4/10/2000 2/7/2002 Rancho Water Project Flood Control biol. Info) for flood control/water storage County Transportation Cucamonga &(Reinitiation) facilities. Project includes replacement and Flood Control Fontana, and
of existing levee, 55 ac. debris basin, District unincorporatedexcavation & concrete lining of 13.4 miles San Bernardinoof existing flood control channels, and 9miles of public trails.34,000 ac "action area."
Economic & Planning Systems, Inc. 2/26/2004 H:\12594gnatcatcher\Report\DEA_Feb2004\EmailTables_Feb2004.xls

Table C-1Selected Section 7 Formal Consultations
No. Project Project Project Action Applicant Date Consultation Date BO City/Name Type Description Agency Initiated Issued County
17 Las Flores Estancia Military Remove CSS surrounding historic building US Marine Marine Corps 9/13/2000 2/2/2001 Camp PendletonCamp Pendleton (Grading) because it is damaging foundation Corps Base Camp Pendleton San Diego
(per National Historic Preservation Act)
18 Parking Construction Military Cut hillside to grade to construct parking US Marine Marine Corps 3/29/2002 5/30/2002 Camp Pendletonfor Bachelor Enlisted (Parking) associated with new military residences Corps Base Camp Pendleton San DiegoQuarters
19 Fallbrook Fire Military Fire Plan designed to protect weapons US Navy Fallbrook Naval 2/28/1994 2/8/1995Management Plan (Fire Plan) storage area composed of grazing, Ordnance Center
firebreak maintenance, and prescribedburnings on 7,360 ac undeveloped land.
20 Improvement/Use Military Repairs to perimeter road and road, US Marine Marine Corps 6/16/1999 9/21/1999 Miramarof Roads, Lots, and (Grading) loading dock pavement repairs, and other Corps Air Station San DiegoLoading Docks road repairs are activities that may result Miramar
in incidental take.
Economic & Planning Systems, Inc. 2/26/2004 H:\12594gnatcatcher\Report\DEA_Feb2004\EmailTables_Feb2004.xls

Table C-1Selected Section 7 Formal Consultations
No. Project Name
1 Padova Padua Hills
2 Sycamore CreekDevelopment
3 Blackmore DevelopmentProject
4 Walnut Hills
Other Listed CAGN Conservation MeasuresPairs Nearest CH Habitat Acres Pairs Species Present
Detected Breeding Site Present Corridor
None 7 miles Yes Infrequent 62.6 (CH) None None 1. Transfer 1207.2 ac within CH to City as open space (mandated by City under CEQA…not breeding habitat)2. Dedicate 55 ac Cons. Easement adjacent to CH (FWS...not breeding habitat)3. Enhance/Revegetate 6.2 ac CSS within CH (breeding)
N/A N/A Yes Important 107 (occ.) 6 Munz's Onion (E) 1. 71 ac wildlife corridor (support 2 pr CAGN), to incl.regional In SKR HCP area passive recreation only, preserved onsite (2 pr CAGN)corridor (no effects) 2. Purchase mitigation credits for 192.2 ac. (and 4 pairs
CAGN) at Wilson Creek Conservation Bank.3. Biological monitoring during clearing/grading4. Revegetate 27.1 acres sage scrub and develop Sage
Scrub Revegetation Plan5. Landscaping and lighting tailored to CAGN needs6. Sage scrub removal outside CAGN breeding season7. Temporary fencing/buffers near occupied CAGN habitat
during construction
1 male ID'd breeding behavior Yes Essential 54.6 ac RSS No take Least Bell's Vireo 1. Purchase 110 ac RSS credits from Wilson Cr Mit Bankobserved on site 55.2 ac CH authorized In SKR HCP area 2. 20.4 ac conserved onsite (within CAGN CH)
(no effects) 3. Vehicular/pedestrian access restrictions on easement4. Biological monitoring during all construction activities5. No grading between Feb 15 and Aug 316. Employee education program for construction workers7. Lighting directed away from natural areas.8. Exclusion fencing adjacent to residential areas9. Educational program for the public
10 On site No Critical 62.67 ac 4 None 1. Avoid 27.37 ac CSS on site (incl. Cons. Easement)suitable habitat (8 sensitive spp.) 2. Create 58 ac. CSS (incl. Cons. Easement)
3. Biological monitoring before/during site disturbance4. Mitigate areas outside designated footprint at 5:1 ratio5. Site grading between Aug 31 and Feb 15 only6. Place/maintain cowbird traps7. Include deed restrictions to: shield lighting near open
space; avoid introducing invasive plant spp.; discourageaccess to restoration areas
8. Implement an approved Habitat Restoration Plan9. Implement an approved Landscape Plan
CAGN Biological Information CAGN Impacts/ITP
Economic & Planning Systems, Inc. 2/26/2004 H:\12594gnatcatcher\Report\DEA_Feb2004\EmailTables_Feb2004.xls

Table C-1Selected Section 7 Formal Consultations
No. Project Name
5 Spring Mtn. RanchSpecific Plan
6 Arroyo TrabucoGolf Course
7 Brookfield Homes/University Commons
Other Listed CAGN Conservation MeasuresPairs Nearest CH Habitat Acres Pairs Species Present
Detected Breeding Site Present Corridor
CAGN Biological Information CAGN Impacts/ITP
One male breeding behavior Yes Essential 103.9 ac CH "Take" of SBKR suitable 1. Wildlife conservation easements over 112.8 acres toobserved on site in project site 1 CAGN habitat (no spp.) offset impacts to project site.
23.6 ac CH (harm) In SKR HCP area 2. A 107.3 ac conservation easement for the landfill site.in landfill site (no effects) 3. Restore 50.5 ac CAGN habitat in cons. easement.
4. Plant 4 ac of scrub5. Develop/implement Resource Management Plan
(including annual CAGN surveys)6. 45 ac set aside as open space, w/ 16.4 ac as scrub7. Biological monitoring during all construction8. Presence/absence surveys within 500 ft of CAGN habitat
(Construction stops if CAGN determined to be present)9. Permanent fencing around all conservation areas
10. All lighting directed away from conservation areas11. Employee training program for all construction personnel12. Develop/implement a revegetation/restoration plan13. Develop educational program for the public
12 pairs & observed on site Yes Critical 11.9 ac CSS 4 pairs least Bell's vireo 1. Dedicate onsite 55.2 ac CSS (10 prs and 2 ind. Males)3 individuals (Unit 6) 79.4 ac other & revegetate and/or restore 4.0 ac CSS as part of 360 acin study area Part of southern suitable habitat open space dedication5 pairs & 1 subregion of 2. Biological monitoring before and during constructionmale are in Orange County (work postponed if nest found w/in construction areas)project area NCCP 3. Sedimentation fencing around CSS during construction
4. Implement contractor education program5. Conduct cowbird trapping program for 20 yrs6. No golf cart bridge maintenance during breeding season7. Golf course and range will be unlit
7 (pre-1996)* N/A Yes Essential 130 ac CSS 6 None 1. Minimize noise impacts during construction3 (2011) (Unit 3) (In MHCP Core 6.6 ac valley grass 2. Project redesign to contribute to 1,000-ft wildlife linkage
Area and San 13.2 ac chaparral 3. Onsite set-aside of 115.6 ac of CSS/suitable habitatMarcos Subarea 0.15 ac nonnative grass 4. Offsite preservation of 170.9 ac of CSS/suitable habitat
Plan) 169.2 ac in CH 5. Add'l 17.5 ac to be preserved off-site from willing seller6. Biological monitoring before/during construction7. Construct bridge for Melrose Dr. extension to preserve
1,000-ft wildlife corridor8. Revegate with original soil and native species9. Chainlink fencing around conservation areas near roads
10. Develop/implement monitoring & management plan11. Insure preservation of at least 6 CAGN pairs within the
on- and off-site preservation areas12. Restoration of 8 ac CSS in off-site preserve13. No clearing during breeding season14. Develop employee education program15. Shield road lighting from habitat areas
Economic & Planning Systems, Inc. 2/26/2004 H:\12594gnatcatcher\Report\DEA_Feb2004\EmailTables_Feb2004.xls

Table C-1Selected Section 7 Formal Consultations
No. Project Name
8 Calavera Hills Phase II
9 La Sierra Avenue &El Sobrante RoadImprovement Project
10 La Estrella/NutmegStreet Extension
11 Rancho Potrero Leadership Academy(Access Road)
12 Hunte Parkway Project
Other Listed CAGN Conservation MeasuresPairs Nearest CH Habitat Acres Pairs Species Present
Detected Breeding Site Present Corridor
CAGN Biological Information CAGN Impacts/ITP
7 pairs N/A Yes Regionally 91.2 ac CSS 3 pairs least Bell's vireo 1. Onsite preservation of 87.3 ac CSS (in CH)significant (65.4 ac in CH) 2. Revegetation of 2.4 ac CSS on site (in CH)corridor 27.5 ac chaparral 3. Preservation of 35.6 ac CSS in adjacent Calavera
("Link A" in (19.2 ac in CH) Nature Preserve (in CH)Carlsbad HMP) 2 ac nonnative grassland 4. Off-site preservation of 51.3 ac CSS
5. Lighting shielded from undeveloped areas6. biological monitoring 7. employee education program8. wildlife undercrossing beneath College Blvd. (not only CAGN)
up to 7 N/A Yes No 3.6 (occ.) 2 Least Bell's Vireo 1. Purchase of 8.8 ac of CSS from Wilson Creek Mit. Banknearby 2. Pre-construction surveys to determine CAGN presence
3. Biological monitoring during construction4. Lighting directed away from natural areas.
One ind. N/A Yes Stepping stone 9.7 ac CH** No Take Least Bell's Vireo 1. Set-aside 254.9 ac (177.4 in CH) at Greer Ranchobserved (Unit 10) (w/in already Authorized In SKR HCP Plan 2. Preserve 10.77 ac Hollingsworth Strip area (in CH) nearonsite* diminished Area Greer Road (thin linkage corridor)
habitat corridor) 3. Restore 10.69 ac of transitional habitat within wildlifemovement corridor (not req'd by USFWS)
"Action Area" 4. Prohibit human activities in preserved areasalso includes 300 graded ac 5. Pet/cat exclusion fencing abutting all residential areasat Greer Ranch, which and potential access pointshad previously avoided 6. Lighting directed away from preservation areasconsultation, but was now 7. Education program for publicincluded due to "indirect" 8. All clearing will occur outside CAGN breeding season(gross inducing) effects. 9. Biological monitoring before/during all construction
10. Employee education program11. Revegation of disturbed areas with RSS
One adult Breeding behavior Yes N/A 46.1 ac CH One pair Arroyo Toad (w/ CH) 1. Preserve 44.1 ac CSS onsitepair and observed onsite (Unit 6) (14.7 ac CSS) 2. Create 2.1 ac oak woodland onsite
3 juveniles 3. Create 4.8 ac native grassland4. Avoid grading/construction during breeding season5. Biological monitoring before/during construction6. Incl weekly reports during grading and annual surveys7. Contractor education program8. Direct lighting away from habitat
One pair Breeding behavior Yes N/A 3.3 ac CH 2 pairs Otay Tarplant 1. Preserve 1.2 ac CSS onsiteon-site observed onsite (Unit 1) (0.6 ac CSS) (and proposed CH) 2. Preserve 3.0 ac non-native grassland onsite
(33 pr in 1200 [incl Otay & Quino Checkerspot 3. Revegetate road boundary adjacent to preserves withac ownership Quino proposed Butterfly CH non-native, non-invasive shrubbery (CAGN barrier)
area) CH] (and proposed CH) 4. Preserve-side fill slope planted w/ CSS seed5. Site grading/construction outside breeding season
Economic & Planning Systems, Inc. 2/26/2004 H:\12594gnatcatcher\Report\DEA_Feb2004\EmailTables_Feb2004.xls

Table C-1Selected Section 7 Formal Consultations
No. Project Name
13 SR-125 South
14 Realignment/Widening of LagunaCanyon Rd, SR-133
15 Moreno-LakesidePipeline
16 San Sevaine CreekWater Project(Reinitiation)
Other Listed CAGN Conservation MeasuresPairs Nearest CH Habitat Acres Pairs Species Present
Detected Breeding Site Present Corridor
CAGN Biological Information CAGN Impacts/ITP
32 pairs On-site No 60.5 ac CSS 32 pairs least Bell's vireo 1. Off-site preservation of 1,100 total acres CAGN habitat(prior to (direct) Quino Chkspt Btfly incl 731 ac in Rancho San Diego Mitigation Bank*
2000) 45.2 ac CSS SD fairy shrimp (supporting 32 pairs), and purchase of development rights(indirect) Otay tarplant 2. Clearing outside breeding season
spreading navarettia 3. Pre-construction surveys and avoidance of nest sites4. Unauthorized destruction of CSS to be offset at 5:1 ratio5. Employee education program6. Biological monitoring during construction
2 pairs (direct) No N/A 21.51 ac CSS 6 pairs least Bell's vireo 1. Implement resource management plan, including surveys,4 pairs (indirect) (prior to (add'l fragmentation SW willow flycatcher biol monitoring, and noise reduction.
2000) of 16.49 ac CSS)
10 pairs in N/A No N/A 0.54 ac CSS 2 pairs arroyo toad 1. Permanent impacts to 0.54 ac mitigated at 2:1 ratio atproject area (permanent) (and CH) applicant's Crestridge Habitat Management Area2 pairs in 5.34 ac CSS 2. Temporary impacts to 5.35 ac mitigated through 1:1 proposed alignment (temporary) revegatation onsite, and 1:1 offsite mitigation at the
applicant's Crestridge Habitat Management Area3. Revegetated areas that do not reestablish in 2 yrs will be
mitigated offsite at add'l 1:1 ratio (2:1 overall mitigation)4. Preconstruction CAGN surveys5. Biological monitoring during all construction/mitigation6. CSS grading outside breeding season
7. Develop mitigation/management plan
10 in action N/A Yes Yes 64 ac RASS One pair SBKR (w/ CH) 1. Preservation of 329 to 343 ac (174 contiguous with CAGNarea since (7,272 ac CH; remaining acres primarily for SBKR).
1994 in action 2. Endowment of $1,000/ac for long-term managementarea) 3. Revegetate 56 ac (CAGN, SBKR, and others)
4. Long-term Maintenance and Monitoring Plan5. Biological monitoring before/during construction6. No clearing during breeding season
Economic & Planning Systems, Inc. 2/26/2004 H:\12594gnatcatcher\Report\DEA_Feb2004\EmailTables_Feb2004.xls

Table C-1Selected Section 7 Formal Consultations
No. Project Name
17 Las Flores EstanciaCamp Pendleton
18 Parking Constructionfor Bachelor EnlistedQuarters
19 Fallbrook FireManagement Plan
20 Improvement/Useof Roads, Lots, andLoading Docks
Other Listed CAGN Conservation MeasuresPairs Nearest CH Habitat Acres Pairs Species Present
Detected Breeding Site Present Corridor
CAGN Biological Information CAGN Impacts/ITP
1 in project N/A No Stepping stone 0.74 ac CSS One pair None 1. Debit 1.48 ac credits (2:1) from Coastal Sage Scrubsite for local Restoration Bank.
dispersal 2. Remove CSS outside breeding season
1 (incidental N/A No N/A 2.21 ac CSS One pair None 1. Debit 4.42 ac credits (2:1) from Coastal Sage Scrub sighting; no Restoration Bank.surveys) 2. Restore 1.18 ac CSS on adjacent slope (part of 2.21 ac)
3. No clearing during breeding season4. Shield parking lot lighting away from habitat
Throughout N/A No Yes Unknown 5 pairs least Bell's vireo 1. Maintain at least 2,000 ac suitable CSS at all timesproject area (2 mortality; SKR 2. Rely on grazing/mowing as preferential fire prevention
3 harass) 3. Only habitat containing fewer than 2 pairs CAGN can be4. considered for prescribed burns5. Focused CAGN surveys immediately prior to burns6. Fire management activities outside breeding season
66 pairs on No 0.22 ac CSS One pair SD Fairy shrimp 1. Mitigate occupied CAGN habitat at 2:1 restorationbase 0.44 ac Chap. (harass) SD button celery 2. Mitigate unoccupied CAGN habitat at 1:1 restoration
0.66 total SD mesa mint 3. Construction outside breeding season4. No noisy construction w/in 500 ft of nest5. Biological monitoring6. Exclusion fencing
Economic & Planning Systems, Inc. 2/26/2004 H:\12594gnatcatcher\Report\DEA_Feb2004\EmailTables_Feb2004.xls

Table C-1Selected Section 7 Formal Consultations
No. Project Name
1 Padova Padua Hills
2 Sycamore CreekDevelopment
3 Blackmore DevelopmentProject
4 Walnut Hills
Voluntary/RecommendedProject Modifications
Salvage/translocate CSS & sensitive plant spp. 0.88:1 non-breed hab pres. OffShield lighting adjacent to open space 0.1:1 breed hab restorationAvoid introducing invasive plants spp.
Management of easement @ $13.5K (Yr1), 0.66:1 onsite$20K (Yr2-5), and $40K (Yr 6), adj CPI after. 1.8:1 off-siteOriginal proposal to include picnic benches in easement were abandoned
CAGN pairs @ 1:1
RSS @ 2:1 off-site0.4:1 onsite
Unknown 0.44:1 on-site0.93:1 creation
MitigationRatio(s))
Effective
Economic & Planning Systems, Inc. 2/26/2004 H:\12594gnatcatcher\Report\DEA_Feb2004\EmailTables_Feb2004.xls

Table C-1Selected Section 7 Formal Consultations
No. Project Name
5 Spring Mtn. RanchSpecific Plan
6 Arroyo TrabucoGolf Course
7 Brookfield Homes/University Commons
Voluntary/RecommendedProject Modifications Mitigation
Ratio(s))
Effective
1.09:1 onsite (cons easement)0.16:1 onsite (open space ded.)
4.55:1 onsite (landfill)
4.64:1 onsiteCAGN pairs @ 2.75:1
0.9:1 onsite1.45:1 offsite
CSS @ 2:1grassland @ 2:1Chaparral @ 1:1Nonnative grassland @ 0.5:1CAGN individuals @ 1:1
Economic & Planning Systems, Inc. 2/26/2004 H:\12594gnatcatcher\Report\DEA_Feb2004\EmailTables_Feb2004.xls

Table C-1Selected Section 7 Formal Consultations
No. Project Name
8 Calavera Hills Phase II
9 La Sierra Avenue &El Sobrante RoadImprovement Project
10 La Estrella/NutmegStreet Extension
11 Rancho Potrero Leadership Academy(Access Road)
12 Hunte Parkway Project
Voluntary/RecommendedProject Modifications Mitigation
Ratio(s))
Effective
0.96:1 onsite0.95:1 offsite0.03:1 restoration
wildlife undercrossing beneath College Blvd. (not only CAGN)
2.44:1 offsite
0.82:1 on-site0.03:1 offsite preservation
Project footprint reduced to avoid CH impacts CSS @ 3:1 on-site (44.1/14.7=3)Oak Woodland @ 1:1 on-sitenative grassland @ 1:1 on-site
CSS @ 2:1 on-site (1.2/0.6 =2)
Non-native grassland @ 1:1 onsite
Economic & Planning Systems, Inc. 2/26/2004 H:\12594gnatcatcher\Report\DEA_Feb2004\EmailTables_Feb2004.xls

Table C-1Selected Section 7 Formal Consultations
No. Project Name
13 SR-125 South
14 Realignment/Widening of LagunaCanyon Rd, SR-133
15 Moreno-LakesidePipeline
16 San Sevaine CreekWater Project(Reinitiation)
Voluntary/RecommendedProject Modifications Mitigation
Ratio(s))
Effective
Informal consultation process included review CSS direct effects @ 2:1 offsiteof 17 build variations for project. Realignments CSS indirect effects @ 1:1to both northern and southern sections of CAGN pairs @ 1:1 [key factor often roadway were selected to avoid significant resulting in larger acreage set-asides impacts to CAGN. Project review required than habitat mitigation alone]considerable time from all participants. (Effective Mit. Ratio of 18.2:1)
Recommend selecting least damaging road Mitigation through Central/Coastalalignment HCP/NCCPRecommend measures to minimize roadway noiseRecommend wildlife undercrossings
Permanent CSS @ 2:1 offsiteTemporary CSS @ 1:1 offsiteand 1:1 onsite revegetation(if revegetation fails w/in 2 yrs, add'l 1:1 offsite mitigation req'd)
Project footprint reduced by 24 acres. 2.7:1 onsite (174/64)74 ac habitat no longer isolated by levees 0.4:1 revegetation ([56/2]/64)Preserve area augmented by 42 acres
Economic & Planning Systems, Inc. 2/26/2004 H:\12594gnatcatcher\Report\DEA_Feb2004\EmailTables_Feb2004.xls

Table C-1Selected Section 7 Formal Consultations
No. Project Name
17 Las Flores EstanciaCamp Pendleton
18 Parking Constructionfor Bachelor EnlistedQuarters
19 Fallbrook FireManagement Plan
20 Improvement/Useof Roads, Lots, andLoading Docks
Voluntary/RecommendedProject Modifications Mitigation
Ratio(s))
Effective
USMC should restore/enhance CSS in the CSS @ 2:1 offsitevicinity of the historic bldg.USMC should eradicate sweet fennel plants
CSS @ 2:1 offsite
Impacts unknown, so no mit. ratio
USMC continues to develop INRMP addressing Occupied = 2:1 restorationCAGN. Unoccupied = 1:1 restoration
Economic & Planning Systems, Inc. 2/26/2004 H:\12594gnatcatcher\Report\DEA_Feb2004\EmailTables_Feb2004.xls

APPENDIX D
REAL ESTATE MARKET DATA AND LAND VALUECALCULATIONS

Table D-1Residential Land Value Calculations by County
Measure Los Angeles Orange Riverside San Bernardino San Diego Ventura
Average Home Sales Price (1) $394,230 $464,304 $250,923 $202,240 $410,435 $415,458
Housing Acreage Distribution (2)Single Family, Detached $226,994 $69,413 $50,822 $59,850 $75,135 $22,714Single Family, Attached $21,195 $10,918 $3,989 $2,296 $8,840 $2,683Multi-Family, 2-4 Units $19,126 $5,835 $1,832 $2,674 $5,036 $1,011Multi-Family, 5+ Units $56,430 $12,584 $4,070 $4,173 $15,106 $1,939Total $323,744 $98,750 $60,713 $68,994 $104,117 $28,348
Units / Gross Ac. (Weighted Avg.)[3] $9.93 $9.46 $8.31 $8.20 $9.53 $8.46
Market Value per Gross Acre $3,916,654 $4,392,812 $2,085,156 $1,657,608 $3,910,551 $3,514,263
Residual Value per Vacant Gross Ac.(4) $391,665 $439,281 $208,516 $165,761 $391,055 $351,426
Residual Value per Vacant GSF $8.99 $10.08 $4.79 $3.81 $8.98 $8.07
(1) From Table 10(2) Calculated by multiplying the number of housing units of each type in 2000 (DOF Table E-5a) by the following assumed unit-per-acre estimates: single family detached: 7
single family attached: 10multi-family (2-4 units): 15multi-family (5+ units): 20
(3) Average of unit-per-acre assumptions in footnote (2), weighted by housing acreage distribution.(4) Assumes value of vacant land zoned for development (but otherwise unentitled) is 10% percent of total market value.
Economic & Planning Systems, Inc. 2/26/2004 H:\12594gnatcatcher\Report\DEA_Feb2004\EmailTables_Feb2004.xls

Table D-2Office and Industrial Land Value Calculations by County
Measure Los Angeles Orange Riverside San Bernardino San Diego Ventura
Office Sales Price ($/Leasable SqFt) (1) $193 $220 $125 $125 $195 $175
Parcel Price per Net SqFt (2) $68 $77 $44 $44 $68 $61
Parcel Price per Gross SqFt (3) $54 $62 $35 $35 $54 $49
Market Value per Gross Acre $2,356,079 $2,683,296 $1,524,600 $1,524,600 $2,373,741 $2,134,440
Residual Value per Vacant Gross Ac.(4) $235,608 $268,330 $152,460 $152,460 $237,374 $213,444
Residual Value per Vacant GSF $5.41 $6.16 $3.50 $3.50 $5.45 $4.90
Industrial Sales Price ($/Leasable SqFt) (1) $43 $59 $41 $41 $65 $69
Parcel Price per Net SqFt (5) $10.86 $14.70 $10.25 $10.25 $16.25 $17.18
Parcel Price per Gross SqFt (3) $8.69 $11.76 $8.20 $8.20 $13.00 $13.74
Market Value per Gross Acre $378,381 $512,266 $357,192 $357,192 $566,280 $598,689
Residual Value per Vacant Gross Ac.(4) $37,838 $51,227 $35,719 $35,719 $56,628 $59,869
Residual Value per Vacant GSF $0.87 $1.18 $0.82 $0.82 $1.30 $1.37
Reported Unimproved Land Value (1) $5.00 -- $4.00 $4.00 $4.00 --
(1) From Table 1(2) Assumes floor area ratio (FAR) of 0.35 for office space.(3) Assumes net-to-gross ratio of 0.80 to account for associated infrastructure (roads, sidewalks, etc.).(4) Assumes value of vacant land zoned for development (but otherwise unentitled) is 10% of total market value.(5) Assumes floor area ratio (FAR) of 0.25 for industrial space.
Source: Economic & Planning Systems, Inc.
Economic & Planning Systems, Inc. 2/26/2004 H:\12594gnatcatcher\Report\DEA_Feb2004\EmailTables_Feb2004.xls

Table D-3Retail Land Value Calculations by County
Measure Los Angeles Orange Riverside San Bernardino San Diego Ventura
Sales Price ($/Leasable SqFt) (1) $144 $142 $108 $108 $124 $144
Parcel Price per Net SqFt (2) $43 $43 $32 $32 $37 $43
Parcel Price per Gross SqFt (3) $35 $34 $26 $26 $30 $35
Market Value per Gross Acre $1,505,434 $1,484,525 $1,129,075 $1,129,075 $1,296,346 $1,505,434
Residual Value per Vacant Gross Ac.(4) $150,543 $148,452 $112,908 $112,908 $129,635 $150,543
Residual Value per Vacant GSF $3.46 $3.41 $2.59 $2.59 $2.98 $3.46
(1) From Table 10(2) Assumes floor area ratio (FAR) of 0.3 for office space.(3) Assumes net-to-gross ratio of 0.80 to account for associated infrastructure (roads, sidewalks, etc.).(4) Assumes value of vacant land zoned for development (but otherwise unentitled) is 10% of total market value.
Source: Economic & Planning Systems, Inc.
Economic & Planning Systems, Inc. 2/26/2004 H:\12594gnatcatcher\Report\DEA_Feb2004\EmailTables_Feb2004.xls

APPENDIX E
PROJECT MODIFICATION COST CALCULATIONS FORPRIVATE LAND DEVELOPMENT

Table E-1Projected Development in Proposed Critical Habitat Regulated Under Section 7 (1)
Proposed Critical Single Family Multi-Family Mobile Home TotalHabitat Unit Residential Residential Residential
Critical Habitat Unit 1 (5)San Diego -- -- -- 64
Critical Habitat Unit 2San Diego 58 0 0 58
Critical Habitat Unit 3San Diego 183 6 0 189
Critical Habitat Unit 4San Diego 0 0 0 0
Critical Habitat Unit 5San Diego -- -- -- 286
Critical Habitat Unit 6Orange 373 50 3 426
San Diego 0 0 0 0
Critical Habitat Unit 7Orange (6) -- -- -- 32
Residential Growth Acres Regulated by Section 7 (1)
Economic & Planning Systems, Inc. 2/26/2004 H:\12594gnatcatcher\Report\DEA_Feb2004\EmailTables_Feb2004.xls

Table E-1Projected Development in Proposed Critical Habitat Regulated Under Section 7 (1)
Proposed Critical Single Family Multi-Family Mobile Home TotalHabitat Unit Residential Residential Residential
Residential Growth Acres Regulated by Section 7 (1)
Critical Habitat Unit 8Los Angeles 0 0 0 0
Critical Habitat Unit 9Los Angeles 58 16 5 80
Orange 71 9 3 83
Riverside 0 0 0 0
San Bernardino 6 1 0 7
Critical Habitat Unit 10Orange 0 0 0 0
Riverside 2,039 106 401 2,546
San Bernardino 293 32 19 344
San Diego 0 0 0 0
Critical Habitat Unit 11San Bernardino 390 12 16 417
Critical Habitat Unit 12Los Angeles 8 3 1 11
Critical Habitat Unit 13Los Angeles 835 155 81 1,071
Ventura 136 17 6 159
Total Acres 4,451 406 535 5,774
Economic & Planning Systems, Inc. 2/26/2004 H:\12594gnatcatcher\Report\DEA_Feb2004\EmailTables_Feb2004.xls

Table E-1Projected Development in Proposed Critical Habitat Regulated Under Section 7 (1)
Proposed Critical Habitat Unit
Critical Habitat Unit 1 (5)San Diego
Critical Habitat Unit 2San Diego
Critical Habitat Unit 3San Diego
Critical Habitat Unit 4San Diego
Critical Habitat Unit 5San Diego
Critical Habitat Unit 6Orange
San Diego
Critical Habitat Unit 7Orange (6)
Office Commercial Industrial Retail Services Other Total Total Total"Office" (2) "Industrial" (3) "Retail" (4)
-- -- -- -- -- -- 0 5 2
0 0 0 -- -- 0 0 0 0
1 9 15 -- -- 0 1 15 9
0 0 0 -- -- 0 0 0 0
-- -- -- -- -- -- 0 2 4
-- -- 0 0 0 0 0 0 0
0 0 0 -- -- 0 0 0 0
-- -- -- -- -- -- 16 48 5
Commercial Growth Acres Regulated by Section 7 (1)
Economic & Planning Systems, Inc. 2/26/2004 H:\12594gnatcatcher\Report\DEA_Feb2004\EmailTables_Feb2004.xls

Table E-1Projected Development in Proposed Critical Habitat Regulated Under Section 7 (1)
Proposed Critical Habitat Unit
Critical Habitat Unit 8Los Angeles
Critical Habitat Unit 9Los Angeles
Orange
Riverside
San Bernardino
Critical Habitat Unit 10Orange
Riverside
San Bernardino
San Diego
Critical Habitat Unit 11San Bernardino
Critical Habitat Unit 12Los Angeles
Critical Habitat Unit 13Los Angeles
Ventura
Total Acres
Office Commercial Industrial Retail Services Other Total Total Total"Office" (2) "Industrial" (3) "Retail" (4)
Commercial Growth Acres Regulated by Section 7 (1)
-- -- 0 0 0 0 0 0 0
-- -- 93 46 171 11 171 104 46
-- -- 115 65 206 24 206 139 65
-- -- 0 0 0 0 0 0 0
-- -- 13 9 24 3 24 16 9
-- -- 0 0 1 0 1 0 0
-- -- 2,184 2,218 5,754 1,283 5,754 3,467 2,218
-- -- 22 4 19 -1 19 21 4
0 0 0 -- -- 0 0 0 0
-- -- 640 448 1,195 158 1,195 797 448
-- -- 35 18 66 4 66 40 18
-- -- 666 338 1,260 82 1,260 748 338
-- -- 524 381 1,134 134 1,134 658 381
1 9 4,309 3,528 9,830 1,699 9,847 6,063 3,549
Economic & Planning Systems, Inc. 2/26/2004 H:\12594gnatcatcher\Report\DEA_Feb2004\EmailTables_Feb2004.xls

Table E-2On-site Set-aside Calculations for Projected Residential Development
Proposed Critical County Set-Aside Calculations by Year (4)Habitat Unit Projected Acres Per-acre Residual 2003 2004 2005 2006 2007
Growth Acres (2) Set-aside Land Value (3) 1 2 3 4 5
Critical Habitat Unit 1Acres San Diego 0.06 :1 64 4 $391,055 Acres 0.15 0.15 0.15 0.15 0.15Units Annual Cost $59,730 $59,730 $59,730 $59,730 $59,730
NPV $461,019Critical Habitat Unit 2
Acres San Diego 0.06 :1 58 3 $391,055 Acres 0.14 0.14 0.14 0.14 0.14Units Annual Cost $53,617 $53,617 $53,617 $53,617 $53,617
NPV $413,838Critical Habitat Unit 3
Acres San Diego 0.06 :1 189 10 $391,055 Acres 0.45 0.45 0.45 0.45 0.45Units Annual Cost $176,269 $176,269 $176,269 $176,269 $176,269
NPV $1,360,519Critical Habitat Unit 4
Acres San Diego 0.06 :1 0 0 $391,055 Acres 0.00 0.00 0.00 0.00 0.00Units Annual Cost $150 $150 $150 $150 $150
NPV $1,160Critical Habitat Unit 5
Acres San Diego 0.06 :1 286 16 $391,055 Acres 0.68 0.68 0.68 0.68 0.68Units Annual Cost $266,790 $266,790 $266,790 $266,790 $266,790
NPV $2,059,198Critical Habitat Unit 6
Acres Orange 1.82 :1 426 275 $439,281 Acres 11.96 11.96 11.96 11.96 11.96Units Annual Cost $5,252,546 $5,252,546 $5,252,546 $5,252,546 $5,252,546
Acres San Diego 0.06 :1 0 0 $391,055 Acres 0.00 0.00 0.00 0.00 0.00Units Annual Cost $12 $12 $12 $12 $12
Total NPV $40,541,515Critical Habitat Unit 7
Acres Orange 1.82 :1 32 20 $439,281 Acres 0.89 0.89 0.89 0.89 0.89Units Annual Cost $388,987 $388,987 $388,987 $388,987 $388,987
NPV $3,002,368Critical Habitat Unit 8
Acres Los Angeles 0.44 :1 0 0 $391,665 Acres 0.00 0.00 0.00 0.00 0.00Units Annual Cost $0 $0 $0 $0 $0
NPV $0Critical Habitat Unit 9
Acres Los Angeles 0.44 :1 80 24 $391,665 Acres 1.06 1.06 1.06 1.06 1.06Units Annual Cost $414,360 $414,360 $414,360 $414,360 $414,360
Acres Orange 1.82 :1 83 54 $439,281 Acres 2.33 2.33 2.33 2.33 2.33Units Annual Cost $1,022,166 $1,022,166 $1,022,166 $1,022,166 $1,022,166
Acres Riverside 1.14 :1 0.1 0.1 $208,516 Acres 0.003 0.003 0.003 0.003 0.003Units Annual Cost $529 $529 $529 $529 $529
Acres San Bernardino 2.70 :1 7 5 $165,761 Acres 0.23 0.23 0.23 0.23 0.23Units Annual Cost $38,021 $38,021 $38,021 $38,021 $38,021
Total NPV $11,385,286Critical Habitat Unit 10
EffectiveOn-site
Mitigation
Projected Residential Development
Ratio (1)
Economic & Planning Systems, Inc. 2/26/2004 H:\12594gnatcatcher\Report\DEA_Feb2004\EmailTables_Feb2004.xls

Table E-2On-site Set-aside Calculations for Projected Residential Development
Proposed Critical County Set-Aside Calculations by Year (4)Habitat Unit Projected Acres Per-acre Residual 2003 2004 2005 2006 2007
Growth Acres (2) Set-aside Land Value (3) 1 2 3 4 5
EffectiveOn-site
Mitigation
Projected Residential Development
Ratio (1)
Acres Orange 1.82 :1 0.4 0.2 $439,281 Acres 0.01 0.01 0.01 0.01 0.01Units Annual Cost $4,592 $4,592 $4,592 $4,592 $4,592
Acres Riverside 1.14 :1 2,546 1,358 $208,516 Acres 59.04 59.04 59.04 59.04 59.04Units Annual Cost $12,311,202 $12,311,202 $12,311,202 $12,311,202 $12,311,202
Acres San Bernardino 2.70 :1 344 251 $165,761 Acres 10.91 10.91 10.91 10.91 10.91Units Annual Cost $1,808,836 $1,808,836 $1,808,836 $1,808,836 $1,808,836
Acres San Diego 0.06 :1 0 0 $391,055 Acres 0.00 0.00 0.00 0.00 0.00Units Annual Cost $111 $111 $111 $111 $111
Total NPV $109,020,874Critical Habitat Unit 11
Acres San Bernardino 2.70 :1 417 305 $165,761 Acres 13.24 13.24 13.24 13.24 13.24Units Annual Cost $2,194,559 $2,194,559 $2,194,559 $2,194,559 $2,194,559
NPV $16,938,559Critical Habitat Unit 12
Acres Los Angeles 0.44 :1 11 3 $391,665 Acres 0.15 0.15 0.15 0.15 0.15Units Annual Cost $59,600 $59,600 $59,600 $59,600 $59,600
NPV $460,019Critical Habitat Unit 13
Acres Los Angeles 0.44 :1 1,071 327 $391,665 Acres 14.23 14.23 14.23 14.23 14.23Units Annual Cost $5,574,503 $5,574,503 $5,574,503 $5,574,503 $5,574,503
Acres Ventura 0.44 :1 159 49 $351,426 Acres 2.11 2.11 2.11 2.11 2.11Units Annual Cost $742,146 $742,146 $742,146 $742,146 $742,146
Total NPV $48,754,636Total NPV, All Units:
(1) For San Diego and Orange counties, the Effective Mitigation Ratio is the County-specific on-site mitigation ratio summarized in Table 11 minus an assumed CEQA mitigation ratio of 2-to-1. For all other counties, the Effective Mitigation Ratio is the ratio reported in Table 11. Mitigation ratios is Ventura County were assumed to be the same as in Los Angeles, because no Biological Opinions were provided for projects in Ventura involving the CAGN.(2) Table E-1(3) Table D-1(4) Assumes projected development is distributed evenly throughout 2025.
$234,398,990
Economic & Planning Systems, Inc. 2/26/2004 H:\12594gnatcatcher\Report\DEA_Feb2004\EmailTables_Feb2004.xls

Table E-2On-site Set-aside Calculations for Projected Residential Development
Proposed Critical CountyHabitat Unit
Critical Habitat Unit 1Acres San DiegoUnits
Critical Habitat Unit 2Acres San DiegoUnits
Critical Habitat Unit 3Acres San DiegoUnits
Critical Habitat Unit 4Acres San DiegoUnits
Critical Habitat Unit 5Acres San DiegoUnits
Critical Habitat Unit 6Acres OrangeUnits
Acres San DiegoUnits
Critical Habitat Unit 7Acres OrangeUnits
Critical Habitat Unit 8Acres Los AngelesUnits
Critical Habitat Unit 9Acres Los AngelesUnits
Acres OrangeUnits
Acres RiversideUnits
Acres San BernardinoUnits
Critical Habitat Unit 10
Set-Aside Calculations by Year (4)2008 2009 2010 2011 2012 2013 2014 2015 2016 2017
6 7 8 9 10 11 12 13 14 15
0.15 0.15 0.15 0.15 0.15 0.15 0.15 0.15 0.15 0.15$59,730 $59,730 $59,730 $59,730 $59,730 $59,730 $59,730 $59,730 $59,730 $59,730
0.14 0.14 0.14 0.14 0.14 0.14 0.14 0.14 0.14 0.14$53,617 $53,617 $53,617 $53,617 $53,617 $53,617 $53,617 $53,617 $53,617 $53,617
0.45 0.45 0.45 0.45 0.45 0.45 0.45 0.45 0.45 0.45$176,269 $176,269 $176,269 $176,269 $176,269 $176,269 $176,269 $176,269 $176,269 $176,269
0.00 0.00 0.00 0.00 0.00 0.00 0.00 0.00 0.00 0.00$150 $150 $150 $150 $150 $150 $150 $150 $150 $150
0.68 0.68 0.68 0.68 0.68 0.68 0.68 0.68 0.68 0.68$266,790 $266,790 $266,790 $266,790 $266,790 $266,790 $266,790 $266,790 $266,790 $266,790
11.96 11.96 11.96 11.96 11.96 11.96 11.96 11.96 11.96 11.96$5,252,546 $5,252,546 $5,252,546 $5,252,546 $5,252,546 $5,252,546 $5,252,546 $5,252,546 $5,252,546 $5,252,546
0.00 0.00 0.00 0.00 0.00 0.00 0.00 0.00 0.00 0.00$12 $12 $12 $12 $12 $12 $12 $12 $12 $12
0.89 0.89 0.89 0.89 0.89 0.89 0.89 0.89 0.89 0.89$388,987 $388,987 $388,987 $388,987 $388,987 $388,987 $388,987 $388,987 $388,987 $388,987
0.00 0.00 0.00 0.00 0.00 0.00 0.00 0.00 0.00 0.00$0 $0 $0 $0 $0 $0 $0 $0 $0 $0
1.06 1.06 1.06 1.06 1.06 1.06 1.06 1.06 1.06 1.06$414,360 $414,360 $414,360 $414,360 $414,360 $414,360 $414,360 $414,360 $414,360 $414,360
2.33 2.33 2.33 2.33 2.33 2.33 2.33 2.33 2.33 2.33$1,022,166 $1,022,166 $1,022,166 $1,022,166 $1,022,166 $1,022,166 $1,022,166 $1,022,166 $1,022,166 $1,022,166
0.003 0.003 0.003 0.003 0.003 0.003 0.003 0.003 0.003 0.003$529 $529 $529 $529 $529 $529 $529 $529 $529 $529
0.23 0.23 0.23 0.23 0.23 0.23 0.23 0.23 0.23 0.23$38,021 $38,021 $38,021 $38,021 $38,021 $38,021 $38,021 $38,021 $38,021 $38,021
Economic & Planning Systems, Inc. 2/26/2004 H:\12594gnatcatcher\Report\DEA_Feb2004\EmailTables_Feb2004.xls

Table E-2On-site Set-aside Calculations for Projected Residential Development
Proposed Critical CountyHabitat Unit
Acres OrangeUnits
Acres RiversideUnits
Acres San BernardinoUnits
Acres San DiegoUnits
Critical Habitat Unit 11Acres San BernardinoUnits
Critical Habitat Unit 12Acres Los AngelesUnits
Critical Habitat Unit 13Acres Los AngelesUnits
Acres VenturaUnits
Total NPV, All Units:
Set-Aside Calculations by Year (4)2008 2009 2010 2011 2012 2013 2014 2015 2016 2017
6 7 8 9 10 11 12 13 14 15
0.01 0.01 0.01 0.01 0.01 0.01 0.01 0.01 0.01 0.01$4,592 $4,592 $4,592 $4,592 $4,592 $4,592 $4,592 $4,592 $4,592 $4,592
59.04 59.04 59.04 59.04 59.04 59.04 59.04 59.04 59.04 59.04$12,311,202 $12,311,202 $12,311,202 $12,311,202 $12,311,202 $12,311,202 $12,311,202 $12,311,202 $12,311,202 $12,311,202
10.91 10.91 10.91 10.91 10.91 10.91 10.91 10.91 10.91 10.91$1,808,836 $1,808,836 $1,808,836 $1,808,836 $1,808,836 $1,808,836 $1,808,836 $1,808,836 $1,808,836 $1,808,836
0.00 0.00 0.00 0.00 0.00 0.00 0.00 0.00 0.00 0.00$111 $111 $111 $111 $111 $111 $111 $111 $111 $111
13.24 13.24 13.24 13.24 13.24 13.24 13.24 13.24 13.24 13.24$2,194,559 $2,194,559 $2,194,559 $2,194,559 $2,194,559 $2,194,559 $2,194,559 $2,194,559 $2,194,559 $2,194,559
0.15 0.15 0.15 0.15 0.15 0.15 0.15 0.15 0.15 0.15$59,600 $59,600 $59,600 $59,600 $59,600 $59,600 $59,600 $59,600 $59,600 $59,600
14.23 14.23 14.23 14.23 14.23 14.23 14.23 14.23 14.23 14.23$5,574,503 $5,574,503 $5,574,503 $5,574,503 $5,574,503 $5,574,503 $5,574,503 $5,574,503 $5,574,503 $5,574,503
2.11 2.11 2.11 2.11 2.11 2.11 2.11 2.11 2.11 2.11$742,146 $742,146 $742,146 $742,146 $742,146 $742,146 $742,146 $742,146 $742,146 $742,146
Economic & Planning Systems, Inc. 2/26/2004 H:\12594gnatcatcher\Report\DEA_Feb2004\EmailTables_Feb2004.xls

Table E-2On-site Set-aside Calculations for Projected Residential Development
Proposed Critical CountyHabitat Unit
Critical Habitat Unit 1Acres San DiegoUnits
Critical Habitat Unit 2Acres San DiegoUnits
Critical Habitat Unit 3Acres San DiegoUnits
Critical Habitat Unit 4Acres San DiegoUnits
Critical Habitat Unit 5Acres San DiegoUnits
Critical Habitat Unit 6Acres OrangeUnits
Acres San DiegoUnits
Critical Habitat Unit 7Acres OrangeUnits
Critical Habitat Unit 8Acres Los AngelesUnits
Critical Habitat Unit 9Acres Los AngelesUnits
Acres OrangeUnits
Acres RiversideUnits
Acres San BernardinoUnits
Critical Habitat Unit 10
Set-Aside Calculations by Year (4)2018 2019 2020 2021 2022 2023 2024 2025
16 17 18 19 20 21 22 23
0.15 0.15 0.15 0.15 0.15 0.15 0.15 0.15$59,730 $59,730 $59,730 $59,730 $59,730 $59,730 $59,730 $59,730
0.14 0.14 0.14 0.14 0.14 0.14 0.14 0.14$53,617 $53,617 $53,617 $53,617 $53,617 $53,617 $53,617 $53,617
0.45 0.45 0.45 0.45 0.45 0.45 0.45 0.45$176,269 $176,269 $176,269 $176,269 $176,269 $176,269 $176,269 $176,269
0.00 0.00 0.00 0.00 0.00 0.00 0.00 0.00$150 $150 $150 $150 $150 $150 $150 $150
0.68 0.68 0.68 0.68 0.68 0.68 0.68 0.68$266,790 $266,790 $266,790 $266,790 $266,790 $266,790 $266,790 $266,790
11.96 11.96 11.96 11.96 11.96 11.96 11.96 11.96$5,252,546 $5,252,546 $5,252,546 $5,252,546 $5,252,546 $5,252,546 $5,252,546 $5,252,546
0.00 0.00 0.00 0.00 0.00 0.00 0.00 0.00$12 $12 $12 $12 $12 $12 $12 $12
0.89 0.89 0.89 0.89 0.89 0.89 0.89 0.89$388,987 $388,987 $388,987 $388,987 $388,987 $388,987 $388,987 $388,987
0.00 0.00 0.00 0.00 0.00 0.00 0.00 0.00$0 $0 $0 $0 $0 $0 $0 $0
1.06 1.06 1.06 1.06 1.06 1.06 1.06 1.06$414,360 $414,360 $414,360 $414,360 $414,360 $414,360 $414,360 $414,360
2.33 2.33 2.33 2.33 2.33 2.33 2.33 2.33$1,022,166 $1,022,166 $1,022,166 $1,022,166 $1,022,166 $1,022,166 $1,022,166 $1,022,166
0.003 0.003 0.003 0.003 0.003 0.003 0.003 0.003$529 $529 $529 $529 $529 $529 $529 $529
0.23 0.23 0.23 0.23 0.23 0.23 0.23 0.23$38,021 $38,021 $38,021 $38,021 $38,021 $38,021 $38,021 $38,021
Economic & Planning Systems, Inc. 2/26/2004 H:\12594gnatcatcher\Report\DEA_Feb2004\EmailTables_Feb2004.xls

Table E-2On-site Set-aside Calculations for Projected Residential Development
Proposed Critical CountyHabitat Unit
Acres OrangeUnits
Acres RiversideUnits
Acres San BernardinoUnits
Acres San DiegoUnits
Critical Habitat Unit 11Acres San BernardinoUnits
Critical Habitat Unit 12Acres Los AngelesUnits
Critical Habitat Unit 13Acres Los AngelesUnits
Acres VenturaUnits
Total NPV, All Units:
Set-Aside Calculations by Year (4)2018 2019 2020 2021 2022 2023 2024 2025
16 17 18 19 20 21 22 23
0.01 0.01 0.01 0.01 0.01 0.01 0.01 0.01$4,592 $4,592 $4,592 $4,592 $4,592 $4,592 $4,592 $4,592
59.04 59.04 59.04 59.04 59.04 59.04 59.04 59.04$12,311,202 $12,311,202 $12,311,202 $12,311,202 $12,311,202 $12,311,202 $12,311,202 $12,311,202
10.91 10.91 10.91 10.91 10.91 10.91 10.91 10.91$1,808,836 $1,808,836 $1,808,836 $1,808,836 $1,808,836 $1,808,836 $1,808,836 $1,808,836
0.00 0.00 0.00 0.00 0.00 0.00 0.00 0.00$111 $111 $111 $111 $111 $111 $111 $111
13.24 13.24 13.24 13.24 13.24 13.24 13.24 13.24$2,194,559 $2,194,559 $2,194,559 $2,194,559 $2,194,559 $2,194,559 $2,194,559 $2,194,559
0.15 0.15 0.15 0.15 0.15 0.15 0.15 0.15$59,600 $59,600 $59,600 $59,600 $59,600 $59,600 $59,600 $59,600
14.23 14.23 14.23 14.23 14.23 14.23 14.23 14.23$5,574,503 $5,574,503 $5,574,503 $5,574,503 $5,574,503 $5,574,503 $5,574,503 $5,574,503
2.11 2.11 2.11 2.11 2.11 2.11 2.11 2.11$742,146 $742,146 $742,146 $742,146 $742,146 $742,146 $742,146 $742,146
Economic & Planning Systems, Inc. 2/26/2004 H:\12594gnatcatcher\Report\DEA_Feb2004\EmailTables_Feb2004.xls

Table E-3Off-site Preservation Calculations for Projected Residential Development
Proposed Critical County Preservation Calculations by Year (4)Habitat Unit Projected Acres Acres Average Price per 2003 2004 2005 2006 2007
Developed (2) Preserved Mitigation Acre (3) 1 2 3 4 5
Critical Habitat Unit 1Acres San Diego 0.00 :1 61 0 $19,750 Acres 0.00 0.00 0.00 0.00 0.00Units Annual Cost $0 $0 $0 $0 $0
NPV $0Critical Habitat Unit 2
Acres San Diego 0.00 :1 54 0 $19,750 Acres 0.00 0.00 0.00 0.00 0.00Units Annual Cost $0 $0 $0 $0 $0
NPV $0Critical Habitat Unit 3
Acres San Diego 0.00 :1 179 0 $19,750 Acres 0.00 0.00 0.00 0.00 0.00Units Annual Cost $0 $0 $0 $0 $0
NPV $0Critical Habitat Unit 4
Acres San Diego 0.00 :1 0 0 $19,750 Acres 0.00 0.00 0.00 0.00 0.00Units Annual Cost $0 $0 $0 $0 $0
NPV $0Critical Habitat Unit 5
Acres San Diego 0.00 :1 271 0 $19,750 Acres 0.00 0.00 0.00 0.00 0.00Units Annual Cost $0 $0 $0 $0 $0
NPV $0Critical Habitat Unit 6
Acres Orange 0.00 :1 151 0 $78,333 Acres 0.00 0.00 0.00 0.00 0.00Units Annual Cost $0 $0 $0 $0 $0
Acres San Diego 0.00 :1 0 0 $19,750 Acres 0.00 0.00 0.00 0.00 0.00Units Annual Cost $0 $0 $0 $0 $0
Total NPV $0Critical Habitat Unit 7
Acres Orange 0.00 :1 11 0 $78,333 Acres 0.00 0.00 0.00 0.00 0.00Units Annual Cost $0 $0 $0 $0 $0
NPV $0Critical Habitat Unit 8
Acres Los Angeles 0.00 :1 0 0 $0 Acres 0.00 0.00 0.00 0.00 0.00Units Annual Cost $0 $0 $0 $0 $0
NPV $0Critical Habitat Unit 9
Acres Los Angeles 0.00 :1 55 0 $0 Acres 0.00 0.00 0.00 0.00 0.00Units Annual Cost $0 $0 $0 $0 $0
Acres Orange 0.00 :1 29 0 $78,333 Acres 0.00 0.00 0.00 0.00 0.00Units Annual Cost $0 $0 $0 $0 $0
Acres Riverside 1.22 :1 0 0 $9,500 Acres 0.00 0.00 0.00 0.00 0.00Units Annual Cost $0 $0 $0 $0 $0
Acres San Bernardino 0.00 :1 2 0 $0 Acres 0.00 0.00 0.00 0.00 0.00Units Annual Cost $0 $0 $0 $0 $0
Total NPV $0Critical Habitat Unit 10
Off-site Mitigation Ratio (1)
Projected Residential Development
Economic & Planning Systems, Inc. 2/26/2004 H:\12594gnatcatcher\Report\DEA_Feb2004\EmailTables_Feb2004.xls

Table E-3Off-site Preservation Calculations for Projected Residential Development
Proposed Critical County Preservation Calculations by Year (4)Habitat Unit Projected Acres Acres Average Price per 2003 2004 2005 2006 2007
Developed (2) Preserved Mitigation Acre (3) 1 2 3 4 5
Off-site Mitigation Ratio (1)
Projected Residential Development
Acres Orange 0.00 :1 0 0 $78,333 Acres 0.00 0.00 0.00 0.00 0.00Units Annual Cost $0 $0 $0 $0 $0
Acres Riverside 1.22 :1 1,188 1,453 $9,500 Acres 63.17 63.17 63.17 63.17 63.17Units Annual Cost $600,147 $600,147 $600,147 $600,147 $600,147
Acres San Bernardino 0.00 :1 93 0 $0 Acres 0.00 0.00 0.00 0.00 0.00Units Annual Cost $0 $0 $0 $0 $0
Acres San Diego 0.00 :1 0 0 $19,750 Acres 0.00 0.00 0.00 0.00 0.00Units Annual Cost $0 $0 $0 $0 $0
Total NPV $4,632,192Critical Habitat Unit 11
Acres San Bernardino 0.00 :1 113 0 $0 Acres 0.00 0.00 0.00 0.00 0.00Units Annual Cost $0 $0 $0 $0 $0
NPV $0Critical Habitat Unit 12
Acres Los Angeles 0.00 :1 8 0 $0 Acres 0.00 0.00 0.00 0.00 0.00Units Annual Cost $0 $0 $0 $0 $0
NPV $0Critical Habitat Unit 13
Acres Los Angeles 0.00 :1 744 0 $0 Acres 0.00 0.00 0.00 0.00 0.00Units Annual Cost $0 $0 $0 $0 $0
Acres Ventura 0.00 :1 110 0 $0 Acres 0.00 0.00 0.00 0.00 0.00Units Annual Cost $0 $0 $0 $0 $0
Total NPV $0Total NPV, All Units:
(1) For San Diego and Orange counties, all mitigation above CEQA baseline is assumed to be on-site. The off-site mitigation ratio is therefore assumed to be zero. For the remaining counties, the mitigation ratio is from a review of selected Biological Opinions, as summarized in Table 11 and detailed in Appendix C.
Mitigation ratios in Ventura County were assumed to be the same as in Los Angeles, because no Biological Opinions were provided for projects in Ventura involving the CAGN.
(2) Equal to Projected Growth Acres minus Acres Set-aside (Table E-1)(3) Table 15(4) Assumes projected development is distributed evenly throughout 2025.
$4,632,192
Economic & Planning Systems, Inc. 2/26/2004 H:\12594gnatcatcher\Report\DEA_Feb2004\EmailTables_Feb2004.xls

Table E-3Off-site Preservation Calculations for Projected Residential Development
Proposed Critical CountyHabitat Unit
Critical Habitat Unit 1Acres San DiegoUnits
Critical Habitat Unit 2Acres San DiegoUnits
Critical Habitat Unit 3Acres San DiegoUnits
Critical Habitat Unit 4Acres San DiegoUnits
Critical Habitat Unit 5Acres San DiegoUnits
Critical Habitat Unit 6Acres OrangeUnits
Acres San DiegoUnits
Critical Habitat Unit 7Acres OrangeUnits
Critical Habitat Unit 8Acres Los AngelesUnits
Critical Habitat Unit 9Acres Los AngelesUnits
Acres OrangeUnits
Acres RiversideUnits
Acres San BernardinoUnits
Critical Habitat Unit 10
Preservation Calculations by Year (4)2008 2009 2010 2011 2012 2013 2014 2015 2016 2017 2018
6 7 8 9 10 11 12 13 14 15 16
0.00 0.00 0.00 0.00 0.00 0.00 0.00 0.00 0.00 0.00 0.00$0 $0 $0 $0 $0 $0 $0 $0 $0 $0 $0
0.00 0.00 0.00 0.00 0.00 0.00 0.00 0.00 0.00 0.00 0.00$0 $0 $0 $0 $0 $0 $0 $0 $0 $0 $0
0.00 0.00 0.00 0.00 0.00 0.00 0.00 0.00 0.00 0.00 0.00$0 $0 $0 $0 $0 $0 $0 $0 $0 $0 $0
0.00 0.00 0.00 0.00 0.00 0.00 0.00 0.00 0.00 0.00 0.00$0 $0 $0 $0 $0 $0 $0 $0 $0 $0 $0
0.00 0.00 0.00 0.00 0.00 0.00 0.00 0.00 0.00 0.00 0.00$0 $0 $0 $0 $0 $0 $0 $0 $0 $0 $0
0.00 0.00 0.00 0.00 0.00 0.00 0.00 0.00 0.00 0.00 0.00$0 $0 $0 $0 $0 $0 $0 $0 $0 $0 $0
0.00 0.00 0.00 0.00 0.00 0.00 0.00 0.00 0.00 0.00 0.00$0 $0 $0 $0 $0 $0 $0 $0 $0 $0 $0
0.00 0.00 0.00 0.00 0.00 0.00 0.00 0.00 0.00 0.00 0.00$0 $0 $0 $0 $0 $0 $0 $0 $0 $0 $0
0.00 0.00 0.00 0.00 0.00 0.00 0.00 0.00 0.00 0.00 0.00$0 $0 $0 $0 $0 $0 $0 $0 $0 $0 $0
0.00 0.00 0.00 0.00 0.00 0.00 0.00 0.00 0.00 0.00 0.00$0 $0 $0 $0 $0 $0 $0 $0 $0 $0 $0
0.00 0.00 0.00 0.00 0.00 0.00 0.00 0.00 0.00 0.00 0.00$0 $0 $0 $0 $0 $0 $0 $0 $0 $0 $0
0.00 0.00 0.00 0.00 0.00 0.00 0.00 0.00 0.00 0.00 0.00$0 $0 $0 $0 $0 $0 $0 $0 $0 $0 $0
0.00 0.00 0.00 0.00 0.00 0.00 0.00 0.00 0.00 0.00 0.00$0 $0 $0 $0 $0 $0 $0 $0 $0 $0 $0
Economic & Planning Systems, Inc. 2/26/2004 H:\12594gnatcatcher\Report\DEA_Feb2004\EmailTables_Feb2004.xls

Table E-3Off-site Preservation Calculations for Projected Residential Development
Proposed Critical CountyHabitat Unit
Acres OrangeUnits
Acres RiversideUnits
Acres San BernardinoUnits
Acres San DiegoUnits
Critical Habitat Unit 11Acres San BernardinoUnits
Critical Habitat Unit 12Acres Los AngelesUnits
Critical Habitat Unit 13Acres Los AngelesUnits
Acres VenturaUnits
Total NPV, All Units:
Preservation Calculations by Year (4)2008 2009 2010 2011 2012 2013 2014 2015 2016 2017 2018
6 7 8 9 10 11 12 13 14 15 16
0.00 0.00 0.00 0.00 0.00 0.00 0.00 0.00 0.00 0.00 0.00$0 $0 $0 $0 $0 $0 $0 $0 $0 $0 $0
63.17 63.17 63.17 63.17 63.17 63.17 63.17 63.17 63.17 63.17 63.17$600,147 $600,147 $600,147 $600,147 $600,147 $600,147 $600,147 $600,147 $600,147 $600,147 $600,147
0.00 0.00 0.00 0.00 0.00 0.00 0.00 0.00 0.00 0.00 0.00$0 $0 $0 $0 $0 $0 $0 $0 $0 $0 $0
0.00 0.00 0.00 0.00 0.00 0.00 0.00 0.00 0.00 0.00 0.00$0 $0 $0 $0 $0 $0 $0 $0 $0 $0 $0
0.00 0.00 0.00 0.00 0.00 0.00 0.00 0.00 0.00 0.00 0.00$0 $0 $0 $0 $0 $0 $0 $0 $0 $0 $0
0.00 0.00 0.00 0.00 0.00 0.00 0.00 0.00 0.00 0.00 0.00$0 $0 $0 $0 $0 $0 $0 $0 $0 $0 $0
0.00 0.00 0.00 0.00 0.00 0.00 0.00 0.00 0.00 0.00 0.00$0 $0 $0 $0 $0 $0 $0 $0 $0 $0 $0
0.00 0.00 0.00 0.00 0.00 0.00 0.00 0.00 0.00 0.00 0.00$0 $0 $0 $0 $0 $0 $0 $0 $0 $0 $0
Economic & Planning Systems, Inc. 2/26/2004 H:\12594gnatcatcher\Report\DEA_Feb2004\EmailTables_Feb2004.xls

Table E-3Off-site Preservation Calculations for Projected Residential Development
Proposed Critical CountyHabitat Unit
Critical Habitat Unit 1Acres San DiegoUnits
Critical Habitat Unit 2Acres San DiegoUnits
Critical Habitat Unit 3Acres San DiegoUnits
Critical Habitat Unit 4Acres San DiegoUnits
Critical Habitat Unit 5Acres San DiegoUnits
Critical Habitat Unit 6Acres OrangeUnits
Acres San DiegoUnits
Critical Habitat Unit 7Acres OrangeUnits
Critical Habitat Unit 8Acres Los AngelesUnits
Critical Habitat Unit 9Acres Los AngelesUnits
Acres OrangeUnits
Acres RiversideUnits
Acres San BernardinoUnits
Critical Habitat Unit 10
Preservation Calculations by Year (4)2019 2020 2021 2022 2023 2024 2025
17 18 19 20 21 22 23
0.00 0.00 0.00 0.00 0.00 0.00 0.00$0 $0 $0 $0 $0 $0 $0
0.00 0.00 0.00 0.00 0.00 0.00 0.00$0 $0 $0 $0 $0 $0 $0
0.00 0.00 0.00 0.00 0.00 0.00 0.00$0 $0 $0 $0 $0 $0 $0
0.00 0.00 0.00 0.00 0.00 0.00 0.00$0 $0 $0 $0 $0 $0 $0
0.00 0.00 0.00 0.00 0.00 0.00 0.00$0 $0 $0 $0 $0 $0 $0
0.00 0.00 0.00 0.00 0.00 0.00 0.00$0 $0 $0 $0 $0 $0 $0
0.00 0.00 0.00 0.00 0.00 0.00 0.00$0 $0 $0 $0 $0 $0 $0
0.00 0.00 0.00 0.00 0.00 0.00 0.00$0 $0 $0 $0 $0 $0 $0
0.00 0.00 0.00 0.00 0.00 0.00 0.00$0 $0 $0 $0 $0 $0 $0
0.00 0.00 0.00 0.00 0.00 0.00 0.00$0 $0 $0 $0 $0 $0 $0
0.00 0.00 0.00 0.00 0.00 0.00 0.00$0 $0 $0 $0 $0 $0 $0
0.00 0.00 0.00 0.00 0.00 0.00 0.00$0 $0 $0 $0 $0 $0 $0
0.00 0.00 0.00 0.00 0.00 0.00 0.00$0 $0 $0 $0 $0 $0 $0
Economic & Planning Systems, Inc. 2/26/2004 H:\12594gnatcatcher\Report\DEA_Feb2004\EmailTables_Feb2004.xls

Table E-3Off-site Preservation Calculations for Projected Residential Development
Proposed Critical CountyHabitat Unit
Acres OrangeUnits
Acres RiversideUnits
Acres San BernardinoUnits
Acres San DiegoUnits
Critical Habitat Unit 11Acres San BernardinoUnits
Critical Habitat Unit 12Acres Los AngelesUnits
Critical Habitat Unit 13Acres Los AngelesUnits
Acres VenturaUnits
Total NPV, All Units:
Preservation Calculations by Year (4)2019 2020 2021 2022 2023 2024 2025
17 18 19 20 21 22 23
0.00 0.00 0.00 0.00 0.00 0.00 0.00$0 $0 $0 $0 $0 $0 $0
63.17 63.17 63.17 63.17 63.17 63.17 63.17$600,147 $600,147 $600,147 $600,147 $600,147 $600,147 $600,147
0.00 0.00 0.00 0.00 0.00 0.00 0.00$0 $0 $0 $0 $0 $0 $0
0.00 0.00 0.00 0.00 0.00 0.00 0.00$0 $0 $0 $0 $0 $0 $0
0.00 0.00 0.00 0.00 0.00 0.00 0.00$0 $0 $0 $0 $0 $0 $0
0.00 0.00 0.00 0.00 0.00 0.00 0.00$0 $0 $0 $0 $0 $0 $0
0.00 0.00 0.00 0.00 0.00 0.00 0.00$0 $0 $0 $0 $0 $0 $0
0.00 0.00 0.00 0.00 0.00 0.00 0.00$0 $0 $0 $0 $0 $0 $0
Economic & Planning Systems, Inc. 2/26/2004 H:\12594gnatcatcher\Report\DEA_Feb2004\EmailTables_Feb2004.xls

Table E-4CSS Restoration Calculations for Projected Residential Development
Proposed Critical County Restoration Calculations by Year (4)Habitat Unit Projected Acres Acres Avg. Restoration 2003 2004 2005 2006
Developed (2) Restored Cost per Acre (3) 1 2 3 4
Critical Habitat Unit 1Acres San Diego 0.00 :1 61 0.00 $30,000 Acres 0.00 0.00 0.00 0.00Units Annual Cost $0 $0 $0 $0
NPV $0Critical Habitat Unit 2
Acres San Diego 0.00 :1 54 0.00 $30,000 Acres 0.00 0.00 0.00 0.00Units Annual Cost $0 $0 $0 $0
NPV $0Critical Habitat Unit 3
Acres San Diego 0.00 :1 179 0.00 $30,000 Acres 0.00 0.00 0.00 0.00Units Annual Cost $0 $0 $0 $0
NPV $0Critical Habitat Unit 4
Acres San Diego 0.00 :1 0 0.00 $30,000 Acres 0.00 0.00 0.00 0.00Units Annual Cost $0 $0 $0 $0
NPV $0Critical Habitat Unit 5
Acres San Diego 0.00 :1 271 0.00 $30,000 Acres 0.00 0.00 0.00 0.00Units Annual Cost $0 $0 $0 $0
NPV $0Critical Habitat Unit 6
Acres Orange 0.00 :1 151 0.00 $30,000 Acres 0.00 0.00 0.00 0.00Units Annual Cost $0 $0 $0 $0
Acres San Diego 0.00 :1 0 0.00 $30,000 Acres 0.00 0.00 0.00 0.00Units Annual Cost $0 $0 $0 $0
Total NPV $0Critical Habitat Unit 7
Acres Orange 0.00 :1 11 0.00 $30,000 Acres 0.00 0.00 0.00 0.00Units Annual Cost $0 $0 $0 $0
NPV $0Critical Habitat Unit 8
Acres Los Angeles 0.93 :1 0 0.00 $30,000 Acres 0.00 0.00 0.00 0.00Units Annual Cost $0 $0 $0 $0
NPV $0Critical Habitat Unit 9
Acres Los Angeles 0.93 :1 55 51.43 $30,000 Acres 2.24 2.24 2.24 2.24Units Annual Cost $67,083 $67,083 $67,083 $67,083
Acres Orange 0.00 :1 29 0.00 $30,000 Acres 0.00 0.00 0.00 0.00Units Annual Cost $0 $0 $0 $0
Acres Riverside 0.00 :1 2 0.00 $30,000 Acres 0.00 0.00 0.00 0.00Units Annual Cost $0 $0 $0 $0
Acres San Bernardino 0.40 :1 2 0.78 $30,000 Acres 0.03 0.03 0.03 0.03Units Annual Cost $1,019 $1,019 $1,019 $1,019
RestorationMitigation Ratio (1)
Projected Residential Development
Economic & Planning Systems, Inc. 2/26/2004 H:\12594gnatcatcher\Report\DEA_Feb2004\EmailTables_Feb2004.xls

Table E-4CSS Restoration Calculations for Projected Residential Development
Proposed Critical County Restoration Calculations by Year (4)Habitat Unit Projected Acres Acres Avg. Restoration 2003 2004 2005 2006
Developed (2) Restored Cost per Acre (3) 1 2 3 4
RestorationMitigation Ratio (1)
Projected Residential Development
Total NPV $525,647Critical Habitat Unit 10
Acres Orange 0.00 :1 0 0.00 $30,000 Acres 0.00 0.00 0.00 0.00Units Annual Cost $0 $0 $0 $0
Acres Riverside 0.00 :1 1,188 0.00 $30,000 Acres 0.00 0.00 0.00 0.00Units Annual Cost $0 $0 $0 $0
Acres San Bernardino 0.40 :1 93 37.18 $30,000 Acres 1.62 1.62 1.62 1.62Units Annual Cost $48,499 $48,499 $48,499 $48,499
Acres San Diego 0.00 :1 0 0.00 $30,000 Acres 0.00 0.00 0.00 0.00Units Annual Cost $0 $0 $0 $0
Total NPV $374,338Critical Habitat Unit 11
Acres San Bernardino 0.40 :1 113 45.11 $30,000 Acres 1.96 1.96 1.96 1.96Units Annual Cost $58,841 $58,841 $58,841 $58,841
NPV $454,163Critical Habitat Unit 12
Acres Los Angeles 0.93 :1 8 7.40 $30,000 Acres 0.32 0.32 0.32 0.32Units Annual Cost $9,649 $9,649 $9,649 $9,649
NPV $74,475Critical Habitat Unit 13
Acres Los Angeles 0.93 :1 744 691.91 $30,000 Acres 30.08 30.08 30.08 30.08Units Annual Cost $902,490 $902,490 $902,490 $902,490
Acres Ventura 0.93 :1 110 102.66 $30,000 Acres 4.46 4.46 4.46 4.46Units Annual Cost $133,908 $133,908 $133,908 $133,908
Total NPV $7,999,371Total NPV, All Units:
(1) Based on review of selected Biological Opinions, as summarized in Table 11 and detailed in Appendix C. Mitigation ratios is Ventura County were assumed to be the same as in Los Angeles, because no Biological Opinions were provided for
projects in Ventura involving the CAGN.(2) Equal to Projected Growth Acres minus Acres Set-aside (Table E-1)(3) Table 15(4) Assumes projected development is distributed evenly throughout 2025.
$9,427,994
Economic & Planning Systems, Inc. 2/26/2004 H:\12594gnatcatcher\Report\DEA_Feb2004\EmailTables_Feb2004.xls

Table E-4CSS Restoration Calculations for Projected Residential Development
Proposed Critical CountyHabitat Unit
Critical Habitat Unit 1Acres San DiegoUnits
Critical Habitat Unit 2Acres San DiegoUnits
Critical Habitat Unit 3Acres San DiegoUnits
Critical Habitat Unit 4Acres San DiegoUnits
Critical Habitat Unit 5Acres San DiegoUnits
Critical Habitat Unit 6Acres OrangeUnits
Acres San DiegoUnits
Critical Habitat Unit 7Acres OrangeUnits
Critical Habitat Unit 8Acres Los AngelesUnits
Critical Habitat Unit 9Acres Los AngelesUnits
Acres OrangeUnits
Acres RiversideUnits
Acres San BernardinoUnits
Restoration Calculations by Year (4)2007 2008 2009 2010 2011 2012 2013 2014 2015 2016
5 6 7 8 9 10 11 12 13 14
0.00 0.00 0.00 0.00 0.00 0.00 0.00 0.00 0.00 0.00$0 $0 $0 $0 $0 $0 $0 $0 $0 $0
0.00 0.00 0.00 0.00 0.00 0.00 0.00 0.00 0.00 0.00$0 $0 $0 $0 $0 $0 $0 $0 $0 $0
0.00 0.00 0.00 0.00 0.00 0.00 0.00 0.00 0.00 0.00$0 $0 $0 $0 $0 $0 $0 $0 $0 $0
0.00 0.00 0.00 0.00 0.00 0.00 0.00 0.00 0.00 0.00$0 $0 $0 $0 $0 $0 $0 $0 $0 $0
0.00 0.00 0.00 0.00 0.00 0.00 0.00 0.00 0.00 0.00$0 $0 $0 $0 $0 $0 $0 $0 $0 $0
0.00 0.00 0.00 0.00 0.00 0.00 0.00 0.00 0.00 0.00$0 $0 $0 $0 $0 $0 $0 $0 $0 $0
0.00 0.00 0.00 0.00 0.00 0.00 0.00 0.00 0.00 0.00$0 $0 $0 $0 $0 $0 $0 $0 $0 $0
0.00 0.00 0.00 0.00 0.00 0.00 0.00 0.00 0.00 0.00$0 $0 $0 $0 $0 $0 $0 $0 $0 $0
0.00 0.00 0.00 0.00 0.00 0.00 0.00 0.00 0.00 0.00$0 $0 $0 $0 $0 $0 $0 $0 $0 $0
2.24 2.24 2.24 2.24 2.24 2.24 2.24 2.24 2.24 2.24$67,083 $67,083 $67,083 $67,083 $67,083 $67,083 $67,083 $67,083 $67,083 $67,083
0.00 0.00 0.00 0.00 0.00 0.00 0.00 0.00 0.00 0.00$0 $0 $0 $0 $0 $0 $0 $0 $0 $0
0.00 0.00 0.00 0.00 0.00 0.00 0.00 0.00 0.00 0.00$0 $0 $0 $0 $0 $0 $0 $0 $0 $0
0.03 0.03 0.03 0.03 0.03 0.03 0.03 0.03 0.03 0.03$1,019 $1,019 $1,019 $1,019 $1,019 $1,019 $1,019 $1,019 $1,019 $1,019
Economic & Planning Systems, Inc. 2/26/2004 H:\12594gnatcatcher\Report\DEA_Feb2004\EmailTables_Feb2004.xls

Table E-4CSS Restoration Calculations for Projected Residential Development
Proposed Critical CountyHabitat Unit
Critical Habitat Unit 10Acres OrangeUnits
Acres RiversideUnits
Acres San BernardinoUnits
Acres San DiegoUnits
Critical Habitat Unit 11Acres San BernardinoUnits
Critical Habitat Unit 12Acres Los AngelesUnits
Critical Habitat Unit 13Acres Los AngelesUnits
Acres VenturaUnits
Total NPV, All Units:
Restoration Calculations by Year (4)2007 2008 2009 2010 2011 2012 2013 2014 2015 2016
5 6 7 8 9 10 11 12 13 14
0.00 0.00 0.00 0.00 0.00 0.00 0.00 0.00 0.00 0.00$0 $0 $0 $0 $0 $0 $0 $0 $0 $0
0.00 0.00 0.00 0.00 0.00 0.00 0.00 0.00 0.00 0.00$0 $0 $0 $0 $0 $0 $0 $0 $0 $0
1.62 1.62 1.62 1.62 1.62 1.62 1.62 1.62 1.62 1.62$48,499 $48,499 $48,499 $48,499 $48,499 $48,499 $48,499 $48,499 $48,499 $48,499
0.00 0.00 0.00 0.00 0.00 0.00 0.00 0.00 0.00 0.00$0 $0 $0 $0 $0 $0 $0 $0 $0 $0
1.96 1.96 1.96 1.96 1.96 1.96 1.96 1.96 1.96 1.96$58,841 $58,841 $58,841 $58,841 $58,841 $58,841 $58,841 $58,841 $58,841 $58,841
0.32 0.32 0.32 0.32 0.32 0.32 0.32 0.32 0.32 0.32$9,649 $9,649 $9,649 $9,649 $9,649 $9,649 $9,649 $9,649 $9,649 $9,649
30.08 30.08 30.08 30.08 30.08 30.08 30.08 30.08 30.08 30.08$902,490 $902,490 $902,490 $902,490 $902,490 $902,490 $902,490 $902,490 $902,490 $902,490
4.46 4.46 4.46 4.46 4.46 4.46 4.46 4.46 4.46 4.46$133,908 $133,908 $133,908 $133,908 $133,908 $133,908 $133,908 $133,908 $133,908 $133,908
Economic & Planning Systems, Inc. 2/26/2004 H:\12594gnatcatcher\Report\DEA_Feb2004\EmailTables_Feb2004.xls

Table E-4CSS Restoration Calculations for Projected Residential Development
Proposed Critical CountyHabitat Unit
Critical Habitat Unit 1Acres San DiegoUnits
Critical Habitat Unit 2Acres San DiegoUnits
Critical Habitat Unit 3Acres San DiegoUnits
Critical Habitat Unit 4Acres San DiegoUnits
Critical Habitat Unit 5Acres San DiegoUnits
Critical Habitat Unit 6Acres OrangeUnits
Acres San DiegoUnits
Critical Habitat Unit 7Acres OrangeUnits
Critical Habitat Unit 8Acres Los AngelesUnits
Critical Habitat Unit 9Acres Los AngelesUnits
Acres OrangeUnits
Acres RiversideUnits
Acres San BernardinoUnits
Restoration Calculations by Year (4)2017 2018 2019 2020 2021 2022 2023 2024 2025
15 16 17 18 19 20 21 22 23
0.00 0.00 0.00 0.00 0.00 0.00 0.00 0.00 0.00$0 $0 $0 $0 $0 $0 $0 $0 $0
0.00 0.00 0.00 0.00 0.00 0.00 0.00 0.00 0.00$0 $0 $0 $0 $0 $0 $0 $0 $0
0.00 0.00 0.00 0.00 0.00 0.00 0.00 0.00 0.00$0 $0 $0 $0 $0 $0 $0 $0 $0
0.00 0.00 0.00 0.00 0.00 0.00 0.00 0.00 0.00$0 $0 $0 $0 $0 $0 $0 $0 $0
0.00 0.00 0.00 0.00 0.00 0.00 0.00 0.00 0.00$0 $0 $0 $0 $0 $0 $0 $0 $0
0.00 0.00 0.00 0.00 0.00 0.00 0.00 0.00 0.00$0 $0 $0 $0 $0 $0 $0 $0 $0
0.00 0.00 0.00 0.00 0.00 0.00 0.00 0.00 0.00$0 $0 $0 $0 $0 $0 $0 $0 $0
0.00 0.00 0.00 0.00 0.00 0.00 0.00 0.00 0.00$0 $0 $0 $0 $0 $0 $0 $0 $0
0.00 0.00 0.00 0.00 0.00 0.00 0.00 0.00 0.00$0 $0 $0 $0 $0 $0 $0 $0 $0
2.24 2.24 2.24 2.24 2.24 2.24 2.24 2.24 2.24$67,083 $67,083 $67,083 $67,083 $67,083 $67,083 $67,083 $67,083 $67,083
0.00 0.00 0.00 0.00 0.00 0.00 0.00 0.00 0.00$0 $0 $0 $0 $0 $0 $0 $0 $0
0.00 0.00 0.00 0.00 0.00 0.00 0.00 0.00 0.00$0 $0 $0 $0 $0 $0 $0 $0 $0
0.03 0.03 0.03 0.03 0.03 0.03 0.03 0.03 0.03$1,019 $1,019 $1,019 $1,019 $1,019 $1,019 $1,019 $1,019 $1,019
Economic & Planning Systems, Inc. 2/26/2004 H:\12594gnatcatcher\Report\DEA_Feb2004\EmailTables_Feb2004.xls

Table E-4CSS Restoration Calculations for Projected Residential Development
Proposed Critical CountyHabitat Unit
Critical Habitat Unit 10Acres OrangeUnits
Acres RiversideUnits
Acres San BernardinoUnits
Acres San DiegoUnits
Critical Habitat Unit 11Acres San BernardinoUnits
Critical Habitat Unit 12Acres Los AngelesUnits
Critical Habitat Unit 13Acres Los AngelesUnits
Acres VenturaUnits
Total NPV, All Units:
Restoration Calculations by Year (4)2017 2018 2019 2020 2021 2022 2023 2024 2025
15 16 17 18 19 20 21 22 23
0.00 0.00 0.00 0.00 0.00 0.00 0.00 0.00 0.00$0 $0 $0 $0 $0 $0 $0 $0 $0
0.00 0.00 0.00 0.00 0.00 0.00 0.00 0.00 0.00$0 $0 $0 $0 $0 $0 $0 $0 $0
1.62 1.62 1.62 1.62 1.62 1.62 1.62 1.62 1.62$48,499 $48,499 $48,499 $48,499 $48,499 $48,499 $48,499 $48,499 $48,499
0.00 0.00 0.00 0.00 0.00 0.00 0.00 0.00 0.00$0 $0 $0 $0 $0 $0 $0 $0 $0
1.96 1.96 1.96 1.96 1.96 1.96 1.96 1.96 1.96$58,841 $58,841 $58,841 $58,841 $58,841 $58,841 $58,841 $58,841 $58,841
0.32 0.32 0.32 0.32 0.32 0.32 0.32 0.32 0.32$9,649 $9,649 $9,649 $9,649 $9,649 $9,649 $9,649 $9,649 $9,649
30.08 30.08 30.08 30.08 30.08 30.08 30.08 30.08 30.08$902,490 $902,490 $902,490 $902,490 $902,490 $902,490 $902,490 $902,490 $902,490
4.46 4.46 4.46 4.46 4.46 4.46 4.46 4.46 4.46$133,908 $133,908 $133,908 $133,908 $133,908 $133,908 $133,908 $133,908 $133,908
Economic & Planning Systems, Inc. 2/26/2004 H:\12594gnatcatcher\Report\DEA_Feb2004\EmailTables_Feb2004.xls

Table E-5On-site Set-aside Calculations for Projected Commercial Development
Proposed Critical County Set-Aside Calculations by Year (4)Habitat Unit Projected Acres Per-acre Residual Acres Acres Per-acre Residual 2003 2004
Growth Acres (2) Set-aside Land Value (3) Impacted (2) Set-aside Land Value (3) 1 2
Critical Habitat Unit 1Acres San Diego 0.06 :1 0 0 $237,374 5 0 $56,628 Acres 0.01 0.01Units Annual Cost $774 $774
NPV $5,970Critical Habitat Unit 2
Acres San Diego 0.06 :1 0 0 $237,374 0 0 $56,628 Acres 0.00 0.00Units Annual Cost $17 $17
NPV $131Critical Habitat Unit 3
Acres San Diego 0.06 :1 1 0 $237,374 15 1 $56,628 Acres 0.04 0.04Units Annual Cost $2,771 $2,771
NPV $21,389Critical Habitat Unit 4
Acres San Diego 0.06 :1 0 0 $237,374 0 0 $56,628 Acres 0.00 0.00Units Annual Cost $2 $2
NPV $19Critical Habitat Unit 5
Acres San Diego 0.06 :1 0 0 $237,374 2 0 $56,628 Acres 0.01 0.01Units Annual Cost $292 $292
NPV $2,254Critical Habitat Unit 6
Acres Orange 1.82 :1 0 0 $268,330 0 0 $51,227 Acres 0.00 0.00Units Annual Cost $0 $0
Acres San Diego 0.06 :1 0 0 $237,374 0 0 $56,628 Acres 0.00 0.00Units Annual Cost $0 $0
Total NPV $0Critical Habitat Unit 7
Acres Orange 1.82 :1 16 10 $268,330 48 31 $51,227 Acres 1.77 1.77Units Annual Cost $185,758 $185,758
NPV $1,433,758Critical Habitat Unit 8
Acres Los Angeles 0.44 :1 0 0 $235,608 0 0 $37,838 Acres 0.00 0.00Units Annual Cost $0 $0
NPV $0Critical Habitat Unit 9
Acres Los Angeles 0.44 :1 171 52 $235,608 104 32 $37,838 Acres 3.66 3.66Units Annual Cost $588,268 $588,268
Acres Orange 1.82 :1 206 133 $268,330 139 90 $51,227 Acres 9.68 9.68Units Annual Cost $1,748,819 $1,748,819
Acres Riverside 1.14 :1 0 0 $152,460 0 0 $35,719 Acres 0.01 0.01Units Annual Cost $1,369 $1,369
Acres San Bernardino 2.70 :1 24 17 $152,460 16 12 $35,719 Acres 1.26 1.26Units Annual Cost $133,278 $133,278
Total NPV $19,077,909
Projected Industrial Development
Ratio (1)
On-site Mitigation
Projected Office Development
Economic & Planning Systems, Inc. 2/26/2004 H:\12594gnatcatcher\Report\DEA_Feb2004\EmailTables_Feb2004.xls

Table E-5On-site Set-aside Calculations for Projected Commercial Development
Proposed Critical County Set-Aside Calculations by Year (4)Habitat Unit Projected Acres Per-acre Residual Acres Acres Per-acre Residual 2003 2004
Growth Acres (2) Set-aside Land Value (3) Impacted (2) Set-aside Land Value (3) 1 2
Projected Industrial Development
Ratio (1)
On-site Mitigation
Projected Office Development
Critical Habitat Unit 10Acres Orange 1.82 :1 1 0 $268,330 0 0 $51,227 Acres 0.03 0.03Units Annual Cost $5,808 $5,808
Acres Riverside 1.14 :1 5,754 3,069 $152,460 3,467 1,850 $35,719 Acres 213.88 213.88Units Annual Cost $23,219,256 $23,219,256
Acres San Bernardino 2.70 :1 19 14 $152,460 21 16 $35,719 Acres 1.29 1.29Units Annual Cost $117,515 $117,515
Acres San Diego 0.06 :1 0 0 $237,374 0 0 $56,628 Acres 0.00 0.00Units Annual Cost $0 $0
Total NPV $180,168,151Critical Habitat Unit 11
Acres San Bernardino 2.70 :1 1,195 872 $152,460 797 582 $35,719 Acres 63.21 63.21Units Annual Cost $6,682,889 $6,682,889
NPV $51,581,437Critical Habitat Unit 12
Acres Los Angeles 0.44 :1 66 20 $235,608 40 12 $37,838 Acres 1.41 1.41Units Annual Cost $227,597 $227,597
NPV $1,756,691Critical Habitat Unit 13
Acres Los Angeles 0.44 :1 1,260 385 $235,608 748 229 $37,838 Acres 26.68 26.68Units Annual Cost $4,320,610 $4,320,610
Acres Ventura 0.44 :1 1,134 346 $213,444 658 201 $59,869 Acres 23.81 23.81Units Annual Cost $3,738,432 $3,738,432
Total NPV $62,203,177Total NPV, All Units $316,250,887
(1) For San Diego and Orange counties, the Effective Mitigation Ratio is the County-specific on-site mitigation ratio summarized in Table 11 minus an assumed CEQA mitigation ratio of 2-to-1. For all other counties, the Effective Mitigation Ratio is the ratio reported in Table 11. Mitigation ratios is Ventura County were assumed to be the same as in Los Angeles, because no Biological Opinions were provided for projects in Ventura involving the CAGN.Ventura involving the CAGN.(2) Table E-1(3) Table D-1(4) Assumes projected development is distributed evenly throughout 2025.
Economic & Planning Systems, Inc. 2/26/2004 H:\12594gnatcatcher\Report\DEA_Feb2004\EmailTables_Feb2004.xls

Table E-5On-site Set-aside Calculations for Projected Commercial Development
Proposed Critical CountyHabitat Unit
Critical Habitat Unit 1Acres San DiegoUnits
Critical Habitat Unit 2Acres San DiegoUnits
Critical Habitat Unit 3Acres San DiegoUnits
Critical Habitat Unit 4Acres San DiegoUnits
Critical Habitat Unit 5Acres San DiegoUnits
Critical Habitat Unit 6Acres OrangeUnits
Acres San DiegoUnits
Critical Habitat Unit 7Acres OrangeUnits
Critical Habitat Unit 8Acres Los AngelesUnits
Critical Habitat Unit 9Acres Los AngelesUnits
Acres OrangeUnits
Acres RiversideUnits
Acres San BernardinoUnits
Set-Aside Calculations by Year (4)2005 2006 2007 2008 2009 2010 2011 2012 2013 2014 2015 2016
3 4 5 6 7 8 9 10 11 12 13 14
0.01 0.01 0.01 0.01 0.01 0.01 0.01 0.01 0.01 0.01 0.01 0.01$774 $774 $774 $774 $774 $774 $774 $774 $774 $774 $774 $774
0.00 0.00 0.00 0.00 0.00 0.00 0.00 0.00 0.00 0.00 0.00 0.00$17 $17 $17 $17 $17 $17 $17 $17 $17 $17 $17 $17
0.04 0.04 0.04 0.04 0.04 0.04 0.04 0.04 0.04 0.04 0.04 0.04$2,771 $2,771 $2,771 $2,771 $2,771 $2,771 $2,771 $2,771 $2,771 $2,771 $2,771 $2,771
0.00 0.00 0.00 0.00 0.00 0.00 0.00 0.00 0.00 0.00 0.00 0.00$2 $2 $2 $2 $2 $2 $2 $2 $2 $2 $2 $2
0.01 0.01 0.01 0.01 0.01 0.01 0.01 0.01 0.01 0.01 0.01 0.01$292 $292 $292 $292 $292 $292 $292 $292 $292 $292 $292 $292
0.00 0.00 0.00 0.00 0.00 0.00 0.00 0.00 0.00 0.00 0.00 0.00$0 $0 $0 $0 $0 $0 $0 $0 $0 $0 $0 $0
0.00 0.00 0.00 0.00 0.00 0.00 0.00 0.00 0.00 0.00 0.00 0.00$0 $0 $0 $0 $0 $0 $0 $0 $0 $0 $0 $0
1.77 1.77 1.77 1.77 1.77 1.77 1.77 1.77 1.77 1.77 1.77 1.77$185,758 $185,758 $185,758 $185,758 $185,758 $185,758 $185,758 $185,758 $185,758 $185,758 $185,758 $185,758
0.00 0.00 0.00 0.00 0.00 0.00 0.00 0.00 0.00 0.00 0.00 0.00$0 $0 $0 $0 $0 $0 $0 $0 $0 $0 $0 $0
3.66 3.66 3.66 3.66 3.66 3.66 3.66 3.66 3.66 3.66 3.66 3.66$588,268 $588,268 $588,268 $588,268 $588,268 $588,268 $588,268 $588,268 $588,268 $588,268 $588,268 $588,268
9.68 9.68 9.68 9.68 9.68 9.68 9.68 9.68 9.68 9.68 9.68 9.68$1,748,819 $1,748,819 $1,748,819 $1,748,819 $1,748,819 $1,748,819 $1,748,819 $1,748,819 $1,748,819 $1,748,819 $1,748,819 $1,748,819
0.01 0.01 0.01 0.01 0.01 0.01 0.01 0.01 0.01 0.01 0.01 0.01$1,369 $1,369 $1,369 $1,369 $1,369 $1,369 $1,369 $1,369 $1,369 $1,369 $1,369 $1,369
1.26 1.26 1.26 1.26 1.26 1.26 1.26 1.26 1.26 1.26 1.26 1.26$133,278 $133,278 $133,278 $133,278 $133,278 $133,278 $133,278 $133,278 $133,278 $133,278 $133,278 $133,278
Economic & Planning Systems, Inc. 2/26/2004 H:\12594gnatcatcher\Report\DEA_Feb2004\EmailTables_Feb2004.xls

Table E-5On-site Set-aside Calculations for Projected Commercial Development
Proposed Critical CountyHabitat Unit
Critical Habitat Unit 10Acres OrangeUnits
Acres RiversideUnits
Acres San BernardinoUnits
Acres San DiegoUnits
Critical Habitat Unit 11Acres San BernardinoUnits
Critical Habitat Unit 12Acres Los AngelesUnits
Critical Habitat Unit 13Acres Los AngelesUnits
Acres VenturaUnits
Total NPV, All Units $316,250,887
Set-Aside Calculations by Year (4)2005 2006 2007 2008 2009 2010 2011 2012 2013 2014 2015 2016
3 4 5 6 7 8 9 10 11 12 13 14
0.03 0.03 0.03 0.03 0.03 0.03 0.03 0.03 0.03 0.03 0.03 0.03$5,808 $5,808 $5,808 $5,808 $5,808 $5,808 $5,808 $5,808 $5,808 $5,808 $5,808 $5,808
213.88 213.88 213.88 213.88 213.88 213.88 213.88 213.88 213.88 213.88 213.88 213.88$23,219,256 $23,219,256 $23,219,256 $23,219,256 $23,219,256 $23,219,256 $23,219,256 $23,219,256 $23,219,256 $23,219,256 $23,219,256 $23,219,256
1.29 1.29 1.29 1.29 1.29 1.29 1.29 1.29 1.29 1.29 1.29 1.29$117,515 $117,515 $117,515 $117,515 $117,515 $117,515 $117,515 $117,515 $117,515 $117,515 $117,515 $117,515
0.00 0.00 0.00 0.00 0.00 0.00 0.00 0.00 0.00 0.00 0.00 0.00$0 $0 $0 $0 $0 $0 $0 $0 $0 $0 $0 $0
63.21 63.21 63.21 63.21 63.21 63.21 63.21 63.21 63.21 63.21 63.21 63.21$6,682,889 $6,682,889 $6,682,889 $6,682,889 $6,682,889 $6,682,889 $6,682,889 $6,682,889 $6,682,889 $6,682,889 $6,682,889 $6,682,889
1.41 1.41 1.41 1.41 1.41 1.41 1.41 1.41 1.41 1.41 1.41 1.41$227,597 $227,597 $227,597 $227,597 $227,597 $227,597 $227,597 $227,597 $227,597 $227,597 $227,597 $227,597
26.68 26.68 26.68 26.68 26.68 26.68 26.68 26.68 26.68 26.68 26.68 26.68$4,320,610 $4,320,610 $4,320,610 $4,320,610 $4,320,610 $4,320,610 $4,320,610 $4,320,610 $4,320,610 $4,320,610 $4,320,610 $4,320,610
23.81 23.81 23.81 23.81 23.81 23.81 23.81 23.81 23.81 23.81 23.81 23.81$3,738,432 $3,738,432 $3,738,432 $3,738,432 $3,738,432 $3,738,432 $3,738,432 $3,738,432 $3,738,432 $3,738,432 $3,738,432 $3,738,432
Economic & Planning Systems, Inc. 2/26/2004 H:\12594gnatcatcher\Report\DEA_Feb2004\EmailTables_Feb2004.xls

Table E-5On-site Set-aside Calculations for Projected Commercial Development
Proposed Critical CountyHabitat Unit
Critical Habitat Unit 1Acres San DiegoUnits
Critical Habitat Unit 2Acres San DiegoUnits
Critical Habitat Unit 3Acres San DiegoUnits
Critical Habitat Unit 4Acres San DiegoUnits
Critical Habitat Unit 5Acres San DiegoUnits
Critical Habitat Unit 6Acres OrangeUnits
Acres San DiegoUnits
Critical Habitat Unit 7Acres OrangeUnits
Critical Habitat Unit 8Acres Los AngelesUnits
Critical Habitat Unit 9Acres Los AngelesUnits
Acres OrangeUnits
Acres RiversideUnits
Acres San BernardinoUnits
Set-Aside Calculations by Year (4)2017 2018 2019 2020 2021 2022 2023 2024 2025
15 16 17 18 19 20 21 22 23
0.01 0.01 0.01 0.01 0.01 0.01 0.01 0.01 0.01$774 $774 $774 $774 $774 $774 $774 $774 $774
0.00 0.00 0.00 0.00 0.00 0.00 0.00 0.00 0.00$17 $17 $17 $17 $17 $17 $17 $17 $17
0.04 0.04 0.04 0.04 0.04 0.04 0.04 0.04 0.04$2,771 $2,771 $2,771 $2,771 $2,771 $2,771 $2,771 $2,771 $2,771
0.00 0.00 0.00 0.00 0.00 0.00 0.00 0.00 0.00$2 $2 $2 $2 $2 $2 $2 $2 $2
0.01 0.01 0.01 0.01 0.01 0.01 0.01 0.01 0.01$292 $292 $292 $292 $292 $292 $292 $292 $292
0.00 0.00 0.00 0.00 0.00 0.00 0.00 0.00 0.00$0 $0 $0 $0 $0 $0 $0 $0 $0
0.00 0.00 0.00 0.00 0.00 0.00 0.00 0.00 0.00$0 $0 $0 $0 $0 $0 $0 $0 $0
1.77 1.77 1.77 1.77 1.77 1.77 1.77 1.77 1.77$185,758 $185,758 $185,758 $185,758 $185,758 $185,758 $185,758 $185,758 $185,758
0.00 0.00 0.00 0.00 0.00 0.00 0.00 0.00 0.00$0 $0 $0 $0 $0 $0 $0 $0 $0
3.66 3.66 3.66 3.66 3.66 3.66 3.66 3.66 3.66$588,268 $588,268 $588,268 $588,268 $588,268 $588,268 $588,268 $588,268 $588,268
9.68 9.68 9.68 9.68 9.68 9.68 9.68 9.68 9.68$1,748,819 $1,748,819 $1,748,819 $1,748,819 $1,748,819 $1,748,819 $1,748,819 $1,748,819 $1,748,819
0.01 0.01 0.01 0.01 0.01 0.01 0.01 0.01 0.01$1,369 $1,369 $1,369 $1,369 $1,369 $1,369 $1,369 $1,369 $1,369
1.26 1.26 1.26 1.26 1.26 1.26 1.26 1.26 1.26$133,278 $133,278 $133,278 $133,278 $133,278 $133,278 $133,278 $133,278 $133,278
Economic & Planning Systems, Inc. 2/26/2004 H:\12594gnatcatcher\Report\DEA_Feb2004\EmailTables_Feb2004.xls

Table E-5On-site Set-aside Calculations for Projected Commercial Development
Proposed Critical CountyHabitat Unit
Critical Habitat Unit 10Acres OrangeUnits
Acres RiversideUnits
Acres San BernardinoUnits
Acres San DiegoUnits
Critical Habitat Unit 11Acres San BernardinoUnits
Critical Habitat Unit 12Acres Los AngelesUnits
Critical Habitat Unit 13Acres Los AngelesUnits
Acres VenturaUnits
Total NPV, All Units $316,250,887
Set-Aside Calculations by Year (4)2017 2018 2019 2020 2021 2022 2023 2024 2025
15 16 17 18 19 20 21 22 23
0.03 0.03 0.03 0.03 0.03 0.03 0.03 0.03 0.03$5,808 $5,808 $5,808 $5,808 $5,808 $5,808 $5,808 $5,808 $5,808
213.88 213.88 213.88 213.88 213.88 213.88 213.88 213.88 213.88$23,219,256 $23,219,256 $23,219,256 $23,219,256 $23,219,256 $23,219,256 $23,219,256 $23,219,256 $23,219,256
1.29 1.29 1.29 1.29 1.29 1.29 1.29 1.29 1.29$117,515 $117,515 $117,515 $117,515 $117,515 $117,515 $117,515 $117,515 $117,515
0.00 0.00 0.00 0.00 0.00 0.00 0.00 0.00 0.00$0 $0 $0 $0 $0 $0 $0 $0 $0
63.21 63.21 63.21 63.21 63.21 63.21 63.21 63.21 63.21$6,682,889 $6,682,889 $6,682,889 $6,682,889 $6,682,889 $6,682,889 $6,682,889 $6,682,889 $6,682,889
1.41 1.41 1.41 1.41 1.41 1.41 1.41 1.41 1.41$227,597 $227,597 $227,597 $227,597 $227,597 $227,597 $227,597 $227,597 $227,597
26.68 26.68 26.68 26.68 26.68 26.68 26.68 26.68 26.68$4,320,610 $4,320,610 $4,320,610 $4,320,610 $4,320,610 $4,320,610 $4,320,610 $4,320,610 $4,320,610
23.81 23.81 23.81 23.81 23.81 23.81 23.81 23.81 23.81$3,738,432 $3,738,432 $3,738,432 $3,738,432 $3,738,432 $3,738,432 $3,738,432 $3,738,432 $3,738,432
Economic & Planning Systems, Inc. 2/26/2004 H:\12594gnatcatcher\Report\DEA_Feb2004\EmailTables_Feb2004.xls

Table E-6Off-site Preservation Calculations for Projected Commercial Development
Proposed Critical County Preservation Calculations by Year (4)Habitat Unit Projected Acres Acres Average Price per Projected Acres Acres Per-acre Residual 2003 2004
Developed (2) Preserved Mitigation Acre (3) Developed (2) Preserved Land Value (3) 1 2
Critical Habitat Unit 1Acres San Diego 0.00 :1 0 0 $19,750 5 0 $56,628 Acres 0.00 0.00Units Annual Cost $0 $0
NPV $0Critical Habitat Unit 2
Acres San Diego 0.00 :1 0 0 $19,750 0 0 $56,628 Acres 0.00 0.00Units Annual Cost $0 $0
NPV $0Critical Habitat Unit 3
Acres San Diego 0.00 :1 1 0 $19,750 14 0 $56,628 Acres 0.00 0.00Units Annual Cost $0 $0
NPV $0Critical Habitat Unit 4
Acres San Diego 0.00 :1 0 0 $19,750 0 0 $56,628 Acres 0.00 0.00Units Annual Cost $0 $0
NPV $0Critical Habitat Unit 5
Acres San Diego 0.00 :1 0 0 $19,750 2 0 $56,628 Acres 0.00 0.00Units Annual Cost $0 $0
NPV $0Critical Habitat Unit 6
Acres Orange 0.00 :1 0 0 $78,333 0 0 $51,227 Acres 0.00 0.00Units Annual Cost $0 $0
Acres San Diego 0.00 :1 0 0 $19,750 0 0 $56,628 Acres 0.00 0.00Units Annual Cost $0 $0
Total NPV $0Critical Habitat Unit 7
Acres Orange 0.00 :1 6 0 $78,333 17 0 $51,227 Acres 0.00 0.00Units Annual Cost $0 $0
NPV $0Critical Habitat Unit 8
Acres Los Angeles 0.00 :1 0 0 $0 0 0 $37,838 Acres 0.00 0.00Units Annual Cost $0 $0
NPV $0Critical Habitat Unit 9
Acres Los Angeles 0.00 :1 119 0 $0 72 0 $37,838 Acres 0.00 0.00Units Annual Cost $0 $0
Acres Orange 0.00 :1 73 0 $78,333 49 0 $51,227 Acres 0.00 0.00Units Annual Cost $0 $0
Acres Riverside 1.22 :1 0 0 $9,500 0 0 $35,719 Acres 0.01 0.01Units Annual Cost $261 $261
Acres San Bernardino 0.00 :1 6 0 $0 4 0 $35,719 Acres 0.00 0.00Units Annual Cost $0 $0
Total NPV $2,016
Projected Office Development Projected Industrial Development
Ratio (1)
Off-site Mitigation
Economic & Planning Systems, Inc. 2/26/2004 H:\12594gnatcatcher\Report\DEA_Feb2004\EmailTables_Feb2004.xls

Table E-6Off-site Preservation Calculations for Projected Commercial Development
Proposed Critical County Preservation Calculations by Year (4)Habitat Unit Projected Acres Acres Average Price per Projected Acres Acres Per-acre Residual 2003 2004
Developed (2) Preserved Mitigation Acre (3) Developed (2) Preserved Land Value (3) 1 2
Projected Office Development Projected Industrial Development
Ratio (1)
Off-site Mitigation
Critical Habitat Unit 10Acres Orange 0.00 :1 0 0 $78,333 0 0 $51,227 Acres 0.00 0.00Units Annual Cost $0 $0
Acres Riverside 1.22 :1 2,685 3,284 $9,500 1,618 1,979 $35,719 Acres 228.84 228.84Units Annual Cost $4,430,084 $4,430,084
Acres San Bernardino 0.00 :1 5 0 $0 6 0 $35,719 Acres 0.00 0.00Units Annual Cost $0 $0
Acres San Diego 0.00 :1 0 0 $19,750 0 0 $56,628 Acres 0.00 0.00Units Annual Cost $0 $0
Total NPV $34,193,311Critical Habitat Unit 11
Acres San Bernardino 0.00 :1 323 0 $0 216 0 $35,719 Acres 0.00 0.00Units Annual Cost $0 $0
NPV $0Critical Habitat Unit 12
Acres Los Angeles 0.00 :1 46 0 $0 27 0 $37,838 Acres 0.00 0.00Units Annual Cost $0 $0
NPV $0Critical Habitat Unit 13
Acres Los Angeles 0.00 :1 875 0 $0 520 0 $37,838 Acres 0.00 0.00Units Annual Cost $0 $0
Acres Ventura 0.00 :1 787 0 $0 457 0 $59,869 Acres 0.00 0.00Units Annual Cost $0 $0
Total NPV $0Total NPV, All Units:
(1) For San Diego and Orange counties, all mitigation above CEQA baseline is assumed to be on-site. The off-site mitigation ratio is therefore assumed to be zero. For the remaining counties, the mitigation ratio is from a review of selected Biological Opinions, as summarized in Table 11 and detailed in Appendix C.
Mitigation ratios in Ventura County were assumed to be the same as in Los Angeles, because no Biological Opinions were provided for projects in Ventura involving the CAGN.
(2) Equal to Projected Growth Acres minus Acres Set-aside (Table E-1)(3) Table 15(4) Assumes projected development is distributed evenly throughout 2025.
$34,195,327
Economic & Planning Systems, Inc. 2/26/2004 H:\12594gnatcatcher\Report\DEA_Feb2004\EmailTables_Feb2004.xls

Table E-6Off-site Preservation Calculations for Projected Commercial Development
Proposed Critical CountyHabitat Unit
Critical Habitat Unit 1Acres San DiegoUnits
Critical Habitat Unit 2Acres San DiegoUnits
Critical Habitat Unit 3Acres San DiegoUnits
Critical Habitat Unit 4Acres San DiegoUnits
Critical Habitat Unit 5Acres San DiegoUnits
Critical Habitat Unit 6Acres OrangeUnits
Acres San DiegoUnits
Critical Habitat Unit 7Acres OrangeUnits
Critical Habitat Unit 8Acres Los AngelesUnits
Critical Habitat Unit 9Acres Los AngelesUnits
Acres OrangeUnits
Acres RiversideUnits
Acres San BernardinoUnits
Preservation Calculations by Year (4)2005 2006 2007 2008 2009 2010 2011 2012 2013 2014 2015 2016
3 4 5 6 7 8 9 10 11 12 13 14
0.00 0.00 0.00 0.00 0.00 0.00 0.00 0.00 0.00 0.00 0.00 0.00$0 $0 $0 $0 $0 $0 $0 $0 $0 $0 $0 $0
0.00 0.00 0.00 0.00 0.00 0.00 0.00 0.00 0.00 0.00 0.00 0.00$0 $0 $0 $0 $0 $0 $0 $0 $0 $0 $0 $0
0.00 0.00 0.00 0.00 0.00 0.00 0.00 0.00 0.00 0.00 0.00 0.00$0 $0 $0 $0 $0 $0 $0 $0 $0 $0 $0 $0
0.00 0.00 0.00 0.00 0.00 0.00 0.00 0.00 0.00 0.00 0.00 0.00$0 $0 $0 $0 $0 $0 $0 $0 $0 $0 $0 $0
0.00 0.00 0.00 0.00 0.00 0.00 0.00 0.00 0.00 0.00 0.00 0.00$0 $0 $0 $0 $0 $0 $0 $0 $0 $0 $0 $0
0.00 0.00 0.00 0.00 0.00 0.00 0.00 0.00 0.00 0.00 0.00 0.00$0 $0 $0 $0 $0 $0 $0 $0 $0 $0 $0 $0
0.00 0.00 0.00 0.00 0.00 0.00 0.00 0.00 0.00 0.00 0.00 0.00$0 $0 $0 $0 $0 $0 $0 $0 $0 $0 $0 $0
0.00 0.00 0.00 0.00 0.00 0.00 0.00 0.00 0.00 0.00 0.00 0.00$0 $0 $0 $0 $0 $0 $0 $0 $0 $0 $0 $0
0.00 0.00 0.00 0.00 0.00 0.00 0.00 0.00 0.00 0.00 0.00 0.00$0 $0 $0 $0 $0 $0 $0 $0 $0 $0 $0 $0
0.00 0.00 0.00 0.00 0.00 0.00 0.00 0.00 0.00 0.00 0.00 0.00$0 $0 $0 $0 $0 $0 $0 $0 $0 $0 $0 $0
0.00 0.00 0.00 0.00 0.00 0.00 0.00 0.00 0.00 0.00 0.00 0.00$0 $0 $0 $0 $0 $0 $0 $0 $0 $0 $0 $0
0.01 0.01 0.01 0.01 0.01 0.01 0.01 0.01 0.01 0.01 0.01 0.01$261 $261 $261 $261 $261 $261 $261 $261 $261 $261 $261 $261
0.00 0.00 0.00 0.00 0.00 0.00 0.00 0.00 0.00 0.00 0.00 0.00$0 $0 $0 $0 $0 $0 $0 $0 $0 $0 $0 $0
Economic & Planning Systems, Inc. 2/26/2004 H:\12594gnatcatcher\Report\DEA_Feb2004\EmailTables_Feb2004.xls

Table E-6Off-site Preservation Calculations for Projected Commercial Development
Proposed Critical CountyHabitat Unit
Critical Habitat Unit 10Acres OrangeUnits
Acres RiversideUnits
Acres San BernardinoUnits
Acres San DiegoUnits
Critical Habitat Unit 11Acres San BernardinoUnits
Critical Habitat Unit 12Acres Los AngelesUnits
Critical Habitat Unit 13Acres Los AngelesUnits
Acres VenturaUnits
Total NPV, All Units:
Preservation Calculations by Year (4)2005 2006 2007 2008 2009 2010 2011 2012 2013 2014 2015 2016
3 4 5 6 7 8 9 10 11 12 13 14
0.00 0.00 0.00 0.00 0.00 0.00 0.00 0.00 0.00 0.00 0.00 0.00$0 $0 $0 $0 $0 $0 $0 $0 $0 $0 $0 $0
228.84 228.84 228.84 228.84 228.84 228.84 228.84 228.84 228.84 228.84 228.84 228.84$4,430,084 $4,430,084 $4,430,084 $4,430,084 $4,430,084 $4,430,084 $4,430,084 $4,430,084 $4,430,084 $4,430,084 $4,430,084 $4,430,084
0.00 0.00 0.00 0.00 0.00 0.00 0.00 0.00 0.00 0.00 0.00 0.00$0 $0 $0 $0 $0 $0 $0 $0 $0 $0 $0 $0
0.00 0.00 0.00 0.00 0.00 0.00 0.00 0.00 0.00 0.00 0.00 0.00$0 $0 $0 $0 $0 $0 $0 $0 $0 $0 $0 $0
0.00 0.00 0.00 0.00 0.00 0.00 0.00 0.00 0.00 0.00 0.00 0.00$0 $0 $0 $0 $0 $0 $0 $0 $0 $0 $0 $0
0.00 0.00 0.00 0.00 0.00 0.00 0.00 0.00 0.00 0.00 0.00 0.00$0 $0 $0 $0 $0 $0 $0 $0 $0 $0 $0 $0
0.00 0.00 0.00 0.00 0.00 0.00 0.00 0.00 0.00 0.00 0.00 0.00$0 $0 $0 $0 $0 $0 $0 $0 $0 $0 $0 $0
0.00 0.00 0.00 0.00 0.00 0.00 0.00 0.00 0.00 0.00 0.00 0.00$0 $0 $0 $0 $0 $0 $0 $0 $0 $0 $0 $0
Economic & Planning Systems, Inc. 2/26/2004 H:\12594gnatcatcher\Report\DEA_Feb2004\EmailTables_Feb2004.xls

Table E-6Off-site Preservation Calculations for Projected Commercial Development
Proposed Critical CountyHabitat Unit
Critical Habitat Unit 1Acres San DiegoUnits
Critical Habitat Unit 2Acres San DiegoUnits
Critical Habitat Unit 3Acres San DiegoUnits
Critical Habitat Unit 4Acres San DiegoUnits
Critical Habitat Unit 5Acres San DiegoUnits
Critical Habitat Unit 6Acres OrangeUnits
Acres San DiegoUnits
Critical Habitat Unit 7Acres OrangeUnits
Critical Habitat Unit 8Acres Los AngelesUnits
Critical Habitat Unit 9Acres Los AngelesUnits
Acres OrangeUnits
Acres RiversideUnits
Acres San BernardinoUnits
Preservation Calculations by Year (4)2017 2018 2019 2020 2021 2022 2023 2024 2025
15 16 17 18 19 20 21 22 23
0.00 0.00 0.00 0.00 0.00 0.00 0.00 0.00 0.00$0 $0 $0 $0 $0 $0 $0 $0 $0
0.00 0.00 0.00 0.00 0.00 0.00 0.00 0.00 0.00$0 $0 $0 $0 $0 $0 $0 $0 $0
0.00 0.00 0.00 0.00 0.00 0.00 0.00 0.00 0.00$0 $0 $0 $0 $0 $0 $0 $0 $0
0.00 0.00 0.00 0.00 0.00 0.00 0.00 0.00 0.00$0 $0 $0 $0 $0 $0 $0 $0 $0
0.00 0.00 0.00 0.00 0.00 0.00 0.00 0.00 0.00$0 $0 $0 $0 $0 $0 $0 $0 $0
0.00 0.00 0.00 0.00 0.00 0.00 0.00 0.00 0.00$0 $0 $0 $0 $0 $0 $0 $0 $0
0.00 0.00 0.00 0.00 0.00 0.00 0.00 0.00 0.00$0 $0 $0 $0 $0 $0 $0 $0 $0
0.00 0.00 0.00 0.00 0.00 0.00 0.00 0.00 0.00$0 $0 $0 $0 $0 $0 $0 $0 $0
0.00 0.00 0.00 0.00 0.00 0.00 0.00 0.00 0.00$0 $0 $0 $0 $0 $0 $0 $0 $0
0.00 0.00 0.00 0.00 0.00 0.00 0.00 0.00 0.00$0 $0 $0 $0 $0 $0 $0 $0 $0
0.00 0.00 0.00 0.00 0.00 0.00 0.00 0.00 0.00$0 $0 $0 $0 $0 $0 $0 $0 $0
0.01 0.01 0.01 0.01 0.01 0.01 0.01 0.01 0.01$261 $261 $261 $261 $261 $261 $261 $261 $261
0.00 0.00 0.00 0.00 0.00 0.00 0.00 0.00 0.00$0 $0 $0 $0 $0 $0 $0 $0 $0
Economic & Planning Systems, Inc. 2/26/2004 H:\12594gnatcatcher\Report\DEA_Feb2004\EmailTables_Feb2004.xls

Table E-6Off-site Preservation Calculations for Projected Commercial Development
Proposed Critical CountyHabitat Unit
Critical Habitat Unit 10Acres OrangeUnits
Acres RiversideUnits
Acres San BernardinoUnits
Acres San DiegoUnits
Critical Habitat Unit 11Acres San BernardinoUnits
Critical Habitat Unit 12Acres Los AngelesUnits
Critical Habitat Unit 13Acres Los AngelesUnits
Acres VenturaUnits
Total NPV, All Units:
Preservation Calculations by Year (4)2017 2018 2019 2020 2021 2022 2023 2024 2025
15 16 17 18 19 20 21 22 23
0.00 0.00 0.00 0.00 0.00 0.00 0.00 0.00 0.00$0 $0 $0 $0 $0 $0 $0 $0 $0
228.84 228.84 228.84 228.84 228.84 228.84 228.84 228.84 228.84$4,430,084 $4,430,084 $4,430,084 $4,430,084 $4,430,084 $4,430,084 $4,430,084 $4,430,084 $4,430,084
0.00 0.00 0.00 0.00 0.00 0.00 0.00 0.00 0.00$0 $0 $0 $0 $0 $0 $0 $0 $0
0.00 0.00 0.00 0.00 0.00 0.00 0.00 0.00 0.00$0 $0 $0 $0 $0 $0 $0 $0 $0
0.00 0.00 0.00 0.00 0.00 0.00 0.00 0.00 0.00$0 $0 $0 $0 $0 $0 $0 $0 $0
0.00 0.00 0.00 0.00 0.00 0.00 0.00 0.00 0.00$0 $0 $0 $0 $0 $0 $0 $0 $0
0.00 0.00 0.00 0.00 0.00 0.00 0.00 0.00 0.00$0 $0 $0 $0 $0 $0 $0 $0 $0
0.00 0.00 0.00 0.00 0.00 0.00 0.00 0.00 0.00$0 $0 $0 $0 $0 $0 $0 $0 $0
Economic & Planning Systems, Inc. 2/26/2004 H:\12594gnatcatcher\Report\DEA_Feb2004\EmailTables_Feb2004.xls

Table E-7CSS Restoration Calculations for Projected Commercial Development
Proposed Critical County Restoration Calculations by Year (4)Habitat Unit Projected Acres Acres Avg. Restoration Projected Acres Acres Avg. Restoration 2003 2004
Developed (2) Restored Cost per Acre (3) Developed (2) Restored Cost per Acre (3) 1 2
Critical Habitat Unit 1Acres San Diego 0.00 :1 0 0.00 $30,000 5 0.00 $30,000 Acres 0.00 0.00Units Annual Cost $0 $0
NPV $0Critical Habitat Unit 2
Acres San Diego 0.00 :1 0 0.00 $30,000 0 0.00 $30,000 Acres 0.00 0.00Units Annual Cost $0 $0
NPV $0Critical Habitat Unit 3
Acres San Diego 0.00 :1 1 0.00 $30,000 14 0.00 $30,000 Acres 0.00 0.00Units Annual Cost $0 $0
NPV $0Critical Habitat Unit 4
Acres San Diego 0.00 :1 0 0.00 $30,000 0 0.00 $30,000 Acres 0.00 0.00Units Annual Cost $0 $0
NPV $0Critical Habitat Unit 5
Acres San Diego 0.00 :1 0 0.00 $30,000 2 0.00 $30,000 Acres 0.00 0.00Units Annual Cost $0 $0
NPV $0Critical Habitat Unit 6
Acres Orange 0.00 :1 0 0.00 $30,000 0 0.00 $30,000 Acres 0.00 0.00Units Annual Cost $0 $0
Acres San Diego 0.00 :1 0 0.00 $30,000 0 0.00 $30,000 Acres 0.00 0.00Units Annual Cost $0 $0
Total NPV $0Critical Habitat Unit 7
Acres Orange 0.00 :1 6 0.00 $30,000 17 0.00 $30,000 Acres 0.00 0.00Units Annual Cost $0 $0
NPV $0Critical Habitat Unit 8
Acres Los Angeles 0.93 :1 0 0.00 $30,000 0 0.00 $30,000 Acres 0.00 0.00Units Annual Cost $0 $0
NPV $0Critical Habitat Unit 9
Acres Los Angeles 0.93 :1 119 110.55 $30,000 72 67.42 $30,000 Acres 7.74 7.74Units Annual Cost $232,140 $232,140
Acres Orange 0.00 :1 73 0.00 $30,000 49 0.00 $30,000 Acres 0.00 0.00Units Annual Cost $0 $0
Acres Riverside 0.00 :1 0 0.00 $30,000 0 0.00 $30,000 Acres 0.00 0.00Units Annual Cost $0 $0
Acres San Bernardino 0.40 :1 6 2.58 $30,000 4 1.72 $30,000 Acres 0.19 0.19Units Annual Cost $5,602 $5,602
Total NPV $1,835,000
Projected Office Development Projected Industrial Development
Ratio (1)
RestorationMitigation
Economic & Planning Systems, Inc. 2/26/2004 H:\12594gnatcatcher\Report\DEA_Feb2004\EmailTables_Feb2004.xls

Table E-7CSS Restoration Calculations for Projected Commercial Development
Proposed Critical County Restoration Calculations by Year (4)Habitat Unit Projected Acres Acres Avg. Restoration Projected Acres Acres Avg. Restoration 2003 2004
Developed (2) Restored Cost per Acre (3) Developed (2) Restored Cost per Acre (3) 1 2
Projected Office Development Projected Industrial Development
Ratio (1)
RestorationMitigation
Critical Habitat Unit 10Acres Orange 0.00 :1 0 0.00 $30,000 0 0.00 $30,000 Acres 0.00 0.00Units Annual Cost $0 $0
Acres Riverside 0.00 :1 2,685 0.00 $30,000 1,618 0.00 $30,000 Acres 0.00 0.00Units Annual Cost $0 $0
Acres San Bernardino 0.40 :1 5 2.09 $30,000 6 2.30 $30,000 Acres 0.19 0.19Units Annual Cost $5,720 $5,720
Acres San Diego 0.00 :1 0 0.00 $30,000 0 0.00 $30,000 Acres 0.00 0.00Units Annual Cost $0 $0
Total NPV $44,151Critical Habitat Unit 11
Acres San Bernardino 0.40 :1 323 129.16 $30,000 216 86.21 $30,000 Acres 9.36 9.36Units Annual Cost $280,922 $280,922
NPV $2,168,281Critical Habitat Unit 12
Acres Los Angeles 0.93 :1 46 42.86 $30,000 27 25.52 $30,000 Acres 2.97 2.97Units Annual Cost $89,192 $89,192
NPV $688,423Critical Habitat Unit 13
Acres Los Angeles 0.93 :1 875 813.89 $30,000 520 483.16 $30,000 Acres 56.39 56.39Units Annual Cost $1,691,807 $1,691,807
Acres Ventura 0.93 :1 787 732.23 $30,000 457 425.08 $30,000 Acres 50.32 50.32Units Annual Cost $1,509,534 $1,509,534
Total NPV $24,709,337Total NPV, All Units:
(1) Based on review of selected Biological Opinions, as summarized in Table 11 and detailed in Appendix C. Mitigation ratios is Ventura County were assumed to be the same as in Los Angeles, because no Biological Opinions were provided for
projects in Ventura involving the CAGN.(2) Equal to Projected Growth Acres minus Acres Set-aside (Table E-1)(3) Table 15(4) Assumes projected development is distributed evenly throughout 2025.
$29,445,192
Economic & Planning Systems, Inc. 2/26/2004 H:\12594gnatcatcher\Report\DEA_Feb2004\EmailTables_Feb2004.xls

Table E-7CSS Restoration Calculations for Projected Commercial Development
Proposed Critical CountyHabitat Unit
Critical Habitat Unit 1Acres San DiegoUnits
Critical Habitat Unit 2Acres San DiegoUnits
Critical Habitat Unit 3Acres San DiegoUnits
Critical Habitat Unit 4Acres San DiegoUnits
Critical Habitat Unit 5Acres San DiegoUnits
Critical Habitat Unit 6Acres OrangeUnits
Acres San DiegoUnits
Critical Habitat Unit 7Acres OrangeUnits
Critical Habitat Unit 8Acres Los AngelesUnits
Critical Habitat Unit 9Acres Los AngelesUnits
Acres OrangeUnits
Acres RiversideUnits
Acres San BernardinoUnits
Restoration Calculations by Year (4)2005 2006 2007 2008 2009 2010 2011 2012 2013 2014 2015 2016
3 4 5 6 7 8 9 10 11 12 13 14
0.00 0.00 0.00 0.00 0.00 0.00 0.00 0.00 0.00 0.00 0.00 0.00$0 $0 $0 $0 $0 $0 $0 $0 $0 $0 $0 $0
0.00 0.00 0.00 0.00 0.00 0.00 0.00 0.00 0.00 0.00 0.00 0.00$0 $0 $0 $0 $0 $0 $0 $0 $0 $0 $0 $0
0.00 0.00 0.00 0.00 0.00 0.00 0.00 0.00 0.00 0.00 0.00 0.00$0 $0 $0 $0 $0 $0 $0 $0 $0 $0 $0 $0
0.00 0.00 0.00 0.00 0.00 0.00 0.00 0.00 0.00 0.00 0.00 0.00$0 $0 $0 $0 $0 $0 $0 $0 $0 $0 $0 $0
0.00 0.00 0.00 0.00 0.00 0.00 0.00 0.00 0.00 0.00 0.00 0.00$0 $0 $0 $0 $0 $0 $0 $0 $0 $0 $0 $0
0.00 0.00 0.00 0.00 0.00 0.00 0.00 0.00 0.00 0.00 0.00 0.00$0 $0 $0 $0 $0 $0 $0 $0 $0 $0 $0 $0
0.00 0.00 0.00 0.00 0.00 0.00 0.00 0.00 0.00 0.00 0.00 0.00$0 $0 $0 $0 $0 $0 $0 $0 $0 $0 $0 $0
0.00 0.00 0.00 0.00 0.00 0.00 0.00 0.00 0.00 0.00 0.00 0.00$0 $0 $0 $0 $0 $0 $0 $0 $0 $0 $0 $0
0.00 0.00 0.00 0.00 0.00 0.00 0.00 0.00 0.00 0.00 0.00 0.00$0 $0 $0 $0 $0 $0 $0 $0 $0 $0 $0 $0
7.74 7.74 7.74 7.74 7.74 7.74 7.74 7.74 7.74 7.74 7.74 7.74$232,140 $232,140 $232,140 $232,140 $232,140 $232,140 $232,140 $232,140 $232,140 $232,140 $232,140 $232,140
0.00 0.00 0.00 0.00 0.00 0.00 0.00 0.00 0.00 0.00 0.00 0.00$0 $0 $0 $0 $0 $0 $0 $0 $0 $0 $0 $0
0.00 0.00 0.00 0.00 0.00 0.00 0.00 0.00 0.00 0.00 0.00 0.00$0 $0 $0 $0 $0 $0 $0 $0 $0 $0 $0 $0
0.19 0.19 0.19 0.19 0.19 0.19 0.19 0.19 0.19 0.19 0.19 0.19$5,602 $5,602 $5,602 $5,602 $5,602 $5,602 $5,602 $5,602 $5,602 $5,602 $5,602 $5,602
Economic & Planning Systems, Inc. 2/26/2004 H:\12594gnatcatcher\Report\DEA_Feb2004\EmailTables_Feb2004.xls

Table E-7CSS Restoration Calculations for Projected Commercial Development
Proposed Critical CountyHabitat Unit
Critical Habitat Unit 10Acres OrangeUnits
Acres RiversideUnits
Acres San BernardinoUnits
Acres San DiegoUnits
Critical Habitat Unit 11Acres San BernardinoUnits
Critical Habitat Unit 12Acres Los AngelesUnits
Critical Habitat Unit 13Acres Los AngelesUnits
Acres VenturaUnits
Total NPV, All Units:
Restoration Calculations by Year (4)2005 2006 2007 2008 2009 2010 2011 2012 2013 2014 2015 2016
3 4 5 6 7 8 9 10 11 12 13 14
0.00 0.00 0.00 0.00 0.00 0.00 0.00 0.00 0.00 0.00 0.00 0.00$0 $0 $0 $0 $0 $0 $0 $0 $0 $0 $0 $0
0.00 0.00 0.00 0.00 0.00 0.00 0.00 0.00 0.00 0.00 0.00 0.00$0 $0 $0 $0 $0 $0 $0 $0 $0 $0 $0 $0
0.19 0.19 0.19 0.19 0.19 0.19 0.19 0.19 0.19 0.19 0.19 0.19$5,720 $5,720 $5,720 $5,720 $5,720 $5,720 $5,720 $5,720 $5,720 $5,720 $5,720 $5,720
0.00 0.00 0.00 0.00 0.00 0.00 0.00 0.00 0.00 0.00 0.00 0.00$0 $0 $0 $0 $0 $0 $0 $0 $0 $0 $0 $0
9.36 9.36 9.36 9.36 9.36 9.36 9.36 9.36 9.36 9.36 9.36 9.36$280,922 $280,922 $280,922 $280,922 $280,922 $280,922 $280,922 $280,922 $280,922 $280,922 $280,922 $280,922
2.97 2.97 2.97 2.97 2.97 2.97 2.97 2.97 2.97 2.97 2.97 2.97$89,192 $89,192 $89,192 $89,192 $89,192 $89,192 $89,192 $89,192 $89,192 $89,192 $89,192 $89,192
56.39 56.39 56.39 56.39 56.39 56.39 56.39 56.39 56.39 56.39 56.39 56.39$1,691,807 $1,691,807 $1,691,807 $1,691,807 $1,691,807 $1,691,807 $1,691,807 $1,691,807 $1,691,807 $1,691,807 $1,691,807 $1,691,807
50.32 50.32 50.32 50.32 50.32 50.32 50.32 50.32 50.32 50.32 50.32 50.32$1,509,534 $1,509,534 $1,509,534 $1,509,534 $1,509,534 $1,509,534 $1,509,534 $1,509,534 $1,509,534 $1,509,534 $1,509,534 $1,509,534
Economic & Planning Systems, Inc. 2/26/2004 H:\12594gnatcatcher\Report\DEA_Feb2004\EmailTables_Feb2004.xls

Table E-7CSS Restoration Calculations for Projected Commercial Development
Proposed Critical CountyHabitat Unit
Critical Habitat Unit 1Acres San DiegoUnits
Critical Habitat Unit 2Acres San DiegoUnits
Critical Habitat Unit 3Acres San DiegoUnits
Critical Habitat Unit 4Acres San DiegoUnits
Critical Habitat Unit 5Acres San DiegoUnits
Critical Habitat Unit 6Acres OrangeUnits
Acres San DiegoUnits
Critical Habitat Unit 7Acres OrangeUnits
Critical Habitat Unit 8Acres Los AngelesUnits
Critical Habitat Unit 9Acres Los AngelesUnits
Acres OrangeUnits
Acres RiversideUnits
Acres San BernardinoUnits
Restoration Calculations by Year (4)2017 2018 2019 2020 2021 2022 2023 2024 2025
15 16 17 18 19 20 21 22 23
0.00 0.00 0.00 0.00 0.00 0.00 0.00 0.00 0.00$0 $0 $0 $0 $0 $0 $0 $0 $0
0.00 0.00 0.00 0.00 0.00 0.00 0.00 0.00 0.00$0 $0 $0 $0 $0 $0 $0 $0 $0
0.00 0.00 0.00 0.00 0.00 0.00 0.00 0.00 0.00$0 $0 $0 $0 $0 $0 $0 $0 $0
0.00 0.00 0.00 0.00 0.00 0.00 0.00 0.00 0.00$0 $0 $0 $0 $0 $0 $0 $0 $0
0.00 0.00 0.00 0.00 0.00 0.00 0.00 0.00 0.00$0 $0 $0 $0 $0 $0 $0 $0 $0
0.00 0.00 0.00 0.00 0.00 0.00 0.00 0.00 0.00$0 $0 $0 $0 $0 $0 $0 $0 $0
0.00 0.00 0.00 0.00 0.00 0.00 0.00 0.00 0.00$0 $0 $0 $0 $0 $0 $0 $0 $0
0.00 0.00 0.00 0.00 0.00 0.00 0.00 0.00 0.00$0 $0 $0 $0 $0 $0 $0 $0 $0
0.00 0.00 0.00 0.00 0.00 0.00 0.00 0.00 0.00$0 $0 $0 $0 $0 $0 $0 $0 $0
7.74 7.74 7.74 7.74 7.74 7.74 7.74 7.74 7.74$232,140 $232,140 $232,140 $232,140 $232,140 $232,140 $232,140 $232,140 $232,140
0.00 0.00 0.00 0.00 0.00 0.00 0.00 0.00 0.00$0 $0 $0 $0 $0 $0 $0 $0 $0
0.00 0.00 0.00 0.00 0.00 0.00 0.00 0.00 0.00$0 $0 $0 $0 $0 $0 $0 $0 $0
0.19 0.19 0.19 0.19 0.19 0.19 0.19 0.19 0.19$5,602 $5,602 $5,602 $5,602 $5,602 $5,602 $5,602 $5,602 $5,602
Economic & Planning Systems, Inc. 2/26/2004 H:\12594gnatcatcher\Report\DEA_Feb2004\EmailTables_Feb2004.xls

Table E-7CSS Restoration Calculations for Projected Commercial Development
Proposed Critical CountyHabitat Unit
Critical Habitat Unit 10Acres OrangeUnits
Acres RiversideUnits
Acres San BernardinoUnits
Acres San DiegoUnits
Critical Habitat Unit 11Acres San BernardinoUnits
Critical Habitat Unit 12Acres Los AngelesUnits
Critical Habitat Unit 13Acres Los AngelesUnits
Acres VenturaUnits
Total NPV, All Units:
Restoration Calculations by Year (4)2017 2018 2019 2020 2021 2022 2023 2024 2025
15 16 17 18 19 20 21 22 23
0.00 0.00 0.00 0.00 0.00 0.00 0.00 0.00 0.00$0 $0 $0 $0 $0 $0 $0 $0 $0
0.00 0.00 0.00 0.00 0.00 0.00 0.00 0.00 0.00$0 $0 $0 $0 $0 $0 $0 $0 $0
0.19 0.19 0.19 0.19 0.19 0.19 0.19 0.19 0.19$5,720 $5,720 $5,720 $5,720 $5,720 $5,720 $5,720 $5,720 $5,720
0.00 0.00 0.00 0.00 0.00 0.00 0.00 0.00 0.00$0 $0 $0 $0 $0 $0 $0 $0 $0
9.36 9.36 9.36 9.36 9.36 9.36 9.36 9.36 9.36$280,922 $280,922 $280,922 $280,922 $280,922 $280,922 $280,922 $280,922 $280,922
2.97 2.97 2.97 2.97 2.97 2.97 2.97 2.97 2.97$89,192 $89,192 $89,192 $89,192 $89,192 $89,192 $89,192 $89,192 $89,192
56.39 56.39 56.39 56.39 56.39 56.39 56.39 56.39 56.39$1,691,807 $1,691,807 $1,691,807 $1,691,807 $1,691,807 $1,691,807 $1,691,807 $1,691,807 $1,691,807
50.32 50.32 50.32 50.32 50.32 50.32 50.32 50.32 50.32$1,509,534 $1,509,534 $1,509,534 $1,509,534 $1,509,534 $1,509,534 $1,509,534 $1,509,534 $1,509,534
Economic & Planning Systems, Inc. 2/26/2004 H:\12594gnatcatcher\Report\DEA_Feb2004\EmailTables_Feb2004.xls

Table E-8On-site Set-aside Calculations for Projected Retail Development
Proposed Critical County Set-Aside Calculations by Year (4)Habitat Unit Projected Acres Per-acre Residual 2003 2004 2005 2006 2007
Growth Acres (2) Set-aside Land Value (3) 1 2 3 4 5
Critical Habitat Unit 1Acres San Diego 0.06 :1 2 0 $129,635 Acres 0.01 0.01 0.01 0.01 0.01Units Annual Cost $729 $729 $729 $729 $729
NPV $5,626Critical Habitat Unit 2
Acres San Diego 0.06 :1 0 0 $129,635 Acres 0.00 0.00 0.00 0.00 0.00Units Annual Cost $43 $43 $43 $43 $43
NPV $332Critical Habitat Unit 3
Acres San Diego 0.06 :1 9 1 $129,635 Acres 0.02 0.02 0.02 0.02 0.02Units Annual Cost $2,827 $2,827 $2,827 $2,827 $2,827
NPV $21,822Critical Habitat Unit 4
Acres San Diego 0.06 :1 0 0 $129,635 Acres 0.00 0.00 0.00 0.00 0.00Units Annual Cost $0 $0 $0 $0 $0
NPV $1Critical Habitat Unit 5
Acres San Diego 0.06 :1 4 0 $129,635 Acres 0.01 0.01 0.01 0.01 0.01Units Annual Cost $1,258 $1,258 $1,258 $1,258 $1,258
NPV $9,713Critical Habitat Unit 6
Acres Orange 1.82 :1 0 0 $148,452 Acres 0.00 0.00 0.00 0.00 0.00Units Annual Cost $0 $0 $0 $0 $0
Acres San Diego 0.06 :1 0 0 $129,635 Acres 0.00 0.00 0.00 0.00 0.00Units Annual Cost $0 $0 $0 $0 $0
Total NPV $3Critical Habitat Unit 7
Acres Orange 1.82 :1 5 3 $148,452 Acres 0.14 0.14 0.14 0.14 0.14Units Annual Cost $21,263 $21,263 $21,263 $21,263 $21,263
NPV $164,115Critical Habitat Unit 8
Acres Los Angeles 0.44 :1 0 0 $150,543 Acres 0.00 0.00 0.00 0.00 0.00Units Annual Cost $0 $0 $0 $0 $0
NPV $0Critical Habitat Unit 9
Acres Los Angeles 0.44 :1 46 14 $150,543 Acres 0.61 0.61 0.61 0.61 0.61Units Annual Cost $91,850 $91,850 $91,850 $91,850 $91,850
Acres Orange 1.82 :1 65 42 $148,452 Acres 1.83 1.83 1.83 1.83 1.83Units Annual Cost $271,751 $271,751 $271,751 $271,751 $271,751
Acres Riverside 1.14 :1 0.1 0.1 $112,908 Acres 0.003 0.003 0.003 0.003 0.003Units Annual Cost $343 $343 $343 $343 $343
Acres San Bernardino 2.70 :1 9 7 $112,908 Acres 0.28 0.28 0.28 0.28 0.28Units Annual Cost $32,039 $32,039 $32,039 $32,039 $32,039
Total NPV $3,056,371Critical Habitat Unit 10
Acres Orange 1.82 :1 0.2 0.1 $148,452 Acres 0.01 0.01 0.01 0.01 0.01
On-site Mitigation Ratio (1)
Projected Residential Development
Economic & Planning Systems, Inc. 2/26/2004 H:\12594gnatcatcher\Report\DEA_Feb2004\EmailTables_Feb2004.xls

Table E-8On-site Set-aside Calculations for Projected Retail Development
Proposed Critical County Set-Aside Calculations by Year (4)Habitat Unit Projected Acres Per-acre Residual 2003 2004 2005 2006 2007
Growth Acres (2) Set-aside Land Value (3) 1 2 3 4 5
On-site Mitigation Ratio (1)
Projected Residential Development
Units Annual Cost $901 $901 $901 $901 $901
Acres Riverside 1.14 :1 2,218 1,183 $112,908 Acres 51.44 51.44 51.44 51.44 51.44Units Annual Cost $5,808,223 $5,808,223 $5,808,223 $5,808,223 $5,808,223
Acres San Bernardino 2.70 :1 4 3 $112,908 Acres 0.13 0.13 0.13 0.13 0.13Units Annual Cost $14,543 $14,543 $14,543 $14,543 $14,543
Acres San Diego 0.06 :1 0 0 $129,635 Acres 0.00 0.00 0.00 0.00 0.00Units Annual Cost $1 $1 $1 $1 $1
Total NPV $44,949,597Critical Habitat Unit 11
Acres San Bernardino 2.70 :1 448 327 $112,908 Acres 14.23 14.23 14.23 14.23 14.23Units Annual Cost $1,606,451 $1,606,451 $1,606,451 $1,606,451 $1,606,451
NPV $12,399,283Critical Habitat Unit 12
Acres Los Angeles 0.44 :1 18 5 $150,543 Acres 0.24 0.24 0.24 0.24 0.24Units Annual Cost $35,563 $35,563 $35,563 $35,563 $35,563
NPV $274,487Critical Habitat Unit 13
Acres Los Angeles 0.44 :1 338 103 $150,543 Acres 4.49 4.49 4.49 4.49 4.49Units Annual Cost $675,201 $675,201 $675,201 $675,201 $675,201
Acres Ventura 0.44 :1 381 117 $150,543 Acres 5.07 5.07 5.07 5.07 5.07Units Annual Cost $762,704 $762,704 $762,704 $762,704 $762,704
Total NPV $11,098,372Total NPV, All Units:
(1) For San Diego and Orange counties, the Effective Mitigation Ratio is the County-specific on-site mitigation ratio summarized in Table 11 minus an assumed CEQA mitigation ratio of 2-to-1. For all other counties, the Effective Mitigation Ratio is the ratio reported in Table 11. Mitigation ratios is Ventura County were assumed to be the same as in Los Angeles, because no Biological Opinions were provided for projects in Ventura involving the CAGN.(2) Table E-1(3) Table D-1(4) Assumes projected development is distributed evenly throughout 2025.
$71,979,721
Economic & Planning Systems, Inc. 2/26/2004 H:\12594gnatcatcher\Report\DEA_Feb2004\EmailTables_Feb2004.xls

Table E-8On-site Set-aside Calculations for Projected Retail Development
Proposed Critical CountyHabitat Unit
Critical Habitat Unit 1Acres San DiegoUnits
Critical Habitat Unit 2Acres San DiegoUnits
Critical Habitat Unit 3Acres San DiegoUnits
Critical Habitat Unit 4Acres San DiegoUnits
Critical Habitat Unit 5Acres San DiegoUnits
Critical Habitat Unit 6Acres OrangeUnits
Acres San DiegoUnits
Critical Habitat Unit 7Acres OrangeUnits
Critical Habitat Unit 8Acres Los AngelesUnits
Critical Habitat Unit 9Acres Los AngelesUnits
Acres OrangeUnits
Acres RiversideUnits
Acres San BernardinoUnits
Critical Habitat Unit 10Acres Orange
Set-Aside Calculations by Year (4)2008 2009 2010 2011 2012 2013 2014 2015 2016 2017
6 7 8 9 10 11 12 13 14 15
0.01 0.01 0.01 0.01 0.01 0.01 0.01 0.01 0.01 0.01$729 $729 $729 $729 $729 $729 $729 $729 $729 $729
0.00 0.00 0.00 0.00 0.00 0.00 0.00 0.00 0.00 0.00$43 $43 $43 $43 $43 $43 $43 $43 $43 $43
0.02 0.02 0.02 0.02 0.02 0.02 0.02 0.02 0.02 0.02$2,827 $2,827 $2,827 $2,827 $2,827 $2,827 $2,827 $2,827 $2,827 $2,827
0.00 0.00 0.00 0.00 0.00 0.00 0.00 0.00 0.00 0.00$0 $0 $0 $0 $0 $0 $0 $0 $0 $0
0.01 0.01 0.01 0.01 0.01 0.01 0.01 0.01 0.01 0.01$1,258 $1,258 $1,258 $1,258 $1,258 $1,258 $1,258 $1,258 $1,258 $1,258
0.00 0.00 0.00 0.00 0.00 0.00 0.00 0.00 0.00 0.00$0 $0 $0 $0 $0 $0 $0 $0 $0 $0
0.00 0.00 0.00 0.00 0.00 0.00 0.00 0.00 0.00 0.00$0 $0 $0 $0 $0 $0 $0 $0 $0 $0
0.14 0.14 0.14 0.14 0.14 0.14 0.14 0.14 0.14 0.14$21,263 $21,263 $21,263 $21,263 $21,263 $21,263 $21,263 $21,263 $21,263 $21,263
0.00 0.00 0.00 0.00 0.00 0.00 0.00 0.00 0.00 0.00$0 $0 $0 $0 $0 $0 $0 $0 $0 $0
0.61 0.61 0.61 0.61 0.61 0.61 0.61 0.61 0.61 0.61$91,850 $91,850 $91,850 $91,850 $91,850 $91,850 $91,850 $91,850 $91,850 $91,850
1.83 1.83 1.83 1.83 1.83 1.83 1.83 1.83 1.83 1.83$271,751 $271,751 $271,751 $271,751 $271,751 $271,751 $271,751 $271,751 $271,751 $271,751
0.003 0.003 0.003 0.003 0.003 0.003 0.003 0.003 0.003 0.003$343 $343 $343 $343 $343 $343 $343 $343 $343 $343
0.28 0.28 0.28 0.28 0.28 0.28 0.28 0.28 0.28 0.28$32,039 $32,039 $32,039 $32,039 $32,039 $32,039 $32,039 $32,039 $32,039 $32,039
0.01 0.01 0.01 0.01 0.01 0.01 0.01 0.01 0.01 0.01
Economic & Planning Systems, Inc. 2/26/2004 H:\12594gnatcatcher\Report\DEA_Feb2004\EmailTables_Feb2004.xls

Table E-8On-site Set-aside Calculations for Projected Retail Development
Proposed Critical CountyHabitat Unit
Units
Acres RiversideUnits
Acres San BernardinoUnits
Acres San DiegoUnits
Critical Habitat Unit 11Acres San BernardinoUnits
Critical Habitat Unit 12Acres Los AngelesUnits
Critical Habitat Unit 13Acres Los AngelesUnits
Acres VenturaUnits
Total NPV, All Units:
Set-Aside Calculations by Year (4)2008 2009 2010 2011 2012 2013 2014 2015 2016 2017
6 7 8 9 10 11 12 13 14 15
$901 $901 $901 $901 $901 $901 $901 $901 $901 $901
51.44 51.44 51.44 51.44 51.44 51.44 51.44 51.44 51.44 51.44$5,808,223 $5,808,223 $5,808,223 $5,808,223 $5,808,223 $5,808,223 $5,808,223 $5,808,223 $5,808,223 $5,808,223
0.13 0.13 0.13 0.13 0.13 0.13 0.13 0.13 0.13 0.13$14,543 $14,543 $14,543 $14,543 $14,543 $14,543 $14,543 $14,543 $14,543 $14,543
0.00 0.00 0.00 0.00 0.00 0.00 0.00 0.00 0.00 0.00$1 $1 $1 $1 $1 $1 $1 $1 $1 $1
14.23 14.23 14.23 14.23 14.23 14.23 14.23 14.23 14.23 14.23$1,606,451 $1,606,451 $1,606,451 $1,606,451 $1,606,451 $1,606,451 $1,606,451 $1,606,451 $1,606,451 $1,606,451
0.24 0.24 0.24 0.24 0.24 0.24 0.24 0.24 0.24 0.24$35,563 $35,563 $35,563 $35,563 $35,563 $35,563 $35,563 $35,563 $35,563 $35,563
4.49 4.49 4.49 4.49 4.49 4.49 4.49 4.49 4.49 4.49$675,201 $675,201 $675,201 $675,201 $675,201 $675,201 $675,201 $675,201 $675,201 $675,201
5.07 5.07 5.07 5.07 5.07 5.07 5.07 5.07 5.07 5.07$762,704 $762,704 $762,704 $762,704 $762,704 $762,704 $762,704 $762,704 $762,704 $762,704
Economic & Planning Systems, Inc. 2/26/2004 H:\12594gnatcatcher\Report\DEA_Feb2004\EmailTables_Feb2004.xls

Table E-8On-site Set-aside Calculations for Projected Retail Development
Proposed Critical CountyHabitat Unit
Critical Habitat Unit 1Acres San DiegoUnits
Critical Habitat Unit 2Acres San DiegoUnits
Critical Habitat Unit 3Acres San DiegoUnits
Critical Habitat Unit 4Acres San DiegoUnits
Critical Habitat Unit 5Acres San DiegoUnits
Critical Habitat Unit 6Acres OrangeUnits
Acres San DiegoUnits
Critical Habitat Unit 7Acres OrangeUnits
Critical Habitat Unit 8Acres Los AngelesUnits
Critical Habitat Unit 9Acres Los AngelesUnits
Acres OrangeUnits
Acres RiversideUnits
Acres San BernardinoUnits
Critical Habitat Unit 10Acres Orange
Set-Aside Calculations by Year (4)2018 2019 2020 2021 2022 2023 2024 2025
16 17 18 19 20 21 22 23
0.01 0.01 0.01 0.01 0.01 0.01 0.01 0.01$729 $729 $729 $729 $729 $729 $729 $729
0.00 0.00 0.00 0.00 0.00 0.00 0.00 0.00$43 $43 $43 $43 $43 $43 $43 $43
0.02 0.02 0.02 0.02 0.02 0.02 0.02 0.02$2,827 $2,827 $2,827 $2,827 $2,827 $2,827 $2,827 $2,827
0.00 0.00 0.00 0.00 0.00 0.00 0.00 0.00$0 $0 $0 $0 $0 $0 $0 $0
0.01 0.01 0.01 0.01 0.01 0.01 0.01 0.01$1,258 $1,258 $1,258 $1,258 $1,258 $1,258 $1,258 $1,258
0.00 0.00 0.00 0.00 0.00 0.00 0.00 0.00$0 $0 $0 $0 $0 $0 $0 $0
0.00 0.00 0.00 0.00 0.00 0.00 0.00 0.00$0 $0 $0 $0 $0 $0 $0 $0
0.14 0.14 0.14 0.14 0.14 0.14 0.14 0.14$21,263 $21,263 $21,263 $21,263 $21,263 $21,263 $21,263 $21,263
0.00 0.00 0.00 0.00 0.00 0.00 0.00 0.00$0 $0 $0 $0 $0 $0 $0 $0
0.61 0.61 0.61 0.61 0.61 0.61 0.61 0.61$91,850 $91,850 $91,850 $91,850 $91,850 $91,850 $91,850 $91,850
1.83 1.83 1.83 1.83 1.83 1.83 1.83 1.83$271,751 $271,751 $271,751 $271,751 $271,751 $271,751 $271,751 $271,751
0.003 0.003 0.003 0.003 0.003 0.003 0.003 0.003$343 $343 $343 $343 $343 $343 $343 $343
0.28 0.28 0.28 0.28 0.28 0.28 0.28 0.28$32,039 $32,039 $32,039 $32,039 $32,039 $32,039 $32,039 $32,039
0.01 0.01 0.01 0.01 0.01 0.01 0.01 0.01
Economic & Planning Systems, Inc. 2/26/2004 H:\12594gnatcatcher\Report\DEA_Feb2004\EmailTables_Feb2004.xls

Table E-8On-site Set-aside Calculations for Projected Retail Development
Proposed Critical CountyHabitat Unit
Units
Acres RiversideUnits
Acres San BernardinoUnits
Acres San DiegoUnits
Critical Habitat Unit 11Acres San BernardinoUnits
Critical Habitat Unit 12Acres Los AngelesUnits
Critical Habitat Unit 13Acres Los AngelesUnits
Acres VenturaUnits
Total NPV, All Units:
Set-Aside Calculations by Year (4)2018 2019 2020 2021 2022 2023 2024 2025
16 17 18 19 20 21 22 23
$901 $901 $901 $901 $901 $901 $901 $901
51.44 51.44 51.44 51.44 51.44 51.44 51.44 51.44$5,808,223 $5,808,223 $5,808,223 $5,808,223 $5,808,223 $5,808,223 $5,808,223 $5,808,223
0.13 0.13 0.13 0.13 0.13 0.13 0.13 0.13$14,543 $14,543 $14,543 $14,543 $14,543 $14,543 $14,543 $14,543
0.00 0.00 0.00 0.00 0.00 0.00 0.00 0.00$1 $1 $1 $1 $1 $1 $1 $1
14.23 14.23 14.23 14.23 14.23 14.23 14.23 14.23$1,606,451 $1,606,451 $1,606,451 $1,606,451 $1,606,451 $1,606,451 $1,606,451 $1,606,451
0.24 0.24 0.24 0.24 0.24 0.24 0.24 0.24$35,563 $35,563 $35,563 $35,563 $35,563 $35,563 $35,563 $35,563
4.49 4.49 4.49 4.49 4.49 4.49 4.49 4.49$675,201 $675,201 $675,201 $675,201 $675,201 $675,201 $675,201 $675,201
5.07 5.07 5.07 5.07 5.07 5.07 5.07 5.07$762,704 $762,704 $762,704 $762,704 $762,704 $762,704 $762,704 $762,704
Economic & Planning Systems, Inc. 2/26/2004 H:\12594gnatcatcher\Report\DEA_Feb2004\EmailTables_Feb2004.xls

Table E-9Off-site Preservation Calculations for Projected Retail Development
Proposed Critical County Preservation Calculations by Year (4)Habitat Unit Projected Acres Acres Average Price per 2003 2004 2005 2006 2007
Developed (2) Preserved Mitigation Acre (3) 1 2 3 4 5
Critical Habitat Unit 1Acres San Diego 0.00 :1 2 0 $19,750 Acres 0.00 0.00 0.00 0.00 0.00Units Annual Cost $0 $0 $0 $0 $0
NPV $0Critical Habitat Unit 2
Acres San Diego 0.00 :1 0 0 $19,750 Acres 0.00 0.00 0.00 0.00 0.00Units Annual Cost $0 $0 $0 $0 $0
NPV $0Critical Habitat Unit 3
Acres San Diego 0.00 :1 9 0 $19,750 Acres 0.00 0.00 0.00 0.00 0.00Units Annual Cost $0 $0 $0 $0 $0
NPV $0Critical Habitat Unit 4
Acres San Diego 0.00 :1 0 0 $19,750 Acres 0.00 0.00 0.00 0.00 0.00Units Annual Cost $0 $0 $0 $0 $0
NPV $0Critical Habitat Unit 5
Acres San Diego 0.00 :1 4 0 $19,750 Acres 0.00 0.00 0.00 0.00 0.00Units Annual Cost $0 $0 $0 $0 $0
NPV $0Critical Habitat Unit 6
Acres Orange 0.00 :1 0 0 $78,333 Acres 0.00 0.00 0.00 0.00 0.00Units Annual Cost $0 $0 $0 $0 $0
Acres San Diego 0.00 :1 0 0 $19,750 Acres 0.00 0.00 0.00 0.00 0.00Units Annual Cost $0 $0 $0 $0 $0
Total NPV $0Critical Habitat Unit 7
Acres Orange 0.00 :1 2 0 $78,333 Acres 0.00 0.00 0.00 0.00 0.00Units Annual Cost $0 $0 $0 $0 $0
NPV $0Critical Habitat Unit 8
Acres Los Angeles 0.00 :1 0 0 $0 Acres 0.00 0.00 0.00 0.00 0.00Units Annual Cost $0 $0 $0 $0 $0
NPV $0Critical Habitat Unit 9
Acres Los Angeles 0.00 :1 32 0 $0 Acres 0.00 0.00 0.00 0.00 0.00Units Annual Cost $0 $0 $0 $0 $0
Acres Orange 0.00 :1 23 0 $78,333 Acres 0.00 0.00 0.00 0.00 0.00Units Annual Cost $0 $0 $0 $0 $0
Acres Riverside 1.22 :1 0 0 $9,500 Acres 0.00 0.00 0.00 0.00 0.00Units Annual Cost $0 $0 $0 $0 $0
Acres San Bernardino 0.00 :1 2 0 $0 Acres 0.00 0.00 0.00 0.00 0.00Units Annual Cost $0 $0 $0 $0 $0
Total NPV $0Critical Habitat Unit 10
Acres Orange 0.00 :1 0 0 $78,333 Acres 0.00 0.00 0.00 0.00 0.00Units Annual Cost $0 $0 $0 $0 $0
Acres Riverside 1.22 :1 1,035 1,266 $9,500 Acres 55.04 55.04 55.04 55.04 55.04Units Annual Cost $522,897 $522,897 $522,897 $522,897 $522,897
Acres San Bernardino 0.00 :1 1 0 $0 Acres 0.00 0.00 0.00 0.00 0.00Units Annual Cost $0 $0 $0 $0 $0
Acres San Diego 0.00 :1 0 0 $19,750 Acres 0.00 0.00 0.00 0.00 0.00
Off-site Mitigation Ratio (1)
Projected Retail Development
Economic & Planning Systems, Inc. 2/26/2004 H:\12594\Model\\EmailTables_Feb2004.xls

Table E-9Off-site Preservation Calculations for Projected Retail Development
Proposed Critical County Preservation Calculations by Year (4)Habitat Unit Projected Acres Acres Average Price per 2003 2004 2005 2006 2007
Developed (2) Preserved Mitigation Acre (3) 1 2 3 4 5
Off-site Mitigation Ratio (1)
Projected Retail Development
Units Annual Cost $0 $0 $0 $0 $0Total NPV $4,035,944
Critical Habitat Unit 11Acres San Bernardino 0.00 :1 121 0 $0 Acres 0.00 0.00 0.00 0.00 0.00Units Annual Cost $0 $0 $0 $0 $0
NPV $0Critical Habitat Unit 12
Acres Los Angeles 0.00 :1 12 0 $0 Acres 0.00 0.00 0.00 0.00 0.00Units Annual Cost $0 $0 $0 $0 $0
NPV $0Critical Habitat Unit 13
Acres Los Angeles 0.00 :1 234 0 $0 Acres 0.00 0.00 0.00 0.00 0.00Units Annual Cost $0 $0 $0 $0 $0
Acres Ventura 0.00 :1 265 0 $0 Acres 0.00 0.00 0.00 0.00 0.00Units Annual Cost $0 $0 $0 $0 $0
Total NPV $0Total NPV, All Units:
(1) For San Diego and Orange counties, all mitigation above CEQA baseline is assumed to be on-site. The off-site mitigation ratio is therefore assumed to be zero. For the remaining counties, the mitigation ratio is from a review of selected Biological Opinions, as summarized in Table 11 and detailed in Appendix C.
Mitigation ratios in Ventura County were assumed to be the same as in Los Angeles, because no Biological Opinions were provided for projects in Ventura involving the CAGN.
(2) Equal to Projected Growth Acres minus Acres Set-aside (Table E-1)(3) Table 15(4) Assumes projected development is distributed evenly throughout 2025.
$4,035,944
Economic & Planning Systems, Inc. 2/26/2004 H:\12594\Model\\EmailTables_Feb2004.xls

Table E-9Off-site Preservation Calculations for Projected Retail Development
Proposed Critical CountyHabitat Unit
Critical Habitat Unit 1Acres San DiegoUnits
Critical Habitat Unit 2Acres San DiegoUnits
Critical Habitat Unit 3Acres San DiegoUnits
Critical Habitat Unit 4Acres San DiegoUnits
Critical Habitat Unit 5Acres San DiegoUnits
Critical Habitat Unit 6Acres OrangeUnits
Acres San DiegoUnits
Critical Habitat Unit 7Acres OrangeUnits
Critical Habitat Unit 8Acres Los AngelesUnits
Critical Habitat Unit 9Acres Los AngelesUnits
Acres OrangeUnits
Acres RiversideUnits
Acres San BernardinoUnits
Critical Habitat Unit 10Acres OrangeUnits
Acres RiversideUnits
Acres San BernardinoUnits
Acres San Diego
Preservation Calculations by Year (4)2008 2009 2010 2011 2012 2013 2014 2015 2016 2017 2018
6 7 8 9 10 11 12 13 14 15 16
0.00 0.00 0.00 0.00 0.00 0.00 0.00 0.00 0.00 0.00 0.00$0 $0 $0 $0 $0 $0 $0 $0 $0 $0 $0
0.00 0.00 0.00 0.00 0.00 0.00 0.00 0.00 0.00 0.00 0.00$0 $0 $0 $0 $0 $0 $0 $0 $0 $0 $0
0.00 0.00 0.00 0.00 0.00 0.00 0.00 0.00 0.00 0.00 0.00$0 $0 $0 $0 $0 $0 $0 $0 $0 $0 $0
0.00 0.00 0.00 0.00 0.00 0.00 0.00 0.00 0.00 0.00 0.00$0 $0 $0 $0 $0 $0 $0 $0 $0 $0 $0
0.00 0.00 0.00 0.00 0.00 0.00 0.00 0.00 0.00 0.00 0.00$0 $0 $0 $0 $0 $0 $0 $0 $0 $0 $0
0.00 0.00 0.00 0.00 0.00 0.00 0.00 0.00 0.00 0.00 0.00$0 $0 $0 $0 $0 $0 $0 $0 $0 $0 $0
0.00 0.00 0.00 0.00 0.00 0.00 0.00 0.00 0.00 0.00 0.00$0 $0 $0 $0 $0 $0 $0 $0 $0 $0 $0
0.00 0.00 0.00 0.00 0.00 0.00 0.00 0.00 0.00 0.00 0.00$0 $0 $0 $0 $0 $0 $0 $0 $0 $0 $0
0.00 0.00 0.00 0.00 0.00 0.00 0.00 0.00 0.00 0.00 0.00$0 $0 $0 $0 $0 $0 $0 $0 $0 $0 $0
0.00 0.00 0.00 0.00 0.00 0.00 0.00 0.00 0.00 0.00 0.00$0 $0 $0 $0 $0 $0 $0 $0 $0 $0 $0
0.00 0.00 0.00 0.00 0.00 0.00 0.00 0.00 0.00 0.00 0.00$0 $0 $0 $0 $0 $0 $0 $0 $0 $0 $0
0.00 0.00 0.00 0.00 0.00 0.00 0.00 0.00 0.00 0.00 0.00$0 $0 $0 $0 $0 $0 $0 $0 $0 $0 $0
0.00 0.00 0.00 0.00 0.00 0.00 0.00 0.00 0.00 0.00 0.00$0 $0 $0 $0 $0 $0 $0 $0 $0 $0 $0
0.00 0.00 0.00 0.00 0.00 0.00 0.00 0.00 0.00 0.00 0.00$0 $0 $0 $0 $0 $0 $0 $0 $0 $0 $0
55.04 55.04 55.04 55.04 55.04 55.04 55.04 55.04 55.04 55.04 55.04$522,897 $522,897 $522,897 $522,897 $522,897 $522,897 $522,897 $522,897 $522,897 $522,897 $522,897
0.00 0.00 0.00 0.00 0.00 0.00 0.00 0.00 0.00 0.00 0.00$0 $0 $0 $0 $0 $0 $0 $0 $0 $0 $0
0.00 0.00 0.00 0.00 0.00 0.00 0.00 0.00 0.00 0.00 0.00
Economic & Planning Systems, Inc. 2/26/2004 H:\12594\Model\\EmailTables_Feb2004.xls
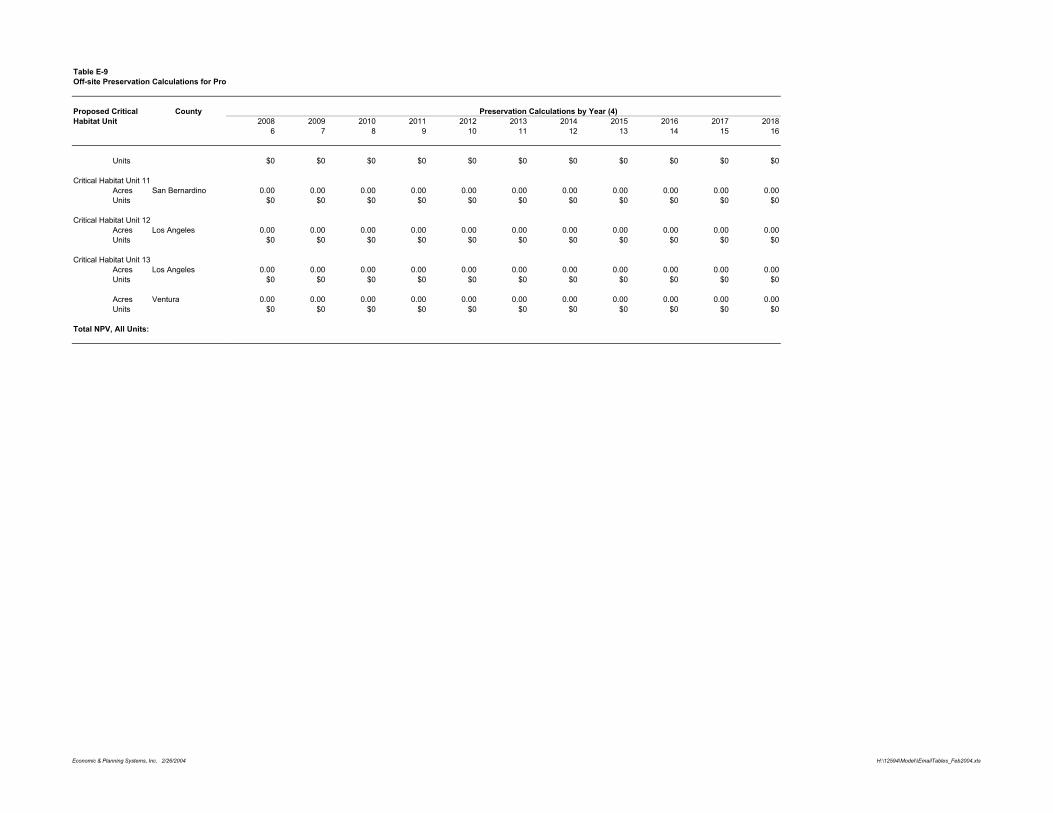
Table E-9Off-site Preservation Calculations for Projected Retail Development
Proposed Critical CountyHabitat Unit
Units
Critical Habitat Unit 11Acres San BernardinoUnits
Critical Habitat Unit 12Acres Los AngelesUnits
Critical Habitat Unit 13Acres Los AngelesUnits
Acres VenturaUnits
Total NPV, All Units:
Preservation Calculations by Year (4)2008 2009 2010 2011 2012 2013 2014 2015 2016 2017 2018
6 7 8 9 10 11 12 13 14 15 16
$0 $0 $0 $0 $0 $0 $0 $0 $0 $0 $0
0.00 0.00 0.00 0.00 0.00 0.00 0.00 0.00 0.00 0.00 0.00$0 $0 $0 $0 $0 $0 $0 $0 $0 $0 $0
0.00 0.00 0.00 0.00 0.00 0.00 0.00 0.00 0.00 0.00 0.00$0 $0 $0 $0 $0 $0 $0 $0 $0 $0 $0
0.00 0.00 0.00 0.00 0.00 0.00 0.00 0.00 0.00 0.00 0.00$0 $0 $0 $0 $0 $0 $0 $0 $0 $0 $0
0.00 0.00 0.00 0.00 0.00 0.00 0.00 0.00 0.00 0.00 0.00$0 $0 $0 $0 $0 $0 $0 $0 $0 $0 $0
Economic & Planning Systems, Inc. 2/26/2004 H:\12594\Model\\EmailTables_Feb2004.xls

Table E-9Off-site Preservation Calculations for Projected Retail Development
Proposed Critical CountyHabitat Unit
Critical Habitat Unit 1Acres San DiegoUnits
Critical Habitat Unit 2Acres San DiegoUnits
Critical Habitat Unit 3Acres San DiegoUnits
Critical Habitat Unit 4Acres San DiegoUnits
Critical Habitat Unit 5Acres San DiegoUnits
Critical Habitat Unit 6Acres OrangeUnits
Acres San DiegoUnits
Critical Habitat Unit 7Acres OrangeUnits
Critical Habitat Unit 8Acres Los AngelesUnits
Critical Habitat Unit 9Acres Los AngelesUnits
Acres OrangeUnits
Acres RiversideUnits
Acres San BernardinoUnits
Critical Habitat Unit 10Acres OrangeUnits
Acres RiversideUnits
Acres San BernardinoUnits
Acres San Diego
Preservation Calculations by Year (4)2019 2020 2021 2022 2023 2024 2025
17 18 19 20 21 22 23
0.00 0.00 0.00 0.00 0.00 0.00 0.00$0 $0 $0 $0 $0 $0 $0
0.00 0.00 0.00 0.00 0.00 0.00 0.00$0 $0 $0 $0 $0 $0 $0
0.00 0.00 0.00 0.00 0.00 0.00 0.00$0 $0 $0 $0 $0 $0 $0
0.00 0.00 0.00 0.00 0.00 0.00 0.00$0 $0 $0 $0 $0 $0 $0
0.00 0.00 0.00 0.00 0.00 0.00 0.00$0 $0 $0 $0 $0 $0 $0
0.00 0.00 0.00 0.00 0.00 0.00 0.00$0 $0 $0 $0 $0 $0 $0
0.00 0.00 0.00 0.00 0.00 0.00 0.00$0 $0 $0 $0 $0 $0 $0
0.00 0.00 0.00 0.00 0.00 0.00 0.00$0 $0 $0 $0 $0 $0 $0
0.00 0.00 0.00 0.00 0.00 0.00 0.00$0 $0 $0 $0 $0 $0 $0
0.00 0.00 0.00 0.00 0.00 0.00 0.00$0 $0 $0 $0 $0 $0 $0
0.00 0.00 0.00 0.00 0.00 0.00 0.00$0 $0 $0 $0 $0 $0 $0
0.00 0.00 0.00 0.00 0.00 0.00 0.00$0 $0 $0 $0 $0 $0 $0
0.00 0.00 0.00 0.00 0.00 0.00 0.00$0 $0 $0 $0 $0 $0 $0
0.00 0.00 0.00 0.00 0.00 0.00 0.00$0 $0 $0 $0 $0 $0 $0
55.04 55.04 55.04 55.04 55.04 55.04 55.04$522,897 $522,897 $522,897 $522,897 $522,897 $522,897 $522,897
0.00 0.00 0.00 0.00 0.00 0.00 0.00$0 $0 $0 $0 $0 $0 $0
0.00 0.00 0.00 0.00 0.00 0.00 0.00
Economic & Planning Systems, Inc. 2/26/2004 H:\12594\Model\\EmailTables_Feb2004.xls

Table E-9Off-site Preservation Calculations for Projected Retail Development
Proposed Critical CountyHabitat Unit
Units
Critical Habitat Unit 11Acres San BernardinoUnits
Critical Habitat Unit 12Acres Los AngelesUnits
Critical Habitat Unit 13Acres Los AngelesUnits
Acres VenturaUnits
Total NPV, All Units:
Preservation Calculations by Year (4)2019 2020 2021 2022 2023 2024 2025
17 18 19 20 21 22 23
$0 $0 $0 $0 $0 $0 $0
0.00 0.00 0.00 0.00 0.00 0.00 0.00$0 $0 $0 $0 $0 $0 $0
0.00 0.00 0.00 0.00 0.00 0.00 0.00$0 $0 $0 $0 $0 $0 $0
0.00 0.00 0.00 0.00 0.00 0.00 0.00$0 $0 $0 $0 $0 $0 $0
0.00 0.00 0.00 0.00 0.00 0.00 0.00$0 $0 $0 $0 $0 $0 $0
Economic & Planning Systems, Inc. 2/26/2004 H:\12594\Model\\EmailTables_Feb2004.xls

Table E-10CSS Restoration Calculations for Projected Retail Development
Proposed Critical County Restoration Calculations by Year (4)Habitat Unit Projected Acres Acres Avg. Restoration 2003 2004 2005 2006 2007
Developed (2) Restored Cost per Acre (3) 1 2 3 4 5
Critical Habitat Unit 1Acres San Diego 0.00 :1 2 0.00 $30,000 Acres 0.00 0.00 0.00 0.00 0.00Units Annual Cost $0 $0 $0 $0 $0
NPV $0Critical Habitat Unit 2
Acres San Diego 0.00 :1 0 0.00 $30,000 Acres 0.00 0.00 0.00 0.00 0.00Units Annual Cost $0 $0 $0 $0 $0
NPV $0Critical Habitat Unit 3
Acres San Diego 0.00 :1 9 0.00 $30,000 Acres 0.00 0.00 0.00 0.00 0.00Units Annual Cost $0 $0 $0 $0 $0
NPV $0Critical Habitat Unit 4
Acres San Diego 0.00 :1 0 0.00 $30,000 Acres 0.00 0.00 0.00 0.00 0.00Units Annual Cost $0 $0 $0 $0 $0
NPV $0Critical Habitat Unit 5
Acres San Diego 0.00 :1 4 0.00 $30,000 Acres 0.00 0.00 0.00 0.00 0.00Units Annual Cost $0 $0 $0 $0 $0
NPV $0Critical Habitat Unit 6
Acres Orange 0.00 :1 0 0.00 $30,000 Acres 0.00 0.00 0.00 0.00 0.00Units Annual Cost $0 $0 $0 $0 $0
Acres San Diego 0.00 :1 0 0.00 $30,000 Acres 0.00 0.00 0.00 0.00 0.00Units Annual Cost $0 $0 $0 $0 $0
Total NPV $0Critical Habitat Unit 7
Acres Orange 0.00 :1 2 0.00 $30,000 Acres 0.00 0.00 0.00 0.00 0.00Units Annual Cost $0 $0 $0 $0 $0
NPV $0Critical Habitat Unit 8
Acres Los Angeles 0.93 :1 0 0.00 $30,000 Acres 0.00 0.00 0.00 0.00 0.00Units Annual Cost $0 $0 $0 $0 $0
NPV $0Critical Habitat Unit 9
Acres Los Angeles 0.93 :1 32 29.66 $30,000 Acres 1.29 1.29 1.29 1.29 1.29Units Annual Cost $38,687 $38,687 $38,687 $38,687 $38,687
Acres Orange 0.00 :1 23 0.00 $30,000 Acres 0.00 0.00 0.00 0.00 0.00Units Annual Cost $0 $0 $0 $0 $0
Acres Riverside 0.00 :1 2 0.00 $30,000 Acres 0.00 0.00 0.00 0.00 0.00Units Annual Cost $0 $0 $0 $0 $0
Acres San Bernardino 0.40 :1 2 0.97 $30,000 Acres 0.04 0.04 0.04 0.04 0.04Units Annual Cost $1,261 $1,261 $1,261 $1,261 $1,261
RestorationMitigation Ratio (1)
Projected Retail Development
Economic & Planning Systems, Inc. 2/26/2004 H:\12594\Model\\EmailTables_Feb2004.xls

Table E-10CSS Restoration Calculations for Projected Retail Development
Proposed Critical County Restoration Calculations by Year (4)Habitat Unit Projected Acres Acres Avg. Restoration 2003 2004 2005 2006 2007
Developed (2) Restored Cost per Acre (3) 1 2 3 4 5
RestorationMitigation Ratio (1)
Projected Retail Development
Total NPV $308,340Critical Habitat Unit 10
Acres Orange 0.00 :1 0 0.00 $30,000 Acres 0.00 0.00 0.00 0.00 0.00Units Annual Cost $0 $0 $0 $0 $0
Acres Riverside 0.00 :1 1,035 0.00 $30,000 Acres 0.00 0.00 0.00 0.00 0.00Units Annual Cost $0 $0 $0 $0 $0
Acres San Bernardino 0.40 :1 1 0.44 $30,000 Acres 0.02 0.02 0.02 0.02 0.02Units Annual Cost $572 $572 $572 $572 $572
Acres San Diego 0.00 :1 0 0.00 $30,000 Acres 0.00 0.00 0.00 0.00 0.00Units Annual Cost $0 $0 $0 $0 $0
Total NPV $4,419Critical Habitat Unit 11
Acres San Bernardino 0.40 :1 121 48.48 $30,000 Acres 2.11 2.11 2.11 2.11 2.11Units Annual Cost $63,236 $63,236 $63,236 $63,236 $63,236
NPV $488,080Critical Habitat Unit 12
Acres Los Angeles 0.93 :1 12 11.48 $30,000 Acres 0.50 0.50 0.50 0.50 0.50Units Annual Cost $14,979 $14,979 $14,979 $14,979 $14,979
NPV $115,614Critical Habitat Unit 13
Acres Los Angeles 0.93 :1 234 218.04 $30,000 Acres 9.48 9.48 9.48 9.48 9.48Units Annual Cost $284,395 $284,395 $284,395 $284,395 $284,395
Acres Ventura 0.93 :1 265 246.29 $30,000 Acres 10.71 10.71 10.71 10.71 10.71Units Annual Cost $321,252 $321,252 $321,252 $321,252 $321,252
Total NPV $4,674,651Total NPV, All Units:
(1) Based on review of selected Biological Opinions, as summarized in Table 11 and detailed in Appendix C. Mitigation ratios is Ventura County were assumed to be the same as in Los Angeles, because no Biological Opinions were provided for
projects in Ventura involving the CAGN.(2) Equal to Projected Growth Acres minus Acres Set-aside (Table E-1)(3) Table 15(4) Assumes projected development is distributed evenly throughout 2025.
$5,591,104
Economic & Planning Systems, Inc. 2/26/2004 H:\12594\Model\\EmailTables_Feb2004.xls

Table E-10CSS Restoration Calculations for Projected Retail Development
Proposed Critical CountyHabitat Unit
Critical Habitat Unit 1Acres San DiegoUnits
Critical Habitat Unit 2Acres San DiegoUnits
Critical Habitat Unit 3Acres San DiegoUnits
Critical Habitat Unit 4Acres San DiegoUnits
Critical Habitat Unit 5Acres San DiegoUnits
Critical Habitat Unit 6Acres OrangeUnits
Acres San DiegoUnits
Critical Habitat Unit 7Acres OrangeUnits
Critical Habitat Unit 8Acres Los AngelesUnits
Critical Habitat Unit 9Acres Los AngelesUnits
Acres OrangeUnits
Acres RiversideUnits
Acres San BernardinoUnits
Restoration Calculations by Year (4)2008 2009 2010 2011 2012 2013 2014 2015 2016 2017
6 7 8 9 10 11 12 13 14 15
0.00 0.00 0.00 0.00 0.00 0.00 0.00 0.00 0.00 0.00$0 $0 $0 $0 $0 $0 $0 $0 $0 $0
0.00 0.00 0.00 0.00 0.00 0.00 0.00 0.00 0.00 0.00$0 $0 $0 $0 $0 $0 $0 $0 $0 $0
0.00 0.00 0.00 0.00 0.00 0.00 0.00 0.00 0.00 0.00$0 $0 $0 $0 $0 $0 $0 $0 $0 $0
0.00 0.00 0.00 0.00 0.00 0.00 0.00 0.00 0.00 0.00$0 $0 $0 $0 $0 $0 $0 $0 $0 $0
0.00 0.00 0.00 0.00 0.00 0.00 0.00 0.00 0.00 0.00$0 $0 $0 $0 $0 $0 $0 $0 $0 $0
0.00 0.00 0.00 0.00 0.00 0.00 0.00 0.00 0.00 0.00$0 $0 $0 $0 $0 $0 $0 $0 $0 $0
0.00 0.00 0.00 0.00 0.00 0.00 0.00 0.00 0.00 0.00$0 $0 $0 $0 $0 $0 $0 $0 $0 $0
0.00 0.00 0.00 0.00 0.00 0.00 0.00 0.00 0.00 0.00$0 $0 $0 $0 $0 $0 $0 $0 $0 $0
0.00 0.00 0.00 0.00 0.00 0.00 0.00 0.00 0.00 0.00$0 $0 $0 $0 $0 $0 $0 $0 $0 $0
1.29 1.29 1.29 1.29 1.29 1.29 1.29 1.29 1.29 1.29$38,687 $38,687 $38,687 $38,687 $38,687 $38,687 $38,687 $38,687 $38,687 $38,687
0.00 0.00 0.00 0.00 0.00 0.00 0.00 0.00 0.00 0.00$0 $0 $0 $0 $0 $0 $0 $0 $0 $0
0.00 0.00 0.00 0.00 0.00 0.00 0.00 0.00 0.00 0.00$0 $0 $0 $0 $0 $0 $0 $0 $0 $0
0.04 0.04 0.04 0.04 0.04 0.04 0.04 0.04 0.04 0.04$1,261 $1,261 $1,261 $1,261 $1,261 $1,261 $1,261 $1,261 $1,261 $1,261
Economic & Planning Systems, Inc. 2/26/2004 H:\12594\Model\\EmailTables_Feb2004.xls

Table E-10CSS Restoration Calculations for Projected Retail Development
Proposed Critical CountyHabitat Unit
Critical Habitat Unit 10Acres OrangeUnits
Acres RiversideUnits
Acres San BernardinoUnits
Acres San DiegoUnits
Critical Habitat Unit 11Acres San BernardinoUnits
Critical Habitat Unit 12Acres Los AngelesUnits
Critical Habitat Unit 13Acres Los AngelesUnits
Acres VenturaUnits
Total NPV, All Units:
Restoration Calculations by Year (4)2008 2009 2010 2011 2012 2013 2014 2015 2016 2017
6 7 8 9 10 11 12 13 14 15
0.00 0.00 0.00 0.00 0.00 0.00 0.00 0.00 0.00 0.00$0 $0 $0 $0 $0 $0 $0 $0 $0 $0
0.00 0.00 0.00 0.00 0.00 0.00 0.00 0.00 0.00 0.00$0 $0 $0 $0 $0 $0 $0 $0 $0 $0
0.02 0.02 0.02 0.02 0.02 0.02 0.02 0.02 0.02 0.02$572 $572 $572 $572 $572 $572 $572 $572 $572 $572
0.00 0.00 0.00 0.00 0.00 0.00 0.00 0.00 0.00 0.00$0 $0 $0 $0 $0 $0 $0 $0 $0 $0
2.11 2.11 2.11 2.11 2.11 2.11 2.11 2.11 2.11 2.11$63,236 $63,236 $63,236 $63,236 $63,236 $63,236 $63,236 $63,236 $63,236 $63,236
0.50 0.50 0.50 0.50 0.50 0.50 0.50 0.50 0.50 0.50$14,979 $14,979 $14,979 $14,979 $14,979 $14,979 $14,979 $14,979 $14,979 $14,979
9.48 9.48 9.48 9.48 9.48 9.48 9.48 9.48 9.48 9.48$284,395 $284,395 $284,395 $284,395 $284,395 $284,395 $284,395 $284,395 $284,395 $284,395
10.71 10.71 10.71 10.71 10.71 10.71 10.71 10.71 10.71 10.71$321,252 $321,252 $321,252 $321,252 $321,252 $321,252 $321,252 $321,252 $321,252 $321,252
Economic & Planning Systems, Inc. 2/26/2004 H:\12594\Model\\EmailTables_Feb2004.xls

Table E-10CSS Restoration Calculations for Projected Retail Development
Proposed Critical CountyHabitat Unit
Critical Habitat Unit 1Acres San DiegoUnits
Critical Habitat Unit 2Acres San DiegoUnits
Critical Habitat Unit 3Acres San DiegoUnits
Critical Habitat Unit 4Acres San DiegoUnits
Critical Habitat Unit 5Acres San DiegoUnits
Critical Habitat Unit 6Acres OrangeUnits
Acres San DiegoUnits
Critical Habitat Unit 7Acres OrangeUnits
Critical Habitat Unit 8Acres Los AngelesUnits
Critical Habitat Unit 9Acres Los AngelesUnits
Acres OrangeUnits
Acres RiversideUnits
Acres San BernardinoUnits
Restoration Calculations by Year (4)2018 2019 2020 2021 2022 2023 2024 2025
16 17 18 19 20 21 22 23
0.00 0.00 0.00 0.00 0.00 0.00 0.00 0.00$0 $0 $0 $0 $0 $0 $0 $0
0.00 0.00 0.00 0.00 0.00 0.00 0.00 0.00$0 $0 $0 $0 $0 $0 $0 $0
0.00 0.00 0.00 0.00 0.00 0.00 0.00 0.00$0 $0 $0 $0 $0 $0 $0 $0
0.00 0.00 0.00 0.00 0.00 0.00 0.00 0.00$0 $0 $0 $0 $0 $0 $0 $0
0.00 0.00 0.00 0.00 0.00 0.00 0.00 0.00$0 $0 $0 $0 $0 $0 $0 $0
0.00 0.00 0.00 0.00 0.00 0.00 0.00 0.00$0 $0 $0 $0 $0 $0 $0 $0
0.00 0.00 0.00 0.00 0.00 0.00 0.00 0.00$0 $0 $0 $0 $0 $0 $0 $0
0.00 0.00 0.00 0.00 0.00 0.00 0.00 0.00$0 $0 $0 $0 $0 $0 $0 $0
0.00 0.00 0.00 0.00 0.00 0.00 0.00 0.00$0 $0 $0 $0 $0 $0 $0 $0
1.29 1.29 1.29 1.29 1.29 1.29 1.29 1.29$38,687 $38,687 $38,687 $38,687 $38,687 $38,687 $38,687 $38,687
0.00 0.00 0.00 0.00 0.00 0.00 0.00 0.00$0 $0 $0 $0 $0 $0 $0 $0
0.00 0.00 0.00 0.00 0.00 0.00 0.00 0.00$0 $0 $0 $0 $0 $0 $0 $0
0.04 0.04 0.04 0.04 0.04 0.04 0.04 0.04$1,261 $1,261 $1,261 $1,261 $1,261 $1,261 $1,261 $1,261
Economic & Planning Systems, Inc. 2/26/2004 H:\12594\Model\\EmailTables_Feb2004.xls

Table E-10CSS Restoration Calculations for Projected Retail Development
Proposed Critical CountyHabitat Unit
Critical Habitat Unit 10Acres OrangeUnits
Acres RiversideUnits
Acres San BernardinoUnits
Acres San DiegoUnits
Critical Habitat Unit 11Acres San BernardinoUnits
Critical Habitat Unit 12Acres Los AngelesUnits
Critical Habitat Unit 13Acres Los AngelesUnits
Acres VenturaUnits
Total NPV, All Units:
Restoration Calculations by Year (4)2018 2019 2020 2021 2022 2023 2024 2025
16 17 18 19 20 21 22 23
0.00 0.00 0.00 0.00 0.00 0.00 0.00 0.00$0 $0 $0 $0 $0 $0 $0 $0
0.00 0.00 0.00 0.00 0.00 0.00 0.00 0.00$0 $0 $0 $0 $0 $0 $0 $0
0.02 0.02 0.02 0.02 0.02 0.02 0.02 0.02$572 $572 $572 $572 $572 $572 $572 $572
0.00 0.00 0.00 0.00 0.00 0.00 0.00 0.00$0 $0 $0 $0 $0 $0 $0 $0
2.11 2.11 2.11 2.11 2.11 2.11 2.11 2.11$63,236 $63,236 $63,236 $63,236 $63,236 $63,236 $63,236 $63,236
0.50 0.50 0.50 0.50 0.50 0.50 0.50 0.50$14,979 $14,979 $14,979 $14,979 $14,979 $14,979 $14,979 $14,979
9.48 9.48 9.48 9.48 9.48 9.48 9.48 9.48$284,395 $284,395 $284,395 $284,395 $284,395 $284,395 $284,395 $284,395
10.71 10.71 10.71 10.71 10.71 10.71 10.71 10.71$321,252 $321,252 $321,252 $321,252 $321,252 $321,252 $321,252 $321,252
Economic & Planning Systems, Inc. 2/26/2004 H:\12594\Model\\EmailTables_Feb2004.xls

APPENDIX F
CONSULTATION COST MODEL

Final Draft ReportEconomic Analysis of Critical Habitat Designation for California Gnatcatcher
1H:\12594gnatcatcher\Report\DEA _Feb2004\CAG N_D EA_Feb2004.wpd5
Estimates of the cost of an individual consultation were developed from a review and
analysis of historical section 7 files from a number of Service field offices around the
country. These files addressed consultations conducted for both listings and CH
designations. Cost figures were based on an average level of effort for consultations of
low, medium, or high complexity, multiplied by the appropriate labor rates for staff4736
from the Service and other Federal agencies. Estimates take into consideration the level
of effort of the Service, the Action agency, and the applicant during both formal and
informal consultations, as well as the varying complexity of consultations. Informal
consultations are assumed to involve a low to medium level of complexity. Formal
consultations are assumed to involve a medium to high level of complexity. The cost of4741
a formal consultation includes the cost of the informal consultation that likely began the
section 7 consultation process.
Section 7 consultation costs include the administrative costs associated with conducting
the consultation, such as the cost of time spent in meetings, preparing letters, and in4746
some cases, developing a biological assessment and biological opinion. The costs of
reinitiating a consultation are assumed to be similar to conducting the original
consultation, because the re-initiation generally involves time spent in meetings and
preparing letters. This analysis assumes that the economic impact associated with a
non-substantive reinitiation is similar to the cost of an informal consultation and the4751
economic impact associated with a substantive re-initiation is similar to the cost of a
formal consultation. The cost of internal consultation, where the Service is the Action
agency, depends on the activity under consideration and may be similar to the costs of
either informal or formal consultations.
4756
Cost estimates for technical assistance are based on an analysis of past technical
assistance efforts by the Service in southern California. Technical assistance costs
represent the estimated economic costs of informational conversations, letters, and
meetings between landowners or developers and the Service regarding the designation
of CH. Most likely, such communication will occur between municipal or private4761
property owners and the Service regarding areas designated as CH or lands adjacent to
CH.

Final Draft ReportEconomic Analysis of Critical Habitat Designation for California Gnatcatcher
105Scenario A assumes discount rates of 12 percent and 7 percent for private and public development,
respectively. Scenario B assumes a discount rate of 3 percent for both private and publicdevelopment.
2H:\12594gnatcatcher\Report\DEA _Feb2004\CAG N_D EA_Feb2004.wpd5
Estimated administrative costs associated with section 7 consultations, reinitiations, and
technical assistance efforts are presented in Table F-1 (these are per effort estimates). 4766
The low and the high scenarios represent a reasonable range of costs for each type of
interaction. For example, when the Service participates in technical assistance with a
third party regarding a particular activity, the cost of the Service's effort is expected to
be approximately $260 to $680. The cost of the third party's effort is expected to be
approximately $600 to $1,500. A summary of total costs by agency and consultation4771
type is shown in Table F-2, for both Scenario A and Scenario B.105 A description of the
number of anticipated consultations by project is shown in Table F-3. Project-level cost
summaries by agency are shown in Tables F-4A and F-4B (for Scenario A and B,
respectively). Project-level cost summaries by consultation type are shown in Tables F-
5A and F-5B (for Scenario A and B, respectively).4776
Project modifications may be agreed upon during both informal and formal
consultations. The costs of modifications are estimated on a case-specific basis, relying
on information provided by the Service, action agencies, and private parties involved in
the consultations. Likely project modifications and associated costs are addressed in the4781
main report text, for each relevant activity.

Table F-1Individual Consultation and Technical Assistance Costs [1]Economic Analysis of Critical Habitat Designation for the California Gnatcatcher
CategoryLow High Low High Low High
USFWS $260 $680 $1,000 $3,100 $3,100 $6,100
Action Agency $0 $0 $1,300 $3,900 $3,900 $6,500
Third Party $600 $1,500 $1,200 $2,900 $2,900 $4,100
Biological Assessment $0 $0 $0 $4,000 $4,000 $5,600
Notes:[1] A low to high cost range is specified for each action.
Technical Assistance Informal Consultations Formal Consultations
Economic & Planning Systems, Inc. 2/26/2004 H:\12594gnatcatcher\Report\DEA_Feb2004\EmailTables_Feb2004.xls

Table F-2Consultation and Technical Assistance Administrative Cost SummaryEconomic Analysis of Critical Habitat Designation for the California Gnatcatcher
CategoryLow High Low High Low High Low High
USFWS $848 $2,218 $184,916 $573,240 $3,760,317 $7,399,333 $3,946,081 $7,974,791
Action Agency $0 $0 $240,391 $721,172 $4,730,721 $7,884,536 $4,971,112 $8,605,708
Third Party $1,957 $4,892 $14,872 $35,942 $3,755,230 $5,309,118 $3,772,059 $5,349,952
Biological Assessments $0 $0 $0 $0 $4,621,793 $6,470,510 $4,621,793 $6,470,510
TOTAL $2,805 $7,110 $440,179 $1,330,353 $16,868,061 $27,063,497 $17,311,045 $28,400,961
Notes:[1] Formal Consultation cost totals include Biological Assessment costs.
Technical Assistance Informal Consultation Formal Consultation [1] TOTAL
Economic & Planning Systems, Inc. 2/26/2004 H:\12414\Report\EmailTables_Feb2004.xls

Table F-3Consultation Descriptions for Future ActivitiesEconomic Analysis of Proposed Critical Habitat Designation for the California Gnatcatcher
Consultation Nexus
Project Owner/Activity Action AgencyTechnical
AssistanceInformal 3rd Party
Private Land Development USACE - - - 866 1259 866
Transportation and Road Construction
Caltrans USACE/FHWA - - - 191 191 191
Transportation Corridor Agency USACE - - - 1 1 1
Municipal Water Supply
Regional Infrastructure USACE - - - 13 13 13
Flood Control BOR - 12 12 3 3 3
Municipal Power Supply USACE/FERC/BLM - - - 6 6 6
Federal Land Management
Angeles National Forest USFS - 23 - - - -
Cleveland National Forest USFS - 41 - 41 - 21
San Bernardino National Forest USFS - 5 - 5 - 5
Bureau of Land Management BLM 3 12 - 4 - 4
Federal Emergency Management Activities FEMA - 75 - 30 - 30
Military Operations
Camp Pendleton (non-training areas) USMC - - - 37 - 0
Fallbrook US Navy - - - 16 - 16
El Toro US Navy - - - 1 - 1
Existing Habitat Conservation Plans (HCPs) USFWS - 28 28 8 8 8
Future Habitat Conservation Plans (HCPs) USFWS - - - 16 16 -
Reinitiated Section 7 Consultations USFWS - - - - - -
Total (2) 3 197 40 1,237 1,496 1,163
[1] The number reported in this column reflects the total number of third parties participating in formal consultations (for example, if there are three formal consultations and one third party listed, only one consultation includes a third party participant).(2) Because training areas in Marine Corps Base Camp Pendleton have not been proposed for critical habitat designation, estimated consultation costs for these areas are not included in the total.
Consultation Descriptions
Informal Consultations
Formal Consultations
Formal 3rd Party [1]
Biological Assessments [2]
Economic & Planning Systems, Inc. 2/26/2004 H:\12594gnatcatcher\Report\DEA_Feb2004\EmailTables_Feb2004.xls

Table F-4 (1)Consultation Costs by Agency and PartyEconomic Analysis of Proposed Critical Habitat Designation for the California Gnatcatcher
Consultation Nexus
Project Owner/Activity Action Agency
Low High Low High Low High Low High
Private Land Development (2) USACE $2,062,942 $3,399,496 $1,133,165 $1,888,609 $1,052,757 $1,488,381 $4,248,864 $6,776,485
Transportation and Road Construction
Caltrans USACE/FHWA $663,318 $1,093,073 $364,358 $607,263 $270,933 $383,043 $1,298,608 $2,083,379
Transportation Corridor Agency (3) USACE $7,100 $11,700 $3,900 $6,500 $2,900 $4,100 $13,900 $22,300
Municipal Water Supply
Regional Infrastructure USACE $45,396 $74,807 $24,936 $41,559 $18,542 $26,214 $88,873 $142,581
Flood Control BOR $15,153 $33,791 $12,883 $32,001 $10,997 $28,932 $39,034 $94,723
Municipal Power Supply USACE/FERC/BLM $20,428 $33,663 $11,221 $18,702 $8,344 $11,796 $39,993 $64,161
Federal Land Management
Angeles National Forest USFS $11,272 $34,944 $14,654 $43,962 $0 $0 $25,926 $78,905
Cleveland National Forest USFS $122,915 $241,800 $104,780 $209,560 $0 $0 $227,695 $451,360
San Bernardino National Forest USFS $19,849 $36,267 $12,742 $25,485 $0 $0 $32,591 $61,752
Bureau of Land Management BLM $20,108 $42,359 $15,377 $36,157 $959 $2,398 $36,444 $80,913
Federal Emergency Management Activities FEMA $141,174 $286,025 $105,145 $238,967 $0 $0 $246,319 $524,991
Military Operations
Camp Pendleton (non-training areas) USMC $56,214 $110,614 $70,721 $117,868 $0 $0 $126,935 $228,482
Fallbrook US Navy $55,675 $91,746 $30,582 $50,970 $0 $0 $86,257 $142,716
El Toro (3) US Navy $7,100 $11,700 $3,900 $6,500 $0 $0 $11,000 $18,200
Existing Habitat Conservation Plans (HCPs) USFWS $0 $0 $0 $0 $0 $0 $0 $0
Future Habitat Conservation Plans (HCPs) USFWS $7,842 $24,309 $10,194 $30,582 $0 $0 $18,035 $54,891
Reinitiated Section 7 Consultations USFWS $0 $0 $0 $0 $0 $0 $0 $0
Total (4) $3,256,485 $5,526,293 $1,918,558 $3,354,683 $1,365,432 $1,944,864 $6,540,475 $10,825,839
(1) Unless otherwise noted, the reported values are the net present value of future costs, assuming that all future costs are distributed evenly through 2025, and using a discount rate of 7 percent.
(2) The reported values are the net present value of future costs, assuming that all future costs are distributed evenly through 2025, and using a discount rate of 12 percent.
(3) The reported values are consultation costs expressed in constant dollars, assuming all costs are incurred in year 1 (2003).
(4) Because training areas in Marine Corps Base Camp Pendleton have not been proposed for critical habitat designation, estimated consultation costs for these areas are not included in the total.
Third Party Total Fish and Wildlife Service
Consultation Costs (1)
Action Agency
Economic & Planning Systems, Inc. 2/26/2004 H:\12594gnatcatcher\Report\DEA_Feb2004\EmailTables_Feb2004.xls

Table F-5 (1)Consultation Costs by Consultation TypeEconomic Analysis of Proposed Critical Habitat Designation for the California Gnatcatcher
Consultation Nexus
Project Owner/Activity Action Agency
Low High Low High Low High Low High
Private Land Development (2) USACE - - - - $3,086,643 $5,149,376 $1,162,221 $1,627,109
Transportation and Road Construction
Caltrans USACE/FHWA - - - - $924,908 $1,560,198 $373,700 $523,180
Transportation Corridor Agency (3) USACE - - - - $9,900 $16,700 $4,000 $5,600
Municipal Water Supply
Regional Infrastructure USACE - - - - $63,298 $106,776 $25,575 $35,805
Flood Control BOR - - $21,259 $60,133 $12,660 $21,355 $5,115 $7,161
Municipal Power Supply USACE/FERC/BLM - - - - $28,484 $48,049 $11,509 $16,112
Federal Land Management
Angeles National Forest USFS - - $25,926 $78,905 - - $0 $0
Cleveland National Forest USFS - - $46,345 $141,050 $141,050 $253,890 $40,300 $56,420
San Bernardino National Forest USFS - - $5,636 $17,153 $17,153 $30,876 $9,802 $13,723
Bureau of Land Management BLM 1,375 3,485 $13,970 $42,518 $13,427 $24,168 $7,673 $10,742
Federal Emergency Management Activities FEMA - - $84,557 $257,349 $102,939 $185,291 $58,823 $82,352
Military Operations
Camp Pendleton (non-training areas) USMC - - - - $126,935 $228,482 $0 $0
Fallbrook US Navy - - - - $54,891 $98,803 $31,366 $43,913
El Toro (3) US Navy - - - - $7,000 $12,600 $4,000 $5,600
Existing Habitat Conservation Plans (HCPs) USFWS - - - - $0 $0 $0 $0
Future Habitat Conservation Plans (HCPs) USFWS - - - - $158,400 $267,200 $0 $0
Reinitiated Section 7 Consultations USFWS - - - - - - $0 $0
Total (4) $1,375 $3,485 $197,694 $597,109 $4,747,688 $8,003,765 $1,734,083 $2,427,716
(1) Unless otherwise noted, the reported values are the net present value of future costs, assuming that all future costs are distributed evenly through 2025, and using a discount rate of 7 percent.
(2) The reported values are the net present value of future costs, assuming that all future costs are distributed evenly through 2025, and using a discount rate of 12 percent.
(3) The reported values are consultation costs expressed in constant dollars, assuming all costs are incurred in year 1 (2003).
(4) Because training areas in Marine Corps Base Camp Pendleton have not been proposed for critical habitat designation, estimated consultation costs for these areas are not included in the total.
Formal ConsultationsInformal Consultations Biological Assessments
Consultation Costs (1)
Technical Assistance
Economic & Planning Systems, Inc. 2/26/2004 H:\12594gnatcatcher\Report\DEA_Feb2004\EmailTables_Feb2004.xls

APPENDIX G
PROJECT MODIFICATION COST CALCULATIONS FORPUBLIC LAND DEVELOPMENT

Appendix Table G-1Project Modification Costs for Caltrans District 7
Year 2003 2004 2005 2006 2007 2008 2009 2010Project Modification Costs 1 2 3 4 5 6 7 8
Total Impact (ac) 6 Annual Acres Impacted 1.0 0.0 0.0 0.0 1.0 0.0 0.0 0.0Mitigation Ratio 1 :1 Annual Acres Mitigated 1.0 0.0 0.0 0.0 1.0 0.0 0.0 0.0Cost/Ac 116,667$ Annual Mitigation Cost 116,667$ -$ -$ -$ 116,667$ -$ -$ -$
Discount Rate 7.0%NPV 369,198$ Year 2011 2012 2013 2014 2015 2016 2017 2018
9 10 11 12 13 14 15 16Acre Adj. 100%Adj. NPV 369,198$ Annual Acres Impacted 1.0 0.0 0.0 0.0 1.0 0.0 0.0 0.0
Annual Acres Mitigated 1.0 0.0 0.0 0.0 1.0 0.0 0.0 0.0Annual Mitigation Cost 116,667$ -$ -$ -$ 116,667$ -$ -$ -$
Year 2019 2020 2021 2022 2023 2024 202517 18 19 20 21 22 23 TOTAL
Annual Acres Impacted 1.0 0.0 0.0 0.0 1.0 0.0 0.0 6.0Annual Acres Mitigated 1.0 0.0 0.0 0.0 1.0 0.0 0.0 6.0Annual Mitigation Cost 116,667$ -$ -$ -$ 116,667$ -$ -$ 700,000$
Economic & Planning Systems, Inc. 2/26/2004 H:\12594gnatcatcher\Report\DEA_Feb2004\EmailTables_Feb2004.xls

Appendix Table G-2Project Modification Costs for Caltrans District 8
Year 2003 2004 2005 2006 2007 2008 2009 2010Project Modification Costs 1 2 3 4 5 6 7 8
Unit 10 Impact 750 acres Annual Acres Impacted 39.1 39.1 39.1 39.1 39.1 39.1 39.1 39.1Riverside growth 22,648 acres Annual Acres Mitigated 117.3 117.3 117.3 117.3 117.3 117.3 117.3 117.3Impact/1,000 ac 33.1 Annual Mitigation Cost 3,752,724$ 3,752,724$ 3,752,724$ 3,752,724$ 3,752,724$ 3,752,724$ 3,752,724$ 3,752,724$ Unit 11 Growth 4,502 acresUnit 11 Impact 149Total Impact 899 acres Year 2011 2012 2013 2014 2015 2016 2017 2018
9 10 11 12 13 14 15 16Mitigation Ratio 3 :1Cost/Ac 32,000$ Annual Acres Impacted 39.1 39.1 39.1 39.1 39.1 39.1 39.1 39.1
Annual Acres Mitigated 117.3 117.3 117.3 117.3 117.3 117.3 117.3 117.3Discount Rate 7.0% Annual Mitigation Cost 3,752,724$ 3,752,724$ 3,752,724$ 3,752,724$ 3,752,724$ 3,752,724$ 3,752,724$ 3,752,724$ NPV 42,301,405$
Acre Adj. 100% Year 2019 2020 2021 2022 2023 2024 2025Adj. NPV 42,301,405$ 17 18 19 20 21 22 23 TOTAL
Annual Acres Impacted 39.1 39.1 39.1 39.1 39.1 39.1 39.1 899.1Annual Acres Mitigated 117.3 117.3 117.3 117.3 117.3 117.3 117.3 2697.3Annual Mitigation Cost 3,752,724$ 3,752,724$ 3,752,724$ 3,752,724$ 3,752,724$ 3,752,724$ 3,752,724$ 86,312,646$
Economic & Planning Systems, Inc. 2/26/2004 H:\12594gnatcatcher\Report\DEA_Feb2004\EmailTables_Feb2004.xls

Appendix Table G-3Project Modification Costs for Caltrans District 11
Project Modification Costs Year 2003 2004 2005 2006 2007 2008 2009 20101 2 3 4 5 6 7 8
Total Impact (ac) 71.5Annual Acres Impacted 3.1 3.1 3.1 3.1 3.1 3.1 3.1 3.1
SD Mitigation Ratio 2.06 :1 Annual Acres Mitigated 0.2 0.2 0.2 0.2 0.2 0.2 0.2 0.2CEQA baseline 2.00 :1 Annual Mitigation Cost 5,770$ 5,770$ 5,770$ 5,770$ 5,770$ 5,770$ 5,770$ 5,770$ "Net" mitigation ratio 0.06 :1
Cost/Ac 32,000$ Year 2011 2012 2013 2014 2015 2016 2017 20189 10 11 12 13 14 15 16
Discount Rate 7.0%NPV 65,038$ Annual Acres Impacted 3.1 3.1 3.1 3.1 3.1 3.1 3.1 3.1
Annual Acres Mitigated 0.2 0.2 0.2 0.2 0.2 0.2 0.2 0.2Acre Adj. 36% Annual Mitigation Cost 5,770$ 5,770$ 5,770$ 5,770$ 5,770$ 5,770$ 5,770$ 5,770$ Adj. NPV 23,480$
Year 2019 2020 2021 2022 2023 2024 202517 18 19 20 21 22 23 TOTAL
Annual Acres Impacted 3.1 3.1 3.1 3.1 3.1 3.1 3.1 71.5Annual Acres Mitigated 0.2 0.2 0.2 0.2 0.2 0.2 0.2 4.1Annual Mitigation Cost 5,770$ 5,770$ 5,770$ 5,770$ 5,770$ 5,770$ 5,770$ 132,704$
Economic & Planning Systems, Inc. 2/26/2004 H:\12594gnatcatcher\Report\DEA_Feb2004\EmailTables_Feb2004.xls

Appendix Table G-4Project Modification Costs for Caltrans District 12
Project Modification Costs Year 2003 2004 2005 2006 2007 2008 2009 20101 2 3 4 5 6 7 8
Units 1-5 Impact 72 acresSan Diego growth 35,065 acres Annual Acres Impacted 1.0 1.0 1.0 1.0 1.0 1.0 1.0 1.0Impact/1,000 ac 2.1 Annual Acres Mitigated 1.9 1.9 1.9 1.9 1.9 1.9 1.9 1.9Unit 11 Growth 11,486 acres Annual Mitigation Cost 59,148$ 59,148$ 59,148$ 59,148$ 59,148$ 59,148$ 59,148$ 59,148$ Unit 11 Impact 24 acres
Orange Mitigation Ratio 3.82 :1 Year 2011 2012 2013 2014 2015 2016 2017 2018CEQA baseline 2.00 :1 9 10 11 12 13 14 15 16"Net" mitigation ratio 1.82 :1
Annual Acres Impacted 1.0 1.0 1.0 1.0 1.0 1.0 1.0 1.0Cost/Ac 31,692$ Annual Acres Mitigated 1.9 1.9 1.9 1.9 1.9 1.9 1.9 1.9
Annual Mitigation Cost 59,148$ 59,148$ 59,148$ 59,148$ 59,148$ 59,148$ 59,148$ 59,148$ Discount Rate 7.0%NPV 666,723$
Year 2019 2020 2021 2022 2023 2024 2025Acre Adj. 67% 17 18 19 20 21 22 23 TOTALAdj. NPV 443,790$
Annual Acres Impacted 1.0 1.0 1.0 1.0 1.0 1.0 1.0 23.6Annual Acres Mitigated 1.9 1.9 1.9 1.9 1.9 1.9 1.9 42.9Annual Mitigation Cost 59,148$ 59,148$ 59,148$ 59,148$ 59,148$ 59,148$ 59,148$ 1,360,395$
Economic & Planning Systems, Inc. 2/26/2004 H:\12594gnatcatcher\Report\DEA_Feb2004\EmailTables_Feb2004.xls

Appendix Table G-5Project Modification Costs for TCA Construction of Foothill-South Toll Road -- Far East Alignment
Toll Road Construction Assumptions:Year 2003 2004 2005 2006 2007 2008 2009 2010
16 Rd miles 1 2 3 4 5 6 7 85280 ft/mile
84,480 Linear Feet Annual CSS Acres Impacted 0 0 145 145 145 145 0 0300 ROW width (ft) Annual mitigation acres 0 0 265 265 265 265 0 0
25,344,000 footprint (sq ft) Annual Proj. Mod. Cost $0 $0 $20,736,970 $20,736,970 $20,736,970 $20,736,970 $0 $0581.8 footprint (ac)100% Assumed CSS coverage581.8 Est. impacts to CSS Year 2011 2012 2013 2014 2015 2016 2017 2018
9 10 11 12 13 14 15 16CSS Mitigation Assumptions:CSS Acres Impacted 581.8 Annual mitigation acres 0 0 0 0 0 0 0 0
Annual Proj. Mod. Cost $0 $0 $0 $0 $0 $0 $0 $0Section 7 mitigation ratio 3.8 :1CEQA baseline CSS mitigation 2.0 :1Effective CSS baseline 1.8 :1 Year 2019 2020 2021 2022 2023 2024 2025
17 18 19 20 21 22 23 TOTALCost per acre mitigated $78,333
Annual CSS Acres Impacted 0 0 0 0 0 0 0 582Discount Rate 7.0% Annual mitigation acres 0 0 0 0 0 0 0NPV $61,350,771 Annual Proj. Mod. Cost $0 $0 $0 $0 $0 $0 $0 $82,947,879
Acre Adj. 100%Adj. NPV 61,350,771$
Economic & Planning Systems, Inc. 2/26/2004 H:\12594gnatcatcher\Report\DEA_Feb2004\EmailTables_Feb2004.xls

Appendix Table G-6Project Modification Costs for TCA Construction of Foothill-South Toll Road -- Arterial Improvement Alternative
Toll Road Construction Assumptions:
I-5 Widening: Arterial Widening (Ant.Pkwy & Av. La Pata): Smart Streets (Ortega Hwy, Camino Las Ramblas, & Av. Pico):4.5 Road miles w/ CSS 10.4 Road miles 9.4 Road miles
23,760 Linear Feet 54,912 Linear Feet 49,632 Linear Feet40 expansion width (ft) 40 ROW width (ft) 10 expansion width (ft)
950,400 footprint (sq ft) 2,196,480 footprint (sq ft) 496320 footprint (sq ft)21.8 footprint (ac) 50.4 footprint (ac) 11.4 footprint (ac)
100% Assumed CSS coverage 100% Assumed CSS coverage 100% Assumed CSS coverage21.8 Est. impacts to CSS 50.4 Est. impacts to CSS 11.4 Est. impacts to CSS
Widening Assumptions: 83.6 Total Acres CSS Affected 2 Total Lanes (one each dir.)
10 Lane Width (ft)10 Shoulder width (ft)40 Total Width (ft)
CSS Mitigation Assumptions:Year 2003 2004 2005 2006 2007 2008 2009 2010
CSS Acres Impacted 83.6 acres 1 2 3 4 5 6 7 8
Section 7 mitigation ratio 3.8 :1 Annual CSS Acres Impacted 0 0 21 21 21 21 0 0CEQA baseline CSS mitigation 2.0 :1 Annual mitigation acres 0 0 38 38 38 38 0 0Effective CSS baseline 1.8 :1 Annual Proj. Mod. Cost $0 $0 $2,980,939 $2,980,939 $2,980,939 $2,980,939 $0 $0
Cost per acre mitigated $78,333Year 2011 2012 2013 2014 2015 2016 2017 2018
Discount Rate 7.0% 9 10 11 12 13 14 15 16NPV $8,819,173
Annual CSS Acres Impacted 0 0 0 0 0 0 0 0Acre Adj. 100% Annual mitigation acres 0 0 0 0 0 0 0 0Adj. NPV 8,819,173$ Annual Proj. Mod. Cost $0 $0 $0 $0 $0 $0 $0 $0
Average, Scenario 1 & 2 (7%) $35,084,972 Year 2019 2020 2021 2022 2023 2024 202517 18 19 20 21 22 23 TOTAL
Annual CSS Acres Impacted 0 0 0 0 0 0 0 84Annual mitigation acres 0 0 0 0 0 0 0Annual Proj. Mod. Cost $0 $0 $0 $0 $0 $0 $0 $11,923,758
Economic & Planning Systems, Inc. 2/26/2004 H:\12594gnatcatcher\Report\DEA_Feb2004\EmailTables_Feb2004.xls

Appendix Table G-7Project Modification Costs for the San Diego County Water Authority
Project Modification Assumptions
Annual CSS Acres Impacted (Temporary)Annual mitigation acres acquired Year 2003 2004 2005 2006 2007 2008 2009 2010Annual Proj. Mod. Cost 1 2 3 4 5 6 7 8
PermanentCSS Impact Acres Impacted Temp/Perm Year Annual CSS Acres Impacted 0.29 0.29 0.29 27 27 27 27 27Project 1 0.86 P 2000-'05 Annual mitigation acres 0 0 0 14 14 14 14 14Project 2 0.5 P 2005-'10 Annual Proj. Mod. Cost $2,150 $2,150 $2,150 $206,175 $206,175 $206,175 $206,175 $206,175Project 3 136.95 P 2005-'10Project 4 8.24 T 2005-'10 TemporaryProject 5 4 P 2010-'15 Annual CSS Acres Impacted 0 0 0 2 2 2 2 2Project 6 0.8 P 2010-'15 Annual mitigation acres 0 0 0 0 0 0 0 0Project 7 2.6 P 2010-'15 Annual Proj. Mod. Cost $0 $0 $0 $7,416 $7,416 $7,416 $7,416 $7,416Project 8 20.72 T 2010-'15Assumed mitigation ratio (Permanent) 0.5 :1
Year 2011 2012 2013 2014 2015 2016 2017 2018Reported mitigation ratio (Temporary) 1.5 :1 9 10 11 12 13 14 15 16Assumed CEQA baseline ratio 1.2 :1 PermanentAssumed mitigation ratio (Temporary) 0.3 :1 Annual CSS Acres Impacted 1.5 1.5 1.5 1.5 1.5 0 0 0
Annual mitigation acres 1 1 1 1 1 0 0 0Cost per acre mitigated (Permanent) $15,000 Annual Proj. Mod. Cost $11,100 $11,100 $11,100 $11,100 $11,100 $0 $0 $0Cost per acre mitigated (Temporary) $15,000
TemporaryDiscount Rate 7.0% Annual CSS Acres Impacted 4 4 4 4 4 0 0 0NPV $791,517 Annual mitigation acres 1 1 1 1 1 0 0 0
Annual Proj. Mod. Cost $18,648 $18,648 $18,648 $18,648 $18,648 $0 $0 $0Acre Adj. 68%Adj. NPV 538,216$
Year 2019 2020 2021 2022 2023 2024 202517 18 19 20 21 22 23 TOTAL
PermanentAnnual CSS Acres Impacted 0 0 0 0 0 0 0 146Annual mitigation acres 0 0 0 0 0 0 0Annual Proj. Mod. Cost $0 $0 $0 $0 $0 $0 $0 $1,092,825
TemporaryAnnual CSS Acres Impacted 0 0 0 0 0 0 0Annual mitigation acres 0 0 0 0 0 0 0Annual Proj. Mod. Cost $0 $0 $0 $0 $0 $0 $0 $130,320
Economic & Planning Systems, Inc. 2/26/2004 H:\12594gnatcatcher\Report\DEA_Feb2004\EmailTables_Feb2004.xls

Appendix Table G-8Project Modification Costs for the Metropolitan Water District
Project Modification Costs Year 2003 2004 2005 2006 2007 2008 2009 20101 2 3 4 5 6 7 8
Annual Acres ImpactedAnnual Acres Mitigated Annual Acres Impacted 8.7 8.7 8.7 8.7 8.7 8.7 8.7 8.7Annual Mitigation Cost Annual Acres Mitigated 18.1 18.1 18.1 18.1 18.1 18.1 18.1 18.1
Annual Mitigation Cost 794,580$ 794,580$ 794,580$ 794,580$ 794,580$ 794,580$ 794,580$ 794,580$ SDCWA impact 146 acresSan Diego growth 35,065 acresImpact/1,000 ac 4.2 Year 2011 2012 2013 2014 2015 2016 2017 2018Growth outside SD 47,987 acres 9 10 11 12 13 14 15 16MWD Impact 199 acres
Annual Acres Impacted 8.7 8.7 8.7 8.7 8.7 8.7 8.7 8.7Average mitigation ratio 2.63 :1 Annual Acres Mitigated 18.1 18.1 18.1 18.1 18.1 18.1 18.1 18.1Est. CEQA baseline 0.54 :1 (1) Annual Mitigation Cost 794,580$ 794,580$ 794,580$ 794,580$ 794,580$ 794,580$ 794,580$ 794,580$ "Net" Mitigation Ratio 2.09 :1 (2)
(3)Cost/Ac 43,917$ Year 2019 2020 2021 2022 2023 2024 2025
17 18 19 20 21 22 23 TOTALDiscount Rate 7.0%NPV 8,956,652$ Annual Acres Impacted 8.7 8.7 8.7 8.7 8.7 8.7 8.7 199.4
Annual Acres Mitigated 18.1 18.1 18.1 18.1 18.1 18.1 18.1 416.1Acre Adj. 68% Annual Mitigation Cost 794,580$ 794,580$ 794,580$ 794,580$ 794,580$ 794,580$ 794,580$ 18,275,335$ Adj. NPV 6,090,353$
(1) (All counties other than San Diego)(2) (2:1 baseline, weighted by relative acreage of Orange County units (3) to all counties other than San Diego)
Economic & Planning Systems, Inc. 2/26/2004 H:\12594gnatcatcher\Report\DEA_Feb2004\EmailTables_Feb2004.xls

Appendix Table G-9Project Modification Costs for the Bureau of Reclamation
Project Modification AssumptionsYear 2003 2004 2005 2006 2007 2008 2009 2010
"Small" Water Reuse Projects 1 2 3 4 5 6 7 8Frequency: 4 projects every 5 years
* 3 informal consultations; 1 formal consultation Annual CSS Acres Impacted 0.5 0.5 0.5 0.5 64 0.5 0.5 0.5CSS Impact per Project 0.5 acres Annual mitigation acres ("net") 0 0 0 0 4 0 0 0
Annual Proj. Mod. Cost $919 $919 $919 $919 $117,642 $919 $919 $919
"Large" Regional Water Infrastructure ProjectsFrequency: One every 5 years Year 2011 2012 2013 2014 2015 2016 2017 2018CSS Impacts per Project 64 acres 9 10 11 12 13 14 15 16
Annual CSS Acres Impacted 0.5 64 0.5 0.5 0.5 0.5 64 0.5Mitigation Assumptions Annual mitigation acres ("net") 0 4 0 0 0 0 4 0CSS Mitigation Ratio: 2.06 Annual Proj. Mod. Cost $919 $117,642 $919 $919 $919 $919 $117,642 $919Baseline mitigation (CEQA): 2.00"Net" section 7 mitigation: 0.06
Year 2019 2020 2021 2022 2023 2024 2025Cost per acre mitigated $31,692 17 18 19 20 21 22 23 TOTAL
Discount Rate 7.0% Annual CSS Acres Impacted 0.5 0.5 0.5 64 0.5 0.5 0.5 266NPV $225,387 Annual mitigation acres ("net") 0 0 0 4 0 0 0 15
Annual Proj. Mod. Cost $919 $919 $919 $117,642 $919 $919 $919 $488,030Acre Adj. 68%Adj. NPV 153,259$
Economic & Planning Systems, Inc. 2/26/2004 H:\12594gnatcatcher\Report\DEA_Feb2004\EmailTables_Feb2004.xls

Appendix Table G-10Project Modification Costs for Southern California Edison
Project Modification CostsYear 2003 2004 2005 2006 2007 2008 2009 2010
Projects with Modifications 4 1 2 3 4 5 6 7 8Total Acres Impacted 250Acres Impacted per project 63 Annual CSS Acres Impacted 63 63
Annual mitigation acres 0 0 91 0 0 91 0 0Reported mitigation ratio 2.00 :1 Annual Proj. Mod. Cost $0 $0 $4,331,335 $0 $0 $4,331,335 $0 $0Est. CEQA baseline 0.54 :1 (1)Est. "net" mitigation ratio 1.46 :1
Year 2011 2012 2013 2014 2015 2016 2017 2018Cost per acre mitigated $47,600 9 10 11 12 13 14 15 16SCE Service Territory 50,000 square miles
Annual CSS Acres Impacted 63 63Discount Rate 7.0% Annual mitigation acres 91 0 0 0 0 0 91 0NPV $10,347,646 Annual Proj. Mod. Cost $4,331,335 $0 $0 $0 $0 $0 $4,331,335 $0
Acre Adj. 68%Adj. NPV 7,036,202$ Year 2019 2020 2021 2022 2023 2024 2025
17 18 19 20 21 22 23 TOTAL
Annual CSS Acres Impacted 250Annual mitigation acres 0 0 0 0 0 0 0Annual Proj. Mod. Cost $0 $0 $0 $0 $0 $0 $0 $17,325,340
(1) (2:1 baseline, weighted by relative acreage of Orange County units to all
Economic & Planning Systems, Inc. 2/26/2004 H:\12594gnatcatcher\Report\DEA_Feb2004\EmailTables_Feb2004.xls

Appendix Table G-11Project Modification Costs for San Diego Gas & Electric
Project Modification Costs Year 2003 2004 2005 2006 2007 2008 2009 20101 2 3 4 5 6 7 8
SCE impact 250 acresGrowth outside SD 47,987 acres Annual Acres Impacted 7.9 7.9 7.9 7.9 7.9 7.9 7.9 7.9Impact/1,000 ac 5.2 Annual Acres Mitigated 0.5 0.5 0.5 0.5 0.5 0.5 0.5 0.5San Diego growth 35,065 acres Annual Mitigation Cost 9,098$ 9,098$ 9,098$ 9,098$ 9,098$ 9,098$ 9,098$ 9,098$ SDG&E Impact 183 acres
Mitigation Ratio 2.06 :1 Year 2011 2012 2013 2014 2015 2016 2017 2018SD CEQA baseline 2.00 :1 9 10 11 12 13 14 15 16"Net" ratio 0.06 :1
Annual Acres Impacted 7.9 7.9 7.9 7.9 7.9 7.9 7.9 7.9Cost/Ac 19,750$ Annual Acres Mitigated 0.5 0.5 0.5 0.5 0.5 0.5 0.5 0.5
Annual Mitigation Cost 9,098$ 9,098$ 9,098$ 9,098$ 9,098$ 9,098$ 9,098$ 9,098$ Discount Rate 7.0%NPV 102,559$
Year 2019 2020 2021 2022 2023 2024 2025Acre Adj. 68% 17 18 19 20 21 22 23 TOTALAdj. NPV 69,738$
Annual Acres Impacted 7.9 7.9 7.9 7.9 7.9 7.9 7.9 182.7Annual Acres Mitigated 0.5 0.5 0.5 0.5 0.5 0.5 0.5 10.6Annual Mitigation Cost 9,098$ 9,098$ 9,098$ 9,098$ 9,098$ 9,098$ 9,098$ 209,263$
Economic & Planning Systems, Inc. 2/26/2004 H:\12594gnatcatcher\Report\DEA_Feb2004\EmailTables_Feb2004.xls

Appendix Table G-12Project Modification Costs for the Southern California Gas Company
Project Modification Costs Year 2003 2004 2005 2006 2007 2008 2009 20101 2 3 4 5 6 7 8
Annual Acres ImpactedAnnual Acres Mitigated Annual Acres Impacted 5.0 5.0 5.0 5.0 5.0 5.0 5.0 5.0Annual Mitigation Cost Annual Acres Mitigated 10.4 10.4 10.4 10.4 10.4 10.4 10.4 10.4
Annual Mitigation Cost 577,958$ 577,958$ 577,958$ 577,958$ 577,958$ 577,958$ 577,958$ 577,958$ SCGC Service Territory 23,000 square milesSCE service territory 50,000 square miles
Scaling factor: 0.46 Year 2011 2012 2013 2014 2015 2016 2017 20189 10 11 12 13 14 15 16
SCE impact 250 acresImputed SDG&E impact 115 acres Annual Acres Impacted 5.0 5.0 5.0 5.0 5.0 5.0 5.0 5.0Estimated Consultations 2 Annual Acres Mitigated 10.4 10.4 10.4 10.4 10.4 10.4 10.4 10.4
Annual Mitigation Cost 577,958$ 577,958$ 577,958$ 577,958$ 577,958$ 577,958$ 577,958$ 577,958$ Average mitigation ratio 2.63 :1 (1)Est. CEQA baseline 0.54 :1 (2)Est. "net" mitigation ratio 2.09 :1 Year 2019 2020 2021 2022 2023 2024 2025
17 18 19 20 21 22 23 TOTALCost/Ac 55,389$
Annual Acres Impacted 5.0 5.0 5.0 5.0 5.0 5.0 5.0 115.0Discount Rate 7.0% Annual Acres Mitigated 10.4 10.4 10.4 10.4 10.4 10.4 10.4 240.0NPV 6,514,855$ Annual Mitigation Cost 577,958$ 577,958$ 577,958$ 577,958$ 577,958$ 577,958$ 577,958$ 13,293,043$
Acre Adj. 68%Adj. NPV 4,429,978$
(1) (All counties other than San Diego)(2) (2:1 baseline, weighted by relative acreage of Orange County units to
all counties other than San Diego)
Economic & Planning Systems, Inc. 2/26/2004 H:\12594gnatcatcher\Report\DEA_Feb2004\EmailTables_Feb2004.xls

Appendix Table G-13Project Modification Costs for Angeles National Forest
Project Modification AssumptionsYear 2003 2004 2005 2006 2007 2008 2009 2010
Total Acres Protected 4,000 1 2 3 4 5 6 7 8Total Prescribed Burns 23Ac. Protected / Burn 174 Annual Acres Protected 174 174 174 174 174 174 174 174Per-Acre Protection Cost $100 Annual Proj. Mod. Cost $17,391 $17,391 $17,391 $17,391 $17,391 $17,391 $17,391 $17,391
Discount Rate 7.0%NPV $196,038 Year 2011 2012 2013 2014 2015 2016 2017 2018
9 10 11 12 13 14 15 16Acre Adj. 100%Adj. NPV 196,038$ Annual Acres Protected 174 174 174 174 174 174 174 174
Annual Proj. Mod. Cost $17,391 $17,391 $17,391 $17,391 $17,391 $17,391 $17,391 $17,391
Year 2019 2020 2021 2022 2023 2024 202517 18 19 20 21 22 23 TOTAL
Annual Acres Protected 174 174 174 174 174 174 174 4000Annual Proj. Mod. Cost $17,391 $17,391 $17,391 $17,391 $17,391 $17,391 $17,391 $400,000
Economic & Planning Systems, Inc. 2/26/2004 H:\12594gnatcatcher\Report\DEA_Feb2004\EmailTables_Feb2004.xls

Appendix Table G-14Project Modification Costs for Cleveland National Forest
Project Modification CostsYear 2003 2004 2005 2006 2007 2008 2009 2010
Annual Acres Protected 1 2 3 4 5 6 7 8Annual Proj. Mod. Cost
Annual Acres Protected 290 290 290 290 290 290 290 290Total Acres Protected 20,000 Annual Proj. Mod. Cost $28,986 $28,986 $28,986 $28,986 $28,986 $28,986 $28,986 $28,986Total Prescribed Burns 69Ac. Protected / Burn 290Per-Acre Protection Cost $100 Year 2011 2012 2013 2014 2015 2016 2017 2018
9 10 11 12 13 14 15 16Discount Rate 7.0%NPV $326,730 Annual Acres Protected 290 290 290 290 290 290 290 290
Annual Proj. Mod. Cost $28,986 $28,986 $28,986 $28,986 $28,986 $28,986 $28,986 $28,986Acre Adj. 62%Adj. NPV 203,838$
Year 2019 2020 2021 2022 2023 2024 202517 18 19 20 21 22 23 TOTAL
Annual Acres Protected 290 290 290 290 290 290 290 6667Annual Proj. Mod. Cost $28,986 $28,986 $28,986 $28,986 $28,986 $28,986 $28,986 $666,667
Economic & Planning Systems, Inc. 2/26/2004 H:\12594gnatcatcher\Report\DEA_Feb2004\EmailTables_Feb2004.xls

Appendix Table G-15Project Modification Costs for San Bernardino National Forest
Project Modification CostsYear 2003 2004 2005 2006 2007 2008 2009 2010
Annual Acres Protected 1 2 3 4 5 6 7 8Annual Proj. Mod. Cost
Annual Acres Protected 43 43 43 43 43 43 43 43Total Acres Protected 1,000 Annual Proj. Mod. Cost $4,348 $4,348 $4,348 $4,348 $4,348 $4,348 $4,348 $4,348Per-Acre Protection Cost $100
Discount Rate 7.0% Year 2011 2012 2013 2014 2015 2016 2017 2018NPV $49,010 9 10 11 12 13 14 15 16
Acre Adj. 100% Annual Acres Protected 43 43 43 43 43 43 43 43Adj. NPV 49,010$ Annual Proj. Mod. Cost $4,348 $4,348 $4,348 $4,348 $4,348 $4,348 $4,348 $4,348
Year 2019 2020 2021 2022 2023 2024 202517 18 19 20 21 22 23 TOTAL
Annual Acres Protected 43 43 43 43 43 43 43 1000Annual Proj. Mod. Cost $4,348 $4,348 $4,348 $4,348 $4,348 $4,348 $4,348 $100,000
Economic & Planning Systems, Inc. 2/26/2004 H:\12594gnatcatcher\Report\DEA_Feb2004\EmailTables_Feb2004.xls

Appendix Table G-16Project Modification Costs for the Bureau of Land Management
Project Modification Costs Year 2003 2004 2005 2006 2007 2008 2009 20101 2 3 4 5 6 7 8
Projects with Modifications 6Acres Impacted per project 4 Annual CSS Acres Impacted 4 0 0 0 4 0 0 0Assumed mitigation ratio 2 :1 Annual mitigation acres 8 0 0 0 8 0 0 0Cost per acre mitigated $1,500 Annual Proj. Mod. Cost $12,000 $0 $0 $0 $12,000 $0 $0 $0
Discount Rate 7.0%NPV $37,975 Year 2011 2012 2013 2014 2015 2016 2017 2018
9 10 11 12 13 14 15 16Acre Adj. 68%Adj. NPV 25,822$ Annual CSS Acres Impacted 4 0 0 0 4 0 0 0
Annual mitigation acres 8 0 0 0 8 0 0 0Annual Proj. Mod. Cost $12,000 $0 $0 $0 $12,000 $0 $0 $0
Year 2019 2020 2021 2022 2023 2024 202517 18 19 20 21 22 23 TOTAL
Annual CSS Acres Impacted 4 0 0 0 4 0 0 24Annual mitigation acres 8 0 0 0 8 0 0Annual Proj. Mod. Cost $12,000 $0 $0 $0 $12,000 $0 $0 $72,000
Economic & Planning Systems, Inc. 2/26/2004 H:\12594gnatcatcher\Report\DEA_Feb2004\EmailTables_Feb2004.xls

Table G-17Project Modification Calculations -- Camp Pendleton
Service Date of EstimatedLocation / Project Name Project # BO Permanent Temporary Cost (1)
Non-Training AreasSan Onofre Sewage Effluent 1-6-95-F-25 3/30/1995 0 0.3 $11,400Bridge Retrofit - Interstate 5 1-6-96-F-31 8/15/1996 0 1.08 $41,040Santa Margarita Sewage Effluent 1-6-96-F-36 10/21/1996 26.3 0.8 $2,029,200Slope Stabilization at SDGE Talega Substation1-6-98-F-27 9/8/1998 0 3.5 $133,000DeLuz Housing 1-6-98-F-38 11/23/1998 3.93 0 $298,680Ammunition Handling Facility 1-6-99-F-30 4/19/1999 2.57 1.07 $235,980Santa Margarita River Levee 1-6-95-F-02-R10 7/19/1999 1.65 0 $125,400PPM Burn at San Mateo 1-6-00-F-34 5/12/2000 5.0 0 $380,000Las Flores Estancia 1-6-01-F-910.2 2/2/2001 0.74 0 $56,240SDGE Talega Substation Expansion 1-6-02-F-1988.2 12/10/2001 0 0 $0SDGE Access Road 1-6-02-F-2464.2 1/31/2002 0 0 $0San Onofre Housing Firebreak 1-6-02-F-2869.1 5/23/2002 0.77 0 $58,520San Mateo BEQ Parking 1-6-02-F-2729.3 5/30/2002 2.21 0 $167,960
Subtotal 13 43.17 6.75 $3,537,420Amount Per Year 1.58 5.23 0.82 $428,778
Training AreasNorthern Power Line 1-6-99-F-45 6/28/1999 0.0013 0.148 $5,723SFPP Petroleum Pipeline 1-6-99-F-54 8/23/1999 0 0 $0Electrical Towers M3-T3 1-6-99-F-76 10/28/1999 0.17 0.12 $17,480Range 314 Road Upgrade 1-6-03-F-3001.3 1/10/2003 3.5 0 $266,000Biological Assessment of Upland Habitat on-going - - -
Subtotal 5 3.6713 0.268 $289,203Amount Per Year 0.61 0.45 0.03 $35,055
(1) Assumes a 2:1 total mitigation requirement for permanent impacts, 1:1 restoration for temporary impacts, and a cost of $38,000 per mitigated or restored acre. Does not represent actual amount paid.
Source: US Fish & Wildlife Service; Fallbrook Naval Weapons Station; Economic & Planning Systems, Inc.
Acres of CSS Impact
Economic & Planning Systems, Inc. 2/26/2004 H:\12594gnatcatcher\Report\DEA_Feb2004\EmailTables_Feb2004.xls

Table G-17Project Modification Calculations -- Camp Pendleton
Non-training NPV 7% $4,833,268 Year 2003 2004 2005 2006 2007 2008 2009 2010
Training NPV: 7% $395,145 Non-Training $428,778 $428,778 $428,778 $428,778 $428,778 $428,778 $428,778 $428,778
Training $35,055 $35,055 $35,055 $35,055 $35,055 $35,055 $35,055 $35,055
Year 2011 2012 2013 2014 2015 2016 2017 2018
Non-Training $428,778 $428,778 $428,778 $428,778 $428,778 $428,778 $428,778 $428,778
Training $35,055 $35,055 $35,055 $35,055 $35,055 $35,055 $35,055 $35,055
Year 2019 2020 2021 2022 2023 2024 2025
Non-Training $428,778 $428,778 $428,778 $428,778 $428,778 $428,778 $428,778
Training $35,055 $35,055 $35,055 $35,055 $35,055 $35,055 $35,055
Economic & Planning Systems, Inc. 2/26/2004 H:\12594gnatcatcher\Report\DEA_Feb2004\EmailTables_Feb2004.xls

Appendix Table G-18Project Modification Costs for Fallbrook Naval Weapons Station
Project Modification Assumptions Year 2003 2004 2005 2006 2007 2008 2009 20101 2 3 4 5 6 7 8
Projects with Modifications 16 Proj. 1 Ammunition Rd. 0 20 0 0 0 0 0 0Assumed mitigation ratio 1 :1 Proj. 2 Ten Mags over 20 years 0 5 0 5 0 5 0 5Cost per acre mitigated $38,000 Proj. 3 Five year Cycles for Roads 0 0 3.3 0 0 0 0 3
Proj. 4 Building 0 0 0 0 0 0 0 0Discount Rate 7.0%NPV $2,109,962 Annual CSS Acres Impacted 0 25 3 5 0 5 0 8
Annual Project Modification Cost $0 $950,000 $126,667 $190,000 $0 $190,000 $0 $316,667Acre Adj. 100% 13500 13500 13500 13500 13500 13500 13500 13500
Year 2011 2012 2013 2014 2015 2016 2017 2018For Fallbrook 9 10 11 12 13 14 15 16
0.25 mi Proj. 1 Ammunition Rd. 0 0 0 0 0 0 0 05280 Proj. 2 Ten Mags over 20 years 0 5 0 5 0 5 0 51320 LF Proj. 3 Five year Cycles for Roads 0 0 0 0 3 0 0 0
22 ft width Proj. 4 Building 0 0 0 0 0 0 15 029040 sq ft
0.666666667 acres/yr Annual CSS Acres Impacted 0 5 0 5 3 5 15 53.333333333 Every Five Years Annual Project Modification Cost $0 $190,000 $0 $190,000 $126,667 $190,000 $570,000 $190,000
13500
Year 2019 2020 2021 2022 2023 2024 202517 18 19 20 21 22 23 TOTAL
Proj. 1 Ammunition Rd. 0 0 0 0 0 0 0Proj. 2 Ten Mags over 20 years 0 5 0 5 0 0 0Proj. 3 Five year Cycles for Roads 0 3 0 0 0 0 0Proj. 4 Building 0 0 0 0 0 0 0
Annual CSS Acres Impacted 0 8 0 5 0 0 0 98Annual Project Modification Cost $0 $316,667 $0 $190,000 $0 $0 $0 $3,736,667
13500 13500 13500 13500 13500 13500 1350014519 14519 14519 14519 14519 14519 1451928019 28019 28019 28019 28019 28019 28019
0 8 0 5 0 0 0
$28,019 $344,685 $28,019 $218,019 $28,019 $28,019 $28,019 $4,381,099
Economic & Planning Systems, Inc. 2/26/2004 H:\12594gnatcatcher\Report\DEA_Feb2004\EmailTables_Feb2004.xls

Appendix Table G-19Project Modification Costs for the Pala Band of Mission Indians
Project Modification Costs Year 2003 2004 2005 2006 2007 2008 2009 20101 2 3 4 5 6 7 8
Housing projects 60Acres Impacted per project 1.0 Annual CSS Acres Impacted 2.0 0.7 0.7 0.7 0.7 2.0 0.7 0.7
Annual mitigation acres 3.9 1.3 1.3 1.3 1.3 3.9 1.3 1.3Community projects 5 (in 2005, '10, '15, & '20)Annual Proj. Mod. Cost $77,127 $26,444 $26,444 $26,444 $26,444 $77,127 $26,444 $26,444Acres Impacted per project 5.0
Percent CSS on Reservation 26% Year 2011 2012 2013 2014 2015 2016 2017 2018Assumed mitigation ratio 2 :1 9 10 11 12 13 14 15 16Cost per acre mitigated $19,750
Annual CSS Acres Impacted 0.7 0.7 2.0 0.7 0.7 0.7 0.7 2.0Discount Rate 7.0% Annual mitigation acres 1.3 1.3 3.9 1.3 1.3 1.3 1.3 3.9NPV $432,705 Annual Proj. Mod. Cost $26,444 $26,444 $77,127 $26,444 $26,444 $26,444 $26,444 $77,127
Year 2019 2020 2021 2022 2023 2024 202517 18 19 20 21 22 23 TOTAL
Annual CSS Acres Impacted 0.7 0.7 0.7 0.7 2.0 0.7 0.7 22Annual mitigation acres 1.3 1.3 1.3 1.3 3.9 1.3 1.3Annual Proj. Mod. Cost $26,444 $26,444 $26,444 $26,444 $77,127 $26,444 $26,444 $861,619
Economic & Planning Systems, Inc. 2/26/2004 H:\12594gnatcatcher\Report\DEA_Feb2004\EmailTables_Feb2004.xls

APPENDIX H
SUMMARY OF ECONOMIC ANALYSIS FOR
AREAS PROPOSED FOR CRITICAL HABITAT DESIGNATIONAND EXCLUSION (COMBINED)

Table H-1Summary of Economic Impacts by Unit -- CH Proposed for Designation and Exclusion
ProposedCH Unit
Unit 1 $34,256,806 $3,605,251 $1,671,146 $35,168,661 $74,701,863
Unit 2 $2,027,499 $281,550 $55,528 $1,168,556 $3,533,132
Unit 3 $6,329,275 $532,510 $188,139 $3,959,294 $11,009,218
Unit 4 $2,448,883 $266,690 $158 $3,326 $2,719,057
Unit 5 $9,807,316 $999,226 $302,572 $6,367,508 $17,476,623
Unit 6 $85,506,924 $966,067 $173,173 $2,817,874 $89,464,038
Unit 7 $10,991,170 $683,677 $27,397 $445,779 $12,148,023
Unit 8 $332,697 $116,418 $0 $0 $449,115
Unit 9 $38,074,247 $392,512 $254,193 $3,950,050 $42,671,002
Unit 10 $435,551,729 $3,069,916 $2,212,996 $19,072,846 $459,907,488
Unit 11 $90,433,234 $297,332 $232,976 $2,400,835 $93,364,377
Unit 12 $3,649,153 $64,918 $44,013 $271,750 $4,029,834
Unit 13 $168,719,062 $1,723,757 $2,156,399 $12,857,995 $185,457,213
Project-specific HCPs (4) N/A $141,539 N/A N/A $141,539
Total Cost $888,127,996 $13,141,364 $7,318,690 $88,484,473 $997,072,523
Annualized Cost (5) $110,347,057 $1,508,355 $948,209 $11,464,045 $124,267,667
(1) Assumes discount rate of 12% for private development projects and 7% for public development projects. (2) Average administrative consultation costs (low and high) were allocated among units in proportion
to the number of projected growth acres in each unit with a Federal nexus. (3) This value is one-half the difference between the total Upper End Mitigation Scenario cost and total estimated project modification costs.(4) Because the location of all existing project-specific HCPs was not known, this item is reported individually.(5) Represents the annual amount that is equivalent to the Total Costs, when distributed over a 23-year period. Assumes a discount rate of 12 percent for Scenario A (private/public costs could not be separated in the Unit Summary table), and 3 percent for Scenario B.
Total Estimated CostEstimated Project Modification
Costs (1)Estimated Administrative Costs
(2) Estimated Delay CostsEstimated Uncertainty Costs
(3)
Economic & Planning Systems, Inc. 2/26/2004 H:\12594gnatcatcher\Report\DEA_Feb2004\EmailTables_Feb2004.xls

APPENDIX I
TIME DELAY SUMMARY

Table I-1Summary of Section 7 Time Delay Calculations
Developable Acres with nexus in CH Acres Land Value of Value Impact
Unit through 2025 Delayed Delayed Acres of Delay(1) (2) (3) (4)
Unit 1 68 3 $1,055,723 $63,343
Unit 2 55 2 $925,461 $55,528
Unit 3 203 9 $3,135,642 $188,139
Unit 4 0 0 $2,634 $158
Unit 5 276 12 $4,626,554 $277,593
Unit 6 151 7 $2,886,221 $173,173
Unit 7 35 2 $327,476 $19,649
Unit 8 0 0 $0 $0
Unit 9 469 20 $4,236,554 $254,193
Unit 10 6,631 288 $36,883,272 $2,212,996
Unit 11 772 34 $3,882,926 $232,976
Unit 12 94 4 $733,544 $44,013
Unit 13 3,993 174 $35,939,988 $2,156,399
Totals 12,747 554 $94,635,996 $5,678,160
(1) See Table 10. Equals projected growth acres through 2025 affected by section 7 minus on-site set-aside requirements.(2) First year of land development after CHD is conservatively assumed to be delayed by six months due to lack of time to plan to avoid breeding season. Acres delay represents developed acres divided by 23, the number of years of the projection.(3) Represents value of raw, entitled land ready for development. Based on land values presented in Appendix D.(4) Based on 6 percent discount rate, as delay lasts six months (i.e., one-half of 12% annual discount rate).(5) Based on 1.5 percent discount rate, as delay lasts six months.
Economic & Planning Systems, Inc. 2/26/2004 H:\12594gnatcatcher\Report\DEA_Feb2004\EmailTables_Feb2004.xls