final drainage report eastcreek farms - thornton co
TRANSCRIPT

solutions. partnerships. success.
t 303.561.3333 | f 303.561.3339 | 45 West 2nd Avenue, Denver, Colorado 80223 | www.jansenstrawn.com
FINAL DRAINAGE REPORT
Eastcreek Farms Thornton, CO
October 28, 2016
JN: 13049
Prepared for:
Carlson Associates, Inc. 12460 1st Street
Eastelake, CO 80614 P:303.457.2966
Prepared by:
Jansen Strawn Consulting Engineers 45 W. 2nd Avenue Denver, CO 80223 P: 303.561.3333 F: 303.561.3339
Thomas C. Jansen, PE No. 35942
Principal

Eastcreek Farm 10/28/2016 Page 2
t 303.561.3333 | f 303.561.3339 | 45 West 2nd Avenue, Denver, Colorado 80223 | www.waremalcomb.com
Carlson Associates hereby certifies that the drainage facilities for the Eastcreek Farms Subdivision shall be constructed according to the design presented in this report. I understand that the City of Thornton does not and will not assume liability for the drainage facilities designed and/or certified by my engineer and that the City of Thornton reviews drainage plans pursuant to Colorado Revised Statutes Title 30, Article 28; but cannot, on behalf of the Eastcreek subdivision, guarantee that final drainage design review will absolve the Carlson Associates and/or their successors and/or assigns of future liability for improper design. I further understand that approval of the Final Plat, Final Development Plan, and/or Subdivision Development Plan does not imply approval of my engineer’s drainage design. __________________________________ Printed Name for and on behalf of Carlson Associates _________________________________ Authorized Signature CERTIFICATION I hereby affirm that this report and plan for the final drainage design of the Eastcreek Farms Subdivision was prepared by me, or under my direct supervision, for the owners thereof, in accordance with the provisions of City of Thornton Standards and Specifications for the Design and Construction of Public and Private Improvements and the Urban Drainage and Flood Control District Criteria Manual, and approved variances and exceptions thereto. I understand that the City of Thornton does not and will not assume liability for drainage facilities designed by others. Thomas C. Jansen, PE Date State of Colorado Registration No. 35942 For and on behalf of Jansen Strawn Consulting Engineers, Inc.

Eastcreek Farm 10/28/2016 Page 3
t 303.561.3333 | f 303.561.3339 | 45 West 2nd Avenue, Denver, Colorado 80223 | www.waremalcomb.com
T A B L E O F C O N T E N T S
I. GENERAL LOCATION AND DESCRIPTION .............................................................................................. 5
II. DRAINAGE BASINS AND SUB-BASINS .................................................................................................... 6
III. DRAINAGE FACILITY DESIGN AND CRITERIA ......................................................................................... 7
IV. STORMWATER MANAGEMENT FACILITY DESIGN ................................................................................. 9
V. CONCLUSION ....................................................................................................................................... 13
VI. REFERENCES ........................................................................................................................................ 14

Eastcreek Farm 10/28/2016 Page 4
t 303.561.3333 | f 303.561.3339 | 45 West 2nd Avenue, Denver, Colorado 80223 | www.waremalcomb.com
A P P E N D I C E S
APPENDIX A – Reference Materials FEMA Flood Insurance Rate Map NRCS Soil Information Related Drainage Reports
APPENDIX B – Site Hydrology and Hydraulics % Impervious Calculations “C” Value Calculations SF2 & SF3 Rational Method Calculations Street Capacity Calculations Inlet Calculations Storm Sewer Design
APPENDIX C – Pond Design & Outlet Structure Stage-Storage Sizing WQCV Outlet Design Restrictor Plate Design Outlet Design & Culvert Design Emergency Spillway Design
APPENDIX D - Maps Historical Basin Map Developed Basin Map

Eastcreek Farm 10/28/2016 Page 5
t 303.561.3333 | f 303.561.3339 | 45 West 2nd Avenue, Denver, Colorado 80223 | www.waremalcomb.com
I. GENERAL LOCATION AND DESCRIPTION
The purpose of this report is to define and analyze developed runoff quantities and conveyance through the Eastcreek Farm development. Runoff will generally drain toward one of the proposed Full Spectrum EURV and 100-year detention pond prior to being discharged from the site. Development constraints that are presented in the Outfall Systems Planning Update of Big Dry Creek Northern Tributaries Conceptual Preliminary Design Report (March 2007) and have been evaluated against the proposed development and the proposed drainage plan. Local restrictions due to existing and future drainage improvements surrounding the site are also evaluated within this report.
A. Site Location
The Eastcreek Farm development (site) is located in the south ½ of Section 12, Township 1 South, Range 68 West of the Sixth Principal Meridian, City of Thornton, county of Adams, Colorado. The site lies to the north of East 152nd Avenue and to the east of York Street. The site is bounded on the north by E-470 and to the west by the Fairfield Subdivision which is currently under construction. The site is bounded on the south by the Silver Creek Elementary School and the Haven At York Street Filing No. 4 subdivision. See the enclosed vicinity map and the Final Drainage Map in Appendix F for exact locations.
B. Description of Property The entire Site is approximately 96 acres, which includes parks and 276 residential lots. The development will include improvements to adjacent portions of East 152nd Avenue and York Street, internal streets and utilities that are required to support the proposed homes. The existing site is undeveloped farmland that has experienced limited oil and gas development. Generally, half the site slopes north and northwest. The existing German Ditch irrigation ditch runs through the property from the lower middle edge of the site to the northeast corner. Existing runoff flows enter the German Ditch from the eastern edge of the site. The Wadley North Creek crosses the site on the southwest corner via an engineered channel where it is received by an existing culvert, eventually outfalling to Big Dry Creek. The Short Run drainage way runs adjacent to the northeast corner of the site. The USCS Soils Survey indicates that the site is generally underlain by Platner loam (PIB and PIC) hydrological groups C and D, as well as Ulm loam (UIC and UID) hydrologic soil groups C and D, as well as a very small portion of Ascolon Sandy Loam (AsD and AsC) hydraulic soil group B. See the soil map located in Appendix A. Platner and Ulm soils are described as having slow permeability on nearly level to mildly sloping areas.

Eastcreek Farm 10/28/2016 Page 6
t 303.561.3333 | f 303.561.3339 | 45 West 2nd Avenue, Denver, Colorado 80223 | www.waremalcomb.com
Hydrologic soil group C soils are identified as soils having a slow infiltration rate when thoroughly wetted and consisting chiefly of soils with a layer that impedes downward movement of water or soils with moderately-fine to fine texture. Hydrologic soil group D soils are identified as soils having high runoff potential when thoroughly wet. Water movement through Type D soils is restricted to very restricted.
II. DRAINAGE BASINS AND SUB-BASINS
A. Major Drainage Basins This site lies within the Big Dry Creek major drainage basin. Development within the Big Dry Creek major drainage basin is controlled by the Outfall Systems Planning Update of Big Dry Creek Northern Tributaries Conceptual Preliminary Design Report (March 2007), prepared by Wright Engineers Inc (OSP). Generally, the OSP describes the historic runoff entering either the Wadley Creek North or Short Run drainageway. According to the Flood Insurance Rate Map Number 08001C0302J, the site is mostly within Zone X, with a small portion of the site identified as being within Zone A where Wadley North Creek lies at the southwest corner of the site. Refer to Appendix A for the Flood Insurance Rate Map information. Proposed improvements will not alter the Zona A floodplain.
B. Sub-Basin Description
The entire site lies within the Big Dry Creek major drainage basin and historically drains towards the existing Short Run drainage way, Wadley Creek North, and existing inlets at low points near the E-470 onramp. The Wadley Creek North and Short Run drainage ways both flow to the Big Dry Creek. The proposed site basins have been evaluated in this report as “Basin A”, “Basin B” and “Basin C”. Ultimately all flows within Basin A, B and C will be conveyed to the proposed detention and WQCV pond A, B, and C (respectively) by way of overland flows which will be captured by the proposed storm drainage system. There will be some offsite flows in the proposed development which will generally follow historic runoff patterns. Some of the offsite flows will enter the existing German Ditch irrigation ditch, which agrees with historic drainage patterns for the site.

Eastcreek Farm 10/28/2016 Page 7
t 303.561.3333 | f 303.561.3339 | 45 West 2nd Avenue, Denver, Colorado 80223 | www.waremalcomb.com
III. DRAINAGE DESIGN AND CRITERIA
A. Regulations The regulations, guidelines, and drainage design criteria used for this report are those contained within the City of Thornton Standards and Specifications for the Design and Constriction of Public and the Urban Drainage Criteria Manual, Volume 1, 2, and 3. The pond and pond release have been designed in accordance with UDFCD criteria. Onsite inlets have been sized and designed utilizing both UDFCD and City of Thornton Criteria, with street capacities and storm sewer being designed in accordance with City of Thornton Criteria.
B. Drainage Studies, Outfall Systems Plans, Site Constraints The site is within the Big Dry Creek major drainage basin. Outfall Systems Planning Update of Big Dry Creek Northern Tributaries Conceptual Preliminary Design Report (March 2007). There are no irregular site constraints that come by way of any streets, utilities, structures or other potential conflicts to the overall drainage design.
C. Hydrology
For the purpose of this report, the onsite flows routed to the stormsewer were calculated using the rational method calculations. These calculations have been included in Appendix B. The pond sizing has been sized using the full spectrum method utilizing UDFCD spreadsheets. The minor and major storm frequencies for design are the 5-year and 100-year storm events, respectively. The one hour point rainfall for the 5-year event is 1.38 inches and 2.69 inches for the 100-year event. The peak discharge for sizing the onsite storm sewer and for the street capacity calculations was calculated using the following Rational Method formula: Q=CIA
Where: Q = peak discharge (cfs) C = runoff coefficient from Table RO-5 of the UDSCM I = rainfall intensity (inches/hour) A = drainage area (acres)

Eastcreek Farm 10/28/2016 Page 8
t 303.561.3333 | f 303.561.3339 | 45 West 2nd Avenue, Denver, Colorado 80223 | www.waremalcomb.com
These flows were routed through the site using the UDFCD SF-3 form to determine the total flow at respective design points. See Appendix B for routing spreadsheets. Stormwater quality and detention for the water quality and detention basin will be located in the southeast corner of the site for Basin A, the northeast corner for Basin B, and across E. 152nd Ave. for Basin C. The ponds will be designed using full spectrum detention and in accordance with Urban Drainage and City of Thornton criteria. This includes providing storage for the Excess Urban Runoff Volume (EURV) and releasing that volume over a period of 72 hours. Storage for the 100-year detention volume is provided within the onsite pond. The 100-year developed release rate from the proposed UDFCD detention pond will be restricted to a maximum of 1.0 cfs per acre. In accordance with current UDFCD recommendations, additional water quality volume will not be added to the 100-year detention volume for the proposed onsite ponds. Please refer to Appendix C for the storage calculations.
D. Hydraulics
Allowable street capacities for the proposed improvements are in accordance with City of Thornton Standards. In the minor storm event, runoff in the streets is not allowed to overtop the crown and is not allowed to flow beyond the back of attached walks or over top the curb. In the major storm event runoff cannot flow at a depth greater than 12 inches or extend beyond the right-of-way. Flows will not encroach upon residential lots in accordance with City of Thornton Criteria. Street capacities were checked for the proposed 34 foot flowline-to-flowline street section with mountable 4 inch curbing, except for E. 152nd Ave. which used a 6 inch curb. Completed street capacity worksheets have been supplied in Appendix B for the proposed street section street capacities which were calculated using the Q-Allow sheet of the UDFCD UD-Inlet spreadsheet. Inlets have been designed throughout the site to capture runoff from the streets before maximum allowable street capacities are exceeded and at sump locations. Inlet calculations have been prepared for the site using the Urban Drainage and Flood Control District UD-Inlet_V4.03.xls spreadsheet. Inlet capture calculations are provided in Appendix B. All inlets have also been analyzed to ensure there is an emergency overflow route which keeps runoff away from residential lots. All inlets will have a 6-inch throat height as shown on the City of Thornton and CDOT M Standard drawings.

Eastcreek Farm 10/28/2016 Page 9
t 303.561.3333 | f 303.561.3339 | 45 West 2nd Avenue, Denver, Colorado 80223 | www.waremalcomb.com
Proposed storm sewers have been designed in accordance with the City of Thornton Standards. During the minor storm event, flows within the storm sewer remain within the pipe, that is, the storm sewer system does not become pressurized. City of Thornton criteria allows the 100-year storm to be controlled in the overall drainage system, which includes in most cases the street and the proposed storm sewer. Hydraflow Storm Sewers Extension for AutoCAD Civil 3D software was utilized to perform hydraulic computations on the proposed storm sewer, including the calculation of hydraulic grade lines. Hydraflow output for the proposed storm sewer, including profiles with hydraulic grade lines, is included in Appendix B.
E. Variances from Criteria
There are no variances from the required criteria.
IV. STORMWATER MANAGEMENT FACILITY DESIGN
A. General Concept
Stormwater within the developed residential portions of the site will have the following runoff characteristics: rainfall within the individual lots will be conveyed through roofs, downspouts, shallow swales, and sheet flow to adjacent sheets or tracts. Once runoff is within the street it will be conveyed within the street section to proposed storm sewer inlets. Runoff captured in proposed inlets will be conveyed through proposed storm sewer to designated outfall locations into the proposed EURV and Detention Ponds. Runoff rates will be attenuated to allowable release rates based of UDFCD criteria and existing downstream offsite conditions for full spectrum detention and released offsite.
B. Specific Details The residential density for the site is computed based on the area of the site that will be developed for residential purposes. This gives the site a density of 2.8 dwelling units per acre for hydrologic calculations. The average home size is anticipated to be roughly 2400 S.F. with 75 percent Single Family two-story homes, and 25 percent ranch style homes. In accordance with UDFCD USDCM Figures RO-3 through RO-5, the residential portions of the site are anticipated to be 35.5 percent impervious. Proposed drainage basins for the site will generally follow historic patterns. See historical drainage map in Appendix D for more information. Basin A

Eastcreek Farm 10/28/2016 Page 10
t 303.561.3333 | f 303.561.3339 | 45 West 2nd Avenue, Denver, Colorado 80223 | www.waremalcomb.com
Basin A accounts for the runoff being directed to Pond A. To the greatest extent possible, runoff from developed portions of Basin A is conveyed to this proposed EURV and 100-year detention pond located at the southwest corner of the site. Sub-basins A-01 (1.36 AC.), A-02 (1.68 AC.), and A-03 (1.35 AC.) consist of residential lots that will be graded with the highpoint in the middle (Type ‘B’) or at the back of the lot (Type ‘A’). Runoff from these basins are directed via the street curb and gutter to design point 1 and 2. At these design points, 2 sump inlets receive the runoff and convey it to the detention pond (Pond A) via underground storm pipe. Sub-basins A-04 (1.45 AC.), A-05 (1.81 AC.), A-06 (0.75 AC.), A-07 (1.53 AC.), A-7.1 (0.33 AC.), A-08 (1.97 AC.), A-09 (1.13 AC.), A-10 (0.29 AC.) also consist of standard residential Type ‘A’ and Type ‘B’ lots. Runoff from theses sub-basins are directed via curb and gutter to design points 6, 7.1, 8 and 10. These design points are located next to the speed table and are in the low point of the street. Four sump inlets receive the flow at this point and direct the runoff to Pond A via underground storm pipe. An on-grade inlet at design point 7 helps reduce flow in the curb and gutter in order to keep the minor flow from overtopping the curb. Sub-basins A-11 (1.49 AC.), A-12 (0.55 AC.), A-13 (0.60 AC.), A-14 (2.11 AC.) also consist of standard residential Type ‘A’ and Type ‘B’ lots. Runoff from these basins are directed to design point 11 via curb and gutter. A sump inlet at this design point receives the flow and directs it to Pond A via underground storm pipe. Sub-basin A-15 consists mostly of detention pond A. A portion of this basin consists of rear lot runoff from Type ‘B’ lots. Runoff sheet flows overland until it reaches the trickle channel at the pond bottom, where it is directed with rest of the flows from Basin A, and then into the Pond A outlet structure. Basin B Basin B accounts for the runoff being directed to Pond B. To the greatest extent possible, runoff from developed portions of Basin B is conveyed to this proposed EURV and 100-year detention pond located at the northeast corner of the site. Sub-basins B-01 (0.66 AC.), B-02 (1.41 AC.), B-03 (3.08 AC.), B-04 (2.13 AC.), B-05 (0.72 AC.), B-4.1 (0.41 AC.), B-06 (2.34 AC.), B-07 (0.51 AC.) and B-08 (0.70 AC.) also consist of standard residential Type ‘A’ and Type ‘B’ lots with some park area. Runoff from these basins are directed to design points 17 and 18 via curb and gutter. Two sump inlets at these design points receive the flow and directs it to Pond B via underground storm pipe running along the northern boundary of the site. An on-grade inlet at design point 16

Eastcreek Farm 10/28/2016 Page 11
t 303.561.3333 | f 303.561.3339 | 45 West 2nd Avenue, Denver, Colorado 80223 | www.waremalcomb.com
helps reduce flow in the curb and gutter in order to keep the minor flow from overtopping the curb. Sub-basins B-10 (1.42 AC.), B-20 (2.34 AC.), B-16 (4.20 AC.), B-15 (0.49 AC.), B-18 (1.00 AC.) and B-19 (1.25 AC.) also consist of standard residential Type ‘A’ and Type ‘B’ lots. Flows from B-15 and B-16 are mostly captured at sump inlets located at design points 33 and 34 next to the speed table. The major storm will overtop the speed table and be directed toward design point 24 via curb and gutter. Runoff from basins B-10, B-20, B-18 and B-19 are also directed to design point 24 via curb and gutter. A sump inlet at this design point receives the flow and directs it to Pond B via underground storm pipe. An on-grade inlet at design point 28 helps reduce flow in the curb and gutter in order to keep the minor flow from overtopping the curb before reaching the sump inlet at design point 24. Sub-basins B-09 (2.18 AC.), B-11 (1.66 AC.), B-12 (1.53 AC.), B-13 (0.48 AC.), B-21 (0.98 AC.) and B-22 (1.52 AC.) also consists of standard residential Type ‘A’ and Type ‘B’ lots with some park area. Runoff from these basins being directed to design point 32 via curb and gutter. A sump inlet at this design point receives the flow and directs it to Pond B via underground storm pipe running along the northern boundary of the site. An on-grade inlet at design point 29 helps reduce flow in the curb and gutter in order to keep the minor flow from overtopping the curb. Sub-basins B-23 (2.88 AC.), B-24.1 (0.25 AC.), B-24 (1.49 AC.), B-25 (2.65 AC.) also consist of standard residential Type ‘A’ and Type ‘B’ lots. Runoff from these basins are directed to design point 27 via curb and gutter. A sump inlet at this design point receives the flow and directs it to Pond B via underground storm pipe running along the northern boundary of the site. An on-grade inlet at design point 26 helps reduce flow in the curb and gutter in order to keep the minor flow from overtopping the curb. Sub-basins B-27 (2.48 AC.) and B-26 (2.17 AC.) consists mostly of detention pond B. A portion of these basins consist of rear lot runoff from Type ‘B’ lots. Runoff sheet flows overland until it reaches the trickle channel at the pond bottom, where it is directed with rest of the flows from Basin B, and then into the Pond B outlet structure. Basin C Basin C accounts for the runoff being directed to Pond A. To the greatest extent possible, runoff from developed portions of Basin A is conveyed to this proposed EURV and 100-year detention pond located south of E. 152nd Ave. on the southern portion of the site. Sub-basins C-01 (0.80 AC.), C-02 (0.86 AC.) and C-03 (2.61 AC.) consists of standard residential Type ‘A’ and Type ‘B’ lots. Runoff from these basins are directed to design

Eastcreek Farm 10/28/2016 Page 12
t 303.561.3333 | f 303.561.3339 | 45 West 2nd Avenue, Denver, Colorado 80223 | www.waremalcomb.com
point 39 via curb and gutter. A sump inlet at this design point receives the flow and directs it to Pond C via underground storm pipe. Sub-basin C-04 (2.72 AC.) consists of Type ‘B’ lots and E. 152nd Ave. Runoff from this basin is directed to design point 40 via curb and gutter. A sump inlet at this design point receives the flow and directs it to Pond C via underground storm. Sub-basins C-05 (1.28 AC.) and C-06 (2.27 AC.) consists mostly of standard residential Type ‘A’ and Type ‘B’ lots. Runoff from these basins are directed to design point 42 via curb and gutter. A sump inlet at this design point receives the flow and directs it to Pond C via underground storm pipe. Sub-basins C-07 (1.42 AC.) and C-08 (0.91 AC.) consists mostly of York Street, with some standard residential Type ‘B’ lots. Runoff from these basins are directed to design points 36 and 37 via curb and gutter. A sump inlet at this design point receives the flow and directs it to Pond C via underground storm pipe. Sub-basins C-09 (1.02 AC.) and C-10 (0.83 AC.) consists mostly of detention pond C. Runoff sheet flows overland until it reaches the trickle channel at the pond bottom, where it is directed with rest of the flows from Basin C, and then into the Pond C outlet structure.
German Ditch German Ditch is an irrigation ditch that runs through the eastern side of the site. This irrigation ditch will be left undisturbed, except where proposed roads will cross the ditch. In these areas, a proposed 48” RCP has been placed to convey irrigation flows under the road.
Sump Inlet Overflow Design Overflow channels have been designed and graded in at drainage points 6,7,8,10,11,18,17,27,32,39,42,43 and 40. These overflow channels have been designed to convey flows away from potentially clogged inlets and lead them directly to the appropriate driangeways. The overflow channels have each been designed to convey the flows in the 100-year storm event. See Appendix B of this report for more information on emergency overflow design. Offsite Basin Conveyance The offsite basins within this project are referred to as Basin OS-1 through OS-14. These basins represent property which generally drains in its historic fashion onto the proposed site.

Eastcreek Farm 10/28/2016 Page 13
t 303.561.3333 | f 303.561.3339 | 45 West 2nd Avenue, Denver, Colorado 80223 | www.waremalcomb.com
Riprap Design Riprap has been designed in accordance with Urban Drainage Criteria. All rundowns have also been designed in accordance with Urban Drainage criteria. Details of these designs have been included within Appendix B of this report. All flow characteristics and velocities were taken from the Hydraflow storm sewer design which can also be found in Appendix B. Any type L riprap has been upsized to type M soil riprap.
V. CONCLUSION
This drainage report has been prepared in conformity with the City of Thornton Standards and Specifications for the Design and Construction of Public and Improvements, and Urban Drainage Criteria Manuals. The proposed drainage plan is also in conformance with assumptions made within the OSP study that was prepared for the Big Dry Creek major drainage basin. The proposed drainage facilities shall safely and effectively convey significant storm events to adequate outfall locations.

Eastcreek Farm 10/28/2016 Page 14
t 303.561.3333 | f 303.561.3339 | 45 West 2nd Avenue, Denver, Colorado 80223 | www.waremalcomb.com
VI. REFERENCES
1. Urban Storm Drainage Criteria Manual, volumes 1, 2, and 3, Urban Drainage and Flood Control District, January 2016.
2. Natural Resources Conservation Center Web Soil Survey, United States Department of Agriculture, site visited October 2016.
3. Federal Emergency Management Agency Flood Insurance Rate Map, Community-Panel Number 08001C0302J, Map Revised January 20, 2016.
4. City of Thornton – Standards and Specifications, City of Thornton, CO, Revised October 2012.
5. Outfall Systems Planning Update of Big Dry Creek Northern Tributaries Conceptual Preliminary Design Report (March 2007), Wright Engineers Inc., March 2007.

t 303.561.3333 | f 303.561.3339 | 45 West 2nd Avenue, Denver, Colorado 80223 | www.waremalcomb.com
APPENDIX A – Reference Materials FEMA Flood Insurance Rate Map NRCS Soil Information Related Drainage Reports


Hydrologic Soil Group—Adams County Area, Parts of Adams and Denver Counties, Colorado(EASTCREEK NRCS WEB SOIL SURVEY)
Natural ResourcesConservation Service
Web Soil SurveyNational Cooperative Soil Survey
10/11/2016Page 1 of 4
4424
400
4424
500
4424
600
4424
700
4424
800
4424
900
4425
000
4425
100
4425
200
4424
400
4424
500
4424
600
4424
700
4424
800
4424
900
4425
000
4425
100
4425
200
503300 503400 503500 503600 503700 503800 503900 504000 504100 504200 504300 504400 504500 504600 504700
503300 503400 503500 503600 503700 503800 503900 504000 504100 504200 504300 504400 504500 504600 504700
39° 58' 38'' N10
4° 5
7' 4
1'' W
39° 58' 38'' N
104°
56'
40'
' W
39° 58' 8'' N
104°
57'
41'
' W
39° 58' 8'' N
104°
56'
40'
' W
N
Map projection: Web Mercator Corner coordinates: WGS84 Edge tics: UTM Zone 13N WGS840 300 600 1200 1800
Feet0 50 100 200 300
MetersMap Scale: 1:6,600 if printed on A landscape (11" x 8.5") sheet.
Warning: Soil Map may not be valid at this scale.

CITY OF THORNTON – Standards and Specifications Revised: October 2012
400-3
1. The storm sewer grade shall be such that a minimum cover is maintained to withstand AASHTO HS-20 loading on the pipe. The minimum cover depends upon the pipe size, type and class, and soil bedding condition, but shall be not less than 18 inches for Reinforced Concrete Pipe (RCP) and 24 inches for High Density Polyethylene (HDPE) at any point along the pipe.
2. Refer to Section 200 and 300 for clearance requirements. 3. Uniform slopes shall be maintained between manholes.
C. Horizontal Alignment
The minimum horizontal separation between storm sewers and water mains shall be 10 feet measured from edge of pipe to edge of pipe.
D. Material
Storm sewers within the City shall be constructed using the following material and meet the applicable standard as presented below:
TABLE 400-2
STORM SEWER STANDARDS
Pipe Material Standard Application
Reinforced Concrete (ClassIII) ASTM C-76/C-506/C-507/C-789/C-850
or AASHTO M-170/M-206/M-207/M-259/M-273
Permitted for all public and private
storm sewer
High Density Polyethylene Polyvinyl Chloride Pipe
AASHTO M-294/M-252 or ASTM F-667ASTM F-679/F-794/F-1803/D-
3212/F-477 or AASHTO M-304
Permitted for all private storm sewer
1. High Density Polyethylene Polyvinyl Chloride Pipe (HDPE)
i. The maximum pipe size for High Density Polyethylene is 48 inch diameter.
ii. The minimum allowable pipe size for all public storm sewer, with the exception of detention pond outlets shall be 18 inches.
iii. The Responsible Party’s shall provide calculations for all concrete head and end walls required
due to the buoyancy of HDPE. E. Storm Sewer Hydraulics
All storm sewers shall be designed for the buildout condition of the street as depicted in the current Transportation Plan, and include the five (5) and 100 year HGL. The five (5) year HGL should be completely contained within the pipe and the 100 year HGL must be contained within the overall drainage system but cannot encroach onto any lots.
402.8 Inlets
1. All inlets in sump conditions must provide an emergency overflow that does not encroach upon
residential lots. All emergency overflows shall be designed for a major storm and the assumption that the storm sewer system is plugged. In addition, the 100 year ponding shall be shown on grading plans.
2. Care should be taken to not place inlets within areas which will be shadowed during the winter months by structures, landscaping, or fencing along the south side of east-west roadways. This may require additional inlets along north-south roadways to minimize flows to the south side of an east-west street.
A. Types of Inlets
Grate and slotted inlets and are not permitted.

CITY OF THORNTON – Standards and Specifications Revised: October 2012
400-1
SECTION 400 - STORM DRAINAGE DESIGN, GRADING, AND WATER QUALITY TECHNICAL CRITERIA 401 GENERAL PROVISIONS 401.1 Purpose
A. These standards are promulgated by the Public Works Director of the City in accordance with the authority
contained in the City Code. Improvements shall also be in conformance with all applicable provisions of the City Code. B. This section presents the minimum design and technical criteria for the analysis and design of storm drainage facilities located within the City. All subdivisions or any other proposed construction, which increase drainage from historic levels or otherwise alters storm runoff shall be subject to these Standards and Specifications. The primary resource for stormwater drainage policy and design is the Urban Drainage and Flood Control District’s (UDFCD) Urban Storm Drainage Criteria Manual (UDFCD Manual). The purpose of these Standards and Specifications is to further define the guidelines and/or to identify variations.
C. In addition to the above, these regulations are to establish minimum design criteria for water quality
control, flood control, and site grading, which are all closely related to stormwater management.
1. Design Criteria
Storm drainage system analysis and design shall meet or exceed these Standards and Specifications which were developed to support and supplement the policies and standards set forth by the UDFCD. Policies and technical criteria not specifically addressed in this document shall follow the provisions of the UDFCD Manual. The Responsible Party is also referred to the Colorado Department of Transportation's Standard Plans ("M-Standards") for additional design details not covered in these Standards and Specifications or the UDFCD Manual.
2. Review and Approval
a. The Development Engineering Manager shall review submittals as necessary for general compliance with these Standards and Specifications. An approval by the Development Engineering Manager does not relieve the Responsible Party from the responsibility of ensuring that the calculations, plans, specifications, construction, and record drawings are in compliance with these Standards and Specifications.
b. The UDFCD shall approve reports and construction plans for regional detention ponds or
Masterplan drainageway improvements as required by this Section or the UDFCD Manual. Where floodplain delineation is involved, UDFCD and FEMA approval is required. All submittals to either UDFCD or FEMA shall be made to the City, who will coordinate the submittal and approval.
402 STORM DRAINAGE DESIGN CRITERIA 402.1 Rainfall
1. Introduction
A. Colorado Urban Hydrograph Procedure (CUHP) or an equivalent method shall be used to generate an
inflow hydrographs from watersheds unless a variance is approved by the Development Engineering Manager.
B. Design Storm Distribution
The one (1) hour design point rainfall values obtained from the NOAA Atlas for Thornton are as follows:
TABLE 400-1
ONE (1) HOUR POINT RAINFALL (IN.)
2-YEAR 5-YEAR 100-YEAR .97 1.38 2.69
402.2 Runoff
A. Introduction This subsection presents the criteria and methodology for approximating the storm runoff design peaks
and volumes to be used in the City in the preparation of storm drainage studies, plans, and facility design.

CITY OF THORNTON – Standards and Specifications Revised: October 2012
400-2
The details of the rainfall/runoff models are presented in the UDFCD Manual. The specific input data requirements and modifications to the procedures are presented in this subsection.
B. CUHP
The CUHP method or equivalent UDFCD method shall be used to determine stormwater runoff calculations. The procedures for the CUHP, as explained in the Manual, Volume-1 "Runoff," shall be followed in the preparation of drainage reports or plans and storm drainage facility designs in the City.
402.3 Overlot Grading
For residential application (single family detached and duplex), the grading shall be designed so that no more than one lot shall drain through another lot.
402.4 Street Drainage
A. Introduction
The Responsible Party is directed to utilize the UDFCD Manual for allowable use of streets for storm runoff, with the exception that the allowable depth of water at the gutter flowline shall be 12 inches on local and collector roadways and streets shall be designed so that the runoff does not encroach onto residential lots.
402.5 Curb and Gutter
A. The minimum longitudinal slope of a gutter shall be 0.75%. B. The minimum cross slope of two (2)% for pavement drainage. C. Concrete cross pans may be used to convey runoff across intersections. However, cross pans will only be
permitted at locations where traffic is controlled by a stop sign. The minimum longitudinal slope for cross pans is 0.75%.
402.6 Roadside Ditches
A. Roadside ditches shall not be permitted in lieu of curb and gutter for public right-of-way except in instances
where the Responsible Party is only required to construct curb and gutter for one (1) side of the roadway, then roadside ditches are permitted and shall be designed to adequately carry the street runoff caused by the minor storm.
B. Freeboard of six (6) inches is required on all roadside ditches. C. Roadside ditches shall be designed with maximum side slopes of 4:1 and maximum velocities during the
minor storm of five (5) feet per second. D. Where the requirements of this section cannot be met, curb and gutter and/or storm sewer shall be
required.
E. Roadside ditches are not permitted in or adjacent to developed property. Are allowed only on a temporary basis and must be approved by the Development Engineering Manager. The primary function is to convey right-of-way drainage to an approved drainage system or approved drainageway.
402.7 Storm Sewers
A. Introduction 1. Storm sewers must be designed to convey the minor storm without surcharging the pipe. The CUHP
method is required to determine the peak flows that the storm sewers must be able to covey. Modeling shall be done using StormCAD or approved equal.
2. All storm sewer infrastructure in public right-of-ways shall be designed for the ultimate cross section
of the roadway. 3. The minimum allowable pipe size for all public storm sewer shall be 18 inches. 4. Private owned and maintained detention pond outlet pipes which do not discharge to public right-of-
way may be smaller than 18 inches. B. Vertical Alignment

DRAINAGE CRITERIA MANUAL (V. 1) RUNOFF
Figure RO-3— Watershed Imperviousness, Single-Family Residential Ranch Style Houses
2007-01 RO-15 Urban Drainage and Flood Control District
40%Imperviousness
2,400 sq. ft.

DRAINAGE CRITERIA MANUAL (V. 1) RUNOFF
Figure RO-5—Watershed Imperviousness, Single-Family Residential Two-Story Houses
Figure RO-6—Runoff Coefficient, C, vs. Watershed Percentage Imperviousness NRCS Hydrologic Soil Group A
2007-01 RO-17 Urban Drainage and Flood Control District
34%ImperviousnessTotal residentialimperviousnesscalculated assuming25% of site was aRanch Style Unit:
0.25(40%)+.75(34%)=35.5% Imperviousness
2,400 sq. ft.

MAP LEGEND MAP INFORMATION
Area of Interest (AOI)Area of Interest (AOI)
SoilsSoil Rating Polygons
A
A/D
B
B/D
C
C/D
D
Not rated or not available
Soil Rating LinesA
A/D
B
B/D
C
C/D
D
Not rated or not available
Soil Rating PointsA
A/D
B
B/D
C
C/D
D
Not rated or not available
Water FeaturesStreams and Canals
TransportationRails
Interstate Highways
US Routes
Major Roads
Local Roads
BackgroundAerial Photography
The soil surveys that comprise your AOI were mapped at 1:20,000.
Warning: Soil Map may not be valid at this scale.
Enlargement of maps beyond the scale of mapping can causemisunderstanding of the detail of mapping and accuracy of soil lineplacement. The maps do not show the small areas of contrastingsoils that could have been shown at a more detailed scale.
Please rely on the bar scale on each map sheet for mapmeasurements.
Source of Map: Natural Resources Conservation ServiceWeb Soil Survey URL: http://websoilsurvey.nrcs.usda.govCoordinate System: Web Mercator (EPSG:3857)
Maps from the Web Soil Survey are based on the Web Mercatorprojection, which preserves direction and shape but distortsdistance and area. A projection that preserves area, such as theAlbers equal-area conic projection, should be used if more accuratecalculations of distance or area are required.
This product is generated from the USDA-NRCS certified data as ofthe version date(s) listed below.
Soil Survey Area: Adams County Area, Parts of Adams andDenver Counties, ColoradoSurvey Area Data: Version 12, Sep 22, 2015
Soil map units are labeled (as space allows) for map scales 1:50,000or larger.
Date(s) aerial images were photographed: Mar 16, 2012—Sep18, 2014
The orthophoto or other base map on which the soil lines werecompiled and digitized probably differs from the backgroundimagery displayed on these maps. As a result, some minor shiftingof map unit boundaries may be evident.
Hydrologic Soil Group—Adams County Area, Parts of Adams and Denver Counties, Colorado(EASTCREEK NRCS WEB SOIL SURVEY)
Natural ResourcesConservation Service
Web Soil SurveyNational Cooperative Soil Survey
10/11/2016Page 2 of 4

Hydrologic Soil Group
Hydrologic Soil Group— Summary by Map Unit — Adams County Area, Parts of Adams and Denver Counties, Colorado(CO001)
Map unit symbol Map unit name Rating Acres in AOI Percent of AOI
AdB Arvada loam, 0 to 3percent slopes
C 0.4 0.3%
AsC Ascalon sandy loam, 3 to5 percent slopes
B 8.7 7.3%
AsD Ascalon sandy loam, 5 to9 percent slopes
B 3.6 3.0%
NuB Nunn clay loam, 1 to 3percent slopes
C 2.3 2.0%
PlB Platner loam, 0 to 3percent slopes
C 60.3 50.6%
PlC Platner loam, 3 to 5percent slopes
C 9.9 8.3%
UlC Ulm loam, 3 to 5 percentslopes
C 26.1 21.9%
UlD Ulm loam, 5 to 9 percentslopes
C 7.8 6.6%
Totals for Area of Interest 119.2 100.0%
Hydrologic Soil Group—Adams County Area, Parts of Adams and Denver Counties, Colorado EASTCREEK NRCS WEB SOILSURVEY
Natural ResourcesConservation Service
Web Soil SurveyNational Cooperative Soil Survey
10/11/2016Page 3 of 4

Description
Hydrologic soil groups are based on estimates of runoff potential. Soils areassigned to one of four groups according to the rate of water infiltration when thesoils are not protected by vegetation, are thoroughly wet, and receive precipitationfrom long-duration storms.
The soils in the United States are assigned to four groups (A, B, C, and D) andthree dual classes (A/D, B/D, and C/D). The groups are defined as follows:
Group A. Soils having a high infiltration rate (low runoff potential) when thoroughlywet. These consist mainly of deep, well drained to excessively drained sands orgravelly sands. These soils have a high rate of water transmission.
Group B. Soils having a moderate infiltration rate when thoroughly wet. Theseconsist chiefly of moderately deep or deep, moderately well drained or well drainedsoils that have moderately fine texture to moderately coarse texture. These soilshave a moderate rate of water transmission.
Group C. Soils having a slow infiltration rate when thoroughly wet. These consistchiefly of soils having a layer that impedes the downward movement of water orsoils of moderately fine texture or fine texture. These soils have a slow rate of watertransmission.
Group D. Soils having a very slow infiltration rate (high runoff potential) whenthoroughly wet. These consist chiefly of clays that have a high shrink-swellpotential, soils that have a high water table, soils that have a claypan or clay layerat or near the surface, and soils that are shallow over nearly impervious material.These soils have a very slow rate of water transmission.
If a soil is assigned to a dual hydrologic group (A/D, B/D, or C/D), the first letter isfor drained areas and the second is for undrained areas. Only the soils that in theirnatural condition are in group D are assigned to dual classes.
Rating Options
Aggregation Method: Dominant Condition
Component Percent Cutoff: None Specified
Tie-break Rule: Higher
Hydrologic Soil Group—Adams County Area, Parts of Adams and Denver Counties, Colorado EASTCREEK NRCS WEB SOILSURVEY
Natural ResourcesConservation Service
Web Soil SurveyNational Cooperative Soil Survey
10/11/2016Page 4 of 4

t 303.561.3333 | f 303.561.3339 | 45 West 2nd Avenue, Denver, Colorado 80223 | www.waremalcomb.com
APPENDIX B – Site Hydrology and Hydraulics % Impervious Calculations “C” Value Calculations SF2 & SF3 Rational Method Calculations Street Capacity Calculations Inlet Calculations Storm Sewer Design

PROJECT: EastcreekJOB NO.: 13049
CALC. BY: DFADATE: 10/17/2016
Impervious Percentages - from Urban Drainage Table 6-3
Residential 36%Paved 100%Parks 10%Walks 90%
Landscaping 2%Historic 2%
SOIL TYPE: C or D (use equation from Table 6-4)
PROPOSED COMPOSITE IMPERVIOUSNESS
Basin Area (ac) Residential Paved Parks Walks Landscaping Historic Imp. C2 C5 C10 C100
A-01 1.38 1.38 36% 0.32 0.36 0.46 0.67
A-02 1.68 1.68 36% 0.32 0.36 0.46 0.67
A-03 1.35 1.35 36% 0.32 0.36 0.46 0.67
A-04 1.45 1.45 36% 0.32 0.36 0.46 0.67
A-05 1.81 1.81 36% 0.32 0.36 0.46 0.67
A-06 0.93 0.93 36% 0.32 0.36 0.46 0.67
A-07 1.84 1.53 0.31 31% 0.28 0.32 0.43 0.65
A-7.1 0.33 0.05 0.28 24% 0.21 0.26 0.37 0.61
A-08 1.97 1.68 0.29 32% 0.28 0.33 0.43 0.65
A-09 0.72 0.72 36% 0.32 0.36 0.46 0.67
Weighted Impervious and C ValuesAreas (ac)
JANSEN STRAWN COMPOSITE C VALUES - PROP10/28/2016
13049-SF2 SF3.xlsx

PROJECT: EastcreekJOB NO.: 13049
CALC. BY: DFADATE: 10/17/2016
Impervious Percentages - from Urban Drainage Table 6-3
Residential 36%Paved 100%Parks 10%Walks 90%
Landscaping 2%Historic 2%
SOIL TYPE: C or D (use equation from Table 6-4)
PROPOSED COMPOSITE IMPERVIOUSNESS
Basin Area (ac) Residential Paved Parks Walks Landscaping Historic Imp. C2 C5 C10 C100
Weighted Impervious and C ValuesAreas (ac)
A-10 0.29 0.29 36% 0.32 0.36 0.46 0.67
A-11 1.49 1.49 36% 0.32 0.36 0.46 0.67
A-12 0.55 0.55 36% 0.32 0.36 0.46 0.67
A-13 0.60 0.60 36% 0.32 0.36 0.46 0.67
A-14 2.11 2.11 36% 0.32 0.36 0.46 0.67
A-15 1.72 0.38 1.34 9% 0.08 0.13 0.27 0.55
OS-01 1.57 0.70 0.87 17% 0.15 0.20 0.33 0.58
OS-02 1.13 0.59 0.54 19% 0.17 0.22 0.34 0.60
JANSEN STRAWN COMPOSITE C VALUES - PROP10/28/2016
13049-SF2 SF3.xlsx

PROJECT: EastcreekJOB NO.: 13049
CALC. BY: DFADATE: 10/17/2016
Impervious Percentages - from Urban Drainage Table 6-3
Residential 36%Paved 100%Parks 10%Walks 90%
Landscaping 2%Historic 2%
SOIL TYPE: C or D (use equation from Table 6-4)
PROPOSED COMPOSITE IMPERVIOUSNESS
Basin Area (ac) Residential Paved Parks Walks Landscaping Historic Imp. C2 C5 C10 C100
Weighted Impervious and C ValuesAreas (ac)
Basin A 22.92 19.24 0.05 0.88 0.00 2.75 0.00 31% 0.27 0.32 0.43 0.65
B-01 0.66 0.66 36% 0.32 0.36 0.46 0.67
B-02 1.41 1.41 36% 0.32 0.36 0.46 0.67
B-03 3.08 3.08 36% 0.32 0.36 0.46 0.67
B-04 2.13 2.13 36% 0.32 0.36 0.46 0.67
B-4.1 0.41 0.41 36% 0.32 0.36 0.46 0.67
B-05 0.72 0.72 36% 0.32 0.36 0.46 0.67
B-06 2.34 2.34 36% 0.32 0.36 0.46 0.67
B-07 0.51 0.51 36% 0.32 0.36 0.46 0.67
JANSEN STRAWN COMPOSITE C VALUES - PROP10/28/2016
13049-SF2 SF3.xlsx

PROJECT: EastcreekJOB NO.: 13049
CALC. BY: DFADATE: 10/17/2016
Impervious Percentages - from Urban Drainage Table 6-3
Residential 36%Paved 100%Parks 10%Walks 90%
Landscaping 2%Historic 2%
SOIL TYPE: C or D (use equation from Table 6-4)
PROPOSED COMPOSITE IMPERVIOUSNESS
Basin Area (ac) Residential Paved Parks Walks Landscaping Historic Imp. C2 C5 C10 C100
Weighted Impervious and C ValuesAreas (ac)
B-08 0.70 0.70 36% 0.32 0.36 0.46 0.67
B-09 2.18 1.56 0.62 28% 0.25 0.30 0.41 0.64
B-10 1.42 1.10 0.32 30% 0.26 0.31 0.42 0.64
B-11 1.66 0.96 0.70 25% 0.22 0.27 0.38 0.62
B-12 1.53 1.53 36% 0.32 0.36 0.46 0.67
B-13 0.48 0.48 36% 0.32 0.36 0.46 0.67
B-14 2.32 2.32 36% 0.32 0.36 0.46 0.67
B-15 0.49 0.39 0.10 80% 0.71 0.75 0.79 0.87
B-16 4.20 4.20 36% 0.32 0.36 0.46 0.67
B-17 1.17 1.17 36% 0.32 0.36 0.46 0.67
JANSEN STRAWN COMPOSITE C VALUES - PROP10/28/2016
13049-SF2 SF3.xlsx

PROJECT: EastcreekJOB NO.: 13049
CALC. BY: DFADATE: 10/17/2016
Impervious Percentages - from Urban Drainage Table 6-3
Residential 36%Paved 100%Parks 10%Walks 90%
Landscaping 2%Historic 2%
SOIL TYPE: C or D (use equation from Table 6-4)
PROPOSED COMPOSITE IMPERVIOUSNESS
Basin Area (ac) Residential Paved Parks Walks Landscaping Historic Imp. C2 C5 C10 C100
Weighted Impervious and C ValuesAreas (ac)
B-18 1.00 0.34 0.66 41% 0.36 0.41 0.50 0.69
B-19 1.25 0.81 0.44 27% 0.24 0.28 0.40 0.63
B-20 2.34 1.05 1.29 21% 0.19 0.24 0.36 0.60
B-21 0.98 0.98 36% 0.32 0.36 0.46 0.67
B-22 1.52 1.52 36% 0.32 0.36 0.46 0.67
B-23 2.88 2.88 36% 0.32 0.36 0.46 0.67
B-24 1.74 1.74 36% 0.32 0.36 0.46 0.67
B-24.1 0.25 0.25 36% 0.32 0.36 0.46 0.67
B-25 2.65 2.65 36% 0.32 0.36 0.46 0.67
B-26 2.17 0.23 1.94 13% 0.11 0.16 0.29 0.57
JANSEN STRAWN COMPOSITE C VALUES - PROP10/28/2016
13049-SF2 SF3.xlsx

PROJECT: EastcreekJOB NO.: 13049
CALC. BY: DFADATE: 10/17/2016
Impervious Percentages - from Urban Drainage Table 6-3
Residential 36%Paved 100%Parks 10%Walks 90%
Landscaping 2%Historic 2%
SOIL TYPE: C or D (use equation from Table 6-4)
PROPOSED COMPOSITE IMPERVIOUSNESS
Basin Area (ac) Residential Paved Parks Walks Landscaping Historic Imp. C2 C5 C10 C100
Weighted Impervious and C ValuesAreas (ac)
B-27 2.48 0.80 1.68 18% 0.16 0.21 0.33 0.59
Basin B 46.67 38.19 0.73 7.65 0.00 0.10 0.00 32% 0.29 0.33 0.44 0.65
C-01 0.80 0.80 36% 0.32 0.36 0.46 0.67
C-02 0.85 0.85 36% 0.32 0.36 0.46 0.67
C-03 2.61 2.58 0.03 35% 0.31 0.36 0.46 0.67
C-04 2.72 2.72 36% 0.32 0.36 0.46 0.67
C-05 1.28 1.28 36% 0.32 0.36 0.46 0.67
JANSEN STRAWN COMPOSITE C VALUES - PROP10/28/2016
13049-SF2 SF3.xlsx

PROJECT: EastcreekJOB NO.: 13049
CALC. BY: DFADATE: 10/17/2016
Impervious Percentages - from Urban Drainage Table 6-3
Residential 36%Paved 100%Parks 10%Walks 90%
Landscaping 2%Historic 2%
SOIL TYPE: C or D (use equation from Table 6-4)
PROPOSED COMPOSITE IMPERVIOUSNESS
Basin Area (ac) Residential Paved Parks Walks Landscaping Historic Imp. C2 C5 C10 C100
Weighted Impervious and C ValuesAreas (ac)
C-06 2.27 2.27 36% 0.32 0.36 0.46 0.67
C-07 1.42 1.00 0.42 73% 0.65 0.69 0.74 0.84
C-08 0.91 0.24 0.36 0.31 52% 0.47 0.51 0.59 0.74
C-09 1.02 0.90 0.12 32% 0.28 0.33 0.43 0.65
C-10 0.83 0.83 10% 0.09 0.14 0.27 0.55
Basin C 14.71 11.64 1.36 1.59 0.00 0.12 0.00 38% 0.34 0.39 0.48 0.68
OS-03 1.50 1.50 10% 0.09 0.14 0.27 0.55
JANSEN STRAWN COMPOSITE C VALUES - PROP10/28/2016
13049-SF2 SF3.xlsx

PROJECT: EastcreekJOB NO.: 13049
CALC. BY: DFADATE: 10/17/2016
Impervious Percentages - from Urban Drainage Table 6-3
Residential 36%Paved 100%Parks 10%Walks 90%
Landscaping 2%Historic 2%
SOIL TYPE: C or D (use equation from Table 6-4)
PROPOSED COMPOSITE IMPERVIOUSNESS
Basin Area (ac) Residential Paved Parks Walks Landscaping Historic Imp. C2 C5 C10 C100
Weighted Impervious and C ValuesAreas (ac)
OS-04 0.49 0.49 10% 0.09 0.14 0.27 0.55
OS-05 0.12 0.12 10% 0.09 0.14 0.27 0.55
OS-06 5.22 5.22 10% 0.09 0.14 0.27 0.55
OS-07 0.20 0.20 10% 0.09 0.14 0.27 0.55
OS-08 0.42 0.42 10% 0.09 0.14 0.27 0.55
OS-09 2.33 2.33 10% 0.09 0.14 0.27 0.55
OS-10 0.55 0.55 10% 0.09 0.14 0.27 0.55
OS-11 3.56 3.56 10% 0.09 0.14 0.27 0.55
OS-12 2.15 0.89 1.26 21% 0.18 0.23 0.35 0.60
OS-13 0.18 0.15 0.03 85% 0.76 0.79 0.83 0.89
JANSEN STRAWN COMPOSITE C VALUES - PROP10/28/2016
13049-SF2 SF3.xlsx

PROJECT: EastcreekJOB NO.: 13049
CALC. BY: DFADATE: 10/17/2016
Impervious Percentages - from Urban Drainage Table 6-3
Residential 36%Paved 100%Parks 10%Walks 90%
Landscaping 2%Historic 2%
SOIL TYPE: C or D (use equation from Table 6-4)
PROPOSED COMPOSITE IMPERVIOUSNESS
Basin Area (ac) Residential Paved Parks Walks Landscaping Historic Imp. C2 C5 C10 C100
Weighted Impervious and C ValuesAreas (ac)
OS-14 1.53 0.88 0.65 63% 0.56 0.60 0.67 0.79
JANSEN STRAWN COMPOSITE C VALUES - PROP10/28/2016
13049-SF2 SF3.xlsx

Calculated By: Project: EastcreekDate: Job No.: 13049
Checked By:
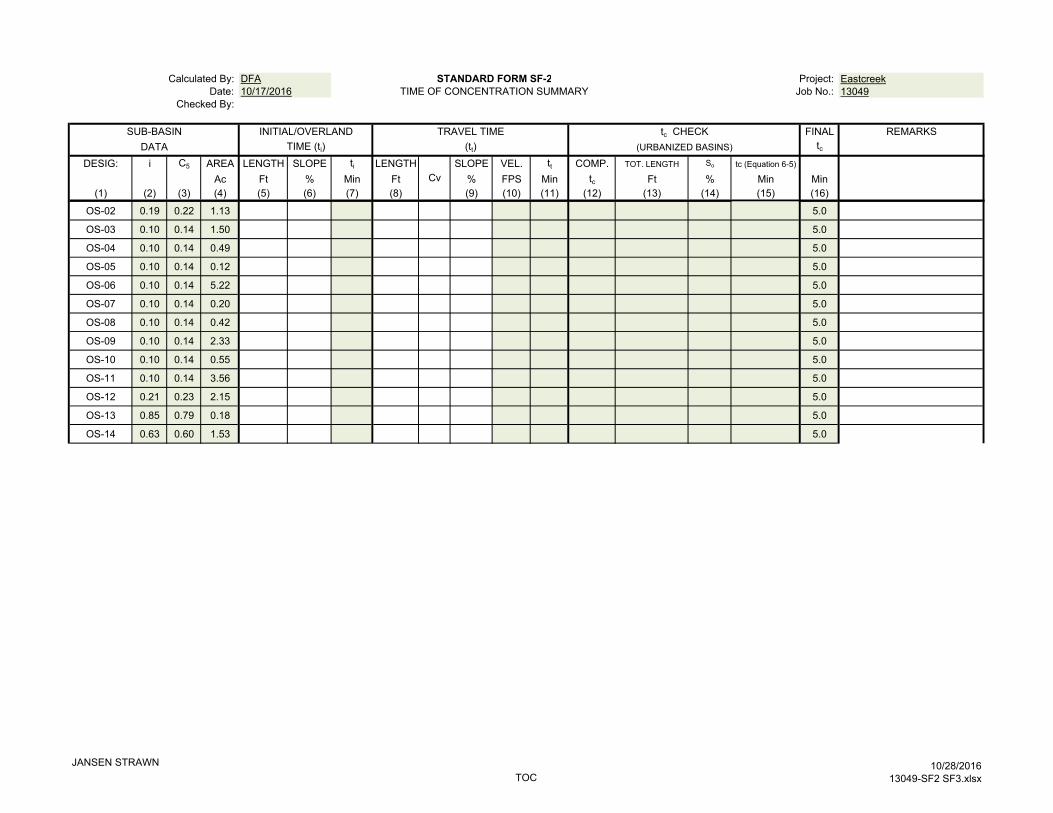
FINAL REMARKStc
DESIG: i C5 AREA LENGTH SLOPE ti LENGTH SLOPE VEL. tt COMP. TOT. LENGTH So tc (Equation 6-5)
Ac Ft % Min Ft % FPS Min tc Ft % Min Min(1) (2) (3) (4) (5) (6) (7) (8) (9) (10) (11) (12) (13) (14) (15) (16)
A-01 0.36 0.36 1.38 126 2.5 11.2 493 20 0.8 1.7 4.7 16.0 619 1.11 17.5 16.0
A-02 0.36 0.36 1.68 67 2.5 8.2 730 20 0.8 1.7 7.0 15.2 797 0.90 19.5 15.2
A-03 0.36 0.36 1.35 130 2.5 11.4 385 20 0.9 1.9 3.4 14.8 515 1.30 16.3 14.8
A-04 0.36 0.36 1.45 134 2.5 11.6 663 20 0.8 1.8 6.1 17.7 797 1.10 18.8 17.7
A-05 0.36 0.36 1.81 130 3.9 9.8 507 20 0.8 1.8 4.8 14.6 637 1.42 17.0 14.6
A-06 0.36 0.36 0.93 71 2.5 8.4 371 20 0.8 1.7 3.6 12.0 442 1.03 16.2 12.0
A-07 0.31 0.32 1.84 125 2.5 11.7 568 20 0.8 1.7 5.4 17.2 693 1.07 19.0 17.2
A-7.1 0.24 0.26 0.33 123 2.5 12.6 62 20 0.8 1.7 0.6 13.2 185 1.92 15.7 13.2
A-08 0.32 0.33 1.97 118 2.5 11.3 701 20 0.8 1.7 6.7 18.1 819 1.00 20.2 18.1
A-09 0.36 0.36 0.72 65 2.5 8.1 655 20 0.8 1.7 6.3 14.4 720 0.91 18.8 14.4
A-10 0.36 0.36 0.29 66 2.5 8.1 125 20 0.8 1.7 1.2 9.3 191 1.35 14.0 9.3
A-11 0.36 0.36 1.49 70 2.5 8.4 615 20 2.8 3.3 3.1 11.4 685 2.72 16.0 11.4
A-12 0.36 0.36 0.55 120 2.5 10.9 261 20 3.5 3.7 1.2 12.1 381 3.19 14.4 12.1
A-13 0.36 0.36 0.60 125 2.5 11.2 277 20 0.8 1.8 2.6 13.7 402 1.33 15.5 13.7
A-14 0.36 0.36 2.11 24 2.5 4.9 948 20 0.9 1.9 8.5 13.4 972 0.90 21.0 13.4
A-15 0.09 0.13 1.72 225 8.0 13.3 180 20 0.8 1.7 1.7 15.0 405 4.78 18.8 15.0
5.0
B-01 0.36 0.36 0.66 118 2.5 10.8 385 20 0.8 1.7 3.7 14.6 503 1.16 16.5 14.6
B-02 0.36 0.36 1.41 67 2.5 8.2 540 20 0.8 1.7 5.2 13.4 607 0.94 17.8 13.4
B-03 0.36 0.36 3.08 238 2.5 15.4 568 20 0.8 1.7 5.5 20.9 806 1.27 18.5 18.5
B-04 0.36 0.36 2.13 127 2.5 11.3 882 20 0.8 1.7 8.5 19.7 1,009 0.97 21.0 19.7
B-4.1 0.36 0.36 0.41 124 2.5 11.1 126 20 1.9 2.8 0.8 11.9 250 2.20 14.0 11.9
B-05 0.36 0.36 0.72 65 2.5 8.1 667 20 0.8 1.8 6.2 14.3 732 0.95 18.8 14.3
B-06 0.36 0.36 2.34 130 2.5 11.4 817 20 0.8 1.7 7.9 19.2 947 0.99 20.4 19.2
B-07 0.36 0.36 0.51 60 2.5 7.7 165 20 0.9 1.9 1.4 9.2 225 1.33 14.3 9.2
B-08 0.36 0.36 0.70 64 2.5 8.0 254 20 0.8 1.7 2.4 10.4 318 1.10 15.1 10.4
B-09 0.28 0.30 2.18 258 5.7 13.3 355 20 2.5 3.2 1.9 15.1 613 3.83 16.5 15.1
B-10 0.30 0.31 1.42 71 2.5 9.0 726 20 2.2 3.0 4.1 13.1 797 2.22 18.2 13.1
B-11 0.25 0.27 1.66 290 2.8 18.6 231 20 1.8 2.6 1.5 20.0 521 2.31 17.5 17.5
Cv
DFA10/17/2016
DATASUB-BASIN TRAVEL TIME
(tt)
STANDARD FORM SF-2TIME OF CONCENTRATION SUMMARY
tc CHECK(URBANIZED BASINS)
INITIAL/OVERLANDTIME (ti)
JANSEN STRAWNTOC
10/28/201613049-SF2 SF3.xlsx

Calculated By: Project: EastcreekDate: Job No.: 13049
Checked By:
FINAL REMARKStc
DESIG: i C5 AREA LENGTH SLOPE ti LENGTH SLOPE VEL. tt COMP. TOT. LENGTH So tc (Equation 6-5)
Ac Ft % Min Ft % FPS Min tc Ft % Min Min(1) (2) (3) (4) (5) (6) (7) (8) (9) (10) (11) (12) (13) (14) (15) (16)
Cv
DFA10/17/2016
DATASUB-BASIN TRAVEL TIME
(tt)
STANDARD FORM SF-2TIME OF CONCENTRATION SUMMARY
tc CHECK(URBANIZED BASINS)
INITIAL/OVERLANDTIME (ti)
B-12 0.36 0.36 1.53 65 2.5 8.1 813 20 2.3 3.0 4.5 12.5 878 2.31 17.4 12.5
B-13 0.36 0.36 0.48 98 2.5 9.9 243 20 1.3 2.3 1.8 11.7 341 1.65 14.8 11.7
B-15 0.80 0.75 0.49 13 3.5 1.5 688 20 2.8 3.3 3.4 5.0 701 2.81 8.2 5.0
B-16 0.36 0.36 4.20 205 2.5 14.3 726 20 2.5 3.2 3.8 18.1 931 2.50 17.5 17.5
B-17 0.36 0.36 1.17 300 3.0 16.3 417 7 3.0 1.2 5.7 22.0 717 3.00 16.0 16.0
B-18 0.41 0.41 1.00 204 3.3 12.2 22 20 0.8 1.7 0.2 12.4 226 3.05 12.9 12.4
B-19 0.27 0.28 1.25 230 2.5 16.7 126 20 1.3 2.3 0.9 17.7 356 2.08 16.3 16.3
B-20 0.21 0.24 2.34 184 2.0 17.0 204 20 1.3 2.3 1.5 18.5 388 1.63 17.7 17.7
B-21 0.36 0.36 0.98 122 2.0 11.9 465 20 2.8 3.3 2.3 14.2 587 2.59 15.6 14.2
B-22 0.36 0.36 1.52 135 2.5 11.6 361 20 2.8 3.3 1.8 13.4 496 2.68 15.1 13.4
B-23 0.36 0.36 2.88 142 2.5 11.9 655 20 1.1 2.1 5.2 17.1 797 1.35 18.2 17.1
B-24 0.36 0.36 1.74 188 2.5 13.7 304 20 1.0 2.0 2.5 16.2 492 1.57 15.9 15.9
B-24.1 0.36 0.36 0.25 27 3.0 4.9 242 20 1.3 2.3 1.8 6.7 269 1.44 14.5 6.7
B-25 0.36 0.36 2.65 120 2.5 10.9 910 20 1.0 2.0 7.6 18.5 1,030 1.17 20.4 18.5
B-26 0.13 0.16 2.17 185 10.0 10.9 130 20 0.8 1.7 1.3 12.1 315 6.18 17.5 12.1
B-27 0.18 0.21 2.48 250 10.0 12.0 180 20 0.8 1.7 1.7 13.7 430 6.13 17.0 13.7
5.0
C-01 0.36 0.36 0.80 63 2.5 7.9 394 20 0.8 1.8 3.7 11.6 457 1.03 16.3 11.6
C-02 0.36 0.36 0.85 124 2.5 11.1 306 20 1.8 2.7 1.9 13.0 430 1.99 15.2 13.0
C-03 0.35 0.36 2.61 180 2.5 13.4 300 20 0.8 1.7 2.9 16.3 480 1.41 16.0 16.0
C-04 0.36 0.36 2.72 156 5.5 9.6 650 20 1.8 2.7 4.1 13.6 806 2.50 16.8 13.6
C-05 0.36 0.36 1.28 63 2.5 7.9 195 20 1.2 2.2 1.5 9.4 258 1.52 14.4 9.4
C-06 0.36 0.36 2.27 121 2.5 11.0 636 20 1.3 2.3 4.6 15.6 757 1.49 17.7 15.6
C-07 0.73 0.69 1.42 40 3.0 3.3 841 20 1.1 2.1 6.7 10.0 881 1.18 11.6 10.0
C-08 0.52 0.51 0.91 105 3.0 7.7 215 20 0.8 1.8 2.0 9.7 320 1.52 11.9 9.7
C-09 0.32 0.33 1.02 152 2.0 13.9 195 20 0.8 1.8 1.8 15.7 347 1.33 15.8 15.7
C-10 0.10 0.14 0.83 300 11.0 13.7 180 20 0.8 1.7 1.7 15.5 480 7.16 18.6 15.5
5.0
OS-01 0.17 0.20 1.57 5.0
JANSEN STRAWNTOC
10/28/201613049-SF2 SF3.xlsx
Calculated By: Project: EastcreekDate: Job No.: 13049
Checked By:
FINAL REMARKStc
DESIG: i C5 AREA LENGTH SLOPE ti LENGTH SLOPE VEL. tt COMP. TOT. LENGTH So tc (Equation 6-5)
Ac Ft % Min Ft % FPS Min tc Ft % Min Min(1) (2) (3) (4) (5) (6) (7) (8) (9) (10) (11) (12) (13) (14) (15) (16)
Cv
DFA10/17/2016
DATASUB-BASIN TRAVEL TIME
(tt)
STANDARD FORM SF-2TIME OF CONCENTRATION SUMMARY
tc CHECK(URBANIZED BASINS)
INITIAL/OVERLANDTIME (ti)
OS-02 0.19 0.22 1.13 5.0
OS-03 0.10 0.14 1.50 5.0
OS-04 0.10 0.14 0.49 5.0
OS-05 0.10 0.14 0.12 5.0
OS-06 0.10 0.14 5.22 5.0
OS-07 0.10 0.14 0.20 5.0
OS-08 0.10 0.14 0.42 5.0
OS-09 0.10 0.14 2.33 5.0
OS-10 0.10 0.14 0.55 5.0
OS-11 0.10 0.14 3.56 5.0
OS-12 0.21 0.23 2.15 5.0
OS-13 0.85 0.79 0.18 5.0
OS-14 0.63 0.60 1.53 5.0
JANSEN STRAWNTOC
10/28/201613049-SF2 SF3.xlsx

Calculated By: Project: EastcreekDate: Job No.: 13049
Checked By: Design Storm: 5-YR1.38
DES
IGN
PO
INT
AREA
D
ESIG
N
AREA
(A
C)
RU
NO
FF
CO
EFF
t c
(MIN
)
C *
A
(AC
)
I
(IN
/HR
)
Q
(C
FS)
t c
(MIN
)
S (C
* A)
(CA) I
(IN/H
R)
Q
(C
FS)
SLO
PE
(%
)
STR
EET
FLO
W
DES
IGN
FLO
W (C
FS)
SLO
PE
(%
)
PIPE
DIA
M.
(IN.)
(2) (3) (4) (5) (6) (7) (8) (9) (10) (11) (12) (13) (14) (15) (16) (17) (18) (19) (20) (21) (22)A-04 1 1.45 0.36 17.7 0.52 2.89 1.5 0.8% 1.5 92 1.7 0.9 Street flow to crosspan at DP4 and then to DP1
A-03 1 1.35 0.36 14.8 0.49 3.15 1.5 Street flow to sump inlet at DP1
A-01 1 1.38 0.36 16.0 0.50 3.04 1.5 Street flow to sump inlet at DP1
1 18.5 0.5 2.82 1.4 Sump inlet at DP1
A-02 2 1.68 0.36 15.2 0.61 3.11 1.9 Sump inlet at DP2
A-05 5 1.81 0.36 14.6 0.65 3.17 2.1 Street flow to crosspan at DP5
A-07 7 1.84 0.32 17.2 0.60 2.94 1.7 Ongrade inlet at DP7
A-7.1 7.1 0.33 0.26 13.2 0.09 3.32 0.3 Street flow to ongrade inlet at DP7.1
7.1 17.2 1.3 2.94 3.9 Sump inlet at DP7.1
A-06 6 0.93 0.36 12.0 0.34 3.47 1.2 Sump inlet at DP6
A-09 8 0.72 0.36 14.4 0.26 3.20 0.8 0.8% 0.8 84 1.8 0.8 Street flow to DP9 and then to DP8
A-08 8 1.97 0.33 18.1 0.65 2.86 1.8 Street flow to inlet at DP8
8 18.1 0.9 2.86 2.6 Sump inlet at DP8
A-10 10 0.29 0.36 9.3 0.10 3.84 0.4 Sump inlet at DP10
A-11 11 1.49 0.36 11.4 0.54 3.53 1.9 Street flow to inlet at DP11
A-13 11 0.60 0.36 13.7 0.22 3.26 0.7 2.5% 0.7 205 3.2 1.1 Street flow to crosspan at DP13, then to DP11
A-12 11 0.55 0.36 12.1 0.20 3.45 0.7 1.0% 0.7 58 2.0 0.5 Street flow to crosspan at DP12, then to DP11
A-14 11 2.11 0.36 13.4 0.76 3.30 2.5 1.0% 2.5 58 2.0 0.5 Street flow to crosspan at DP14/DP12, then to DP11
11 14.8 1.7 3.15 5.4 Sump inlet at DP11
B-02 21 1.41 0.36 13.4 0.51 3.30 1.7 0.8% 1.7 21 1.7 0.2 Street flow to crosspan then to DP21
B-01 21 0.66 0.36 14.6 0.24 3.18 0.8 Street flow to DP21
14.6 0.7 3.18 2.4 Ongrade inlet at DP21
B-03 16 3.08 0.36 18.5 1.11 2.83 3.1 1.9% 3.1 65 2.8 0.4 Street flow to crosspan at DP15 then to DP16
STANDARD FORM SF-310/17/2016 STORM DRAINAGE SYSTEM DESIGN
(RATIONAL METHOD PROCEDURE)
PIPE
DFA
LEN
GTH
(F
T)
VELO
CIT
Y
(F
PS)
t t
(MIN
)
REMARKS
5-yr, 1-hour rainfall=
DIRECT RUNOFF TOTAL RUNOFF STREET
BASIN
JANSEN STRAWN5-YEAR
10/28/201613049-SF2 SF3.xlsx

Calculated By: Project: EastcreekDate: Job No.: 13049
Checked By: Design Storm: 5-YR1.38
DES
IGN
PO
INT
AREA
D
ESIG
N
AREA
(A
C)
RU
NO
FF
CO
EFF
t c
(MIN
)
C *
A
(AC
)
I
(IN
/HR
)
Q
(C
FS)
t c
(MIN
)
S (C
* A)
(CA) I
(IN/H
R)
Q
(C
FS)
SLO
PE
(%
)
STR
EET
FLO
W
DES
IGN
FLO
W (C
FS)
SLO
PE
(%
)
PIPE
DIA
M.
(IN.)
(2) (3) (4) (5) (6) (7) (8) (9) (10) (11) (12) (13) (14) (15) (16) (17) (18) (19) (20) (21) (22)
STANDARD FORM SF-310/17/2016 STORM DRAINAGE SYSTEM DESIGN
(RATIONAL METHOD PROCEDURE)
PIPE
DFA
LEN
GTH
(F
T)
VELO
CIT
Y
(F
PS)
t t
(MIN
)
REMARKS
5-yr, 1-hour rainfall=
DIRECT RUNOFF TOTAL RUNOFF STREET
BASIN
B-04 16 2.13 0.36 19.7 0.77 2.73 2.1 Street flow to DP16
19.7 1.9 2.73 5.1 Ongrade inlet at DP16
B-07 17 0.51 0.36 9.2 0.18 3.86 0.7 0.9% 0.7 688 1.9 5.9 Street flows to crosspan at DP22 then DP17
B-06 17 2.34 0.36 19.2 0.84 2.77 2.3 Street flows to DP 17
B-4.1 17 0.41 0.36 11.9 0.15 3.48 0.5 Street flows to DP 17
19.2 1.2 2.77 3.3 Sump inlet at DP17
B-05 18 0.72 0.36 14.3 0.26 3.21 0.8 Street flow to DP18
B-08 18 0.70 0.36 10.4 0.25 3.67 0.9 Street flow to DP18
18 14.3 0.5 3.21 1.6 Sump inlet at DP18
B-17 17.1 1.17 0.36 16.0 0.42 3.03 1.3 2.6% 1.3 491 3.2 2.6 Street flow to DP17.1 then to DP23
B-18 23 1.00 0.41 12.4 0.41 3.41 1.4 1.1% 2.7 205 2.1 1.6 Street flow to DP23 then to DP24
B-19 24 1.25 0.28 16.3 0.35 3.01 1.1 Street flow to DP24
B-20 24 2.34 0.24 17.7 0.56 2.89 1.6 Street flow to DP24
24 18.6 1.7 2.82 4.9 Sump inlet at DP24
B-10 28 1.42 0.31 13.1 0.44 3.34 1.5 Ongrade inlet at DP28
B-09 36 2.18 0.30 15.1 0.65 3.12 2.0 2.2% 2.0 440 3.0 2.5 Street flows to DP36 then to DP29
B-11 36 1.66 0.27 17.5 0.44 2.91 1.3 2.9% 3.3 437 3.4 2.1 Street flows to DP36 then to DP29
B-12 29 1.53 0.36 12.5 0.55 3.40 1.9 Street flows to DP29
29 19.6 1.6 2.74 4.5 Ongrade inlet at DP29
B-13 30 0.48 0.36 11.7 0.17 3.51 0.6 1.4% 0.6 471 2.4 3.3 Street flows to DP30 then to DP32
B-21 32 0.98 0.36 14.2 0.35 3.21 1.1 Street flows to DP32
B-22 32 1.52 0.36 13.4 0.55 3.30 1.8 Steet flows to DP32
32 15.0 1.1 3.14 3.4 Sump inlet at DP32
B-16 33 4.20 0.36 17.5 1.52 2.91 4.4 Sump inlet at DP33
JANSEN STRAWN5-YEAR
10/28/201613049-SF2 SF3.xlsx

Calculated By: Project: EastcreekDate: Job No.: 13049
Checked By: Design Storm: 5-YR1.38
DES
IGN
PO
INT
AREA
D
ESIG
N
AREA
(A
C)
RU
NO
FF
CO
EFF
t c
(MIN
)
C *
A
(AC
)
I
(IN
/HR
)
Q
(C
FS)
t c
(MIN
)
S (C
* A)
(CA) I
(IN/H
R)
Q
(C
FS)
SLO
PE
(%
)
STR
EET
FLO
W
DES
IGN
FLO
W (C
FS)
SLO
PE
(%
)
PIPE
DIA
M.
(IN.)
(2) (3) (4) (5) (6) (7) (8) (9) (10) (11) (12) (13) (14) (15) (16) (17) (18) (19) (20) (21) (22)
STANDARD FORM SF-310/17/2016 STORM DRAINAGE SYSTEM DESIGN
(RATIONAL METHOD PROCEDURE)
PIPE
DFA
LEN
GTH
(F
T)
VELO
CIT
Y
(F
PS)
t t
(MIN
)
REMARKS
5-yr, 1-hour rainfall=
DIRECT RUNOFF TOTAL RUNOFF STREET
BASIN
B-15 34 0.49 0.75 5.0 0.37 4.68 1.7 Sump inlet at DP34
B-23 25 2.88 0.36 17.1 1.04 2.94 3.1 0.8% 3.1 42 1.7 0.4 Street flows to crosspan at DP25 then DP26
B-24.1 26 0.25 0.36 6.7 0.09 4.31 0.4 Steet flows to DP26
26 17.5 1.1 2.91 3.3 Ongrade inlet at DP26
B-24 27 1.74 0.36 15.9 0.63 3.05 1.9 Street flows to DP27
B-25 27 2.65 0.36 18.5 0.96 2.82 2.7 Street flows to DP27
27 18.5 1.6 2.82 4.5 Sump inlet at DP27
C-07 36 1.42 0.69 10.0 0.98 3.73 3.7 Sump inlet at DP36
C-08 37 0.91 0.51 9.7 0.46 3.77 1.7 Sump inlet at DP37
C-01 38 0.80 0.36 11.6 0.29 3.51 1.0 1.2% 1.0 454 2.2 3.4 Street flows to DP38
C-02 38 0.85 0.36 13.0 0.31 3.34 1.0 1.2% 2.0 436 2.2 3.3 Street flows to DP38
C-03 39 2.61 0.36 16.0 0.94 3.04 2.8
16.3 1.5 3.01 4.6 Sump inlet at DP39
C-04 40 2.72 0.36 13.6 0.98 3.27 3.2 Sump inlet at DP40
C-05 41 1.28 0.36 9.4 0.46 3.82 1.8 1.8% 1.8 90 2.7 0.6 Street flows to DP41 then to 42
C-06 42 2.27 0.36 15.6 0.82 3.07 2.5 Street flows to DP42
15.6 1.3 3.07 3.9 Sump inlet at DP42
C-09 43 1.02 0.33 15.7 0.33 3.07 1.0 Sump inlet at DP43
JANSEN STRAWN5-YEAR
10/28/201613049-SF2 SF3.xlsx

Calculated By: Project: EastcreekDate: Job No.: 13049
Checked By: Design Storm: 100-YR2.69
DES
IGN
PO
INT
AREA
D
ESIG
N
AREA
(A
C)
RU
NO
FF
CO
EFF
t c
(MIN
)
C *
A
(AC
)
I
(IN
/HR
)
Q
(C
FS)
t c
(MIN
)
S (C
* A)
(CA) I
(IN/H
R)
Q
(C
FS)
SLO
PE
(%
)
STR
EET
FLO
W
DES
IGN
FLO
W (C
FS)
SLO
PE
(%
)
PIPE
DIA
M.
(IN.)
(2) (3) (4) (5) (6) (7) (8) (9) (10) (11) (12) (13) (14) (15) (16) (17) (18) (19) (20) (21) (22)A-04 1 1.45 0.67 17.7 0.97 5.64 5.5 0.8% 5.5 92 1.7 0.9 Street flow to crosspan at DP4 and then to DP1
A-03 1 1.35 0.67 14.8 0.90 6.15 5.5 Street flow to sump inlet at DP1
A-01 1 1.38 0.67 16.0 0.92 5.93 5.5 Street flow to sump inlet at DP1
1 18.5 0.9 5.50 5.1 Sump inlet at DP1
A-02 2 1.68 0.67 15.2 1.12 6.07 6.8 Sump inlet at DP2
A-05 5 1.81 0.67 14.6 1.21 6.18 7.5 Street flow to crosspan at DP5
A-07 7 1.84 0.65 17.2 1.19 5.72 6.8 Ongrade inlet at DP7
A-7.1 7.1 0.33 0.61 13.2 0.20 6.47 1.3 Street flow to ongrade inlet at DP7.1
7.1 17.2 2.6 5.72 14.9 Sump inlet at DP7.1
A-06 6 0.93 0.67 12.0 0.62 6.76 4.2 Sump inlet at DP6
A-09 8 0.72 0.67 14.4 0.48 6.23 3.0 0.8% 3.0 84 1.8 0.8 Street flow to DP9 and then to DP8
A-08 8 1.97 0.65 18.1 1.28 5.58 7.1 Street flow to inlet at DP8
8 18.1 1.8 5.58 9.8 Sump inlet at DP8
A-10 10 0.29 0.67 9.3 0.19 7.48 1.4 Sump inlet at DP10
A-11 11 1.49 0.67 11.4 0.99 6.89 6.9 Street flow to inlet at DP11
A-13 11 0.60 0.67 13.7 0.40 6.36 2.5 2.5% 2.5 205 3.2 1.1 Street flow to crosspan at DP13, then to DP11
A-12 11 0.55 0.67 12.1 0.37 6.73 2.5 1.0% 2.5 58 2.0 0.5 Street flow to crosspan at DP12, then to DP11
A-14 11 2.11 0.67 13.4 1.41 6.43 9.1 1.0% 9.1 58 2.0 0.5 Street flow to crosspan at DP14/DP12, then to DP11
11 14.8 3.2 6.14 19.5 Sump inlet at DP11
B-02 21 1.41 0.67 13.4 0.94 6.44 6.1 0.8% 6.1 21 1.7 0.2 Street flow to crosspan then to DP21
B-01 21 0.66 0.67 14.6 0.44 6.19 2.7 Street flow to DP21
14.6 1.4 6.19 8.6 Ongrade inlet at DP21
B-03 16 3.08 0.67 18.5 2.06 5.51 11.3 1.9% 11.3 65 2.8 0.4 Street flow to crosspan at DP15 then to DP16
STANDARD FORM SF-310/17/2016 STORM DRAINAGE SYSTEM DESIGN
(RATIONAL METHOD PROCEDURE)
PIPE
DFA
LEN
GTH
(F
T)
VELO
CIT
Y
(F
PS)
t t
(MIN
)
REMARKS
100-yr, 1-hour rainfall=
DIRECT RUNOFF TOTAL RUNOFF STREET
BASIN
JANSEN STRAWN100-YEAR
10/28/201613049-SF2 SF3.xlsx

Calculated By: Project: EastcreekDate: Job No.: 13049
Checked By: Design Storm: 100-YR2.69
DES
IGN
PO
INT
AREA
D
ESIG
N
AREA
(A
C)
RU
NO
FF
CO
EFF
t c
(MIN
)
C *
A
(AC
)
I
(IN
/HR
)
Q
(C
FS)
t c
(MIN
)
S (C
* A)
(CA) I
(IN/H
R)
Q
(C
FS)
SLO
PE
(%
)
STR
EET
FLO
W
DES
IGN
FLO
W (C
FS)
SLO
PE
(%
)
PIPE
DIA
M.
(IN.)
(2) (3) (4) (5) (6) (7) (8) (9) (10) (11) (12) (13) (14) (15) (16) (17) (18) (19) (20) (21) (22)
STANDARD FORM SF-310/17/2016 STORM DRAINAGE SYSTEM DESIGN
(RATIONAL METHOD PROCEDURE)
PIPE
DFA
LEN
GTH
(F
T)
VELO
CIT
Y
(F
PS)
t t
(MIN
)
REMARKS
100-yr, 1-hour rainfall=
DIRECT RUNOFF TOTAL RUNOFF STREET
BASIN
B-04 16 2.13 0.67 19.7 1.42 5.33 7.6 Street flow to DP16
19.7 3.5 5.33 18.5 Ongrade inlet at DP16
B-07 17 0.51 0.67 9.2 0.34 7.52 2.6 0.9% 2.6 688 1.9 5.9 Street flows to crosspan at DP22 then DP17
B-06 17 2.34 0.67 19.2 1.56 5.40 8.4 Street flows to DP 17
B-4.1 17 0.41 0.67 11.9 0.27 6.78 1.9 Street flows to DP 17
19.2 2.2 5.40 11.8 Sump inlet at DP17
B-05 18 0.72 0.67 14.3 0.48 6.25 3.0 Street flow to DP18
B-08 18 0.70 0.67 10.4 0.47 7.16 3.3 Street flow to DP18
18 14.3 0.9 6.25 5.9 Sump inlet at DP18
B-17 17.1 1.17 0.67 16.0 0.78 5.91 4.6 2.6% 4.6 491 3.2 2.6 Street flow to DP17.1 then to DP23
B-18 23 1.00 0.69 12.4 0.69 6.65 4.6 1.1% 9.2 205 2.1 1.6 Street flow to DP23 then to DP24
B-19 24 1.25 0.63 16.3 0.78 5.87 4.6 Street flow to DP24
B-20 24 2.34 0.60 17.7 1.41 5.63 8.0 Street flow to DP24
24 18.6 3.7 5.49 20.2 Sump inlet at DP24
B-10 28 1.42 0.64 13.1 0.91 6.50 5.9 Ongrade inlet at DP28
B-09 36 2.18 0.64 15.1 1.38 6.08 8.4 2.2% 8.4 440 3.0 2.5 Street flows to DP36 then to DP29
B-11 36 1.66 0.62 17.5 1.03 5.67 5.8 2.9% 14.2 437 3.4 2.1 Street flows to DP36 then to DP29
B-12 29 1.53 0.67 12.5 1.02 6.63 6.8 Street flows to DP29
29 19.6 3.4 5.35 18.4 Ongrade inlet at DP29
B-13 30 0.48 0.67 11.7 0.32 6.84 2.2 1.4% 2.2 471 2.4 3.3 Street flows to DP30 then to DP32
B-21 32 0.98 0.67 14.2 0.65 6.26 4.1 Street flows to DP32
B-22 32 1.52 0.67 13.4 1.01 6.43 6.5 Steet flows to DP32
32 15.0 2.0 6.11 12.2 Sump inlet at DP32
B-16 33 4.20 0.67 17.5 2.80 5.67 15.9 Sump inlet at DP33
JANSEN STRAWN100-YEAR
10/28/201613049-SF2 SF3.xlsx

Calculated By: Project: EastcreekDate: Job No.: 13049
Checked By: Design Storm: 100-YR2.69
DES
IGN
PO
INT
AREA
D
ESIG
N
AREA
(A
C)
RU
NO
FF
CO
EFF
t c
(MIN
)
C *
A
(AC
)
I
(IN
/HR
)
Q
(C
FS)
t c
(MIN
)
S (C
* A)
(CA) I
(IN/H
R)
Q
(C
FS)
SLO
PE
(%
)
STR
EET
FLO
W
DES
IGN
FLO
W (C
FS)
SLO
PE
(%
)
PIPE
DIA
M.
(IN.)
(2) (3) (4) (5) (6) (7) (8) (9) (10) (11) (12) (13) (14) (15) (16) (17) (18) (19) (20) (21) (22)
STANDARD FORM SF-310/17/2016 STORM DRAINAGE SYSTEM DESIGN
(RATIONAL METHOD PROCEDURE)
PIPE
DFA
LEN
GTH
(F
T)
VELO
CIT
Y
(F
PS)
t t
(MIN
)
REMARKS
100-yr, 1-hour rainfall=
DIRECT RUNOFF TOTAL RUNOFF STREET
BASIN
B-15 34 0.49 0.87 5.0 0.43 9.12 3.9 Sump inlet at DP34
B-23 25 2.88 0.67 17.1 1.92 5.73 11.0 0.8% 11.0 42 1.7 0.4 Street flows to crosspan at DP25 then DP26
B-24.1 26 0.25 0.67 6.7 0.17 8.40 1.4 Steet flows to DP26
26 17.5 2.1 5.66 11.8 Ongrade inlet at DP26
B-24 27 1.74 0.67 15.9 1.16 5.95 6.9 Street flows to DP27
B-25 27 2.65 0.67 18.5 1.77 5.51 9.7 Street flows to DP27
27 18.5 2.9 5.51 16.1 Sump inlet at DP27
C-07 36 1.42 0.84 10.0 1.19 7.28 8.7 Sump inlet at DP36
C-08 37 0.91 0.74 9.7 0.68 7.36 5.0 Sump inlet at DP37
C-01 38 0.80 0.67 11.6 0.53 6.85 3.7 1.2% 3.7 454 2.2 3.4 Street flows to DP38
C-02 38 0.85 0.67 13.0 0.57 6.51 3.7 1.2% 7.4 436 2.2 3.3 Street flows to DP38
C-03 39 2.61 0.67 16.0 1.74 5.92 10.3
16.3 2.8 5.86 16.6 Sump inlet at DP39
C-04 40 2.72 0.67 13.6 1.82 6.38 11.6 Sump inlet at DP40
C-05 41 1.28 0.67 9.4 0.85 7.45 6.4 1.8% 6.4 90 2.7 0.6 Street flows to DP41 then to 42
C-06 42 2.27 0.67 15.6 1.52 5.99 9.1 Street flows to DP42
15.6 2.4 5.99 14.2 Sump inlet at DP42
C-09 43 1.02 0.65 15.7 0.66 5.98 4.0 Sump inlet at DP43
JANSEN STRAWN100-YEAR
10/28/201613049-SF2 SF3.xlsx

13049_Eastcreek UD-Inlet_v4.03.xlsm, A1 10/27/2016, 5:30 PM
Project:Inlet ID:
Gutter Geometry (Enter data in the blue cells)Maximum Allowable Width for Spread Behind Curb TBACK = 12.0 ftSide Slope Behind Curb (leave blank for no conveyance credit behind curb) SBACK = 0.040 ft/ftManning's Roughness Behind Curb (typically between 0.012 and 0.020) nBACK = 0.020
Height of Curb at Gutter Flow Line HCURB = 4.00 inchesDistance from Curb Face to Street Crown TCROWN = 17.0 ftGutter Width W = 2.00 ftStreet Transverse Slope SX = 0.020 ft/ftGutter Cross Slope (typically 2 inches over 24 inches or 0.083 ft/ft) SW = 0.083 ft/ftStreet Longitudinal Slope - Enter 0 for sump condition SO = 0.000 ft/ftManning's Roughness for Street Section (typically between 0.012 and 0.020) nSTREET = 0.015
Minor Storm Major StormMax. Allowable Spread for Minor & Major Storm TMAX = 10.6 17.0 ftMax. Allowable Depth at Gutter Flowline for Minor & Major Storm dMAX = 4.0 8.3 inches
Allow Flow Depth at Street Crown (leave blank for no) check = yes
MINOR STORM Allowable Capacity is based on Depth Criterion Minor Storm Major StormMAJOR STORM Allowable Capacity is based on Depth Criterion Qallow = SUMP SUMP cfs
ALLOWABLE CAPACITY FOR ONE-HALF OF STREET (Minor & Major Storm)(Based on Regulated Criteria for Maximum Allowable Flow Depth and Spread)
EASTCREEKA1

13049_Eastcreek UD-Inlet_v4.03.xlsm, A1 10/27/2016, 5:30 PM
Design Information (Input) MINOR MAJORType of Inlet Type =Local Depression (additional to continuous gutter depression 'a' from 'Q-Allow') alocal = 5.00 5.00 inchesNumber of Unit Inlets (Grate or Curb Opening) No = 2 2 Water Depth at Flowline (outside of local depression) Ponding Depth = 4.0 5.6 inchesGrate Information MINOR MAJORLength of a Unit Grate Lo (G) = N/A N/A feetWidth of a Unit Grate Wo = N/A N/A feetArea Opening Ratio for a Grate (typical values 0.15-0.90) Aratio = N/A N/AClogging Factor for a Single Grate (typical value 0.50 - 0.70) Cf (G) = N/A N/AGrate Weir Coefficient (typical value 2.15 - 3.60) Cw (G) = N/A N/AGrate Orifice Coefficient (typical value 0.60 - 0.80) Co (G) = N/A N/ACurb Opening Information MINOR MAJORLength of a Unit Curb Opening Lo (C) = 5.00 5.00 feetHeight of Vertical Curb Opening in Inches Hvert = 6.00 6.00 inchesHeight of Curb Orifice Throat in Inches Hthroat = 6.00 6.00 inchesAngle of Throat (see USDCM Figure ST-5) Theta = 63.40 63.40 degreesSide Width for Depression Pan (typically the gutter width of 2 feet) Wp = 2.00 2.00 feetClogging Factor for a Single Curb Opening (typical value 0.10) Cf (C) = 0.10 0.10Curb Opening Weir Coefficient (typical value 2.3-3.7) Cw (C) = 3.60 3.60Curb Opening Orifice Coefficient (typical value 0.60 - 0.70) Co (C) = 0.67 0.67
Low Head Performance Reduction (Calculated) MINOR MAJORDepth for Grate Midwidth dGrate = N/A N/A ftDepth for Curb Opening Weir Equation dCurb = 0.17 0.30 ftCombination Inlet Performance Reduction Factor for Long Inlets RFCombination = 0.38 0.53Curb Opening Performance Reduction Factor for Long Inlets RFCurb = 0.79 0.91Grated Inlet Performance Reduction Factor for Long Inlets RFGrate = N/A N/A
MINOR MAJOR
Total Inlet Interception Capacity (assumes clogged condition) Qa = 3.1 8.7 cfsInlet Capacity IS GOOD for Minor and Major Storms(>Q PEAK) Q PEAK REQUIRED = 1.4 5.1 cfs
INLET IN A SUMP OR SAG LOCATION
CDOT Type R Curb Opening
H-VertH-Curb
W
Lo (C)
Lo (G)
WoWP
CDOT Type R Curb Opening
Override Depths

13049_Eastcreek UD-Inlet_v4.03.xlsm, A2 10/27/2016, 5:30 PM
Project:Inlet ID:
Gutter Geometry (Enter data in the blue cells)Maximum Allowable Width for Spread Behind Curb TBACK = 12.0 ftSide Slope Behind Curb (leave blank for no conveyance credit behind curb) SBACK = 0.040 ft/ftManning's Roughness Behind Curb (typically between 0.012 and 0.020) nBACK = 0.020
Height of Curb at Gutter Flow Line HCURB = 4.00 inchesDistance from Curb Face to Street Crown TCROWN = 17.0 ftGutter Width W = 2.00 ftStreet Transverse Slope SX = 0.020 ft/ftGutter Cross Slope (typically 2 inches over 24 inches or 0.083 ft/ft) SW = 0.083 ft/ftStreet Longitudinal Slope - Enter 0 for sump condition SO = 0.000 ft/ftManning's Roughness for Street Section (typically between 0.012 and 0.020) nSTREET = 0.015
Minor Storm Major StormMax. Allowable Spread for Minor & Major Storm TMAX = 10.6 17.0 ftMax. Allowable Depth at Gutter Flowline for Minor & Major Storm dMAX = 4.0 8.3 inches
Allow Flow Depth at Street Crown (leave blank for no) check = yes
MINOR STORM Allowable Capacity is based on Depth Criterion Minor Storm Major StormMAJOR STORM Allowable Capacity is based on Depth Criterion Qallow = SUMP SUMP cfs
ALLOWABLE CAPACITY FOR ONE-HALF OF STREET (Minor & Major Storm)(Based on Regulated Criteria for Maximum Allowable Flow Depth and Spread)
EASTCREEKA2

13049_Eastcreek UD-Inlet_v4.03.xlsm, A2 10/27/2016, 5:30 PM
Design Information (Input) MINOR MAJORType of Inlet Type =Local Depression (additional to continuous gutter depression 'a' from 'Q-Allow') alocal = 5.00 5.00 inchesNumber of Unit Inlets (Grate or Curb Opening) No = 2 2 Water Depth at Flowline (outside of local depression) Ponding Depth = 4.0 5.6 inchesGrate Information MINOR MAJORLength of a Unit Grate Lo (G) = N/A N/A feetWidth of a Unit Grate Wo = N/A N/A feetArea Opening Ratio for a Grate (typical values 0.15-0.90) Aratio = N/A N/AClogging Factor for a Single Grate (typical value 0.50 - 0.70) Cf (G) = N/A N/AGrate Weir Coefficient (typical value 2.15 - 3.60) Cw (G) = N/A N/AGrate Orifice Coefficient (typical value 0.60 - 0.80) Co (G) = N/A N/ACurb Opening Information MINOR MAJORLength of a Unit Curb Opening Lo (C) = 5.00 5.00 feetHeight of Vertical Curb Opening in Inches Hvert = 6.00 6.00 inchesHeight of Curb Orifice Throat in Inches Hthroat = 6.00 6.00 inchesAngle of Throat (see USDCM Figure ST-5) Theta = 63.40 63.40 degreesSide Width for Depression Pan (typically the gutter width of 2 feet) Wp = 2.00 2.00 feetClogging Factor for a Single Curb Opening (typical value 0.10) Cf (C) = 0.10 0.10Curb Opening Weir Coefficient (typical value 2.3-3.7) Cw (C) = 3.60 3.60Curb Opening Orifice Coefficient (typical value 0.60 - 0.70) Co (C) = 0.67 0.67
Low Head Performance Reduction (Calculated) MINOR MAJORDepth for Grate Midwidth dGrate = N/A N/A ftDepth for Curb Opening Weir Equation dCurb = 0.17 0.30 ftCombination Inlet Performance Reduction Factor for Long Inlets RFCombination = 0.38 0.53Curb Opening Performance Reduction Factor for Long Inlets RFCurb = 0.79 0.91Grated Inlet Performance Reduction Factor for Long Inlets RFGrate = N/A N/A
MINOR MAJOR
Total Inlet Interception Capacity (assumes clogged condition) Qa = 3.1 8.7 cfsInlet Capacity IS GOOD for Minor and Major Storms(>Q PEAK) Q PEAK REQUIRED = 1.9 6.8 cfs
INLET IN A SUMP OR SAG LOCATION
CDOT Type R Curb Opening
H-VertH-Curb
W
Lo (C)
Lo (G)
WoWP
CDOT Type R Curb Opening
Override Depths

13049_Eastcreek UD-Inlet_v4.03.xlsm, A3 10/27/2016, 5:31 PM
Project:Inlet ID:
Gutter Geometry (Enter data in the blue cells)Maximum Allowable Width for Spread Behind Curb TBACK = 12.0 ftSide Slope Behind Curb (leave blank for no conveyance credit behind curb) SBACK = 0.040 ft/ftManning's Roughness Behind Curb (typically between 0.012 and 0.020) nBACK = 0.020
Height of Curb at Gutter Flow Line HCURB = 4.00 inchesDistance from Curb Face to Street Crown TCROWN = 17.0 ftGutter Width W = 2.00 ftStreet Transverse Slope SX = 0.020 ft/ftGutter Cross Slope (typically 2 inches over 24 inches or 0.083 ft/ft) SW = 0.083 ft/ftStreet Longitudinal Slope - Enter 0 for sump condition SO = 0.008 ft/ftManning's Roughness for Street Section (typically between 0.012 and 0.020) nSTREET = 0.015
Minor Storm Major StormMax. Allowable Spread for Minor & Major Storm TMAX = 10.6 17.0 ftMax. Allowable Depth at Gutter Flowline for Minor & Major Storm dMAX = 4.0 8.3 inches
Allow Flow Depth at Street Crown (leave blank for no) check = yes
MINOR STORM Allowable Capacity is based on Depth Criterion Minor Storm Major StormMAJOR STORM Allowable Capacity is based on Depth Criterion Qallow = 3.2 38.3 cfs
Major storm max. allowable capacity GOOD - greater than the design flow given on sheet 'Inlet Management'Minor storm max. allowable capacity GOOD - greater than the design flow given on sheet 'Inlet Management'
ALLOWABLE CAPACITY FOR ONE-HALF OF STREET (Minor & Major Storm)(Based on Regulated Criteria for Maximum Allowable Flow Depth and Spread)
EASTCREEKA3

13049_Eastcreek UD-Inlet_v4.03.xlsm, A3 10/27/2016, 5:31 PM
Design Information (Input) MINOR MAJORType of Inlet Type =Local Depression (additional to continuous gutter depression 'a') aLOCAL = 5.0 5.0 inchesTotal Number of Units in the Inlet (Grate or Curb Opening) No = 2 2Length of a Single Unit Inlet (Grate or Curb Opening) Lo = 5.00 5.00 ftWidth of a Unit Grate (cannot be greater than W, Gutter Width) Wo = N/A N/A ftClogging Factor for a Single Unit Grate (typical min. value = 0.5) Cf-G = N/A N/AClogging Factor for a Single Unit Curb Opening (typical min. value = 0.1) Cf-C = 0.10 0.10Street Hydraulics: OK - Q < Allowable Street Capacity' MINOR MAJORTotal Inlet Interception Capacity Q = 1.7 6.1 cfsTotal Inlet Carry-Over Flow (flow bypassing inlet) Qb = 0.0 0.7 cfs Capture Percentage = Qa/Qo = C% = 100 90 %
INLET ON A CONTINUOUS GRADE
CDOT Type R Curb OpeningCDOT Type R Curb Opening

13049_Eastcreek UD-Inlet_v4.03.xlsm, A4 AND A7 10/27/2016, 5:31 PM
Project:Inlet ID:
Gutter Geometry (Enter data in the blue cells)Maximum Allowable Width for Spread Behind Curb TBACK = 12.0 ftSide Slope Behind Curb (leave blank for no conveyance credit behind curb) SBACK = 0.040 ft/ftManning's Roughness Behind Curb (typically between 0.012 and 0.020) nBACK = 0.020
Height of Curb at Gutter Flow Line HCURB = 4.00 inchesDistance from Curb Face to Street Crown TCROWN = 17.0 ftGutter Width W = 2.00 ftStreet Transverse Slope SX = 0.020 ft/ftGutter Cross Slope (typically 2 inches over 24 inches or 0.083 ft/ft) SW = 0.083 ft/ftStreet Longitudinal Slope - Enter 0 for sump condition SO = 0.000 ft/ftManning's Roughness for Street Section (typically between 0.012 and 0.020) nSTREET = 0.015
Minor Storm Major StormMax. Allowable Spread for Minor & Major Storm TMAX = 10.6 17.0 ftMax. Allowable Depth at Gutter Flowline for Minor & Major Storm dMAX = 4.0 8.3 inches
Allow Flow Depth at Street Crown (leave blank for no) check = yes
MINOR STORM Allowable Capacity is based on Depth Criterion Minor Storm Major StormMAJOR STORM Allowable Capacity is based on Depth Criterion Qallow = SUMP SUMP cfs
ALLOWABLE CAPACITY FOR ONE-HALF OF STREET (Minor & Major Storm)(Based on Regulated Criteria for Maximum Allowable Flow Depth and Spread)
EASTCREEKA4 AND A7

13049_Eastcreek UD-Inlet_v4.03.xlsm, A4 AND A7 10/27/2016, 5:31 PM
Design Information (Input) MINOR MAJORType of Inlet Type =Local Depression (additional to continuous gutter depression 'a' from 'Q-Allow') alocal = 5.00 5.00 inchesNumber of Unit Inlets (Grate or Curb Opening) No = 4 4 Water Depth at Flowline (outside of local depression) Ponding Depth = 4.0 8.3 inchesGrate Information MINOR MAJORLength of a Unit Grate Lo (G) = N/A N/A feetWidth of a Unit Grate Wo = N/A N/A feetArea Opening Ratio for a Grate (typical values 0.15-0.90) Aratio = N/A N/AClogging Factor for a Single Grate (typical value 0.50 - 0.70) Cf (G) = N/A N/AGrate Weir Coefficient (typical value 2.15 - 3.60) Cw (G) = N/A N/AGrate Orifice Coefficient (typical value 0.60 - 0.80) Co (G) = N/A N/ACurb Opening Information MINOR MAJORLength of a Unit Curb Opening Lo (C) = 5.00 5.00 feetHeight of Vertical Curb Opening in Inches Hvert = 6.00 6.00 inchesHeight of Curb Orifice Throat in Inches Hthroat = 6.00 6.00 inchesAngle of Throat (see USDCM Figure ST-5) Theta = 63.40 63.40 degreesSide Width for Depression Pan (typically the gutter width of 2 feet) Wp = 2.00 2.00 feetClogging Factor for a Single Curb Opening (typical value 0.10) Cf (C) = 0.10 0.10Curb Opening Weir Coefficient (typical value 2.3-3.7) Cw (C) = 3.60 3.60Curb Opening Orifice Coefficient (typical value 0.60 - 0.70) Co (C) = 0.67 0.67
Low Head Performance Reduction (Calculated) MINOR MAJORDepth for Grate Midwidth dGrate = N/A N/A ftDepth for Curb Opening Weir Equation dCurb = 0.17 0.53 ftCombination Inlet Performance Reduction Factor for Long Inlets RFCombination = 0.38 0.78Curb Opening Performance Reduction Factor for Long Inlets RFCurb = 0.64 0.91Grated Inlet Performance Reduction Factor for Long Inlets RFGrate = N/A N/A
MINOR MAJOR
Total Inlet Interception Capacity (assumes clogged condition) Qa = 5.2 41.6 cfsInlet Capacity IS GOOD for Minor and Major Storms(>Q PEAK) Q PEAK REQUIRED = 3.9 15.6 cfs
INLET IN A SUMP OR SAG LOCATION
CDOT Type R Curb Opening
H-VertH-Curb
W
Lo (C)
Lo (G)
WoWP
CDOT Type R Curb Opening
Override Depths

13049_Eastcreek UD-Inlet_v4.03.xlsm, A5 AND A6 10/27/2016, 5:31 PM
Project:Inlet ID:
Gutter Geometry (Enter data in the blue cells)Maximum Allowable Width for Spread Behind Curb TBACK = 12.0 ftSide Slope Behind Curb (leave blank for no conveyance credit behind curb) SBACK = 0.040 ft/ftManning's Roughness Behind Curb (typically between 0.012 and 0.020) nBACK = 0.020
Height of Curb at Gutter Flow Line HCURB = 4.00 inchesDistance from Curb Face to Street Crown TCROWN = 17.0 ftGutter Width W = 2.00 ftStreet Transverse Slope SX = 0.020 ft/ftGutter Cross Slope (typically 2 inches over 24 inches or 0.083 ft/ft) SW = 0.083 ft/ftStreet Longitudinal Slope - Enter 0 for sump condition SO = 0.000 ft/ftManning's Roughness for Street Section (typically between 0.012 and 0.020) nSTREET = 0.015
Minor Storm Major StormMax. Allowable Spread for Minor & Major Storm TMAX = 10.6 17.0 ftMax. Allowable Depth at Gutter Flowline for Minor & Major Storm dMAX = 4.0 8.3 inches
Allow Flow Depth at Street Crown (leave blank for no) check = yes
MINOR STORM Allowable Capacity is based on Depth Criterion Minor Storm Major StormMAJOR STORM Allowable Capacity is based on Depth Criterion Qallow = SUMP SUMP cfs
ALLOWABLE CAPACITY FOR ONE-HALF OF STREET (Minor & Major Storm)(Based on Regulated Criteria for Maximum Allowable Flow Depth and Spread)
EASTCREEKA5 AND A6

13049_Eastcreek UD-Inlet_v4.03.xlsm, A5 AND A6 10/27/2016, 5:31 PM
Design Information (Input) MINOR MAJORType of Inlet Type =Local Depression (additional to continuous gutter depression 'a' from 'Q-Allow') alocal = 5.00 5.00 inchesNumber of Unit Inlets (Grate or Curb Opening) No = 4 4 Water Depth at Flowline (outside of local depression) Ponding Depth = 4.0 8.3 inchesGrate Information MINOR MAJORLength of a Unit Grate Lo (G) = N/A N/A feetWidth of a Unit Grate Wo = N/A N/A feetArea Opening Ratio for a Grate (typical values 0.15-0.90) Aratio = N/A N/AClogging Factor for a Single Grate (typical value 0.50 - 0.70) Cf (G) = N/A N/AGrate Weir Coefficient (typical value 2.15 - 3.60) Cw (G) = N/A N/AGrate Orifice Coefficient (typical value 0.60 - 0.80) Co (G) = N/A N/ACurb Opening Information MINOR MAJORLength of a Unit Curb Opening Lo (C) = 5.00 5.00 feetHeight of Vertical Curb Opening in Inches Hvert = 6.00 6.00 inchesHeight of Curb Orifice Throat in Inches Hthroat = 6.00 6.00 inchesAngle of Throat (see USDCM Figure ST-5) Theta = 63.40 63.40 degreesSide Width for Depression Pan (typically the gutter width of 2 feet) Wp = 2.00 2.00 feetClogging Factor for a Single Curb Opening (typical value 0.10) Cf (C) = 0.10 0.10Curb Opening Weir Coefficient (typical value 2.3-3.7) Cw (C) = 3.60 3.60Curb Opening Orifice Coefficient (typical value 0.60 - 0.70) Co (C) = 0.67 0.67
Low Head Performance Reduction (Calculated) MINOR MAJORDepth for Grate Midwidth dGrate = N/A N/A ftDepth for Curb Opening Weir Equation dCurb = 0.17 0.53 ftCombination Inlet Performance Reduction Factor for Long Inlets RFCombination = 0.38 0.78Curb Opening Performance Reduction Factor for Long Inlets RFCurb = 0.64 0.91Grated Inlet Performance Reduction Factor for Long Inlets RFGrate = N/A N/A
MINOR MAJOR
Total Inlet Interception Capacity (assumes clogged condition) Qa = 5.2 41.6 cfsInlet Capacity IS GOOD for Minor and Major Storms(>Q PEAK) Q PEAK REQUIRED = 3.0 11.2 cfs
INLET IN A SUMP OR SAG LOCATION
CDOT Type R Curb Opening
H-VertH-Curb
W
Lo (C)
Lo (G)
WoWP
CDOT Type R Curb Opening
Override Depths

13049_Eastcreek UD-Inlet_v4.03.xlsm, A8 10/27/2016, 5:31 PM
Project:Inlet ID:
Gutter Geometry (Enter data in the blue cells)Maximum Allowable Width for Spread Behind Curb TBACK = 13.0 ftSide Slope Behind Curb (leave blank for no conveyance credit behind curb) SBACK = 0.030 ft/ftManning's Roughness Behind Curb (typically between 0.012 and 0.020) nBACK = 0.020
Height of Curb at Gutter Flow Line HCURB = 6.00 inchesDistance from Curb Face to Street Crown TCROWN = 18.0 ftGutter Width W = 2.00 ftStreet Transverse Slope SX = 0.020 ft/ftGutter Cross Slope (typically 2 inches over 24 inches or 0.083 ft/ft) SW = 0.083 ft/ftStreet Longitudinal Slope - Enter 0 for sump condition SO = 0.000 ft/ftManning's Roughness for Street Section (typically between 0.012 and 0.020) nSTREET = 0.015
Minor Storm Major StormMax. Allowable Spread for Minor & Major Storm TMAX = 18.0 18.0 ftMax. Allowable Depth at Gutter Flowline for Minor & Major Storm dMAX = 6.0 10.3 inches
Allow Flow Depth at Street Crown (leave blank for no) check = yes
MINOR STORM Allowable Capacity is based on Depth Criterion Minor Storm Major StormMAJOR STORM Allowable Capacity is based on Depth Criterion Qallow = SUMP SUMP cfs
ALLOWABLE CAPACITY FOR ONE-HALF OF STREET (Minor & Major Storm)(Based on Regulated Criteria for Maximum Allowable Flow Depth and Spread)
EASTCREEKA8

13049_Eastcreek UD-Inlet_v4.03.xlsm, A8 10/27/2016, 5:31 PM
Design Information (Input) MINOR MAJORType of Inlet Type =
Warning 1 Local Depression (additional to continuous gutter depression 'a' from 'Q-Allow') alocal = 5.00 5.00 inchesNumber of Unit Inlets (Grate or Curb Opening) No = 2 2 Water Depth at Flowline (outside of local depression) Ponding Depth = 5.8 5.8 inchesGrate Information MINOR MAJORLength of a Unit Grate Lo (G) = N/A N/A feetWidth of a Unit Grate Wo = N/A N/A feetArea Opening Ratio for a Grate (typical values 0.15-0.90) Aratio = N/A N/AClogging Factor for a Single Grate (typical value 0.50 - 0.70) Cf (G) = N/A N/AGrate Weir Coefficient (typical value 2.15 - 3.60) Cw (G) = N/A N/AGrate Orifice Coefficient (typical value 0.60 - 0.80) Co (G) = N/A N/ACurb Opening Information MINOR MAJORLength of a Unit Curb Opening Lo (C) = 5.00 5.00 feetHeight of Vertical Curb Opening in Inches Hvert = 6.00 6.00 inchesHeight of Curb Orifice Throat in Inches Hthroat = 6.00 6.00 inchesAngle of Throat (see USDCM Figure ST-5) Theta = 63.40 63.40 degreesSide Width for Depression Pan (typically the gutter width of 2 feet) Wp = 2.00 2.00 feetClogging Factor for a Single Curb Opening (typical value 0.10) Cf (C) = 0.10 0.10Curb Opening Weir Coefficient (typical value 2.3-3.7) Cw (C) = 3.60 3.60Curb Opening Orifice Coefficient (typical value 0.60 - 0.70) Co (C) = 0.67 0.67
Low Head Performance Reduction (Calculated) MINOR MAJORDepth for Grate Midwidth dGrate = N/A N/A ftDepth for Curb Opening Weir Equation dCurb = 0.32 0.32 ftCombination Inlet Performance Reduction Factor for Long Inlets RFCombination = 0.55 0.55Curb Opening Performance Reduction Factor for Long Inlets RFCurb = 0.92 0.92Grated Inlet Performance Reduction Factor for Long Inlets RFGrate = N/A N/A
MINOR MAJOR
Total Inlet Interception Capacity (assumes clogged condition) Qa = 9.7 9.7 cfsInlet Capacity IS GOOD for Minor and Major Storms(>Q PEAK) Q PEAK REQUIRED = 5.4 6.9 cfsWarning 1: Dimension entered is not a typical dimension for inlet type specified.
INLET IN A SUMP OR SAG LOCATION
CDOT Type R Curb Opening
H-VertH-Curb
W
Lo (C)
Lo (G)
WoWP
CDOT Type R Curb Opening
Override Depths

13049_Eastcreek UD-Inlet_v4.03.xlsm, B1 10/27/2016, 5:31 PM
Project:Inlet ID:
Gutter Geometry (Enter data in the blue cells)Maximum Allowable Width for Spread Behind Curb TBACK = 12.0 ftSide Slope Behind Curb (leave blank for no conveyance credit behind curb) SBACK = 0.040 ft/ftManning's Roughness Behind Curb (typically between 0.012 and 0.020) nBACK = 0.020
Height of Curb at Gutter Flow Line HCURB = 4.00 inchesDistance from Curb Face to Street Crown TCROWN = 17.0 ftGutter Width W = 2.00 ftStreet Transverse Slope SX = 0.020 ft/ftGutter Cross Slope (typically 2 inches over 24 inches or 0.083 ft/ft) SW = 0.083 ft/ftStreet Longitudinal Slope - Enter 0 for sump condition SO = 0.008 ft/ftManning's Roughness for Street Section (typically between 0.012 and 0.020) nSTREET = 0.015
Minor Storm Major StormMax. Allowable Spread for Minor & Major Storm TMAX = 10.6 17.0 ftMax. Allowable Depth at Gutter Flowline for Minor & Major Storm dMAX = 4.0 8.3 inches
Allow Flow Depth at Street Crown (leave blank for no) check = yes
MINOR STORM Allowable Capacity is based on Depth Criterion Minor Storm Major StormMAJOR STORM Allowable Capacity is based on Spread Criterion Qallow = 3.1 10.3 cfs
Major storm max. allowable capacity GOOD - greater than the design flow given on sheet 'Inlet Management'Minor storm max. allowable capacity GOOD - greater than the design flow given on sheet 'Inlet Management'
ALLOWABLE CAPACITY FOR ONE-HALF OF STREET (Minor & Major Storm)(Based on Regulated Criteria for Maximum Allowable Flow Depth and Spread)
EASTCREEKB1

13049_Eastcreek UD-Inlet_v4.03.xlsm, B1 10/27/2016, 5:31 PM
Design Information (Input) MINOR MAJORType of Inlet Type =Local Depression (additional to continuous gutter depression 'a') aLOCAL = 5.0 5.0 inchesTotal Number of Units in the Inlet (Grate or Curb Opening) No = 2 2Length of a Single Unit Inlet (Grate or Curb Opening) Lo = 5.00 5.00 ftWidth of a Unit Grate (cannot be greater than W, Gutter Width) Wo = N/A N/A ftClogging Factor for a Single Unit Grate (typical min. value = 0.5) Cf-G = N/A N/AClogging Factor for a Single Unit Curb Opening (typical min. value = 0.1) Cf-C = 0.10 0.10Street Hydraulics: OK - Q < Allowable Street Capacity' MINOR MAJORTotal Inlet Interception Capacity Q = 2.4 7.0 cfsTotal Inlet Carry-Over Flow (flow bypassing inlet) Qb = 0.0 1.6 cfs Capture Percentage = Qa/Qo = C% = 100 82 %
INLET ON A CONTINUOUS GRADE
CDOT Type R Curb OpeningCDOT Type R Curb Opening

13049_Eastcreek UD-Inlet_v4.03.xlsm, B2 10/27/2016, 5:31 PM
Project:Inlet ID:
Gutter Geometry (Enter data in the blue cells)Maximum Allowable Width for Spread Behind Curb TBACK = 12.0 ftSide Slope Behind Curb (leave blank for no conveyance credit behind curb) SBACK = 0.040 ft/ftManning's Roughness Behind Curb (typically between 0.012 and 0.020) nBACK = 0.020
Height of Curb at Gutter Flow Line HCURB = 4.00 inchesDistance from Curb Face to Street Crown TCROWN = 17.0 ftGutter Width W = 2.00 ftStreet Transverse Slope SX = 0.020 ft/ftGutter Cross Slope (typically 2 inches over 24 inches or 0.083 ft/ft) SW = 0.083 ft/ftStreet Longitudinal Slope - Enter 0 for sump condition SO = 0.008 ft/ftManning's Roughness for Street Section (typically between 0.012 and 0.020) nSTREET = 0.015
Minor Storm Major StormMax. Allowable Spread for Minor & Major Storm TMAX = 13.0 17.0 ft
Warning 02 Max. Allowable Depth at Gutter Flowline for Minor & Major Storm dMAX = 5.0 8.3 inches
Allow Flow Depth at Street Crown (leave blank for no) check = yes
MINOR STORM Allowable Capacity is based on Spread Criterion Minor Storm Major StormMAJOR STORM Allowable Capacity is based on Depth Criterion Qallow = 5.3 37.5 cfs
Major storm max. allowable capacity GOOD - greater than the design flow given on sheet 'Inlet Management'Minor storm max. allowable capacity GOOD - greater than the design flow given on sheet 'Inlet Management'
ALLOWABLE CAPACITY FOR ONE-HALF OF STREET (Minor & Major Storm)(Based on Regulated Criteria for Maximum Allowable Flow Depth and Spread)
EASTCREEKB2

13049_Eastcreek UD-Inlet_v4.03.xlsm, B2 10/27/2016, 5:31 PM
Design Information (Input) MINOR MAJORType of Inlet Type =Local Depression (additional to continuous gutter depression 'a') aLOCAL = 5.0 5.0 inchesTotal Number of Units in the Inlet (Grate or Curb Opening) No = 2 2Length of a Single Unit Inlet (Grate or Curb Opening) Lo = 5.00 5.00 ftWidth of a Unit Grate (cannot be greater than W, Gutter Width) Wo = N/A N/A ftClogging Factor for a Single Unit Grate (typical min. value = 0.5) Cf-G = N/A N/AClogging Factor for a Single Unit Curb Opening (typical min. value = 0.1) Cf-C = 0.10 0.10Street Hydraulics: OK - Q < Allowable Street Capacity' MINOR MAJORTotal Inlet Interception Capacity Q = 5.0 10.6 cfsTotal Inlet Carry-Over Flow (flow bypassing inlet) Qb = 0.1 9.5 cfs Capture Percentage = Qa/Qo = C% = 97 53 %
INLET ON A CONTINUOUS GRADE
CDOT Type R Curb OpeningCDOT Type R Curb Opening

13049_Eastcreek UD-Inlet_v4.03.xlsm, B3 10/27/2016, 5:31 PM
Project:Inlet ID:
Gutter Geometry (Enter data in the blue cells)Maximum Allowable Width for Spread Behind Curb TBACK = 12.0 ftSide Slope Behind Curb (leave blank for no conveyance credit behind curb) SBACK = 0.040 ft/ftManning's Roughness Behind Curb (typically between 0.012 and 0.020) nBACK = 0.020
Height of Curb at Gutter Flow Line HCURB = 4.00 inchesDistance from Curb Face to Street Crown TCROWN = 17.0 ftGutter Width W = 2.00 ftStreet Transverse Slope SX = 0.020 ft/ftGutter Cross Slope (typically 2 inches over 24 inches or 0.083 ft/ft) SW = 0.083 ft/ftStreet Longitudinal Slope - Enter 0 for sump condition SO = 0.000 ft/ftManning's Roughness for Street Section (typically between 0.012 and 0.020) nSTREET = 0.015
Minor Storm Major StormMax. Allowable Spread for Minor & Major Storm TMAX = 10.6 17.0 ftMax. Allowable Depth at Gutter Flowline for Minor & Major Storm dMAX = 4.0 8.3 inches
Allow Flow Depth at Street Crown (leave blank for no) check = yes
MINOR STORM Allowable Capacity is based on Depth Criterion Minor Storm Major StormMAJOR STORM Allowable Capacity is based on Depth Criterion Qallow = SUMP SUMP cfs
ALLOWABLE CAPACITY FOR ONE-HALF OF STREET (Minor & Major Storm)(Based on Regulated Criteria for Maximum Allowable Flow Depth and Spread)
EASTCREEKB3

13049_Eastcreek UD-Inlet_v4.03.xlsm, B3 10/27/2016, 5:31 PM
Design Information (Input) MINOR MAJORType of Inlet Type =Local Depression (additional to continuous gutter depression 'a' from 'Q-Allow') alocal = 5.00 5.00 inchesNumber of Unit Inlets (Grate or Curb Opening) No = 2 2 Water Depth at Flowline (outside of local depression) Ponding Depth = 4.1 8.3 inchesGrate Information MINOR MAJORLength of a Unit Grate Lo (G) = N/A N/A feetWidth of a Unit Grate Wo = N/A N/A feetArea Opening Ratio for a Grate (typical values 0.15-0.90) Aratio = N/A N/AClogging Factor for a Single Grate (typical value 0.50 - 0.70) Cf (G) = N/A N/AGrate Weir Coefficient (typical value 2.15 - 3.60) Cw (G) = N/A N/AGrate Orifice Coefficient (typical value 0.60 - 0.80) Co (G) = N/A N/ACurb Opening Information MINOR MAJORLength of a Unit Curb Opening Lo (C) = 5.00 5.00 feetHeight of Vertical Curb Opening in Inches Hvert = 6.00 6.00 inchesHeight of Curb Orifice Throat in Inches Hthroat = 6.00 6.00 inchesAngle of Throat (see USDCM Figure ST-5) Theta = 63.40 63.40 degreesSide Width for Depression Pan (typically the gutter width of 2 feet) Wp = 2.00 2.00 feetClogging Factor for a Single Curb Opening (typical value 0.10) Cf (C) = 0.10 0.10Curb Opening Weir Coefficient (typical value 2.3-3.7) Cw (C) = 3.60 3.60Curb Opening Orifice Coefficient (typical value 0.60 - 0.70) Co (C) = 0.67 0.67
Low Head Performance Reduction (Calculated) MINOR MAJORDepth for Grate Midwidth dGrate = N/A N/A ftDepth for Curb Opening Weir Equation dCurb = 0.18 0.53 ftCombination Inlet Performance Reduction Factor for Long Inlets RFCombination = 0.39 0.78Curb Opening Performance Reduction Factor for Long Inlets RFCurb = 0.80 1.00Grated Inlet Performance Reduction Factor for Long Inlets RFGrate = N/A N/A
MINOR MAJOR
Total Inlet Interception Capacity (assumes clogged condition) Qa = 3.4 21.4 cfsInlet Capacity IS GOOD for Minor and Major Storms(>Q PEAK) Q PEAK REQUIRED = 3.4 19.7 cfs
INLET IN A SUMP OR SAG LOCATION
CDOT Type R Curb Opening
H-VertH-Curb
W
Lo (C)
Lo (G)
WoWP
CDOT Type R Curb Opening
Override Depths

13049_Eastcreek UD-Inlet_v4.03.xlsm, B4 10/27/2016, 5:31 PM
Project:Inlet ID:
Gutter Geometry (Enter data in the blue cells)Maximum Allowable Width for Spread Behind Curb TBACK = 12.0 ftSide Slope Behind Curb (leave blank for no conveyance credit behind curb) SBACK = 0.040 ft/ftManning's Roughness Behind Curb (typically between 0.012 and 0.020) nBACK = 0.020
Height of Curb at Gutter Flow Line HCURB = 4.00 inchesDistance from Curb Face to Street Crown TCROWN = 17.0 ftGutter Width W = 2.00 ftStreet Transverse Slope SX = 0.020 ft/ftGutter Cross Slope (typically 2 inches over 24 inches or 0.083 ft/ft) SW = 0.083 ft/ftStreet Longitudinal Slope - Enter 0 for sump condition SO = 0.000 ft/ftManning's Roughness for Street Section (typically between 0.012 and 0.020) nSTREET = 0.015
Minor Storm Major StormMax. Allowable Spread for Minor & Major Storm TMAX = 10.6 17.0 ftMax. Allowable Depth at Gutter Flowline for Minor & Major Storm dMAX = 4.0 8.3 inches
Allow Flow Depth at Street Crown (leave blank for no) check = yes
MINOR STORM Allowable Capacity is based on Depth Criterion Minor Storm Major StormMAJOR STORM Allowable Capacity is based on Depth Criterion Qallow = SUMP SUMP cfs
ALLOWABLE CAPACITY FOR ONE-HALF OF STREET (Minor & Major Storm)(Based on Regulated Criteria for Maximum Allowable Flow Depth and Spread)
EASTCREEKB4

13049_Eastcreek UD-Inlet_v4.03.xlsm, B4 10/27/2016, 5:31 PM
Design Information (Input) MINOR MAJORType of Inlet Type =Local Depression (additional to continuous gutter depression 'a' from 'Q-Allow') alocal = 5.00 5.00 inchesNumber of Unit Inlets (Grate or Curb Opening) No = 2 2 Water Depth at Flowline (outside of local depression) Ponding Depth = 4.0 5.6 inchesGrate Information MINOR MAJORLength of a Unit Grate Lo (G) = N/A N/A feetWidth of a Unit Grate Wo = N/A N/A feetArea Opening Ratio for a Grate (typical values 0.15-0.90) Aratio = N/A N/AClogging Factor for a Single Grate (typical value 0.50 - 0.70) Cf (G) = N/A N/AGrate Weir Coefficient (typical value 2.15 - 3.60) Cw (G) = N/A N/AGrate Orifice Coefficient (typical value 0.60 - 0.80) Co (G) = N/A N/ACurb Opening Information MINOR MAJORLength of a Unit Curb Opening Lo (C) = 5.00 5.00 feetHeight of Vertical Curb Opening in Inches Hvert = 6.00 6.00 inchesHeight of Curb Orifice Throat in Inches Hthroat = 6.00 6.00 inchesAngle of Throat (see USDCM Figure ST-5) Theta = 63.40 63.40 degreesSide Width for Depression Pan (typically the gutter width of 2 feet) Wp = 2.00 2.00 feetClogging Factor for a Single Curb Opening (typical value 0.10) Cf (C) = 0.10 0.10Curb Opening Weir Coefficient (typical value 2.3-3.7) Cw (C) = 3.60 3.60Curb Opening Orifice Coefficient (typical value 0.60 - 0.70) Co (C) = 0.67 0.67
Low Head Performance Reduction (Calculated) MINOR MAJORDepth for Grate Midwidth dGrate = N/A N/A ftDepth for Curb Opening Weir Equation dCurb = 0.17 0.30 ftCombination Inlet Performance Reduction Factor for Long Inlets RFCombination = 0.38 0.53Curb Opening Performance Reduction Factor for Long Inlets RFCurb = 0.79 0.91Grated Inlet Performance Reduction Factor for Long Inlets RFGrate = N/A N/A
MINOR MAJOR
Total Inlet Interception Capacity (assumes clogged condition) Qa = 3.1 8.7 cfsInlet Capacity IS GOOD for Minor and Major Storms(>Q PEAK) Q PEAK REQUIRED = 1.6 5.9 cfs
INLET IN A SUMP OR SAG LOCATION
CDOT Type R Curb Opening
H-VertH-Curb
W
Lo (C)
Lo (G)
WoWP
CDOT Type R Curb Opening
Override Depths

13049_Eastcreek UD-Inlet_v4.03.xlsm, B5 10/27/2016, 5:31 PM
Project:Inlet ID:
Gutter Geometry (Enter data in the blue cells)Maximum Allowable Width for Spread Behind Curb TBACK = 12.0 ftSide Slope Behind Curb (leave blank for no conveyance credit behind curb) SBACK = 0.040 ft/ftManning's Roughness Behind Curb (typically between 0.012 and 0.020) nBACK = 0.020
Height of Curb at Gutter Flow Line HCURB = 4.00 inchesDistance from Curb Face to Street Crown TCROWN = 17.0 ftGutter Width W = 2.00 ftStreet Transverse Slope SX = 0.020 ft/ftGutter Cross Slope (typically 2 inches over 24 inches or 0.083 ft/ft) SW = 0.083 ft/ftStreet Longitudinal Slope - Enter 0 for sump condition SO = 0.000 ft/ftManning's Roughness for Street Section (typically between 0.012 and 0.020) nSTREET = 0.015
Minor Storm Major StormMax. Allowable Spread for Minor & Major Storm TMAX = 10.6 17.0 ftMax. Allowable Depth at Gutter Flowline for Minor & Major Storm dMAX = 4.0 8.3 inches
Allow Flow Depth at Street Crown (leave blank for no) check = yes
MINOR STORM Allowable Capacity is based on Depth Criterion Minor Storm Major StormMAJOR STORM Allowable Capacity is based on Depth Criterion Qallow = SUMP SUMP cfs
ALLOWABLE CAPACITY FOR ONE-HALF OF STREET (Minor & Major Storm)(Based on Regulated Criteria for Maximum Allowable Flow Depth and Spread)
EASTCREEKB5

13049_Eastcreek UD-Inlet_v4.03.xlsm, B5 10/27/2016, 5:31 PM
Design Information (Input) MINOR MAJORType of Inlet Type =Local Depression (additional to continuous gutter depression 'a' from 'Q-Allow') alocal = 5.00 5.00 inchesNumber of Unit Inlets (Grate or Curb Opening) No = 2 2 Water Depth at Flowline (outside of local depression) Ponding Depth = 4.0 5.6 inchesGrate Information MINOR MAJORLength of a Unit Grate Lo (G) = N/A N/A feetWidth of a Unit Grate Wo = N/A N/A feetArea Opening Ratio for a Grate (typical values 0.15-0.90) Aratio = N/A N/AClogging Factor for a Single Grate (typical value 0.50 - 0.70) Cf (G) = N/A N/AGrate Weir Coefficient (typical value 2.15 - 3.60) Cw (G) = N/A N/AGrate Orifice Coefficient (typical value 0.60 - 0.80) Co (G) = N/A N/ACurb Opening Information MINOR MAJORLength of a Unit Curb Opening Lo (C) = 5.00 5.00 feetHeight of Vertical Curb Opening in Inches Hvert = 6.00 6.00 inchesHeight of Curb Orifice Throat in Inches Hthroat = 6.00 6.00 inchesAngle of Throat (see USDCM Figure ST-5) Theta = 63.40 63.40 degreesSide Width for Depression Pan (typically the gutter width of 2 feet) Wp = 2.00 2.00 feetClogging Factor for a Single Curb Opening (typical value 0.10) Cf (C) = 0.10 0.10Curb Opening Weir Coefficient (typical value 2.3-3.7) Cw (C) = 3.60 3.60Curb Opening Orifice Coefficient (typical value 0.60 - 0.70) Co (C) = 0.67 0.67
Low Head Performance Reduction (Calculated) MINOR MAJORDepth for Grate Midwidth dGrate = N/A N/A ftDepth for Curb Opening Weir Equation dCurb = 0.17 0.30 ftCombination Inlet Performance Reduction Factor for Long Inlets RFCombination = 0.38 0.53Curb Opening Performance Reduction Factor for Long Inlets RFCurb = 0.79 0.91Grated Inlet Performance Reduction Factor for Long Inlets RFGrate = N/A N/A
MINOR MAJOR
Total Inlet Interception Capacity (assumes clogged condition) Qa = 3.1 8.7 cfsWARNING: Inlet Capacity less than Q Peak for Minor and Major Storms Q PEAK REQUIRED = 4.4 15.9 cfs
INLET IN A SUMP OR SAG LOCATION
CDOT Type R Curb Opening
H-VertH-Curb
W
Lo (C)
Lo (G)
WoWP
CDOT Type R Curb Opening
Override Depths

13049_Eastcreek UD-Inlet_v4.03.xlsm, B6 10/27/2016, 5:31 PM
Project:Inlet ID:
Gutter Geometry (Enter data in the blue cells)Maximum Allowable Width for Spread Behind Curb TBACK = 12.0 ftSide Slope Behind Curb (leave blank for no conveyance credit behind curb) SBACK = 0.040 ft/ftManning's Roughness Behind Curb (typically between 0.012 and 0.020) nBACK = 0.020
Height of Curb at Gutter Flow Line HCURB = 4.00 inchesDistance from Curb Face to Street Crown TCROWN = 17.0 ftGutter Width W = 2.00 ftStreet Transverse Slope SX = 0.020 ft/ftGutter Cross Slope (typically 2 inches over 24 inches or 0.083 ft/ft) SW = 0.083 ft/ftStreet Longitudinal Slope - Enter 0 for sump condition SO = 0.000 ft/ftManning's Roughness for Street Section (typically between 0.012 and 0.020) nSTREET = 0.015
Minor Storm Major StormMax. Allowable Spread for Minor & Major Storm TMAX = 10.6 17.0 ftMax. Allowable Depth at Gutter Flowline for Minor & Major Storm dMAX = 4.0 8.3 inches
Allow Flow Depth at Street Crown (leave blank for no) check = yes
MINOR STORM Allowable Capacity is based on Depth Criterion Minor Storm Major StormMAJOR STORM Allowable Capacity is based on Depth Criterion Qallow = SUMP SUMP cfs
ALLOWABLE CAPACITY FOR ONE-HALF OF STREET (Minor & Major Storm)(Based on Regulated Criteria for Maximum Allowable Flow Depth and Spread)
EASTCREEKB6

13049_Eastcreek UD-Inlet_v4.03.xlsm, B6 10/27/2016, 5:31 PM
Design Information (Input) MINOR MAJORType of Inlet Type =Local Depression (additional to continuous gutter depression 'a' from 'Q-Allow') alocal = 5.00 5.00 inchesNumber of Unit Inlets (Grate or Curb Opening) No = 2 2 Water Depth at Flowline (outside of local depression) Ponding Depth = 4.0 5.6 inchesGrate Information MINOR MAJORLength of a Unit Grate Lo (G) = N/A N/A feetWidth of a Unit Grate Wo = N/A N/A feetArea Opening Ratio for a Grate (typical values 0.15-0.90) Aratio = N/A N/AClogging Factor for a Single Grate (typical value 0.50 - 0.70) Cf (G) = N/A N/AGrate Weir Coefficient (typical value 2.15 - 3.60) Cw (G) = N/A N/AGrate Orifice Coefficient (typical value 0.60 - 0.80) Co (G) = N/A N/ACurb Opening Information MINOR MAJORLength of a Unit Curb Opening Lo (C) = 5.00 5.00 feetHeight of Vertical Curb Opening in Inches Hvert = 6.00 6.00 inchesHeight of Curb Orifice Throat in Inches Hthroat = 6.00 6.00 inchesAngle of Throat (see USDCM Figure ST-5) Theta = 63.40 63.40 degreesSide Width for Depression Pan (typically the gutter width of 2 feet) Wp = 2.00 2.00 feetClogging Factor for a Single Curb Opening (typical value 0.10) Cf (C) = 0.10 0.10Curb Opening Weir Coefficient (typical value 2.3-3.7) Cw (C) = 3.60 3.60Curb Opening Orifice Coefficient (typical value 0.60 - 0.70) Co (C) = 0.67 0.67
Low Head Performance Reduction (Calculated) MINOR MAJORDepth for Grate Midwidth dGrate = N/A N/A ftDepth for Curb Opening Weir Equation dCurb = 0.17 0.30 ftCombination Inlet Performance Reduction Factor for Long Inlets RFCombination = 0.38 0.53Curb Opening Performance Reduction Factor for Long Inlets RFCurb = 0.79 0.91Grated Inlet Performance Reduction Factor for Long Inlets RFGrate = N/A N/A
MINOR MAJOR
Total Inlet Interception Capacity (assumes clogged condition) Qa = 3.1 8.7 cfsInlet Capacity IS GOOD for Minor and Major Storms(>Q PEAK) Q PEAK REQUIRED = 1.7 3.9 cfs
INLET IN A SUMP OR SAG LOCATION
CDOT Type R Curb Opening
H-VertH-Curb
W
Lo (C)
Lo (G)
WoWP
CDOT Type R Curb Opening
Override Depths

13049_Eastcreek UD-Inlet_v4.03.xlsm, B7 10/27/2016, 5:31 PM
Project:Inlet ID:
Gutter Geometry (Enter data in the blue cells)Maximum Allowable Width for Spread Behind Curb TBACK = 12.0 ftSide Slope Behind Curb (leave blank for no conveyance credit behind curb) SBACK = 0.040 ft/ftManning's Roughness Behind Curb (typically between 0.012 and 0.020) nBACK = 0.020
Height of Curb at Gutter Flow Line HCURB = 4.00 inchesDistance from Curb Face to Street Crown TCROWN = 17.0 ftGutter Width W = 2.00 ftStreet Transverse Slope SX = 0.020 ft/ftGutter Cross Slope (typically 2 inches over 24 inches or 0.083 ft/ft) SW = 0.083 ft/ftStreet Longitudinal Slope - Enter 0 for sump condition SO = 0.000 ft/ftManning's Roughness for Street Section (typically between 0.012 and 0.020) nSTREET = 0.015
Minor Storm Major StormMax. Allowable Spread for Minor & Major Storm TMAX = 10.6 17.0 ftMax. Allowable Depth at Gutter Flowline for Minor & Major Storm dMAX = 4.0 8.3 inches
Allow Flow Depth at Street Crown (leave blank for no) check = yes
MINOR STORM Allowable Capacity is based on Depth Criterion Minor Storm Major StormMAJOR STORM Allowable Capacity is based on Depth Criterion Qallow = SUMP SUMP cfs
ALLOWABLE CAPACITY FOR ONE-HALF OF STREET (Minor & Major Storm)(Based on Regulated Criteria for Maximum Allowable Flow Depth and Spread)
EASTCREEKB7

13049_Eastcreek UD-Inlet_v4.03.xlsm, B7 10/27/2016, 5:31 PM
Design Information (Input) MINOR MAJORType of Inlet Type =Local Depression (additional to continuous gutter depression 'a' from 'Q-Allow') alocal = 5.00 5.00 inchesNumber of Unit Inlets (Grate or Curb Opening) No = 2 2 Water Depth at Flowline (outside of local depression) Ponding Depth = 5.0 8.3 inchesGrate Information MINOR MAJORLength of a Unit Grate Lo (G) = N/A N/A feetWidth of a Unit Grate Wo = N/A N/A feetArea Opening Ratio for a Grate (typical values 0.15-0.90) Aratio = N/A N/AClogging Factor for a Single Grate (typical value 0.50 - 0.70) Cf (G) = N/A N/AGrate Weir Coefficient (typical value 2.15 - 3.60) Cw (G) = N/A N/AGrate Orifice Coefficient (typical value 0.60 - 0.80) Co (G) = N/A N/ACurb Opening Information MINOR MAJORLength of a Unit Curb Opening Lo (C) = 5.00 5.00 feetHeight of Vertical Curb Opening in Inches Hvert = 6.00 6.00 inchesHeight of Curb Orifice Throat in Inches Hthroat = 6.00 6.00 inchesAngle of Throat (see USDCM Figure ST-5) Theta = 63.40 63.40 degreesSide Width for Depression Pan (typically the gutter width of 2 feet) Wp = 2.00 2.00 feetClogging Factor for a Single Curb Opening (typical value 0.10) Cf (C) = 0.10 0.10Curb Opening Weir Coefficient (typical value 2.3-3.7) Cw (C) = 3.60 3.60Curb Opening Orifice Coefficient (typical value 0.60 - 0.70) Co (C) = 0.67 0.67
Low Head Performance Reduction (Calculated) MINOR MAJORDepth for Grate Midwidth dGrate = N/A N/A ftDepth for Curb Opening Weir Equation dCurb = 0.25 0.53 ftCombination Inlet Performance Reduction Factor for Long Inlets RFCombination = 0.47 0.78Curb Opening Performance Reduction Factor for Long Inlets RFCurb = 0.87 1.00Grated Inlet Performance Reduction Factor for Long Inlets RFGrate = N/A N/A
MINOR MAJOR
Total Inlet Interception Capacity (assumes clogged condition) Qa = 6.3 21.4 cfsWARNING: Inlet Capacity less than Q Peak for Major Storm Q PEAK REQUIRED = 6.2 27.7 cfs
INLET IN A SUMP OR SAG LOCATION
CDOT Type R Curb Opening
H-VertH-Curb
W
Lo (C)
Lo (G)
WoWP
CDOT Type R Curb Opening
Override Depths

13049_Eastcreek UD-Inlet_v4.03.xlsm, B8 10/27/2016, 5:31 PM
Project:Inlet ID:
Gutter Geometry (Enter data in the blue cells)Maximum Allowable Width for Spread Behind Curb TBACK = 12.0 ftSide Slope Behind Curb (leave blank for no conveyance credit behind curb) SBACK = 0.040 ft/ftManning's Roughness Behind Curb (typically between 0.012 and 0.020) nBACK = 0.020
Height of Curb at Gutter Flow Line HCURB = 4.00 inchesDistance from Curb Face to Street Crown TCROWN = 17.0 ftGutter Width W = 2.00 ftStreet Transverse Slope SX = 0.020 ft/ftGutter Cross Slope (typically 2 inches over 24 inches or 0.083 ft/ft) SW = 0.083 ft/ftStreet Longitudinal Slope - Enter 0 for sump condition SO = 0.009 ft/ftManning's Roughness for Street Section (typically between 0.012 and 0.020) nSTREET = 0.015
Minor Storm Major StormMax. Allowable Spread for Minor & Major Storm TMAX = 10.6 17.0 ftMax. Allowable Depth at Gutter Flowline for Minor & Major Storm dMAX = 4.0 8.3 inches
Allow Flow Depth at Street Crown (leave blank for no) check = yes
MINOR STORM Allowable Capacity is based on Depth Criterion Minor Storm Major StormMAJOR STORM Allowable Capacity is based on Depth Criterion Qallow = 3.4 40.5 cfsMinor storm max. allowable capacity GOOD - greater than the design flow given on sheet 'Inlet Management'
ALLOWABLE CAPACITY FOR ONE-HALF OF STREET (Minor & Major Storm)(Based on Regulated Criteria for Maximum Allowable Flow Depth and Spread)
EASTCREEKB8
Major storm max. allowable capacity GOOD - greater than the design flow given on sheet 'Inlet Management'

13049_Eastcreek UD-Inlet_v4.03.xlsm, B8 10/27/2016, 5:31 PM
Design Information (Input) MINOR MAJORType of Inlet Type =Local Depression (additional to continuous gutter depression 'a') aLOCAL = 5.0 5.0 inchesTotal Number of Units in the Inlet (Grate or Curb Opening) No = 2 2Length of a Single Unit Inlet (Grate or Curb Opening) Lo = 5.00 5.00 ftWidth of a Unit Grate (cannot be greater than W, Gutter Width) Wo = N/A N/A ftClogging Factor for a Single Unit Grate (typical min. value = 0.5) Cf-G = N/A N/AClogging Factor for a Single Unit Curb Opening (typical min. value = 0.1) Cf-C = 0.10 0.10Street Hydraulics: OK - Q < Allowable Street Capacity' MINOR MAJORTotal Inlet Interception Capacity Q = 3.3 10.1 cfsTotal Inlet Carry-Over Flow (flow bypassing inlet) Qb = 0.0 7.7 cfs Capture Percentage = Qa/Qo = C% = 100 57 %
INLET ON A CONTINUOUS GRADE
CDOT Type R Curb OpeningCDOT Type R Curb Opening

13049_Eastcreek UD-Inlet_v4.03.xlsm, B9 10/27/2016, 5:31 PM
Project:Inlet ID:
Gutter Geometry (Enter data in the blue cells)Maximum Allowable Width for Spread Behind Curb TBACK = 12.0 ftSide Slope Behind Curb (leave blank for no conveyance credit behind curb) SBACK = 0.040 ft/ftManning's Roughness Behind Curb (typically between 0.012 and 0.020) nBACK = 0.020
Height of Curb at Gutter Flow Line HCURB = 4.00 inchesDistance from Curb Face to Street Crown TCROWN = 17.0 ftGutter Width W = 2.00 ftStreet Transverse Slope SX = 0.020 ft/ftGutter Cross Slope (typically 2 inches over 24 inches or 0.083 ft/ft) SW = 0.083 ft/ftStreet Longitudinal Slope - Enter 0 for sump condition SO = 0.000 ft/ftManning's Roughness for Street Section (typically between 0.012 and 0.020) nSTREET = 0.015
Minor Storm Major StormMax. Allowable Spread for Minor & Major Storm TMAX = 10.6 17.0 ftMax. Allowable Depth at Gutter Flowline for Minor & Major Storm dMAX = 4.0 8.3 inches
Allow Flow Depth at Street Crown (leave blank for no) check = yes
MINOR STORM Allowable Capacity is based on Depth Criterion Minor Storm Major StormMAJOR STORM Allowable Capacity is based on Depth Criterion Qallow = SUMP SUMP cfs
ALLOWABLE CAPACITY FOR ONE-HALF OF STREET (Minor & Major Storm)(Based on Regulated Criteria for Maximum Allowable Flow Depth and Spread)
EASTCREEKB9

13049_Eastcreek UD-Inlet_v4.03.xlsm, B9 10/27/2016, 5:31 PM
Design Information (Input) MINOR MAJORType of Inlet Type =Local Depression (additional to continuous gutter depression 'a' from 'Q-Allow') alocal = 5.00 5.00 inchesNumber of Unit Inlets (Grate or Curb Opening) No = 3 3 Water Depth at Flowline (outside of local depression) Ponding Depth = 4.2 8.3 inchesGrate Information MINOR MAJORLength of a Unit Grate Lo (G) = N/A N/A feetWidth of a Unit Grate Wo = N/A N/A feetArea Opening Ratio for a Grate (typical values 0.15-0.90) Aratio = N/A N/AClogging Factor for a Single Grate (typical value 0.50 - 0.70) Cf (G) = N/A N/AGrate Weir Coefficient (typical value 2.15 - 3.60) Cw (G) = N/A N/AGrate Orifice Coefficient (typical value 0.60 - 0.80) Co (G) = N/A N/ACurb Opening Information MINOR MAJORLength of a Unit Curb Opening Lo (C) = 5.00 5.00 feetHeight of Vertical Curb Opening in Inches Hvert = 6.00 6.00 inchesHeight of Curb Orifice Throat in Inches Hthroat = 6.00 6.00 inchesAngle of Throat (see USDCM Figure ST-5) Theta = 63.40 63.40 degreesSide Width for Depression Pan (typically the gutter width of 2 feet) Wp = 2.00 2.00 feetClogging Factor for a Single Curb Opening (typical value 0.10) Cf (C) = 0.10 0.10Curb Opening Weir Coefficient (typical value 2.3-3.7) Cw (C) = 3.60 3.60Curb Opening Orifice Coefficient (typical value 0.60 - 0.70) Co (C) = 0.67 0.67
Low Head Performance Reduction (Calculated) MINOR MAJORDepth for Grate Midwidth dGrate = N/A N/A ftDepth for Curb Opening Weir Equation dCurb = 0.18 0.53 ftCombination Inlet Performance Reduction Factor for Long Inlets RFCombination = 0.40 0.78Curb Opening Performance Reduction Factor for Long Inlets RFCurb = 0.65 0.91Grated Inlet Performance Reduction Factor for Long Inlets RFGrate = N/A N/A
MINOR MAJOR
Total Inlet Interception Capacity (assumes clogged condition) Qa = 4.6 30.8 cfsInlet Capacity IS GOOD for Minor and Major Storms(>Q PEAK) Q PEAK REQUIRED = 4.5 22.4 cfs
INLET IN A SUMP OR SAG LOCATION
CDOT Type R Curb Opening
H-VertH-Curb
W
Lo (C)
Lo (G)
WoWP
CDOT Type R Curb Opening
Override Depths

13049_Eastcreek UD-Inlet_v4.03.xlsm, B10 10/27/2016, 5:31 PM
Project:Inlet ID:
Gutter Geometry (Enter data in the blue cells)Maximum Allowable Width for Spread Behind Curb TBACK = 12.0 ftSide Slope Behind Curb (leave blank for no conveyance credit behind curb) SBACK = 0.040 ft/ftManning's Roughness Behind Curb (typically between 0.012 and 0.020) nBACK = 0.020
Height of Curb at Gutter Flow Line HCURB = 4.00 inchesDistance from Curb Face to Street Crown TCROWN = 17.0 ftGutter Width W = 2.00 ftStreet Transverse Slope SX = 0.020 ft/ftGutter Cross Slope (typically 2 inches over 24 inches or 0.083 ft/ft) SW = 0.083 ft/ftStreet Longitudinal Slope - Enter 0 for sump condition SO = 0.022 ft/ftManning's Roughness for Street Section (typically between 0.012 and 0.020) nSTREET = 0.015
Minor Storm Major StormMax. Allowable Spread for Minor & Major Storm TMAX = 10.6 17.0 ftMax. Allowable Depth at Gutter Flowline for Minor & Major Storm dMAX = 4.0 8.3 inches
Allow Flow Depth at Street Crown (leave blank for no) check = yes
MINOR STORM Allowable Capacity is based on Depth Criterion Minor Storm Major StormMAJOR STORM Allowable Capacity is based on Spread Criterion Qallow = 5.4 17.7 cfsMinor storm max. allowable capacity GOOD - greater than the design flow given on sheet 'Inlet Management'
ALLOWABLE CAPACITY FOR ONE-HALF OF STREET (Minor & Major Storm)(Based on Regulated Criteria for Maximum Allowable Flow Depth and Spread)
EASTCREEKB10
Major storm max. allowable capacity GOOD - greater than the design flow given on sheet 'Inlet Management'

13049_Eastcreek UD-Inlet_v4.03.xlsm, B10 10/27/2016, 5:31 PM
Design Information (Input) MINOR MAJORType of Inlet Type =Local Depression (additional to continuous gutter depression 'a') aLOCAL = 5.0 5.0 inchesTotal Number of Units in the Inlet (Grate or Curb Opening) No = 2 2Length of a Single Unit Inlet (Grate or Curb Opening) Lo = 5.00 5.00 ftWidth of a Unit Grate (cannot be greater than W, Gutter Width) Wo = N/A N/A ftClogging Factor for a Single Unit Grate (typical min. value = 0.5) Cf-G = N/A N/AClogging Factor for a Single Unit Curb Opening (typical min. value = 0.1) Cf-C = 0.10 0.10Street Hydraulics: OK - Q < Allowable Street Capacity' MINOR MAJORTotal Inlet Interception Capacity Q = 1.5 5.6 cfsTotal Inlet Carry-Over Flow (flow bypassing inlet) Qb = 0.0 0.3 cfs Capture Percentage = Qa/Qo = C% = 100 95 %
INLET ON A CONTINUOUS GRADE
CDOT Type R Curb OpeningCDOT Type R Curb Opening

13049_Eastcreek UD-Inlet_v4.03.xlsm, B11 10/27/2016, 5:31 PM
Project:Inlet ID:
Gutter Geometry (Enter data in the blue cells)Maximum Allowable Width for Spread Behind Curb TBACK = 12.0 ftSide Slope Behind Curb (leave blank for no conveyance credit behind curb) SBACK = 0.040 ft/ftManning's Roughness Behind Curb (typically between 0.012 and 0.020) nBACK = 0.020
Height of Curb at Gutter Flow Line HCURB = 4.00 inchesDistance from Curb Face to Street Crown TCROWN = 17.0 ftGutter Width W = 2.00 ftStreet Transverse Slope SX = 0.020 ft/ftGutter Cross Slope (typically 2 inches over 24 inches or 0.083 ft/ft) SW = 0.083 ft/ftStreet Longitudinal Slope - Enter 0 for sump condition SO = 0.022 ft/ftManning's Roughness for Street Section (typically between 0.012 and 0.020) nSTREET = 0.015
Minor Storm Major StormMax. Allowable Spread for Minor & Major Storm TMAX = 10.6 17.0 ftMax. Allowable Depth at Gutter Flowline for Minor & Major Storm dMAX = 4.0 8.3 inches
Allow Flow Depth at Street Crown (leave blank for no) check = yes
MINOR STORM Allowable Capacity is based on Depth Criterion Minor Storm Major StormMAJOR STORM Allowable Capacity is based on Spread Criterion Qallow = 5.4 17.7 cfsMinor storm max. allowable capacity GOOD - greater than the design flow given on sheet 'Inlet Management'
ALLOWABLE CAPACITY FOR ONE-HALF OF STREET (Minor & Major Storm)(Based on Regulated Criteria for Maximum Allowable Flow Depth and Spread)
EASTCREEKB11
WARNING: MAJOR STORM max. allowable capacity is less than the design flow given on sheet 'Inlet Management'

13049_Eastcreek UD-Inlet_v4.03.xlsm, B11 10/27/2016, 5:31 PM
Design Information (Input) MINOR MAJORType of Inlet Type =Local Depression (additional to continuous gutter depression 'a') aLOCAL = 5.0 5.0 inchesTotal Number of Units in the Inlet (Grate or Curb Opening) No = 1 1Length of a Single Unit Inlet (Grate or Curb Opening) Lo = 5.00 5.00 ftWidth of a Unit Grate (cannot be greater than W, Gutter Width) Wo = N/A N/A ftClogging Factor for a Single Unit Grate (typical min. value = 0.5) Cf-G = N/A N/AClogging Factor for a Single Unit Curb Opening (typical min. value = 0.1) Cf-C = 0.10 0.10Street Hydraulics: WARNING: Q > ALLOWABLE Q FOR MAJOR STORM MINOR MAJORTotal Inlet Interception Capacity Q = 3.0 5.4 cfsTotal Inlet Carry-Over Flow (flow bypassing inlet) Qb = 1.5 13.0 cfs Capture Percentage = Qa/Qo = C% = 66 29 %
INLET ON A CONTINUOUS GRADE
CDOT Type R Curb OpeningCDOT Type R Curb Opening

13049_Eastcreek UD-Inlet_v4.03.xlsm, B12 10/27/2016, 5:31 PM
Project:Inlet ID:
Gutter Geometry (Enter data in the blue cells)Maximum Allowable Width for Spread Behind Curb TBACK = 12.0 ftSide Slope Behind Curb (leave blank for no conveyance credit behind curb) SBACK = 0.040 ft/ftManning's Roughness Behind Curb (typically between 0.012 and 0.020) nBACK = 0.020
Height of Curb at Gutter Flow Line HCURB = 4.00 inchesDistance from Curb Face to Street Crown TCROWN = 17.0 ftGutter Width W = 2.00 ftStreet Transverse Slope SX = 0.020 ft/ftGutter Cross Slope (typically 2 inches over 24 inches or 0.083 ft/ft) SW = 0.083 ft/ftStreet Longitudinal Slope - Enter 0 for sump condition SO = 0.000 ft/ftManning's Roughness for Street Section (typically between 0.012 and 0.020) nSTREET = 0.015
Minor Storm Major StormMax. Allowable Spread for Minor & Major Storm TMAX = 10.6 17.0 ftMax. Allowable Depth at Gutter Flowline for Minor & Major Storm dMAX = 4.0 8.3 inches
Allow Flow Depth at Street Crown (leave blank for no) check = yes
MINOR STORM Allowable Capacity is based on Depth Criterion Minor Storm Major StormMAJOR STORM Allowable Capacity is based on Depth Criterion Qallow = SUMP SUMP cfs
ALLOWABLE CAPACITY FOR ONE-HALF OF STREET (Minor & Major Storm)(Based on Regulated Criteria for Maximum Allowable Flow Depth and Spread)
EASTCREEKB12

13049_Eastcreek UD-Inlet_v4.03.xlsm, B12 10/27/2016, 5:31 PM
Design Information (Input) MINOR MAJORType of Inlet Type =Local Depression (additional to continuous gutter depression 'a' from 'Q-Allow') alocal = 5.00 5.00 inchesNumber of Unit Inlets (Grate or Curb Opening) No = 3 3 Water Depth at Flowline (outside of local depression) Ponding Depth = 4.3 8.3 inchesGrate Information MINOR MAJORLength of a Unit Grate Lo (G) = N/A N/A feetWidth of a Unit Grate Wo = N/A N/A feetArea Opening Ratio for a Grate (typical values 0.15-0.90) Aratio = N/A N/AClogging Factor for a Single Grate (typical value 0.50 - 0.70) Cf (G) = N/A N/AGrate Weir Coefficient (typical value 2.15 - 3.60) Cw (G) = N/A N/AGrate Orifice Coefficient (typical value 0.60 - 0.80) Co (G) = N/A N/ACurb Opening Information MINOR MAJORLength of a Unit Curb Opening Lo (C) = 5.00 5.00 feetHeight of Vertical Curb Opening in Inches Hvert = 6.00 6.00 inchesHeight of Curb Orifice Throat in Inches Hthroat = 6.00 6.00 inchesAngle of Throat (see USDCM Figure ST-5) Theta = 63.40 63.40 degreesSide Width for Depression Pan (typically the gutter width of 2 feet) Wp = 2.00 2.00 feetClogging Factor for a Single Curb Opening (typical value 0.10) Cf (C) = 0.10 0.10Curb Opening Weir Coefficient (typical value 2.3-3.7) Cw (C) = 3.60 3.60Curb Opening Orifice Coefficient (typical value 0.60 - 0.70) Co (C) = 0.67 0.67
Low Head Performance Reduction (Calculated) MINOR MAJORDepth for Grate Midwidth dGrate = N/A N/A ftDepth for Curb Opening Weir Equation dCurb = 0.19 0.53 ftCombination Inlet Performance Reduction Factor for Long Inlets RFCombination = 0.41 0.78Curb Opening Performance Reduction Factor for Long Inlets RFCurb = 0.66 0.91Grated Inlet Performance Reduction Factor for Long Inlets RFGrate = N/A N/A
MINOR MAJOR
Total Inlet Interception Capacity (assumes clogged condition) Qa = 5.0 30.8 cfsInlet Capacity IS GOOD for Minor and Major Storms(>Q PEAK) Q PEAK REQUIRED = 4.9 25.2 cfs
INLET IN A SUMP OR SAG LOCATION
CDOT Type R Curb Opening
H-VertH-Curb
W
Lo (C)
Lo (G)
WoWP
CDOT Type R Curb Opening
Override Depths

13049_Eastcreek UD-Inlet_v4.03.xlsm, C1 10/27/2016, 5:31 PM
Project:Inlet ID:
Gutter Geometry (Enter data in the blue cells)Maximum Allowable Width for Spread Behind Curb TBACK = 12.0 ftSide Slope Behind Curb (leave blank for no conveyance credit behind curb) SBACK = 0.040 ft/ftManning's Roughness Behind Curb (typically between 0.012 and 0.020) nBACK = 0.020
Height of Curb at Gutter Flow Line HCURB = 4.00 inchesDistance from Curb Face to Street Crown TCROWN = 17.0 ftGutter Width W = 2.00 ftStreet Transverse Slope SX = 0.020 ft/ftGutter Cross Slope (typically 2 inches over 24 inches or 0.083 ft/ft) SW = 0.083 ft/ftStreet Longitudinal Slope - Enter 0 for sump condition SO = 0.000 ft/ftManning's Roughness for Street Section (typically between 0.012 and 0.020) nSTREET = 0.015
Minor Storm Major StormMax. Allowable Spread for Minor & Major Storm TMAX = 10.5 17.0 ftMax. Allowable Depth at Gutter Flowline for Minor & Major Storm dMAX = 4.0 8.3 inches
Allow Flow Depth at Street Crown (leave blank for no) check = yes
MINOR STORM Allowable Capacity is based on Depth Criterion Minor Storm Major StormMAJOR STORM Allowable Capacity is based on Depth Criterion Qallow = SUMP SUMP cfs
ALLOWABLE CAPACITY FOR ONE-HALF OF STREET (Minor & Major Storm)(Based on Regulated Criteria for Maximum Allowable Flow Depth and Spread)
EASTCREEKC1

13049_Eastcreek UD-Inlet_v4.03.xlsm, C1 10/27/2016, 5:31 PM
Design Information (Input) MINOR MAJORType of Inlet Type =Local Depression (additional to continuous gutter depression 'a' from 'Q-Allow') alocal = 5.00 5.00 inchesNumber of Unit Inlets (Grate or Curb Opening) No = 2 2 Water Depth at Flowline (outside of local depression) Ponding Depth = 4.0 5.6 inchesGrate Information MINOR MAJORLength of a Unit Grate Lo (G) = N/A N/A feetWidth of a Unit Grate Wo = N/A N/A feetArea Opening Ratio for a Grate (typical values 0.15-0.90) Aratio = N/A N/AClogging Factor for a Single Grate (typical value 0.50 - 0.70) Cf (G) = N/A N/AGrate Weir Coefficient (typical value 2.15 - 3.60) Cw (G) = N/A N/AGrate Orifice Coefficient (typical value 0.60 - 0.80) Co (G) = N/A N/ACurb Opening Information MINOR MAJORLength of a Unit Curb Opening Lo (C) = 5.00 5.00 feetHeight of Vertical Curb Opening in Inches Hvert = 6.00 6.00 inchesHeight of Curb Orifice Throat in Inches Hthroat = 6.00 6.00 inchesAngle of Throat (see USDCM Figure ST-5) Theta = 63.40 63.40 degreesSide Width for Depression Pan (typically the gutter width of 2 feet) Wp = 2.00 2.00 feetClogging Factor for a Single Curb Opening (typical value 0.10) Cf (C) = 0.10 0.10Curb Opening Weir Coefficient (typical value 2.3-3.7) Cw (C) = 3.60 3.60Curb Opening Orifice Coefficient (typical value 0.60 - 0.70) Co (C) = 0.67 0.67
Low Head Performance Reduction (Calculated) MINOR MAJORDepth for Grate Midwidth dGrate = N/A N/A ftDepth for Curb Opening Weir Equation dCurb = 0.17 0.30 ftCombination Inlet Performance Reduction Factor for Long Inlets RFCombination = 0.38 0.53Curb Opening Performance Reduction Factor for Long Inlets RFCurb = 0.79 0.91Grated Inlet Performance Reduction Factor for Long Inlets RFGrate = N/A N/A
MINOR MAJOR
Total Inlet Interception Capacity (assumes clogged condition) Qa = 3.1 8.7 cfsInlet Capacity IS GOOD for Minor and Major Storms(>Q PEAK) Q PEAK REQUIRED = 1.7 5.0 cfs
INLET IN A SUMP OR SAG LOCATION
CDOT Type R Curb Opening
H-VertH-Curb
W
Lo (C)
Lo (G)
WoWP
CDOT Type R Curb Opening
Override Depths

13049_Eastcreek UD-Inlet_v4.03.xlsm, C2 10/27/2016, 5:31 PM
Project:Inlet ID:
Gutter Geometry (Enter data in the blue cells)Maximum Allowable Width for Spread Behind Curb TBACK = 12.0 ftSide Slope Behind Curb (leave blank for no conveyance credit behind curb) SBACK = 0.040 ft/ftManning's Roughness Behind Curb (typically between 0.012 and 0.020) nBACK = 0.020
Height of Curb at Gutter Flow Line HCURB = 4.00 inchesDistance from Curb Face to Street Crown TCROWN = 17.0 ftGutter Width W = 2.00 ftStreet Transverse Slope SX = 0.020 ft/ftGutter Cross Slope (typically 2 inches over 24 inches or 0.083 ft/ft) SW = 0.083 ft/ftStreet Longitudinal Slope - Enter 0 for sump condition SO = 0.000 ft/ftManning's Roughness for Street Section (typically between 0.012 and 0.020) nSTREET = 0.015
Minor Storm Major StormMax. Allowable Spread for Minor & Major Storm TMAX = 10.6 17.0 ftMax. Allowable Depth at Gutter Flowline for Minor & Major Storm dMAX = 4.0 8.3 inches
Allow Flow Depth at Street Crown (leave blank for no) check = yes
MINOR STORM Allowable Capacity is based on Depth Criterion Minor Storm Major StormMAJOR STORM Allowable Capacity is based on Depth Criterion Qallow = SUMP SUMP cfs
ALLOWABLE CAPACITY FOR ONE-HALF OF STREET (Minor & Major Storm)(Based on Regulated Criteria for Maximum Allowable Flow Depth and Spread)
EASTCREEKC2

13049_Eastcreek UD-Inlet_v4.03.xlsm, C2 10/27/2016, 5:31 PM
Design Information (Input) MINOR MAJORType of Inlet Type =Local Depression (additional to continuous gutter depression 'a' from 'Q-Allow') alocal = 5.00 5.00 inchesNumber of Unit Inlets (Grate or Curb Opening) No = 2 2 Water Depth at Flowline (outside of local depression) Ponding Depth = 4.2 5.6 inchesGrate Information MINOR MAJORLength of a Unit Grate Lo (G) = N/A N/A feetWidth of a Unit Grate Wo = N/A N/A feetArea Opening Ratio for a Grate (typical values 0.15-0.90) Aratio = N/A N/AClogging Factor for a Single Grate (typical value 0.50 - 0.70) Cf (G) = N/A N/AGrate Weir Coefficient (typical value 2.15 - 3.60) Cw (G) = N/A N/AGrate Orifice Coefficient (typical value 0.60 - 0.80) Co (G) = N/A N/ACurb Opening Information MINOR MAJORLength of a Unit Curb Opening Lo (C) = 5.00 5.00 feetHeight of Vertical Curb Opening in Inches Hvert = 6.00 6.00 inchesHeight of Curb Orifice Throat in Inches Hthroat = 6.00 6.00 inchesAngle of Throat (see USDCM Figure ST-5) Theta = 63.40 63.40 degreesSide Width for Depression Pan (typically the gutter width of 2 feet) Wp = 2.00 2.00 feetClogging Factor for a Single Curb Opening (typical value 0.10) Cf (C) = 0.10 0.10Curb Opening Weir Coefficient (typical value 2.3-3.7) Cw (C) = 3.60 3.60Curb Opening Orifice Coefficient (typical value 0.60 - 0.70) Co (C) = 0.67 0.67
Low Head Performance Reduction (Calculated) MINOR MAJORDepth for Grate Midwidth dGrate = N/A N/A ftDepth for Curb Opening Weir Equation dCurb = 0.19 0.30 ftCombination Inlet Performance Reduction Factor for Long Inlets RFCombination = 0.40 0.53Curb Opening Performance Reduction Factor for Long Inlets RFCurb = 0.81 0.91Grated Inlet Performance Reduction Factor for Long Inlets RFGrate = N/A N/A
MINOR MAJOR
Total Inlet Interception Capacity (assumes clogged condition) Qa = 3.8 8.7 cfsInlet Capacity IS GOOD for Minor and Major Storms(>Q PEAK) Q PEAK REQUIRED = 3.7 8.7 cfs
INLET IN A SUMP OR SAG LOCATION
CDOT Type R Curb Opening
H-VertH-Curb
W
Lo (C)
Lo (G)
WoWP
CDOT Type R Curb Opening
Override Depths

13049_Eastcreek UD-Inlet_v4.03.xlsm, C3 10/27/2016, 5:31 PM
Project:Inlet ID:
Gutter Geometry (Enter data in the blue cells)Maximum Allowable Width for Spread Behind Curb TBACK = 12.0 ftSide Slope Behind Curb (leave blank for no conveyance credit behind curb) SBACK = 0.040 ft/ftManning's Roughness Behind Curb (typically between 0.012 and 0.020) nBACK = 0.020
Height of Curb at Gutter Flow Line HCURB = 4.00 inchesDistance from Curb Face to Street Crown TCROWN = 17.0 ftGutter Width W = 2.00 ftStreet Transverse Slope SX = 0.020 ft/ftGutter Cross Slope (typically 2 inches over 24 inches or 0.083 ft/ft) SW = 0.083 ft/ftStreet Longitudinal Slope - Enter 0 for sump condition SO = 0.000 ft/ftManning's Roughness for Street Section (typically between 0.012 and 0.020) nSTREET = 0.015
Minor Storm Major StormMax. Allowable Spread for Minor & Major Storm TMAX = 10.6 17.0 ftMax. Allowable Depth at Gutter Flowline for Minor & Major Storm dMAX = 4.0 8.3 inches
Allow Flow Depth at Street Crown (leave blank for no) check = yes
MINOR STORM Allowable Capacity is based on Depth Criterion Minor Storm Major StormMAJOR STORM Allowable Capacity is based on Depth Criterion Qallow = SUMP SUMP cfs
ALLOWABLE CAPACITY FOR ONE-HALF OF STREET (Minor & Major Storm)(Based on Regulated Criteria for Maximum Allowable Flow Depth and Spread)
EASTCREEKC3

13049_Eastcreek UD-Inlet_v4.03.xlsm, C3 10/27/2016, 5:31 PM
Design Information (Input) MINOR MAJORType of Inlet Type =Local Depression (additional to continuous gutter depression 'a' from 'Q-Allow') alocal = 5.00 5.00 inchesNumber of Unit Inlets (Grate or Curb Opening) No = 2 2 Water Depth at Flowline (outside of local depression) Ponding Depth = 4.5 8.3 inchesGrate Information MINOR MAJORLength of a Unit Grate Lo (G) = N/A N/A feetWidth of a Unit Grate Wo = N/A N/A feetArea Opening Ratio for a Grate (typical values 0.15-0.90) Aratio = N/A N/AClogging Factor for a Single Grate (typical value 0.50 - 0.70) Cf (G) = N/A N/AGrate Weir Coefficient (typical value 2.15 - 3.60) Cw (G) = N/A N/AGrate Orifice Coefficient (typical value 0.60 - 0.80) Co (G) = N/A N/ACurb Opening Information MINOR MAJORLength of a Unit Curb Opening Lo (C) = 5.00 5.00 feetHeight of Vertical Curb Opening in Inches Hvert = 6.00 6.00 inchesHeight of Curb Orifice Throat in Inches Hthroat = 6.00 6.00 inchesAngle of Throat (see USDCM Figure ST-5) Theta = 63.40 63.40 degreesSide Width for Depression Pan (typically the gutter width of 2 feet) Wp = 2.00 2.00 feetClogging Factor for a Single Curb Opening (typical value 0.10) Cf (C) = 0.10 0.10Curb Opening Weir Coefficient (typical value 2.3-3.7) Cw (C) = 3.60 3.60Curb Opening Orifice Coefficient (typical value 0.60 - 0.70) Co (C) = 0.67 0.67
Low Head Performance Reduction (Calculated) MINOR MAJORDepth for Grate Midwidth dGrate = N/A N/A ftDepth for Curb Opening Weir Equation dCurb = 0.21 0.53 ftCombination Inlet Performance Reduction Factor for Long Inlets RFCombination = 0.42 0.78Curb Opening Performance Reduction Factor for Long Inlets RFCurb = 0.83 1.00Grated Inlet Performance Reduction Factor for Long Inlets RFGrate = N/A N/A
MINOR MAJOR
Total Inlet Interception Capacity (assumes clogged condition) Qa = 4.6 21.4 cfsInlet Capacity IS GOOD for Minor and Major Storms(>Q PEAK) Q PEAK REQUIRED = 4.6 16.6 cfs
INLET IN A SUMP OR SAG LOCATION
CDOT Type R Curb Opening
H-VertH-Curb
W
Lo (C)
Lo (G)
WoWP
CDOT Type R Curb Opening
Override Depths

13049_Eastcreek UD-Inlet_v4.03.xlsm, C4 10/27/2016, 5:31 PM
Project:Inlet ID:
Gutter Geometry (Enter data in the blue cells)Maximum Allowable Width for Spread Behind Curb TBACK = 13.0 ftSide Slope Behind Curb (leave blank for no conveyance credit behind curb) SBACK = 0.030 ft/ftManning's Roughness Behind Curb (typically between 0.012 and 0.020) nBACK = 0.020
Height of Curb at Gutter Flow Line HCURB = 6.00 inchesDistance from Curb Face to Street Crown TCROWN = 18.0 ftGutter Width W = 2.00 ftStreet Transverse Slope SX = 0.020 ft/ftGutter Cross Slope (typically 2 inches over 24 inches or 0.083 ft/ft) SW = 0.083 ft/ftStreet Longitudinal Slope - Enter 0 for sump condition SO = 0.000 ft/ftManning's Roughness for Street Section (typically between 0.012 and 0.020) nSTREET = 0.015
Minor Storm Major StormMax. Allowable Spread for Minor & Major Storm TMAX = 18.0 18.0 ftMax. Allowable Depth at Gutter Flowline for Minor & Major Storm dMAX = 6.0 6.0 inches
Allow Flow Depth at Street Crown (leave blank for no) check = yes
MINOR STORM Allowable Capacity is based on Depth Criterion Minor Storm Major StormMAJOR STORM Allowable Capacity is based on Depth Criterion Qallow = SUMP SUMP cfs
ALLOWABLE CAPACITY FOR ONE-HALF OF STREET (Minor & Major Storm)(Based on Regulated Criteria for Maximum Allowable Flow Depth and Spread)
EASTCREEKC4

13049_Eastcreek UD-Inlet_v4.03.xlsm, C4 10/27/2016, 5:31 PM
Design Information (Input) MINOR MAJORType of Inlet Type =Local Depression (additional to continuous gutter depression 'a' from 'Q-Allow') alocal = 3.00 3.00 inchesNumber of Unit Inlets (Grate or Curb Opening) No = 2 2 Water Depth at Flowline (outside of local depression) Ponding Depth = 6.0 6.3 inchesGrate Information MINOR MAJORLength of a Unit Grate Lo (G) = N/A N/A feetWidth of a Unit Grate Wo = N/A N/A feetArea Opening Ratio for a Grate (typical values 0.15-0.90) Aratio = N/A N/AClogging Factor for a Single Grate (typical value 0.50 - 0.70) Cf (G) = N/A N/AGrate Weir Coefficient (typical value 2.15 - 3.60) Cw (G) = N/A N/AGrate Orifice Coefficient (typical value 0.60 - 0.80) Co (G) = N/A N/ACurb Opening Information MINOR MAJORLength of a Unit Curb Opening Lo (C) = 5.00 5.00 feetHeight of Vertical Curb Opening in Inches Hvert = 6.00 6.00 inchesHeight of Curb Orifice Throat in Inches Hthroat = 6.00 6.00 inchesAngle of Throat (see USDCM Figure ST-5) Theta = 63.40 63.40 degreesSide Width for Depression Pan (typically the gutter width of 2 feet) Wp = 2.00 2.00 feetClogging Factor for a Single Curb Opening (typical value 0.10) Cf (C) = 0.10 0.10Curb Opening Weir Coefficient (typical value 2.3-3.7) Cw (C) = 3.60 3.60Curb Opening Orifice Coefficient (typical value 0.60 - 0.70) Co (C) = 0.67 0.67
Low Head Performance Reduction (Calculated) MINOR MAJORDepth for Grate Midwidth dGrate = N/A N/A ftDepth for Curb Opening Weir Equation dCurb = 0.33 0.36 ftCombination Inlet Performance Reduction Factor for Long Inlets RFCombination = 0.57 0.59Curb Opening Performance Reduction Factor for Long Inlets RFCurb = 0.93 0.95Grated Inlet Performance Reduction Factor for Long Inlets RFGrate = N/A N/A
MINOR MAJOR
Total Inlet Interception Capacity (assumes clogged condition) Qa = 10.5 11.9 cfsInlet Capacity IS GOOD for Minor and Major Storms(>Q PEAK) Q PEAK REQUIRED = 3.2 11.6 cfs
INLET IN A SUMP OR SAG LOCATION
CDOT Type R Curb Opening
H-VertH-Curb
W
Lo (C)
Lo (G)
WoWP
CDOT Type R Curb Opening
Override Depths

13049_Eastcreek UD-Inlet_v4.03.xlsm, C5 10/27/2016, 5:31 PM
Project:Inlet ID:
Gutter Geometry (Enter data in the blue cells)Maximum Allowable Width for Spread Behind Curb TBACK = 12.0 ftSide Slope Behind Curb (leave blank for no conveyance credit behind curb) SBACK = 0.040 ft/ftManning's Roughness Behind Curb (typically between 0.012 and 0.020) nBACK = 0.020
Height of Curb at Gutter Flow Line HCURB = 4.00 inchesDistance from Curb Face to Street Crown TCROWN = 17.0 ftGutter Width W = 2.00 ftStreet Transverse Slope SX = 0.020 ft/ftGutter Cross Slope (typically 2 inches over 24 inches or 0.083 ft/ft) SW = 0.083 ft/ftStreet Longitudinal Slope - Enter 0 for sump condition SO = 0.000 ft/ftManning's Roughness for Street Section (typically between 0.012 and 0.020) nSTREET = 0.015
Minor Storm Major StormMax. Allowable Spread for Minor & Major Storm TMAX = 10.6 17.0 ftMax. Allowable Depth at Gutter Flowline for Minor & Major Storm dMAX = 4.0 8.3 inches
Allow Flow Depth at Street Crown (leave blank for no) check = yes
MINOR STORM Allowable Capacity is based on Depth Criterion Minor Storm Major StormMAJOR STORM Allowable Capacity is based on Depth Criterion Qallow = SUMP SUMP cfs
ALLOWABLE CAPACITY FOR ONE-HALF OF STREET (Minor & Major Storm)(Based on Regulated Criteria for Maximum Allowable Flow Depth and Spread)
EASTCREEKC5

13049_Eastcreek UD-Inlet_v4.03.xlsm, C5 10/27/2016, 5:31 PM
Design Information (Input) MINOR MAJORType of Inlet Type =Local Depression (additional to continuous gutter depression 'a' from 'Q-Allow') alocal = 5.00 5.00 inchesNumber of Unit Inlets (Grate or Curb Opening) No = 2 2 Water Depth at Flowline (outside of local depression) Ponding Depth = 4.3 8.3 inchesGrate Information MINOR MAJORLength of a Unit Grate Lo (G) = N/A N/A feetWidth of a Unit Grate Wo = N/A N/A feetArea Opening Ratio for a Grate (typical values 0.15-0.90) Aratio = N/A N/AClogging Factor for a Single Grate (typical value 0.50 - 0.70) Cf (G) = N/A N/AGrate Weir Coefficient (typical value 2.15 - 3.60) Cw (G) = N/A N/AGrate Orifice Coefficient (typical value 0.60 - 0.80) Co (G) = N/A N/ACurb Opening Information MINOR MAJORLength of a Unit Curb Opening Lo (C) = 5.00 5.00 feetHeight of Vertical Curb Opening in Inches Hvert = 6.00 6.00 inchesHeight of Curb Orifice Throat in Inches Hthroat = 6.00 6.00 inchesAngle of Throat (see USDCM Figure ST-5) Theta = 63.40 63.40 degreesSide Width for Depression Pan (typically the gutter width of 2 feet) Wp = 2.00 2.00 feetClogging Factor for a Single Curb Opening (typical value 0.10) Cf (C) = 0.10 0.10Curb Opening Weir Coefficient (typical value 2.3-3.7) Cw (C) = 3.60 3.60Curb Opening Orifice Coefficient (typical value 0.60 - 0.70) Co (C) = 0.67 0.67
Low Head Performance Reduction (Calculated) MINOR MAJORDepth for Grate Midwidth dGrate = N/A N/A ftDepth for Curb Opening Weir Equation dCurb = 0.19 0.53 ftCombination Inlet Performance Reduction Factor for Long Inlets RFCombination = 0.41 0.78Curb Opening Performance Reduction Factor for Long Inlets RFCurb = 0.81 1.00Grated Inlet Performance Reduction Factor for Long Inlets RFGrate = N/A N/A
MINOR MAJOR
Total Inlet Interception Capacity (assumes clogged condition) Qa = 4.0 21.4 cfsInlet Capacity IS GOOD for Minor and Major Storms(>Q PEAK) Q PEAK REQUIRED = 3.9 14.2 cfs
INLET IN A SUMP OR SAG LOCATION
CDOT Type R Curb Opening
H-VertH-Curb
W
Lo (C)
Lo (G)
WoWP
CDOT Type R Curb Opening
Override Depths

13049_Eastcreek UD-Inlet_v4.03.xlsm, C6 10/27/2016, 5:31 PM
Project:Inlet ID:
Gutter Geometry (Enter data in the blue cells)Maximum Allowable Width for Spread Behind Curb TBACK = 12.0 ftSide Slope Behind Curb (leave blank for no conveyance credit behind curb) SBACK = 0.040 ft/ftManning's Roughness Behind Curb (typically between 0.012 and 0.020) nBACK = 0.020
Height of Curb at Gutter Flow Line HCURB = 4.00 inchesDistance from Curb Face to Street Crown TCROWN = 17.0 ftGutter Width W = 2.00 ftStreet Transverse Slope SX = 0.020 ft/ftGutter Cross Slope (typically 2 inches over 24 inches or 0.083 ft/ft) SW = 0.083 ft/ftStreet Longitudinal Slope - Enter 0 for sump condition SO = 0.000 ft/ftManning's Roughness for Street Section (typically between 0.012 and 0.020) nSTREET = 0.015
Minor Storm Major StormMax. Allowable Spread for Minor & Major Storm TMAX = 10.6 17.0 ftMax. Allowable Depth at Gutter Flowline for Minor & Major Storm dMAX = 4.0 8.3 inches
Allow Flow Depth at Street Crown (leave blank for no) check = yes
MINOR STORM Allowable Capacity is based on Depth Criterion Minor Storm Major StormMAJOR STORM Allowable Capacity is based on Depth Criterion Qallow = SUMP SUMP cfs
ALLOWABLE CAPACITY FOR ONE-HALF OF STREET (Minor & Major Storm)(Based on Regulated Criteria for Maximum Allowable Flow Depth and Spread)
EASTCREEKC6

13049_Eastcreek UD-Inlet_v4.03.xlsm, C6 10/27/2016, 5:31 PM
Design Information (Input) MINOR MAJORType of Inlet Type =Local Depression (additional to continuous gutter depression 'a' from 'Q-Allow') alocal = 5.00 5.00 inchesNumber of Unit Inlets (Grate or Curb Opening) No = 2 2 Water Depth at Flowline (outside of local depression) Ponding Depth = 4.0 5.6 inchesGrate Information MINOR MAJORLength of a Unit Grate Lo (G) = N/A N/A feetWidth of a Unit Grate Wo = N/A N/A feetArea Opening Ratio for a Grate (typical values 0.15-0.90) Aratio = N/A N/AClogging Factor for a Single Grate (typical value 0.50 - 0.70) Cf (G) = N/A N/AGrate Weir Coefficient (typical value 2.15 - 3.60) Cw (G) = N/A N/AGrate Orifice Coefficient (typical value 0.60 - 0.80) Co (G) = N/A N/ACurb Opening Information MINOR MAJORLength of a Unit Curb Opening Lo (C) = 5.00 5.00 feetHeight of Vertical Curb Opening in Inches Hvert = 6.00 6.00 inchesHeight of Curb Orifice Throat in Inches Hthroat = 6.00 6.00 inchesAngle of Throat (see USDCM Figure ST-5) Theta = 63.40 63.40 degreesSide Width for Depression Pan (typically the gutter width of 2 feet) Wp = 2.00 2.00 feetClogging Factor for a Single Curb Opening (typical value 0.10) Cf (C) = 0.10 0.10Curb Opening Weir Coefficient (typical value 2.3-3.7) Cw (C) = 3.60 3.60Curb Opening Orifice Coefficient (typical value 0.60 - 0.70) Co (C) = 0.67 0.67
Low Head Performance Reduction (Calculated) MINOR MAJORDepth for Grate Midwidth dGrate = N/A N/A ftDepth for Curb Opening Weir Equation dCurb = 0.17 0.30 ftCombination Inlet Performance Reduction Factor for Long Inlets RFCombination = 0.38 0.53Curb Opening Performance Reduction Factor for Long Inlets RFCurb = 0.79 0.91Grated Inlet Performance Reduction Factor for Long Inlets RFGrate = N/A N/A
MINOR MAJOR
Total Inlet Interception Capacity (assumes clogged condition) Qa = 3.1 8.7 cfsInlet Capacity IS GOOD for Minor and Major Storms(>Q PEAK) Q PEAK REQUIRED = 1.0 4.0 cfs
INLET IN A SUMP OR SAG LOCATION
CDOT Type R Curb Opening
H-VertH-Curb
W
Lo (C)
Lo (G)
WoWP
CDOT Type R Curb Opening
Override Depths

PROJECT: EastcreekJOB NO.: 13049
CALC. BY: DFA = FORMULA CELLSDATE:
DESCRIPTION Inlet No.
DESIGN POINT
Q5
(cfs)Q100
(cfs) Inlet Type 5-Year Inlet Capacity
5-Year Inlet Interception
5-Year Inlet
Bypass
100-Year Inlet
Capacity
100-Year Inlet
Interception
100-Year Inlet
BypassDescription
Sump inlet A1 1 1.4 5.1 10' Type R 3.1 1.4 0.0 8.7 5.1 0.0
Sump inlet A2 2 1.9 6.8 10' Type R 3.1 1.9 0.0 8.7 6.8 0.0
Ongrade inlet A3 7 1.7 6.8 10' Type R 1.7 1.7 0.0 6.1 6.1 0.7 Carry over to inlet A4
Sump inlet A4 7.1 3.9 14.9 10' Type R 5.2 3.9 0.0 41.6 14.9 0.0 Duel sump A4 and A7
Sump inlet A5 8 2.6 9.8 10' Type R 5.2 2.6 0.0 41.6 9.8 0.0 Duel sump A5 and A6
Sump inlet A6 10 0.4 1.4 10' Type R 5.2 0.4 0.0 41.6 1.4 0.0 Duel sump A5 and A6
Sump inlet A7 6 1.2 4.2 10' Type R 5.2 1.2 0.0 41.6 4.2 0.0 Duel sump A4 and A7
Sump inlet A8 11 5.4 6.9 10' Type R 9.7 5.4 0.0 9.7 6.9 0.0 152nd section
Ongrade inlet B1 21 2.4 8.6 10' Type R 2.4 2.4 0.0 7.0 7.0 1.6 Carry over to inlet B2
Ongrade inlet B2 16 5.1 18.5 10' Type R 5.0 5.0 0.1 10.6 10.6 7.9 Carry over to inlet B3
Sump inlet B3 17 3.3 11.8 10' Type R 3.4 3.3 0.0 21.4 11.8 0.0
Sump inlet B4 18 1.6 5.9 10' Type R 3.1 1.6 0.0 8.7 5.9 0.0
Sump inlet B5 33 4.4 15.9 10' Type R 3.1 3.1 1.3 8.7 8.7 7.2 Carry over to inlet B7
Sump inlet B6 34 1.7 3.9 10' Type R 3.1 1.7 0.0 8.7 3.9 0.0
Sump inlet B7 24 4.9 20.2 10' Type R 6.2 4.9 0.0 27.4 20.2 6.0 Carry over to inlet B9
Ongrade inlet B8 26 3.3 11.8 10' Type R 3.3 3.3 0.0 10.1 10.1 1.7 Carry over to inlet B9
Sump inlet B9 27 4.5 16.1 15' Type R 4.6 4.5 0.0 30.8 16.1 0.0
Ongrade inlet B10 28 1.5 5.9 10' Type R 1.5 1.5 0.0 5.6 5.6 0.3 Carry over to B7
Ongrade inlet B11 29 4.5 18.4 10' Type R 3.0 3.0 1.5 5.4 5.4 13.0 Carry over to inlet B12
Sump inlet B12 32 3.4 12.2 15' Type R 5.0 3.4 0.0 30.8 12.2 0.0
Sump inlet C1 37 1.7 5.0 10' Type R 3.1 1.7 0.0 8.7 5.0 0.0
Sump inlet C2 36 3.7 8.7 10' Type R 3.8 3.7 0.0 8.7 8.7 0.0
10/17/2016
JANSEN STRAWNInlet Summary Table
10/28/201613049-SF2 SF3.xlsx

Sump inlet C3 39 4.6 16.6 10' Type R 4.6 4.6 0.0 21.4 16.6 0.0
Sump inlet C4 40 3.2 11.6 10' Type R 10.5 3.2 0.0 11.9 11.6 0.0 152nd section
Sump inlet C5 42 3.9 14.2 10' Type R 4.0 3.9 0.0 21.4 14.2 0.0
Sump inlet C6 43 1.0 4.0 10' Type R 3.1 1.0 0.0 8.7 4.0 0.0
JANSEN STRAWNInlet Summary Table
10/28/201613049-SF2 SF3.xlsx


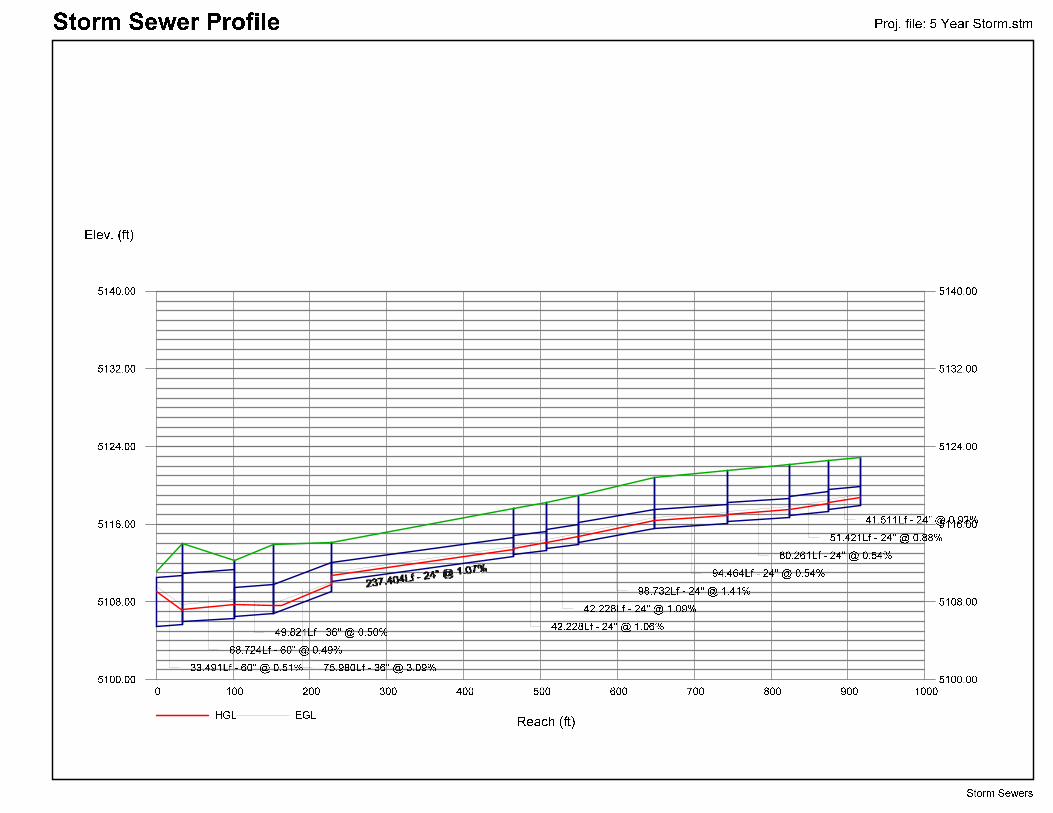


t 303.561.3333 | f 303.561.3339 | 45 West 2nd Avenue, Denver, Colorado 80223 | www.waremalcomb.com
APPENDIX C – Pond Design & Outlet Structure Stage-Storage Sizing WQCV Outlet Design Restrictor Plate Design Outlet Design & Culvert Design Spillway Design

JANSEN STRAWN CONSULTING ENGINEERS45 West 2nd Ave. - Denver, CO 80223
p: 303.561.3333 f: 303.561.3339
PROJECT : EastCreek Farms DATE : 10/28/2016PROJECT NO. : 13049 BY : DFA
Required VolumeTributary Area (ac) % Impervious 1-Hour Rainfall Depth (100-yr)
22.92 31.0% 2.69
Soil Type % : A = 0.0% B = 0.0% C&D= 100.0%
WQCV = 0.30 ac-ft ( WQCV = 1.0*A*(0.91i 3 -1.19i 2 +0.78i)/12 )WQCV = 12,859 cu-ftEURV = 0.65 ac-ft ( EURV = A((0.140i 1.28 )*A+(0.113i 1.08 )B%+(0.100i 1.08 )C%)
EURV = 28,182 cu-ft (NCLUDES WQCV)100-yr Detention = 1.83 ac-ft (V100 =(P 1 ((0.728i 1.258 +0.150i 0.258 )A%+(0.364i 1.28 6+0.381i 0.286 )B%
100-yr Detention = 79,549 cu-ft +(0.306i 1.286 +0.402i 0.286 )C%))/12 * A)
Total Required Volume = 1.83 ac-ft (V100)= 79,549 cu-ft
Max Allowable Release RateQ100 = 20.63 cfs ( 0.90 cfs/ac )
Provided Volume
Pond Depth
Contour Elevation
0.00 5108.001.00 5109.002.00 5110.003.00 5111.004.00 5112.005.00 5113.006.00 5114.007.00 5115.008.00 5116.00
WSEL Depth (ft)WQCV = 5110.40 2.40EURV = 5111.34 3.34
100-yr = 5113.64 5.64
Pond A - EURV / Detention Calculations
31,35337,808
Ft2
1002,001
11,77617,53920,631
8496,210
14,56219,06422,20826,192
0849
7,06021,62240,68662,89489,087
120,439158,247
1.442.052.763.63
1/3 (A1 + A2 + (A1A2)1/2) D Total Volume (ft3) Total Volume (ac-ft)
0.000.020.160.500.93
23,82428,63434,15241,585

PROJECT : EastCreek Farms DATE : 10/28/2016PROJECT NO. : 13049 BY : DFA
POND WEIRQ100 = 85.00 cfs
Weir Equation => Q=CLH3/2
Try Weir Release:Q100 x2= 170.00 cfs
C = 3.00L = 57.00 ft
Flow Depth = 1.00 ft
USE: 57' LONG OVERFLOW WEIR TO PASS THE 2xQ100
Pond A - Overflow Weir

Pond A - UD-Detention_v3 05.xlsm, Basin 10/28/2016, 9:59 AM
Project:
Basin ID:
Depth Increment = 0.1 ft
Required Volume Calculation Micropool -- 0.00 -- -- -- 100 0.002
Selected BMP Type = EDB -- 1.00 -- -- -- 2,001 0.046 1,031 0.024
Watershed Area = 22.92 acres -- 2.00 -- -- -- 11,776 0.270 7,822 0.180
Watershed Length = 1,000 ft -- 3.00 -- -- -- 17,539 0.403 22,596 0.519
Watershed Slope = 0.020 ft/ft EURV -- 3.34 -- -- -- 14,071 0.323 27,970 0.642
Watershed Imperviousness = 31.00% percent -- 4.00 -- -- -- 20,631 0.474 39,422 0.905
Percentage Hydrologic Soil Group A = 0.0% percent -- 5.00 -- -- -- 23,824 0.547 61,649 1.415
Percentage Hydrologic Soil Group B = 0.0% percent 100-Year -- 5.64 -- -- -- 26,883 0.617 77,875 1.788
Percentage Hydrologic Soil Groups C/D = 100.0% percent Overflow Weir -- 6.00 -- -- -- 28,634 0.657 87,868 2.017
Desired WQCV Drain Time = 40.0 hours -- 7.00 -- -- -- 34,152 0.784 119,261 2.738
Location for 1-hr Rainfall Depths = Thornton - Thornton City Office Top Of Berm -- 8.00 -- -- -- 41,585 0.955 157,130 3.607
Water Quality Capture Volume (WQCV) = 0.295 acre-feet -- -- -- --
Excess Urban Runoff Volume (EURV) = 0.647 acre-feet -- -- -- --
2-yr Runoff Volume (P1 = 0.95 in.) = 0.508 acre-feet inches -- -- -- --
5-yr Runoff Volume (P1 = 1.35 in.) = 1.105 acre-feet inches -- -- -- --
10-yr Runoff Volume (P1 = 1.61 in.) = 1.583 acre-feet inches -- -- -- --
25-yr Runoff Volume (P1 = 2.03 in.) = 2.460 acre-feet inches -- -- -- --
50-yr Runoff Volume (P1 = 2.32 in.) = 3.012 acre-feet inches -- -- -- --
100-yr Runoff Volume (P1 = 2.66 in.) = 3.767 acre-feet inches -- -- -- --
500-yr Runoff Volume (P1 = 3.33 in.) = 5.160 acre-feet inches -- -- -- --
Approximate 2-yr Detention Volume = 0.478 acre-feet -- -- -- --
Approximate 5-yr Detention Volume = 0.795 acre-feet -- -- -- --
Approximate 10-yr Detention Volume = 0.887 acre-feet -- -- -- --
Approximate 25-yr Detention Volume = 1.119 acre-feet -- -- -- --
Approximate 50-yr Detention Volume = 1.404 acre-feet -- -- -- --
Approximate 100-yr Detention Volume = 1.821 acre-feet -- -- -- --
-- -- -- --
Stage-Storage Calculation -- -- -- --
Zone 1 Volume (WQCV) = 0.295 acre-feet -- -- -- --
Zone 2 Volume (EURV - Zone 1) = 0.352 acre-feet -- -- -- --
Zone 3 Volume (100-year - Zones 1 & 2) = 1.174 acre-feet -- -- -- --
Total Detention Basin Volume = 1.821 acre-feet -- -- -- --
Initial Surcharge Volume (ISV) = user ft^3 -- -- -- --
Initial Surcharge Depth (ISD) = user ft -- -- -- --
Total Available Detention Depth (Htotal) = user ft -- -- -- --Depth of Trickle Channel (HTC) = user ft -- -- -- --
Slope of Trickle Channel (STC) = user ft/ft -- -- -- --
Slopes of Main Basin Sides (Smain) = user H:V -- -- -- --
Basin Length-to-Width Ratio (RL/W) = user -- -- -- --
-- -- -- --
Initial Surcharge Area (AISV) = user ft^2 -- -- -- --
Surcharge Volume Length (LISV) = user ft -- -- -- --
Surcharge Volume Width (W ISV) = user ft -- -- -- --
Depth of Basin Floor (HFLOOR) = user ft -- -- -- --
Length of Basin Floor (LFLOOR) = user ft -- -- -- --
Width of Basin Floor (WFLOOR) = user ft -- -- -- --
Area of Basin Floor (AFLOOR) = user ft^2 -- -- -- --
Volume of Basin Floor (VFLOOR) = user ft^3 -- -- -- --
Depth of Main Basin (HMAIN) = user ft -- -- -- --
Length of Main Basin (LMAIN) = user ft -- -- -- --
Width of Main Basin (WMAIN) = user ft -- -- -- --
Area of Main Basin (AMAIN) = user ft^2 -- -- -- --
Volume of Main Basin (VMAIN) = user ft^3 -- -- -- --
Calculated Total Basin Volume (Vtotal) = user acre-feet -- -- -- ---- -- -- ---- -- -- ---- -- -- ---- -- -- ---- -- -- ---- -- -- ---- -- -- ---- -- -- ---- -- -- ---- -- -- ---- -- -- ---- -- -- ---- -- -- ---- -- -- ---- -- -- ---- -- -- ---- -- -- ---- -- -- ---- -- -- ---- -- -- ---- -- -- ---- -- -- ---- -- -- ---- -- -- ---- -- -- ---- -- -- ---- -- -- ---- -- -- ---- -- -- ---- -- -- ---- -- -- ---- -- -- ---- -- -- ---- -- -- ---- -- -- ---- -- -- ---- -- -- ---- -- -- ---- -- -- ---- -- -- ---- -- -- ---- -- -- ---- -- -- ---- -- -- ---- -- -- --
DETENTION BASIN STAGE-STORAGE TABLE BUILDER
Optional Override
Area (ft^2)Length
(ft)
Optional Override Stage (ft)
Stage(ft)
Stage - StorageDescription
Area (ft^2)
Width (ft)
East Creek
Pond A
Volume (ft^3)
Volume (ac-ft)
Area (acre)
Optional User Input1-hr Precipitation
Example Zone Configuration (Retention Pond)

Pond A - UD-Detention_v3 05.xlsm, Basin 10/28/2016, 9:59 AM
1 User Defined Stage-Area Boolean for Message
1 Equal Stage-Area Inputs Watershed L:W
1 CountA
0 Calc_S_TC
(0.83) H_FLOOR
L_FLOOR_OTHER
0.00 ISV 0.00 ISV
0.00 Floor 0.00 Floor
2.39 Zone 1 (WQCV) 2.39 Zone 1 (WQCV)
3.36 Zone 2 (EURV) 3.36 Zone 2 (EURV)
5.70 Zone 3 (100-yea 5.70 Zone 3 (100-year)
DETENTION BASIN STAGE-STORAGE TABLE BUILDER
0.000
0.905
1.810
2.715
3.620
0.000
0.240
0.480
0.720
0.960
0.00 2.00 4.00 6.00 8.00Vo
lum
e (a
c-ft
)
Area
(acr
es)
Stage (ft.)
Area (acres) Volume (ac-ft)
0
100
200
300
400
0
5
10
15
20
0.00 2.00 4.00 6.00 8.00
Area
(sq.
ft.)
Leng
th, W
idth
(ft.)
Stage (ft)
Length (ft) Width (ft) Area (sq.ft.)

Project: Basin ID:
Stage (ft) Zone Volume (ac-ft) Outlet Type
Zone 1 (WQCV) 2.39 0.295 Orifice Plate
Zone 2 (EURV) 3.36 0.352 Orifice Plate
Zone 3 (100-year) 5.70 1.174 Weir&Pipe (Restrict)
1.821 TotalUser Input: Orifice at Underdrain Outlet (typically used to drain WQCV in a Filtration BMP) Calculated Parameters for Underdrain
Underdrain Orifice Invert Depth = N/A ft (distance below the filtration media surface) Underdrain Orifice Area = N/A ft2
Underdrain Orifice Diameter = N/A inches Underdrain Orifice Centroid = N/A feet
User Input: Orifice Plate with one or more orifices or Elliptical Slot Weir (typically used to drain WQCV and/or EURV in a sedimentation BMP) Calculated Parameters for PlateInvert of Lowest Orifice = 0.00 ft (relative to basin bottom at Stage = 0 ft) WQ Orifice Area per Row = 9.792E-03 ft2
Depth at top of Zone using Orifice Plate = 3.36 ft (relative to basin bottom at Stage = 0 ft) Elliptical Half-Width = N/A feetOrifice Plate: Orifice Vertical Spacing = 13.40 inches Elliptical Slot Centroid = N/A feet
Orifice Plate: Orifice Area per Row = 1.41 sq. inches (diameter = 1-5/16 inches) Elliptical Slot Area = N/A ft2
User Input: Stage and Total Area of Each Orifice Row (numbered from lowest to highest)Row 1 (required) Row 2 (optional) Row 3 (optional) Row 4 (optional) Row 5 (optional) Row 6 (optional) Row 7 (optional) Row 8 (optional)
Stage of Orifice Centroid (ft) 0.00 1.12 2.24Orifice Area (sq. inches) 1.41 1.41 1.41
Row 9 (optional) Row 10 (optional) Row 11 (optional) Row 12 (optional) Row 13 (optional) Row 14 (optional) Row 15 (optional) Row 16 (optional)Stage of Orifice Centroid (ft)
Orifice Area (sq. inches)
User Input: Vertical Orifice (Circular or Rectangular) Calculated Parameters for Vertical OrificeNot Selected Not Selected Not Selected Not Selected
Invert of Vertical Orifice = N/A N/A ft (relative to basin bottom at Stage = 0 ft) Vertical Orifice Area = N/A N/A ft2
Depth at top of Zone using Vertical Orifice = N/A N/A ft (relative to basin bottom at Stage = 0 ft) Vertical Orifice Centroid = N/A N/A feetVertical Orifice Diameter = N/A N/A inches
User Input: Overflow Weir (Dropbox) and Grate (Flat or Sloped) Calculated Parameters for Overflow WeirZone 3 Weir Not Selected Zone 3 Weir Not Selected
Overflow Weir Front Edge Height, Ho = 3.36 N/A ft (relative to basin bottom at Stage = 0 ft) Height of Grate Upper Edge, Ht = 5.21 N/A feetOverflow Weir Front Edge Length = 5.00 N/A feet Over Flow Weir Slope Length = 7.63 N/A feet
Overflow Weir Slope = 4.00 N/A H:V (enter zero for flat grate) Grate Open Area / 100-yr Orifice Area = 12.94 N/A should be > 4Horiz. Length of Weir Sides = 7.40 N/A feet Overflow Grate Open Area w/o Debris = 26.70 N/A ft2
Overflow Grate Open Area % = 70% N/A %, grate open area/total area Overflow Grate Open Area w/ Debris = 13.35 N/A ft2
Debris Clogging % = 50% N/A %
User Input: Outlet Pipe w/ Flow Restriction Plate (Circular Orifice, Restrictor Plate, or Rectangular Orifice) Calculated Parameters for Outlet Pipe w/ Flow Restriction PlateZone 3 Restrictor Not Selected Zone 3 Restrictor Not Selected
Depth to Invert of Outlet Pipe = 6.00 N/A ft (distance below basin bottom at Stage = 0 ft) Outlet Orifice Area = 2.06 N/A ft2
Outlet Pipe Diameter = 21.00 N/A inches Outlet Orifice Centroid = 0.76 N/A feetRestrictor Plate Height Above Pipe Invert = 16.80 inches Half-Central Angle of Restrictor Plate on Pipe = 2.21 N/A radians
User Input: Emergency Spillway (Rectangular or Trapezoidal) Calculated Parameters for SpillwaySpillway Invert Stage= 6.10 ft (relative to basin bottom at Stage = 0 ft) Spillway Design Flow Depth= 0.94 feet
Spillway Crest Length = 34.00 feet Stage at Top of Freeboard = 8.04 feetSpillway End Slopes = 4.00 H:V Basin Area at Top of Freeboard = 0.95 acres
Freeboard above Max Water Surface = 1.00 feet
Routed Hydrograph ResultsDesign Storm Return Period = WQCV EURV 2 Year 5 Year 10 Year 25 Year 50 Year 100 Year 500 YearOne-Hour Rainfall Depth (in) = 0.53 1.07 0.95 1.35 1.61 2.03 2.32 2.66 3.33
Calculated Runoff Volume (acre-ft) = 0.295 0.647 0.508 1.105 1.583 2.460 3.012 3.767 5.160OPTIONAL Override Runoff Volume (acre-ft) =
Inflow Hydrograph Volume (acre-ft) = 0.294 0.647 0.508 1.105 1.584 2.462 3.013 3.768 5.155Predevelopment Unit Peak Flow, q (cfs/acre) = 0.00 0.00 0.02 0.32 0.54 1.02 1.29 1.61 2.24
Predevelopment Peak Q (cfs) = 0.0 0.0 0.4 7.4 12.4 23.3 29.5 36.9 51.3Peak Inflow Q (cfs) = 8.0 17.5 13.8 29.8 42.7 66.4 81.5 102.2 140.2
Peak Outflow Q (cfs) = 0.1 0.2 0.2 5.3 13.1 30.3 32.2 33.4 73.5Ratio Peak Outflow to Predevelopment Q = N/A N/A N/A 0.7 1.1 1.3 1.1 0.9 1.4
Structure Controlling Flow = Plate Plate Plate Overflow Grate 1 Overflow Grate 1 Overflow Grate 1 Outlet Plate 1 Outlet Plate 1 SpillwayMax Velocity through Grate 1 (fps) = N/A N/A N/A 0.2 0.5 1.1 1.2 1.2 1.3Max Velocity through Grate 2 (fps) = N/A N/A N/A N/A N/A N/A N/A N/A N/A
Time to Drain 97% of Inflow Volume (hours) = 38 59 51 59 57 53 51 48 43Time to Drain 99% of Inflow Volume (hours) = 40 63 55 65 64 62 60 59 56
Maximum Ponding Depth (ft) = 2.33 3.28 2.92 3.94 4.33 4.86 5.30 6.05 6.61Area at Maximum Ponding Depth (acres) = 0.31 0.34 0.39 0.46 0.50 0.54 0.58 0.66 0.73
Maximum Volume Stored (acre-ft) = 0.276 0.622 0.483 0.877 1.065 1.339 1.584 2.044 2.442
Detention Basin Outlet Structure Design
EastcreekPond A
Example Zone Configuration (Retention Pond)

COUNTA for Basin Tab = 1 Ao Dia WQ Plate Type Vert Orifice 1 Vert Orifice 2Count_Underdrain = 0 0.11 meter = 3/8 inch) 2 1 1
Count_WQPlate = 1 0.14 eter = 7/16 inch)
Count_VertOrifice1 = 0 0.18 meter = 1/2 inch) Outlet Plate 1 Outlet Plate 2 Drain Time Message Boolean
Count_VertOrifice2 = 0 0.24 eter = 9/16 inch) 4 1 5yr, <72hr 0
Count_Weir1 = 1 0.29 meter = 5/8 inch) >5yr, <120hr 0
Count_Weir2 = 0 0.36 er = 11/16 inch) Max Depth Row
Count_OutletPipe1 = 1 0.42 meter = 3/4 inch) WQCV 234 Watershed Constraint CheckCount_OutletPipe2 = 0 0.50 er = 13/16 inch) 2 Year 293 Slope 0.020
COUNTA_2 (Standard FSD Setup)= 1 0.58 meter = 7/8 inch) EURV 329 Shape 2.00MaxPondDepth_Error? FALSE 0.67 er = 15/16 inch) 5 Year 395
Hidden Parameters & Calculations 0.76 ameter = 1 inch) 10 Year 434 Spillway Depth
0.86 = 1-1/16 inches) 25 Year 487 0.94WQ Plate Flow at 100yr depth = 0.31 0.97 = 1-1/8 inches) 50 Year 531
CLOG #1= 35% 1.08 = 1-3/16 inches) 100 Year 606 1 Z1_BooleanCdw #1 = 0.89 1.20 = 1-1/4 inches) 500 Year 662 1 Z2_BooleanCdo #1 = 0.69 1.32 = 1-5/16 inches) Zone3_Pulldown Message 1 Z3_Boolean
Overflow Weir #1 Angle = 0.245 1.45 = 1-3/8 inches) Opening MessageCLOG #2= #VALUE! 1.59 = 1-7/16 inches) Draintime Running
Cdw #2 = #VALUE! 1.73 = 1-1/2 inches) Outlet Boolean Outlet Rank Total (1 to 4)Cdo #2 = #VALUE! 1.88 = 1-9/16 inches) Vertical Orifice 1 0 0 1
Overflow Weir #2 Angle = #VALUE! 2.03 = 1-5/8 inches) Vertical Orifice 2 0 0 Boolean
Underdrain Q at 100yr depth = 0.00 2.20 1-11/16 inches) Overflow Weir 1 1 1 0 Max Depth
VertOrifice1 Q at 100yr depth = 0.00 2.36 = 1-3/4 inches) Overflow Weir 2 0 0 0 500yr Depth
VertOrifice2 Q at 100yr depth = 0.00 2.54 1-13/16 inches) Outlet Pipe 1 1 1 1 Freeboard
EURV_draintime_user = 2.72 = 1-7/8 inches) Outlet Pipe 2 0 0 1 Spillway
Count_User_Hydrographs 0 2.90 1-15/16 inches) 0 Spillway LengthCountA_3 (EURV & 100yr) = 1 3.09 eter = 2 inches) Button Visibility Boolean FALSE Time Interval
CountA_4 (100yr Only) = 1 3.29 gular openings) 1 Button_Trigger0 Underdrain1 WQCV Plate0 EURV-WQCV Plate0 EURV-WQCV VertOrifice1 Outlet 90% Qpeak0 Outlet Undetained
S-A-V-D Chart Axis Override X-axis Left Y-Axis Right Y-Axisminimum bound
maximum bound
Detention Basin Outlet Structure Design
0
20
40
60
80
100
120
140
160
0.1 1 10
FLO
W [c
fs]
TIME [hr]
500YR IN
500YR OUT
100YR IN
100YR OUT
50YR IN
50YR OUT
25YR IN
25YR OUT
10YR IN
10YR OUT
5YR IN
5YR OUT
2YR IN
2YR OUT
EURV IN
EURV OUT
WQCV IN
WQCV OUT
0
1
2
3
4
5
6
7
0.1 1 10 100
PON
DIN
G D
EPTH
[ft]
DRAIN TIME [hr]
500YR
100YR
50YR
25YR
10YR
5YR
2YR
EURV
WQCV
0.00
50.00
100.00
150.00
200.00
250.00
300.00
350.00
400.00
0
20,000
40,000
60,000
80,000
100,000
120,000
140,000
160,000
180,000
0.00 1.00 2.00 3.00 4.00 5.00 6.00 7.00 8.00 9.00
OU
TFLO
W [c
fs]
AREA
[ft^
2], V
OLU
ME
[ft^
3]
PONDING DEPTH [ft]
User Area [ft^2]
Interpolated Area [ft^2]
Summary Area [ft^2]
Volume [ft^3]
Summary Volume [ft^3]
Outflow [cfs]
Summary Outflow [cfs]

Outflow Hydrograph Workbook Filename:
Storm Inflow HydrographsThe user can override the calculated inflow hydrographs from this workbook with inflow hydrographs developed in a separate program.
SOURCE WORKBOOK WORKBOOK WORKBOOK WORKBOOK WORKBOOK WORKBOOK WORKBOOK WORKBOOK WORKBOOK
Time Interval TIME WQCV [cfs] EURV [cfs] 2 Year [cfs] 5 Year [cfs] 10 Year [cfs] 25 Year [cfs] 50 Year [cfs] 100 Year [cfs] 500 Year [cfs]
4.11 min 0:00:00 0.00 0.00 0.00 0.00 0.00 0.00 0.00 0.00 0.00
0:04:07 0.01 0.03 0.02 0.05 0.07 0.10 0.12 0.14 0.17
Hydrograph 0:08:13 0.45 0.94 0.76 1.53 2.10 3.06 3.60 4.29 5.44Constant 0:12:20 1.08 2.31 1.83 3.83 5.36 8.05 9.69 11.85 15.68
1.217 0:16:26 3.01 6.38 5.07 10.53 14.70 21.93 26.26 31.97 41.940:20:33 7.56 16.06 12.75 26.59 37.18 55.68 66.81 81.54 107.420:24:40 7.99 17.52 13.76 29.84 42.71 66.42 81.52 102.23 140.16
0:28:46 6.72 14.90 11.65 25.64 37.01 58.11 71.52 90.05 124.270:32:53 5.39 12.01 9.37 20.78 30.10 47.42 58.39 73.57 101.67
0:36:59 4.33 9.63 7.52 16.65 24.10 37.91 46.65 58.74 81.120:41:06 3.39 7.57 5.90 13.11 19.01 29.98 36.93 46.55 64.390:45:13 2.68 6.00 4.68 10.39 15.06 23.72 29.19 36.77 50.870:49:19 2.23 4.95 3.87 8.52 12.29 19.24 23.61 29.66 41.050:53:26 1.58 3.55 2.76 6.17 8.97 14.22 17.58 22.26 31.120:57:32 1.19 2.66 2.08 4.62 6.70 10.55 12.99 16.36 22.691:01:39 0.82 1.85 1.44 3.22 4.70 7.47 9.23 11.70 16.351:05:46 0.60 1.34 1.05 2.33 3.38 5.34 6.57 8.29 11.511:09:52 0.47 1.04 0.81 1.81 2.62 4.13 5.08 6.40 8.881:13:59 0.39 0.86 0.67 1.48 2.14 3.35 4.11 5.17 7.151:18:05 0.35 0.76 0.60 1.31 1.88 2.94 3.60 4.51 6.221:22:12 0.33 0.73 0.57 1.25 1.80 2.80 3.43 4.29 5.891:26:19 0.33 0.72 0.56 1.23 1.76 2.73 3.34 4.18 5.731:30:25 0.33 0.72 0.56 1.23 1.76 2.73 3.34 4.18 5.72
1:34:32 0.33 0.72 0.56 1.23 1.76 2.73 3.34 4.18 5.721:38:38 0.20 0.46 0.36 0.81 1.18 1.90 2.36 3.02 4.251:42:45 0.12 0.27 0.21 0.47 0.69 1.11 1.38 1.75 2.461:46:52 0.07 0.15 0.12 0.27 0.40 0.64 0.79 1.01 1.431:50:58 0.04 0.08 0.06 0.15 0.22 0.35 0.43 0.54 0.771:55:05 0.02 0.04 0.03 0.07 0.11 0.17 0.21 0.27 0.391:59:11 0.00 0.01 0.01 0.02 0.03 0.06 0.07 0.09 0.14
2:03:18 0.00 0.00 0.00 0.00 0.00 0.00 0.00 0.00 0.012:07:25 0.00 0.00 0.00 0.00 0.00 0.00 0.00 0.00 0.002:11:31 0.00 0.00 0.00 0.00 0.00 0.00 0.00 0.00 0.002:15:38 0.00 0.00 0.00 0.00 0.00 0.00 0.00 0.00 0.002:19:44 0.00 0.00 0.00 0.00 0.00 0.00 0.00 0.00 0.002:23:51 0.00 0.00 0.00 0.00 0.00 0.00 0.00 0.00 0.002:27:58 0.00 0.00 0.00 0.00 0.00 0.00 0.00 0.00 0.002:32:04 0.00 0.00 0.00 0.00 0.00 0.00 0.00 0.00 0.002:36:11 0.00 0.00 0.00 0.00 0.00 0.00 0.00 0.00 0.002:40:17 0.00 0.00 0.00 0.00 0.00 0.00 0.00 0.00 0.002:44:24 0.00 0.00 0.00 0.00 0.00 0.00 0.00 0.00 0.002:48:31 0.00 0.00 0.00 0.00 0.00 0.00 0.00 0.00 0.002:52:37 0.00 0.00 0.00 0.00 0.00 0.00 0.00 0.00 0.002:56:44 0.00 0.00 0.00 0.00 0.00 0.00 0.00 0.00 0.003:00:50 0.00 0.00 0.00 0.00 0.00 0.00 0.00 0.00 0.003:04:57 0.00 0.00 0.00 0.00 0.00 0.00 0.00 0.00 0.003:09:04 0.00 0.00 0.00 0.00 0.00 0.00 0.00 0.00 0.003:13:10 0.00 0.00 0.00 0.00 0.00 0.00 0.00 0.00 0.003:17:17 0.00 0.00 0.00 0.00 0.00 0.00 0.00 0.00 0.003:21:23 0.00 0.00 0.00 0.00 0.00 0.00 0.00 0.00 0.003:25:30 0.00 0.00 0.00 0.00 0.00 0.00 0.00 0.00 0.00
3:29:37 0.00 0.00 0.00 0.00 0.00 0.00 0.00 0.00 0.00
3:33:43 0.00 0.00 0.00 0.00 0.00 0.00 0.00 0.00 0.003:37:50 0.00 0.00 0.00 0.00 0.00 0.00 0.00 0.00 0.003:41:56 0.00 0.00 0.00 0.00 0.00 0.00 0.00 0.00 0.003:46:03 0.00 0.00 0.00 0.00 0.00 0.00 0.00 0.00 0.003:50:10 0.00 0.00 0.00 0.00 0.00 0.00 0.00 0.00 0.003:54:16 0.00 0.00 0.00 0.00 0.00 0.00 0.00 0.00 0.003:58:23 0.00 0.00 0.00 0.00 0.00 0.00 0.00 0.00 0.004:02:29 0.00 0.00 0.00 0.00 0.00 0.00 0.00 0.00 0.004:06:36 0.00 0.00 0.00 0.00 0.00 0.00 0.00 0.00 0.004:10:43 0.00 0.00 0.00 0.00 0.00 0.00 0.00 0.00 0.004:14:49 0.00 0.00 0.00 0.00 0.00 0.00 0.00 0.00 0.004:18:56 0.00 0.00 0.00 0.00 0.00 0.00 0.00 0.00 0.004:23:02 0.00 0.00 0.00 0.00 0.00 0.00 0.00 0.00 0.004:27:09 0.00 0.00 0.00 0.00 0.00 0.00 0.00 0.00 0.00
4:31:16 0.00 0.00 0.00 0.00 0.00 0.00 0.00 0.00 0.004:35:22 0.00 0.00 0.00 0.00 0.00 0.00 0.00 0.00 0.004:39:29 0.00 0.00 0.00 0.00 0.00 0.00 0.00 0.00 0.004:43:35 0.00 0.00 0.00 0.00 0.00 0.00 0.00 0.00 0.00
4:47:42 0.00 0.00 0.00 0.00 0.00 0.00 0.00 0.00 0.004:51:49 0.00 0.00 0.00 0.00 0.00 0.00 0.00 0.00 0.004:55:55 0.00 0.00 0.00 0.00 0.00 0.00 0.00 0.00 0.00
Detention Basin Outlet Structure Design

JANSEN STRAWN CONSULTING ENGINEERS45 West 2nd Ave. - Denver, CO 80223
p: 303.561.3333 f: 303.561.3339
PROJECT : EastCreek Farms DATE : 10/28/2016PROJECT NO. : 13049 BY : DFA
Required VolumeTributary Area (ac) % Impervious 1-Hour Rainfall Depth (100-yr)
46.67 32.0% 2.69
Soil Type % : A = 0.0% B = 0.0% C&D= 100.0%
WQCV = 0.61 ac-ft ( WQCV = 1.0*A*(0.91i 3 -1.19i 2 +0.78i)/12 )WQCV = 26,693 cu-ftEURV = 1.36 ac-ft ( EURV = A((0.140i 1.28 )*A+(0.113i 1.08 )B%+(0.100i 1.08 )C%)
EURV = 59,386 cu-ft (INCLUDES WQCV)100-yr Detention = 3.78 ac-ft (V100 =(P 1 ((0.728i 1.258 +0.150i 0.258 )A%+(0.364i 1.28 6+0.381i 0.286 )B%
100-yr Detention = 164,464 cu-ft +(0.306i 1.286 +0.402i 0.286 )C%))/12 * A)
Total Required Volume = 3.78 ac-ft (V100)= 164,464 cu-ft
Max Allowable Release RateQ100 = 42.00 cfs ( 0.90 cfs/ac )
Provided Volume
Pond Depth
Contour Elevation
0.00 5105.001.00 5106.002.00 5107.003.00 5108.004.00 5109.005.00 5110.006.00 5111.007.00 5112.008.00 5113.009.00 5114.00
WSEL Depth (ft)WQCV = 5108.05 3.05EURV = 5109.07 4.07
100-yr = 5111.70 6.70
Pond B - EURV / Detention Calculations
43,79848,80855,197
Ft2
501,429
11,09428,41834,938
281,486
5825,502
19,08931,62236,68140,207
0582
6,08425,17356,79593,476
133,683177,481226,289
2.153.074.075.196.46
1/3 (A1 + A2 + (A1A2)1/2) D Total Volume (ft3) Total Volume (ac-ft)
0.000.010.140.581.30
38,45241,98845,63352,05458,400

PROJECT : EastCreek Farms DATE : 10/28/2016PROJECT NO. : 13049 BY : DFA
POND WEIRQ100 = 157.00 cfs
Weir Equation => Q=CLH3/2
Try Weir Release:Q100 x2= 314.00 cfs
C = 3.00L = 105.00 ft
Flow Depth = 1.00 ft
USE: 105' LONG OVERFLOW WEIR TO PASS THE 2xQ100
Pond B - Overflow Weir

Pond B - UD-Detention_v3 05.xlsm, Basin 10/28/2016, 10:34 AM
Project:
Basin ID:
Depth Increment = 0.1 ft
Required Volume Calculation Micropool -- 0.00 -- -- -- 50 0.001
Selected BMP Type = EDB -- 1.00 -- -- -- 1,429 0.033 1,031 0.024
Watershed Area = 46.67 acres -- 2.00 -- -- -- 11,094 0.255 7,822 0.180
Watershed Length = 1,650 ft -- 3.00 -- -- -- 28,418 0.652 22,596 0.519
Watershed Slope = 0.020 ft/ft -- 4.00 -- -- -- 34,938 0.802 39,422 0.905
Watershed Imperviousness = 32.00% percent EURV -- 4.07 -- -- -- 35,186 0.808 40,874 0.938
Percentage Hydrologic Soil Group A = 0.0% percent -- 5.00 -- -- -- 38,452 0.883 61,649 1.415
Percentage Hydrologic Soil Group B = 0.0% percent -- 6.00 -- -- -- 41,988 0.964 87,868 2.017
Percentage Hydrologic Soil Groups C/D = 100.0% percent 100-Year -- 6.70 -- -- -- 44,550 1.023 109,264 2.508
Desired WQCV Drain Time = 40.0 hours Overflow Weir -- 7.00 -- -- -- 45,633 1.048 119,261 2.738
Location for 1-hr Rainfall Depths = Thornton - Thornton City Office -- 8.00 -- -- -- 52,054 1.195 157,130 3.607
Water Quality Capture Volume (WQCV) = 0.613 acre-feet Top Of Berm -- 9.00 -- -- -- 58,400 1.341
Excess Urban Runoff Volume (EURV) = 1.363 acre-feet -- -- -- --
2-yr Runoff Volume (P1 = 0.95 in.) = 1.071 acre-feet inches -- -- -- --
5-yr Runoff Volume (P1 = 1.35 in.) = 2.293 acre-feet inches -- -- -- --
10-yr Runoff Volume (P1 = 1.61 in.) = 3.270 acre-feet inches -- -- -- --
25-yr Runoff Volume (P1 = 2.03 in.) = 5.055 acre-feet inches -- -- -- --
50-yr Runoff Volume (P1 = 2.32 in.) = 6.180 acre-feet inches -- -- -- --
100-yr Runoff Volume (P1 = 2.66 in.) = 7.717 acre-feet inches -- -- -- --
500-yr Runoff Volume (P1 = 3.33 in.) = 10.556 acre-feet inches -- -- -- --
Approximate 2-yr Detention Volume = 1.008 acre-feet -- -- -- --
Approximate 5-yr Detention Volume = 1.662 acre-feet -- -- -- --
Approximate 10-yr Detention Volume = 1.853 acre-feet -- -- -- --
Approximate 25-yr Detention Volume = 2.331 acre-feet -- -- -- --
Approximate 50-yr Detention Volume = 2.914 acre-feet -- -- -- --
Approximate 100-yr Detention Volume = 3.764 acre-feet -- -- -- --
-- -- -- --
Stage-Storage Calculation -- -- -- --
Zone 1 Volume (WQCV) = 0.613 acre-feet -- -- -- --
Zone 2 Volume (EURV - Zone 1) = 0.751 acre-feet -- -- -- --
Zone 3 Volume (100-year - Zones 1 & 2) = 2.401 acre-feet -- -- -- --
Total Detention Basin Volume = 3.764 acre-feet -- -- -- --
Initial Surcharge Volume (ISV) = user ft^3 -- -- -- --
Initial Surcharge Depth (ISD) = user ft -- -- -- --
Total Available Detention Depth (Htotal) = user ft -- -- -- --Depth of Trickle Channel (HTC) = user ft -- -- -- --
Slope of Trickle Channel (STC) = user ft/ft -- -- -- --
Slopes of Main Basin Sides (Smain) = user H:V -- -- -- --
Basin Length-to-Width Ratio (RL/W) = user -- -- -- --
-- -- -- --
Initial Surcharge Area (AISV) = user ft^2 -- -- -- --
Surcharge Volume Length (LISV) = user ft -- -- -- --
Surcharge Volume Width (W ISV) = user ft -- -- -- --
Depth of Basin Floor (HFLOOR) = user ft -- -- -- --
Length of Basin Floor (LFLOOR) = user ft -- -- -- --
Width of Basin Floor (WFLOOR) = user ft -- -- -- --
Area of Basin Floor (AFLOOR) = user ft^2 -- -- -- --
Volume of Basin Floor (VFLOOR) = user ft^3 -- -- -- --
Depth of Main Basin (HMAIN) = user ft -- -- -- --
Length of Main Basin (LMAIN) = user ft -- -- -- --
Width of Main Basin (WMAIN) = user ft -- -- -- --
Area of Main Basin (AMAIN) = user ft^2 -- -- -- --
Volume of Main Basin (VMAIN) = user ft^3 -- -- -- --
Calculated Total Basin Volume (Vtotal) = user acre-feet -- -- -- ---- -- -- ---- -- -- ---- -- -- ---- -- -- ---- -- -- ---- -- -- ---- -- -- ---- -- -- ---- -- -- ---- -- -- ---- -- -- ---- -- -- ---- -- -- ---- -- -- ---- -- -- ---- -- -- ---- -- -- ---- -- -- ---- -- -- ---- -- -- ---- -- -- ---- -- -- ---- -- -- ---- -- -- ---- -- -- ---- -- -- ---- -- -- ---- -- -- ---- -- -- ---- -- -- ---- -- -- ---- -- -- ---- -- -- ---- -- -- ---- -- -- ---- -- -- ---- -- -- ---- -- -- ---- -- -- ---- -- -- ---- -- -- ---- -- -- ---- -- -- ---- -- -- ---- -- -- --
Optional User Input1-hr Precipitation
Volume (ft^3)
Volume (ac-ft)
Area (acre)
DETENTION BASIN STAGE-STORAGE TABLE BUILDER
Optional Override
Area (ft^2)Length
(ft)
Optional Override Stage (ft)
Stage(ft)
Stage - StorageDescription
Area (ft^2)
Width (ft)
East Creek
Pond B
Example Zone Configuration (Retention Pond)

Pond B - UD-Detention_v3 05.xlsm, Basin 10/28/2016, 10:34 AM
1 User Defined Stage-Area Boolean for Message
1 Equal Stage-Area Inputs Watershed L:W
1 CountA
0 Calc_S_TC
(0.83) H_FLOOR
L_FLOOR_OTHER
0.00 ISV 0.00 ISV
0.00 Floor 0.00 Floor
3.26 Zone 1 (WQCV) 3.26 Zone 1 (WQCV)
4.91 Zone 2 (EURV) 4.91 Zone 2 (EURV)
8.01 Zone 3 (100-yea 8.01 Zone 3 (100-year)
DETENTION BASIN STAGE-STORAGE TABLE BUILDER
0.000
0.905
1.810
2.715
3.620
0.000
0.240
0.480
0.720
0.960
0.00 2.00 4.00 6.00 8.00Vo
lum
e (a
c-ft
)
Area
(acr
es)
Stage (ft.)
Area (acres) Volume (ac-ft)
0
100
200
300
400
0
5
10
15
20
0.00 2.00 4.00 6.00 8.00
Area
(sq.
ft.)
Leng
th, W
idth
(ft.)
Stage (ft)
Length (ft) Width (ft) Area (sq.ft.)

Project: Basin ID:
Stage (ft) Zone Volume (ac-ft) Outlet Type
Zone 1 (WQCV) 3.26 0.613 Orifice Plate
Zone 2 (EURV) 4.91 0.751 Orifice Plate
Zone 3 (100-year) 8.01 2.401 Weir&Pipe (Restrict)
3.764 TotalUser Input: Orifice at Underdrain Outlet (typically used to drain WQCV in a Filtration BMP) Calculated Parameters for Underdrain
Underdrain Orifice Invert Depth = N/A ft (distance below the filtration media surface) Underdrain Orifice Area = N/A ft2
Underdrain Orifice Diameter = N/A inches Underdrain Orifice Centroid = N/A feet
User Input: Orifice Plate with one or more orifices or Elliptical Slot Weir (typically used to drain WQCV and/or EURV in a sedimentation BMP) Calculated Parameters for PlateInvert of Lowest Orifice = 0.00 ft (relative to basin bottom at Stage = 0 ft) WQ Orifice Area per Row = 1.493E-02 ft2
Depth at top of Zone using Orifice Plate = 3.36 ft (relative to basin bottom at Stage = 0 ft) Elliptical Half-Width = N/A feetOrifice Plate: Orifice Vertical Spacing = 13.40 inches Elliptical Slot Centroid = N/A feet
Orifice Plate: Orifice Area per Row = 2.15 sq. inches (diameter = 1-5/8 inches) Elliptical Slot Area = N/A ft2
User Input: Stage and Total Area of Each Orifice Row (numbered from lowest to highest)Row 1 (required) Row 2 (optional) Row 3 (optional) Row 4 (optional) Row 5 (optional) Row 6 (optional) Row 7 (optional) Row 8 (optional)
Stage of Orifice Centroid (ft) 0.00 1.12 2.24Orifice Area (sq. inches) 2.15 2.15 2.15
Row 9 (optional) Row 10 (optional) Row 11 (optional) Row 12 (optional) Row 13 (optional) Row 14 (optional) Row 15 (optional) Row 16 (optional)Stage of Orifice Centroid (ft)
Orifice Area (sq. inches)
User Input: Vertical Orifice (Circular or Rectangular) Calculated Parameters for Vertical OrificeNot Selected Not Selected Not Selected Not Selected
Invert of Vertical Orifice = N/A N/A ft (relative to basin bottom at Stage = 0 ft) Vertical Orifice Area = N/A N/A ft2
Depth at top of Zone using Vertical Orifice = N/A N/A ft (relative to basin bottom at Stage = 0 ft) Vertical Orifice Centroid = N/A N/A feetVertical Orifice Diameter = N/A N/A inches
User Input: Overflow Weir (Dropbox) and Grate (Flat or Sloped) Calculated Parameters for Overflow WeirZone 3 Weir Not Selected Zone 3 Weir Not Selected
Overflow Weir Front Edge Height, Ho = 4.07 N/A ft (relative to basin bottom at Stage = 0 ft) Height of Grate Upper Edge, Ht = 5.92 N/A feetOverflow Weir Front Edge Length = 7.00 N/A feet Over Flow Weir Slope Length = 7.63 N/A feet
Overflow Weir Slope = 4.00 N/A H:V (enter zero for flat grate) Grate Open Area / 100-yr Orifice Area = 7.10 N/A should be > 4Horiz. Length of Weir Sides = 7.40 N/A feet Overflow Grate Open Area w/o Debris = 37.38 N/A ft2
Overflow Grate Open Area % = 70% N/A %, grate open area/total area Overflow Grate Open Area w/ Debris = 18.69 N/A ft2
Debris Clogging % = 50% N/A %
User Input: Outlet Pipe w/ Flow Restriction Plate (Circular Orifice, Restrictor Plate, or Rectangular Orifice) Calculated Parameters for Outlet Pipe w/ Flow Restriction PlateZone 3 Restrictor Not Selected Zone 3 Restrictor Not Selected
Depth to Invert of Outlet Pipe = 0.00 N/A ft (distance below basin bottom at Stage = 0 ft) Outlet Orifice Area = 5.26 N/A ft2
Outlet Pipe Diameter = 36.00 N/A inches Outlet Orifice Centroid = 1.17 N/A feetRestrictor Plate Height Above Pipe Invert = 25.10 inches Half-Central Angle of Restrictor Plate on Pipe = 1.98 N/A radians
User Input: Emergency Spillway (Rectangular or Trapezoidal) Calculated Parameters for SpillwaySpillway Invert Stage= 999.00 ft (relative to basin bottom at Stage = 0 ft) Spillway Design Flow Depth= 0.97 feet
Spillway Crest Length = 64.00 feet Stage at Top of Freeboard = 1000.97 feetSpillway End Slopes = 4.00 H:V Basin Area at Top of Freeboard = 0.00 acres
Freeboard above Max Water Surface = 1.00 feet
Routed Hydrograph ResultsDesign Storm Return Period = WQCV EURV 2 Year 5 Year 10 Year 25 Year 50 Year 100 Year 500 YearOne-Hour Rainfall Depth (in) = 0.53 1.07 0.95 1.35 1.61 2.03 2.32 2.66 3.33
Calculated Runoff Volume (acre-ft) = 0.613 1.363 1.071 2.293 3.270 5.055 6.180 7.717 10.556OPTIONAL Override Runoff Volume (acre-ft) =
Inflow Hydrograph Volume (acre-ft) = 0.613 1.362 1.070 2.292 3.269 5.052 6.175 7.706 10.550Predevelopment Unit Peak Flow, q (cfs/acre) = 0.00 0.00 0.02 0.32 0.54 1.02 1.29 1.61 2.24
Predevelopment Peak Q (cfs) = 0.0 0.0 0.8 15.1 25.3 47.5 60.1 75.1 104.5Peak Inflow Q (cfs) = 15.3 33.9 26.6 56.9 81.6 126.6 154.9 193.3 264.3
Peak Outflow Q (cfs) = 0.3 4.3 0.9 19.5 38.3 58.6 62.7 67.7 77.4Ratio Peak Outflow to Predevelopment Q = N/A N/A N/A 1.3 1.5 1.2 1.0 0.9 0.7
Structure Controlling Flow = Plate Overflow Grate 1 Overflow Grate 1 Overflow Grate 1 Overflow Grate 1 Outlet Plate 1 Outlet Plate 1 Outlet Plate 1 N/AMax Velocity through Grate 1 (fps) = N/A 0.10 0.01 0.5 1.0 1.6 1.7 1.8 1.9Max Velocity through Grate 2 (fps) = N/A N/A N/A N/A N/A N/A N/A N/A N/A
Time to Drain 97% of Inflow Volume (hours) = 38 49 50 47 44 40 38 35 30Time to Drain 99% of Inflow Volume (hours) = 40 53 53 52 51 49 48 46 44
Maximum Ponding Depth (ft) = 3.15 4.50 4.19 5.14 5.61 6.52 7.29 8.30 10.30Area at Maximum Ponding Depth (acres) = 0.37 0.51 0.49 0.56 0.61 0.72 0.83 0.00 0.00
Maximum Volume Stored (acre-ft) = 0.573 1.146 0.996 1.487 1.769 2.369 2.964 #VALUE! #VALUE!
Detention Basin Outlet Structure Design
EastcreekPond B
Example Zone Configuration (Retention Pond)

COUNTA for Basin Tab = 1 Ao Dia WQ Plate Type Vert Orifice 1 Vert Orifice 2Count_Underdrain = 0 0.11 meter = 3/8 inch) 2 1 1
Count_WQPlate = 1 0.14 eter = 7/16 inch)
Count_VertOrifice1 = 0 0.18 meter = 1/2 inch) Outlet Plate 1 Outlet Plate 2 Drain Time Message Boolean
Count_VertOrifice2 = 0 0.24 eter = 9/16 inch) 4 1 5yr, <72hr 0
Count_Weir1 = 1 0.29 meter = 5/8 inch) >5yr, <120hr 0
Count_Weir2 = 0 0.36 er = 11/16 inch) Max Depth Row
Count_OutletPipe1 = 1 0.42 meter = 3/4 inch) WQCV 316 Watershed Constraint CheckCount_OutletPipe2 = 0 0.50 er = 13/16 inch) 2 Year 420 Slope 0.020
COUNTA_2 (Standard FSD Setup)= 1 0.58 meter = 7/8 inch) EURV 451 Shape 2.00MaxPondDepth_Error? FALSE 0.67 er = 15/16 inch) 5 Year 515
Hidden Parameters & Calculations 0.76 ameter = 1 inch) 10 Year 562 Spillway Depth
0.86 = 1-1/16 inches) 25 Year 653 0.97WQ Plate Flow at 100yr depth = 0.58 0.97 = 1-1/8 inches) 50 Year 730
CLOG #1= 35% 1.08 = 1-3/16 inches) 100 Year 831 1 Z1_BooleanCdw #1 = 0.89 1.20 = 1-1/4 inches) 500 Year 901 1 Z2_BooleanCdo #1 = 0.69 1.32 = 1-5/16 inches) Zone3_Pulldown Message 1 Z3_Boolean
Overflow Weir #1 Angle = 0.245 1.45 = 1-3/8 inches) 1 Opening MessageCLOG #2= #VALUE! 1.59 = 1-7/16 inches) Draintime Running
Cdw #2 = #VALUE! 1.73 = 1-1/2 inches) Outlet Boolean Outlet Rank Total (1 to 4)Cdo #2 = #VALUE! 1.88 = 1-9/16 inches) Vertical Orifice 1 0 0 1
Overflow Weir #2 Angle = #VALUE! 2.03 = 1-5/8 inches) Vertical Orifice 2 0 0 Boolean
Underdrain Q at 100yr depth = 0.00 2.20 1-11/16 inches) Overflow Weir 1 1 1 1 Max Depth
VertOrifice1 Q at 100yr depth = 0.00 2.36 = 1-3/4 inches) Overflow Weir 2 0 0 1 500yr Depth
VertOrifice2 Q at 100yr depth = 0.00 2.54 1-13/16 inches) Outlet Pipe 1 1 1 0 Freeboard
EURV_draintime_user = 2.72 = 1-7/8 inches) Outlet Pipe 2 0 0 1 Spillway
Count_User_Hydrographs 0 2.90 1-15/16 inches) 0 Spillway LengthCountA_3 (EURV & 100yr) = 1 3.09 eter = 2 inches) Button Visibility Boolean FALSE Time Interval
CountA_4 (100yr Only) = 1 3.29 gular openings) 1 Button_Trigger0 Underdrain1 WQCV Plate0 EURV-WQCV Plate0 EURV-WQCV VertOrifice1 Outlet 90% Qpeak0 Outlet Undetained
S-A-V-D Chart Axis Override X-axis Left Y-Axis Right Y-Axisminimum bound
maximum bound
Detention Basin Outlet Structure Design
0
50
100
150
200
250
300
0.1 1 10
FLO
W [c
fs]
TIME [hr]
500YR IN
500YR OUT
100YR IN
100YR OUT
50YR IN
50YR OUT
25YR IN
25YR OUT
10YR IN
10YR OUT
5YR IN
5YR OUT
2YR IN
2YR OUT
EURV IN
EURV OUT
WQCV IN
WQCV OUT
0
2
4
6
8
10
12
0.1 1 10 100
PON
DIN
G D
EPTH
[ft]
DRAIN TIME [hr]
500YR
100YR
50YR
25YR
10YR
5YR
2YR
EURV
WQCV
0.00
10.00
20.00
30.00
40.00
50.00
60.00
70.00
80.00
0
20,000
40,000
60,000
80,000
100,000
120,000
140,000
160,000
180,000
0.00 1.00 2.00 3.00 4.00 5.00 6.00 7.00 8.00 9.00 10.00
OU
TFLO
W [c
fs]
AREA
[ft^
2], V
OLU
ME
[ft^
3]
PONDING DEPTH [ft]
User Area [ft^2]
Interpolated Area [ft^2]
Summary Area [ft^2]
Volume [ft^3]
Summary Volume [ft^3]
Outflow [cfs]
Summary Outflow [cfs]

Outflow Hydrograph Workbook Filename:
Storm Inflow HydrographsThe user can override the calculated inflow hydrographs from this workbook with inflow hydrographs developed in a separate program.
SOURCE WORKBOOK WORKBOOK WORKBOOK WORKBOOK WORKBOOK WORKBOOK WORKBOOK WORKBOOK WORKBOOK
Time Interval TIME WQCV [cfs] EURV [cfs] 2 Year [cfs] 5 Year [cfs] 10 Year [cfs] 25 Year [cfs] 50 Year [cfs] 100 Year [cfs] 500 Year [cfs]
4.46 min 0:00:00 0.00 0.00 0.00 0.00 0.00 0.00 0.00 0.00 0.00
0:04:28 0.03 0.06 0.04 0.09 0.11 0.16 0.18 0.21 0.26
Hydrograph 0:08:55 0.83 1.70 1.37 2.66 3.54 4.93 5.72 6.70 8.33Constant 0:13:23 2.02 4.29 3.43 6.95 9.61 14.19 16.95 20.57 26.97
1.121 0:17:50 5.58 11.79 9.42 18.96 26.01 37.98 45.11 54.45 70.890:22:18 14.05 29.79 23.78 48.09 66.23 97.25 115.84 140.23 183.350:26:46 15.29 33.88 26.64 56.94 81.59 126.57 154.85 193.29 264.29
0:31:13 12.99 29.25 22.88 49.77 71.69 112.17 137.89 173.32 240.180:35:41 10.47 23.75 18.53 40.60 58.54 91.76 112.92 142.06 196.90
0:40:08 8.40 19.02 14.85 32.47 46.76 73.21 90.06 113.19 156.550:44:36 6.60 15.00 11.70 25.67 37.02 58.11 71.57 90.07 124.780:49:04 5.23 11.88 9.27 20.32 29.26 45.91 56.55 71.17 98.620:53:31 4.32 9.72 7.61 16.49 23.64 37.05 45.63 57.43 79.560:57:59 3.09 7.07 5.50 12.16 17.65 28.06 34.78 44.08 61.651:02:26 2.32 5.28 4.12 9.04 13.02 20.48 25.26 31.86 44.361:06:54 1.61 3.70 2.87 6.38 9.27 14.74 18.27 23.16 32.381:11:22 1.17 2.67 2.08 4.57 6.59 10.39 12.82 16.19 22.541:15:49 0.91 2.07 1.61 3.54 5.09 8.01 9.88 12.45 17.281:20:17 0.75 1.69 1.32 2.87 4.12 6.45 7.95 9.99 13.831:24:44 0.67 1.49 1.17 2.52 3.60 5.61 6.89 8.65 11.941:29:12 0.64 1.42 1.12 2.40 3.43 5.32 6.51 8.14 11.171:33:40 0.63 1.39 1.09 2.34 3.34 5.18 6.33 7.91 10.851:38:07 0.63 1.39 1.09 2.34 3.34 5.17 6.32 7.88 10.79
1:42:35 0.63 1.39 1.09 2.34 3.34 5.17 6.32 7.88 10.791:47:02 0.40 0.93 0.72 1.62 2.38 3.83 4.77 6.08 8.571:51:30 0.23 0.55 0.42 0.95 1.39 2.21 2.75 3.50 4.951:55:58 0.13 0.31 0.24 0.55 0.80 1.29 1.60 2.05 2.882:00:25 0.07 0.17 0.13 0.30 0.43 0.69 0.87 1.10 1.562:04:53 0.03 0.08 0.06 0.15 0.21 0.35 0.45 0.57 0.822:09:20 0.01 0.03 0.02 0.05 0.07 0.12 0.16 0.21 0.32
2:13:48 0.00 0.00 0.00 0.00 0.00 0.01 0.01 0.02 0.042:18:16 0.00 0.00 0.00 0.00 0.00 0.00 0.00 0.00 0.002:22:43 0.00 0.00 0.00 0.00 0.00 0.00 0.00 0.00 0.002:27:11 0.00 0.00 0.00 0.00 0.00 0.00 0.00 0.00 0.002:31:38 0.00 0.00 0.00 0.00 0.00 0.00 0.00 0.00 0.002:36:06 0.00 0.00 0.00 0.00 0.00 0.00 0.00 0.00 0.002:40:34 0.00 0.00 0.00 0.00 0.00 0.00 0.00 0.00 0.002:45:01 0.00 0.00 0.00 0.00 0.00 0.00 0.00 0.00 0.002:49:29 0.00 0.00 0.00 0.00 0.00 0.00 0.00 0.00 0.002:53:56 0.00 0.00 0.00 0.00 0.00 0.00 0.00 0.00 0.002:58:24 0.00 0.00 0.00 0.00 0.00 0.00 0.00 0.00 0.003:02:52 0.00 0.00 0.00 0.00 0.00 0.00 0.00 0.00 0.003:07:19 0.00 0.00 0.00 0.00 0.00 0.00 0.00 0.00 0.003:11:47 0.00 0.00 0.00 0.00 0.00 0.00 0.00 0.00 0.003:16:14 0.00 0.00 0.00 0.00 0.00 0.00 0.00 0.00 0.003:20:42 0.00 0.00 0.00 0.00 0.00 0.00 0.00 0.00 0.003:25:10 0.00 0.00 0.00 0.00 0.00 0.00 0.00 0.00 0.003:29:37 0.00 0.00 0.00 0.00 0.00 0.00 0.00 0.00 0.003:34:05 0.00 0.00 0.00 0.00 0.00 0.00 0.00 0.00 0.003:38:32 0.00 0.00 0.00 0.00 0.00 0.00 0.00 0.00 0.003:43:00 0.00 0.00 0.00 0.00 0.00 0.00 0.00 0.00 0.00
3:47:28 0.00 0.00 0.00 0.00 0.00 0.00 0.00 0.00 0.00
3:51:55 0.00 0.00 0.00 0.00 0.00 0.00 0.00 0.00 0.003:56:23 0.00 0.00 0.00 0.00 0.00 0.00 0.00 0.00 0.004:00:50 0.00 0.00 0.00 0.00 0.00 0.00 0.00 0.00 0.004:05:18 0.00 0.00 0.00 0.00 0.00 0.00 0.00 0.00 0.004:09:46 0.00 0.00 0.00 0.00 0.00 0.00 0.00 0.00 0.004:14:13 0.00 0.00 0.00 0.00 0.00 0.00 0.00 0.00 0.004:18:41 0.00 0.00 0.00 0.00 0.00 0.00 0.00 0.00 0.004:23:08 0.00 0.00 0.00 0.00 0.00 0.00 0.00 0.00 0.004:27:36 0.00 0.00 0.00 0.00 0.00 0.00 0.00 0.00 0.004:32:04 0.00 0.00 0.00 0.00 0.00 0.00 0.00 0.00 0.004:36:31 0.00 0.00 0.00 0.00 0.00 0.00 0.00 0.00 0.004:40:59 0.00 0.00 0.00 0.00 0.00 0.00 0.00 0.00 0.004:45:26 0.00 0.00 0.00 0.00 0.00 0.00 0.00 0.00 0.004:49:54 0.00 0.00 0.00 0.00 0.00 0.00 0.00 0.00 0.00
4:54:22 0.00 0.00 0.00 0.00 0.00 0.00 0.00 0.00 0.004:58:49 0.00 0.00 0.00 0.00 0.00 0.00 0.00 0.00 0.005:03:17 0.00 0.00 0.00 0.00 0.00 0.00 0.00 0.00 0.005:07:44 0.00 0.00 0.00 0.00 0.00 0.00 0.00 0.00 0.00
5:12:12 0.00 0.00 0.00 0.00 0.00 0.00 0.00 0.00 0.005:16:40 0.00 0.00 0.00 0.00 0.00 0.00 0.00 0.00 0.005:21:07 0.00 0.00 0.00 0.00 0.00 0.00 0.00 0.00 0.00
Detention Basin Outlet Structure Design

JANSEN STRAWN CONSULTING ENGINEERS45 West 2nd Ave. - Denver, CO 80223
p: 303.561.3333 f: 303.561.3339
PROJECT : EastCreek Farms DATE : 10/28/2016PROJECT NO. : 13049 BY : DFA
Required VolumeTributary Area (ac) % Impervious 1-Hour Rainfall Depth (100-yr)
14.71 38.0% 2.69
Soil Type % : A = 0.0% B = 0.0% C&D= 100.0%
WQCV = 0.21 ac-ft ( WQCV = 1.0*A*(0.91i 3 -1.19i 2 +0.78i)/12 )WQCV = 9,318 cu-ftEURV = 0.52 ac-ft ( EURV = A((0.140i 1.28 )*A+(0.113i1.08)B%+(0.100i1.08)C%)
EURV = 22,535 cu-ft (NCLUDES WQCV)100-yr Detention = 1.30 ac-ft (V100 =(P 1 ((0.728i 1.258 +0.150i 0.258 )A%+(0.364i 1.28 6+0.381i 0.286 )B%
100-yr Detention = 56,449 cu-ft +(0.306i 1.286 +0.402i 0.286 )C%))/12 * A)
Total Required Volume = 1.30 ac-ft (V100)= 56,449 cu-ft
Max Allowable Release RateQ100 = 13.24 cfs ( 0.90 cfs/ac )
Provided Volume
Pond Depth
Contour Elevation
0.00 5116.001.00 5117.002.00 5118.003.00 5119.004.00 5120.005.00 5121.006.00 5122.007.00 5123.00
WSEL Depth (ft)WQCV = 5118.04 2.04EURV = 5119.03 3.03
100-yr = 5120.91 4.91
1/3 (A1 + A2 + (A1A2)1/2) D Total Volume (ft3) Total Volume (ac-ft)
0.000.040.200.510.89
20,56323,00926,455
01,5678,765
22,01938,77258,15279,926
104,638
1.331.832.40
1,5677,198
13,25416,75319,37921,775
POND C - EURV / Detention Calculations
24,712
Ft2
1553,780
11,28315,32918,219

PROJECT : EastCreek Farms DATE : 10/28/2016PROJECT NO. : 13049 BY : DFA
POND WEIRQ100 = 62.30 cfs
Weir Equation => Q=CLH3/2
Try Weir Release:Q100 x2= 124.60 cfs
C = 3.00L = 41.50 ft
Flow Depth = 1.00 ft
USE: 42' LONG OVERFLOW WEIR TO PASS THE 2xQ100
POND C - Overflow Weir

Pond C - UD-Detention_v3 05.xlsm, Basin 10/28/2016, 10:43 AM
Project:
Basin ID:
Depth Increment = 0.1 ft
Required Volume Calculation Micropool -- 0.00 -- -- -- 155 0.004
Selected BMP Type = EDB -- 1.00 -- -- -- 3,780 0.087 1,930 0.044
Watershed Area = 14.71 acres -- 2.00 -- -- -- 11,283 0.259 9,386 0.215
Watershed Length = 950 ft WQCV -- 2.04 -- -- -- 11,451 0.263 9,839 0.226
Watershed Slope = 0.020 ft/ft -- 3.00 -- -- -- 15,329 0.352 22,808 0.524
Watershed Imperviousness = 38.00% percent EURV -- 3.03 -- -- -- 15,418 0.354 23,269 0.534
Percentage Hydrologic Soil Group A = 0.0% percent -- 4.00 -- -- -- 18,219 0.418 39,583 0.909
Percentage Hydrologic Soil Group B = 0.0% percent 100-Year -- 4.91 -- -- -- 20,357 0.467 57,135 1.312
Percentage Hydrologic Soil Groups C/D = 100.0% percent Overflow Weir -- 5.00 -- -- -- 20,563 0.472 58,977 1.354
Desired WQCV Drain Time = 40.0 hours -- 6.00 -- -- -- 23,009 0.528 80,763 1.854
Location for 1-hr Rainfall Depths = Thornton - Thornton City Office Top Of Berm -- 7.00 -- -- -- 26,455 0.607 105,495 2.422
Water Quality Capture Volume (WQCV) = 0.214 acre-feet -- -- -- --
Excess Urban Runoff Volume (EURV) = 0.517 acre-feet -- -- -- --
2-yr Runoff Volume (P1 = 0.95 in.) = 0.407 acre-feet inches -- -- -- --
5-yr Runoff Volume (P1 = 1.35 in.) = 0.806 acre-feet inches -- -- -- --
10-yr Runoff Volume (P1 = 1.61 in.) = 1.117 acre-feet inches -- -- -- --
25-yr Runoff Volume (P1 = 2.03 in.) = 1.679 acre-feet inches -- -- -- --
50-yr Runoff Volume (P1 = 2.32 in.) = 2.038 acre-feet inches -- -- -- --
100-yr Runoff Volume (P1 = 2.66 in.) = 2.521 acre-feet inches -- -- -- --
500-yr Runoff Volume (P1 = 3.33 in.) = 3.418 acre-feet inches -- -- -- --
Approximate 2-yr Detention Volume = 0.384 acre-feet -- -- -- --
Approximate 5-yr Detention Volume = 0.608 acre-feet -- -- -- --
Approximate 10-yr Detention Volume = 0.674 acre-feet -- -- -- --
Approximate 25-yr Detention Volume = 0.834 acre-feet -- -- -- --
Approximate 50-yr Detention Volume = 1.020 acre-feet -- -- -- --
Approximate 100-yr Detention Volume = 1.291 acre-feet -- -- -- --
-- -- -- --
Stage-Storage Calculation -- -- -- --
Zone 1 Volume (WQCV) = 0.214 acre-feet -- -- -- --
Zone 2 Volume (EURV - Zone 1) = 0.303 acre-feet -- -- -- --
Zone 3 Volume (100-year - Zones 1 & 2) = 0.773 acre-feet -- -- -- --
Total Detention Basin Volume = 1.291 acre-feet -- -- -- --
Initial Surcharge Volume (ISV) = user ft^3 -- -- -- --
Initial Surcharge Depth (ISD) = user ft -- -- -- --
Total Available Detention Depth (Htotal) = user ft -- -- -- --Depth of Trickle Channel (HTC) = user ft -- -- -- --
Slope of Trickle Channel (STC) = user ft/ft -- -- -- --
Slopes of Main Basin Sides (Smain) = user H:V -- -- -- --
Basin Length-to-Width Ratio (RL/W) = user -- -- -- --
-- -- -- --
Initial Surcharge Area (AISV) = user ft^2 -- -- -- --
Surcharge Volume Length (LISV) = user ft -- -- -- --
Surcharge Volume Width (W ISV) = user ft -- -- -- --
Depth of Basin Floor (HFLOOR) = user ft -- -- -- --
Length of Basin Floor (LFLOOR) = user ft -- -- -- --
Width of Basin Floor (WFLOOR) = user ft -- -- -- --
Area of Basin Floor (AFLOOR) = user ft^2 -- -- -- --
Volume of Basin Floor (VFLOOR) = user ft^3 -- -- -- --
Depth of Main Basin (HMAIN) = user ft -- -- -- --
Length of Main Basin (LMAIN) = user ft -- -- -- --
Width of Main Basin (WMAIN) = user ft -- -- -- --
Area of Main Basin (AMAIN) = user ft^2 -- -- -- --
Volume of Main Basin (VMAIN) = user ft^3 -- -- -- --
Calculated Total Basin Volume (Vtotal) = user acre-feet -- -- -- ---- -- -- ---- -- -- ---- -- -- ---- -- -- ---- -- -- ---- -- -- ---- -- -- ---- -- -- ---- -- -- ---- -- -- ---- -- -- ---- -- -- ---- -- -- ---- -- -- ---- -- -- ---- -- -- ---- -- -- ---- -- -- ---- -- -- ---- -- -- ---- -- -- ---- -- -- ---- -- -- ---- -- -- ---- -- -- ---- -- -- ---- -- -- ---- -- -- ---- -- -- ---- -- -- ---- -- -- ---- -- -- ---- -- -- ---- -- -- ---- -- -- ---- -- -- ---- -- -- ---- -- -- ---- -- -- ---- -- -- ---- -- -- ---- -- -- ---- -- -- ---- -- -- ---- -- -- --
Optional User Input1-hr Precipitation
Volume (ft^3)
Volume (ac-ft)
Area (acre)
DETENTION BASIN STAGE-STORAGE TABLE BUILDER
Optional Override
Area (ft^2)Length
(ft)
Optional Override Stage (ft)
Stage(ft)
Stage - StorageDescription
Area (ft^2)
Width (ft)
East Creek
Pond C
Example Zone Configuration (Retention Pond)

Pond C - UD-Detention_v3 05.xlsm, Basin 10/28/2016, 10:43 AM
1 User Defined Stage-Area Boolean for Message
1 Equal Stage-Area Inputs Watershed L:W
1 CountA
0 Calc_S_TC
(0.83) H_FLOOR
L_FLOOR_OTHER
0.00 ISV 0.00 ISV
0.00 Floor 0.00 Floor
1.99 Zone 1 (WQCV) 1.99 Zone 1 (WQCV)
2.99 Zone 2 (EURV) 2.99 Zone 2 (EURV)
4.87 Zone 3 (100-yea 4.87 Zone 3 (100-year)
DETENTION BASIN STAGE-STORAGE TABLE BUILDER
0.000
0.220
0.440
0.660
0.880
0.000
0.205
0.410
0.615
0.820
0.00 2.50 5.00 7.50 10.00Vo
lum
e (a
c-ft
)
Area
(acr
es)
Stage (ft.)
Area (acres) Volume (ac-ft)
0
100
200
300
400
0
5
10
15
20
0.00 2.50 5.00 7.50 10.00
Area
(sq.
ft.)
Leng
th, W
idth
(ft.)
Stage (ft)
Length (ft) Width (ft) Area (sq.ft.)

Project: Basin ID:
Stage (ft) Zone Volume (ac-ft) Outlet Type
Zone 1 (WQCV) 1.99 0.214 Orifice Plate
Zone 2 (EURV) 2.99 0.303 Orifice Plate
Zone 3 (100-year) 4.87 0.773 Weir&Pipe (Restrict)
1.291 TotalUser Input: Orifice at Underdrain Outlet (typically used to drain WQCV in a Filtration BMP) Calculated Parameters for Underdrain
Underdrain Orifice Invert Depth = N/A ft (distance below the filtration media surface) Underdrain Orifice Area = N/A ft2
Underdrain Orifice Diameter = N/A inches Underdrain Orifice Centroid = N/A feet
User Input: Orifice Plate with one or more orifices or Elliptical Slot Weir (typically used to drain WQCV and/or EURV in a sedimentation BMP) Calculated Parameters for PlateInvert of Lowest Orifice = 0.00 ft (relative to basin bottom at Stage = 0 ft) WQ Orifice Area per Row = 9.514E-03 ft2
Depth at top of Zone using Orifice Plate = 3.36 ft (relative to basin bottom at Stage = 0 ft) Elliptical Half-Width = N/A feetOrifice Plate: Orifice Vertical Spacing = 13.40 inches Elliptical Slot Centroid = N/A feet
Orifice Plate: Orifice Area per Row = 1.37 sq. inches (diameter = 1-5/16 inches) Elliptical Slot Area = N/A ft2
User Input: Stage and Total Area of Each Orifice Row (numbered from lowest to highest)Row 1 (required) Row 2 (optional) Row 3 (optional) Row 4 (optional) Row 5 (optional) Row 6 (optional) Row 7 (optional) Row 8 (optional)
Stage of Orifice Centroid (ft) 0.00 1.12 2.24Orifice Area (sq. inches) 1.37 1.37 1.37
Row 9 (optional) Row 10 (optional) Row 11 (optional) Row 12 (optional) Row 13 (optional) Row 14 (optional) Row 15 (optional) Row 16 (optional)Stage of Orifice Centroid (ft)
Orifice Area (sq. inches)
User Input: Vertical Orifice (Circular or Rectangular) Calculated Parameters for Vertical OrificeNot Selected Not Selected Not Selected Not Selected
Invert of Vertical Orifice = N/A N/A ft (relative to basin bottom at Stage = 0 ft) Vertical Orifice Area = N/A N/A ft2
Depth at top of Zone using Vertical Orifice = N/A N/A ft (relative to basin bottom at Stage = 0 ft) Vertical Orifice Centroid = N/A N/A feetVertical Orifice Diameter = N/A N/A inches
User Input: Overflow Weir (Dropbox) and Grate (Flat or Sloped) Calculated Parameters for Overflow WeirZone 3 Weir Not Selected Zone 3 Weir Not Selected
Overflow Weir Front Edge Height, Ho = 4.07 N/A ft (relative to basin bottom at Stage = 0 ft) Height of Grate Upper Edge, Ht = 5.92 N/A feetOverflow Weir Front Edge Length = 7.00 N/A feet Over Flow Weir Slope Length = 7.63 N/A feet
Overflow Weir Slope = 4.00 N/A H:V (enter zero for flat grate) Grate Open Area / 100-yr Orifice Area = 17.68 N/A should be > 4Horiz. Length of Weir Sides = 7.40 N/A feet Overflow Grate Open Area w/o Debris = 37.38 N/A ft2
Overflow Grate Open Area % = 70% N/A %, grate open area/total area Overflow Grate Open Area w/ Debris = 18.69 N/A ft2
Debris Clogging % = 50% N/A %
User Input: Outlet Pipe w/ Flow Restriction Plate (Circular Orifice, Restrictor Plate, or Rectangular Orifice) Calculated Parameters for Outlet Pipe w/ Flow Restriction PlateZone 3 Restrictor Not Selected Zone 3 Restrictor Not Selected
Depth to Invert of Outlet Pipe = 0.00 N/A ft (distance below basin bottom at Stage = 0 ft) Outlet Orifice Area = 2.11 N/A ft2
Outlet Pipe Diameter = 24.00 N/A inches Outlet Orifice Centroid = 0.72 N/A feetRestrictor Plate Height Above Pipe Invert = 15.30 inches Half-Central Angle of Restrictor Plate on Pipe = 1.85 N/A radians
User Input: Emergency Spillway (Rectangular or Trapezoidal) Calculated Parameters for SpillwaySpillway Invert Stage= 999.00 ft (relative to basin bottom at Stage = 0 ft) Spillway Design Flow Depth= 0.46 feet
Spillway Crest Length = 64.00 feet Stage at Top of Freeboard = 1000.46 feetSpillway End Slopes = 4.00 H:V Basin Area at Top of Freeboard = 0.61 acres
Freeboard above Max Water Surface = 1.00 feet
Routed Hydrograph ResultsDesign Storm Return Period = WQCV EURV 2 Year 5 Year 10 Year 25 Year 50 Year 100 Year 500 YearOne-Hour Rainfall Depth (in) = 0.53 1.07 0.95 1.35 1.61 2.03 2.32 2.66 3.33
Calculated Runoff Volume (acre-ft) = 0.214 0.517 0.407 0.806 1.117 1.679 2.038 2.521 3.418OPTIONAL Override Runoff Volume (acre-ft) =
Inflow Hydrograph Volume (acre-ft) = 0.214 0.518 0.407 0.806 1.118 1.681 2.039 2.523 3.421Predevelopment Unit Peak Flow, q (cfs/acre) = 0.00 0.00 0.02 0.32 0.54 1.02 1.29 1.61 2.24
Predevelopment Peak Q (cfs) = 0.0 0.0 0.2 4.7 8.0 15.0 18.9 23.7 32.9Peak Inflow Q (cfs) = 5.3 12.7 10.0 19.8 27.4 41.1 49.8 61.8 84.1
Peak Outflow Q (cfs) = 0.1 0.2 0.2 0.2 1.4 9.9 16.2 22.0 24.3Ratio Peak Outflow to Predevelopment Q = N/A N/A N/A 0.0 0.2 0.7 0.9 0.9 0.7
Structure Controlling Flow = Plate Plate Plate Plate Overflow Grate 1 Overflow Grate 1 Overflow Grate 1 Outlet Plate 1 Outlet Plate 1Max Velocity through Grate 1 (fps) = N/A N/A N/A N/A 0.0 0.3 0.4 0.6 0.6Max Velocity through Grate 2 (fps) = N/A N/A N/A N/A N/A N/A N/A N/A N/A
Time to Drain 97% of Inflow Volume (hours) = 38 60 54 75 82 78 76 73 69Time to Drain 99% of Inflow Volume (hours) = 40 64 57 80 89 88 87 85 83
Maximum Ponding Depth (ft) = 1.93 2.92 2.59 3.68 4.27 4.80 5.04 5.38 6.40Area at Maximum Ponding Depth (acres) = 0.25 0.34 0.31 0.40 0.43 0.46 0.47 0.49 0.56
Maximum Volume Stored (acre-ft) = 0.198 0.492 0.387 0.774 1.019 1.261 1.368 1.537 2.072
Detention Basin Outlet Structure Design
EastcreekPond C
Example Zone Configuration (Retention Pond)

COUNTA for Basin Tab = 1 Ao Dia WQ Plate Type Vert Orifice 1 Vert Orifice 2Count_Underdrain = 0 0.11 meter = 3/8 inch) 2 1 1
Count_WQPlate = 1 0.14 eter = 7/16 inch)
Count_VertOrifice1 = 0 0.18 meter = 1/2 inch) Outlet Plate 1 Outlet Plate 2 Drain Time Message Boolean
Count_VertOrifice2 = 0 0.24 eter = 9/16 inch) 4 1 5yr, <72hr 1 1
Count_Weir1 = 1 0.29 meter = 5/8 inch) >5yr, <120hr 0
Count_Weir2 = 0 0.36 er = 11/16 inch) Max Depth Row
Count_OutletPipe1 = 1 0.42 meter = 3/4 inch) WQCV 193 Watershed Constraint CheckCount_OutletPipe2 = 0 0.50 er = 13/16 inch) 2 Year 260 Slope 0.020
COUNTA_2 (Standard FSD Setup)= 1 0.58 meter = 7/8 inch) EURV 293 Shape 2.00MaxPondDepth_Error? FALSE 0.67 er = 15/16 inch) 5 Year 369
Hidden Parameters & Calculations 0.76 ameter = 1 inch) 10 Year 428 Spillway Depth
0.86 = 1-1/16 inches) 25 Year 481 0.46WQ Plate Flow at 100yr depth = 0.28 0.97 = 1-1/8 inches) 50 Year 505
CLOG #1= 35% 1.08 = 1-3/16 inches) 100 Year 539 1 Z1_BooleanCdw #1 = 0.89 1.20 = 1-1/4 inches) 500 Year 641 1 Z2_BooleanCdo #1 = 0.69 1.32 = 1-5/16 inches) Zone3_Pulldown Message 1 Z3_Boolean
Overflow Weir #1 Angle = 0.245 1.45 = 1-3/8 inches) 1 Opening MessageCLOG #2= #VALUE! 1.59 = 1-7/16 inches) Draintime Running
Cdw #2 = #VALUE! 1.73 = 1-1/2 inches) Outlet Boolean Outlet Rank Total (1 to 4)Cdo #2 = #VALUE! 1.88 = 1-9/16 inches) Vertical Orifice 1 0 0 1
Overflow Weir #2 Angle = #VALUE! 2.03 = 1-5/8 inches) Vertical Orifice 2 0 0 Boolean
Underdrain Q at 100yr depth = 0.00 2.20 1-11/16 inches) Overflow Weir 1 1 1 1 Max Depth
VertOrifice1 Q at 100yr depth = 0.00 2.36 = 1-3/4 inches) Overflow Weir 2 0 0 1 500yr Depth
VertOrifice2 Q at 100yr depth = 0.00 2.54 1-13/16 inches) Outlet Pipe 1 1 1 1 Freeboard
EURV_draintime_user = 2.72 = 1-7/8 inches) Outlet Pipe 2 0 0 1 Spillway
Count_User_Hydrographs 0 2.90 1-15/16 inches) 0 Spillway LengthCountA_3 (EURV & 100yr) = 1 3.09 eter = 2 inches) Button Visibility Boolean FALSE Time Interval
CountA_4 (100yr Only) = 1 3.29 gular openings) 1 Button_Trigger0 Underdrain1 WQCV Plate0 EURV-WQCV Plate0 EURV-WQCV VertOrifice1 Outlet 90% Qpeak0 Outlet Undetained
S-A-V-D Chart Axis Override X-axis Left Y-Axis Right Y-Axisminimum bound
maximum bound
Detention Basin Outlet Structure Design
0
10
20
30
40
50
60
70
80
90
0.1 1 10
FLO
W [c
fs]
TIME [hr]
500YR IN
500YR OUT
100YR IN
100YR OUT
50YR IN
50YR OUT
25YR IN
25YR OUT
10YR IN
10YR OUT
5YR IN
5YR OUT
2YR IN
2YR OUT
EURV IN
EURV OUT
WQCV IN
WQCV OUT
0
1
2
3
4
5
6
7
0.1 1 10 100
PON
DIN
G D
EPTH
[ft]
DRAIN TIME [hr]
500YR
100YR
50YR
25YR
10YR
5YR
2YR
EURV
WQCV
0.00
5.00
10.00
15.00
20.00
25.00
30.00
0
20,000
40,000
60,000
80,000
100,000
120,000
0.00 1.00 2.00 3.00 4.00 5.00 6.00 7.00 8.00
OU
TFLO
W [c
fs]
AREA
[ft^
2], V
OLU
ME
[ft^
3]
PONDING DEPTH [ft]
User Area [ft^2]
Interpolated Area [ft^2]
Summary Area [ft^2]
Volume [ft^3]
Summary Volume [ft^3]
Outflow [cfs]
Summary Outflow [cfs]

Outflow Hydrograph Workbook Filename:
Storm Inflow HydrographsThe user can override the calculated inflow hydrographs from this workbook with inflow hydrographs developed in a separate program.
SOURCE WORKBOOK WORKBOOK WORKBOOK WORKBOOK WORKBOOK WORKBOOK WORKBOOK WORKBOOK WORKBOOK
Time Interval TIME WQCV [cfs] EURV [cfs] 2 Year [cfs] 5 Year [cfs] 10 Year [cfs] 25 Year [cfs] 50 Year [cfs] 100 Year [cfs] 500 Year [cfs]
4.53 min 0:00:00 0.00 0.00 0.00 0.00 0.00 0.00 0.00 0.00 0.00
0:04:32 0.01 0.02 0.02 0.03 0.05 0.07 0.08 0.09 0.12
Hydrograph 0:09:04 0.30 0.70 0.56 1.05 1.40 2.01 2.37 2.83 3.61Constant 0:13:35 0.72 1.70 1.35 2.58 3.51 5.14 6.14 7.47 9.86
1.105 0:18:07 2.00 4.69 3.73 7.12 9.66 14.08 16.80 20.35 26.660:22:39 5.02 11.79 9.37 17.95 24.40 35.64 42.56 51.67 67.920:27:11 5.27 12.74 10.00 19.79 27.40 41.11 49.83 61.80 84.13
0:31:43 4.42 10.79 8.45 16.90 23.55 35.68 43.46 54.08 73.970:36:14 3.53 8.68 6.79 13.65 19.08 29.03 35.44 44.13 60.41
0:40:46 2.84 6.96 5.45 10.95 15.29 23.24 28.36 35.28 48.250:45:18 2.22 5.46 4.27 8.61 12.04 18.34 22.40 27.90 38.210:49:50 1.75 4.33 3.39 6.82 9.55 14.53 17.74 22.08 30.190:54:22 1.46 3.59 2.81 5.62 7.83 11.85 14.42 17.90 24.380:58:53 1.03 2.56 2.00 4.04 5.67 8.66 10.59 13.24 18.231:03:25 0.78 1.92 1.50 3.03 4.24 6.46 7.89 9.82 13.431:07:57 0.53 1.33 1.04 2.11 2.96 4.54 5.56 6.95 9.581:12:29 0.39 0.97 0.76 1.53 2.14 3.27 3.99 4.97 6.801:17:01 0.30 0.75 0.59 1.19 1.66 2.53 3.09 3.84 5.261:21:32 0.25 0.62 0.49 0.98 1.36 2.06 2.51 3.12 4.251:26:04 0.23 0.55 0.44 0.87 1.20 1.81 2.20 2.73 3.711:30:36 0.22 0.53 0.42 0.83 1.15 1.73 2.10 2.60 3.531:35:08 0.22 0.52 0.41 0.81 1.13 1.69 2.05 2.54 3.451:39:40 0.22 0.52 0.41 0.81 1.13 1.69 2.05 2.54 3.45
1:44:11 0.22 0.52 0.41 0.81 1.13 1.69 2.05 2.54 3.451:48:43 0.13 0.33 0.26 0.52 0.74 1.14 1.40 1.77 2.461:53:15 0.08 0.19 0.15 0.31 0.43 0.67 0.83 1.04 1.431:57:47 0.04 0.11 0.08 0.17 0.25 0.38 0.47 0.60 0.832:02:19 0.02 0.06 0.05 0.09 0.13 0.21 0.26 0.32 0.452:06:50 0.01 0.03 0.02 0.05 0.06 0.10 0.13 0.16 0.222:11:22 0.00 0.01 0.01 0.01 0.02 0.03 0.04 0.05 0.07
2:15:54 0.00 0.00 0.00 0.00 0.00 0.00 0.00 0.00 0.002:20:26 0.00 0.00 0.00 0.00 0.00 0.00 0.00 0.00 0.002:24:58 0.00 0.00 0.00 0.00 0.00 0.00 0.00 0.00 0.002:29:29 0.00 0.00 0.00 0.00 0.00 0.00 0.00 0.00 0.002:34:01 0.00 0.00 0.00 0.00 0.00 0.00 0.00 0.00 0.002:38:33 0.00 0.00 0.00 0.00 0.00 0.00 0.00 0.00 0.002:43:05 0.00 0.00 0.00 0.00 0.00 0.00 0.00 0.00 0.002:47:37 0.00 0.00 0.00 0.00 0.00 0.00 0.00 0.00 0.002:52:08 0.00 0.00 0.00 0.00 0.00 0.00 0.00 0.00 0.002:56:40 0.00 0.00 0.00 0.00 0.00 0.00 0.00 0.00 0.003:01:12 0.00 0.00 0.00 0.00 0.00 0.00 0.00 0.00 0.003:05:44 0.00 0.00 0.00 0.00 0.00 0.00 0.00 0.00 0.003:10:16 0.00 0.00 0.00 0.00 0.00 0.00 0.00 0.00 0.003:14:47 0.00 0.00 0.00 0.00 0.00 0.00 0.00 0.00 0.003:19:19 0.00 0.00 0.00 0.00 0.00 0.00 0.00 0.00 0.003:23:51 0.00 0.00 0.00 0.00 0.00 0.00 0.00 0.00 0.003:28:23 0.00 0.00 0.00 0.00 0.00 0.00 0.00 0.00 0.003:32:55 0.00 0.00 0.00 0.00 0.00 0.00 0.00 0.00 0.003:37:26 0.00 0.00 0.00 0.00 0.00 0.00 0.00 0.00 0.003:41:58 0.00 0.00 0.00 0.00 0.00 0.00 0.00 0.00 0.003:46:30 0.00 0.00 0.00 0.00 0.00 0.00 0.00 0.00 0.00
3:51:02 0.00 0.00 0.00 0.00 0.00 0.00 0.00 0.00 0.00
3:55:34 0.00 0.00 0.00 0.00 0.00 0.00 0.00 0.00 0.004:00:05 0.00 0.00 0.00 0.00 0.00 0.00 0.00 0.00 0.004:04:37 0.00 0.00 0.00 0.00 0.00 0.00 0.00 0.00 0.004:09:09 0.00 0.00 0.00 0.00 0.00 0.00 0.00 0.00 0.004:13:41 0.00 0.00 0.00 0.00 0.00 0.00 0.00 0.00 0.004:18:13 0.00 0.00 0.00 0.00 0.00 0.00 0.00 0.00 0.004:22:44 0.00 0.00 0.00 0.00 0.00 0.00 0.00 0.00 0.004:27:16 0.00 0.00 0.00 0.00 0.00 0.00 0.00 0.00 0.004:31:48 0.00 0.00 0.00 0.00 0.00 0.00 0.00 0.00 0.004:36:20 0.00 0.00 0.00 0.00 0.00 0.00 0.00 0.00 0.004:40:52 0.00 0.00 0.00 0.00 0.00 0.00 0.00 0.00 0.004:45:23 0.00 0.00 0.00 0.00 0.00 0.00 0.00 0.00 0.004:49:55 0.00 0.00 0.00 0.00 0.00 0.00 0.00 0.00 0.004:54:27 0.00 0.00 0.00 0.00 0.00 0.00 0.00 0.00 0.00
4:58:59 0.00 0.00 0.00 0.00 0.00 0.00 0.00 0.00 0.005:03:31 0.00 0.00 0.00 0.00 0.00 0.00 0.00 0.00 0.005:08:02 0.00 0.00 0.00 0.00 0.00 0.00 0.00 0.00 0.005:12:34 0.00 0.00 0.00 0.00 0.00 0.00 0.00 0.00 0.00
5:17:06 0.00 0.00 0.00 0.00 0.00 0.00 0.00 0.00 0.005:21:38 0.00 0.00 0.00 0.00 0.00 0.00 0.00 0.00 0.005:26:10 0.00 0.00 0.00 0.00 0.00 0.00 0.00 0.00 0.00
Detention Basin Outlet Structure Design

t 303.561.3333 | f 303.561.3339 | 45 West 2nd Avenue, Denver, Colorado 80223 | www.waremalcomb.com
APPENDIX D - Maps Developed Basin Map Historic Basin Map

