preliminary drainage report - city of thornton … · i hereby certify that this report (plan) for...
TRANSCRIPT

FINAL DRAINAGE REPORT CORNERSTONE RIVER VALLEY VILLAGE FILING NO. 1
CITY OF THORNTON, COUNTY OF ADAMS, STATE OF COLORADO
PREPARED FOR:
Thornton Cornerstone LLC 558 Castle Pines Parkway
Suite B4-321 Castle Pines, CO 80108
Ph: 720-341-6358 Attn: Joseph H. Quinn
PREPARED BY:
Contact: David R. Addor, P.E.
ORIGINAL DATE PREPARED: April 26, 2016 REVISED:
TABLE OF CONTENTS
Page No.
1. General Location and Description….…………………………………………………… 3 2. Drainage Basins & Sub-Basins…………………………………………………………. 3-4 3. Drainage Design Criteria…..……………………………………………………………. 4-5 4. Drainage Facility Design ……………………………………………………………….. 5-6 5. Conclusions……………………………………………………………………………….. 6 6. List of References………………………………………………………………………... 6
Appendix: 7
Basin and Runoff Calculations 9 (19 sheets) Storm Sewer Calculations 29 (13 sheets) Backup Information 43 (6 sheets) (Firmette, Soils Information)
Cornerstone River Valley Village - 2 - Engineering Service Company
Thornton Cornerstone LLC herby certifies that the drainage facilities for Cornerstone River Valley Village Filing No. 1 will be constructed according to the design presented in this report. I understand that the City of Thornton does not and shall not assume liability for the drainage facilities designed and/or certified by my engineer. I understand that the City of Thornton reviews drainage plans but cannot, on behalf of Thornton Cornerstone LLC, guarantee that final drainage design review will absolve Thornton Cornerstone LLC and/or their successors and/or assigns of future liability for improper design. I further understand that approval of the Plat and/o Development Permit does not imply approval of my engineer’s drainage design. Attest: Name of Responsible Party ________________________________ _________________________ ________________________________ Notary Public Authorized Signature I hereby certify that this report (plan) for the final drainage design of Cornerstone River Valley Village Filing No. 1 was prepared by me (or under my direct supervision) in accordance with the provisions of the City of Thornton Standards and Specifications for the Design and Construction of Public and Private Improvements for the Responsible Parties thereof. I understand that the City of Thornton does not and shall not assume liability for drainage facilities designed by others. _____________________________________ Registered Professional Engineer State of Colorado No. ___________________
Cornerstone River Valley Village - 3 - Engineering Service Company
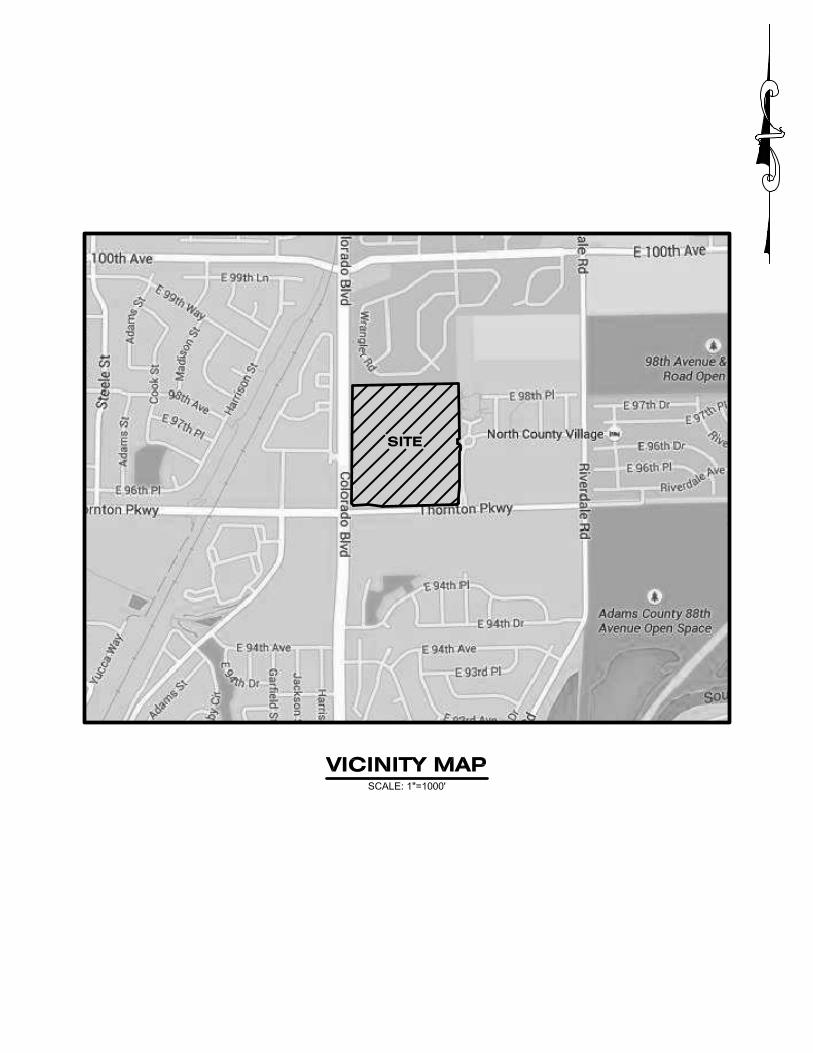
1. General Location and Description a. Location This property is located in the SW ¼ of Section 18, T. 2 S.,
R. 67 W. of the 6th P.M. It is located on the northeast corner of Colorado Boulevard and Thornton Parkway to the west of Clermont Street. The Colorado Agricultural Ditch runs along the western edge of the property.
This site is bounded on the west by The Reserve at
Thornton on the west side of Colorado Boulevard and Cherrylane Subdivision to the south on the south side of Thornton Parkway. To the north and east are undeveloped portions of River Valley Village Subdivision.
b. Description of Property This first filing for Cornerstone River Valley Village will
subdivide the south 14.23 acres of the western portion of the River Valley Village Subdivision. Tract D containing 18.22 acres will be subject to future platting for additional residential development.
The property is sparsely covered with native grasses.
Grades are generally to the south and east at slopes between 1 and 3 percent. Thornton Parkway is elevated from 2 to 10 feet above this site along the south boundary. Soils are generally Ulm Loams which is a hydrologic group C soil. Other soils within this western portion of River Valley Village Subdivision are Samsil Shingle Complex located generally on the northwest quadrant of 32.45 acres. This is a hydrologic group D soil.
The proposal for this first phase is to subdivide this portion of
the property into 79 single family residential lots.
2. Drainage Basins and Sub-basins
a. Major Basin Description
This site lies outside of the100-year floodplain. It appears on two FIRMs as provided by FEMA, Map Number 08001C0602H and 08001C0606H, both dated March 5, 2007.
Cornerstone River Valley Village - 4 - Engineering Service Company
This site falls within the Basin 4100 and Direct Flow Area 0056 Outfall System Planning Study prepared for the City of Thornton and Adams County by Kiowa Engineering, March 2001. Reach 5602-2 lies along the alignment for Thornton Parkway. It is not the existing flow path for any existing runoff. Local storm sewer is identified to control drainage.
b. Sub-Basin Description
This site is part of the River Valley Village Subdivision – Amendment No. 1. That plat was the subject of a Final Drainage Report prepared by Manhard Consulting as approved by the City of Thornton on May 23, 2002. It has since been the subject of a Preliminary Drainage Report prepared by VLC, LLC that revised the original Manhard report to change the uses on the 32.45 acres that lie within Cornerstone River Valley Village Filing No. 1. This report rationalizes the basins in the southern 15.20 acres to align with the proposal street and storm sewer layout.
3. Drainage Design Criteria
a. Regulations
The key variation from the City of Thornton Standards is the use of the Rational Method for runoff calculations. This was done due to the relatively small sizes of the various sub-basins created by the storm sewer system.
b. Development Criteria Reference and Constraints
As stated above, this property was the subject of a previous final drainage report by Manhard Consulting. That report set in place the existing detention facility for the overall River Valley Village complex. The discharge from this site will be to the existing storm sewer system that directs the flows to this pond.
c. Hydrological Criteria
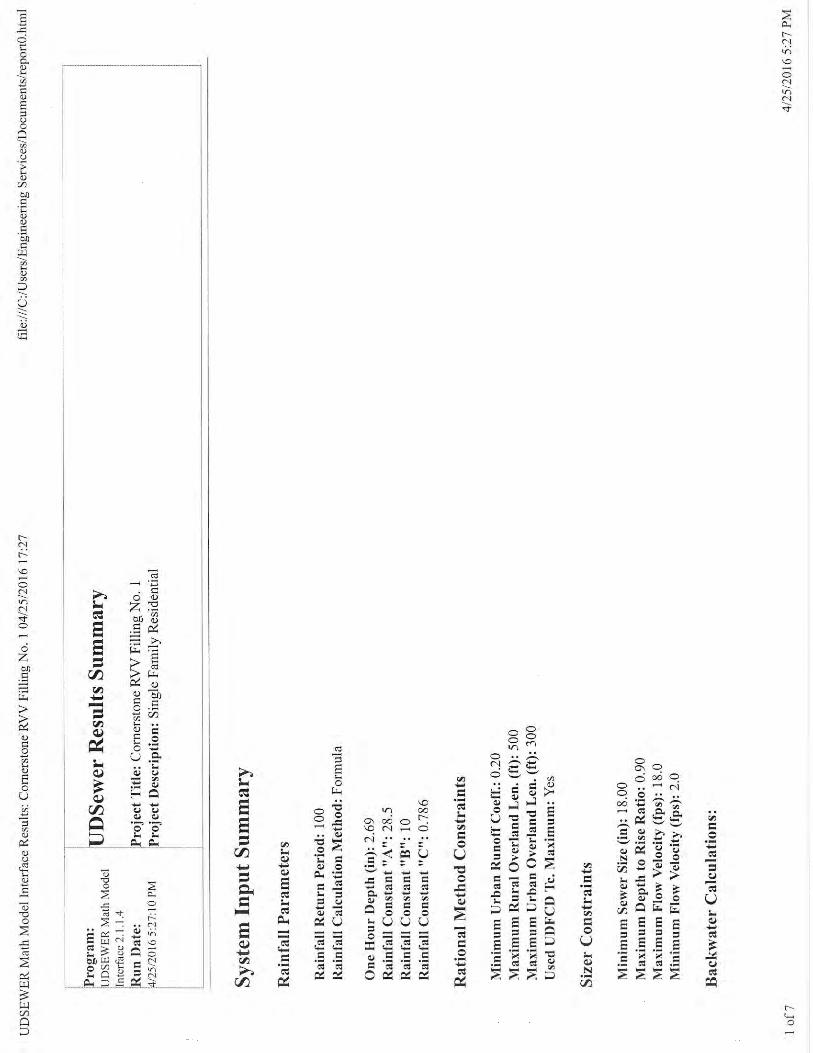
The design rainfall is taken from the City of Thornton Standards and Specifications. The five year one-hour rainfall is 1.38 inches and the 100-year one-hour rainfall is 2.69 inches.
Cornerstone River Valley Village - 5 - Engineering Service Company
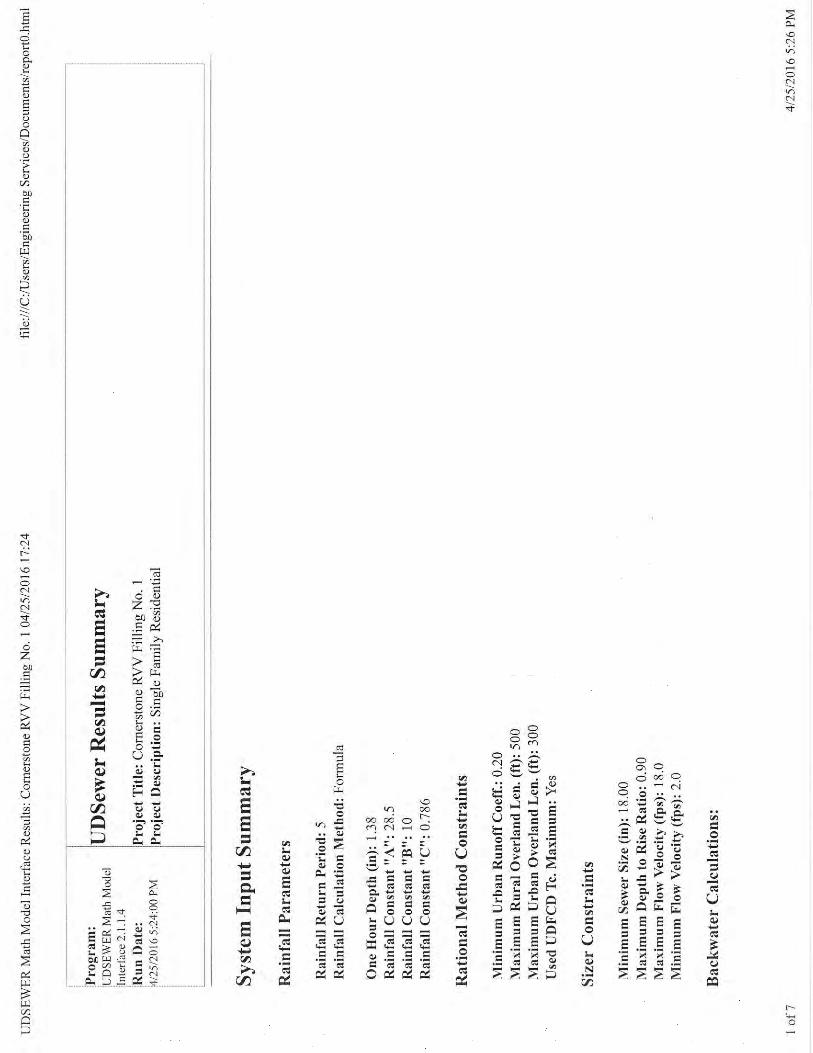
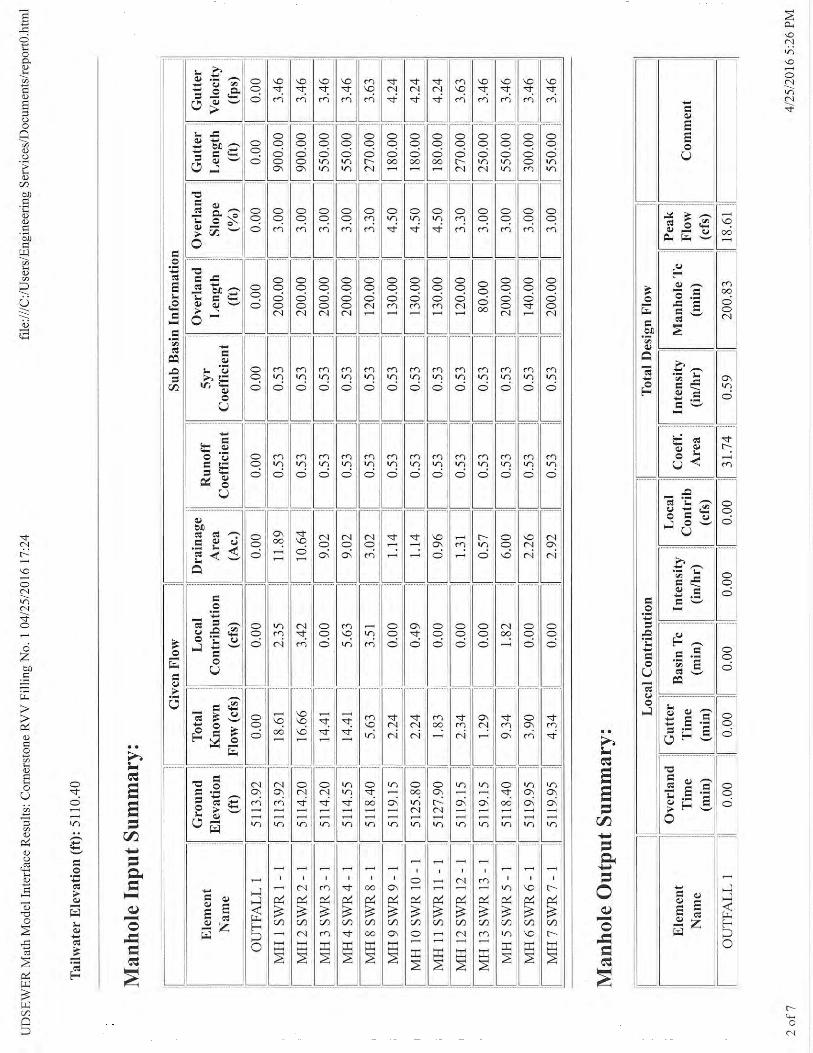
Runoff calculations were done using the Rational Method. The rainfall intensities were generated using the UDFCD formula applying the one-hour rainfall for the 5-year and 100-year storms.
d. Hydraulic Criteria
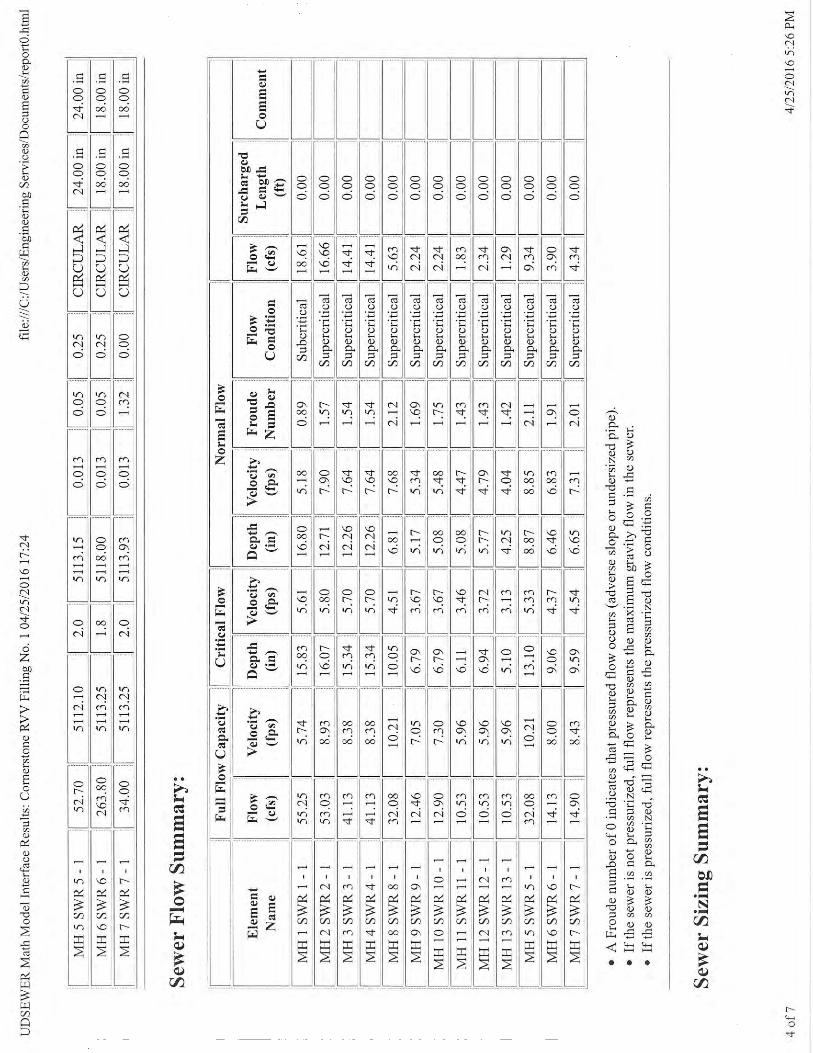
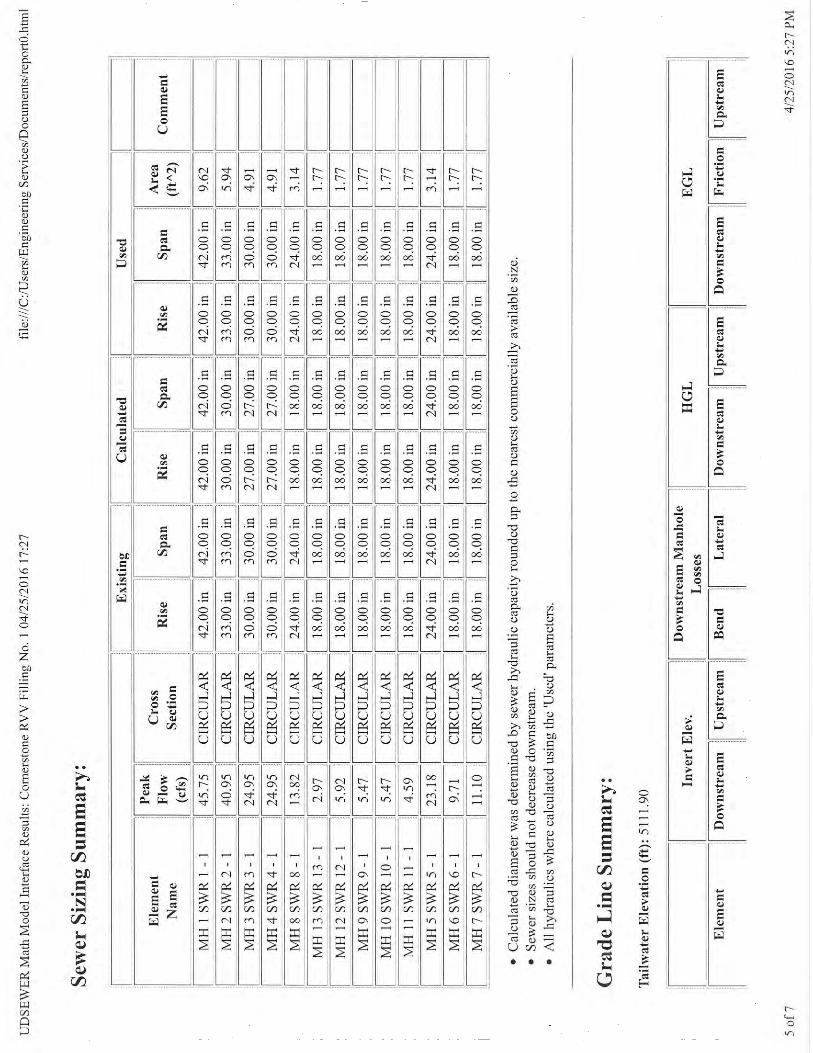
Water surface profiles were calculated for the storm sewer system using the UDFCD NeoUDSewer program. Streets and inlets will be evaluated using UDFCD UD-Inlet.
4. Drainage Facility Design a. General Concept
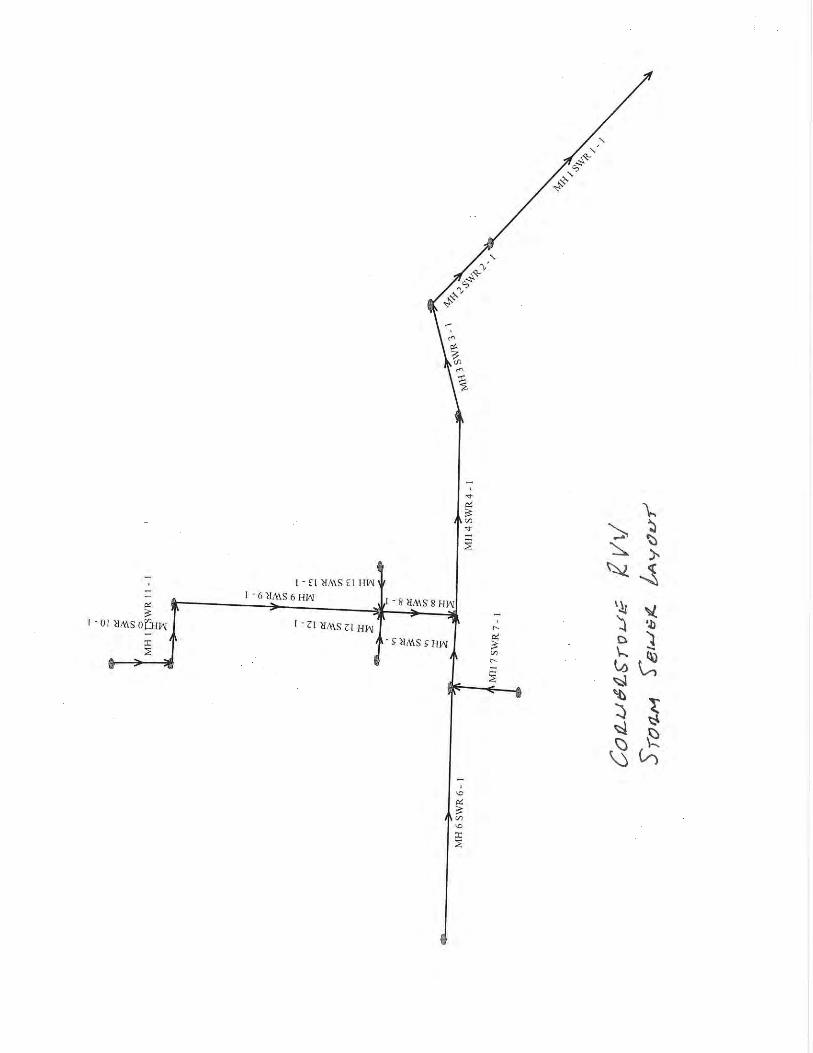
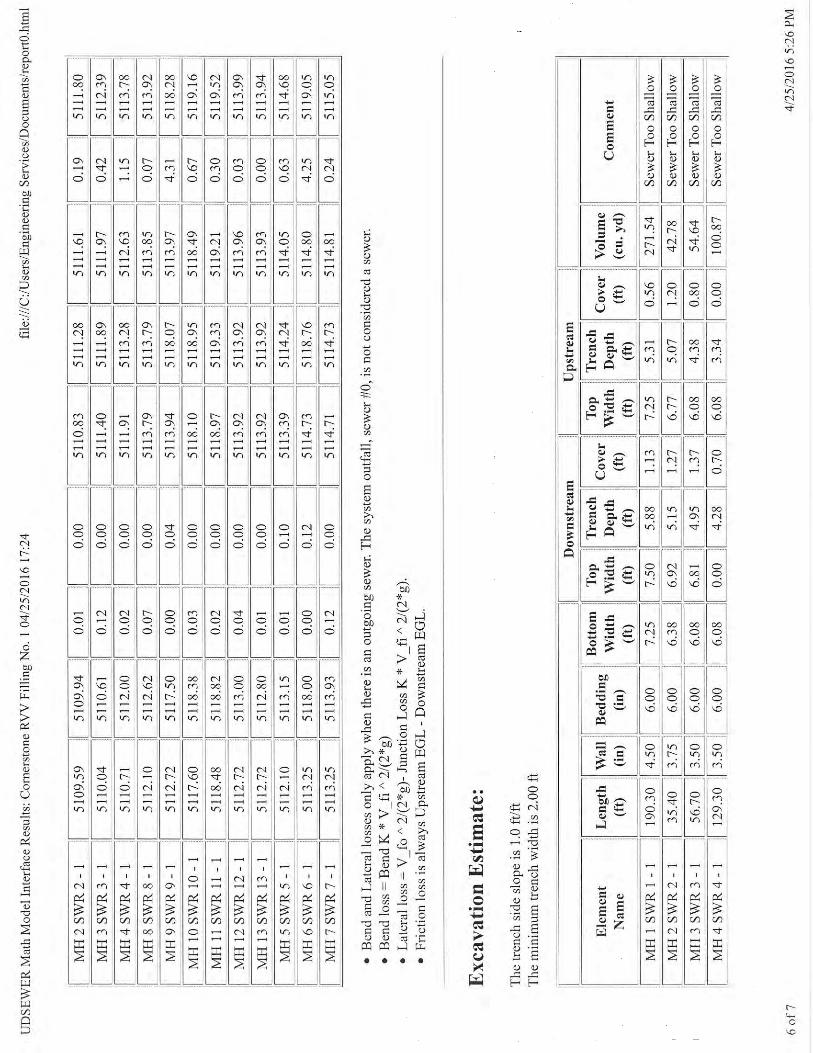
The drainage pattern for this site will be the simple collection of runoff in the proposed street system and directed to the storm sewer system for delivery to the existing detention pond. There is little offsite drainage that impacts this first filing. Minor flows may collect along the northern boundary and will be directed to the existing storm system in Clermont Street. The project site has been divided into thirteen (13) sub-basins with one off-site basin. See the Drainage Plan. All of the basins are similar and were developed to show discharge to the proposed storm sewer system. The outfall will be into the existing 36” RCP storm sewer at the intersection of Thornton Parkway and Clermont Street.
b. Specific Details There were no specific drainage problems encountered. The off-site basin is the existing Basin identified as CPA:1 on the VLC plan or 14C on the Manhard Plan. This basin consists of the right-of-way for Colorado Boulevard and Thornton Parkway adjacent to this site. No new calculations are included for this basin as it does not impact the proposed subdivision. Detention will be provided in the existing pond located at the northwest corner of Thornton Parkway and Riverdale Road.

Cornerstone River Valley Village - 6 - Engineering Service Company
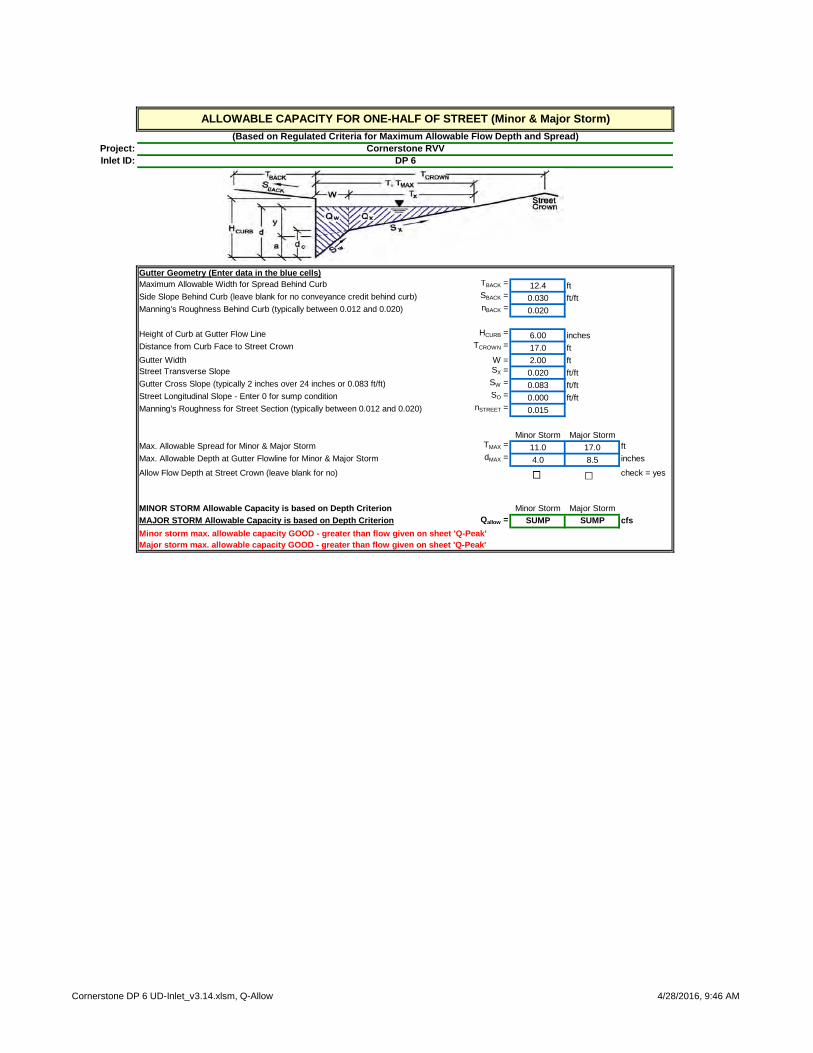
Inlet calculations are included for key locations. Design Point 1 has the maximum flow and the calculations show that it requires a 10 foot Type R inlet. Design Point 6 has the high median flow and was calculated as the maximum for a 5 foot Type R inlet. All inlets that receive more flow are sized as 10 foot.
5. Conclusions
a. Compliance with Standards
The drainage for this site complies with all City of Thornton Standards and Specifications and with the Urban Drainage Flood Control District Criteria Manual.
b. Drainage Concept
The drainage design will control the runoff as anticipated in the previous reports and direct it to the existing detention facility.
F. LIST OF REFERENCES
#1) “Standards and Specifications for the Design and Construction of Public and Private Improvements”, City of Thornton, Colorado. October 2012.
#2) “Urban Storm Drainage Criteria Manual - Volumes 1,2, and 3”,
Urban Drainage and Flood Control District, Denver, Colorado. Published June 2001, latest edition.
#3) Phase III Drainage Study for River Valley Village Subdivision,
prepared by Manhard Consulting, Ltd., May, 2002. #4) Phase I Drainage Report for Cornerstone River Valley Ranch,
prepared by Vision Land Connection, LLC, August, 2015. #5) “Soil Map – Arapahoe County, Colorado”, United States
Department of Agriculture, Natural Resources Conservation Service, Web Soil Survey 2.2.
Cornerstone River Valley Village - 7 - Engineering Service Company
APPENDIX

Cornerstone River Valley Village - 8 - Engineering Service Company
BASIN & RUNOFF CALCULATIONS
Cornerstone RVV 4/28/2016
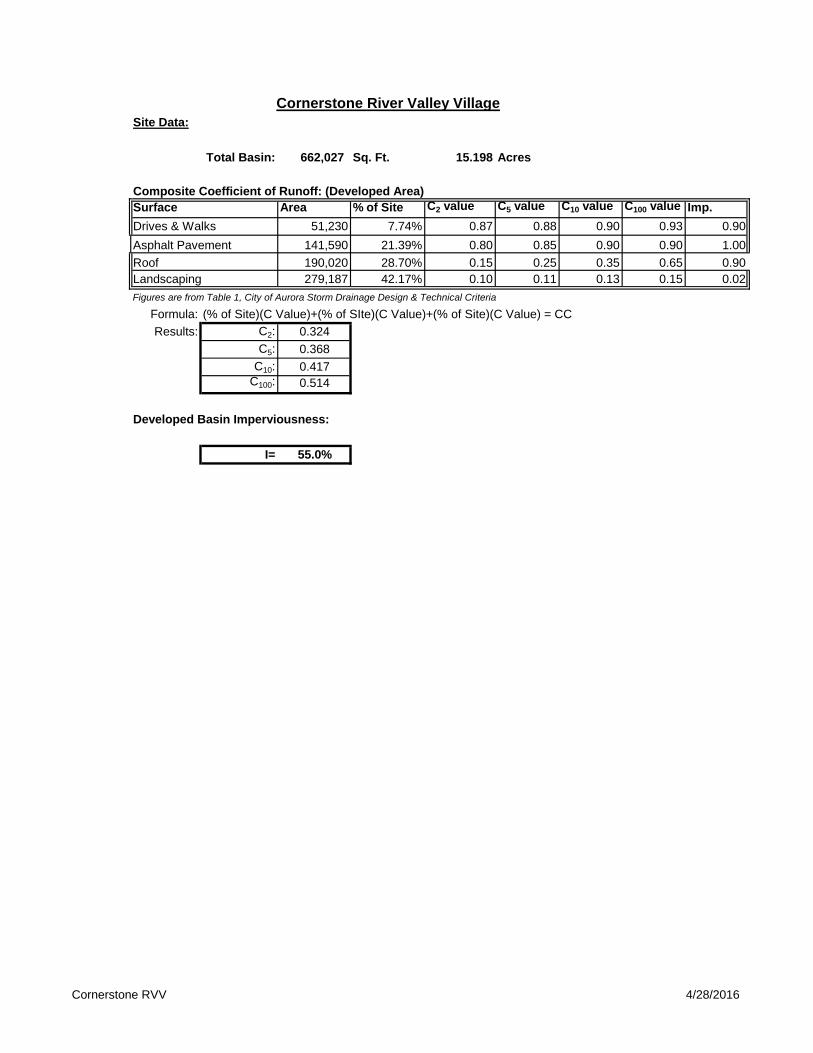
Cornerstone River Valley VillageSite Data:
Total Basin: 662,027 Sq. Ft. 15.198 Acres#REF!
Composite Coefficient of Runoff: (Developed Area)Surface Area % of Site C2 value C5 value C10 value C100 value Imp.Drives & Walks 51,230 7.74% 0.87 0.88 0.90 0.93 0.90Asphalt Pavement 141,590 21.39% 0.80 0.85 0.90 0.90 1.00Roof 190,020 28.70% 0.15 0.25 0.35 0.65 0.90Landscaping 279,187 42.17% 0.10 0.11 0.13 0.15 0.02Figures are from Table 1, City of Aurora Storm Drainage Design & Technical Criteria
Formula: (% of Site)(C Value)+(% of SIte)(C Value)+(% of Site)(C Value) = CCResults: C2: 0.324
C5: 0.368C10: 0.417
C100: 0.514
Developed Basin Imperviousness:
I= 55.0%
Cornerstone RVV 4/28/2016
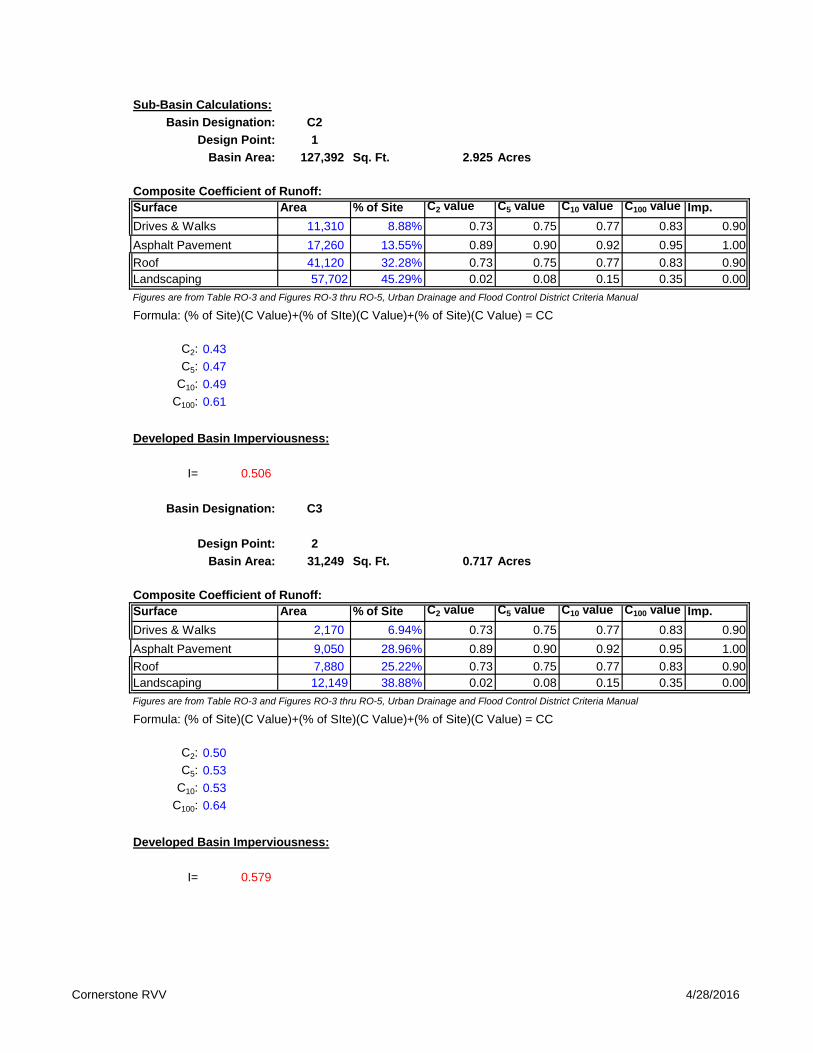
Sub-Basin Calculations:Basin Designation: C2
Design Point: 1Basin Area: 127,392 Sq. Ft. 2.925 Acres
Composite Coefficient of Runoff:Surface Area % of Site C2 value C5 value C10 value C100 value Imp.Drives & Walks 11,310 8.88% 0.73 0.75 0.77 0.83 0.90Asphalt Pavement 17,260 13.55% 0.89 0.90 0.92 0.95 1.00Roof 41,120 32.28% 0.73 0.75 0.77 0.83 0.90Landscaping 57,702 45.29% 0.02 0.08 0.15 0.35 0.00Figures are from Table RO-3 and Figures RO-3 thru RO-5, Urban Drainage and Flood Control District Criteria Manual
Formula: (% of Site)(C Value)+(% of SIte)(C Value)+(% of Site)(C Value) = CC
C2: 0.43C5: 0.47
C10: 0.49C100: 0.61
Developed Basin Imperviousness:
I= 0.506
Basin Designation: C3
Design Point: 2Basin Area: 31,249 Sq. Ft. 0.717 Acres
Composite Coefficient of Runoff:Surface Area % of Site C2 value C5 value C10 value C100 value Imp.Drives & Walks 2,170 6.94% 0.73 0.75 0.77 0.83 0.90Asphalt Pavement 9,050 28.96% 0.89 0.90 0.92 0.95 1.00Roof 7,880 25.22% 0.73 0.75 0.77 0.83 0.90Landscaping 12,149 38.88% 0.02 0.08 0.15 0.35 0.00Figures are from Table RO-3 and Figures RO-3 thru RO-5, Urban Drainage and Flood Control District Criteria Manual
Formula: (% of Site)(C Value)+(% of SIte)(C Value)+(% of Site)(C Value) = CC
C2: 0.50C5: 0.53
C10: 0.53C100: 0.64
Developed Basin Imperviousness:
I= 0.579
Cornerstone RVV 4/28/2016
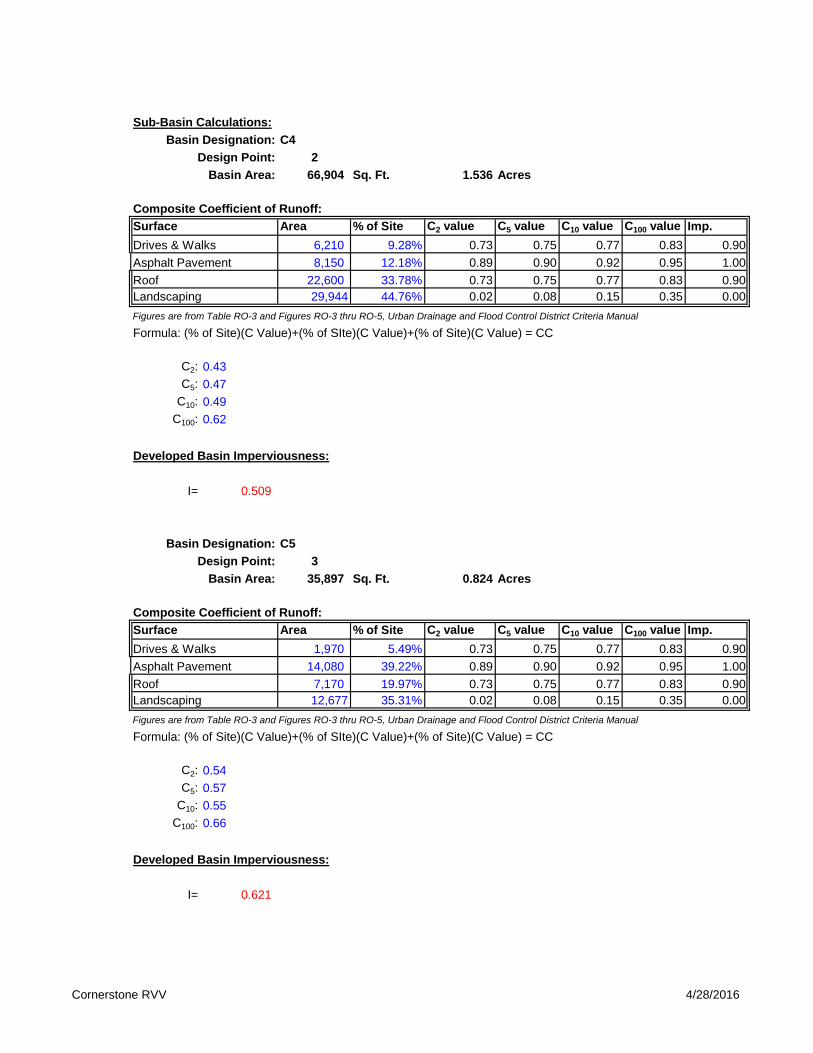
Sub-Basin Calculations:Basin Designation: C4
Design Point: 2Basin Area: 66,904 Sq. Ft. 1.536 Acres
Composite Coefficient of Runoff:Surface Area % of Site C2 value C5 value C10 value C100 value Imp.Drives & Walks 6,210 9.28% 0.73 0.75 0.77 0.83 0.90Asphalt Pavement 8,150 12.18% 0.89 0.90 0.92 0.95 1.00Roof 22,600 33.78% 0.73 0.75 0.77 0.83 0.90Landscaping 29,944 44.76% 0.02 0.08 0.15 0.35 0.00Figures are from Table RO-3 and Figures RO-3 thru RO-5, Urban Drainage and Flood Control District Criteria Manual
Formula: (% of Site)(C Value)+(% of SIte)(C Value)+(% of Site)(C Value) = CC
C2: 0.43C5: 0.47
C10: 0.49C100: 0.62
Developed Basin Imperviousness:
I= 0.509
Basin Designation: C5Design Point: 3
Basin Area: 35,897 Sq. Ft. 0.824 Acres
Composite Coefficient of Runoff:Surface Area % of Site C2 value C5 value C10 value C100 value Imp.Drives & Walks 1,970 5.49% 0.73 0.75 0.77 0.83 0.90Asphalt Pavement 14,080 39.22% 0.89 0.90 0.92 0.95 1.00Roof 7,170 19.97% 0.73 0.75 0.77 0.83 0.90Landscaping 12,677 35.31% 0.02 0.08 0.15 0.35 0.00Figures are from Table RO-3 and Figures RO-3 thru RO-5, Urban Drainage and Flood Control District Criteria Manual
Formula: (% of Site)(C Value)+(% of SIte)(C Value)+(% of Site)(C Value) = CC
C2: 0.54C5: 0.57
C10: 0.55C100: 0.66
Developed Basin Imperviousness:
I= 0.621

Cornerstone RVV 4/28/2016
Sub-Basin Calculations:Basin Designation: C6
Design Point: 4Basin Area: 41,959 Sq. Ft. 0.963 Acres
Composite Coefficient of Runoff:Surface Area % of Site C2 value C5 value C10 value C100 value Imp.Drives & Walks 3,690 8.79% 0.73 0.75 0.77 0.83 0.90Asphalt Pavement 6,590 15.71% 0.89 0.90 0.92 0.95 1.00Roof 13,420 31.98% 0.73 0.75 0.77 0.83 0.90Landscaping 18,259 43.52% 0.02 0.08 0.15 0.35 0.00Figures are from Table RO-3 and Figures RO-3 thru RO-5, Urban Drainage and Flood Control District Criteria Manual
Formula: (% of Site)(C Value)+(% of SIte)(C Value)+(% of Site)(C Value) = CC
C2: 0.45C5: 0.48
C10: 0.50C100: 0.62
Developed Basin Imperviousness:
I= 0.524
Basin Designation: C7Design Point: 5
Basin Area: 7,779 Sq. Ft. 0.179 Acres
Composite Coefficient of Runoff:Surface Area % of Site C2 value C5 value C10 value C100 value Imp.Drives & Walks - 0.00% 0.73 0.75 0.77 0.83 0.90Asphalt Pavement 4,780 61.45% 0.89 0.90 0.92 0.95 1.00Roof - 0.00% 0.73 0.75 0.77 0.83 0.90Landscaping 2,999 38.55% 0.02 0.08 0.15 0.35 0.00Figures are from Table RO-3 and Figures RO-3 thru RO-5, Urban Drainage and Flood Control District Criteria Manual
Formula: (% of Site)(C Value)+(% of SIte)(C Value)+(% of Site)(C Value) = CC
C2: 0.55C5: 0.58
C10: 0.53C100: 0.64
Developed Basin Imperviousness:
I= 0.614
Cornerstone RVV 4/28/2016
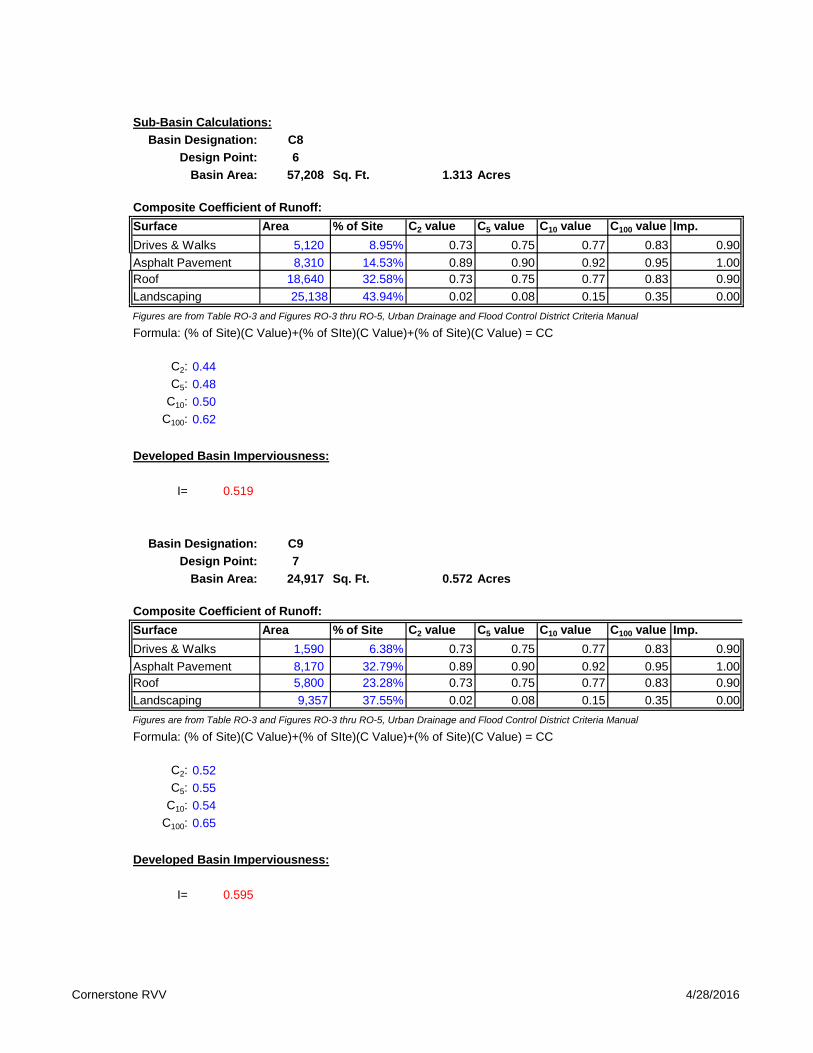
Sub-Basin Calculations:Basin Designation: C8
Design Point: 6Basin Area: 57,208 Sq. Ft. 1.313 Acres
Composite Coefficient of Runoff:Surface Area % of Site C2 value C5 value C10 value C100 value Imp.Drives & Walks 5,120 8.95% 0.73 0.75 0.77 0.83 0.90Asphalt Pavement 8,310 14.53% 0.89 0.90 0.92 0.95 1.00Roof 18,640 32.58% 0.73 0.75 0.77 0.83 0.90Landscaping 25,138 43.94% 0.02 0.08 0.15 0.35 0.00Figures are from Table RO-3 and Figures RO-3 thru RO-5, Urban Drainage and Flood Control District Criteria Manual
Formula: (% of Site)(C Value)+(% of SIte)(C Value)+(% of Site)(C Value) = CC
C2: 0.44C5: 0.48
C10: 0.50C100: 0.62
Developed Basin Imperviousness:
I= 0.519
Basin Designation: C9Design Point: 7
Basin Area: 24,917 Sq. Ft. 0.572 Acres
Composite Coefficient of Runoff:Surface Area % of Site C2 value C5 value C10 value C100 value Imp.Drives & Walks 1,590 6.38% 0.73 0.75 0.77 0.83 0.90Asphalt Pavement 8,170 32.79% 0.89 0.90 0.92 0.95 1.00Roof 5,800 23.28% 0.73 0.75 0.77 0.83 0.90Landscaping 9,357 37.55% 0.02 0.08 0.15 0.35 0.00Figures are from Table RO-3 and Figures RO-3 thru RO-5, Urban Drainage and Flood Control District Criteria Manual
Formula: (% of Site)(C Value)+(% of SIte)(C Value)+(% of Site)(C Value) = CC
C2: 0.52C5: 0.55
C10: 0.54C100: 0.65
Developed Basin Imperviousness:
I= 0.595

Cornerstone RVV 4/28/2016
Sub-Basin Calculations:Basin Designation: C10
Design Point: 9Basin Area: 70,351 Sq. Ft. 1.615 Acres
Composite Coefficient of Runoff:Surface Area % of Site C2 value C5 value C10 value C100 value Imp.Drives & Walks 5,100 7.25% 0.73 0.75 0.77 0.83 0.90Asphalt Pavement 18,740 26.64% 0.89 0.90 0.92 0.95 1.00Roof 18,570 26.40% 0.73 0.75 0.77 0.83 0.90Landscaping 27,941 39.72% 0.02 0.08 0.15 0.35 0.00Figures are from Table RO-3 and Figures RO-3 thru RO-5, Urban Drainage and Flood Control District Criteria Manual
Formula: (% of Site)(C Value)+(% of SIte)(C Value)+(% of Site)(C Value) = CC
C2: 0.49C5: 0.52
C10: 0.52C100: 0.64
Developed Basin Imperviousness:
I= 0.569
Basin Designation: C11Design Point: 10
Basin Area: 54,256 Sq. Ft. 1.246 Acres
Composite Coefficient of Runoff:Surface Area % of Site C2 value C5 value C10 value C100 value Imp.Drives & Walks 4,490 8.28% 0.73 0.75 0.77 0.83 0.90Asphalt Pavement 10,550 19.44% 0.89 0.90 0.92 0.95 1.00Roof 16,320 30.08% 0.73 0.75 0.77 0.83 0.90Landscaping 22,896 42.20% 0.02 0.08 0.15 0.35 0.00Figures are from Table RO-3 and Figures RO-3 thru RO-5, Urban Drainage and Flood Control District Criteria Manual
Formula: (% of Site)(C Value)+(% of SIte)(C Value)+(% of Site)(C Value) = CC
C2: 0.46C5: 0.50
C10: 0.51C100: 0.63
Developed Basin Imperviousness:
I= 0.540
Cornerstone RVV 4/28/2016
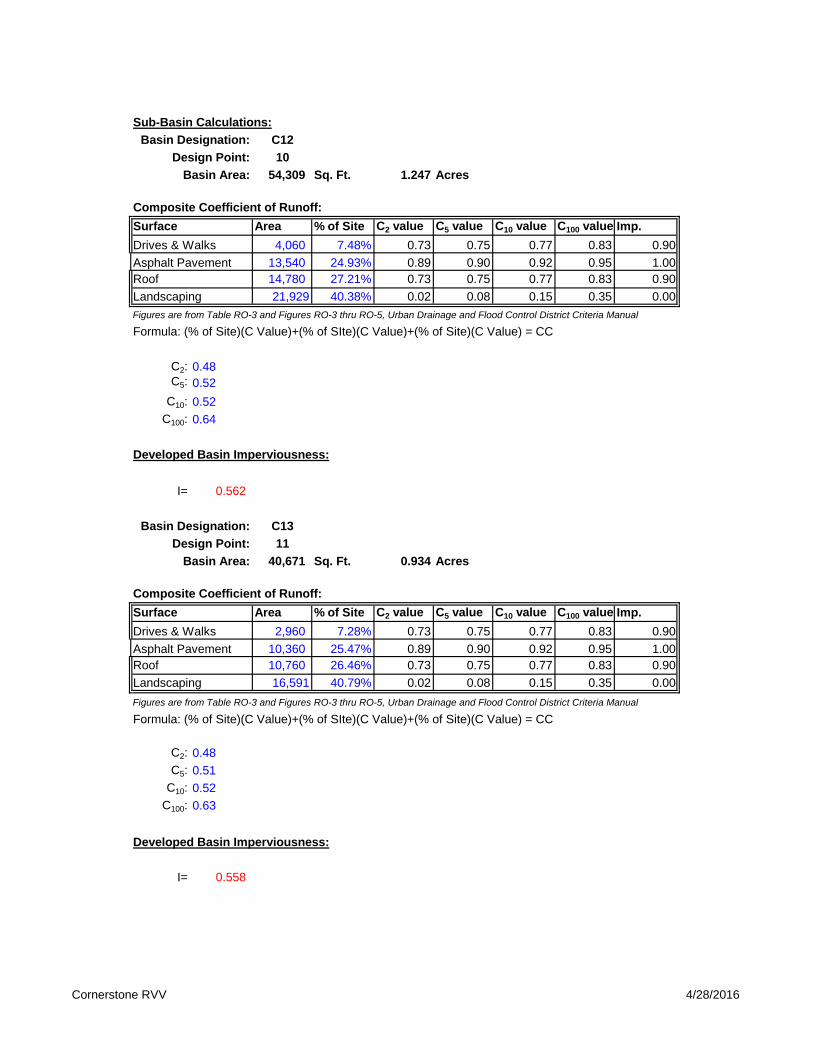
Sub-Basin Calculations:Basin Designation: C12
Design Point: 10Basin Area: 54,309 Sq. Ft. 1.247 Acres
Composite Coefficient of Runoff:Surface Area % of Site C2 value C5 value C10 value C100 value Imp.Drives & Walks 4,060 7.48% 0.73 0.75 0.77 0.83 0.90Asphalt Pavement 13,540 24.93% 0.89 0.90 0.92 0.95 1.00Roof 14,780 27.21% 0.73 0.75 0.77 0.83 0.90Landscaping 21,929 40.38% 0.02 0.08 0.15 0.35 0.00Figures are from Table RO-3 and Figures RO-3 thru RO-5, Urban Drainage and Flood Control District Criteria Manual
Formula: (% of Site)(C Value)+(% of SIte)(C Value)+(% of Site)(C Value) = CC
C2: 0.48C5: 0.52
C10: 0.52C100: 0.64
Developed Basin Imperviousness:
I= 0.562
Basin Designation: C13Design Point: 11
Basin Area: 40,671 Sq. Ft. 0.934 Acres
Composite Coefficient of Runoff:Surface Area % of Site C2 value C5 value C10 value C100 value Imp.Drives & Walks 2,960 7.28% 0.73 0.75 0.77 0.83 0.90Asphalt Pavement 10,360 25.47% 0.89 0.90 0.92 0.95 1.00Roof 10,760 26.46% 0.73 0.75 0.77 0.83 0.90Landscaping 16,591 40.79% 0.02 0.08 0.15 0.35 0.00Figures are from Table RO-3 and Figures RO-3 thru RO-5, Urban Drainage and Flood Control District Criteria Manual
Formula: (% of Site)(C Value)+(% of SIte)(C Value)+(% of Site)(C Value) = CC
C2: 0.48C5: 0.51
C10: 0.52C100: 0.63
Developed Basin Imperviousness:
I= 0.558
Cornerstone RVV 4/28/2016
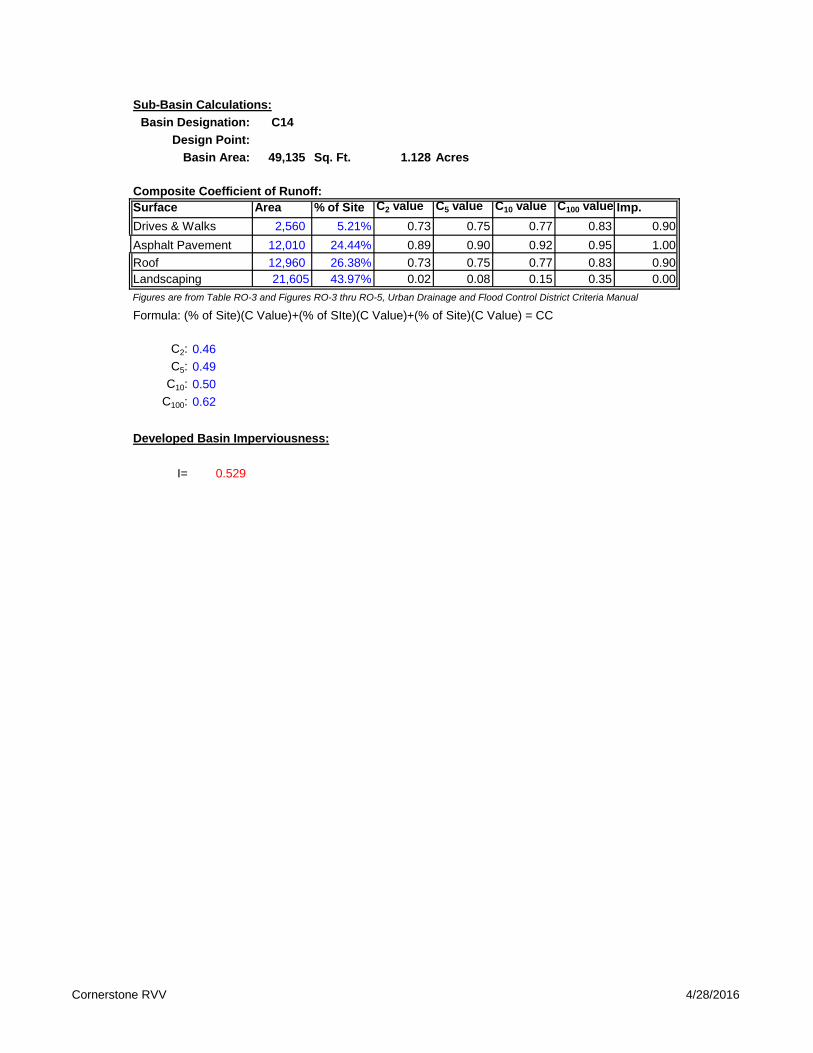
Sub-Basin Calculations:Basin Designation: C14
Design Point:Basin Area: 49,135 Sq. Ft. 1.128 Acres
Composite Coefficient of Runoff:Surface Area % of Site C2 value C5 value C10 value C100 value Imp.Drives & Walks 2,560 5.21% 0.73 0.75 0.77 0.83 0.90Asphalt Pavement 12,010 24.44% 0.89 0.90 0.92 0.95 1.00Roof 12,960 26.38% 0.73 0.75 0.77 0.83 0.90Landscaping 21,605 43.97% 0.02 0.08 0.15 0.35 0.00Figures are from Table RO-3 and Figures RO-3 thru RO-5, Urban Drainage and Flood Control District Criteria Manual
Formula: (% of Site)(C Value)+(% of SIte)(C Value)+(% of Site)(C Value) = CC
C2: 0.46C5: 0.49
C10: 0.50C100: 0.62
Developed Basin Imperviousness:
I= 0.529
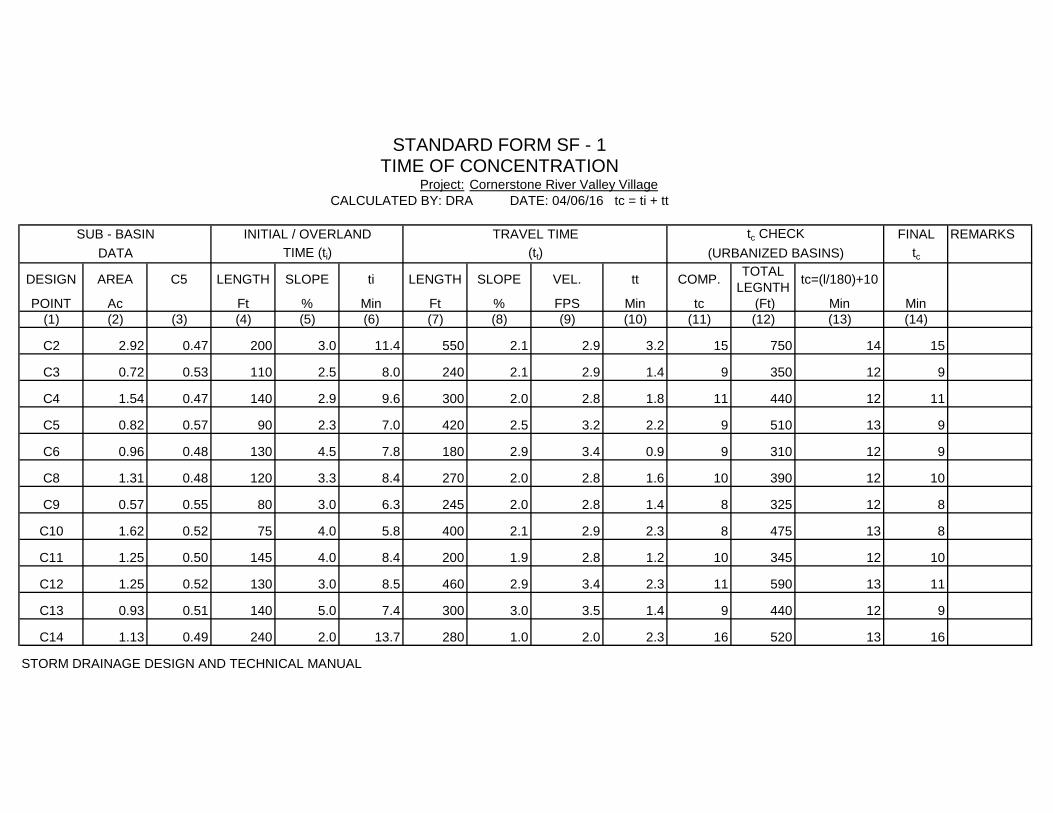
STANDARD FORM SF - 1TIME OF CONCENTRATION
Project: Cornerstone River Valley VillageCALCULATED BY: DRA DATE: 04/06/16 tc = ti + tt
SUB - BASIN INITIAL / OVERLAND TRAVEL TIME tc CHECK FINAL REMARKSDATA TIME (ti) (tt) (URBANIZED BASINS) tc
DESIGN AREA C5 LENGTH SLOPE ti LENGTH SLOPE VEL. tt COMP. TOTAL LEGNTH tc=(l/180)+10
POINT Ac Ft % Min Ft % FPS Min tc (Ft) Min Min(1) (2) (3) (4) (5) (6) (7) (8) (9) (10) (11) (12) (13) (14)
C2 2.92 0.47 200 3.0 11.4 550 2.1 2.9 3.2 15 750 14 15
C3 0.72 0.53 110 2.5 8.0 240 2.1 2.9 1.4 9 350 12 9
C4 1.54 0.47 140 2.9 9.6 300 2.0 2.8 1.8 11 440 12 11
C5 0.82 0.57 90 2.3 7.0 420 2.5 3.2 2.2 9 510 13 9
C6 0.96 0.48 130 4.5 7.8 180 2.9 3.4 0.9 9 310 12 9
C8 1.31 0.48 120 3.3 8.4 270 2.0 2.8 1.6 10 390 12 10
C9 0.57 0.55 80 3.0 6.3 245 2.0 2.8 1.4 8 325 12 8
C10 1.62 0.52 75 4.0 5.8 400 2.1 2.9 2.3 8 475 13 8
C11 1.25 0.50 145 4.0 8.4 200 1.9 2.8 1.2 10 345 12 10
C12 1.25 0.52 130 3.0 8.5 460 2.9 3.4 2.3 11 590 13 11
C13 0.93 0.51 140 5.0 7.4 300 3.0 3.5 1.4 9 440 12 9
C14 1.13 0.49 240 2.0 13.7 280 1.0 2.0 2.3 16 520 13 16
STORM DRAINAGE DESIGN AND TECHNICAL MANUAL
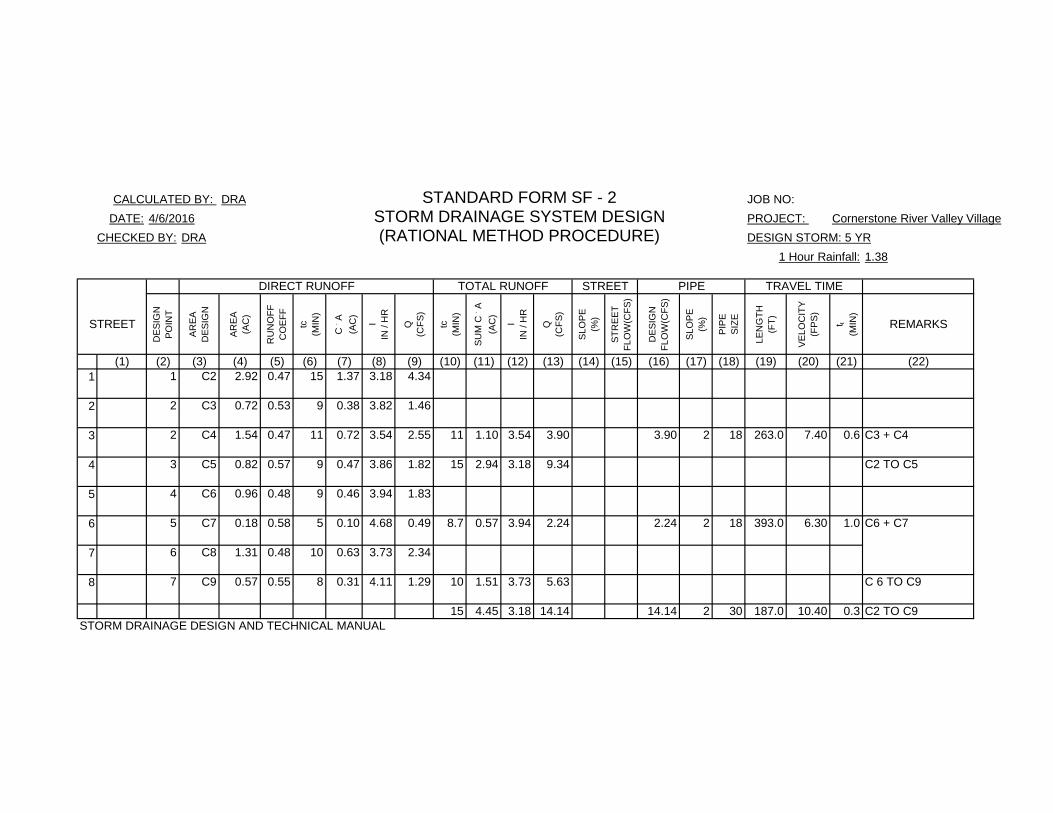
CALCULATED BY: DRA STANDARD FORM SF - 2 JOB NO: DATE: STORM DRAINAGE SYSTEM DESIGN PROJECT: Cornerstone River Valley Village
CHECKED BY: DRA (RATIONAL METHOD PROCEDURE) DESIGN STORM: 5 YR1 Hour Rainfall: 1.38
DIRECT RUNOFF TOTAL RUNOFF STREET PIPE TRAVEL TIME
STREET
DES
IGN
PO
INT
AREA
D
ESIG
N
AREA
(A
C)
RU
NO
FF
CO
EFF
tc
(MIN
)
C . A
(A
C)
I
IN /
HR
Q
(CFS
)
tc
(M
IN)
SUM
C . A
(A
C)
I
IN /
HR
Q
(CFS
)
SLO
PE
(%)
STR
EET
FLO
W(C
FS)
DES
IGN
FL
OW
(CFS
)
SLO
PE
(%)
PIPE
SIZE
LEN
GTH
(FT)
VELO
CIT
Y
(F
PS)
t t
(MIN
)
REMARKS
(1) (2) (3) (4) (5) (6) (7) (8) (9) (10) (11) (12) (13) (14) (15) (16) (17) (18) (19) (20) (21) (22)1 1 C2 2.92 0.47 15 1.37 3.18 4.34
2 2 C3 0.72 0.53 9 0.38 3.82 1.46
3 2 C4 1.54 0.47 11 0.72 3.54 2.55 11 1.10 3.54 3.90 3.90 2 18 263.0 7.40 0.6 C3 + C4
4 3 C5 0.82 0.57 9 0.47 3.86 1.82 15 2.94 3.18 9.34 C2 TO C5
5 4 C6 0.96 0.48 9 0.46 3.94 1.83
6 5 C7 0.18 0.58 5 0.10 4.68 0.49 8.7 0.57 3.94 2.24 2.24 2 18 393.0 6.30 1.0 C6 + C7
7 6 C8 1.31 0.48 10 0.63 3.73 2.34
8 7 C9 0.57 0.55 8 0.31 4.11 1.29 10 1.51 3.73 5.63 C 6 TO C9
15 4.45 3.18 14.14 14.14 2 30 187.0 10.40 0.3 C2 TO C9STORM DRAINAGE DESIGN AND TECHNICAL MANUAL
4/6/2016

CALCULATED BY: DRA STANDARD FORM SF - 2 JOB NO: DATE: STORM DRAINAGE SYSTEM DESIGN PROJECT: Cornerstone River Valley Village
CHECKED BY: DRA (RATIONAL METHOD PROCEDURE) DESIGN STORM: 5 YR1 Hour Rainfall: 1.38
DIRECT RUNOFF TOTAL RUNOFF STREET PIPE TRAVEL TIME
STREET
DE
SIG
N
PO
INT
AR
EA
D
ES
IGN
AR
EA
(A
C)
RU
NO
FF
CO
EFF
tc
(MIN
)
C . A
(A
C)
I
IN /
HR
Q
(CFS
)
tc
(M
IN)
SU
M C
. A
(AC
)
I
IN /
HR
Q
(CFS
)
SLO
PE
(%
)
STR
EE
T FL
OW
(CFS
)
DE
SIG
N
FLO
W(C
FS)
SLO
PE
(%
)
PIP
E
S
IZE
LEN
GTH
(FT)
VE
LOC
ITY
(FP
S)
t t
(MIN
)
REMARKS
(1) (2) (3) (4) (5) (6) (7) (8) (9) (10) (11) (12) (13) (14) (15) (16) (17) (18) (19) (20) (21) (22)1 8 C10 1.62 0.52 8 0.85 4.04 3.42 15 5.29 3.15 16.66 C2 TO C10
2 9 C11 1.25 0.50 10 0.62 3.79 2.35 15 5.91 3.15 18.61 C2 TO C11
3 10 C12 1.25 0.52 11 0.64 3.63 2.34
4 10 C13 0.93 0.51 9 0.48 3.91 1.88 11 1.13 3.63 4.09 C12 TO C13
5 11 C14 1.13 0.49 16 0.56 3.03 1.68 16 1.68 3.03 5.10 C13 TO C14
6
7
8
STORM DRAINAGE DESIGN AND TECHNICAL MANUAL
4/6/2016
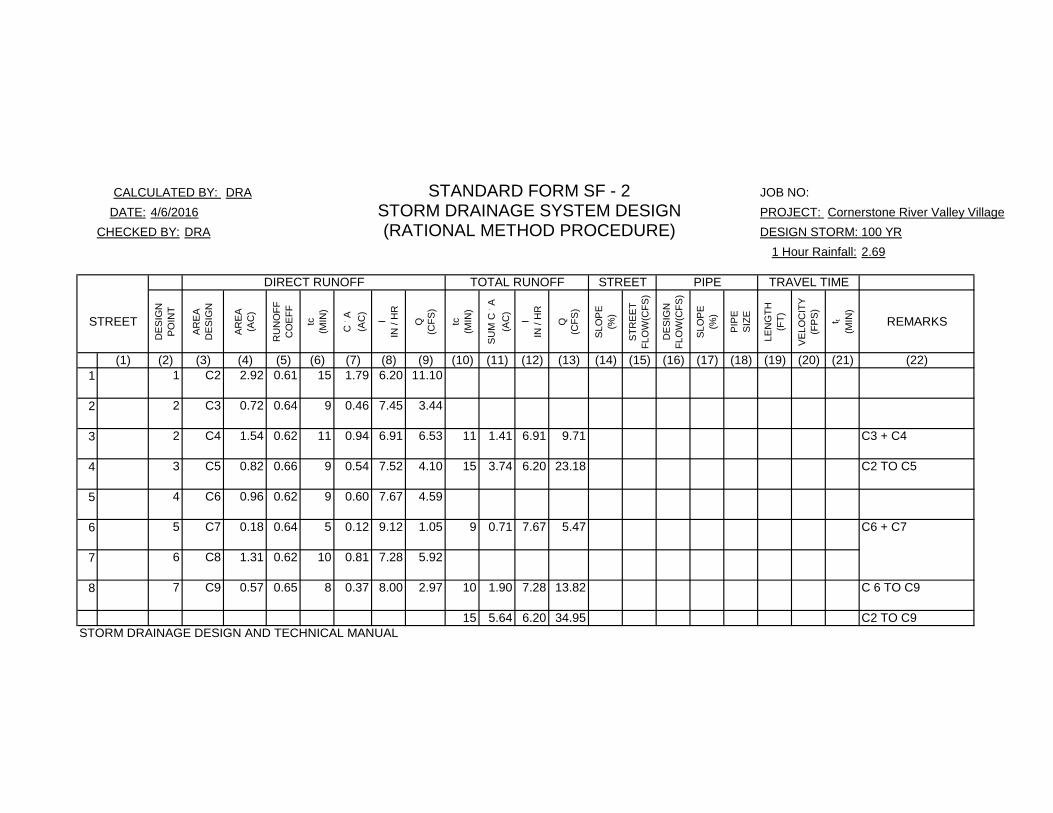
CALCULATED BY: DRA STANDARD FORM SF - 2 JOB NO: DATE: STORM DRAINAGE SYSTEM DESIGN PROJECT: Cornerstone River Valley Village
CHECKED BY: DRA (RATIONAL METHOD PROCEDURE) DESIGN STORM: 100 YR1 Hour Rainfall: 2.69
DIRECT RUNOFF TOTAL RUNOFF STREET PIPE TRAVEL TIME
STREET
DE
SIG
N
PO
INT
AR
EA
D
ES
IGN
AR
EA
(A
C)
RU
NO
FF
CO
EFF
tc
(MIN
)
C . A
(A
C)
I
IN /
HR
Q
(CFS
)
tc
(M
IN)
SU
M C
. A
(AC
)
I
IN /
HR
Q
(CFS
)
SLO
PE
(%
)
STR
EE
T FL
OW
(CFS
)
DE
SIG
N
FLO
W(C
FS)
SLO
PE
(%
)
PIP
E
S
IZE
LEN
GTH
(FT)
VE
LOC
ITY
(FP
S)
t t
(MIN
)
REMARKS
(1) (2) (3) (4) (5) (6) (7) (8) (9) (10) (11) (12) (13) (14) (15) (16) (17) (18) (19) (20) (21) (22)1 1 C2 2.92 0.61 15 1.79 6.20 11.10
2 2 C3 0.72 0.64 9 0.46 7.45 3.44
3 2 C4 1.54 0.62 11 0.94 6.91 6.53 11 1.41 6.91 9.71 C3 + C4
4 3 C5 0.82 0.66 9 0.54 7.52 4.10 15 3.74 6.20 23.18 C2 TO C5
5 4 C6 0.96 0.62 9 0.60 7.67 4.59
6 5 C7 0.18 0.64 5 0.12 9.12 1.05 9 0.71 7.67 5.47 C6 + C7
7 6 C8 1.31 0.62 10 0.81 7.28 5.92
8 7 C9 0.57 0.65 8 0.37 8.00 2.97 10 1.90 7.28 13.82 C 6 TO C9
15 5.64 6.20 34.95 C2 TO C9STORM DRAINAGE DESIGN AND TECHNICAL MANUAL
4/6/2016

CALCULATED BY: DRA STANDARD FORM SF - 2 JOB NO: DATE: STORM DRAINAGE SYSTEM DESIGN PROJECT: Cornerstone River Valley Village
CHECKED BY: DRA (RATIONAL METHOD PROCEDURE) DESIGN STORM: 100 YR1 Hour Rainfall: 2.69
DIRECT RUNOFF TOTAL RUNOFF STREET PIPE TRAVEL TIME
STREET
DE
SIG
N
PO
INT
AR
EA
D
ES
IGN
AR
EA
(A
C)
RU
NO
FF
CO
EFF
tc
(MIN
)
C . A
(A
C)
I
IN /
HR
Q
(CFS
)
tc
(M
IN)
SU
M C
. A
(AC
)
I
IN /
HR
Q
(CFS
)
SLO
PE
(%
)
STR
EE
T FL
OW
(CFS
)
DE
SIG
N
FLO
W(C
FS)
SLO
PE
(%
)
PIP
E
S
IZE
LEN
GTH
(FT)
VE
LOC
ITY
(FP
S)
t t
(MIN
)
REMARKS
(1) (2) (3) (4) (5) (6) (7) (8) (9) (10) (11) (12) (13) (14) (15) (16) (17) (18) (19) (20) (21) (22)1 8 C10 1.62 0.64 8 1.03 7.88 8.14 15 6.67 6.14 40.95 C2 TO C10
2 9 C11 1.25 0.63 10 0.78 7.39 5.78 15 7.45 6.14 45.75 C2 TO C11
3 10 C12 1.25 0.64 11 0.79 7.08 5.62
4 10 C13 0.93 0.63 9 0.59 7.62 4.51 11 1.39 7.08 9.81 C12 TO C13
5 11 C14 1.13 0.62 16 0.70 5.91 4.13 16 2.08 5.91 12.32 C13 TO C14
6
7
8
STORM DRAINAGE DESIGN AND TECHNICAL MANUAL
4/6/2016
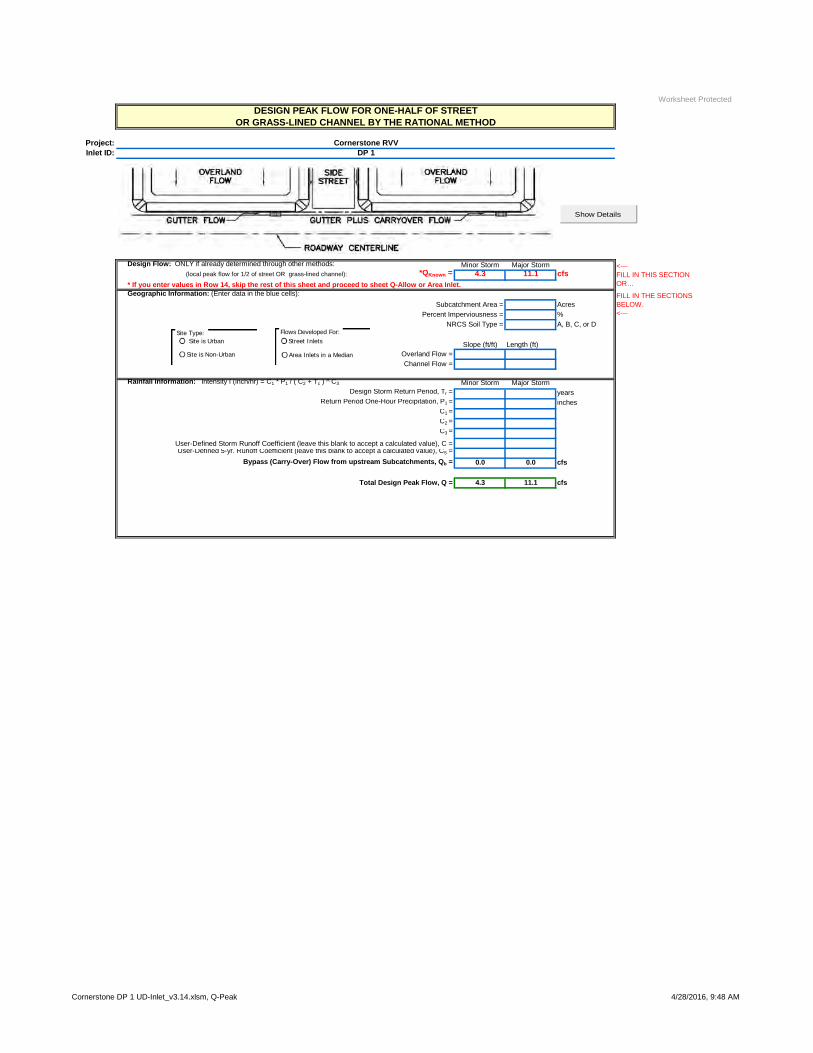
Cornerstone DP 1 UD-Inlet_v3.14.xlsm, Q-Peak 4/28/2016, 9:48 AM
Worksheet Protected
Project:Inlet ID:
Design Flow: ONLY if already determined through other methods: Minor Storm Major Storm (local peak flow for 1/2 of street OR grass-lined channel): *QKnown = 4.3 11.1 cfs
* If you enter values in Row 14, skip the rest of this sheet and proceed to sheet Q-Allow or Area Inlet. Geographic Information: (Enter data in the blue cells):
Subcatchment Area = AcresPercent Imperviousness = %
NRCS Soil Type = A, B, C, or D
Slope (ft/ft) Length (ft)Overland Flow =Channel Flow =
Rainfall Information: Intensity I (inch/hr) = C1 * P1 / ( C2 + Tc ) ^ C3 Minor Storm Major StormDesign Storm Return Period, Tr = years
Return Period One-Hour Precipitation, P1 = inchesC1 =C2 =C3 =
User-Defined Storm Runoff Coefficient (leave this blank to accept a calculated value), C =User-Defined 5-yr. Runoff Coefficient (leave this blank to accept a calculated value), C5 =
Bypass (Carry-Over) Flow from upstream Subcatchments, Qb = 0.0 0.0 cfs
Total Design Peak Flow, Q = 4.3 11.1 cfs
<---FILL IN THIS SECTION OR…
FILL IN THE SECTIONS BELOW.<---
DESIGN PEAK FLOW FOR ONE-HALF OF STREET OR GRASS-LINED CHANNEL BY THE RATIONAL METHOD
Cornerstone RVVDP 1
Site is Urban
Site is Non-Urban
Show Details
Site Type: Street Inlets
Area Inlets in a Median
Flows Developed For:

Cornerstone DP 1 UD-Inlet_v3.14.xlsm, Q-Allow 4/28/2016, 9:48 AM
Project:Inlet ID:
Gutter Geometry (Enter data in the blue cells)Maximum Allowable Width for Spread Behind Curb TBACK = 12.4 ftSide Slope Behind Curb (leave blank for no conveyance credit behind curb) SBACK = 0.030 ft/ftManning's Roughness Behind Curb (typically between 0.012 and 0.020) nBACK = 0.020
Height of Curb at Gutter Flow Line HCURB = 6.00 inchesDistance from Curb Face to Street Crown TCROWN = 17.0 ftGutter Width W = 2.00 ftStreet Transverse Slope SX = 0.020 ft/ftGutter Cross Slope (typically 2 inches over 24 inches or 0.083 ft/ft) SW = 0.083 ft/ftStreet Longitudinal Slope - Enter 0 for sump condition SO = 0.000 ft/ftManning's Roughness for Street Section (typically between 0.012 and 0.020) nSTREET = 0.015
Minor Storm Major StormMax. Allowable Spread for Minor & Major Storm TMAX = 11.0 17.0 ftMax. Allowable Depth at Gutter Flowline for Minor & Major Storm dMAX = 4.0 8.5 inches
Allow Flow Depth at Street Crown (leave blank for no) check = yes
MINOR STORM Allowable Capacity is based on Depth Criterion Minor Storm Major StormMAJOR STORM Allowable Capacity is based on Depth Criterion Qallow = SUMP SUMP cfs
Major storm max. allowable capacity GOOD - greater than flow given on sheet 'Q-Peak'
ALLOWABLE CAPACITY FOR ONE-HALF OF STREET (Minor & Major Storm)
Cornerstone RVVDP 1
(Based on Regulated Criteria for Maximum Allowable Flow Depth and Spread)
Minor storm max. allowable capacity GOOD - greater than flow given on sheet 'Q-Peak'
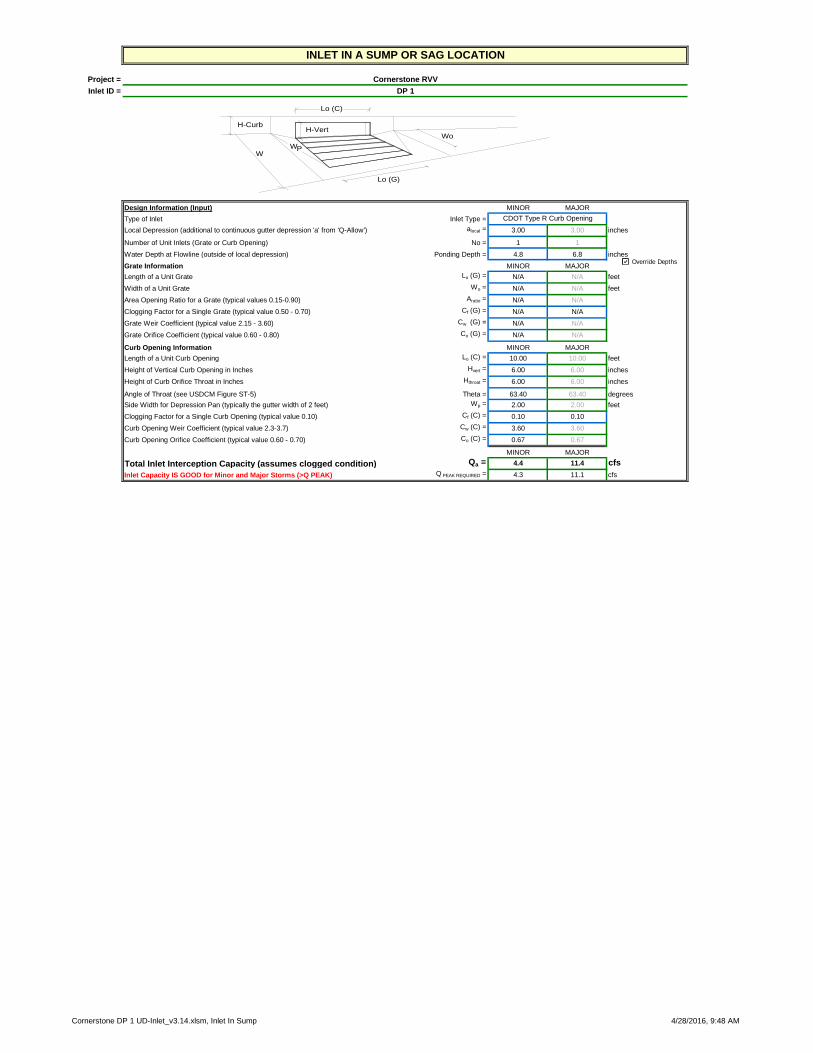
Cornerstone DP 1 UD-Inlet_v3.14.xlsm, Inlet In Sump 4/28/2016, 9:48 AM
Project =Inlet ID =
Design Information (Input) MINOR MAJORType of Inlet Inlet Type =Local Depression (additional to continuous gutter depression 'a' from 'Q-Allow') alocal = 3.00 3.00 inches
Number of Unit Inlets (Grate or Curb Opening) No = 1 1 Water Depth at Flowline (outside of local depression) Ponding Depth = 4.8 6.8 inchesGrate Information MINOR MAJORLength of a Unit Grate Lo (G) = N/A N/A feetWidth of a Unit Grate Wo = N/A N/A feetArea Opening Ratio for a Grate (typical values 0.15-0.90) Aratio = N/A N/AClogging Factor for a Single Grate (typical value 0.50 - 0.70) Cf (G) = N/A N/AGrate Weir Coefficient (typical value 2.15 - 3.60) Cw (G) = N/A N/AGrate Orifice Coefficient (typical value 0.60 - 0.80) Co (G) = N/A N/A
Curb Opening Information MINOR MAJORLength of a Unit Curb Opening Lo (C) = 10.00 10.00 feetHeight of Vertical Curb Opening in Inches Hvert = 6.00 6.00 inchesHeight of Curb Orifice Throat in Inches Hthroat = 6.00 6.00 inches
Angle of Throat (see USDCM Figure ST-5) Theta = 63.40 63.40 degreesSide Width for Depression Pan (typically the gutter width of 2 feet) Wp = 2.00 2.00 feetClogging Factor for a Single Curb Opening (typical value 0.10) Cf (C) = 0.10 0.10Curb Opening Weir Coefficient (typical value 2.3-3.7) Cw (C) = 3.60 3.60Curb Opening Orifice Coefficient (typical value 0.60 - 0.70) Co (C) = 0.67 0.67
MINOR MAJOR
Total Inlet Interception Capacity (assumes clogged condition) Qa = 4.4 11.4 cfsInlet Capacity IS GOOD for Minor and Major Storms (>Q PEAK) Q PEAK REQUIRED = 4.3 11.1 cfs
INLET IN A SUMP OR SAG LOCATION
Cornerstone RVVDP 1
CDOT Type R Curb Opening
H-VertH-Curb
W
Lo (C)
Lo (G)
WoWP
Override Depths

Cornerstone DP 6 UD-Inlet_v3.14.xlsm, Q-Peak 4/28/2016, 9:46 AM
Worksheet Protected
Project:Inlet ID:
Design Flow: ONLY if already determined through other methods: Minor Storm Major Storm (local peak flow for 1/2 of street OR grass-lined channel): *QKnown = 2.3 5.9 cfs
* If you enter values in Row 14, skip the rest of this sheet and proceed to sheet Q-Allow or Area Inlet. Geographic Information: (Enter data in the blue cells):
Subcatchment Area = AcresPercent Imperviousness = %
NRCS Soil Type = A, B, C, or D
Slope (ft/ft) Length (ft)Overland Flow =Channel Flow =
Rainfall Information: Intensity I (inch/hr) = C1 * P1 / ( C2 + Tc ) ^ C3 Minor Storm Major StormDesign Storm Return Period, Tr = years
Return Period One-Hour Precipitation, P1 = inchesC1 =C2 =C3 =
User-Defined Storm Runoff Coefficient (leave this blank to accept a calculated value), C =User-Defined 5-yr. Runoff Coefficient (leave this blank to accept a calculated value), C5 =
Bypass (Carry-Over) Flow from upstream Subcatchments, Qb = 0.0 0.0 cfs
Total Design Peak Flow, Q = 2.3 5.9 cfs
<---FILL IN THIS SECTION OR…
FILL IN THE SECTIONS BELOW.<---
DESIGN PEAK FLOW FOR ONE-HALF OF STREET OR GRASS-LINED CHANNEL BY THE RATIONAL METHOD
Cornerstone RVVDP 6
Site is Urban
Site is Non-Urban
Show Details
Site Type: Street Inlets
Area Inlets in a Median
Flows Developed For:
Cornerstone DP 6 UD-Inlet_v3.14.xlsm, Q-Allow 4/28/2016, 9:46 AM
Project:Inlet ID:
Gutter Geometry (Enter data in the blue cells)Maximum Allowable Width for Spread Behind Curb TBACK = 12.4 ftSide Slope Behind Curb (leave blank for no conveyance credit behind curb) SBACK = 0.030 ft/ftManning's Roughness Behind Curb (typically between 0.012 and 0.020) nBACK = 0.020
Height of Curb at Gutter Flow Line HCURB = 6.00 inchesDistance from Curb Face to Street Crown TCROWN = 17.0 ftGutter Width W = 2.00 ftStreet Transverse Slope SX = 0.020 ft/ftGutter Cross Slope (typically 2 inches over 24 inches or 0.083 ft/ft) SW = 0.083 ft/ftStreet Longitudinal Slope - Enter 0 for sump condition SO = 0.000 ft/ftManning's Roughness for Street Section (typically between 0.012 and 0.020) nSTREET = 0.015
Minor Storm Major StormMax. Allowable Spread for Minor & Major Storm TMAX = 11.0 17.0 ftMax. Allowable Depth at Gutter Flowline for Minor & Major Storm dMAX = 4.0 8.5 inches
Allow Flow Depth at Street Crown (leave blank for no) check = yes
MINOR STORM Allowable Capacity is based on Depth Criterion Minor Storm Major StormMAJOR STORM Allowable Capacity is based on Depth Criterion Qallow = SUMP SUMP cfs
Major storm max. allowable capacity GOOD - greater than flow given on sheet 'Q-Peak'
ALLOWABLE CAPACITY FOR ONE-HALF OF STREET (Minor & Major Storm)
Cornerstone RVVDP 6
(Based on Regulated Criteria for Maximum Allowable Flow Depth and Spread)
Minor storm max. allowable capacity GOOD - greater than flow given on sheet 'Q-Peak'
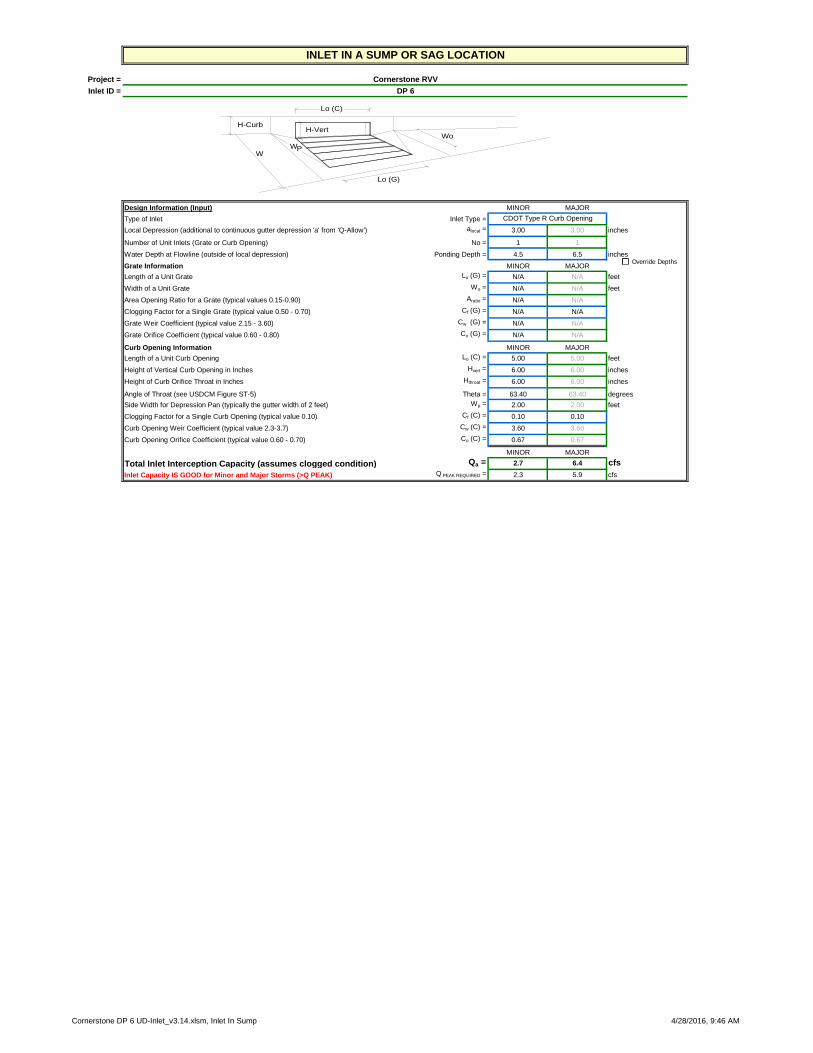
Cornerstone DP 6 UD-Inlet_v3.14.xlsm, Inlet In Sump 4/28/2016, 9:46 AM
Project =Inlet ID =
Design Information (Input) MINOR MAJORType of Inlet Inlet Type =Local Depression (additional to continuous gutter depression 'a' from 'Q-Allow') alocal = 3.00 3.00 inches
Number of Unit Inlets (Grate or Curb Opening) No = 1 1 Water Depth at Flowline (outside of local depression) Ponding Depth = 4.5 6.5 inchesGrate Information MINOR MAJORLength of a Unit Grate Lo (G) = N/A N/A feetWidth of a Unit Grate Wo = N/A N/A feetArea Opening Ratio for a Grate (typical values 0.15-0.90) Aratio = N/A N/AClogging Factor for a Single Grate (typical value 0.50 - 0.70) Cf (G) = N/A N/AGrate Weir Coefficient (typical value 2.15 - 3.60) Cw (G) = N/A N/AGrate Orifice Coefficient (typical value 0.60 - 0.80) Co (G) = N/A N/A
Curb Opening Information MINOR MAJORLength of a Unit Curb Opening Lo (C) = 5.00 5.00 feetHeight of Vertical Curb Opening in Inches Hvert = 6.00 6.00 inchesHeight of Curb Orifice Throat in Inches Hthroat = 6.00 6.00 inches
Angle of Throat (see USDCM Figure ST-5) Theta = 63.40 63.40 degreesSide Width for Depression Pan (typically the gutter width of 2 feet) Wp = 2.00 2.00 feetClogging Factor for a Single Curb Opening (typical value 0.10) Cf (C) = 0.10 0.10Curb Opening Weir Coefficient (typical value 2.3-3.7) Cw (C) = 3.60 3.60Curb Opening Orifice Coefficient (typical value 0.60 - 0.70) Co (C) = 0.67 0.67
MINOR MAJOR
Total Inlet Interception Capacity (assumes clogged condition) Qa = 2.7 6.4 cfsInlet Capacity IS GOOD for Minor and Major Storms (>Q PEAK) Q PEAK REQUIRED = 2.3 5.9 cfs
INLET IN A SUMP OR SAG LOCATION
Cornerstone RVVDP 6
CDOT Type R Curb Opening
H-VertH-Curb
W
Lo (C)
Lo (G)
WoWP
Override Depths
Cornerstone River Valley Village - 9 - Engineering Service Company
STORM SEWER HYDRAULIC CALCULATIONS


Cornerstone River Valley Village - 10 - Engineering Service Company
BACKUP INFORMATION
FIRMETTE SOILS MAP


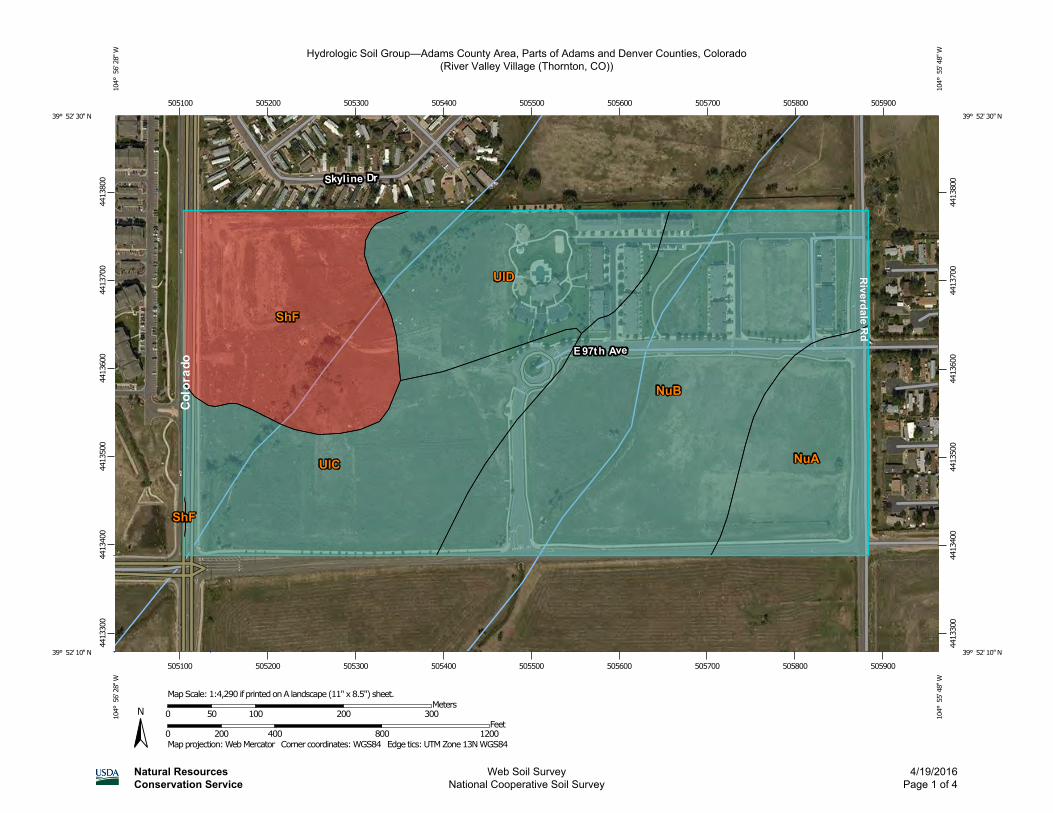
Hydrologic Soil Group—Adams County Area, Parts of Adams and Denver Counties, Colorado(River Valley Village (Thornton, CO))
Natural ResourcesConservation Service
Web Soil SurveyNational Cooperative Soil Survey
4/19/2016Page 1 of 4
4413
300
4413
400
4413
500
4413
600
4413
700
4413
800
4413
300
4413
400
4413
500
4413
600
4413
700
4413
800
505100 505200 505300 505400 505500 505600 505700 505800 505900
505100 505200 505300 505400 505500 505600 505700 505800 505900
39° 52' 30'' N10
4° 5
6' 2
8'' W
39° 52' 30'' N
104°
55'
48'
' W
39° 52' 10'' N
104°
56'
28'
' W
39° 52' 10'' N
104°
55'
48'
' W
N
Map projection: Web Mercator Corner coordinates: WGS84 Edge tics: UTM Zone 13N WGS840 200 400 800 1200
Feet0 50 100 200 300
MetersMap Scale: 1:4,290 if printed on A landscape (11" x 8.5") sheet.
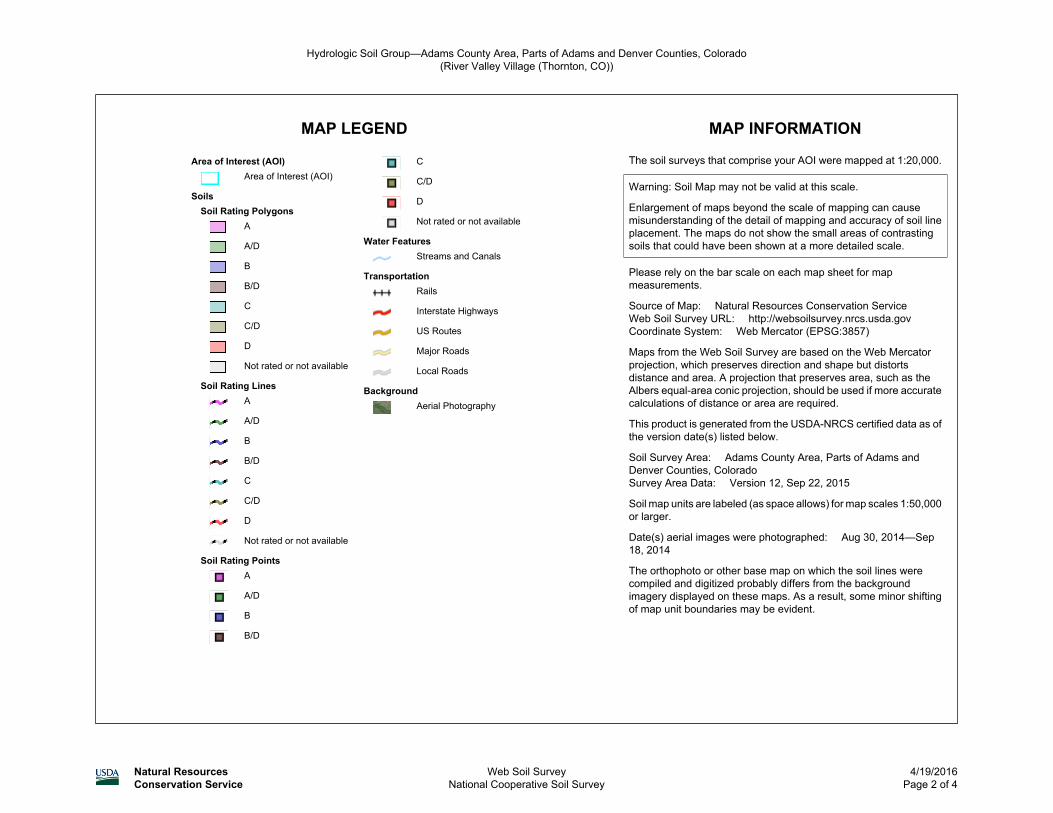
MAP LEGEND MAP INFORMATION
Area of Interest (AOI)Area of Interest (AOI)
SoilsSoil Rating Polygons
A
A/D
B
B/D
C
C/D
D
Not rated or not available
Soil Rating LinesA
A/D
B
B/D
C
C/D
D
Not rated or not available
Soil Rating PointsA
A/D
B
B/D
C
C/D
D
Not rated or not available
Water FeaturesStreams and Canals
TransportationRails
Interstate Highways
US Routes
Major Roads
Local Roads
BackgroundAerial Photography
The soil surveys that comprise your AOI were mapped at 1:20,000.
Warning: Soil Map may not be valid at this scale.
Enlargement of maps beyond the scale of mapping can causemisunderstanding of the detail of mapping and accuracy of soil lineplacement. The maps do not show the small areas of contrastingsoils that could have been shown at a more detailed scale.
Please rely on the bar scale on each map sheet for mapmeasurements.
Source of Map: Natural Resources Conservation ServiceWeb Soil Survey URL: http://websoilsurvey.nrcs.usda.govCoordinate System: Web Mercator (EPSG:3857)
Maps from the Web Soil Survey are based on the Web Mercatorprojection, which preserves direction and shape but distortsdistance and area. A projection that preserves area, such as theAlbers equal-area conic projection, should be used if more accuratecalculations of distance or area are required.
This product is generated from the USDA-NRCS certified data as ofthe version date(s) listed below.
Soil Survey Area: Adams County Area, Parts of Adams andDenver Counties, ColoradoSurvey Area Data: Version 12, Sep 22, 2015
Soil map units are labeled (as space allows) for map scales 1:50,000or larger.
Date(s) aerial images were photographed: Aug 30, 2014—Sep18, 2014
The orthophoto or other base map on which the soil lines werecompiled and digitized probably differs from the backgroundimagery displayed on these maps. As a result, some minor shiftingof map unit boundaries may be evident.
Hydrologic Soil Group—Adams County Area, Parts of Adams and Denver Counties, Colorado(River Valley Village (Thornton, CO))
Natural ResourcesConservation Service
Web Soil SurveyNational Cooperative Soil Survey
4/19/2016Page 2 of 4
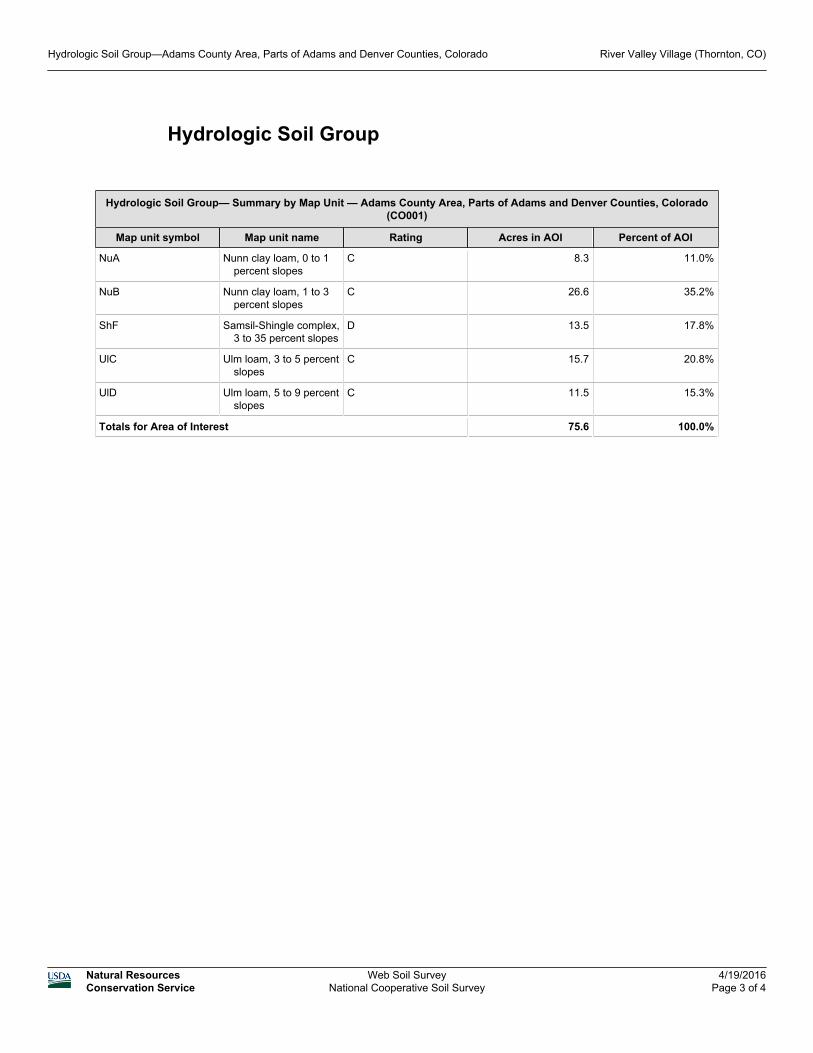
Hydrologic Soil Group
Hydrologic Soil Group— Summary by Map Unit — Adams County Area, Parts of Adams and Denver Counties, Colorado(CO001)
Map unit symbol Map unit name Rating Acres in AOI Percent of AOI
NuA Nunn clay loam, 0 to 1percent slopes
C 8.3 11.0%
NuB Nunn clay loam, 1 to 3percent slopes
C 26.6 35.2%
ShF Samsil-Shingle complex,3 to 35 percent slopes
D 13.5 17.8%
UlC Ulm loam, 3 to 5 percentslopes
C 15.7 20.8%
UlD Ulm loam, 5 to 9 percentslopes
C 11.5 15.3%
Totals for Area of Interest 75.6 100.0%
Hydrologic Soil Group—Adams County Area, Parts of Adams and Denver Counties, Colorado River Valley Village (Thornton, CO)
Natural ResourcesConservation Service
Web Soil SurveyNational Cooperative Soil Survey
4/19/2016Page 3 of 4

Description
Hydrologic soil groups are based on estimates of runoff potential. Soils areassigned to one of four groups according to the rate of water infiltration when thesoils are not protected by vegetation, are thoroughly wet, and receive precipitationfrom long-duration storms.
The soils in the United States are assigned to four groups (A, B, C, and D) andthree dual classes (A/D, B/D, and C/D). The groups are defined as follows:
Group A. Soils having a high infiltration rate (low runoff potential) when thoroughlywet. These consist mainly of deep, well drained to excessively drained sands orgravelly sands. These soils have a high rate of water transmission.
Group B. Soils having a moderate infiltration rate when thoroughly wet. Theseconsist chiefly of moderately deep or deep, moderately well drained or well drainedsoils that have moderately fine texture to moderately coarse texture. These soilshave a moderate rate of water transmission.
Group C. Soils having a slow infiltration rate when thoroughly wet. These consistchiefly of soils having a layer that impedes the downward movement of water orsoils of moderately fine texture or fine texture. These soils have a slow rate of watertransmission.
Group D. Soils having a very slow infiltration rate (high runoff potential) whenthoroughly wet. These consist chiefly of clays that have a high shrink-swellpotential, soils that have a high water table, soils that have a claypan or clay layerat or near the surface, and soils that are shallow over nearly impervious material.These soils have a very slow rate of water transmission.
If a soil is assigned to a dual hydrologic group (A/D, B/D, or C/D), the first letter isfor drained areas and the second is for undrained areas. Only the soils that in theirnatural condition are in group D are assigned to dual classes.
Rating Options
Aggregation Method: Dominant Condition
Component Percent Cutoff: None Specified
Tie-break Rule: Higher
Hydrologic Soil Group—Adams County Area, Parts of Adams and Denver Counties, Colorado River Valley Village (Thornton, CO)
Natural ResourcesConservation Service
Web Soil SurveyNational Cooperative Soil Survey
4/19/2016Page 4 of 4