final kalkhof tri state hfma 09 15 11 integrated service lines and managed care
TRANSCRIPT

L E A D E R S H I P P R O B L E M SO L V I N G V A L U E C R E A T I O N
© Copyright 2011. Alvarez & Marsal Healthcare Industry Group, LLC. All Rights Reserved. Confidential. For discussion purposes only.
HFMA 2011 Tri-State Fall Institute(Florence, Indiana)
September 15, 2011
Building a Value-Driven Integrated Service Line Care Continuum: Business Models, Strategic Pricing and Managed Care Contracting Strategy
Christopher J. Kalkhof, FACHE
Director, Healthcare Industry
Group
(New York Office)
© Copyright 2011. Alvarez & Marsal Healthcare Industry Group, LLC. All Rights Reserved. Confidential. For discussion purposes only. 2
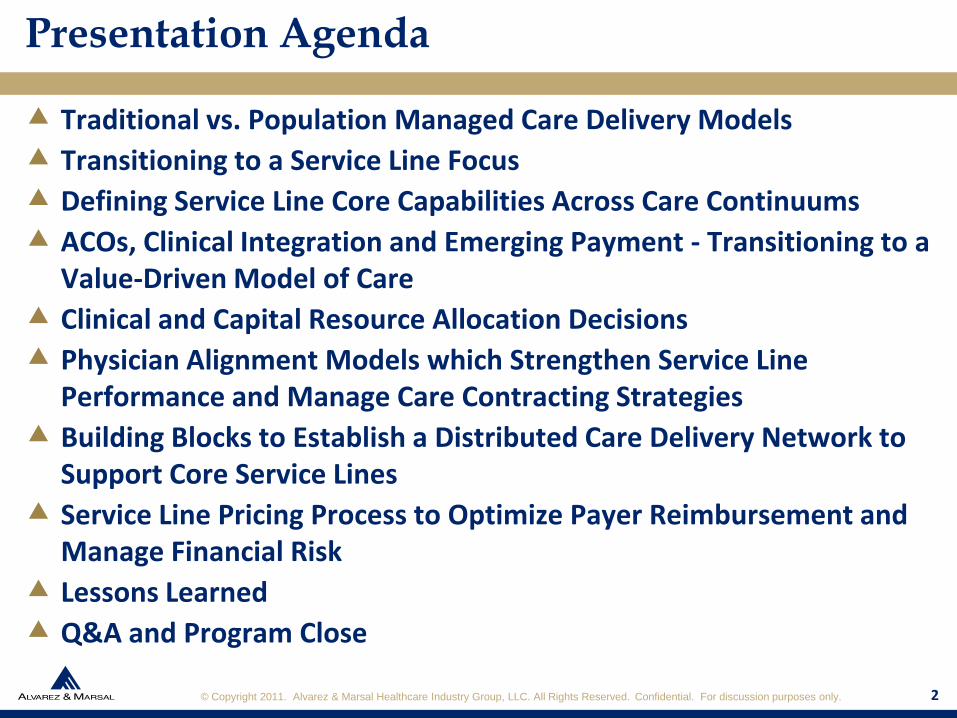
Presentation Agenda
Traditional vs. Population Managed Care Delivery Models
Transitioning to a Service Line Focus
Defining Service Line Core Capabilities Across Care Continuums
ACOs, Clinical Integration and Emerging Payment - Transitioning to a Value-Driven Model of Care
Clinical and Capital Resource Allocation Decisions
Physician Alignment Models which Strengthen Service Line Performance and Manage Care Contracting Strategies
Building Blocks to Establish a Distributed Care Delivery Network to Support Core Service Lines
Service Line Pricing Process to Optimize Payer Reimbursement and Manage Financial Risk
Lessons Learned
Q&A and Program Close
© Copyright 2011. Alvarez & Marsal Healthcare Industry Group, LLC. All Rights Reserved. Confidential. For discussion purposes only.
"The best way to predict the future is
to invent it." – Alan Kay
"The future belongs to those who see
possibilities before they become
obvious." – John Sculley
Traditional vs. Population Managed Care Delivery Models
Creating A Future Care Delivery and Financing Model
What type of organization do we need to become to have a sustainable business model under healthcare reform?
3

© Copyright 2011. Alvarez & Marsal Healthcare Industry Group, LLC. All Rights Reserved. Confidential. For discussion purposes only.
TRADITIONAL CARE MANAGEMENT MODEL
Medicare and Medicaid continue to evolve their payment systems (e.g., ACOs) and growing margin gap
FFS with Quality and Other P-4-P incentives… goal to control price
Providers compete for reduced revenues… Do more with less!
5% of patients with high cost/complex care continues to consume 50%+ cost
More physicians seeking employment due to unsustainability of practices
Industry consolidation… big may “win” but may not provide better value
Continued acute care focus
Disaggregation of hospital services to ambulatory… unused capacity increases
Providers at increased bankruptcy risk
POPULATION MANAGEMENT CARE MODEL
ACO and other global capitation or
bundled payment models
– Shared risk for providers
Requires hospitals and physicians to align
and deliver patient care across care
continuums… “In-Network” emphasis”
Key characteristics of a population
management model: – Integrates and coordinates care around
the clinical/social needs of patients
– Focus on health promotion/prevention
– Organized to manage acute and chronic
disease from non-complex to complex
– Balances financial/clinical incentives
– End-to-end patient pathways
– Regional model approach
Traditional vs. Population Managed Care Delivery Models
Macro View - Post ACA Delivery ModelsBest value for buyers and patients?
4
© Copyright 2011. Alvarez & Marsal Healthcare Industry Group, LLC. All Rights Reserved. Confidential. For discussion purposes only.
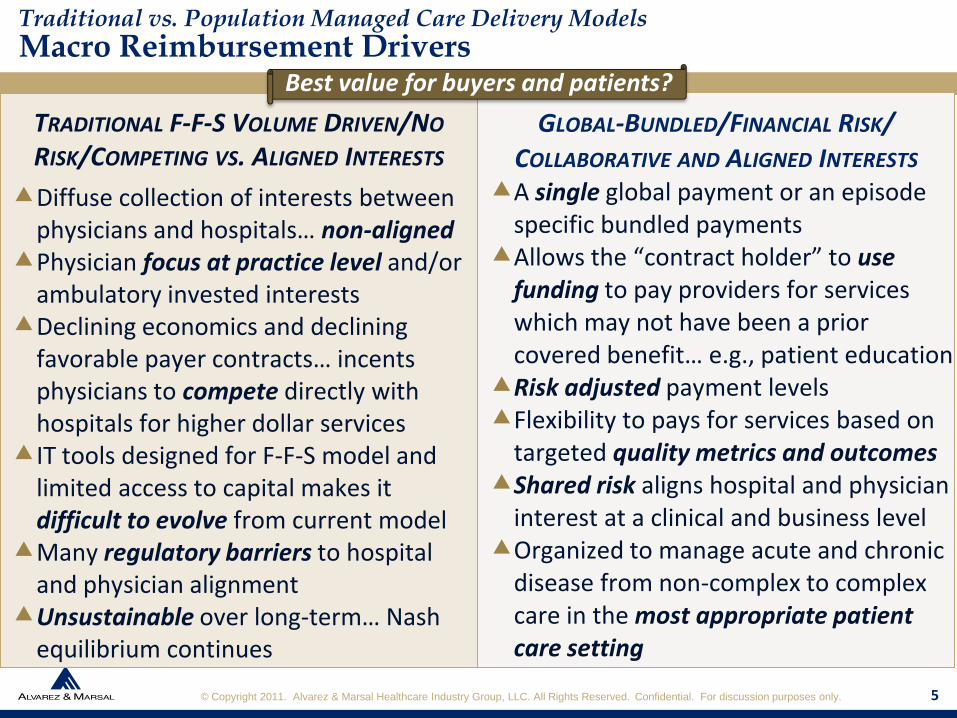
TRADITIONAL F-F-S VOLUME DRIVEN/NO
RISK/COMPETING VS. ALIGNED INTERESTS
Diffuse collection of interests between physicians and hospitals… non-aligned
Physician focus at practice level and/or ambulatory invested interests
Declining economics and declining favorable payer contracts… incents physicians to compete directly with hospitals for higher dollar services
IT tools designed for F-F-S model and limited access to capital makes it difficult to evolve from current model
Many regulatory barriers to hospital and physician alignment
Unsustainable over long-term… Nash equilibrium continues
GLOBAL-BUNDLED/FINANCIAL RISK/
COLLABORATIVE AND ALIGNED INTERESTS
A single global payment or an episode specific bundled payments
Allows the “contract holder” to use funding to pay providers for services which may not have been a prior covered benefit… e.g., patient education
Risk adjusted payment levels Flexibility to pays for services based on
targeted quality metrics and outcomesShared risk aligns hospital and physician
interest at a clinical and business levelOrganized to manage acute and chronic
disease from non-complex to complex care in the most appropriate patient care setting
Traditional vs. Population Managed Care Delivery Models
Macro Reimbursement DriversBest value for buyers and patients?
5

© Copyright 2011. Alvarez & Marsal Healthcare Industry Group, LLC. All Rights Reserved. Confidential. For discussion purposes only.
INDEPENDENT / COOPERATIVE MODEL
Volume rewarded regardless of quality
and patient outcomes
Payer cost containment through price,
payment rules and utilization controls
Pays each provider separately with no
linkage to patient care coordination,
satisfaction or efficiency of services
Does not pay for non-medical services
such as patient education
Provider decisions often made with little
patient understanding of options
Incents providers to focus on services
which reimburse the most vs. what is in
the best clinical interests of the patient
CLINICAL INTEGRATION / ALIGNMENT
Clinical integration model to manage
populations…
– Process integration models
– ACO type integration models
– FTC regulatory type integration models
Various disease/chronic care
management programs in place and
shared payer contractual arrangements
Complete care continuums...
– Vertical integration with physicians
– Distributed network models
– A true clinical and business strategic
alliance can create a market disruptive
care delivery service model
Traditional vs. Population Managed Care Delivery Models
Macro Alignment/Integration DriversBest value for buyers and patients?
6

© Copyright 2011. Alvarez & Marsal Healthcare Industry Group, LLC. All Rights Reserved. Confidential. For discussion purposes only.
INCREMENTAL-MARKET DRIVEN
Preparing for future state… but protective of current model and current services
Characteristics:– Filling service gaps– Protecting and balancing market share…
incremental growth– Transitioning select hospital services to
community based settings– Matrix and Modified Service Lines models
most commonSuccess Measures:
– Market share (inpatient focused)– Quality of care– Patient satisfaction
Risks:– Presumes future much the same as today– Successful innovators– “Fast Following” is a high risk strategy and
capital intensive
INNOVATION-MARKET LEADINGCreating future state:
– Market disruptive alliances/technologies– Leading change
Characteristics:– Program innovation– Population management– Outpatient “hospitals w/o beds”– Built around Divisional Structure Service
Lines and PhysiciansSuccess Measures:
– Population managed is under financial risk-provider accountability
– Quality of care and patient outcomes– Improved patient
experience/convenience– Preventive medicine/healthier popul.– Minimal “out-of-network” leakage
Risks:– Early adoption, uncertainties and capital
intensive
Traditional vs. Population Managed Care Delivery Models
Competitive PositioningBest value for buyers and patients?
7

© Copyright 2011. Alvarez & Marsal Healthcare Industry Group, LLC. All Rights Reserved. Confidential. For discussion purposes only.
Traditional vs. Population Managed Care Delivery Models Healthcare Reform Goals: Federal and State Objectives
The above supports a transition to a new model of care… ACOs are one example of a new model… based on population management!
Combined Effects of Healthcare Reform – Federal and State
State MedicaidSignificant budget challenges,
no longer sustainable
Affordable Care Act and
Medicare Payment ReformsSignificant budget challenges,
no longer sustainable
Integrated care managed across
the care continuum is at
the heart of reform
More affordable coverage and more covered individuals
Reduce the cost growth trend and
promote high-value, effective care
Improve access, quality and patient
safety
Transform the Current Healthcare Delivery & Financing Model
Hold providers accountable for
their performance
Population and disease care management
Financial incentives to better align and
coordinate care deliveryPayment Reform
8

© Copyright 2011. Alvarez & Marsal Healthcare Industry Group, LLC. All Rights Reserved. Confidential. For discussion purposes only. 9
Traditional vs. Population Managed Care Delivery ModelsStrategic Considerations: “C-Suite” Uncertainty - Future Models
Shared requirements for sustainable business models in the future…
1. Reimbursement will reward value/penalize poor value and provider financial
risk will increase.
2. Effective physician alignment and integration is the cornerstone from which
all future service mix and patient strategies must be built.
3. The provider organization’s core care delivery model must account for the
above two pivotal factors.
Reimbursement and Risk
Physician Alignment and Integration
Care Delivery Model

© Copyright 2011. Alvarez & Marsal Healthcare Industry Group, LLC. All Rights Reserved. Confidential. For discussion purposes only.
Lack of a Reliable Measure of Success... patients do not “buy” a "med/surg"
bed yet we contract for med/surg per diems.
Inability to See the Big Picture... traditional hospital organizational structures
consist of care delivery and management silos of activity.
Internal, Hospital-Centric Focus… concentrates on providing services to
patients… without addressing how to bring patients to the hospital to begin
with or whether the services can be delivered closer to home… no one is
responsible for growing the business.
Focus on Cost Management and Benchmarks rather than on Growth, Improving
Quality or Maintaining a Flexible Care Delivery Model... Cost management is
important, especially in an era of budget cuts, reimbursement freezes or
reductions… too much focus on cost management can paralyze an organization
to a level of inaction.
Transitioning to a Service Line Focus
Limitations in Traditional Hospital Services Approach
10
TRADITIONAL VS. SERVICE LINE
APPROACH AT YOUR ORGANIZATION?10

© Copyright 2011. Alvarez & Marsal Healthcare Industry Group, LLC. All Rights Reserved. Confidential. For discussion purposes only. 11
Transitioning to a Service Line Focus
Three Basic Service Line Organizational Models
1. Matrix Organization: Organized around traditional departments and service lines.
Managers and staff have two lines of accountability.
Service Line and Department Managers make joint decisions.
Represents a 1st stage transitional model, but is a complex model to manage and
can lead to directional conflicts.
2. Modified Service Line Divisions: Primary reporting built around self-contained Service Lines to take care of
patients whom fall into Service Line category (e.g., cancer, cardio-vascular).
Primary focus is on service line growth which, however, can lead to conflicts with
shared resources and potential to allocate more resources to traditional high
reimbursement I/P services vs. the overall Service Line care continuum.
3. Divisional Structure Service Lines: Complete divisional focus on Service Line which encompasses the entire care
continuum… hospital becomes a focused-factory model vs. all services model.
Can lead to organizational fragmentation if shared services culture is not present.
© Copyright 2011. Alvarez & Marsal Healthcare Industry Group, LLC. All Rights Reserved. Confidential. For discussion purposes only.
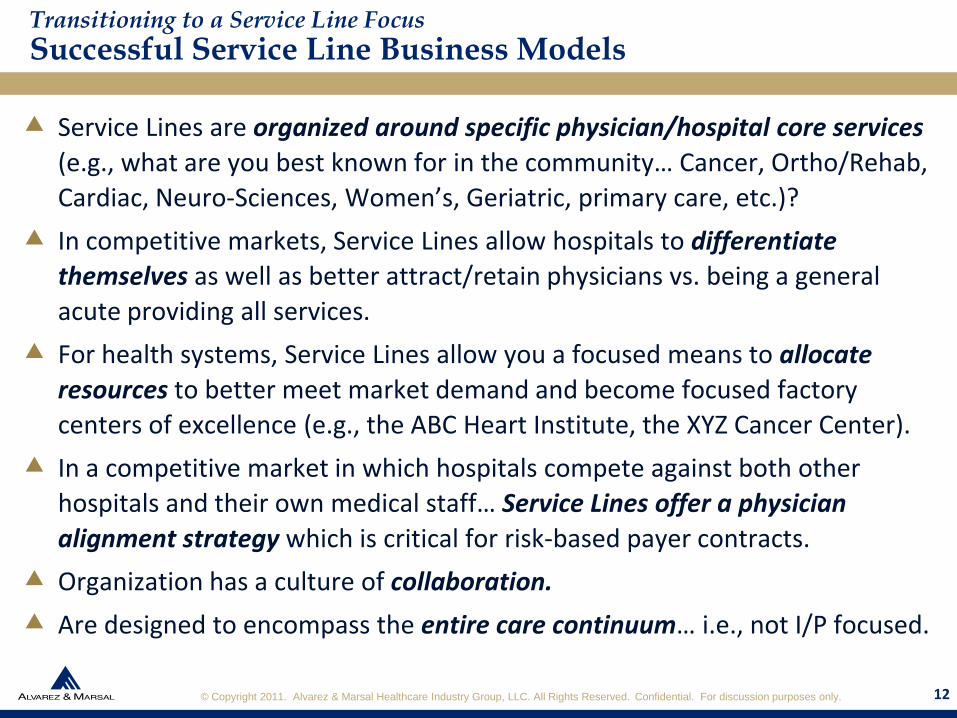
Service Lines are organized around specific physician/hospital core services
(e.g., what are you best known for in the community… Cancer, Ortho/Rehab,
Cardiac, Neuro-Sciences, Women’s, Geriatric, primary care, etc.)?
In competitive markets, Service Lines allow hospitals to differentiate
themselves as well as better attract/retain physicians vs. being a general
acute providing all services.
For health systems, Service Lines allow you a focused means to allocate
resources to better meet market demand and become focused factory
centers of excellence (e.g., the ABC Heart Institute, the XYZ Cancer Center).
In a competitive market in which hospitals compete against both other
hospitals and their own medical staff… Service Lines offer a physician
alignment strategy which is critical for risk-based payer contracts.
Organization has a culture of collaboration.
Are designed to encompass the entire care continuum… i.e., not I/P focused.
Transitioning to a Service Line Focus
Successful Service Line Business Models
12 12

© Copyright 2011. Alvarez & Marsal Healthcare Industry Group, LLC. All Rights Reserved. Confidential. For discussion purposes only. 13
Defining Service Line Core Capabilities Across Care Continuums
F-F-S Service Line Business Models
Define service area(s) and clinical service line area.
Determine which services result in the highest reimbursement.
Define current and anticipated service line needs… inpatient and
acute-care campus (I/P and O/P) focused.
Determine capability to provide services… staffing, clinical and tech
needs.
Determine drivers of profitability… e.g., volume, price, cost, etc.
Integrate Service Line strategy with organizational strategic plan and
market branding strategy.
Build organizational accountability and performance management
mechanisms.
Add Service Line components such as an ambulatory surgery center
based on patient need and profitability contribution to Service Line.
© Copyright 2011. Alvarez & Marsal Healthcare Industry Group, LLC. All Rights Reserved. Confidential. For discussion purposes only.
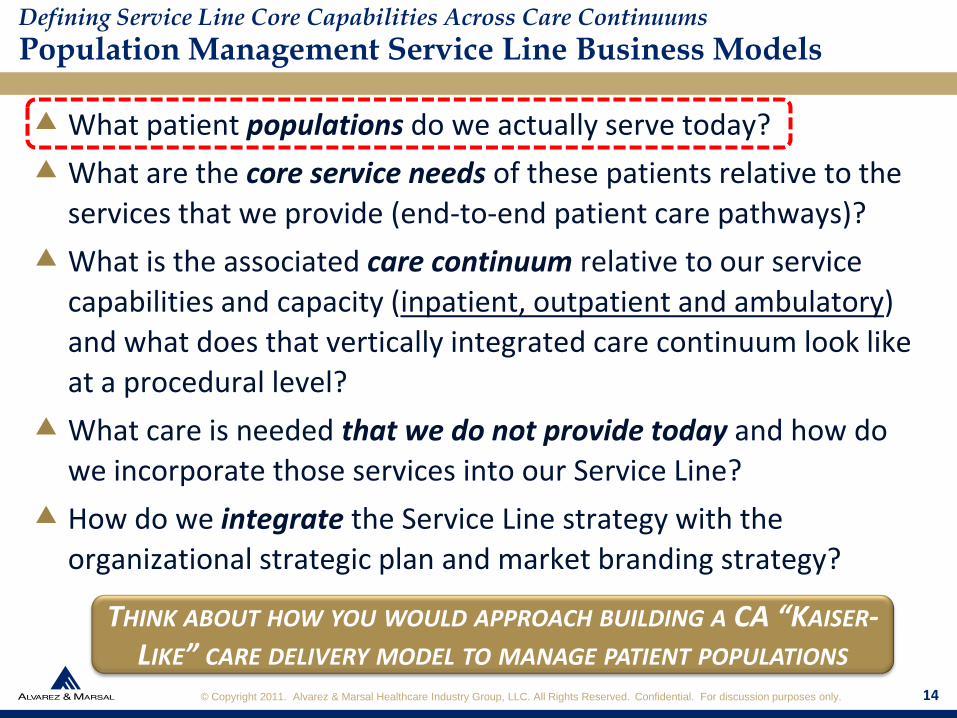
What patient populations do we actually serve today?
What are the core service needs of these patients relative to the
services that we provide (end-to-end patient care pathways)?
What is the associated care continuum relative to our service
capabilities and capacity (inpatient, outpatient and ambulatory)
and what does that vertically integrated care continuum look like
at a procedural level?
What care is needed that we do not provide today and how do
we incorporate those services into our Service Line?
How do we integrate the Service Line strategy with the
organizational strategic plan and market branding strategy?
1414
Defining Service Line Core Capabilities Across Care Continuums
Population Management Service Line Business Models
THINK ABOUT HOW YOU WOULD APPROACH BUILDING A CA “KAISER-LIKE” CARE DELIVERY MODEL TO MANAGE PATIENT POPULATIONS

© Copyright 2011. Alvarez & Marsal Healthcare Industry Group, LLC. All Rights Reserved. Confidential. For discussion purposes only.
How will we address…
…disease management… demand management… catastrophic care
management… disability management… lifestyle management…
individual needs within groups which cross multiple service lines…
alignment of financial incentives… evaluation metrics… organizational
resource allocations… referral coordination in-out of network… IT/data
analytic needs… overall provider network and case management…
patient clinical risk and complexity relative to the most appropriate care
setting… improving the overall patient experience?
How do we price all of the above within our own organization and
on a 3rd party payer basis (e.g., bundled payment or global
capitation)?
1515
Defining Service Line Core Capabilities Across Care Continuums
Population Management Service Line Business Models

© Copyright 2011. Alvarez & Marsal Healthcare Industry Group, LLC. All Rights Reserved. Confidential. For discussion purposes only.
Decline in status due to adverse advent
Trauma/ED-ICU-Acute Care
Injury, illness, surgery or other intervention
Inpatient Rehabilitation –IRFs & Other Sub-Acute
YES
Goal Identification
Further rehabilitation
goals identified, but not met at current level of rehabilitation
Patient re-referred
NO (Identify ongoing patient needs)
Multi-Specialty Center Ambulatory Rehabilitation
Collaborative Care Rehabilitation
Community Rehabilitation
Highest functional level achieved
YES
NO (Identify ongoing patient needs)
Re-referred for additional care
Highest functional level achieved
Highest functional level achieved
Highest functional level achieved
Highest functional level achieved YE
S
NO (Identify ongoing patient needs)
NO (Identify ongoing patient needs)
Re-referred for additional care
YES
NO (Identify ongoing needs)
Re-referred for additional care
YES
DischargeHighest functional level achieved for an individual at the time. Patients with long-term needs can receive expert follow-up and re-enter the care continuum if required.
Hub-and-Spoke Illustration: Rehabilitation Services for Neuro-Spine-Ortho-Stroke
Care
Com
plex
ity
Leve
l
5
2
1
3
4
Defining Service Line Core Capabilities Across Care Continuums
Population Management Service Line Business Models
16
Illustration – Adult-Peds-Seniors: Trauma-Neuro-Spine Service Line Care Continuum
© Copyright 2011. Alvarez & Marsal Healthcare Industry Group, LLC. All Rights Reserved. Confidential. For discussion purposes only.
ACOs, Clinical Integration and Emerging Payment and Value-Driven ModelsMedicare ACOs… Possible Framework for Medicaid As Well
17
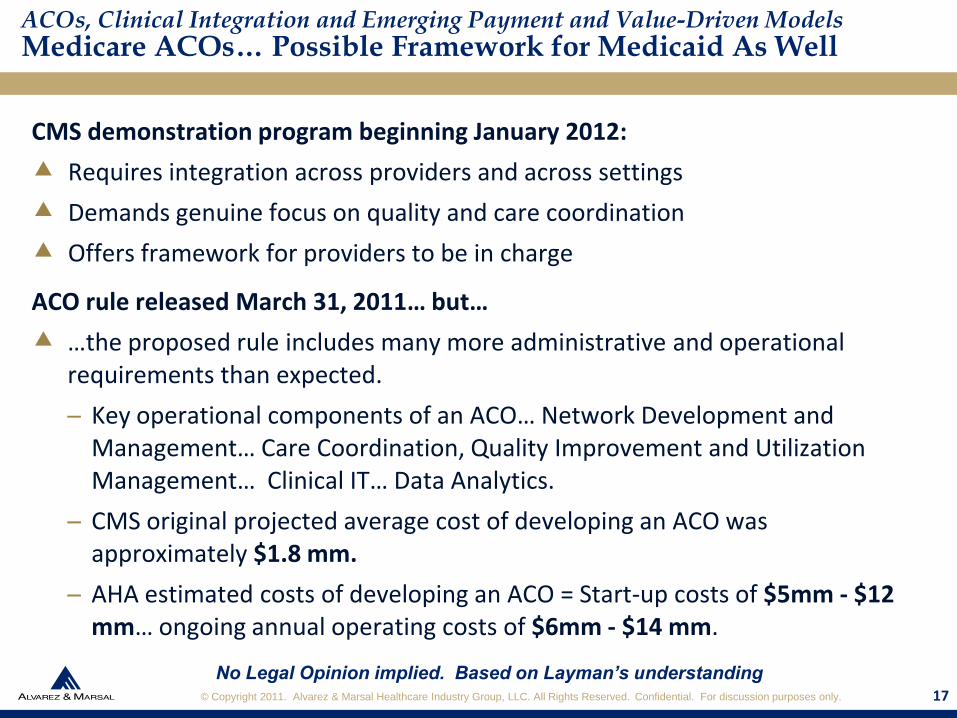
CMS demonstration program beginning January 2012:
Requires integration across providers and across settings
Demands genuine focus on quality and care coordination
Offers framework for providers to be in charge
ACO rule released March 31, 2011… but…
…the proposed rule includes many more administrative and operational requirements than expected.
– Key operational components of an ACO… Network Development and Management… Care Coordination, Quality Improvement and Utilization Management… Clinical IT… Data Analytics.
– CMS original projected average cost of developing an ACO was approximately $1.8 mm.
– AHA estimated costs of developing an ACO = Start-up costs of $5mm - $12 mm… ongoing annual operating costs of $6mm - $14 mm.
17
No Legal Opinion implied. Based on Layman’s understanding

© Copyright 2011. Alvarez & Marsal Healthcare Industry Group, LLC. All Rights Reserved. Confidential. For discussion purposes only.
ACOs, Clinical Integration and Emerging Payment and Value-Driven ModelsMedicare ACOs… Possible Framework for Medicaid As Well
18
ACOs and how they will interact with the Stark Law, the kickback
statute, and Civil Money Penalties Law remains an open
question.
– Clinical integration models allow a “safe harbor” on the
regulatory issues but require significant IT investments and a
broad based alignment and clinical integration of care delivery
with physicians and many provider organizations were hoping
for a less costly and time consumptive solution through ACOs.
How many providers will apply for ACO status in 2012? How many will wait-and-see? What are the risks of either option if the provider organization is
revenue dependent on Medicare patients?
18
No Legal Opinion implied. Based on Layman’s understanding

© Copyright 2011. Alvarez & Marsal Healthcare Industry Group, LLC. All Rights Reserved. Confidential. For discussion purposes only. 19
ACO Eligibility & Structure… an ACO may be formed by:
– Physicians or certain allied health professionals in group practice arrangements.
Networks of such practices (Medicare certified only).
– Joint ventures between such practices and hospitals.
– Hospitals employing physicians or certain allied health professionals.
– Start date for first ACOs… January 1, 2012.
Must be a separate legal entity (LLC, LLP, Foundation, etc) with a TIN.
Governing body must provide “proportionate representation” to various ACO participants.
If approved, ACOs enter into 3-year agreement with CMS, beginning January 1 after approval
– During 3 years, ACOs can remove but may not add ACO participants; ACO may add/remove suppliers.
ACOs, Clinical Integration and Emerging Payment and Value-Driven ModelsMedicare ACOs… Possible Framework for Medicaid As Well
No Legal Opinion implied. Based on Layman’s understanding

© Copyright 2011. Alvarez & Marsal Healthcare Industry Group, LLC. All Rights Reserved. Confidential. For discussion purposes only. 20
Application process requires ACOs to document how they plan to:
– Promote evidence-based medicine… Promote beneficiary engagement… Report internally on quality and cost metrics… Coordinate care.
Operational Requirements… major obligations include:
– Physician-directed quality assurance and performance improvement… Primary care providers must be exclusive to ACO… At least ½ of primary care MDs must qualify as “meaningful users” of electronic medical record technology by end of 1st year of participation… Demonstrated financial capacity to repay any amounts owed to CMS for shared losses… Full-time board-certified medical director physically present at ACO site… Agree to CMS publishing quality and cost-related performance data pertaining to the ACO.
Reimbursement: Two Tracks for Payment, Shared Savings Methodology and a Defined Mechanism for Distribution of Gains/Losses.
ACOs, Clinical Integration and Emerging Payment and Value-Driven ModelsMedicare ACOs… Possible Framework for Medicaid As Well
No Legal Opinion implied. Based on Layman’s understanding

© Copyright 2011. Alvarez & Marsal Healthcare Industry Group, LLC. All Rights Reserved. Confidential. For discussion purposes only. 21
ACOs, Clinical Integration and Emerging Payment and Value-Driven Models
Clinical Integration – FTC Compliance Guideline
FTC review considerations typically encompass the following:
1. Integration of facilities/practitioners that represents true inter-
dependence in collaboration and productive information sharing.
2. Participation of both specialists and primary care physicians, in a way
that requires in-network referrals.
3. Treatment of a broad spectrum of diseases/disorders accompanied by a
comprehensive array of corresponding clinical protocols.
4. Integrated information technology that allows network providers to
efficiently and effectively exchange information regarding patients and
practice experience.
5. Integrated IT in which utilization and claims information is collected,
analyzed, and distributed with the goals of lowering costs, reducing
utilization rates, and improving the quality of care.
No Legal Opinion implied. Based on Layman’s understanding

© Copyright 2011. Alvarez & Marsal Healthcare Industry Group, LLC. All Rights Reserved. Confidential. For discussion purposes only. 22
ACOs, Clinical Integration and Emerging Payment and Value-Driven Models
Clinical Integration – FTC Compliance Guideline
FTC review considerations typically encompass the following:
5. Integrated IT that enables the measurement of physician compliance
and performance, in comparison to widely accepted, peer-reviewed
benchmarks and standards.
6. A high level of physician financial investment and commitment of time
for training and utilization of the system, accompanied by agreement
among physicians to comply with the standards, benchmarks, and
protocols of the network.
7. Processes for improving performance and compliance, with
enforceable consequences for non-compliance.
Greater Rochester IPA (Rochester, NY) – FTC advisory opinion “Gold Standard” for clinical integration. For-profit partnership (PHO) which is 50% owned by non-profit Rochester General Health System (2 hospitals) and 50% owned by physician shareholders who made capital investments ( 430 private practice, 230 employed by RGHS and 120 non-shareholders, representing 41 medical and surgical specialties).
No Legal Opinion implied. Based on Layman’s understanding

© Copyright 2011. Alvarez & Marsal Healthcare Industry Group, LLC. All Rights Reserved. Confidential. For discussion purposes only. 23
ACOs, Clinical Integration and Emerging Payment and Value-Driven Models
Clinical Integration – FTC Perspective: Collective Negotiations
FTC & DOJ Antitrust Policy Regarding “Collective” Contracting:
Each case is evaluated by the specific criterion associated with provider
networks/ affiliations which are created through a clinical integration
business model… if payer contracts do not involve a substantial sharing of
financial risk, there are some common themes the FTC looks for:
Joint contracting is essential to achieve integration goals/results and is
considered… an ancillary requirement.
Same measures across all payers… same network for all payers.
Common procedures at practice level for all contracted plans.
Stable networks… non-exclusive… efficiency in credentialing.
Mechanisms to monitor/control utilization, costs and assure care quality.
– Selectively choosing network physicians to further these objectives.
– Significant investment of human/financial capital to gain efficiencies.
No Legal Opinion implied. Based on Layman’s understanding

© Copyright 2011. Alvarez & Marsal Healthcare Industry Group, LLC. All Rights Reserved. Confidential. For discussion purposes only. 24
Full Global
Capitation
Acct Care Orgs (Physician Model)
Global Hospital
Capitation
Episodes of Care &
Gainsharing
Deg
ree
of F
inan
cial
Ris
k
Global Hospital
Case Rates
Low
High
Risk Withholds
& P-4-P
Hospital PPS (IP/OP)
FFS Charges
Degree of Clinical integration
Medical Homes
High
Low
Non-Competitive Market and
Provider Risk is Uncommon
Competitive Market and
Provider Risk Is Dominant
Care Delivery and Financial Risk Continuum
Required Care Delivery
Model?
Emerging
ACOs, Clinical Integration and Emerging Payment and Value-Driven Models
Payment, Risk Management and Clinical Integration
© Copyright 2011. Alvarez & Marsal Healthcare Industry Group, LLC. All Rights Reserved. Confidential. For discussion purposes only.
25
Clinical and Capital Resource Allocation Decisions
Service Line Organization: Resource Allocation Criterion
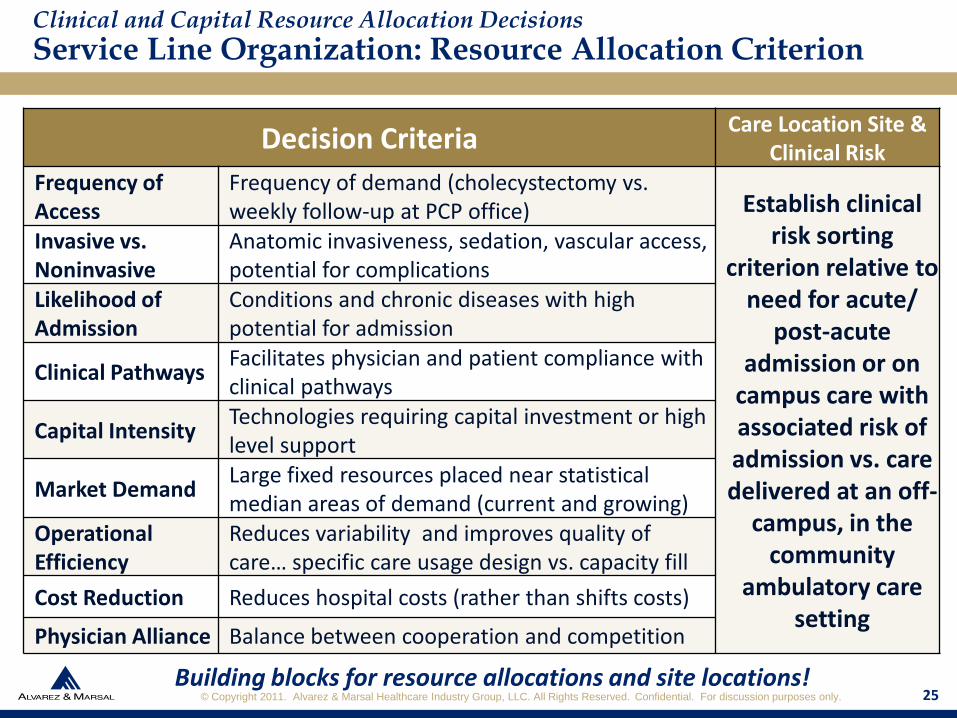
Decision CriteriaCare Location Site &
Clinical RiskFrequency of Access
Frequency of demand (cholecystectomy vs. weekly follow-up at PCP office) Establish clinical
risk sorting criterion relative to
need for acute/ post-acute
admission or on campus care with associated risk of admission vs. care delivered at an off-
campus, in the community
ambulatory care setting
Invasive vs. Noninvasive
Anatomic invasiveness, sedation, vascular access, potential for complications
Likelihood ofAdmission
Conditions and chronic diseases with high potential for admission
Clinical PathwaysFacilitates physician and patient compliance with clinical pathways
Capital IntensityTechnologies requiring capital investment or high level support
Market Demand Large fixed resources placed near statistical median areas of demand (current and growing)
Operational Efficiency
Reduces variability and improves quality of care… specific care usage design vs. capacity fill
Cost Reduction Reduces hospital costs (rather than shifts costs)
Physician Alliance Balance between cooperation and competition
Building blocks for resource allocations and site locations!25

© Copyright 2011. Alvarez & Marsal Healthcare Industry Group, LLC. All Rights Reserved. Confidential. For discussion purposes only.
Clinical and Capital Resource Allocation Decisions
Physical Site of Service Delivery Decision Criterion
26
Market Access
and
Competitiveness
Ability to maximize patient catchment area
Ability to attract and retain physicians and staff
Ability to project a positive image and attract new patients
Ability to have a dominant presence at the site/service cluster
Accessibility Proximity to public transportation
Convenient access for physicians, employees and patients
Deliverability
Availability of adequate contiguous land for new construction/expansion
Compliant land use and ability to obtain zoning variance if necessary
Availability/ability to co-locate supporting service lines (e.g., ambulatory services serving multiple patient populations)
Community
Impact Likelihood of garnering support of neighbors in surrounding
community
Flexibility Ability to expand operations in future/availability of adjoining land
Building blocks for resource allocations and site locations!

© Copyright 2011. Alvarez & Marsal Healthcare Industry Group, LLC. All Rights Reserved. Confidential. For discussion purposes only. 27
PHOs and IPAs can serve as an organizing model for clinical integration and as a platform for offering member physicians various value-added services.
– What about physician business alignment as more-and-more hospitals and physicians are in direct competition with each other?
– Consider the nature of the physician’s practice today... e.g., completely office-based, primarily hospital-based or hospital-independent physicians pursuing service opportunities often offered by the hospital in an outpatient capacity.
Hospitals are also employing more physicians for non-strategic reasons.
Hospitals have... the capability to, if they have the will to... Explore and develop fast-track physician strategic alliances basis... i.e., < 1 year.
Hospital-physician alliances can serve as the strategic framework for the development and implementation of a sustainable business model for the ambulatory care components of service line care continuums.
Physician Alignment Models Which Strengthen Service Lines and Payer Contracts
Alignment Strategy - Employed and Independent Physicians

© Copyright 2011. Alvarez & Marsal Healthcare Industry Group, LLC. All Rights Reserved. Confidential. For discussion purposes only. 28
Physician Collaboration Models to Consider: 1
– Physician Enterprise Model (i.e., one in which the physicians and
hospital retains respective asset/operating license ownership).
– An Equity Joint Venture Model (e.g., can be specific to service lines).
– Leasing Model (e.g., joint venture to acquire leasing equipment).
– Time Share Lease Structure (e.g., fixed blocks of time in an
ambulatory surgery center).
– Under Arrangements Joint Venture (e.g., hospital and physicians
form a JV to acquire imaging equipment and operate at a hospital).
Note: A multitude of legal and regulatory issues are associated with
any type of hospital-physician strategic alliance.
(1) No Legal Opinion implied. Based on Layman’s understanding
Physician Alignment Models Which Strengthen Service Lines and Payer Contracts
Alignment Strategy - Employed and Independent Physicians
© Copyright 2011. Alvarez & Marsal Healthcare Industry Group, LLC. All Rights Reserved. Confidential. For discussion purposes only.
29
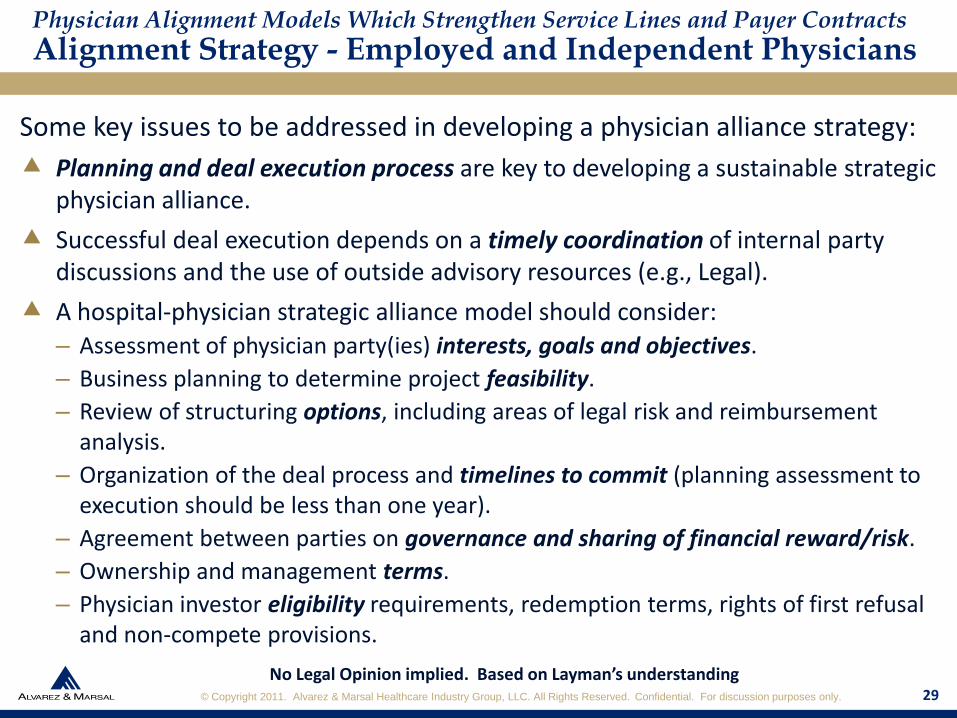
Some key issues to be addressed in developing a physician alliance strategy:
Planning and deal execution process are key to developing a sustainable strategic physician alliance.
Successful deal execution depends on a timely coordination of internal party discussions and the use of outside advisory resources (e.g., Legal).
A hospital-physician strategic alliance model should consider:
– Assessment of physician party(ies) interests, goals and objectives.
– Business planning to determine project feasibility.
– Review of structuring options, including areas of legal risk and reimbursement analysis.
– Organization of the deal process and timelines to commit (planning assessment to execution should be less than one year).
– Agreement between parties on governance and sharing of financial reward/risk.
– Ownership and management terms.
– Physician investor eligibility requirements, redemption terms, rights of first refusal and non-compete provisions.
No Legal Opinion implied. Based on Layman’s understanding
Physician Alignment Models Which Strengthen Service Lines and Payer Contracts
Alignment Strategy - Employed and Independent Physicians
29
© Copyright 2011. Alvarez & Marsal Healthcare Industry Group, LLC. All Rights Reserved. Confidential. For discussion purposes only.
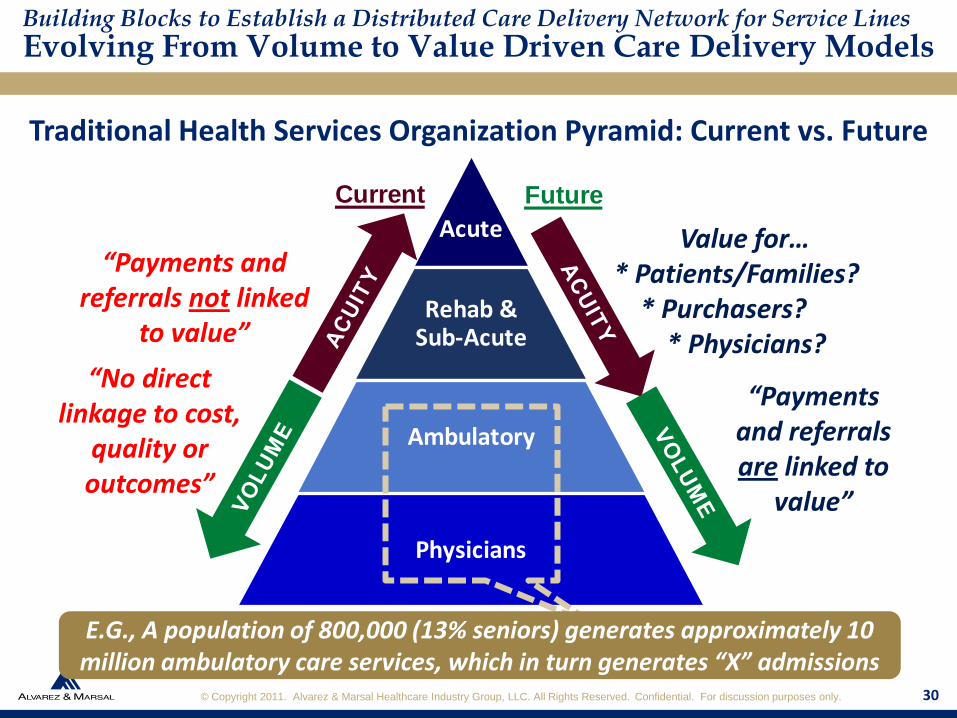
Traditional Health Services Organization Pyramid: Current vs. Future
Current
Acute
Rehab & Sub-Acute
Ambulatory
Physicians
Future
“Payments and referrals not linked
to value”
“No direct linkage to cost,
quality or outcomes”
Value for…* Patients/Families?
* Purchasers?* Physicians?
Building Blocks to Establish a Distributed Care Delivery Network for Service Lines
Evolving From Volume to Value Driven Care Delivery Models
“Payments and referrals are linked to
value”
30
E.G., A population of 800,000 (13% seniors) generates approximately 10 million ambulatory care services, which in turn generates “X” admissions
© Copyright 2011. Alvarez & Marsal Healthcare Industry Group, LLC. All Rights Reserved. Confidential. For discussion purposes only. 31
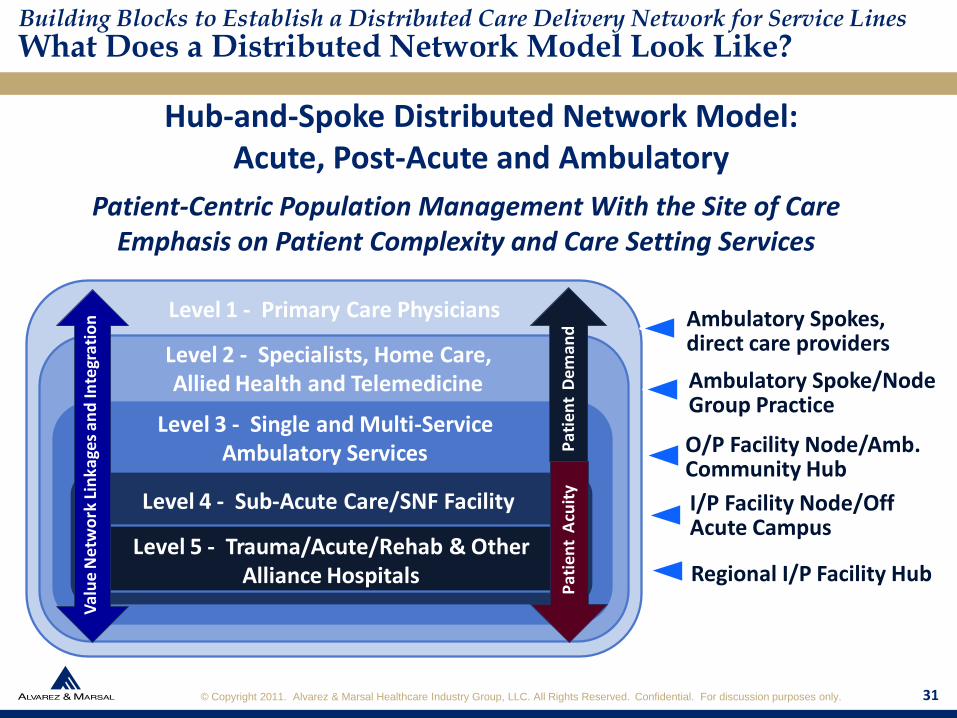
Building Blocks to Establish a Distributed Care Delivery Network for Service Lines
What Does a Distributed Network Model Look Like?
Hub-and-Spoke Distributed Network Model: Acute, Post-Acute and Ambulatory
Level 1 - Primary Care Physicians
Level 2 - Specialists, Home Care, Allied Health and Telemedicine
Level 3 - Single and Multi-Service Ambulatory Services
Level 5 - Trauma/Acute/Rehab & Other Alliance Hospitals
Level 4 - Sub-Acute Care/SNF Facility
Val
ue
Ne
two
rk L
inka
ges
and
Inte
grat
ion
Pat
ien
t D
em
and
Pat
ien
t A
cuit
y
Ambulatory Spokes, direct care providers
Regional I/P Facility Hub
I/P Facility Node/Off Acute Campus
Ambulatory Spoke/Node Group Practice
O/P Facility Node/Amb. Community Hub
Patient-Centric Population Management With the Site of Care Emphasis on Patient Complexity and Care Setting Services

© Copyright 2011. Alvarez & Marsal Healthcare Industry Group, LLC. All Rights Reserved. Confidential. For discussion purposes only.
Safe Elevates the importance of evidence-based safety programs and initiatives
Effective Supports hospital/physician interdisciplinary team approach to care
Patient-Centered
Better support of patient populations managed with ease of navigation between different levels of care/care setting… allowing patients to receive care in the right setting… how, when and where they want to receive care
Accessible Improves the availability of services across the care continuum
EfficientEnhances quality of care through improved efficiencies, by sharing resources and clinical expertise to manage patient care in the most appropriate setting
Equitable Providing needed medical and social support to all patients
Integrated Improves coordination of continuum of care across all “in-network” providers/levels of care… seamless transition from one care level to another
Appropriate Resources
Necessary/appropriate capacity and staffing in place for care provision on-campus/in the community/at home
Enables Pop. Mgmt.
Inpatient, outpatient, ambulatory and wellness resources are organized around the needs of the patient to manage patient care across the care continuum
Building Blocks to Establish a Distributed Care Delivery Network for Service Lines
What Do We Think “Network Value” Looks Like?
32

© Copyright 2011. Alvarez & Marsal Healthcare Industry Group, LLC. All Rights Reserved. Confidential. For discussion purposes only. 33
Building Blocks to Establish a Distributed Care Delivery Network for Service Lines
Key Service Line Care Continuum Priorities – Post the ACA
1. Improving Access and Regional IntegrationIntegrates and coordinates care around the needs of patients, rather than service types, professional boundaries, organizational structures or covered benefits; thereby actively addressing service gaps.
2. Population ManagementOrganizing the distributed network model to deliver patient care “in-network” to the Hospital or Health System; with resources organized around service lines, patient need/clinical risk; with care being provided in an ambulatory setting, whenever appropriate, safe and effective for patients.
3. Transitional Platform and Physician AlignmentAdapting distributed network model to account for the continued decanting of acute care based services to ambulatory settings and integration of physician alignment strategies.
4. Wellness/Prevention/ Chronic Care ManagementDevelop capabilities to prevent acute/chronic care events across the Hospital/Health System network as well as effectively manage chronic care.
5. Aging in PlaceImproving the medical, social and wellness needs of the elderly, whom represent a significant portion of the patient population for the Hospital/Health System.

© Copyright 2011. Alvarez & Marsal Healthcare Industry Group, LLC. All Rights Reserved. Confidential. For discussion purposes only.
Building Blocks to Establish a Distributed Care Delivery Network for Service Lines
E.G., Ambulatory Services Strategy Map - Service Lines
34
WHAT WILL DRIVE MARGINS?– Managed growth in high margin Service Lines… Collaboration vs. competition with
physicians… Affiliated physician in-network care management… Increased cost-efficiencies in care delivery.
HOW?– Attract Service Line patient population through targeted referring physicians who value
leading edge technology and expertise… Aligning with physicians critical to core Service Lines… Co-location of ambulatory hubs in close proximity to where key Service Line physicians practice… PHO financial incentives to provide care at “in-network” designated ambulatory hubs… Employed PCPs refer to PHO specialist physicians… Combined on-campus/off-campus care options… Clinical risk/patient complexity sorting criterion.
WHAT WILL THE INTERNAL FOCUS BE?– Ensure clinical excellence through leading edge programs and techniques in focused
specialty areas… Strategy integration with facility-based services… Develop population management capabilities… Continuous innovation and adaptable models
WILL OUR PEOPLE BE PREPARED TO DO THAT?– Yes, with appropriate technology… Yes, by recruiting critical expertise.
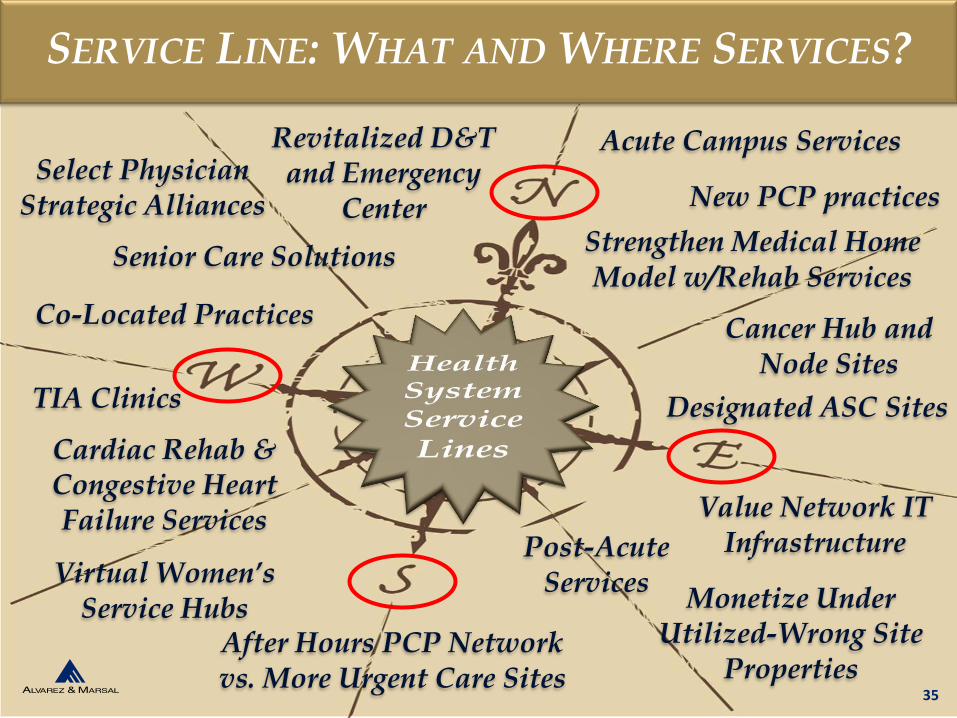
© Copyright 2011. Alvarez & Marsal Healthcare Industry Group, LLC. All Rights Reserved. Confidential. For discussion purposes only. 35
SERVICE LINE: WHAT AND WHERE SERVICES?
TIA Clinics Designated ASC Sites
Co-Located Practices
New PCP practices
Revitalized D&T and Emergency
Center
Virtual Women’s Service Hubs
Cancer Hub and Node Sites
Select Physician Strategic Alliances
Strengthen Medical Home Model w/Rehab Services
Cardiac Rehab & Congestive Heart Failure Services
Monetize Under Utilized-Wrong Site
PropertiesAfter Hours PCP Network vs. More Urgent Care Sites
Value Network IT Infrastructure
Senior Care Solutions
Acute Campus Services
Post-Acute Services

© Copyright 2011. Alvarez & Marsal Healthcare Industry Group, LLC. All Rights Reserved. Confidential. For discussion purposes only.
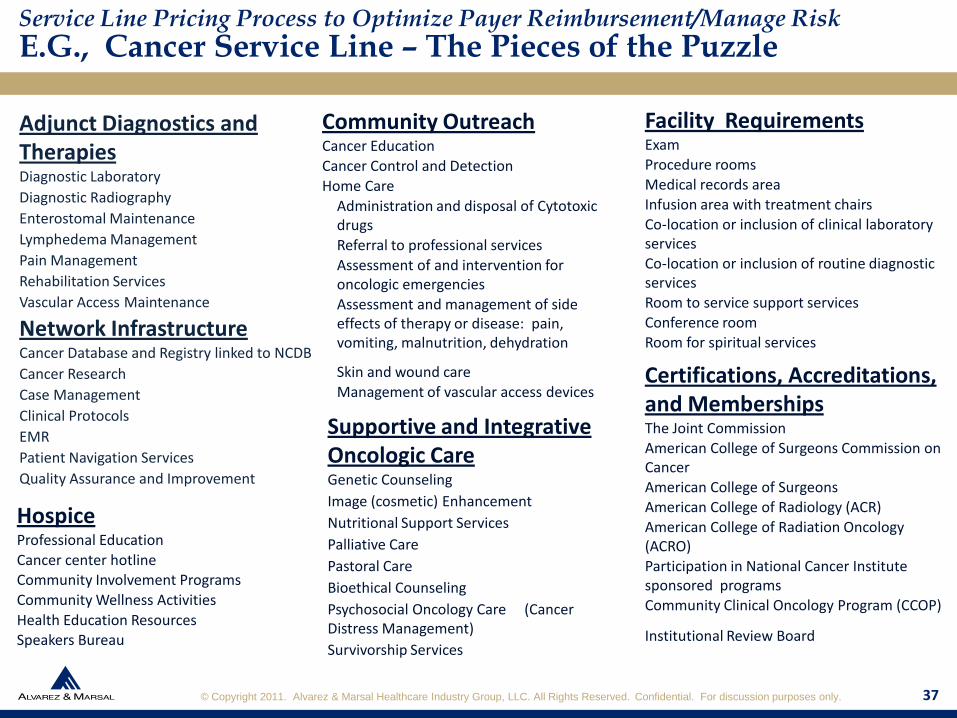
Service Line Pricing Process to Optimize Payer Reimbursement/Manage Risk
E.G., Cancer Service Line – The Pieces of the Puzzle
36
Population ManagementPopulations ServedAdult
Established cancer diagnosis
High-risk pre-cancer
Disease treated by infusion therapy
Multiple Sclerosis
Osteoporosis
Crohn's Disease
Ulcerative Colitis
Rheumatoid Arthritis
Chronic Infection
Populations ExcludedHospice patients
Oncologic emergencies
Pediatrics
Clinical drug research patients
Clinical Human ResourcesMedical Director
Medical Oncologists
Medical Multidisciplinary Team
Oncology Nursing
Radiation Oncologist
Radiation Therapy Support Staff
Support Staff
Core CapabilitiesCentral vascular accessEndoscopic or Radiologic Guided Biopsies
Core CapabilitiesRadiation TherapyDiagnostic Oncology Radiology
PET ScanTissue Diagnostics
BiopsiesBone marrowFlow cytometry
Infusion Center:Cytotoxic chemotherapyAnti-arthritic therapyBlood administrationFirst dose antibioticsHydration
Peripheral vascular accessPharmacy (Oncology)Clinical trials related to supportive care: prevention, screening, and quality of life
Excluded CapabilitiesBreast cancer screeningChemotherapy Sensitivity testing
Cystoscopy
Hospice care
Hysteroscopy
Invasive procedures
Select chemotherapies
Staging procedures (Outpatient)
Stem cell transplantation
Tumor markers
A hospital needs to accurately
track resources used to
support a service line and in
effect… create a service line
financial statement.
DEFINE A SERVICE LINE AT THE PROCEDURAL CODE LEVEL (e.g., MS-DRGs, ICD-9/ICD-10, HCPC, CPT, APC, APG, EAPG, etc.).
© Copyright 2011. Alvarez & Marsal Healthcare Industry Group, LLC. All Rights Reserved. Confidential. For discussion purposes only. 37
Adjunct Diagnostics and TherapiesDiagnostic Laboratory
Diagnostic Radiography
Enterostomal Maintenance
Lymphedema Management
Pain Management
Rehabilitation Services
Vascular Access Maintenance
Network InfrastructureCancer Database and Registry linked to NCDB
Cancer Research
Case Management
Clinical Protocols
EMR
Patient Navigation Services
Quality Assurance and Improvement
Supportive and Integrative Oncologic CareGenetic Counseling
Image (cosmetic) Enhancement
Nutritional Support Services
Palliative Care
Pastoral Care
Bioethical Counseling
Psychosocial Oncology Care (Cancer Distress Management)
Survivorship Services
Community OutreachCancer Education
Cancer Control and Detection
Home Care
Administration and disposal of Cytotoxic drugs
Referral to professional services
Assessment of and intervention for oncologic emergencies
Assessment and management of side effects of therapy or disease: pain, vomiting, malnutrition, dehydration
Skin and wound care
Management of vascular access devices
Facility RequirementsExamProcedure roomsMedical records areaInfusion area with treatment chairsCo-location or inclusion of clinical laboratory servicesCo-location or inclusion of routine diagnostic servicesRoom to service support servicesConference roomRoom for spiritual services
Certifications, Accreditations, and MembershipsThe Joint CommissionAmerican College of Surgeons Commission on CancerAmerican College of SurgeonsAmerican College of Radiology (ACR)American College of Radiation Oncology (ACRO)Participation in National Cancer Institute sponsored programsCommunity Clinical Oncology Program (CCOP)
Institutional Review Board
HospiceProfessional Education
Cancer center hotlineCommunity Involvement Programs
Community Wellness Activities
Health Education ResourcesSpeakers Bureau
Service Line Pricing Process to Optimize Payer Reimbursement/Manage Risk
E.G., Cancer Service Line – The Pieces of the Puzzle

© Copyright 2011. Alvarez & Marsal Healthcare Industry Group, LLC. All Rights Reserved. Confidential. For discussion purposes only. 38
Do you have the data to price correctly?
– How do you know it is correct?
How will you account for both physician costs and physician compensation?
Multiple quality/incentive funds?
How will you manage patient care/pay for care which goes “out of network”?
Impact on Revenue Cycle?
Impact on contracting process?
Comparative external benchmarks on payer reimbursements?
Where are there gaps in the service line care continuum… cost to fill?
Per Diem Conversions to MS-DRG Costs?
WITH GLOBAL CAP/BUNDLED PAYMENTS… YOU CANNOT GET IT WRONG GOING OUT
THE GATE!
Service Line Pricing Process to Optimize Payer Reimbursement/Manage Risk
Service Line Pricing Considerations

© Copyright 2011. Alvarez & Marsal Healthcare Industry Group, LLC. All Rights Reserved. Confidential. For discussion purposes only.
Commercial pricing for the above service line is impacted by government fixed payments, which result in financial losses.
Comm. Payers Cases Actual Days ALOS ChargesActual
Payments
% of BC
PaidTotal Cost
% of BC for
BreakevenCost/Day Net Income Ave. PD
Payer 1 17 425 25.0 3,676,966$ 2,923,413$ 79.51% 1,507,010$ 40.99% 3,546$ 1,416,403$ 6,879$ 194.0%
Payer 2 96 1,964 20.5 18,409,913 8,642,509 46.94% 7,443,733 40.43% 3,790$ 1,198,776 4,400 116.1%
Payer 3 51 1,122 22.0 9,333,443 7,352,584 78.78% 3,882,317 41.60% 3,460$ 3,470,267 6,553 189.4%
Payer 4 24 508 21.2 6,534,899 4,020,352 61.52% 2,494,456 38.17% 4,910$ 1,525,896 7,914 161.2%
Payer 5 20 435 21.8 3,523,656 2,511,578 71.28% 1,453,609 41.25% 3,342$ 1,057,969 5,774 172.8%
Payer 6 19 518 27.3 4,005,415 2,916,214 72.81% 1,696,964 42.37% 3,276$ 1,219,250 5,630 171.8%
Payer 7 15 274 18.3 2,081,169 1,473,573 70.81% 898,855 43.19% 3,280$ 574,718 5,378 163.9%
Other Payers 43 1,174 27.3 10,617,803 6,532,594 61.52% 4,254,728 40.07% 3,624$ 2,277,866 5,564 153.5%
Totals/Wtd Aves 285 6,420 22.5 58,183,264$ 36,372,817$ 62.51% 23,631,672$ 40.62% 3,681$ 12,741,145$ 5,666$ 153.9%
Medicare 95 1,619 17.0 12,576,944$ 4,504,610$ 35.82% 5,255,160$ 41.78% 3,246$ (750,550)$ 2,782$ 85.7%
Medicaid 135 3,508 26.0 32,688,190$ 7,799,230$ 23.86% 12,999,919$ 39.77% 3,706$ (5,200,689)$ 2,223$ 60.0%
Mgd. Medicaid 25 563 22.5 5,235,088$ 1,501,549$ 28.68% 2,099,873$ 40.11% 3,730$ (598,324)$ 2,667$ 71.5%
Other HMO 14 358 25.6 3,298,640$ 19,899$ 0.60% 1,302,044$ 39.47% 3,637$ (1,282,145)$ 56$ 1.5%
Uninsured 4 60 15.0 468,228$ 850$ 0.18% 190,670$ 40.72% 3,178$ (189,820)$ 14$ 0.4%
Other 4 71 17.8 540,255$ 128,868$ 23.85% 222,085$ 41.11% 3,128$ (93,217)$ 1,815$ 58.0%
Totals Gov/Other 277 6,179 22.3 54,807,345$ 13,955,006$ 25.46% 22,069,751$ 40.27% 3,572$ (8,114,745)$ 2,258$ 63.2%
All Payers Comb. 562 12,599 22.4 112,990,609$ 50,327,823$ 44.54% 45,701,423$ 40.45% 3,627$ 4,626,400$ 3,995$ 110.1%
Inpatient Services - A Core Service Line P & L (Tertiary/Quaternary Service Level)
Commercial 3rd Party PayersPay to
Cost %
Government and Other 3rd Party Payers
39
Service Line Pricing Process to Optimize Payer Reimbursement/Manage Risk
Preparing Service Line P&Ls – Inpatient Illustration
Core Service Lines can represent 70%+ of all patient revenues and be the principal source of profit
Building a Population Management Model Requires an Accurate Picture of Payments and Services Utilization Across the Care Continuum in Your Market
39

© Copyright 2011. Alvarez & Marsal Healthcare Industry Group, LLC. All Rights Reserved. Confidential. For discussion purposes only. 40
Much of what a hospital does today can be done in an off-campus ambulatory setting.
Hospitals are not in the “hospital” business, they are in the “patient care” business.
Most solutions to a hospital’s current problems lay outside the four walls of the hospital.
Superior access, quality, outcomes, efficiencies, patient experiences, physician alignment,
clinical integration and purpose built facility designs will lead to a sustainable business
model under either volume driven or value driven models of care.
Current models such as in development ACOs and early stage clinical integration models
will not achieve the desired “savings” being sought by deficit ridden government
agencies, because the necessary infrastructure and hospital-physician-payer incentive
alignment to achieve the desired outcomes… largely does not exist across the U.S.
healthcare system.
Competitive, mature urban markets no longer support the general, all services hospital.
There will be multiple pricing and risk models emerging over the next few years… most
will not achieve substantial savings, absent hospital-physician-payer financial alignment
and collaboration.
Lessons Learned
The Final Word – Irrespective of “Healthcare Reform”
© Copyright 2011. Alvarez & Marsal Healthcare Industry Group, LLC. All Rights Reserved. Confidential. For discussion purposes only. 41
Care delivery models should be designed around:
– The clinical risk/clinical complexity needs of the patient.
– Patient and their physician preference of care setting.
– The real “bending the cost curve” value is in the delivery model… not price controls.
Health Plan “Managed Care” systems are not designed for managing…
– Direct patient care by patient care setting.
– Patient care coordination and referral navigation.
– Patient clinical risk or high cost/complex care.
ACA and State Medicaid reform and current managed care contracts… may grow to
represent 80%+ of patient revenues by 2016 or earlier. Organizational sustainability will
to a large degree depend on “paying me right” (value-driven) vs. “paying me more”
(volume-driven) and will impact all operations, programs and services.
Managed care agreements represent a provider’s only significant opportunity to improve
their net patient revenues and offset underpayments/bad debt/cost shifting from
government payers and the uninsured.
“THINK STRATEGIC OPPORTUNITY!” PLAN AND ACT NOW BEFORE
IT GETS MORE DIFFICULT UNDER HEALTHCARE REFORM.
Lessons Learned
The Final Word – Irrespective of “Healthcare Reform”

© Copyright 2011. Alvarez & Marsal Healthcare Industry Group, LLC. All Rights Reserved. Confidential. For discussion purposes only.
Presenter - Christopher Kalkhof
Chris is a Director with Alvarez & Marsal’s Healthcare Industry Group, based in New York City. He has more than 26 years of
diverse healthcare management experience and he specializes in managed care strategy development and contract negotiations;
contract implementation and integration with revenue cycle/case management processes; provider-payer collaborations; physician
alignment and integration; strategic planning and new product development.
Over the last several years, Chris has spent much of his time assisting clients optimize their net managed care revenue potential,
resulting in net rate increases and revenue improvements of nearly $500 million. Over the span of his career he has gained
managed care related work experience in over 20 states and has directly negotiated hundreds of payer agreements for hospital,
behavioral health, physician, IPA/PHO, home care, hospice and skilled nursing facility clients. He has also reviewed hundreds of
additional payer contracts.
Recent or prior relevant experience has included:
– Developing a broad-based payer pricing and contracting strategy for a 400+ bed tertiary hospital as well as leading the contract
re-negotiations process for 50+ payer product contracts.
– Working with a multi-hospital system to develop an ambulatory services strategy to support the health systems core service
lines and close access gaps while also creating new access points within their respective service line care continuums; while also
being in alignment with their clinical integration and ACO strategy under federal healthcare reform.
– Working with a health system and their clinically integrated PHO to develop a broad-based payer contracting, patient retention
and employer outreach strategy as well as commercial reimbursement benchmarking.
– Working with a large safety net health system to reorganize the managed care department, build a contracts administration
unit, develop service line strategies/external strategic alliances for the organizations inpatient Traumatic Brain Injury, Burn,
Spine, Severe Wound and Polytrauma rehabilitation facility as well as developing enrollment growth and provider contracting
strategies for a system owned health plan.
Prior to joining A&M, Chris was: Director/National Managed Care Lead for a Big 4 firm’s provider consulting practice; Interim SVP of
Delivery Systems/Payer Relations for Saint Vincent Catholic Medical Centers of NY and Co-Chair of the system’s PHO; Interim VP
Managed Care for Christ Hospital (Jersey City, NJ); Director of Managed Care at Doctors Hospital (Houston, TX) through the
bankruptcy and post-bankruptcy ownership change to physicians; Partner in a practice management firm; Director of Marketing
Administration and Professional Relations for a large health insurer; and Product Development Manager for a HMO.
▲ Chris received his Master of Health Administration degree from Tulane University and his Bachelor of Science, degree from Allegheny College. He is a former Chapter President of the HFMA WNY and has received the HFMA Bronze, Silver and Gold awards and has also served as a Yerger judge on two occasions. He is also a Fellow in the American College of Healthcare Executives and a frequent presenter on managed care revenue improvement and physician alignment topics for the HFMA, ACHE, MGMA, WRG and other professional groups. In 2008, Chris served as a member of the NYS Office of Medicaid Inspector General’s Medicaid Managed Care Compliance Program Guidance Advisory Committee.
42
Director,
Healthcare Industry
Group
Christopher Kalkhof
ckalkhof@
alvarezandmarsal.com
347.254.2433
42