final performance mon of yg pv systems feb 28 2014
TRANSCRIPT

Yukon Government Solar Energy Pilot: Performance Monitoring Yukon Government’s Energy Solutions Centre
February2014

YG Solar PV Pilot: Performance Monitoring Summary
Energy Solutions Centre Page 2 of 19 February 2014
Contents1. Project Overview ................................................................................................................................... 3
2. System Specifications ............................................................................................................................ 3
2.1. Yukon Government Main Administration Building (MAB) PV System .......................................... 3
2.2. Yukon College Renewable Energy Demonstration Site ................................................................ 4
2.3. Northern Lights Space and Science Centre ................................................................................... 4
3. Yukon’s Solar Resource ......................................................................................................................... 4
3.1. NASA SSE Satellite Data ................................................................................................................ 5
3.2. Yukon’s 20 Year Average Solar Resource ...................................................................................... 5
4. Estimated/Modelled System Performance ........................................................................................... 8
4.1. Natural Resources Canada (NRCan) Map of PV Potential in Canada ............................................ 8
4.2. RetScreen® Performance Estimate for PV and Wind .................................................................... 9
4.3. PVSyst® Performance Modelling ................................................................................................... 9
5. Measured System Performance ............................................................................................................ 9
5.1. MAB PV System Performance ..................................................................................................... 10
5.2. Yukon College PV System Performance ...................................................................................... 11
1.1. Watson Lake PV System Performance ........................................................................................ 13
2. Operations and Maintenance ............................................................................................................. 14
3. Economic Analysis ............................................................................................................................... 15
3.1. Current Installed Cost ................................................................................................................. 15
3.2. Comparison with Alternatives .................................................................................................... 15
3.3. Micro‐Scale PV System Economics ............................................................................................. 17
4. Conclusions ......................................................................................................................................... 19
5. Next Steps ........................................................................................................................................... 19

YG Solar PV Pilot: Performance Monitoring Summary
Energy Solutions Centre Page 3 of 19 February 2014
1. ProjectOverviewThis report presents the performance monitoring results of three, grid connected, solar electric (also
called “photovoltaic”) demonstration sites monitored by the Yukon government’s Energy Solutions
Centre (ESC). These grid‐connected renewable systems provide some of the electricity for the buildings
in which they are connected. The balance of buildings’ electrical demands is delivered via the local
electrical grid. These solar systems reduce the total electrical consumption of the buildings, offer an
opportunity to evaluate the effectiveness of this technology in the Yukon’s unique northern climate, and
allow the Yukon government to build capacity and knowledge of this technology amongst Yukon
contractors and public.
The first site consists of a grid‐connected photovoltaic (often abbreviated as PV) system installed on the
Yukon government’s Main Administration Building (MAB) located in Yukon’s capital city of Whitehorse.
The second site also consists of a ground mounted PV system installed at the Yukon College, Whitehorse
Campus. The third site consists of a roof mounted PV system on the Yukon’s Northern Lights Space and
Science Centre located in the community of Watson Lake (www.northernlightscentre.ca).
Figure 1.1: Photos of the MAB, College, and Watson Lake Space and Science Centre PV Systems
2. SystemSpecificationsDetailed specifications for these three systems are given below:
2.1. YukonGovernmentMainAdministrationBuilding(MAB)PVSystem
The MAB PV system consists of 24 Sharp 170 watt PV modules arranged in three strings of eight for
a total power at standard test conditions (STC)1 of 4.08 kilowatts (kW). This system feeds power to
the grid through an SMA SB3800U inverter. It was installed and commissioned in winter 2008.
The modules are installed on a flat portion of the roof of the MAB and mounted using a ballasted
mounting system that avoids the requirement for roof penetrations that may cause leaks (a
common concern with flat roofs).
1 Standard Test Conditions (STC) represent a set of environmental values including sunlight, temperature and air density at which the power
performance of the array is measured. The actual power numbers realized in practical applications are typically less than these numbers;
however, STC offers an excellent means by which to compare PV systems.

YG Solar PV Pilot: Performance Monitoring Summary
Energy Solutions Centre Page 4 of 19 February 2014
The modules are oriented due south at a tilt angle of 47O from vertical. This system was
commissioned in December2008 and has been operating without interruption since that time.
2.2. YukonCollegeRenewableEnergyDemonstrationSiteThe Yukon College Renewable Energy Demonstration project consists of both a PV system and a
small wind turbine. The PV system is made up of 30 Hoxan 50 watt PV modules arranged in a single
string for a total rated STC power of 1.5 kW. This system feeds power to the grid through an SMA
1100U inverter. These panels are ground mounted on a custom made mounting apparatus. The
panels are oriented due south and are currently set at a tilt angle of 64O from vertical; however, the
tilt angle for this mounting system is fully adjustable.
This system was originally installed and commissioned in 1992 as an off‐grid demonstration project.
It was later converted to a grid‐tied system in 2000. The PV system, inverter, and wind turbine were
upgraded in 2008/2009 with formal monitoring of the system’s performance beginning in
September 2009.
2.3. NorthernLightsSpaceandScienceCentreThe Northern Lights Space and Science Centre renewable energy system consists of 24 Coenergy
185 watt PV modules that are arranged in three strings of eight for a total rated STC power of 4.4
kW. This system feeds power to the grid through an SMA 4000U inverter. It was installed and
commissioned in April 2011 with monitoring starting in September 2011.
The modules are installed on a pitched portion of the roof of the building using a mounting system
that allows the panels’ tilt angle to exceed the roof’s pitch so as to optimize snow shedding in the
winter and improve the modules’ orientation for best performance.
The modules are oriented due south at a tilt angle of 60O from vertical. This system has operated
without incident since its original installation in the spring of 2011.
3. Yukon’sSolarResourceYukon has significant natural resources including both wind and sun. Despite common misconceptions,
Yukon has an excellent solar resource through most of the year that, on an annual basis, is comparable
with many of jurisdictions that are currently leading the world in solar installation (Japan, Germany,
Ontario, and the United States).
The following is a brief summary of Yukon’s solar resource data collected to date.

YG Solar PV Pilot: Performance Monitoring Summary
Energy Solutions Centre Page 5 of 19 February 2014
3.1. NASASSESatelliteDataFigure 3.1 below gives an estimated solar irradiance2 on a horizontal surface for various Yukon sites
based on NASA SSEE satellite data collected between 1983 and 2006.
Figure 3.1: Daily solar irradiance on a horizontal surface NASA SSEE Satellite data3 (1983‐2006)
This data clearly shows the trend of solar resource on a horizontal surface over the course of a year
and demonstrates the significant resource available even in Yukon’s most northern communities.
3.2. Yukon’sMeasured20YearAverageSolarResourceEnvironment Canada collected solar irradiance data for the City of Whitehorse for a 20‐year period
between 1974 and 1994. Subsequently ESC has been collected solar data at its Whitehorse
renewable energy Yukon College site from September 2009 to present. The results of Environment
Canada’s 20‐year daily average solar irradiance versus the data collected over the past four years by
ESC is shown in Figure 3.2 below.
2 Irradiance is the density of radiation incident on a given surface usually expressed in watts per square centimeter or square meter 3 These data were obtained from the NASA Langley Research Center Atmospheric Science Data Center, Surface meteorological and Solar Energy (SSE) web portal supported by the NASA LaRC POWER Project.
Jan Feb Mar Apr May Jun Jul Aug Sep Oct Nov Dec Ann
Watson Lake 0.36 1.16 2.61 4.48 5.57 5.85 5.18 4.32 2.74 1.46 0.55 0.21 2.87
Whitehorse 0.36 1.12 2.42 4.19 5.52 6 5.48 4.37 2.73 1.44 0.55 0.21 2.87
Dawson/Mayo 0.15 0.79 2.13 3.98 5.25 5.99 5.41 4.06 2.56 1.17 0.3 0.04 2.65
Old Crow 0.04 0.47 1.77 3.68 5.48 6.39 5.55 3.86 2.31 0.9 0.13 0 2.55
0.0
1.0
2.0
3.0
4.0
5.0
6.0
7.0
Solar Insulation (kW
h/m
2/D
ay

YG Solar PV Pilot: Performance Monitoring Summary
Energy Solutions Centre Page 6 of 19 February 2014
Figure 3.2: Daily Solar Irradiance on a Horizontal Surface; Measured (July 2009‐Nov. 2013) and 20 Year Average
(1974‐1994)
Figures 3.1 and 3.2 above show that the territory’s solar resource is predictable and has remained
relatively unchanged over the last 40 years.
The above data demonstrates the annual cycle of the solar resource in the territory; however, it is
important to note that these measurements were taken, as per standard practice, on a fixed
horizontal plain which is strongly biased towards mid‐summer months when the sun is at its highest.
In reality a more ideal orientation for total annual solar collection in the north would be a surface
tilted towards the southern hemisphere. As demonstrated in Figure 3.3 below, a strongly tilted
surface will result in greater solar collection during the spring and fall months with a slight
compromise of decreased collection in the mid‐summer months.
0
1000
2000
3000
4000
5000
6000
7000
8000
9000
Jul‐0
9
Oct‐0
9
Jan‐10
Apr‐1
0
Jul‐1
0
Sep‐10
Dec‐1
0
Mar‐1
1
Jun‐11
Sep‐11
Dec‐1
1
Mar‐1
2
Jun‐12
Sep‐12
Dec‐1
2
Mar‐1
3
Jun‐13
Sep‐13
Dec‐1
3
Mar‐1
4Watt‐hour/m
2
Daily Irr. (Meas.)
20 yr. Average

YG Solar PV Pilot: Performance Monitoring Summary
Energy Solutions Centre Page 7 of 19 February 2014
Figure 3.3: Tilt Angle effect on solar collection (RetScreen® data)
Based on RetScreen® and PVSyst® simulations the ideal tilt angle for maximum annual solar collection in
the southern/central Yukon is between 45O and 55O; however, there is very little lost in annual
performance with tilt angles between 40O and 60O . This is in slight contrast to the conventional
understanding which states that the optimum tilt angle for such a systems should be equivalent to the
latitude of the installation, which would make it close to 60O for the southern Yukon. The combination of
low winter light levels, snow covering the panels, and good spring performance is likely the cause of this
discrepancy.
Regardless of the cause, the reality is that the effect of tilt angle is likely not as important to annual
system performance in Yukon as it is to seasonal performance (i.e., improved spring/fall performance
versus improved summer performance).
It is also worth noting that, regardless of tilt angle, solar resource for the months of December and
January are consistently very low due to limited sun hours and snow covering the panels.

YG Solar PV Pilot: Performance Monitoring Summary
Energy Solutions Centre Page 8 of 19 February 2014
4. Estimated/ModelledSystemPerformanceESC used three separate tools to evaluate the potential energy generation of these systems before
installation took place: Natural Resources Canada’s PV performance estimate maps, RetScreen®
performance evaluation software, and the PVSyst® PV simulation software.
4.1. NaturalResourcesCanada(NRCan)MapofPVPotentialinCanadaNRCan, CanMet, Canadian Forest Service, and Environment Canada have collaborated to develop an
interactive map that offers a rough approximation of the potential for PV throughout Canada that
can be found here pv.nrcan.gc.ca .
Figure 4.1: NRCan PV Potential Map of Canada
According to this tool the majority of Yukon has the potential to receive between 900 ‐ 1,000
kilowatt hours (kWh) per kW of installed PV. This is on par with a large portion of British Columbia
and only slightly lower in potential than the rest of Canada on an annual resource basis.
YG Solar PV Pilot: Performance Monitoring Summary
Energy Solutions Centre Page 9 of 19 February 2014
Year
Meas.
Annual PV
Gen.
(kWh/y)
Meas.
Annual PV
kWh/kWp/y
Meas. Vs.
Simulation
(% better
then Sim.)
Meas.
Annual PV
Gen.
(kWh/y)
Meas.
Annual PV
kWh/kWp/y
Meas. Vs.
Simulation
(% better
then Sim.)
Meas.
Annual PV
Gen.
(kWh/y)
Meas.
Annual PV
kWh/kWp/y
Meas. Vs.
Simulation
(% better
then Sim.)2009 4,294 1,047 6.8%2010 4,563 1,113 13.5% 1,264 843 0.3%2011 4,361 1,064 8.5% 1,230 820 ‐2.4%2012 4,309 1,051 7.2% 1,197 798 ‐5.0% 4,332 985 ‐17.6%2013 4,544 1,108 13.0% 1,257 838 ‐0.2% 4,390 998 ‐16.5%
Average 4,414 1,077 9.8% 1,237 825 ‐1.8% 4,361 991 ‐17.0%
Main Admin. Building (Whse) Yukon College/NRI (Whse) Space Centre (Watson Lake)
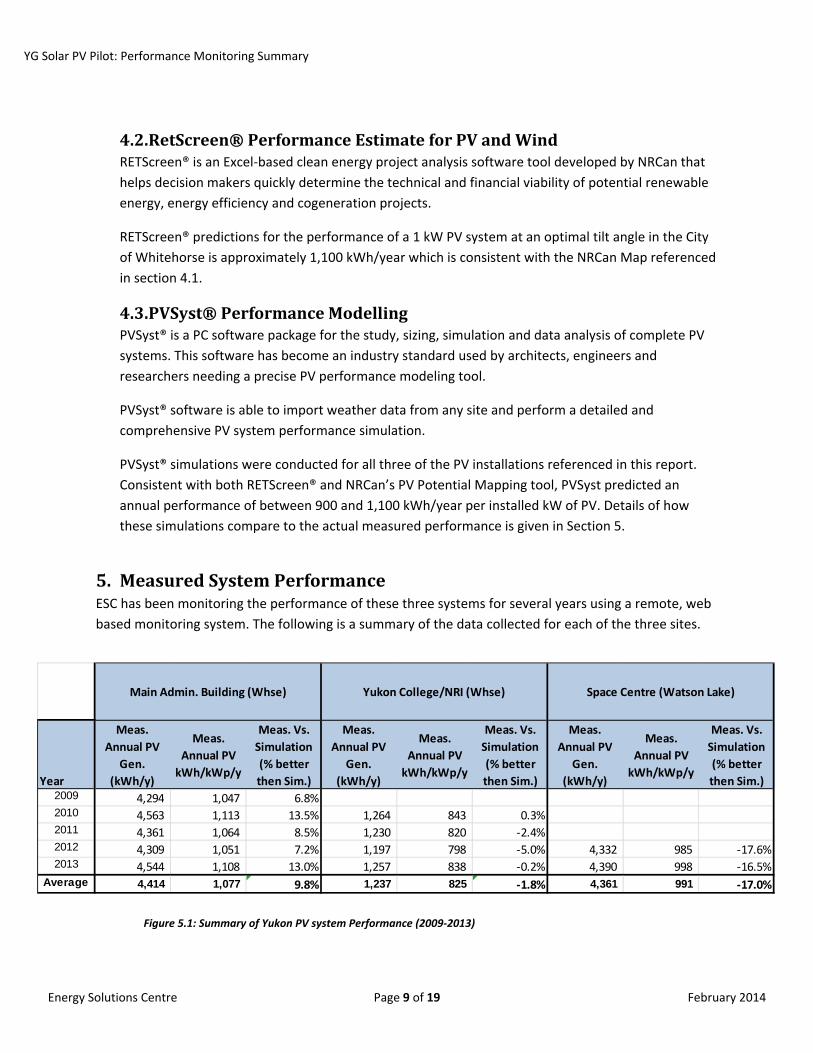
4.2. RetScreen®PerformanceEstimateforPVandWindRETScreen® is an Excel‐based clean energy project analysis software tool developed by NRCan that
helps decision makers quickly determine the technical and financial viability of potential renewable
energy, energy efficiency and cogeneration projects.
RETScreen® predictions for the performance of a 1 kW PV system at an optimal tilt angle in the City
of Whitehorse is approximately 1,100 kWh/year which is consistent with the NRCan Map referenced
in section 4.1.
4.3. PVSyst®PerformanceModellingPVSyst® is a PC software package for the study, sizing, simulation and data analysis of complete PV
systems. This software has become an industry standard used by architects, engineers and
researchers needing a precise PV performance modeling tool.
PVSyst® software is able to import weather data from any site and perform a detailed and
comprehensive PV system performance simulation.
PVSyst® simulations were conducted for all three of the PV installations referenced in this report.
Consistent with both RETScreen® and NRCan’s PV Potential Mapping tool, PVSyst predicted an
annual performance of between 900 and 1,100 kWh/year per installed kW of PV. Details of how
these simulations compare to the actual measured performance is given in Section 5.
5. MeasuredSystemPerformanceESC has been monitoring the performance of these three systems for several years using a remote, web
based monitoring system. The following is a summary of the data collected for each of the three sites.
Figure 5.1: Summary of Yukon PV system Performance (2009‐2013)

YG Solar PV Pilot: Performance Monitoring Summary
Energy Solutions Centre Page 10 of 19 February 2014
5.1. MABPVSystemPerformanceThe PV system at the MAB was installed in December 2008 providing five years of performance data
for this site.
Figure 5.2 below shows the PV system generation on a monthly basis at the MAB alongside the
PVSyst® simulation for that system which is based on Environment Canada weather data averaged
from 1974 to 1994. This chart shows that the generation at this site over the past 4 years agrees
strongly with the predictions made by the PVSyst® simulation.
PVSyst® predicted the performance of this system to be approximately 4,020 kWh/year while the
system actually produced an average of 4,414 kWh/year; approximately 10% above the predicted
generation. Some of this increase can be accounted for by the greater than average solar resource
during these five years. From 2009 through 2013 the solar irradiance in Yukon measured on a
horizontal plane was approximately 3.6% greater than the 20 year average measured from 1974‐
1994.
Figure 5.2: MAB PV System Performance 2009‐2013
0
100
200
300
400
500
600
700
800
Jan‐09
Apr‐…
Jul‐0
9
Oct‐…
Jan‐10
Apr‐…
Jul‐1
0
Oct‐…
Jan‐11
Apr‐…
Jul‐1
1
Oct‐…
Jan‐12
Apr‐…
Jul‐1
2
Oct‐…
Jan‐13
Apr‐…
Jul‐1
3
Oct‐…
Monthly Generation (kW
h/m
onth)
Measured Monthly PV Gen.
PVSyst® Sim (based on 1974‐94weather data)

YG Solar PV Pilot: Performance Monitoring Summary
Energy Solutions Centre Page 11 of 19 February 2014
Year
Meas.
Annual PV
Gen.
(kWh/year)
Meas.
Annual PV
kWh/kWp/y
ear
Meas. Vs.
Simulation
(% better
then Sim.)
Meas.
Annual Irr.
(kWh/m2)
Meas. Vs.
1974‐94
Average (%
better then
Av.)
2009
2010 1,264 843 0.3% 1,049 4.3%2011 1,230 820 ‐2.4% 1,043 3.7%2012 1,197 798 ‐5.0% 1,033 2.7%2013 1,257 838 ‐0.2% 1,080 7.4%
Average 1,237 825 ‐1.8% 1,051 3.6%
Year
Meas. Annual PV
Gen. (kWh/year)
Meas. Annual PV
kWh/kWp/year
Meas. Vs. Simulation (% better then Sim.)
Meas. Annual Irr. (kWh/m2)
Meas. Vs. 1974‐94 Average (% better then Av.)
2009 4,294 1,047 9.5%2010 4,563 1,113 16.4% 1,049 4.3% 2011 4,361 1,064 11.2% 1,043 3.7% 2012 4,306 1,050 9.8% 1,033 2.7%
Average 4,381 1,069 11.8% 1,041 3.6% Figure 5.3: MAB PV System Performance 2009‐2013 vs. Simulation based on 1974‐94 weather data
This system averaged 1,069 kWh/year per installed kW, which is consistent with the estimates made by
NRCan, RETScreen® and PVSyst® as described in Section 4 above.
5.2. YukonCollegePVSystemPerformanceThe PV system at the Yukon College was originally installed in 1992 and was re‐commissioned with a
new inverter in 2008/2009 through a partnership between ESC and the Northern Research Institute
(NRI). Data monitoring for the project began in September 2009, providing three years of
performance data for this site.
Figure 5.4 below shows the PV system generation on a monthly basis at the college, alongside the
PVSyst® simulation for that system, which is based on Environment Canada weather data averaged
from 1974 to 1994. This chart shows that the generation at this site over the past four years is
consistent with the predictions made by the PVSyst® simulation.
Figure 5.4: Yukon College PV System Performance 2010‐2012 vs. Simulation based on 1974‐94 weather data

YG Solar PV Pilot: Performance Monitoring Summary
Energy Solutions Centre Page 12 of 19 February 2014
PVSyst® predicted the performance of this system to be approximately 1,260 kWh/year while the
system actually produced an average of 1,237 kWh/year; approximately 2% below the predicted
generation. Some of this decrease is likely as a result of shading effects associated with the large
number of buildings and other structures in the vicinity of the installation. It is also likely that the
age of these modules may be having a small effect on performance. Despite the relatively slight
decrease in performance over the prediction, this system continues to show impressive
performance even after 20 years of operation in the harsh Yukon environment.
Figure 5.5: Yukon College PV System Performance 2009‐2012
0
50
100
150
200
250
Sep‐09
Nov‐0
9
Jan‐10
Mar‐1
0
May‐1
0
Jul‐1
0
Sep‐10
Nov‐1
0
Jan‐11
Mar‐1
1
May‐1
1
Jul‐1
1
Sep‐11
Nov‐1
1
Jan‐12
Mar‐1
2
May‐1
2
Jul‐1
2
Sep‐12
Nov‐1
2
Jan‐13
Mar‐1
3
May‐1
3
Jul‐1
3
Sep‐13
Nov‐1
3Monthly Generation (kW
h/m
onth)
College Monthly PV Energy (kWh)
PVSyst® Sim (based on 1974‐94 weatherdata)

YG Solar PV Pilot: Performance Monitoring Summary
Energy Solutions Centre Page 13 of 19 February 2014
5.3. WatsonLakePVSystemPerformanceThe PV system at the Watson Lake Space and Science Centre was installed in April 2011 through a
partnership between ESC and the Town of Watson Lake. Data monitoring for the project began in
September 2011 providing two years of performance data for this site.
Figure 5.7 below shows the PV system generation on a monthly base at the Centre alongside the
PVSyst® simulation for that system which is based on NASA SSEE satellite data collected from 1983
to 2006. This chart shows that the generation at this site over the past two years agrees with the
predictions made by the PVSyst® simulation.
PVSyst® predicted the performance of this system to be approximately 5,257 kWh/year while the
system actually produced an average of 4,361 kWh/year; approximately 17% below the predicted
generation. Some of this decrease is likely as a result of significant snow cover on the panels in this
area which results in very poor performance during the winter months and is not captured by the
simulation software due to this simulation’s reliance on satellite data (inherently less reliable then
data collected terrestrially such as the data for Whitehorse). A more detailed evaluation of the
performance of this system may be warranted based on site solar resource data collection.
Despite lower than predicted performance from the PVSyst® simulation, this system averages 991
kWh per kW of installed PV per year which is very much consistent with both RETScreen® and
NRCan predictions for Yukon and is a respectable performance that proves the viability of this
technology in the Watson Lake area.
Figure 5.6: Watson Lake Science Centre PV System Performance 2012‐2013 vs. Simulation based on NASA Satellite
data
Year
Meas. Annual
PV Gen.
(kWh/year)
Meas. Annual
PV
kWh/kWp/year
Meas. Vs.
Simulation (%
better then
Sim.)
2012 4,332 985 ‐17.6%2013 4,390 998 ‐16.5%
Average 4,361 991 ‐17.0%

YG Solar PV Pilot: Performance Monitoring Summary
Energy Solutions Centre Page 14 of 19 February 2014
Figure 5.7: Watson Lake Space and Science Centre PV System Performance 2011‐2013
6. OperationsandMaintenanceESC managed the installation of both the MAB PV system and the Watson Lake Space Centre system in
2008 and 2011 respectively. Performance monitoring of these two systems began soon after system
commissioning was complete. ESC worked with the NRI to make improvements to the existing PV
system at the Yukon College in 2008/2009 including replacing the inverter with a more efficient and
appropriate technology as well as removing panels that had been damaged by a vandalism incident.
Over the course of the five years that ESC has monitored these systems they have operated without
interruption. No maintenance has been required outside of the optional sweeping of snow from
modules during the winter months. To date there have been no costs associated with the operations
and maintenance of these three systems.
0
100
200
300
400
500
600
700
800
Sep‐11
Oct‐1
1
Nov‐1
1
Dec‐1
1
Jan‐12
Feb‐12
Mar‐1
2
Apr‐1
2
May‐1
2
Jun‐12
Jul‐1
2
Aug‐1
2
Sep‐12
Oct‐1
2
Nov‐1
2
Dec‐1
2
Jan‐13
Feb‐13
Mar‐1
3
Apr‐1
3
May‐1
3
Jun‐13
Jul‐1
3
Aug‐1
3
Sep‐13
Oct‐1
3
Nov‐1
3Monthly Generation (kW
h/m
onth)
WL Monthly PV Energy (kWh)
PVSyst® Sim (based on NASA SSE Satellite Data)

YG Solar PV Pilot: Performance Monitoring Summary
Energy Solutions Centre Page 15 of 19 February 2014
The Yukon College PV system was originally installed in 1992. Limited data monitoring for the system
existing until the system was re‐commissioned in 2009. Through discussions with those involved in the
operation of the system during the years between 1992 and 2008, it appears that this system operated
without any challenges with the exception of a vandalism incident that resulted in 25% of the modules
being damaged. Despite the damage that occurred to these modules the system was found to be
operational in 2008 when ESC began working with NRI to undertake the upgrades. These PV modules
continue to perform well today despite being in operation in Yukon’s harsh environment for over 20
years.
7. EconomicAnalysisWhile the monitoring of these three systems over the past several years has proven definitively that
solar PV system work very reliably in Yukon, it has yet to be established that these systems are
economically viable.
7.1. CurrentInstalledCostOver the course of monitoring these three systems the installed cost of PV systems has dropped
dramatically. The following table shows a summary of the installed cost of the MAB and Watson
Lake Space and Science Centre PV systems along with a more recent installation that ESC has
undertaken in Yukon’s Kluane area in partnership with the Kluane First Nation government.
Year Installation $/Watt Installed
2008 Main Administration Building $ 17.10
2010 Watson Lake Northern Lights Centre $ 8.20
2012 Kluane Maintenance Building $ 4.88
Clearly the installed cost of PV systems has declined considerably over the past five years. This trend
is likely to continue as equipment prices continue to drop and local installation capacity increases.
Costs for recently installed, large scale (>50 kW) PV systems in the Edmonton area have dropped to
under $3/Watt4 installed. It is likely that Yukon could see similar numbers over the next 10 years.
7.2. ComparisonwithAlternativesIn evaluating the economic viability of renewable electricity production technologies it is
appropriate to ask two questions:
1. Is the technology cost competitive with the current generation technologies in a given
region?
2. Is the technology cost competitive with the likely new sources of generation that could be
developed should they be required?
4 Based on discussion with Alberta solar energy expert Gordon Howell of Howell Mayhew Engineering.

YG Solar PV Pilot: Performance Monitoring Summary
Energy Solutions Centre Page 16 of 19 February 2014
Yukon’s electrical system is made up of one large interconnection grid called the Yukon Integrated
System (YIS) and a handful of smaller remote communities/individuals that are not connected to this
system. The YIS receives the majority of its generation from legacy hydro resources that were
developed several decades ago and now produce electricity at a very low price. However, increasing
electrical loads in the territory are seeing increased demand for diesel generation during periods of
significant peak energy demand and/or low hydro resource availability. This increased demand may
soon require new generation options to be developed.
Communities/individuals that are not connected to the YIS are reliant on costly diesel generation for
100% of their electricity supply.
It is unlikely that any new generation option, including solar PV, will ever be able to compete with
the territory’s legacy hydroelectric facilities from an economic perspective. The age of these
facilities combined with the relative high quality of the resource allows power to be produced from
these assets at a very low cost. With that understanding Figure 6.1 below compares the economics
of PV systems in Yukon with the potential of offsetting existing diesel generation, and potential
liquefied natural gas (LNG) generation projects using the Levelized Cost of Energy (LCOE)5 method.
Like wind generation, solar PV generation is a non‐dispatchable technology, meaning that its power
output cannot be easily adjusted to match demand. This does not present as significant a challenge
as it may seem because most electrical grids are able to accept as much as 20% of their generation
from non‐dispatchable sources without any mitigation. Even higher levels of non‐dispatchable
generation are possible if appropriate storage and/or load shedding/control is incorporated.
However, it is extremely difficult for non‐dispatchable generation technologies to completely
replace dispatchable forms of generation like diesel, natural gas, and/or hydro. Some form of load
matching is generally required, particularly during periods of peak electrical demand. For this reason
this comparison only investigates the economics of offsetting a portion of generation from these
traditional facilities and the costs associated with LNG and diesel given below do not include the
cost of capital infrastructure and are therefore not a true LCOE for these technologies but rather a
simple levelized avoided cost savings.
From Figure 6.1 it is clear that even at the current cost of installed PV systems and modest
predictions for diesel cost escalations, PV is very competitive with the avoided cost of diesel and
extremely competitive with diesel generation in the remote community of Old Crow where the cost
of imported diesel fuel is quite high. PV is less competitive with today’s estimated avoided cost of
LNG generation; however, the current North American price for LNG is very low and likely to
increase in the future as the product becomes open to the world market and demand for the
product grows. Based on this analysis, if LNG sees a fuel price increase in the range of 6‐9% per year
or greater, PV would again be a competitive option for offsetting the costs associated with these
thermal plants.
5 The Levelized Cost of Energy (LCOE) is the price at which electricity must be generated from a specific source to break even over the lifetime
of the project. It is an economic assessment of the cost of the energy‐generating system including all the costs over its lifetime: initial investment, operations and maintenance, cost of fuel, and cost of capital.

YG Solar PV Pilot: Performance Monitoring Summary
Energy Solutions Centre Page 17 of 19 February 2014
Figure 6.1: LCOE comparison of PV and LNG/Diesel Avoided Cost
7.3. Micro‐ScaleUtilityCustomerPVSystemEconomicsIn October 2013, the Yukon government released its micro‐generation policy which allows Yukon
residents to connect their renewable energy systems to the grid enabling them to offset some of
their own electrical consumption while receiving financial compensation for any power they export
to the grid. Participants are compensated for electricity which is exported to the grid at a rate of
$0.21/kWh on the YIS and $0.30/kWh in remote diesel communities.
Figure 6.2 below shows the current simple payback for a residential PV system based on an installed
PV system cost of $4.90/Watt (the most recent system installation cost known to ESC), an assumed
annual generation of approximately 1,000 kWh/kWp/year, and an annual household energy
consumption of 10,000 kWh.
Estimated Current Small Scale PV LCOE
Estimated Avoided Diesel Generaton LCOE
(no capital)
Estimated Large Scale/Future PV LCOE
($3/Watt ins.)
Estimated Avoided LNG Generaton LCOE (no
capital)
Old Crow Estimated Avoided Diesel
Generaton LCOE (no capital)
0
0.5
1
1.5
2
2.5
3
3.5
4
0% 2% 4% 6% 8% 10% 12% 14% 16%
LCOE ($/kWh)
Annual Fuel Escallation Rate

YG Solar PV Pilot: Performance Monitoring Summary
Energy Solutions Centre Page 18 of 19 February 2014
System Size (kW)
System Cost (installed)
Annual Revenue
Simple Payback (Years)
1.0 $ 4,900 $ 139 35.3
5.0 $ 24,500 $ 913 26.8
10.0 $ 49,000 $ 2,005 24.4
15.0 $ 73,500 $ 3,120 23.6
20.0 $ 98,000 $ 4,242 23.1
25.0 $ 122,500 $ 5,367 22.8
Figure 6.2: Estimated Simple payback for PV System installed in Yukon on a residential building with an assumed
installed cost of $4.90/Watt
Assuming that the trend of decreased installation system costs continues, these paybacks will improve
over time. Figure 6.3 below shows the relationship between simple payback and installed PV system
costs for a 5 kW system given the same assumptions as above.
Installed System Cost ($/Watt)
5 kW System Cost (installed)
Annual Revenue
Simple Payback (Years)
$ 2.00 $ 10,000 $ 913 11.0
$ 2.50 $ 12,500 $ 913 13.7
$ 3.00 $ 15,000 $ 913 16.4
$ 3.50 $ 17,500 $ 913 19.2
$ 4.00 $ 20,000 $ 913 21.9
$ 4.50 $ 22,500 $ 913 24.7
$ 5.00 $ 25,000 $ 913 27.4
$ 5.50 $ 27,500 $ 913 30.1
$ 6.00 $ 30,000 $ 913 32.9
Figure 6.3: Estimated Simple payback for a 5 kW PV System installed in the Yukon on a residential building with
varying installed system costs.
It is clear from this table that there is a strong relationship between installed system costs and simple
payback. Decreases in installed system costs with the potential for increased electrical rates over the
next 10 years are likely to compound to make PV systems increasingly economically attractive in the
future. At this time, it’s fair to say that for the utility customer who may wish to install such a system
today, paybacks are likely to be greater than 20 years.

YG Solar PV Pilot: Performance Monitoring Summary
Energy Solutions Centre Page 19 of 19 February 2014
8. ConclusionsGrid connected PV systems have been in operation in Yukon for nearly 13 years with successful results.
This report catalogues the performances of three such systems over the course of five years and shows
definitively that this technology works well in Yukon’s harsh northern environment. Over the course of
monitoring, these systems have required no maintenance or intervention to maintain their performance
and have typically performed as predicted.
The systems have shown significantly strong performance through the months of March through
September with reasonable performance in February, October and November and generally poor
performance in December and January. While this performance characterization does not match the
peak electrical demands the territory sees during the coldest months of the year, it does offer excellent
performance when the territory’s hydro resources are depleted right before the spring freshet begins to
revive these reserves.
Economically, PV systems are competitive in remote regions reliant on diesel generation and may
compare favourably with LNG in the future depending on the trends in pricing of both PV system
installations and natural gas. PV systems will likely never be economically competitive with legacy hydro
generation which weakens the current economic argument for residential/commercial scale installations
on the YIS. Decreasing installation costs, increasing demand for new generation options and increasing
electrical rates may act to improve the economic rationale for this technology in Yukon.
9. NextStepsESC will continue to monitor the performance of these three systems and has recently begun planning
the monitoring of three new systems in more remote areas of the territory: one in Burwash Landing and
two in Old Crow. These new systems, combined with our current and expanding knowledge of the
Watson Lake and Whitehorse area systems, will help to give Yukoners a more fulsome understanding of
the potential for this technology in the territory. ESC will continue to monitor the installation costs of PV
both inside and outside of the territory and report on the latest advances in both technology and
economic viability for solar technologies.