mathematic yg baru
TRANSCRIPT
Mathematic 2Statistic
EIT 2
• Muhammad Syamim Bin Yahaya• Luqman Hakim Bin Azhar
• Nuruliszatul Assyakin Binti Mohd Yusof• Nura Aina Aliyah Binti Syamsu Kamar
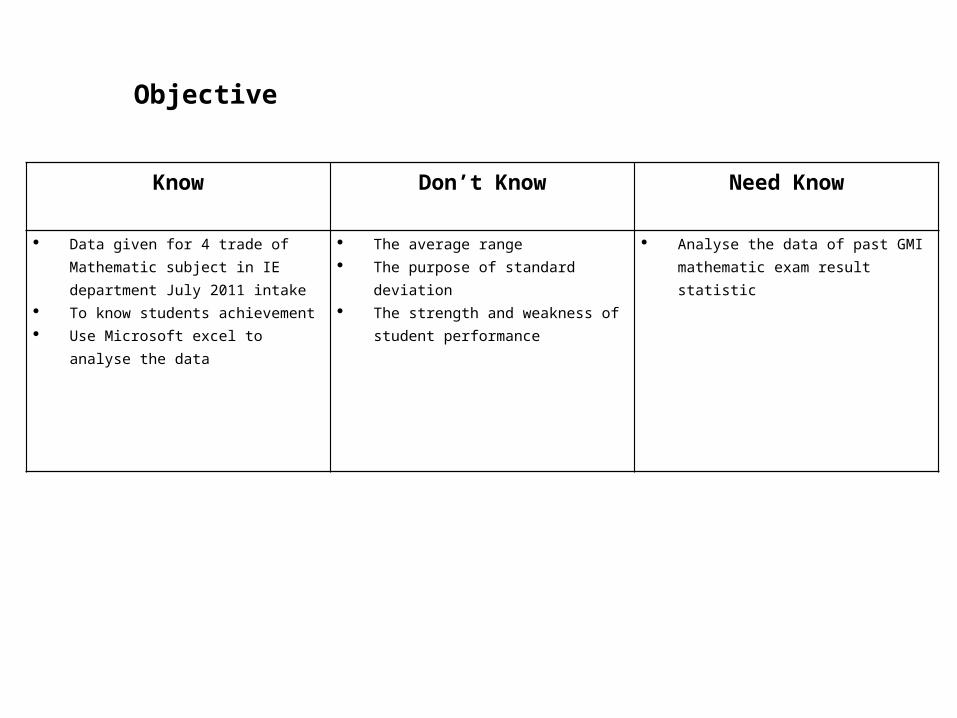
Know Don’t Know Need Know
Data given for 4 trade of Mathematic subject in IE department July 2011 intake
To know students achievement Use Microsoft excel to analyse the data
The average range The purpose of standard deviation The strength and weakness of student
performance
Analyse the data of past GMI mathematic exam result statistic
Objective
F E D- D C- C C+ B- B B+ A- A
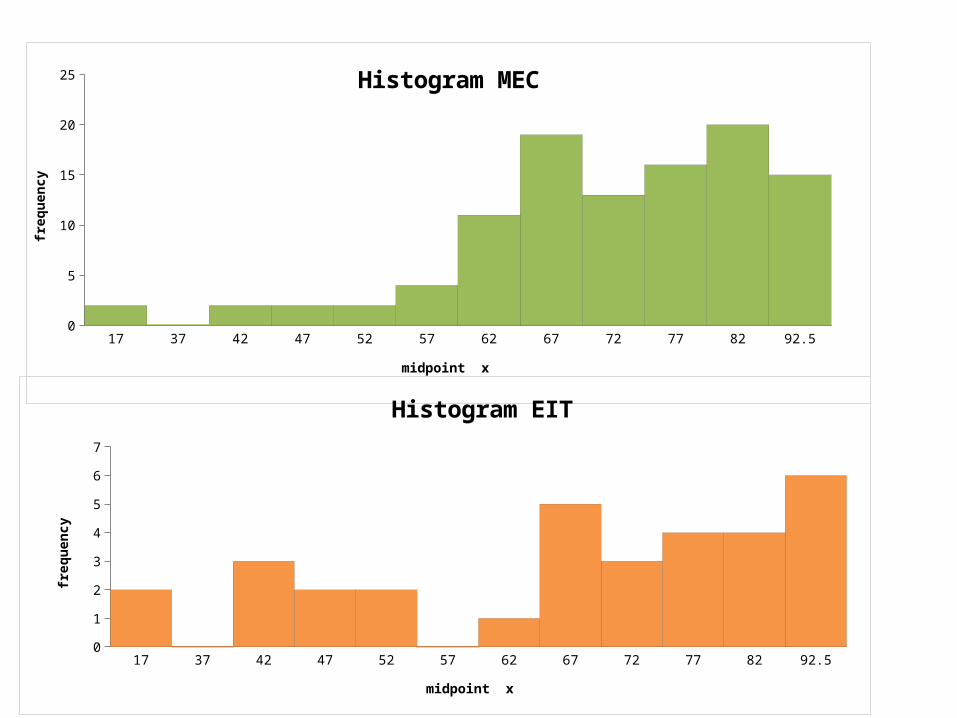
MEC 2 0 2 2 2 4 11 19 13 16 20 15
EIT 2 0 3 2 2 0 1 5 3 4 4 6
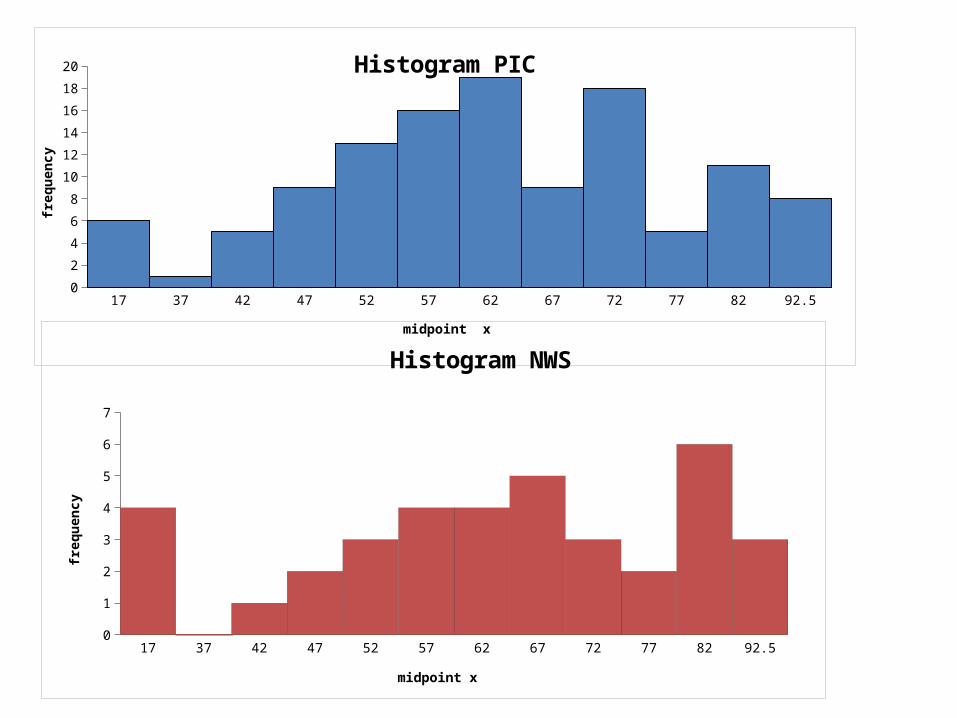
PIC 6 1 5 9 13 16 19 9 18 5 11 8
NWS 4 0 1 2 3 4 4 5 3 2 6 3
2.5
7.5
12.5
17.5
22.5
2
0
2 2 2
4
11
19
13
16
20
15
2
0
32 2
01
5
34 4
66
1
5
9
13
16
19
9
18
5
11
8
4
01
23
4 45
32
6
3
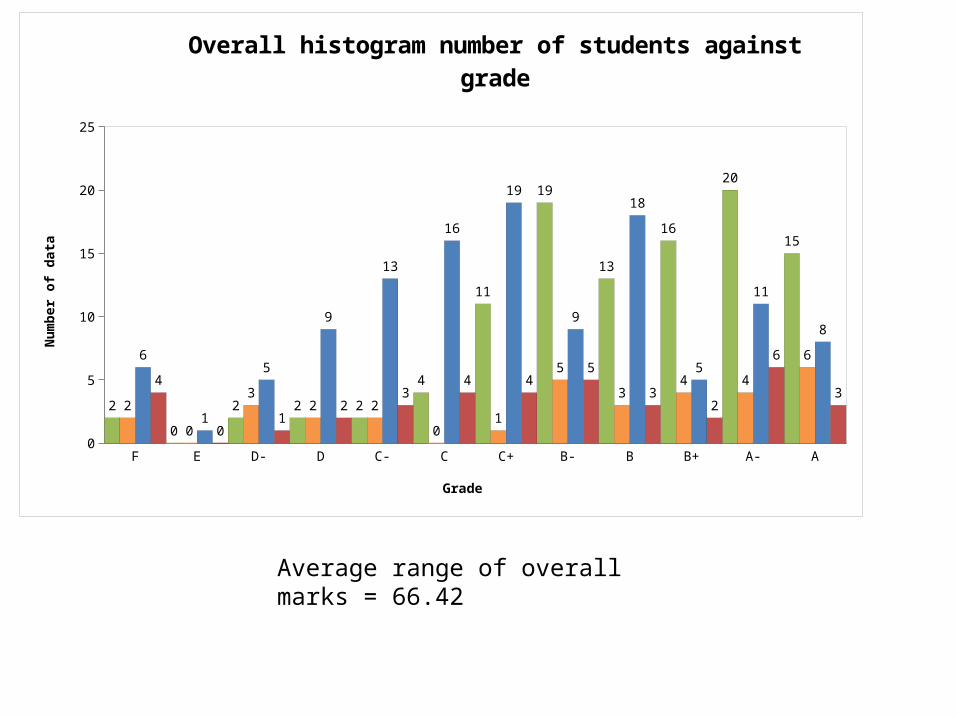
Overall histogram number of students against grade
Grade
Num
ber o
f dat
a
Average range of overall marks = 66.42
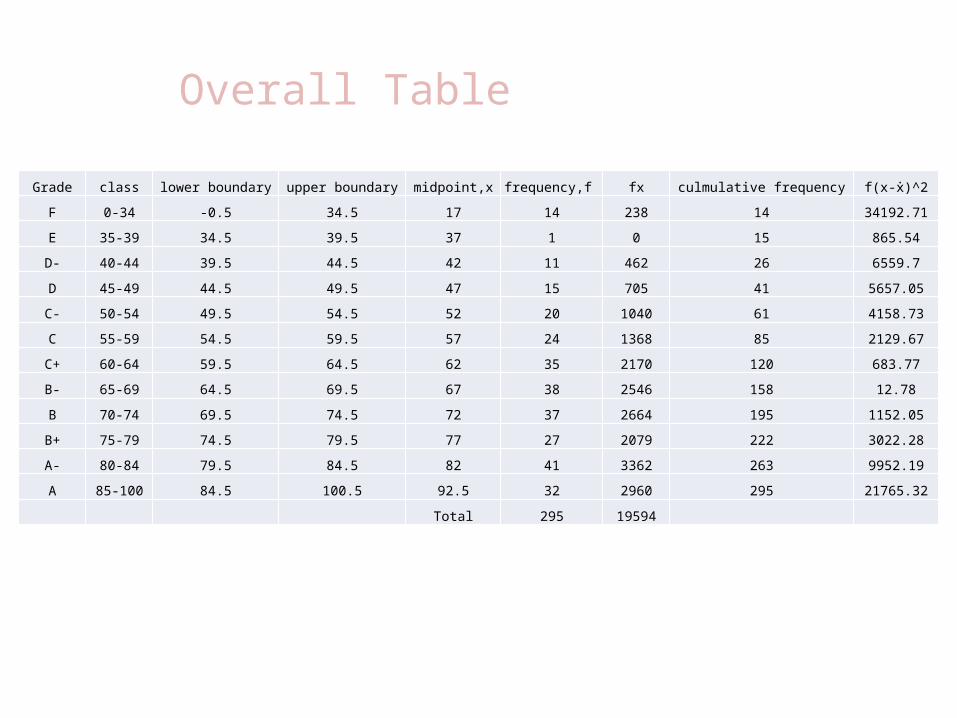
Grade class lower boundary upper boundary midpoint,x frequency,f fx culmulative frequency f(x-ẋ)^2
F 0-34 -0.5 34.5 17 14 238 14 34192.71
E 35-39 34.5 39.5 37 1 0 15 865.54
D- 40-44 39.5 44.5 42 11 462 26 6559.7
D 45-49 44.5 49.5 47 15 705 41 5657.05
C- 50-54 49.5 54.5 52 20 1040 61 4158.73
C 55-59 54.5 59.5 57 24 1368 85 2129.67
C+ 60-64 59.5 64.5 62 35 2170 120 683.77
B- 65-69 64.5 69.5 67 38 2546 158 12.78
B 70-74 69.5 74.5 72 37 2664 195 1152.05
B+ 75-79 74.5 79.5 77 27 2079 222 3022.28
A- 80-84 79.5 84.5 82 41 3362 263 9952.19
A 85-100 84.5 100.5 92.5 32 2960 295 21765.32
Total 295 19594
Overall Table
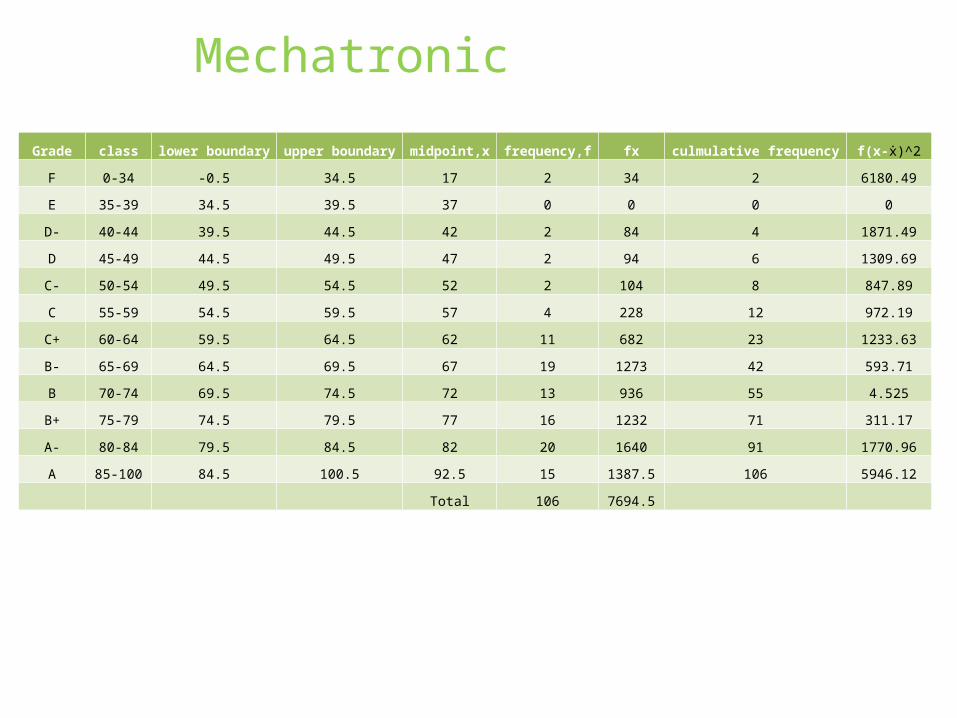
Grade class lower boundary upper boundary midpoint,x frequency,f fx culmulative frequency f(x-ẋ)^2
F 0-34 -0.5 34.5 17 2 34 2 6180.49
E 35-39 34.5 39.5 37 0 0 0 0
D- 40-44 39.5 44.5 42 2 84 4 1871.49
D 45-49 44.5 49.5 47 2 94 6 1309.69
C- 50-54 49.5 54.5 52 2 104 8 847.89
C 55-59 54.5 59.5 57 4 228 12 972.19
C+ 60-64 59.5 64.5 62 11 682 23 1233.63
B- 65-69 64.5 69.5 67 19 1273 42 593.71
B 70-74 69.5 74.5 72 13 936 55 4.525
B+ 75-79 74.5 79.5 77 16 1232 71 311.17
A- 80-84 79.5 84.5 82 20 1640 91 1770.96
A 85-100 84.5 100.5 92.5 15 1387.5 106 5946.12
Total 106 7694.5
Mechatronic
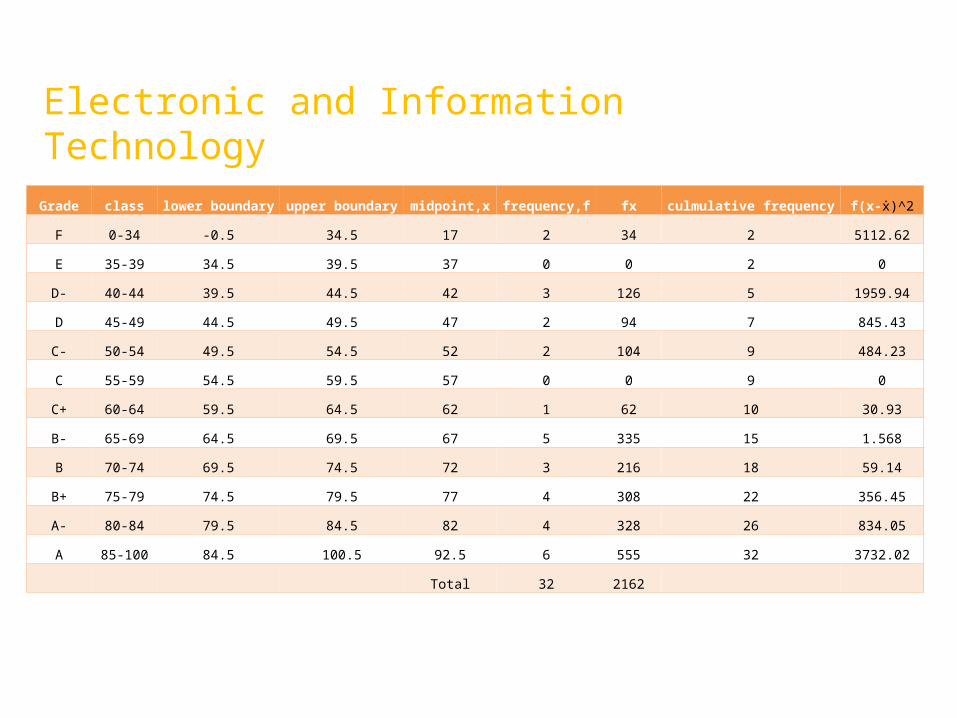
Grade class lower boundary upper boundary midpoint,x frequency,f fx culmulative frequency f(x-ẋ)^2
F 0-34 -0.5 34.5 17 2 34 2 5112.62
E 35-39 34.5 39.5 37 0 0 2 0
D- 40-44 39.5 44.5 42 3 126 5 1959.94
D 45-49 44.5 49.5 47 2 94 7 845.43
C- 50-54 49.5 54.5 52 2 104 9 484.23
C 55-59 54.5 59.5 57 0 0 9 0
C+ 60-64 59.5 64.5 62 1 62 10 30.93
B- 65-69 64.5 69.5 67 5 335 15 1.568
B 70-74 69.5 74.5 72 3 216 18 59.14
B+ 75-79 74.5 79.5 77 4 308 22 356.45
A- 80-84 79.5 84.5 82 4 328 26 834.05
A 85-100 84.5 100.5 92.5 6 555 32 3732.02
Total 32 2162
Electronic and Information Technology
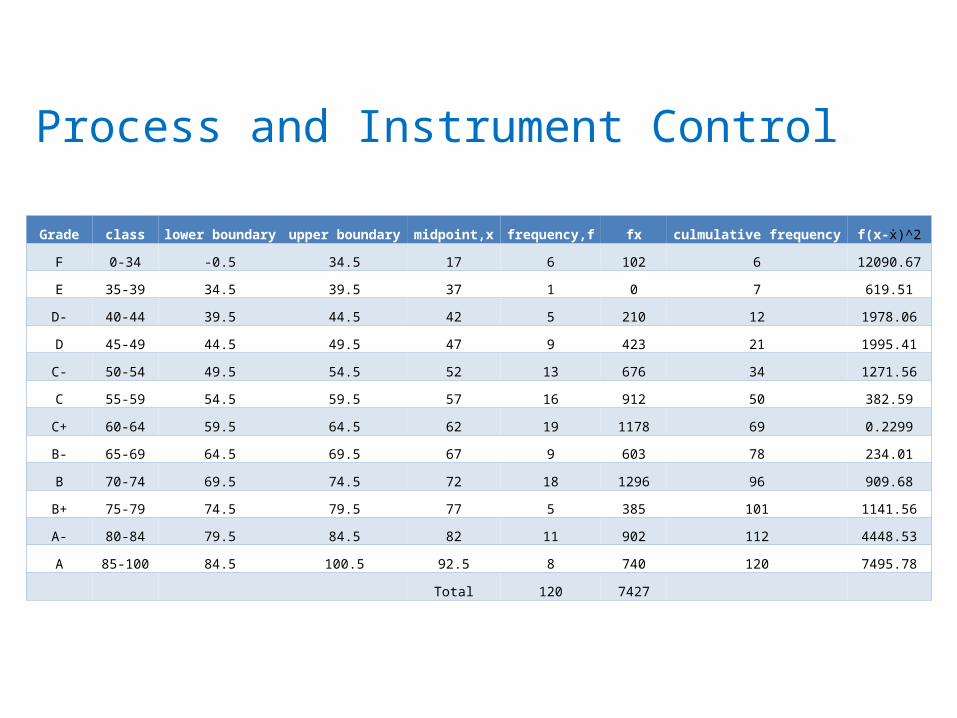
Grade class lower boundary upper boundary midpoint,x frequency,f fx culmulative frequency f(x-ẋ)^2
F 0-34 -0.5 34.5 17 6 102 6 12090.67
E 35-39 34.5 39.5 37 1 0 7 619.51
D- 40-44 39.5 44.5 42 5 210 12 1978.06
D 45-49 44.5 49.5 47 9 423 21 1995.41
C- 50-54 49.5 54.5 52 13 676 34 1271.56
C 55-59 54.5 59.5 57 16 912 50 382.59
C+ 60-64 59.5 64.5 62 19 1178 69 0.2299
B- 65-69 64.5 69.5 67 9 603 78 234.01
B 70-74 69.5 74.5 72 18 1296 96 909.68
B+ 75-79 74.5 79.5 77 5 385 101 1141.56
A- 80-84 79.5 84.5 82 11 902 112 4448.53
A 85-100 84.5 100.5 92.5 8 740 120 7495.78
Total 120 7427
Process and Instrument Control
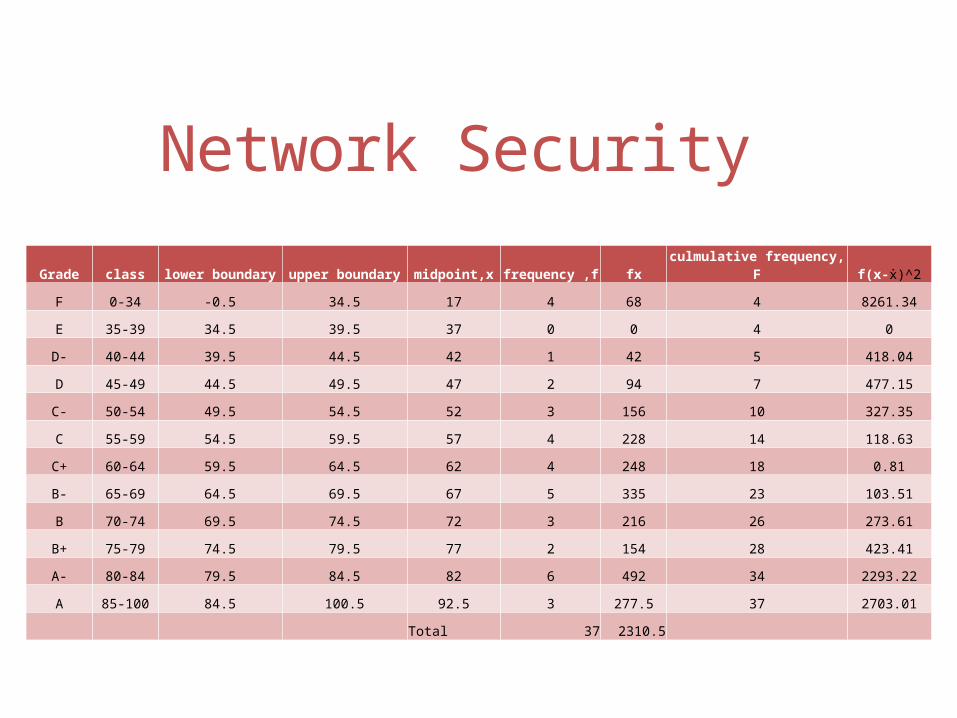
Grade class lower boundary upper boundary midpoint,x frequency ,f fx culmulative frequency, F f(x-ẋ)^2
F 0-34 -0.5 34.5 17 4 68 4 8261.34
E 35-39 34.5 39.5 37 0 0 4 0
D- 40-44 39.5 44.5 42 1 42 5 418.04
D 45-49 44.5 49.5 47 2 94 7 477.15
C- 50-54 49.5 54.5 52 3 156 10 327.35
C 55-59 54.5 59.5 57 4 228 14 118.63
C+ 60-64 59.5 64.5 62 4 248 18 0.81
B- 65-69 64.5 69.5 67 5 335 23 103.51
B 70-74 69.5 74.5 72 3 216 26 273.61
B+ 75-79 74.5 79.5 77 2 154 28 423.41
A- 80-84 79.5 84.5 82 6 492 34 2293.22
A 85-100 84.5 100.5 92.5 3 277.5 37 2703.01
Total 37 2310.5
Network Security
17 37 42 47 52 57 62 67 72 77 82 92.50
5
10
15
20
25 Histogram MEC
midpoint x
freq
uenc
y
17 37 42 47 52 57 62 67 72 77 82 92.50
1
2
3
4
5
6
7
Histogram EIT
midpoint x
freq
uenc
y
17 37 42 47 52 57 62 67 72 77 82 92.50
2
4
6
8
10
12
14
16
18
20 Histogram PIC
midpoint x
freq
uenc
y
17 37 42 47 52 57 62 67 72 77 82 92.50
1
2
3
4
5
6
7
Histogram NWS
midpoint x
freq
uenc
y
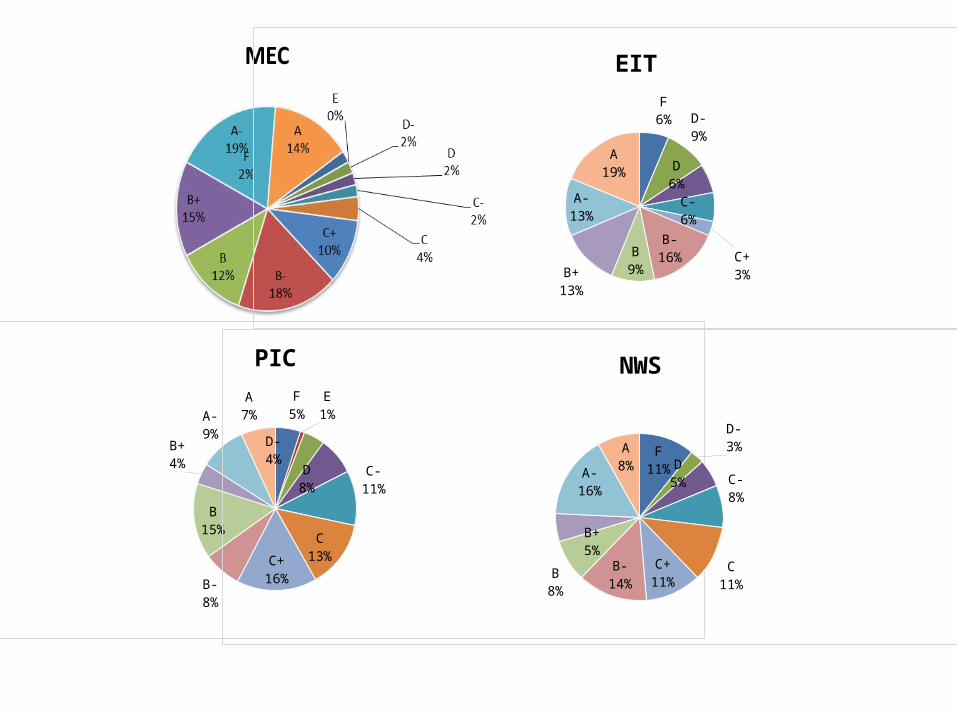
F6% D-
9%D
6%C-6%
C+3%
B-16%B
9%
B+13%
A-13%
A19%
EIT
F5%
E1%
D-4%
D8%
C-11%
C13%
C+16%
B-8%
B15%
B+4%
A-9%
A7%
PIC
F11%
D-3%
D5%
C-8%
C11%
C+11%
B-14%
B8%
B+5%
A-16%
A8%
NWS
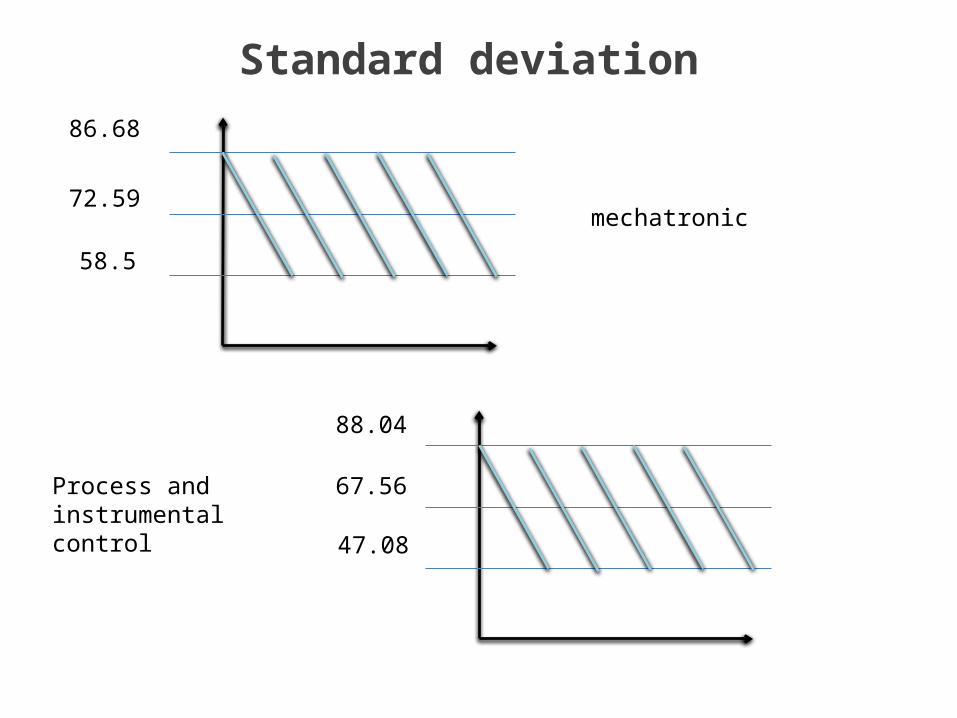
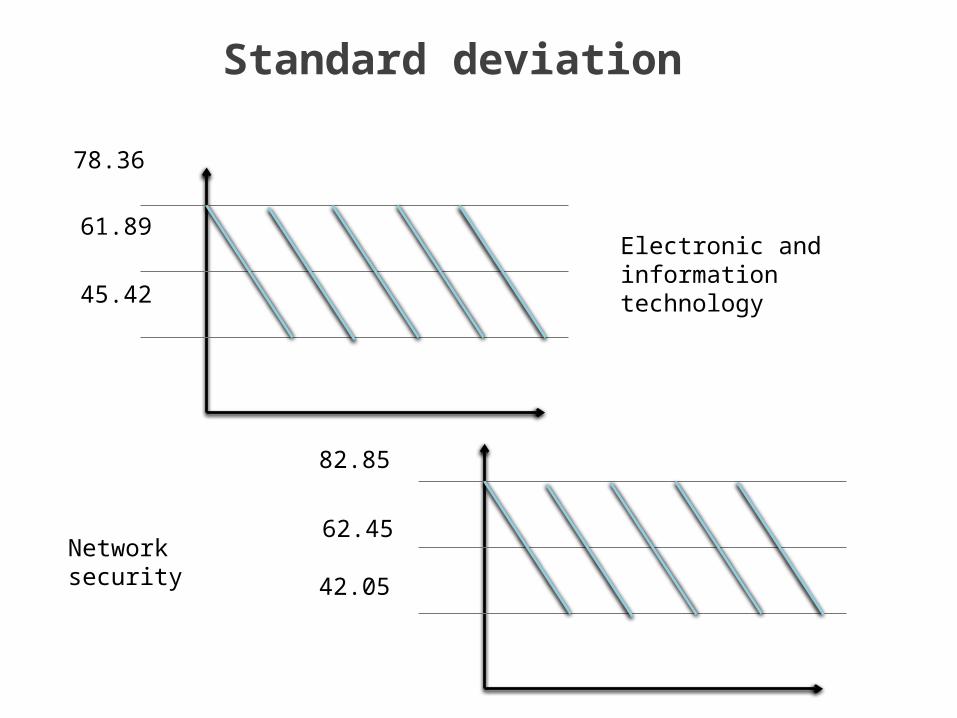
Standard deviation
58.5
86.68
72.59mechatronic
88.04
67.56
47.08
Process and instrumental control
Standard deviation
61.89
45.42
78.36
82.85
62.45
42.05
Electronic and information technology
Network security
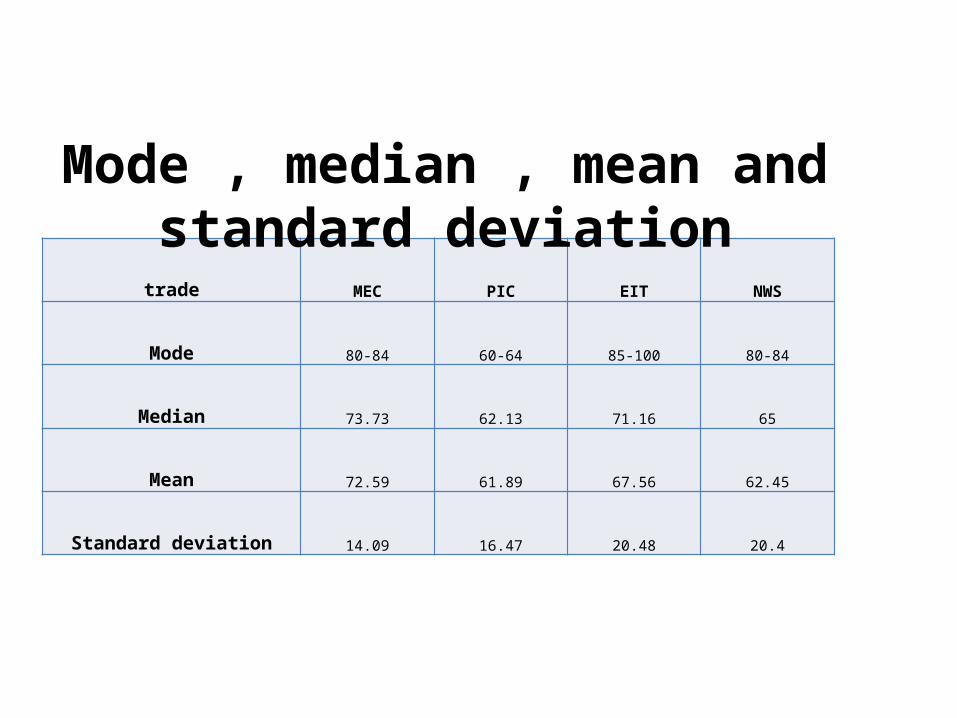
trade MEC PIC EIT NWS
Mode 80-84 60-64 85-100 80-84
Median 73.73 62.13 71.16 65
Mean 72.59 61.89 67.56 62.45
Standard deviation 14.09 16.47 20.48 20.4
Mode , median , mean and standard deviation
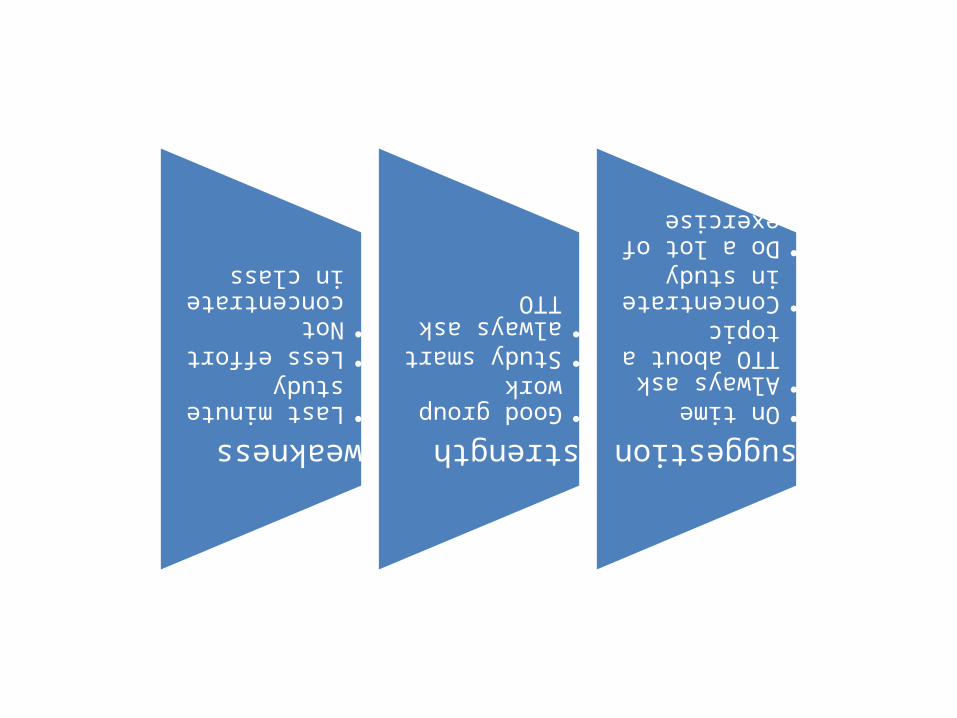
weakness•Last minute study•Less effort•Not concentrate in class
strength•Good group work•Study smart•always ask TTO
suggestion•On time•Always ask TTO about a topic•Concentrate in study•Do a lot of exercise