final presentation
TRANSCRIPT

Improvement of Inbound Supply and Warehousing
John MisoyianisKaran Chaudhry
Grant GeeKris Ladera

2
Introduction Problem StatementCurrent Operational DataRecommendations Expected ResultsSummary
Agenda

3
Company Background

4
Drilling & Production Valve
Systems
MeasurementSystems
Processing Systems
Compression Systems

5
Drilling & Production Valve
Systems
MeasurementSystems
Processing Systems
Compression Systems

6
Company Background
7
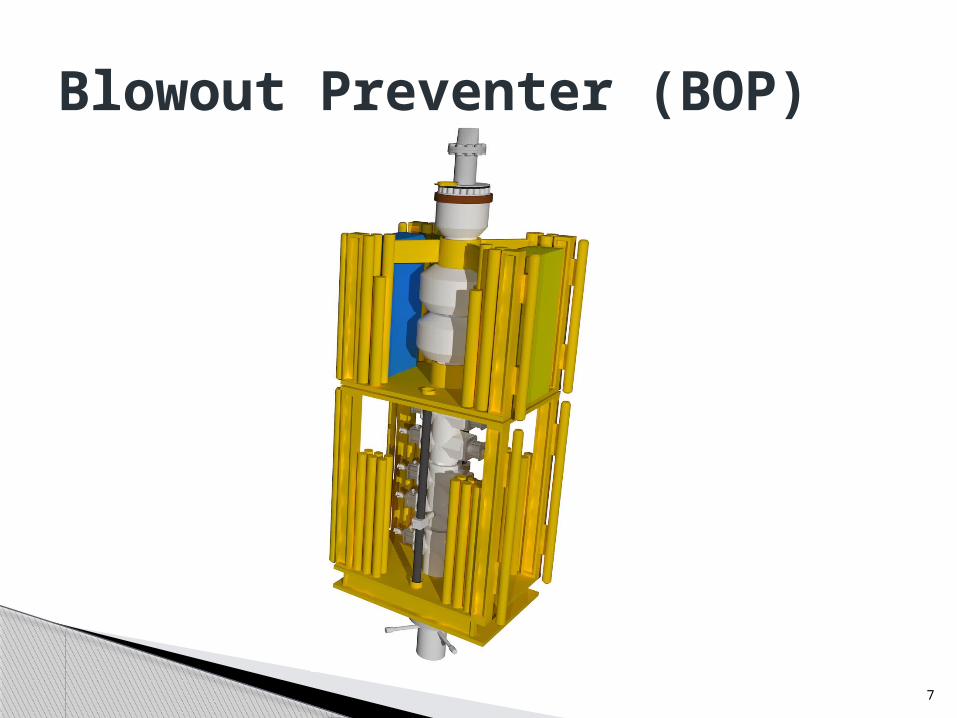
Blowout Preventer (BOP)

8
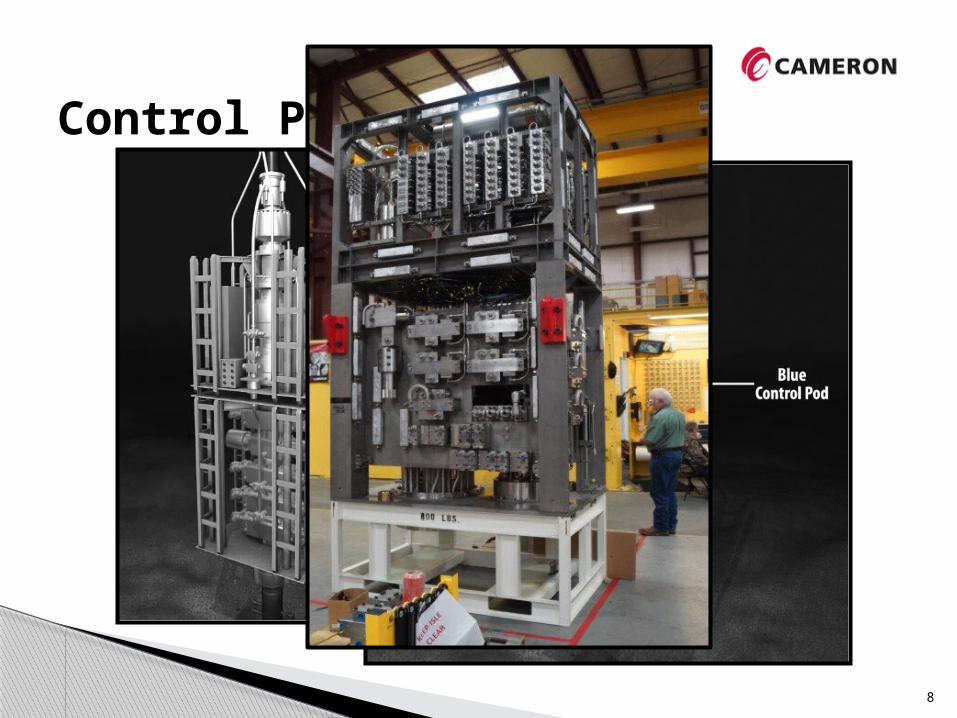
Control Pod

8
Control Pod
8
Control Pod

9
Introduction – Bingle Road Facility Overview
10
Q1 Q2 Q3 Q40
200000
400000
600000
800000
1000000
1200000
1400000
Warehouse Transactions (2011/2012)
20112012
Quarter
Num
ber
of
Tra
nsact
ions
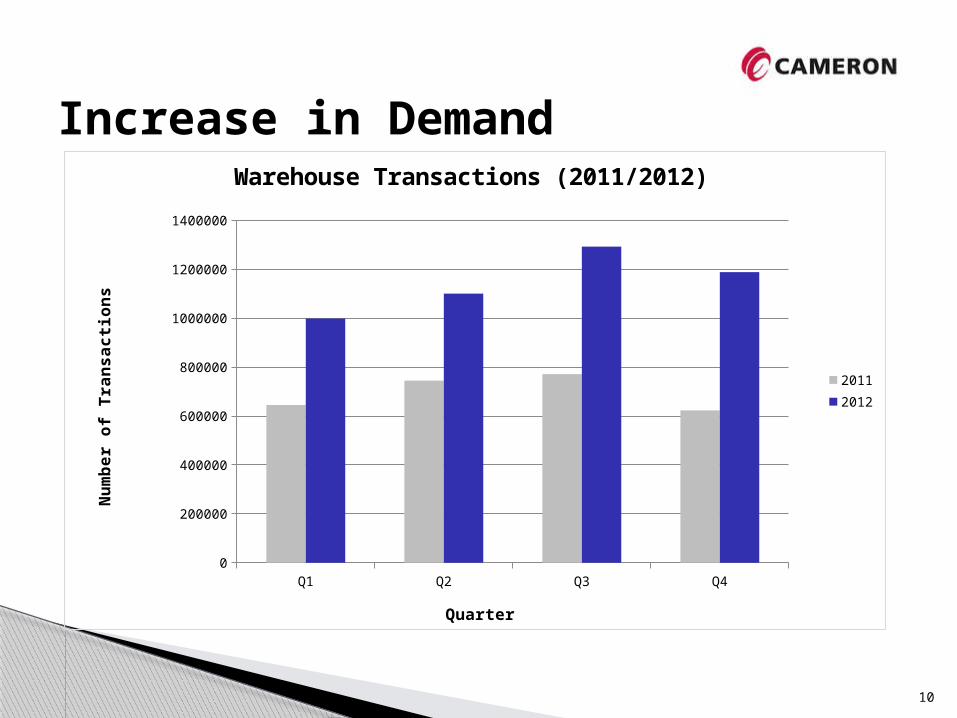
Increase in Demand

Stall Build Automotive Build
11
Keeping Up With Demand - Assembly

12
Successful Increase in Production, but…

12
Problem Statement
With production operations performing at a higher capacity, the supply chain requires improvement to match the increased level of demand.
13
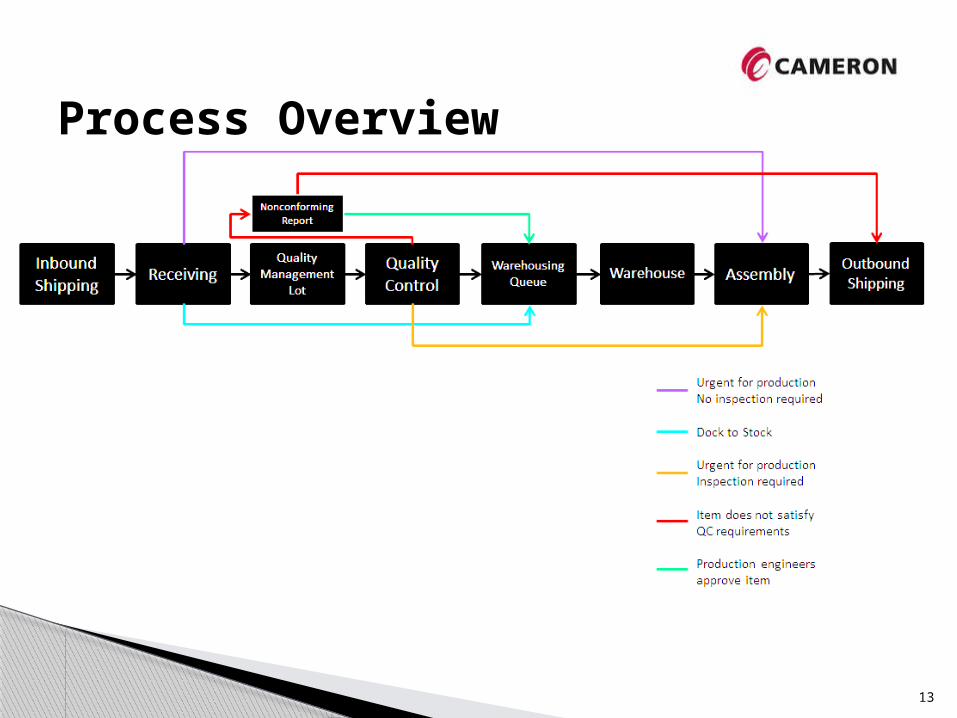
Process Overview

Receiving Area
13
Process Overview
Receiving

Quality Management(QM) Lot
13
Process Overview
Quality Management
Lot
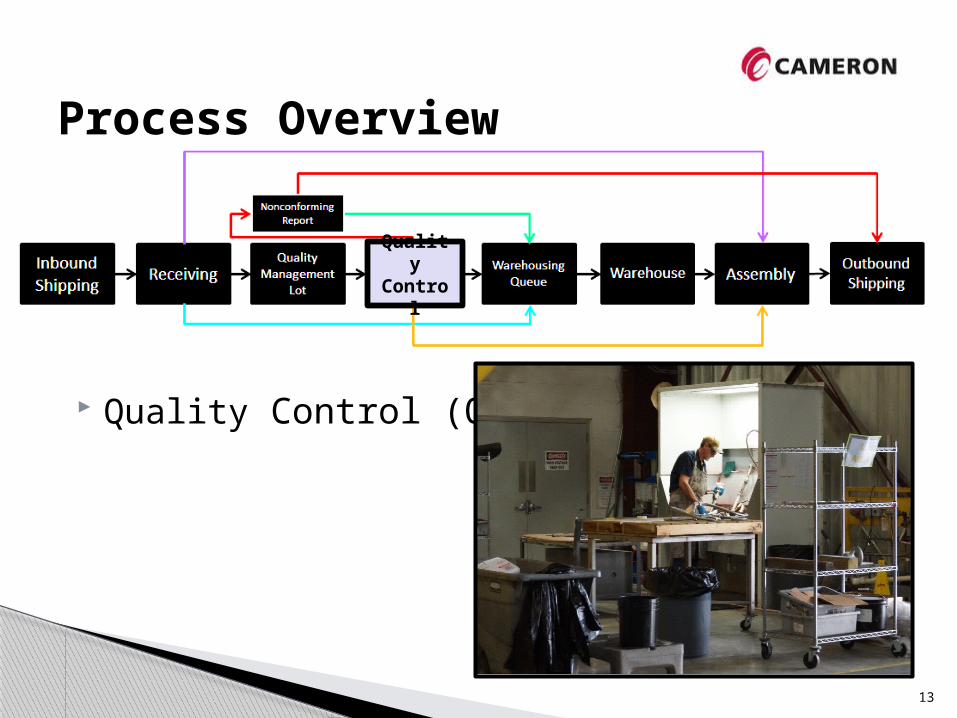
Quality Control (QC)
13
Process Overview
Quality Control

NCR (Non-Conformance Report)
13
Process Overview
Nonconformance Report

Warehousing Queue
13
Process Overview
Warehousing Queue

Warehouse
13
Process Overview
Warehouse

Assembly
13
Process Overview
Assembly

14
Current QM Lot

Type Distribution ExpressionSquare
Error
Buy Triangular TRIA(39, 121, 202) 0.006571
Make Beta -0.5 + 33 * BETA(0.802, 1.21) 0.032283
Total Beta 39 + 164 * BETA(1.75, 1.35) 0.030579
15
Current Operations
Receiving Summary

Receiving Quantities (Total)◦ Square Error: 0.030579
16
Current Operations
Receiving Quantities (Made)◦ Square Error: 0.032283

Receiving Quantities (Bought)◦ Square Error: .006571
17
Current Operations
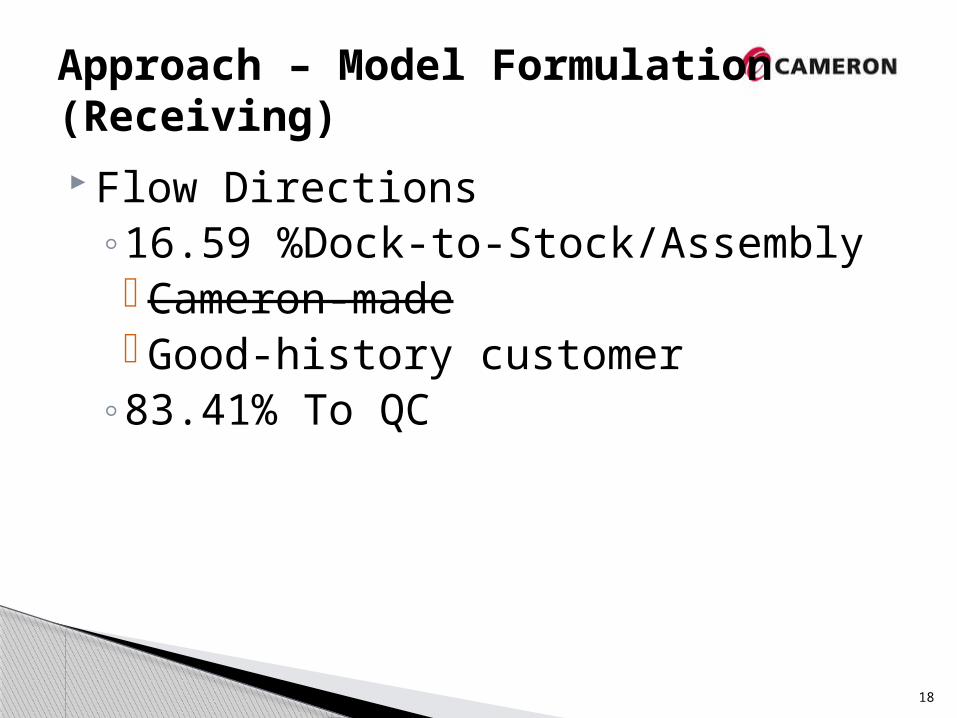
Flow Directions◦16.59 %Dock-to-Stock/Assembly Cameron-made Good-history customer
◦83.41% To QC
18
Approach – Model Formulation (Receiving)
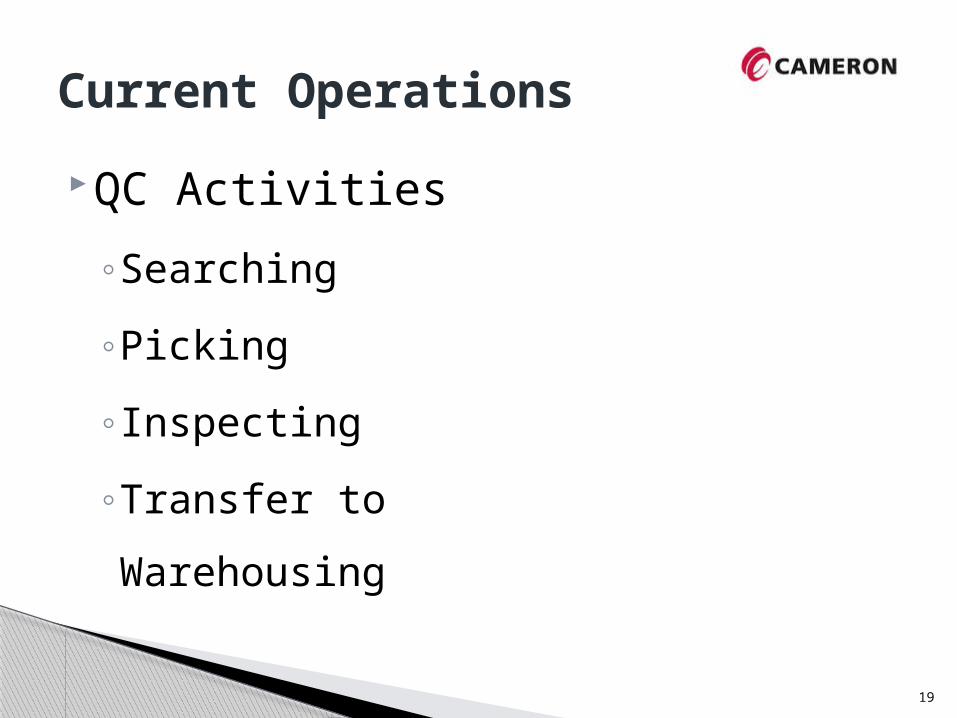
QC Activities
◦Searching
◦Picking
◦Inspecting
◦Transfer to
Warehousing
19
Current Operations

Searching◦ Worker Estimates
20
Current Operations

Picking / Transfer◦ Forklift Specs
Estimated Times From Move and Lift Speeds
21
Current Operations

Inspection◦ Estimated Hours per Inspection from available
man-hours then subtracted other operations
22
Current Operations
Estimated Time per item (Searching + Picking + Inspection + Transfer)

Recommendations
New QM Lot
Barcoding
New WMS
23

24
New QM Lot

24
New QM Lot
FIFO(First-in First-Out)Achieved

25
New QM Lot (Contd..)
Rack Layout: Option 1 Rack Layout: Option 2
No. of Racks=7
Max Pallet Storage=140
No. of Racks=6
Max Pallet Storage=120
26
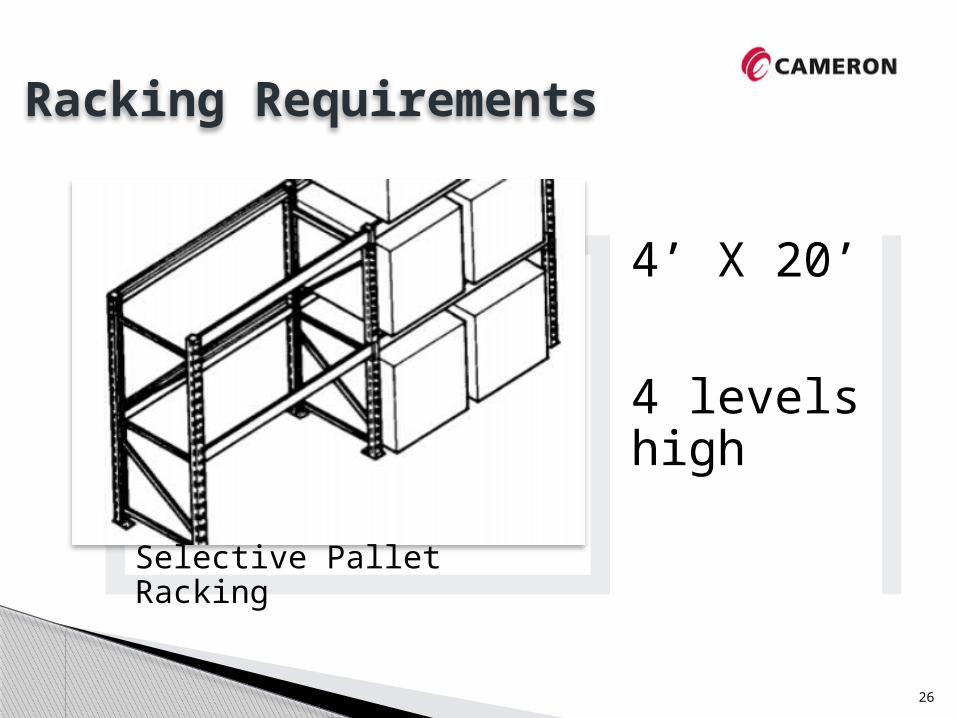
Selective Pallet Racking
4’ X 20’
4 levels high
Racking Requirements

27
Forklift Requirements
MODEL: NPR-20
Vertical Lift-At least 12 ft.
Load Lift-3000 lbs.
Operate in 10 ft. aisles

Barcoding (Parts)
28
Max Character Limit=48 (PO#, Material#, Date)Easily Scannable from
Minor Defects
GS1-128 Barcode

Barcoding (Racks)
29
UPC-E Barcode
Color - Coding barcodes
Easily Scannable
Barcode Location

Scanning Options
30
Smartphone + App Scan Gun

New WMS
31

No change to inspection process itself
32
New Process Times
Process Previous New Saved / Item
Searchin
g~5m ~1m ~4m
Retrievin
g1.7m 0.411m 1.288m
Transfer 0.55m 0.37m 0.17m
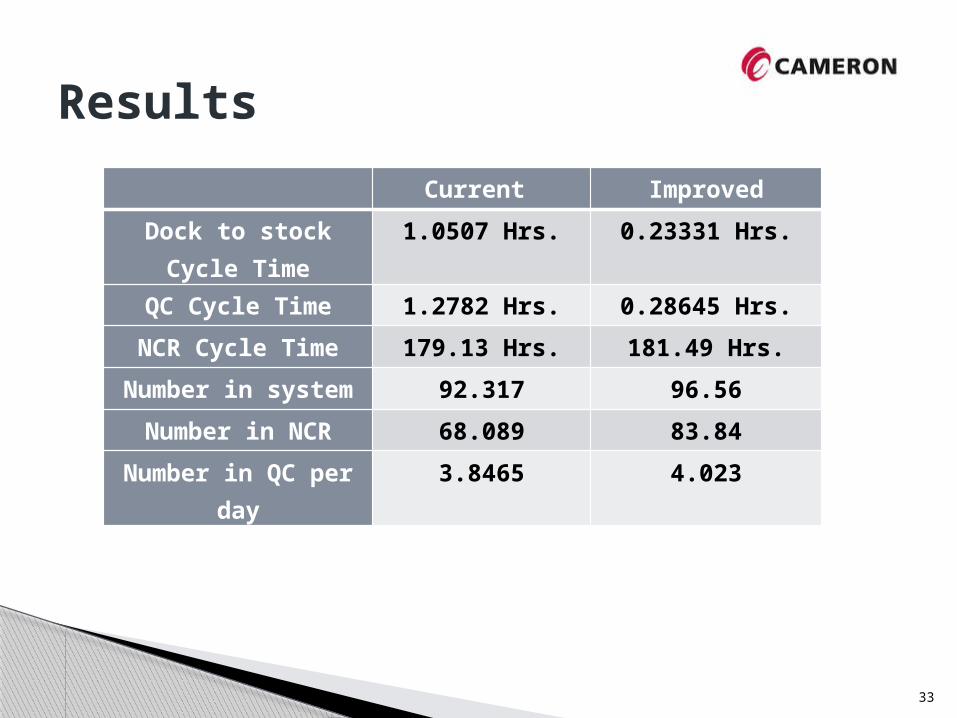
Current Improved
Dock to stock Cycle Time
1.0507 Hrs. 0.23331 Hrs.
QC Cycle Time 1.2782 Hrs. 0.28645 Hrs.
NCR Cycle Time 179.13 Hrs. 181.49 Hrs.
Number in system 92.317 96.56
Number in NCR 68.089 83.84
Number in QC per day
3.8465 4.023
33
Results

Initial Investment
34
Cost Analysis
Activity Description Cost
Racking Racks and Installation $9000
WMSDevelopment and Implementation $10800
Scanning Eqp. 4x Scanguns $4800
ForkliftBased on Current Model
(Clark NPR 20) $5000

Projected Savings – Same Throughput
35
Cost Analysis
Process Hours / Week Saved OT Savings / Week
Searching 40 $1500
Picking 12.8 $583
Transfer 0.88 $33*
Total 53.68 $2116
Racking◦ Clear Area◦ One Day Install (Sunday)
WMS Training◦ Training during lunch hours◦ Simulated Movements (Mock ups)
36
Implementation

Expected Results
37
Activity Previous New Items /
Day Total Saved /
Day
Time (Searching) 5 Minutes 1 Minute 100 400
Time (Movement) 1.7 Minutes 0.412 Minutes 100 128.81
Time ( Transferring) 0.553 Minutes .379 Minutes 100 8.78
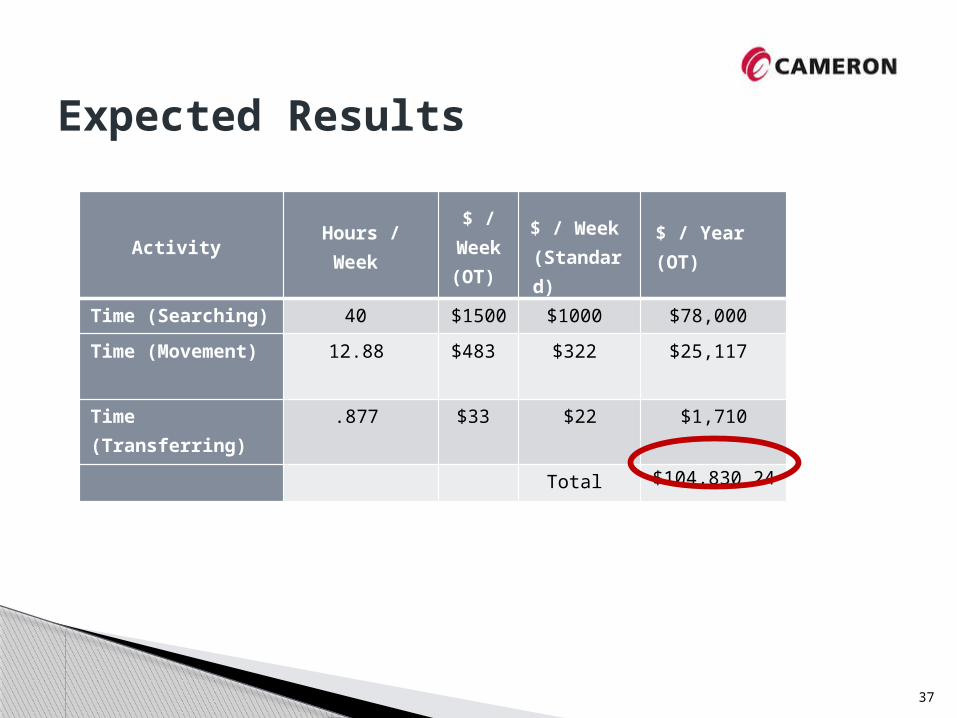
Expected Results
37
Activity Hours / Week
$ / Week (OT)
$ / Week (Standard)
$ / Year (OT)
Time (Searching) 40 $1500 $1000 $78,000
Time (Movement)
12.88 $483 $322 $25,117
Time (Transferring)
.877 $33 $22 $1,710
Total $104,830.24
Expected Results
38
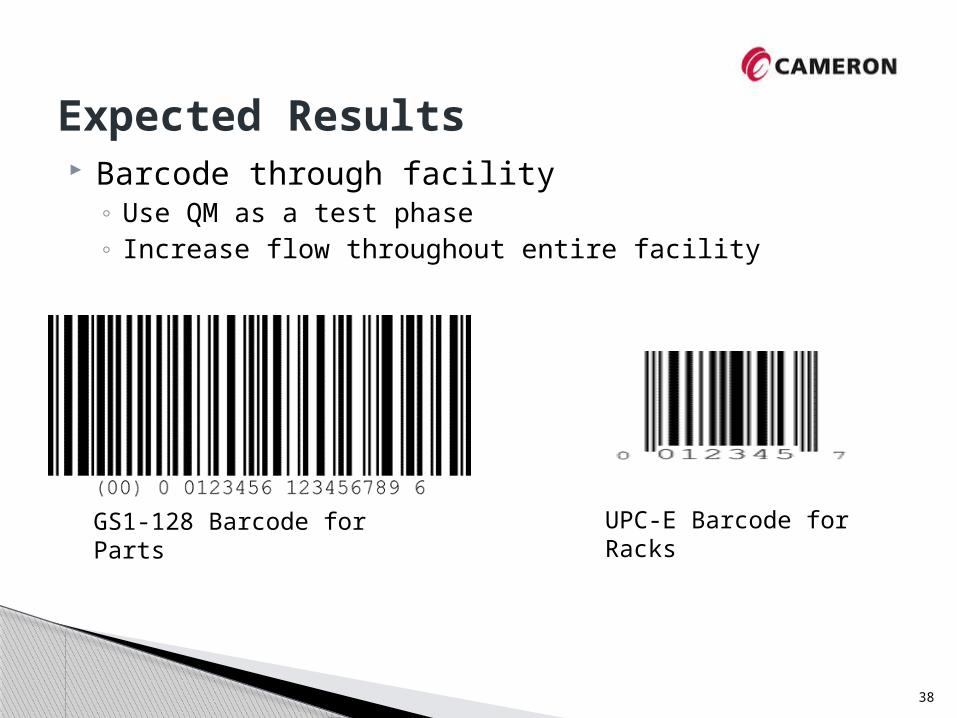
Barcode through facility◦ Use QM as a test phase ◦ Increase flow throughout entire facility
GS1-128 Barcode for Parts UPC-E Barcode for Racks

Inventory Cleanup (Removal of SMI)
1 2 3 4 5 6 7 N0
500000
1000000
1500000
2000000
2500000
3000000
3500000
4000000
4500000
Parts used over 36 months
Count
Velocity Codes
39
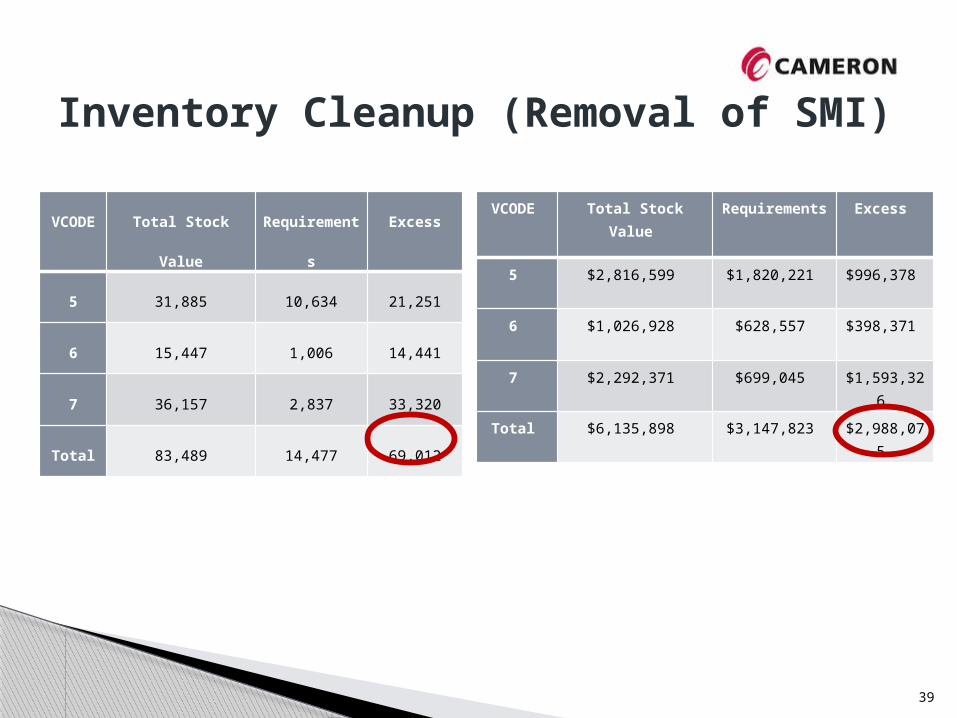
Inventory Cleanup (Removal of SMI)
VCODE Total Stock
Value
Requiremen
ts
Excess
5 31,885 10,634 21,251
6 15,447 1,006 14,441
7 36,157 2,837 33,320
Total 83,489 14,477 69,012
39
VCODE Total Stock Value Requirements
Excess
5 $2,816,599 $1,820,221 $996,378
6 $1,026,928 $628,557 $398,371
7 $2,292,371 $699,045 $1,593,326
Total $6,135,898 $3,147,823 $2,988,075

40
Summary
Problem
Methodology
Recommendations
Expected Results
- Inadequate supply of parts to assembly
- Observational study from site visits- Data analysis- Model building
- Redesign of QM Lot- WMS improvements- Removal of SMI
- Increase in 16% more throughput, and/or
- Cut back 58 working hours per week with a savings of approximately $104,000

38
Questions