final report a k: e i a - mississippi department of...
TRANSCRIPT

FINAL REPORT
APPENDIX K: ECONOMIC IMPACT ANALYSISMAY 2011

APPENDIX K: ECONOMIC IMPACT ANALYSIS i
Table of Contents
1. Introduction ............................................................................................................................... 1
2. Methodology ............................................................................................................................. 12.1 Modeling Inputs – Capital Expenditures ......................................................................... 12.2 Terms and Definitions ..................................................................................................... 2
3. Impacts Findings ....................................................................................................................... 33.1 Employment Impacts ....................................................................................................... 33.2 Economic Activity Impacts ............................................................................................. 4
4. Conclusion ................................................................................................................................ 5
Appendix A: IMPLAN® Model Summary Description ............................................................. A-1
List of Tables
Table 2-1: Capital Expenditures with Conservative Funding Projections by Mode ...................... 2Table 3-1: Employment Impacts ..................................................................................................... 4Table 3-2: Economic Activity Impacts ........................................................................................... 5

APPENDIX K: ECONOMIC IMPACT ANALYSIS 1
1. INTRODUCTION This report presents the estimated economic impacts within the State of Mississippi resulting from the capital expenditures on transportation infrastructure projected for the 2035 Statewide Multimodal Long-Range Transportation Plan for Mississippi (MULTIPLAN 2035). Derived economic impacts for the State are presented by transportation modal-related expenditures, economic impact variable and type, and time period.
Injection of capital infrastructure spending into the State economy leads to direct construction-related jobs, as well as to indirect jobs related to industries supporting the construction through supplying materials and equipment. In turn, these direct and indirect jobs support additional jobs within the region’s economy (induced impacts), all of which, in combination, can generate a boost to the State economy.
Capital expenditures on transportation support the creation of new, and retention of existing, construction jobs, and contribute to the total economic production (value added) of the impacted economy. As transportation expenditures are made within the construction industry, the construction industry, in turn, purchases intermediate production inputs from the other industries in the rest of the regional economy. As a result, and as the other non-construction industries in the economy follow-suit by making further intermediate production input purchases, the initial construction expenditures trickle throughout the State, economically impacting the affected geography beyond just the construction industry.
Based on estimated direct capital expenditures, the total economic impacts, as measured in terms of employment and value added economic activity are derived by means of utilizing an economic impact assessment modeling software program: IMPLAN®
2. METHODOLOGY
Professional 3.0.
Provided with inputs identifying estimated capital expenditures over the planning time periods, and by transportation mode, the resulting total economic impacts are calculated utilizing the social accounting and impact analysis computer software, developed by the Minnesota IMPLAN Group, Inc.; the IMPLAN Professional 3.0 model (IMPLAN®
Appendix A) – a model summary description is
provided within .
Estimated capital expenditures are entered into IMPLAN®
2.1 Modeling Inputs – Capital Expenditures
to calculate the respective total economic impacts of the direct expenditures. All input data runs through the internal social account matrix to account for industry interdependencies.
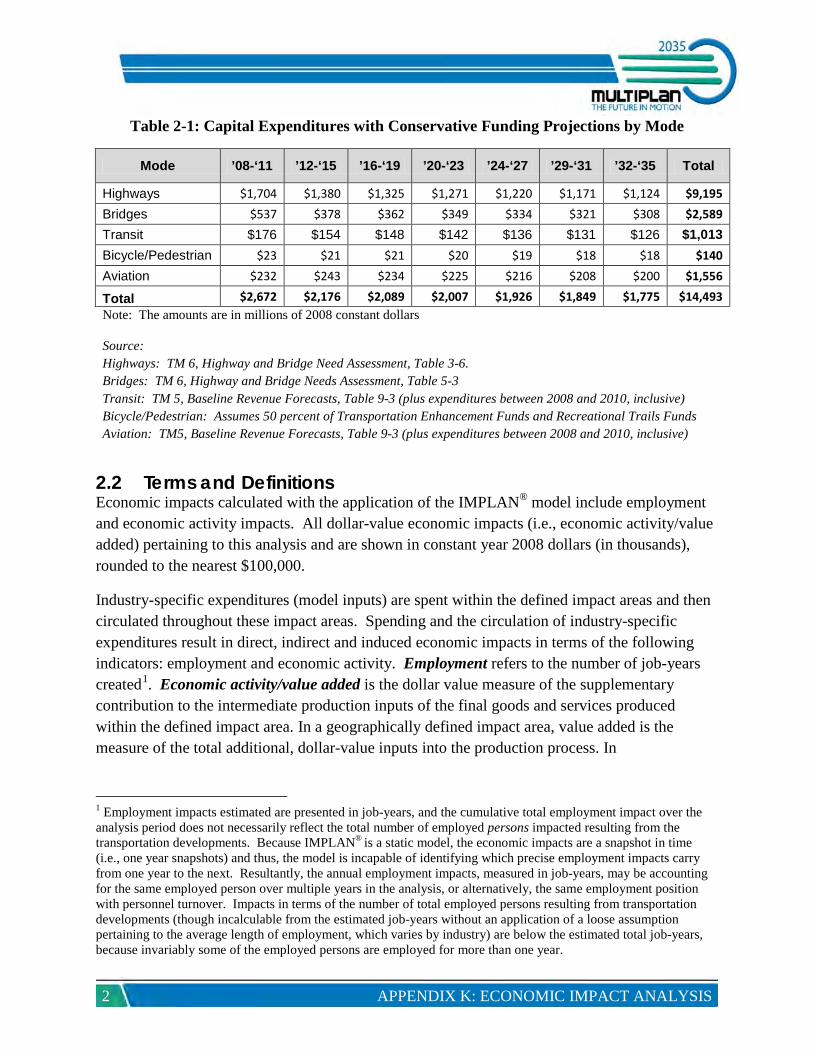
Total periodical capital expenditure estimates were developed separately for each of the transportation modes and by each of the seven time intervals through the 2035 planning horizon, as shown in Table 2-1. The grand total projected capital expenditures on all applicable modes amount to almost $14.5 billion (expressed in constant 2008 dollar terms).
2 APPENDIX K: ECONOMIC IMPACT ANALYSIS
Table 2-1: Capital Expenditures with Conservative Funding Projections by Mode
Mode ’08-‘11 ’12-‘15 ’16-‘19 ’20-‘23 ’24-‘27 ’29-‘31 ’32-‘35 Total
Highways $1,704 $1,380 $1,325 $1,271 $1,220 $1,171 $1,124 $9,195
Bridges $537 $378 $362 $349 $334 $321 $308 $2,589
Transit $176 $154 $148 $142 $136 $131 $126 $1,013 Bicycle/Pedestrian $23 $21 $21 $20 $19 $18 $18 $140
Aviation $232 $243 $234 $225 $216 $208 $200 $1,556
Total $2,672 $2,176 $2,089 $2,007 $1,926 $1,849 $1,775 $14,493 Note: The amounts are in millions of 2008 constant dollars
Source: Highways: TM 6, Highway and Bridge Need Assessment, Table 3-6. Bridges: TM 6, Highway and Bridge Needs Assessment, Table 5-3 Transit: TM 5, Baseline Revenue Forecasts, Table 9-3 (plus expenditures between 2008 and 2010, inclusive) Bicycle/Pedestrian: Assumes 50 percent of Transportation Enhancement Funds and Recreational Trails Funds Aviation: TM5, Baseline Revenue Forecasts, Table 9-3 (plus expenditures between 2008 and 2010, inclusive)
2.2 Terms and Definitions Economic impacts calculated with the application of the IMPLAN®
Industry-specific expenditures (model inputs) are spent within the defined impact areas and then circulated throughout these impact areas. Spending and the circulation of industry-specific expenditures result in direct, indirect and induced economic impacts in terms of the following indicators: employment and economic activity. Employment refers to the number of job-years created
model include employment and economic activity impacts. All dollar-value economic impacts (i.e., economic activity/value added) pertaining to this analysis and are shown in constant year 2008 dollars (in thousands), rounded to the nearest $100,000.
1
1 Employment impacts estimated are presented in job-years, and the cumulative total employment impact over the analysis period does not necessarily reflect the total number of employed persons impacted resulting from the transportation developments. Because IMPLAN® is a static model, the economic impacts are a snapshot in time (i.e., one year snapshots) and thus, the model is incapable of identifying which precise employment impacts carry from one year to the next. Resultantly, the annual employment impacts, measured in job-years, may be accounting for the same employed person over multiple years in the analysis, or alternatively, the same employment position with personnel turnover. Impacts in terms of the number of total employed persons resulting from transportation developments (though incalculable from the estimated job-years without an application of a loose assumption pertaining to the average length of employment, which varies by industry) are below the estimated total job-years, because invariably some of the employed persons are employed for more than one year.
. Economic activity/value added is the dollar value measure of the supplementary contribution to the intermediate production inputs of the final goods and services produced within the defined impact area. In a geographically defined impact area, value added is the measure of the total additional, dollar-value inputs into the production process. In

APPENDIX K: ECONOMIC IMPACT ANALYSIS 3
macroeconomics, value added refers to the contribution of the factors of production, i.e., labor, and capital goods, to raising the value of a product.
Direct impacts are impacts that affect only the specific industry in which expenditures are spent or job-years generated, i.e., the direct impacts resulting from construction expenditures occur only within the construction industry. Indirect and induced impacts, commonly referred to as multiplier impacts, occur in all other applicable industries within the defined impact area (via industry interdependencies). Purchases of goods and services by the construction industry from other industries and the purchases by those industries, in turn, of goods and services from other industries create the indirect impacts. Induced impacts are the result of the purchases by employees and proprietors with earned labor income received from the directly and indirectly impacted industries. Total economic impacts are the cumulative direct, indirect, and induced impacts.
IMPLAN® is a static model, with the economic impacts estimated only for a specific time period. It is incapable of estimating changing economic impacts beyond one-year intervals. Economic impacts calculated by IMPLAN®
3. IMPACTS FINDINGS
in this analysis are expressed and represent impacts only during the capital spending timeframe, based on expenditures in those years. Because the construction expenditures do not occur in perpetuity, the estimated economic impacts will only occur once, during the expenditure years, and thereafter, eventually taper off.
IMPLAN®
Impact estimates are calculated through a model application once the direct capital expenditures are applied to the appropriate industry sector and the model run. Presented below are the associated expenditures-related economic impacts with multiple dimensions. These include impacts by transportation mode, impact variable (i.e., job-years and economic activity), variable type (i.e., direct and total), and time period. In addition, the cumulative total for the overall period is presented
estimates the following impact variables: employment and economic activity/value added impacts, resulting from the projected direct capital expenditures. These impacts are only expenditure based, and do not include other impact types such as those related to travel efficiency savings or additional development in the State that would also be expected to occur.
2
3.1 Employment Impacts
.
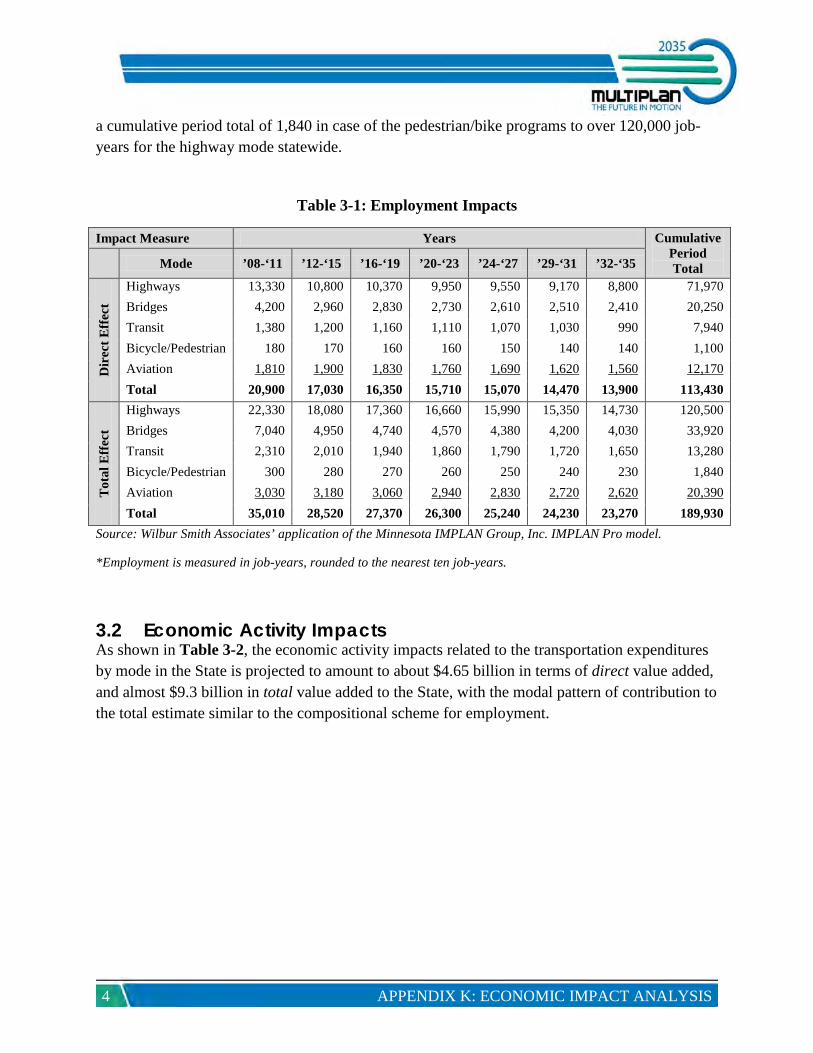
As shown in Table 3-1, the projected direct capital expenditures are expected to yield a cumulative total of about 113,430 direct job-years (ranging from 1,100 job-years related to pedestrian/bike programs to almost 72,000 highways-related job-years across the entire planning horizon) in the State. The corresponding cumulative planning period sum of the total (i.e., inclusive of the multiplier effects) job-years in Mississippi is projected at 189,930, ranging from
2 Cumulative employment impacts across the analysis horizon are measured in job-years (see footnote 2).
4 APPENDIX K: ECONOMIC IMPACT ANALYSIS
a cumulative period total of 1,840 in case of the pedestrian/bike programs to over 120,000 job-years for the highway mode statewide.
Table 3-1: Employment Impacts
Impact Measure Years Cumulative Period Total
Mode ’08-‘11 ’12-‘15 ’16-‘19 ’20-‘23 ’24-‘27 ’29-‘31 ’32-‘35
Dir
ect E
ffec
t
Highways 13,330 10,800 10,370 9,950 9,550 9,170 8,800 71,970 Bridges 4,200 2,960 2,830 2,730 2,610 2,510 2,410 20,250 Transit 1,380 1,200 1,160 1,110 1,070 1,030 990 7,940 Bicycle/Pedestrian 180 170 160 160 150 140 140 1,100 Aviation 1,810 1,900 1,830 1,760 1,690 1,620 1,560 Total
12,170 20,900 17,030 16,350 15,710 15,070 14,470 13,900 113,430
Tota
l Eff
ect
Highways 22,330 18,080 17,360 16,660 15,990 15,350 14,730 120,500 Bridges 7,040 4,950 4,740 4,570 4,380 4,200 4,030 33,920 Transit 2,310 2,010 1,940 1,860 1,790 1,720 1,650 13,280 Bicycle/Pedestrian 300 280 270 260 250 240 230 1,840 Aviation 3,030 3,180 3,060 2,940 2,830 2,720 2,620 Total
20,390 35,010 28,520 27,370 26,300 25,240 24,230 23,270 189,930
Source: Wilbur Smith Associates’ application of the Minnesota IMPLAN Group, Inc. IMPLAN Pro model.
*Employment is measured in job-years, rounded to the nearest ten job-years.
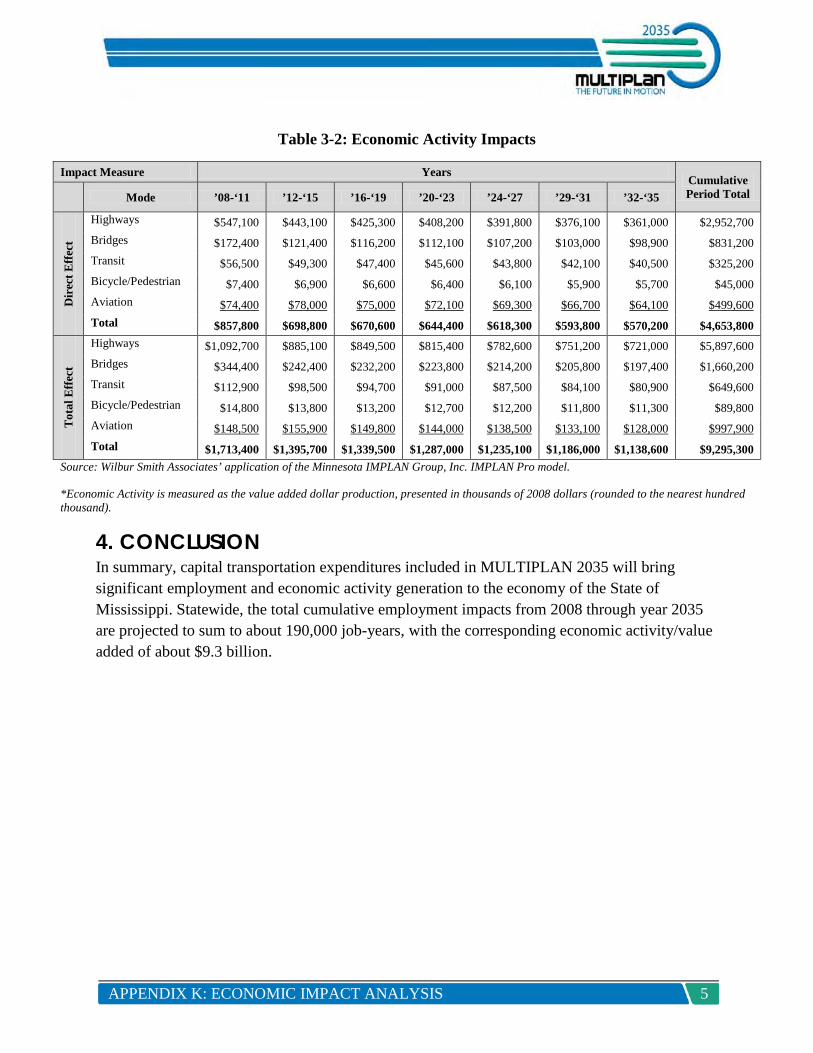
3.2 Economic Activity Impacts As shown in Table 3-2, the economic activity impacts related to the transportation expenditures by mode in the State is projected to amount to about $4.65 billion in terms of direct value added, and almost $9.3 billion in total value added to the State, with the modal pattern of contribution to the total estimate similar to the compositional scheme for employment.
APPENDIX K: ECONOMIC IMPACT ANALYSIS 5
Table 3-2: Economic Activity Impacts
Impact Measure Years Cumulative Period Total Mode ’08-‘11 ’12-‘15 ’16-‘19 ’20-‘23 ’24-‘27 ’29-‘31 ’32-‘35
Dir
ect E
ffec
t
Highways $547,100 $443,100 $425,300 $408,200 $391,800 $376,100 $361,000 $2,952,700 Bridges $172,400 $121,400 $116,200 $112,100 $107,200 $103,000 $98,900 $831,200 Transit $56,500 $49,300 $47,400 $45,600 $43,800 $42,100 $40,500 $325,200 Bicycle/Pedestrian $7,400 $6,900 $6,600 $6,400 $6,100 $5,900 $5,700 $45,000 Aviation $74,400 $78,000 $75,000 $72,100 $69,300 $66,700 $64,100 Total
$499,600
$857,800 $698,800 $670,600 $644,400 $618,300 $593,800 $570,200 $4,653,800
Tot
al E
ffec
t
Highways $1,092,700 $885,100 $849,500 $815,400 $782,600 $751,200 $721,000 $5,897,600 Bridges $344,400 $242,400 $232,200 $223,800 $214,200 $205,800 $197,400 $1,660,200 Transit $112,900 $98,500 $94,700 $91,000 $87,500 $84,100 $80,900 $649,600 Bicycle/Pedestrian $14,800 $13,800 $13,200 $12,700 $12,200 $11,800 $11,300 $89,800 Aviation $148,500 $155,900 $149,800 $144,000 $138,500 $133,100 $128,000 Total
$997,900
$1,713,400 $1,395,700 $1,339,500 $1,287,000 $1,235,100 $1,186,000 $1,138,600 $9,295,300 Source: Wilbur Smith Associates’ application of the Minnesota IMPLAN Group, Inc. IMPLAN Pro model.
*Economic Activity is measured as the value added dollar production, presented in thousands of 2008 dollars (rounded to the nearest hundred thousand).
4. CONCLUSION In summary, capital transportation expenditures included in MULTIPLAN 2035 will bring significant employment and economic activity generation to the economy of the State of Mississippi. Statewide, the total cumulative employment impacts from 2008 through year 2035 are projected to sum to about 190,000 job-years, with the corresponding economic activity/value added of about $9.3 billion.


APPENDIX K: ECONOMIC IMPACT ANALYSIS A-1
APPENDIX A: IMPLAN® MODEL SUMMARY DESCRIPTION
A-2 APPENDIX K: ECONOMIC IMPACT ANALYSIS
IMPLAN® Professional 3.0 is an economic modeling, input-output based, social account matrix software with the capability of estimating the economic impacts to a defined geography ensuing from expenditures in an industry or group of industries. A social account matrix reflects the economic interrelationships between the various industries, households, and governments in an economy and measures the economic interdependency of each industry on others through impact multipliers. Impact multipliers are internally developed within IMPLAN®
Although a capable model for determining the annual economic impact from expenditures within an industry or group of industries, a limitation of IMPLAN
, derived from the regional purchase coefficients, production functions, and socioeconomic data for the defined economy, for each of the economic impact variables and are geographically-specific.
®
Another limitation of this economic impact analysis is that the IMPLAN
is that it is static, since it estimates impacts only for a specific annual period – without any dynamic effects. An underlying assumption of the model is that the economic impacts will occur only in the year in which the expenditures occur and would not carry over into subsequent years, which could occur in certain instances.
®
model does not account for economic impacts beyond the predefined study area resulting from expenditure leakages outside that study area, despite the fact that expenditure leakages outside the study area result in economic impacts there. It is assumed that the economic impacts to the defined study area resulting from expenditure leakages outside the defined area are relatively negligible.
