final report developing and validating a … · final report developing and validating a highway...
TRANSCRIPT
FINAL REPORT
DEVELOPING AND VALIDATING A HIGHWAY CONSTRUCTION PROJECT COST ESTIMATION TOOL
Cheryl A. Kyte Senior Research Scientist
Michael A. Perfater Associate Director
Stephen Haynes
Senior Transportation Engineer Fredericksburg District
Harry W. Lee
Location and Design Engineer Fredericksburg District
Virginia Transportation Research Council (A Cooperative Organization Sponsored Jointly by the
Virginia Department of Transportation and the University of Virginia)
Charlottesville, Virginia
December 2004 VTRC 05-R1

ii
DISCLAIMER
The contents of this report reflect the views of the authors, who are responsible for the facts and the accuracy of the data presented herein. The contents do not necessarily reflect the official views or policies of the Virginia Department of Transportation, the Commonwealth Transportation Board, or the Federal Highway Administration. This report does not constitute a standard, specification, or regulation.
Copyright 2004 by the Commonwealth of Virginia.
iii
ABSTRACT
In May 2002, Virginia’s Commonwealth Transportation Commissioner tasked his Chief of Technology, Research & Innovation with leading an effort to develop a definitive, consistent, and well-documented approach for estimating the cost of delivering construction projects. A task force that included Virginia Department of Transportation (VDOT) central and district office staff, Virginia Transportation Research Council staff, Commonwealth Transportation Board members, and a metropolitan planning organization member was formed to either locate a well-founded, tested method for estimating project costs that could be adapted for use by VDOT or develop one.
The task group found that a VDOT district had been using an estimation worksheet for several years that produced consistent and reliable results for certain types of roadway and bridge construction. The task group determined that no other method examined had the specificity and potential of this tool. The project team expanded the tool by collecting extensive project data and obtaining evaluations of VDOT project management personnel statewide to develop it further.
The existing Excel worksheet with roadway and bridge estimates was expanded to
include construction engineering, to be applicable for interstates, and to generate estimates for right-of-way and utilities costs. Data on completed projects were collected from all VDOT districts to help calibrate the model further to account for cost variations across the state.
The task group also recognized early on that a very strong focus on project scoping was
essential to accurate project estimation. A previous VDOT scoping committee had determined that VDOT did not have a consistent, uniform method that was being used statewide to scope projects. As a result, project cost estimates made at the scoping stage often did not hold up over time because key project features were invariably overlooked. The result was inaccurate estimates.
Testing of the cost estimation tool was completed in the summer of 2003. Analysis of a sample of completed VDOT construction projects throughout the state showed that the tool yielded results that, on average, differed from actual final project costs by 22 percent. After further modifications, the Project Cost Estimation System (PCES), as it was named, became a fully operational system for VDOT in October 2003. The PCES is composed of three elements: a cost estimation tool, an improved scoping process, and a project development website. The responsibility for maintaining and updating the PCES now rests with VDOT’s Scheduling & Contract Development Division.
FINAL REPORT
DEVELOPING AND VALIDATING A HIGHWAY CONSTRUCTION PROJECT COST ESTIMATION TOOL
Cheryl A. Kyte
Senior Research Scientist
Michael A. Perfater Associate Director
Stephen Haynes
Senior Transportation Engineer Fredericksburg District
Harry W. Lee
Location and Design Engineer Fredericksburg District
INTRODUCTION
Inaccurate estimation of the costs of construction projects has obvious and serious budgetary implications for transportation agencies. When project costs are underestimated, insufficient funds are budgeted for the actual cost of the project. When bills come due, agencies scramble to cover them and often have to delay or cancel other road projects. Conversely, substantial overestimation can lead to missed opportunities to fund needed projects. Over the past several years, this problem of keeping transportation programs in line with available funding grew in scale in the case of the Virginia Department of Transportation (VDOT) and began to capture the attention of agency leadership, the public, the media, and Virginia’s General Assembly. For example, according to the 2002 audit of the Springfield Interchange project in Northern Virginia, VDOT had to postpone or cancel 166 projects because costs were underestimated.1 A 2001 Joint Legislative Audit and Review Committee (JLARC) study had found that VDOT tended to underestimate construction costs significantly at each phase of project life.2 One of the study recommendations was that VDOT examine ways to improve cost estimates.
The problems associated with underestimating transportation project costs are not unique to VDOT. Many other state departments of transportation (DOTs) face similar problems. The issue has far-ranging implications. In fact, the National Cooperative Highway Research Program has begun a study to review the methods employed by various transportation agencies with the ultimate objective of developing a best practices guidebook.3 An American Association of State Highway and Transportation Officials (AASHTO) Task Force on Project Oversight found that other state DOTs were struggling with the same issues. Estimating the cost of highway projects accurately and consistently early in their development has become such a nationwide challenge
2
that in addition to the previously mentioned task force, AASHTO’s Subcommittee on Design formed the Cost Estimating Task Force to seek answers.
In conversations with staff from VDOT and other states in the early stages of this study,
many reasons as to why final project costs can exceed initial estimates became apparent. In certain cases, project scoping is not sufficiently detailed or potentially costly items such as traffic management devices, crossovers, turn lanes, and others are added as time goes by. In other cases, unforeseen environmental issues arise that require amelioration or the method used to estimate costs is incompletely or inconsistently applied. All of these sources of estimation error apply to various projects in VDOT’s case.
In addition to the practical and managerial difficulties caused by consistently underestimating and, therefore, “underbudgeting” projects, VDOT faced an increasingly skeptical public and legislature. Project delays and escalating costs led to unfavorable media coverage and a general view by the public that VDOT could not manage its work.
One of the key underlying issues was that VDOT did not have a consistent, documented,
statewide approach for developing project cost estimates early in the life of a project (i.e., at the scoping stage). Many early estimates tended to be based on judgment; history; incomplete project information; and, occasionally, guesswork. VDOT management made the assessment that the agency simply could not continue to run its business in this fashion: realistic program budgets could not be developed this way.
These developments reached a crucial point in May 2002. At that time, Commonwealth
Transportation Commissioner Philip Shucet asked the Virginia Transportation Research Council (VTRC) to develop a method to improve VDOT’s cost estimates. The request included developing an inclusive, definitive, consistent, well-documented, accurate approach to estimating the cost of delivering construction projects at the various stages of development and delivery. The commissioner emphasized that achieving accurate, reliable costs for the construction program is a critical piece in developing project budgets, delivering projects within budget limits, and improving VDOT’s credibility with the members of the legislature and the public.
PURPOSE AND SCOPE
The purpose of this study was to develop a methodology to ensure accurate and consistent cost estimations by VDOT. The objectives of the study were twofold: to improve VDOT’s project scoping process and to develop a cost estimation system suitable for use throughout the agency. The scope of the study was limited initially to cost estimations for typical or ordinary construction projects—large-scale or controversial projects were not included. However, as the project progressed, the project task force decided that the cost estimation tool developed could be used, at least in the early stages of project life, for almost all highway construction projects. This report discusses the development of the Project Cost Estimation System (PCES) up to Version 2.0, at which point the responsibility for its maintenance and updating was delegated to VDOT’s Scheduling & Contract Development Division.
3
METHODOLOGY To achieve the study objectives, the researchers pursued eight tasks: (1) formation of a
project task force, (2) review of the literature on project cost estimation, (3) survey of VDOT districts to determine their methods of cost estimation, (4) review of methods used outside Virginia, (5) recommendations to improve project scoping processes, (6) selection and necessary modification of the selected cost estimation tool, (7) testing and statistical analysis of the tool’s performance, and (8) further refinement and statewide implementation of the tool.
Formation of Project Task Force
A multidisciplinary task force was established to assist in the direction and tone of the research effort. It was essential that this group have the technical expertise and knowledge of the project development process to enable them to advise the project group. Thus, the group included representatives from VDOT, Virginia’s Commonwealth Transportation Board (CTB), and a metropolitan planning organization (MPO). The task force met extensively in the summer of 2002 and presented its findings to Commissioner Shucet in late September 2002. Members included:
• Gary R. Allen, Chief of Technology, Research & Innovation, VDOT, Task Force Chair
• Robert O. Cassada, Assistant Division Administrator, Scheduling & Contract Development Division, VDOT
• Robert C. Edwards, Assistant State Construction Engineer, Construction Management Division, VDOT
• Dwight L. Farmer, Director of Transportation, Hampton Roads Planning District Council
• James S. Gillespie, Senior Research Scientist, VTRC • Stephen P. Haynes, Senior Design Engineer, Fredericksburg District, VDOT • Bryan E. Kornblau, Member, Commonwealth Transportation Board • Cherie A. Kyte, Senior Research Scientist, VTRC • Kenneth E. Lantz, State Transportation Planning Engineer, Transportation & Mobility
Planning Division, VDOT • Joe E. Orcutt, Transportation Engineer Program Supervisor, Transportation
& Mobility Planning Division, VDOT • John W. Lawson, Division Administrator, Financial Planning Division, VDOT • Harry W. Lee, Fredericksburg District Location & Design Engineer, VDOT • Dewey O. Litton, Location & Design Division, VDOT • Mohammad Mirshahi, State Location & Design Engineer, VDOT • Leonard S. Mitchell, Member, Commonwealth Transportation Board • Michael A. Perfater, Associate Director, VTRC • Murali Rao, Director, Information Technology Applications Division, VDOT
4
Review of the Literature
The researchers reviewed publications from legislative and financial audit sources and other reports on cost estimation in particular. They found relevant publications on the work of other states through the suggestions of the task force members and more general cost estimation articles through on-line journal searches (WebCat).
Survey of VDOT Districts
VTRC staff had conducted preliminary research on cost estimation in early 2002 and had found that VDOT’s Fredericksburg District was obtaining very accurate project cost estimates using an estimating tool developed in-house. The developers of the tool were contacted in an effort to investigate the procedure further. At the same time, the researchers sent emails to administrators in the other eight VDOT districts to find out how they were estimating project costs. Emails were sent to the heads of the location and design, right-of-way, construction, and structure and bridge sections in each district.
Review of Methods Outside Virginia Representatives from the project task force examined the structure and output of several
project cost estimation methods in use by other state transportation agencies and one method available from a private company.
Improvement of Project Scoping
The VDOT Project Scoping Committee had met extensively after its formation in 2002, and this group had developed recommended methods for enhancing and improving project scoping. The premise behind these recommendations was that the more information planners have on a project at the early stages, the better their estimates will be. Thorough and well-documented project scoping was seen as inextricably entwined with a project cost estimation system.
One member of the project cost estimation task force, VDOT’s Fredericksburg District
Location & Design Engineer, joined the VDOT Project Scoping Committee as its co-chair. The committee defined scoping as a systematic means of defining the purpose, need, and characteristics of proposed improvement projects. The members explored many issues central to good project scoping, including how to convene successful project scoping meetings. Meanwhile, members of the cost estimation task force, along with staff from VDOT’s IT Applications Division, worked to help develop a new “project development website” as an intranet-based repository that would contain all information for every VDOT project. The VDOT Project Scoping Committee had been charged with developing an appropriate scoping model to be used statewide. The Fredericksburg District Location & Design Engineer kept the cost estimation task group continuously updated on the progress of this committee.
5
Selection of Cost Estimation Tool After reviewing project cost estimation methods in use outside and across Virginia, the
task force selected the tool they judged to be the most effective, to be the most conducive to statewide implementation, and to have the greatest potential to be deployed in VDOT without a long delay.
Testing and Statistical Analysis
A testing and validation exercise was designed to compare the estimates of a sample of
132 completed projects prepared by each VDOT district using the selected tool and the actual final cost of the projects. This comparison provided necessary information on how the tool performed and directed the research team toward any area that needed refinement and further study.
Further Refinement of Tool and Statewide Implementation
The testing and statistical analysis enabled the researchers to identify areas of the tool that needed improvement before statewide implementation.
RESULTS AND DISCUSSION
Literature Review
The literature demonstrated that underestimating project costs is endemic across the world and transcends types of transportation projects and even other large-scale public projects outside the transportation realm.
Pickrell argued that examples of cost underestimation could be found beyond highway infrastructure projects.4 The researcher found that a systematic tendency to underestimate costs and overestimate potential transit and rail customers generates a bias toward the selection of rail projects over other transit alternatives and recommended that forecasts be reviewed by objective, outside experts and be accompanied by disclaimers of uncertainty. The number of rail projects included in the study was relatively small.
Flyvbjerg et al. demonstrated that project cost forecasting for large infrastructure projects of any kind is a challenge.5 The researchers analyzed a large sample (258 rail, road, and fixed-link projects) of transportation infrastructure projects from around the world. They relied on actual project construction costs at the time of completion compared to the estimate made at the time of decision to build in their analysis of error. The researchers did point out that this estimate is not always available for all projects, that various agencies differ in their planning processes, and that later estimates were used in some cases. As a consequence, they stated, their method may have led to a conservative measure of inaccuracy. As in the earlier Pickrell study,4 the researchers concluded that cost forecasts tend to underestimate final costs 9 of 10 times. The
6
researchers divided the sample by type of project and found that actual road project costs are typically 20 percent higher than forecast. Underestimation transcended world region and type of project and spanned all 88 years of the sample (1910 through 1998). The findings pointed to an absence of learning and improvement in methods over time; i.e., the underestimation is consistent over time. The researchers took their conclusions a step further and asserted that their evidence showed a deliberate attempt (dubbed “strategic misrepresentation”) by economic forecasters and project promoters to keep cost estimates low so that projects will be built. The researchers acknowledge that not all details and unexpected problems can be accounted for but that it is possible to forecast the likelihood that these will be encountered based on other previous projects. The researchers recommended increased transparency of cost estimates and methods, increased use of performance specifications, involvement of private risk capital in public projects, and increased accountability.
The JLARC analysis of VDOT projects involved examining the accuracy of cost estimates, cost increases, and time schedules of construction projects.2 JLARC relied on data from 297 projects beyond the design or construction phase. They found that early project estimates are much lower than estimates made later on and that the final construction cost tends to be greater than the award amount. JLARC pinpointed some reasons initial estimates tend to be low: augmenting a project’s scope, excluding inflation in the estimates, and leaving out items such as sound walls and lighting. Final cost tended to exceed awarded amounts because of overlooked, complicating, and troublesome field conditions and unforeseen contract administration costs.2 JLARC made several recommendations regarding cost estimation and scoping, including that VDOT review its cost estimation process with an eye toward improvement.
The Commonwealth’s Auditor of Public Accounts (APA) completed a review of VDOT’s budgeting and cash management practices in July 2002.6 Although the study task force began work before the APA process, several APA findings were related to cost estimation, echoing JLARC, and underscored the importance of the work of the task force:
Transportation should develop and employ a more rigorous cost estimation process, and allocate more resources (front loading) to the development of cost estimates during the planning process, thereby yielding more refined and more accurate project concepts. We believe Transportation has taken a step in the right direction with the formation of the group to study cost estimates. We strongly urge Transportation to closely monitor their progress and ensure the development and application of a reasonable, realistic, and consistent cost estimation method.
The APA concluded that VDOT did not have the necessary practices in place to foster accurate project estimates, accountability for a project, and communication among the multiple VDOT divisions involved in the projects. The APA concluded that inflation, contingencies, and construction engineering were not always applied appropriately or consistently.
An audit of the Springfield Interchange project by the U.S. Office of the Inspector General also reached conclusions regarding VDOT’s project cost estimation process. The findings led the auditors to recommend that the Federal Highway Administration require VDOT to “complete its planned review of VDOT’s cost estimation process to ensure that it is sufficiently rigorous to generate reasonable estimates of project costs.”1
7
Survey of VDOT Districts
The researchers received responses from five of the eight districts surveyed.
The email survey of VDOT’s construction districts revealed a variety of methods in use across the state to estimate projects. Of the five respondents (Salem, Richmond, Lynchburg, Culpeper, and Bristol), the Bristol District was using the Fredericksburg estimation tool mentioned previously, along with geography-specific historical cost data. The other districts relied on a combination and variety of methods, including a standard form from VDOT’s Location & Design Division, statewide planning cost per mile data prepared by VDOT’s then Transportation Planning Division, historical cost data, and engineering judgment. No one method was judged appropriate for adaptation statewide by the research team.
One district respondent expressed the need for intense and complete scoping of each
project as “the only way to obtain a truly accurate (or at least the best possible) estimate.” In the opinion of the respondent, such scoping should involve full participation from all professional disciplines and outside input from local political officials. Another respondent mentioned the difficulty of estimating projects when each seems unique.
Review of Methods Used Outside Virginia
Members of the task force reviewed a privately available method, TRACER, and
methods in place at other state DOTs (Maryland, Washington, Florida, and Delaware).7-12 Each had elements that appealed to the task force, specifically the Washington State DOT’s use of risk factors and cost probability ranges and TRACER’s ability to produce consistent estimates and its ease of use. However, no method the task force looked at was judged to be immediately applicable in Virginia, especially within the very short time frame of the study. TRACERTM (Transportation Cost Estimator)
Earth Tech, Inc., developed a software prototype named TRACER to estimate the cost of transportation construction. The package is an adaptation of a successful software application that Earth Tech created to estimate the costs of other kinds of construction. The prototype available for testing, and the literature that accompanied it, gave a good idea of the capabilities TRACER promises: (1) ease of use (for an engineer or technician armed with the available information about the project); (2) the ability to create and update a cost estimate throughout the design process; and (3) consistent estimates based on consistent standards and costs, no matter who makes the estimate and no matter where the estimate is made.7
The software bases the cost estimate on quantities or units of work: tons of structural steel, cubic yards of excavation, etc. For an early stage project, TRACER supplies default values for most quantities as a function of a few very basic specifications. As the project matures and more information becomes available, the software user can override and replace the default values to create a progressively more accurate estimate of the true quantities.
8
TRACER appears to have the ability to generate consistent estimates among its users and appears relatively easy to use. However, at the time this study was conducted, the software was still in the prototype stage and was not available for immediate use. Since it is a proprietary software package, it would have been difficult for VDOT to modify or substitute Virginia-specific data during the time frame of this study.
Cost Estimation Practices in Other States The template for the Maryland State Highway Administration’s cost estimation tool is a
large Excel notebook. The file is designed to accommodate both early-stage estimates and detailed late-stage estimates. The memorandum accompanying the Excel file explains that three methods of cost estimation are possible: (1) a simple approach that models all costs based on historical costs per mile, (2) an approach that accepts project-specific estimates of grading and paving costs and models all other costs as a percentage of paving and grading, and (3) a detailed quantity-based estimate. The method chosen obviously depends on the amount and quality of project information available at a given time. The cost guidelines that support the three methods are derived from three maintained databases: costs per mile, percentage costs, and historical unit costs, respectively.8,9
The Wisconsin DOT publishes summary output from its cost estimating validation process, with much additional information about the status of each major construction project, on its Internet website. The website shows a project description and benefits, any assumptions made to adjust estimates, cost probability ranges, and major risk factors and some unknown factors that could increase the cost of the project. A team of public and private sector experts reviews the costs periodically and adjusts them as more information about the project becomes known.10
The Florida DOT’s Transportation Costs Report provides periodically updated historical
data on highway cost per centerline mile (for rural and urban roads of two through eight lanes), new bridge construction and bridge preservation cost per square foot, costs of traffic signals, right-of-way costs, engineering costs, and unit costs for bicycle and pedestrian facilities.11
The Delaware DOT uses a form with a set of blank lines on which to write the dollar estimates of each anticipated component of total cost. The list of cost components goes into fine detail. Other than for “contingency costs (normally 5% for large projects and 10% for small projects—to be approved by section head)” the form specifies no quantitative relationships among the subentries; all they must do is add correctly. The form specifies no relationship between cost and physical quantity.12
Researchers at VTRC conducted a survey of nine state DOTs in the spring of 2001:
Delaware, Florida, Kentucky, Minnesota, Pennsylvania, Tennessee, Texas, Washington, and West Virginia.13 The researchers identified two basic cost estimate methodologies: respondents either (1) applied a method based on estimating quantities based on specific items known through available mapping, anticipated typical sections, and engineering judgment, or (2) relied on tables of average cost data for groups of similar projects.
9
Improvement of Project Scoping
The recommendations of VDOT’s Project Scoping Committee centered on raising the profile and importance of scoping at VDOT. These recommendations included best practices for the structure of the scoping team, preparation for the scoping meeting, communication among staff, documentation of the process, definition and control of scope creep, and re-scoping of projects when they change significantly.
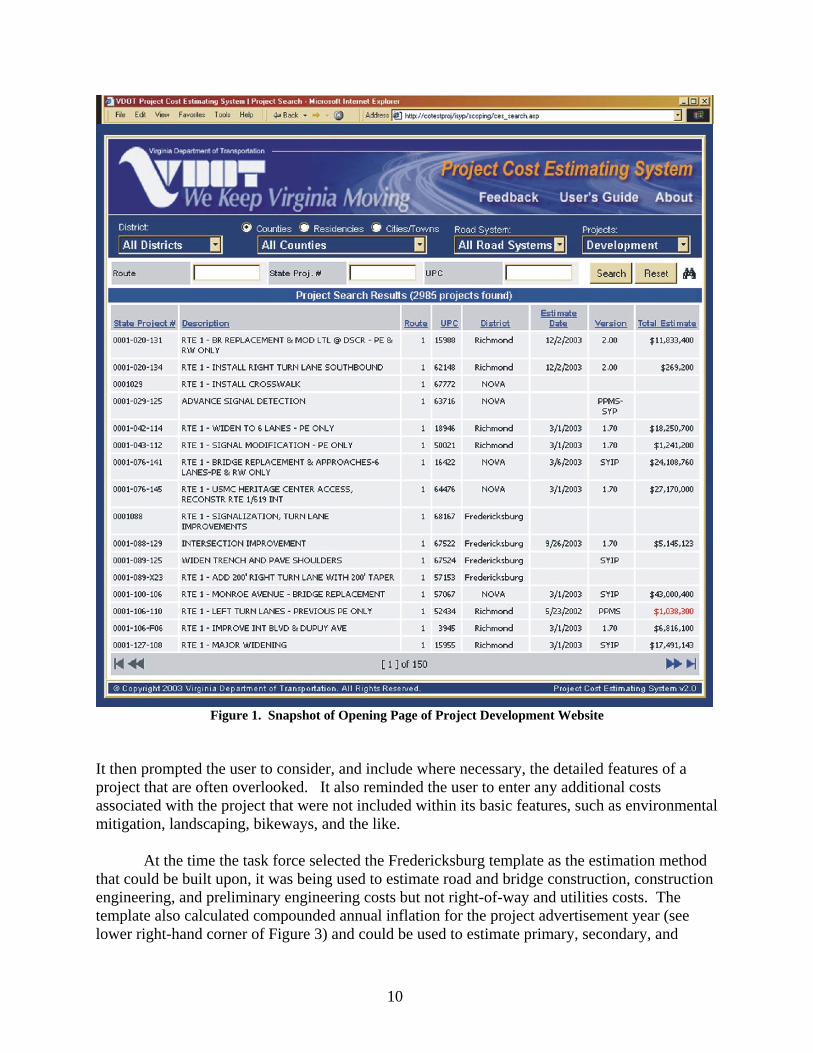
In addition, the project development website was developed to serve as a repository for project information. All information about a project can be reached through the website. Estimates, plans, maps, documents, video, project cross sections, the names of project contacts (and how to reach them)—anything that is pertinent to the project—can be viewed on the site. The site is searchable by project number and by district. Figure 1 is a snapshot of the website’s opening page.
The website also displays detailed information about individual projects, such as location,
description, scope of work, project status, and project manager (see Figure 2). An email feature enables staff accessing the site to contact the project manager. All these features are designed to enable staff to access critical information on any given project. The website is the place for “one-stop shopping” for any information on a project. Perhaps most crucial, it enables VDOT to maintain, save, and eventually archive the history of every project from cost estimates to environmental documents in one location.
Selection of Cost Estimation Tool
The task force decided that the construction cost estimation tool used by VDOT’s Fredericksburg District, with necessary adjustments, was the most conducive to adaptation statewide. Staff in the district had developed the template several years previously, and the tool had been performing well for certain types of road and bridge projects during that time. Formal records of performance were not kept, but the developers recall estimates falling within 5 to 10 percent of actual costs with a tendency to err, if at all, on the side of overestimation rather than underestimation, which had been the tendency for many projects in the recent past.
In addition, the task force believed the tool provided an excellent basis upon which to build a broader and even more inclusive estimation method. The “Fredericksburg template,” as it was called in its earliest form, had further advantages: it was relatively easy to learn and use since it was an Excel spreadsheet and it was a practical, systematic approach for estimating project costs. It was also felt that with some customizing, the template could be deployed in all VDOT districts fairly quickly.
The template had been used by Fredericksburg district staff for several years and had
seen much refinement over that time. An Excel worksheet was used to estimate construction costs for primary, secondary, and urban projects and for bridges. It included an annually compounded inflation rate and a method to estimate preliminary engineering (PE) costs. The basic principle of the tool was to begin with the basic elements or commonalties across projects.
10
Figure 1. Snapshot of Opening Page of Project Development Website
It then prompted the user to consider, and include where necessary, the detailed features of a project that are often overlooked. It also reminded the user to enter any additional costs associated with the project that were not included within its basic features, such as environmental mitigation, landscaping, bikeways, and the like.
At the time the task force selected the Fredericksburg template as the estimation method
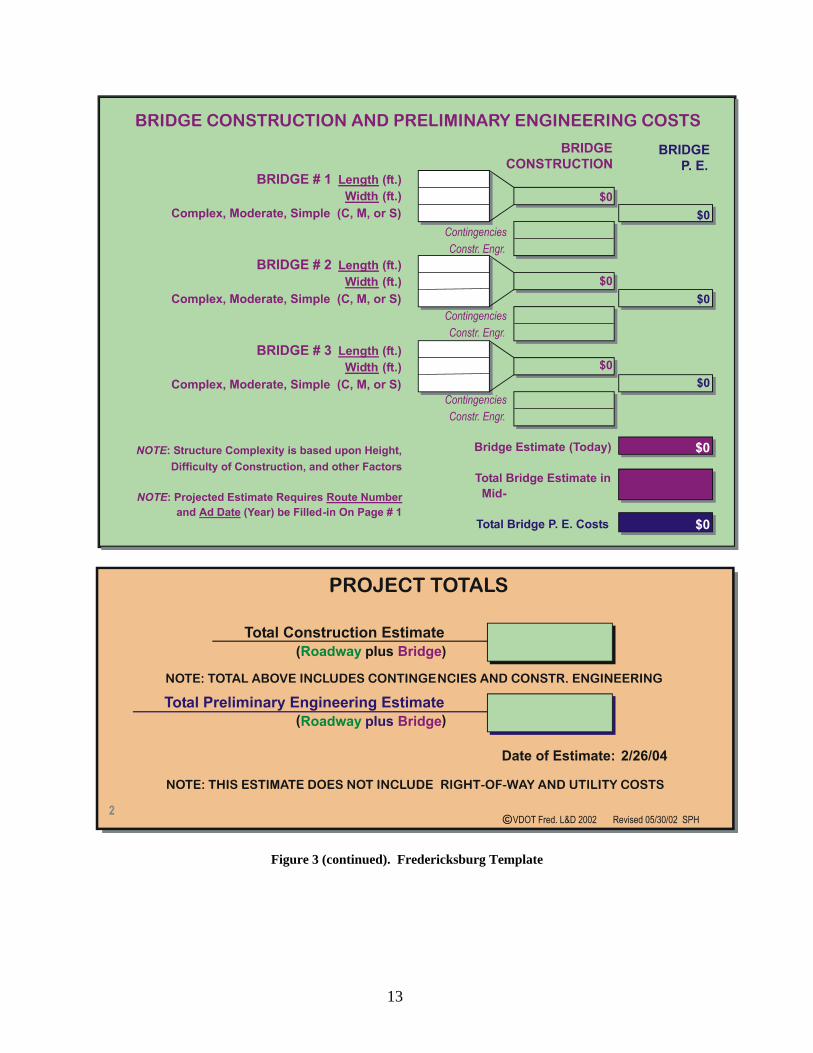
that could be built upon, it was being used to estimate road and bridge construction, construction engineering, and preliminary engineering costs but not right-of-way and utilities costs. The template also calculated compounded annual inflation for the project advertisement year (see lower right-hand corner of Figure 3) and could be used to estimate primary, secondary, and

11
Figure 2. Project Information Menu of Project Development Website urban projects, but not interstate projects. Since the focus of the template was the development of cost estimates very early in the project development cycle, it called for a broader approach than the detailed unit price and quantity approaches that had been used by VDOT estimators historically. An early version of the Fredericksburg template is provided in Figure 3.

12
Figure 3. Fredericksburg Template (continues)
13
Figure 3 (continued). Fredericksburg Template
14
Overview of the Development of the Fredericksburg Template The idea behind the development of the estimation template was to build an easy-to-use
spreadsheet that would include all project attributes, paying special attention to items that had tended to be typically overlooked during the estimation process. Historically, such items tended to include crossovers, turn lanes, curb and gutter, landscaping, and the like (shown in a “checklist” style in the template). Excluding or underestimating the costs of such relatively high-dollar items had resulted in major miscalculation with regard to project costs. An exhaustive list of often overlooked project features was included into the estimation template, and a cost figure for each was calculated based on the amount it contributed, on average, to overall project cost. The guiding principle here was that the actual dollar values attached to each item are far less important than the inclusion of some “relatively reasonable” figure that, when included in a complete estimate, yielded a more realistic result than if they were grossly underestimated or omitted completely.
In building the template, the approach by Fredericksburg staff was to determine which costs were “common” to most projects and which were “unique” or specific. Common items are best defined as those for which a relationship between alignment length and cost could be determined and that varied mainly by the classification of the roadway. (Such items could have a practical “cost-per-mile” value applied.) The unique items were typically those most often overlooked when scoping estimates were created. In addition, the costs of these unique items were not typically correlated with alignment length. The focus of the template therefore became to prompt the user to consider expensive, unique, and unusual items individually while the common items were applied from a “per mile” table of data. Common costs and unique costs were compiled from a sample of about 40 typical or average construction projects in the Fredericksburg District. The data consisted of actual costs paid to contractors, award amounts, and final TRN*SPORT estimates. {TRN*SPORT estimates are those detailed quantity estimates (bid prices on awarded projects) that typically are made when construction projects are well along in their development cycle.}
The total sample of primary highway projects used in the creation of the estimating system was relatively small in the initial database simply because there were fewer such projects in the Fredericksburg District than in other districts. However, the projects in the sample provided detailed information. There were more rural primary projects than urban ones, but a reasonable sampling of each was on hand. Interstate highway projects, on the other hand, were few and were generally very specific in scope. It did not seem prudent at the time to incorporate interstates or other freeways into the new estimating model until further data became available, so that was not done at this juncture. Ultimately, about 80 projects were used to form the basis for the template.
Fredericksburg staff decided that a worksheet would be arranged to prompt the user for
three types of input. The first would be general information, which would establish a foundational estimate based upon the appropriate common cost factor (CCF) (which is based on the per mile average of many similar projects). The second would involve the selection of quantities of specific unique items. These items, which would be prompted for where appropriate, would be objects that might have been commonly omitted in previous estimation practices, including turn lanes and traffic signals (which could have their cost based upon
15
classification and speed), crossovers (on divided highways), costs related to median type, and costs associated with whether shoulders or curb and gutter would be used. The third type of input would be unique or unusual items requiring a specific dollar input. These items, determined by specialists in a particular field, might include things such as large drainage structures and other lump sum costs that could be projected as a result of previous experience..
The costs common to an average mile of project were derived based on a 10-foot-wide
lane. The actual cost associated with any of the individual items is based on an average, rounded up to an even dollar amount. The logical breakdown was the geometric standard (the third entry box in Figure 3). By determining a design speed (and thus a lane width), all other factors (such as varying shoulder and ditch width) could be included in a CCF for the particular geometric standard. The CCF included costs for everything common to all projects within a geometric standard, such as stone, asphalt, grading, pipes, erosion control, pavement markings, moderate shoulder widening, etc. In other words, the CCF is the cost of every “usual element” averaged and factored according to highway type. By working backward from actual final payments to contractors, using the as-built plans and contract, a set of CCFs was established. These “per mile” multipliers would be the average of all of the projects within each classification/design speed category, after the known, unique costs were subtracted from the individual projects in the sample.
Development of Common Cost Factor
As a first step in deriving the CCFs, the first order of partitioning was to place similar projects into groups, which could be used to begin building data tables. The eight main VDOT geometric standards (four rural, four urban) were logical categories. Projects were further segregated by traffic volume within each functional classification. (On most rural projects, traffic volume determines design speed, which determines pavement width and depth, shoulder width, minimum radius, and maximum grade. For urban design, the selected design speed determines many of these factors. Most of the common cost items on a project are a product of the functional classification and traffic volume or the design speed.) The final breakdown of projects involved the separation of urban projects into those with either shoulders or curb and gutter. (Although number of lanes was another obvious grouping partition, it was hoped that a previously established practice at VDOT regarding alignment mileage of two- and four-lane highways would prove to be a simple method of handling multiple lanes.) The first table of costs was, therefore, logically based upon the differences between design standards.
On any given classification of roadway for which approximate traffic volumes could be
established (and, therefore a design speed could be determined), a cost per mile, based upon project averages, could be derived. The items that seemed reasonable to include in this group included general paving, grading, drainage, and incidentals. (The term general indicates that unusual costs in these categories, when known, should be considered unique and handled as additional costs.) The difficulty in drawing a line between which costs should be considered general (or common) and which should be regarded as unique (or unusual/project specific) existed within the question: What data are commonly available at early stages of project development, assuming a thorough scoping effort will be performed? Unique items that were
16
normally undetermined at the scoping stage would be included in the CCFs. These “soft costs” would be an average of all of those types of items from the database of completed projects, which could be applied to all estimates. This issue would prove to be the most difficult in terms of the understanding of the users. Inevitably, questions, such as these, would be posed by potential users: What about unsuitable material excavation or guardrail? How about corrugated metal and concrete pipes? Are contingencies and work orders accounted for in these figures? (These items are unique to projects but normally unspecified at project scoping.) The answer would ultimately be: The cost of an average amount of unsuitable material excavation and guardrail and pipes and pavement markings and contingencies and work order adjustments, etc., are included in the common cost for any project being estimated. Since the database contains actual completed construction projects, the cost of normal (or typical) cost overruns and work orders were already included in the database, as were typical amounts of environmental costs, etc. The estimate generated by the worksheet is the estimate for the final payout of the project.
Other Adjustments to Base Estimate Construction engineering (originally computed as a flat 12% of construction costs in
order to match other estimating methods and later, a more accurate figure based on an historic curve) would be added and the total would be factored for compounded inflation to the year of advertisement.
Certain costs are fixed, regardless of the cost of the project. For this reason, small projects have slightly higher per mile costs than typical ones, all other things being equal. This difference in costs averaged out to about 20 percent higher for the smallest projects. Because early project estimating must have its basis in the length of the project, the district staff determined that a cost adjustment factor of +20 percent should apply to projects less than 0.5 mile in length and a cost adjustment factor of +10 percent should work for projects between 0.5 and 1.0 mile in length. Projects over 1.0 mile in length required no adjustment.
Well before the worksheet was conceived, VDOT’s then Programming & Scheduling Division determined that there was a general relationship between the cost of construction of two lanes versus four lanes versus ramps and loops. If 1 mile of two-lane highway was considered to be “1.0,” then 1 mile of a four-lane highway was considered to be 1.8 multiplied by that baseline cost and 1 mile of ramps/loops was 2.0 times the baseline cost. This was how alignment mileage was determined. The only change made for the worksheet was that ramps and loops were found to be about 1.8 times the cost of two-lane mileage as well.
An adjustment required on each project (regardless of whether it was completed 10 years ago or whether it was still 10 years away from construction) was the annual compounded inflation rate. Initially, VDOT’s own 3.89 percent was applied by the worksheet. (This is now a flat 3% according to VDOT’s Financial Planning Division and will require periodic maintenance as will all of the other features.) This rate will likely be adjusted depending on prevailing market conditions.
17
A couple of adjustments for items specific to low volume roads were required. The Virginia Resurfacing, Restoration, and Rehabilitation (RRR) Guidelines (VDOT Road Design Manual, Location & Design Division) were established to allow improvements for a fraction of the cost of normal construction, which will extend the service life of an existing low-volume facility. The data indicated a savings of about 25 percent over “normal” standards, so a 0.75 multiplier was applied. In the rare event that surface treatment was chosen over plant-mix asphalt, the savings was set at 40 percent (versus “normal” standards), although use was extremely scarce in this category.
The factors listed in the previous paragraphs were applied to a given project to determine the cost per mile of all items that varied directly with length.
Unique/Unusual Project Items
The principal issue here was identifying which costly, unique, or unusual items could be ascertained at a sufficient level of detail during early project development. The identification of these items and the appropriate quantities to be included in the estimate would require a thorough scoping process with the expertise of a diverse group of specialists. In fact, every further decision in the development of the template was based on the supposition that a thorough, fact-based, methodical effort would be given by all project team members from various disciplines regarding the attributes of the project. In other words, as much guesswork as possible needed to be eliminated during the scoping phase. Project team members had to develop project information during on-site visits to the project and collaborations with team members to derive the most realistic information that was available.
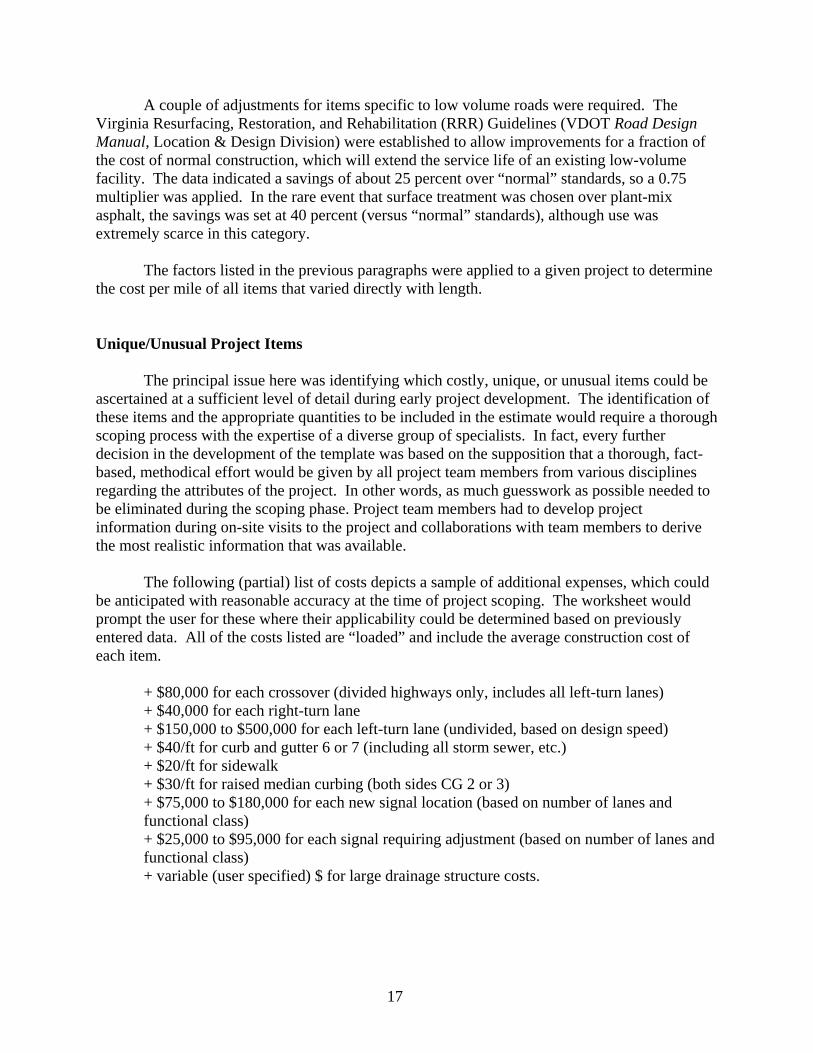
The following (partial) list of costs depicts a sample of additional expenses, which could
be anticipated with reasonable accuracy at the time of project scoping. The worksheet would prompt the user for these where their applicability could be determined based on previously entered data. All of the costs listed are “loaded” and include the average construction cost of each item.
+ $80,000 for each crossover (divided highways only, includes all left-turn lanes) + $40,000 for each right-turn lane + $150,000 to $500,000 for each left-turn lane (undivided, based on design speed) + $40/ft for curb and gutter 6 or 7 (including all storm sewer, etc.) + $20/ft for sidewalk + $30/ft for raised median curbing (both sides CG 2 or 3) + $75,000 to $180,000 for each new signal location (based on number of lanes and functional class) + $25,000 to $95,000 for each signal requiring adjustment (based on number of lanes and functional class) + variable (user specified) $ for large drainage structure costs.
18
Initial Use of Template and Further Refinements
The road designers of the Fredericksburg District Location & Design Section began using this estimation method on all projects in early 1999. Minor adjustments would be made over the next 3 years, which would refine the values based on the ever-growing database of completed projects. Enhancements were made in a way that would retain simplicity and ease of use and would continue to emphasize roadway features (versus items) so as to achieve the goal of addressing estimating needs at the early stages of project development.
Over time, it became apparent to district staff that other costs should be included in the template. The first major enhancement was the provision of a bridge estimation section. Research showed that bridge costs could be estimated with reasonable accuracy on the basis of the deck area. A cost per square foot was normally applied from a range based on the complexity of the structure. It seemed adequate to provide three categories of bridges—simple, moderate, and complex—to which a cost per deck area could be applied. The designer would provide the length, width, and complexity, and the worksheet would calculate the cost. These estimates were based on the cost per square foot of a typical bridge of moderate complexity in the district. Multipliers brought that cost up or down if the bridge was simpler or more complex than typically seen.
Further enhancements to the template by Fredericksburg staff included a provision for PE
costs for roads and bridges. Analysis of the project data demonstrated that PE costs ranged from about 8 percent of construction costs on very expensive projects to about 20 percent on very small ones. Bridge PE costs were similar but ranged from about 2 to about 40 percent.
Finally, roadway and bridge PE costs could also be calculated within the worksheet based
on historical PE as a percentage of construction costs. Inflation was also a component of the estimate and was compounded annually up to the year of project advertisement.
Modification of Cost Estimation System
The Fredericksburg template, which was to become the VDOT prototype project cost estimation system (PCES), was selected by the task group with the full knowledge that many adjustments and augmentations would have to be made to encompass all road projects (e.g., there was no way to estimate interstate projects) and to account for cost variations across the state. In addition, the template did not include components for building estimates of right-of-way and utilities costs. VDOT district and central office staff had several opportunities to provide comments and feedback regarding successive versions of the tool. These modifications took place over the course of 1 year; involved hundreds of VDOT staff and management who participated in meetings, demonstrations of the tool, and hand-on training sessions; and resulted in a prototype version of the estimation system that could be tested and validated.
The template also contained only Fredericksburg cost data and thus could not be used
statewide without adjustment; e.g., construction costs in the Northern Virginia District are known to be higher than in other districts. In addition, the template had several curves (e.g.,
19
construction and bridge PE) that relied solely on Fredericksburg project data and therefore required validation across the state. The existing construction engineering and inspection flat percentage rate were refined to vary with project cost. Finally, the bridge estimates were based on a relatively small sample of projects and required sample expansion and validation. These modifications were made over a 1-year period between the summer of 2002 and the summer of 2003. The PCES was then tested for accuracy and validity in early summer 2003.
Accounting for Statewide Cost Variation
The task force determined that the most efficient and expedient way to enable the template to be applicable statewide was to adjust the Fredericksburg costs (which were about the overall state average) by factors derived from actual project data from each district. After some consideration and an examination of potentially available data, the districts were asked to provide information that could be used to compare common costs of projects across the state for a range of project types in each district.
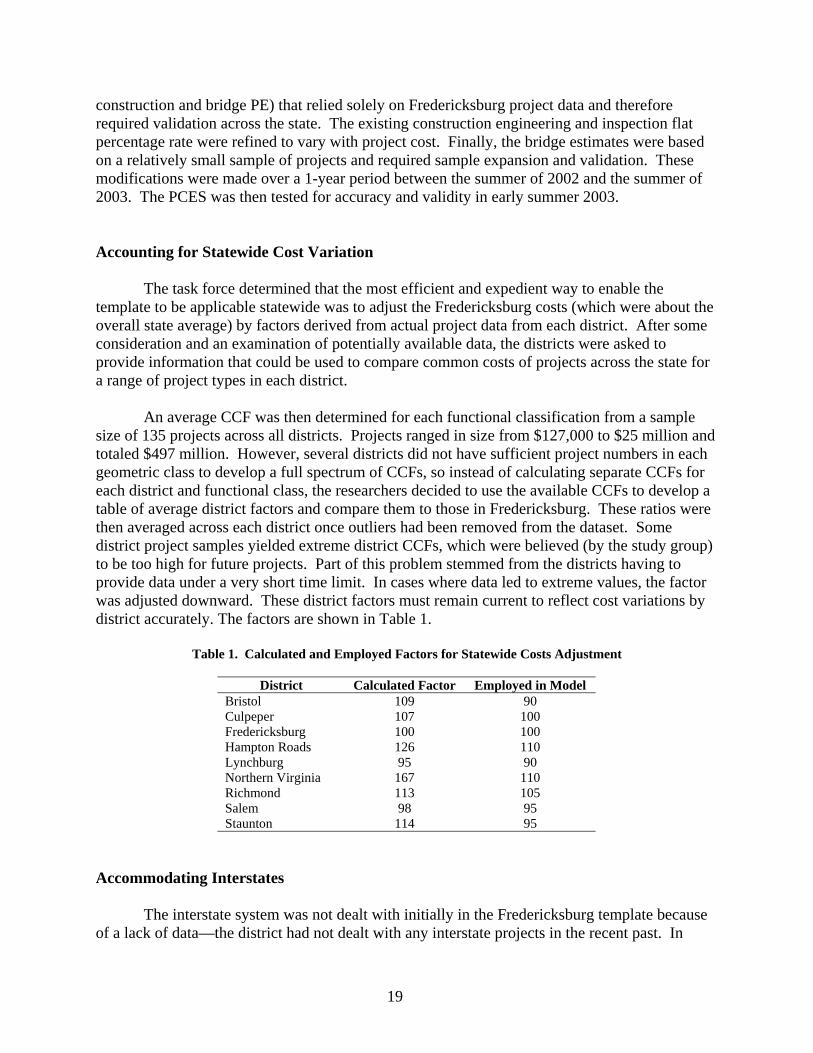
An average CCF was then determined for each functional classification from a sample size of 135 projects across all districts. Projects ranged in size from $127,000 to $25 million and totaled $497 million. However, several districts did not have sufficient project numbers in each geometric class to develop a full spectrum of CCFs, so instead of calculating separate CCFs for each district and functional class, the researchers decided to use the available CCFs to develop a table of average district factors and compare them to those in Fredericksburg. These ratios were then averaged across each district once outliers had been removed from the dataset. Some district project samples yielded extreme district CCFs, which were believed (by the study group) to be too high for future projects. Part of this problem stemmed from the districts having to provide data under a very short time limit. In cases where data led to extreme values, the factor was adjusted downward. These district factors must remain current to reflect cost variations by district accurately. The factors are shown in Table 1.
Table 1. Calculated and Employed Factors for Statewide Costs Adjustment
District Calculated Factor Employed in Model
Bristol 109 90 Culpeper 107 100 Fredericksburg 100 100 Hampton Roads 126 110 Lynchburg 95 90 Northern Virginia 167 110 Richmond 113 105 Salem 98 95 Staunton 114 95
Accommodating Interstates
The interstate system was not dealt with initially in the Fredericksburg template because of a lack of data—the district had not dealt with any interstate projects in the recent past. In
20
order to incorporate interstates, the task force sought the assistance of VDOT’s Assistant State Construction Engineer. The CCFs for the GS-1 (Rural Principal Arterial System) and GS-5 (Urban Principal Arterial System) “freeway” options were used and adjusted according to the design speed of the interstate. For high-speed rural locations (70 mph design speed) the adjustment to the normal GS-1 CCF was determined to be +33 percent. For interstate locations calling for a 60 mph design speed, a factor of +25 percent was established. These cost adjustments were verified by comparing them to cost trends in the 2002 VDOT Roadway Values Report, used to assess the value of VDOT’s roadway assets.14
Verification of Other Cost Relationships
The tool’s existing roadway and bridge PE curves were verified using samples of costs from recently completed projects from across the state (136 roadway and 23 bridge projects). To account for consultant PE costs, which tend to be higher than in-house costs, the user can choose the percentage of PE work to be contracted out. The original flat construction engineering percentage was modified into a sliding percentage of construction costs based on historical data and the experience of the study group. Analysis of construction engineering and inspection (CEI) costs indicated that they ranged from 11 percent on projects with a construction estimate at or exceeding $12 million to about 18 percent for projects that were less costly. The sample used to develop these CEI costs consisted of 30 projects.
Construction and Bridge PE Verification
This cost is a variable figure based on a data-derived curve plus any user-specified additional or unusual PE costs. The PE curve is derived from the ratio of PE costs over construction costs. The range is from about 20 percent for small projects to 8 percent) for multi-million dollar projects. The PE curve came as a result of actual PE cost data from about 30 projects. To verify the PE curve for all districts, VDOT’s IT Applications Division provided a larger sample of 136 completed projects across the state from January 2001 through August 2002. Analysis of these data showed that PE costs do vary inversely with the size of the project and that the shape of the curve was statistically consistent with the curve already in the spreadsheet. The sample size was not large enough to allow for a direct district-to-district comparison.
To attempt to account for consultant PE costs, the user can choose from a menu on the worksheet the percentage of PE work to be contracted out. A 50 percent factor is then applied to that percentage to raise the costs over in-house PE work. This 50 percent factor came from VDOT’s Management Services Division’s earlier study of the costs of design consultants.15
To double-check this adjustment, it was necessary to distinguish between PE performed in-house and PE performed by consultants in the roadway PE database. The database was sent to VDOT’s State Location & Design Engineer, whose staff was able to divide the costs into the two categories (29 consultant designed projects and 107 in-house designed projects) so the researchers could verify cost differences in the two types of PE. This analysis showed that the 50 percent mark-up option on consultant PE was a reasonable approach.
21
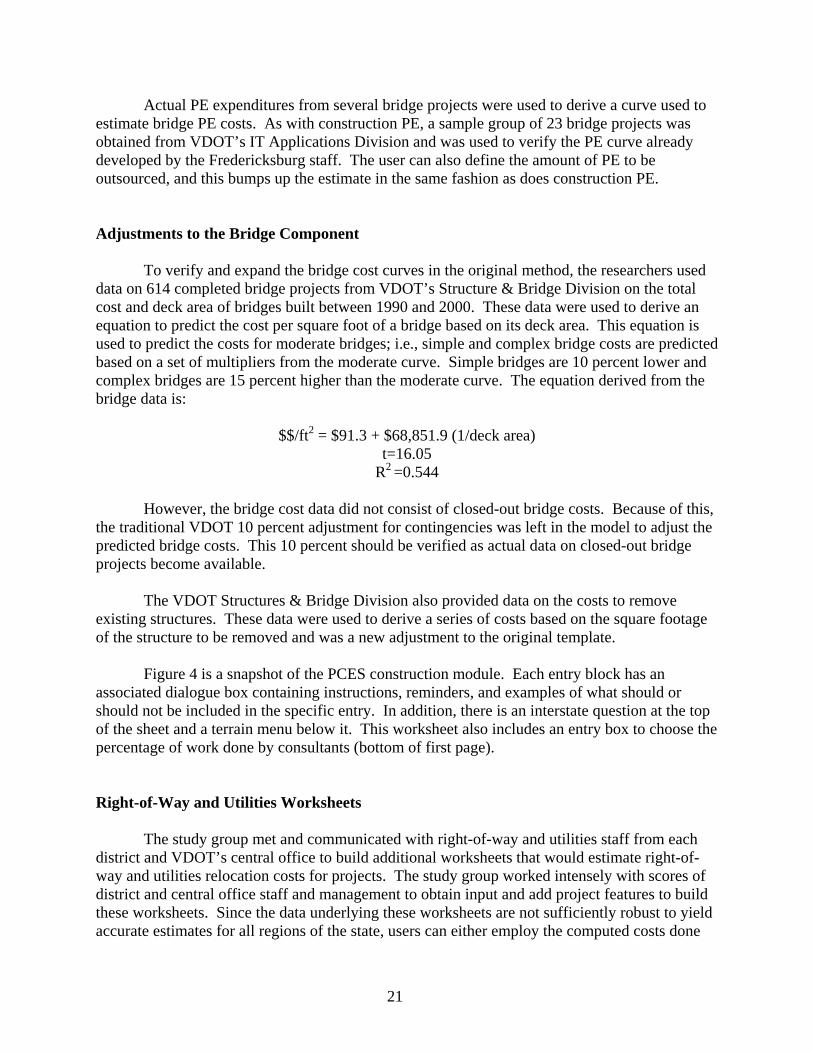
Actual PE expenditures from several bridge projects were used to derive a curve used to estimate bridge PE costs. As with construction PE, a sample group of 23 bridge projects was obtained from VDOT’s IT Applications Division and was used to verify the PE curve already developed by the Fredericksburg staff. The user can also define the amount of PE to be outsourced, and this bumps up the estimate in the same fashion as does construction PE. Adjustments to the Bridge Component
To verify and expand the bridge cost curves in the original method, the researchers used data on 614 completed bridge projects from VDOT’s Structure & Bridge Division on the total cost and deck area of bridges built between 1990 and 2000. These data were used to derive an equation to predict the cost per square foot of a bridge based on its deck area. This equation is used to predict the costs for moderate bridges; i.e., simple and complex bridge costs are predicted based on a set of multipliers from the moderate curve. Simple bridges are 10 percent lower and complex bridges are 15 percent higher than the moderate curve. The equation derived from the bridge data is:
$$/ft2 = $91.3 + $68,851.9 (1/deck area) t=16.05
R2 =0.544
However, the bridge cost data did not consist of closed-out bridge costs. Because of this, the traditional VDOT 10 percent adjustment for contingencies was left in the model to adjust the predicted bridge costs. This 10 percent should be verified as actual data on closed-out bridge projects become available.
The VDOT Structures & Bridge Division also provided data on the costs to remove
existing structures. These data were used to derive a series of costs based on the square footage of the structure to be removed and was a new adjustment to the original template.
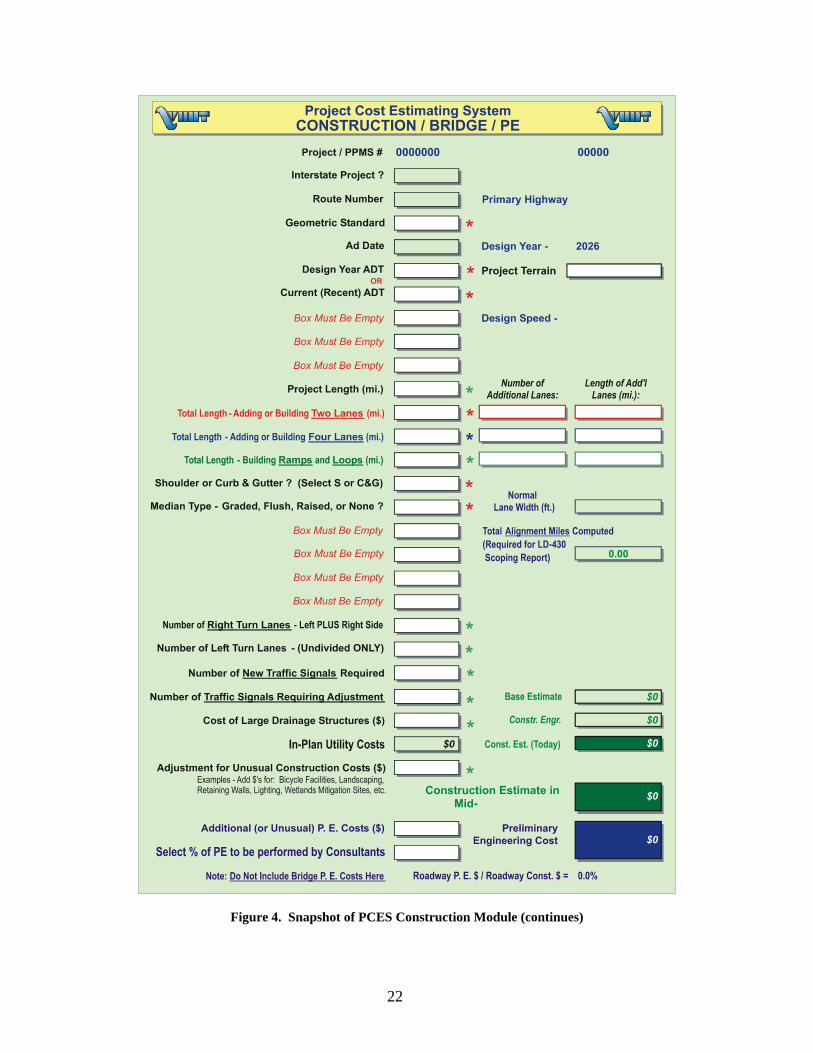
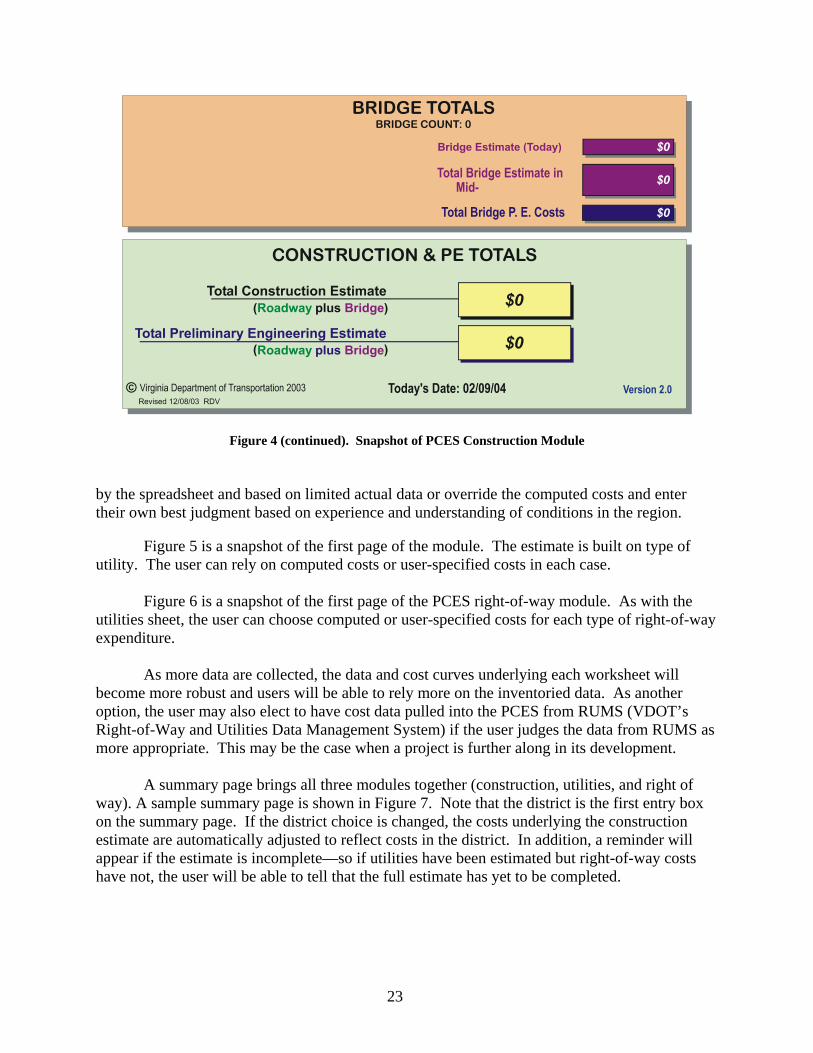
Figure 4 is a snapshot of the PCES construction module. Each entry block has an associated dialogue box containing instructions, reminders, and examples of what should or should not be included in the specific entry. In addition, there is an interstate question at the top of the sheet and a terrain menu below it. This worksheet also includes an entry box to choose the percentage of work done by consultants (bottom of first page). Right-of-Way and Utilities Worksheets
The study group met and communicated with right-of-way and utilities staff from each district and VDOT’s central office to build additional worksheets that would estimate right-of-way and utilities relocation costs for projects. The study group worked intensely with scores of district and central office staff and management to obtain input and add project features to build these worksheets. Since the data underlying these worksheets are not sufficiently robust to yield accurate estimates for all regions of the state, users can either employ the computed costs done
22
Figure 4. Snapshot of PCES Construction Module (continues)
23
Figure 4 (continued). Snapshot of PCES Construction Module by the spreadsheet and based on limited actual data or override the computed costs and enter their own best judgment based on experience and understanding of conditions in the region.
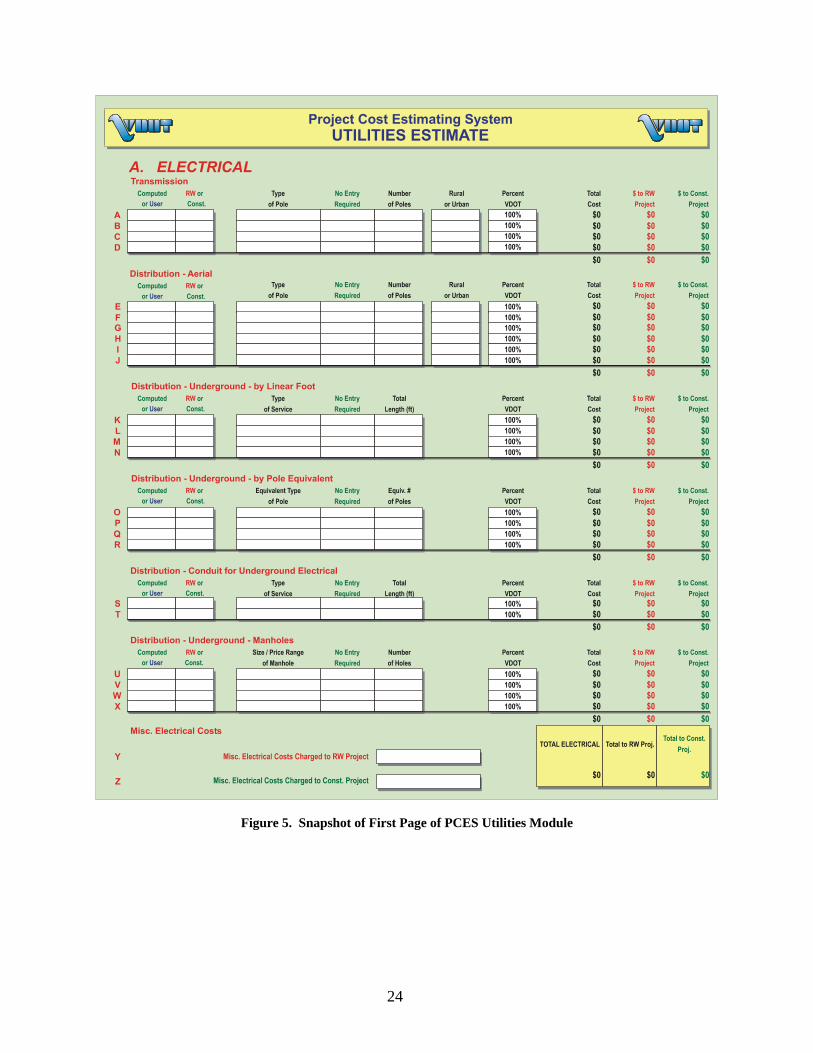
Figure 5 is a snapshot of the first page of the module. The estimate is built on type of
utility. The user can rely on computed costs or user-specified costs in each case. Figure 6 is a snapshot of the first page of the PCES right-of-way module. As with the
utilities sheet, the user can choose computed or user-specified costs for each type of right-of-way expenditure.
As more data are collected, the data and cost curves underlying each worksheet will
become more robust and users will be able to rely more on the inventoried data. As another option, the user may also elect to have cost data pulled into the PCES from RUMS (VDOT’s Right-of-Way and Utilities Data Management System) if the user judges the data from RUMS as more appropriate. This may be the case when a project is further along in its development.
A summary page brings all three modules together (construction, utilities, and right of
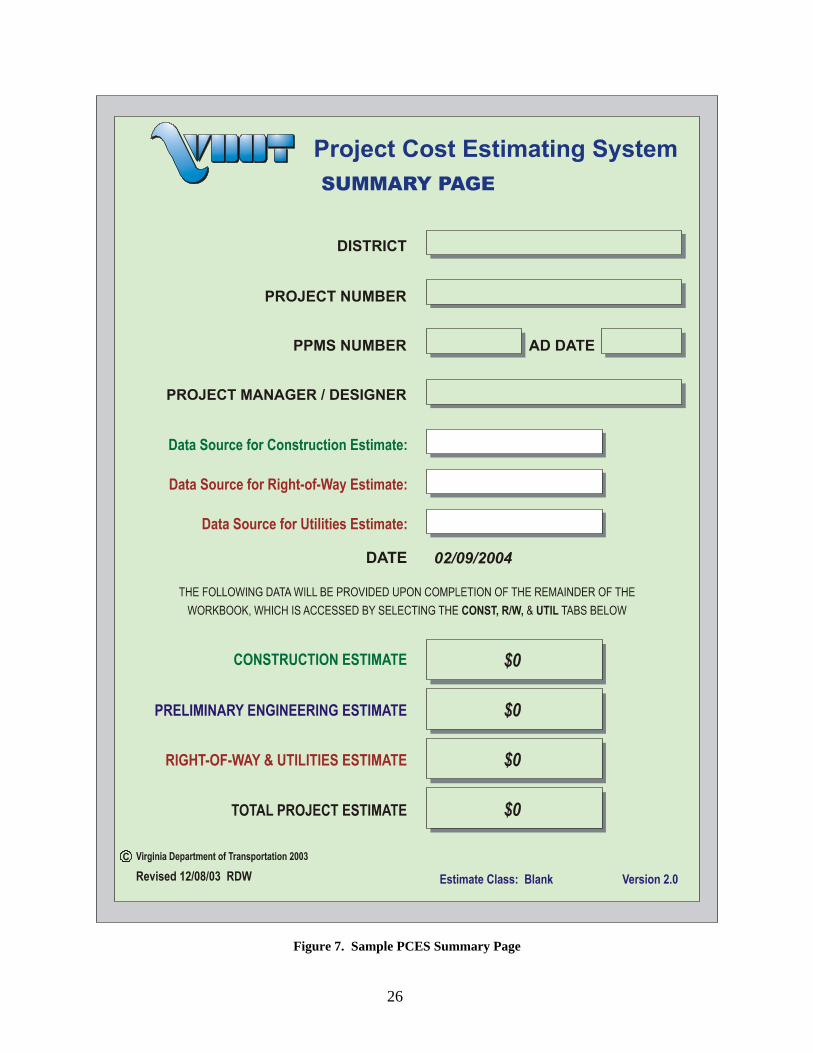
way). A sample summary page is shown in Figure 7. Note that the district is the first entry box on the summary page. If the district choice is changed, the costs underlying the construction estimate are automatically adjusted to reflect costs in the district. In addition, a reminder will appear if the estimate is incomplete—so if utilities have been estimated but right-of-way costs have not, the user will be able to tell that the full estimate has yet to be completed.
24
Figure 5. Snapshot of First Page of PCES Utilities Module

25
Figure 6. Snapshot of First Page of PCES Right-of-Way Module
26
Figure 7. Sample PCES Summary Page
27
Moving to a Web-Based Environment
After the aforementioned modifications and additions had been made to the original template, the PCES became a multi-page workbook consisting of construction, bridge, right-of-way, and utilities modules. VDOT’s IT Applications Division staff then moved the PCES into a web environment. The staff documented and mapped all formulae and relationships underlying the system and created links to other VDOT data systems (TR*NSPORT and RUMS). With the modifications done by ITD, the system automatically saves data over time. The PCES became a component of the project development website discussed in an earlier section of this report.
Testing and Statistical Analysis
Testing was performed on project cost estimates with the aid of district staff. In the summer of 2003, using the PCES template, staff was asked to prepare estimates of completed projects. This initial testing of the rigor of the PCES consisted, then, of “back testing” which would mimic, as closely as possible, an improved scooping process environment. Details on the sample projects are provided in Table 2.
Most of the subsequent analysis centered on the percentage error of the estimates
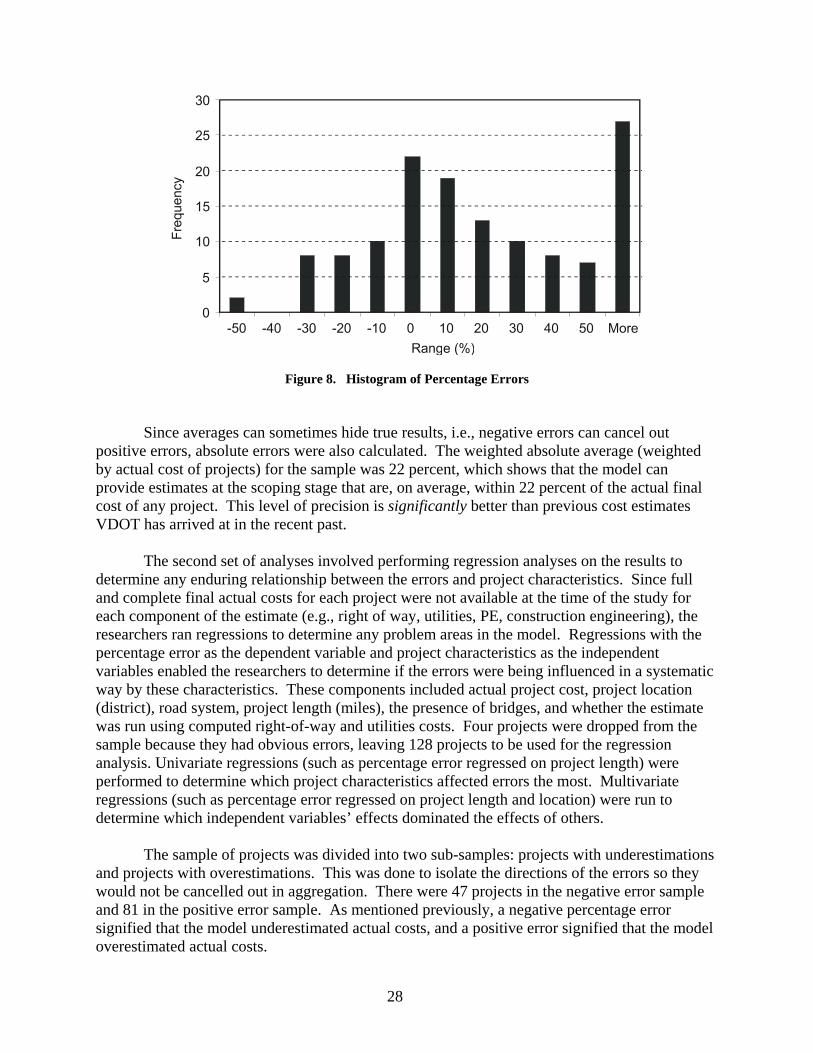
conducted by district staff using the PCES, i.e., the difference between those estimates and the actual cost of the projects in the sample. A positive percentage error signifies the tool overestimated actual project costs, and a negative error signifies the tool underestimated the actual costs. The first set of analyses involved calculating various average percentage errors by using the sample as a whole to get an overall picture of the sample. To get a clear sense of the average, outliers were identified and removed from the calculation, which left 119 projects. Averages were also calculated by system, project size, and length. Average percentage errors by project size showed the tool performed well for projects greater than $5 million, in particular. As Figure 8 shows, the majority (61%) of the errors fell between ±30 percent. In addition, 48 percent of the errors fell between ±20 percent.
Table 2. Sample of Projects Used in Performance Testing
District No. of Projects (Actual) $ Value of Projects Bristol 14 54,744,070 Culpeper 12 35,935,529 Fredericksburg 11 58,794,629 Hampton Roads 17 192,144,297 Lynchburg 13 61,223,568 Northern Virginia 4 73,790,191 Richmond 20 176,174,021 Salem 22 82,704,314 Staunton 19 79,470,720 Total 132 814,981,339
28
Figure 8. Histogram of Percentage Errors
Since averages can sometimes hide true results, i.e., negative errors can cancel out positive errors, absolute errors were also calculated. The weighted absolute average (weighted by actual cost of projects) for the sample was 22 percent, which shows that the model can provide estimates at the scoping stage that are, on average, within 22 percent of the actual final cost of any project. This level of precision is significantly better than previous cost estimates VDOT has arrived at in the recent past.
The second set of analyses involved performing regression analyses on the results to determine any enduring relationship between the errors and project characteristics. Since full and complete final actual costs for each project were not available at the time of the study for each component of the estimate (e.g., right of way, utilities, PE, construction engineering), the researchers ran regressions to determine any problem areas in the model. Regressions with the percentage error as the dependent variable and project characteristics as the independent variables enabled the researchers to determine if the errors were being influenced in a systematic way by these characteristics. These components included actual project cost, project location (district), road system, project length (miles), the presence of bridges, and whether the estimate was run using computed right-of-way and utilities costs. Four projects were dropped from the sample because they had obvious errors, leaving 128 projects to be used for the regression analysis. Univariate regressions (such as percentage error regressed on project length) were performed to determine which project characteristics affected errors the most. Multivariate regressions (such as percentage error regressed on project length and location) were run to determine which independent variables’ effects dominated the effects of others.
The sample of projects was divided into two sub-samples: projects with underestimations
and projects with overestimations. This was done to isolate the directions of the errors so they would not be cancelled out in aggregation. There were 47 projects in the negative error sample and 81 in the positive error sample. As mentioned previously, a negative percentage error signified that the model underestimated actual costs, and a positive error signified that the model overestimated actual costs.
29
Underestimations
The dependent variable of underestimation (negative percentage error) was regressed on each independent variable (project characteristics) in turn. Results indicated that none of the project characteristics variables was statistically significant, with the exception of the system variables. Results showed that when the model under-predicts costs, it does so to a lesser extent for primary and secondary systems than for the urban system. In other words, underestimation was most prevalent in the urban system. The coefficients for the primary and secondary systems were significant, but their contribution to average error was relatively small (–12 percent for secondary, –13 percent for primary). Since there was only one interstate project in this sub-sample, any result for this category would be insignificant. On the other hand, urban projects had a higher average underestimation percentage of –26 percent. District, project cost and length (miles), the presence of bridges, and the use of computed costs for right of way and utilities had no significant, consistent influence on the underestimation. In the multivariate analysis, these results were verified further. No other variable was significant, but the effect of urban projects became more pronounced. These results point to the need to monitor the performance of the model for urban projects in particular. The sample of projects upon which urban costs were based was relatively small, and this may be the reason the urban estimates were under-predicted. Overestimations
The positive percentage errors variable was regressed on each of the project
characteristics in turn. In contrast to the earlier analysis, project cost had significant effects on positive percentage error. This indicates that the model over-predicts to a lesser extent for larger projects than for smaller ones. In other words, cost estimation results get better the higher the cost of the project.
The next variables tested were the district dummy variables (the variable has the value of “1” if a project is in a particular district). One project in Northern Virginia was removed because it was the only one in the sample when the district regressions were done. The results of the district analysis indicate that the Culpeper and Richmond districts had significant effects on the errors and had high average errors, each about 91 percent; in other words, if projects were located in these districts, they tended to have estimated costs that were almost double their actual costs. A couple of other regions had somewhat higher average errors than the control region of Fredericksburg but they were not significantly different from the Fredericksburg errors (and from 0). This indicates that there is something about the projects in these two districts that impacts errors considerably. The researchers examined the estimates completed for both districts and found a few that appeared to be unusual projects: unusually large costs were added on by the users, for example, in an attempt to account for additional turn lanes or unusual construction costs. Staff from the Richmond District re-estimated their projects during the fall of 2003 and found that some estimates were associated with significant user error. They subsequently corrected these estimates. Regressions were not repeated with this new dataset, but overall averages (average absolute weighted percentage error fell from 24% to 22%) and the histogram were adjusted.
30
In fact, the Culpeper and Richmond districts had errors that were so different from those of the remaining districts that their data points were removed from the sample for subsequent analysis so that they would not contaminate the effect of the other variables. Other factors may exist that are influencing errors that were masked by the two districts with higher errors. Regressions were performed on the subset, omitting data from the Richmond and Culpeper districts. A couple of telling results were apparent. On the cost underestimation side, analysis showed that results stayed about the same: primary and secondary system variables were significant, but their average errors were still –13 percent and –12 percent as before. The urban system variable retained its higher average error of –24 percent. No other district had a significant effect on the negative errors in univariate regression analysis. Multivariate regressions of the underestimation error on road system and districts indicated that errors were significantly greater for the Hampton Roads District, but its average error was still small when compared to the omitted districts: 23 percent.
On the cost overestimation side, total actual project cost still had a significant effect on errors and had a negative coefficient, which indicates that the estimates for larger projects have smaller percentage errors compared to small projects. The Hampton Roads District emerged as a significant influencing factor, with an average error of 58 percent.
In subsequent multivariate regressions of overestimations on project cost, districts, and the other variables, the Hampton Roads District was significant and no other variable showed significance. This result indicates that the inclusion of the Culpeper and Richmond district data was hiding the influence of the Hampton Roads District on errors. Hampton Roads seems to be another district that tends to have systematically overestimated projects, but the error was less serious than in the Richmond and Culpeper districts.
Small and Large Projects
The findings about the effect of project costs on estimation errors led to the next set of tests that involved regressions on two subsets of the sample: projects under $2.5 million and projects over $2.5 million, or “lower cost” and “higher cost” projects. For these regressions, the data from all the districts were included. The sample of lower cost projects contained 68 data points, and that of higher cost projects contained 60 data points.
The results for the sample subsets indicated that a couple of the districts had a significant effect on percentage errors, but their errors were much smaller than those for the Richmond and Culpeper districts. For example, the error for the Salem District was 14 percent, and that for the Bristol District was 12 percent. In contrast, the average error for the Richmond District was 135 percent, and that for the Culpeper District was 89 percent. The findings led the researchers to conclude that small projects in the Richmond and Culpeper districts were typically overestimated in the sample.
In the analysis of projects over $2.5 million, no project characteristic had a significant effect on errors. This has an important repercussion: although there is a sequence of projects with high absolute errors, the projects are clustered in the smaller projects where there will be
31
less of an impact on VDOT’s overall construction expenditures. The researchers speculated that the estimates were skewed upward by a particular option in the worksheet for smaller projects.
Further Refinement and Statewide Implementation
The results of the testing led to two noteworthy changes to the estimation worksheets. Since the estimation errors seemed to be larger for the lower cost projects, adjustments were made to make the section on surface-treated projects (which tend to be small) more user-friendly and intuitive. The other change was to increase the costs of the urban project database underlying the construction worksheet. Since the testing showed that urban projects tended to be underestimated and the data underlying this section were based on a relatively small sample size and were biased on the low side, costs were adjusted upward by 5 percent.
Additional changes and adjustments continued to be made to the PCES in the late summer and fall of 2003. Some were the result of suggestions made by the district staff, which by then was becoming somewhat familiar with the worksheets. For example, a feature was added to the construction worksheet to help account for cost differences arising from building roads through different types of terrain. The user may choose the type of terrain typically found in the project area and the costs are automatically adjusted based on a set of factors applied to a baseline, which in this case was “rolling terrain.” For instance, when the user chooses “mountainous terrain,” the costs are adjusted upward by 25 percent; choosing “gently rolling terrain” adjusts the costs downward 10 percent. The features may help address some of the errors seen in some districts.
As a result of suggestions from staff, refinements were also made to the right-of-way module to make it more consistent with a commonly used internal VDOT form (LD-238). Changes were also made to the utilities module, and it became increasingly detailed in order to include many item-specific sections. As a result, the utilities module became the largest piece of the PCES. Suggestions from staff also led to the creation of comments pages at the end of the workbook to help document the estimates.
The PCES, as mentioned earlier, can retrieve data from other VDOT systems. In addition to the link to RUMS, the PCES can get data from TR*NSPORT, which means that if a project is further along in its development, the user can choose to employ the more detailed quantity estimates from TR*NSPORT on the construction side.
The PCES was implemented statewide in October 2003, and the responsibility for the PCES was moved to VDOT’s Scheduling & Contract Development Division at that time. Testing of the completed PCES will be ongoing.
CONCLUSIONS
This study produced a robust scoping process and an inclusive, consistent, well-documented, and tested cost estimation system that VDOT could used to estimate the cost of
32
construction projects statewide. In addition, the study yielded a project development website that resides on VDOT’s intranet. These accomplishments enabled VDOT to implement some of the recommendations from the audits of the agency over the past few years.
The following conclusions were drawn from this study, many of which may be of benefit
to other states as they embark upon similar efforts. • A cost estimation tool can be created using the talents of the agency and off-the-shelf
software. Under the guidance of a diverse task group, and the assignment of a small study team to develop a way for VDOT to estimate project costs, this study showed that such a product could be delivered using the talents of those in the agency. The work was also based on off-the-shelf software that was familiar to staff: VDOT did not have to buy anything new.
• A detailed project scoping process must be in place before a reliable cost estimate
can be developed for each construction project. Only the combination of a robust scooping process and a reliable estimation tool will lead to accurate project cost estimates. These two elements are mutually dependent.
• The performance of any cost estimation tool must be monitored and evaluated over
time. Adjustments must be made when testing shows they are warranted. VDOT’s tool remains a work in progress that will undergo continuous scrutiny and needed adjusting over time. Relationships and factors such as inflation must be scrutinized as times change. Formulae may need to be adjusted as policies or programs change or as more data become available.
• The responsibility for maintaining and adjusting a cost estimation tool needs to rest
with one particular unit or section in the agency. In VDOT’s case, that responsibility was assigned to VDOT’s Scheduling & Contract Development Division.
• Full training in the improved scoping system and the estimation tool is crucial to
their success. VDOT adopted an early version of the PCES as its official estimating tool in the fall of 2002 and used it to update its Six Year Improvement Plan. The tool was implemented very quickly. This provided the advantage of a statewide tool for the agency, but in some cases, the users lacked training and this affected the early cost estimates made with the system.
• Involving the districts and getting ongoing feedback required frequent telephone calls
and emails, but it probably resulted in more “buy-in” and acceptance than would otherwise have been the case. A change of this magnitude is a huge adjustment for staff. The researchers learned that the implementation of such a system is met with every emotion from skepticism to complete acceptance. The group may have spent more time than was needed for purely technical reasons to develop particular worksheets. Some of this time involved answering many questions and convincing others that the change was a good idea. Even though the many previous estimation approaches were clearly flawed, some staff resisted putting their trust in the PCES.
33
• Support from upper management is critical to the successful agency-wide implementation of such a new way of doing business.
RECOMMENDATIONS
Scoping 1. The Commonwealth Transportation Commissioner, by decree, should designate one day each
month across VDOT as a “Project Day.” On these days, district scoping meetings would be held and, to avoid conflicts, no other meetings would be scheduled.
2. Each district construction engineer should appoint a moderator to chair all scoping meetings
to ensure that stated meeting goals are met. 3. Each district administrator should require district section heads and technical experts to
attend scoping meetings. 4. The commissioner should require VDOT top management to participate in scoping meetings,
field inspections, and the like, on a random basis as a means of attaching importance and significance to these meetings.
5. Each district administrator should authorize project scoping team members to make
decisions that represent their area of responsibility. In other words, attendees at the scoping meetings should have the authority and ability to make decisions regarding their areas of expertise.
6. Each district administrator should delegate authority to the district construction engineer to
approve the scoping process and to direct projects to be re-scoped when significant changes are obvious. (Effective October 1, 2003, VDOT’s Scheduling & Contract Development Division was designated as such.)
7. Each district construction engineer and project manager should develop methods to control
“scope creep.” Many kinds of scope creep can occur for a variety of reasons. Program creep can occur if policies or regulations change during the life of a project. Political creep, defined as changes that occur in a project’s life as a result of outcry from political constituents or others who have decision-making authority, can also occur. Although both can be anticipated for individual projects, the PCES cannot forecast their effect. Project creep may be controlled by planners knowing as much as possible about a project early in its development life. Political and program creep may not always be anticipated, but projects can (and should) be re-scoped and re-estimated to determine the effect of the scope creep.
8. Each project manager should continually document all project changes as they occur. The
maintenance of thorough project records will enable project staff and managers to determine
34
what transpired in the life of the project to warrant and/or cause such changes. Such records will serve to enhance VDOT accountability.
9. VDOT’s Location & Design Division with assistance from the IT Applications Division
should adapt the scoping process to a web-based system.
Cost Estimation
1. VDOT should use the PCES statewide for estimating all interstate, primary, secondary, and urban projects. The system is to be used from the scoping phase all the way through the right-of-way authorization phase of project development.
2. The State Scheduling & Contract Engineer should establish a standing committee to develop
estimates for projects determined to be highly complex by the Chief Engineer for Program Development. Since the PCES can be used to estimate the vast majority of VDOT projects, all that may be needed is an ad hoc committee to develop/oversee estimates for complex or politically charged projects.
3. VDOT’s IT Applications Division should migrate the PCES to a web-enabled production
environment. 4. VDOT’s Scheduling & Contract Division and IT Applications Division should collect data
continuously and provide feedback loops to ensure that underlying cost data are reviewed, updated, and refreshed, based on the performance of the model over time.
5. VDOT’s Scheduling & Contract Development Division should integrate the PCES with
VDOT’s Six Year Improvement Program to provide cost estimates for the program’s annual update.
6. VDOT’s Chief Engineer should designate a responsible group and give them the authority
and accountability to maintain and manage the PCES. (Effective October 1, 2003, VDOT’s Scheduling & Contract Development Division was designated as such.)
ACKNOWLEDGMENTS
The authors acknowledge and thank the members of the project task force for their guidance and direction throughout the development of the PCES. The study and development of the VDOT PCES also could not have occurred without the excellent advice, involvement, and suggestions of countless VDOT district staff. Location and design, right-of-way, and utilities staff, both in VDOT’s central and district offices, provided invaluable assistance in the design, testing, and rollout of many iterations of the estimation system. The efforts of the central office IT staff, who worked tirelessly to move the system into a web environment, were also extremely valuable to the success of this venture. The authors also extend their thanks to Linda Evans of VTRC, who edited all drafts of this report.
35
REFERENCES 1. U.S. Department of Transportation, Office of the Inspector General. Audit of the Springfield
Interchange. Washington, D.C., November 2002. 2. Joint Legislative Audit and Review Commission. Review of Construction Costs and Time
Schedules for Virginia Highway Projects A Report in a Series on Transportation Issues in Virginia. House Document No. 31. Richmond, Va., January 2001.
3. National Cooperative Highway Research Program. Improved Cost Estimating for Planning,
Capital Programming, and Engineering of Transportation Projects. NCHRP Problem Statement 08-49. Washington, D.C., 2003.
4. Pickrell, D.H. Urban Rail Transit Projects: Forecast Versus Actual Ridership and Costs.
Urban Mass Transit Administration and United States Department of Transportation, Washington, D.C., October 1989.
5. Flyvbjerg, B., M.S. Holm, and S. Buhl. Underestimating Costs in Public Works Projects.
Error or Lie? Journal of American Planning Association, Vol. 68, No. 3, Summer 2002. 6. Commonwealth of Virginia, Auditor of Public Accounts. Special Review of Cash
Management and Capital Budgeting Practices. Richmond, July 2002. 7. EarthTech, Inc. TracerTM Prototype: Overview and Quick-Start Guide. Englewood, Col.,
2002. 8. Rummel, Klepper & Kahl, LLP. Maryland State Highway Administration Cost Estimating
Program (Cost2000). Richmond, Va., 2002. 9. Perry, O., and J. Koch. Memorandum to Dewey O. Litton of VDOT, June 2002. 10. Washington State Department of Transportation. Cost Estimating Validation Process. 2003.
www.wsdot.wa.gov/projects/cevp/default.htm. Accessed July 21, 2003. 11. Florida Department of Transportation, Office of Policy Planning. 2002 Transportation
Costs. March 2003. www.dot.state.fl.us/planning/policy/. Accessed July 21, 2003. 12. Delaware Department of Transportation. CIP Estimate. Dover, June 2002. 13. Turochy, R.E., L.A. Hoel, and R.S. Doty. Highway Project Cost Estimating Methods Used
in the Planning Stage of Project. VTRC 02-TAR3. Virginia Transportation Research Council, Charlottesville, 2001.
14. Virginia Department of Transportation. Roadway Values Report. October 2000.
www.virginiadot.org/business/resources/GASB-roadway_values.pdf. Accessed July 21, 2003.

36
15. Virginia Department of Transportation, Management Services Division. Make-Buy Study: Developing an Outsourcing Methodology. Report to the House Appropriations and Senate Finance Committees. Richmond, December 1999.