final report - ehima · final report march 2016 jean de kervasdoué professor emeritus,...
TRANSCRIPT
Economic Impact of Hearing Loss in France and Developed Countries A survey of academic literature 2005-2015
FINALREPORTMarch2016
JeandeKervasdouéProfessoremeritus,ConservatoireNationaldesArtsetMétiers
LaurenceHartmann
Seniorlecturer,ConservatoireNationaldesArtsetMétiers

2
ListofabbreviationsAFL AuditivefunctionallimitationsALD AffectiondelongueduréeAMC AssurancemaladiecomplémentaireAMO AssurancemaladieobligatoireAPA Allocationpersonnaliséed’autonomieAPHAB AbbreviatedProfileofHearingAidBenefitBLSA BaltimorelongitudinalstudyofagingBS BaromètresantéSurveyBSI BriefsymptomInventoryBSSM BaromètresantésourdsetmalentendantsSurveyCASF Codedel’actionsocialeetdelafamilleCEPP Commissiond’évaluationdesproduitsetprestationsCEPS ComitééconomiquedesproduitsdesantéCMUC CouverturemaladieuniversellecomplémentaireCNAMTS Caissenationaled’assurancemaladiedestravailleurssalariésCNEDiMTS Commissionnationaled’évaluationdesdispositifsmédicauxetdestechnologiesde
santédB Decibel(s)DREES Directiondelarecherche,desétudes,del’évaluationetdesstatistiquesDSS DirectiondelasécuritésocialeEHIMA EuropeanHearingInstrumentManufacturersAssociationENT Ear,NoseandThroatspecialistESPS EnquêtesantéetprotectionsocialeSurveyEQ-5D QualityoflifequestionnaireEuroQolHA(s) Hearingaid(s)HAS HauteAutoritédeSantéHCAAM HautConseilpourl’avenirdel’assurancemaladieHID Handicaps-Incapacités-DépendancesSurvey1998HUI3 QualityoflifequestionnaireHealthutilitiesindexMark3IGAS InspectionGénéraledesAffairesSocialesICER IncrementalCost-EffectivenessRatioINSEE InstitutNationaldelaStatistiqueetdesEtudesEconomiquesInVS InstitutNationaldeVeilleSanitaireINPES InstitutNationaldePréventionetd’EducationàlaSantéMMSE MinimentalstateexaminationNHANES NationalhealthandnutritionexaminationsurveyNHI NationalHealthInsuranceNHS NationalHealthSystemNICE NationalInstituteofClinicalExcellenceOCAM Organismescomplémentairesd’assurancemaladieOECD OrganisationforEconomicCooperationandDevelopmentOOP Out-of-pocketPCH PrestationdecompensationduhandicapPHQ9 Patienthealthquestionnaire-depressionQALYs QualityadjustedLifeYearsROSP RémunérationsurobjectifsdesantépubliqueRQTH ReconnaissancedelaqualitédetravailleurhandicapéSF12 QualityoflifequestionnaireShortform12dimensionsSNIIRAM Systèmenationalinter-régimesdel’assurancemaladieSNITEM SyndicatNationaldel’IndustriedesTechnologiesMédicalesUNPS UnionNationaledesProfessionnelsdeSantéUNSAF UnionNationaledesSyndicatsdesAudioprothésistesFrançaisVAT Valueadded-taxVSL ValueofstatisticallifeWHO WorldwideHealthOrganisationWHO-QoL QualityoflifequestionnaireofWHO

3
Contents
Listofabbreviations...........................................................................................................2Contents.............................................................................................................................3
Summary............................................................................................................................5
Introduction.......................................................................................................................91 Hearingloss:outlinedata...........................................................................................111.1 PrevalenceofhearinglossandauditivefunctionallimitationsinFrance...............................121.1.1 Estimationsofhearinglossprevalencein“Handicap-Santé”Frenchsurvey2008.............131.1.2 Estimateddataforhearinglossprevalencein2015.........................................................................151.1.3 Mainfeaturesofthepopulationaffectedbyauditivefunctionallimitations.........................16
1.2 AccesstohearingaidsinFrance:anoverview....................................................................................181.2.1 PublicandprivatehearingaidsexpenditureinFrance...................................................................181.2.1.1 Overallhearingaidsexpenditure...............................................................................................................181.2.1.2 Estimationsofthenumberofhearingaidusers..................................................................................211.2.1.1 Estimationsoftheaveragepriceofahearingaid...............................................................................26
1.2.2 Financinghearingaids...................................................................................................................................301.2.2.1 Financingrulesforhearingaidsaseithertechnicalsupportormedicaldevices.................301.2.2.2 Publicandprivatefinancingrulesforhearingaidequipment......................................................311.2.2.3 Estimationsofout-of-pocketpaymentandhealthcarerenouncement.....................................35
1.2.3 Thehearingaid:adurablegoodassociatedwithaparamedicalservice................................401.2.4 Hearingaidpricingissues:ananalyticaleconomicframework..................................................42
1.3 Hearinglossprevalence,hearingaidaccessandpricingincomparablecountriestoFrance ...................................................................................................................................................................................481.3.1 Hearinglossprevalence,equipmentrateandaccessratetohearingaids.............................481.3.2 Estimationoftherealaccessrateforhearingaidsdependingontheeligiblepopulationandoncompliance............................................................................................................................................................501.3.3 Determinantsofaccesstohearingaids..................................................................................................521.3.4 Theroleofhealthsystemsinhearingaidaccessandperceivedefficiencybyusers...........55
2 Healthandeconomicconsequencesofhearingloss:impactstudy..............................622.1 Observedscientificconnectionsbetweenhearinglossandmorbi-mortalityinadultsandelderlypopulations..........................................................................................................................................................622.1.1 HearinglossandassociatedlimitationsinFrance............................................................................632.1.1.1 Associateddeficiencieswithhearingloss...............................................................................................632.1.1.2 Functionallimitationsassociatedwithhearingloss..........................................................................642.1.1.3 Activityrestrictionsandsocialinvolvementassociatedwithhearingloss..............................65
2.1.2 Mainfindingsinmedicalscientificliterature......................................................................................662.1.2.1 Anincreasedriskofmortality......................................................................................................................662.1.2.2 Anincreasedriskoffalls................................................................................................................................672.1.2.3 Adegradationinmentalhealth...................................................................................................................672.1.2.4 Deteriorationincognitivecapacities........................................................................................................692.1.2.5 Healthatwork.....................................................................................................................................................71

4
2.2 Economicimpactofhearingloss...............................................................................................................712.2.1 Economicassessmentsinscientificliteratureofhearingloss:healthcareaccess,expenditureandscreening............................................................................................................................................732.2.1.1 Higherhealthcareaccessandexpenditurelevel................................................................................732.2.1.2 Economicconcernsofearlierscreeningforhearingloss................................................................74
2.2.2 EconomicimpactofhearinglossinFrance:scenariosandapproximations.........................782.2.2.1 Qualityoflife,preference-basedscores,QALYsandstatisticalvalueofahumanlife:aframework792.2.2.2 Annualcostofhearingloss(2014)accordingtothequalityoflifeperspective....................812.2.2.3 Additionalhealthcarecostsduetonon-equippedhearinglossandefficiencyofhearingaidsregardingeligiblepopulation:approximations.................................................................................................86
3 Conclusion..................................................................................................................90References.......................................................................................................................93

5
SummaryHearinglossinFranceaffectsabout10%ofthepopulation,namelyover6millionpeoplehavetofacehearingdifficultiesindailylife.Olderadults(over50yearsold)arethemostconcerned–onethirdof thispopulation–ashearing lossarisesduringthecourseof life (for88%ofFrench people), through a natural and progressive phenomenon (presbycusis) or afterexposuretonoise.InEurope,JapanandtheUnitedStates,prevalenceratesarecomparabletothoseinFrance.TheWHOestimatesthisburdenofillnesstocurrentlyconcernmorethan5% of the global population, representing 360 billion people. Nowadays, hearing loss isconsideredasamajorpublichealthissueinthescientificliteratureandbyinternationalhealthagencies.Notonly is hearing loss apparent throughdirect functional limitations (understandingandcommunicationdifficulties),buthearingimpairmentisalsoassociatedwithahigherfrequencyof mental disorders, cognitive decline, falls and even mortality, independently of ageingeffects. Hearing loss could precipitate the elderly into dependency.Hearing aids (‘medicaldevices for individual use’) compensate, to a certain extent, for hearing impairment and,furthermore,ensuresomeindividualrehabilitation:in2015,morethan2millionFrenchpeopleownedhearingaidsoutof3millioneligiblepeople.Thistechnicalsolutionshouldbefurtherencouraged,since1millionFrenchpeopledeclareaneedforhearingaidsbutdon’tgetthem.Asaresult,improvingaccesstohearingaidsrepresentsadecisiveissue,notonlyintermsoffinancialaccessibilityandfairness,butalso intermsofefficiency:hearingaidequipment ispresumedtoreducethesignificantimplicationsofhearinglossonhealthstateandhealthcareexpenditureand,thus,improvethepatient’squalityoflife.Yet,thehearingaidsectorinFrancehasbeenlongcharacterizedbyawait-and-seepublicpolicy:theregulatoryruleshavebeenfrozenforseveraldecades,duetoalackofreliableinformationontheexpectedaddedvalueofhearingaids(ineconomictermsofutility).Thislackofinformationandstalledregulationshaveresultedinseveralrecentreports,releasedbytheCourtofAccounts(Courdescomptes)and the General Inspectorate for Social Affairs (Inspection générale des affaires sociales),whichbothunderlinetheurgentneedtore-examinetheaccessrulestohearingaidsandtoprovide,atthesametimeaneconomicassessmentofthisequipment.ThemainobstacletohearingaidaccessinFrance(financialbarrier)concernscurrentfinancingrules,andparticularlythepublictrade-offsthathaveledhearingaidstobeclassifiedinthe‘low risk’ category and practically excluded from socialised health care. This classificationimplicitlyindicatesthatthehearingaidisaluxuryproductwhosemedicaladded-valueisverylow: incomparisontothetrade-offs fordrugclassification, thehearingaidmedicaladded-valuerangesbetween‘low’and‘insufficient’,sinceitsobservedreimbursementrateisunder15%.Yet,wideaccesstohearingaids(2/3intermsof‘realaccess’oftheeligiblepopulation)showsclearlythatdemandelasticityislow:theyareanecessaryitem.Ingeneral,thepublicchoiceofcoinsurancedependsonthecombinationof‘lowrisk’and‘commitment’.Thereisonlypartialreimbursementinrelationto‘lowrisk’,oreventotallyexclusionfromthesocialhealthcarebasketwhenitdoesnotdependonthecollectiveresponsibilityandimpliesanindividualjudgementonthetrade-offconsumption-price(inordertoavoidover-consumptionor,ineconomics,the‘moralhazard’risk).Yet,notonlyisaccesssignificantdespitetheout-of-pocketpayment,butmoreover itshealthconsequencesaswellas itseconomic impactare
6
likelytobemajor.Thecosttosocietyofhearingaidrenunciation,intermsofqualityoflife,expenditure and social inequalities is in total opposition to the objectives assigned to theFrenchhealthsystem.Hearingloss:outlinedataDisablinghearinglossprevalenceisestimatedtodaytorangebetween8.6%and11.2%oftheoverallFrenchpopulation.Theanalysisofhearingaidaccessshowsthat30%to35%ofhearingimpairedpeopleareequipped,namely2millionoutof6millionpeople.Thisgapisreducedwhenconsideringpeoplebeingequippedandpeopleeligibleforhearingaids:whatevertheexpertassessments,surveydataorempiricalstatements(monographsbycountry),onlyhalfofhearingimpairedpeoplewouldbeeligibleforhearingaids,thus3millionpeopleinFrance.Thus, 65%of eligible Frenchpeoplearehearingaidownerswhereas35%of them remainunequipped.Thereare twomain reasonswhich canexplain this renunciation: a lowpublic andprivatecoverage(provision),andalackofinformation.Indeed,theaveragepriceforonehearingaidcomes to1,535euros,and3,070euros forbinauralequipment.But thisexpense ispoorlycoveredbytheNationalHealthInsurance(8%)andpoorlyreinsuredbycomplementaryhealthinsurances(30%),leavingahighout-of-pocketpaymentfortheadultinsured(62%),namely950eurosperapparatus.Thepriceforhearingaidequipmentcomprisesboththedeviceandtheaudiologist’scounsellingandfollow-upservices.Forthehearingaidowners,theequipmenthasanaveragedurationof5to6years,duringwhichaqualifiedcheck-upisensuredbytheaudiologist.Thequalityoftheequipmentaswellasthequalityofthefollow-upshould influencehearingaidefficiency,usersatisfactionandbeneficial compliance. This hypothesis seems to be confirmed throughout internationalcomparisons:incountrieswhereaccessratetohearingaidsishigher,thesocialcoverageisbetter for downmarket or middle market equipment. However, these countries don’tnecessarilyhavegreaterratesofrealHAsusers(i.e.ratesconsideringeffectiveeligiblepeopleforhearingaidsandeffectivewearingofhearingaids).Takenthus,FrancewouldpresentarealrateofuseclosetothoseoftheUnitedKingdom,GermanyandNorwayandstartingfromvery different situations in terms of financial access to equipment. If there is room forimprovement in France regarding the need for hearing aid equipment – due to financialimpediment-thereisalsoroomforgrowthincountrieswherehearingaidsare(almost)freelydeliveredbutwherethecomplianceisn’tsufficientlyperformant.Areviewoffinancialrulesrelatingtohearingaidshastoconsiderthecompliancefactorsdeterminingtheeffectiveuseofequipmentand,thus,thelevelofsatisfactionforhearingaidusers.Concerningthepaymentschemesforaudiologists,aneconomicanalysisisnecessary,takinginto account their incentiveproperties. In order to regulate thehearing aid sector and todesignanincentivepaymentforhearingaids,atrade-offisnecessarybetweentheobjectivesofexpenditurecontrol,healthcarequalityandfreedomofchoice,inahypotheticframeworkassumingahighercoverageofhearingaids.Therearemanytoolsallowingustorealisetheoptimaltrade-offforpublicfinancing,butacautiousapproachisrequiredregardingtheissueofapossibledecouplingofthedeviceandtheservice.Thisdecouplingmodelbringsupadverseeffectswhich are similar to those of ‘cost-plus’ payment, leading to increasing prices and
7
puttingpatients’complianceatstake,i.e.affectingthetherapeuticefficiencyofhearingaidsfor some of them. At the same time that recourse to prospective payment systems isincreasingly implementedforpricinginhealthsystems,andasgrowingattentionispaidtopatients’empowerment, this conceptofdivisibilitydevice/service fallswithinabackwardseconomicapproach intermsofoptimal incentives. Internationalcomparisonshighlighttheimpactofcoverageandhealthcareorganisationonhearingaidaccess,equipmentrenewaland patients’ compliance. They showalso that French prices for one hearing aid are verysimilartothoseofotherEuropeancountries.Healthandeconomicconsequencesofhearingloss:impactstudyInternationalmedical scientific literatureaswellasFrenchsurveydataareprofuseon theburden of illness topics and these start to provide evidence-based studies on the causalallegedconnectionbetweenhearinglossandhealthstatedegradation.Disablinghearingloss(ormoderatetototalauditivefunctionallimitations),byreducingtheperson’scommunicationcapacities, rebounds significantly onto the whole dimensions of health state (mobility,autonomy,dailyactivities,pain/discomfort,anxiety/depression)throughasuccessionofchainreactions,themainonesbeingsocial isolation,cognitivedecline,sufferingatwork,mentaltroublesandfalls.Hearinglossrepresentsamajorimpairmentwhich,byaffectingmorethansixmillion(oftenolder)Frenchpeople,notonlyhasdeleteriouseffectsonqualityoflifebutalsoleadstoadditionalhealthandsocialcareexpenditureforsocietyasawhole.Thescientificliteratureunambiguouslyreportsthenegativewaterfalleffectsofhearingloss,butalsoshowthebeneficialeffectsofhearingaidwearing:reducedmortalityrisk;improvedpsycho-socialhealthstate;andanormalisingeffectoncognitivedeclinerisk.Publicationsalsopointoutthatthisfavourableimpactonmentalhealthisappreciablestartingfromthefirst3monthsof equipment. In the sameperspective, some studies show the reliability and theefficiencyofearlierscreeningforpeopleattheendoftheirworkinglives,screeningthosewhoareoldenoughto justifysecondaryprevention,butyoungenoughtobenefit from itsincetheirhearinglosslevelismoderatetosevere.Earlierscreeningappearstobeaveryefficientstrategyregardingcostandqualityoflife.Itshouldbeimplementedoverthecourseofmedicalconsultations,intheformoftwoshortquestionswithoutadditionalcoststogeneralpractice.Startingfromthisliteratureandthesurveydata,twoscenariosforeconomicassessmentofhearinglossareproposed.ThefirstonegivesroughestimatesforintangiblecostsrelatedtoqualityoflifedegradationinFrance.Theaimistoassessthemonetaryvalueoflosthealthyyears by valuing them in terms of the implicit price of human life. Based on realisticassumptions,thisestimationdrawsanimageofsavedcoststhankstohearingaidequipmentor compliance, as well as the economic burden of hearing loss related to its prevalence:without equipment, this burden would amount to 23.4 billion euros. The real rate ofequipment(effectiveaccessandeffectiveuseofhearingaids)reducesthisburdenby30%,whereas the target equipment rate (i.e. 50%ofhearing impairedpeople related to actualcompliance)wouldlightentheburdenby40%.The secondscenario relieson severalassumptions inorder toestimate,on theonehand,medical costs related tohearing losswithoutequipment and,on theotherhand, averagescoresof lostutility related toqualityof life.Bothdimensionsaregraduatedaccording toFrench hearing loss prevalence rates by age groups and by severity levels, then they are

8
connectedwiththerateofeligiblepeopleforhearingaidsbutwhoarenotbeingequipped.Forthisspecificpopulation,weassumethatagainshouldbeexpectedinqualityoflifeandincost savings, if equipmentweredelivered for 6 years.Assessing these values allowsus toroughlyestimatearangefortheincrementalcost-utilityratio,expressingthecosttopayinordertogainoneadditionalhealthyyearfortheperiod.Yet,throughthissimplesimulation,thetargetstrategy(i.e.equipmentforeligiblepopulationnotaccessinghearingaids)wouldbedominant,eventakingintoaccountthecomplianceratethatreducesqualityoflifegainsandcostssavings:theoverallcostofthisadditionalequipmentwouldbe1.5billioneuros,with48,000QALYsgainedandwithcostsavingsworth1.7billioneuros,namelya ICERof -830euros/QALY.Inotherwords,thetargetstrategyof‘alleligiblepeopleareequipped’savescostsandprovidesanincreasedqualityoflife,andisthusthedominantstrategy.Thisentirecasestudy,whichreliesonacceptableassumptions,underlinestherequirementforasubstantialeconomicassessmentthatwouldcorroboratetheseresults,thatisthehighlyefficienttargetstrategy that ‘all eligible hearing impaired people are equipped’, since the annual overallexpenditureofthehearingaidsectorcomescloseto1billioneuros.However,itremainstosolve the touchy question of hearing aid financing likely to support access to them, andespecially thequestionof therelativefinancialcontributionsofpayers,asseen inthefirstsectionofthereport.Moreover, if theNationalHealth Insurancecouldgreatly increase itsfinancialroleinhearingaidreimbursement,wewouldanticipateabounceeffectforpeoplebeing equipped but having postponed hearing aid renewing. This effect would inevitablyincreasethebudgetimpactofhearingaidaccess.That’swhyanoverallscenariohastobesetup,throughprospectivecost-efficiencyassessments,bycollectingusefuldatainsequentialorregularsurveysbasedontheworkingandolderpopulation,inordertoinferthedifferentialcost-utilityratiobetweenstrategies.ThisoverallscenariowouldbecompletedbyestimatingthebudgetimpactofhearingaidequipmentdependingonseveralcoveragescenariosfromtheNationalHealthInsurance’spointofview.Comingoutofthisoverview,thehealthpolicyforsecondaryprevention,thatcouldconsistofscreeningandequippinghearingimpairedpeoplewithhearingaids,isnon-existentregardingpublicreimbursement.NationalHealthInsurance,bycoveringonly8%ofhearingaidpriceforadults,hasalmostexcludedhearinglossfromitsmanagementpolicyforhealthrisk,leavingtheout-of-pocketpaymenttocomplementaryinsurancebodiesandabovealltopatients.Infine,families,closerelativesandthewholesocietybearsthecostsofthisimpairment,aswellasforthelossofautonomysinceonethirdoftheeligiblepopulationforhearingaidsdon’tgettothem.Moreover,inequalitiesrelatingtotherightsofthoseinsuredwithcomplementaryhealthbodies,theirrevenueandabilitytopayforequipmentcontributetomaintainthesesocialinequalitiesinhealth,bytherenouncementeffect.ThesestatementswouldimposetheneedforanurgentexaminationoftheregulatoryrulesforthehearingaidsectorinFrance,atamomentwhereageing,andlisteningtoamplifiedmusicamongtheyoungriskscontributingtoaggravatedhearinglossprevalenceinFrance.

9
IntroductionInFrance,over6millionpeoplehavedisablinghearingloss,leadingtodifficultiesindailylife.Olderadults(over50yearsold)arethemostconcerned–onethirdofthispopulation–ashearing loss arises during life course (for 88% of French people), through a natural andprogressivephenomenon(presbycusis)orafterexposuretonoise.Notonly is hearing loss apparent throughdirect functional limitations (understandingandcommunicationdifficulties),buthearingimpairmentisalsoassociatedwithahigherfrequencyof mental disorders, cognitive decline, falls and even mortality, independently of ageingeffects. Hearing loss could precipitate the elderly into dependency. Medical scientificliteratureisprofuseonthistopicandstartstoprovideevidence-basedstudiesonthecausalallegedconnectionbetweenhearinglossandhealthstatedegradation.Moreover,ithighlightstheburdenofillnessanditsimpactonhealthcareconsumptionandexpenditure.Therefore,hearinglossisamajortopicforpublichealth.Hearingaidscompensate,toacertainextent,forhearinglossand,furthermore,ensuresomeindividual rehabilitation: in 2015,more than 2million French people owned hearing aids.However,thistechnicalsolutionshouldbefurtherencouraged,since1millionFrenchpeopleareeligibleforhearingaidsbutdon’tgetthem.Therearetwomainreasonswhichcanexplainthis renunciation:a lowpublicandprivatecoverage (provision),anda lackof information.Indeed, the average price for one hearing aid comes to 1,535 euros, and 3,070 euros forbinauralequipment.ButthisexpenseispoorlycoveredbytheNationalHealthInsuranceandpoorlyreinsuredbycomplementaryhealthinsurances,leavingahighout-of-pocketpaymentfortheinsured.Asaresult,improvingaccesstohearingaidsrepresentsadecisiveissue,notonlyintermsoffinancialaccessibilityandfairness,butalso intermsofefficiency:hearingaidequipment ispresumedtoreducethesignificantimplicationsofhearinglossonhealthstateandhealthcareexpenditure and, thus, improve the patient’s quality of life. Yet, the hearing aid sector inFrancehasbeenlongcharacterizedbyawait-and-seepublicpolicy:theregulatoryruleshavebeenfrozenforseveraldecades,duetoalackofreliableinformationontheexpectedaddedvalue of hearing aids (in economic terms of utility). This lack of information and stalledregulationshaveresultedinseveralrecentreports,releasedbytheCourtofAccounts(Courdescomptes)andtheGeneralInspectorateforSocialAffairs(Inspectiongénéraledesaffairessociales),whichbothunderlinetheurgentneedtore-examinetheaccessrulestohearingaidsandtoprovide,atthesametimeaneconomicassessmentofthisequipment.Economic assessment of hearing aids should corroborate their efficiency and, if relevant,shouldleadtoacorrectionofthescopeforsocialreimbursement,asfarasthebudgetimpactonNationalHealthInsuranceisaffordable.Suchanassessmentrequiresthinkingintermsofutilityandqualityoflifeforpeoplewearinghearingaidsandtocomparethecost-utilityratioofequipmentwithrespecttonon-equipment.Inlinewiththesequestions,anotherissueisthereliabilityofhearinglossscreeninginordertopreventearlylossofautonomy.Shouldageneralised screening program be considered appropriate for people at the end of theirworkinglives?Ifso,underwhichconditionsandforwhatefficiency?
10
Thepurposeofthepresentstudyistogatherandreviewthemajorpapersinthescientificliteratureaswellasthegreyliteraturereleasedonthistopicovertheperiod2005-2015.Weput this literature into perspective using some economic tools in order to propose aneconomical framework for regulatory analysis of the hearing aid sector. Then, we bringforwardroughestimatesforthecostandtheutilityofhearingaids.This report is structured in twomain sections as follows: section 1 focuses specifically onhearinglossinFranceandpresentstheruleswhichorganiseaccessanddeliveryofhearingaidequipment.AninternationalcomparisonforkeycountriesinEuropeisaddressedwhensimilarcollectionofdataisavailable.Section2outlinestheglobalburdenofhearingloss,onthebasisofkeypapersreleasedinthemedicalscientific literature.Asanextensionofthissurvey,ahypotheticalscenarioforeconomicassessment issetoutonthebasisofavailabledataforFrance.

11
1 Hearingloss:outlinedataHearinglossprevalenceinFranceanditsconsequencesonhealthstateemphasizethispublichealthissue,eventhoughtherearedifferingdefinitions:approximately16%ofFrenchpeoplereportsomedifficultieswithhearing(inthebroadestsense,definedby‘auditivefunctionallimitations’)whereasdisablinghearinglossaffects8.6%to11.2%ofFrenchpeople(definedby‘disablinghearingloss’)(Haeuslerandal.,2014;EHIMA,2015)1.Hearinglossaffectsmostlyadultsaged50yearsandover(progressivehearingimpairmentwitholderageorpresbycusis).Inthegeneralcase,hearinglossalleviationreliesontheuseofhearingaids(HAs),whicharea ‘medical device for individual-use’ in the French classification. The analysis of access tohearing aids is tricky because not only is available data lacking, but values are variablebetween sources, surveys or databases. There is an obvious and important gap betweenpeoplebeing fittedwith aprosthesis (in the study, ‘hearing aidowners’) andpeoplewithdisablinghearingloss:only30%to35%ofthelatterarehearingaidowners2.Theaverageprice foronehearingaid (HA) isaround1,535euros,while social coverage isparticularlylow(120eurosforoneear,thatisabasisforsocialreimbursementof200eurosassociatedwithacoinsurancerateof60%).Hence,thegrossout-of-pocketsumis likelytorepresentahighbarriertoaccess,inthatcomplementaryinsurancecoversaminorpartofit.There is also significant inequalitybetweenbeneficiariesdue to thediversityof contracts.Indeed,thenetout-of-pocketsumisestimatedtobe62%ofthetotalprice(i.e.958eurosapiece) and is associated with healthcare renunciation. For the hearing aid owners, theequipmenthasanaveragedurationof5years,duringwhichaqualifiedcheck-upisensuredbytheaudiologist: thepricecomprisesboththedeviceandtheservice.Thequalityof theequipment as well as the quality of the follow-up should influence user satisfaction andbeneficialcompliance.Thishypothesisseemstobeconfirmedthroughoutinternationalcomparisons:startingfromthedataoftheEHIMA(2015)andonthebasisofthemethodologyofAlcimed-CNSA(2009),wecanstatethefactthatincountrieswhereaccessratetohearingaidsishigher,thesocialcoverageisbetterfordownmarketormiddlemarketequipment.However,thesecountriesdon’tnecessarilyhavegreaterratesofrealHAsusers(i.e.ratesconsideringeffectivewearingofhearingaids).Takenthus,Francewouldpresentarealrateofusecloseto61%(combiningtherateofeligiblepeopleforhearingaidsandtherateofeffectiveuse),aratesimilartothoseoftheUnited-Kingdom,GermanyandNorwayandstartingfromverydifferentsituationsintermsoffinancialaccesstoequipment.IfthereisroomforimprovementinFranceregardingtheneedforhearingaidequipment–duetofinancial impediment-there isalsoroomforgrowth in countries where hearing aids are (almost) freely delivered but where the
1Thereissomevariabilityinestimationsofthenumberofpeopleaffectedbyhearingloss,dependingonthefieldsofsurveysandtheirmethodology.Inthisstudy,wequalifyhearinglossinthebroadsensewhenitincludesslightlimitationsnotassociatedwithaneedforhearingaids,anddisablinghearingloss(orhearinglossinthestrictsenseoftheterm)whentheimpairmenthasanimpactuponthedailyactivities.2As shown further, theseestimationsarewidely variable in surveys.Moreover, the reportwill focuson thedifferencebetweenpeopleabletobeequippedandpeoplewithdisablinghearingloss.Hence,theseestimationshavetobetakenasapproximations.
12
compliance isn’tsufficientlyperformant.Areviewoffinancialrulesrelatingtohearingaidshastoconsiderthecompliancefactorsdeterminingtheeffectiveuseofequipmentand,thus,thelevelofsatisfactionforhearingaidusers.Atrade-offhastobeundertakenbetween,onone hand, financial access and, on the other hand, suppliers’ and users’ commitment tohearingaiduse.
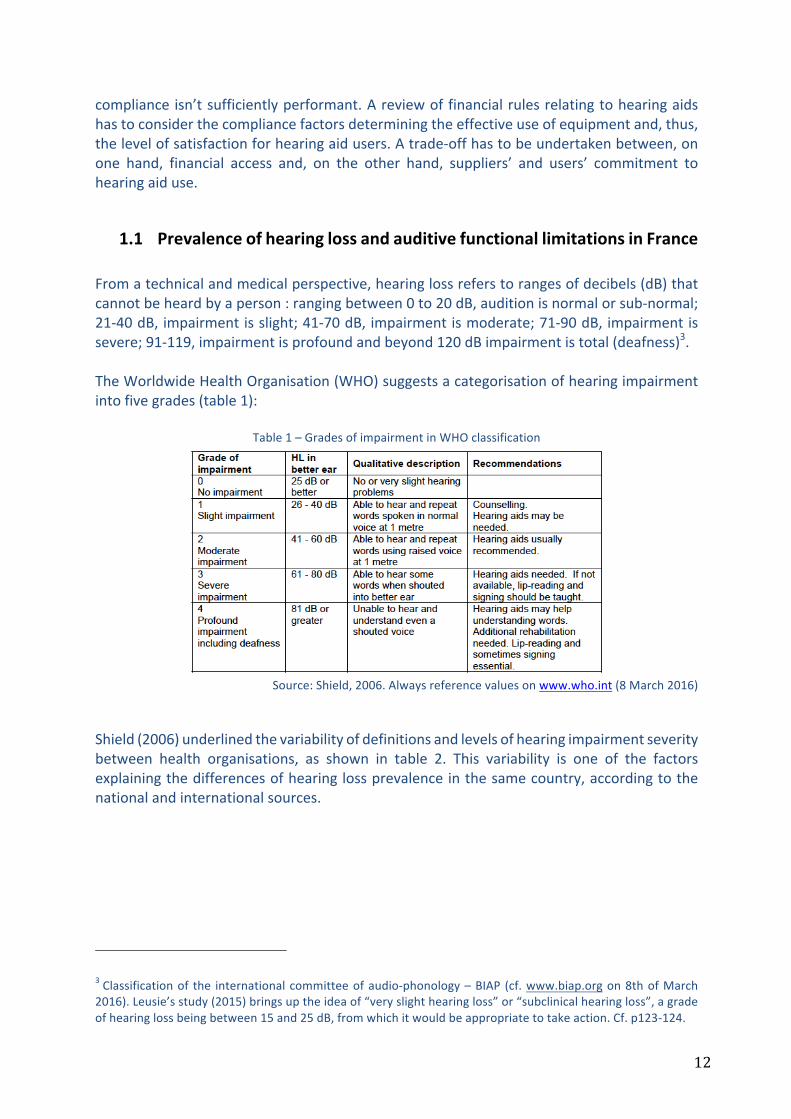
1.1 PrevalenceofhearinglossandauditivefunctionallimitationsinFranceFromatechnicalandmedicalperspective,hearinglossreferstorangesofdecibels(dB)thatcannotbeheardbyaperson:rangingbetween0to20dB,auditionisnormalorsub-normal;21-40dB,impairmentisslight;41-70dB,impairmentismoderate;71-90dB,impairmentissevere;91-119,impairmentisprofoundandbeyond120dBimpairmentistotal(deafness)3.TheWorldwideHealthOrganisation(WHO)suggestsacategorisationofhearingimpairmentintofivegrades(table1):
Table1–GradesofimpairmentinWHOclassification
Source:Shield,2006.Alwaysreferencevaluesonwww.who.int(8March2016)
Shield(2006)underlinedthevariabilityofdefinitionsandlevelsofhearingimpairmentseveritybetween health organisations, as shown in table 2. This variability is one of the factorsexplainingthedifferencesofhearinglossprevalenceinthesamecountry,accordingtothenationalandinternationalsources.
3Classificationof the internationalcommitteeofaudio-phonology–BIAP (cf.www.biap.orgon8thofMarch2016).Leusie’sstudy(2015)bringsuptheideaof“veryslighthearingloss”or“subclinicalhearingloss”,agradeofhearinglossbeingbetween15and25dB,fromwhichitwouldbeappropriatetotakeaction.Cf.p123-124.

13
Table2–Variabilityofreferencevaluesinhearingimpairmentclassifications
WHO:WorldwideHealthOrganisation;ANSI:AmericanNationalStandardsInstitute;RNID:RoyalNationalInstituteofDeafand hard of hearing people; BSI: British Society of Audiology; NIDCD: National Institute of Deafness and otherCommunicationDisorders.
Source:Shield,2006The quantitativemeasure of hearing levels in dB, performed by the ear, nose and throatspecialist (ENT specialist) or the audiologist, doesn’t allow for a direct estimation of thehearing loss prevalence in the general population, as far as this measure occurs when aconsultation is effective (inotherswords, there is a long timebetween theoccurrenceofdisabling hearing loss and healthcare access and the needs for hearing aids cannot beappreciatedonlythroughhealthcareconsumption).Theestimationofhearinglossprevalencerelies in general on population studies and self-reported qualitative data. The ten-yearlyFrench survey ‘Handicap-Santé’ (i.e. ‘Impairment-Health’) 2008, carried-outby twoFrenchnational institutesofstatistics,theINSEEandtheDREES,andreleasedin2014,isthemaindeclarativeFrenchsurveyallowinganestimationofhearinglossprevalenceandanappraisalof auditive functional limitations (Haeusler, Mordier, 2014; Haeusler and al., 2014; InVS,2015)4.However,giventhatthedatawerecollectedin2008,itisadvisabletobringthemuptodate,onthebasisofafewhypothesesandonotherrecentdatasources,asfollows.
1.1.1 Estimationsofhearinglossprevalencein“Handicap-Santé”Frenchsurvey2008Followingthe“Handicap-Santé”survey2008,hearingimpairmentisrecognisedeitherthroughindividualstatementsofusinghearingaidsorstatementsofaneedforhearingaidequipment.Inthisway,1,112,000peoplewerehearingaidowners in2008,whereas2,043,000peopledeclared a need for hearing aid equipment (being 35% of the equipment for the wholepopulationeligibleforhearingaids).Thispopulationrepresentedmorethan3millionpeopleaffectedbyalevelofhearinglosssignificantlydamagingtheirhealthstatus(table3).
4 Data are gathered from several surveys, of which the latest in France is the “Handicap-Santé” survey,implementedin2008.EstimatedstatisticsreportedbyHaeuslerandMordier(2014)relyonapanelsampleof28,500peopleandareextrapolatedtotheFrenchwholepopulation.EstimatedstatisticsreportedbyHaeuslerandal.(2014)arebasedonqualitativestatementsof30,000peopleinordinaryhouseholdsand9,000peopleininstitutions.

14
Table3–Numberofpeoplewhoarehearingaidusersordeclaringaneedforhearingaidsin2008
Source:DREES,2014
Moreover,thenumberofpeopledeclaringatleastonehearingimpairmentrisestomorethan7million–being11.2%oftheFrenchpopulation–providedthateverytypeofdisability isincludedinthesurvey(table4).Therefore,fromdeductionsbasedonthedataintable3andtable4,therateofequipmentrelativetodisablinghearingpeopleiscloseto15.8%in2008.
Table4–Numberofpeopledeclaringhearingimpairments
Source:DREES,2014
In the 2008 survey, disabling hearing, on one hand, is estimated directly by ‘hearingimpairment’(hearingaidsusers/declaredneedforahearingaid,hearingdisability)and,ontheotherhand,isassessedindirectlyby‘auditivefunctionallimitations’(forinstance,difficultytohearinaconversationwithseveralparticipants).Theprevalencedataarethenreckonedbytheauthorsonthisdoublesource(hearingimpairmentandauditivefunctionallimitations).Auditive functional limitations (AFL) are classified into four levels of severity in order toidentifytheminthesurvey(table5).
Table5–Referencegroupsofseverityforauditivefunctionallimitations(AFL)
Source:DREES,2014
Are you a hearing aids user ? Number of people % of total population
Yes 1 112 000 1.8%No, but I would need to use them 2 043 000 3.2%
No and I don't need them 59 875 000 94.9%Doesn't know, withdraws from answer 54 000 0.1%
Total population 63 084 000 100%
Hearing loss : do you have some hearing troubles ? (hard of hearing, tinnitus). If yes, which ones ?
Number of people
% of the total population
Deafness 182 000 0.3%Hard of hearing 1 062 000 1.7%Single-sided deafness 974 000 1.5%Other hearing loss but neither hard of hearing, nor deaf 3 153 000 0,05Other hearing trouble (tinnitus, buzzing, ringing in the ears…) 2 012 000 3.2%At least one hearing impairment 7 056 000 11.2%
Level of AFL Rule for findings
Very severe or totalCannot hear at all a conversation with several participants and declares him/herself to bedeaf (single-sided or double-sided) or hard of hearing
SevereHas a lot of difficulties to hear a conversation with several participants or cannot hear atall a conversation with several people and declares a hearing impairment other thandeafness (single-sided or double-sided) or hard of hearing
Moderate
Has some difficulties to hear a conversation with several participants or being a personequipped with hearing aids and able to follow a conversation without any difficulty orbeing a person hard of hearing or being a person single-sided deaf having declared aneed for hearing aids and following a conversation without any difficulty
SlightHas some difficulties to hear a conversation, but hasn't a declared hearing impairment orhasn't difficulties to hear a conversation and declares a hearing impairment such as tinnitusor ringing in the ears and doesn't use hearing aids

15
In2008,10millionpeoplewereaffectedbyAFL:thiswas16.1%ofthemainpopulation.ModeratetosevereAFL(threelevelsofseverityhigher)affect5.4millionpeople(8.6%ofthegeneralpopulation)and16%ofthemhaveasocialrecognitionofinvalidityordisabilityfortheir impairment (amongst people younger than 60 years). Among this social recognitiongroup,only2%arefoundinaninstitution(whereas10%ofpeoplewithverysevereortotalAFLliveinaninstitution)5.
Table6–Wholeprevalenceofauditivefunctionallimitations(AFL)duetohearinglossinFrance
Source:DREES,2014
TheoverallAFLconcern15.9%ofpeoplelivingathome,18%ofpeoplelivingininstitutionsfordisabledpersonsand42%ofpeoplelivingininstitutionsfortheelderly6.Inotherwords,peoplelivingininstitutionsaremorefrequentlyaffectedbyAFL.
1.1.2 Estimateddataforhearinglossprevalencein2015TheEurotrakdata2015releasedbytheEHIMA(EuropeanHearingInstrumentManufacturersAssociation)arebasedonaqualitativesurveyrelyingonarepresentativesampleof14,824French people. Hearing loss prevalence was stated to be around 9.3% of the generalpopulation(11.4%forpeopleolderthan18),andthisestimationhasbeensteadysince2009(2009:10.4%;2012:9.4%)7.
5AsunderlinedbytheDREES(Haeuslerandal.,2014),the“Handicaps-Incapacités-Dépendances”(‘Impairments-Incapacities-Dependencies’) 1998 survey assessed 5.2 million people affected by moderate to total hearingdifficulties, including303,000people concernedbyvery severe to totalAFL.Theseestimationsappear tobesteadyovertime,despitesomedifferencesintheassessmentmethod.6Thus,36.2%ofpeople in institutionsareaffectedbyslight tototalAFL.However, theDREESconsiders thatthereisprobablyanunderstatementofhearinglossamongtheelderlyininstitutions,becausehearinglossmightbejudgedas“normal”inrelationtootherimpairmentswhicharelikelytobemoremarked(Haeuslerandal.,2014,p.20).7Since2009theEHIMAassociationhasconductedatriennialsurveyintothemajorEuropeanmarkets(France,Germany,UnitedKingdom),whichhasextendedsince2012toSwitzerland,Denmark,NorwayandItalyaswellas to Japan.Themethodology for thesurveyreproducesthatofoneof theAmericanmodels,Marketrak. Itsconception, design and conduction are operated by a Swiss company (Anovum). Thus, because of a similarmethodologyforsurveysonsignificantpanelsofthenationalpopulation(onaverage14,000peopleinsamples),thedataallowsomeinternationalcomparisons.Moreover,itshouldbeunderlinedthattheseEHIMAdataareputintoperspectiveintheDREESreport2014andareconsistentwithFrenchdatareleasedinnationalsurveys.
Auditive limitation scale Number Confidence interval 95% %
Not any problem* 52 931 000 52438000-53424000 82,50%Slight 4 730 000 4471000-4989000 8%Moderate 3 474 000 3264000-3684000 5,90%Severe 1 600 000 1477000-1723000 2,70%Profound or total 359 000 311000-406000 0,60%Whole population 63 094 000 100%Total with auditive limitations 10 163 000 9822000-10503000 16,10%
Including moderate to profound 5 433 000 5190000-5675000 8,61%
Field : People living at home or in institutionSources : Disability-health survey 2008 ('enquête Handicap-Santé 2008')*including 1 353 000 people not able to answer the question about conversation (young people or having heavy impairments)

16
Chart1–PrevalenceofhearinglossinFrance2009,2012and2015(Eurotrak2015)
Source:EHIMA,2015
In the last section of this study (cf. section 2.2), an estimation of the 2014 hearing lossprevalencebyadultagegroupwillbecarriedoutonthebasisofINSEEdemographicdataandhearing loss rates available in the 1998 survey “Handicap-Incapacité-Dépendance”(‘Impairment–Disability–Dependency’).Theserateswerealsoconsideredassteadyovertime.
1.1.3 MainfeaturesofthepopulationaffectedbyauditivefunctionallimitationsAFLconcernedmorementhanwomen(17.2%and15.1%),andarederivedfromprofessionalstatus(exposuretonoisyenvironments)orleisurehabits(soundinjuryduetoloudmusicorheadphones).InthegroupofmoderatetototalAFL,thegapbetweenmenandwomenwasmorepronounced(10,4%and7%)8.Thisgapappearedfromtheageof40years(whereasitappearedatanageof50yearsinthe1998survey).ThelinkbetweentheprevalenceofAFLandageisveryclose:10%ofpeopleaged50yearsandoverwereaffectedbymoderatetototalAFL,asshowninchart2.8Thisestimationisstandardisedbyage,meaningthatitreliesonthehypothesisofasimilarstructureofmaleandfemalepopulationsbyagegroup.
2,1%
4,6%
6,4%
6,4%
10,7%
14,8%
21,3%
31,3%
12,7%
10,4%
1,6%
3,2%
4,8%
5,5%
8,8%
12,6%
18,2%
33,7%
11,5%
9,4%
1,7%
3,2%
4,9%
5,5%
7,9%
12,3%
18,0%
33,0%
11,4%
9,3%
0% 5% 10% 15% 20% 25% 30% 35% 40% 45% 50%
<=14
15-24
25-34
35-44
45-54
55-64
65-74
74+
Total 18+
Total
EuroTrak 2015 Base: 14'824
EuroTrak 2012 Base: 15'430
EuroTrak 2009 Base: 15'545

17
Chart2–Prevalenceofauditivefunctionallimitationsbyageandseverity
Interpretation:“moinsde10ans”:youngerthan10yearsold;“entre10et19ans”:agerangingbetween10and19years–
“LFAlégères”:slightAFL;“LFAmoyennes”:moderateAFL;“LFAgraves”:severeAFL;“LFAtrèsgravesoutotales”:veryseveretototalAFL
Source:DREES,2014NotonlydoestheprevalenceofAFLincreasewithage,butfrom60yearsonwardstherelativesizeofmoderatetototalAFLovertakesslightAFL:59%ofpeoplesufferingfrommoderatetototalAFLwereaged60yearsandolder9.Moreover,startingfrom80years,AFL–alllevelsofseverityinclusive–affectsmorethanoneoutofeverytwoindividuals.IftheageofoccurrenceforveryseveretototalAFLisalwaysknown,itremainsunknowninthegeneralcaseforthegroupofmoderatetototalAFL,aswellasthecausesofhearingloss,whicharenotspecifiedinmostcases.Anadvancedage is likely tobeassociatedwithmoredifficultieswithsocialintegration.As regards the professional category (actual or former occupation), the prevalence ofmoderate to total AFL is variable: workers and farmers weremore affected (+13%) thancraftspeople, shopkeepers and company heads (+9%) or senior managers (+10%).Nevertheless, it isn’t possible to interpret the direction of causality (impact of AFL onoccupationorimpactofoccupationonAFLoccurrence,exceptforfarmersforwhomanexcessofriskduetoworkingconditionsisdemonstrated)10.ThepresenceofAFLseemstohaveanimpact on qualification level or job occupation (InVS, 2015). However, job rates andunemploymentratesaresimilartonationalaveragerates,exceptwhenAFLisverysevereortotal.Moreover, for theworkingpopulation, the search formultivariatedemographic andsocio-economicfactorslikelytoexplaintheprevalenceofmoderatetototalAFLonlybringsouttheage,thesexandthelevelofqualification(particularlywhenthequalificationishigherthanabachelor’sdegree)11.
9Thisstudymostoftenfocusesontheelderlycategory,giventhegreaterseverityofhearingtroublesandthesignificantsizeofthispopulationinhearinglossprevalence.10Odds-ratio1.49*(1.08-2.06):allageandsexbeingequal,thelikelihoodofbeingaffectedbymoderatetototalAFLforaworkerorafarmeris1.5timesgreaterthanformanagersandself-employedprofessionals.11Cf.Haeuslerandal.(2014),p.22andfollowing.
18
Compensationofhearinglossleadstohearingaidequipment(eventocochlearimplantsinsomeseverecases).However,therateofpeoplebeingequippedissubstantiallylowerthantherateofprevalenceformoderatetototalAFL.Itisconvenienttoanalysethemaintriggersofaccesstohearingaids,inordertolaterquestiontheeconomicimpactofhearingloss.
1.2 AccesstohearingaidsinFrance:anoverviewHearing aids (“audioprothèses”) are a device allowing thewearer to receive, process andamplifysounds,whichhavetobeadaptedtotheuser’sabilityofunderstanding(perception)andtolerance.Thus,theyareamedicaldeviceforindividualuse.In order to highlight some approximations relating to the expenditure of the hearing aidsector,totheaveragepriceofapieceofequipmentandtohearingaidaccess,severaldatasourceshavebeencross-referenced.Moreover,therulesforsocialfinancingofhearingaidsarefeatured,wherepublicandprivateinsurancecoverageisassociatedwithalargenetout-of-pocketexpenseforadultHAsusers.Finally,theprovisionoftheequipment,combiningthedeviceandtheservice,isaddressedinitsspecificity.
1.2.1 PublicandprivatehearingaidsexpenditureinFranceHearingaidexpenditureisneitherdirectlyestimated,noratleastreleasedinpublishedFrenchhealthaccountsorintheopendatabase‘Eco-santéOCDE’.Indeed,theexpenditureforthisitemiscompriseswithintheoverallrangeofprosthesis(includinghearingaids,orthopaedicbracesandvehiclesforimpairedpersons)12.Hence,anestimationisproposedonthebasisofsomeavailabletrenddata,andthentheexpenditureissplitupintobothavolumeeffect–dependingonthenumberofhearingaidusers–andanaveragepriceeffect.
1.2.1.1 OverallhearingaidsexpenditureOverallhearingaidexpenditurerangedaroundonebillioneurosin2015,anestimationbasedonthepreviousdatacombinedwiththegrowthrateofsales,aswellasthefiguresintheIGF-IGASreport(2015)13.Estimationoftheoverallexpenditurefor2011In2011,overallhearingaidexpenditurewasestimatedtobearound800millioneurosbythe“HautConseilpour l’avenirde l’assurancemaladie” (‘HighCouncil for theFutureofHealthInsurance’)HCAAM(2013b)andtheCourtofAccounts(2013)14,with:
- 114 million euros funded by National Health Insurance (“Assurance maladieobligatoire”,AMO)(around14%oftheoverallexpenditure);
12AdifficultywhichisunderlinedbytheCourtofAccounts(2013).Asforthefieldof‘othermedicaldevices’forindividualuse,itdepicts80000differentproducts(CourtofAccounts,2014).13IGF:GeneralInspectionofFinances.Cf.volume2,form8,p.59.14Cf.p.395,bydeductingoptics.
19
- 246millioneurosfundedbycomplementaryhealth insurances(“Assurancemaladiecomplémentaire”,AMC)(around31%oftheoverallexpenditure).
Socialexpenditurepresentedasustainedaverageannualgrowthratethatwassustainedatarateof11%between1997and2009(IGAS,2010).Estimationoftheoverallexpenditurefor2012In2012(IGAS,2014),overallhearingaidexpenditureroseto824millioneuros,including:
- areimbursableamountof169millioneuros(cf.infra);- a reimbursable amount of 112million euros coveredbyNationalHealth Insurance
(AMO)(abaserateforreimbursementof65.5%,andarealrateofreimbursementof13,6%);
- agrossout-of-pocketamount(includingcoverageofcomplementaryhealthinsuranceAMC)of711millioneuros.
Inadditiontotheseoverallestimates,theNationalHealthInsurancedata(database‘SNIIRAM)used by the French trade union of audiologists (UNSAF - “Union nationale des syndicatsd’audiprothésistes français”), andmembers of the National Union of Health Professionals(UNPS,“Unionnationaledesprofessionnelsdesanté”),enableustohighlightthedistributionbyageofthehearingaidexpenditurefor2012,thenestimatedtobe822877925euros15.This distribution illustrates the strong concentration of reimbursed social expenditure forpeopleaged54to95(chart3).
15Thegapbetweenestimations–ontheonehandIGAS(2014)andontheotherhandUNSAF(Godinho,2015a)– for 2012 data should be explained either by the different areas of inclusion for social expenditure in theSNIIRAMdatabase(anon-exhaustivefieldat100%dependingontheinclusionornotofthedifferenthealthcareinsurance funds) or else by the portion of hearing aid expenditure not presented for reimbursement. TheCompetitionsAuthorityassesstheamountofrevenuetobe927millioneurosinits2016publicnotice(withoutspecifyingayearofreference,whichwasprobably2014or2015).

20
Chart3–Distributionoftheitem“electronicdevicesforhearingloss”byageinSNIIRAMdatabase(2012)
Source:Sniiram–dataandchartUNSAF(2015).
Twoshortagesarevisibleinthisdistribution,interpretedbyUNSAFasthresholdeffectsduetocoveragerules:theendofspecificrightsforyoungerpeoplewhentheyreachtheageof20years;andtheendofeligibilitytocollectivecontracts,well-knowntobemoregenerous,fromtheageof65years(cf.infra).Thehighestexpenditureisobservableat81years(around31millioneuros).Thecumulatedexpenditureclearlybringsaboutdelayedaccesstohearingaids,regardingtheAFLprevalencedatareleasedbyDREES(Haeusleretal.,2014).Indeed,olderpeopleover65representthree-quartersoftheexpenditurewhereaspeopleover75comprisemorethanhalfoftheexpenditure(54%)16(chart4).
16AsforUNSAF(2015),thenoteworthycumulatedpercentagesare:3.1%<age20,9.1%<age50,24.9%<age65,45.9%<age75.
0 €
5 000 000 €
10 000 000 €
15 000 000 €
20 000 000 €
25 000 000 €
30 000 000 €
35 000 000 €
Estimationofexpenditure"electronicdevicesforhearingloss" (chapter3)in2012byage(registeredatthemomentofequipment)
Overallexpenditure=822877925€

21
Chart4–Cumulatedexpenditurebyage,onitem“electronicdeviceforhearingloss”in2012
Source:SNIIRAM–dataandchartUNSAF(2015).
Finally,themaindatarelatingtooverallhearingaidexpenditureareshownintable7.
Table7–Summarytable:overallhearingaidsexpenditureineurosdependingondatasources
Source:Authorsonbasisonavailabledata
1.2.1.2 EstimationsofthenumberofhearingaidusersEstimationsofthenumberofhearingaidusersinFrancevaryaccordingtotheextrapolateddataofsurveys(decennialsurvey‘HandicapSanté’2008;Alcimed/DSS,2011;biennialsurveyESPS2012;Eurotrak2015).
0€
100 000 000€
200 000 000€
300 000 000€
400 000 000€
500 000 000€
600 000 000€
700 000 000€
800 000 000€
900 000 000€0… 3 6 9 12 15 18 21 24 27 30 33 36 39 42 45 48 51 54 57 60 63 66 69 72 75 78 81 84 87 90 93 96 99 102
Cumulatedexpendituredependingonage(in%)
75 yearsandover:54%ofHAexpenditure65yearsandover:75%ofHAexpenditure
Year Source Overall HAs
expenditure in euros
AMO (National Health Insurance)
AMC (Complementary health insurances)
Gross OOP
2011 HCAAM (2013b) 800 million 114 million (14%) 246 million (31%)
2012 IGAS (2014) 824 million112 million
(13,6%)711 million
2012SNIIRAM (UNSAF
2015)822,877,925
2015 IGF-IGAS (2015) 1 billion

22
Estimationsofthe‘Handicap-Santé’survey2008Following the ‘Handicap-Santé’ survey of 2008 (Haeusler et al., 2014), in 2008 access tohearingaidsconcerned1,112,000people(1.8%ofthewholepopulation,giventhatonly20%ofpeopleaffectedbymoderatetototalAFLworehearingaid(s)–andweremorefrequentlywomen and senior executives, all sex and severity levels of hearing loss being equal)17 .However,therateofhearingaidownershadincreasedby7pointsbetween1998(13%)–theyearoftheprevioussurvey–and2008:thiscouldbeexplainedbyabetterqualityofhearingaidequipment.
Table8–HearingaidequipmentrateforpeopleaffectedbymoderatetototalAFL
Source:DREES,2014
Youngerpeopleagedunder20(37%)aremoreoftenequippedwithhearingaidsthanthoseaged75andover(32%against21%in1998),whichcanbeexplained,simultaneously,byabettersocialcoverageoftheformergroupandabetterresponsetoequipmentintermsofitseffectiveness(cf.infra).Also,itshouldbeunderlinedthat:
- Womenaremoreoftenequippedthanmenamongpeopleagedover60;- Seniorexecutivesaremoreoftenequippedthanworkers,alllevelsofseveritybeing
equal(theyaretwiceaslikelytobeequipped)andindependentofanyincomeeffect(notsignificantinthesurvey);
- Impairedpeoplearemoreoftenequippedthanotherpeopleintheagegroup60-74years,duetoFrenchsocialcoverageruleswhichdistinguishimpairmentandoldage(cf.infra);
- In the labour force, there is no significant difference between employed andunemployedpeople(despitethefactthatthelatterhavelowerincomes).
Asfarastheincomeeffectisnotperceptibleonhearingaidaccessinthesurvey,thisaccessseemstodependmorelargelyonasocio-psychologicaleffect(hearingaidsaremorediscreetfor women than for men), on a socio-cultural effect probably due to information (socio-economicclasseffect)andonthelevelofpublicand(aboveall)privatecoverage.EstimationsofAlcimed-DSS(2011)fortheyear2009TheAlcimed-DSSsurveyestablishedthefollowingobservations:
- 1.25millionFrenchpeoplearehearingaid(s)users(estimationbasedontradeuniondata),being31.7%ofthepopulationeligibleforhearingaids;
17Theratewouldbeof10.7%ifthewholeAFLhadbeentakenintoaccount.
Age Under 20 20-44 45-59 60-74 75 and over Overall
Moderate AFL 13% 8% 17% 31% 18,4%Severe AFL 9% 8% 20% 30% 21,8%
Very severe to total AFL 25% 19% 26% 41% 33,5%Moderate to total AFL 37% 14% 8% 15% 32% 20,4%
Moderate AFL 22% 28% 32% 41% 32%Severe AFL 35% 45% 51% 51% 47%
Very severe to total AFL 32% 51% 63% 49% 51%Moderate to total AFL 9% 26% 34% 38% 45% 37%
Equipment rate
Need for an equipment

23
- amonghardofhearingpeople(6,300,000people),halfwereeligibleforhearingaidequipment;
- hence, there isnotable roomfor improvementgiven the targetof3millionpeople(being1,75millionpeoplewhoneedatleastonehearingaid);
- the average age at first equipment is estimated to be 71, thus at a late age, as aconsequenceofadelayinthediagnosisfollowedbyadelayinaccess.Thegapbetweentheperceptionofadecline inhearingandthepurchaseofadevice isestimated inyears18.
EstimationsofthebiennialsurveyESPSfortheperiod1992-2012Thebiennialsurveys“Santéetprotectionsociale”ESPS(‘HealthandSocialWelfareSurvey’)showaremarkableevolutioninhearingaidaccessbetween1992and201219(table9):
Table9–Evolutionofthenumberofhearingaidsownersfrom1992to2012
Source:BiennialsurveyESPS,dataEco-SantéOCDE
(availableonlineFebruary2016).
18 According to Le Monde 29 September 2009, access to hearing aids requires “seven years of reflection”(estimation based on the ‘Ipsos’ survey, June 2009). The Eurotrak survey for France 2015 estimates morepreciselythat84%ofpeoplebeingequippedwaited justunder6yearsbeforeaccessingequipmentand43%waitedbetween3to6years.19 The ESPS survey collects data from a panel sample of 8000 ordinary households (20,000 people) and isconsideredasrepresentativeof97%oftheFrenchmetropolitanpopulation.
A B C D
Hearing aids
owners
Hearing aids
owners aged 65
and over
Inhabitants Hearing owners
In % of total
population
In % of total
population
Number Estimated number
1992 1,0 6,0 56 975 597 569 7561993 1,1 7,0 57 239 847 629 6381994 0,9 6,0 57 467 085 517 2041995 0,9 5,5 57 658 772 518 9291996 1,0 5,0 57 844 247 578 4421997 1,2 5,8 58 025 989 696 3121998 1,0 5,7 58 207 490 582 0751999 nd nd 58 397 788 nd2000 1,0 4,9 58 677 406 586 7742001 nd nd 59 062 385 nd2002 1,9 7,8 59 476 236 1 130 0482003 nd nd 59 893 870 nd2004 1,5 7,1 60 303 631 904 5542005 nd nd 60 734 343 nd2006 2,2 9,1 61 181 499 1 345 9932007 nd nd 61 597 486 nd2008 2,3 8,6 61 965 052 1 425 1962009 nd nd 62 615 472 nd2010 2,3 8,6 62 917 790 1 447 1092011 nd nd 63 223 158 nd2012 3,7 11,4 63 514 003 2 350 018
AAGR 6,8% 3,3% 0,5% 7,3%
Me
tro
po
lita
n
Fra
nce

24
- Theproportionofhearingaidusershas risen from1%to3.7%,namelyanaverageannualgrowthrateof6.8%;
- Theproportionofhearingaidusersolderthan65yearshasgrownfrom6%to11.4%,namelyanaverageannualgrowthrateof3.3%.Atthesametime,therateofthesepeopledeclaringhearingtroublerisesto23%;
- Takingintoaccounttheselatterobservations,theriseinaccesstohearingaidsappearstobepushedupwardsbypeopleyoungerthan65years,ratherthanbythoseover65,indicatingearlieraccesstohearingaids;
- Theestimatednumberofhearingaidusershasincreasedby7.3%perannumovertheentireperiod,growingfrom569,756peoplein1992to2,350,018peoplein2012.Thisaverageannualgrowthrateisduetoacombinationinthegrowingnumberofpeoplebeingequippedanddemographicgrowthof7.6%intheperiod2002to2012;
- In 2012, there is probably an overestimation in the number of hearing aid users’numbers (2.35 million people according to the survey). This presumption ofoverestimationisreinforcedwhencomparedtootheravailablerecentdata(cf.infratable18).Accordingtoourestimation,thenumberofhearingaidusersoughttobeabout1.8millionpeoplein2012.
EstimationsEurotrak2015TheEurotraksurveyestimatestherateofhearingaidaccessat34.1%ofthehearingimpairedpopulation in 2015 and shows also that older people aged over 65, affected by hearingimpairment, are equipped at 42% (23.2% for the age group 45-64 and 29.5% for peopleyoungerthan45years).
Chart5–Evolutionoftherateofhearingaidaccessrelativetohearinglossprevalence(2009,2012,2015)Eurotrakdata
Source:EHIMA,2015
70%ofpeoplebeingequippedhavegotabinauraldevice(bothears).Moreover,accessisasgreatashearinglossseverityissevere(chart6)20.
20Severity isassessedonthebasisofahearing loss level thatdependson:monauralorbinauralequipment,grade of hearing loss (moderate to severe), score on APHAB scale, and degree of difficulty to follow a
9,3% 9,4% 10,4%
3,2% 2,8% 3,1%
34,1% 30,4% 29,8%
0%
5%
10%
15%
20%
25%
30%
35%
40%
45%
50%
EuroTrak 2015 EuroTrak 2012 EuroTrak 2009
Hearing impaired (stated) Adoption (% of population) Adoption (% of stated impaired)

25
Chart6–Rateofhearingaidsaccessrelativeonhearinglossseverity(Eurotrak)
Source:EHIMA,2015
ReferencevaluesAccordingtothevariabilityofestimations(cf.table10),itseemstoberelevanttotakeonanaccessraterangingbetween30%to35%ofthepopulationaffectedbydisablinghearingloss21.Reader’sattentionshouldbedrawnto themeaningof thedifferencebetweentherateofhearing loss prevalence and the rate of people being equipped with hearing aids: thisdifferencedoesn’tfitwiththepopulationthatwouldbebothnotequippedandabletobeequipped. For different reasons relative to feasibility of equipment, to the relevance of ahearingcompensation,topossibletherapeuticoptionsforseverecases(i.e.cochlearimplant),orelsetosocialandpsychologicalfactors(rejectionofhearingaids),theaccesstohearingaidsisforeseeableonlyforafractionofhearingimpairedpeople.Itisusuallyconsideredthatthepopulationeligibleforhearingaidequipmentrepresentshalfoftheimpairedpopulation.Thisreferencetarget,centralinthisreport,ishighlightedfurther(cf.1.2.2.3).
conversationinanoisybackgroundwithouthearingaidequipment.Thisestimationleadsto6groupsofidenticalsize(16,67%).21TheIGAS(2014)estimatesthenumberofimpairedpeopletobe7million,ofwhom15%areequipped.The“UFC-Quechoisir”(FrenchConsumersAssociation–periodical‘WhattoChoose’)(2015)estimatesthisnumberat6million,with25%equipped.These ratesofequipmentareamong the lowestvalues in thewholesetofsurveys.
13% 14% 31%
42% 49% 69%
87% 86% 69%
58% 51% 31%
0%
10%
20%
30%
40%
50%
60%
70%
80%
90%
100%
1 2 3 4 5 6
Hearing aid No Hearing aid

26
Table10–Summaryofestimatedratesofhearingaidsaccessintheliteratureandsurveys
Source:Authorsonbasisofdifferentsurveydata.
Anotherwaytoestimatethisrateofhearingaidaccessistobasenumbersonthequantityofdevicessold(accordingtothe“Syndicatnationaldel’industrieetdestechnologiesmédicales”SNITEM–‘NationalUnionofMedicalIndustryandTechnologies’)duringthelast6years(themedianlifespanforequipmentis6yearsaccordingtotheEurotraksurvey2015forFrance),andthentoconsidertheshareforbinauralequipment(70%,samesource).Thus,itispossibletoestimatethenumberofwearersofhearingaids,byassumingthatthedevicesboughtinthelastsixyearshaveasyettoberenewed,giving2,041,075hearingaidowners.Givenarateofhearinglossprevalenceof10%in2012,theaccessratewouldthenbeabout32,6%22.Hence,thisstudyisbasedonareferencerateforhearingaidaccessrangingbetween30to35%ofthehearingimpairedpopulation.
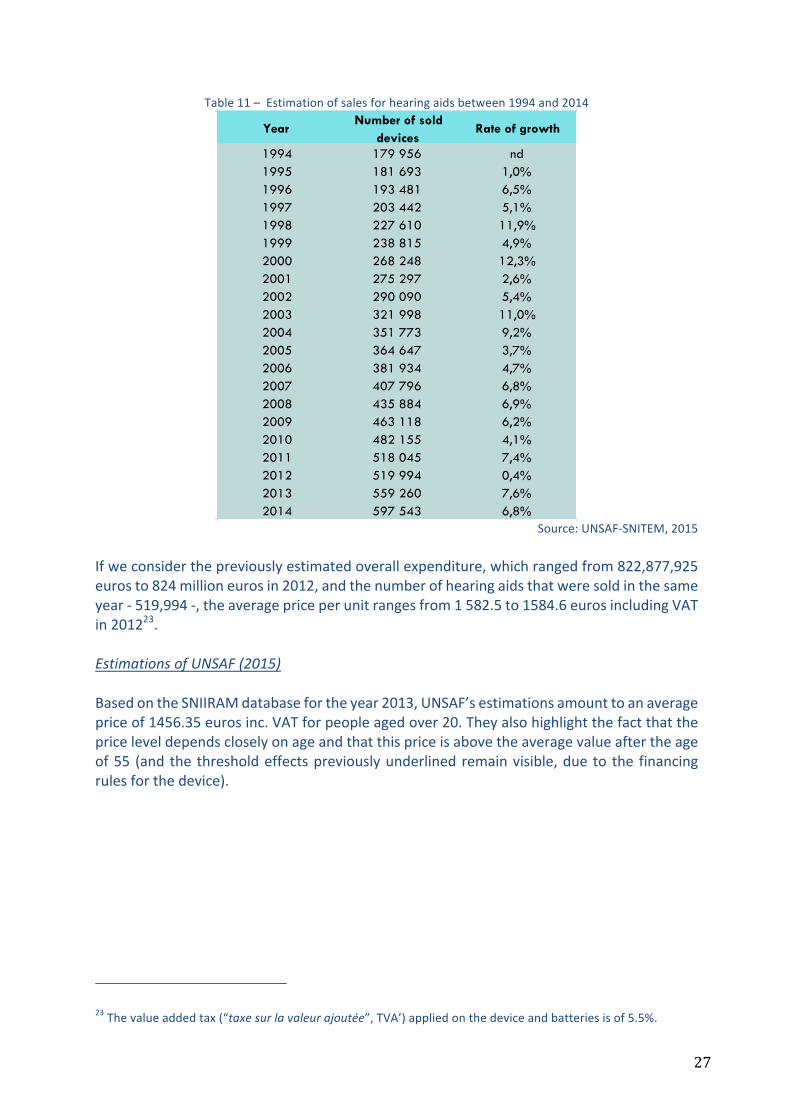
1.2.1.1 EstimationsoftheaveragepriceofahearingaidAccordingtotheSNITEM(2015),hearingaidsaleshavefollowedadynamictrendforthe20yearsfrom1994to2014:
22ItwouldbeinterestingtoestimateretrospectivelyandprospectivelytheprogressionoftherateofhearingaidsownersonthebasisofSNITEMsalesdata,onthedemographicstructureofpopulationandlifeexpectancy,ontherateofdevicerenewal(medianof6years)andtherateofnewpurchasersandonthebinauralrateofequipment.However,thisestimationwouldbedependentonseveralassumptions(stabilityofdevicedurationandof rateofbinauralequipmentand, for the forecasting, stabilityofaverageannualgrowth rate for sales,stabilityoftherenewaltimeoccurrence,stabilityoftherateofdiffusionrelatedtoacceptance,forecastofthenoiseexposure impact for younggenerations). This longitudinal analysiswould require thedesignof severalscenariosthatgoesbeyondthescopeofthisstudy.
Year Survey and HL criteria Access rate to equipmentPrevalence rate of
hearing loss
2008Handicap Santé (disabling
hearing loss)15,8% 11,2%
2008Handicap santé (moderate to
total AFL)20,4% 8,6%
2008 ESPS 23,0% 10,0%
2009 Eurotrak 29,8% 10,4%
2009 Alcimed-DSS 31,7% 10%*
2010 ESPS 23,0% 10%*
2012 Eurotrak 30,4% 9,4%
2012 ESPS 37,0% 10%*
2015 Eurotrak 34,1% 9,3%
* Assumption
27
Table11–Estimationofsalesforhearingaidsbetween1994and2014
Source:UNSAF-SNITEM,2015
Ifweconsiderthepreviouslyestimatedoverallexpenditure,whichrangedfrom822,877,925eurosto824millioneurosin2012,andthenumberofhearingaidsthatweresoldinthesameyear-519,994-,theaveragepriceperunitrangesfrom1582.5to1584.6eurosincludingVATin201223.EstimationsofUNSAF(2015)BasedontheSNIIRAMdatabasefortheyear2013,UNSAF’sestimationsamounttoanaveragepriceof1456.35eurosinc.VATforpeopleagedover20.Theyalsohighlightthefactthatthepriceleveldependscloselyonageandthatthispriceisabovetheaveragevalueaftertheageof55 (and the thresholdeffectspreviouslyunderlinedremainvisible,due to the financingrulesforthedevice).
23Thevalueaddedtax(“taxesurlavaleurajoutée”,TVA’)appliedonthedeviceandbatteriesisof5.5%.
YearNumber of sold
devicesRate of growth
1994 179 956 nd1995 181 693 1,0%1996 193 481 6,5%1997 203 442 5,1%1998 227 610 11,9%1999 238 815 4,9%2000 268 248 12,3%2001 275 297 2,6%2002 290 090 5,4%2003 321 998 11,0%2004 351 773 9,2%2005 364 647 3,7%2006 381 934 4,7%2007 407 796 6,8%2008 435 884 6,9%2009 463 118 6,2%2010 482 155 4,1%2011 518 045 7,4%2012 519 994 0,4%2013 559 260 7,6%2014 597 543 6,8%

28
Chart7–Averagepriceasafunctionofageinin2013
Source:Sniiram–dataandchartUNSAF(2015).
Thedistributionofaveragepricesbyageshowsthatahearingaidismoreexpensiveforolderpeopleaged65andover(1,560.83eurosinc.VAT),thenforyoungerpeopleunder20yearsold(1,503.60eurosVAT)andforpeopleagedbetween20and64(1,349.51eurosVAT).
Table12–AverageVATpriceforahearingaidbyagegroupsin2013
Source:SNIIRAM–dataandtableUNSAF(2015).
OtherestimationsinthegreyliteratureThegreyliteraturecapturesingeneralanaverageunitpriceof1,600eurosinc.VATin2009(Alcimed-DSS,2011),or1,550eurosinc.VATin2014(Autoritédelaconcurrence,2016)or1,535eurosinc.VATin2011(estimationoftheNationalHealthInsuranceCNAMTSthathasbeenusedbytheCourtofAccounts(Courdescomptes,2013),theIGAS(2014)andtheIGF-IGAS(2015)),beingaround3,070eurosinc.VATforbothears24.
24Theseestimationsdon’tincludethetechnicalcostofmaintenance(batteriesetc.).
0
2 000
4 000
6 000
8 000
10 000
12 000
0 €
200 €
400 €
600 €
800 €
1 000 €
1 200 €
1 400 €
1 600 €
1 800 €
1051009590858075706560555045403530252015105
Qua
ntity
of d
evic
es
Aver
age
pric
e
Age
Year 2013 / Source : Sniiram
Average price (scale on the right) Quantity of devices (scale on the left)
Age Under 20 20-64 Over 64Overall
population
Average price 1,503.60€ 1,349.83€ 1,560.83€ 1,465.37€
Number of people 8,064 59,458 218,271 285,793
Number of devices 16,054 100,312 339,435 455,801
Binaural Rate 99.08% 68.71% 55.51% 59.49%
29
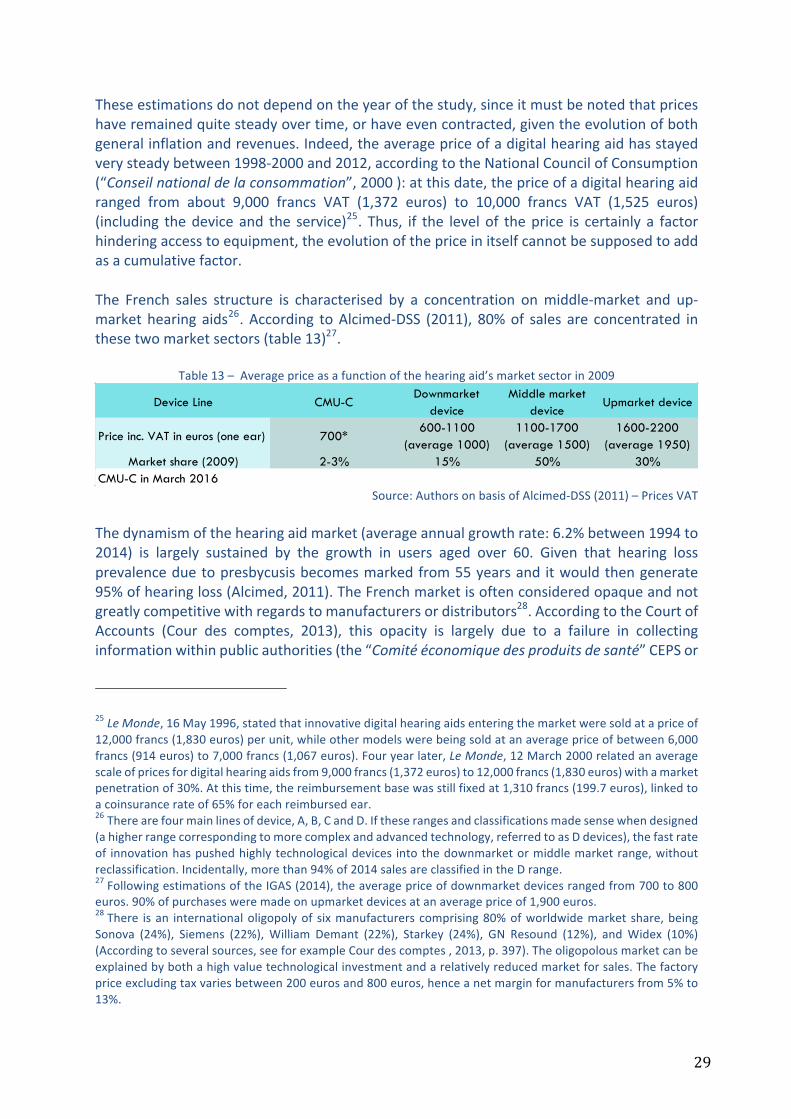
Theseestimationsdonotdependontheyearofthestudy,sinceitmustbenotedthatpriceshaveremainedquitesteadyovertime,orhaveevencontracted,giventheevolutionofbothgeneralinflationandrevenues.Indeed,theaveragepriceofadigitalhearingaidhasstayedverysteadybetween1998-2000and2012,accordingtotheNationalCouncilofConsumption(“Conseilnationaldelaconsommation”,2000):atthisdate,thepriceofadigitalhearingaidranged from about 9,000 francs VAT (1,372 euros) to 10,000 francs VAT (1,525 euros)(including thedevice and the service)25. Thus, if the level of theprice is certainly a factorhinderingaccesstoequipment,theevolutionofthepriceinitselfcannotbesupposedtoaddasacumulativefactor.The French sales structure is characterised by a concentration onmiddle-market and up-markethearing aids26.According toAlcimed-DSS (2011), 80%of sales are concentrated inthesetwomarketsectors(table13)27.
Table13–Averagepriceasafunctionofthehearingaid’smarketsectorin2009
Source:AuthorsonbasisofAlcimed-DSS(2011)–PricesVAT
Thedynamismofthehearingaidmarket(averageannualgrowthrate:6.2%between1994to2014) is largely sustained by the growth in users aged over 60. Given that hearing lossprevalenceduetopresbycusisbecomesmarkedfrom55yearsand itwouldthengenerate95%ofhearingloss(Alcimed,2011).TheFrenchmarketisoftenconsideredopaqueandnotgreatlycompetitivewithregardstomanufacturersordistributors28.AccordingtotheCourtofAccounts (Cour des comptes, 2013), this opacity is largely due to a failure in collectinginformationwithinpublicauthorities(the“Comitééconomiquedesproduitsdesanté”CEPSor
25LeMonde,16May1996,statedthatinnovativedigitalhearingaidsenteringthemarketweresoldatapriceof12,000francs(1,830euros)perunit,whileothermodelswerebeingsoldatanaveragepriceofbetween6,000francs(914euros)to7,000francs(1,067euros).Fouryearlater,LeMonde,12March2000relatedanaveragescaleofpricesfordigitalhearingaidsfrom9,000francs(1,372euros)to12,000francs(1,830euros)withamarketpenetrationof30%.Atthistime,thereimbursementbasewasstillfixedat1,310francs(199.7euros),linkedtoacoinsurancerateof65%foreachreimbursedear.26Therearefourmainlinesofdevice,A,B,CandD.Iftheserangesandclassificationsmadesensewhendesigned(ahigherrangecorrespondingtomorecomplexandadvancedtechnology,referredtoasDdevices),thefastrateof innovationhaspushedhighlytechnologicaldevices intothedownmarketormiddlemarketrange,withoutreclassification.Incidentally,morethan94%of2014salesareclassifiedintheDrange.27FollowingestimationsoftheIGAS(2014),theaveragepriceofdownmarketdevicesrangedfrom700to800euros.90%ofpurchasesweremadeonupmarketdevicesatanaveragepriceof1,900euros.28There isan internationaloligopolyof sixmanufacturerscomprising80%ofworldwidemarket share,beingSonova (24%), Siemens (22%),William Demant (22%), Starkey (24%), GN Resound (12%), andWidex (10%)(Accordingtoseveralsources,seeforexampleCourdescomptes,2013,p.397).Theoligopolousmarketcanbeexplainedbybothahighvaluetechnologicalinvestmentandarelativelyreducedmarketforsales.Thefactorypriceexcludingtaxvariesbetween200eurosand800euros,henceanetmarginformanufacturersfrom5%to13%.
Device Line CMU-CDownmarket
deviceMiddle market
deviceUpmarket device
Price inc. VAT in euros (one ear) 700*600-1100
(average 1000)1100-1700
(average 1500)1600-2200
(average 1950)Market share (2009) 2-3% 15% 50% 30%
CMU-C in March 2016
30
‘Economiccommitteeofhealthproducts’itselfnothavingavailablesalesstatisticsformedicaldevices).Thetopicsofcompetition,marketcharacteristics,productdifferentiationstrategies,hearingaiddistributionnetworksand sector regulationsgobeyond the frameworkof thisstudybuttheinterestedreadershouldrefertorecentstudiesbytheCourtofAccounts(Courdescomptes,2013and2014),bytheDirectorateofSocialSecurity(“Directiondelasécuritésociale”-DSS,2011),theIGAS(2013and2014),theIGF-IGAS(2015),andbytheCompetitionAuthority(Autoritédelaconcurrence,2016)29.
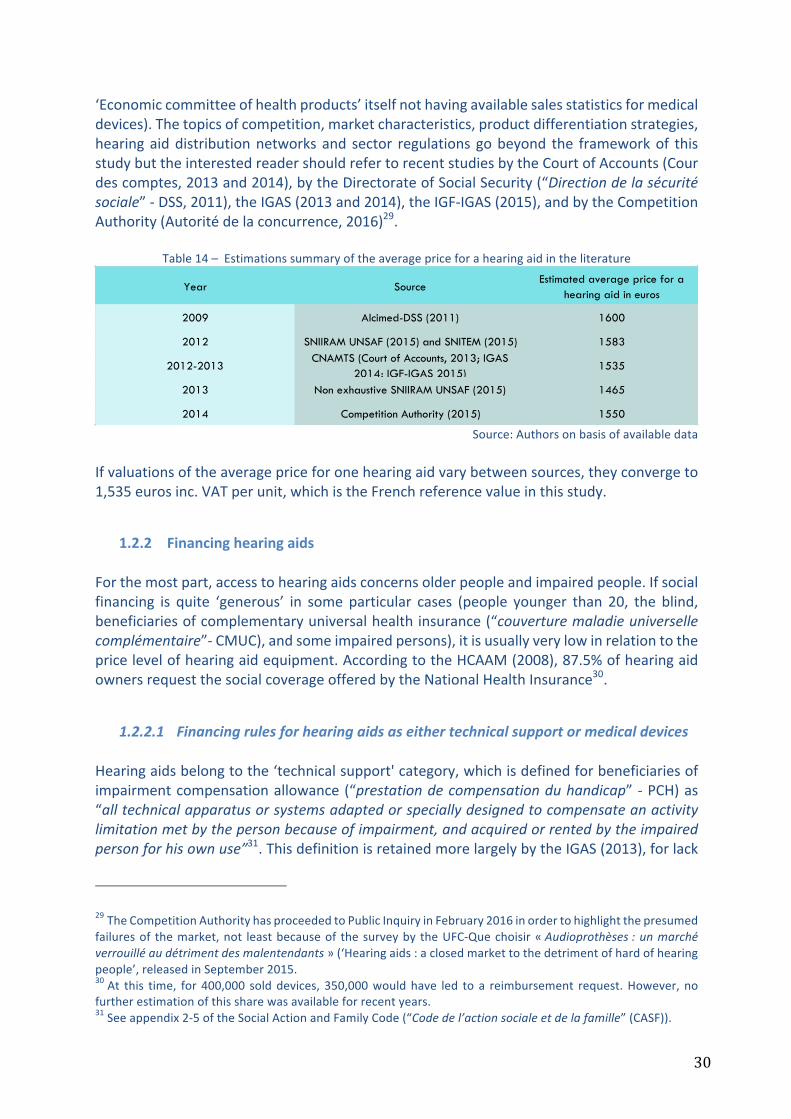
Table14–Estimationssummaryoftheaveragepriceforahearingaidintheliterature
Source:Authorsonbasisofavailabledata
Ifvaluationsoftheaveragepriceforonehearingaidvarybetweensources,theyconvergeto1,535eurosinc.VATperunit,whichistheFrenchreferencevalueinthisstudy.
1.2.2 FinancinghearingaidsForthemostpart,accesstohearingaidsconcernsolderpeopleandimpairedpeople.Ifsocialfinancing is quite ‘generous’ in some particular cases (people younger than 20, the blind,beneficiariesofcomplementaryuniversalhealthinsurance(“couverturemaladieuniversellecomplémentaire”-CMUC),andsomeimpairedpersons),itisusuallyverylowinrelationtothepricelevelofhearingaidequipment.AccordingtotheHCAAM(2008),87.5%ofhearingaidownersrequestthesocialcoverageofferedbytheNationalHealthInsurance30.
1.2.2.1 FinancingrulesforhearingaidsaseithertechnicalsupportormedicaldevicesHearingaidsbelongtothe‘technicalsupport'category,whichisdefinedforbeneficiariesofimpairmentcompensationallowance(“prestationdecompensationduhandicap”-PCH)as“alltechnicalapparatusorsystemsadaptedorspeciallydesignedtocompensateanactivitylimitationmetbythepersonbecauseofimpairment,andacquiredorrentedbytheimpairedpersonforhisownuse”31.ThisdefinitionisretainedmorelargelybytheIGAS(2013),forlack
29TheCompetitionAuthorityhasproceededtoPublicInquiryinFebruary2016inordertohighlightthepresumedfailuresof themarket,not leastbecauseof thesurveyby theUFC-Quechoisir«Audioprothèses:unmarchéverrouilléaudétrimentdesmalentendants»(‘Hearingaids:aclosedmarkettothedetrimentofhardofhearingpeople’,releasedinSeptember2015.30At this time, for 400,000 solddevices, 350,000wouldhave led to a reimbursement request.However, nofurtherestimationofthissharewasavailableforrecentyears.31Seeappendix2-5oftheSocialActionandFamilyCode(“Codedel’actionsocialeetdelafamille”(CASF)).
Year Source Estimated average price for a
hearing aid in euros
2009 Alcimed-DSS (2011) 1600
2012 SNIIRAM UNSAF (2015) and SNITEM (2015) 1583
2012-2013CNAMTS (Court of Accounts, 2013; IGAS
2014; IGF-IGAS 2015)1535
2013 Non exhaustive SNIIRAM UNSAF (2015) 1465
2014 Competition Authority (2015) 1550
31
of a similar definition for beneficiaries of the personalised autonomy subsidy (“allocationpersonnaliséed’autonomie”,APA).Suchapitfallisrevealing–asunderlinedbytheIGAS–ofthegreatconfusionsurroundingtherightsandwaitingperiodsinvolvedinfinancingtechnicalsupport,dependingonrecipients’classificationintoillness,impairmentoroldage(thisdifferentiationofneeds,rightsorstatus– illness, invalidity, impairment, dependency - is particular to France). This confusion isreinforcedbythemultiplefinancingbodiesincaseofimpairmentandbythevariationinrightsdependingontheareaofresidence.Furthermore, hearing aids are not only technical supports but are also medical devices(“dispositifsmédicaux”,DM),andthusrelatetohealthcare,andtothe listofreimbursableproducts and service provision (“Liste des produits et prestations remboursables” - LPPR)definedbytheNationalHealthInsurance32.However,registrationintheLPPRisnotlinkedtoanupperpricelimit(unlikemostmedicaldevices)andthegapbetweenpricesandtariffsisremarkablywide(CEPS,2015)33.Thejuxtapositionofdefinitions,publicbodiesandrightshasfinallyresultedinalackofmanagementoftheaccesstotechnicalsupports,tohighcostsduetoorganisationandtheriskoferrors,andtoinequalitiesbetweencustomerswhoselevelofinformationaboutaccessibilityvariesgreatly.
1.2.2.2 PublicandprivatefinancingrulesforhearingaidequipmentCoveragebytheNationalHealthInsuranceAsofFebruary2016, theNationalHealth Insurancecovers, for standardcases (i.e.peopleolderthan20yearsand/ornoblindnessimpairment34),60%oftheLPPRtariffforahearingaid,fixedat199.71euros,thatis119.83eurosperunit35.Thisreferencetariff includesnotonlythedeviceitself,butalsotheaccessories,theadaptationandprostheticeducationbythe
32ArticleL.5211-1ofthePublicHealthCodewhichimposesnorms,suchastheCEmarkbythemanufacturer(articleL.5211-3).33“Fixingaceilingpriceforsalesimplies,however,ifneedbe,theresolutionofthequestionofanysurchargebilledinreturnfor/againstservicesoraccessoriesexceedingthedefinitionofthereimbursableproductorservicespecifiedbythelist.Inparticular,thisisthecaseintheexternalprosthesisororthoticssectors,wherepatientsoughttoaskfor,andsuppliersoughttooffer,technicaloraestheticaccessories,butnotonlythat.Forexample,inthefieldofhearingaidsforveryyoungpeople,professionalsarguethatthegapbetweenpricesandtariffsallowsforpaymentforaudiologistswhoseinterventionisneededtoadapttheequipmentfortheirpatients,andcould,dependingonthecase,representagreatnumberofconsultationsforveryyoungpeopleormulti-impairedpersons. Indeed, the resulting out-of-pocket sum was mostly reimbursed either by the CMU-C, or bycomplementary insurancesandinothercasesbymeansofregionalor localassistancebodies,andwasoftenrequestedbyaudiologiststhemselves.Thedifficulty,eventheimpossibility,inthesesituationstodetermineaboundedpriceofsaleaccordingtorationalreferencesandexistingfinancepossibilitieshaveledtheCommitteetopostponethefixationofaceilingpriceforsalesforthesehearingaidsthatwouldbesuperiortothetariff”,CEPS(2015),p.142.34Intheseparticularcases,technicalsupportequipmentisreimbursedatacoinsurancerateof60%forpricesrangingbetween900and1,400euros,dependingonthedeviceclassification.Inthecaseofachronicdiseaseor‘long-term affliction’ (“Affection de longue durée”, ALD) or in the case of invalidity allowance, the rate ofreimbursementis100%oftheLPPRtariff.Cf.www.ameli.fraccessed24February2016.35Thereimbursementratedroppedfrom65%to60%in2011.
32
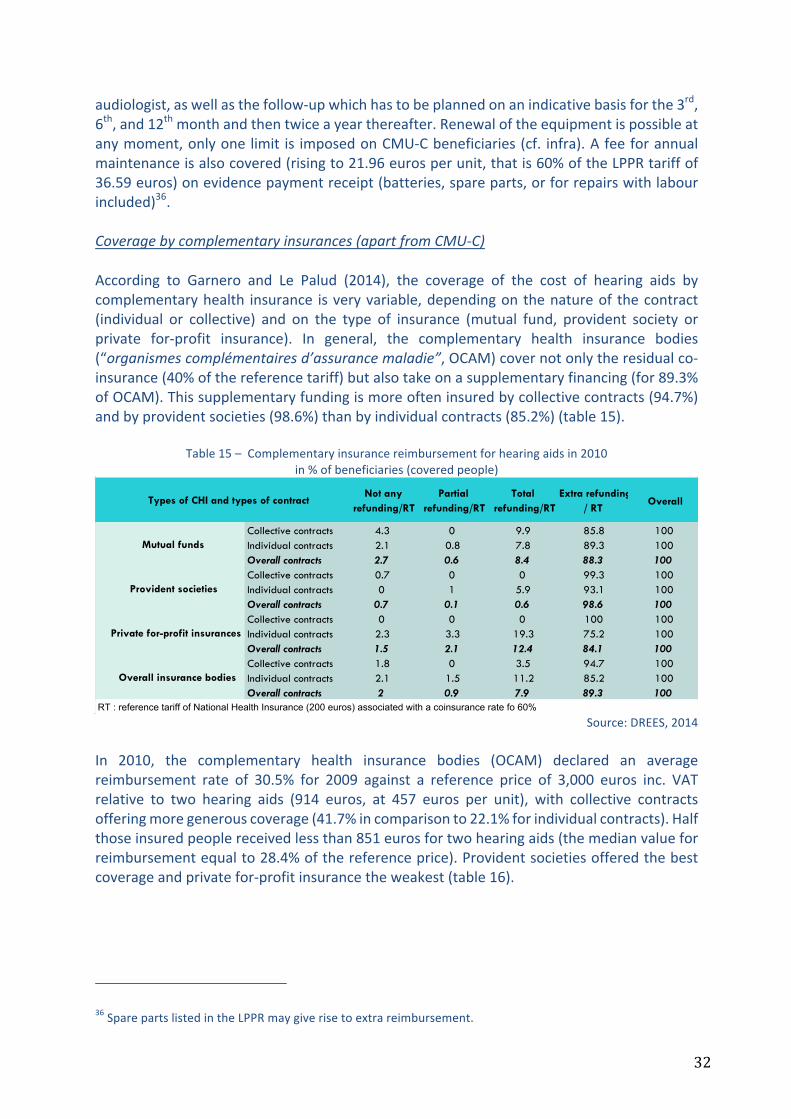
audiologist,aswellasthefollow-upwhichhastobeplannedonanindicativebasisforthe3rd,6th,and12thmonthandthentwiceayearthereafter.Renewaloftheequipmentispossibleatanymoment,onlyone limit is imposedonCMU-Cbeneficiaries(cf. infra).Afeeforannualmaintenanceisalsocovered(risingto21.96eurosperunit,thatis60%oftheLPPRtariffof36.59euros)onevidencepaymentreceipt(batteries,spareparts,orforrepairswithlabourincluded)36.Coveragebycomplementaryinsurances(apartfromCMU-C)According to Garnero and Le Palud (2014), the coverage of the cost of hearing aids bycomplementaryhealth insurance isveryvariable,dependingonthenatureof thecontract(individual or collective) and on the type of insurance (mutual fund, provident society orprivate for-profit insurance). In general, the complementary health insurance bodies(“organismescomplémentairesd’assurancemaladie”,OCAM)covernotonlytheresidualco-insurance(40%ofthereferencetariff)butalsotakeonasupplementaryfinancing(for89.3%ofOCAM).Thissupplementaryfundingismoreofteninsuredbycollectivecontracts(94.7%)andbyprovidentsocieties(98.6%)thanbyindividualcontracts(85.2%)(table15).
Table15–Complementaryinsurancereimbursementforhearingaidsin2010in%ofbeneficiaries(coveredpeople)
Source:DREES,2014
In 2010, the complementary health insurance bodies (OCAM) declared an averagereimbursement rate of 30.5% for 2009 against a reference price of 3,000 euros inc. VATrelative to two hearing aids (914 euros, at 457 euros per unit), with collective contractsofferingmoregenerouscoverage(41.7%incomparisonto22.1%forindividualcontracts).Halfthoseinsuredpeoplereceivedlessthan851eurosfortwohearingaids(themedianvalueforreimbursementequalto28.4%ofthereferenceprice).Providentsocietiesofferedthebestcoverageandprivatefor-profitinsurancetheweakest(table16).
36SparepartslistedintheLPPRmaygiverisetoextrareimbursement.
Not any refunding/RT
Partial refunding/RT
Total refunding/RT
Extra refunding / RT
Overall
Collective contracts 4.3 0 9.9 85.8 100Individual contracts 2.1 0.8 7.8 89.3 100Overall contracts 2.7 0.6 8.4 88.3 100Collective contracts 0.7 0 0 99.3 100Individual contracts 0 1 5.9 93.1 100Overall contracts 0.7 0.1 0.6 98.6 100Collective contracts 0 0 0 100 100Individual contracts 2.3 3.3 19.3 75.2 100Overall contracts 1.5 2.1 12.4 84.1 100Collective contracts 1.8 0 3.5 94.7 100Individual contracts 2.1 1.5 11.2 85.2 100Overall contracts 2 0.9 7.9 89.3 100
RT : reference tariff of National Health Insurance (200 euros) associated with a coinsurance rate fo 60%
Types of CHI and types of contract
Mutual funds
Provident societies
Private for-profit insurances
Overall insurance bodies

33
Table16–Distributionofthereimbursementforapairofhearingaidsin2010(referenceamountfortwonumericaldevices:3000eurosVAT)
Source:DREES,2014
Finally,afterpublicandprivatecoverage(AMOandAMC)andonanaverageamountof3,000eurosfortwohearingaids,thenetout-of-pocketsumfortheownerwouldbeeither1,846euros (923 euros per ear)37starting from themean reimbursement value, or 1,909 euros(954.5eurosperear)startingfromthemedianreimbursementvalue.Thisestimationtakesintoaccountthedistributionofbeneficiariesbytypeofinsuranceandbytypeofcontract38.ThisestimationofAMCcoverageisslightlyhigherthanthosefoundintheliterature:
- 330eurosperearfortheCourtofAccounts(Courdescomptes,2013);- 395eurosperearfortheIGAS(2014);- 300to400eurosperearinAlcimed-DSS(2011).
Thus, it is possible that OCAM have slightly increased the coverage rate, which can beinterpretedastheeffectofcompetitiononcontracts(butthe“adverseselection”effectlimitstherelevancyofthisexplanation)orasa“forced”roleinriskmanagementbythewithdrawalofNationalHealthInsuranceonthisitem.However,complementaryinsuranceremainsveryweakforoptics(68%)ordentalcare(38%)39.
37Calculation:3000eurosminus240euros(AMO)minus914eurosAMC.38 Adverse selection refers to a situation in economic theory according to which if insurances offer bettercoverageforgoodsthatareassociatedwithhigherrisk(here,hearingaidsassociatedwitholderage),theywillcapture the people likely to have other health troubles, and then they capture adversely high risk people.Moreover,inthetable19,collectivecontractsrepresent42.7%ofthoseinsured.Theirdistributionisof66.6%inmutualfunds,3.7%inprovidentsocietiesand29.6%inprivatefor-profitinsurances.Estimationsofmeanandmedianreimbursementtakeintoaccountthisdistributionofthoseinsuredbetweenthethreedifferenttypesofcomplementary insurances and the different types of contracts (collective or individual). Hence, these areweightedestimations.Moreover,quartileanalysisshowsthat25%ofthoseinsuredarereimbursedatmostfor350eurosfortwoears,whereas25%ofthemarereimbursedatleast1,220euros.39DataHCAAM,2013b,p.111.
Mean First quartile Median Third quartile
Collective contracts 1 032 539 939 1 398
Individual contracts 800 440 799 1 020
Overall contracts 865 445 840 1 039
Collective contracts 1 487 1 138 1 538 1 997
Individual contracts 777 578 739 1 138
Overall contracts 1 413 939 1 500 1 937
Collective contracts 1 142 939 1 198 1 338
Individual contracts 338 160 300 352
Overall contracts 626 240 390 1 038
Collective contracts 1 252 790 1 138 1 737
Individual contracts 662 260 640 976
Overall contracts 914 350 851 1 220
Types of CHI and types of contract
Mutual funds
Provident societies
Private for-profit insurances
Overall insurance bodies
34
One consequenceof this differentiationbetween collective and individual contracts is theevident phenomenon of the high take-up of hearing aids just before leaving collectivecontractsbypeoplereachingretirementage,whencetheshortageeffectpreviouslyshown.Indeed,olderandretiredpeoplearefinanciallypenalizedbythelossofsocialrightsbasedonworkingstatus.CoveragefortheCMU-CbeneficiariesAudiologistsareboundtoofferhearingaidequipmentsuitableforCMUCbeneficiarieswithinthe limitsofapplicabletariffs,whichwererevalued in2014 inordertoreflectupgrades inmedicaldevicesforindividualuse(Courdescomptes,2015).Foraceilingpriceof700eurosperear40, theCMU-Cbeneficiariesareallowedoneor twoC-classhearingaidsevery fouryears,whichtheaudiologistmustbeabletosupplyatthisprice.Thisrevisionofthereferencetariffforthispopulationshouldsignificantlyreducetheadverseeffectsoftheprevioussystem(theequipmentoftheotherearpostponeduntiltwoyearslater,oreventhewithdrawalofcarebytheaudiologist)41.CoverageforthebeneficiariesofPCHandAPAInthecaseofimpairedpersons,thePCHallowsforanadditionalreimbursementallocationfixedbyministerialdecreeataceilingof600eurosforamiddlemarketorup-marketdevice(CorD)incasesofsevereimpairment42.Variableallocationsarelikelytoreducethenetout-of-pocketamount,andmayevenleadtoover-reimbursement.Incontrast,theassessmentofelderlydependencydoesnotallow,inmostcases,foranysupplementaryAPA(becauseofanoverloadedhelpplan,theunsuitabilityoftheautonomygridAGGIR,orlackofawarenessofthefield).Finally, it is arduous to estimate the real value of financial subsidies, and requires betterknowledgeof equipment life span. Theentire statementof the IGAS (2013) isof a stronginequity in access and rights, and is as follows : “for the same impairment or the samedeficiency, older people in dependency and impaired people do not have, at this time, anequivalentaccess to technical supportequipment”and,among the latter,hearingaidsarebroughttotheforefrontofthiscriticism,since“itisforthistypeofsupportequipmentthattheelderlydeclaretheirtechnicaldeviceneedstobethelesswellsatisfied”43.
40 Current reimbursement rule in February 2016, www.ameli.fr. Reimbursement for two devices is thenguaranteedatapriceof1,400eurosbytheCMU-C.Reimbursementlevelsarehighestforpeopleagedunder20yearsorincasesofcumulativehearinglossandblindness.41Beforethistariffrevision,theCMU-Cbeneficiarieswereofferedatotalreimbursementof443.63eurosforonlyoneear,theotherearbeingreimbursedatthereferencetariff,sotherewasanobservablegapintwo-earequipmentandalowperformantaccesstohearingaids.4216%ofpeoplewithmoderatetototalAFLbenefitfromadministrativerecognitionlikelytobeassociatedwithanadditionalallowance(HaeusleretMordier,2014).43p.5,IGAS(2013).

35
1.2.2.3 Estimationsofout-of-pocketpaymentandhealthcarerenouncementEstimationsofout-of-pocketpayment(OOP)Grossout-of-pocket(orout-ofpocketbeforeAMC)Apartfromopticaldevices,hearingaidsrepresent,inthefieldofmedicaldevices,thegreatestproportion of gross OOP payment before complementary health insurance intervention,representing40%ofthegrossOOPpayments(CESE,2015).Asshownpreviously,theNationalHealthInsurance(AMO)covers120eurosperadultear,independentlyoftheapparatusclass:thissumincludestheserviceoftheaudiologistandVATat5,5%.In2011,ifoneusesthestudyreferenceprice–basedontheCourtofAccounts(2013)estimateof1,535eurosperhearingaid-thegrossOOPpaymentrisestoaround1,400eurosperitem,namelyagrossOOPpaymentof91%,oreven97%foranupmarkethearingaid.ThisgrossOOPpaymentremainshighinparticularcases(youngerpeopleunder20yearsold,andtheblind)thatrepresent5%ofhearingaidowners(thegrossOOPpaymentvariesfrom54%to59%).Suchasituationraisesquestions.Itisduetothebaseforreimbursementbeingfrozensince1986,whenhearingaidswereobviouslylessefficientandwhentheywereimplicitlyclassifiedas“lowrisk”andaminormedicalservice,resultinginsocialreimbursementfunding(AMO)of6%to9%ofthedevice.ItisalsoduetothewithdrawalofNationalHealthInsurance(AMO)inrelationtotheroleofcomplementaryhealthinsuranceswhichplayedagreaterfinancingrole,butalsocreatedmore inequalities in thesystem(optionalpurchase,anddifferentiationofcontracts). Finally, it is also due to the wait-and-see attitude of public authorities, andparticularlytothe“paralysisofthereviewingofgenericlines”oftheLPPR,whichhastheeffectof“penalisingmanypatientsaswellasmanufacturerswhoproposeinnovativesolutions”44.Inanycase,tariffshavenotbeenreviewedformorethan10years45.However,onenoteworthyadvancein2002wasmadewiththeadoptionofreimbursementforstereodevices(whileonlyonemonodevicewasreimbursedbefore),resultinginstronggrowthforthisiteminthesameyear46.
44Courdescomptes(2013),p.407.Thus,anexaminationofhearingaidsin2006wasplannedbyadecreeofJuly2005, but this opinion was only given in 2008 by the ‘commission for products and benefits assessment’(“Commissiond’évaluationdesproduitsetprestations”–CEPP-,todayCNEDIMTSsince2009)whichproposedanewclassificationandarevisionoftechnicalprescriptions,apropositionwhichhasnotbeenfollowedbyanyobviousresultsatthetimeofthisreport.ThemainrecommendationsoftheCEPPwere:prescriptionsupervisionby an ENT specialist; a minimum real-life probationary period of 15 days for the prosthetic; standardisedfeedback to be given to the prescriber post-equipment; a 5-year, non-curtailable period before a newreimbursement,exceptwhensupportedbytheprescriber;classificationbasedontheimpairmentlevelwithaminimalrequirementfortechnicalperformancebydigitalhearingaids.However,theCEPPmaintained,giventheliterature, the generic prescription and did not discuss the indivisible character of the device and theperformanceoftheprovision.45Courdescomptes,2014,p.311.46Decreeof23April2002.Cf.HCAAM(2008).
36
Netout-of-pocketpayment(OOP)(orout-of-pocketpaymentafterreimbursementbyAMC)Despitetheimprovementinhearingaidreimbursementbycomplementaryhealthinsurances(AMC)anddespitethepositiveevolutionofthesystemforCMU-Cbeneficiaries,thereremainsweakcoverageforthoseinsuredinthisfield.Dependingonthepolicyholder’ssituation,andinparticularregardinghis/hercomplementary insurancecontract,thenetOOPpayment islikelytobehigh,around62%aftercoverageofAMOandAMC(8%+30%)47,andrangingonaveragefrom45%foradownmarketdeviceto72%foranupmarketdevice,giventhatthisrangerisesrelativetothelowerpriceofthedownmarketdeviceandthehigherpriceoftheupmarketdevice,thenatureofthecomplementaryinsuranceandthetypeofcontract(table17).
Table17–Estimationofthenetout-of-pocketsumasafunctionoftheaverageorthemedianreimbursementbycomplementaryinsurance(AMC)
Source:AuthorsonbasisonAlcimed-DSSdata(2011),DREESdata(2014)
andthereferencepriceofthestudyOn the basis of this study’s reference price, the expense for an adult covered by acomplementaryhealthinsurancepolicyapartfromCMU-Crisestoanaverageof950eurosperear.Intheliterature,theroughestimatesare48:
- 1,040euros/ear(Alcimed,2011);- 1,100euros/earfortheCourtofAccounts(Courdescomptes,2013);- 1,000euros/ear(HCAAM,2013);- 940euros/earfortheIGAS(2014).
Thepresumptiveevidenceoftheweakpublicandprivatecoverageofhearingaidexpenditureistherateofhealthcarerenunciation,whichcantaketheformeitherofadelayinaccesstocareregardingneedsand/orofsocialinequalitiesinaccesstohearingaids(dependingonthesocio-economic category, the status of the need (illness, impairment, dependency), theownershipofcomplementaryhealthinsuranceanditstype).Theliteraturedoesnotprovideaconcreteestimateforcarerenunciationduetoinabilitytopay,becausethewithdrawalofcareaccessistheresultofseveralfactors:financial,psychological,andlackofinformation.Itwouldbeincorrecttousetherateofaccesstohearingaidstodirectlydeducetherenunciationrateduetoinabilitytopay.
47Estimatedsharesbasedonahearingaidpricedat1,535€,minus120€AMO,minus457€AMCfollowingthepreviousdataoftheDREES(2014).48NoestimationexistsforOOPimpactonthehouseholdbudget,giventheoccasionalcharacterofthepurchase.
37
The proportion of people eligible for hearing aids is usually taken at 50% of the hearingimpairedpopulation.Thereareseveralwaystodemonstrateitsrelevancy:
- first, by referring to the Alcimed-CNSA (2009) study which gathered expertrecommendationsinordertodeterminethisreferencerateof50%;
- bystudyingthesurveydatafrom‘Handicap-Santé’2008:o usingthedirectapproachofhearingloss(cf.table3):inthis,1.8%ofthewhole
populationdeclaresthemselvestobehearingaidusers,3.2%declareaneedtousehearingaidswithoutowningone,thus5%ofeligiblepeopledeclaringforahearinglossprevalenceof11.2%.Thismeansthat44.6%ofhearingimpairedpeopleareeligibletohearingaids(5%/11.2%);
o orbytheindirectapproachofmoderatetototalAFL(cf.table8):20.4%ofthispopulationusehearingaids,37%declareaneedwithoutowningone,namely57.4%ofthepopulationwithdisablinghearinglosseligibletohearingaids;
- by analysing the access rate in countries where this access to hearing aids is free(complete financial coverage of the device), as in Denmark (cf. section 1.3.1): theaccessrateisof48%ofthehearingimpairedpopulation;
- bystudyingthesurveydatainEurotrak(2015)whichillustrates(forFrance)thecoursetakenbyhearingimpairedpersonsuntilowninghearingaids(“theroutetothehearingaid”):of100%ofhearingimpairedpeople,26%donotseetheirphysician.Therefore74%ofpeoplehaveamedicalconsultationrelatedtohearingloss.Inthispopulation,36%donot receiveadviceabouthearingaidequipment.Thus,only48%ofpeoplereceiveguidanceabouthearingaids.Afterrenunciationofhearingaids,34%ofthesepeoplegethearingaids.
Theexpertassessmentsandtheempiricalanalysisofaccesstohearingaidsaresufficientlyrobust tomaintain the reference target for people eligible to hearing aids of 50% of thehearingimpairedpopulation.Byrevisitingthechronologicaldataofsurveyswhichestimatetheaccessratetohearingaids,bytakingintoaccounttherateofhearinglossprevalence,thenbyintroducingthepopulationINSEEdataandconsideringforeachyearthat50%ofthehearingimpairedpeopleshouldbeequipped(target),itispossibletodirectlyestimatethepeoplebeingequippedandthepeople(whoarenotowners)abletobeequippedperyear(table18).Thisestimationallowsustoobserve a noteworthy growth in the equipment rate, despite the differences in datadependingonsources.

38
Table18–Estimationofthepopulationbeingequippedinfunctionofthesources–2008-2015
Source:Authors,onbasisonAlcimed-DSSdata(2011),othersavailablesurveydataandINSEE.
Yea
rSu
rvey
and
HL
crite
riaPo
pula
tion
in
met
ropo
litan
Fr
ance
Acc
ess
rate
Prev
alen
ce
rate
Hea
ring
impa
ired
popu
latio
n
Equi
pmen
t ra
te
Hea
ring
aid
owne
rs /
ta
rget
Elig
ible
pop
ulat
ion
for
hear
ing
aids
Hea
ring
aid
owne
rsR
emai
ning
elig
ible
po
pula
tion
for
HA
s (n
ot o
wne
rs)
2008
Han
dica
p Sa
nté
(disa
blin
g he
arin
g lo
ss)
62 3
00 2
8815
.8%
11.2
%6
977
632
1.8%
31.6
%3
488
816
1 12
1 40
52
367
411
2008
Han
dica
p sa
nté
(mod
erat
e to
tota
l A
FL)
62 3
00 2
8820
.4%
8.6%
5 35
7 82
51.
8%40
.8%
2 67
8 91
21
092
996
1 58
5 91
6
2008
ESPS
62 3
00 2
8823
%10
%6
230
029
2.3%
46%
3 11
5 01
41
432
907
1 68
2 10
8
2009
Euro
trak
62 6
15 4
7229
.8%
10.4
%6
512
009
3.1%
59.6
%3
256
005
1 94
0 57
91
315
426
2009
Alc
imed
-DSS
62 6
15 4
7231
.7%
10%
6 26
1 54
73.
2%63
.4%
3 13
0 77
41
984
910
1 14
5 86
3
2010
ESPS
62 9
17 7
9023
%10
%6
291
779
2.3%
46%
3 14
5 89
01
447
109
1 69
8 78
0
2012
Euro
trak
63 5
36 9
1830
.4%
9.4%
5 97
2 47
02.
9%60
.8%
2 98
6 23
51
815
631
1 17
0 60
4
2012
ESPS
63 5
36 9
1837
%10
%6
353
692
3.7%
74%
3 17
6 84
62
350
866
825
980
2015
Euro
trak
64 3
95 2
4234
.1%
9.3%
5 98
8 75
83.
2%68
.2%
2 99
4 37
92
042
166
952
212

39
Alldataconvergeatthistimetowardsacurrentsizeofonemillionpeopleabletobeequipped(andnotalreadyowningahearingaid)inFrance.Thiscase-by-casereviewisbeneficial inordertoputtheestimationsofgreyliteratureintoperspective,sincetheseestimationsbecomequicklydatedgiventherapiddevelopmentofhearingaidaccess(theseestimationsoftenrelyonthestudyoftheDREES(2014)fortheyear2008).Asanexample,theseestimationscanbefoundintheliterature:
- according to theCESE (2015),only20%ofhearing impairedpeoplewereequippedbecauseofcarerenunciationforaffordabilityreasons;
- accordingtoIGAS(2014),theequipmentraterangesbetween33%and40%:1.5to2millionpeopleremaineligibleforhearingaids(anddonotownthem)foreveryonemillionpeoplewhoarealreadyequipped49;
- accordingtotheCompetitionAuthority(Autoritédelaconcurrence,2016),therearecurrently1.5millionequippedpeoplefor4.4millionpeopleeligible,allinclusive(thusanequipmentrateof32%);
- according to the survey ‘UFC-Que Choisir’ (2015)50, there are 1.5 million peopleequippedforaneligiblepopulationnotowningaidsof2millionpeoplein2012.
Theseestimationsseemtobeveryapproximate:eitherthenumberofpeoplebeingequippedisincorrectlyassessed,orthenumberofeligiblepeopleiswrong,orconfusionpersistsastotheequivalencebetweentherateofhearinglossprevalenceandtherateofpeopleabletobeequipped.Whatevertheanswer,accesstohearingaidshasgrownsignificantlyinaveryfewyearswhereasthenumberofpeopleabletobeequippedhashardlyincreased,despitetheeffectsofdemographicgrowthandageing.
49AccordingtotheIGAS,Franceischaracterisedbyanatypicalsituation,witharegulationfailurewhichhasledtohighpricesandlowsalesvolumes.Itconsidersthat,forasimilarexpenditure,thereversesituationisfoundinEnglishHealthauthorities:thereisahighrateofreimbursementofdemandsandcontrolofpricesandproducts.TheIGASadvisepreferentiallythereinforcementoftheNationalHealthInsurance’sroleintherunningofthesystemandthefinancingpolicyfortechnicalsupportequipmentandthereinforcementoftheHASandCEPS’rolesinthefieldofthetechnicalsupportequipmentassessment.50ThesurveybyUFC-Quechoisirfirstconsidersthedemandnotbeingequippedonthebasisofdataforcountrieswherethedemandistotallyreimbursed(Denmark,UnitedKingdom,Sweden).Itthencomputes,forapopulationagedover65, thenumberof devices sold in 2014anddeduces an average for 1,000older inhabitants. Thisaveragevalue is thereferencevaluefromwhichacomparison inaccess isdrawnfor thesamepopulation inFrance.Asthisaccessis2.41timesless,theauthorsestimatethatforthepastfiveyearsthesalesnotrealisedofdevices on the basis of sold devices, and then deduce the number of people not being equipped, with anassumptionofabinauralequipmentrateof80%.Thisestimationwouldbetterhavetakenintoaccountseveraladditionalfactorsinordertobemorereliable:thenumberofnewbuyersofHAsonthemarketeachyear(48%inDK,54%inUK,68%inFrance-dataEurotrak2012);themedianlifespan(4yearsinDKagainst5to6yearsinFrance); the different rate of binaural equipment (84% in DK; 64% in UK; 74% in France). Therefore, thisestimationfor2014–whereasallstudiesshowanincreaseinaccesssince2008–isfrailintermsofmethodology.Forexample,ifthesamereasoningisappliedtothesamedataforFranceandDK,butincludesthenewbuyersonthemarket-142.2*48%inDKand51.5*68%-aratioof2isobtained(andnot2.41),thenkeepingtheDanishdataforequipmentlifespan(4years)andtherateofbinauralequipment(80%),theestimationofpeoplenotbeingequippedisabout1.2million.Moreover,asshownpreviously,therateofaccessforpeopleagedover65yearshasbeenslightlyslowerthanthisrateforthewholepopulationinFrance,whichalsointroducesanotherbiastotheresults.GiventhattheinitialestimationreliesonoverallsalesinFrancetocustomersofallages,itwouldhavebeenbettertobasethereasoningonthewholeadultpopulation.
40
Inanycase,healthcarerenunciation–giventhelackofcomplementaryhealthinsuranceorinsufficientprotection-islikelytoconcernpeoplewithlowincomeswhomayforgohearingaidcarebecauseofimpossiblecostsorlargeout-of-pocketpayments51.Moreover,ifhearingaid renunciation is often understood as a result of financial constraints, we should alsoconsidertheroleofpsychologicalbarriers,lackofinformationorthevaryingeffectivenessofdevicesparticularlyamongtheelderly(cf.infra2.3).
1.2.3 Thehearingaid:adurablegoodassociatedwithaparamedicalserviceThehearingaidis‘ahearinglosscorrectiveelectronicdevice’inwhichadjustmentofoutputdependsonthefrequency,inordertocompensateforhearingloss:thereareeither“behind-the-ear”hearingaidswhichaccountfor88%ofdevices(classicalbehind-the-ear/childrenandelderly; micro-sound-tube and soft plastic ear tip / slight to profound losses; or remoteearphones/slighttoprofoundlosses),or“inthecanal”(completelyinthecanal,inthecanalorintheear/moderateloss).Theyaredigitaldevicesinnearly100%ofcases(SNITEM,2014).Thepurchaseofahearingaidischaracterisedbyasimultaneouspurchaseoftheapparatusitself and long term delivery of a back-up service (on average 5 years), which makesaudiologistsdifferentamongsthealthcaresuppliers.Thisroleofdeliverywiththesupportofthenetworkconnectingthesixmanufacturerswithcentralpurchasingagencies,andthelatterwithaudiologists52.Audiologistsareeithersalariedorself-employed,dependingontheirtypeofpractice,andmightbeemployedbyspecialisedgroupsinaretailchain(inabranchofficeorasamanagingdirector)ortheymightoperateindependently,orasamemberofamutualdistributionnetwork53.TheroleoftheaudiologistisdefinedbythePublicHealthCode(“Codedelasantépublique”,CSP)andtheSocialSecurityCode(“Codedelasécuritésociale”)and,since2015,anumerusclaususrestrictsaccesstothisprofession54.In2015,thereare3,064salariedorindependentprofessionals (table 19). The average annual growth rate of the professional demography(+5.3%fortheperiod1999-2015)isclosetowhatwasobservedforhearingaidsales(+6.2%).
51TheHCAAM(2013)considersthatthestakesaretodetermineagoodchoiceofcomplementaryhealthcarethroughbetterhealthriskmanagement(fairandresponsiblecontracts),sincecomplementaryhealthinsurancesarethemainsourceofsubsidies,andabovealltoquestiontheirabilitytobringundercontroldevicesalesprices;itsupportsthedevelopmentofnetworks.Insodoing,itexcludesthepossibilityoftherecaptureofthehearingaidsectorbytheAMOandtheadoptionofapplicabletariffs,becauseofthebackgroundofshortfall.Severalscenarios are designed by the HCAAM, either a takeover of reimbursement by the AMO (by returning to acoinsurancerateforthereferencetariffof65%insteadof60%),orcompletelytransfertotheAMCthewholereimbursementcharge.At the timeof this report,noadditionalclausehasbeen innegotiationbetween theUNOCAMandthesectorrepresentatives.52SuchverticalintegrationhasbeenpermittedbytheCompetitionAuthorityinDecember2015fortheAudikagroupwhich is controlledbyWilliamDemant.Moreover, thepurchasing agencies - contrary towholesalers’distributorsinthecaseofdrugs–playareferencing,ratherthanadistributionrole.53Discountpricebeingaround15%ontheHAsprices(agreementofpartnershipquality-price).Cf.IGAS(2013).54Decreeof15July2015.Thenumerusclausushasbeenfixedat199studentsin2015-2016.

41
Table19–EvolutionofthenumberandthedensityofaudiologistsinmetropolitanFrance
Source:BiennialsurveyESPS,dataEco-SantéOCDEandDREES(opendata)
(AvailableinFebruary2016).Oncethehearinglossdiagnosedbythephysicianleadstomedicaladviceforhearingaids,theaudiologistplaysanadvisory role,delivering thedeviceand theassociatedservices55.Thisrole, regulated by article L4361-1 of the CSP, is to ensure counselling of customers, thedeliveryandtheadaptationofhearingaids,andfollow-upsduringthelifetimeofthedevice,inahighperformancetechnicalfacility.Themainsequencesthathavetobefollowedare:
- The preliminary consultation, which leads to a standardised estimate, clearlydifferentiatingontheonehandthepricesofgoods(apparatus)and,ontheotherhand,thepricesofassociatedservices56;
- Theadaptationconsultation,inordertounderstandthedeviceanditsuseinreal-lifesituations,includingaprobationaryperiodof15days;
- Theadjustmentconsultations(1to3)dedicatedtofinetuningandcounselling;- The follow-up consultations (twice a year) dedicated to maintenance and later
adjustments.
Thepriceofahearingaidcomprisesthereforethecostofthedeviceandthelong-termfollow-up, including the apparatus, the audiologist’s time, the technician’s or assistant’s salaries(administration)andthetechnicalfacilities.Theestimatedtimedevotedtotheuserisvariableintheliterature:
- itrangesbetween11.5hoursto20hoursaccordingtotheCNC(2000);55 The freedom of counselling leads to a possible information asymmetry between the patient and theaudiologist,with theaudiologistbeing incentivised tomakemore frequent references toupmarketproductsbecauseofahigherprofitmargin.56Thisclarification is imposedbythe«Macron» lawof6August2015.Thecostingpresentsthepre-taxsalepriceandtheserviceprice,thenetpriceincludingVATandthereferencetarifffixedbytheLPPR(articleL.165-1ofthesocialsecurityCode,title2.
Audiologists - ADELI Repertoire (salaried and
independent)
Audiologists - ADELI Repertoire (salaried and
independent)
Numbers Density for 100 000 inhabitants
1999 1229 2,102000 1313 2,232001 1422 2,402002 1526 2,562003 1620 2,702004 1714 2,832005 1806 2,962006 1905 3,102007 2029 3,282008 2116 3,412009 2229 3,572010 2352 3,752011 2437 3,862012 2599 4,102013 2740 4,30AAGR 5,9% 5,3%
Metropolitan France
42
- 10hoursaccordingtotheCourtofAccounts(Courdescomptes,2013);- 12hoursto15hoursover5years,including4hoursforinitialadaptationaccordingo
IGAS(2014)57;- 10 to 12 hours according to Alcimed-DSS (2011). The report points out that the
combinationofhighmanufacturers’salespricesandthehumantimerequiredforahighqualityfittinglimitsthepossibilityofcheapersupplies(no“discount”equipment).
Contrarytosomemedicaldeviceswhichonlyrequireashortamountoftimeforcounselling,usinghearingaidscallsfordeeperacquaintanceand“cognitive”adaptation,dependingonthecapabilities of the auditive nervous system, where the stakes are compliance, and thus,improvementinthequalityoflifethatmaynotbeperceivedimmediately.Thisadaptationis,according to the reportAlcimed-DSS (2011), ‘akeyphase fora successfulequipment’, andrequiresalong-termfollow-upandaconfident,sharingrelationshipbetweenthepatientandtheaudiologist.Thereportalsounderlinesgiventhat“thepsychologicalstakeisstrongandthepopulationofpatientsmostlyolder,itisnotrarethatadaptationsessionsalsoplayasocialrole”58.ThispointofviewistakenupbytheCESE(2015)forthewholesetofmedicaldevices,whichqualifiesthemas“user-dependent”productstotheextentthattherapeuticresultsdependonpatientcompliancewithrecommendationsandthatspecificpatientcounsellingisrequired.TheIGAS(2014)alsounderlinesthedifficultyforassessingthecostoftheservice,whichisadecisive factor in satisfaction (and thusofpatients’ compliance).All thisdifferentiates thistechnicalsupportequipmentfromothers,sincethedeviceisnotseparablefromcounsellingandtune-uponalong-termbasis,andwherethepurchasecostdoesnotdividedeviceandservicedelivery.
1.2.4 Hearingaidpricingissues:ananalyticaleconomicframeworkIn the framework of hearing aid deliverymentioned above, is it reliable to dissociate theapparatusandtheservice forpricing?This issue,which is regularlyquestioned in thegreyliterature,wouldrequireanassessmentoftheadded-valueforthecombinationofapparatus-service:
- Arguments in favour of this decoupling suggest that pre-payment – or prospectivepayment–doesnotensuretheeffectivefulfilmentoftheservice(incaseofpatientdecease,centreclosureetc.59)oranyqualityimprovementinthefollow-up(asthereisnoincentivetomakeaneffortfortheserviceprovider);
- Argumentsagainstthisdecouplingputforward,overall,therapeuticefficiency,whichis linked to compliance and patient satisfaction, which themselves depend on thecounsellingduringthehealthcarepathway.
57BasedonUNSAFdeclarations,cf.addendum5p.19.58p.42.59Patientdeceaseshouldnotleadtoachargefortheprovider,giventhatthisruledoesn’tapplyinthewholefinancingsituationsofproviders,whateverit is(physician,dentist…).Thecasesofacentreclosureorretiringprovider,eventhoughquitemarginal,shouldleadtoatransferruleofpatientsbetweenproviders,whichcouldbeimplementedbythedesignofaclearinghouse.

43
Thesetwoclassesofargumentsrelyonfundamentallydifferentassumptions:inthefirstcase,itisimplicitlyassumedthathealthcaredemanddoesnotdependonthequalityofthefollow-up (no reputation effect, no long-lasting provider-patient relationship, no competitionbetweenproviders,providersnotbeingaltruistic).Inthesecondcase,itisimplicitlyassumedthat healthcare demand does depend on the quality of follow-up (reputation effects,durability of the provider-patient relationship, competition in quality between providers,altruisticproviders).Thisquestionofdecouplingthepricesof“apparatus-service”referstoaclassicissuein“moralrisk”situations,whereincentivebasedreasoningisrequiredinaframeworkwithinformationasymmetrybetweenthepurchaserandtheprovider60.Theanalyticalframework:
- The financing body (health care insurance) designs payment rules in order tocompensate the provider (the audiologist), expecting to pay the least for the bestquality;
- Thefinancingbody,whichcannotconsistentlycontrolprovideractivity, is facinganinformationasymmetrythatimpliesbotheffortstoachievecostreductionandeffortstoimprovequality;
- Ithastodesignapaymentrulelikelytoincitetheprovidertochoosethebest‘cost-quality‘pairing,namelythe“optimalcost”andthe“optimalquality”;
- Ithastochoosebetween3pricingrules(orevenacombinationofthe3):o Aglobalbudgetforallpatients:thisincludesthecostofthedevicesinorderto
satisfythedemand,andtheprovider’ssalarywhichdoesn’tdependondemandsize. This is the prospective payment system of the United Kingdom or inScandinaviancountries(theexpenditureisforecastexante);
o Afee-for-serviceappliedbothtopieceworkdone(solddevices)andservices(dependingontheprovider’scounsellingactivity).Thisisthedecoupledsystem,which is retrospective (payment depending on sold devices and effectiveconsultations);
o Anoverall paymentbycase/patient, beingapricingboth forapparatusandservice.Thisistheprospectivepaymentforthecombinationapparatus-serviceinFrance,GermanyorSwitzerland.
- Thesethreepaymentrulesdonotpresentthesamepropertiesintermsofcost/quality
incentives:o Theglobalbudgetallowsexpenditurecontrolandforecast.However,sincethe
provider’spaymentisnotdependentonquantityandqualityofcare,costandqualityincentivesarelacking.Therefore,he/shereduceshis/herefforttotheminimum level, translating toademand rationing (delays inequipmentandmoreover follow-up delays). In such a system, in general patients have areducedchoiceofprovider(andthus,cannotmakeuseoftheirsensibilitytoqualityinordertostimulatetheprovider)buttheyaretotallysubsidised.Theirdemandishighbecauseoftotalrefundingandtheactivityofprovidersisdrivenbytheequipmentmorethanbythefollow-up.Theconsequenceisacertain
60Cf.forexempleDranoveandSatterthwaite(2000)orMougeotandNaegelen(2011).
44
non-observance/non-compliance (devices owned but not worn) and finally,costs are higher because of the lower level of service quality (ratiosalaries/effectiveactivity);
o Thefee-for-servicepaymentpresentsanoppositesetofincentives.Itcreatestheincentivetomultiplyconsultationsandtosellpiecework.Inthissituation,theaudiologist is incentivised to sell a greatnumberofdevicesandagreatnumberofcounsellingandfollow-upconsultations.Theaudiologist’sdegreeoffreedomdependsonthenatureofdemand,regardlessofthequalityofcare,andontheinsurancecoveragerulesforthepackage:
§ Ifpatientdemandisindependentofqualityofcare:
• Ifdemanddoesn’tdependontheperceivedqualityofcare(for
example,a totallypassiveandmanoeuvrabledemand),and ifhealthcareinsurancecoverageishigh,theproviderwillsaturateitsactivitybychoosingthemoreprofitableroute:highsalesofdevices associated with little follow-up, or sales of uselessservices(induceddemand).Thesystemiscostlyforsociety;
• Ifhealthcareinsurancecoverageislow,peoplewhoarewillingto paywill be equipped andwill be frequently offered eithernewdevices,oragreatnumberofservices,whereaspeoplewhoarenot able topaywill renounce care (at least for follow-upservices,evenfordevices).Thelevelofqualitywillbeoptimalforthepeoplewhoarewillingtopay,butthissystemislikelytobecostlyandisunfair;
§ Ifpatients’demanddependsonqualityofcare:
• If patients are sensible to care quality (for example, well-informed patients), the provider cannot manipulate thembecauseherunstheriskof losinghispatients,buthewillstillhave an incentive tomultiply follow-up services if healthcareinsurancecoverageishigh(patient-providercoalition):thelevelofqualityisoptimalbutthesocialcostishigh;
• Ifpatientdemandissensibletoqualitybuthealthcareinsurancecoverageislow,thentherenunciationofcarewillremain,andthus theequipment failure is likely tobehigher (someof thepatientswillrenouncefollow-upservices,evenforequipment).The level of quality isn’t optimal because of the possiblerenunciation of care (or possible non-compliance in case ofaccess to equipment) whereas the cost of follow-up for theothersmaybehigh.
o Theoverallpaymentbycase/patientlooksliketheactualpaymentforhospitals
inFrance:itcombinestheactandserviceinanindivisibleway(forexample,
45
hip replacement or cataract). This system presents the optimal incentivesundersomeconditionsandisgenerallymoredesirablethantheotherpaymentsystems(thisiswhypublicauthoritieshavegivenuptheglobalbudgetsystemfor public hospitals and the fee-for-service system for for-profit hospitals).However,thissystemisn’tidealandisnotdefectfree.Therearealsotwocasestobeconsidered,dependingonthenatureofdemand:
§ Ifpatientdemandisindependentofqualityofcare:• If patient demand does not depend on the quality of care
(passiveandmanoeuvrable).Inthiscase,theproviderwillhavethe incentive to propose the most profitable device and toreducetheservicesthatareassociatedwithit.Effortsisreducedto the minimum level, with possible equipment failure. Ifhealthcareinsurancecoverageishigh,theproviderwillsaturatethedemandinordertobillthegreatestnumberofdeviceswiththeleastpossiblefollow-upservices;
• Ifhealthcareinsurancecoverageis low,theproviderwillhavean incentive to capture patients who are willing to pay byofferingdifferentdevicesatdifferentpricesinordertoincreaserevenue,whilereducingitsqualityefforttotheminimumlevelin terms of follow-up services. If the competition betweenprovidersispoor,itwillbeeasierfortheprovidertocapturetheclientele.This istheargumentofcriticsoftheactualcouplingapparatus-serviceinFrance;
§ Ifpatientdemanddependsonqualityofcare:• If patient demand depends on the quality of care (they are
interestedintheperceivedqualityofapparatusandservice,andare likely to renew purchases over time). In this case, theprovider will have an incentive to propose an attractivecombinationofdeviceandservice,namelythebestqualityforboth dimensions at a profitable cost for him. If healthcareinsurancecoverageishigh,theproviderwillhaveanincentivenottomultiplythefollow-upconsultationsthatwouldreducemargins,buthewillhaveanincentivetoofferenoughservicesinordertokeephisclientele,sensibletoquality.Hewillhavealsoanincentivetoproposethemostprofitabledevicesandtoreplace them quickly in time because of the largereimbursement (coalition patient-provider), thus an optimalsituationintermsofqualityandcompliancebutnotintermsofsocialcosts.Insuchacase,healthcareinsurancewouldbewelladvised to set aminimumdelay for device renewal as a firstconditionforreimbursement(forexample,5years)andaceilingsalepriceasasecondconditionforreimbursement;
46
• Ifhealthcareinsurancecoverageislow,theproviderwillhaveastrongincentivetodelivertheoptimalqualityinordertoretaincustomers,whateverthetypeofpurchasedproduct(theywilltry to drive choice towards the more profitable upmarketproducts), but the issue of renunciation of care will remain.Particularattentionhas tobepaid to thepossible strategyofdumpingandcream-skimming,whichwould introducebias tothisscheme(choiceof lessseverepatientsasbetterfromthefollow-up perspective, withdrawal of care for certain severepatients,differentlevelsofqualitydependingontheabilityorwillingnesstopay).Inthiscase,theprovidermustberequiredsatisfy demand, whatsoever it be and to impose at least aminimalfollow-upserviceforeachofclient.
In summary, the issueofcouplingordecouplinghearingaiddevicesandservices isnotasmundaneasitwouldappear.Oneofthedifficultiesencounteredbytheactualprospective‘paymentbycase’reliesonthespecific roleof theaudiologist,beingtheprescriberof thedeviceand,thus,theprescriberofthepriceofthedevice-servicepair.Toputitsimply,let’ssupposethat,inFrance,demandforhearingaidsisrelativelyawareofthequalityofcare.Thisassumption is themore reliable for 3 reasons: 1) the out-of-pocket sum is so high that itinducespatientstobeawareoftheexpenseandtosearchforinformationinordertorealiseatrade-off;2)oftheoldestpatients,therelationshipbetweentheproviderandthepatientislikelytobelong-lasting.Inacontextofcompetition,qualityandreputationarelikelytoplayanoteworthyroleinholdingasatisfyingrelationshipfortheuser,fora“experienceservice”whose quality is only known after the purchase (and where the follow-up is one of thejudgementcriteria)61;3)apositive reputationeffectderived fromthecounsellingandthefollow-upallowstheprovidertoincreasehisowndemand.The different provider’s behaviours in the three cases of payment systems, under theassumptionoftotalrefundingofpatients’demand(analternativescenarioincomparisontothecurrentsituationinFrance),wouldbecharacterisedasfollows:-Providerspaidonthebasisofaglobalbudgetorsalarieswillreducetheiractivityandqualityeffortand,aslongastheirownactivitydoesn’tdependonperceivedqualitybythepatient,theeffortissetattheminimumlevel,buttheexpenditureforequipmentiscontrolled.Thissystem is not conceivable in France since it would imply for healthcare insurance a freedeliveryofdevicesandawagesystemforaudiologists;-Providerspaidonthebasisofpieceworkandconsultationfeeswillincreasetheireffortsinquantityandquality,butthissystemwouldbecostlyforhealthcareinsurance;61In economics, an experience good or service is a good or service whose quality is only known after thepurchase.Aconfidencegoodorserviceisagood/servicewhosequalityisneverknownbythepurchaser.Asearchgoodor service is a good/servicewhose quality is knownbefore the purchase.On this topic of informationsearchingbythepatient,itshouldbenotedthattheIGAS(2014)considersthat:“attemptsbythepersonbeforethetechnicalsupportequipmentpurchaseisinitselfnon-compulsory.However,suchanobligationwouldbeparticularlyreliablefortechnicalsupportequipmentrequiringstrongpersonalisationand/orahighcost(hearingaidsconstituteagoodexampleofthese)”.p.76.
47
-Theprospectivepaymentbycase/patientofferstheadvantageofprovidingbetterincentivesfor cost reduction (not multiplying consultations) and in quality improvement (patientsatisfactionandreactivity).Moreover,itcoverstheproviderundertheriskofadistributionofheterogeneouscases(severity),costlycasesbeingcompensatedbynon-costlyones(asinthehospital pricing case), under the condition that the provider does not select the patients(withdrawalfromseverecases)ordoesnotdiscriminateagainstthem(bydifferentiatingthelevels of quality). The health insurance expenditure is controlled under the condition ofdeterminingaceiling-priceforsalesandaminimumdelayofuse.WhataretheoptionsforNationalHealthInsuranceinthecaseofaprospectivepaymentpercaseandatotalreimbursement?
- Option1–Tocoverthetotalpriceoftheequipmentbyfixingaceilingfeedependingontherange:inthiscase,allthepriceswillbeboundedbythemaximumpriceofthebest range, and so the systemwouldbe costlywith anoptimal quality anda totalcoverageofneeds;
- Option 2– To cover the total price of the equipment by fixing a bottom pricecorrespondingto thedownmarketormiddlemarketprice,by letting thepurchaserchoosethedevicesandpaythecostsoutofhisownpocket:thecostiscontrolled,thequality is optimal, andwith a coverage of needs (this system is similar to the feereferencetariffappliedtodrugs);
- Option3–Toorganisethemarket intonetworksofcontractedproviders:thisgivesthebestcontroloftariffsbutalsoariskofequalisationbetweenadropintheproductpriceandanimplicitincreaseinqualityprice(i.e.areductionoffollow-upqualitythatwouldresultfromthepatient’sstatuswhoiscaptivebecauseofhisinsurancecontract,exceptiftheinsurancecompaniesmadetheprovider-networkscompeteeachyearonthebasisofpatientsatisfaction,thatisaccordingtoaquality/priceratio,inordertoconcludeagreements).Thisoptionisconceivablebutiscostlyintermsofinformationsearchingandregulation.
Startingfromanefficiencypointofview,andassumingthattheissueofequityissolvedbysocialsubsidisingofequipment,option2appearstobemoredesirable,oracombinationofoptions2and3.Internationalcomparisonsshowthatingeneralthegoodsandtheserviceareindivisible,butthatcomplianceandpatientssatisfactionarequitevariable,dependingonfinancingrules,therangeofprosthesesandthefollow-upservice(whichisrelatedtoaccessrulesandpaymentrules in the health system). As will be shown, this comparative analysis for people beingequippedwithhearingaidsseemstodemonstratetheexistenceofalinkbetween,ontheonehand,compliance/patients’satisfactionand,ontheotherhand,hearingaidfinancingschemesandtypesofaudiologistfollow-up.

48
1.3 Hearinglossprevalence,hearingaidaccessandpricingincomparablecountriestoFrance
Theaimofthissectionistocompletethepreviousoverviewwithsomekeyreferencesandforseveralcomparablecountries.Theaccessrateishearingaidsisstudiedinparticular,onthebasisofcross-referenceddatarelatingtotheobservedaccessrate,thecompliancerateandtherealrateofeligibilityforhearingaids.
1.3.1 Hearinglossprevalence,equipmentrateandaccessratetohearingaidsInternationalcomparisonsrelyonEurotrakdata(EHIMA,2015)gatheredfrompanelsurveys(table19).InFrance,itshouldbeunderlinedthattheestimatedprevalencerateofhearingloss is very close to the previous data: Eurotrak survey assess it to be at 10.4% in 2009(whereastheDREESestimationin2008rangedbetween11.2%asfor‘disablinghearingloss’and8.6%asformoderatetototalAFL.Incontrast,therateofhearingaidownerswashigherin2009(3.1%)comparedtotheDREESestimation(1.8%in2008)andlowerin2012(2.8%)comparedtotheESPSsurvey(3,7%).Theaccessratetohearingaidsisestimatedtobe34.1%in2015(cf.supraregardingthevariabilityofestimations).Hearinglossprevalencerateacrossthecomparedcountriesisverysimilar,rangingfrom8%(Switzerland)to12.1%(Germany).
Table20–Estimationsforhearinglossprevalencerate,equipmentrate,andaccessratetohearingaids–Eurotraktriennialsurveys(2009,2012,2015)
Source:AuthorsonbasisofEHIMAdata,2015
Eurotrack Surveys% Binaural equipment
Country/Year 2009 2012 2015 2009 2012 2015 2009 2012 2015 last year available
France 10.4 9.4 9.3 3.1 2.8 3.2 29.8 30.4 34.1 70
United Kingdom 9.5 9.1 9.7 3.7 3.7 4.1 38.6 41.1 42.4 61
Switzerland nd 8.8 8 nd 3.4 3 nd 38.8 41.4 72
Italy nd 11.6 11.7 nd 2.9 3 nd 24.6 25.2 57
Japan nd 10.9 11.3 nd 1.5 1.5 nd 14.1 13.5 46
Germany 13.1 12.5 12.1 4.2 4.2 4.2 31.8 34 34.9 75
Denmark nd 10 nd nd 4.8 nd nd 47.8 nd 82
USA 11.3 nd nd nd nd nd 24.6 nd nd nd
Norway nd 8.8 nd nd 3.7 nd nd 42.5 nd 74
HL prevalence rate (in % of total population)
Equipment rate (in% of total population)
Access rate for HAs (in % of hearing impaired people)

49
However,thehearingaidequipmentratevariesbyafactorof1to3,Japanbeingtheleastwellequippedcountry(1.5%)andDenmarkthebest.Thisvariationisalsofoundinthehearingaidaccessrateforhearingimpairedpeople,itisparticularlylowinJapan(13.5%),quiteweakinItalyandtheUSA(around25%),mid-pointinFranceandGermany(about34%)andhighintheUnitedKingdom,SwitzerlandandespeciallyinDenmark(47.8%).Thus,Denmarkwillbeusedinthisstudyasthereferencevaluetarget,evenifthisisonlybasedononeyear’sdata(2012).Moreover,theshareforbinauralequipmentishighastheaccessrateishigh.TheanalysisofGodinho(2016)comparesobservedsalesinnineEuropeancountries,gatheredin2011fromtheEuropeanmarket,withthedemographicdata62.Heidentifies3groupsofcountries:
- Thosewheretheequipmentrateislowerthan5/1000inhabitants(Italy,Spain).TheOOPdoesnotsufficetoexplainthepooraccess level,cultural factorsalsotoplayapart;
- Thosewheretheequipmentraterangesbetween5and11/1000inhabitants:Belgium,France,Switzerland,Germany.Thecoverageforhearingaidsisquitesimilarinthesecountries (if we consider the additional role of complementary health insuranceswhichisnotincludedintheFrenchfinancingreferencechart).ItshouldbenotedthatthesehealthsystemsarepredominantlyBismarckorganisations(i.e.SocialInsurance)exceptinSwitzerland(regulatedliberalorganisation);
- Thosewheretheequipmentraterangesbetween18and23/1000inhabitants(UnitedKingdom,Norway,Denmark),namelycountriesunderNationalHealthSystemswithatotalornearlytotalrefundingforhearingaids.
Figure1–Salesofhearingaidsfor1,000inhabitantsin2011
Source:Godinho,2015/2016
Thesestrongdifferencesaskforanin-depthstudyofhearingaidaccess.
62Themarketanalysisreliesonasurveywhichisavailableonline(Grant-Salmon,2013)anddemographicdataareextractedfromtheEuropeandatabaseEurostat.

50
1.3.2 Estimationoftherealaccessrateforhearingaidsdependingontheeligiblepopulationandoncompliance
Startingfromtheformerpreviousdata(section1.1and1.2),fromtheEurotraksurveydataand using the same assessment methodology as Alcimed-CNSA (2009), it is possible toproposeanestimationfortherealaccessratedependingontheeligiblepopulationandoncomplianceinthecomparedcountries.The Alcimed-CNSAmethodology is as following: given the existing different definitions ofhearinglossinEuropeancountries,thestudyappliesauniformrateofhearingimpairmentof12%, in order to deduce the eligible population (the rate of 50%of the hearing impairedpopulationistheconsensualreferenceaccordingtoexperts)and,then,toestimatetherateofhearingaidowners(here,“effectiveaccessrate”).IntheAlcimed-CNSAstudy,twomethodsarecompared,taking(ornot) intoaccounttherealrateofusers(excludingthenumberofpeopleowninghearingaidsbutnotwearingthem)63. Inourstudy,wecombineboththesepreviousmethodsusedbytheAlcimed-CNSAinordertorealiseanestimationoftheequippedpopulation, who wear their hearing aids (more than one hour a day), as these data areavailableintheEurotraksurvey2015(cf.tables21and22).However,wedonotnormalisetheprevalencerateat12%,butweretaintheobservedprevalencerate ineachcountry inordertobetter integratethenationaldefinitionsofhearing lossandhearingaideligibility.Theseestimationsarepresentedintable21.
Table21–Estimationoftheeffectiveaccessrate
*InGermany,thecompliancerate(notavailable)isestimatedonthebasisofitsmainsurvey(2015)andisnormalisedatthesamelevelasforFrance,givensimilardataandgiventhecomplianceratein2009(15%oftheequippedpopulation).
Source:AuthorsonbasisofEHIMAdata,2015Resultsofthisestimationwhichshouldbenoted:
- EffectiveaccessratesthatarenotablyhighinUnitedKingdom(85%),Denmark(85%)andNorway(85%)approachthetotalcoverageofneeds,whichcanbeexplainedbyfree access (or almost free access in Sweden) for downmarket or middle-markethearingaids,wherepricesareslightlylowerthanthoseinFrance;
63Estimatedequipmentrates (outofcompliance)were:69% inSweden,84% in theUnitedKingdom,50% inGermany,16%inSpain,27%inItaly.Thestudyunderlinesthattheseratesdon’ttakeintoaccountcompliancewhereasarateof45%isobservedintheUnited-Kingdomamongownerswhodonotweartheirhearingaids.

51
- The effective access rate in France rises to 68%: it means that 2/3 of the eligible
populationisequipped,andthustheremainingnumberofpeoplewhoshouldhaveaccesstohearingaidsisaround1million(basedonpreviousestimations),amid-ratelevelwhichcanbeexplainedbythefinancialbarrier;
- Nevertheless, the compliance rate (estimated as the rate of people wearing their
hearingaidsmorethananhouraday)issecond-rateinthe3countriesassociatedwithahigheffectiveaccessrate(compliance/UK:80%,DK:81%andNW:76%),hencetherealaccessratesareobviouslylower:69%,76%and65%.Thesecountrieslose15%to20%ofhearingaidowners in theestimated real access ratebecauseof thisquasi-renouncementofequipmentwear;
- Atthesametime,thecompliancerateisparticularlyhighinFrance(90%),Switzerland
(88%)andGermany(90%).Thesehighrateshavelessimpactontherealaccessrateincomparisontothepreviouscountries;
- Asaconsequence,realaccessratestendtoconverge,butfordifferentreasons:onthe
onehand,higheraccess–becausefreeaccess-butassociatedwithlowercompliance,ontheotherhand,loweraccess–becausecostlyaccess–butassociatedwithhighercompliance. These rates range between 61% to 76% of equipped and compliantpatients,Francehastheworstscore(apartfrompeculiarcasessuchasJapanandItaly).
- IfFrancehadDenmark’seffectiveaccessrate(96%),itsrealaccessratewouldbe86%,
whichwouldgiveitthebestobservablerateofallthecountriesthankstocompliance;
- OnlySwitzerlandcombinesahighaccessrateandasatisfactorycompliancerate;
- AsforJapan,itcombinesalowaccessrateandapoorcompliancerate64,whereasItalycombinesamiddlingaccessratewithaverysatisfactorycompliancerate.
Takenthus,Francepresentsareal rateofusecloseto61%(combiningtherateofeligiblepeopleforhearingaidsandtherateofeffectiveuse),aratesimilartothoseoftheUnitedKingdom,GermanyandNorwayandstartingfromverydifferentsituationsintermsoffinancialaccesstoequipment.IfthereisroomforimprovementinFranceregardingtheneedforhearingaidequipment–duetofinancialimpediment-thereisalsoroomforgrowthincountrieswherehearingaidsare(almost)freelydeliveredbutwherethecomplianceisinsufficientlyperformant.Areview
64Thiscouldbeexplainedbyacombinationofdevicequality(downmarketproducts)andfollow-upquality(oftenpoor):indeed,onethirdofpurchasesweremadebymailorderedinopticians’shops(EurotrakJapan,2012).Itmustbenotedthatsincethedecreeof13August2014(modifyingthedecreeof15February2002)fixingthegoodsthatpharmacistsareallowedtodispense;theyareentitledtosell“assistantsforhearing”pre-setatamaximumpowerof20dB.Thisequipmentisthensoldfreelyinpharmaciesover-the-counter,atalowerpriceof500euros(ingeneral300euros).TheyareusefulforpatientswithaslighthearinglossandoughttobeusedoccasionallyaccordingtotheGeneralDirectoryforcompetition,consumptionandfraudrepression(“Directiongénéralede laconcurrence,de laconsommationetde la répressiondes fraudes” (www.economie.gouv.fr -8March2016).

52
offinancialrulesrelatingtohearingaidshastoconsiderthecompliancefactorsdeterminingtheeffectiveuseofequipmentand, thus, the levelof satisfaction forhearingaidusers.Atrade-offhastobeundertakenbetween,ontheonehand,financialaccessand,ontheotherhand,suppliers’andusers’commitmenttohearingaiduse.
1.3.3 DeterminantsofaccesstohearingaidsTheEurotraksurveyallows foramorepreciseanalysisof the reasons leading toaccessorrenouncementofhearingaids(table22),basedonqualitativestatements.Itshouldbenotedthat:
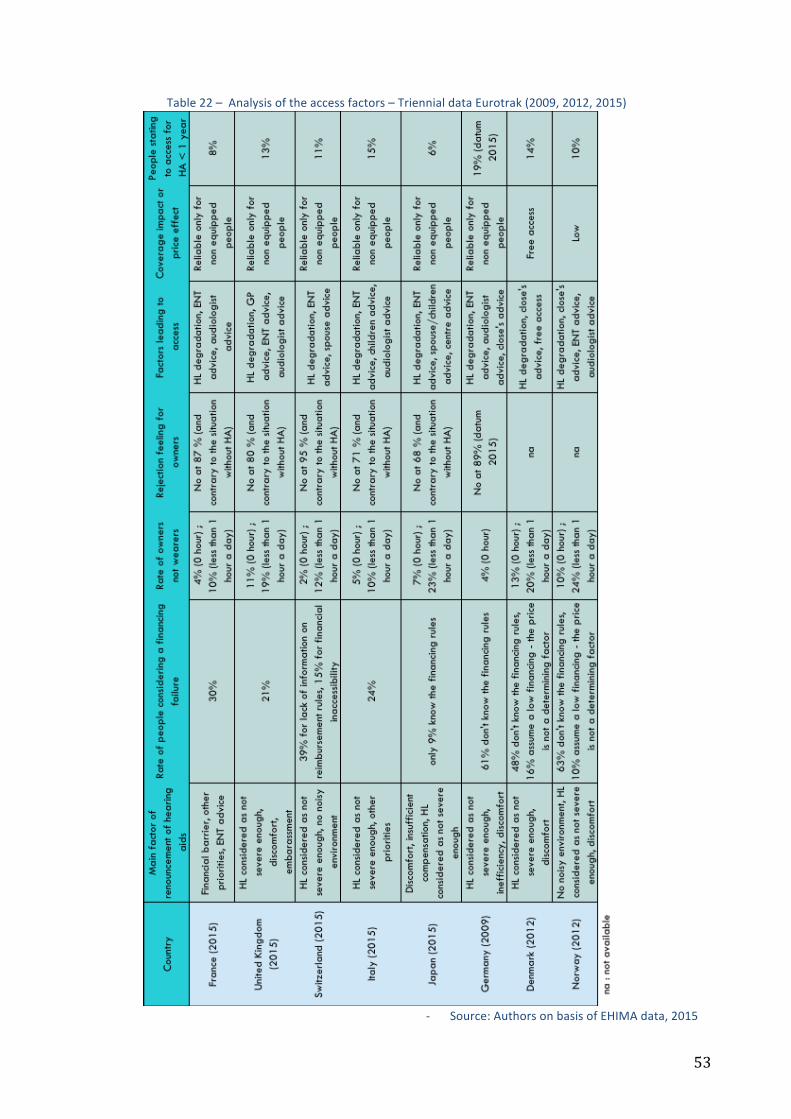
53
Table22–Analysisoftheaccessfactors–TriennialdataEurotrak(2009,2012,2015)
- Source:AuthorsonbasisofEHIMAdata,2015
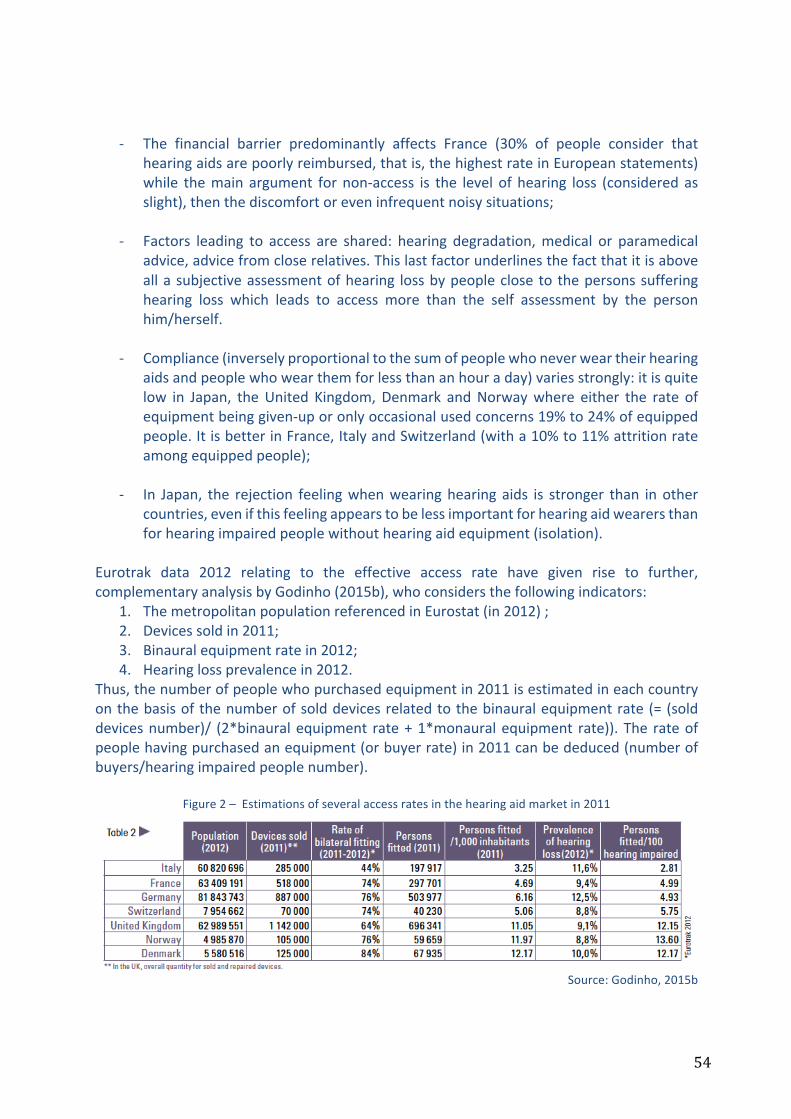
54
- The financial barrier predominantly affects France (30% of people consider thathearingaidsarepoorlyreimbursed,thatis,thehighestrateinEuropeanstatements)while themain argument fornon-access is the level of hearing loss (consideredasslight),thenthediscomfortoreveninfrequentnoisysituations;
- Factors leading to access are shared: hearing degradation,medical or paramedicaladvice,advicefromcloserelatives.Thislastfactorunderlinesthefactthatitisaboveallasubjectiveassessmentofhearing lossbypeopleclosetothepersonssufferinghearing loss which leads to access more than the self assessment by the personhim/herself.
- Compliance(inverselyproportionaltothesumofpeoplewhoneverweartheirhearing
aidsandpeoplewhowearthemforlessthananhouraday)variesstrongly:itisquitelow in Japan, theUnited Kingdom,Denmark andNorwaywhere either the rate ofequipmentbeinggiven-uporonlyoccasionalusedconcerns19%to24%ofequippedpeople.ItisbetterinFrance,ItalyandSwitzerland(witha10%to11%attritionrateamongequippedpeople);
- In Japan, the rejection feelingwhenwearinghearing aids is stronger than inother
countries,evenifthisfeelingappearstobelessimportantforhearingaidwearersthanforhearingimpairedpeoplewithouthearingaidequipment(isolation).
Eurotrak data 2012 relating to the effective access rate have given rise to further,complementaryanalysisbyGodinho(2015b),whoconsidersthefollowingindicators:
1. ThemetropolitanpopulationreferencedinEurostat(in2012);2. Devicessoldin2011;3. Binauralequipmentratein2012;4. Hearinglossprevalencein2012.
Thus,thenumberofpeoplewhopurchasedequipmentin2011isestimatedineachcountryonthebasisofthenumberofsolddevicesrelatedtothebinauralequipmentrate(=(solddevicesnumber)/ (2*binauralequipment rate+1*monauralequipment rate)).The rateofpeoplehavingpurchasedanequipment(orbuyerrate)in2011canbededuced(numberofbuyers/hearingimpairedpeoplenumber).
Figure2–Estimationsofseveralaccessratesinthehearingaidmarketin2011
Source:Godinho,2015b

55
TheauthorestimatestheratiobetweentheobservedaccessrategivenbyEurotrak(numberof users/number of hearing impaired people) to the buyer’s rate, in order to deduce acomplianceindex.
Figure3–Estimationofancomplianceindex
Source:Godinho,2015b
This compliance index is equal to the inverse of the new purchases rate for the wholepopulationofhearingimpairedpeopleowninghearingaids.Theimplicitassumptionoftheauthoristhefollowing:if,asinDenmark,25%ofhearingaidsownerspurchasenewdevicesin2011,andgiventheaveragelifespanofadevice(5years),thewholeeligiblepopulationshouldbeequipped,evenincludingnewbuyersonthemarket.Yet,thehearingaidaccessestimatedby Eurotrak shows that the latter is less then forecast regardingmarket devicepenetration.Theauthordeducesthataportionofpopulationrenouncesitsequipment,anddoesn’tevenstatethatitownsthem(maybeafterhavingbeenequippedandgivenup).ThesamereasoningappliesintheUnitedKingdomwherewithdrawalwouldbehighcomparedtothe French compliance index. This reasoning brings into light another explanation of thecomplianceissue,sinceitconsidersthatarapidrotationrateofdevicesisareliableindicatorofcompliancebyincluding‘desertion’:ahighratewouldresultnotonlyfromatotalrefundingofhearingaidsbutalsofromsignificantdesertion.From our point of view, other factors might be behind this explanation: free provisionencourages rapid replacement of hearing aids, especially if they are downmarket devices,usersbeingwillingtoaccessapresumedbetterqualitynewdevices;andeven,freeprovisioncreatesademandforwhichhearingaidsarenotsuited,anassumptiontobeinvestigated.
1.3.4 Theroleofhealthsystemsinhearingaidaccessandperceivedefficiencybyusers
ThepriceofahearingaidonthewesternEuropeanmarketisverysimilar,butcoverageinFranceisremarkablypoor(table23).TheaveragepriceontheFrenchmarketisslightlyhigherthaninothercountries,theaveragebottomoftherangepriceissimilarandtheaveragetopoftherangepriceislower,sothereisastrengtheningofsalespricesbetweenthe3linesinregardtoothercountries.
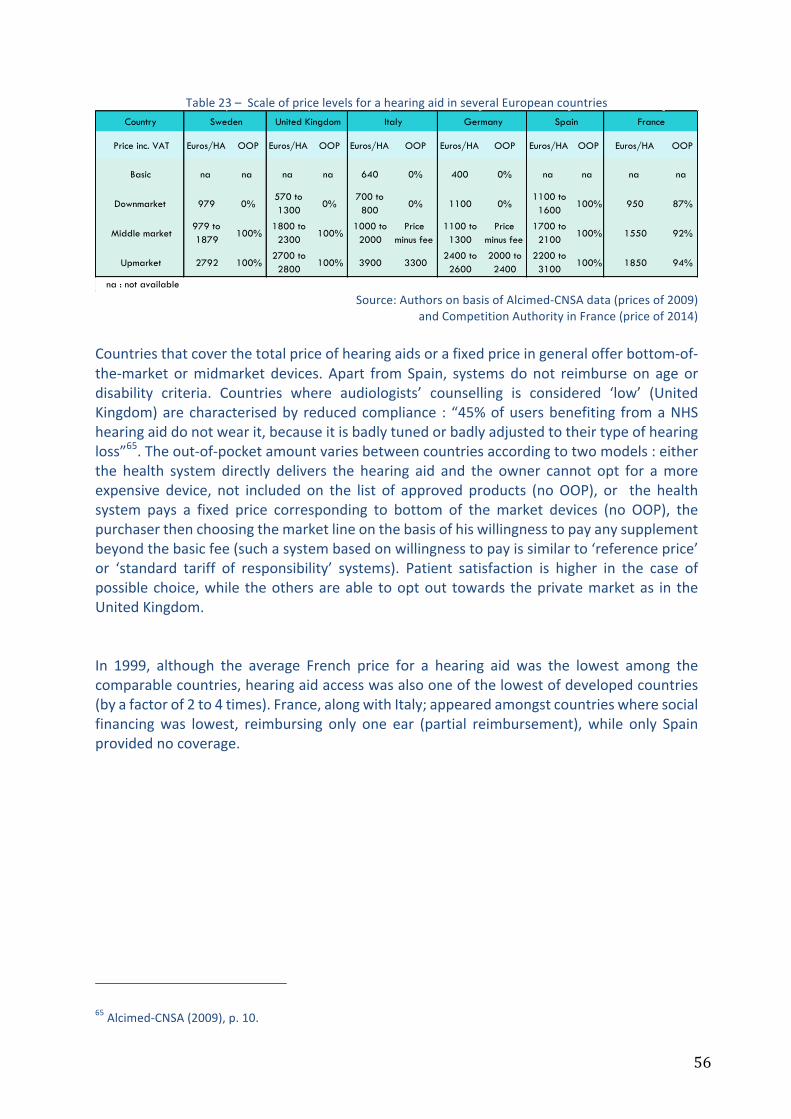
56
Table23–ScaleofpricelevelsforahearingaidinseveralEuropeancountries
Source:AuthorsonbasisofAlcimed-CNSAdata(pricesof2009)
andCompetitionAuthorityinFrance(priceof2014)Countriesthatcoverthetotalpriceofhearingaidsorafixedpriceingeneralofferbottom-of-the-market ormidmarket devices. Apart fromSpain, systemsdonot reimburse on ageordisability criteria. Countries where audiologists’ counselling is considered ‘low’ (UnitedKingdom)arecharacterisedby reducedcompliance : “45%ofusersbenefiting fromaNHShearingaiddonotwearit,becauseitisbadlytunedorbadlyadjustedtotheirtypeofhearingloss”65.Theout-of-pocketamountvariesbetweencountriesaccordingtotwomodels:eitherthe health system directly delivers the hearing aid and the owner cannot opt for amoreexpensive device, not included on the list of approved products (noOOP), or the healthsystem pays a fixed price corresponding to bottom of the market devices (no OOP), thepurchaserthenchoosingthemarketlineonthebasisofhiswillingnesstopayanysupplementbeyondthebasicfee(suchasystembasedonwillingnesstopayissimilarto‘referenceprice’or ‘standard tariff of responsibility’ systems). Patient satisfaction is higher in the case ofpossiblechoice,while theothersareable tooptout towards theprivatemarketas in theUnitedKingdom.In 1999, although the average French price for a hearing aid was the lowest among thecomparablecountries,hearingaidaccesswasalsooneofthelowestofdevelopedcountries(byafactorof2to4times).France,alongwithItaly;appearedamongstcountrieswheresocialfinancingwas lowest, reimbursing only one ear (partial reimbursement),while only Spainprovidednocoverage.
65Alcimed-CNSA(2009),p.10.
Country
Price inc. VAT Euros/HA OOP Euros/HA OOP Euros/HA OOP Euros/HA OOP Euros/HA OOP Euros/HA OOP
Basic na na na na 640 0% 400 0% na na na na
Downmarket 979 0%570 to 1300
0%700 to 800
0% 1100 0%1100 to 1600
100% 950 87%
Middle market979 to 1879
100%1800 to 2300
100%1000 to 2000
Price minus fee
1100 to 1300
Price minus fee
1700 to 2100
100% 1550 92%
Upmarket 2792 100%2700 to 2800
100% 3900 33002400 to 2600
2000 to 2400
2200 to 3100
100% 1850 94%
na : not available
FranceSweden United Kingdom Italy Germany Spain

57
Table24–Comparisonofthepriceandreimbursementrulesforadigitalhearingaidinseveralcomparablecountriesin1999(infrancs)
Source:Conseilnationaldelaconsommation,2000
Thepricelevel,thedegreeofcoverageand/orthemarketlineofdevicescouldhaveanimpacton its median lifespan, although this only appears as a trend and is not systematicallyobservable (table 25). In France, themedian lifespan is 6 years, whereas in the United-KingdomandDenmarkitis4years.Foractualhearingaidusers,thedailytimeofuseis8to9hours. It shouldbenoted that thisdaily time inDenmark is incontrast to thegiven-uporoccasionalrate(20%):thedistributionanalysisofthetimeofuseinhoursshowsthat2typesof population are concentrated at the extremes, the non-compliant users and the verycompliantusers(cf.EurotrakDK,2012,p.56).
Table25–Comparisonofindicatorsofequipmentlifespanandondailylengthofuse
Source:AuthorsonbasisofEHIMAdata,2015
As regards overall satisfaction, the survey shows that France has the best rateswith 84%satisfiedusers(comparablerateswithSwitzerland).TheseratesareclearlybetterthanthoseofGermany,theUnitedKingdom,DenmarkandNorway,andtheyarealsoreliablewiththecomplianceratestatedinourstudy66.
66OurstudyfurtherexploitsthemoredetailedresultsoftheEurotraksurveyasforsatisfactionandqualityoflife.
Netherland 11390 Socialsecurity:3800F(2ears)
Switzerland 13500 75%forretiredpeople,100%forworkingpeople(2ears)
USA 21000 Privateinsurances
Germany 11200 80%(2oreilles).
Spain 12400 Noreimbursement
Italy 12400 670F(1ear).
France 9000to10000 1310F(1ear
CountriesPricefora
hearingaidinfrancs
Reimbursementrules
Indicators Median lifespan of a HAAverage age of equipment (at the
time of the survey) Daily length of use in hours
Country Last year available Last year available Last year availableFrance 6 2.9 8.6
United Kingdom 4 2.1 8.1Switzerland 6 2.1 9,0
Italy 4 2.5 8.4Japan 5 4.1 6.8
Germany 5 na naDenmark 4 4.1 9.2Norway 6 2.7 7.9
na : not available

58
Table26–Overallsatisfactionofusers(7possibleanswers,from‘veryunsatisfied’to‘verysatisfied’:
satisfaction=totalof3satisfactiongroups–enough,well,verywell)
Source:EHIMA,2015
As underlined by the IGAS (2013), it is best to remain careful when interpreting thissatisfaction score,whichalso reflects socio-culturaldifferencesandcollectivepreferences.Similarly, a score function cannot be transposed fromone country to another, and in theframeworkofaqualityoflifeassessmentwhichreliesonapreference-basedquestionnaire(such as EQ-5D or HUI3), it is tricky to compare these rates that do not cover the samecollective preferences regarding health status. It would be more interesting to observe,countrybycountry,preferencevariations,butdataareinsufficienttostateatrend.Empirically,itishoweverinterestingtounderlinethepresumedlinkbetweenthecomplianceindex (inverse of equipment rotation rate for the eligible hearing aid population) and thesatisfactionrate(Godinho,2015b).Theauthorlinkedthisindexwiththeoverallsatisfactionratein2012.ApartfromItaly,heobservedacloserelationshipbetweensatisfactionrateandcompliance rate: where the satisfaction rate drops from 80% (France) to 72% (UnitedKingdom),thecompliance index is2times lower.Twogroupsofcountriesare identifiable:Switzerland-France-Germany characterised by both a performant satisfaction rate andcompliance index; the group Norway-Denmark-United Kingdom where a less performantsatisfactionrateisassociatedwithlesscompliance.Italyhasauniqueposition(withahighcomplianceindexandmiddlingsatisfaction).Thispositionisduetoabiasinthecomparison,becausethebinauralequipmentrateislow(44%)andtheaccessrateparticularlylow.Thecompliance would remain high for equipped people, because of insufficient access (OOPremaininghigh);thechoicewouldbedriventowardsbasicordownmarketdevicesgiventhecoverage(zeroOOPinthesecases),explainingonlymiddlingsatisfaction.Asregardsthetwocriteria(compliance/satisfaction),thebestgroupisSwitzerland-France-Germany:thisanalysisreinforcesthepreviousapproachintermsofrealaccessrate.The international comparison of Alcimed-CNSA (2009) which focused on traditionally‘Beveridge-type’countries(Sweden,theUnitedKingdom,Italy,Spain)anda‘Bismarck-type’country(Germany)showedmoreoverthatequipmentrateswerenotonlydependentonthefinancing system but also on cultural factors (southern countries more often renouncingequipmentseenasadisabilityindicator),orelseofusers’lackofinformationorthedevicetype(downmarketetc.).

59
Startingfromtheirstatementsandfromouranalysis,themainelementstobeunderlinedarethefollowing:
- Theoptimalequipmentrateineachcountryisnotasstandardisedasinthepreviousestimations (for example 50% of hearing impaired people, because of culturaldifferences between countries, or medical advice or social disability perceptions).Moreover,thisrateislikelytochangeovertime.Thisstatementslightlyrestrictsthesignificanceofourestimations;
- ArefundedaccessinFrancewouldinvolvechangingthesysteminapoliticallyradical
direction and,moreover, it has been observed that free access in National HealthSystemsisassociatedwithalowercomplianceandsotoalowerefficiency(aweakerresult): it is not possible to state if this is a consequence arising from lower usercommitment,orifitisaneffectofintegratedsystemswhichassociatefreeaccesswithaccessrationing(itisapossibleexplanationofinsufficientadaptationandfollow-upsbyaudiologist),orevenifitisanimpactofhearingaidquality(downmarketandmid-marketones).Theassumptionofalackofinterestinfollow-upsaudiologistsand/ororganisationalbarrierstofollow-upaccessshould-befavouredhere67;
- Theissueofdecouplingthedeviceandtheservicebymeansofseparatepricingcannot
bediscussedregardingothercountriesincludedinthecomparison.Indeed,itwouldbenecessarytoinvestigatethisquestionbyitself.Ingeneral,bothactivitiesarenotdissociated in western European countries (Alcimed-CNSA, 2009). If they wereseparated, the compliance rate would be affected since the follow-up service isassociatedtoanOOPforpatients.Moreover,itwouldprobablygenerateanextracostintermsofbusinessactivity(relaunches,induceddemand),thatwouldbepassedoninprices,associatedwithariskofactivitydeviatingfromvariouspatientneedsandwhichfocusedinsteadontheirabilitytopay.Aconventionalboundedminimalpricefor middle-market hearing aids, identical in every place, including the service, isprobablyamoredesirablepathwayforusers;
- Thedevicelifespanvariesbetweencountries,whichhasanimpactontheoverallcost
forseveralyears.This lifespancertainlydependsonfinancingrules(it isreduced incountrieswherecoverageislarge)orontheinitialinvestmentcost(thechoiceofanupmarketdevicemaybeassociatedwithalongerlifespanasinFrance);
- Overallusersatisfactionvariesbetweencountriesyetisquitecomparable(apartfrom
Japanesepeoplewhomsubjectiveassessmentofhealth status is structurally lowerthanthoseinothercountries–OCDE,2015).Thissatisfactionrateseemstobelinkedtothecompliancerate,andsoprobablytotheaudiologists’counsellingservice,sincethedeviceperformancesarelikelytobesimilaraccordingtowhatexpertssay(cf.infra,section4).Themarketlineofdevicesmayalsoplayarole;
67Inaccordancewithourpreviousanalysisonhearingaidpricing.
60
- Itisimportantthattheusercaninfinechoicetheirpreferreddeviceinordertosustainabettercompliance(thankstoafixedpriceusers’preferencesandtheirwillingnesstopay).Ahigherreimbursementofdownmarketormiddlemarketdevicesensuresuser’ssolvencyandallowsthistrade-off;
- Compliance depends closely on device suitability to needs, which relies on the
audiologist’srole(however,biasinthiscounsellingandadviceispossibleinthecaseindependent,nonstate-salariedpractitioners);
- Compliancedependscloselyonadaptionandfollow-upand,thus,imposetodeliver
informationnexttotheuser,aboutthedeviceandtheadded-valueofaudiologist’scounselling(thataremoreoftenbilledonanexantebasisinallthecountries);
- the added-value of upmarket devices should be more fully discussed in scientific
literature,inordertodissociatetheeffect‘hightechnology’andtheeffect‘qualityofservice’inpatientsatisfaction.Accordingtothedifferenthearingaidmarketlines,theissue of lack of information about added-value is a major impediment in theassessmentoftheirrelativeutility;
- geographicalaccessibilityofhearingaidcentresaswellasaccessdelaystofollow-up
appointmentshavetobeanalysedthroughtheissuesofcomplianceandcounselling.It isalsonecessarytostudyaccessviareferencesfrompriorconsultationswithENTphysiciansandgeneralpractitioners(andparticularlythemedicaldemography);
- the lack of information and monitoring a posteriori of ENT’s or GP’s medical
recommendations and advice is a common feature in countries, which limits thepossiblefieldforequipmentassessment.
The significant growth of equipment rate in France during the last few years seems todemonstratetheimpactoftechnologicalimprovementonthepreferencesofeligiblepeopleforhearingaids:
- theyincreasinglyaccesshearingsaidsdespitethepricetopay;- hearingaidminiaturisationandtheirlow-visibilityleadstobetteraccessandmakeit
commonplace,evenforyoungerpeoplewiththespreadofconnectedhearingaids.The main obstacle to hearing aid access in France (financial barrier) questions currentfinancingrules,andparticularlythepublictrade-offsthathaveledhearingaidstobeclassifiedin the ‘low risk’ category and practically out of socialised health care. This classificationimplicitlyindicatesthatthehearingaidisaluxuryproductwhosemedicaladded-valueisverylow: incomparisontothetrade-offsfordrugclassification,thehearingaidmedicaladded-valuerangesbetween‘low’and‘insufficient’,sinceitsobservedreimbursementrateisunder15%.Yet,wideaccesstohearingaids(2/3intermsof‘realaccess’oftheeligiblepopulation)showsclearlythatdemandelasticityislow:theyareanecessaryitem.Ingeneral,thepublicchoiceof coinsurancedependson the combinationof ‘low risk’ and ‘commitment’. There is onlypartialreimbursementinrelationto‘lowrisk’,oreventotallyexcludedfromthesocialhealthcarebasketwhenitdoesnotdependonthecollectiveresponsibilityandimpliesanindividual

61
judgement on the trade-off consumption-price (in order to avoid over-consumptionor, ineconomics, the ‘moral hazard’ risk). Yet, not only is access significant despite the OOPpayment,butmoreover–contrarytooptics–itshealthconsequencesaswellasitseconomicimpact are likely tobemajor. The cost to societyof hearing aid renunciation, in termsofquality of life, expenditure and social inequalities is in total opposition to the objectivesassignedtotheFrenchhealthsystem.Thesurveyofscientificliteraturewhichfollowsinthenextsectionwillshedlightonthelinkbetweenhearinglossandpeople’smorbidity-mortalityrate,allowingtoestimatetheburdenofillness.
62
2 Healthandeconomicconsequencesofhearingloss:impactstudy
Nowadays,hearinglossisconsideredasamajorpublichealthissueinthescientificliteratureandbyinternationalhealthagencies.TheWorldHealthOrganisation(WHO,2016)estimatesthattheburdenofillnessactuallyconcernsmorethan5%oftheglobalpopulation,namely360millionpeople,andonethirdofthepopulationagedover65,withadominantprevalenceinlow-andmiddle-incomecountries68.Sincehearinglossprevalenceisrisingwithage,actualageing of the global population would else increase this prevalence, with an over-representationofmoderatetototalhearingloss.It is themost frequentsensorydeficiency, leadingtoagreatdegradationofqualityof life,whichisassociatedwithsubstantialeconomicandsocietalcosts.Themainconsequencesofhearinglossareduetothedecreaseincommunicationandhumaninteraction,whichhasanimpactuponmental,psychologicalandcognitivedimensionsof theperson’shealthstatus.These consequences have been known for a long time, as in 2006 Shield reviewed them,showing that psycho-social effects were already being referred to in1979. The maindimensionsofwell-being (in the actual assessable sense, namelyhealth state,wealth andeducation/qualification level) affected by hearing loss and referenced by the author are:global qualityof life; loneliness, social isolation andexclusion; psychiatric disturbanceanddepression; family relationships; stigma and low self-esteem; education; difficulties inparticular environments; general health estimated in terms of doctor’s consultations;cognitive skills and dementia; memory loss; intimate relationships; prejudice and abuse;employment;allthesedimensionsarealsoassociatedwithdenialforafractionofimpairedhearingpeople.Causalrelationshipsbetweenhearinglossandeachofthesedimensionsarebetterrecognisedandquantifiedintherecentliterature.Givethatthisthisliteratureisabundant,weproposeasurvey of the main papers on this topic (and not a systematic review of the scientificliterature).Moreover,wehaveselectedpapersspecificallyfocusedontheelderly,butwithaspecific inclusion of papers questioning the link between hearing loss and professionalsituationsfortheadultworkforce.
2.1 Observed scientific connections between hearing loss and morbi-mortalityinadultsandelderlypopulations
Intheinternationalliterature,numerouspapersstudytheconnectionbetweenhearingloss–one of themost frequent chronic health status for elderly – and severalmorbi-mortalityindicators. Thus, hearing loss is independently associated with mortality, heart attack,ischemicheartdisease,diabetes, and smoking69.Also, it is established thathearing loss is
68TheWHO(2016)defineshearinglossasanimpairmentimplyingat leasta lossof40dBinthebestearforadultsand30dBforchildren.69Theindependentassociationmeansherethatageimpacteffectiscontrolled.

63
associatedwithfunctional,physicalandpsychosocialdeficiencies,orelsewithalowerqualityoflife,anincreasedriskofinstitutionalisation,falls,cognitivedecline,carcrashes,andevenlesserabilityforpersonalhealthempowerment70.Inotherwords,theburdenofillnessislikelytobeheavierforhearingimpairedpeople,notonlybecauseofthehearingdegradationwhichdecreasescommunicationcapacities,butalsoforassociatedmorbi-mortality.Intheliterature,theconnectionsthataremostlyrecordedfortheelderlyandforwhichapresumedcausalityisstated,concernmortalityrisk,mentalhealthdegradationandcognitivedecline.Hence,ourreviewwillbeprimarilyfocusedontheseissues.Secondly,wewillbringuptheconnectionbetweenhearingloss,labourmarketintegrationandsocialrelationships/leisureactivities.
2.1.1 HearinglossandassociatedlimitationsinFranceIn order to assess theextent towhich activity restrictions (daily, professional and leisure)dependonauditivefunctionallimitations(AFL,cf.supra),itisimportanttodifferentiatethelatter fromother associateddeficiencies and functional limitations. This analysis hasbeendrivenbytheDREES(Haeusleretal.,2014;HaeusleretMordier,2014),whichdistinguishes,on the one hand, deficiencies associated with AFL and, on the other hand, functionallimitations–apartfromauditiveones-relatedtothesedeficiencies.
2.1.1.1 AssociateddeficiencieswithhearinglossIn2008,givenasimilarageandsex,77.4%ofpeopleaffectedbymoderatetototalAFLstatedthat theyhadat leastoneanotherassociateddeficiencyapart fromauditive,beingeithermotor,visual,intellectual,cognitive,orother(against63.3%inthegeneralpopulation).Thisrateisclearlydifferentsincemoderatevisualdeficiencies71areexcludedfromthefield,giventhat they almost equally concern both populations (i.e. moderate to total AFL / generalpopulation):indeed,68%ofpeopleaffectedbymoderatetototalAFLdeclared,in2008,thattheyhadanassociateddeficiency,against37%ofthegeneralpopulation.Themostsignificantgapsthatcanbeobservedregardingthestandardisedrateare:
- Motordeficiencies:35.1%against20.3%;§ Significantdiscomfortinjoints (24.3%/14.5%);§ Muscularstrengthlimitations (14.7%/8.3%);§ Balancetroubles (12.3%/5.2%);
- Deficienciesrelatingtospeech:8.9%/2.5%;- Psychological,intellectual,cognitivedeficiencies:39.3%/20%
§ Significantmemorytroubles (10.1%/4.8%);§ Moodtroubles (19.7%/8.7%);§ Anxioustroubles (23%/12.6%);§ Difficultiesinrelationshipswithothers (10.8%/3%);§ Understandingdifficulties (7.9%/2%).
70Cf.forexampleKarpaandal.(2010)orArchboldandal.(2014).71Definedasthe“difficultytoseecloserorfurther,butneitherblind,norvisuallyimpaired”.
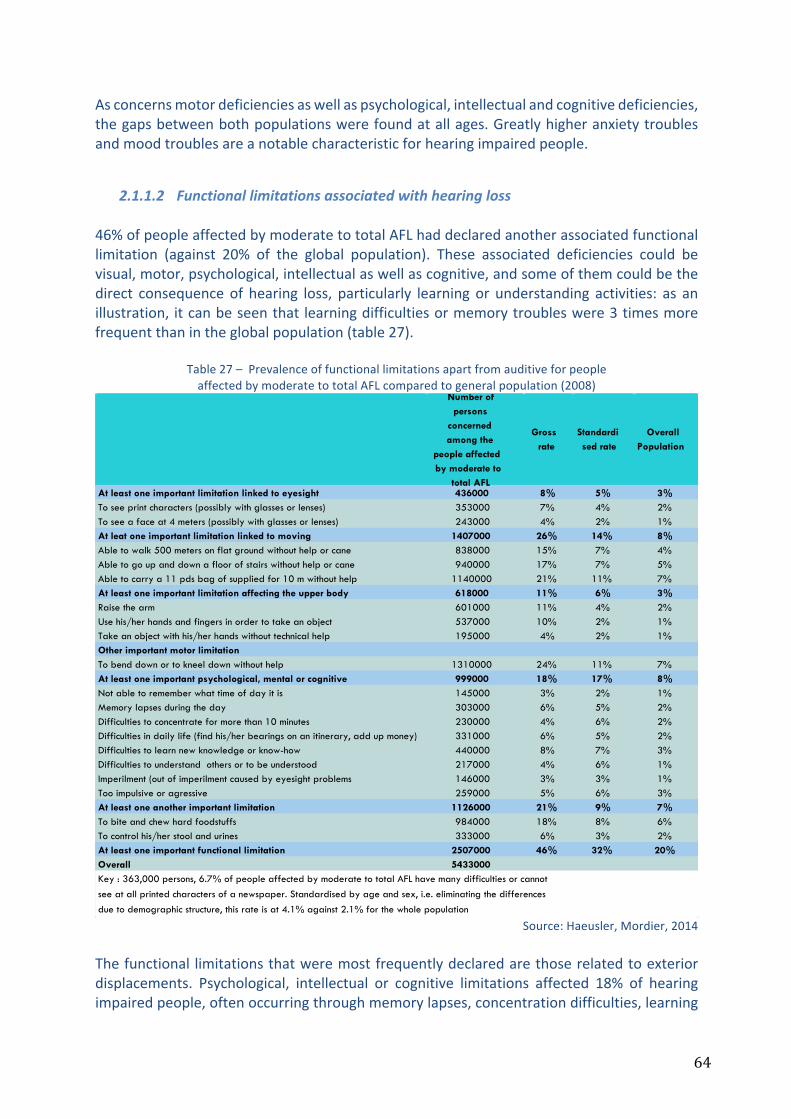
64
Asconcernsmotordeficienciesaswellaspsychological,intellectualandcognitivedeficiencies,thegapsbetweenbothpopulationswerefoundatallages.Greatlyhigheranxietytroublesandmoodtroublesareanotablecharacteristicforhearingimpairedpeople.
2.1.1.2 Functionallimitationsassociatedwithhearingloss46%ofpeopleaffectedbymoderatetototalAFLhaddeclaredanotherassociatedfunctionallimitation (against 20% of the global population). These associated deficiencies could bevisual,motor,psychological,intellectualaswellascognitive,andsomeofthemcouldbethedirect consequenceof hearing loss, particularly learning or understanding activities: as anillustration, itcanbeseenthat learningdifficultiesormemorytroubleswere3timesmorefrequentthanintheglobalpopulation(table27).
Table27–PrevalenceoffunctionallimitationsapartfromauditiveforpeopleaffectedbymoderatetototalAFLcomparedtogeneralpopulation(2008)
Source:Haeusler,Mordier,2014
Thefunctional limitationsthatweremostfrequentlydeclaredarethoserelatedtoexteriordisplacements. Psychological, intellectual or cognitive limitations affected 18% of hearingimpairedpeople,oftenoccurringthroughmemorylapses,concentrationdifficulties,learning
At least one important limitation linked to eyesight 436000 8% 5% 3%To see print characters (possibly with glasses or lenses) 353000 7% 4% 2%To see a face at 4 meters (possibly with glasses or lenses) 243000 4% 2% 1%At leat one important limitation linked to moving 1407000 26% 14% 8%Able to walk 500 meters on flat ground without help or cane 838000 15% 7% 4%Able to go up and down a floor of stairs without help or cane 940000 17% 7% 5%Able to carry a 11 pds bag of supplied for 10 m without help 1140000 21% 11% 7%At least one important limitation affecting the upper body 618000 11% 6% 3%Raise the arm 601000 11% 4% 2%Use his/her hands and fingers in order to take an object 537000 10% 2% 1%Take an object with his/her hands without technical help 195000 4% 2% 1%Other important motor limitationTo bend down or to kneel down without help 1310000 24% 11% 7%At least one important psychological, mental or cognitive 999000 18% 17% 8%Not able to remember what time of day it is 145000 3% 2% 1%Memory lapses during the day 303000 6% 5% 2%Difficulties to concentrate for more than 10 minutes 230000 4% 6% 2%Difficulties in daily life (find his/her bearings on an itinerary, add up money) 331000 6% 5% 2%Difficulties to learn new knowledge or know-how 440000 8% 7% 3%Difficulties to understand others or to be understood 217000 4% 6% 1%Imperilment (out of imperilment caused by eyesight problems 146000 3% 3% 1%Too impulsive or agressive 259000 5% 6% 3%At least one another important limitation 1126000 21% 9% 7%To bite and chew hard foodstuffs 984000 18% 8% 6%To control his/her stool and urines 333000 6% 3% 2%At least one important functional limitation 2507000 46% 32% 20%Overall 5433000
Number of persons
concerned among the
people affected by moderate to
total AFL
Gross rate
Standardised rate
Overall Population
Key : 363,000 persons, 6.7% of people affected by moderate to total AFL have many difficulties or cannot see at all printed characters of a newspaper. Standardised by age and sex, i.e. eliminating the differences due to demographic structure, this rate is at 4.1% against 2.1% for the whole population

65
newknowledgeorknow-howdifficulties,orelsedifficultiestomakethemselvesunderstoodortounderstandothers.
2.1.1.3 ActivityrestrictionsandsocialinvolvementassociatedwithhearinglossForFrance,thestudyofHaeuslerandMordier(2014)showedthatinvolvementinsociallifeisonly reduced for people affected by heavier AFL, and in general activity restrictionsweremostlyrelatedtonon-hearinglimitations:of19dailyrestrictions,thetwomainsituations–forsevereortotalAFL–weretheindependentuseofaphoneandcallforemergencyservices.Forpeopleagedover60,accessforassistance indailyactivities ishigherwhenpeopleareaffectedbymoderatetototalAFL(35%against22%forpeoplenotbeinghearingimpaired),buttheaccumulationofseveralhealthtroubles,functionallimitationsandtheageingeffectmakesitarduoustohighlightacausalrelationshipbetweenhearinglossandautonomyloss:very severe to total AFL are associated with an autonomy loss, itself leading to a moreimportantaccesstoassistants.However,thisaccessisnotonlyduetoAFLseveritybutalsotoassociatedfunctionallimitations.PeoplewithAFLwhoareintheworkforcedifferedfromthoseinthegeneralpopulationbyhaving a lower level of qualifications: the more severe the limitation, the lower thequalification. As for employment access, the activity rate of people being affected bymoderate to total AFL was similar to that in the general population, indicating animprovementinoccupationalintegrationoveradecade.However,theseveritylevelofAFLhadanimpactontheopportunitiestoaimformanagerialpositions.Moreover,thesamestudyshowedthatsocialrelationships,beingestimatedbythelikelihoodtoliveasacouple,werenotimpactedbythehearingtroubleexceptinverysevereortotalAFL,andnorweresocialrelationships,beingestimatedbythefrequencyoffamilialorfriendlymeetings: the frequencyof friendlymeetings reduceswithage, independentlyof involvedAFL.Nevertheless,thesefavourableresultshavetobeconsideredwithcaution,totheextentthatthequalityofconversationandtheirdependencyonAFLlevelcouldnotbemeasured.TheFrenchstudyalsoshowedthattheboundaryofleisureactivitiesforpeopleaffectedbyAFLisreduced,withanotablylowerinvolvementcomparedtothegeneralpopulation(81%forAFLcomprisingallseveritylevels,55%formoderatetototalAFLand90%forthegeneralpopulation). The impactwas particularly clear on activities such as “listen tomusic” (62%against83%)and“gotothecinema”:theprobabilityofgoingtothecinemawasreducedby30% in cases ofmoderate AFL and by 50% in cases of severe to total AFL (Haeusler andMordier,2014).Itshouldbeunderlinedthat“forpeopleover60years,hearingtroublesdonothaveanimpactonthenumberofleisureactivitiespracticed”72.
72p.15.

66
2.1.2 MainfindingsinmedicalscientificliteratureThemainrecentfindingsinmedicalscientificliteraturehaveshowntheassociationbetweenhearinglossandrisksofmortality,manymortalityriskmarkers,falls,degradationofmentalhealth, and cognitive decline for older people over 50. They have also highlighted thedifficulties encountered on the labour market for working people. Finally, they havedemonstratedthepositiveimpactofhearingaidsontheriskofhealthstatusdegradation.
2.1.2.1 AnincreasedriskofmortalityForpeopleaged50overandover,studieshaveshownanincreasedriskofmortalityforthoseaffectedbymoderatetoseverehearinglosscomparedtothegeneralpopulation.In2010,Karpaetal.demonstrated,onthebasisofstatisticalanalysisof2,956Australiansaged50andover,followedfor13years,thathearingloss(hearingthresholdsgreaterthan25dB)wasassociatedwithincreasedriskall-causemortalityafteradjustmentforageandsex73.Thisriskwasmediatedbycognitiveimpairment,walkingdisabilityandself-assessmentsofhealth,that increased mortality directly and indirectly. The study was however able to reveal aconnectionbetweenthedegreeofhearinglossseverityandanincreasedriskofmortality.The observation of a connection between hearing loss and increased risk of all-causesmortalityisalsostatedbyFisheretal.(2014),onapopulation-basedcohortstudy:theaimofthestudywastoanalysethelinkbetween,ontheonehand,hearingimpairmentonly,visualimpairmentonly,bothassociatedimpairmentsand,ontheotherhand,all-causesmortalityandcardio-vasculardiseases.Thepopulationinvolved4,926Icelandicpeopleagedover66,followed on the basis of their examinations between 2002 and 2006 and then followedprospectively by survey until 2009 for mortality. Impairments ranged from moderate togreater. Hearing loss prevalence is estimated at 25.4% in the sample. The main resultsshowed:1)anall-causesmortality significantlygreater forhearing impairedpersons (afteradjustment by age), particularly for men and particularly from cardio-vascular causes 74 .Mortalityratesforwomenwerenotsignificant,althoughtheyweregreaterthanthoseinthegeneralpopulation.2)Menandwomenbeingfittedwithhearingaidstendtobeolderandmoreseverelyimpairedthanothers.However,theirriskofmortalityislower,andthishasanimpactupon theglobal result forall thepeoplewithhearing impairment (inotherwords,hearing aid access reduces themortality risk, and this reduction reduces itself the gap inmortalityriskcomparedtothegeneralpopulation).Theassumptionmadebytheauthorsisthe following: hearing aid equipment reduces social isolation and increases neurosensorystimulation.The study of Genther et al. (2015) strengthens these results, by analysing an Americanpopulation-basedcohortof1,958olderpeopleagedover69during8yearsafteraudiometric
73Twostatisticalmodelsusedbytheauthorsconfirmtheassociation:intheCoxmodel,theOR*is1.39,(CI95%1.11-1.79);inthestructuralequationsmodel,theOR*is2.58CI95%(1.64-4.05).74Onthebasisoftwostatisticalmodels,theOR*formenis1.74(CI95%1.21-2.49)and1.93(IC95%1.30-2.87).
67
examination.Withcontrolofdemographicandcardiovascularriskfactors,theyshowedthathearingimpairment(>25dBinthebetterear)wasassociatedwitha20%increasedmortalityrisk compared with normal hearing75 . The authors suggested investigating the pathwaysleading to this association and in order to determine the impact of rehabilitation hearingstrategies.Allthesepapersrecommendtakingintoaccountthisassociationbetweenhearingimpairmentandmortalityriskinmedicalfollow-ups,whichimpliesthatapartofthisriskispreventableandcauseslossoflifeinyears.
2.1.2.2 AnincreasedriskoffallsTheINSERMrecommendations(2014)forpreventingfallsamongsttheelderlyestimatedthatahearinglossofatleast25dBwasassociatedwithathreefoldincreaseofriskforfalls,duetothedeteriorationofsensoryfunction,thelossofsoundmarkscontributingtobalance,andthereductionincognitiveresourcesensuringbalanceandattention.ThispossiblelinkhasbeenstudiedbyViljanenetal.in2009andbyLinandFerrucciin2012.Viljanen et al. (2009) analysed the predictive value of hearing impairment as a fall factorthroughasampleof217pairsoffemaleFinnishtwins–monozygoticanddizygotic–aged63-76years.Theyshowedthatpeoplewithpoorhearingacuity(lossofatleast21dBinthebetterear)haveahigherfallrisk,becauseoftheirpoorerposturalcontrolamongotherfactors.
LinandFerrucci(2012)studiedapopulationof2,017personsaged40-69years,from2001to2004,basedontheAmericanregisterNHANES.Theyshowedthathearing loss(>25dB) issignificantly associated with the risk of reported falls. Moreover, this risk increased withhearing loss severity (1.4 fold by 10 dB classes), independently of demographic factors,cardiovascularfactorsandvestibularbalance.
2.1.2.3 AdegradationinmentalhealthTheconnectionbetweenhearing lossandmentaldistresshasbeenhighlightedbyagreatnumberofstudies.The analysis proposed by Fellinger et al. (2007) of 373members of the German Hard ofHearingAssociationofallagesshowedthatpeopleaffectedbymoderatetoseverehearingloss (even total) had worse psychological scores in contrast to a non- hearing impairedpopulation:usingtheWHO’sbriefqualityoflife(WHO-QOL)thescoresaresimilarinbothpopulations;throughthescale‘BSI’(Briefsymptominventory),peopleaffectedbymoderateto severe hearing loss suffer from greater anxiety, somatization, paranoid ideation, anddepression(thelevelofdegradationdependsonseverity).Thisstudyalsoshowedthatthesepeoplehaveworsesocialrelationshipscomparedtothesigningdeaf(evidentinthescalesofboththeWHO-QOLandBSI).Theauthorscomparedthelevelsofpsychologicaldistressandqualityof lifeandsuggested twomainconclusions:on theonehand,generalpsychiatrists75OR*1.2095%IC(1.03-1.41).

68
should consider the increasing risk of isolation and quality of life degradation for hearingimpaired people who have communication difficulties or who lip-read (compared to thesigningdeaf);ontheotherhand,thebenefitofhearingaidequipmentcouldbesubstantialsincetheywouldimprovetheircommunicationcapacities(formoreprofoundhearingloss,thebenefitwouldrelyoncochlearimplants).Moreover,thestudyofBernabeietal.(2011)hasshownthattheaccumulationofahearingimpairment and vision impairment in an Italian study population (7,389 older people) isassociatedwithdepressionandanxiety.Morerecently,throughresearchintheUnited-States,Lietal.(2014)haveestimatedtheprevalenceandriskfactorindepressionforadultsolderthan69andbeingaffectedbyhearingloss(among18,318personsparticipatinginanationalsurvey).Depressionwasassessedonthebasisofacustomisedscale,andresultsshowedasignificant association between hearing loss and depression, particularly for women, andespeciallyinthecaseofmoderatehearingloss.Atthesametime,Acarandal.(2011)analysedtheresultsofastudyinvolving34Turkishpeopleolderthan65inordertoestimatetheimpactofhearingaidequipmentonmentalhealth:theyshowedthattheuseofhearingaidsfor3monthssignificantlyimprovedpsycho-socialhealthstate,asdescribedbytheMMSEscale.Inthesameperspective,in2013,Meneretal.workedonthecohortNHANESdata,fortwoperiods(2005-2006)and(2009-2010),includingapopulationaged70-79towhomaspecificquestionnaireassessingdepressionwasproposed(PHQ-9).Theystudiedtheimpactofhearingaiduse(atleast5hoursaday)andshowedasignificantreductionofsymptomsofdepressionandmajordepressivetroubles.Thisfavourableimpactwasappreciablestartingfromthefirst3monthsofequipment.However,theauthorsunderlinedthatitwasn’tpossibletostateifthisassociationwouldresult ina larger inclinationofpeoplewithoutdepressivetroubletoaccessforhearingaids,oriftheirperceptionoftheirownpsychologicalfrailtywouldhaveledthemtoaccessforhearingaids.Hence,theauthorssuggestfuturescientificinvestigationinordertoquestionthelinkbetweenhearingaidsandthereductionindepressivesymptoms.ForFrance,thestudiesoftheInVSandtheINPES(Sitbonandal.,2015)undertakenaspartofthetheframeworkofthe«Baromètresantésourdsetmalentendants»(BSSM–‘Barometerforthehealthofdeafandhardofhearingpeople’)in2011-2012underlinedthedegradationofmentalhealthforpeopleaffectedbydeafnessandhearingtroubles.Theyhighlightedthemorefrequentrateofsuicidalthoughtsthaninthegeneralpopulation(Baromètresanté2010,BS): suicidal thoughts occurring during the last 12 months were 5 times more frequent(affecting indeed22%ofpeople in theNSSMsurveyagainst4%of thegeneralBSsurvey),whereasthenumberofsuicideattemptsduringthelifecoursewere3timeshigherformenand twice for women. The analysis by sex and age groups showed a decrease in suicidalthoughtswithage:15%ofmenand17.2%ofwomenaged55-75hadthesethoughtsagainst35.4%ofmenand25.3%ofwomenaged15-24.Retiredpeople (13.4%) lessaffectedthanprofessionallyactivepeople.Moreover,thecomparisonsbetweenthetwosurveysshowedthatindicatorsrelativetophysicalviolence(6.7%against2.8%),dismissiveorhumiliatinglooksorwords(26.4%/14.9%)orsexualviolence(20.4%/8%)areobviouslyhigher.Theresearchofthecausesleadingtopsychologicalsufferingresultedfromtiringcommunicationsituationsandhardnessofhearingtroubles.Situationsofpsychologicalviolencecanalsoparticipateinthe deterioration of psychological health. Indeed, everyday life characterised by adeteriorationincommunicationqualityandsocialrelationshipsbecauseofimpairmentwould

69
be likely to generate ‘conflictual interactions’, ‘isolation, feelings of exclusion anddiscrimination’.Vulnerability, which is linked to physical and psychological suffering, led the authors torecommendreflectionconcerningaccessconditionsfortechnicalandhumanassistance,aswellasanawarenesscampaignforhearingimpairedpeopleandforthegeneralpopulationinorder to promote positive change of representations and prejudice, or even for healthprofessionals(dealingwithpain,anddealingwithpsychologicalsuffering).
2.1.2.4 DeteriorationincognitivecapacitiesThepapersofLinetal.(2011a;2011b;2013;2014)areamongthemostcitedarticlesinthefieldofresearchintothelinkbetweenhearinglossandcognitivedecline.In2011(a),Linetal.testedtheassumptioninwhichhearinglossisassociatedwithall-causesdementiasandwithAlzheimer’s disease. They based their study on a population of 639 Americans followedprospectively since 1990-1994 (inclusion period) when they didn’t have dementia, with afollow-upof11.9years (mediantime)duringwhich58casesofdementiawerediagnosed,including37casesofAlzheimer’sdisease.Theauthorsshowedthatdementiariskincreasessignificantlyandlinearlywithhearinglossseverity.TheriskofAlzheimer’sdiseaseincreasedatsuchaconfidenceintervalthatitwasnotpossibletovalidatetheassociationassumption.They concluded that hearing loss is associated independently with all-causes dementia,withoutbeingabletosayifhearinglossisanearlymarkerorisamodifiableriskfactor.Thestudiesalsoreleasedin2011(b)byLinetal.analysedthelinkbetweenhearinglossandcognitivedeclineonthebasisofacohortof347personsaged55andover,whowereinthesamepanelcohortBLSA(BaltimoreLongitudinalStudyofAging),andwhohadneitherhearinglossnordementiaduringtheinclusionperiod1990-1994.Theauthorsshowedthatthemorehearinglossincreases,themorethescoresonthementalhealthscale(MMSE)deteriorate,aswellasmemoryandcognitivefunction:whenhearingperformanceisreducedby25dB,thescoresconvergetothoseofapopulationwithouthearinglosswhoareolderby6.8years.Inotherwords,hearinglossacceleratesthecognitiveageingprocess.The study of 2013 assumed that hearing loss was independently associated with anacceleratedcognitivedecline.Therewere1,984Americanadults,agedonaverage44.4years,followedsincetheirinclusionin1977-98for6years.Hearinglossconcerned1,162persons,forwhomcognitivedeclinerate–measuredthrough2adaptedscales–appearedtobe41%or32%accordingtothe2scales.Finally,theauthorsstatedthatpeoplewithhearinglosshaveanincreasedriskofcognitivedeficiencyof24%76,theselatterratesandthisriskbeinglinearlyassociated with the severity level of hearing loss. They concluded that hearing loss isindependently associated with accelerated cognitive decline and they then suggested anassessmentoftheimpactofauditiverehabilitationontheseresults.In2014,Linetal.estimatedtheassociationbetweenhearinglossandbrainvolumechangesfortheolderpeopleincludedinBLSApanelandtheyconfirmedtheindependentassociation
76OR*:1.24CI95%(1.05-1.48).
70
betweenthetwomeasures:hearinglossbeyond25dBledtoanacceleratedatrophyofthewholebrainandinparticulartheregionalvolumesconcentratedintherighttemporallobe.The very recentmeta-analysis of Schmulian Taljaard et al. (2015) on the issueof a causalrelationship between hearing loss and cognitive decline included 33 studies related to 40populationsamples.Itconcluded(withsomereserveonthesamplesizeandonthelackofcontrolonriskfactors)that:
- Cognitivecapacitiesaresignificantlylowerforpeoplewithnon-treatedhearingloss,and and remain lower for hearing aid equipped people regarding people withouthearingloss;
- Thedegreeofcognitivedeclineissignificantlyassociatedwiththelevelofhearinglossforbothpeoplebeingequippedandnotbeingequippedwithhearingaids;
- Auditiveinterventionsignificantlyimprovescognitivecapacities;- Hearinglosshasanimpactuponallcognitivedomains.
If several papers have stated a significant connection between hearing loss and cognitivedecline, the analysis ofAmievaet al. (2015) showed the favourable impact of hearing aidequipment inreducingthisadverseeffect.Thestudywasbasedontheprospectivecohort(‘Personnesâgées’QUID),whosepopulationwasstudiedfrom1989-90.Thecohortinvolved3,670olderpeople(65+)atthemomentofthestudy.Hearinglosswasassessedthroughaperception questionnaire recording themoderate ormajor difficulties relating to hearingcapacity. Cognitive decline was assessed by the MMSE scale, recorded during follow-upconsultations.Theauthorsalsoshowedanindependentandsignificantassociationbetweenhearinglossandcognitivedecline.Aboveall,theyshowedthatdeclinedependsontheuseornot of hearing aids,which can delay it: indeed, people using hearing aids have the samecognitivedeclinethanpeoplewithouthearingloss.Inasimilarperspective,Dawesetal.(2015)examined,onthebasisofEnglishdata(164,770personsaged40-69whosehearingcapacitieswererecorded)theimpactofhearingaiduseoncognitiveperformances,socialisolationand/ordepression).Usingamodel,theyshowedthathearingaidsareassociatedwithabettercognitiveperformance,independentlyofsocialisolationanddepression;thesehearingaidsarenotherestatedfactorsofimprovedcognitivecapacity, but thanksmore to direct improvement in hearing and personal efficiency. Theauthorssuggestsupportingaccesstohearinglosstreatmentinordertoreducetheburdenofdiseaserelatedtocognitivedeclineandqualityoflife.Meanwhile,thepaperofHungetal.(2015)focusedonAlzheimer’sdiseaseandreliedonacontrolled study including a sample of Taiwanese over a 13 years’ period andwhere 488persons aged over 65, with a diagnosis of Alzheimer’s disease, werematchedwith 1,952persons without Alzheimer’s disease in the control group. The aimwas then to comparecomorbidityfactors(includinghearingloss)withtheriskofhavingAlzheimer’sdiseaseinbothgroups.ThestatisticalanalysisshowedthathearinglossisassociatedwithanincreasedriskofAlzheimer’sdiseaseinanolderpopulationwithanodds-ratioof1.3977.
77Interpretation:individualsbeingaffectedbyahearinglosshave1.39timesmorerisktohaveanAlzheimer’sdisease,astheconfidenceintervaldoesnotcomprisethevalue1(1.05-1.84).However,theassociationdoesnotprovethecausality,evenapresumptionexiststoday.

71
2.1.2.5 HealthatworkInFrance,therecentanalysisofSitbonetal.(2015)ofBSSMhavegivensomekeydataontheimpactofhearinglossonhealthatwork:
- Hearing impaired people more frequently suffer at work, as 34% of this workingpopulation is in a psychological distress situation due to working conditions (incontrastto5.4%ofgeneralworkingpeople),10.3%ofthemhavethoughtofsuicideduringthelastpast12monthsbecauseoftheirworkingsituation(1.4%forthegeneralpopulation)and3.5%haveattemptedtokillthemselvesduringtheirlivesforthesamereasons(0.6%forthegeneralpopulation).Moreover,comprehensiondifficultiesarefrequent, in the double sense of being understood by and to have understoodcolleagues;
- 2/3 of this population have asked for a recognition of their impairment (‘RQTH’benefit).
Although the ‘Handicap-Santé’ survey2008didnot reveal anymajordifficulty in termsofprofessionalintegration(cf.supra)–whichcouldbeinterpretedastheresultofsocialprogressoveradecade-theobservedresultsindevelopedcountriesaremoremixed:intheUnited-Kingdomitcanbeobservedthattheperson’ssituationinthelabourmarketisaffectedinthecase of hearing loss with regard to career opportunities, the loss of employment, anddifficultiestogetbacktowork(Archboldetal.,2014).Accesstohearingaidswouldalleviatethisnegativeimpact.Whethermortalityormorbidity,Frenchaswellasinternationalscientificliteraturehighlightstheconsequencesofhearingloss,whicharelikelytobesubstantialforthehearingimpairedpersons themselves, notonly in termsof quality andquantityof life, but also in termsofeconomicandsocietalimpact(burdenofillness):ifhearinglossisindependentlyconnectedto other health state dimensions - physical, psychological, cognitive, social - , it is thenassociatedwithaneconomicburdenintermsofmedicalandnon-medicaldirectcosts,indirectcosts(productivity)andintangiblecosts.Accesstohearingaidswouldreducethisburden–recent scientific studies increasingly tend todemonstrate this assumption. Theaimof thefollowingsectionistoexplorethisissue.
2.2 EconomicimpactofhearinglossAsshowninthefirstsectionofthisreport,mostFrenchagencies(HAS,2008;HCAAM,2008;CEPP, 2008; IGAS, 2014) have pointed out the lack of global assessment of hearing aidexpectedservice(particularlyonthepossibledifferencesofqualityrenderedbyhearingaidsaccordingtotheircharacteristics).However,theHAS(2008)specifiedthat“thebenefitoftheprosthesisislinkedtoitssuitabilitywiththeaudiometriccharacteristicsandthepatient’swayoflife,aswellasthequalityofitsadaptationperformedbytheaudiologist”78.TheHCAAM
78p.9.

72
(2008)estimatedonitssidethatthequestionofmedicaldevicesrecordedontheLPPRistrickytotheextentthat“therenderedserviceishardlyassessable”becauseitdependsbothontheapparatusandtheservice79.Moreover,thecontinuousinnovationconcerninghearingaidsleadstoarapidreplacementoftheproductson themarket,upmarketproductsbecoming fiveyears laterdownmarketormiddlemarketproducts,whereastheleastperformantexitthemarket,resultingina100%digitalsupply(Alcimed-DSS,2011).Inthisway,deviceassessmentisincreasinglycomplex,intermsofseparatingadded-valuefrommarketinginnovation.Asunderlinedinthisreport,suchanassessmentisstillnecessarytoputinperspectivereimbursementrulesforhearingaids.This question is also raised in the international literature: two systematic reviews wereundertakenin2015bytheCochraneLibrary,buttheirresultswerenotyetreleasedatthetimeofthisreport.TheresearchprotocolofFergusonetal. (2015)specifiesthatthemainmedicalaction in the faceofhearing loss iscompensationwithhearingaids,butwedon’tknow their exact performance,which is ‘user dependant’, to use the CESE’s term (2015),although11millionhearingaidsweresoldinoneyear.Themainobjectiveofhearingaidusersaffectedbymoderatetoseverehearinglossisobviouslytoreducethesensoryimpairment,butalsotoreduce, indirectly,associated limitations. If it ispossible toassess thepatient’shearingcapacitiesbymeansofphysicalmeasures(audiometricones),theconsequences interms of associated limitations could be assessed by using questionnaires specific to theassociated disease/limitation (for example, MMSE in the case of mental health) or bypreference-basedgenericquestionnairesforqualityoflife.However,thelattermaynotallow,ingeneral,thedemonstrationoftherealbenefitsofhearingaidsbecauseofthelowimpactmultiple consequences have on them. This is apart from the HUI3 questionnaire whichincludesaquestiondirectlylinkedtohearinglosslevel(cf.infra).Fergusonetal.pointoutthelackofscientificconsensusonthisissueand,further,thelackofameasurereferenceonthebenefitintermsofqualityoflife,andeventhelackofsystematicreviewofrecentliterature(particularlythatwhichwouldhighlightresultsofprospectiverandomisedcontrolledtrials).Allthisconsiderablylimitshealthpoliciestowardsaroadmapforhearingaidregulationanddelivery,anditalsolimitsthepossibilitytodefineaguidelinefortheirprescribers.Takingintoaccountthisstatement,ouranalysiswillproposeanassessmentscenariowhichdoesnotpretendtobeanefficiencyanalysisandwhichmustbereadwithcaution,butthatwould give some general orientation on this issue. Before beginning, we propose a briefoverviewofseveralpapersfocusedonthelinkbetweenhearinglossandhealthcareaccess.
79p.3.

73
2.2.1 Economicassessmentsinscientificliteratureofhearingloss:healthcareaccess,expenditureandscreening
On the basis of previous articles which have demonstrated an independent connectionbetweenhearing lossand themorbi-mortalityofolderpeople, somepapershave tried toestimatetheimpactofhealthdegradationrelatedtohearinglossonheathcareaccessandexpenditurelevel.Otherspapershaveconsideredthebenefitthatwouldbeexpectedofanearlierscreeningofhearingloss.
2.2.1.1 HigherhealthcareaccessandexpenditurelevelTworecentpapers,relyingonresultsfrompreviousinternationalstudies,havefocusedontheeconomicimpactofadegradedhealthstateforhearingimpairedolderpeopletoheathcareaccessandexpenditure.Gentherandal. (2013)have identifiedanassociationbetweenhearing loss,hospitalisationandburdenof illness forolderpeopleagedover69 (representing2/3ofhearing impairedpeopleand1,140peoplewhowerematchedwith529personswithouthearingloss)fortwodifferent periods: 2005-06 and 2009-10. The statistical analysis showed a significantassociationbetweenhearing lossand severalmarkersofhealth carepathwaysandhealthstates:theoccurrenceofhospitalisation,thenumberofhospitalisations,andthenumberofdayswithworsenedphysicalandmentalhealth.However,theconnectionwithaninactivityrelatedtohealthstatewasnotstated.Itshowedthathearinglossisindependentlyassociatedwithhospital access and sowithan increaseduseofhealth care services,which couldbeexplained by social isolation, and by the effects of hearing loss on cognitive decline anddementia(thesefactorswerecontrolledintheanalysisofhealthcarepathways).Theauthorssuggested that an analysis should be pursued of the effect of auditive rehabilitation onhospitalisationreductionandself-assessmentofhealthstate.InFoleyetal.(2014),thequestionwastoinvestigatethenature(independentornot)oftheconnectionbetweenhearinglossandthehigherlevelofhealthexpenditure.Thestudyusedexpenditurefiguresfor34,981personsagedover64,whohadcompletedtheShortForm12qualityoflifequestionnaire.Healthexpenditurewasassessedregardlessoffinancingtype,towhichwereaddedanon-monetaryestimationforhealthstateresults(numberofassistancedays, qualityof life scores). Themain results in this study showed, that for ahearing lossprevalencerangingaround23.7%,theprobabilityofhigherexpenditurewassignificant(theextraamountwassignificant-a39%)80,meaningonaverageUS$392,becauseofmoreoftenmedicalvisits,outpatientandemergencyhospitalisations.Thescoresforqualityoflifewerelowerinthephysicalandmentaldimensionscomparedtopeoplewithouthearingloss.Theauthorsconcluded that therewasan independentassociationbetweenhearing lossandahigher levelofexpenditure:thiswouldrepresentanextraamountofUS$3.1billionforallhearingimpairedpeople(7.91millionpeople),relatedtofalls,cognitivedecline,depressionandsocialisolation.Theyalsoconsideredthatthisestimationwasprobablyanunder-estimate
80Extrahealthexpenditureproportion:OR*1.39CI95%(1.12-1.71);extrahealthexpenditureamount:OR*392$CI95%(277-513).

74
becauseofhearinglossdenialinsurveys.Aswithpreviousauthors,theysuggestedtheimpactofauditiverehabilitationstrategiesonhealthcareexpenditurereductionshouldbestudied.Thesesuggestedauditiverehabilitationstrategieswouldinvolveearlierscreeningforhearingdifficultiesand,thus,animprovementinaccesstohearingaidssinceeconomicstudieswillhavedemonstratedtheirfavourablecost-effectivenessratio.
2.2.1.2 EconomicconcernsofearlierscreeningforhearinglossAs shown previously, hearing loss is common after the age of 50 years, with increasingprevalenceandseveritywithageing.Autonomyaswellasqualityof life’speoplewouldbejeopardisedifhearinglossisnotcompensated.TheEnglishliteraturehasshownthatindividualsoftenwaitfor10to15yearsbeforeaccessinghearingaids,becausetheyconsidererthattheirhearinglevelisnotsobadandbecausetheydon’tenvisagethemselveswithahearingaiduntilittheirhearinghasseriouslydeteriorated.Thisisalsoaresultofthemisreadingoftheconnectionbetweenhearinglossandlongtermhealth state: indeed, it is actually stated that hearing aids improve social integration andqualityof life, even in the caseofmoderatehearing loss, andmainlywhen theyareusedearlierbyindividuals.Issecondarypreventionofhearinglosseconomicallyreliable?Inordertojustifyasystematicscreening process, this hearing loss must become a significant public health priority,associatedwithapreciseknowledgeofthe‘natural’historyofhearinglossandtheevidence-based efficiency of earlier screening. Yet, the previous statements highlight not only thesignificantprevalenceofthishealthstateproblem,butalsoitsadverseconsequencessincethe link between severity and age has been demonstrated. Screening aims to reduce thehearingimpairmentimpacttimelineanditsseverityimpactinapatient’slife.Furthermore,this raises questions about the cost of such systematic screening: indeed, a secondaryprevention campaign could require significant financialmeans. The financial requirementswould depend on themethod, as a systematic screening during theGP’s consultations inFrancewouldrepresentlittlefinancialoutlaytobeefficient.Indeed,onthebasisofAmievaetal. (2015), screening of the PAQUID cohort was realised over the course of follow-upconsultations,byrecordingaveryshortquestionnaireallowinghearing lossscreening.Thequestionnairecomprisedtwoquestions:
- Doyouhavehearingtrouble?(possibleresponses:“Idonothavehearingtrouble”/”Ihavetroublefollowingtheconversationwithtwoormorepeopletalkingatthesametimeorinanoisybackground”/“Ihavemajorharingloss”);
- Doyouuseahearingaid?(possibleresponses:yes/no)SuchaquestionnaireiseasytocarryoutduringageneralconsultationwithoutburdeningtheGP’s time. That’s why a reflection about this screening method in general consultationdeservestobestudied,linkedwiththe‘ROSP’system(theFrenchpaymentforperformancesystem). In the literature,most analyses suggest the implementation of hearing loss screening foradultsaged50-65,i.e.anaudiencewhoaresufficientlyoldtorepresentanimportanttargetregardingprevalencebutyoungenough tobenefit fromearlier screening.However, these
75
recommendationsarerarelyassessedregardingefficiencyandtheeconomicliteratureisstillsporadic on this issue.We present themain results of two studies on this topic, but weunderlinethatotherefficiencystudiesdoexistonthespecificeconomicimpactofcochlearimplants(notpartofthisdiscussion).1- The studyofDavis et al. (2007): hearing loss screening is acceptable andbeneficial forpeopleaged55-74,andatargetscreeningofpeopleaged60-70forabilateralhearinglossofatleast35dBisthemostappropriate.Theauthorshaveconsideredadultbilateralhearingloss,havingconsequencesonhearingandcommunication (1/5 of this population), associated with difficulties hearing in a noisybackground.Iftheyassessthatoneintenpeoplewouldbenefitfromhearingaids,oneinsixhearingaidequippedpersonsdidnotbenefitfromthem(noefficacy).Moreover,individualswhosehearingcapacitieswereassessedadmittedtohavinghearingtroubleforat least10years,wereaged75onaverageandhadhearinglossconsideredassevere.Thislateraccessleadstomoredifficultiesintermsoftheirownadaptationbecauseofimpairmentseverityandisassociatedwithreducedcommunicationcapacities.ThestudyofDavisetal.aimedtoassessthereliabilityofhearinglossscreeningbyefficientandacceptablemethods,inorderthatthisscreeningbelinkedtoameasurableresultintermsofqualityoflife.
Theirpreliminarystudydemonstratedthatpeopleaged54-74aregreatlyaffectedbyhearingloss andwould benefit from referred to screening. The amplification obtained fromusinghearing aids clearly improved the health state of people affected bymoderate to severehearingloss(atleast35dB)whentheyarescreenedatleast10yearsbeforethe‘natural’pointofself-referralforhearingaids.Theyestimatedthatthecost-utilityincrementalratiorangedaround£800to£1,000byQALY(Qualityadjustedlifeyears,seeinfra).2)Earlyscreeningefficientlyimprovesthequalityoflifeofolderpeople:thestudyofMorrisetal.(2012)ThestudyofMorrisetal.(2012)waslargelybasedontheinitialanalysisofDavisetal.(2007)andfolloweditsrecommendations.Inordertosetupaneconomicassessmentofscreening,theauthorscompared3programsfollowingtheEnglishpopulation:
- A1stepscreeningprogram,whichtargetseligibleadultsforscreeningaged60-70andinvitesthemtobescreened;
- A2stepscreeningprogram,which targetseligibleadults for screeningaged60-70,firstly by posting them a questionnaire, then inviting to screening those who hassignalledhearingtroublesintheiranswers;
- The self-referral rates through the GP (comparator), who would refer the patienttowardsanaudiometricassessment.
Ifhearinglossisconfirmed(>35dB),thepatientwasofferedoneortwohearingaids,takingintoaccountthatindividualscouldrenouncethemormightnotusethem.Themodelisbuiltaroundthesedifferentscenarios:theframeworkisaMarkovmodelwherecycleslastfor5

76
years,andwherecostandutilitydimensionsareincluded(utilitiesareestimatedinQALYs,andthesevaluesaregiveninthestudyofDavisetal.).
Map1–Transitionsbetweenhealthstates(Markovcycle–5years)
Source:Morrisandal.,2012.Themainresultsshowedthat:
- The1stepscreeningscenariodominates(itgeneratesbetterresultsthanthe2stepscreeningscenario),thusthisscenarioischosen;
- The incremental cost-effectiveness ratio between the one-step scenario and thecomparator(selfreferencetoaGP)isestimatedtobe£1,461/QALY:itisthepricetopayforhavingoneyearofgoodhealth.Itiscalculatedastheratioofcostvariationandutilityvariationbetweenthetwostrategies;
- Thedifferentlysimulatedscenarioslinkedwithaprobabilisticanalysisshowthatthedominantstrategyisthatofone-stepbilateralscreeningofhearinglossfromtheageof60,andadeliveryofhearingaidequipmentstartingfrom35dB
Thetableofparametersandcostspresentedinthefollowingpagesshowsestimationrangesrelated to access to, and use of hearing aids, as well as cost and utility associated withscreening(withautilityscalerangingbetween0–worsehealthstate-to1–besthealthstate).

77
Table28–Morrisandal.studyresultsofscreeningefficiencyofHLfortheEnglishpopulationaged60-70
Source:Morrisandal.,2012
On the basis of these assumptions and results, the screening strategy appears to be veryefficient:thefollowingmapillustratestheacceptabilityofthisstrategyfromafinancingpointofview.Usually,theNICE(NationalInstituteofClinicalExcellence)determinesawillingnesstopaythresholdrangingfrom£20,000to£30,000foreachyearofgoodhealthgained.Itcanbeseenthattheprobabilityofbeingbelowsuchathresholdiscloseto1(map2).
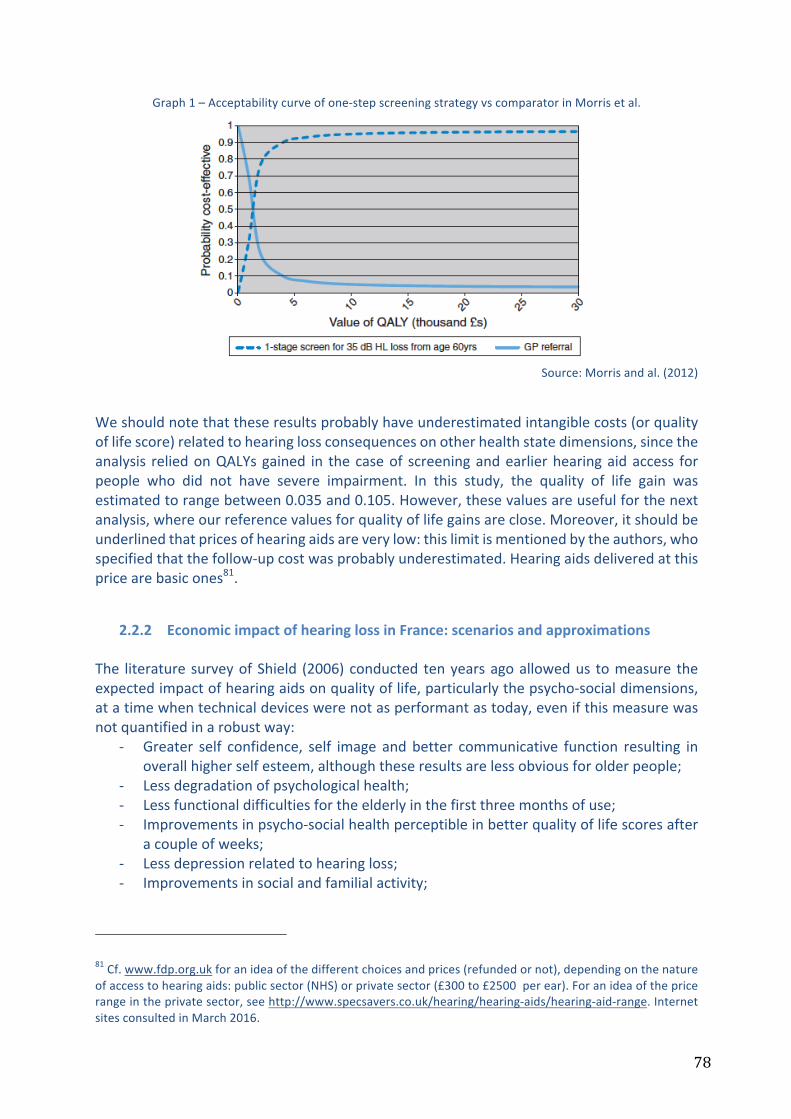
78
Graph1–Acceptabilitycurveofone-stepscreeningstrategyvscomparatorinMorrisetal.
Source:Morrisandal.(2012)
Weshouldnotethattheseresultsprobablyhaveunderestimatedintangiblecosts(orqualityoflifescore)relatedtohearinglossconsequencesonotherhealthstatedimensions,sincetheanalysis reliedonQALYsgained in thecaseof screeningandearlierhearingaidaccess forpeople who did not have severe impairment. In this study, the quality of life gain wasestimatedtorangebetween0.035and0.105.However,thesevaluesareusefulforthenextanalysis,whereourreferencevaluesforqualityoflifegainsareclose.Moreover,itshouldbeunderlinedthatpricesofhearingaidsareverylow:thislimitismentionedbytheauthors,whospecifiedthatthefollow-upcostwasprobablyunderestimated.Hearingaidsdeliveredatthispricearebasicones81.
2.2.2 EconomicimpactofhearinglossinFrance:scenariosandapproximationsThe literaturesurveyofShield (2006)conducted tenyearsagoallowedus tomeasure theexpectedimpactofhearingaidsonqualityoflife,particularlythepsycho-socialdimensions,atatimewhentechnicaldeviceswerenotasperformantastoday,evenifthismeasurewasnotquantifiedinarobustway:
- Greater self confidence, self image andbetter communicative function resulting inoverallhigherselfesteem,althoughtheseresultsarelessobviousforolderpeople;
- Lessdegradationofpsychologicalhealth;- Lessfunctionaldifficultiesfortheelderlyinthefirstthreemonthsofuse;- Improvementsinpsycho-socialhealthperceptibleinbetterqualityoflifescoresafter
acoupleofweeks;- Lessdepressionrelatedtohearingloss;- Improvementsinsocialandfamilialactivity;
81Cf.www.fdp.org.ukforanideaofthedifferentchoicesandprices(refundedornot),dependingonthenatureofaccesstohearingaids:publicsector(NHS)orprivatesector(£300to£2500perear).Foranideaofthepricerangeintheprivatesector,seehttp://www.specsavers.co.uk/hearing/hearing-aids/hearing-aid-range.InternetsitesconsultedinMarch2016.

79
- Increasingrelationshipbetweensatisfactionrelatedtohearingaidsandhearinglossseverity: thegreater the severityof thehearing loss, is thegreater the satisfaction(apartfromveryseverecases);
- Levelofsatisfactionindependentofage;- Lesssocialisolation;- Lessfeelingsofstigmatisationforhearingaidusersthanfornonusers;- Betteremotionallife.
Hearingaidusersbeartheirimpairmentmoreeasilythannon-users(whoaremoreoftenindenial)andaremoreawareofsecurity.Theirfamiliesestimatethatwearersofhearingaidshave improved cognitive capacities in comparison to non-users, and wearers are lessintroverted. Hearing aid users have in a better overall health state, particularly forrelationships,selfesteem,mentalhealthandthisisespeciallytrueformoreseverehearingimpaired people. This body of evidence – highlighted on the basis of Shield’s scientificliteraturesurveyreleasedbefore2006- seemstobereinforcedbyourprevious literaturesurveyof2005-2015 inwhich statistical investigationshavealso supported the favourableimpactofhearingaidsonhealthstate.The consequencesof hearing losson all dimensionsof health status, impose theuseof aqualityoflifeframework.However,forlackofreliabledataonhealthreferencedscores,weproposeafewscenariosandapproximationsinordertoassessthepotentialeconomicimpactofhearinglossinFrance.Investigatingsocio-economiccostsrelatedtohearingloss(‘economicburden’),Shield(2006),theLondoneconomics/RNID(2010)andArchbold(2014)proposemethodsthatwecombineaccordingtoavailabledataforFrance.Ideally,themainobjectivewouldbetoestimate:
- Avoidablehealth,socialandlong-termdirectdirectcostsrelatedtohearingloss;- indirect costs (loss of productivity, selection in the labourmarket, impact of noisy
professionalbackgrounds…);- adirectassessmentofutilityscorebenefits,oran indirectassessmentof intangible
costs–greaterones–estimatedby thequalityof lifedegradationwithorwithouthearing aids. Intangible costs are estimated on the whole, by combining averagequalityof lifescoresandstatisticalvaluesofhumanlife,butthesemethodsremaincontroversial.
Inourapproach,itisobviousthatapreciseanalysisofeachlineisnotpossible.Theestimationthatwillbeproposedisthereforepartial–notincludingallthecostsandnotassessingtheutilityscores–andapproximate(relyingonacertainnumberofassumptions).Itconsistsofaroughestimate,tobecomparedtootheravailableestimationsintheliterature.Thefirststepofthiseconomicreckoningistogiveapossiblevalueforintangiblecosts.
2.2.2.1 Qualityoflife,preference-basedscores,QALYsandstatisticalvalueofahumanlife:aframework
In heath economics, cost-utility analysis consists of comparing at least two strategiesregardingtheircosts(directmedical,directnonmedical,indirect)andtheirconsequencesintermsofqualityoflife.Qualityoflifeisestimatedthroughvalidatedscales;inFrance,theHAS
80
suggestsusingeither theEQ-5D-3L (Euroqol)or theHUI3 (Healthutilities indexmark3)82.Qualityof life scores areobtained throughapatientquestionnaire anda scoring formula.Averagescores–ingeneral–canbereportedon0-1scale(0=stateequivalenttodeathand1=stateequivalent toperfecthealth)which,whencombinedwith the lengthof life in thisstate,allowustoconvertyearsoflifeinthisstateintohealthyyearsoflife,withthehelpofQALYs83.Whentherearetwostrategiesforwhichcostsandutilityscoresareassessed,itispossibletocomputetheincrementalcost-utilityratiobycomparingcostvariationtoutilityvariation:wethusobtain the cost to pay for one year in a perfect stateof health. The issue is then toquestionifthiscostisaffordablefromasocialpointofviewornot.Itdependsonthecollectivewillingnesstopay.ThethresholdforsuchawillingnesstopayforoneyearinperfecthealthisnotrevealedinFrancebytheHAS.However,itisknownfortheUnitedKingdom,andthisthresholdrangesbetween£20,000and£30000,i.e.ineuros€25,840and€38,760.Thisthresholdrevealstheuppercollectivewillingnesstopayforayearinperfecthealthandhasindeedaconnectionwiththestatisticalvalueofahumanlife.AlthoughthisrangerepresentsthelowervalueclassforanextraQALY(Shiroawaetal.,2010),weproposetotakeasareference€40,00084.Wedrawthereader’sattentiontothemethodologicalprecautionswiththisassumption,requiringustotodeducethevalueofstatisticallife(VSL)fromthethresholdofwillingnesstopayforoneadditionalQALYgained(andsoonthevalueofoneyearofhumanlifeVHL)(Commissariatgénéraldelastratégieetdelaprospective,2013).Asstated,themainobjectiveistoproposeaframeworkandourassessmentisbasedonshortperiodsoftime(withouttakingaccountofvalueofhumanliferelatedtoage).Moreover,weusetheassessmentmethodfoundintheliterature,inordertocompareroughvaluesforlackofpossibilitytosetupacost-effectivenessanalysis.Economicevaluationsaboundforcochlearimplants,forwhichitispossibletocomparetwostrategies(implantsvstraditionalcare)andtoinferanincrementalcost-effectivenessratio(costvariation/utilityvariation).However,itistrickiertofindintheliteratureareferencescaleforaverageutilityscoresrelatedtoeachagegroupandeachlevelofhearinglossseverity,especially as these scores themselves depend on the assessment tool (EQ-5D, HUI3…).Therefore,severalreferencevalueshavebeentakenasreferencesfromthestudyofquality
82Cf.www.euroqol.organdwww.healthutilitiesindex.com83Example:ifthelossinutilityassociatedwithaprofoundhearinglosswereestimatedto-0.46over10years,thepersonwouldgetascoreof0.54forhealthstate,soitcanbededucedthatthishealthstatewouldrepresent5.4QALYsinsteadof10QALYsifhe/shewereinperfecthealth(inotherwords,thedegradationofhealthstatehasresultedinalossof4.6yearsinperfecthealth).Ifhearingaidequipmentallowedthepersonareductioninutilitylosswithascoreof0.74(loss:-0.26)thenthepersonwouldgetahealthstateestimatedtobeat7.4QALYsfor10yearsoflife,meaningagainof2QALYsthankstohearingaids.Infact,thisassessmentshouldtakeintoaccountthediscountrate(timepreference)butitwon’tbenecessarytoapplyitinourestimationasfarasitreliesontheeconomicburdenin2014(oneyear).Thisisverycomplicated84TheauthorsestimatedforexampletheAustralianthresholdtobeat€43,112,theAmericanthresholdtobeat€56,374,butthesethresholdswouldbeseveralmillioneurosinAsiancountries.Shield(2006)hastakenonthevalueof€44,000,asdefinedbytheEuropeancommissionfortheEnvironmentin2003.

81
of life led by Shield (2006)85, who has proposed a frame of reference for the Europeanpopulation(table29).
Table29–Frameofreferenceforutilityscoresinhearingloss
Source:AuthorsonbasisofShield(2006)andapplyinga40,000€valueforoneadditionalQALYgained
More than the absolute value of scores, these score variations are meaningful here. Forexample,ifwewereapplyingtheHUI3questionnairewhichincludesadirectquestionrelatedtohearingdimension:
- Apersonwouldhaveascoreof0.788ifhe/shehasdeclarednolimitationotherthan:o “abletohearwhatissaidinaconversationwithanotherpersoninaquietroom
withahearingaid,andabletohearwhatissaidinagroupconversationwithatleastthreeotherpeoplewithahearingaid”;
o “somewhathappy”.
- AsfortheEQ-5D-3Lquestionnaire,adecrease inthescorewouldhappenfortheseillustrativecases:
o A personwho has “some problemswith performing usual activities”wouldhavealossintheirscoreof0.117(ifnootherlimitation);
o Apersonwhodeclares “moderatepainordiscomfort”wouldhavea loss inscoreof0.204(ifnootherlimitation);
o Apersonwhocumulatesthesetwolimitationswouldhavea loss inscoreof0.24(ifnootherlimitation);
2.2.2.2 Annualcostofhearingloss(2014)accordingtothequalityoflifeperspectiveStartingfromthedatacollectedinthefirstsectionaswellasanalysesrelatedtoeconomicburdenandqualityoflife,weproposeanestimationoftheeconomiccostofnon-equippedhearingloss.Thecomponentsofcostsaretrickytoevaluatesincewedonotknowdirectmedicalandnon-medicalcosts,includingcostsrelatingtothesocialdomain,nordoweknowtheindirectcosts
85Thesecondestimationmethodconsistsofanassessmentoflostrevenuesbecauseofhearingloss.Thismethodseemstobelessadvisabletotheextentthatalargeproportionofhearingimpairedpeopleareolderandalsobecausethishumancapitalapproachislessused.Moreover,thequalityoflifeapproachpresentstheadvantageofcoveringallthedimensions,includingoccupationalones(particularlyinHUI3questionnaire).

82
(lossofproductivity).Asconcernstheeconomicburdenofillness,weestimateitbyqualityoflifemethod.Thismethodrequiresdefinitionofthefollowingvariables:
- TheFrenchadultpopulationaffectedbyhearinglossaccordingtothedifferentlevelsofseverity;
- TheFrenchadultpopulationwhoarenothearingaidequippedandwhoshouldbe(eligiblepopulationbutnotowninghearingaids);
- TheFrenchadultpopulationbeingequippedbutnotusingitshearingaids;- Thequalityoflifeassociatedwiththedifferentlevelsofseverity;- Themonetaryvalueassociatedwithahealthyyearoflife.
ThesurveyHandicap-Santé2008presentedchartsofhearinglossprevalenceaccordingtoofseveritylevels,butwithoutreleasingthepreciseoccurrences.Aswedonotknowthesevaluesbyagegroups,wehaveretainedthoseofthe1998surveyinordertoestimatehearinglossprevalencefortheadultpopulationin2014accordingtoseveritylevels(rememberthatthesedatahaveremainedsteadyovertime,asshowninthefirstsection):
Table30–Referenceratesforhearinglossprevalenceaccordingtoseveritylevels
Source:SurveyHandicapsanté1998
Onthebasisofdemographicdatafortheyear2014(databaseEco-santéOCDE),wededuceheadcountsbyagegroupsinmainland‘metropolitan’FranceandforallFrenchpossessions(‘thewholeof’France)(table31).
Table31–EstimationofFrenchadultpopulationin2014affectedbydisablinghearingloss(moderatetototalAFLfollowingthedefinitionoftheDREES2014)
Source:Authors,datapop.Eco-Santé2016,dataprevalenceHS1998
Asmentionedabove,andbyhypothesis,theaveragehealthscoreforanadultinEuropeis0.85and:
- Amoderatehearinglossleadstoa0.05lossinutility(scoreof0.8);- Aseverehearinglossleadstoa0.15lossinutility(scoreof0.7);- Andaveryseverehearinglossleadstoa0.15lossinutility(scoreof0.6).
Themonetaryvalueforahealthyyearisfixedat40,000euros.
Prevalence rate/1000
people
Slight to moderate
Moderate to severe
Very severe to total
<20 12.3 0.7 1.320-39 18.3 2.7 140-59 51.5 17.6 2.860-74 157 56.6 8.8
75 and over 229.6 158.7 37.3Overall 50.4 24.6 5.2
Stat. Eco santé year
2014
Stat. Eco-santé year
2014
Group age Moderate SevereVery severe to
totalMetrop. France
Overall France Moderate AFL Severe AFLVery severe to
total AFL Moderate AFL Severe AFL
Very severe to total AFL
20 à 39 ans 1.83% 1,0% 0.1% 15 551 014 16 001 614 284 584 155 510 15 551 292 830 160 016 16 00240 à 59 ans 5.15% 1.76% 0.28% 17 180 853 17 709 879 884 814 302 383 48 106 912 059 311 694 49 58860 à 74 ans 15.7% 5.66% 0.88% 9 720 665 9 941 571 1 526 144 550 190 85 542 1 560 827 562 693 87 486
75 ans ou plus 22.96% 15.87% 3.73% 5 875 312 5 976 043 1 348 972 932 412 219 149 1 372 099 948 398 222 906
AFL severityMetropolitan France 2014 - Number of
peopleOverall France 2014 - Number of people
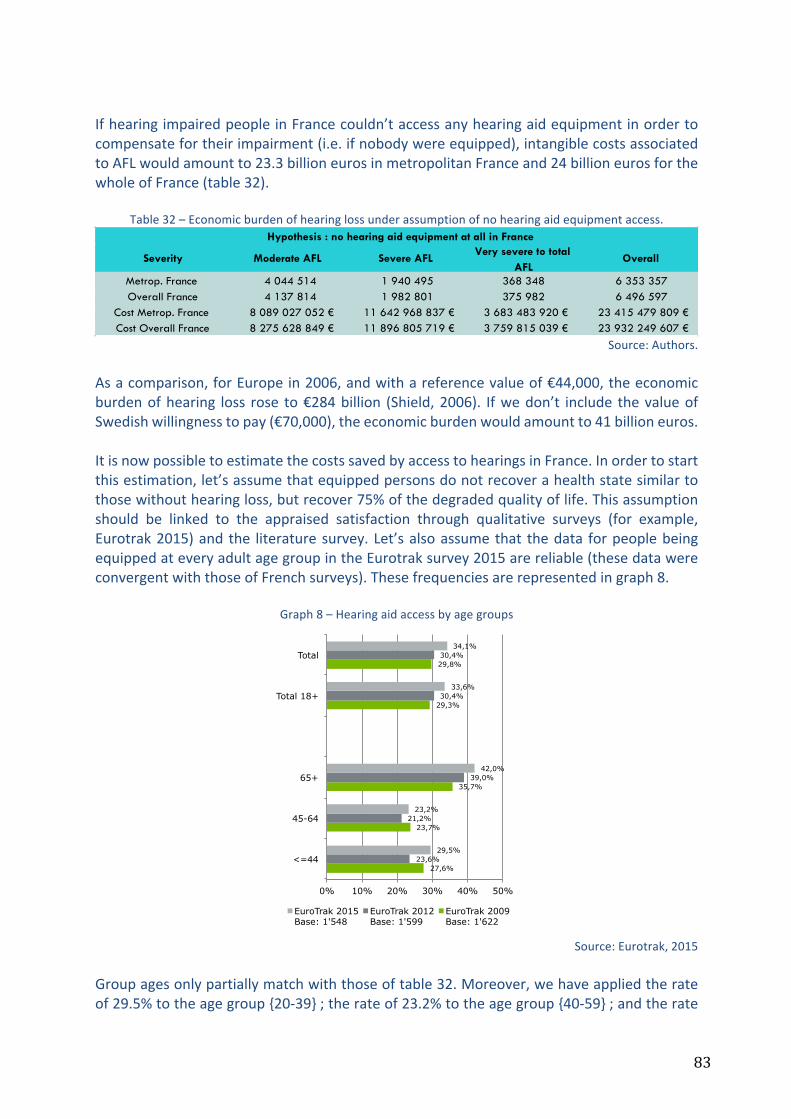
83
IfhearingimpairedpeopleinFrancecouldn’taccessanyhearingaidequipmentinordertocompensatefortheirimpairment(i.e.ifnobodywereequipped),intangiblecostsassociatedtoAFLwouldamountto23.3billioneurosinmetropolitanFranceand24billioneurosforthewholeofFrance(table32).
Table32–Economicburdenofhearinglossunderassumptionofnohearingaidequipmentaccess.
Source:Authors.
Asacomparison,forEuropein2006,andwithareferencevalueof€44,000,theeconomicburdenofhearing loss rose to€284billion (Shield,2006). Ifwedon’t include thevalueofSwedishwillingnesstopay(€70,000),theeconomicburdenwouldamountto41billioneuros.ItisnowpossibletoestimatethecostssavedbyaccesstohearingsinFrance.Inordertostartthisestimation,let’sassumethatequippedpersonsdonotrecoverahealthstatesimilartothosewithouthearingloss,butrecover75%ofthedegradedqualityoflife.Thisassumptionshould be linked to the appraised satisfaction through qualitative surveys (for example,Eurotrak2015)and the literaturesurvey.Let’salsoassumethat thedata forpeoplebeingequippedateveryadultagegroupintheEurotraksurvey2015arereliable(thesedatawereconvergentwiththoseofFrenchsurveys).Thesefrequenciesarerepresentedingraph8.
Graph8–Hearingaidaccessbyagegroups
Source:Eurotrak,2015
Groupagesonlypartiallymatchwiththoseoftable32.Moreover,wehaveappliedtherateof29.5%totheagegroup{20-39};therateof23.2%totheagegroup{40-59};andtherate
Severity Moderate AFL Severe AFLVery severe to total
AFLOverall
Metrop. France 4 044 514 1 940 495 368 348 6 353 357Overall France 4 137 814 1 982 801 375 982 6 496 597
Cost Metrop. France 8 089 027 052 € 11 642 968 837 € 3 683 483 920 € 23 415 479 809 €Cost Overall France 8 275 628 849 € 11 896 805 719 € 3 759 815 039 € 23 932 249 607 €
Hypothesis : no hearing aid equipment at all in France
27,6%
23,7%
35,7%
29,3%
29,8%
23,6%
21,2%
39,0%
30,4%
30,4%
29,5%
23,2%
42,0%
33,6%
34,1%
0% 10% 20% 30% 40% 50%
<=44
45-64
65+
Total 18+
Total
EuroTrak 2015 Base: 1'548
EuroTrak 2012 Base: 1'599
EuroTrak 2009 Base: 1'622
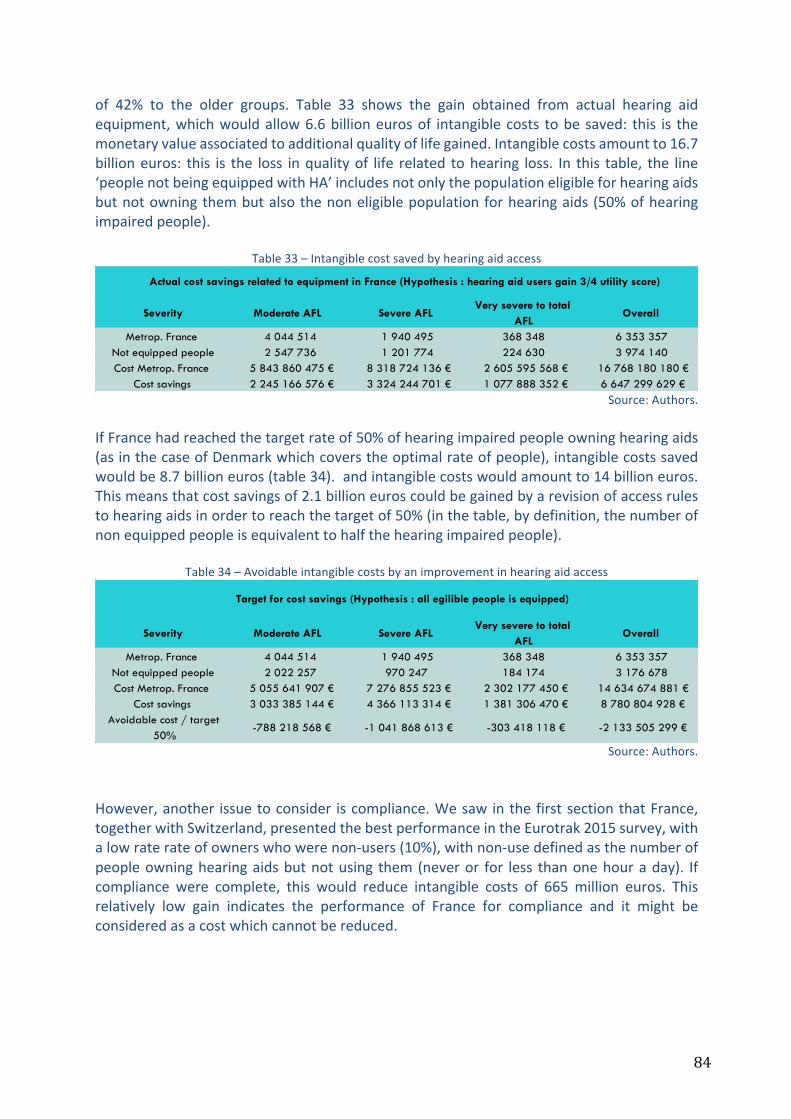
84
of 42% to the older groups. Table 33 shows the gain obtained from actual hearing aidequipment,whichwouldallow6.6billioneurosof intangiblecosts tobesaved: this is themonetaryvalueassociatedtoadditionalqualityoflifegained.Intangiblecostsamountto16.7billioneuros: this is the loss inqualityof life related tohearing loss. In this table, the line‘peoplenotbeingequippedwithHA’includesnotonlythepopulationeligibleforhearingaidsbutnotowningthembutalsothenoneligiblepopulationforhearingaids(50%ofhearingimpairedpeople).
Table33–Intangiblecostsavedbyhearingaidaccess
Source:Authors.
IfFrancehadreachedthetargetrateof50%ofhearingimpairedpeopleowninghearingaids(asinthecaseofDenmarkwhichcoverstheoptimalrateofpeople),intangiblecostssavedwouldbe8.7billioneuros(table34).andintangiblecostswouldamountto14billioneuros.Thismeansthatcostsavingsof2.1billioneuroscouldbegainedbyarevisionofaccessrulestohearingaidsinordertoreachthetargetof50%(inthetable,bydefinition,thenumberofnonequippedpeopleisequivalenttohalfthehearingimpairedpeople).
Table34–Avoidableintangiblecostsbyanimprovementinhearingaidaccess
Source:Authors.
However,another issuetoconsider iscompliance.WesawinthefirstsectionthatFrance,togetherwithSwitzerland,presentedthebestperformanceintheEurotrak2015survey,withalowraterateofownerswhowerenon-users(10%),withnon-usedefinedasthenumberofpeopleowninghearingaidsbutnotusing them(neveror for less thanonehouraday). Ifcompliance were complete, this would reduce intangible costs of 665million euros. Thisrelatively low gain indicates the performance of France for compliance and it might beconsideredasacostwhichcannotbereduced.
Severity Moderate AFL Severe AFLVery severe to total
AFLOverall
Metrop. France 4 044 514 1 940 495 368 348 6 353 357Not equipped people 2 547 736 1 201 774 224 630 3 974 140Cost Metrop. France 5 843 860 475 € 8 318 724 136 € 2 605 595 568 € 16 768 180 180 €
Cost savings 2 245 166 576 € 3 324 244 701 € 1 077 888 352 € 6 647 299 629 €
Actual cost savings related to equipment in France (Hypothesis : hearing aid users gain 3/4 utility score)
Severity Moderate AFL Severe AFLVery severe to total
AFLOverall
Metrop. France 4 044 514 1 940 495 368 348 6 353 357Not equipped people 2 022 257 970 247 184 174 3 176 678Cost Metrop. France 5 055 641 907 € 7 276 855 523 € 2 302 177 450 € 14 634 674 881 €
Cost savings 3 033 385 144 € 4 366 113 314 € 1 381 306 470 € 8 780 804 928 €Avoidable cost / target
50%-788 218 568 € -1 041 868 613 € -303 418 118 € -2 133 505 299 €
Target for cost savings (Hypothesis : all egilible people is equipped)
85
Table35–Avoidableintangiblecostsbyanimprovementincompliance
Source:Authors.
Hence,thiscostreductiontargetrelyingoncomplianceimprovementseemstobedifficulttomeet since theFrenchperformance is in itself a referencepoint compared to someothercountries (Norway,Denmark, theUnitedKingdom).Conversely, letus study the intangiblecosts saved in France due to its better compliance in comparison to these countries. Forexample,ifwetaketheDanishratethereare20%ofnoncomplyingpatients:
Table36–AvoidedintangiblecostsinFranceincomparisontotheDanishcompliancerate
Source:Authors.
IfinFrance20%ofpatientswerenon-compliant(insteadof10%),intangiblecosts(orvalueofthelossofqualityoflife)wouldbeincreasedby1billioneuros.Thisstatementhastobeplacedinperspectiveagainsttheanalysisofhealthsystemorganisation:freedelivery,asinDenmark,allowsalmosttotalcoverageforthepeopleeligibleforequipment.However,theweakerpatientfollow-upassociatedwiththisfreedeliveryinNHSsystemsleadstoalossineffectiveness,which translates into a ‘loss’ of hearing aid users, and so into in additionalintangiblecosts.Therefore, it is necessary to simultaneously support hearing aid access, to give strongincentives to audiologists to improve the quality of follow-up services and to give strongincentivesforpatientstousethesefollow-upservices.
Severity Moderate AFL Severe AFLVery severe to total
AFLOverall
Metrop. France 4 044 514 1 940 495 368 348 6 353 357Not equipped people 2 697 414 1 275 646 239 002 4 212 061Cost Metrop. France 6 068 377 133 € 8 651 148 606 € 2 713 384 404 € 17 432 910 143 €
Cost savings 2 020 649 919 € 2 991 820 231 € 970 099 516 € 5 982 569 666 €Avoidable cost / perfect
compliance-224 516 658 € -332 424 470 € -107 788 835 € -664 729 963 €
Target for compliance (Hypothesis : all HAs owners are users)
Severity Moderate AFL Severe AFLVery severe to total
AFLOverall
Metrop. France 4 044 514 1 940 495 368 348 6 353 357Not equipped people with Danish values (including
compliance)2 426 708 1 164 297 221 009 3 812 014
Cost Metrop. France 5 662 318 936 € 8 150 078 186 € 2 578 438 744 € 16 390 835 866 €Cost savings / initial
situation2 426 708 116 € 3 492 890 651 € 1 105 045 176 € 7 024 643 943 €
Cost savings regarding the Danish compliance
-406 058 197 € -501 070 420 € -134 945 660 € -1 042 074 277 €
Cost savings regading the Danish rate for compliance
86
2.2.2.3 Additionalhealthcarecostsduetonon-equippedhearinglossandefficiencyofhearingaidsregardingeligiblepopulation:approximations
The previous scenario was an exercise which permitted the estimation of the impact ofhearingaidaccessandcomplianceonadditionalqualityof lifegain,asvalued inmonetaryterms.Itisalsointerestingtodesignanassessmentscenarioinordertoestimatethesizeofhearingaidcosts,ofsavingcostsrelatedtoequipmentandofqualityof lifebenefits.Onceagain,weproposeasimulationexerciserelyingonsomeassumptions:
- Thetotalnumberofpeopleaffectedbyhearingloss(moderate,severeandverysevereAFL)in2014isassessableonthebasisofprevalenceratesbyagegroupsinthesurvey‘Handicap-Santé 1998’ (table 30) and on the estimated demographic population inmetropolitanFrancein2014(Eco-santéOCDE);
- ThenumberofthishearingimpairedpopulationnotaccessinghearingaidsisavailableintheEurotrak2015survey,aswellasthecompliancerate(10%ofhearingaidownersarenotusers);
- Thedegradationofqualityoflifeaccordingtoimpairmentseveritylevelsisassessable
onthebasisofShield’sreferences(2006),sincetheyseemtobereliableregardingtherecentliterature(table29);
- Hearingimpairedpeopleeligibleforhearingaidsbutwhoarenotequippedisrelated
toanadditionalcostintermsofhealthcareconsumption,becauseofthemorbiditylinkedtohearingloss.WeassumethatthisadditionalannualcostdependsontheAFLseverity and we retain as monetary values: +400 euros/moderate AFL, +1,200euros/severe AFL and +2,000 euros/very severe AFL. These estimations are verydebatable, but they rely on the IRDES study (Sirven and Bougueil, 2016) whichestimatedthattheadditionalhealthcarecostforfrailpeopleamountedto2,000eurosaperson/year.Moreover,theprevioussurvey(seeFoley,2014)showedanincreaseinhealthcareexpenditureforhearingimpairedpeoplerangingaround+39%incontrastto the same population without hearing loss: in France, the average health careexpenditurepercapitaamountsto3,000eurosbeyondageof55,thereforeanaverageadd-onof1,000eurosrelatingtoseverehearinglossseemstobereliable.Assumingthat thismonetaryadd-on isassociatedwith thehigher loss inqualityof life score(0.25),wecanseethevaluesfora0.15lossofutility(1,200euros)andfora0.05lossofutility(400euros).Thislinearityincostsisalsodebatable.Nevertheless,takingintoaccountthepreviouslyunderlinedelementsconcerninghearinglossmorbidityeffects,thisseemsanappropriateestimate;
- Weassumethatthecomplyinghearingaidusershavealowerlossinutility(thisloss
isreducedby75%becauseofsatisfactionlinkedtohearingaids),butastheydonotreturntothesamehealthstateasthesamepeoplewithouthearingloss,weassumethat additional annual health care costs are, following the AFL severity levels: 100euros;300euros;500euros(asaproportionalreductionofhealthcarecostsof75%inrelationtohearingimpairedpeoplewhoarenotequipped);

87
- Weestimatetheadditionalcostofhearingaidaccessandthesavingcostaccordingtopopulationtypes(HAsownersandusers/HAsnotownersorHAsownersnotusers)and according to hearing loss severity for the French population if the equipmenttargetof50%wasreached(thatisthewholeeligiblepopulation);
- Theadditionalcostsavingsrelyingonoptimalaccessarethenestimatedonthebasis
ofthesevalues,takingintoaccountnon-compliance(whichisconsideredtobenon-improvable). This cost is estimated for 6 years (themedian life span of a piece ofequipment). This is then the additional health care cost born by society, and isattributabletothelackofhearingaidaccessfortheeligiblepopulation.
Thus,undertheseassumptions,thehealthcarecostsavingsamountstoaround290millioneurosfor2014,thatis,for6yearsandinconstanteuroswithoutdiscounting,1.7billioneuros.This is themorbidity cost related to disabling hearing loss that could be saved by all thefinancing contributors (National health Insurance, complementary health insurances andpatients)ifanoptimalaccessforhearingaidswereimplementedforeligiblepeople(50%ofthe whole hearing impaired population), taking into account a non-modifiable loss ofeffectivenessrelatedtoacompliancerateof10%(hearingaidownersbutnon-users).Next,thenumberofpeopletoequip(includingbothcompliantandnon-compliantgroupsasitisnotpossibletodistinguishbetweenthemforhearingaidaccess)isestimatedinrelationtothetarget.Weassessthecostofhearingaidequipmentforthiseligiblepopulation(797,461people).Onthebasisofourreferencevalues–theunitcostforahearingaid(€1,535),averagecostofaninitialENTconsultation(€50)andannualbatterycost(€50/year),wecanestimatethe total costofhearingaidequipment for this additionalpopulation for6 years (medianlifespanofequipment).Thisequipmentcostwouldamountto1.5billioneurosover6years.Yet,thisadditionalequipmentcostwouldallowustoavoidoverthesametime(6years)1.7billioneurosintermsofhealthcareexpenditure(takingintoaccountcompliance),thatis,asavingof200millioneuros.Finally,weestimatethequalityof lifebenefits for this fractionofpeoplewhowerenewlyequippedduringthe6yearsofequipment,takingintoaccountcompliancerateandthepartialrecoveryofqualityof life forpeoplebothequippedandcompliant.Thisutilitygainwouldrangearound48,000QALYsfor685,817people.Underalltheseassumptions:
- Thetotalcostofequipmentforeligiblehearingimpairedpersons(compliantornot),estimatedtobe1.5billioneurosandlinkedtoabenefitof48,000QALYs(forcompliantusers),leadstoanincrementalcost-effectivenessratioof€5,462/QALY.Itmeansthatacostof€5,219€gainsonehealthyyear,whichisaratiolargelybelowthepreviousthresholdsofwillingnesstopay.Evenifthegaininqualityoflifeweremarkedlylower(forexample,5 times lower), this ratiowoulddeservebeconsideredasa trade-offregardingthesethresholds(€26000/QALY);
- Ifwecomparethenetdifferentialcost(additionalcostofequipmentminushealthcarecost savings), the incremental cost-effectiveness ratio (ICER) would be equal to -

88
€830/QALY: inotherwords, thetargetstrategyof ‘alleligiblepeopleareequipped’savescostsandprovidesanincreasedqualityoflife,andisthusthedominantstrategy.
Underwhichassumptionswouldthetargetstrategyof‘alleligiblepeopleareequipped’berejected?ItwouldbethecaseifeithertheincreaseinQALYsgainedwas5timeslessthaninthiscasestudy(thatisanunlikelysituationgiventheliteratureontheassociationbetweenhearinglossandmorbidityandregardingthelowscorevariationsofutilityemployedinthecase study), or if the additional costs related to hearing loss (in terms of health careexpenditureimpact)weremuchlower:
- Ifwehalvethehealthcarecostreferencevaluesforallseveritylevels(thatis€200;€600; €1,000 for people being not equipped and €25; €75; €125 for people beingequipped)theICERwouldamountto€9,759/QALY.
- TheICERwouldamountto€9,085/QALYwiththecostreferencevaluesof€0;€600;1,000€forpeoplebeingnotequippedand€0;€150;€250forpeoplebeingequipped).
Evenunderrelaxedassumptionsaboutthehealthcarecostsforahearingimpairedpersonnotbeingahearingaidowner,theICERremainssociallyacceptable.Beyondassumptionsrelatingtothissimulationexercise,itshouldbenotedthatwehavenotprovided an estimation for indirect costs (for example, the impact of hearing loss onproductivity)orsocialcostslinkedtodependency.Thesedimensionswouldraisethetotalcostsavings.Thisentirecasestudy,whichreliesonacceptableassumptions,underlinestherequirementforasubstantialeconomicassessmentthatwouldcorroboratetheseresults,thatisthehighlyefficienttargetstrategythat‘alleligiblehearingimpairedpeopleareequipped’.However, itremainstosolvethetouchyquestionofhearingaidfinancing likelytosupportaccesstothem,andespeciallythequestionoftherelativefinancialcontributionsofpayers,asseen inthefirstsectionofthereport.Moreover, if theNationalHealth Insurancecouldgreatlyincreaseitsfinancialroleinhearingaidreimbursement,wewouldanticipateabounceeffect for people being equipped but having postponed hearing aid renewing. This effectwouldinevitablyincreasethebudgetimpactofhearingaidaccess.

89
Table37–Scenarioforaneconomicassessmentofthestrategy‘alleligiblehearingimpairedpeopleareequipped’

90
3 ConclusionThisoverviewofhearinglossandhearingaidaccessinFranceemphasizesfourmainlessons,inthelightofinternationalcomparisonsandofmedicalscientificliterature:
1) Disabling hearing loss (or moderate to total auditive functional limitations), byreducing theperson’s communication capacities, rebounds significantly onbroaderdimensions of health state (mobility, autonomy, daily activities, pain/discomfort,anxiety/depression) through a succession of chain reactions, the main ones beingsocialisolation,cognitivedecline,sufferingatwork,mentaltroublesandfalls.Hearinglossrepresentsamajorimpairmentwhich,byaffectingmorethansixmillionFrench(oftenolder)people,notonlyhasdeleteriouseffectsonqualityoflifebutalsoleadstoadditionalhealthandsocialcareexpendituresforsocietyasawhole;
2) The health policy for secondary prevention, that could consist of screening andequippinghearingimpairedpeoplewithhearingaids,isnon-existentregardingpublicreimbursement.NationalHealth Insurance, by covering only 8%of the hearing aidprice for adults, has almost excluded hearing loss from itsmanagement policy forhealth risk, leaving theout-of-pocketpayment to complementary insurancebodiesandabovealltopatients.Infine,families,closerelativesandthewholesocietybearthecostsofthisimpairment,aswellasforthelossofautonomysinceonethirdoftheeligiblepopulationforhearingaidsdon’tgetthem.Moreover,inequalitiesrelatingtothe rights of those insured with complementary health bodies, their revenue andabilitytopayforequipmentcontributetomaintainthesesocialinequalitiesinhealth,bytherenouncementeffect.
3) Asconcerningpaymentschemesforaudiologists,reflectionmusttakeplaceastheir
effectiveness.Inordertoregulatethehearingaidsectorandtodesignanincentivepayment for hearing aids, a trade-off is necessary between the objectives ofexpenditurecontrol,healthcarequalityandfreedomofchoice;thismusttakeplaceinahypotheticframeworkwhichassumesahighercoverageofhearingaids.Therearemanytoolswhichwouldallowustofindtheoptimaltrade-offforpublicfinancing,butwemustbeverycautiousabouttheissueofapossibledecouplingofthedeviceandtheservice.Thisdecouplingmodelbringsupadverseeffectswhicharesimilartothoseof‘cost-plus’payment,leadingtoincreasingpricesandputtingpatients’complianceatstake,thatisthetherapeuticefficiencyofhearingaidsforsomepatients.Atthesametime,recoursetoprospectivepaymentsystemsisincreasinglyimplementedforpricinginhealthsystems,andasagrowingattentionispaidtopatients’empowerment,thisconceptofdivisibilityofdevice/servicefallsintoanold-fashionedeconomicapproachin terms of optimal incentives. International comparisons highlight the impact ofcoverageandhealthcareorganisationonhearingaidaccess,equipmentrenewalandpatients’compliance.
4) TheimperativerevisionofcoveragerulesforhearingaidsinFrancehastotakeintoaccountnotonlytheincentivesofpaymentschemesforaudiologists,butalsocost-effectivenessstudieswhichshedlightontheevidenceregardingexpectedserviceof
91
hearingaids.Byintuition,thisexpectedserviceisatleast‘important’,evenextremelyso:
- Adult hearing aid owners – that is two thirds of the eligible population for
equipment–bypayingoutoftheirownpocket950euros(oneear)to1,900euros(twoears),purchasetheequipmentdespitethefinancialcharge,whichindicatesthenatureofthebenefit(fundamentalone);
- The medical scientific literature unambiguously reports the negative waterfalleffectsofhearingloss,butalsoshowthebeneficialeffectsofhearingaidaccess(atleastoncognitivedeclineandmentalhealth,sincethesystematicreviewsonthistopicareexpectedfor2016);
- The simulation exercise of the cost-utility ratio that has been proposed in thisreport,althoughrelyingonsimplisticassumptions,givessomeapproximatevaluesthat lead one to believe in the efficiency hearing aid strategy, and even in adominanthearingaidstrategyforsocietyasawhole.
ThesefourmainlessonsleadtosomeproposalsfortheregulationofthehearingaidsectorinFrance:
§ Toreinforcepublicauthorities’ informationatalldecisionmakinglevelsofthehealthsystemontheburdenofhearingloss:- on the basis of a systematic review of the medical and economic scientificliterature;- through prospective cost-efficiency assessments, by collecting useful data insequentialorregularsurveysbasedontheworkingandolderpopulation,inordertoinferthedifferentialcost-utilityratiobetweenstrategies;-byestimatingthebudgetimpactofhearingaidequipmentdependingonseveralcoveragescenariosfromtheNationalHealthInsurance’spointofview.
§ Beforehealthcaredemand:
- inform the whole population on the consequences of noise exposure andpresbycusis;-toreformaccessrightsforhearingaidsindependentlyofstatusconsiderations(illness, impairment,oldage) inordertosetupa levelplayingfieldforhearingimpairedpeopleinFrance.
§ Followinghealthcaredemand:
-Toensureasufficientcoverageofneedswitharefundingofcheaperequipment,on thebasisofaprospective fixedpriceandaminimum lengthofuse,and letwillingpatientspayfortheirownfreechoiceinthefaceofdifferentiateddevices,followingtheprincipleoftheresponsiblyfixedtariffappliedtodrugsinFrance;- To inform people who need equipment about the expected service for thedifferenttypesofhearingaids,bydisassociatingcommonandrecognisedqualitiesinauditiverehabilitationfromcomfortoptions;-Toassess,fromtheNationalHealthInsurancepointofview,thebudgetimpactrelatedtoreimbursementrulesrevision, includingnotonlyeligiblepeoplewho

92
arenothearingaidownersbutalsoremediationbehaviourforpeopleequippedformorethansixyears.
§ Beforehealthcaresupply:- To link, using appropriate incentives, networks of general practitioners andoccupational health doctors in a secondary prevention campaign in real-time,duringmedicalconsultationsofpeopleattheendoftheiractivelife,aged60-65.This screening could be carried out with little costs on the basis of a shortquestionnairecomprisingtwoquestionsthatalloweasyidentificationofhearinglossoccurrence.
§ Followinghealthcaresupply:
-Tomaintain theprincipleofaprospectivepayment– forwhich the incentiveproperties are well-known – for audiologists, in order to promote bothexpenditurecontrolandhealthcarequality,thentopromotethecomplianceandtherapeuticefficacyofhearingaidsforallpatients,whatevertheircapabilitytopay.
Theseoverallsuggestionshavefoundtheirjustificationintheanalyticalsurveyoftherecentliteraturepresentedinthisreport.TheyimposetheneedforanurgentexaminationoftheregulatoryrulesforthehearingaidsectorinFrance,atamomentwhereageing,andlisteningtoamplifiedmusicamongtheyoungriskscontributingtoaggravatedhearinglossprevalenceinFrance.

93
ReferencesAcar B, YurekliMF, BabademezMA, Karabulut H, Karasen RM. Effects of hearing aids oncognitivefunctionsanddepressivesignsinelderlypeople.ArchGerontolGeriatr.2011May-Jun;52(3):250-2Archbold Sue, LambBrian,O’Neill Ciaran,Atkins John. The real cost of adult hearing loss:reducing its impact by increasing access to the latest hearing technologies, The earfoundation.2014.24p.Alcimed-Directionde la sécurité sociale.Analyseéconomiquedusecteurdesappareillagesoptiquesetauditifs.Rapportfinal.2011.Mars.121p.Alcimed-CNSA. Etude européenne sur le marché des aides techniques destinées auxpersonneshandicapéesetâgéesenperted’autonomie.Synthèsetransversaleetannexeaidesauditives.2009.Décembre.AmievaH,OuvrardC,GiulioliC,MeillonC,RullierL,etal.Self-ReportedHearingLoss,HearingAids, and Cognitive Decline in Elderly Adults: A 25-Year Study. J Am Geriatr Soc. 2015Oct;63(10):2099-104.Autoritéde laConcurrence.Décisionn°16-SOA-01du3 février2016 relativeàune saisined’officepouravisportantsurlesecteurdesaudiprothèses.2016.Fév.8p.BainbridgeKE,HoffmanHJ,CowieCC.DiabetesandhearingimpairmentintheUnitedStates:audiometricevidence fromtheNationalHealthandNutritionExaminationSurvey,1999to2004.AnnInternMed.2008;149:1–10.BernabeiV,MoriniV,MorettiF,MarchioriA,FerrariB,etal.Visionandhearingimpairmentsareassociatedwithdepressive--anxietysyndromeinItalianelderly.AgingMentHealth.2011May;15(4):467-74.Commissiond’évaluationdesproduitsetprestations.Avisdelacommission01/04/2008surles dispositifs appareils électroniques correcteurs de surdité (titre II, chap.3 de la LPPmentionnésàl’articleL.165-1ducodedelasécuritésociale).2008.Avril.22p.Comitééconomiquedesproduitsdesanté.Rapportd’activité2014/2015.2015.Septembre.Commissariatgénéralàlastratégieetàlaprospective(RapportBaumstarkL,DervauxB,treichN).Elémentspourunerévisiondelavaleurdelaviehumaine.Rapportsetdocuments.Tome2.2013.Avril.28p.Conseiléconomique,socialetenvironnemental(BeaudetT,CoutyE).Laplacedesdispositifsmédicauxdanslastratégienationaledesanté.2015.Janvier.66p.
94
Courdescomptes.L’accèsauxsoinsdesménagesdéfavorisés:unbilanendemi-teinte,uneactionàmieuxcibler(chapitreXIIdurapportSécuritésociale).2015.Sept.pp.415-448.Cour des comptes. Les dispositifs médicaux: une dépense non maîtrisée (chapitre X durapportSécuritésociale).2014.Sept.pp.291-318.Courdescomptes.Lapriseenchargeparlesorganismesdeprotectionsocialedel’optiquecorrectriceetdesaudioprothèses(chapitreXIVdurapportSécuritésociale).2013.Sept.Pp.393-420.Conseilnationaldelaconsommation.RapportduCNCrelatifauxprothèsesauditives.2000.Mars.NOR:ECOC0000082X.Consultableenligne.DavisA,SmithP,FergusonM,StephensD,GianopoulosI.Acceptability,benefitandcostsofearlyscreeningforhearingdisability:astudyofpotentialscreeningtestsandmodels.HealthTechnolAssess2007;11(42).DawesP,EmsleyR,CruickshanksKJ,MooreDR,FortnumH,etal.Hearinglossandcognition:theroleofhearingAIDS,socialisolationanddepression.PLoSOne.2015;10(3)DranoveD,SatterthwaiteMA.Theindustrialorganizationofhealthcaremarkets.Chp.20inHandbookofhealtheconomics.Vol1.PartB.ed.Elsevier.2000.pp1093-1139.Eco-SantéOCDE.Opendatabase.http://www.ecosante.frValuesonFebruary2016.EHIMA. Market surveys Eurotrak (2009, 2012, 2015). Available onlinehttp://www.ehima.com/documents/FergusonMA,KitterickPT,Edmondson-JonesM,HoareDJHearingaidsformildtomoderatehearinglossinadults(Protocol).Thecochranecollaboration.Ed.Wiley.2015.FellingerJ,HolzingerD,GerichJ,GoldbergD.Mentaldistressandqualityoflifeinthehardofhearing.ActaPsychiatrScand.2007Mar;115(3):243-5.FisherD,LiCM,ChiuMS,ThemannCL,PetersenH,etal.Impairmentsinhearingandvisionimpactonmortalityinolderpeople:theAGES-ReykjavikStudy.AgeAgeing.2014Jan;43(1):69-76.FoleyDM,FrickKD,LinFR.AssociationofHearingLossandHealthCareExpendituresinOlderAdults.JournaloftheAmericanGeriatricsSociety.2014;62(6):1188-1189.Garnero M, Le Palud V (DREES). Les contrats les plus souscrits auprès des organismescomplémentairessantéen2010.DocumentdetravailSériestatistiques.N°191.2014.Août.78p.GentherDJ,FrickKD,ChenD,BetzJ,LinFR.Associationofhearinglosswithhospitalizationandburdenofdiseaseinolderadults.JAMA.2013Jun12;309(22):2322-4
95
GentherDJ,BetzJ,PrattS,etal.AssociationofHearingImpairmentandMortality inOlderAdults. The Journals of Gerontology Series A: Biological Sciences and Medical Sciences.2015;70(1):85-90.GodinhoL..Analysesectorielledusecteurdel’audioprothèseenFrance.Documentdetravail.2015a.Décembre.GodinhoL.WhatisthemostefficientreimbursementsysteminEurope?AstatisticallookatthewiderangeofEuropeanhearingaidreimbursementsystems.TheHearingRewiew.2015b.Dec.–Availableonline:http://www.hearingreview.com/2015/12/efficient-reimbursement-system-europe/Grant-SalmonT.TheEuropeanhearingaidmarket.Audio-infos.N°81.2013.Sept.Pp.20-23.HaeuslerL,MordierB.Vivreavecdesdifficultésd’audition–Répercussionssurlesactivitésquotidiennes, l’insertion et la participation sociale. Dossiers solidarité et santé. 2014 fev;n°52:1-17.HaeuslerL,DeLavalT,MillotC.Etudequantitativesurlehandicapauditifàpartirdel’enquête«Handicap-Santé».Documentdetravail,sérieEtudesetrecherches.2014août;n°131:156p.HautConseilpourl’avenirdel’assurancemaladie(HCAAM).Rapportannuel2013.2013a.273p.HautConseilpourl’avenirdel’assurancemaladie(HCAAM).Lagénéralisationdelacouverturecomplémentaireensanté.Rapport.2013b.Juillet.120p.Hautconseilpourl’avenirdel’assurancemaladie(HCAAM).Notesurlesdispositifsmédicaux.2008.Mai.79p.HungSC,LiaoKF,MuoCH,LaiSW,ChangCW,HungHC.Hearinglossisassociatedwithriskof Alzheimer’s disease: a case§control study in older people. J Epidemiol. 2015 May16;25(8):517-521.Inserm (Institut national de la santé et de la recherche médicale). Activité physique etpréventiondeschuteschezlespersonnesâgées.Synthèseetrecommandations.2014.114p.Inspectiongénéraledesaffairessociales (IGAS).Evaluationde lapriseenchargedesaidestechniquespourlespersonnesâgéesdépendantesetlespersonneshandicapées.Rapport(P.Blanchard,H.Strohl-Maffesoli,B.Vincent).2013.Avril.115p.Inspection générale des affaires sociales (IGAS). Evolution et maîtrise de la dépense desdispositifsmédicaux.RapportTome1(A.Morel,A.Kiour,A.Garcia).2010.Nov.171p.InVS(Institutdeveillesanitaire),Handicapauditif,limitationsetdéficiencesfonctionnelles:
96
Principaux résultatsde l’enquêteHandicap-Santé2008-2009, France.Bull EpidémiolHebd.2015;(42-43):796-8.Le Monde daté du 29 Septembre 2009. Les Français malentendants tardent à s’équiperd’audioprothèses.Archiveonlineinwww.lemonde.fr.LeMondedatédu12Mars2000.Deplusenplusperformantes,lesaidesauditivessonttrèsmalremboursées.Archiveonlineinwww.lemonde.fr.LeMondedatédu16Mai1996.Douzemillefrancsl’unité.Archiveonlineinwww.lemonde.fr.LeusieS.Privationsensorielleauditiveetréhabilitationchezlesujetâgé:conséquencessurlefonctionnementcognitif. Thèsededoctoratenneurosciences.UniversitéClaudeBernard -LyonI,2015Li C-M, Zhang X, Hoffman HJ, Cotch MF, Themann CL, Wilson MR. Hearing ImpairmentAssociatedWithDepressioninUSAdults,NationalHealthandNutritionExaminationSurvey2005–2010.JAMAotolaryngology--head&necksurgery.2014;140(4):293-302.Lin FR,Metter EJ,O'BrienRJ, Resnick SM, ZondermanAB, et al.Hearing loss and incidentdementia.ArchNeurol.2011Feb;68(2):214-20.LinFR,Ferrucci L,MetterEJ,AnY,ZondermanAB,etal.Hearing lossandcognition in theBaltimoreLongitudinalStudyofAging.Neuropsychology.2011Nov;25(6):763-70LinFR,FerrucciL.HearingLossandFallsAmongOlderAdultsintheUnitedStates.Archivesofinternalmedicine.2012;172(4):369-371.LinFR,YaffeK,XiaJ,etal.Hearinglossandcognitivedeclineinolderadults.JAMAInternMed.2013;173:293–299.LinFR,FerrucciL,AnY,GohJO,DoshiJ,etal.Associationofhearingimpairmentwithbrainvolumechangesinolderadults.Neuroimage.2014Apr15;90:84-92.LiuCF,CollinsMP,SouzaPE,YuehB.Long-termcost-effectivenessofscreeningstrategiesforhearingloss.JRehabilResDev.2011;48(3):235-43.Ministère du travail, des relations sociales, de la famille, de la solidarité et de la ville –Secrétariat d’Etat chargé de la famille et de la solidarité. Plan 2010-2012 en faveur despersonnessourdesetmalentendantes.2010.Février.MenerDJ,BetzJ,GentherDJ,ChenD,LinFR.HearingLossandDepressioninOlderAdults.JournaloftheAmericanGeriatricsSociety.2013;61(9):1627-1629.MougeotM,NaegelenF.Régulationettarificationdeshôpitaux.Ed.economica.2011.

97
MorrisAE,LutmanME,CookAJ,TurnerD.Aneconomicevaluationofscreening60-to70-year-oldadultsforhearingloss.JPubHealth.2012Sept35;1:139:146.OECD. Panorama de la santé 2013. 2015. Available online:http://www.oecd.org/fr/sante/systemes-sante/panorama-de-la-sante-19991320.htmValuesinFebruary2016.WHO. Deafness and hearing loss. Fact Sheet n°300. 2016. Mars.http://www.who.int/mediacentre/factsheets/fs300/en/ValuesinMarch2016.SchmulianTaljaardD,OlaitheM,Brennan-JonesCG,EikelboomRH,BucksRS.Therelationshipbetween hearing impairment and cognitive function: A meta-analysis in adults. ClinOtolaryngol.2015Dec16.ShieldB.Evaluationofthesocialandeconomiccostsofhearingimpairment.AreportforHear-it.2006Shiroiwa,T.,Sung,Y.-K.,Fukuda,T.,Lang,H.-C.,Bae,S.-C.andTsutani,K.(2010),Internationalsurveyonwillingness-to-pay(WTP)foroneadditionalQALYgained:whatisthethresholdofcosteffectiveness?.HealthEcon.,19:422–437.Sirven N, Bourgueil Y. La prévention de la perte d’autonomie: la fragilité en questions,apports,limites,perspectives.Rapportdel’IRDESn°563.2016,janvier.SitbonA,GuignardR,ChanCheeC,duRoscoätE.Penséessuicidaires,tentativesdesuicideetviolences subies chez les populations sourdes etmalentendantes en France. Résultats duBaromètre santé Sourds et malentendants, 2011-2012. Bull Epidémiol Hebd. 2015;(42-43):789-95.UFC-Que choisir. Audioprothèses. Unmarché verrouillé au détriment desmalentendants.2015,Septembre.ViljanenA,KaprioJ,PyykköI,SorriM,PajalaS,etal.Hearingasapredictoroffallsandposturalbalanceinolderfemaletwins.JGerontolABiolSciMedSci.2009Feb;64(2):312-7.