final report - jicaopen_jicareport.jica.go.jp/pdf/11844362_01.pdf · · 2007-03-13we are pleased...
TRANSCRIPT

DIRECTORATE GENERAL OF HIGHWAYS
MINISTRY OF PUBLIC WORKS
MAIN TEXT
JANUARY 2007
JAPAN INTERNATIONAL
COOPERATION AGENCY (JICA)
NO.
SD
JR
07-09
FINAL REPORT
THE STUDY ONPUBLIC-PRIVATE PARTNERSHIP SCHEMEFORTRANS JAVA TOLL ROADINTHE REPUBLIC OF INDONESIA

PREFACE
In response to a request from the Government of the Republic of Indonesia, the Government of Japan decided to conduct “The Study on Public-Private Partnership (PPP) Scheme for Trans Java Toll Road in the Republic of Indonesia” and entrusted it to the Japan International Cooperation Agency (JICA). JICA selected and dispatched a Study Team headed by Dr. Hani Abdel-Halim of Katahira & Engineers International from April 2006 and January 2007. The team held discussions with the officials concerned of the Ministry of Public Works as well as other officials concerned, and conducted field surveys, data analysis and PPP financial scheme. Upon returning to Japan, the team prepared this final report to summarize the results of the study.
I hope that this report will contribute to development in the Republic of Indonesia, and to the enhancement of friendly relationship between our two countries.
Finally, I wish to express my sincere appreciation to the officials concerned of the Government of the Republic of Indonesia for their close cooperation extended to the Study Team. January 2007,
Kazuhisa MATSUOKA, Vice President Japan International Cooperation Agency

Mr. Kazuhisa MATSUOKA, Vice President Japan International Cooperation Agency
January 2007 Dear Sir,
Letter of Transmittal We are pleased to submit herewith the Final Report of “The Study on Public-Private Partnership (PPP) Scheme for Trans Java Toll Road in the Republic of Indonesia”. The report compiles the results of the Study and includes the advices and suggestions of the authorities concerned of the Government of Japan and your agency as well as the comments made by the Ministry of Public Works and other authorities concerned in the Republic of Indonesia. The report includes review of previous feasibility study on the study road, and analyses the present and future road network conditions and demand of transport in Java Island. Revised cost estimate and transport demand are applied for the economic evaluation and financial analysis of six established PPP options. An optimum PPP scheme is recommended based on a comprehensive evaluation and assessment process that takes into consideration the pros and cons of each option and the minimum financial requirements by the Government of Indonesia. In addition, bidding guidelines and implementation plan are included for the smooth and on-schedule implementation of the toll road project. We wish to take this opportunity to express our sincere gratitude to your agency and the Ministry of Foreign Affairs. We also wish to express our deep gratitude to the Ministry of Public Works as well as other Governmental Agencies concerned in the Republic of Indonesia for the close cooperation and assistance extended to us during the Study. We hope this report will contribute to the development of the Republic of Indonesia. Very truly yours, Dr. Hani Abdel-Halim Team Leader, The Study on Public-Private Partnership (PPP) Scheme for Trans Java Toll Road in the Republic of Indonesia

LOCATION MAP

- i -
TABLE OF CONTENTS
Preface Letter of Transmittal Location Map Abbreviations
Page CHAPTER 1 INTRODUCTION 1.1 BACKGROUND......................................................................................................... 1-1 1.2 OBJECTIVES OF THE STUDY ................................................................................ 1-2 1.3 STUDY CORRIDOR .................................................................................................. 1-2 1.4 SCOPE OF THE STUDY ........................................................................................... 1-2 1.5 SCHEDULE OF THE STUDY................................................................................... 1-4 1.6 ORGANIZATION OF THE STUDY.......................................................................... 1-4
PART I: YOGYAKARTA – SOLO – KERTOSONO TOLL ROAD DEVELOPMENT CHAPTER 2 DESCRIPTION OF THE PROJECT 2.1 BACKGROUND OF THE PROJECT ...................................................................... 2-1 2.2 OBJECTIVE OF THE PROJECT ............................................................................. 2-2 2.3 NECESSITY OF THE PROJECT ............................................................................. 2-2
2.3.1 National Mid-Term Development Plan ........................................................ 2-2 2.3.2 Infrastructure Road Map ............................................................................... 2-4
2.4 SOCIOECONOMIC CHARACTERISTICS IN PROJECT AREA .......................... 2-7 2.4.1 Population ..................................................................................................... 2-7 2.4.2 Economy ....................................................................................................... 2.7 2.4.3 Socioeconomic Framework .......................................................................... 2-9
2.5 ROAD NETWORK DEVELOPMENT .................................................................... 2-10 2.5.1 Arterial Road Network Development ........................................................... 2-10 2.5.2 Toll Road Development ................................................................................ 2-11 2.5.3 Indonesia Highway Corporation ................................................................... 2-15
2.6 TRANS JAVA TOLL ROAD ..................................................................................... 2-16 2.7 MAJOR COMPONENTS OF THE PROJECT ......................................................... 2-18 2.8 EFFECTS OF TOLL ROAD PROJECT ................................................................... 2-21
2.8.1 Direct Effects ................................................................................................ 2-21 2.8.2 Regional Effects ........................................................................................... 2-22
CHAPTER 3 TRAFFIC SURVEY AND DEMAND FORECAST 3.1 OBJECTIVES ............................................................................................................. 3-1 3.2 TRAFFIC SURVEY .................................................................................................. 3-1
3.2.1 Survey Method ............................................................................................. 3-1 3.2.2 Results of Traffic Survey .............................................................................. 3-3
3.3 DEMAND FORECAST ............................................................................................ 3-7 3.3.1 Basic Policy .................................................................................................. 3-7 3.3.2 OD Zoning System ....................................................................................... 3-7 3.3.3 Present and Future Trip Pattern .................................................................... 3-8

- ii -
3.4 FUTURE TRAFFIC VOLUMES .............................................................................. 3-9 3.4.1 Basic Policy .................................................................................................. 3-9 3.4.2 Traffic Assignment Procedure ...................................................................... 3-9 3.4.3 Future Traffic Volume ................................................................................... 3-14
CHAPTER 4 COST ESTIMATION AND ECONOMIC ANALYSIS 4.1 REVIEW OF PROJECT COST ................................................................................ 4-1
4.1.1 Construction Cost ......................................................................................... 4-2 4.1.2 Land Acquisition Cost .................................................................................. 4-3
4.2 REVISED PROJECT COST ..................................................................................... 4-6 4.2.1 Major Items for Cost Estimate ...................................................................... 4-6 4.2.2 Review of Bridge Construction Cost ............................................................ 4-8
4.3 ECONOMIC ANALYSIS .......................................................................................... 4-11 4.3.1 Review of F/S Economic Analysis ............................................................... 4-11 4.3.2 Revised Economic Analysis ......................................................................... 4-14 4.3.3 Revised Economic Parameters ..................................................................... 4-15
PART II: FORMULATION OF PPP SCHEME
CHAPTER 5 OVERVIEW OF PPP 5.1 BENEFITS OF PROMOTING PPP............................................................................ 5-1
5.1.1 Definitions of PPPs......................................................................................... 5-1 5.1.2 Objectives of PPPs ....................................................................................... 5-3 5.1.3 Progress in PPPs ........................................................................................... 5-3 5.1.4 Survey of PPP Progress by Areas ................................................................. 5-7 5.1.5 Type of PPP .................................................................................................. 5-8
5.2 FACTORS FOR SUCCESS AND FAILURE FROM INTERNATIONAL EXPERIENCES ........................................................................................................ 5-10
5.2.1 Road BOT Experiences in Asia .................................................................... 5-10 5.2.2 DBFO Road Experience in UK .................................................................... 5-12 5.2.3 Lessons Learned from International Experience: Main Factors for Successful and Failed PPPs .............................................. 5-15
CHAPTER 6 REVIEW OF PPP ENVIRONMENT 6.1 REVIEW OF LEGISLATIVE FRAMEWORK ........................................................ 6-1
6.1.1 Stages of Toll Road Financing ...................................................................... 6-1 6.1.2 Law and Regulation for Toll Road ............................................................... 6-1 6.1.3 Implementation Framework on Toll Road .................................................... 6-3
6.2 REVIEW OF ISSUES OF PREVIOUS ROAD BOT SCHEMES ............................ 6-9 6.2.1 Recent Toll Road Development Program ..................................................... 6-9 6.2.2 Issues of Previous Road BOT Schemes ........................................................ 6-11

- iii -
CHAPTER 7 STUDY ON PPP SCHEME 7.1 OPTIONS OF PROJECT SCHEME ......................................................................... 7-1
7.1.1 Objective to introduce PPP ........................................................................... 7-1 7.1.2 Options Considered ...................................................................................... 7-1
7.2 EVALUATION OF PPP OPTIONS ............................................................................ 7-4 7.3 PROJECT FINANCIAL ANALYSIS ........................................................................ 7-18
7.3.1 Scenario Setting and Major Assumptions ..................................................... 7-18 7.3.2 Results of Financial Study ............................................................................ 7-20
7.4 SUMMARY OF RESULTS AND RECOMMENDATIONS .................................... 7-41 7.4.1 Pros and Cons Options ................................................................................... 7-41 7.4.2 Financial Evaluation ..................................................................................... 7-41 7.4.3 Sensitivity Analysis ........................................................................................ 7-42 7.4.4 Recommendations .......................................................................................... 7-47
PART III: RECOMMENDED PPP SCHEME AND IMPLEMENTATION PLAN CHAPTER 8 RECOMMENDED PPP SCHEME
8.1 PPP SCHEME UNDER OPTION 6............................................................................ 8-1
8.1.1 Project Scheme ............................................................................................... 8-1 8.1.2 Evaluation on Option 6................................................................................... 8-3
8.2 FINANCIAL ANALYSIS ON OPTION 6 .................................................................. 8-4 8.2.1 Scenario Setting and Major Assumptions....................................................... 8-4 8.2.2 Results of Financial Study.............................................................................. 8-6
8.3 PAYMENT MECHANISM ......................................................................................... 8-9 8.3.1 Upfront Payment ............................................................................................ 8-9 8.3.2 Service Payment ............................................................................................. 8-9 8.3.3 Required Subsidy Policy of MPW.................................................................. 8-11
8.4 SUBSIDY SCHEME................................................................................................... 8-11 8.4.1 Toll Road Investment Projects supported by Government ............................. 8-11 8.4.2 Infrastructure Policy Package in Indonesia .................................................... 8-12
8.5 MECHANISM OF PSO .............................................................................................. 8-13 8.5.1 Governing Law in Indonesia Concerning Application of PSO ...................... 8-13 8.5.2 Mechanism of PSO Application ..................................................................... 8-13 8.5.3 Implementation of PSO .................................................................................. 8-14 8.5.4 Aspects Required in regulating PSO .............................................................. 8-15
8.6 USE OF BLU .............................................................................................................. 8-15 8.7 WORK AND RISK SHARING .................................................................................. 8-15
8.7.1 Illustrative Work Sharing for Java Toll Road ................................................. 8-15 8.7.2 Illustrative Risk Sharing for Java Toll Road................................................... 8-17 8.7.3 General Risk Sharing...................................................................................... 8-17
CHAPTER 9 IMPLEMENTATION PLAN 9.1 DETAILED PLAN OF PUBLIC SECTOR TASKS ................................................... 9-1
9.1.1 Feasibility Study ............................................................................................. 9-1 9.1.2 Public Funding Arrangement.......................................................................... 9-1 9.1.3 Preparation of Tender Documents .................................................................. 9-1 9.1.4 Selection of PPP Company............................................................................. 9-2 9.1.5 Environmental Impact Assessment................................................................. 9-2

- iv -
9.1.6 Land Acquisition of ROW.............................................................................. 9-2 9.1.7 Monitoring of Detailed Design and Construction .......................................... 9-3 9.1.8 Confirmation of Construction Completion..................................................... 9-3
9.2 DETAILED PLAN OF PRIVATE SECTOR TASKS.................................................. 9-3 9.2.1 Preparation of Tender ..................................................................................... 9-3 9.2.2 Detailed Design of Toll Road ......................................................................... 9-4 9.2.3 Construction of Toll Road .............................................................................. 9-4
9.3 DETAILED DESIGN OF TOLL ROAD..................................................................... 9-4 9.3.1 Organization ................................................................................................... 9-5 9.3.2 Toll Roads to be designed............................................................................... 9-5 9.3.3 Design Standards and Criteria ........................................................................ 9-6 9.3.4 Quality Assurance and Approval on Detailed Design .................................... 9-7 9.3.5 Change in Detailed Design ............................................................................. 9-8 9.3.6 The Detailed Design Schedule ....................................................................... 9-8
9.4 CONSTRUCTION OF TOLL ROAD......................................................................... 9-8 9.4.1 Organization ................................................................................................... 9-9 9.4.2 Scope of Construction Work........................................................................... 9-9 9.4.3 Construction Schedule.................................................................................... 9-10 9.4.4 Stage-by-Stage Construction .......................................................................... 9-10 9.4.5 Construction Supervision and Quality Assurance .......................................... 9-10 9.4.6 Change of Scope of Works ............................................................................. 9-11 9.4.7 Environmental Monitoring in Construction ................................................... 9-11
9.5 OVERALL IMPLEMENTATION SCHEDULE......................................................... 9-12 CHAPTER 10 MAINTENANCE AND OPERATION PLAN 10.1 MAINTENANCE PLAN ............................................................................................ 10-1
10.1.1 Maintenance System....................................................................................... 10-1 10.1.2 Inspection ....................................................................................................... 10-3 10.1.3 Maintenance Management.............................................................................. 10-4 10.1.4 Maintenance Work.......................................................................................... 10-6 10.1.5 Maintenance Criteria and Specifications ........................................................ 10-7 10.1.6 Monitoring/Quality Assurance ....................................................................... 10-8
10.2 OPERATION PLAN ................................................................................................... 10-8 10.2.1 Toll Collection Management .......................................................................... 10-9 10.2.2 Traffic Management Service .......................................................................... 10-10
CHAPTER 11 BIDDING GUIDELINES
11.1 OVERVIEW................................................................................................................ 11-1 11.2 ROLE OF PPP CONTRACTOR................................................................................. 11-1 11.3 ROLE OF GOVERNMENT ....................................................................................... 11-2 11.4 OVERVIEW OF PAYMENT MECHANISM ............................................................. 11-2 11.5 PROCUREMENT PROCESS..................................................................................... 11-4 11.6 TENDER EVALUATION ........................................................................................... 11-5 11.7 DIFFERENCES FROM CURRENT BIDDING DOCUMENTS ............................... 11-5
CHAPTER 12 CONCLUSIONS AND RECOMMENDATIONS
12.1 CONCLUSIONS......................................................................................................... 12-1 12.2 RECOMMENDATIONS............................................................................................. 12-5

- v -
List of Tables Page Table 2.3-1 Performance Targets of National Road Development Scenarios ................... 2-4 Table 2.3-2 Annual Macroeconomic Indicators 2005 – 2009 ........................................... 2-5 Table 2.4-1 Population and Growth Rate .......................................................................... 2-7 Table 2.4-2 Trend of Economic Indicators........................................................................ 2-8 Table 2.4-3 Future Socioeconomic Growth Rates............................................................. 2-9 Table 2.7-1 Length of Study Road Segments .................................................................... 2-18 Table 3.2-1 Questionnaire Sheets (Sample) for WTP Survey............................................ 3-2 Table 3.2-2 Traffic Volume on the Study Section ............................................................ 3-4 Table 3.2-3 Traffic Volume on Tangelan-Merak Toll Road ............................................. 3-5 Table 3.2-4 Part of Summary Table of WTP Survey Result ............................................ 3-6 Table 3.4-1 Time Evaluation Value (Rp/hour) ................................................................. 3-11 Table 3.4-2 Observed and Assigned Traffic Volumes ...................................................... 3-12 Table 3.4-3 α and β for Diversion Rate ..................................................................... 3-14 Table 3.4-4 Growth of GRDP per Capita in Java Island (per year) ................................. 3-14 Table 3.4-5 Toll Rates of Existing Toll Roads ................................................................. 3-16 Table 3.4-6 Calculation Cases ......................................................................................... 3-17 Table 3.4-7 Future Traffic Volume of Case 1 ................................................................... 3-19 Table 3.4-8 Future Traffic Volume of Case 2 ................................................................... 3-20 Table 3.4-9 Future Traffic Volume of Case 3 ................................................................... 3-20 Table 4.1-1 F/S Construction Cost (Rp million)................................................................ 4-3 Table 4.1-2 Summary of Land Acquisition Cost ............................................................. 4-5 Table 4.2-1 Summary of Revised Project Cost (Rp million) ........................................... 4-9 Table 4.2-2 Number of Bridges and Boring Investigation Data ...................................... 4-10 Table 4.3-1 Economic Parameters of Economic Analysis ............................................... 4-12 Table 4.3-2 Main Items Applied in Economic Analysis .................................................. 4-13 Table 4.3-3 Case Set Up .................................................................................................. 4-14 Table 4.3-4 Economic Parameters (Yogyakarta – Kertosono) ......................................... 4-16 Table 4.3-5 Economic Parameters (Yogyakarta – Solo) .................................................. 4-16 Table 4.3-6 Economic Parameters (Solo - Kertosono) .................................................... 4-16 Table 4.3-7 Revised Sensitivity Analysis Result (Yogyakarta - Kertosono) ................... 4-18 Table 4.3-8 Revised Sensitivity Analysis Result (Yogyakarta - Solo) ............................. 4-19 Table 4.3-9 Revised Sensitivity Analysis Result (Solo - Kertosono) .............................. 4-20 Table 5.1-1 Summary of PPPs by Country and Sector in Europe ................................... 5-5 Table 5.1-2 Summary of PPP Institutional Development in Europe ............................... 5-6 Table 5.1-3 Summary of PPP Methods.............................................................................. 5-9 Table 5.2-1 Expressway BOT Concessions in Asia (as at ADB observation) ................. 5-11 Table 5.2-2 Operational Expressway BOT (as at ADB observation) .............................. 5-12 Table 6.1-1 Stages of Toll Road Financing ...................................................................... 6-1 Table 6.1-2 Toll Roads Laws and Regulations ................................................................ 6-2 Table 6.1-3 Toll Road Institutional Framework................................................................. 6-3 Table 6.1-4 Toll Road Provision Cycle.............................................................................. 6-4 Table 6.2-1 List of Toll Road Projects (1/2) .................................................................... 6-9 Table 6.2-1 List of Toll Road Projects (2/2) .................................................................... 6-10 Table 6.2-2 Tender Results of Batch I in June 2005 ........................................................ 6-11 Table 6.2-3 Tender Results of Batch II in October 2005 ................................................. 6-12 Table 6.2-4 Proposed Key Changes to the Concession Agreement (CA) under PPITA .. 6-13

- vi -
Table 7.1-1 Outline of PPP Options ................................................................................. 7-2 Table 7.2-1 Evaluation of PPP Options ........................................................................... 7-11 Table 7.2-2 Comments from MPW .................................................................................. 7-13 Table 7.3-1 Assumption – Initial Investment Cost .......................................................... 7-19 Table 7.3-2 Assumption – Financing, OPEX, Depreciation & Tax ................................. 7-20 Table 7.3-3 Summary of Five Financial Results – Full Section (Jogjakarta – Kertosono) 7-21 Table 7.3-4 Financial Projections for Full Sections (Jogjakarta – Kertosono) .............. 7-23 Table 7.3-5 Financial Projections for Jogjakarta – Solo .................................................. 7-24 Table 7.3-6 Financial Projections for Solo – Kertosono .................................................. 7-25 Table 7.3-7 Financial Projection – Full Sections & Option 4 .......................................... 7-26 Table 7.3-8 Financial Projection – Full Sections & Option 5-1 ...................................... 7-27 Table 7.3-9 Financial Projection – Full Sections & Option 5-2 ...................................... 7-28 Table 7.3-10 Financial Projection – Full Sections – Option 6 ........................................... 7-29 Table 7.3-11 Financial Projection – Full Sections & Traditional Public Work with Operation Outsourcing ………………………………………………………………... 7-30 Table 7.3-12 Financial Projection – Jogjakarta – Solo & Option 4 ................................... 7-31 Table 7.3-13 Financial Projection – Jogjakarta – Solo & Option 5-1 ................................ 7-32 Table 7.3-14 Financial Projection – Jogjakarta – Solo & Option 5-2 ................................ 7-33 Table 7.3-15 Financial projection – Jogjakarta – Solo & Option 6 ................................... 7-34 Table 7.3-16 Financial Projection – Jogjakarta – Solo & Traditional Public Work with Operation Outsourcing ......................................................................... 7-35 Table 7.3-17 Financial Projection – Solo – Kertosono & Option 4 ................................... 7-36 Table 7.3-18 Financial Projection – Solo – Kertosono & Option 5-1 ............................... 7-37 Table 7.3-19 Financial Projection – Solo – Kertosono & Option 5-2 ............................... 7-38 Table 7.3-20 Financial Projection – Solo – Kertosono & Option 6 ................................... 7-39 Table 7.3-21 Financial Projection – Solo – Kertosono & Traditional Public Work with Operation Outsourcing ......................................................................... 7-40 Table 7.4-1 Summarized Pros and Cons of Options.......................................................... 7-41 Table 7.4-2 Financial Evaluation of 6 Cases ..................................................................... 7-42 Table 7.4-3 Assumptions and Financial Evaluation on Four Options ............................... 7-43 Table 8.2-1 Assumption – Initial Investment Cost ............................................................ 8-5 Table 8.2-2 Financing Initial Capital Expenditure............................................................. 8-5 Table 8.2-3 Operation Cost, Depreciation and Tax Assumption........................................ 8-6 Table 8.2-4 Financial Projection – Solo – Kertosono & Option 6..................................... 8-8 Table 8.2-5 Summary of Financial Projection of Option 6................................................ 8-7 Table 8.7-1 Summary of Work Sharing among PU and the Private Sector ....................... 8-16 Table 8.7-2 Summary of Risk Sharing with Upfront Subsidy and Ongoing Operational Subsidy ........................................................................ 8-17 Table 9.3-1 Toll Road Facilities......................................................................................... 9-5 Table 9.3-2 Typical Detailed Design Schedule.................................................................. 9-8 Table 9.4-1 Typical Construction Schedule....................................................................... 9-10 Table 9.5-1 Overall Implementation Schedule .................................................................. 9-12 Table 10.1-1 Part of Reference of Maintenance Specifications........................................... 10-7

- vii -
List of Figures
Page
Figure 1.5-1 Study Flow Diagram....................................................................................... 1-5 Figure 1.6-1 Organization Chart ....................................................................................... 1-6 Figure 2.5-1 Toll Roads Short-Term Plan ......................................................................... 2-12 Figure 2.5-2 Toll Roads Long-Term Plan .......................................................................... 2-13 Figure 2.6-1 National Activity Centres in Java Island ...................................................... 2-17 Figure 2.6-2 Trans Java Toll Road Development Plan ...................................................... 2-17 Figure 2.7-1 Yogyakarta – Solo – Kertsono Toll Road ..................................................... 2-20 Figure 2.7-2 Semarang and Surabaya Toll Road Connections .......................................... 2-20 Figure 3.2-1 Traffic Survey Location Map ....................................................................... 3-2 Figure 3.2-2 Grouping of Vehicles .................................................................................... 3-3 Figure 3.2-3 Traffic Volume at Each Location .................................................................. 3-4 Figure 3.2-4 Traffic Growth of Toll Roads ....................................................................... 3-5 Figure 3.3-1 Study Area Zone Plan ................................................................................... 3-7 Figure 3.3-2 Future Desire Lines ...................................................................................... 3-8 Figure 3.4-1 Traffic Assignment for the Road Network in the Study Regions ................. 3-10 Figure 3.4-2 Speed-Flow Relationship ................................................................................... 3-10 Figure 3.4-3 Assignment Steps per Increment .................................................................. 3-12 Figure 3.4-4 Traffic Assignment Verification .................................................................... 3-13 Figure 3.4-5 Determination of αandβfrom WTP Survey Result ................................... 3-13 Figure 3.4-6 Searching the Maximum Revenue for the Study Section ............................. 3-15 Figure 3.4-7 Relationship between Toll Rate and WTP Data ............................................ 3-16 Figure 3.4-8 Traffic Volume in 2010 ................................................................................. 3-18 Figure 3.4-9 Traffic Volume in 2020 and 2030 ................................................................. 3-18 Figure 3.4-10 Assigned Traffic Volumes in 2006 and 2010 ................................................ 3-21 Figure 3.4-11 Assigned Traffic Volumes in 2020 and 2030 ................................................ 3-22 Figure 4.2-1 Typical Bridge over River ............................................................................ 4-6 Figure 4.2-2 Typical Bridge over Toll Road ..................................................................... 4-6 Figure 4.2-3 Standard Cross Section ................................................................................. 4-7 Figure 4.2-4 Typical Interchange ...................................................................................... 4-7 Figure 4.2-5 Rough Standard of Bridge Construction Cost by Bridge Type in Indonesia 4-10 Figure 5.1-1 PPP Structures .............................................................................................. 5-2 Figure 5.1-2 Cumulative Capital Value of PPPs in UK ..................................................... 5-6 Figure 5.1-3 Capital Value of Closed PPP Deals ............................................................... 5-7 Figure 7.3-1 Toll Revenue Comparison (Revenue max, socially accepted and feasibility study) .................................................................................... 7-18 Figure 7.3-2 Initial Funds Raised by GOI (Billions of Rupiah).......................................... 7-22 Figure 7.3-3 Annual Service Payment (Millions of Rupiah) .............................................. 7-22 Figure 7.4-1 Government Expenditure and Net Contribution NPV Base (1/3) .................. 7-44 Figure 7.4-1 Government Expenditure and Net Contribution NPV Base (2/3) .................. 7-45 Figure 7.4-1 Government Expenditure and Net Contribution NPV Base (3/3) .................. 7-46 Figure 8.1-1 Summary of Structure and Government Expenditure Schedule..................... 8-2 Figure 8.2-1 Toll Revenue................................................................................................... 8-4
- viii -
Figure 8.5-1 Mechanism of PSO Development .................................................................. 8-14 Figure 9.3-1 Organization of Detailed Design .................................................................... 9-5 Figure 9.4-1 Organization of Construction ......................................................................... 9-9 Figure 10.1-1 Maintenance Procedure .................................................................................. 10-2 Figure 10.1-2 Maintenance Organization.............................................................................. 10-3

- ix -
Appendix
Page
Appendix 3-1 OD Zoning Data ............................................................................................. A3-1-1 Appendix 4-1 Bridge List ...................................................................................................... A4-1-1 Appendix 7-1 Project Structure ............................................................................................. A7-1-1 Appendix 7-2 Payment Mechanism ...................................................................................... A7-2-1 Appendix 7-3 Risk Allocation ............................................................................................... A7-3-1 Appendix 8-1 Work Sharing between the Public Sector and the Private Sector ................... A8-1-1 Appendix 8-2 Risk Sharing between the Public Sector and the Private Sector..................... A8-2-1 Appendix 11-1 Invitation to Tender ........................................................................................ A11-1-1
- x -
ABBREVIATIONS ASEAN : Association of South East Asian Nations ADT : Average Daily Traffic Volume BAPPENNAS : National Development Planning Agency B/C : Benefit/Cost Ratio BLU : Management of Public Service Agency BOT : Build, Operate and Transfer BPJT : Indonesian Toll Road Authority CA : Concession Agreement CCTV : Closed-Circuit TV DBFO : Design, Build, Finance, and Operate DGH : Directorate General of Highway EIA : Environmental Impact Assessment EIRR : Economic Internal Rate of Return % GDP : Gross Domestic Products GOI : Government of Indonesia GOJ : Government of Japan GRDP : Gross Regional Domestic Products ITRA : Indonesia Toll Road Authority ITT : Invitation to Tender JARNS : Java Arterial Road Network JBIC : Japan Bank for International Cooperation JORR : Jakarta Outer Ring Road KKPPI : National Committee for the Acceleration of Infrastructure Provision LCC : Life Cycle Cost MOF : Ministry of Finance MPW : Ministry of Public Works NPV : Net Present Value OD : Origin-Destination ODA : Official Development Assistance OPEX : Operating Expenditures PPP : Public-Private Partnership PPITA : Private Provision of Infrastructure Technical Assistance PQ : Pre-Qualification PRC : People’s Republic of China PSO : Public Service Obligation PSP : Private Sector Participation QC Consultant : Quality Control consultant ROW : Light of Way Rp. : Rupiah

- xi -
RPJM : Mid-Term Development Plan 2005-2009 SPC : Special Purpose Company STRADA : System for Traffic Demand Analysis SUTT : High Voltage Aerial Cable SUTET : Extra High Voltage Aerial Cable TEV : Time Evaluation Value TTC : Travel Time Cost UKL : Environmental Management Plan UNCITRAL : United Nations Commission on International Trade Law UPL : Environmental Monitoring Plan VCR : Vehicle Capacity Ratio VFM : Value for Money WTP : Willingness-To-Pay

CHAPTER 1
INTRODUCTION

1 - 1
CHAPTER 1
INTRODUCTION 1.1 BACKGROUND
Java Island is the mainstay of socioeconomic activities of Indonesia as well as the nucleus of prospective industrial development and diverse economic investment. Economic activities in Java Island have been boomed by domestic and international enterprises, which have inevitably induced remarkable development of road network in Java Island. Due to the rapid development of economic activities, however, the congestion level of trunk roads has reached to the critical limit in terms of physical capacity and network function, and thus emergent increment of road capacity in duly required. To cope with this situation and to support the booming socioeconomic activities and further development in Java Island, many road development projects are being implemented to attain substantial enhancement of the road transport system in the island. Previous toll road projects in Indonesia have been implemented by government finance, foreign funds, Jasa Marga fund, BOT schemes and so forth. However, the current economic conditions and financial uncertainty in Indonesia induce certain constraints in project finance by the government, and conventional BOT schemes has been depressed mainly due to intolerable risk for the private sector in terms of demand, tariff, land acquisition and taxes. With the existing financial constraints, new and stable sources of fund are required. This financial gap is expected to be filled by the private sector that is also expected to be capable of improving the quality of transport infrastructure services. The development of private sector involvement in the provision of public services can be achieved through insuring private as well as public benefits. The benefits through private sector participation will be greater when the government clarifies the responsibilities of involved governmental agencies, optimizes risk and work sharing between both public and private sectors and develops supporting policies on competition and regulations. The approach of applying PPP schemes in financing toll road projects is currently applied in different countries. In Indonesia, however, it is still new financing mechanism that requires to be carefully studied in order to successfully apply. Applying PPP scheme on the study road has many objectives and is expected to generate many benefits, including:

1 - 2
- To provide a pilot PPP project that will open the market for more private sector participation in financing public infrastructure projects.
- To develop, strengthen and open more business opportunities for the private sector to carry out more roles in future.
- To reduce the life-cycle governmental burden in financing public infrastructure projects which will support the national budget on the long term.
- To allow the utilization of private sector experience, efficiency, flexibility and advanced technology in implementing and operating public projects.
- To deliver better and less expensive services to road users. In response to the request of the Government of the Republic of Indonesia (GOI), the Government of Japan (GOJ) has decided to conduct “The Study on Public-Private Partnership (PPP) Scheme for Trans Java Toll Road in the Republic of Indonesia”. Accordingly, JICA organized and dispatched a Study Team, from Katahira & Engineers International (KEI) and PwC Advisory Co., Ltd. (PwC), a member firm of PricewaterhouseCoopers, to Indonesia to commence the Study on April 2006. The Final Report is scheduled to be submitted to the Government of the Republic of Indonesia on January 2007.
1.2 OBJECTIVES OF THE STUDY The objectives of the Study are: 1. To propose financially viable PPP scheme for the selected section of Trans Java
Toll Road based on the proposed PPP scheme; and 2. To transfer a set of PPP related knowledge and know how to the counterparts
during the course of the Study.
1.3 STUDY CORRIDOR The road corridor under this Study is the section of “Yogyakarta ~ Surakarta (Solo) ~ Ngawi ~ Mantingan ~ Kertosono” with a total length of 219 km of Trans Java Toll Road.
1.4 SCOPE OF THE STUDY In order to achieve the objectives mentioned above, the Study will cover the following items: 1. Collection and Review of Basic Information

1 - 3
- Laws and regulations related to PPP road projects - Status and progress of other donors’ activities related to the project
2. Review and Analysis of Relevant Data and Reports
- Central and provincial development plans by Sector - Socioeconomic data and information (population, GDP, employment, etc.) - Land use and ownership - Natural conditions in the Study Area - Environmental conditions - Trend of other donors and NDOs activities
3. Review of Results of the Feasibility Study on the Study Road Section - Present conditions - Traffic and road network conditions - Results of traffic demand forecast - Engineering aspects - Estimated cost - Environmental conditions - Economic viability - Implementation strategy and plan
4. Traffic Surveys and Demand Forecast - Field survey - Supplementary traffic count surveys - Willingness-to-Pay interview survey - Review of demand forecast - Simulation of toll levels and revenues - Review of cost estimate
5. Formulation of Optimum PPP Scheme for Yogyakarta – Kertsono Section
- Information on pre-conditions PPP projects - Interview with related government agencies, prospective operators/investors
and financial institutions. - Optimum PPP scheme
6. Project Implementation Plan - Proposed implementation plan based on work sharing between public and
private sectors - Review of existing tender procedures and proposed procedures for the PPP
road project

1 - 4
- Proposed evaluation points of the proposals
7. Effective Utilization of PPP Scheme - Review existing BOT projects and identify problems - Proposed improvements for implementation plans of PPP projects - Identifying legislative hurdles which hamper PPP operations
8. Conclusions and Recommendations
1.5 SCHEDULE OF THE STUDY
The Study is commenced in April 2006 and the Final Report is scheduled to be submitted by January 2007. Figure 1.5-1 shows the Study Flow Diagram.
1.6 ORGANIZATION OF THE STUDY The Study is carried out by JICA Study Team which is composed of the following experts: Dr. Hani ABDEL-HALIM Team Leader / PPP Scheme Mrs. Yumiko NODA PPP Structure Ms. Mariko OGAWA PPP Maintenance and Operation Plan Mr. Soemu OSHITA PPP Construction Plan Mr. Jon SIVERTSON Bidding Procedure (1) Mr. Munehiko ETO Bidding Procedure (2) Mr. Hiroo TAKEDA Toll Road Legislation Dr. Shingo GOSE Toll Road Plan Mr. Tatsuyuki SAKURAI Toll Road Policy Advisor
An Implementing Committee is set up to steer the Study effectively under the initiative of the Ministry of Public Works. The committee is consisted of the following: Mrs. Sri Apriatini Soekardi Chairman; Director of General Planning,
Directorate General of highways, MPW Mr. Soebagiono Secretary; Head of Sub Directorate of Freeways and Toll Road Development, Directorate of Freeways and Urban Road, Directorate General of Highways, MPW

1 - 5
2006
Apr
May
June
July
Aug
Sep
Oct
Nov
Dec
Jan
* IC
/R
: Inception R
eport
IT/R
: Inte
rim
Report
DF/R
: D
raft
Fin
al R
eport
F/R
: F
inal
Report
Year
/M
onth
Sta
kehold
er
Meeting
/W
ork
shop
Ste
ering
Com
mitte
eM
eeting
Stu
dy
Item
s
Stu
dy
Pla
ce
Report
s
2.2
Collection and Review of Relevant Data
2.3
Presentation of Inception Report
2.4
Collection and Review of Basic Information
2.2
Preparation of InceptionReport
2.1
0
Preparation of Draft Final Report
2.1
4
Preparation of Final Report
2.5 2.6 ①
Resu
lts
of
Tra
ffic
Surv
eys
and
Tra
ffic
Dem
and F
ore
cas
t②
Toll
Reve
nue S
imula
tion
Anal
ysis
③ R
esu
lts
of
Est
imate
d P
roje
ct
Cost2
.7
① R
evi
ew
of
Pre
conditio
ns
② Inte
rvie
w S
urv
ey
to C
oncern
ed O
rgan
izat
ions
③ S
tudy a
nd F
orm
ula
tion o
f P
PP
Schem
e
2.8
① S
tudy
on O
vera
ll Im
ple
menta
tion
Pla
n
② S
tudy
on B
iddin
g P
rocedure
Pro
posa
l fo
r P
roje
ct
Imple
menta
tion
Pla
n
2.9
① A
nal
ysis
on C
ontr
acting
Issu
es
of
Pre
vious
PP
P S
chem
es
② P
roposa
l of
Guid
elin
es
Pro
posa
l fo
r Eff
ective U
tiliz
ation o
fP
PP
Schem
e f
or
Road P
roje
cts
2.1
1 Discussion on Draft Final Report in Japan
2.1
22.1
3 Presentation and Discussion on Draft Final Report, andHolding of Workshop
Submission of Final Report
Com
ments
on D
raft
Fin
al
Report
from
GO
I
IC/R
IT/R
DF/R
F/R
IC/P
and S
tudy
Org
aniz
atio
n
Work
shop
(DF/R
)(IT/R
)(D
raft
PP
P S
chem
e)
Revie
w o
f F/S
Resu
lts
on t
he
Stu
dy R
oad
Sta
kehold
er
Meeting
(2)
Pro
posa
l fo
r Eff
ective
Utiliz
atio
n o
fP
PP
Schem
e
Form
ula
tion o
f P
PP
Schem
e f
or
the S
tudy
Section
Pre
-Stu
dy
Pre
-Stu
dy
in J
apan
Stu
dy
in Indonesi
aStu
dy
in J
apan
(Pro
posa
l of
Guid
elin
es)
Sta
kehold
er
Meeting
(1)
① C
olle
ction a
nd R
evi
ew
of
Deve
lopm
ent
Pla
ns
Rele
vant
to t
he S
tudy
② D
ata
Colle
ction a
nd A
nal
ysis
Colle
ction a
nd R
evie
w o
f R
ele
vant
Data
and R
eport
s
Form
ula
tion o
f P
PP
Schem
e f
or
Yogy
aka
rta –
Kert
sono S
ection
Fi
gure
1.5
-1 S
tudy
Flo
w D
iagr
am
1 - 5

1 - 6
Mr. Nurdin Manurung Member; Director of Freeways and Urban Road, Directorate General of Highways, MPW
Mr. Muhammad Irian Member; Secretary of BPJT, MPW Ms. U. Hayati Triastuti, Member; Director of Transportation, Bappenas Mr. Imron Bulkin Member; Director of PPP Development,
Bappenas Mr. Ceppie Kurniadi Sumadilaga Member; Director of Bilateral Funding,
Bappenas Mr. Agus Suprijanto Member; Director of Loan and Grant
Management, Ministry of Finance The Study is supposed to be conducted in a manner of a joint work of Indonesian and Japanese sides. In this context, the Ministry of Public Works allocated the Counterpart Personnel as follows: Mr. Herry Trisaputra Zuna Sub Directorate of Freeways and Toll Road
Development Mr. Dedy Gunawan Sub Directorate of Freeways and Toll Road
Development Mr. Rahman Arief Sub Directorate of Planning Mr. Hardi Siahaan Toll Road Regulatory Board (BPJT) The Organization Chart of the Study is shown in Figure 1.6-1.
Figure 1.6-1 Organization Chart
Government of Indonesia Government of Japan
Directorate General
of Highways
Counterpart Team
Implementing Committees
Japan International Cooperation Agency
(JICA)
JICA Study Team
JICA Advisory
Committee

PART I
YOGYAKARTA – SOLO – KERTOSONO
TOLL ROAD DEVELOPMENT

CHAPTER 2
DESCRIPTION OF THE PROJECT

2 - 1
CHAPTER 2
DESCRIPTION OF THE PROJECT 2.1 BACKGROUND OF THE PROJECT
Compared with other ASEAN countries, Indonesia has a low density of road networks, which give a density of 0.02 km per sq. km of land area. The road is rapidly getting crowded as the number of motor vehicles increased more rapidly than the growth of road network, particularly in Java Island, which accommodates the highest population density and economic activities in the country. The rapid socioeconomic growth at the southern and eastern areas of Java Island is increasing the demand for better transportation facilities including road infrastructure. Such areas are varying in terms of regional capacity, characteristics and potential. Yogyakarta is known as a tourism area and the centre of education. Solo city has also the same characteristics. Meanwhile, other cities along the corridor have potential as centres of agriculture production and some tourism spots. The Project Road is a section of Trans Java Toll Road, located in Central and East Java that connects East Java and Central Java heading to Jakarta. The distribution of goods from production areas to markets and the movement of people require higher travel speed and shorter travel time to decrease travel cost with higher safety levels. The development of a toll road will overcome the existing problems regarding the growth in transport demand due to development in socioeconomic sectors. The project’s main purpose is to provide an efficient road transport network in Java Island in order to promote its rapid socioeconomic development. Java Island, with its highest population density, is the mainstay of socioeconomic activities in Indonesia. Due to the rapid development of economic activities, the congestion level of trunk roads is expected to reach critical limits in the near future in terms of physical capacity and network function. The proposed sections are critical components of Trans Java Toll Road. The current economic conditions and financial uncertainty in Indonesia induce certain constraints in financial viability of projects. With the existing financial difficulties, new and stable sources of fund are required through PPP schemes. In order to attract the private sector participation, which is expected to improve the quality of the transport services, the appropriate public sector’s support under PPP schemes will be

2 - 2
required to lower financial requirements of the private sector down to the level affordable by toll revenues.
2.2 OBJECTIVE OF THE PROJECT
The objectives of implementing the road project, between Yogyakarta – Solo – Kertosono to Surabaya as a part of Trans Java Toll Road, are as follows: ・ To improve accessibility and capacity of road networks for the movement of
people and freight on this important transport corridor. ・ To promote national and regional socioeconomic development in corridor-impact
areas and cities along the road in eastern parts of Java Island ・ To increase productivity with repression of distributional cost and giving access to
regional and international markets ・ To provide an efficient road transport network in Java Island to promote its rapid
socioeconomic development 2.3 NECESSITY OF THE PROJECT
The economic growth and increase of social, economic and tourism activities within the project area and along its corridor as well as the need to enhance the regional development in central and eastern areas in Java Island, as per the targets of national development plans, it can be said that this toll road project is the optimum alternative to meet these requirements and conditions. The Project Road has been declared in the RPJM (Mid-Term Development Plan 2005-2009) and also has been stated in the following: ・ Strategic Plan of the Ministry of Public Works, 2005-2009 ・ Minister of Public Works Decree No. 369/KPTS/M/2005 on National Road
Network Master Plan to include toll road network master plan. ・ GOI has launched the Toll Road Acceleration Development Program through
Indonesia Infrastructure Summit I, January 2005.
2.3.1 National Mid-Term Development Plan National road infrastructure in the National Mid-Term Development Plan of 2005 - 2009 represents an important sector that requires approximately Rp 25 trillion for maintenance and upgrading, while the expected available fund is only Rp 15 trillion. The needs for the development of strategic national road network including shortcut

2 - 3
roads, roads in isolated areas and in small islands and long span bridges is approximately Rp. 50 trillion. The development of about 1,600 km of the highway network in the three main islands of Java, Sumatra and Sulawesi requires a budget of Rp 89 trillion in the five year plan. The Plan also states that the length of the national road network will be expanded from 26,853 km to 34,828 km. To overcome this financing gap, the funding scheme includes the involvement of the public sector together with both domestic and foreign private sector. The general policy of the plan includes the following major points: ・ Harmonizing the road network system with the policy of national spatial planning
to support regional development and integrate with other infrastructure network systems.
・ Maintaining the performance of road infrastructure by optimizing the handling of road network development to meet the transportation needs.
・ Improving the accessibility of regional development in the framework of a unified nation of the Republic of Indonesia.
・ Promoting professional attitudes and institutional efficiency with human resources independency in handling the road sector development.
・ Encouraging the involvement of private sector and business circles to participate with the public sector in developing the road network.
The following points are stated under the operational policy of the Plan: ・ Prioritization in handling the development of strategic national roads has the
criteria of supporting the national economy as well as the completion of road segments for optimum function in supporting developing areas, state-bordering areas and isolated areas.
・ Maintaining the existing road network in good operational conditions ・ Increasing the strength of structures and capacity of roads in line with the increase
in demand for cargo movement and growth in traffic volumes. ・ Establishing standards, guidelines and manuals on road development to support
regional autonomy as well as to optimize road operation and management. ・ Providing information to stakeholders on road infrastructure operation and
encouraging investment for the acceleration of road development. Goals of the Plan include the creation of reliable national road network with strategic and collaborated interconnections to increase the accessibility and mobility for goods and services from production centres to marketing areas. It has also the objective of opening opportunities in road operation for the involvement of stakeholders including
2 - 4
regional governments, private partners and the public sector. Three scenarios; limited, moderate and ideal, are developed with different levels of road network performance targets, as presented in Table 2.3-1. Based on each performance target, road network improvement tasks are established regarding lengths of roads under maintenance, rehabilitation, widening and construction. In addition, required funds for national roads are estimated as Rp 30.0 trillion for the limited, Rp 45.0 trillion for moderate and Rp 75.0 for the ideal scenario. In addition, a fund of Rp 89.4 trillion is required to improve other roads under any of the three scenarios. Table 2.3-1 Performance Targets of National Road Development Scenarios
Item Limited Scenario Moderate Scenario Ideal Scenario Average Speed
Decrease: 44 km/hr to 42 km/hr
Increase: 44 km/hr to 48 km/hr
Increase: 44 km/hr to 55 km/hr
Good From 37 % to 28% From 37 to 31% From 37 to 40% Moderate From 44% to 42% From 44% to 50% From 44% to 60% Bad From 8% to 24% From 8% to 11% From 8% to 0%
Road C
ondition Very Bad From 11% to 6% From 11% to 8% From 11% to 0%
2.3.2 Infrastructure Road Map The Infrastructure Summit of January 2005 in Jakarta confirmed the Indonesian Government intention to launch an extremely huge amount of new investments for the development of infrastructure projects, including 38 toll road projects with investment of about USD 9.5 billion in total. Such projects are now left to the investors, as Jasa Marga is no longer the single operator and regulator assigned bt the Government. Infrastructure development is now a pillar for the 5-year development strategy under which the growth of GDP has the target of increasing from 4.9% in 2003 to 7.2% by 2009, reducing unemployment from 9% to 5.1% and the income poverty rate from 16.6% to 8.2% of Indonesia’s population. The targeted macroeconomic indicators are presented in Table 2.3-2 for the years 2009 – 2009. The Infrastructure Road Map established under the Strategic Initiatives to Accelerate Infrastructure Development in Indonesia, Bappenas, addresses the private sector participation with the following three policy initiatives: 1. General Policy Environment: Appropriate Guarantee for reducing uncertainty
a) Ensure predictability in rules and policies (including tariff and market arrangement

2 - 5
Table 2.3-2 Annual Macroeconomic Indicators 2005 – 2009 Macro Indicators 2005 2006 2007 2008 2009
Inflation, CPI (%) 7.0 5.5 5.0 4.0 3.0 Nom. Exchange Rate (Rp/US$) 8,900 8,800 8,800 8,700 8,700 GDP Growth by Expenditure (%) 5.5 6.1 6.7 7.2 7.6 Current Account/GDP (%) 1.6 0.5 0.1 -0.2 -0.5 Foreign Reserves (US$ billion) 36.8 36.0 35.6 35.2 35.9 GDP/Capita (Rp thousand) 7,946 8,333 8,791 9,317 9,914 Budget Deficit/GDP (%) -0.7 -0.6 -0.3 0.0 Tax Revenue/GDP (%) 11.6 11.6 11.9 12.6 13.6 Debt Stock/GDP (%) 48.0 43.9 39.5 35.4 31.8 Open Unemployment (%) 9.5 8.9 7.9 6.6 5.1
b) Introduce enforceable contractual agreements, essential for mitigating non-
commercial investor risks c) Policy certainty that can be offered, not a blanket “comfort letter”. d) Commitment to accelerate infrastructure development and consistency with
the latest progress in other policy reform. e) Policy direction for the management and mitigation of non-commercial risks,
such as political, economic, project, legal and other risks
2. Entry Policies: Reduced regulatory obstacles and facilitate fair competition a) Reducing regulatory obstacles by facilitating reforms to remove obstacles for
private participation b) Unbundling/liberalization of infrastructure sectors c) Establishing fair competition, with models of competition such as deregulation,
BOT schemes and concessions for delegated management.
3. Pricing Policy: Reliable procedure and institutional setup for price determination a) A simplified procedure for tariff setting b) Strengthening/establishing regulatory body to oversee fair process of tariff
determination Supportive Policies 1. Infrastructure Development Fund
a) Developing infrastructure development fund to tap domestic savings, by creating an institutional framework/mechanism to raise funds from public and institutional investors to support infrastructure development on a medium to long term basis.

2 - 6
b) Potential use of infrastructure development fund 2. Consolidate Indonesia Infrastructure Forum as a strategic partner of government
and as a conduit for private sector. The issues and challenges in the transport sector are expressed as degradation in the level-of-services as follows:
• Low quality and quantity of transportation services and un-integrated inter-
modal network services • Inadequate government spending in transportation sectors needed to support
economic growth, to attain higher quality of welfare, and to facilitate regional development
• Inadequate regulatory frameworks for fruitful public-private partnership in transportation investment
The policy direction for the transportation sector has the targets of: • Higher level-of-service: by rehabilitating and maintaining the existing infra-
structure to increase the quality of services to an acceptable level and by enforcing law to attain safety.
• Greater integration: by developing a network of transportation that facilitates inter-modal function, focusing along commercially viable corridors (demand driven) while facilitating new investments for opening under-developed areas (supply-driven).
• Better regulatory frameworks: for private participation and develop Blue Print of national transportation system and roadmap strategy.
• Increasing mobility: by improving road quality performance to reduce road user cost along national important corridors, e.g., Sumatra East Corridor and North Java Corridor.
• Developing high grade network: along North-Coast Java and attracting private investment
• Addressing bottleneck issues: in toll road industry, such as land acquisition, tariff setting, government guarantee such as subsidy for low economic tariff and low occupancy for pioneer transport services set by the government, etc.

2 - 7
2.4 SOCIOECONOMIC CHARACTERISTICS IN PROJECT AREA 2.4.1 Population
Population data are based on the national census that is conducted every 10 years, with the last one on the year 2000 and predictions of 2004. As presented in Table 2.4-1, the average growth rate of population in Indonesia had decreased from 1.97% in the 1980s to 1.43% in recent years, while it is increasing in Java Island from 1.3% to 1.5% in the same period. Most of Indonesia population is concentrated in Java Island, which occupies only an area of 7% of the total country and accommodates about 60% of the population, without a well balanced regional distribution. Table 2.4-1 Population and Growth Rate
Population (‘000) Annual Growth Rate (%)Region
Area (km2) 1990 2000 2004 1980-90 1990-00 2000-04
DKI Jakarta 740 8,228 8,361 8,750 2.38 0.17 1.14
Java Barat 36,925 29,414 35,724 38,611 2.57 2.03 1.96
Java Tengah 32,800 28,516 31,223 32,543 1.17 0.94 1.04
DI Yogyakarta 3,133 2,913 3,121 3,223 0.57 0.72 0.81
Java Timur 46,690 32,488 34,766 36,482 1.08 0.70 1.21
Banten* 9,019 6,968 8,098 9,129 - 3.21 3.04
Java Island 129,306 107,527 121,293 128,738 1.30 1.21 1.50
Indonesia 1,860,360 178,500 205,843 217,854 1.97 1.49 1.43* Was formed in 2000 Source: Statistical Yearbook of Indonesia – 2004, June 2005
2.4.2 Economy
For the year 2004, growth rate of Indonesian economy showed a better performance than that of 2003. Based on GDP at 2000 constant prices, growth of Indonesian economy in 2004 was 5.13 percent, as presented in Table 2.4-2. Almost all of the sectors of economy, which compose the GDP, produced a positive growth in 2004, except mining and quarrying sector. The highest growth was reached by transportation and communication sector at 12.7 percent. Per capita national income at current prices increased from Rp 8.3 million in 2003 to Rp 9.5 million in 2004. At 2000 constant prices, the growth rate on the per capita national income was 5.87% in 2004 compared with only 1.51% in 2003.

2 - 8
Table 2.4-2 Trend of Economic Indicators Year Annual Growth Rate (%)
Indicator 2001 2002 2003 2004 2001 2002 2003 2004
At current market prices
GDP (billion Rp) 1,684,281 1,863,275 2,045,854 2,303,031 - - - -
GDP/Capita (Rp) 8,080,533 8,828,050 9,572,485 10,641,732 - - - -
GNP (billion Rp) 1,623,229 1,808,762 1,966,225 2,223,983 - - - -
GNP/Capita (Rp) 7,787,633 8,569,771 9,199,905 10,276,467 - - - -
NI (billion Rp) 1,507,590 1,644,412 1,778,660 2,046,297
NI/Capita (Rp) 7,232,838 7,791,094 8,322,295 9,455,426
At constant 2000 market prices
GDP (billion Rp) 1,442,984 1,506,124 1,579,559 1,660,579 3.84 4.38 4.88 5.13
GDP/Capita (Rp) 6,922,888 7,135,900 7,390,707 7,673,119 2.54 3.08 3.57 3.82
GNP (billion Rp) 1,376,774 1,449,767 1,498,328 1,580,111 6.10 5.30 3.35 5.46
GNP/Capita (Rp) 6,605,235 6,868,885 7,010,631 7,301,296 4.78 3.99 2.06 4.15
NI (billion Rp) 1,277,342 1,316,776 1,353,474 1,451,041 0.90 3.09 2.79 7.21
NI/Capita (Rp) 6,128,196 6,238,784 6,332,861 6,704,898 -0.35 1.80 1.51 5.87
GRDP (billion Rp at current market prices)
Java Island 809,942 926,110 1,031,446 - - - - -
DKI Jakarta 219,934 253,435 284,000 - - - - -
Java Barat 193,297 214,302 234,451 - - - - -
Java Tengah 136,131 156,418 175,106 - - - - -
DI Yogyakarta 14,577 16,713 18,839 - - - - -
Java Timur 195,763 226,957 254,381 - - - - -
Banten 50,241 58,284 64,670 - - - - -
GRDP (billion Rp at constant 1993 prices)
Java Island 243,772 253,104 264,108 - 3.88 3.81 4.35 -
DKI Jakarta 61,868 64,338 67,163 - 3.69 3.88 4.51 -
Java Barat 58,312 60,594 63,179 - 4.67 3.95 4.29 -
Java Tengah 42,305 43,776 45,605 - 3.42 3.55 4.11 -
DI Yogyakarta 5,187 5,395 5,616 - 4.00 3.85 3.70 -
Java Timur 58,750 60,754 63,252 - 3.34 3.40 4.11 -
Banten 17,350 18,246 19,293 - 5.45 4.60 6.04 - Source: Statistical Yearbook of Indonesia – 2004, June 2005 Among all the provinces of Indonesia, DKI Jakarta has the highest GRDP with about 16.6% of total 30 provinces at 2003 current prices. The second and third ranks were Java Timur (East Java) and Java Barat (West Java) with 14.9% and 13.7% of total 30 provinces, respectively.

2 - 9
2.4.3 Socioeconomic Framework Socioeconomic growth parameters of Java Island applied in the future socioeconomic frameworks of the related studies of Java Arterial Road Network Study, JARNS 2001, Heavy Loaded Improvement Project II, HLIRP 2001 and the Feasibility Study on Yogyakarta – Solo – Kertsono Toll Road, F/S 2006 are reviewed in relation to the national and regional future growth rates. Applied growth of population shows the same rates of 1.12% to the year 2010 and 1.09 to the year 2020. Economic growth rates are developed under the 3 scenarios of high, medium and low growth of GDP, in which the medium scenario is adopted in JARNS and HLIRP with slightly different rates. This scenario is the base of estimating the expenditures on roads in Java Island as a percentage of total roads expenditures and is utilized in the forecast process of future OD matrices of JARNS. The HLIRP adopted also the moderate scenario with a lower growth rate between 2005 and 2010. The Feasibility Study on the project road applied adjustment factors to adjust the framework based on the recent economic performance and the realization of existing economic growth to reach the targets of the Government, as shown in Table 2.4-3. This adjusted scenario is applied in the demand forecast process of this study as the most newly developed scenario that reflects the latest developments in the Indonesian economy and meets the established economic development targets produced under the Infrastructure summit. Table 2.4-3 Future Socioeconomic Growth Rates
Study Area 2005 - 2010 2010 - 2015 2015 – 2020
HLIRP-F/S Indonesia Population 1.33% 1.30% 1.30%
HLIRP-F/S Java Island Population 1.12% 1.09% 1.09%
JARNS Indonesia GDP – Moderate 5.40% 5.50% 5.60%
HLIRP Indonesia GDP – Moderate 5.10% 5.50% 5.50% HLIRP Java Island GRDP – Moderate 3.78% 4.90% 5.34%
F/S Indonesia GDP – Adjusted 6.60% 7.12% 7.12%
F/S Java Island GRDP – Adjusted 6.34% 6.91% 6.91%

2 - 10
2.5 ROAD NETWORK DEVELOPMENT 2.5.1 Arterial Road Network Development
In 2001, a comprehensive study on the development Java Arterial Road Network (JARNS) was completed with the objectives of establishing a 20-year road network development plan that indicates the most economically feasible means of providing future capacity and access needs, and formulating a series of 5-year implementation plans indicating the forecast optimal timing of successive additions to and improvements of the network. The initial stimulus for the study derived from a number of different issues and concerns: - The realization of the need for future road capacity expansion in Java - The belief that there was a need for toll roads which would be provided through a
high decree of private sector participation - The absence of an overall road network development plan that would coordinate
and prioritise government’s investment programs in arterial road network capacity provision in Java Island, and
- The relative disarray in the planning and coordination of emerging a program for toll road schemes available to the private sector.
A Road Network Development Plan with staged Implementation Programs for the whole of Java Island were established for the strategic network that includes all inter-urban roads of strategic significance in Java for a period of 20 years. Under the Main Trunk Network, the creation of a major “backbone” for the Java network has been formed as essential as a continuation of the strategy that has been pursued by several other programs, including the North Java corridor program. The overall objective here is to create a high-quality high-capacity route between the western and eastern ends of Java, connecting the major cities and provincial capitals and promoting the flow of long distance traffic through the economic heart of Java and Indonesia. Identification of the future need for toll roads in Java and their staged development priorities was one of the original motivations of JARNS study. It was found that with the exception of a number or predominantly urban or urban-fringe toll road schemes, inter-urban traffic volumes are generally low to achieve financial viability roads based on traditional BOT schemes for private sector financing.

2 - 11
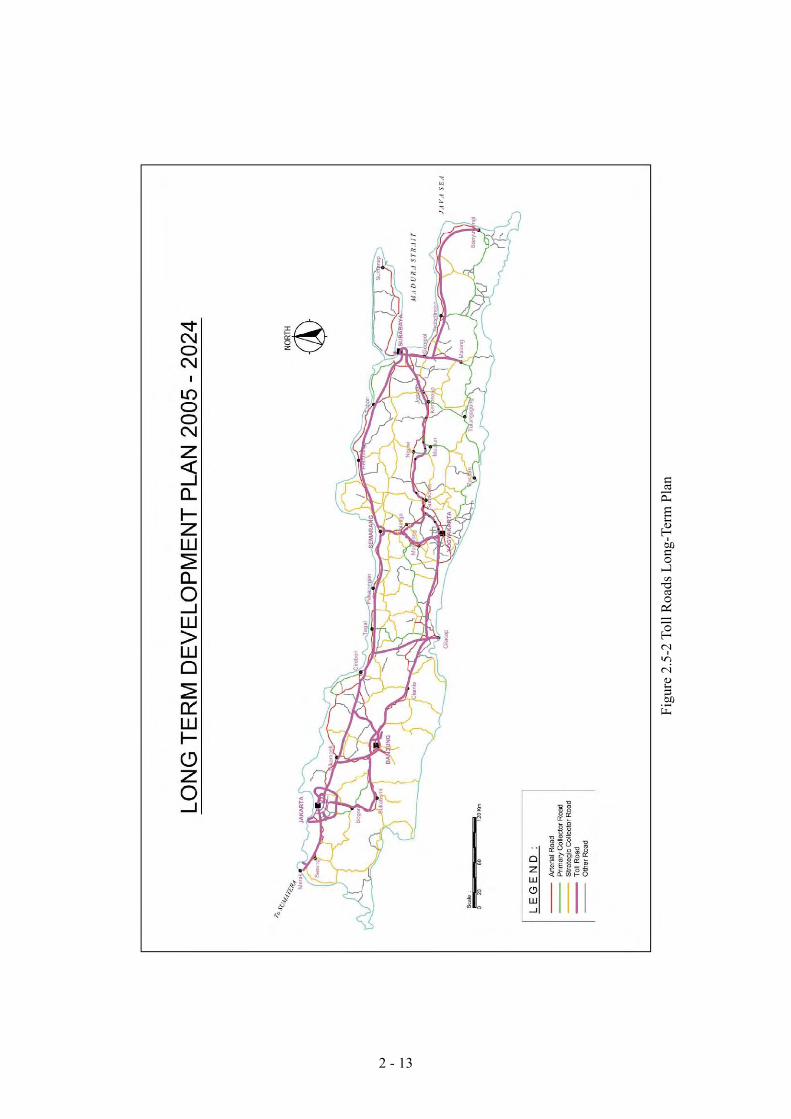
2.5.2 Toll Road Development The urban development in Indonesia had been increasing ever since the First Five Year Development. This fact led to the increase of social and economic activities which caused high growth in traffic volumes. Arterial roads, which were to be used for long distance traffic had been confuse not only with collector roads but also local roads. These situations caused traffic congestion and obstruction for targeted growth in economic sectors. Developing arterial road network requires a large amount of fund, while the national budget was very limited. Although the basic principal is that a public road is free-of-charge to use, the urgency of, and the insufficiency in the fund for, road network development necessitate the governments to adopt toll road systems. Collecting toll is justified by the beneficiary-pay principal for the new service provided by expressways as long as free alternatives exist. Figures 2.5-1 and 2.5-2 shows the short-term and long-term development plans of toll roads in Java Island The first toll road built in Indonesia was the “Jagorawi Toll Road” with a length of 46 km linking Jakarta to the outer suburbs of Bogor and Ciawi in March 1978. The Government funded it through offshore loans and the issuance of Indonesia Highway Corporation (Jasa Marga) bonds. Having been founded to operate the toll road on March 1st, 1978 based on the Government Regulation No. 4 of 1978, later based on Presidential Decree no. 38 of 1981, PT Jasa Marga (Persero) was appointed to operate nine toll roads/bridges in Indonesia. At the end of 1980s, the Government invited the private sector to take part in the development of the toll road network through Build, Operate and Transfer (BOT) schemes. As of the beginning of 2006, 649.12 km of toll roads are in operation in Indonesia, of which and 165 km are managed by private operators. In general, toll roads form part of the road infrastructure network. They were deemed to be implemented in a self-sufficient context without straining the Government’s budget. In order to give further strength to that investment concept, the regulatory status of toll roads was alerted by the Road Law No. 38/2004. The government tends to finance future toll roads through both approaches of fully private funds and Public-Private Partnership (PPP) programs. In order to attract private sector, there are steps that are done or being considered by the Government: ・ Strengthening the institutional and regulatory framework for toll roads ・ Establishing the Indonesian Toll Road Authority (BPJT) which will be responsible
for investment regulations on toll roads to replace Jasa Marga regulatory role

2 - 12
Sour
ce: M
inis
teri
al D
ecre
e 36
9, A
ugus
t 200
5
Figu
re 2
.5-1
Tol
l Roa
ds S
hort-
Term
Pla
n
2 - 13
Figu
re 2
.5-2
Tol
l Roa
ds L
ong-
Term
Pla
n

2 - 14
・ Formulating appropriate structure for the automatic adjustment of toll rates ・ Applying transparent and competitive process ・ Addressing issues on land acquisition and rights ・ Establishing clear and sound policies to determine the proper conditions under
which Government support should be extended ・ Formulating a road master plan including toll road master plan Article 43(2) of the Road Law No. 38/2004 gives the new policy of the Government regarding the development of toll roads, and the Government Regulation No. 15/2005 on toll roads, article 19-23 shows that for the toll road sections that indicate positive economical viability but not financially viable, the Government will finance or construct the respective toll road. After constructing the toll road, the Government will practice contract management for the operation and maintenance of the facility. For toll road sections with indications for positive economic viability but marginal financial viability, they can be implemented by the Government and an enterprise in which finance and construction can be conducted through a partnership scheme. For toll roads having good economic and financial viability, they will be offered through open and transparent investment tender process. The Road Law No. 38/2004 encompasses the following regulations: Indonesian Toll Road Authority (BPJT) ・ Indonesian Toll Road Authority (BPJT) established by, and is responsible to the
Minister of Public Works. ・ The Authority includes participants from the Government, stakeholders and the
public. ・ BPJT’s basic responsibilities encompass the implementation of regulations and the
supervision of toll road operators in accordance with the policies and regulations specified in Law No. 38 of 2004 and Government Regulation No. 15 of 2005.
・ Major tasks to be carried out by the Government/BPJT include: project preparation, invitation to pre-qualification (PQ & bidding), pre-bid conference, evaluation of bids, appointment of successful bidder, contract signing and contract implantation.
Toll Rates ・ Initial toll rates and subsequent toll rate adjustments are proposed by the investor
through BPJT and approved by the Minister of Public Works. ・ The rates are calculated by taking into consideration the willingness-to-pay of toll
road users, savings in vehicle operating cost and the feasibility of the investment. ・ Tariffs are regulated under a toll road authorization agreement; however, their

2 - 15
application is subject to the official announcement of the toll road operation. ・ Tariffs are subject to be reviewed and adjusted every two years with a coefficient
based on the inflation rate. Land Acquisition ・ The Government is responsible for the acquisition of land through the Ministry of
Public Works. ・ Land Acquisition is funded either by the Government, State Owned Company or
Private Sector. ・ The budget for land acquisition is determined by the Government. ・ The toll road and the land on which it is built are the property of the Government. ・ In case of land acquisition funds emanating from private parties if the cost exceeds
the approved budget, the shortfall will be compensated by an adjustment of the concession or through other acceptable methods.
To cope with the problem of land speculation that has caused project-cost inflation and uncertainty, it is expected that the Government will issue a regulation banning the use of land designated for turnpike projects for other purposes. With this regulation, land that has been earmarked for turnpike projects can not be sold except to the local government at a price that is slightly higher than the market value. This will be a part of the Government’s efforts to encourage investors to participate in future toll road projects and to reduce the length of the land acquisition process.
2.5.3 Indonesia Highway Corporation
On March 1978, Indonesia Highway Corporation, PT Jasa Marga (Persero), was established to operate the first section of toll roads in Indonesia. It was established as a state-owned corporation whose business includes the construction, management and maintenance of toll roads based on the Government’s Rules No. 4 and the Decision of the Minister of Finance of No. 90/KMK.06/1978, about the capital of PT Jasa Marga (Persero), dated February 27, 1978. The official document for establishment had been legalized by The Minister of Justice by the Decision No.YA5/130/I, dated February 22, 1982. It had been registered at the Office of the Court of First Instance in Jakarta No. 767 dated March 2, 1982 and had been announced in the State News of The Republic of Indonesia, No. 73 dated September 10, 1982, addition number 1138. March 9, 1978, the operation of first Toll Road in Indonesia was officially opened, called Jagorawi Toll Road that covers Cawang-Cibinong for about 27 km. This Toll road was operated right after it was officially opened. Until 1987, Jasa Marga was the only toll road operator in Indonesia. As of the beginning of 2006, a total of 649.12 km
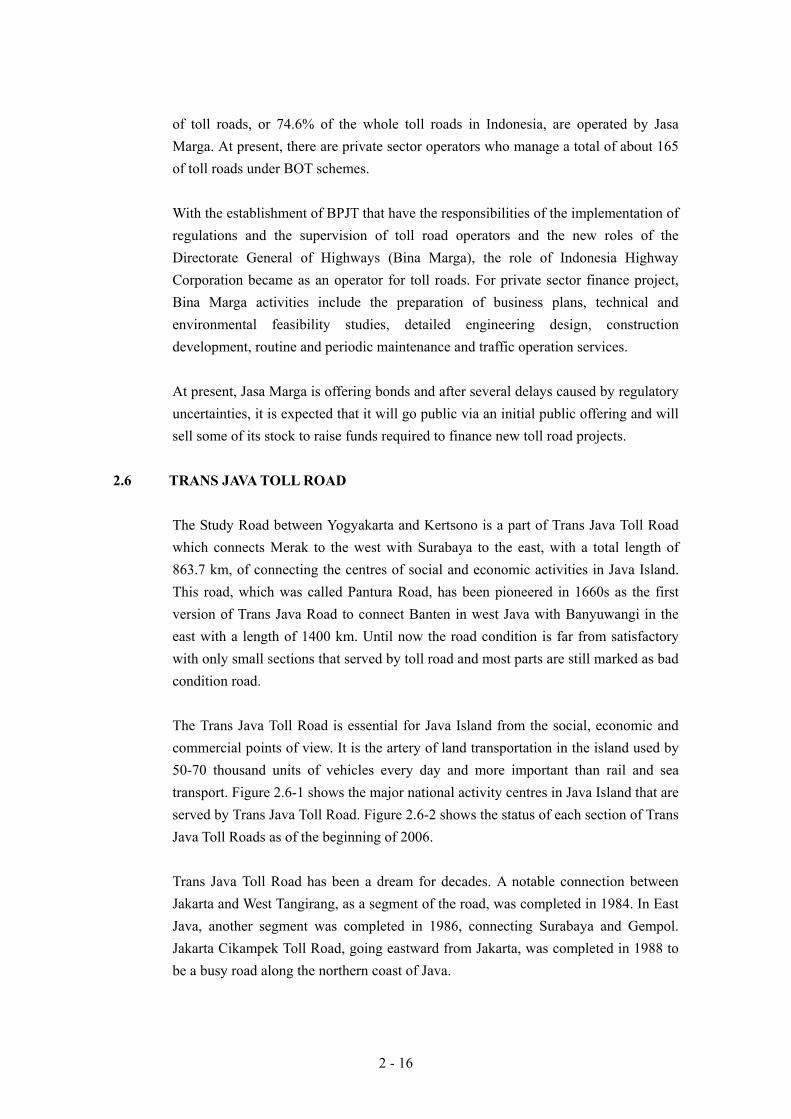
2 - 16
of toll roads, or 74.6% of the whole toll roads in Indonesia, are operated by Jasa Marga. At present, there are private sector operators who manage a total of about 165 of toll roads under BOT schemes. With the establishment of BPJT that have the responsibilities of the implementation of regulations and the supervision of toll road operators and the new roles of the Directorate General of Highways (Bina Marga), the role of Indonesia Highway Corporation became as an operator for toll roads. For private sector finance project, Bina Marga activities include the preparation of business plans, technical and environmental feasibility studies, detailed engineering design, construction development, routine and periodic maintenance and traffic operation services. At present, Jasa Marga is offering bonds and after several delays caused by regulatory uncertainties, it is expected that it will go public via an initial public offering and will sell some of its stock to raise funds required to finance new toll road projects.
2.6 TRANS JAVA TOLL ROAD
The Study Road between Yogyakarta and Kertsono is a part of Trans Java Toll Road which connects Merak to the west with Surabaya to the east, with a total length of 863.7 km, of connecting the centres of social and economic activities in Java Island. This road, which was called Pantura Road, has been pioneered in 1660s as the first version of Trans Java Road to connect Banten in west Java with Banyuwangi in the east with a length of 1400 km. Until now the road condition is far from satisfactory with only small sections that served by toll road and most parts are still marked as bad condition road. The Trans Java Toll Road is essential for Java Island from the social, economic and commercial points of view. It is the artery of land transportation in the island used by 50-70 thousand units of vehicles every day and more important than rail and sea transport. Figure 2.6-1 shows the major national activity centres in Java Island that are served by Trans Java Toll Road. Figure 2.6-2 shows the status of each section of Trans Java Toll Roads as of the beginning of 2006. Trans Java Toll Road has been a dream for decades. A notable connection between Jakarta and West Tangirang, as a segment of the road, was completed in 1984. In East Java, another segment was completed in 1986, connecting Surabaya and Gempol. Jakarta Cikampek Toll Road, going eastward from Jakarta, was completed in 1988 to be a busy road along the northern coast of Java.
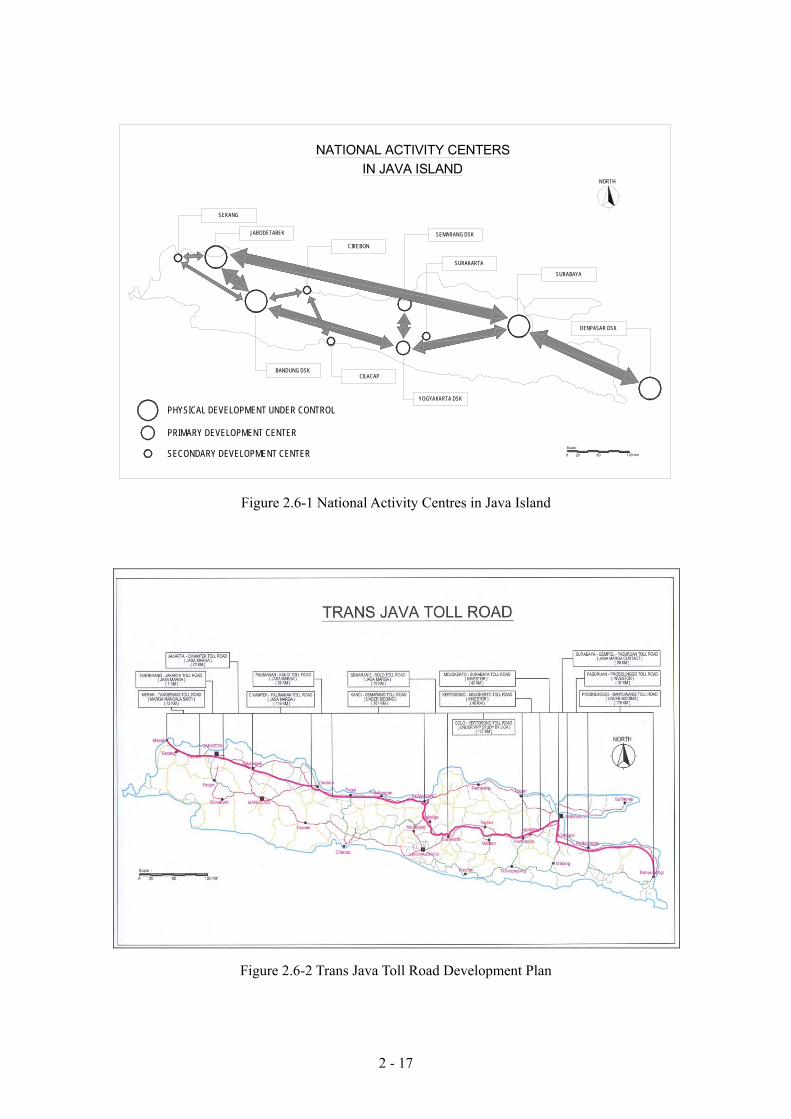
2 - 17
NORTH
Scale :
0 20 60 120 Km
SERANG
JABODETABEK SEMARANG DSK
CIREBON
SURAKARTA
SURABAYA
DENPASAR DSK
BANDUNG DSKCILACAP
YOGYAKARTA DSK
PHYSICAL DEVELOPMENT UNDER CONTROL
PRIMARY DEVELOPMENT CENTER
SECONDARY DEVELOPMENT CENTER
NATIONAL ACTIVITY CENTERSIN JAVA ISLAND
Figure 2.6-1 National Activity Centres in Java Island
Figure 2.6-2 Trans Java Toll Road Development Plan

2 - 18
2.7 MAJOR COMPONENTS OF THE PROJECT Tasks of the project under this study involve all the works required for the new construction of a toll road facility between Yogyakarta and Kertosono with a total length of 219.018 kilometres. The Study Road is divided into 12 segments between interchanges with the lengths shown in Table 2.7-1. It contains 13 interchanges and one junction at its connection with Semarang – Kartosuro section of Trans Java Toll Road. The road is planned to be constructed as divided with two lanes in each direction that will require a right of way of 60 – 70 meters. During the feasibility study stage, it was basically divided into the following four sections: Section I: Ygyakarta – Surakarta (Solo) Yogyakarta is characterised as a student and tourism city that is always busy with domestic and foreign tourism. More than the cultural heritage, the city has beautiful natural panorama. The existing road between the two cities, passing through 4 districts with high agricultural productivity, was widened to 2 lanes in each direction; however, the road is still characterized by traffic congestions due to the high traffic volumes and traffic friction at built-up areas. In line with the increase of economic activities in the area, the new toll road connection between the two cities is required. Section II: Surakarta (Solo) – Mantingan Surakarta is one of the big cities in Central Java and is the centre of trade, industry and other services in the region. The limited-capacity road network in this heavily built-up area with concentration of population density is handling high traffic volumes of heavy vehicles that transport heavy commodity vehicles. Section III: Mantingan – Ngawi Ngawi, neighboring with Kapupaten Sragen, is expected to practice rapid development in the near future. With Mantigan, being a growth center in the district, traffic volumes are rapidly growing. Meanwhile, the capacities of the existing road networks, which need improvement works, can not be well operated as distributed by mixed traffic and heavy side friction.
Table 2.7-1 Length of Study Road Segments Interchange Yogyakarta Prambanan Klaten Delanggu Kartosuro (Junction-I/C ) Kilometer 0+000 3+413 8+423 20+626 32+274 39+791 41+900
Length, km 3.413 5.010 12.203 11.648 7.517 2.109
Interchange Kartosuro (I/C) Solo Karanganyar Sragen Ngawi Madiun Caruban Nganujuk KertosonoKilometer 41+900/0+000 11+338 21+787 35+543 86+297 109+782 118+320 153+925 177+118
Length, km 11.338 10.449 13.756 50.754 23.485 8.538 35.605 23.193
2 - 19
Section IV: Mantingan - Kertosono The corridor in this area region consists of built up and densely populated areas and traffic is characterized with large volumes of heavy-duty vehicles transporting natural products like oil, oil palms, tea and rubber destined for Kertosono.
To realize the Project, major tasks which are expected to be carried out by either the Government or private sector based on the formulated work sharing program can be setup as follows: ・ Fund Arrangement: based on the formulated PPP scheme and the sharing in the
financial responsibilities between both the Government and PPP entities of the private sector, arrangements should be done to secure both public and private funds for different steps of project implementation
・ Selection of Consultant: with the utilization of public funds under the PPP scheme, consultants should be selected under the Governmental roles and those of the financing agencies involved in providing funds for the Government.
・ Detailed Engineering Design: Due to the large volume and nature of works of the Project, which composes of the construction of a large number of structures including interchanges and bridges as well as the construction of the toll road carriageway, the Project should be divided into several packages, to be designed and implemented simultaneously.
・ Land Acquisition: as this task composes a high risk toward the implementation of the project on schedule and it usually requires long time to finalize, it should be started at earliest possible stages.
・ Environmental Impact Assessment: although high negative environmental impacts are not expected, acquiring environmental clearance based on EIA with mitigating measures for any expected impacts is necessary for such large-scale project.
・ Tender Documents: The ordinary procedure for the tendering stage is to be conducted after the completion of the detailed engineering design stage which includes the preparation of the tender documents; however, with the adoption of a PPP scheme, early tendering stage is required to select the private sector partner that will handle designated tasks under the scheme. This task includes the sub-tasks of: Advertisement - Prequalification - Bidding – Contracting.
・ Construction: based on the source of utilized funds and the contracting agreement, construction activities are defined under the work sharing concept. With the limited time-frame for construction, the issue of land acquisition should be completely cleared in advance.
・ Operation and Maintenance: are the two tasks that are completely carried out by the private sector partner under any of the proposed PPP schemes of the Study.

2 - 20
L E G E N D :Arterial RoadPrimary Collector RoadStrategic Collector RoadTol RoadOther Road
Magelang
Salatiga
Surakarta
TubanRembang
Madiun
Jombang
Pacitan Tulungagung
Malang
Gempol
Probolinggo
SURABAYA
SEMARANG
YOGYAKARTA
Kertosono
NgawiS RAGEN
IN TE RC HAN GE K ARTOSU ROINTER CH AN GE
INTER CH AN GED ELAN GGU
IN TERC H ANGE
I NTERC H ANGEKLA TEN
IN TERC H ANGEPR AMB ANAN
YOGYAK ARTA
S OLO
INTER CH AN GEIN TERC H ANGE
I NTER CH ANGE
I NTERC H ANGEKAR ANG A NYAR
IN TE RC HA NGEC ARU BAN
MA DIU N
K ERTOSON OE ND PR OJECT
NGA NJUKI NTERC H ANGE
N GAWI
Figure 2.7-2 Semarang and Surabaya Toll Road Connections
Figure 2.7-1 Yogyakarta – Solo – Kertosono Toll Road

2 - 21
2.8 EFFECTS OF TOLL ROAD PROJECT Fully access control roads, such as the Toll Road Project, have various and far reaching effects on a variety of economic sectors and individuals as well, not only on their areas of construction but also on other parts of the whole region or country. Socioeconomic effects gained by the construction of fully access control roads can be usually classified in two major categories; direct effects and indirect effects. Direct effects are those benefits which road users directly receive by using the road as savings in travel time and cost and can be basically evaluated on monetary basis to some extent, while the indirect effects that are mostly represented as regional and national development effects. Since Indonesia aims to further nationwide and regional development, greater focus should be placed on the regional development, or indirect, effects rather than the direct effect and the profitability of applying toll on the road. Regional development will bring a variety of benefits to the whole nation, and if adequate policies and investment schemes accompany road development, regional development can be set efficiently and equitably.
2.8.1 Direct Effects
1) Savings in Travel Time: This is the most important effect of the new road gained through the reduction in trip distance and time due to its higher speed and level-of-service compared with other ordinary roads.
2) Savings in Vehicle Operating Cost: Contribution to energy savings including fuel and lubricant consumption as well as other savings in vehicle tyres, parts, maintenance and capital consumption provide benefits on individual base as well as on national level.
3) Improvement in Traffic safety: Higher safety for road traffic is a major benefit to the road users as well as to the whole society. This benefit can be partially expressed in monetary basis; however, the social impact has more effect.
4) More comfortable and safe driving: With the high level-of-service facility and non-interrupted traffic, it is expected that travel on the road will be more comfortable and safe for road users with reduced driver’s fatigue and other related effects.
5) Decreasing congestion on ordinary roads: This benefit is not for the users of the new facility but for drivers on the existing ordinary roads. By diverting a portion of the traffic volume from ordinary roads to the new high level-of-service facility, it is expected that congestions on the ordinary roads will be alleviated. In addition, as new road facilities have the bypass function at built-up areas, through traffic

2 - 22
moves outside centre of cities and towns along the road. 6) Improvement in punctuality: Toll roads with access control enable punctual arrival
at destinations, which help production centres to perform detailed scheduling of transport for products and efficient logistic systems for different activities distributed between different locations.
7) Betterment of environment: The better energy efficiency of vehicles on high level-of-service roads will lead to reducing emission of exhausted gases and improvement in air quality. In addition, less traffic on ordinary roads at city centres and populated areas will result in better urban environment.
8) Promotion of mobility (long-distance bus service): With toll roads that provide higher travel speeds than ordinary roads, inter-urban high-speed bus services can be provided for long-distance public transport trips in shorter travel times.
2.8.2 Regional Effects
1) Betterment of nationwide development: Promotion of economic activities in rural
and local, including; industry, manufacturing, agriculture, tourism and commercial activities, is an important task in the national development planning process. The toll road plays an important role toward this end, which will result redistributing excess agglomerated activities in metropolitan areas. This will consequently result in creating demand by road investments, higher productivity, betterment of economic activities distribution, increase in tax revenues, increase in exports, increase in population and income in rural areas and enhanced national identity.
2) Improvement in living conditions: Better road infrastructure facilities will result in widening life and employment opportunities, providing region-wide services such as medical care and education as well as efficient recovery systems in case of natural disasters.

CHAPTER 3
TRAFFIC SURVEY
AND
DEMAND FORECAST

3 - 1
CHAPTER 3
TRAFFIC SURVEY AND DEMAND FORECAST 3.1 OBJECTIVES
The purpose of this chapter is to review the future traffic volume of the F/S conducted for the study section by GOI in February of 2006 in order to ensure the precision of PPP scheme study. The following tasks were carried out for the review. • Conducting traffic surveys including traffic volume count survey, road side OD
survey and willingness-to-pay (WTP) survey. • Collecting and reviewing the trends of the past traffic volume and growth, and the
present toll rates of the existing toll roads to support the traffic analysis in interpretation of its results and setting the socially acceptable level of toll rate.
• Reviewing procedure and factors for traffic demand forecast used in the F/S to identify the issues for this study.
• Forecasting future traffic demand and assignment with JICA STRADA.
3.2 TRAFFIC SURVEY 3.2.1 Survey Method
Traffic survey was conducted on both May 2 (Tuesday) and May 3 (Wednesday) of 2006, which consists of the following surveys; (1) Traffic Volume Count Survey for 24-hour and 12-hour • Survey Location: Eight (8) locations for each as shown in Figure 3.2-1 that are
near the locations where the survey was conducted in the F/S. • Survey Time: 6:00 AM to 6:00 AM of the next day for 24-hour.
6:00 AM to 6:00 PM for 12-hour. • Survey Method Manual count by direction and vehicle type, data of which
was recorded at every 15 minutes. (2) Roadside Origin and Destination (OD) Interview Survey for 12-hour. • Survey Location: Eight (8) locations shown in Figure 3.2-1. • Survey Time: 6:00 AM to 6:00 AM • Survey Method: Around 20% out of the traffic were stopped at random, drivers
being interviewed.

3 - 2
(3) Willingness-To-Pay (WTP) Survey • Survey Location: Eight (8) locations including gas stations. • Survey Time: 6:00 AM to 6:00 AM • Survey Method: Interview with vehicle owners. • Survey Format: Some examples shown in Table 3.2-1. Note that in order to
avoid the bias of individuals, five (5) kinds of questionnaire sheets with various toll rates were prepared - one sheet is for one interviewee.
Table 3.2-1 Questionnaire Sheets (Sample) for WTP Survey
- Legend –24 hrs and OD Survey 12 hrs Survey Study Section
Figure 3.2-1 Traffic Survey Location Map
for study purpose only
Sample ID Date (month/day)
Location Time
Vehicle Gr.
1-Address
2-Sex 3-Age 1)20-29 2)30-39 3)40-491-Male 2-Female 4)50-59 5)>60
4-Do you have a driving lisence 5-Total number of cars your family has1-Yes 2-No
6-Car availability 7-Occupation1-Always 1- Admin. 2- Professional 3- Tech./assist.2-Often 4- Clerk 5- Sale/Services 6- Farmer/fisher3-Occasionally 7- Craftman 8- Production 9- Unskilled4-Seldom 10- Student 11- House wife 12- Retired5-Not available 13- Jobless 14- Other
8-Monthly Income (1,000 Rp)1) <1,000 2) 1,001-5,000 3) 5,001-10,0004) 10,001-20,000 5) >20,001
10- Trip ODWhere did you start this trip?
Landmark
Where do you go this trip?
Landmark
11-Travel TimeHow long does it take? Minutes
12- Trip purpose 13-Frequency1.Work 7.Shopping/Eating How often do you use a car for this trip purpose and OD ?2.Education 8.Sending/ Fetching 1) more than 90% of time
3.Home 9.Recreation 2) 70 - 90 %
4.Selling/Delivering 10.Medical treatment 3) 50 - 70 %
5.Meeting/business 11.Social 4) 30 - 50 %
6.Return to work place 12.Other 5) less than 30%
14- How much would you pay for travel time reduction of this trip by Urban Expressway ?
1) By 20% of travel time of this trip Rp
2) By 50% of travel time of this trip Rp
Gen
eral
Inf
o.P
erso
nal I
nfor
mat
ion
Trip
Inf
orm
atio
n
1. ; 2. ; 3. ; 4. ; 5a. ; 5b. ; 6. ; 7a. ; 7b. ; 7c.
Case A
Case B
Case C
Choice (pls. Check)
Travel time (hrs)
Travel Cost (1,000Rp)
0
65
Travel time (hrs)
5
2
Toll Expressway 0.5 15
Ordinary Road 1 0
Road Type Travel time (hrs) Travel Cost (1,000Rp) Choice (pls. Check)
Road Type
Ordinary Road
Toll Expressway
Road Type Travel Cost (1,000Rp) Choice (pls. Check)
Ordinary Road 3 0
Toll Expressway 1.5 40
C a s e A
C a s e B
C a s e C
T o l l E x p r e s s w a y 0 . 5 5
O r d in a r y R o a d 1 0
R o a d T y p e T r a v e l t im e ( h r s ) T r a v e l C o s t ( R p ) C h o ic e ( p ls . C h e c k )
T o l l E x p r e s s w a y 1 . 5 3 0
O r d in a r y R o a d 3 0
R o a d T y p e T r a v e l t im e ( h r s ) T r a v e l C o s t ( R p ) C h o ic e ( p ls . C h e c k )
T o l l E x p r e s s w a y 2 8 0
O r d in a r y R o a d 5 0
R o a d T y p e T r a v e l t im e ( h r s ) T r a v e l C o s t ( 1 , 0 0 0 R p ) C h o ic e ( p ls . C h e c k )
Common Sheet
Sheet 1
Sheet 2

3 - 3
3.2.2 Results of Traffic Survey
(1) Grouping of Vehicles There are ten (10) types of vehicles surveyed in the study. They can be categorized into three (3) groups following regulation in Indonesia except for such small vehicles as motorcycles, etc. which are usually not allowed to use toll roads. Grouping of Vehicles is as follows (refer to Figure 3.2-2): Group-I
- Utility (sedan, jeep, etc.), Small public and cargo transport (oplet, pick-up, micro truck, small bus, etc.).
Group-IIA
- Big bus, Truck with 2-axle Group-IIB
- Truck with 3-axle or more (2) Traffic Volume along the Study Section and Its Interpretation The result of traffic volume count survey is shown in Table 3.2-2 and Figure 3.2-3 with comparing to the F/S. The result has the following tendency. • Traffic volume counted in the study is smaller than that in the F/S. Difference in
total traffic volume between them is 10 to 30%. The tendency of difference in traffic volume between both surveys is interpreted as follows. • Seasonal fluctuation as shown in Table 3.2-3
--The study’s survey was in early May of 2006, the F/S’s survey in September of 2005. While traffic volume in April and May when the study’s survey was conducted is constantly smaller than in other months, traffic volume in September is larger than in other months
• Influence of gasoline price hike as shown in Table 3.2-3 --Gasoline price has been almost double since November of 2005; the F/S’s
survey and the study’s survey conducted before and after gasoline price hike, respectively.
--According to the table, traffic volume in 2006 is almost the same as that in 2004.
Since seasonal factor for traffic on toll roads has been prepared, average annual traffic volume may be estimated to be smaller than that of the F/S but larger than that of the
Figure 3.2-2 Grouping of Vehicles
Group I Group IIA Group IIB

3 - 4
F/S Study F/S Study F/S Study F/S StudyYogya-Prambanan 34,498 - 3,024 - 703 - 38,225 -Prambanan-Klaten 21,074 17,570 2,481 683 1,024 201 24,579 18,454Klaten-Delanggu 21,807 - 2,105 - 1,074 - 24,986 -
Delanggu-Kartosuro 19,158 17,670 2,111 923 1,113 239 22,382 18,832Solo-Sragen 14,869 13,584 3,753 1,463 1,538 443 20,160 15,490
Sragen-Mantingan 9,961 7,424 1,690 1,517 1,214 641 12,865 9,582Mantingan-Ngawi Mantingan-Ngawi 9,399 - 1,620 - 1,183 - 12,202 -
Ngawi-Maospati(S) N.A. 6,327 N.A. 789 N.A. 656 8,591 7,772Maospati-Madiun(S) 10,894 - 880 - 319 - 12,093 -Madiun-Caruban(S) 9,457 9,214 1,303 683 584 106 11,344 10,003Ngawi-Caruban(N) 7,609 - 865 - 1,109 - 9,582 -Caruban-Nganjuk 12,599 9,694 1,909 1,229 1,462 529 15,970 11,452
Nganjuk-Kertosono 10,766 10,250 1,701 815 1,050 611 13,517 11,676Note: Group-I=Sedan,Jeep,Kijang,Taxi, Small/Medium Bus, Pick-up,Truck(3/4ton),) Group-IIA=Large(55 seats),Truck(2xle) Group-IIB = 3axle, Trailer
(S): south route, (N): north route, F/S: September of 2005, Study: May of 2006
Remarks
Grp-I Grp-IIA Grp-IIB Total
Ngawi-Kertosono
Solo-Mantingan
Yogya-Solo
Section
Table 3.2-2 Traffic Volume on the Study Section
study. As for the influence of gasoline price hike, decrease of the traffic volume is considered to be temporary phenomenon according to Figure 3.2-4, which shows the past trend of the traffic growth after/before Asian Monetary Crisis in 1998. In several years after 1998, the traffic growth has tendency to get back on the past growth trend line. These trends seem to be true of the traffic on the arterial road where the traffic survey was conducted.
Figure 3.2-3 Traffic Volume at Each Location
Ngawi – Kertosono Section
Surakarta (Solo) - Mantingan SectionYogyakarta – Surakarta (Solo) Section
Palu
SUKO
Kartosuro
KLATENPrambanan
KALIURANG
BOYOLALI
Kaprekan
SURAKARTA
pSecong
Selo
KrenderanBulu Grogal
SLEMAN
Blando
Muntilan
NguCawangSangkal Putung
Jetlonom
Blimbing
YOGYAKARTA
Delanggu
38.225
24.579
18.454
24.986
22.382
18.832
M
n g N G
G a lan
M a
S R A G E NG am o long
P a lu r K A R A N G A N Y A R
C em oros ew e
o su roS U R A K A R T A
M an tinga n
G a ye r
e la n g gu
1 8 .83 2
2 0 .1 60
1 5 .4 90
9 .58 2
1 2 .8 651 2 .2 02
7
9 .5 8 2
1 2 .2 0 2
8 .5 9 1
7 .7 7 2
1 2 .0 9 31 0
1 1 .3 4 4
9
B a n y u u r ipM a n t in g a n
N G A W I
M A G E T A N
A G E N
G A N Y A R
P a d a s
M a o s p a tiM A D IU N
U le ra n
Padas
WilangonNGANJUK
Maospati
Caruban
MADIUN
Uleran
Pajeng
MAGETAN
NGAWI
Kertosono
Banyuurip
8.591
7.772
12.09310.003
11.344
9.58215.970
11.452
13.517
11.676
Mantingan - Ngawi Section Note; Figures in the F/S data Figures in the study data
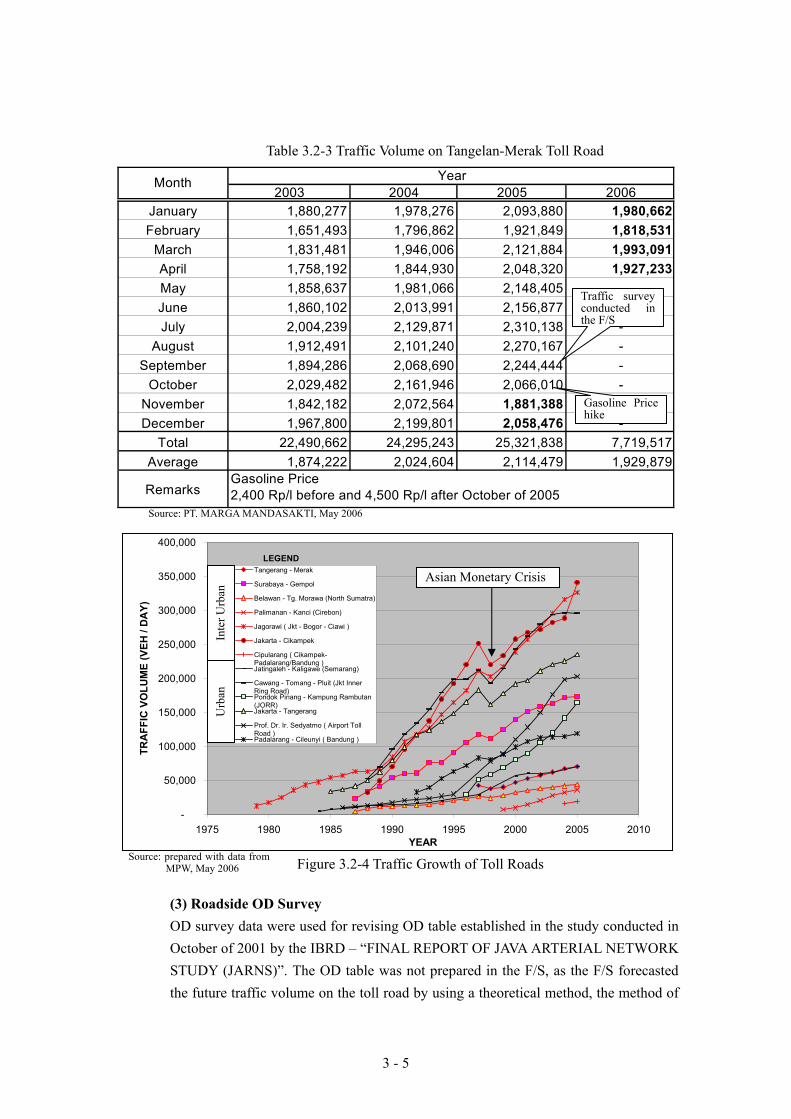
3 - 5
(3) Roadside OD Survey OD survey data were used for revising OD table established in the study conducted in October of 2001 by the IBRD – “FINAL REPORT OF JAVA ARTERIAL NETWORK STUDY (JARNS)”. The OD table was not prepared in the F/S, as the F/S forecasted the future traffic volume on the toll road by using a theoretical method, the method of
Source: prepared with data from MPW, May 2006
Source: PT. MARGA MANDASAKTI, May 2006
2003 2004 2005 2006January 1,880,277 1,978,276 2,093,880 1,980,662February 1,651,493 1,796,862 1,921,849 1,818,531
March 1,831,481 1,946,006 2,121,884 1,993,091April 1,758,192 1,844,930 2,048,320 1,927,233May 1,858,637 1,981,066 2,148,405 -June 1,860,102 2,013,991 2,156,877 -July 2,004,239 2,129,871 2,310,138 -
August 1,912,491 2,101,240 2,270,167 -September 1,894,286 2,068,690 2,244,444 -
October 2,029,482 2,161,946 2,066,010 -November 1,842,182 2,072,564 1,881,388 -December 1,967,800 2,199,801 2,058,476 -
Total 22,490,662 24,295,243 25,321,838 7,719,517Average 1,874,222 2,024,604 2,114,479 1,929,879
RemarksGasoline Price2,400 Rp/l before and 4,500 Rp/l after October of 2005
Month Year
Table 3.2-3 Traffic Volume on Tangelan-Merak Toll Road
-
50,000
100,000
150,000
200,000
250,000
300,000
350,000
400,000
1975 1980 1985 1990 1995 2000 2005 2010YEAR
TRA
FFIC
VO
LUM
E (V
EH /
DA
Y)
Tangerang - Merak
Surabaya - Gempol
Belawan - Tg. Morawa (North Sumatra)
Palimanan - Kanci (Cirebon)
Jagorawi ( Jkt - Bogor - Ciawi )
Jakarta - Cikampek
Cipularang ( Cikampek-Padalarang/Bandung )Jatingaleh - Kaligawe (Semarang)
Cawang - Tomang - Pluit (Jkt InnerRing Road)Pondok Pinang - Kampung Rambutan(JORR)Jakarta - Tangerang
Prof. Dr. Ir. Sedyatmo ( Airport TollRoad )Padalarang - Cileunyi ( Bandung )
LEGEND
Asian Monetary Crisis
Figure 3.2-4 Traffic Growth of Toll Roads
Inte
r Urb
an
Urb
an
Gasoline Price hike
Traffic survey conducted in the F/S

3 - 6
which doesn’t require road network in the study regions. (4) Willingness - To - Pay (WTP) Survey The main purpose of WTP survey is to reflect its data to prediction of diversion rate. An example of simplified summary table of WTP survey result is shown below for reference (Table 3.2-4). Table 3.2-4 Part of Summary Table of WTP Survey Result
No. Sample Time Difference x 60 Toll Ratex1000 Toll Rate/Time difference
2 30 250 1.5 20 222 1 0.5 10 333 2 30 250
1.5 20 222 2 0.5 5 167 2 40 333
1.5 40 444 3 0.5 5 167 2 30 250
1.5 20 222 4 0.5 5 167 2 30 250
1.5 20 222 5 0.5 5 167 2 30 250
1.5 20 222 6 0.5 5 167 2 30 250
1.5 20 222 7 0.5 5 167 2 30 250
1.5 30 333 8 0.5 5 167 2 40 333
1.5 30 333 9 0.5 10 333 2 30 250
1.5 20 222 10 0.5 5 167 2 30 250
1.5 20 222 11 0.5 10 333 2 30 250
1.5 20 222 12 0.5 5 167 2 30 250
1.5 20 222 13 0.5 10 333
Note: total number of samples is 1,610.

3 - 7
3.3 DEMAND FORECAST 3.3.1 Basic Policy
In the study the demand forecast of the F/S was reviewed following the procedure below. • Present and future OD matrix tables of the IBRD study- “FINAL REPORT OF
JAVA ARTERIAL NETWORK STUDY (JARNS), 2001”- were utilized as the basis of the study.
• Since OD table of the IBRD study covers entire Java Island, the scale of which was simplified focusing on the regions where the study section is located.
• The present OD table was revised based on the roadside OD survey results conducted by the study. As for the present traffic volume, adjustment was made targeting around traffic volume obtained from both the F/S and the study from the reasons described in Section 3.2.2(2).
3.3.2 OD Zoning System
OD zoning system applied in the study is shown in Figure 3.3-1 and in Appendix 3-1.
2
1
3
5
6
4
10
7
1112
8
9
13
1516
17
39 18 19
2021
43
47
464445
48
88
58
60
5961
57565553
83 84
82
81
42
49
5051 52
54
86
87
7678
89
85
6364
66
62
6567
68
6970
73
72
80
747577
79
14
3031
4032
22
26 2425
23
2729
234135
3738
3433
3648
Figure 3.3-1 Study Area Zone Plan

3 - 8
3.3.3 Present and Future Trip Pattern Figure 3.3-2 shows that high trip growth is expected in the future due to the rapid socio-economic development in Java Island.
12
3
4
5
6
78
9
10
11
1213 14
15
1617
Surabaya
Yogyakarta
Semarang Jakarta
12
3
4
5
6
78
9
10
11
1213 14
15
1617
Legend : 50,000 veh/day : 100,000 veh/day : 200,000 veh/day
Jakarta Semarang
Surabaya
Yogyakarta
Year 2005
Year 2030
Figure 3.3-2 Future Desire Lines

3 - 9
3.4 FUTURE TRAFFIC VOLUMES 3.4.1 Basic Policy
The future traffic volume on the study section was reviewed following the policies below. • Present and future road network for the study regions established in the study of
IBRD (refer to Section 3.2.2(3)) is basically applicable. • By adding toll roads of study section, Semarang - Solo section and Surabaya -
Kertosono section, to the above road network, basic road network for the traffic assignment analysis is to be established.
• Toll roads of Semarang-Solo and Surabaya-Kertosono are to be constructed before construction of whole/part of the study section.
• The national road in the north corridor is to be widened to 4-lane road in 2020. Forecasting of future traffic volume on the study toll road in the F/S was carried out without considering the road network by using theoretical method. However, for the section between Solo and Kertosono, diversion traffic from national road in the north corridor between Semarang and Surabaya shall be highly expected, since two toll roads, one is from Semarang and the other is from Surabaya, to be connected with the study section will be constructed earlier than construction of the study section according to the Status of Land Acquisition for Toll Road, 7 April 2006, MPW.
3.4.2 Traffic Assignment Procedure (1) Assignment Procedure In the study, the capacity restraint assignment method was used, the method of which is the most straightforward technique among the network models, and the most efficient one, particularly where the number of the trip matrix is relatively large. This assignment is based on the speed-flow relationship. The traffic assignment procedure is shown in Figure 3.4-1 as a flow chart. In this assignment technique, and calculating the required travel time for each link according to its travel time and road conditions, the program determines the fastest routes between each origin and destination by evaluating the travel time on links, and assigns the trips between the given origins and destinations to these routes starting at the destinations and getting back to the origins. As congestion increases to a certain level as traffic volume increases, alternative routes are introduced to handle the unassigned traffic. Zone-to-zone routing is built, which is the fastest path from each zone to any other, all trips are assigned to these optimum routes.

3 - 10
Computer software of the JICA STRADA (System for Traffic Demand Analysis) was utilized for the traffic assignment, which has all necessary tools for transportation planning and was developed to analyze transportation problems, model demand forecast and develop project proposals. (2) Speed-Flow Relationship The speed-flow relationship used in the course of the traffic assignment analysis is shown in Figure 3.4-2. With the traffic volume increasing in traffic volume in excess of 0.3 Qmax, the travel speed begins to decrease gradually up to Vmin which is about 0.10xVmax at Qmax. After reaching Vmin, the travel speed of Vmin is assumed to be kept constantly in order to avoid unrealistic assignments in the assignment applications.
Road Network Data Speed-Flow Relationship
Shortest Route using Road Network Only
(Without Project)
Shortest Route using Road Network including toll roads
Toll Rate
Diversion Rate Model for Inter-Urban toll Road
WTP Survey Result
Assignment on Shortest Route on Both Networks for Each
Scenario of Toll Road Development for Traffic Assignment
Assigned Traffic Volume on Road Network
Figure 3.4-1 Traffic Assignment for the Road Network in the Study Regions
Initial Speeds on Links
OD Traffic Data Divided by the Number of Increments To
be
repe
ated
up
to th
e La
st In
crem
ent
Qmax 0.3Qmax
Vmin = 0.1Vmax
Vmax
Figure 3.4-2 Speed-Flow Relationship

3 - 11
(3) Time Evaluation Value The time evaluation Value (TEV) is applied to evaluate the travel time on links of road network in use for persons, either passenger or assistants in trucks , in all vehicle categories. The TEV prepared in the F/S as shown in Table 3.4-1 was utilize as the basis of estimating the TEV for the study. As for present and future TEV, it was estimated by considering the inflation rate of 7.2%. Table 3.4-1 Time Evaluation Value (Rp/hour)
Vehicle Category Java Sumatra Kalimantan Sulawesi
Light Vehicle 15,437 14,105 18,448 11,560
Mini Bus 17,159 15,679 20,506 12,850
Medium Vehicle 35,022 32,001 41,853 26,226
Big Bus 72,104 65,884 86,167 53,996
Source : Studi HLRIP, Ditjen Prasarana Wilayah 2001
(4) Incremental Assignment with Diversion Rate Method This assignment incorporates the diversion rate method with the formula 3.4.2(1), developed by the Japan Highway Public Corporation for inter-urban expressway, into incremental assignment which divides the input OD traffic data into certain increments and assigns each increment to the minimum route.
The diversion rate method is applied to estimate the proportion of traffic volumes diverted from the future ordinary road network to the newly developed toll roads. The factors having the greatest influence on the routes taken by drivers are the comparative travel time and distance. Several diversion rate models have been developed for toll roads within urban areas and for inter-urban toll roads. Since having been developed for inter-urban toll roads such as the study section, the formula 3.4.2(1) was utilised for the study.
)1(2.4.3100)/(1
1−−−−−−−−−−−−×
+= βα SX
P
:,:::
)/(::
2
1
21
βαStt
ttCXP
−=
Where, Diversion Rate (%)Toll Rate (Rp) / Time Difference (minutes)
Travel Time when passing a Non-Toll Road (minutes) Travel Time when passing a Toll Road (minutes) Future Shift Ratio Local Factors

3 - 12
The steps of assignment per increment are shown in Figure 3.4-3. Table 3.4-2 and Figure 3.4-4 presents the results of traffic assignment verification process on observed and assignment traffic volumes with a correlation factor of 0.91.
Table 3.4-2 Observed and Assigned Traffic Volumes Location Section Observed(a) Assigned(b) (c=b-a) (d=c/a)
TC 01 Wates Yogyakarta - Wates 9,940 10,448 508 5%TC 02 Tempel Yogyakarta - Magelang 15,987 14,668 -1,319 -8%TC 03 Piyungan Wonosari - Yogyakarta 6,372 6,286 -86 -1%TC 04 Karang Anyar Kr ANYAR - Palur 21,127 19,656 -1,471 -7%TC 05 Magetan Madiun - Ngawi 7,414 7,050 -364 -5%TC 06 Nganjuk Madiun - Nganjuk 11,452 10,298 -1,154 -10%TC 07 Kediri Kertosono - Kediri 9,235 8,411 -824 -9%TC 08 Kertosono Jombang - Kertosono 14,364 15,903 1,539 11%TC OD1 Prambanan Yogyakarta - Klaten 17,247 21,533 4,286 25%TC OD2 Boyolali Boyolali - Kertosura 11,865 12,456 591 5%TC OD3 Kartosuro SOLO - Yogyakarta 17,600 21,087 3,487 20%TC OD4 Palur PALUR - SRAGEN 15,490 13,119 -2,371 -15%TC OD5 Mantingan Ngawi - Sragen 9,582 10,220 638 7%TC OD6 Ngawi Caruban - Mantingan 7,772 7,324 -448 -6%TC OD7 Nganjuk Kediri - Kertosono 9,235 12,406 3,171 34%TC OD8 Nganjuk Kertosono - Nganjuk 11,676 9,330 -2,346 -20%
Figure 3.4 -3 Assignment Steps per Increment
Step 0: InitializeSet the increment n=0 and the link traffic pattern X(0)=0.
Step 1: Link cost calculationCalculate the link cost t(n) by the traffic pattern.
Step 2: Minimum routes searchSearch two minimum routes under the link cost of t(n) : the route that includes road links and the other that excludes them. The former search covers the entire links in the network, ignoring the toll rate resistance. The latter search avoids the road links in the network.
Step 3: Calculation of traffic diversion and assignmentObtain the diversion rate by calculating the toll rate resistance and travel time per OD pair on two minimum routes, apply the diversion rate to the increment and assign it to two minimum routes to obtain the new link traffic X(n).
Step 4: Repeating of calculationSet the increment n=n+1 and go to Step 1 up to the last increment.

3 - 13
0
5,000
10,000
15,000
20,000
25,000
0 5,000 10,000 15,000 20,000 25,000
Observed Volumes (veh./day)
Ass
igned
Volu
mes
(veh./
day)
Figure 3.4-4 Traffic Assignment Verification
Local factors of α, βof the formula 3.4.2(1) were determined with the least square method based on the WTP survey result as shown in Figure 3.4 -5 and Table 3.4-3.
0.00
10.00
20.00
30.00
40.00
50.00
60.00
70.00
80.00
90.00
100.00
0 100 200 300 400 500 600
X (Rp/Minute)
Div
ersi
on R
ate
(P%
)
Diversion Rate Curve obtained from WTP Survey Data
WTP Data
Correlation Coefficient R2 = 0.9706
X (toll rate (Rp) / time difference (minutes))
P (d
iver
sion
rate
(%))
Figure 3.4 -5 Determination of αandβfrom WTP Survey Result
R = 0.91

3 - 14
As for the Shift Ratio (S), it was determined based on the growth of GRDP per capita of Java Island as shown in Table 3.4-4. The S after year 2020 was extended.
3.4.3 Future Traffic Volume (1) Scenario of Toll Road Development As described in Section 3.4.1, the scenario of toll road development was presumed as follows: • Toll roads between Semarang and Solo, and between Surabaya and Kertosono are
to be developed earlier than the study section. • Either case that Yogya-Solo section only is constructed or that Solo-Kertosono
section only is constructed is considered. • Operation of the study section will be opened from 2010.
(2) Assignment Cases The following cases for traffic assignment were analyzed.
Vehicle Group α β Group- I* 7.220 x 10⁻⁶ 2.095 Group- IIA** 3.088 x 10⁻⁶ 2.095 Group- IIB** 1.690 x 10⁻⁶ 2.095
* : obtained from Figure 3.4-4 **: obtained by following the F/S method; toll rates of Group-IIA and Group-IIB are 1.5 times and twice that of Group-I, respectively.
Table 3.4-3 α and β for Diversion Rate
2005-2010 2010-2020
G row th of GRDP (%) 6 .34 6 .91
G row th of Popu lation (%) 1 .12 1 .09
G row th of GRDP per Cap ita (% ) 5 .16 5 .76
Shift Ratio S (Year 2006; S=1 .0 ) 1 .29 (2010) 2 .26 (2020)
Source of GRDP and Popu lation (2005-2020): F/S Report
Table 3.4 -4 Growth of GRDP per Capita in Java Island (per year)
Kertosono Yogya Solo Matingan Ngawi
Semarang Surabaya
Section I Section II Section III Section IV
Case1: with all sections in 2010, 2020 and 2030.

3 - 15
(3) Study on Maximum Revenue Level In order to search the maximum revenue level for the study section, the calculation varying toll rates from Rp100/km to Rp 1,000/km as shown in Figure 3.4-6 was carried out in Group-I with case 1 in 2010. From the calculated results, the maximum revenue level of Group-I is presumed to be about Rp 400/km.
Kertosono Yogya Solo Matingan Ngawi
Semarang Surabaya
Section I Section II Section III Section IV
Case2: with section I only in 2010, 2020 and 2030.
Kertosono Yogya Solo Matingan Ngawi
Semarang Surabaya
Section I Section II Section III Section IV
Case3: with section II, III and IV below in 2010, 2020 and 2030.
Kertosono Yogya Solo Matingan Ngawi
Semarang Surabaya
Section I Section II Section III Section IV
Case4: without toll on all sections in 2010, 2020 and 2030 for Economic
Toll Rate (Rp/km)
0
200
400
600
800
1,000
1,200
1,400
0 200 400 600 800 1000 1200
Rev
enue
(mill
ion
Rp)
Figure 3.4-6 Searching the Maximum Revenue for the Study Section
Maximum Revenue Level
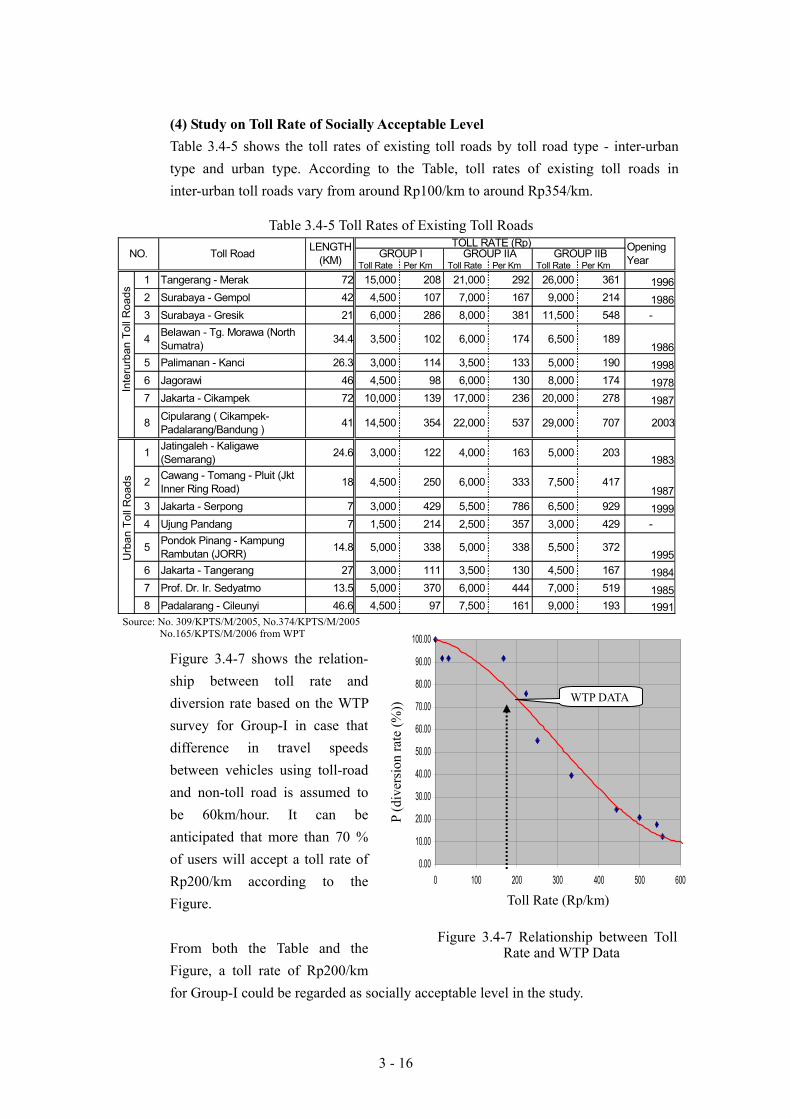
3 - 16
(4) Study on Toll Rate of Socially Acceptable Level Table 3.4-5 shows the toll rates of existing toll roads by toll road type - inter-urban type and urban type. According to the Table, toll rates of existing toll roads in inter-urban toll roads vary from around Rp100/km to around Rp354/km. Figure 3.4-7 shows the relation- ship between toll rate and diversion rate based on the WTP survey for Group-I in case that difference in travel speeds between vehicles using toll-road and non-toll road is assumed to be 60km/hour. It can be anticipated that more than 70 % of users will accept a toll rate of Rp200/km according to the Figure. From both the Table and the Figure, a toll rate of Rp200/km for Group-I could be regarded as socially acceptable level in the study.
Source: No. 309/KPTS/M/2005, No.374/KPTS/M/2005 No.165/KPTS/M/2006 from WPT
Toll Rate Per Km Toll Rate Per Km Toll Rate Per Km1 Tangerang - Merak 72 15,000 208 21,000 292 26,000 361 19962 Surabaya - Gempol 42 4,500 107 7,000 167 9,000 214 19863 Surabaya - Gresik 21 6,000 286 8,000 381 11,500 548 -
4 Belawan - Tg. Morawa (NorthSumatra) 34.4 3,500 102 6,000 174 6,500 189
19865 Palimanan - Kanci 26.3 3,000 114 3,500 133 5,000 190 19986 Jagorawi 46 4,500 98 6,000 130 8,000 174 19787 Jakarta - Cikampek 72 10,000 139 17,000 236 20,000 278 1987
8 Cipularang ( Cikampek-Padalarang/Bandung ) 41 14,500 354 22,000 537 29,000 707 2003
1 Jatingaleh - Kaligawe(Semarang) 24.6 3,000 122 4,000 163 5,000 203
1983
2 Cawang - Tomang - Pluit (JktInner Ring Road) 18 4,500 250 6,000 333 7,500 417
19873 Jakarta - Serpong 7 3,000 429 5,500 786 6,500 929 19994 Ujung Pandang 7 1,500 214 2,500 357 3,000 429 -
5 Pondok Pinang - KampungRambutan (JORR) 14.8 5,000 338 5,000 338 5,500 372
19956 Jakarta - Tangerang 27 3,000 111 3,500 130 4,500 167 19847 Prof. Dr. Ir. Sedyatmo 13.5 5,000 370 6,000 444 7,000 519 19858 Padalarang - Cileunyi 46.6 4,500 97 7,500 161 9,000 193 1991
Inte
rurb
an T
oll R
oads
Urb
an T
oll R
oads
OpeningYearGROUP I GROUP IIA GROUP IIBLENGTH
(KM)TOLL RATE (Rp)
Toll RoadNO.
Table 3.4-5 Toll Rates of Existing Toll Roads
0.00
10.00
20.00
30.00
40.00
50.00
60.00
70.00
80.00
90.00
100.00
0 100 200 300 400 500 600
X (Rp/Minute)
Div
ersi
onR
ate
(P%
)
Toll Rate (Rp/km)
P (d
iver
sion
rate
(%))
Figure 3.4-7 Relationship between Toll Rate and WTP Data
WTP DATA

3 - 17
(5) Future Traffic Volume Calculation Cases for Traffic Assignment Future traffic volume on the study section was forecast for the cases shown in Table 3.4-6 considering the convenience for cash flow analysis, economic benefit analysis and review of the F/S results. Regarding assignment cases in the Table, refer to Section 3.4.3(2).
Table 3.4-6 Calculation Cases Year
10 20 30 Assignment Case S.A.L M.R.L S.A.L M.R.L S.A.L M.R.L
Toll Rate (Rp/km) 200 400 400 800 800 1,000
Case 1 Case Name Case1-10S Case1-10M Case1-20S Case1-20M Case1-30S Case1-30M
Toll Rate (Rp/km) 200 400 400 800 800 1,000
Case 2 Case Name Case2-10S Case2-10M Case2-20S Case2-20M Case2-30S Case2-30M
Toll Rate (Rp/km) 200 400 400 800 800 1,000
Case 3 Case Name Case3-10S Case3-10M Case3-20S Case3-20M Case3-30S Case3-30M
- - - - - - - Case 4 Case
Name Case4-1 Case4-2 Case4-3
Remarks
• Toll Rates of Group-I are presented here. Toll rates of Group-IIA and Group-IIB were to be 1.5 times and twice those of Group-I, respectively.
• S.A.L: Socially Acceptable Revenue Level. • M.R.L: Maximum Revenue Level. • Toll rates of S.A.L and M.R.L after 2010 were estimated at a inflation rate of
7.2% Comparison with the F/S Results Figure 3.4-8 shows the future total traffic volume on the toll road by segment in 2010 with the F/S results. The segment means a section between two interchanges (regarding relationship between segment numbers and interchange names, refer to Table 3.4-7). Traffic volume at the case1-10S in 2010 forecast by this study is approximately corresponding to the F/S, the toll rate of which is Rp450/km for Group-I. Traffic volumes forecast by the study in 2020 and 2030 are shown in case of the toll rate of the socially acceptable level as shown in Figure 3.4-9. With respect to the case numbers, refer to Table 3.4-6. Traffic volume on Segment 1 (Yogay-Prambanan) obtained from the study is expected to be much less than the results of the F/S. As the reasons for this, the following are pointed out.

3 - 18
• There are many alternative routes in the area. • The arterial road running parallel with the toll road has been widened to 4-lane.
Assigned Traffic Volume Tables 3.4-7, 3.4 -8 and 3.4-9 show traffic volume of all calculation cases by vehicle group except for case 4 and cases of maximum revenue level. Figures 3.4-10 and 3.4-11 show the distribution of the assigned traffic volumes with VCR (Vehicle Capacity Ratio) - the former is for 2006 and 2010, the latter for 2020 and 2030.
05000
100001500020000250003000035000
0 1 2 3 4 5 6 7 8 9 10 1112 1314
Segment No.
Traf
fic V
olum
e (V
/Day
)
F/S
Case 1-10S
Case 1-10M
0
20000
40000
60000
80000
100000
120000
140000
0 1 2 3 4 5 6 7 8 9 10 11 12 13Segment No.
Traf
fic V
olum
e (V
/Day
)
F/S(2020)
Case 1-20S
F/S(2030)
Case 1-30S
Figure 3.4-8 Traffic Volume in 2010
Figure 3.4-9 Traffic Volume in 2020 and 2030
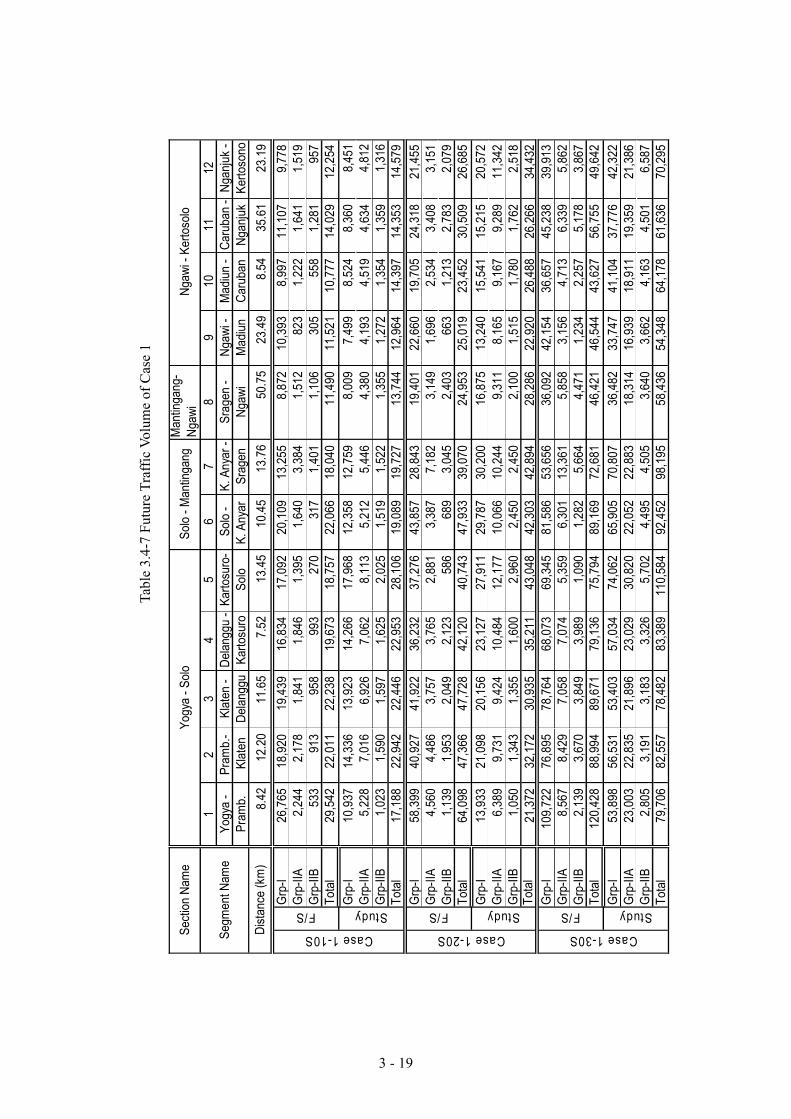
3 - 19
Tabl
e 3.
4-7
Futu
re T
raffi
c Vo
lum
e of
Cas
e 1
12
34
56
78
910
1112
Yogy
a -
Pram
b.-
Klat
en -
Delan
ggu
-Ka
rtosu
ro-
Solo
-K.
Any
ar -
Srag
en -
Ngaw
i -M
adiu
n -
Caru
ban
-Ng
anju
k -
Pram
b. K
laten
Dela
nggu
Karto
suro
Solo
K. A
nyar
Sr
agen
Ngaw
iM
adiu
nCa
ruba
nNg
anju
kKe
rtoso
no8.
4212
.20
11.6
57.
5213
.45
10.4
513
.76
50.7
523
.49
8.54
35.6
123
.19
Grp
-I26
,765
18
,920
19
,439
16,8
34
17
,092
20,1
09
13
,255
8,87
2
10
,393
8,99
7
11,1
07
9,77
8
Grp
-IIA
2,24
4
2,17
8
1,
841
1,
846
1,
395
1,
640
3,38
4
1,
512
823
1,
222
1,
641
1,51
9
Grp
-IIB
533
913
95
8
99
3
27
0
31
7
1,40
1
1,
106
305
55
8
1,
281
957
Tota
l29
,542
22
,011
22
,238
19,6
73
18
,757
22,0
66
18
,040
11,4
90
11
,521
10,7
77
14
,029
12
,254
Grp
-I10
,937
14
,336
13
,923
14,2
66
17
,968
12,3
58
12
,759
8,00
9
7,
499
8,52
4
8,36
0
8,
451
Grp
-IIA
5,22
8
7,01
6
6,
926
7,
062
8,
113
5,
212
5,44
6
4,
380
4,19
3
4,
519
4,
634
4,81
2G
rp-II
B1,
023
1,
590
1,59
7
1,62
5
2,02
5
1,51
9
1,
522
1,35
5
1,
272
1,35
4
1,35
9
1,
316
Tota
l17
,188
22
,942
22
,446
22,9
53
28
,106
19,0
89
19
,727
13,7
44
12
,964
14,3
97
14
,353
14
,579
Grp
-I58
,399
40
,927
41
,922
36,2
32
37
,276
43,8
57
28
,843
19,4
01
22
,660
19,7
05
24
,318
21
,455
Grp
-IIA
4,56
0
4,48
6
3,
757
3,
765
2,
881
3,
387
7,18
2
3,
149
1,69
6
2,
534
3,
408
3,15
1
Grp
-IIB
1,13
9
1,95
3
2,
049
2,
123
58
6
68
9
3,04
5
2,
403
663
1,
213
2,
783
2,07
9
Tota
l64
,098
47
,366
47
,728
42,1
20
40
,743
47,9
33
39
,070
24,9
53
25
,019
23,4
52
30
,509
26
,685
Grp
-I13
,933
21
,098
20
,156
23,1
27
27
,911
29,7
87
30
,200
16,8
75
13
,240
15,5
41
15
,215
20
,572
Grp
-IIA
6,38
9
9,73
1
9,
424
10
,484
12,1
77
10
,066
10,2
44
9,
311
8,16
5
9,
167
9,
289
11,3
42
G
rp-II
B1,
050
1,
343
1,35
5
1,60
0
2,96
0
2,45
0
2,
450
2,10
0
1,
515
1,78
0
1,76
2
2,
518
To
tal
21,3
72
32,1
72
30,9
35
35
,211
43,0
48
42
,303
42,8
94
28
,286
22,9
20
26
,488
26,2
66
34,4
32
G
rp-I
109,
722
76,8
95
78,7
64
68
,073
69,3
45
81
,586
53,6
56
36
,092
42,1
54
36
,657
45,2
38
39,9
13
G
rp-II
A8,
567
8,
429
7,05
8
7,07
4
5,35
9
6,30
1
13
,361
5,85
8
3,
156
4,71
3
6,33
9
5,
862
G
rp-II
B2,
139
3,
670
3,84
9
3,98
9
1,09
0
1,28
2
5,
664
4,47
1
1,
234
2,25
7
5,17
8
3,
867
To
tal
120,
428
88,9
94
89,6
71
79
,136
75,7
94
89
,169
72,6
81
46
,421
46,5
44
43
,627
56,7
55
49,6
42
G
rp-I
53,8
98
56,5
31
53,4
03
57
,034
74,0
62
65
,905
70,8
07
36
,482
33,7
47
41
,104
37,7
76
42,3
22
G
rp-II
A23
,003
22
,835
21
,896
23,0
29
30
,820
22,0
52
22
,883
18,3
14
16
,939
18,9
11
19
,359
21
,386
Grp
-IIB
2,80
5
3,19
1
3,
183
3,
326
5,
702
4,
495
4,50
5
3,
640
3,66
2
4,
163
4,
501
6,58
7
Tota
l79
,706
82
,557
78
,482
83,3
89
11
0,58
4
92
,452
98,1
95
58
,436
54,3
48
64
,178
61,6
36
70,2
95
Case 1-20S Case 1-30S
F/S Study F/S StudyNg
awi -
Ker
toso
loF/S Study
Segm
ent N
ame
Dist
ance
(km
)
Man
tinga
ng-
Ngaw
iYo
gya
- Solo
Solo
- Man
tinga
ngSe
ctio
n Na
me
Case 1-10S
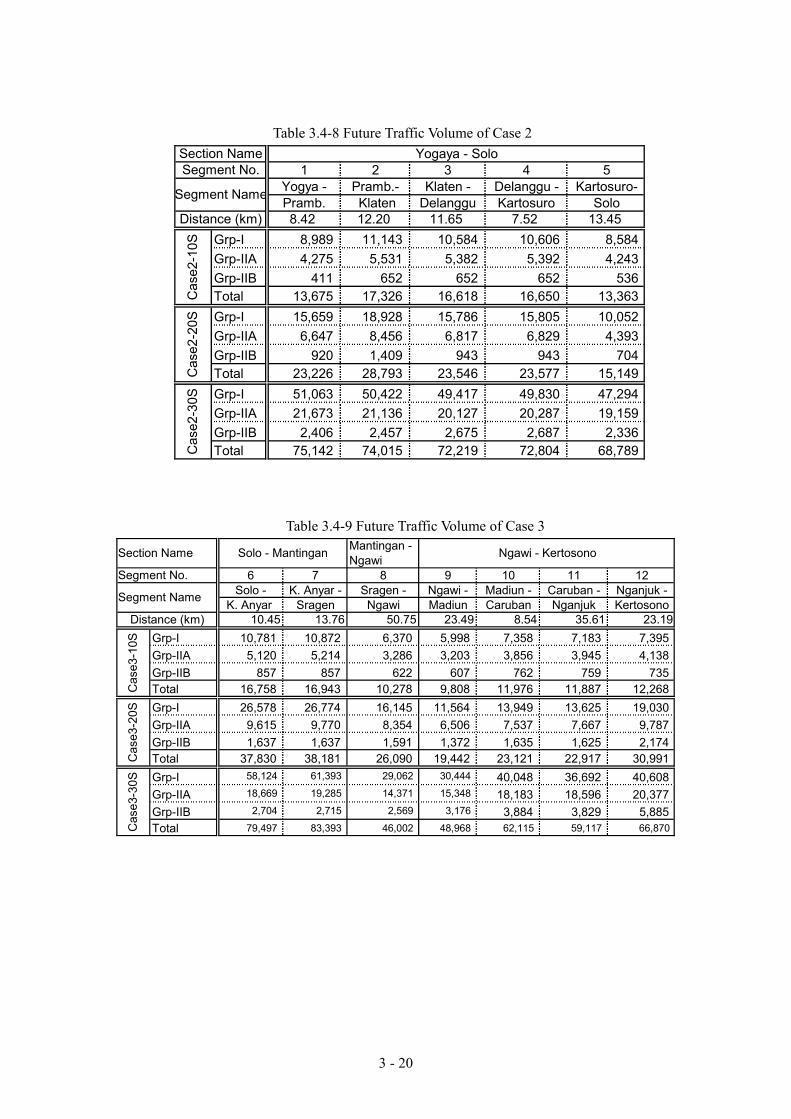
3 - 20
Table 3.4-8 Future Traffic Volume of Case 2
1 2 3 4 5Yogya - Pramb.- Klaten - Delanggu - Kartosuro-Pramb. Klaten Delanggu Kartosuro Solo8.42 12.20 11.65 7.52 13.45
Grp-I 8,989 11,143 10,584 10,606 8,584 Grp-IIA 4,275 5,531 5,382 5,392 4,243 Grp-IIB 411 652 652 652 536 Total 13,675 17,326 16,618 16,650 13,363 Grp-I 15,659 18,928 15,786 15,805 10,052 Grp-IIA 6,647 8,456 6,817 6,829 4,393 Grp-IIB 920 1,409 943 943 704 Total 23,226 28,793 23,546 23,577 15,149 Grp-I 51,063 50,422 49,417 49,830 47,294 Grp-IIA 21,673 21,136 20,127 20,287 19,159 Grp-IIB 2,406 2,457 2,675 2,687 2,336 Total 75,142 74,015 72,219 72,804 68,789
Cas
e2-1
0SC
ase2
-20S
Cas
e2-3
0S
Yogaya - SoloSection NameSegment No.
Segment Name
Distance (km)
Table 3.4-9 Future Traffic Volume of Case 3 Mantingan -Ngawi
6 7 8 9 10 11 12Solo - K. Anyar - Sragen - Ngawi - Madiun - Caruban - Nganjuk -
K. Anyar Sragen Ngawi Madiun Caruban Nganjuk Kertosono10.45 13.76 50.75 23.49 8.54 35.61 23.19
Grp-I 10,781 10,872 6,370 5,998 7,358 7,183 7,395 Grp-IIA 5,120 5,214 3,286 3,203 3,856 3,945 4,138 Grp-IIB 857 857 622 607 762 759 735 Total 16,758 16,943 10,278 9,808 11,976 11,887 12,268 Grp-I 26,578 26,774 16,145 11,564 13,949 13,625 19,030 Grp-IIA 9,615 9,770 8,354 6,506 7,537 7,667 9,787 Grp-IIB 1,637 1,637 1,591 1,372 1,635 1,625 2,174 Total 37,830 38,181 26,090 19,442 23,121 22,917 30,991 Grp-I 58,124 61,393 29,062 30,444 40,048 36,692 40,608 Grp-IIA 18,669 19,285 14,371 15,348 18,183 18,596 20,377 Grp-IIB 2,704 2,715 2,569 3,176 3,884 3,829 5,885 Total 79,497 83,393 46,002 48,968 62,115 59,117 66,870
Segment Name
Solo - Mantingan Ngawi - KertosonoSection Name
Segment No.
Cas
e3-1
0SC
ase3
-20S
Cas
e3-3
0S
Distance (km)

3 - 21
LEGEND :
Traffic Flow( Mode: + 1 + 2 + 3 )
VCR<1.00VCR<1.20VCR<1.501.50<VCR
scale: 1mm =20000(pcu)
LEGEND :
Traffic Flow( Mode: + 1 + 2 + 3 )
VCR<1.00VCR<1.20VCR<1.501.50<VCR
scale: 1mm =20000(pcu)
(b) Year 2010
Figure 3.4-10 Assigned Traffic Volumes in 2006 and 2010
(a) Year 2006

3 - 22
LEGEND :
Traffic Flow( Mode: + 1 + 2 + 3 )
VCR<1.00VCR<1.20VCR<1.501.50<VCR
scale: 1mm =30000(pcu)
LEGEND :
Traffic Flow( Mode: + 1 + 2 + 3 )
VCR<1.00VCR<1.20VCR<1.501.50<VCR
scale: 1mm =50000(pcu)
Year 2020
Year 2030
Figure 3.4-11 Assigned Traffic Volumes in 2020 and 2030

CHAPTER 4
COST ESTIMATION
AND
ECONOMIC ANALYSIS
4 - 1
CHAPTER 4
COST ESTIMATION AND ECONOMIC ANALYSIS 4.1 REVIEW OF PROJECT COST
To recognize the required investments for project implementation and to conduct both the economic and financial analysis, the project costs should be accurately estimated. The investment cost is estimated based on the engineering design of the different project components and the payment for main construction equipment required for earth works and structure works. The unit price for each item and component are based on latest data received from the local government’s Basic Prices Guidelines and from the Journal of Building Construction and Interior Material Prices. These obtained unit prices are first compared with unit prices applied in the Feasibility Study reports for each section of the toll road, then they were checked by the market prices of similar projects considering the difference between supplier, dealer and distributor. In addition, the cost for both routine and periodic maintenance works and that of toll road operation is considered in this study based on information obtained from different toll road operators, especially those applied by Jasa Marga as the biggest toll road operator in Indonesia. The other main component, beside construction, maintenance and operation costs, is land acquisition cost which plays very significant role in supporting the project construction. This cost is determined and evaluated based on various external factors including applied laws and regulation, biro crates experiences, socio community culture, agrarian aspects etc. In general, the applied unit costs in the Feasibility Study reports are reasonable when compared with collected and analyzed unit costs of other resources. In addition, quantities estimated based on the preliminary design of the Feasibility Study to be used in constructing the project are accepted for the carriageway road sections only. As for the structures along the toll road, including bridges and interchanges, information in the preliminary design are not enough to accept their estimated costs as many items and soil characteristics are not considered or underestimated. It should be noted here that the project cost is estimated in the Feasibility Study for two stages; an initial stage in which the toll road has a carriage way of two lanes for each direction, while in the final stage the carriageway is composed of three lanes in each direction.

4 - 2
4.1.1 Construction Cost
Under the Feasibility Study estimations, the quantities of major construction items are calculated based on the design data, which are presented in the preliminary engineering design drawings, including the existing road conditions. The main work items for quantity calculation, among others, are described as follows: - Clearing the working site:
This work covers clearing, demolished, banishment of bushes and burns clearance of the working site, undertaken within ROW.
- Drainage Works
This work’s quantity is generally calculated based on its types, lengths and the type of works.
- Asphalt Pavement The asphalt treated base, asphalt concrete binder course and the asphalt concrete wearing course pavement are used and calculated in ton unit weight. The quantity is computed by width of cross section and the length time’s thickness of the design pavement.
- Concrete Pavement The volumes is calculated by multiplying width of cross sections time the distance between those two cross sections, thickness 27 cm and 10 cm for lean concrete comply with the typical cross section drawing.
- Structure Works The concrete quantities are calculated based on the dimension and the structure component forms the drawings design and the pay items.
- Toll Plaza and Toll Facility At entrance and exit approach of interchange, toll plaza and toll facility are planned.
A summary of the construction cost estimated by the Feasibility Study for each of the main items is presented in Table 4.1-1 for the 4 sections of the toll road.
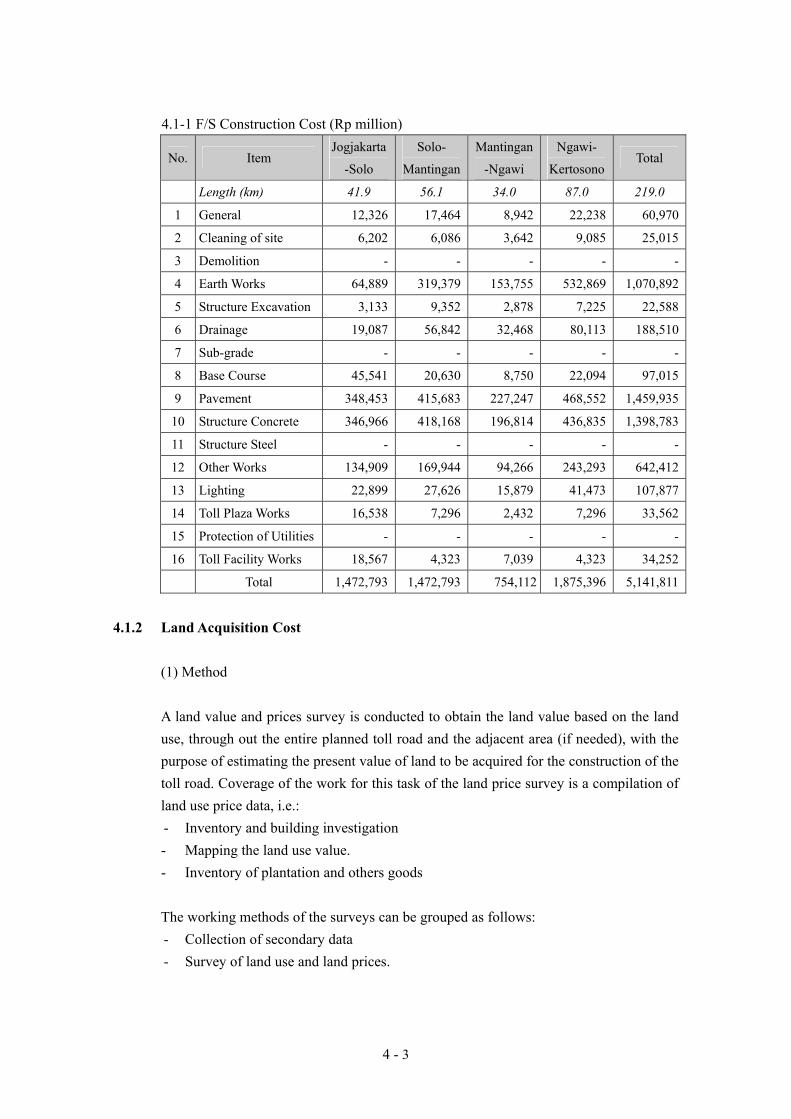
4 - 3
4.1-1 F/S Construction Cost (Rp million)
No. Item Jogjakarta
-Solo
Solo-
Mantingan
Mantingan
-Ngawi
Ngawi-
Kertosono Total
Length (km) 41.9 56.1 34.0 87.0 219.0
1 General 12,326 17,464 8,942 22,238 60,970
2 Cleaning of site 6,202 6,086 3,642 9,085 25,015
3 Demolition - - - - -
4 Earth Works 64,889 319,379 153,755 532,869 1,070,892
5 Structure Excavation 3,133 9,352 2,878 7,225 22,588
6 Drainage 19,087 56,842 32,468 80,113 188,510
7 Sub-grade - - - - -
8 Base Course 45,541 20,630 8,750 22,094 97,015
9 Pavement 348,453 415,683 227,247 468,552 1,459,935
10 Structure Concrete 346,966 418,168 196,814 436,835 1,398,783
11 Structure Steel - - - - -
12 Other Works 134,909 169,944 94,266 243,293 642,412
13 Lighting 22,899 27,626 15,879 41,473 107,877
14 Toll Plaza Works 16,538 7,296 2,432 7,296 33,562
15 Protection of Utilities - - - - -
16 Toll Facility Works 18,567 4,323 7,039 4,323 34,252
Total 1,472,793 1,472,793 754,112 1,875,396 5,141,811
4.1.2 Land Acquisition Cost
(1) Method A land value and prices survey is conducted to obtain the land value based on the land use, through out the entire planned toll road and the adjacent area (if needed), with the purpose of estimating the present value of land to be acquired for the construction of the toll road. Coverage of the work for this task of the land price survey is a compilation of land use price data, i.e.: - Inventory and building investigation - Mapping the land use value. - Inventory of plantation and others goods
The working methods of the surveys can be grouped as follows: - Collection of secondary data - Survey of land use and land prices.
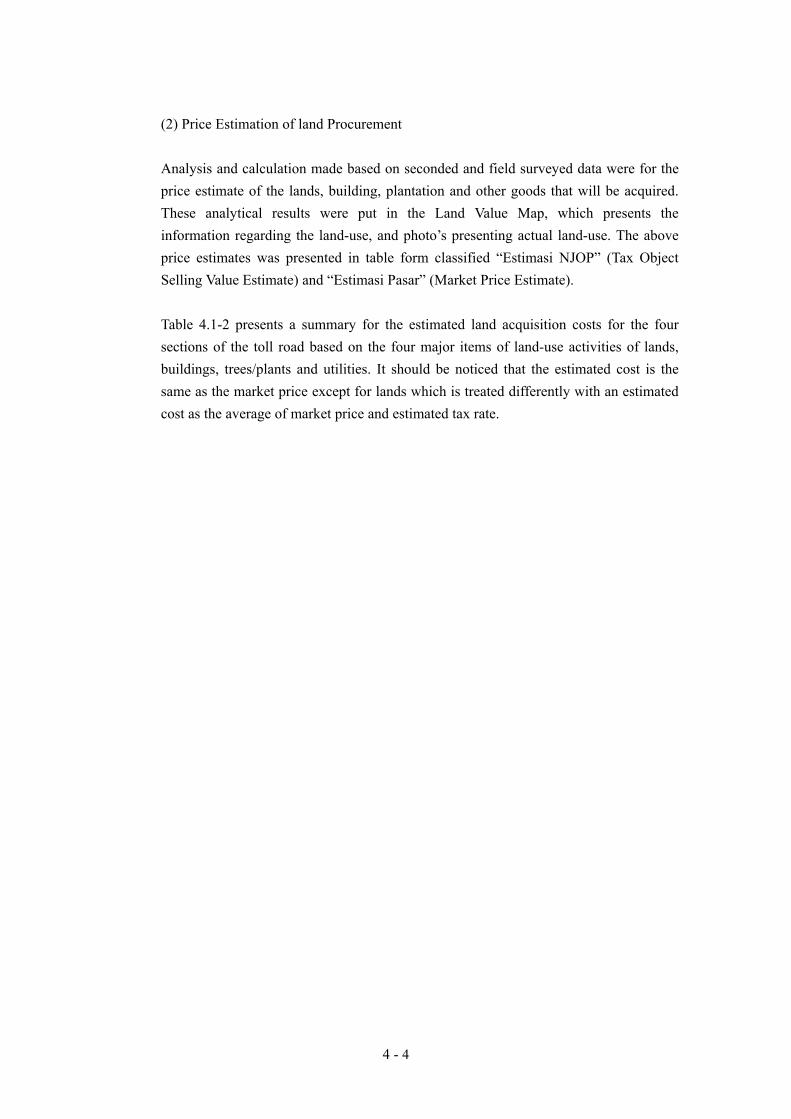
4 - 4
(2) Price Estimation of land Procurement Analysis and calculation made based on seconded and field surveyed data were for the price estimate of the lands, building, plantation and other goods that will be acquired. These analytical results were put in the Land Value Map, which presents the information regarding the land-use, and photo’s presenting actual land-use. The above price estimates was presented in table form classified “Estimasi NJOP” (Tax Object Selling Value Estimate) and “Estimasi Pasar” (Market Price Estimate). Table 4.1-2 presents a summary for the estimated land acquisition costs for the four sections of the toll road based on the four major items of land-use activities of lands, buildings, trees/plants and utilities. It should be noticed that the estimated cost is the same as the market price except for lands which is treated differently with an estimated cost as the average of market price and estimated tax rate.
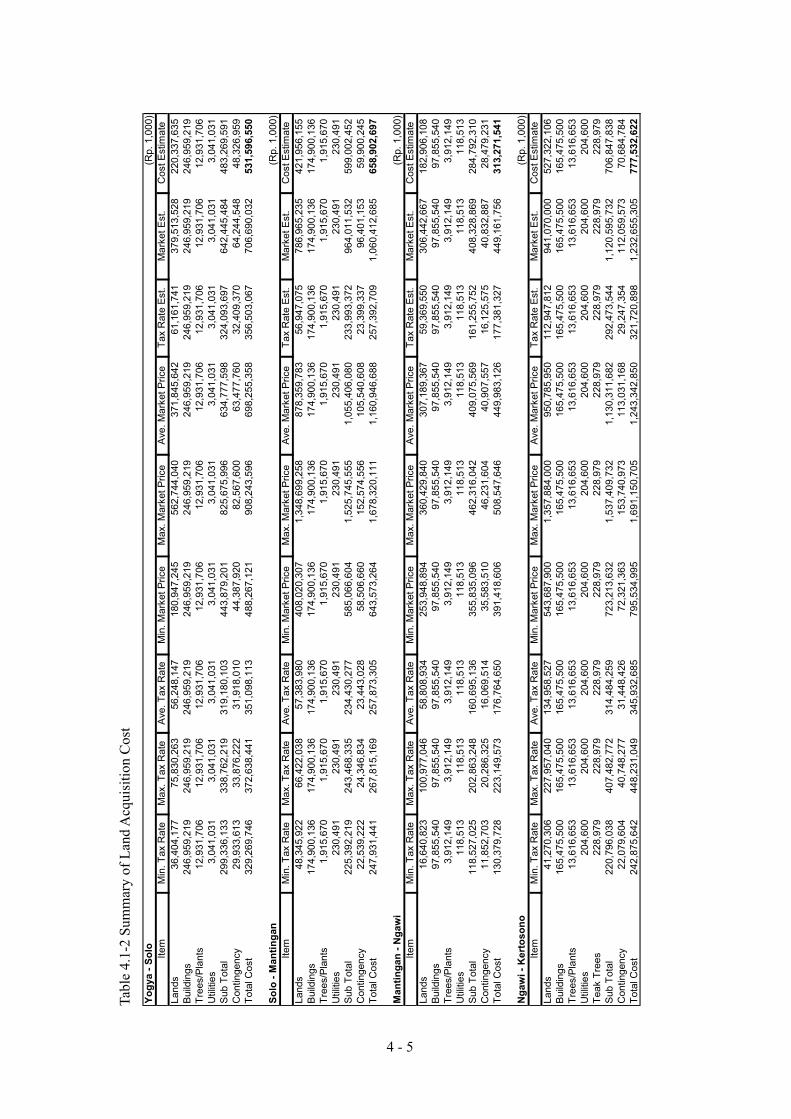
4 - 5
Tabl
e 4.
1-2
Sum
mar
y of
Lan
d A
cqui
sitio
n C
ost
Yogy
a - S
olo
(Rp.
1,0
00)
Item
Min
. Tax
Rat
eM
ax. T
ax R
ate
Ave
. Tax
Rat
eM
in. M
arke
t Pric
eM
ax. M
arke
t Pric
eA
ve. M
arke
t Pric
eTa
x R
ate
Est.
Mar
ket E
st.
Cos
t Est
imat
eLa
nds
36,4
04,1
77
75,8
30,2
63
56,2
48,1
47
180,
947,
245
56
2,74
4,04
0
371,
845,
642
61
,161
,741
37
9,51
3,52
8
220,
337,
635
Build
ings
246,
959,
219
246,
959,
219
24
6,95
9,21
9
24
6,95
9,21
9
246,
959,
219
24
6,95
9,21
9
246,
959,
219
246,
959,
219
24
6,95
9,21
9
Tr
ees/
Plan
ts12
,931
,706
12
,931
,706
12
,931
,706
12
,931
,706
12
,931
,706
12,9
31,7
06
12,9
31,7
06
12,9
31,7
06
12
,931
,706
U
tiliti
es3,
041,
031
3,
041,
031
3,04
1,03
1
3,04
1,03
1
3,
041,
031
3,04
1,03
1
3,
041,
031
3,
041,
031
3,04
1,03
1
Su
b To
tal
299,
336,
133
338,
762,
219
31
9,18
0,10
3
44
3,87
9,20
1
825,
675,
996
63
4,77
7,59
8
324,
093,
697
642,
445,
484
48
3,26
9,59
1
C
ontin
genc
y29
,933
,613
33
,876
,222
31
,918
,010
44
,387
,920
82
,567
,600
63,4
77,7
60
32,4
09,3
70
64,2
44,5
48
48
,326
,959
To
tal C
ost
329,
269,
746
372,
638,
441
35
1,09
8,11
3
48
8,26
7,12
1
908,
243,
596
69
8,25
5,35
8
356,
503,
067
706,
690,
032
53
1,59
6,55
0
Solo
- M
antin
gan
(Rp.
1,0
00)
Item
Min
. Tax
Rat
eM
ax. T
ax R
ate
Ave
. Tax
Rat
eM
in. M
arke
t Pric
eM
ax. M
arke
t Pric
eA
ve. M
arke
t Pric
eTa
x R
ate
Est.
Mar
ket E
st.
Cos
t Est
imat
eLa
nds
48,3
45,9
22
66,4
22,0
38
57,3
83,9
80
408,
020,
307
1,
348,
699,
258
878,
359,
783
56
,947
,075
78
6,96
5,23
5
421,
956,
155
Build
ings
174,
900,
136
174,
900,
136
17
4,90
0,13
6
17
4,90
0,13
6
174,
900,
136
17
4,90
0,13
6
174,
900,
136
174,
900,
136
17
4,90
0,13
6
Tr
ees/
Plan
ts1,
915,
670
1,
915,
670
1,91
5,67
0
1,91
5,67
0
1,
915,
670
1,91
5,67
0
1,
915,
670
1,
915,
670
1,91
5,67
0
U
tiliti
es23
0,49
1
23
0,49
1
230,
491
230,
491
23
0,49
1
230,
491
23
0,49
1
23
0,49
1
230,
491
Su
b To
tal
225,
392,
219
243,
468,
335
23
4,43
0,27
7
58
5,06
6,60
4
1,52
5,74
5,55
5
1,
055,
406,
080
233,
993,
372
964,
011,
532
59
9,00
2,45
2
C
ontin
genc
y22
,539
,222
24
,346
,834
23
,443
,028
58
,506
,660
15
2,57
4,55
6
105,
540,
608
23
,399
,337
96
,401
,153
59,9
00,2
45
Tota
l Cos
t24
7,93
1,44
1
26
7,81
5,16
9
257,
873,
305
643,
573,
264
1,
678,
320,
111
1,16
0,94
6,68
8
25
7,39
2,70
9
1,
060,
412,
685
658,
902,
697
Man
tinga
n - N
gaw
i(R
p. 1
,000
)Ite
mM
in. T
ax R
ate
Max
. Tax
Rat
eA
ve. T
ax R
ate
Min
. Mar
ket P
rice
Max
. Mar
ket P
rice
Ave
. Mar
ket P
rice
Tax
Rat
e Es
t.M
arke
t Est
.C
ost E
stim
ate
Land
s16
,640
,823
10
0,97
7,04
6
58,8
08,9
34
253,
948,
894
36
0,42
9,84
0
307,
189,
367
59
,369
,550
30
6,44
2,66
7
182,
906,
108
Build
ings
97,8
55,5
40
97,8
55,5
40
97,8
55,5
40
97,8
55,5
40
97,8
55,5
40
97
,855
,540
97
,855
,540
97
,855
,540
97,8
55,5
40
Tree
s/Pl
ants
3,91
2,14
9
3,91
2,14
9
3,
912,
149
3,
912,
149
3,91
2,14
9
3,
912,
149
3,91
2,14
9
3,91
2,14
9
3,
912,
149
Util
ities
118,
513
118,
513
11
8,51
3
11
8,51
3
118,
513
11
8,51
3
118,
513
118,
513
11
8,51
3
Sub
Tota
l11
8,52
7,02
5
20
2,86
3,24
8
160,
695,
136
355,
835,
096
46
2,31
6,04
2
409,
075,
569
16
1,25
5,75
2
40
8,32
8,86
9
284,
792,
310
Con
tinge
ncy
11,8
52,7
03
20,2
86,3
25
16,0
69,5
14
35,5
83,5
10
46,2
31,6
04
40
,907
,557
16
,125
,575
40
,832
,887
28,4
79,2
31
Tota
l Cos
t13
0,37
9,72
8
22
3,14
9,57
3
176,
764,
650
391,
418,
606
50
8,54
7,64
6
449,
983,
126
17
7,38
1,32
7
44
9,16
1,75
6
313,
271,
541
Nga
wi -
Ker
toso
no(R
p. 1
,000
)Ite
mM
in. T
ax R
ate
Max
. Tax
Rat
eA
ve. T
ax R
ate
Min
. Mar
ket P
rice
Max
. Mar
ket P
rice
Ave
. Mar
ket P
rice
Tax
Rat
e Es
t.M
arke
t Est
.C
ost E
stim
ate
Land
s41
,270
,306
22
7,95
7,04
0
134,
958,
527
543,
687,
900
1,
357,
884,
000
950,
785,
950
11
2,94
7,81
2
94
1,07
0,00
0
527,
322,
106
Build
ings
165,
475,
500
165,
475,
500
16
5,47
5,50
0
16
5,47
5,50
0
165,
475,
500
16
5,47
5,50
0
165,
475,
500
165,
475,
500
16
5,47
5,50
0
Tr
ees/
Plan
ts13
,616
,653
13
,616
,653
13
,616
,653
13
,616
,653
13
,616
,653
13,6
16,6
53
13,6
16,6
53
13,6
16,6
53
13
,616
,653
U
tiliti
es20
4,60
0
20
4,60
0
204,
600
204,
600
20
4,60
0
204,
600
20
4,60
0
20
4,60
0
204,
600
Te
ak T
rees
228,
979
228,
979
22
8,97
9
22
8,97
9
228,
979
22
8,97
9
228,
979
228,
979
22
8,97
9
Sub
Tota
l22
0,79
6,03
8
40
7,48
2,77
2
314,
484,
259
723,
213,
632
1,
537,
409,
732
1,13
0,31
1,68
2
29
2,47
3,54
4
1,
120,
595,
732
706,
847,
838
Con
tinge
ncy
22,0
79,6
04
40,7
48,2
77
31,4
48,4
26
72,3
21,3
63
153,
740,
973
11
3,03
1,16
8
29,2
47,3
54
112,
059,
573
70
,684
,784
To
tal C
ost
242,
875,
642
448,
231,
049
34
5,93
2,68
5
79
5,53
4,99
5
1,69
1,15
0,70
5
1,
243,
342,
850
321,
720,
898
1,23
2,65
5,30
5
77
7,53
2,62
2
4 - 5

4 - 6
4.2 REVISED PROJECT COST 4.2.1 Major Items for Cost Estimate
(1) Work Items The revised project costs under this study on the toll road are estimated basically based on reviewing F/S cost estimation. In order to support the construction of the toll road project under the formulated different options of PPP schemes, the project cost is aggregated by new groups of works coinciding options of PPP schemes and on intervals or segments between interchanges. The work groups are roughly divided into structure works such as interchanges and bridges or other works related to the road sections such as sub-base, base, pavement and the rest of works for the main road. 1) Bridge The bridge is further divided into two types; the bridge of the main toll road, mainly over river as shown in Figure 4.2-1, and flyover for crossing roads, as shown in Figure 4.2-2. Bridges are counted separately for main road and flyover for each segment. The cost is estimated in such an aggregated in term of bridge area in square-meters for every segment, and multiplied by the average unit cost of Rp 7.5 million/m2, which is the average value derived from currently constructed bridges works in the project regions in Java Island. The following Section 4.2.2 provides detailed information on the bridge issue regarding the preliminary design and cost estimate.
Figure 4.2-1 Typical Bridge over River
Figure 4.2-2 Typical Bridge over Toll Road
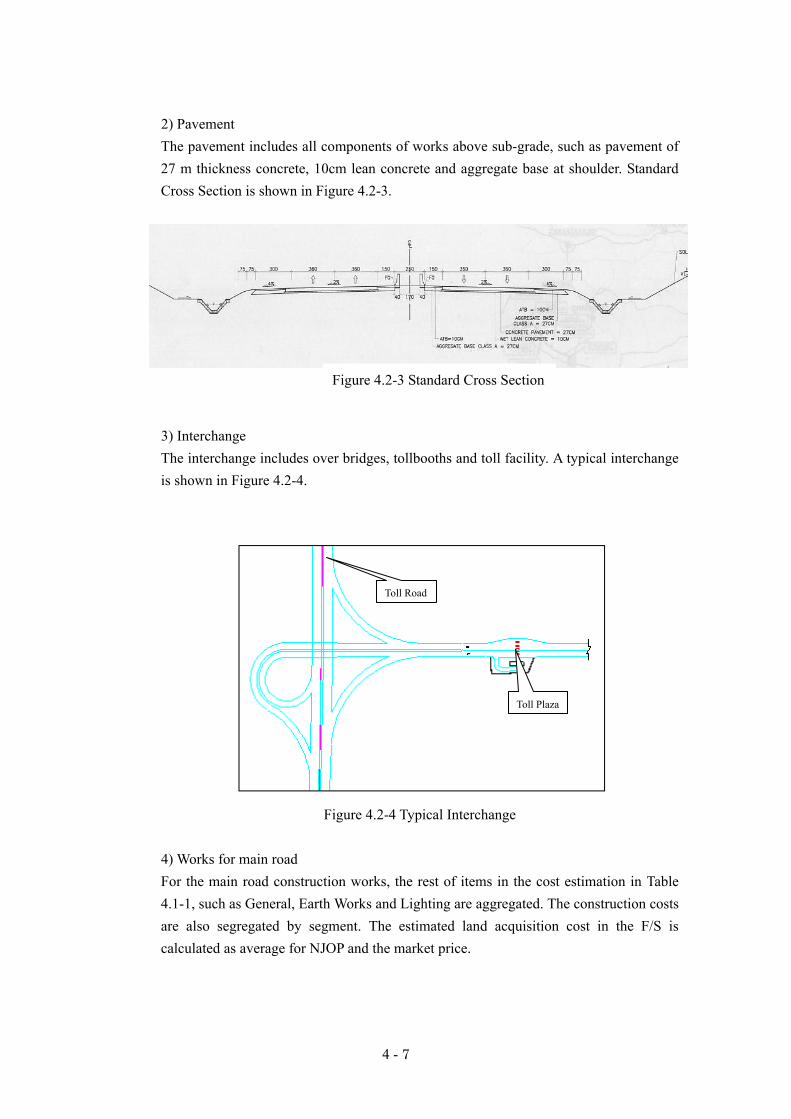
4 - 7
2) Pavement The pavement includes all components of works above sub-grade, such as pavement of 27 m thickness concrete, 10cm lean concrete and aggregate base at shoulder. Standard Cross Section is shown in Figure 4.2-3.
3) Interchange
The interchange includes over bridges, tollbooths and toll facility. A typical interchange is shown in Figure 4.2-4.
Figure 4.2-4 Typical Interchange
4) Works for main road For the main road construction works, the rest of items in the cost estimation in Table 4.1-1, such as General, Earth Works and Lighting are aggregated. The construction costs are also segregated by segment. The estimated land acquisition cost in the F/S is calculated as average for NJOP and the market price.
Figure 4.2-3 Standard Cross Section
Toll Plaza
Toll Road

4 - 8
5) Total Cost The revised cost estimation results are summarized as shown in Table 4.2-4. The estimated total cost is Rp 5,777,985 million, which is 12.4% higher than the cost of Rp 5,141,811 million that was obtained in the F/S. The reason may be attributed to duplication items in estimating construction cost. The bridge unit cost of Rp 7.5 million /m2 includes all works pertaining bridge construction, such as mobilization and traffic control during construction period, there must be some duplication in those items which are included in the works for main road. These items can not be separated for main works and bridge construction. The results are adopted as construction cost for our further study with a difference of 12.4% in the total construction cost.
4.2.2 Review of Bridge Construction Cost
In the review of bridge construction costs, as presented in Figure 4.2-5, a unit cost of Rp 7.5 million per square meter was taken based on the construction cost experiences of the same type bridges in Indonesia as bridges of this study from the following reasons. • It is very difficult for the review to identify the construction costs for bridges, since
there are no descriptions on the construction costs one by one in the report. • There are a few borehole drilling data comparing to the number of the bridges, as
shown in Table 4.2-5. Construction cost estimate without enough soil investigation data tends to be under estimation for the bridge foundation costs.
• According to the bridge list in Appendix 4-1, many of piers do not have pile foundations. Piers without piles especially in river areas tend to be easily damaged due to scouring during flood even in relatively good ground conditions.
• With the depths of bearing strata indicated in Table 4.2-5, bridge substructures usually require pile foundations.
• Bridge construction costs per square meter for bridges with PCI-Girder in Figure 4.2-5 are scattered around Rp 7.5 million /m2 level, costs of which shall be taken from the conservative side view point because of the above situations.
Details of the bridges along the toll road, with a total of 67 bridges as components of the toll road and another required 302 bridges for road crossings over the toll road, are presented in Appendix 4-1 of the Bridge List.

4 - 9
Tabl
e 4.
2-1
Sum
mar
y of
Rev
ised
Pro
ject
Cos
t (R
p m
illio
n)
Segm
ent
23
46
7
Segm
ent
Star
ting
-Jo
gyak
arta
ICJo
gyak
arta
IC -
Pran
man
an IC
Pran
man
an IC
-K
late
n IC
Kla
ten
IC -
Del
angg
u IC
Del
angg
u IC
-K
arto
suro
ICK
arto
suro
IC -
Ker
tosu
ro J
ctK
erto
suro
Jct -
Solo
ICSo
lo IC
- K
rang
Aya
r IC
Kra
ng A
yar I
C -
Sera
gen
IC
Leng
th (
km)
12.2
011.
657.
5210.
45
13.7
6
Leng
th (k
m)
3.41
5.01
12.2
011
.65
7.52
2.11
11.3
410
.45
13.7
6M
ain
road
1,16
643
,912
70,0
9374
,425
40,7
7029
,947
135,
963
110,
858
147,
435
Pave
men
t1,
838
68,5
7610
4,68
810
6,17
581
,890
30,8
2782
,445
83,1
7411
2,77
2B
ridge
29,1
3094
,290
187,
815
153,
105
79,4
1034
,020
96,9
3814
9,25
010
9,17
0 O
ver b
ridge
13,5
0850
,918
121,
755
97,3
3553
,775
7,19
364
,170
35,7
6874
,828
On
river
15,6
2343
,373
66,0
6055
,770
25,6
3526
,828
32,7
6811
3,48
334
,343
Inte
rcha
nge
7,03
915
,572
17,9
8617
,986
17,9
863,
387
015
,086
15,0
86To
tal (
000,
000R
p)39
,176
222,
354
380,
594
351,
702
220,
064
98,1
8331
5,35
735
8,37
838
4,47
6La
nd A
c qui
sitio
n43
,264
63,5
6315
4,78
514
7,80
795
,408
26,7
7013
2,36
412
1,97
616
0,61
1G
rand
Tot
al82
,439
285,
918
535,
379
499,
509
315,
472
124,
953
447,
721
480,
353
545,
088
Code
910
11
12
Segm
ent
Sera
gen
IC -
Man
tinga
nM
antin
gan
-N
gaw
i IC
Nga
wi I
C -
Mad
igan
ICM
adiu
n IC
-C
arub
an IC
Car
uban
IC -
Nga
njuk
ICN
ganj
uk IC
-K
erto
sono
Leng
th (
km)
23.4
98.5
435.6
123
.19
219
.03
Leng
th (k
m)
20.9
029
.85
23.4
98.
5435
.61
23.1
921
9.0
3M
ain
road
203,
085
271,
199
235,
306
81,4
9442
7,09
922
2,92
52,
095
,677
Pave
men
t15
7,92
221
1,27
316
3,87
265
,927
171,
942
113,
631
1,556
,951
Brid
ge20
2,06
518
7,63
520
8,80
036
,630
214,
253
151,
695
1,934
,205
Ove
r brid
ge99
,683
144,
203
126,
698
25,8
0816
0,30
578
,128
1,154
,070
On
river
102,
383
43,4
3382
,103
10,8
2353
,948
73,5
68780
,135
Inte
rcha
nge
15,0
860
20,6
8315
,086
15,0
8615
,086
191
,152
Tota
l (00
0,00
0Rp)
578,
179
670,
137
628,
685
199,
145
828,
414
503,
360
5,777
,985
Land
Acq
uisi
tion
243,
952
277,
813
211,
322
76,3
1531
8,21
620
7,14
02,
281
,304
Gra
nd T
otal
822,
130
947,
950
973,
791
275,
460
1,14
6,63
071
0,49
98,
059
,289
15
Jogj
akar
ta -
Solo
8.4
2
Solo
- S
era
gen
13.
45
Sera
gen -
Nga
wi
8
50.7
5
Nga
wi - K
ert
oso
no
Tota
l
4 - 9
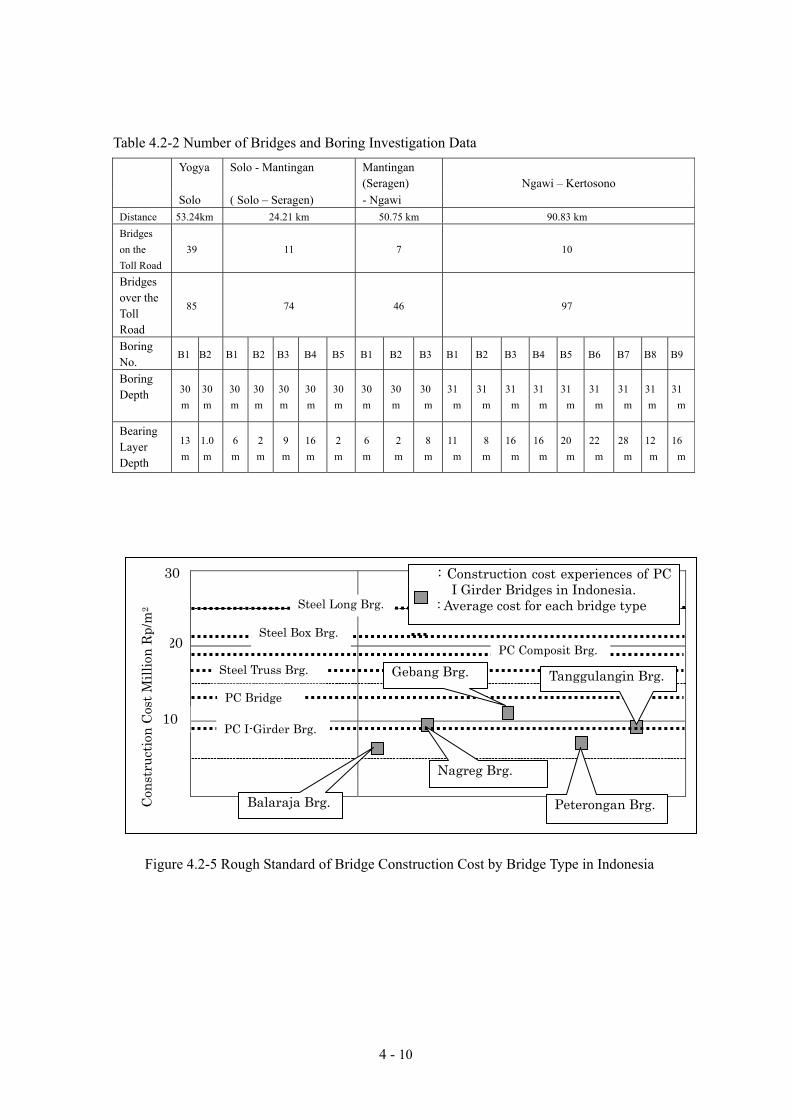
4 - 10
Table 4.2-2 Number of Bridges and Boring Investigation Data
Yogya Solo - Mantingan Mantingan (Seragen)
Solo ( Solo – Seragen) - Ngawi Ngawi – Kertosono
Distance 53.24km 24.21 km 50.75 km 90.83 km Bridges on the Toll Road
39 11 7 10
Bridges over the Toll Road
85 74 46 97
Boring No.
B1 B2 B1 B2 B3 B4 B5 B1 B2 B3 B1 B2 B3 B4 B5 B6 B7 B8 B9
Boring Depth 30
m 30 m
30m
30 m
30 m
30 m
30 m
30 m
30 m
30 m
31 m
31 m
31 m
31 m
31 m
31 m
31 m
31 m
31 m
Bearing Layer Depth
13 m
1.0 m
6m
2 m
9 m
16 m
2 m
6 m
2 m
8 m
11 m
8 m
16 m
16 m
20 m
22 m
28 m
12 m
16 m
20
Figure 4.2-5 Rough Standard of Bridge Construction Cost by Bridge Type in Indonesia
Cons
truc
tion
Cost
Mill
ion
Rp/m
2
30
10
Balaraja Brg.
Nagreg Brg.
Gebang Brg.
Peterongan Brg.
Tanggulangin Brg.
PC I-Girder Brg.
PC Bridge
Steel Truss Brg. PC Composit Brg.
Steel Box Brg.
Steel Long Brg.
: Construction cost experiences of PC I Girder Bridges in Indonesia.
: Average cost for each bridge type

4 - 11
4.3 ECONOMIC ANALYSIS 4.3.1 Review of F/S Economic Analysis
The Feasibility Study estimated the economic parameters of Benefit/Cost ratio (B/C), Economic Internal Rate of Return % (EIRR) and Net Present Value (NPV) based on the costs estimated as presented in Section 4.1 of this Chapter and the benefits expected to be gained by the implementation of the toll road project, as presented in the following sections. (1) Cost 1) Construction Cost Construction cost summarized in the previous section and land acquisition cast were included in the toll road construction cost. 2) Engineering cost for design and construction supervision is not included 3) Operation and Maintenance Cost Operation and maintenance cost covering the operation and the runtime and the periodic maintenance works.
- The runtime maintenance cost was used for clearing the area, cutting plantation, and overlay and for the similar types works. The cost amount was estimated 5% from the construction cost.
- Operation and periodic maintenance cost such as structure rehabilitation works (overlay), and the similar types, and its implementation once in ten (10) years, 10% of construction cost.
- Road upgrading cost was a cost for toll roads widening works to final stage.
(2) Benefit 1) Reduction of Vehicle Operation Cost Economic benefit, which can be derived by toll roads construction, is increasing efficiency of vehicle operation cost. VOC on the arterial roads for different vehicle categories are follows:
- Passenger car (Group I): Rp 1,294/km with a speed of 30 km/hour - Class IIA vehicle: Rp 5,678/km with a speed of 25 km/hour - Class IIB vehicle: Rp 4,189/km with a speed of 25 km/hour
Whiles the VOC on the toll roads are as follows:
- Passenger car (Group I) : Rp 1,000/km with a speed of 80 km/hour - Class IIA vehicle: Rp 5,348/km with a speed of 65 km/hour

4 - 12
- Class IIB vehicle: Rp 3,675/km with a speed of 60 km/hour 2) Travel Time Cost Saving By using toll road, travel time can be saved. The saved travel times were converted to monetary value using time evaluation. This is Travel Time Cost (TTC) saving merit. The time evaluation is estimated as follows:
- Passenger car (Group I): time value is Rp 21,002/hour - Class IIA vehicle: time value is Rp 98,097/hour - Class IIB vehicle: time value is Rp 19,604/hour
The adopted time values are those of “Heavy Loaded Road Improvement Project Master Plan Review Study” by Bina Marga in 2001, for Bus and Passenger Car and JARNS (Java Arterial Road Network Study) in 2001 for trucks. The values are adjusted to 2005 price based on the latest five (5) years average inflation rate, 8% per annum.
3) The assumption The assumption used for the evaluation is as follows:
- Basic Year Operation: 2009 - Observation time period: 35 years - Price level: 2005 - Alternatives of Discount Rate : 12.75%, 15%, and 20%
(3) Result of Economic Analysis The three economic parameters of B/C Ratio, NPV and EIRR are summarized in Table 4.3-1.
Table 4.3-1 Economic Parameters of Economic Analysis
discountrate Yogya - Solo Solo -
MantinganMantingan-Ngawi
Ngawi -Kertosono
B/C Ratio12.75% 2.04 2.45 2.21 2.6015.00% 1.87 2.03 1.83 2.1520.00% 1.53 1.43 1.29 1.52
NVP12.75% 3,822,547 3,638,136 1,452,214 4,767,38015.00% 2,712,618 1,200,091 931,964 3,210,85620.00% 1,279,644 896,761 293,031 1,289,254
IRR 32.98% 26.74% 24.69% 27.62%

4 - 13
(4) Examination of the Analysis The above analysis is examined by checking O&M cost, VOC benefit and TTC benefit for the years of 2010, 2025 and 2040. The result is shown in Table 4.3-2. Table 4.3-2 Main Items Applied in Economic Analysis
Item
2010 402 v-km 339 v-km 144 v-km 355 v-km2025 1,213 v-km 1,019 v-km 435 v-km 1,071 v-km2040 2,778 v-km 2,335 v-km 995 v-km 2,090 v-km
/v-km /v-km /v-km /v-km2010 97,498 243 73,640 217 37,706 262 93,137 2622025 415,582 343 103,618 102 53,056 122 131,053 1222040 1,318,296 475 138,858 59 71,100 71 175,624 84
Benefit VOC (Rp million) /v-km /v-km /v-km /v-km2010 381,196 948 231,696 683 118,327 822 350,599 9882025 1,126,069 928 694,468 682 356,448 819 1,055,374 9852040 2,198,864 792 1,590,474 681 816,348 820 2,417,009 1,156
Benefit TTC Rp million) /v-km /v-km /v-km /v-km2010 230,735 574 261,889 773 94,173 654 270,155 7612025 685,935 565 779,520 765 279,896 643 803,729 7502040 1,339,408 482 1,785,315 765 641,040 644 1,840,723 881
O&M (Rp million)
Traffic Volume (million)
Ngawi - KertosonoMantingan- NgawiSolo - MantinganYogya - Solo
These three components are considered to be interrelated to traffic volume in terms of vehicle-kilometer. For O&M cost the coefficients are decreasing for future years, except Yogya – Solo section.Therefore, for this section O&M cost is inflated using 8% per annum. Including the section the average cost for O&M is Rp 196.8 /v-km. This is considered as a unit cost for O&M, proportional to traffic volume (v-km). VOC benefit figures are not so fluctuated, as they must be related closely to traffic volume (v-km), but it varies by section. Solo – Mantingan section is the lowest with 682 and Ngawi – Kertosono section is highest of 988. As for TTC benefit, the figures are also not fluctuated. But, the tendency is rather different. The lowest figure is that of Yogya – Solo section and it suddenly reduced to 482. The highest is for Solo – Mantingan section followed by Ngawi – Kertosono section. For the latter section it raised up to 881 in 2040. The examination shows those figures are favorable for Ngawi – Kertosono section and adverse for Yogya – Solo section. If the figures were same as the other sections the economic indices will become higher for this section.

4 - 14
In addition, the engineering cost for the detailed design of the project and construction supervision is not considered in the economic analysis, which can be estimated as about 4% for detailed design and 4% for construction supervision.
4.3.2 Revised Economic Analysis (1) Case set up
Three cases are set up for economic analysis in order to compare economic viability of the section of toll road under operation. It is assumed that The Trans Java Toll Road outside of the Study Area will be operated by traffic by the year when the study Toll Road will be open. The sections of Semarang – Solo and Kertosono – Surabaya will be connected to the Study Toll Road to complete the Trans Java Toll Road. A section of toll road in the Study area between Yogya and Solo is branched outside of Trans Java Toll Road. Therefore, in addition to the case of constructed the whole of the Study Road between Yogyakarta and Kertosono, the two sections of the Study Road Yogyakarta – Solo and Solo – Kertosono sections are considered independently, as presented in Table 4.3-3.
Table 4.3-3 Case Set Up
Case Yogyakarta – Solo Solo – Kertosono 1 Open Open 2 Open - 3 - Open
(2) Cost
1) Construction cost The construction cost summarized in Table 4.2-4 is used, but land acquisition cost is not included. 2) Operation and maintenance cost Routine maintenance works such as cleaning of roadway; bush cutting and toll road operation cost are considered to be proportional to traffic volume (vehicle-km). A coefficient of 196.8 derived from F/S is used. For major maintenance and repair works, 5% of construction cost for every 5 year is included. 3) Engineering Cost The engineering cost for the detailed design of the project and construction supervision is considered as about 4% for detailed design and 4% for construction supervision.
4 - 15
(3) Benefit Traffic flow diverted to toll expressway can enjoy benefit by improved traffic flow. The remaining traffic on ordinary roads can also enjoy merit by improved traffic flow due to reduction of traffic volume attained by diversion to toll expressway. To simulate such a situation traffic assignment procedure is employed. Traffic volume along the study road is obtained by traffic assignment procedure using OD tables, road network. Changes of traffic condition through out study area is compared by “with and without” the project road basis. Quantitative amount of vehicle-km (v-km) and vehicle-hour (v-hr) are accumulated during assignment process. 1) VOC reduction To obtain VOC reduction merit, unit VOC cost as used in F/S is applied to average speed calculated v-km divided by v-hr for toll road and non toll road for 3 vehicle categories, with and without cases.
2) TTC savings Total accumulated amount of veh-hr for without case subtracted by with each case is a total save travel time within study area. This amount of saved time multiplied by time evaluation of each vehicle categories is monetary conversion of saved time. This is a procedure to get the savings in TTC.
4.3.3 Revised Economic Parameters
(1) Presumptions for Economic Analysis The applied values of veh-km and veh-hr as well traffic parameters for each of the three cases are estimated through the traffic assignments applying JICA STRADA programs. The following presumptions are applied for the economic analysis: - Implementation Schedule Year 2007: Land acquisition and detailed engineering design Year 2008: Construction of 40% of the project Year 2009: Construction of 60% of the project Year 2010: Operation - Evaluation Period This period is considered as 30 years of operation from the year 2010 to 2039.
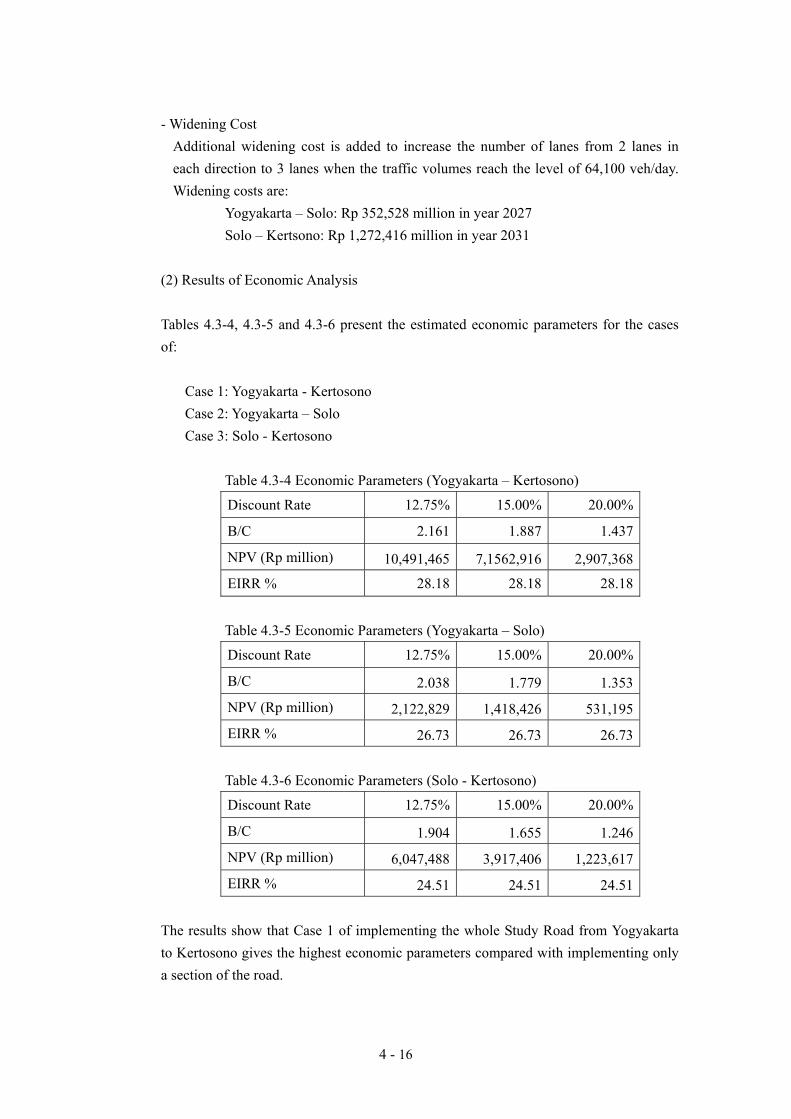
4 - 16
- Widening Cost Additional widening cost is added to increase the number of lanes from 2 lanes in each direction to 3 lanes when the traffic volumes reach the level of 64,100 veh/day. Widening costs are: Yogyakarta – Solo: Rp 352,528 million in year 2027 Solo – Kertsono: Rp 1,272,416 million in year 2031
(2) Results of Economic Analysis Tables 4.3-4, 4.3-5 and 4.3-6 present the estimated economic parameters for the cases of:
Case 1: Yogyakarta - Kertosono Case 2: Yogyakarta – Solo Case 3: Solo - Kertosono
Table 4.3-4 Economic Parameters (Yogyakarta – Kertosono)
Discount Rate 12.75% 15.00% 20.00%
B/C 2.161 1.887 1.437
NPV (Rp million) 10,491,465 7,1562,916 2,907,368
EIRR % 28.18 28.18 28.18
Table 4.3-5 Economic Parameters (Yogyakarta – Solo)
Discount Rate 12.75% 15.00% 20.00%
B/C 2.038 1.779 1.353
NPV (Rp million) 2,122,829 1,418,426 531,195
EIRR % 26.73 26.73 26.73 Table 4.3-6 Economic Parameters (Solo - Kertosono)
Discount Rate 12.75% 15.00% 20.00%
B/C 1.904 1.655 1.246
NPV (Rp million) 6,047,488 3,917,406 1,223,617
EIRR % 24.51 24.51 24.51 The results show that Case 1 of implementing the whole Study Road from Yogyakarta to Kertosono gives the highest economic parameters compared with implementing only a section of the road.

4 - 17
(3) Sensitivity Analysis A sensitivity analysis is carried out on the three cases of project implementation to take into account the uncertainty of assumptions and to determine the potential of each project road for unexpected increase in construction costs or decrease in benefits. The cases considered in this sensitivity analysis are those of unexpected increase or decrease in the project costs or benefits by 10% and 20% under the three applied discount rates of 12.75%, 15% and 20%. Results of the sensitivity analysis are presented in Tables 4.3-7, 4.3-8 and 4.3-9 for the different three cases of project implementation of:
1. Yogyakarta – Kertosono 2. Yogyakarta – Solo 3. Solo - Kertosono
The results show that the Project is economically feasible and give the indication that, from the economic point of view, the whole road should be implemented from Yogyakarta to Kertosono, which is the case that gives higher economic parameters.

4 - 1
8
Tabl
e 4.
3-7
Rev
ised
Sen
sitiv
ity A
naly
sis R
esul
t (Yo
gyak
arta
- K
erto
sono
) M
ap o
f Sen
sibi
lity
Ana
lysi
sR
esul
ts o
f Ana
lysi
sdi
scou
nt ra
te12
.75%
disc
ount
rate
15.0
0%di
scou
nt ra
te20
.00%
disc
ount
rate
12.7
5%di
scou
nt ra
te15
.00%
disc
ount
rate
20.0
0%di
scou
nt ra
te12
.75%
disc
ount
rate
15.0
0%di
scou
nt ra
te20
.00%
cost
-1
0%co
st
0co
st
+10%
B/C
2.38
62.
082
1.58
42.
377
2.07
61.
580
2.53
22.
222
1.70
5N
PV12
,477
,957
8,69
9,23
03,
877,
386
12,4
44,3
218,
674,
419
3,86
3,75
012
,997
,886
9,20
3,99
84,
351,
198
bene
fit+1
0%be
nefit
+10%
bene
fit+1
0%EI
RR
30.7
5%30
.75%
30.7
5%30
.73%
30.7
3%30
.73%
33.2
4%33
.24%
33.2
4%co
st
-10%
cost
0
cost
+1
0%B
/C2.
302
2.02
01.
550
2.16
11.
887
1.43
72.
272
1.99
51.
532
NPV
11,0
45,0
307,
682,
495
3,39
4,81
710
,491
,465
7,15
2,91
62,
907,
368
10,9
31,5
327,
586,
647
3,32
1,31
9be
nefit
0be
nefit
0be
nefit
0EI
RR
30.4
7%30
.47%
30.4
7%28
.18%
28.1
8%28
.18%
30.1
4%30
.14%
30.1
4%co
st
-10%
cost
0
cost
+1
0%B
/C2.
072
1.81
81.
395
1.94
51.
699
1.29
32.
044
1.79
51.
379
NPV
9,09
2,17
56,
160,
993
2,43
8,43
58,
538,
609
5,63
1,41
31,
950,
986
8,97
8,67
66,
065,
144
2,36
4,93
7be
nefit
-10%
bene
fit-1
0%be
nefit
-10%
EIR
R27
.64%
27.6
4%27
.64%
25.5
8%25
.58%
25.5
8%27
.33%
27.3
3%27
.33%
disc
ount
rate
12.7
5%di
scou
nt ra
te15
.00%
disc
ount
rate
20.0
0%di
scou
nt ra
te12
.75%
disc
ount
rate
15.0
0%di
scou
nt ra
te20
.00%
disc
ount
rate
12.7
5%di
scou
nt ra
te15
.00%
disc
ount
rate
20.0
0%co
st
-20%
cost
0
cost
+2
0%B
/C2.
955
2.60
72.
020
2.59
32.
265
1.72
42.
310
2.00
21.
504
NPV
15,5
04,3
0711
,255
,081
5,79
5,02
914
,397
,176
10,1
95,9
224,
820,
131
13,2
90,0
459,
136,
762
3,84
5,23
4be
nefit
+20%
bene
fit+2
0%be
nefit
+20%
EIR
R39
.28%
0.00
%0.
00%
33.2
2%33
.22%
33.2
2%29
.00%
29.0
0%29
.00%
cost
-2
0%co
st
0co
st
+20%
B/C
2.46
32.
173
1.68
32.
161
1.88
71.
437
1.92
51.
668
1.25
3N
PV11
,598
,596
8,21
2,07
53,
882,
265
10,4
91,4
657,
152,
916
2,90
7,36
89,
384,
334
6,09
3,75
71,
932,
470
bene
fit0
bene
fit0
bene
fit0
EIR
R34
.76%
00
28.1
8%28
.18%
28.1
8%24
.64%
24.6
4%24
.64%
cost
-2
0%co
st
0co
st
+20%
B/C
1.97
01.
738
1.34
71.
729
1.51
01.
149
1.54
01.
334
1.00
3N
PV7,
692,
885
5,16
9,06
91,
969,
502
6,58
5,75
34,
109,
910
994,
605
5,47
8,62
23,
050,
751
19,7
07be
nefit
-20%
bene
fit-2
0%be
nefit
-20%
EIR
R26
.95%
26.9
5%26
.95%
22.9
0%22
.90%
22.9
0%20
.05%
20.0
5%20
.05%
4 - 18

4 - 1
9
Tabl
e 4.
3-8
Rev
ised
Sen
sitiv
ity A
naly
sis R
esul
t (Yo
gyak
arta
- So
lo)
Map
of S
ensi
bilit
y A
naly
sis
Res
ults
of A
naly
sis
disc
ount
rate
12.7
5%di
scou
nt ra
te15
.00%
disc
ount
rate
20.0
0%di
scou
nt ra
te12
.75%
disc
ount
rate
15.0
0%di
scou
nt ra
te20
.00%
disc
ount
rate
12.7
5%di
scou
nt ra
te15
.00%
disc
ount
rate
20.0
0%co
st
-10%
cost
0
cost
+1
0%B
/C2.
388
2.09
41.
607
2.24
11.
956
1.48
92.
388
2.09
41.
607
NPV
2,66
5,14
11,
862,
514
845,
197
2,53
9,69
11,
742,
453
734,
612
2,66
5,14
11,
862,
514
845,
197
bene
fit+1
0%be
nefit
+10%
bene
fit+1
0%EI
RR
31.6
2%31
.62%
31.6
2%29
.19%
29.1
9%29
.19%
31.6
2%31
.62%
31.6
2%co
st
-10%
cost
0
cost
+1
0%B
/C2.
171
1.90
41.
461
2.03
81.
779
1.35
32.
143
1.88
01.
444
NPV
2,24
8,27
91,
538,
487
641,
780
2,12
2,82
91,
418,
426
531,
195
2,22
3,00
61,
517,
108
625,
294
bene
fit0
bene
fit0
bene
fit0
EIR
R28
.92%
28.9
2%28
.92%
26.7
3%26
.73%
26.7
3%28
.61%
28.6
1%28
.61%
cost
-1
0%co
st
0co
st
+10%
B/C
1.95
41.
714
1.31
51.
834
1.60
11.
218
1.92
81.
692
1.29
9N
PV1,
831,
417
1,21
4,46
143
8,36
31,
705,
967
1,09
4,39
932
7,77
81,
806,
144
1,19
3,08
142
1,87
7be
nefit
-10%
bene
fit-1
0%be
nefit
-10%
EIR
R26
.18%
26.1
8%26
.18%
24.2
1%24
.21%
24.2
1%25
.89%
25.8
9%25
.89%
disc
ount
rate
12.7
5%di
scou
nt ra
te15
.00%
disc
ount
rate
20.0
0%di
scou
nt ra
te12
.75%
disc
ount
rate
15.0
0%di
scou
nt ra
te20
.00%
disc
ount
rate
12.7
5%di
scou
nt ra
te15
.00%
disc
ount
rate
20.0
0%co
st
-20%
cost
0
cost
+2
0%B
/C2.
787
2.45
81.
904
2.44
52.
134
1.62
42.
178
1.88
61.
416
NPV
3,20
7,45
42,
306,
602
1,15
9,19
92,
956,
553
2,06
6,48
093
8,02
92,
705,
651
1,82
6,35
771
6,85
9be
nefit
+20%
bene
fit+2
0%be
nefit
+20%
EIR
R37
.50%
37.5
0%37
.50%
31.6
2%31
.62%
31.6
2%27
.55%
27.5
5%27
.55%
cost
-2
0%co
st
0co
st
+20%
B/C
2.32
22.
049
1.58
72.
038
1.77
91.
353
1.81
51.
571
1.18
0N
PV2,
373,
730
1,65
8,54
975
2,36
52,
122,
829
1,41
8,42
653
1,19
51,
871,
927
1,17
8,30
431
0,02
5be
nefit
0be
nefit
0be
nefit
0EI
RR
33.0
4%33
.04%
33.0
4%26
.73%
26.7
3%26
.73%
23.3
4%23
.34%
23.3
4%co
st
-20%
cost
0
cost
+2
0%B
/C1.
858
1.63
91.
270
1.63
01.
423
1.08
31.
452
1.25
70.
944
NPV
1,54
0,00
61,
010,
495
345,
531
1,28
9,10
577
0,37
312
4,36
11,
038,
203
530,
250
-96,
809
bene
fit-2
0%be
nefit
-20%
bene
fit-2
0%EI
RR
25.4
9%25
.49%
25.4
9%21
.62%
21.6
2%21
.62%
18.9
2%18
.92%
18.9
2%
4 - 19

4 - 2
0
Tabl
e 4.
3-9
Rev
ised
Sen
sitiv
ity A
naly
sis R
esul
t (So
lo -
Ker
toso
no)
Map
of S
ensi
bilit
y A
naly
sis
Res
ults
of A
naly
sis
disc
ount
rate
12.7
5%di
scou
nt ra
te15
.00%
disc
ount
rate
20.0
0%di
scou
nt ra
te12
.75%
disc
ount
rate
15.0
0%di
scou
nt ra
te20
.00%
disc
ount
rate
12.7
5%di
scou
nt ra
te15
.00%
disc
ount
rate
20.0
0%co
st
-10%
cost
0
cost
+1
0%B
/C2.
238
1.95
41.
483
2.09
51.
820
1.37
12.
238
1.95
41.
483
NPV
7,74
7,97
75,
316,
208
2,21
9,60
17,
320,
962
4,90
7,53
81,
843,
187
7,74
7,97
75,
316,
208
2,21
9,60
1be
nefit
+10%
bene
fit+1
0%be
nefit
+10%
EIR
R28
.82%
28.8
2%28
.82%
26.6
9%26
.69%
26.6
9%28
.82%
28.8
2%28
.82%
cost
-1
0%co
st
0co
st
+10%
B/C
2.03
41.
776
1.34
81.
904
1.65
51.
246
2.00
71.
753
1.33
2N
PV6,
474,
504
4,32
6,07
61,
600,
032
6,04
7,48
83,
917,
406
1,22
3,61
76,
388,
478
4,25
3,30
31,
543,
918
bene
fit0
bene
fit0
bene
fit0
EIR
R26
.46%
26.4
6%26
.46%
24.5
1%24
.51%
24.5
1%26
.17%
26.1
7%26
.17%
cost
-1
0%co
st
0co
st
+10%
B/C
1.83
11.
598
1.21
31.
714
1.48
91.
121
1.80
61.
578
1.19
9N
PV5,
201,
030
3,33
5,94
498
0,46
24,
774,
015
2,92
7,27
460
4,04
85,
115,
004
3,26
3,17
192
4,34
9be
nefit
-10%
bene
fit-1
0%be
nefit
-10%
EIR
R24
.03%
24.0
3%24
.03%
22.2
7%22
.27%
22.2
7%23
.76%
23.7
6%23
.76%
disc
ount
rate
12.7
5%di
scou
nt ra
te15
.00%
disc
ount
rate
20.0
0%di
scou
nt ra
te12
.75%
disc
ount
rate
15.0
0%di
scou
nt ra
te20
.00%
disc
ount
rate
12.7
5%di
scou
nt ra
te15
.00%
disc
ount
rate
20.0
0%co
st
-20%
cost
0
cost
+2
0%B
/C2.
620
2.30
01.
762
2.28
51.
986
1.49
52.
026
1.74
71.
299
NPV
9,44
8,46
66,
715,
011
3,21
5,58
68,
594,
436
5,89
7,67
02,
462,
756
7,74
0,40
55,
080,
329
1,70
9,92
7be
nefit
+20%
bene
fit+2
0%be
nefit
+20%
EIR
R33
.95%
33.9
5%33
.95%
28.8
2%28
.82%
28.8
2%25
.24%
25.2
4%25
.24%
cost
-2
0%co
st
0co
st
+20%
B/C
2.18
31.
916
1.46
81.
904
1.65
51.
246
1.68
91.
456
1.08
2N
PV6,
901,
519
4,73
4,74
71,
976,
447
6,04
7,48
83,
917,
406
1,22
3,61
75,
193,
458
3,10
0,06
547
0,78
8be
nefit
0be
nefit
0be
nefit
0EI
RR
30.0
2%30
.02%
30.0
2%24
.51%
24.5
1%24
.51%
21.4
9%0
0co
st
-20%
cost
0
cost
+2
0%B
/C1.
747
1.53
31.
175
1.52
31.
324
0.99
71.
351
1.16
50.
866
NPV
4,35
4,57
22,
754,
483
737,
308
3,50
0,54
11,
937,
142
-15,
522
2,64
6,51
11,
119,
801
-768
,351
bene
fit-2
0%be
nefit
-20%
bene
fit-2
0%EI
RR
23.4
2%23
.42%
23.4
2%19
.94%
19.9
4%19
.94%
17.4
7%17
.47%
17.4
7%
4 - 20