final report macc-ii - ecmwf · nasa/jpl (collaboration): christian frankenberg . kit...
TRANSCRIPT

Grant agreement n°283576
October 2014
Final Report
MACC-II Monitoring Atmospheric Composition and Climate - Interim Implementation

MACC-II Final Report – October 2014
2 / 137
Date October 2014
Status Final version
Authors See p.4
Use and reproduction of this report or parts of it may be restricted. Appropriate non-commercial use will normally be granted under the condition that reference is made to MACC-II. Please enquire with: [email protected]
This document has been produced in the context of the MACC-II project (Monitoring Atmospheric Composition and Climate - Interim Implementation). The research leading to these results has received funding from the European Community's Seventh Framework Programme (FP7 THEME [SPA.2011.1.5-02]) under grant agreement n° 283576. All information in this document is provided "as is" and no guarantee or warranty is given that the information is fit for any particular purpose. The user thereof uses the information at its sole risk and liability. For the avoidance of all doubts, the European Commission has no liability in respect of this document, which is merely representing the authors view.

MACC-II Final Report – October 2014
3 / 137
Executive Summary / Abstract MACC-II (Monitoring Atmospheric Composition and Climate - Interim Implementation) was an interim stage in the development of the Copernicus Atmosphere Monitoring Service (CAMS). The project started on November 1st 2011 at finished the end of July 2014, with a duration of 33 months. Its overall institutional objective was to function as the bridge between the developmental precursor projects -GEMS, PROMOTE and MACC- and the Atmosphere Service envisaged to form part of CAMS Operations for 2015-2020, the period covered by the current European Union’s Multi-annual Financial Framework.
MACC-II provided continuity and refinement of the atmospheric services provided by MACC. Its continued provision of coherent atmospheric data and information, either directly or via value-adding downstream services, was for the benefit of European citizens and helped meet global needs as a key European contribution to the Global Climate Observing System (GCOS) and the encompassing Global Earth Observation System of Systems (GEOSS). MACC-II services covered:
• air quality and atmospheric composition; • climate forcings; • ozone layer and UV radiation; • solar radiation and solar energy resources; • emissions and surface fluxes.
The website of MACC-II (http://copernicus-atmosphere.eu) gives access to the searchable catalogue of products, which has over 200 entries. For each individual product, links to quick-look plots, verification/validation results and to the corresponding numerical data are provided. The website has also areas providing background information on the project and on the services delivered. Further, it has a “news” and an “in focus” sections, which highlighted MACC-II response in case of events of specific interest (e.g. air quality episodes, wildfires, volcanic eruptions…) or of project events such as General Assemblies or User events. Over 300 deliverables have been delivered during the course of MACC-II (266 deliverables on the SESAM system; 40 additional ones on the MACC-II website, such as new issues of evaluation reports). The vast majority of MACC-II deliverables are publicly available at: http://copernicus-atmosphere.eu/documents/maccii/deliverables/.
The present final report provides a synthetic account of activities during MACC-II and presents highlights of the main results and findings. It is presented with sections on each of the 15 sub-projects. A companion Special Issue in the open access European Journals ACP/AMT/GMD/ESSD provides a more in-depth analysis of some of the research results. Papers can be freely accessed at http://www.atmos-chem-phys.net/special_issue310.html.
In practise, MACC-II was followed by a short follow-on project of 8 months (MACC-III), funded under the Horizon 2020, which was designed to bridge the gap until the effective establishment of the operational Copernicus programme in the Spring of 2015.

MACC-II Final Report – October 2014
4 / 137
Co-authors and contributors Management (MAN) ECMWF: Vincent-Henri Peuch (project co-ordinator), Richard Engelen (project manager), Rebecca Calnan (project assistant) BIRA-IASB: Jean-Christopher Lambert, Anne de Rudder Acquisition of observations (OBS) NILU: Leonor Tarrason (leader), Philipp Schneider, Åsmund Fahre Vik, William Lahoz, Matthias Vogt ECMWF: Martin Suttie, Marijana Crepulja NUIG: Colin O’Dowd, Tomas Grigas CNRS-LA: Valérie Thouret, Hannah Clark JULICH (collaboration): Martin Schultz, Snehal Waychal Emissions (EMI) UPMC: Claire Granier (leader), Katerina Sindelarova, Thierno Doumbia EC - DG JRC: Greet Maenhout-Janssens, Monica Crippa, Marilena Muntean INERIS: Frederik Meleux, Bertrand Bessagnet TNO: Hugo Denier van der Gon, Jeroen Kuenen MET Norway: Michael Gauss CNRS-LA (collaboration): Catherine Liousse, Aude Mieville Observatoire Midi-Pyrénées (collaboration): Sabine Darras NOAA ESL, USA (collaboration): Gregory Frost NCAR, USA (collaboration): Jean-Francois Lamarque Fire emissions (FIR) ECMWF: Johannes Kaiser (leader), Samuel Rémy JULICH: Angelika Heil, Martin Schultz IPMA: Joao Macedo, Isabel Trigo KCL: Jiangping He, Ronan Paugam, Martin Wooster, Weidong Xu VUA: Niels Andela, Rob Detmers, Guido van der Werf Greenhouse gases (GHG) LSCE: Frédéric Chevallier (leader), Philippe Bousquet, Robin Locatelli, Anna Lourantou, Jérôme Tarniewicz, Lynn Hazan IUP-UB: Maximilian Reuter,Jens Heymann, Michael Hilker, Vladimir Rozanov, Alexei Rozanov, Michael Buchwitz Leicester University: Hartmut Boesch, Kristiina Byckling CNRS-LMD: Raymond Armante, Corinne Burlaud, Laurent Crépeau, Cyril Crevoisier ECMWF: Anna Agusti-Panareda, Sébastien Massart JRC: Mihai Alexe, Peter Bergamaschi NILU: Rona Thompson TNO: Arjo Segers

MACC-II Final Report – October 2014
5 / 137
SRON: Rob Detmers, Remco Scheepmaker, Otto Hasekamp, Ilse Aben NASA/JPL (collaboration): Christian Frankenberg KIT (collaboration): Andre Butz Global reactive gases (GRG) JULICH: Martin Schultz (leader), Olaf Stein, Sabine Schröder, Snehal Waychal ECMWF: Johannes Flemming, Antje Inness, Luke Jones, Beatriz Monge-Sanz, Mark Parrington KNMI: Vincent Huijnen, Roland van der A, Henk Eskes BIRA-IASB: Simon Chabrillat, Karolien Lefever, Dominique Fonteyn MF-CNRM: Virginie Marécal, Joaquim Arteta, Béatrice Josse CERFACS: Daniel Cariolle, Emanuele Emili, Elodie Jaumouillé IUP-UB: Anne-Marlene Blechschmidt, Andreas Richter, Andreas Hilboll UPMC: Idir Bouarar DLR: Frank Baier, Diego Loyola RIUUK: Hendrik Elbern, Ketevan Kasradze, Scarlet Stadtler Global aerosols (AER) CNRS-LMD: Olivier Boucher (leader), Nicolas Huneeus, Jeronimo Escribano, Alina Gainusa-Bogdan, Cyril Crevoisier, Virginie Capelle, Alain Chédin CNRS-ICARE: Jacques Descloitres, Anne Vermeulen, Nicolas Henriot, Stanislaw Matusiak, Manuel Saunier, Julien Bonte, Bruno Six, Sylvain Neut, Jean-Marc Nicolas, Loredana Focsa, Henri Meurdesoif CEA-LSCE: Frédéric Chevallier DLR: Thomas Holzer-Popp, Miriam Kosmale,Dmytro Martynenko,Franziska Schnell ECMWF: Angela Benedetti, Alessio Bozzo, Luke Jones, Johannes Kaiser, Jean-Jacques Morcrette, Samuel Rémy FMI: Gerrit de Leeuw, Pekka Kolmonen, Larisa Sogacheva MET Norway: Michael Schulz, Jan Griesfeller, Anna Benedictow Met Office: Jane Mulcahy, David Walters, Malcolm Brooks MPIM: Stefan Kinne University of Leeds: Graham Mann, Will Hewson, Matt Woodhouse, Francois Benduhn, Sandip Dhomse University of Leipzig: Johannes Quaas, Johannes Muelmenstaedt, Karoline Block University of Reading: Nicolas Bellouin, Anna Esteve Global Production (GDA) ECMWF: Richard Engelen (leader), Anna Agusti-Panareda, Angela Benedetti, Alessio Bozzo, Marijana Crepulja, Johannes Flemming, Jan Haseler, Antje Inness, Luke Jones, Johannes Kaiser, Sébastien Massart, Beatriz Monge-Sanz, Jean-Jacques Morcrette, Mark Parrington, Miha Razinger, Samuel Rémy, Martin Suttie, Xiaobo Yang Validation activities (VAL) KNMI: Henk Eskes (leader), Vincent Huijnen, Ronald van der A AA: Theodora Antonakaki, John Kapsomenakis, Mihalis Vrekoussis, Christos Zerefos AEMET: Emilio Cuevas AUTH: Dimitris Melas, Eleni Katragkou
MACC-II Final Report – October 2014
6 / 137
IUP-UB: Anne-Marlene Blechschmidt, Andreas Richter BIRA-IASB: E. Botek, Simon Chabrillat, Y. Christophe, B. Langerok, Karolien Lefever CNRS-LA: Hannah Clark, Audrey Gaudel, Valérie Thouret CNRS-LMD: Nicholas Huneeus DWD: Harald Flentje, Werner Thomas, Annette Wagner ECMWF: Luke Jones, Miha Razinger FMI: Antti Arola MET Norway: Anna Benedictow, Jan Griesfeller, Michael Schulz MPG: Stefan Kinne UPMC: Idir Bouarar Regional Air Quality activities (EDA, ENS, EVA) RIUUK: Hendrik Elbern (leader EDA), Elmar Friese, Ketevan Kasradze, Zoi Paschalidi, Kai Krajsek, Clarissa Figura, Scarlet Stadtler AEMET: Alberto Cansado, Esther López, Isabel Martínez, Tomás Morales AUTH: Dimitrios Melas, Stavros Avgoloupis, Spyros Dimopoulos, Theodore Giannaros, Christos Giannaros, Eleni Katragkou, Chariklia Meleti, Natasa Poupkou CERFACS: Daniel Cariolle, Emanuele Emili, Elodie Jaumouillé CNRS-LISA: Matthias Beekmann, Adriana Coman, Gilles Foret, Benjamin Gaubert FMI: Mikhail Sofiev, Julius Vira, Marje Prank, Joana Soares, Rostislav Kouznetsov, Ari Karppinen, Jaakko Kukkonen INERIS: Laurence Rouïl (leader EVA), Bertrand Bessagnet, Frédérik Meleux, Anthony Ung KNMI: Henk Eskes, Ujjwal Kumar, Martijn de Ruyter de Wildt, Robert van Versendaal MET Norway: M. Gauss, Alvaro Valdebenito, Anna Benedictow, Heiko Klein, Birthe Marie Steensen, Svetlana Tsyro, Peter Wind MF-CNRM: Virginie Marécal (leader ENS), Joaquim Arteta, Nicole Asencio, Guillaume Beffrey, Frederic Chavaux, Françoise Chéroux, Jean Clochard, Richard Dupont, Laaziz El Amraoui, Denis Ferriol, Chantal Flick, Sylvie Guidotti, Jonathan Guth, Mathieu Joly, Béatrice Josse, Nikolay Kadygrov, Antoine Kergomard, Bruno Lacroix, Vincent Lemaire, Stéphane Martinez, Philippe Moinat, Jonathan Parmetier, Dominique Paulais, Marion Pithon, Matthieu Plu, Solen Quéguiner, Sébastien Rouzeau, Bojan Sic, Pascal Simon NILU: Leonor Tarrason SMHI: Lennart Robertson, Camilla Andersson, Stefan Andersson, Manu AnnaThomas, Cecilia Bennet, Robert Bergström, Magnuz Engardt, Michael Kahnert TNO: Lyana Curier, Martijn Schaap, Arjo Segers, Richard Kranenburg, Renske Timmermans Products in support of Policy users (POL) MET Norway: Michael Gauss (leader), Semeena Valiyaveetil, Alvaro Valdebenito NILU: Leonor Tarrason, Sam Erik Walker EAA: Herbert Haubold, Christian Ansorge, Christian Nagl CNRS-LISA: Isabelle Coll, Gilles Foret, Guillaume Siour, Matthias Beekmann INERIS: Laurence Rouil, Frederik Meleux Solar radiation (RAD) DLR: Marion Schroedter-Homscheidt (leader), Niels Killius, Gerhard Gesell Armines: Lucien Wald, Bella Espinar, Mireille Lefèvre, Philippe Blanc FMI: Antti Arola, Mikko Pitkänen, Vaida Cesnulyte, Anders V. Lindfors

MACC-II Final Report – October 2014
7 / 137
ECMWF: Angela Benedetti, Alessio Bozzo Transvalor (collaboration): Etienne Wey User Interface (INT) DLR: Thomas Holzer-Popp (leader), Miriam Kosmale, Dmytro Martynenko, Lars Klüser, Franziska Schnell, Julian Meyer-Arnek, Oleg Goussev, Christoph Harsch, Thilo Erbertseder, Gerhard Gesell ECMWF: Richard Engelen, Xiaobo Yang, Miha Razinger CERC: Amy Stidworthy, David Carruthers JULICH: Martin Schultz, Snehal Waychal UPMC: Claire Cranier, Katerina Sindelarova, Thierno Doumbia, Idir Bouarar CNRS-LA (collaboration): Catherine Liousse

MACC-II Final Report – October 2014
8 / 137
Table of Contents
1. Project Overview ........................................................................................................ 11
1.1 The programmatic context ............................................................................................. 11
1.2 Products and services ..................................................................................................... 12
1.3 Project management activities ...................................................................................... 13
2. Acquisition of observations (OBS) ............................................................................... 16
2.1 Acquisition of satellite data products ............................................................................ 16
2.2 Acquisition of in-situ data .............................................................................................. 20
2.3 Acquisition of aircraft measurements ............................................................................ 23
2.4 Acquisition of vertical profile and column data ............................................................. 24
2.5 Interaction with data providers ..................................................................................... 25
3. Emissions (EMI) .......................................................................................................... 28
3.1 Introduction .................................................................................................................... 28
3.2 European anthropogenic emissions ............................................................................... 28
3.3 Global anthropogenic emissions .................................................................................... 29
4. Natural emissions of hydrocarbons ................................................................................. 31
3.4 Pilot study: an inverse modelling system of carbon monoxide ..................................... 32
3.5 Access to the EMI datasets through the ECCAD database............................................. 33
4. Fire data assimilation (FIR) .......................................................................................... 34
4.1 NRT production of emissions with GFAS ........................................................................ 34
4.2 Real-time data provision: Satellite FRP .......................................................................... 36
4.3 Retrospective data provision: Global emissions ............................................................ 37
4.4 Outreach ......................................................................................................................... 37
4.5 Key deliverables ............................................................................................................. 38
5. Global greenhouse gases (GHG) .................................................................................. 39
5.1 Observations .................................................................................................................. 39
5.2 Design of the forecasting system for GHGs ................................................................... 42
5.3 Surface flux inversions ................................................................................................... 43
6. Advances in the analysis and forecasting of global reactive gases (GRG) ...................... 46

MACC-II Final Report – October 2014
9 / 137
6.1 GRG satellite data processing and data assimilation ..................................................... 46
6.2 Stratospheric ozone analyses and forecasts .................................................................. 49
6.3 Global tropospheric analyses and forecasts .................................................................. 51
6.4 User interaction and data dissemination ....................................................................... 53
7. Global aerosol (AER) ................................................................................................... 54
7.1 Maintenance, further development and testing of the IFS aerosol scheme ................. 54
7.2 Maintenance and further development of the data assimilation system ..................... 56
7.3 Further development and provision of satellite aerosol products ................................ 58
7.4 Global aerosol services ................................................................................................... 60
8. Integrated global data assimilation, production and services (GDA)............................. 65
8.1 Integration of new developments .................................................................................. 66
8.2 Global production........................................................................................................... 68
8.3 Global services ................................................................................................................ 69
8.4 Towards operations........................................................................................................ 70
9. The validation subproject (VAL) .................................................................................. 71
9.1 Overview ........................................................................................................................ 71
9.2 Validation of the MACC near-real time global atmospheric composition service ........ 76
9.3 Validation of the MACC global reanalysis ...................................................................... 77
9.4 Validation of other MACC services ................................................................................. 79
10. Data assimilation for European air quality (EDA) ....................................................... 82
10.1 Objectives ..................................................................................................................... 82
10.2 Strategy ........................................................................................................................ 82
10.3 Description of work and achievements ....................................................................... 84
10.4 References cited ........................................................................................................... 95
11. Regional Ensemble Air Quality Forecasting (ENS) ....................................................... 97
12. Validated Air Quality assessment (EVA) ................................................................... 102
12.1 Development of the operational infrastructure ........................................................ 103
12.2 Assessment report production and routine evaluation ............................................. 104
13. Policy-relevant applications (POL) ........................................................................... 109
13.1 Introduction................................................................................................................ 109
13.2 The product lines of POL ............................................................................................ 109
13.3 Research in POL .......................................................................................................... 111

MACC-II Final Report – October 2014
10 / 137
13.4 Interaction with Air Quality policy users .................................................................... 112
13.5 Summary and outlook ................................................................................................ 114
14. Solar radiation services (RAD) ................................................................................. 115
14.1 The Heliosat-4 method and processing chain ............................................................ 115
14.2 The MACC-RAD Information System .......................................................................... 117
14.3 The HelioClim-4 and McClear services ....................................................................... 118
14.4 User’s Guide for the MACC-RAD service .................................................................... 119
14.5 Evaluation of ECMWF irradiance forecasts with respect to solar energy users ........ 120
14.6 Prognostic aerosol validation for monitoring the input to the UV service ............... 121
14.7 UV service validation .................................................................................................. 123
14.8 References cited ......................................................................................................... 125
15. User Interface activities (INT) .................................................................................. 126 References……………………………………………………………………………………………………………………132

MACC-II Final Report – October 2014
11 / 137
1. Project Overview MACC-II had the overall functional objective of delivering reliable operational products and information services that support research, European environmental policy and the on-going development of user-specific downstream services. It prepared for the transition to long-term sustainable operation as the fully-fledged Copernicus Atmosphere Monitoring Service (CAMS) from the second half of 2015 onwards. In track from the predecessor projects GEMS and MACC, the services were operated and further developed in a way complementary to the established range of meteorological and related services that are operated nationally and at European level by what is known collectively as the European Meteorological Infrastructure. The latter services include most notably weather forecasting, but also include services more closely related to the Copernicus services, such as those provided to international aviation by the Volcanic Ash Advisory Centres (VAACs). The strong involvement of meteorological service providers in the MACC-II consortium, which includes the two European operators of VAACs, ensures that the Copernicus services can benefit most fully from ready access to the meteorological data and data-processing infrastructure essential for their operation, and that the Copernicus services are implemented in a way that supports the established services in a manner consistent with the European Union’s principles of complementarity and subsidiarity.
The following sections describe the programmatic context of the establishment of Copernicus (1.1), the main range of products and services delivered by MACC-II (1.2) and give finally an account of the governance and management activities as well as of communications and outreach efforts (1.3).
1.1 The programmatic context MACC-II situates in direct continuity of a series of EU funded precursor project that have established pre-operational capabilities to deliver reliable and quality-assessed products and services on atmospheric composition, in line with requirements expressed by users. From the start, the project has been delivering data and services with a high-level of reliability and has effectively achieved readiness to transition to fully operational mode.
While it was expected in the beginning of MACC-II that the operational phase of Copernicus would start immediately after, it became apparent towards the summer of 2013 that such a direct transition from MACC-II to CAMS in August 2014 was not achievable, due to overall delays in establishing the implementation of the operational Copernicus programme. Through engagement with several EU Member States and with support from the European Commission, a call for a short follow-on project to MACC-II (with predefined beneficiaries) could be set up, with funding available for 8 months of activities (at the MACC-II level). The MACC-II consortium has prepared a proposal in response in February 2014, and thanks to a fast and efficient handling of the whole evaluation and negotiation process, the MACC-III project could effectively take over from MACC-II at the end of July 2014. Achieving a seamless transition between the two projects was essential for some partners in order to keep their highly qualified and experienced personnel.

MACC-II Final Report – October 2014
12 / 137
The adoption in April 2014 of the Copernicus Regulation by the European Parliament formally established the Copernicus programme. The European Commission (DG-ENTR) has opened a call for expressions of interest for being entrusted with the implementation of the Copernicus Atmosphere Monitoring Service (CAMS) over the period until the end of 2020. ECMWF has received support from its Council to be candidate for such an activity and, as a result of its application, was invited by the European Commission to start negotiations. At the time of writing, this process is well under way, with signature of the so-called Delegation Agreement expected to occur in November 2014.
The design of CAMS is largely carrying forward the “heritage” from MACC-II and its predecessor projects, with some organisational evolutions needed for operational implementation. The expenditure management rules of the European Union requires that the providers of the different service elements are selected by means of open and transparent competition, which will be implemented in the first quarters of 2015
The start of the transition to operational status could not start during MACC-II, before providers for the Copernicus Atmosphere Monitoring Service have been selected by means of competitive calls. There is no formal guaranty regarding the entities that will be in charge of providing the CAMS service element. The focus in the last phase of MACC-II has thus been more in testing and documenting key aspects for operational implementation rather than in going forward with the effective transition.
1.2 Products and services Consistent with the MACC’s pre-existing capabilities and service lines and evolving requirements determined through user consultation, MACC-II has supplied:
• monitoring of the global distributions of greenhouse gases, reactive gases and aerosols through assimilation of satellite and in situ observations, using NRT, delayed-mode and reanalysis production systems;
• twice-daily forecasts of the global distributions of reactive gases and aerosols for several days ahead;
• specific stratospheric ozone products, based both on the integrated MACC-II system and on systems that are operated to extend the long-term records built up in PROMOTE and then MACC;
• boundary values for regional modelling of tropospheric and stratospheric chemistry, and local and urban modelling for air quality;
• analyses and forecasts for the European domain based on an ensemble approach using multiple regional air quality models;
• annual assessments and source attribution for the main atmospheric pollutants over Europe;
• tools that may be applied to past cases or in NRT to assess actions to control pollution events;
• global fire analyses and estimates of emissions from fires for use in the global and European regional monitoring and forecasting systems;

MACC-II Final Report – October 2014
13 / 137
• surface fluxes of carbon dioxide, methane and aerosols produced using inverse methods;
• global datasets for emissions from sources other than fires, to be updated based on new statistics or results from flux inversion;
• higher-resolution emission datasets for aerosols and reactive gases over Europe;
• satellite data retrievals as needed to complement work carried out under space-agency auspices, including that from the EUMETSAT SAFs and ESA activities such as its Climate Change Initiative (CCI);
• estimates of direct and indirect climate forcing from aerosols;
• core data services supporting solar power generation and monitoring and prediction of UV radiation.
In addition, MACC-II has responded promptly to supply specific products related to major events involving atmospheric constituents such as volcanic ash and pollutants from major fires. Among other events, we mention here the study of the haze affecting Seatle in July 2012, of the Canadian fires affecting the European troposphere in July 2013 or of the eruption from Icelandic Bardarbunga volcano. News article (as well as on other events) can be seen at: http://copernicus-atmosphere.eu/news/. These events are also covered in validation reports in particular (see section 9). MACC-II’s services were freely and openly available to downstream-service providers and other users throughout Europe. MACC-II and its downstream service sector have between them enabled European citizens at home and abroad to benefit from improved warning, advisory and general information services and from improved formulation and implementation of regulatory policy. MACC-II, together with its scientific-user sector, also helped to improve the provision of science-based information for policy-makers and for decision-making at all levels.
1.3 Project management activities A large fraction of the management and co-ordination activities aimed at liaising with (and supporting) other related projects and programmes, including Copernicus downstream and user uptake projects, as well as in-situ data coordination (European Environment Agency). Regarding the Copernicus space segment, project co-ordinator and manager participated to the Mission Advisory Groups of Sentinel 4-5 and of Sentinel 5P and are liaising actively with EUMETSAT. Project representation has been a very significant activity, with many events and venues to cover. The international visibility of MACC-II has thus been maintained and developed actively, to become a world-leading source of information on global atmospheric composition based upon Earth Observation and advanced modelling and data assimilation. As an illustration, the World Meteorological Organisation highest body (Executive Council) noted in its 65th Session of May 15th-23th 2013 about the Global Atmospheric Watch Programme: “The Council noted the fruitful collaboration with the International Global

MACC-II Final Report – October 2014
14 / 137
Atmospheric Chemistry (IGAC) project of IGBP on Megacities and biomass burning and requested for GAW to continue this, expanding to air pollution and climate interactions by collaborating on the development of a strategic plan for integrated programmes on air pollution and climate change. It also noted the good connections to the 2nd phase of the Monitoring Atmospheric Composition and Climate (MACC-II) project of the European Global Monitoring for Environment and Security (GMES), with for instance GAW stations providing data to this initiative and GURME using MACC-II for boundary conditions in air quality modelling activities.”
1.3.1 Governance and general assemblies As was the case in GEMS and MACC, the Management Board of MACC-II (MB), comprising the leaders of its 15 sub-projects as well as the president of the Beneficiaries Committee, has been the main executive governance board for the project. MB meetings and teleconferences have taken place on a monthly basis -except during main vacations period at the end of civil year and during summer. They allowed to discuss project wide issues and to decide of other targeted meeting/teleconferences on aspects that are of interest only for some of the management board members. In addition to these, several smaller-size teleconferences have been held to discuss specific topics or issues without requiring attendance of the entire management board.
There were three General Assemblies organised during MACC-II:
• Reading, 27 February to 2 March 2012; • Toulouse, 5-9 November 2012; • Brussels, 27-31 January 2014 (in the form of an Open Science Conference, with
around 170 participants).
The project benefited from the input provided by the project Advisory Board, who attended the General Assemblies and met immediately afterwards. The AB provided positive and useful feedback in most scientific/technical/operational areas of the project, linking also with satellite and in-situ observations as well as with some important segments of users (policy, research…).
Among the overall management activities, some effort was devoted to establishing a cross-project Service Validation Protocol (SVP), which would be adapted to the products and services being brought to maturity during the project lifetime and after. It was published in May 2013 and helped monitor service validation compliance with international standards, by working together with the VAL sub-project. A service validation report has been delivered at the end of MACC-II (D_153.3). It provided a transverse view on how validation is implemented and has assessed (favourably) progress towards the operational stage, taking an external/auditing standpoint: it was done by personnel at BIRA-IASB different from the ones involved in the development and production activities.
The MACC-II management at ECMWF established the Service Specification Document (SSD), with two successive versions issued on the MACC-II website: D_153.2 and D153.4. This document has been designed to remain fully in sync with the products catalogue, as well as with the products portfolio (effectively a short/synthetic version of the SSD). A single/central products specifications metadata database has been established in order to

MACC-II Final Report – October 2014
15 / 137
ensure consistency across the different information provided on the products. This tool has proven very effective and will be maintained in the operations phase (CAMS). 1.3.2 Communications and outreach Communications and outreach evolved during MACC-II into a fully-fledged activity, as a range of MACC-II products reached maturity and there were significant project achievements to showcase: e.g. results from MACC-II being taken up in the fifth report of the IPCC, in the annual “State of the Climate” reports compiled in the Bulletin of the American Meteorological Society or a MACC-II feature article in the magazine of the Air & Waste Management Association, two publications that have highest global visibility for meteorologists and environmental managers worldwide. A summer school organised by MACC-II took place in mid-June 2013 (see section 15, INT), with videos of the main lectures being made available on a dedicated “Copernicus Atmosphere” YouTube channel (one introductive video totalling more than 1000 views).
Figure 1.1. Broadcast of the second MACC-II video on HR (Croatia), featuring Etienne Wey (Delegate Director General for Innovation in the French company Transvalor, and user of MACC-II solar services).
A contract with the communications company Youris.com has allowed producing articles and two video news releases, explaining basic elements on how the MACC-II systems work and serve users in particular in the field of air quality as well as on what MACC-II brings to solar applications. The distribution process to the TV media -started in November 2013 for the first video and in May 2014 for the second video led to take-ups and/or broadcast by 28 TV stations: 15 TV stations for “Forecasting Air Pollution” and 13 TV stations for “Forecasting Desert Storms to Empower Solar Panels”. Both videos were broadcast by the pan-European station Euronews that has European coverage (and beyond), broadcasts in 13 languages and has an overall audience of several tens of millions people per day. Beyond Euronews, summing up actual tracked broadcasts and estimates for non-tracked broadcasts on the other TVs; the 2 videos recorded a total estimation of several hundred of thousand watchers. On the web side, from November 2013 till July 2014 the two videos, articles and interviews recorded 44,100 viewers, resulting from the sum of the unique visitors of the MACC-II communication materials on the youris.com platform, of the Facebook viewers and of the multiplier’s (Alpha Galileo, Phys.org, CORDIS) visits. The external outreach for this communications package alone was of approximately 664,000 people.

MACC-II Final Report – October 2014
16 / 137
2. Acquisition of observations (OBS) The acquisition of observations is obviously at the core of a monitoring programme like Copernicus: establishing robust and sustainable data flows has thus been a significant focus of MACC-II and, specifically, the OBS sub-project. OBS drew on existing observation capacities and worked to ensure the establishment of an operational data flow between data providers and the MACC-II production chains. In particular, the OBS sub-project worked:
• to identify existing databases and observational infrastructure, by evaluating the relevance of the existing data flows for operational MACC-II use and their possible compliance with INSPIRE and WIS standards;
• to operationalize the data transmission and data exchange, by linking to existing databases and securing access to data for the global and regional production systems;
• to evaluate the use of new satellite products as they become available, by carrying out some initial testing of the satellite products against existing NRT in situ observations;
• to prepare feedback to the observation data providers, by drawing on the experience gained from data use in MACC-II’s global and regional data assimilation systems.
During MACC-II, efforts have been pursued to access Near-Real-Time (NRT) in situ and satellite data necessary to supply the MACC-II forecast chains. Data available only in delayed-mode, as well as reprocessed versions of data originally in NRT, were acquired for use in MACC-II’s delayed-mode and reanalysis production streams, as well as for validation purposes. New satellite products have been incorporated over the last few years, in particular data from MODIS Deep Blue, MSG SERVERI, PMAP products from EUMETSAT, AOD from VIIRS, GOSAT data and selected products from ESA's Climate Change Initiative (CCI). The MACC-II website provides up-to-date information on the data used by the pre-operational Copernicus atmosphere service. This section of the report provides a snapshot of the state of play at the end of MACC-II. For updated information, please consult http://copernicus-atmosphere.eu/about/project/macc_input_data/. In addition to the technical acquisition activities, the work has focused on evaluating the progress with operationalization of observational data exchanges. As a result, recommendations to support harmonization of data exchange have been elaborated, and MACC-II contributed to and supported a number of international initiatives towards enhanced inter-operability and data exchange.
2.1 Acquisition of satellite data products Satellite observations are a crucial input to the MACC-II systems in order to produce services in NRT (a few hours after time) and in delayed-mode (some days to some months after time). They are also an essential element going into reanalysis activities.

MACC-II Final Report – October 2014
17 / 137
Table 2.1 lists the satellite instruments providing observations in NRT, which are routinely acquired as an input to the MACC-II system for analysis and prediction of atmospheric composition at the global scale (see section 8, GDA). This information feeds the regional component of MACC-II primarily via chemical boundary conditions, although a growing number of high-resolution regional Air Quality systems also assimilate satellite remote-sensing observations in test mode (see section 10, EDA). Table 2.1 Satellite observations assimilated in the global NRT MACC-II system
Instrum. Satellite Space Agency Data Provider Species Status* MODIS EOS-Aqua, -Terra NASA NASA AOD, FRP A MLS EOS-Aura NASA O3 profile A OMI EOS-Aura NASA KNMI O3, NO2, SO2 A SBUV-2 NOAA-16, 17, 18, 19 NOAA NOAA O3 profile A IASI METOP-A EUMETSAT/CNES ULB/LATMOS CO A MOPITT EOS-Terra NASA NCAR CO A GOME-2 METOP-A, -B EUMETSAT/ESA DLR O3 A GOME-2 METOP-A, -B EUMETSAT/ESA DLR NO2, SO2 M IASI METOP-B EUMETSAT/CNES ULB/LATMOS CO M SEVIRI METEOSAT EUMETSAT LandSAF O3, FRP M Imager GOES-11, -12 NOAA UCAR FRP radiances M CALIOP CALIPSO NASA lidar backscat. P OMPS Suomi NPP NASA O3 P IASI METOP-A, -B EUMETSAT/CNES EUMETSAT O3 radiances P Imager MTSAT-2 JMA JMA FRP radiances P VIIRS Suomi NPP NASA AOD, FRP P SEVIRI MSG EUMETSAT ICARE AOD P
* A = Active assimilation; M = passive monitoring ; P = implementation is planned.
Figure 2.1. Monitoring plots of METOP-A/GOME-2 ozone product assimilated, showing a healthy behaviour of the assimilation system in spite of occasional reductions of the dataflow.

MACC-II Final Report – October 2014
18 / 137
ECMWF maintains and further enhance the suite of observational data streams, from both operational and research satellite missions. Monitoring plots are produces for instruments that are (actively) assimilated or (passively) monitored ; these plots are made available continuously on the MACC-II website: http://copernicus-atmosphere.eu/d/services/gac/monitor/nrt/moz_ifs/active_departures/
Figure 2.1 presents an example of such monitoring plots for the METOP-A GOME-2 instrument.
Recent work carried out in collaboration with EUMETSAT and NOAA aimed to set up routine acquisition of aerosol optical thickness products from the VIIRS instrument on the S-NPP mission. For reactive gases, a major enhancement of the observational data streams was the inclusion of products from METOP-B. For aerosols, development efforts have been addressed to test the feasibility of assimilating aerosol optical depth from:
• products obtained with the MODIS Deep Blue algorithm; • MSG SEVIRI; • The new PMAP product from EUMETSAT (Polar Multi-Sensor Aerosol Optical
Properties product). Besides, some efforts have been devoted to evaluate the potential interest new satellite retrieval products with use of in situ data. Activities have particularly focused on the CALIOP aerosol lidar product that has been evaluated against data from the ground-based European Aerosol Research Lidar Network (EARLINET). A method was developed to convert EARLINET backscatter into the attenuated backscatter coefficient, in order to inter-compare CALIOP and EARLINET coincidental measurements. Assessment parameters for the relationship between CALIOP and EARLINET measurements were established and 90 CALIOP overpasses within 100 km distance from operating EARLINET stations were located over the period from Nov. 2010 to Dec. 2012. Aerosols classified as dust, polluted dust, clean marine, clean continental, polluted continental, mixed and smoke/biomass burning were detected during the 64 CALIOP overpasses. From the overall dataset, two case study overpasses were selected to perform a more detailed analysis. The influences of the geo-location and proximity of the EARLINET station to pollution sources, the altitude of the dominant aerosol layer, and the aerosol type were analysed in detail. 5-profile averages of CALIOP data were averaged up to correspond to a 100 km spatial scale and to be within this distance from the corresponding EARLINET station. Despite the averaging, the profile data were found to be too noisy that they are probably not useful for assimilation into air quality models; however, 5-profile averages of the integrated attenuated backscatter coefficient were found to be within acceptable signal-to-noise ratios. The results show that averages of the studied CALIOP profiles are so noisy that they are probably not useful for assimilation into air quality models for a given location such as a metropolitan area, but may provide useful averages over much longer ground tracks. This work is reported in deliverable report D_15.1 and further refined as a publication submitted to the MACC-II ACP special issue.

MACC-II Final Report – October 2014
19 / 137
Figure 2.2. CALIOP vs EARLINET total attenuated backscatter coefficient for CALIOP overpasses over EARLINET stations within 100 km distance. The colour is used to present the ground track distance from the EARLINET station. Greenhouse gas products are typically not available in NRT and are currently assimilated in a specific delayed-mode run of the MACC-II global system, which is run 3-6 months behind real-time. During MACC-II, the major effort was to adapt to using new greenhouse gas products from the GOSAT mission in order to replace the SCIAMACHY products previously used from the ENVISAT mission (which was lost in April 2012). This is described in Table 2.2.
Significant improvements in the speed of processing and of delivery of these data are foreseen in the near future: the delayed mode production is now expected to run soon only 3 to 5 days after present. With the 10-day forecast horizon of the GHG forecasts (see section 5), these will be actual forecasts, which some MACC-II users have expressed interest for (scientific field campaign planning in particular). Table 2.2 Global delayed-mode analysis and forecast system
Instrum. Satellite Space Agency Data Provider Species Status* SCIAMACHY ENVISAT ESA SRON CH4 A AIRS EOS-Aqua NASA NASA CO2 radiances M IASI METOP-A EUMETSAT/CNES EUMETSAT CO2 radiances M IASI METOP-A EUMETSAT/CNES LMD CH4 M TANSO GOSAT JAXA NIES CH4 M TANSO GOSAT JAXA NASA-ACOS CO2 M TANSO GOSAT JAXA SRON CH4 P
* A = Active assimilation; M = passive monitoring ; P = implementation is planned. A wide range of satellite products were also processed off-line for the extension of the MACC reanalysis, including selected products from ESA's Climate Change Initiative (CCI). These data were processed for a specific one-year re-analysis (April 2011 to September 2012), as specified in deliverable report D_11.5. They are described in Table 2.3.

MACC-II Final Report – October 2014
20 / 137
Table 2.3 Satellite observations that are assimilated in the global REA system
Instrum. Satellite Space Agency Data Provider Species MODIS EOS-Aqua, -Terra NASA NASA AOD, FRP, burnt area
MLS EOS-Aura NASA NASA O3 profile, SO2, formaldehyde
OMI EOS-Aura NASA KNMI O3 SBUV-2 NOAA-16, 17, 18, 19 NOAA NOAA O3 profile SCIAMACHY ENVISAT ESA KNMI O3, NO2, CH4 SCIAMACHY ENVISAT ESA BIRA-IASB SO2, formaldehyde SCIAMACHY ENVISAT ESA SRON CH4 MIPAS ENVISAT ESA ESA O3 profile GOME ERS-2 ESA RAL O3 profile IASI METOP-A EUMETSAT/CNES ULB/LATMOS CO MOPITT EOS-Terra NASA NCAR CO AIRS EOS-Aqua NASA NASA CO2 radiances IASI METOP-A EUMETSAT EUMETSAT CO2 radiances
2.2 Acquisition of in-situ data The provision of ground-based observations for the routine operational production of analyses and forecasts as well as of validated observations for the delayed-mode analysis system were also among the key objectives of MACC-II. Secondary objectives were to identify new data and to provide recommendations for facilitating data acquisition and exchanges.
A summary of the activities is provided in the deliverable report entitled “Ground-based observations in the MACC-II production systems”. It presents first the different data centres linked to MACC-II production chain and indicates to what degree data exchange activities are currently operationalised for each of these data nodes. It includes a chapter on the general lessons learned from the operationalization work and provides recommendations as how to proceed in the future, seeking further harmonisation with the WMO Information System. The main conclusion is to recommend that the centers supplying data to the MACC-II should comply with WIS requirements of Data Centers or Production Centers (DCPC). This is because the systematic requirements from WMO to their DCPCs are highly relevant also for the MACC-II/Copernicus production chains. Hopefully, this will allow harmonization of data exchange and will ensure also synergies between the atmospheric composition and the meteorological data exchange.
European surface air quality observations from the MACC system continues to be acquired in NRT (one file per day per country with 24h hourly values) as a backup to the acquisition performed by Météo-France for the regional modelling groups of MACC-II, based on new retrieval algorithms developed by NILU to gather EEA NRT data. Some surface observations from the WMO GAW are made available in NRT by DWD and are acquired for use in the verification of the global system. The acquisition of surface observations from the North American AIRNow service continued. Most important additions in the second period of MACC-II were the incorporation of ICOS surface data for CO2 and CH4, and the pre-operational link to EEA NRT data flow. Table 2.4 below summarises the main pre-operational data acquisition sources for NRT surface observations.

MACC-II Final Report – October 2014
21 / 137
Table 2.4 Surface observations acquired in NRT for MACC-II.
Network/source Observation type Provider Species European air quality Surface EEA O3, CO, NO2, NOx, SO2, PM2.5,
PM10 hourly concentrations GAW Surface DWD O3, CO, SO2, NO, NO2, PM10 hourly
concentrations AIRNow (US-Can.) Surface US EPA O3, CO, SO2, NO, NO2, PM2.5, PM10
hourly concentrations ICOS Surface ICOS consortium CO2, CH4
AERONET provides globally distributed observations of spectral aerosol optical depth (AOD), inversion products, and precipitable water in diverse aerosol regimes. These data are currently incorporated to MACC-II as well as data from the NASA Micro Pulse Lidar Network (MPLNET). This is a federated network of Micro Pulse Lidar (MPL) systems that measures aerosol and cloud vertical structures. In addition to these data, MACC-II compiles also validated data from the above NRT networks (available between 6 months and 2 years after real-time). Table 2.5 provides a summary of the validated data acquired. Table 2.5 Validate surface observations acquired for MACC-II (delayed mode).
Network/source Observation type Provider Species AERONET Surface NASA aerosol optical thickness, daily values European air quality Surface EEA O3, CO, NO2, NOx, SO2, PM2.5, PM10
validated concentrations GAW Surface DWD O3, CO, SO2, NO, NO2, PM10 validated
concentrations AIRNow Surface US EPA O3, CO, SO2, NO, NO2, PM2.5, PM10 validated
concentrations MPLNET surface lidar NASA aerosol lidar backscatter
The most relevant additions of in-situ observation data during MACC-II are the link to EAN pollen data and the pre-operational testing of EEA NRT data.
On an experimental basis, 4-day pollen forecasts over Europe were produced by MACC-II. These pollen forecasts depend critically on observational data compiled by the members of the European Aeroallergen Network (EAN). MACC-II used indeed the EAN pollen data for verification purposes of the Regional model pollen forecasts over Europe, including calculation computation of skill-scores and indicators, and a posteriori regional analyses of the pollen concentrations. The voluntary character of the EAN network hampers the capability for operationalization of this data flow. Consequently, the data flow from EAN to MACC-II is not operationalized but it is based on a common voluntary agreement that needs to be renewed each year. We have currently agreed a Memorandum of Understanding between EAN representatives and MACC-II. The overall goal of this agreement was to ensure a long-term sustainable mutually beneficial cooperation. The collaboration aims at bringing added value to EAN efforts to characterise pollen seasons and trends, by demonstrating the technical feasibility and benefits of MACC-II pollen forecasts across Europe. The evolution to the Copernicus Atmosphere Monitoring Service will allow

MACC-II Final Report – October 2014
22 / 137
consolidating further the relationship with the EAN and engaging in joint work, with funding available for this purpose.
The provision of regulatory surface data from EEA to MACC-II has been thoroughly tested in a series of 3 rounds (Autumn 2011; Spring 2012; Summer 2013). Continuous feedback and co-operation was maintained between the MACC-II team and the responsible data officers at EEA and the ETC/ACM. In September 2012, the operational delivery of NRT data via EEA was initiated on a regular basis through the Météo-France server for the routine regional analyses and forecasts production. This connection is running in parallel with the current operational MACC-II NRT surface data flow. A significant issue identified during these tests is the inconsistencies in timeliness reporting by different countries in the EIONET/EEA network (see Figure 2.3). The conclusions from these tests have been reported in the deliverable report D_16.3: “Feedback to EEA/EIONET NRT data”.
Figure 2.3. Identified inconsistencies in the timeliness of EEA Near-Real-Time data deliveries. A series of recommendations on metadata descriptions and data exchanges have been formulated in order to ensure inter-operability with data providers and the optimal use of observational data by the MACC-II production systems. These recommendations are summarized in different deliverable reports (D_12.5, D_12.6 and D_12.7). They are based on a number of international discussions on data interoperability and on choices for data nodes and metadata descriptions, which MACC-II has organized or contributed to. Most significant was the cooperation with the GEO Air quality Community of Practice and the joint workshop organized in Dublin in June 2012. Further international effort has been carried out to liaise with WMO WIGOS and EEA’s ETC/ACM activities on e-reporting, as well as with the EIONET community on the issue of data flagging. Among the resulting actions, WMO has now established a task team on "atmospheric composition vocabulary" which will commence its work in October 2014 and will comprise MACC-II participants. This team will identify common vocabularies and metadata items lists, i.e. harmonized ISO 19115 profiles. This will link also to the regulatory activities at EEA under e-reporting: the idea is to harmonize the WIGOS and INSPIRE and e-reporting profiles of ISO 19115 by setting up mapping tables of the metadata items and identifying common vocabularies. The ideal solution would aim at developing single XML codes for the different scientific and regulatory communities, with
MACC-II Final Report – October 2014
23 / 137
optional metadata elements to meet the specific needs of each community for the characterization of in-situ data.
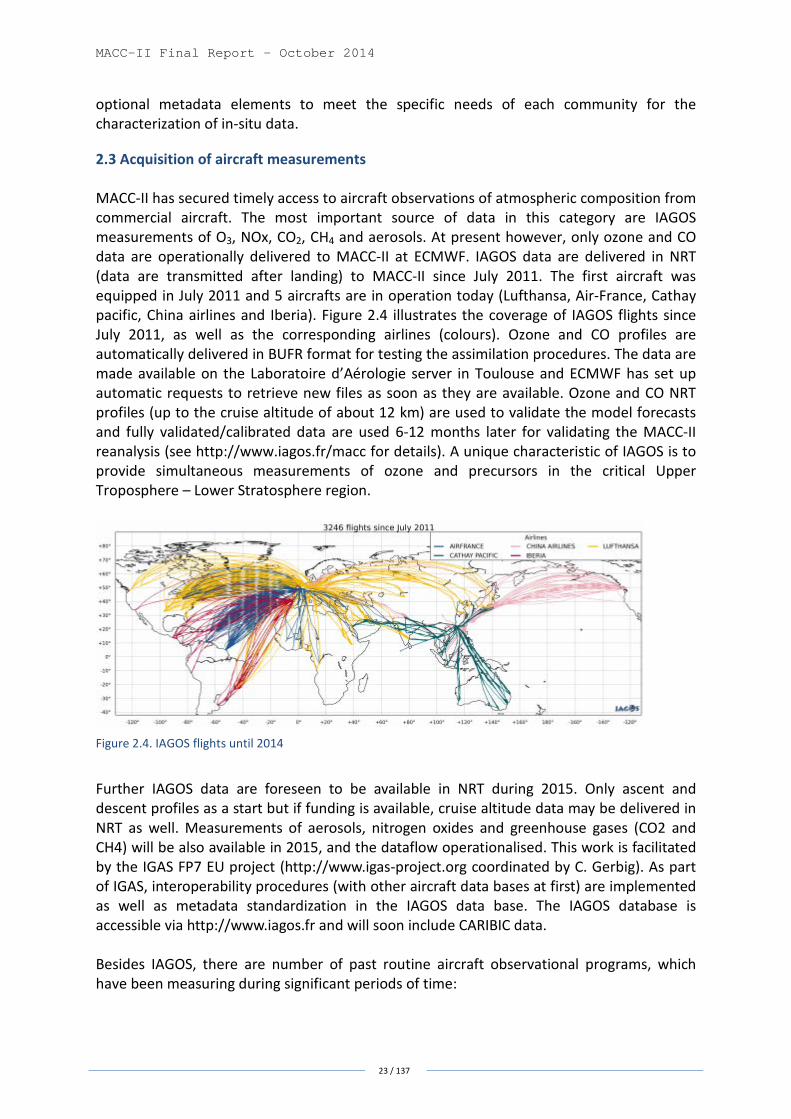
2.3 Acquisition of aircraft measurements MACC-II has secured timely access to aircraft observations of atmospheric composition from commercial aircraft. The most important source of data in this category are IAGOS measurements of O3, NOx, CO2, CH4 and aerosols. At present however, only ozone and CO data are operationally delivered to MACC-II at ECMWF. IAGOS data are delivered in NRT (data are transmitted after landing) to MACC-II since July 2011. The first aircraft was equipped in July 2011 and 5 aircrafts are in operation today (Lufthansa, Air-France, Cathay pacific, China airlines and Iberia). Figure 2.4 illustrates the coverage of IAGOS flights since July 2011, as well as the corresponding airlines (colours). Ozone and CO profiles are automatically delivered in BUFR format for testing the assimilation procedures. The data are made available on the Laboratoire d’Aérologie server in Toulouse and ECMWF has set up automatic requests to retrieve new files as soon as they are available. Ozone and CO NRT profiles (up to the cruise altitude of about 12 km) are used to validate the model forecasts and fully validated/calibrated data are used 6-12 months later for validating the MACC-II reanalysis (see http://www.iagos.fr/macc for details). A unique characteristic of IAGOS is to provide simultaneous measurements of ozone and precursors in the critical Upper Troposphere – Lower Stratosphere region.
Figure 2.4. IAGOS flights until 2014 Further IAGOS data are foreseen to be available in NRT during 2015. Only ascent and descent profiles as a start but if funding is available, cruise altitude data may be delivered in NRT as well. Measurements of aerosols, nitrogen oxides and greenhouse gases (CO2 and CH4) will be also available in 2015, and the dataflow operationalised. This work is facilitated by the IGAS FP7 EU project (http://www.igas-project.org coordinated by C. Gerbig). As part of IGAS, interoperability procedures (with other aircraft data bases at first) are implemented as well as metadata standardization in the IAGOS data base. The IAGOS database is accessible via http://www.iagos.fr and will soon include CARIBIC data. Besides IAGOS, there are number of past routine aircraft observational programs, which have been measuring during significant periods of time:

MACC-II Final Report – October 2014
24 / 137
• CONTRAIL (on-going, data available ~6 months after landing, species: CO2, CH4, CO, N2O, SF6, H2, and isotopes)
• NOXAR (from May 1995 until May 1996 on about 500 scheduled flights to destinations in the United States (NY, Atlanta, Chicago, Boston) and the Far East (Beijing, Bombay, Hong Kong); species: ozone, NO, NO2)
• GASP (1975-1979; species: O3 and CO)
Furthermore, data from a large number of aircraft field campaigns are available in various databases:
• NASA Global Tropospheric Experiment series (GTE); • HIPPO (HIAPER Pole-to-Pole observations) • BADC data archive • DLR data archive (e.g. CONTRACE, TROCCINOX, and ITOP) • NOAA data archive • US DoE RAF G1 • POLARCAT • IPAC-NC • SAMBBA, GABRIEL
Given the number of on-going initiatives in the community to build comprehensive data portals and specific data products suited for model evaluation from the diversity of existing databases, MACC-II will rely upon these efforts for historical aircraft data rather than aiming at developing yet another database.
2.4 Acquisition of vertical profile and column data
MACC-II/OBS has also liaised with data providers of ground-based remote sensing data, especially the EARLINET and AERONET networks.
ECMWF acquired continuously AERONET Level 1.5 data in NRT (one file per day containing all observations collected by NASA for the previous day) from NASA Goddard. These observations were used primarily for the verification of the global aerosol forecast.
Research Column and Profile data were compiled by MACC-II from a large number of networks and programs, including NDACC, AERONET, EARLINET, MPLNET, TCCON and SKYNET. The level of operationalization of the observational data flow exchange varies for the different networks and it is currently done in an ad-hoc basis. Service level agreements with research programs generating and compiling the data are necessary for the future; this aspect has been taken into account in designing the Copernicus Atmosphere Monitoring Servoce. Many of these networks share data centres for distribution and storage of the data. A prominent example is the ACTRIS infrastructure (http://www.actris.net), which is currently identified as a central node concerning research column and profile data. ACTRIS NRT aerosol data from EUSAAR and EMEP are already available to MACC-II via the web-interface (http://ebas.nilu.no).
Experience within the operationalization of observational data flows in MACC-II indicates that supporting projects (like IGAS for IAGOS, ICOS-INWIRE for ICOS and NORS for NDACC) are necessary to bridge the needs for operations at the Copernicus production service.

MACC-II Final Report – October 2014
25 / 137
Further cooperation with ACTRIS is necessary to develop the algorithms necessary for the transmission of ground-based aerosol data from EARLINET to MACC-II.
Figure 2.5. Position of ACTRIS ground based stations and those available at the ACTRIS portal in 2014.
2.5 Interaction with data providers Providing coordinated feedback to the observational data providers on their data is an essential value-adding activity for MACC-II. This feedback is drawing from the experience gained under the data use in the production of MACC-II Global and Regional data assimilation systems and though the validation product chain.
A report compiling an overview of the ground-based data used as input in the MACC-II production chain has been produced and includes a short overview the different approaches used to secure the operational access to ground-based observations (report D_16.1). The report identifies the main observational data nodes for: a) regulatory surface data, b) research surface data, c) research aircraft data and d) research column and profile data. The focus of this report is on the challenges encountered when the actual data exchange was to be operationalized and how these challenges were solved differently for the different networks.
Two main feedback reports to data providers were elaborated under this task: one was addressed to the main new surface data provider in MACC-II production chain, namely the EEA/EIONET network (2.5.1); the other was addressed to the satellite measurement community in general (2.5.2).
2.5.1 EEA/EIONET NRT data
The feedback about EEA/EIONET NRT data has been built upon the experience by MACC-II partners, working in collaboration with EEA and ETC/ACM data managers. The corresponding report (D_16.3) shows that the volume of surface NRT data provided by EEA/EIONET covers a larger geographical area than in the original MACC-II data provision (based upon specific bilateral agreements with some countries) and includes considerably more stations available per component. However, a number of stations have been identified to report data to MACC-II but apparently not to EEA/EIONET. There have been identified some gaps in the night transmission of EEA/EIONET NRT data (Figure 2.6). There are also identified issues concerning instabilities and drop-outs in the data transmission from

MACC-II Final Report – October 2014
26 / 137
EEA/NRT. The evaluation of the EEA/EIONET NRT data provision has also identified a series of inconsistencies in the data itself. Such inconsistencies limit the usefulness of the data in an operational context. EEA is currently developing a download service to support the new e-Reporting dataflow, which will eventually replace the current download tool used by MACC-II. Further discussions with the EEA and the EIONET is thus necessary is order to ensure that operational requirements for the Copernicus Atmosphere Monitoring Service are met.
Figure 2.6. Comparison of the total number of regulatory stations reporting O3 in NRT through the EEA and MACC retrieval mechanisms. Top panel shows values at 07:00 UTC, central panel shows values at 21:00 UTC and lower panel shows values for 23:00 UTC.
2.5.1 Satellite data
The second feedback report is D_16.4 “Report with recommendations for observational NRT for future missions”. This report provides an overview of the satellite data used by MACC-II, and of potential future satellite data, which could potentially benefit developments within

MACC-II Final Report – October 2014
27 / 137
the Copernicus Atmosphere Monitoring Service. It considers experiences from MACC-II through the use of satellite data, especially under the VAL subproject. It also considers new satellites missions planned and includes recommendations for future missions, with the focus being on monitoring air quality and greenhouse gases. The methodology of Observing System Simulation Experiments (OSSEs) is introduced as a way of quantifying the added value of future satellite missions and some recommendations are provided as to how to MACC-II modelling systems can contribute to OSSEs. There is a strong link between the quality and nature of the Global Observing System (GOS) as applies to atmospheric observations, and the benefits provided by the Copernicus Atmosphere Monitoting Service. Therefore, MACC-II and related future activities should be aware of and be able to, influence efforts to design, modify and extend the GOS.

MACC-II Final Report – October 2014
28 / 137
3. Emissions (EMI)
3.1 Introduction The needs for emissions information and the demands for their accuracy and consistency have grown over the past few years. Changing economies, demographics, agricultural practices, and energy sources, along with requests to evaluate emissions mitigation efforts have led to new developments and evaluations of surface emissions.
The goal of the EMI sub-project was to provide the distribution of surface emissions to the MACC-II sub-projects. European and global emissions from anthropogenic and natural sources were considered in EMI. EMI has also evaluated the possibility of developing a service providing optimized emissions of carbon monoxide.
All along MACC-II, EMI has developed strong interactions with international projects such as GEIA (Global Emissions Initiative) and AQMEII (EU-North American AQ Model Evaluation International Initiative). The emissions datasets developed as part of MACC-II are all distributed as part of ECCAD, which is the emissions database of GEIA.
3.2 European anthropogenic emissions Within MACC-II, a spatially explicit high-resolution emission inventory (7kmx7km spatial resolution) for UNECE-Europe for all years between 2003 and 2009 was developed. The European emissions inventory for the main pollutants was constructed by using reported emission national totals by sector, followed by a detailed analysis and they were completed with alternative emission estimates as needed. The emission dataset includes annual emissions per grid cell for 7 years (2003-2009) for 8 pollutants (NOx, SO2, NMVOC, NH3, PM10, PM2.5, CO, CH4).
A specific effort was made to improve emissions of particulate compounds. For each source, emissions have been split into coarse and fine particulate matter, and further disaggregated to EC, OC, SO4, Na and others using fractions based on the literature. Doing this at the most detailed sectoral level in the database implies that a consistent set was obtained across Europe. This dataset allows better comparisons with observational data that can, through feedback, help to further identify uncertain sources and/or support emission inventory improvements for these highly uncertain pollutants.
Figure 3.1.a (left). Spatially distributed NOx emissions in 2009 for all sources. Figure 3.1.b (right). Change in NOx emissions between 2003 and 2009 for all sources.

MACC-II Final Report – October 2014
29 / 137
The resulting emission dataset was spatially distributed consistently across all countries by using proxy parameters. Point sources were spatially distributed using the specific location of the point source. The spatial distribution for the point sources was made year-specific.
An example of the distribution of the NOx emissions from all different sources in 2009 is given in Figure 3.1.a: this figure highlights the high spatial resolution of the inventory. Figure 3.1.b shows the changes in NOx emissions from 2003 to 2009 in Europe. It highlights the decrease of emissions in continental regions as a result of emission reduction policies, as well as the increase in ship emissions, for which no strict regulations are yet in place. A detailed study of the emissions related to shipping in Europe has started, which shows that emissions from maritime transport in European waters constitute a significant share of worldwide ship emissions of air pollutants and greenhouse gases.
MACC-II has also analyzed the ammonia emission distribution in European models, through the use of the mechanistic model VOLT'AIR, which calculates the NH3 volatilisation taking into account agricultural practices, meteorology and soil properties. Satellite observations of ammonia performed by the IASI instrument (Figure 3.2.a) show different patterns than the ammonia emissions provided by the TNO-MACC inventory (Figure 3.2.b): The IASI retrievals over Western France, for example, suggest that the hotspot of NH3 emission in TNO-MACC emission inventory might be overestimated. Such preliminary studies demonstrate the potential of IASI as a proxy to better spatially distribute the ammonia emissions.
Figure 3.2.a (left). NH3 concentration patterns retrieved from IASI. Figure 3.2.b (right). NH3 emissions from MACC-TNO emissions inventory.
3.3 Global anthropogenic emissions As part of MACC-II, and together with colleagues from other FP7 projects, the MACCity global emissions inventory was finalized. The MACCity emissions dataset covers now the 1960-2013 period, and provides emissions at a 0.5 x 0.5 degree resolution for a large set of chemical compounds for several sectors. These MACCity emissions are now used not only in MACC-II, but they are widely used in the international atmospheric chemistry modeling community. For example, the CCMI (Chemistry-Climate Model Initiative) international initiative has decided to use the MACCity dataset as the reference emissions for all its hindcast (1960-2010) simulations. A new version of the MACCity dataset is under

MACC-II Final Report – October 2014
30 / 137
development, which will be used in MACC-III, as well as in the next IPCC report and its modeling project, CMIP (Coupled Model Intercomparison Project). EMI has organized two meetings in 2013 and 2014 to launch this new development, where the MACC-II work on both global and regional scales is the basis for developing the new dataset.
The species included in the MACCity dataset include a large set of reactive gases and particles in the form of BC and OC. Emissions provided by the MACCity dataset have been compared with most publicly available emissions inventories for different regions of the world. An example of these comparisons is given in Figure 3.3.a which displays the emissions of carbon monoxide in China, a region where emissions have changed significantly during the past decades: it shows a large increase in the emissions from 1980 in all datasets, but large differences exist between the emissions and their trends. Figure 3.3.b shows the minimum, average and maximum values of CO emissions for different regions for the year 2005: it indicates that, for some regions, there are very large differences between the minimum and maximum values reported by different countries. This figure also shows that, while China displays the largest emissions, more studies are needed also for other regions where emissions have reached very large amounts, such as Africa and the rest of Asia.
Figure 3.3.a (left). Comparisons of the emissions of CO for China from 1980 to 2010, as provided by different inventories. Figure 3.3.b (right). Minimum, average and maximum CO emissions provided by different inventories in 2005 for different regions of the world. Similarly to European emissions, ship emissions have increased significantly during the past years also at the global scale. During a workshop gathering European and international experts on ship emissions organized by MACC-II, discussions on available data on shipping routes in Europe and worldwide were discussed. Different systems based on different types of data exist: local data concerning harbour arrival/departure times are available, sometimes in combination with local recording of other ancillary data: these data are, however, not directly suitable for regional or global applications.
A comparison has started, focusing on two global inventories providing emissions from shipping, the MACCity and EDGAR v4.2 inventories. Preliminary results of the comparisons are displayed in Figure 3.4, which shows the global total emitted by ships (seas only) in the MACCity and EDGAR v4.2 datasets. This figure highlights some of the problems encountered when comparing different inventories providing ship emissions. The lower values found in the EDGAR inventory could be due to the fact that the sectors provided by both inventories are not the same, i.e. "International shipping" in MACCity is different from "non-road transportation" in EDGAR. Emissions in harbours might therefore not been taken into account in the same way in both datasets. This issue shows that a detailed comparison of

MACC-II Final Report – October 2014
31 / 137
emissions from shipping needs to include much more details, and requires detailed geographical data and more information on the way sectors are considered in inventories.
Figure 3.4. Comparisons between SO2 and NOx emissions from shipping from the MACCity and EDGAR v4.2 emissions inventories.
4. Natural emissions of hydrocarbons Emissions of hydrocarbons from vegetation play a significant role in the determination of the concentration of several pollutants at both the global and regional scales. They play a large role in the determination of the OH radical concentrations in many regions of the world, and they are also precursors of organic aerosols.
Within MACC-II, a global dataset, called MEGAN-MACC, providing emissions of biogenic hydrocarbons was developed. The emissions were calculated by applying the MEGAN model (Model of Emissions of Gases and Aerosols from Nature) at the global scale. MEGAN is an up-to-date modeling tool for estimation of emissions from natural sources. The MEGAN-MACC dataset provides emissions of the main biogenic VOC species (22 compounds), which include isoprene, monoterpenes, sesquiterpenes, methanol, other oxygenated VOCs and carbon monoxide. The mean annual amount emitted for all listed biogenic VOCs reaches 760 Tg(C) yr−1 with isoprene accounting for 70 %, the sum of monoterpenes for 11%, methanol for 6% and other VOCs for 14% of the total biogenic VOC emissions.
Emissions are available at a 0.5 x 0.5 degree horizontal resolution on a monthly basis from 1980 to 2010. The zonal average of the MEGAN-MACC isoprene emissions for the period of January 1980 to December 2010 is shown in the top panel of Figure 3.5. The temporal profile of global monthly emission totals is presented in the mid panel, while the bottom panel shows inter-annual variability of isoprene annual global totals. As shown in the figure, isoprene is mainly emitted in the south-tropical region, which contributes about 56% to the global total, followed by northern tropics (32 %) and northern and southern temperate regions contributing with 7% and 4%, respectively. Less than 1% of global isoprene is emitted in the Arctic.

MACC-II Final Report – October 2014
32 / 137
Figure 3.5: Zonal averages of monthly mean isoprene emissions (mg m−2 day−1) (top panel), temporal profile of isoprene global monthly totals (Tg month−1) (mid-panel), global annual totals of isoprene (Tg yr−1) (bottom panel) for the period of 1980–2010 from the MEGAN-MACC dataset.
3.4 Pilot study: an inverse modelling system of carbon monoxide Within MACC-II, the possibility of developing an inverse modeling system of carbon monoxide was investigated. CO surface emissions at the global and regional scales are provided by the MACCity dataset, based on statistical information provided by countries and international reports. Providing CO from an inversion system would give another determination of emissions of this compound using satellite inversion, and thus allow a better understanding of the current knowledge on surface emissions.
The CO inversion system has benefited from the robust infrastructure that has been built for greenhouse gases in GEMS/MACC/MACC-II. Tests have shown that the CO inversion could be run operationally, even in near real time (NRT). Its computations are just more expensive, by about 4-fold, because it addresses four chemically-related tracers at once (CH4, HCHO, CO and methyl chloroform) rather than one (CO2).
It was shown that, since CO global average lifetime is a couple of months in the troposphere, it is particularly difficult to reliably monitor CO emissions in NRT from satellite column measurements. Indeed CO columns integrate molecules of various ages (up to a few months) that can only be disentangled with the analysis of such data over at least a few weeks. The assimilation of surface concentrations close to the sources is less problematic in this respect, at the price of large errors in the representation of gridded values and of a regional focus rather than a global one.
It was also shown that CO concentrations inform about CO emissions in an ambiguous way: the significant lifetime of CO convolves this information with atmospheric transport information, while the role of CO in atmospheric chemistry also convolves it with information about CO atmospheric production and loss. Disentangling the various signals to extract the specific emission signal requires assimilating other measurements, like HCHO

MACC-II Final Report – October 2014
33 / 137
observations, often relying heavily on prior information. The analysis of the uncertainty in the various input data will result in significant uncertainties in the inverted CO emissions, with likely biases.
The inversion product could be tailored to bring it closer to the needs of some users, like the inventory developers. Currently, the analysis of the differences between inventories and inverted emissions is not conclusive due to the large uncertainties in the different methodologies to quantify emissions. The inversion system could also be extended to the optimization of uncertain parameters of the emission models used in the inventories, like emission factors. Lastly, reducing the uncertainty on the inverted emissions implies reducing the uncertainties in OH and an improved OH field would be very valuable for the chemistry community.
Technically, it is possible to bring a CO inversion system into production, either in NRT or in delayed mode, in the course of MACC-III. Given the current uncertainties in the inverted CO emissions, that are even larger in the case of NRT estimates, this investment seems premature. The top-down approach mathematically links the inventories with the atmospheric data and we recommend that this link be reinforced. The challenges for CO inversion such as the uncertainty in OH or the biases in the satellite retrievals will be addressed by other components of the Atmospheric Service. We therefore recommend exploiting the potential synergies between CO flux inversion and the CO forward modelling and data assimilation at ECMWF.
3.5 Access to the EMI datasets through the ECCAD database All the datasets developed as part of EMI are publicly available through the ECCAD (Emissions of atmospheric Compounds & Compilation of Ancillary Data) database, such as the most recent updates of the MACCity global emissions, the TNO-MACC regional emissions, and the GFAS fire emissions. The MEGAN-MACC natural emissions have also been included in ECCAD.
EMI has also worked with the MACC-II GRG sub-project for the development of a remote access to the files in the database: the first step for this work was undertaken, with the ECCAD database being now a client for the WCS Jülich server.
The ECCAD database, which delivers the MACC-II emissions datasets had less than 300 regular users from Europe and from several countries when MACC-II started. The number of ECCAD users has increased dramatically during MACC-II, and has now reached 1608 users from 664 world institutions. This indicates that the emissions products developed as part of MACC-II are now widely used, in Europe and in the rest of the world.

MACC-II Final Report – October 2014
34 / 137
4. Fire data assimilation (FIR) The FIR subproject provides global estimates of smoke constituent fluxes from open biomass burning, e.g. forest fires, savannah fires, agricultural waste burning. These estimates are provided in near real time (NRT) and retrospectively to all atmospheric modelling systems of MACC-II and a growing user base outside the project. They constitute boundary conditions for atmospheric analyses and forecasts that complement the information from satellite data assimilation and are essential for the accuracy of air quality forecasts during burning episodes (e.g. Huijnen et al. 2012, Poupkou et al. 2014). Satellite-derived Fire Radiative Power (FRP) observations are available from the MODIS and SEVIRI instruments as input for the fire emission calculation. FIR has produced additional FRP products from the GOES-East/-West satellites. The NRT production chain of FIR has been moved completely to operational infrastructure during MACC-II. Its status at the end of the project is sketched in Figure 4.1.
Figure 4.1. FIR NRT production chain FIR has performed a comprehensive assessment of the fitness-for-purpose of its NRT production (D31.2; Andela et al., 2013). Its further development and research activities have been guided by the assessment and documented in D32.1 / (Kaiser et al., 2013). See 4.6 for URL links.
4.1 NRT production of emissions with GFAS The NRT production of fire emission estimates is performed with the Global Fire Assimilation System (GFAS, Kaiser et al. 2012). In addition to the version 1.0, which was developed in the MACC project, three updated versions have been run in real time:
• GFASv1.0 produces daily global fire emission fields with 0.5° resolution based on NASA’s FRP products from the MODIS instrument with a timeliness of 7 hours.
• GFASv1.1 performs the same processing with 0.1° resolution. • GFASv1.2 additionally provides injection height information calculated with a 1-d plume
rise model, incorporates several optimisations and a minor bug fix. • GFASv1.2-early-delivery is an unofficial version that makes daily fire emission over
Europe valid on the day of production available to the European air quality forecasting systems of MACC-II at 20:30 UTC.

MACC-II Final Report – October 2014
35 / 137
GFASv1.2 has been implemented on operational infrastructure at ECMWF and is planned to become the main production stream in the near future.
FIR has also run a NRT version of GFAS with 1-hour time resolution and FRP input from the geostationary GOES-West satellite in support of the SAMBBA field campaign.
Validation of GFASv1.0 in the scientific literature summarised in Table 4.1. The results are rather diverging. However, a tendency to underestimate CO by around 20% is visible. For aerosols, major underestimation has been observed and an enhancement factor of 3.4 has been derived (Kaiser et al. 2012) and is now being used in AER and the wider community. Interestingly, the FRP-based approach in GFAS appears to be particularly stable for extreme fire events and other un-expected cases: For example, GFAS was not developed for tundra fires, but it is in agreement with the in-situ study reported by Mack et al. (2011).
Table 4.1 Overview of validation case studies. The colors correspond to the different fire events that were used (Andela et al. 2013).
Location & year Reference Species Emission estimate1
GFAS v1.0 estimate
Difference2
(%) Russia (20/07-15/08/2010)
Huijnen et al. (2011)3 CO
15.64 Tg 17.18 Tg
12.2 Tg -22% -29%
Russia (20/07-15/08/2010) Huijnen et al. (2011)4 CO
15.25 Tg 61 Tg
12.2 Tg -20% -80%
Russia (20/07-15/08/2010) Huijnen et al. (2011)3 NO2
79 Gg 85 Gg
71 Gg -10% -15%
Russia (20/07-15/08/2010) Huijnen et al. (2011)4 NO2
91 Gg 95 Gg
71 Gg -22% -25%
Russia (20/07-15/08/2010) Huijnen et al. (2011) AOD n.a. n.a. -28% / +12% Russia (June-August 2010) Krol et al, (2013) CO 22 Tg
27 Tg 13.31 Tg -39%
-51% Russia (June-August 2010) Konovalov et al. (2011) CO 10 Tg 13.31 Tg +33% Russia (June-August 2010) Yurganov et al. (2011) CO 34 Tg
40 Tg 13.31 Tg -61%
-67% Russia (June-August 2010) Fokeeva et al. (2010) CO 29.8 Tg
36.1 Tg 13.31 Tg -55%
-63% Russia (June-August 2010) Fokeeva et al. (2010) CH4 1.6 Tg
1.9 Tg 1.21 Tg -24%
Russia (June-August 2010) Kaiser et al. (2012) AOD n.a. n.a. -71% (x 3.4) Greece (25/08/2007) Coheur et al. (2009) NH3 40 Gg 2.4 Gg -94% Greece (25/08/2007) Coheur et al. (2009) C2H4 6.5 Gg 2.8 Gg -57% Greece (25/08/2007) Coheur et al. (2009) CH3OH 7 Gg 4.8 Gg -31% Greece (25/08/2007) Turquety et al. (2009) CO 336 Gg
348 Gg 417 Gg +24%
+20% Alaska & Canada (June-August 2004)
Pfister et al. (2005) CO 30 ± 5 Tg 23.44 Tg -22%
Alaska and Canada (June-August 2004)
Turquety et al. (2007) CO 30 Tg 23.44 Tg -22 %
Alaska (2007) Mack et al. (2011) C 2.1 ± 0.4 Tg 1.7 Tg -19% Siberia (2003) Huang et al. (2009) C 401 Tg
684 Tg 217.75 Tg -46%
-68% 1Emission estimates from validation studies. Two emission estimates for one specific case study correspond to different model assumptions or hindcast days.

MACC-II Final Report – October 2014
36 / 137
2 Difference (%) in emission estimates between GFAS and validation study estimates, as a percent of validation study estimates: Positive numbers indicate that GFAS is higher than study estimates and vice versa. 3 Satellite-based comparison. 4 Ground-based comparison. Following requests from GFAS users in the atmospheric modelling sub-projects of MACC-II, (Andela et al., 2013) recommended, amongst others, to include injection height information in GFAS. Following the major new developments outlined in (Kaiser et al., 2013), GFASv1.2 is now able provide the product, and it is being tested in the AER, GRG and GHG sub projects. The product is illustrated in Figure 4.2.
Figure 4.2. Aqua, maximum FRP (in MW) of fire that emit more than half of their emissions above the boundary layer, daytime fires above (9 to 21 local time), night-time fires below (21 to 9 local time). For June-July 2013 (Kaiser et al. 2013).
4.2 Real-time data provision: Satellite FRP Throughout the MACC-II, FIR has generated FRP products from the GOES-East and GOES-West observations in native satellite resolution in real time. The products are derived from the satellite radiance products acquired from UCAR and the operational meteorological forecasts acquired from ECMWF. The production was transferred from a scientific environment at KCL to the operational environment at IPMA during MACC-II. Both FRP and radiances are archived at IPMA. The FRP products are also archived at ECMWF and disseminated on a public ftp server at IPMA. The IPMA products are described in “Fire Radiative Power – GOES Product User Manual” (Trigo et al., 2014; Deliverable D32.1).
GFASv1.2 is providing access to the FRP observations of the MODIS, SEVIRI and GOES instruments in the value-added form of gridded, hourly FRP and detection opportunity fields for each individual satellite.

MACC-II Final Report – October 2014
37 / 137
The gridded GOES FRP products were provided to the SAMBBA team in support of their flight planning during the 2012 campaign, as depicted on Figure 4.3.
Figure 4.3. Combustion rate in a GFAS version with 1 hour resolution, that used FRP from GOES-East in support of the SAMBBA campaign.
4.3 Retrospective data provision: Global emissions Concerning retrospective emissions, FIR has extended GFAS back by three years to 2000, and contributed to the update of GFED3 for 2010 and 2011, and an upcoming update of the GFED inventory. The extended time series of the global time series are shown in Figure 4.4.
Figure 4.4. Monthly global carbon consumption by fires in GFED3 and GFASv1.0. The extension of GFAS has been achieved with a newly developed bias correction for the two different MODIS instruments (Remy & Kaiser 2014). This now also ensures resilience of the NRT production against failure of one of the MODIS instruments and prepares for the assimilation of observations by Suomi-NPP VIIRS and Sentinel-3 SLSTR.
4.4 Outreach FIR products are now used by the sub-projects AER, GRG, GHG, ENS, and EDA. FIR has collaborated closely with these, plus EMI and VAL, in order to assess the accuracy of GFAS and its suitability for air quality and atmospheric composition modeling. Furthermore, it is
only MODIS Terra
updated GFED3

MACC-II Final Report – October 2014
38 / 137
accessed by 7 users via the NRT dissemination, 63 users via the ECCAD database, an unknown number of users via the JOIN server, and 28 users by personal contact to the FIR team. The access statistics depicted in Figure 4.5 demonstrate the global reach and particular European interest in the FIR services.
Figure 4.5. Access statistics map for the FIR homepage http://atmosphere.copernicus.eu/fire The NRT extension of the GFAS time series is of recognised interest to the climate monitoring community. Thus, GFAS describes fire disturbance in NOAA’s annual State of the Climate reports since 2010 (Kaiser and van der Werf, 2010, 2011, 2012, 2013, 2014). Furthermore, GFAS is the only CDR for the ECV fire disturbance in EUMETSAT’s compilation of maturity matrices for EU’s CORE-CLIMAX project, and GFAS and GFED are both used as reference by ESA’s Fire CCI project.
FIR is represented in the GOFC-GOLD Fire IT, the Sentinel-3 validation team and the EUMETSAT Land SAF in order to liaise with the relevant satellite data providers. It is also represented in the GEIA steering committee and co-chairs the Interdisciplinary Biomass Burning Initiative (IBBI) of WMO, IGAC and iLEAPS. This enables communication of research needs into the wider scientific community and tapping into relevant project-external research results at an early stage.
Occasional contacts are maintained with the JRC EFFIS and the Global Fire Monitoring Centre (GMFC, http://www.fire.uni-freiburg.de) in order to ensure complementarity of the developments and capitalise on upcoming opportunities for synergies.
4.5 Key deliverables
# Title Type Provider Access information D31.1 NRT production of
GFAS emissions daily data service for previous day
ECMWF http://atmosphere.copernicus.eu/fire
D31.4 NRT production of FRP from GOES-E/-W
data service within 3 hours of observation
IPMA http://atmosphere.copernicus.eu/about/project_structure/input_data/d_fire/lit/MACCII_FRP_GOES_v04.pdf
D31.3 retrospective fire emissions
data since 1997 (GFED) / 2000 (GFAS)
VU Amsterdam / ECMWF
http://www.globalfiredata.org / http://atmosphere.copernicus.eu/fire
D31.2 Assessment of GFAS report http://old.ecmwf.int/publications/library/do/references/show?id=90747
D32.1 Recommended fire service enhancement
report http://old.ecmwf.int/publications/library/do/references/show?id=91044

MACC-II Final Report – October 2014
39 / 137
5. Global greenhouse gases (GHG) The GHG subproject of MACC-II managed and consolidated the GHG processing chain designed and built in the course of GEMS and MACC. This pioneer service, now brought to a pre-operational level, goes from series of atmospheric observations of CH4 and CO2 to global 4D concentration fields and 3D flux fields of these species. It has been relying (i) on the ECMWF 12-h 4D-Var to analyse the GHG concentrations in an optimal way, and (ii) on two long-window (from months to decades) variational inversion schemes to extend the analysis to the surface fluxes. This two-tier approach allows the 4D concentrations to be analysed at much higher global spatial resolution (<2,000km2) than the fluxes (>10,000km2). Further it guarantees some consistency with the analysis of the other species within the broad MACC-II service. The development of the GHG processing chain in MACC-II included the addition of high-resolution medium-range forecasts of CH4 and CO2, and of the analysis of the N2O fluxes, as reported below.
5.1 Observations The GHG processing chain exploits a large variety of observations from the very accurate but sparse surface measurements to the global satellite observations of the vertical column. The constraints on accuracy and precision for GHG measurements are much more stringent than for species that have not accumulated in the atmosphere: by default these data are therefore available only in research mode, i.e. months or years after the acquisition of the raw data. The MACC/MACC-II service has pioneered a much faster processing in order to monitor the GHGs closer to NRT.
Table 5.1. List of contributing observatories to MACC-II. Tower stations are multi-level sites.
Observatory Country Acronym Type Species Biscarosse France BIS Mast CO2/CH4 Cabauw Netherlands CBW Tall tower CO2/CH4 Ivittuut Greenland IVI Mast CO2/CH4 Lamto Cote d’Ivoire LTO Mast CO2/CH4 Mace Head Ireland MHD Mast CO2/CH4 Observatoire Pérenne de l’Environnement
France OPE Tall tower CO2/CH4/CO/N2O
Puijo Finlande PUJ Mast CO2/CH4 Puy-de-dome France PUY Mast CO2/CH4 For MACC-II, a NRT delivery (24 hour delay, once a day) of surface CO2 and CH4 measured at eight observatories in Europe, Greenland and Africa (Table 5.1), managed by the Integrated Carbon Observation System (ICOS), was set up by the ICOS Atmospheric Thematic Centre (ATC, located at LSCE/CEA). This NRT data goes through automatic calibration (with back traceability to the WMO international scale) and quality control (QC) procedures. Effort has been made to design an efficient and robust data protocol delivery for MACC-II, with file formats based on NASA AMES convention. The metadata is WMO compatible. These NRT data are also reprocessed at a slower pace with a manual QC to form homogeneous longer

MACC-II Final Report – October 2014
40 / 137
(months or years) datasets. Because of their high accuracy, the various ICOS in situ datasets have been serving for independent validation of the various MACC-II GHG products. However, the current 4D-Var system is not able to keep the benefit of analysis increments generated from the assimilation of surface in situ data beyond the 12-h length of the 4D-Var assimilation window. A weak-constraint formulation of the 4D-var, with a parametric formulation of the model error, is being considered to address this issue in the future.
Column or partial column measurements do not pose similar difficulties and satellite retrievals of such quantities have formed the backbone of the GEMS/MACC/MACC-II GHG service. MACC-II has been considering both satellite measurements in the thermal infra-red spectral domain, with peak sensitivity in the middle troposphere (IASI) and measurements in the solar infra-red domain (ENVISAT/SCIAMACHY, GOSAT/TANSO) with a more uniform sensitivity to GHGs throughout the atmospheric column, including the boundary layer.
The loss of the ENVISAT satellite in April 2012 speeded up the transition from ENVISAT/SCIAMACHY to GOSAT/TANSO within this part of the MACC-II service. For the production of CO2 total column retrievals, IUP-UB has adapted the algorithm that they had been using for ENVISAT/SCIAMACHY to GOSAT/TANSO. This included adding a fit window in the strong CO2 band at about 2 µm, and using a high resolution synthetic solar spectrum. The first delayed-mode delivery of these new retrievals was achieved in May 2013 and the following deliveries have been made on a monthly schedule while regular improvements were brought to the algorithm in parallel. Figure 5.1 shows an overview of the entire XCO2 time series generated with the latest version of the algorithm together with other datasets for comparison. For CH4 retrievals, SRON has similarly delivered ENVISAT/SCIAMACHY retrievals and, from October 2012 onward, GOSAT data using the same “proxy method” on a monthly schedule without any major issues. Figure 5.2 illustrates the evaluation of the GOSAT CH4 retrievals with the reference TCCON data.
Figure 5.1. XCO2 time series from SCIAMACHY/ENVISAT (black) and TANSO/GOSAT (green) as retrieved using the BESD retrieval algorithm developed at IUP, Univ. Bremen (IUP-UB). The satellite retrievals are compared with TCCON surface observations (red) at 2 TCCON sites: Lamont, USA (top) and Darwin, Australia (bottom). Quantitative comparison results in terms of correlation coefficient (r), mean bias (Δ) and standard deviation of the difference (σ) are shown in the bottom right of each panel.

MACC-II Final Report – October 2014
41 / 137
Figure 5.2. Comparison of TCCON XCH4 produced by SRON vs GOSAT XCH4 for the 12 different TCCON stations. There is a small residual bias of -1.52 ppb remaining and the standard deviation of the differences is 15.87 ppb.
The same pace of monthly production and delivery was followed for Metop-A/IASI. Figure 5.3 shows the full time series of this data until the last delivery within MACC-II. Preliminary testing of MetOp-B/IASI retrievals has been conducted, showing consistent products between the two IASI instruments.
Figure 5.3. Time-latitude monthly evolution over August 2007-May 2014 of mid-tropospheric CH4 column as retrieved from IASI onboard Metop-A by CNRS/LMD. Exceptionally, the three satellite data streams have been reorganised and further developed by each delivering partner for a NRT processing (D+4 instead of M+5) during a short test period in January 2014. The success of this demonstration exercise has paved the way for a NRT delivery of GHG satellite retrievals (D+4) within MACC-III. Subsequent automation of the production chain and further testing have been performed by the three data providers

MACC-II Final Report – October 2014
42 / 137
SRON, IUP-UB and CNRS/LMD within the last months of MACC-II, so that the NRT delivery could be achieved at the beginning of MACC-III.
5.2 Design of the forecasting system for GHGs Throughout MACC-II, ECMWF has worked towards the provision of an operational high resolution CO2 and CH4 forecast, which has the same high-resolution as the operational NWP (16 km at the surface and 137 vertical layers). Compared to a low resolution (e.g., 80 km and 60 layers), the high resolution shows significant benefits both in terms of simulated transport, particularly over mountains and coastal regions, and in terms of simulated fluxes, close to areas of strong anthropogenic sources. However, the high resolution necessitates the implementation of a localized tracer mass fixer in order to conserve the CO2 and CH4 global mass in the IFS semi-lagrangian advection scheme while avoiding biasing the inter-hemispheric gradient. The CO2 and CH4 forecasts now run daily in a pre-operational mode. The initial conditions for the meteorological parameters are obtained from the operational ECMWF analysis and the atmospheric CO2 and CH4 fields are cycled from a one-day forecast to the next, i.e. they are free-running. The near-term plan is to re-initialize the CO2 and CH4 fields with a 4D-Var analysis once the satellite retrievals are available in NRT. Surface fluxes are provided by climatologies in the case of CH4 and by the online CTESSEL carbon module (implemented in the IFS within the FP7 Geoland-2 project) for CO2. The absence of observational constraints allows the flux errors to accumulate over time in the atmosphere, resulting in global biases of the order to 3 ppm for CO2. A bias correction is therefore being prepared that re-scales the fluxes by comparing 10-day budgets for different vegetation types with the same budgets from a climatology of the MACC-II optimized fluxes.
At the beginning of MACC-II, the delayed-mode (M-5) 4D-Var analysis of CO2 that assimilated AIRS and IASI radiances only, was flawed with biased due to the modest information content about CO2 of such data. Within MACC-II, the assimilation of TANSO/GOSAT CO2 column data was initiated and, starting on 1 January 2013, the delayed mode system started to provide an analysis of CO2 based on these products. For CH4, the delayed-mode 4D-Var analysis initially relied on ENVISAT/SCIAMACHY, but the performance of the instrument was already deteriorating at that time. With the loss of the ENVISAT in April 2012, a new flexible observation operator was developed and the transition from ENVISAT/SCIAMACHY to GOSAT/TANSO and METOP/IASI was studied: an improvement in the quality of the analysis was actually demonstrated with TANSO, and with the combination TANSO+IASI, compared to SCIAMACHY. The new observation operator allows assimilating current and past satellite products (e.g. those from ESA’s GHG CCI) as well as future products (e.g. those of OCO-2).
The 4D-Var system was further improved for GHGs, in particular its background error covariance matrices. Posterior diagnostics were applied to optimise the standard deviation of these errors. An ensemble of data assimilations (EDA) was also implemented to better estimate the background error covariances. This required several adjustments to the default EDA of the ECMWF system, like adding a perturbed component to the fluxes. ULEIC has assessed biases and random errors for GOSAT/TANSO and ENVISAT/SCIAMACHY CH4 column products by comparing them with the ground-based TCCON column data for 12 ground-based TCCON sites. Based on the comparisons between these satellite data and TCCON

MACC-II Final Report – October 2014
43 / 137
observations, a bias correction scheme has been developed based on linear regressions. For Metop-A/IASI CH4, the data coverage is much denser compared to the coverage of the GOSAT/TANSO data. Diagnostics run by ECMWF on the Metop-A/IASI data showed some correlation of the error between observations. The typical length-scale of the error correlation was found to be larger than the size of the model grid cells. To account for this, the correlation of the observation error was specified within the assimilation system and the first results showed an improvement in the use of the Metop-A/IASI data.
Last, a special effort has been devoted to the scientific documentation of the GHG forecasting system with the writing of two papers (Agustí-Panareda et al., 2014; Massart et al., 2014) and of a series of MACC-II publicly available reports.
5.3 Surface flux inversions 5.3.1 CH4 Regular updates of the global CH4 flux inversions have been provided by JRC every 6 months (for period ~7-13 months before real-time). These “Delayed-Mode” CH4 inversions use generally both satellite and surface observations. For the inversions until the end of 2011, satellite retrievals from ENVISAT/SCIAMACHY were assimilated. GOSAT XCH4 retrievals were used afterwards. For both data sources, a polynomial bias correction (2nd order polynomial as a function of latitude and month) is applied. This bias correction is constrained by the surface observations in the remote atmosphere (from the NOAA/ESRL global cooperative air sampling network), which measure the latitudinal gradient of the background atmosphere with high accuracy. The impact of the different satellite data streams for the period 2010-2011 has been studied (Alexe et al., 2014), showing overall relatively consistent flux adjustment patterns, particularly across Equatorial Africa and North America, but differences over South America and India (Figure 5.4).
Figure 5.4. Comparison of derived global CH4 emissions using the GOSAT/TANSO (RemoteC proxy v2.0) XCH4 retrievals (top) and using ENVISAT/SCIAMACHY retrievals (IMAPv55) (bottom) (Alexe et al., 2014); the figure shows 2010-2011 average CH4 emissions (left) and difference compared to a reference inversion using only NOAA surface observations (right).

MACC-II Final Report – October 2014
44 / 137
The MACC CH4 inversion reanalysis over the period 2003-2010 has been further extended until end of 2012 (Bergamaschi et al., 2013), with ENVISAT/SCIAMACHY assimilated only until 2011. As for 2007-2010, higher global CH4 emissions in 2011-2012 are derived compared to 2003-2005. Most of the emission increase was found in the tropics and in the mid-latitudes of the northern hemisphere, while no significant trend was derived for Arctic latitudes (Figure 5.5).
Figure 5.5. Extension of the reanalysis of the global CH4 emissions until end 2012: CH4 inter-annual variation of total CH4 emissions derived from the different inversions. The variations are shown relative to the average emissions during the reference period 2003-2005 (12-month running mean values). 5.4.2 CO2 For CO2 flux inversion, LSCE has tested the assimilation of GOSAT/TANSO CO2 column retrievals made by various groups (ULEIC, SRON, NIES and NASA). Some of these results have been published in collaboration with the Univ. of Edinburgh (Chevallier et al. 2014). Despite obvious improvements of the retrieval quality over time, it was found that these data have still not reached a sufficient quality for routine exploitation for flux inversion and that, as of today, this part of the service has still to rely on the global surface monitoring network. Since its backbone is the NOAA flask measurements, that are made available each year in summer for the year before, the pace of delivery has to be slower than initially hoped. LSCE has therefore put the emphasis on the length of the inversion window, developing (in partnership with the French PREVASSEMBLE project) a novel parallelisation of the inversion (Chevallier 2013). The outcome was the successful processing of the 1979-2011 measurement archive (MACC CO2 inversion v11.1) within three weeks only after the NOAA flask data for 2011 had been made available. The CO2 flux inversion has been updated by LSCE in May 2013 (with all 33 years reprocessed, this was v11.2), including data made available after the previous release and the addition of an outer loop for the minimization of the cost Bayesian function. Its quality has been monitored by comparison of its error

MACC-II Final Report – October 2014
45 / 137
statistics to CO2 column retrievals from TANSO-GOSAT and by comparison of the posterior atmospheric simulation to various independent column and in situ measurements. The extension to year 2012 (v12.2) was first released in October 2013 and updated in January 2014, again with all years reprocessed each time. The update included a doubling of the number of vertical layers in the underlying LMDZ transport model (from 19 to 39) and thinner grid boxes in latitude (from 2.5o to 1.9o). The extension to year 2013 was released in July 2014 (v13.1, see Figure 5.6), in time to contribute to the annual update of the Global Carbon Project. This continues the pace of two releases per year, with a longer period consistently analysed each year.
Figure 5.6. Time series of the inverted natural net CO2 fluxes over land aggregated at the annual and continental scale (v13.1). 5.4.3 N2O Finally, a demonstration product has been introduced in MACC-II for N2O, the third more important GHG of anthropogenic origin: a 12-year (1998-2009) atmospheric inversion was released in November 2012 by NILU. It was based on the assimilation of air mole fraction records from 70 N2O sites plus ship-based and ocean mooring records from NOAA, AGAGE, NIES and Tohoku University and uses an extension of the inversion system designed for CO2. This inversion has been extended to years 1996-2011 in November 2013.

MACC-II Final Report – October 2014
46 / 137
6. Advances in the analysis and forecasting of global reactive gases (GRG) The end of MACC-II almost coincides with an important change in the operational configuration of the global data assimilation and forecasting system: the coupled IFS-MOZART model will soon be replaced by a first version of the Composition-IFS-TM5 (C-IFS-TM5) model, which has all chemical parameterisations directly built into the Integrated Forecasting System. This marks an important milestone in the development of a sustainable operation atmospheric monitoring service, because C-IFS is computationally much more efficient than the coupled model set-up, it offers better consistency between physical and chemical parameterisations, and it can be run in much finer resolution. All three chemistry transport models – MOZART, MOCAGE, and TM5 – have been implemented into C-IFS and are technically running. C-IFS-TM5 has undergone extensive validation for more than a year, and the results are re-assuring: usually C-IFS-TM5 performs better than the older IFS-MOZART, and, at least in the troposphere, it rarely yields results that are worse. Thus, the global reactive gases subproject accomplished its primary objective besides continuation of the existing services and provides a robust update to the global MACC system
The GRG sub project accomplished all of its deliverables, mostly without delays, and it produced several peer-reviewed publications and conference contributions. The following sections describe the major achievements in the main elements of the GRG service line: satellite data processing and data assimilation (section 6.1), stratospheric ozone analyses and forecasts (section 6.2), global tropospheric analyses and forecasts (section 6.3), and user interaction and data dissemination (section 6.4). The latter theme is of course closely related to activities in the INT and GDA sub projects.
6.1 GRG satellite data processing and data assimilation
During MACC-II the MACC o-suite underwent several IFS model cycle updates (see GDA report). Table 6.1 lists the data sets that were actively assimilated in the operational MACC data analysis (o-suite) and highlights those that were newly introduced during MACC-II. In addition, GOME-2 NO2 and SO2 data from Metop-A and Metop-B, formaldehyde columns from GOME-2 on Metop-A, and CO total columns from IASI on Metop-B were passively monitored.
Improvements in the satellite data sets and in the data assimilation operators led to noticeable enhancements of the GRG analysis skills. As an example, Figure 6.1 shows the improvement of the MACC o-suite over time with respect to the ozone sondes launched from Neumayer station, Antarctica, measured as the “Common area fraction score (CAF)”,which indicates how well the analysis profile fits the observation profile, and is computed as follows:
CAF = ∫min([O3(observation)(p)O3(model)(p)])dp5 hPa
1000 hPa
∫ max([O3(observation)(p)O3(model)(p)])dp5 hPa1000 hPa
where the integral is computed over the observation and model common vertical pressure grid, and O3(observation) and O3(model) are the observation and model ozone profiles at the observation location. A CAF value of 1 denotes a perfect fit.

MACC-II Final Report – October 2014
47 / 137
Table 6.1. Satellite retrievals of reactive gases that are actively assimilated in the MACC o-suite. Data that were newly activated during MACC-II are highlighted in blue.
Instrument Satellite Provider Version Type Status
GOME-2 Metop-A DLR GDP 4.7 O3 columns 20131210 -
GOME-2 Metop-B DLR GDP 4.7 O3 columns 20140512 -
MIPAS Envisat ESA V6 O3 Profiles 20111206 - 20130408
MLS AURA NASA V02 O3 Profiles 20090901 - 20130107
MLS AURA NASA V3.4 O3 Profiles 20130107 -
OMI AURA NASA V883 O3 Total column 20090901 -
SBUV-2 NOAA NOAA V8 O3 6 layer profiles 20090901 - 20131006
SBUV-2 NOAA NOAA V8 O3 21 layer profiles 20131007 -
SCIAMACHY Envisat KNMI TOSOMI V2.0
O3 total column 20090916 - 20120408
IASI MetOp-A LATMOS/ULB - CO Total column 20090901 -
MOPITT TERRA NCAR V4 CO Total column 20120705-20130128
MOPITT TERRA NCAR V5-TIR CO Total column 20130129-
OMI AURA KNMI DOMINO
V2.0
NO2 Tropospheric column
20120705 -
OMI AURA NASA v003 SO2 Tropospheric column
20120705 -
The timeseries shows how changes in the model and in the data usage led to a better ozone analysis. However, Figure 6.1 also indicates the general problem of the model to represent the ozone field during the Antarctic ozone hole correctly. Every year the scores at Neumayer are lowest during Austral spring. This problem is due to a combination of a model bias (the free running IFS-MOZART system does not reproduce the low ozone values observed over Antarctica) and the lack of profile data in the assimilation and is discussed in more detail elsewhere (e.g. Flemming et al. 2011; Inness et al. 2013, Lefever et al. 2014). Even though MLS ozone profiles have always been assimilated in the MACC o-suite since 2008, until January 2013 the useful range of the NRT MLS data V02 was limited to above 68 hPa, i.e. the data could not help to correct the model’s ozone biases further down. MLS V3.4 data extended the useful range down to 261 hPa, which led to a considerable improvement in the ozone scores during the ozone-hole season. Nevertheless, with the current fleet of Earth-observing satellites, issues remain with respect to the poor sensitivity of many data products in the troposphere, and in particular in the planetary boundary layer. It remains to

MACC-II Final Report – October 2014
48 / 137
be seen how new satellite missions, such as the geostationary Sentinel-4, can improve this situation in the future.
Figure 6.1. Time series of the common area fraction score computed for the Neumayer station (8.3⁰W, 70.7⁰S) in the Antarctic for the MACC NRT analysis.The figure shows the time evolution of the MACC NRT-system from IFS CY32R3 (EXPVER=f1kd, blue), via IFS CY36R1 (EXPVER=f93i, green) to IFS CY37R3 and CY38R2 (EXPVER=fnyp, red).
Various research activities were undertaken with respect to enhancing the data assimilation capabilities for reactive gases. Among others, tests were run on the assimilation of ozone radiances instead of retrieval products, and the use of IAGOS aircraft data in the assimilation was explored.
Figure 6.2. Variability of MACC MOZART reanalysis derived daily AMFs for NO2 retrievals in January 2003 (left) and July 2003 (right). Shown is the ratio between the largest and smallest AMF found for each pixel.
The potential of using MACC-II GRG fields (analysis and forecast) as a priori has been evaluated for two different steps in the retrieval of tropospheric NO2 columns from UV/vis satellite sensors. Firstly, simulated stratospheric NO2 columns were applied to GOME-2 satellite data for separating tropospheric columns from the signal. Secondly, simulated vertical NO2 profiles were used to calculate air mass factors for deriving tropospheric NO2 columns from the satellite data. MACC-II data are indeed well suited for both purposes. However, smaller model time steps are needed for stratospheric correction of satellite data

MACC-II Final Report – October 2014
49 / 137
and the low bias problem in some runs needs to be solved. The day-to-day variability of computed air mass factors (see Figure 6.2 as an example from the MOZART reanalysis) shows variations of up to a factor of two within a single month, mainly over outflow from continents and over biomass burning regions. This is similar to results that were obtained with other model systems. In the future, higher spatial resolution of model fields and input data will be needed to match the abilities of the next generation of satellite instruments (e.g. S5P, S5, S4) which will have ground pixels on the order of 7 x 7 km2.
6.2 Stratospheric ozone analyses and forecasts MACC-II operates an ensemble of three data assimilation systems for stratospheric ozone and in addition produces a long-term reanalysis of total column ozone. The stratospheric models include multi-species assimilation and their results are easily accessible at http://www.gmes-stratosphere.eu/. MACC-II stratospheric data products form an important regular contribution to the WMO/GAW ozone bulletins.
In order to investigate to what extent differences between the three stratospheric systems are due to different chemical parameterisations, offline simulations in chemistry-only mode were run by MOZART, BASCOE and SACADA. The analysis focused on species linked to ozone depletion, i.e., active chlorine, bromine and nitrogen compounds and their respective reservoirs. In the lower stratosphere, differences in ozone mixing ratios reach 20% after 30 days of integration (see Figure 6.3 below). In the upper stratosphere, ozone differences are larger, probably due to different photolysis rates, especially at high zenith angles. The models’ parameterizations of liquid and solid particles strongly influence results in the winter polar latitudes. The findings underline the need to review the calculation of photolysis rates and the models’ liquid/solid phase chemistry. The results from this study will help development of the future C-IFS systems with full stratospheric chemistry.
Figure 6.3. Zonal mean ozone differences between MOZART-BASCOE, MOZART-SACADA and BASCOE-SACADA on July 30, 2011, after a 30 days-run with chemistry only.
The wind fields delivered by the dynamics component of MACC (IFS) are also a possible cause for errors in modelling stratospheric composition - especially with respect to ozone in

MACC-II Final Report – October 2014
50 / 137
the lower stratosphere. This issue was investigated through offline experiments using the BASCOE Chemistry-Transport Model, allowing the evaluation and inter-comparison of three different analyses of wind fields: ERA-Interim, the ECMWF Operational analyses of 2008 (EC-OD), and the reanalysis MERRA by NASA GMAO.
Overall the results using the three winds fields are similar except in the polar regions and in the tropical lower stratosphere. The sensitivity to the driving wind fields is largest above the South Pole latitude band (90°S-60°S). During the wintertime Antarctic vortex, in the lowermost stratosphere (70-150 hPa), large ozone biases appear: the simulations driven by ERA-I and especially MERRA lead to a model underestimation of ozone, but not the simulation driven by EC-OD which keeps the same ozone bias during the formation of the polar vortex.
As shown in Figure 6.4, all three simulations underestimate ozone depletion but EC-OD allows the best simulation of ozone depletion. MERRA wind fields also allow some representation of Antarctic polar ozone depletion, but the simulation driven by ERA-I winds has much less vertical structure and cannot maintain an ozone minimum in the lowermost stratosphere during the whole ozone depletion event.
There is one obvious factor to explain the improved results with ECMWF-OD w.r.t. polar ozone depletion: it has better vertical resolution than both MERRA and ERA-I in this region of the lower stratosphere. The 60 levels used by ERA-I - and currently by C-IFS in MACC-II - have the coarsest vertical resolution. It is very probable that a finer vertical resolution would improve the analyses of stratospheric ozone by C-IFS, especially in the polar regions during the ozone depletion events. We note that test results with C-IFS-MOZART indicate a reasonable description of Antarctic ozone hole dynamics and chemistry, contrary to the old coupled IFS-MOZART set-up, where ozone depletion was always underestimated.
Figure 6.4. Ozone number density averaged over the South polar cap (90°S-60°S) on 1 June 2008 (left) and on 15 October 2008 (right). Green lines: CTM driven by ERA-I; blue lines: CTM driven by MERRA; red lines: CTM driven by EC-OD; black lines: analysis of Aura-MLS observations.

MACC-II Final Report – October 2014
51 / 137
6.3 Global tropospheric analyses and forecasts The global analysis and forecast system of reactive gases ran with only few interruptions and provided daily services of maps, cross sections, and boundary conditions to a variety of users. The MACC-II operational system of IFS-MOZART has not been further developed and showed a stable performance with generally acceptable results (exceptions are a summertime high-bias of ozone over large parts of Europe and a wintertime low bias of CO). Special plots and data were provided to various field campaigns (see http://www.copernicus-atmosphere.eu/services/aqac/campaign_support/). Some dedicated model runs were performed to support activities of the task force hemispheric transport of air pollution (TFHTAP).
During the course of the project the C-IFS-TM5 system evolved into a system that is fit to contribute to scientific studies, like a model inter-comparison study of Arctic chemistry (POLMIP, Monks et al., 2014, submitted, Arnold et al., 2014, submitted), and to replace IFS-MOZART as the operational system for providing NRT analyses and forecasts of the global atmospheric composition. Figure 6.5 shows the C-IFS tropospheric ozone results over the Northern mid-latitudes. The quality of the simulation is generally similar to the current MACC-osuite with the coupled IFS-MOZART system, if not better. C-IFS-TM5 has run continuously since December 2012 and is presently tested in ECMWF’s e-suite configuration.
A major effort in the development of C-IFS-TM5 concerned the implementation of the feedback of the MACC aerosol model to the chemistry in a first test version, by means of the optical properties affecting the photolysis rates and the aerosol surface area densities required for the heterogeneous chemistry (Huijnen et al., 2014). It was shown that these feedback mechanisms contribute to a decrease in the oxidizing capacity of the model, leading to longer lifetimes of CO and O3. Further studies are needed to confirm the robustness of these results.
Figure 6.5. Mean normalized biases (%) of ozone in the free troposphere (between 750 and 300 hPa) from the IFS model runs against aggregated sonde data over the northern mid-latitudes. The numbers indicate the amount of individual number of sondes. The red line denotes the o-suite, based on the IFS-MOZART system with data-assimilation, yellow the IFS-MOZART system without data-assimilation, and blue the C-IFS-TM5 system without data-assimilation.

MACC-II Final Report – October 2014
52 / 137
Since C-IFS-TM5 runs without a full stratospheric chemistry scheme, work was initiated to couple this model system with the BASCOE chemistry which has been operated as a separate offline model so far. Furthermore, both the MF-CNRM MOCAGE and the JUELICH MOZART models were implemented into C-IFS and successfully ran multi-months test experiments. Results are generally satisfactory, but a thorough evaluation is still needed. With C-IFS-MOCAGE also a number of initial data assimilation tests were carried out. As a first step toward inverse modelling with C-IFS, an adjoint module of the MOZART chemistry was created as a box model.
A major update of C-IFS included the introduction of an interactive scheme for emissions and dry deposition based on MF-MNRM’s SUMO model. This parameterisation overcomes a long-standing limitation of the MACC system to accurately simulate extreme episodes, because emission fluxes (biogenic VOC) and deposition velocities were prescribed from monthly climatologies in the past.
The long-standing issue of a low bias in Northern Hemisphere wintertime CO concentrations in global models has been addressed in Stein et al. (2014). Our results indicate that anthropogenic emissions in the MACCity inventory are too low for the industrialized countries during winter and spring. Only a combination of seasonally and regionally varying scaling factors for anthropogenic emissions and the use of an improved parameterization for CO dry deposition and uptake by oxidation from soil bacteria and microbes allowed reconciliation of model results with surface observations and to significantly reduce the model bias with respect to satellite and aircraft observations. It remains unclear which emission sectors are underestimated. Possible candidates are cold start traffic emissions, underestimated number of super-emitters, or residential wood burning, among others. Underestimation of anthropogenic VOC emissions can also account for a small part of the missing CO concentrations.
Figure 6.6. Time evolution of the global CO mass (in Tg) from the different IFS experiments for the year 2008: LINCO with (solid red) and without (dotted blue) fire emissions and the MACC reanalysis (circles).
A linear chemical scheme for CO was implemented into C-IFS as a cost-effective representation of a tracer for atmospheric emissions and transport. A first two-year simulation at a resolution of T159L60, and a simulation at a much higher T799L60 resolution have been performed. An example of model results for the global CO mass for the simulated 2008 year is shown in Figure 6.6. The C-IFS simulation appears to be very close to the MACC

MACC-II Final Report – October 2014
53 / 137
reanalysis when updated CO emissions by wild fires are taken into account. Therefore the high-resolution IFS model with the CO linear scheme is now qualified to perform assimilation experiments with the available satellite data. Work has begun to also derive a linearized scheme for HNO3.
6.4 User interaction and data dissemination The “Air quality and atmospheric composition” section of the MACC web pages was re-organized and a better link to documentation, validation results, and data access was added. As mentioned in the introduction, various MACC-II reactive gases products have been used regularly in assessment reports or as boundary conditions for regional air quality model simulations worldwide. The MACC-II team has interacted with the scientific community to support field campaigns and international modelling initiatives such as the Task Force Hemispheric Transport of Air Pollution (TFHTAP) or the SPARC Chemistry Climate Model Initiative (CCMI) projects. The Jülich OWS interface which allows easy access to MACC global boundary conditions has undergone a major re-design which will greatly enhance its usability, include a much more powerful module to compare model results with observations, and enhance the flexibility to view and analyze model data sets. JOIN 2.0 will also include requested features such as a user registration. The release of the new system is expected for the summer of 2015. Data transfer from ECMWF to Jülich and the harmonisation of the data into fully CF-compliant netCDF files generally worked well, although a number of service interruptions occurred with respect to the daily fire emission data sets. Work is ongoing to improve the efficiency of internal data handling and data storage at Jülich.

MACC-II Final Report – October 2014
54 / 137
7. Global aerosol (AER) Work in the AER global aerosol subproject has proceeded along four different strands:
• maintenance, further development and testing of the IFS aerosol scheme with emphasis on the new IFS-GLOMAP modal scheme;
• maintenance and further development of the data assimilation system; • further development and provision of satellite aerosol products for stand-alone
aerosol monitoring and/or for assimilation in the operational aerosol models; • further development and provision of global aerosol services (aerosol forcing, dust
forecast, aerosol alert system, aerosol source inversion). The more mature services have been further consolidated to prepare for the forthcoming operational phase.
7.1 Maintenance, further development and testing of the IFS aerosol scheme The original IFS-LMD aerosol scheme has been monitored and maintained throughout the project but has seen fairly little development. An issue has appeared in April 2013 following a number of model upgrades, with the loss of performance in the forecasts of the current e-suite, which has delayed the implementation of the e-suite as the o-suite. The tools which are in place to monitor the e-suite performance have been effective at pointing to the issue. The source of the problem was quickly identified and a fix was developed. An interactive source of DMS based on climatological seawater DMS has been added and contributes to the “aerosol precursor” variable of the model. This change is now going through the e-suite.
The delay inherited from the MACC project in the development of a new aerosol scheme (IFS-GLOMAP) has been partly caught up and the new scheme is getting closer to be introduced in the e-suite (or to start with in a parallel e-suite). The IFS version of GLOMAP-mode has been coupled to the RADAER module for calculating aerosol optical properties. The results from a free-running simulation (i.e., without data assimilation) was made available and has been included in the AeroCom evaluation tool for comparison with earlier versions and observations. A number of outstanding issues have been identified and worked on.
The initial IFS-GLOMAP runs did not include dust because initial simulations showed the GLOMAP-mode dust tracers had spurious values (orders of magnitude too high) around the Himalaya region. At that time the implementation of dust was very preliminary with some surface fields required to drive the emissions flux not yet implemented. Further work was carried out to provide all required inputs for the two interactive dust emissions schemes contained within GLOMAP. Results from additional simulations to understand the cause of the spurious dust have been performed, which demonstrate that the erroneous values are associated with a technical “system problem” whereby some of the GLOMAP aerosol tracers are not being re-initialised correctly at the beginning of some forecast cycles. A solution is being sought in collaboration with researchers at ECMWF.

MACC-II Final Report – October 2014
55 / 137
Figure 7.1. Annual mean sulphate mass with and without DMS included in IFS-GLOMAP against observations in the coloured circles. IFS-GLOMAP was upgraded to incorporate the biogenic source of aerosol from DMS (in parallel to work done in IFS-LMD). Figure 7.1 shows IFS-GLOMAP simulations with and without DMS to isolate the influence of DMS on the simulated sulphate mass concentrations, size-resolved particle concentrations and aerosol optical depth.
The existing IFS-GLOMAP scheme has been prepared to couple with C-IFS, with gas phase and aqueous phase sulphate production taken directly from C-IFS as an alternative to the simple timescale-based SO2 to sulphate conversion approach inherited from the mass-based IFS-LMD scheme. The nitrate-extended GLOMAP module is planned to be incorporated into the IFS during MACC-III to operate fully within this coupled C-IFS-GLOMAP system.
The GLOMAP-mode aerosol scheme was also extended to simulate the dissolution of gas phase nitric acid and ammonia into the particle phase and subsequent dissociation within mixed ammonium-nitrate-sulphate particles. This “nitrate-extended” version of GLOMAP uses a new “dissolution solver” developed at Leeds University. Simulations with the nitrate-extended GLOMAP in a global offline 3D chemical transport model were performed and evaluated. The way the new extended scheme will be implemented into the IFS via coupling to gas phase nitric acid and ammonia from the C-IFS atmospheric chemistry module was investigated but this work remains to be done.
In summary the report shows that, aside from the corruption of the dust, the IFS-GLOMAP module is operating very well within the IFS global aerosol forecasting capability. We expect that within MACC-III the aerosol will be coupled to the AOD data assimilation system and a

MACC-II Final Report – October 2014
56 / 137
“tropospheric aerosol microphysics re-analysis” will be carried out with both IFS-GLOMAP and C-IFS-GLOMAP.
For a number of reasons, in particular related to staff recruitment and retention, the progress on stratospheric aerosols has been limited. For the sake of continuity and consistency, it was decided to extend the GLOMAP tropospheric aerosol code to the stratosphere. Some modifications to the code were performed to consider specific stratospheric aerosol processes. Some of the tests were done offline and the final code is not quite finalized but some routines are available for further test. Short simulations with stratospheric SO2 injection corresponding to the Nabro stratospheric eruption have also been conducted in the IFS.
7.2 Maintenance and further development of the data assimilation system 7.2.1 Improvements to the MODIS bias correction
A new bias correction has been implemented within a variational approach for MODIS Aerosol Optical Depth (AOD) data at 550 nm. The bias model is based on a linear regression model, with regression coefficients of the selected predictors being estimated during the 4D-VAR minimization and updated every 12 hours, which is the current assimilation window. The AOD bias correction uses surface wind speed over ocean and total cloud cover as predictors along with a global constant. In the pre-operational MACC-II NRT run only the global constant and the wind speed are currently used. In the next system upgrade the total cloud cover will be included. The geographical distribution of the bias reveals the well-documented MODIS bias in the Southern Ocean (with unrealistically high values due to cloud contamination and fixed surface winds in the retrieval). Other areas affected by cloudiness are also visible. Some of the biases in the MODIS standard product collection 5 have been largely removed in collection 6, and it is likely that the values of the bias correction in the MACC-II system will respond to this, once the switch to collection 6 is made. It is worth mentioning, however, that the absolute values of the bias correction for MODIS data are relatively low in a global mean sense. Implementation of this new bias correction shows little impact on the bias of the MACC-II aerosol optical depths with respect to independent AERONET AOD data. However, the biggest impact of the introduction of surface winds and total cloud cover as predictors is felt in regions not well sampled by AERONET (i.e. Southern Ocean and storm tracks). 7.2.2 Lidar data assimilation
Lidar data assimilation has been a focus of the assimilation efforts during MACC-II. During the development, a few bugs in the lidar backscatter operator and its adjoint were found and corrected, which resulted in an improved agreement between model backscatter and CALIPSO level 1.5 observations. Large improvements in the agreement between the model and the data have also been observed in relation to model improvements, particularly those aimed at a better representation of the dust emissions. In figure 7.2, a reduction up to an order of magnitude can be noted both in bias and standard deviation. Comparisons with independent ground-based lidar data over a selected station have shown a good performance of the MACC-II system as far as the vertical distribution of the aerosol extinction is concerned (see figure 7.3). The backscatter appears to be slightly over-

MACC-II Final Report – October 2014
57 / 137
estimated, which could point to incorrect assumptions in the aerosol optical properties, and/or on the aerosol shape and size distribution. More investigation needs to take place to understand the causes. When the performance of the system is compared with global AERONET AODs, the inclusion of the lidar data degrades the global agreement with respect to the AERONET data, even in the case when MODIS data are still used in the assimilation (figure 7.4). However, the performance is good in the African region, indicating a positive impact of the assimilation of lidar data over a region with sparse MODIS Dark Target AOD data. More investigation is on-going to establish the causes of this deterioration which seems to point towards an observational bias in the level 1.5 data. One possible solution might be the implementation of a tighter bias correction for the CALIPSO data. This work is also preparatory for future satellite missions that will feature lidar instruments and perform aerosol measurements, such as Aeolus (ESA), CATS (NASA) and Earthcare (ESA).
Figure 7.2. Observations statistics (bias and root mean square error) for the lidar assimilation experiments. Top: old model cycle, and bottom: new model cycle with improvements to the dust representation and to the lidar observation operator. 7.2.3 Stratospheric aerosols
The work on stratospheric aerosol data assimilation has not started but assimilation of CALIPSO lidar data is directly relevant.
7.2.4 Assimilation of AOD data from other instruments
As part of the development of the current aerosol assimilation system which is entirely reliant on the standard MODIS AOD data, we have investigated the inclusion of other retrieval products such as MODIS Deep Blue AOD, AATSR AOD from FMI, and GOME2/AVHRR PMAP from EUMETSAT.

MACC-II Final Report – October 2014
58 / 137
MODIS Deep Blue covers desert areas and complements the standard MODIS product. In collection 6, the two products will be seamlessly incorporated into one single AOD product. In preparation for this, we have successfully run month-long assimilation tests of MODIS Deep Blue. The technical developments to ensure the correct use of the Deep Blue data are all in place, and in principle monitoring of this data stream could be started immediately. In practice, model upgrades and assimilation changes are implemented when a new cycle is released, and has undergone the testing phase (experimental suite, e-suite) before being adopted as the operational cycle (operational suite, o-suite). It is hence envisaged that the MODIS Deep Blue data will be monitored in the next e-suite expected for September 2014.
The AATSR AOD product from FMI has been also included in the MACC-II system. The test year was chosen to be 2008 and was part of collaboration with ESA under the umbrella of the Climate Change Initiative. MACC-II ran a one-year reanalysis with CCI reprocessed data. It was shown that the AATSR AOD product added value to the analysed aerosols and improved the bias with respect to independent AERONET observations, when compared to a forecast-only experiment. Optimal use of the AATSR AOD data in conjunction with MODIS is still under investigation. Evaluation of the analysis including AATSR and MODIS is also on-going. This work serves as preparation for the NRT AOD data from SLSTR on Sentinel 3. The PMAP AOD product from EUMETSAT has been released pre-operationally in February 2014. MACC-II has been acquiring test data sets since April 2014, and successful assimilation runs have been conducted. As for AATSR AOD, optimal use of data in conjunction with MODIS and other AOD products is still on-going. In particular, the observational bias correction will have to be revisited. The SEVIRI AOD over-ocean product provided by ICARE will also be tested by the end of MACC-II/beginning of MACC3.
7.3 Further development and provision of satellite aerosol products
Satellite algorithms for aerosol retrieval have continued to be improved and developed. 7.3.1 SYNAER data
The currently available SYNAER dataset is provided from the MACC-II catalogue. The dataset contains the extended ENVISAT time series (v2.2.) until the ENVISAT failure on 8 April 2012. Additional orbits for global coverage in 2008 were added. Data are provided as orbit and monthly / data files (hdf) as well as daily / monthly quicklook files (gif).
The transfer of the SYNAER methodology from ENVISAT sensors SCIAMACHY and AATSR to the equivalent sensors GOME-2 and AVHRR onboard the METOP platform turned out to be more challenging than foreseen (in particular the nadir only surface parameterization together with the different channel characteristics of AVHRR as compared to AATSR). Therefore, the whole effort was spent on developing and testing several altered and new approaches for the surface parameterization of dark fields in the AVHRR measurements.
Additionally, based on development within the ESA Aerosol CCI project, major elements were transferred to the SYNAER/METOP algorithm. The output file format was altered from HDF to netCDF (which is more convenient and thus more widely used). A new set of optical aerosol mixtures was implemented, which was developed in Aerosol CCI as better match of

MACC-II Final Report – October 2014
59 / 137
the satellite information content and the climatological characteristics of modeled (AEROCOM) and observed (AERONET) global aerosol properties.
In the final phase of applying the most advanced new surface parameterization a software bug occurred, which is still under investigation and therefore prevented us from producing a relevant dataset for validation and comparison to model output. This bug search will be continued outside MACC with the goal to allow proper dataset production and validation. No METOP or fully reprocessed ENVISAT data are therefore contained in the archive. 7.3.2 SEVIRI
The MSG/SEVIRI aerosol product over land generated routinely at the ICARE data and Services Center uses a code developed by HYGEOS. One of the major modifications is the provision of the aerosol optical depth at 550 nm (instead of 630 nm) and stricter tests implemented to filter out dubious results. An NRT production stream was also implemented. The current version is v1.3.5. The aerosol product is generated routinely at ICARE and is now publicly available. The product is generated at the native SEVIRI spatial and temporal resolution (3 km at nadir and 15 min). The product generated by the nominal version is currently available 8 days after data acquisition, while the NRT production is usually available 2-3 hours after data acquisition. Products are now available over the whole duration of the MSG mission (i.e. since January 2004). 7.3.3 AATSR
The Along Track Scanning Radiometer (ATSR-2) on the ESA (European Space Agency) satellite ERS-2 (1995-2002) and it successor AATSR (Advanced Along Track Scanning Radiometer) on the ESA polar orbiting Environmental Satellite ENVISAT (2002-2012) were developed to measure surface temperature. However, the ATSR instrument characteristics make them also suitable for aerosol retrieval over ocean and, taking advantage of the single and dual view algorithms, over land. Algorithms have been developed and are continually improved to provide aerosol properties from AATSR on global and regional scales. An operational version has been developed for the MACC project to provide AATSR-retrieved aerosol properties on global scale and for the European domain in near-real time (NRT). The new AOD Product was validated against independent ground-based data provided by the AERONET sun-photometer network. The statistics (correlation coefficient and RMS error) are compared with those from similar validation of MODIS and MISR. 7.3.4 IASI
Seven years of the IASI-derived monthly mean infrared (10 µm) dust aerosol optical depth (AOD) and altitude are now available and have been evaluated against ground based AERONET measurements of the 500 nm coarse mode AOD and CALIOP altitude measurements at 38 AERONET sites (sea and land) within the tropical belt (30°N-30°S). The evaluation has been performed through the statistical analysis of correlation and normalized standard deviation, separating situations over sea and over land, over boxes centered on each AERONET site. For the AOD, such an evaluation raises the problem of the difference between the two spectral domains used: infrared for IASI and visible for AERONET. As the two measurements do not share the same metric, AERONET coarse mode AOD has first to be “translated” into IASI-equivalent infrared AOD. This goes through the determination, site by site, of an infrared to visible AOD ratio which requires an accurate

MACC-II Final Report – October 2014
60 / 137
knowledge of variables such as the infrared refractive index, or the particle size distribution. Averaged over all remaining sites, the mean ratio comes to 0.79±0.25 for the sites over sea, and to 0.55±0.15 for the sites over land. The fact that the mean site ratio is larger over sea, where the MITR aerosol model seems best adapted, than over land, where a model more typical of dust closer to sources is a priori better adapted, agrees with the theory.
7.4 Global aerosol services
Development and production of global aerosol services have proceeded nominally.
The aerosol forcings product is also available and updated on a regular basis; a publication is now available in the ACP journal. The aerosol source inversion system in the LMDZ model is operational, the sensitivity to the emission inventory as prior has been tested, and the system has been run over the full 2001 to 2010 period with a new set of regions and a priori emission data. A manuscript is in revision for ACP and another one on the SO2 inversion for the full period is in preparation. Finally work on defining a global aerosol alert system has progressed but is delayed by a few months. 7.4.1 NRT dust forecast
The Met Office while the model has undergone several improvements. The most significant has been the inclusion of a dust data assimilation system. The current observations used in the data assimilation system have been extended to include MODIS AOD retrievals over ocean, which have been filtered for the presence of dust aerosol. The additional observations provide key information on dust load downwind of dust source regions and lead to an improved analysis and a large improvement in dust forecast skill out to five days. Coupling the global dust forecasts to the model’s radiation scheme is also being investigated as currently the dust radiative feedbacks in the model are calculated using a dust climatology. The interactive dust has a small positive impact on dust forecast skill and should be implemented operationally later this year. Significant improvements have also been made to the simulation of dust using a new modal dust scheme as part of the UKCA-GLOMAP-mode aerosol scheme. This scheme will replace the current two-bin dust scheme used in the operational global NWP model. To this effect the UKCA-GLOMAP-mode is now running with the ENDGame atmospheric dynamics and has been successfully coupled to model’s radiation scheme. Initial evaluations against the CLASSIC bin scheme and surface dust observations showed that UKCA dust has too much dust remote from source and too little downwind of source regions. Initial simulations whereby the insoluble dust is allowed to age into the soluble modes have also been carried out. However additional work is required to evaluate the dust ageing as well as investigate the mapping of the emitted dust into the aerosol modes.
The dust forecasts from the Met Office and from the IFS have been continuously broadcasted on the WMO SDS node for Europe and North Africa as part of a multi-model ensemble (see figure 7.3). This activity is expected to continue although the Met Office withdraws from the MACC-III consortium.

MACC-II Final Report – October 2014
61 / 137
Figure 7.3. Snapshot of the dust forecasts from the Met Office and from the IFS on the WMO SDS node for Europe and North Africa. 7.4.2 Aerosol alert system
A prototype aerosol alert system has been available since April 2014 from the AeroCom website. Alert maps are available back to January 2013 along with info on aerosol contributions from dust, organic aerosol and sulphate. Maps as shown below highlight the aerosol alert regions, corresponding to three alert levels. The alert level 1, 2 and 3 represents aerosol areas with AOD twice, three and five times the climatological mean, respectively, and with AOD at least greater than a value of 0.5.
A qualitative evaluation was performed against observations for four categories of aerosols events: small and large scale dust events, fire plumes, and pollution episodes. Aerosol events which came to the attention to the authors and have been discussed in the media over the last 18 months were chosen. Large dust events and wild fire plumes can most easily be identified as being above the chosen alert levels. Aerosol alerts relating to such events can be considered as robust. Small scale dust events are more likely to be overlooked due to the meso-scale nature of the phenomena. The detection of alerts with respect to pollution episodes seems to be difficult. It would require further efforts to understand, whether such episodes are missed due to missing satellite detection, or due to the choice of the aerosol alert algorithm chosen.

MACC-II Final Report – October 2014
62 / 137
Figure 7.4. Snapshot of the aerosol alert system. 7.4.3 Aerosol radiative forcing products
The Aerosol Radiative Forcing products, including daily distributions of component aerosol optical depths, component direct radiative effects, and anthropogenic direct and indirect radiative forcing are available on the MACC website at or directly from the MACC FTP server at. Previous versions of the products, released in November 2011 and February 2013, remain available on the MACC FTP website.
The MACC aerosol re-analysis is used routinely to estimate the radiative forcing due to aerosol scattering and absorption of solar radiation, also called direct radiative forcing or radiative forcing of aerosol-radiation interactions. Improvements to regional estimates of anthropogenic aerosol optical depths and radiative forcing due to aerosol-radiation interactions have been made over the duration of the MACC II project. The datasets of anthropogenic aerosol absorption and land-based anthropogenic fractions have been updated, changing from simple continental and annual prescriptions to realistic distributions that account for monthly variations. Globally- and annually-averaged estimates have proven remarkably robust, however. All-sky radiative forcing due to aerosol-radiation interactions is estimated at –0.46 ± 0.3 W.m-2 over the industrial era.
More experimental developments have also taken place, with the achievement of the first estimates of above-cloud aerosol optical depth and cloudy-sky radiative effects. Seasonal distributions compare well qualitatively against satellite retrievals, but are generally underestimated. Cloudy-sky radiative effects are a small contribution to all-sky values on a global average, but are strong during the biomass-burning season in southern Africa (August to October), when biomass-burning aerosols are transported over the southeastern Atlantic stratocumulus deck. Those experimental products require further developments, and not distributed publicly for the moment.

MACC-II Final Report – October 2014
63 / 137
Semi-direct and also secondary indirect effects on cloud cover, as well as potentially on precipitation shifts and cloud liquid water, may be important climate forcings beyond the first aerosol indirect effect diagnosed within MACC. We compared the cloud fields as diagnosed by the MACC reanalysis that includes aerosol-radiation interactions, and the ERA-Interim reanalysis that does not. Two methods, regressing the relative difference in total cloud cover between the two re-analyses on aerosol optical depth (AOD) by component focusing on black carbon (BC) AOD, and analysing the relative difference for high vs. low terciles of the BC distributions at each grid-point, were examined. The results of both methods agree that no distinct features of TCC differences stick out of the statistical noise. The preliminary conclusion is thus that the semi-direct effect as represented in the re-analyses is small compared to the noise.
Former estimates of the aerosol indirect radiative forcing were based on a statistical approach and heavily relied on sensitivities computed from present-day aerosol- and cloud variability, leading to large uncertainties documented in past deliverables to MACC. A very different approach was introduced, combining the full capabilities of the A-Train satellite constellation and the MACC aerosol reanalysis, and off-line radiative transfer modelling. MACC aerosols are co-located to the cloud radar / lidar satellite data, and cloud droplet number concentrations for liquid-water clouds are computed using an advanced, mechanistic parameterisation, adapted to individual cloud regimes. Two off-line radiation computations using the rapid radiation transfer module (RRTM) were performed, once using the diagnosed present-day cloud droplet number concentration, and once re-scaling it to its natural-only value based on the natural aerosol optical depth developed in MACC. The geographical distribution of the radiative forcing by the first aerosol indirect effect diagnosed in this way seems realistic in many regards, but also shows features that might be related to deficiencies in the current method to scale the droplet number concentration to obtain the natural value. The global-mean diagnosed radiative forcing of -2.2 W.m-2 (present-day minus natural only) is substantially larger than previously estimated in MACC. Future work will make use of the 3D anthropogenic and natural aerosol number concentration and evaluate and further improve the method.
7.4.4 Aerosol source inversion
The existing aerosol and gaseous precursor emission estimate from the assimilation of MODIS AOD for the decade 2001 to 2010 was extended to the year 2012. The performance of the inversion system was examined on one hand by assessing the impact of the estimated fluxes to reproduce the observations and on the other hand comparing the inverse emissions to existing “bottom-up” inventories. For the combustion of fossil fuel emissions the MACCity projections were used since no inventory exists at present estimating the emissions for 2011 and 2012. For the biomass burning emissions we used the inventory from the Global Fire Assimilation system (GFAS). The inverse emissions improve the model performance with respect to independent AERONET AOD. The total AOD is improved in terms of RMS error and correlation coefficient by the assimilation. However, for certain years an increase in bias is observed after assimilation. In general the inversion system largely increases the emissions globally with respect to the FG for all species and all sources. This increase is larger in the emissions corresponding to fossil fuel combustion than biomass burning. Figure 7.5 shows inverted biomass burning emissions for fifteen regions and the full period. The system, which is still experimental, proves useful to detect regions where

MACC-II Final Report – October 2014
64 / 137
inventories may be incorrect or may not capture the most recent trend in anthropogenic emissions.
Figure 7.5. Biomass burning regional yearly emissions of POM (in Tg yr-1) in fifteen regions from the a priori (FG, black), the analysis (AN, red solid line) and the GFAS (green solid line) inventory. A linear fit (red dashed) for years 2001-2010 has been added to illustrate the trend in the estimated emissions.

MACC-II Final Report – October 2014
65 / 137
8. Integrated global data assimilation, production and services (GDA) The Global Data Assimilation (GDA) sub-project has been central to the global services in MACC-II. It has strong interaction with the AER, GHG, GRG, OBS, EMI, FIR, INT, and VAL sub-projects to ensure provision, quality control, and further development of the various global services. Using its global data assimilation system, GDA provided the following global services:
• near-real-time global monitoring and forecasting; • delayed-mode monitoring; • reanalyses; • user-targeted forecasts.
GDA also ensured easy access to both graphical and data products through the MACC-II web site as well as other forms of data portals. Emphasis lay on continuing the provision of the services from MACC, transforming them to fully operational status, and improving or newly developing services based on user input. The tasks of GDA can be divided into three categories and are summarized as follows:
• Integration of new developments ‒ Integrate model and data assimilation developments from other sub-projects
in the global production system as well as a full integration of the MACC-II system with meteorological developments at ECMWF;
‒ Assessment and refinement of the integrated global assimilation of data on atmospheric composition;
‒ Interact with external Copernicus-related research developments. • Global production
‒ Routine running of a near-real-time (NRT) system for analysis and prediction of atmospheric composition;
‒ Provision of additional global products for extreme cases such as fires or volcanic eruptions;
‒ Routine running of a delayed-mode system for analysis of atmospheric composition;
‒ Continuation of the 2003-2010 MACC reanalysis for the years 2011-2012 and production of short reanalyses using model improvements and new data streams.
• Global services ‒ Monitoring and routine verification of the global MACC-II production streams; ‒ Development and maintenance of the MACC-II website and its systems for
display of results and supply of data products; ‒ User support.
Over the duration of MACC-II GDA has ensured the routine running of the global data assimilation and forecast services, improved the system based on developments from the other sub-projects, and made the output data available to an extensive set of internal and external users. In parallel, all relevant procedures and documentation necessary for a full transition to the operational phase have been put in place.

MACC-II Final Report – October 2014
66 / 137
Figure 8.1. Example of global MACC-II forecast with CO2 (top left), NO+ (top right), CO (bottom left), and AOD (bottom right).
8.1 Integration of new developments
An important part of GDA has been the integration and testing of new data assimilation and model developments in the ECMWF IFS system. Most modelling components, the chemical transport models (CTMs) Mozart, Mocage, and TM5, the aerosol model GLOMAP, and the land surface carbon model CTESSEL, have been developed by partners or even other projects. Implementing these models in the IFS system is a significant task, as is the subsequent fine-tuning based on testing of the new model components. On top of this comes the testing of the MACC-II system when new meteorological developments are implemented in the IFS system. In order to test the system developments new tools were developed to enable quick comparison with independent observations. In addition, MACC-II has developed a strong validation component of the global system within the VAL sub-project, which is described elsewhere. The Validation reports have been instrumental in assessing the system development and readiness for implementation in the pre-operational forecasting system.
During MACC-II a significant number of improvements have been implemented as listed below:
• Upgrade of the coupled Mozart CTM to version MOZART3.5; • Implementation of new global anthropogenic emission data set, MACCity; • Implementation of Global Fire Assimilation System, GFAS; • Implementation and testing of Composition-IFS (C-IFS) , which allows different
chemical schemes to be used: C-IFS-TM5, C-IFS-Mozart, and C-IFS-Mocage; • Testing of C-IFS-TM5 in data assimilation mode to prepare for implementation as
new pre-operational system; • Testing of C-IFS-Mocage in data assimilation mode; • Coupling of CO2 modelling with CTESSEL land surface carbon model enabling high-
resolution global CO2 forecasts; • Improvements to aerosol bin model;

MACC-II Final Report – October 2014
67 / 137
• Support for development and implementation of GLOMAP modal aerosol model; • Migration of MACC-II system to IBM and Cray supercomputers; • Introduction of EDA-based background statistics for greenhouse gas data
assimilation; • Introduction of MOPITT CO observations; • Introduction of OMI NO2 and SO2 observations; • Introduction of GOME-2 O3 observations from Metop-A and Metop-B; • Introduction of IASI CO from Metop-B; • Introduction of SBUV/2 O3 observations on 21 layers; • Introduction of GOME-2 NO2, SO2 and HCHO observations in monitoring mode; • Introduction of MOPITT, IASI and GOME-2 profile observations using averaging
kernels.
All these improvements have been implemented in a set of IFS model cycles, in line with the implementation of meteorological updates to the IFS. The following cycles have been produced during the MACC-II project period: CY37R3, CY38R1, CY38R2, CY40R1, and CY40R2.
The cycle at the time of writing (CY40R2) has been a major accomplishment integrating important MACC-II developments. Especially, the first version of C-IFS, C-IFS-TM5, now allows a much more efficient running of the chemical forecasting system as well as consistent interaction with the aerosol model, the greenhouse gases, and not least the meteorology in the form of vertical diffusion, convection, and the various deposition processes. MACC-II provides now the first global integrated atmospheric composition forecasting system based on a Numerical Weather Prediction (NWP) model.
Figure 8.2. Timeliness statistics for the near-real-time global production. The target time is reflected by the dashed black line while the timing of the forecast run is in dark green and the timing of the data archiving is in light green.

MACC-II Final Report – October 2014
68 / 137
8.2 Global production
GDA has also been responsible for running the various pre-operational global systems. MACC-II runs a daily data assimilation and 5-day forecasting system, which assimilates most satellite observations of atmospheric composition that are available in near-real-time as well as all the meteorological observations that are used in the ECMWF NWP system. A significant user group of these daily forecasts are the regional modelling groups, both within MACC-II and outside the project. While most of the focus has been on the European domain, interest is increasing in Asia and the Americas as well. The global forecasts are also used for other purposes, most notably the aerosol forecasts, which are important for the solar power industry and for (governmental) groups dealing with health and visibility in the most affected countries. During MACC-II the provision of the daily forecasts has been very stable with on-time dissemination of the output for more than 95% of the time. This timeliness is being monitored continuously and an example is shown in Figure 8.2. A second major component has been the reanalysis. MACC-II has extended the MACC reanalysis to include 2011 and 2012. The reanalysis has become a well-recognized data set, especially in the scientific community. It provides an important data set to a wealth of users dealing with climate science, long-range pollution transport, solar energy applications, and the carbon cycle. The reanalysis as well as two separate short experimental reanalyses have also supported data reprocessing efforts, such as the ESA CCI initiative.
A third component has been the support of scientific field campaigns by providing dedicated forecasts over specific domains. These forecasts help with flight planning during the campaign and with interpretation of the data afterwards. The support MACC-II has given to these campaigns has also had positive feedback for the project itself. Observations from the various campaigns are extremely useful to further improve the modelling systems.
As in MACC, MACC-II has used a so-called Delayed mode assimilation system to process greenhouse gas observations that are not available in near-real-time. Originally the idea was to use these delayed-mode analyses in off-line flux inversions to estimate global CO2 and CH4 fluxes. However, various issues with the observations and some discrepancies between the IFS and the off-line models caused results that were not accurate enough to be useful for MACC-II users. The flux inversions are therefore now using the observations directly and the delayed-mode system has been transformed in a test bed for future developments. One element of the latter is the assimilation of GOSAT CO2 and CH4 observations with very encouraging results (Figure 8.3). Another element is the testing of ensemble data assimilation to estimate assimilation background errors for the greenhouse gas data assimilation. This will also benefit the assimilation of reactive gases and aerosol on the longer term. In parallel, NRT forecasts of CO2 and CH4 without data assimilation are now routinely provided at high resolution.
During MACC-II focus was also put on improving the forecast in case of large wildfires and volcanic eruptions. For instance, the fires affecting Singapore in June 2013 and Europe in July 2013 were very well captured. Emissions from volcanic eruptions are now to some extent picked up automatically by the NRT data assimilation system and mechanisms to introduce sudden emissions for SO2 and volcanic ash have been developed.

MACC-II Final Report – October 2014
69 / 137
Figure 1 CO2 time series over a station of the TCCON network. The magenta line is the total CO2 column from the Delayed Mode system assimilating GOSAT data. The red dots are CO2 values computed using TCCON averaging kernels and prior profiles. The cyan dots are the measurements
8.3 Global services
Within the global service part of GDA, three important components can be identified: routine monitoring of incoming and outgoing data streams, product display, dissemination and web services, and user support.
For the monitoring of the global system, changes have been incremental. The routine monitoring of incoming satellite data has been improved allowing quick detection of any issues with the data. The timeliness of the near-real-time forecasting system is now also being monitored. Much progress has been made with the routine verification of the various output data streams with independent observations. Various examples can be accessed on http://www.copernicus-atmosphere.eu/services/aqac/global_verification/.
While the existing MACC web site was maintained with a routine generation of thousands of daily plots, a new structure was developed within MACC-II in collaboration with the INT sub-project to improve the user interaction. A major component of the new web site, which went on-line in November 2012, is the Product Catalogue, which lists all available MACC-II products with easy access to plots, data, and validation (Figure 8.4).
Other aspects of the web site have been redesigned to provide easy-to-understand information about the MACC-II services as well as detailed information for our routine users. Specific sections have been dedicated to operational users and general user support. These have become an increasingly important part of the web site providing details about system changes, system status, and impact of implemented changes. Web services facilitating interaction between MACC-II partners also still exist and are being expanded on the “Internal” parts of the web site.

MACC-II Final Report – October 2014
70 / 137
User support has been further improved by implementing an on-line system, which documents user questions and the responses to these. This ensures all questions are being followed-up by relevant staff.
Figure 8.4. Screenshot of the MACC-II Product Catalogue
8.4 Towards operations
With the operational phase to be provided by the Copernicus Atmosphere Monitoring Service (CAMS) getting nearer, it has been an important aspect of MACC-II to put in place the various components required for running an operational global forecasting system 24/7. In collaboration with the other global sub-projects a system of experimental (e-suite) and operational (o-suite) suites has been set-up, and the procedures for developing, implementing and validating new code and input data have been described in a document that was distributed within the project. In parallel, the same system of e-suites and o-suites is being implemented within the Forecast department of ECMWF to prepare for the full operational service in 2015. The data acquisition and data dissemination has gradually been moved to operationally supported systems at ECMWF. Documentation of the various components has been made available and will be further improved and important information for users is more systematically distributed. Discussions are on-going with the ECMWF Forecast Department to ensure the MACC-II services can develop into a system with the same high level of operational performance as the ECMWF NWP system.

MACC-II Final Report – October 2014
71 / 137
9. The validation subproject (VAL)
9.1 Overview The goal of the validation (VAL) sub-project in MACC-II can be summarised in the following way: Every service, forecast and reanalysis, on the MACC website should be accompanied by a validation report which is essential for users. These validation reports should be regularly updated and should document the quality of the latest model/analysis version. The validation subproject has proved the validation reports for the core global services of MACC-II. Apart from these reports, VAL provides a set of dedicated websites hosted by VAL partners with more detailed comparisons between the MACC service products and individual validation datasets. Furthermore verification statistics is produced in an operational way, in collaboration with the global production team (GDA), and is made available on the MACC website. Quick-look validation work was performed to provide feedback to the modelling teams in case of updates: the e-suite verification reports.
The validation (VAL) sub-project is a new activity: before MACC-II the validation work was integrated in the different sub-projects and was more focused on model development. The aim of the VAL project is to set up a unified, operational and user-oriented approach to validation. By clustering the validation work in VAL, the validation has become more independent from the modelling work.
Validation has to reach an operational status, which implies an automated production of verification/validation data and plots, and updates of validation reports with fixed intervals. The focus of VAL is on the global reactive gas and aerosol services. The regional sub-projects ENS (regional ensemble forecasts) and EVA (regional reanalyses and assessments) as well as the greenhouse gas sub-project have their own validation activities and reports. The production and presentation of validation results has been harmonised. The VAL project is progressively extending its work to other MACC services which do not yet have a systematic approach to validation.
The Validation (VAL) sub-project is maintaining interaction with most of the other MACC sub-projects to ensure routine documentation of the quality of the global services with contributions to the regional air quality sub-projects. The other MACC-II sub-projects have be involved to unify scoring approaches and presentation of the validation results. Inaccuracies in the fire emission and other emission input will be quantified based on their effects in the various global and regional atmospheric analyses and forecasts.
Below we will provide an overview of the main activities of the validation team. The reports mentioned in the text can all be found on the MACC website.
9.1.1 Structure of the validation reports
The validation reports are written for the users, and provide a regularly updated documentation of the validation results for the service data products available in the MACC catalogue. The reports contain:
• A summary with an overview of the main findings. This summary is split according to areas of interest to users: Climate forcing, regional air quality, ozone layer and UV.

MACC-II Final Report – October 2014
72 / 137
Specific attention is given to the ability of the MACC system to capture recent events.
• A section with detailed information on the model configuration, analysis system and evolution/upgrade details.
• Availability and timing statistics. • A detailed presentation of the validation results. This is the bulk of the reports. A
reader interested in the details of certain aspects of the system can directly jump to the corresponding sub-section of the report.
• An annex with details on the validation methodology.
The reports are delivered on a regular basis with an update frequency depending on the service: every 3 months for the real-time forecasts, every 6 months during production of the reanalysis, and after major upgrades for other service products.
9.1.2 e-suite evaluation reports
During MACC-II the process of introducing new upgrades has evolved to prepare for operations. For the global near-real time composition forecast/monitoring service, upgrades are typically introduced a few times each year. The steps are:
• A new model version and/or assimilation upgrade is prepared and evaluated off-line. For the global composition forecast service this work is performed by the reactive gas, aerosol and production sub-projects (GRG, AER and GDA).
• The new system version is documented, and a so-called "e-suite" is prepared and is run for typically half a year in parallel to the (pre-)operational "o-suite".
• The performance of this e-suite is evaluated against the o-suite by the VAL team. Based on the validation results a recommendation is given wether or not to replace the o-suite. Typically it is required that the e-suite performs equally or better on all aspects than the o-suite.
The VAL team has produced three e-suite evaluations during MACC-II. In one case a negative advice was given because of a degradation of the aerosol forecasts, see Figure 9.1. The upgrade was postponed, the problem was solved and a new e-suite was launched.
Figure 9.1. E-suite verification example. Total AOD plots show that there is a considerable loss of aerosol of 30% after a three days forecast in the e-suite "ftki"compared to the o-suite "fnyp". The Angstroem exponent shows considerably smaller particles in the e-suite as compared to the o-suite. Because of this the o-suite upgrade of April 2013 was postponed. The problems were solved and a new e-suite run was tested positively in August 2013. Example taken from the e-suite report of April 2013.

MACC-II Final Report – October 2014
73 / 137
9.1.3 Scoring
Part of the research activity in VAL consists of defining meaningful validation scores. In particular there is a need to define scores which can document the improvements of the system over time, and with respect to other modelling systems. The VAL sub-project has produced the report "Skill scores and evaluation methodology for the MACC II project". This document summarises the general scores and evaluation methods which will be used during MACC II. The document is not intended to provide a broad overview of scoring theory, and will also not provide a complete list of all scoring techniques used within MACC II. The aims of the report are:
• To “harmonize” the scoring methods: propose a “default” set of common scores for the VAL subproject as well as the other subprojects.
• To initiate the definition of a set of “headline scores” which will be used in the future to document the improvements of the Copernicus Atmosphere Monitoring Service products over time.
• To introduce scores that measure the performance in comparison to a reference, e.g. compared to climatology.
• To introduce uniform graphics styles and a uniform presentation of validation results on the MACC II website.
• To briefly discuss the value of other scores (e.g. threshold scores, ranking scores).
It should be acknowledged that the formulation of the recommendations that are provided in this report is a continuous process. Feedback from the teams working on validation, modelling teams and users are incorporated in updates of this document.
Special attention was given on the "headline score" topic. An approach is proposed in a discussion note with title "Roadmap to develop a set of skill scores for the MACC-II project". The purpose of this note is to guide the development of a set of summary skill scores which can be used to document the performance, and monitor the improvements of the MACC-II system over time. These skill scores are targeting a set of Copernicus-atmosphere user application areas.
9.1.4 Validation/verification web pages
A set of 12 dedicated websites has been set up, where more detailed comparisons against individual datasets are presented. These websites are maintained by the VAL partners, and can be accessed through the MACC webpage http://www.copernicus-atmosphere.eu/ services/aqac/global_verification/. An impression of the datasets provided is given in Figure 9.2. The websites contain:
• Verification plots for the global atmospheric monitoring and forecasting service. • Verification plots for the reanalysis service. • Real-time monitoring plots, provided by ECMWF.
During MACC-II the VAL subproject has started a collaboration with the EU NORS project (http://nors.aeronomie.be) to make real-time measurements from the NDACC network available to MACC. The NORS server, http://nors-server.aeronomie.be, provides a comprehensive browser of plots comparing NDACC data with the MACC global analyses/forecasts.

MACC-II Final Report – October 2014
74 / 137
Figure 9.2. Snapshot impressions from the VAL verification pages.
9.1.5 Case studies: fire, dust and pollution events, ozone depletion
One of the main aims of the MACC system is to provide analyses and forecasts of extreme events. The evaluation of such events is a cross-cutting topic, and is co-ordinated with the other involved sub-projects, and in several cases rapid-response actions have been taken. Examples are major fires (Russian fires in July-August 2010), dust storms, volcano eruptions (Eyjafjallajökull volcano in 2010) and air pollution events. The VAL group studied more than 10 events, and the results have been included in the validation reports. An example is shown in Figure 9.3. Data from large international measurement campaigns is also used to evaluate the model results. Examples are POLARCAT/POLMIP, PEGASOS (EU) or SEAC4RS (NASA).
Figure 9.3. Case study of two dust cloud events in August 2011 over the Canary Islands. Daily mean DOD from MACC_osuite (red) and AOD from AERONET, MPL and Modis for August 6th-20th.

MACC-II Final Report – October 2014
75 / 137
9.1.6 Validation research
Research has been conducted on the following topics:
• Improvement of the validation methodology • Development and harmonisation of scoring approaches, see above. • Analysis of events, see above. • Scientific papers. • Evaluation of new datasets: ceilometer and MAX-DOAS.
Validation methodology The detailed validation procedures are described in the annexes of the validation reports, and we refer the reader to those reports for more details.
Scientific papers
The validation results by the partners of VAL have been described in scientific papers. These may be grouped in papers submitted for the MACC special issue (Lefever et al., 2014; Cuevas et al, 2014; Wagner et al., 2014) or contributions to papers led by partners from other sub-projects of MACC (Huijnen et al., 2012; Inness et al., 2013; Pérez García-Pando et al., 2014; Stein et al., 2014; Cesnulyte et al., 2014). Several papers are in preparation for the MACC special issue.
Ceilometer The evaluation of the MACC analyses with German ceilometer observations is discussed in a report entitled "Using Ceilometers for the Evaluation of MACC-II Modelled Aerosol Profiles" published in July 2014. The report shows the usefulness of the ceilometer data to track fire plumes, (Sahara) dust plumes and to validate the modelled boundary layer heights.
Figure 9.4. Example from the Ceilometer study. Top panel: Biomass Burning AOD over Europe from 6-18. July 2013. Time-height plot of extinction-coefficient above Soltau from 6.-16. July 2013 from Ceilometer (middle panel) and the operational MACC o-suite (bottom panel). MAX-DOAS The evaluation of regional model output against MAX-DOAS NO2 observations is discussed in a report entitled "Using MAX-DOAS measurements of NO2 tropospheric columns for MACC-II model validation", published July 2014. Tropospheric NO2 columns from MAX-DOAS instruments at four different European stations are compared to results from the regional model LOTOS-EUROS. Using MAX-DOAS measurements for MACC-II model validation is promising and it is proposed to use MAX-DOAS in future validation activities of the operational COPERNICUS atmospheric service, in particular for the regional models.

MACC-II Final Report – October 2014
76 / 137
Figure 9.5. Example from the MAX-DOAS study. Scatter density plot showing MAX-DOAS against Lotos-Euros NO2 VCDs for Bremen. The data is shown for different bins with a size of 1015 molec cm-2) and is colored according to the number of data points per bin [%].
9.2 Validation of the MACC near-real time global atmospheric composition service
The near-real time global atmospheric composition service is one of the core services of MACC. It is providing daily (near-real time) forecasts and analyses of the global reactive gas and aerosol distribution. One of the main tasks of VAL is the evaluation of the products from this service. During MACC-II, regular updates of the near-real time reports were produced every three months. The structure of these reports was discussed above. The last MACC-II report is called "Validation report of the MACC near-real time global atmospheric composition service: System evolution and performance statistics, status up to 1 March 2014" The validation reports are publicly available at http://www.copernicus-atmosphere.eu/services/aqac/global_verification/validation_reports/.
The following independent datasets have been used to produce the validation reports:
• Profiles of CO and O3 from MOZAIC/IAGOS. • Surface observations of CO and O3 from 13 GAW stations. • Ozone profiles from O3 sondes. • Assimilation results from the independent BASCOE, SACADA, and TM3DAM data
assimilation systems. • Satellite data from ACE-FTS, Odin-OSIRIS and OMPS-limb. • MOPITT and IASI CO observations. • Retrievals of NO2 and HCHO columns from the SCIAMACHY and GOME-2
instruments. • Ten ground-based station data from ESRL Global Monitoring Division network
(http://www.esrl.noaa.gov/gmd/). • Aerosol optical depth and Angström Exponent datasets from the Aeronet sun
photometer network, available from NASA Goddard. Supporting graphs were generated with the AeroCom tools.
• Analyses of dust plumes clouds in Northern Africa and Europe have been performed with AOD from AERONET stations, with Modis (Aqua/Terra) and with lidar profiles.
• Near-real time monitoring of the global forecasts is based on NRT observations from the AERONET network and ozone and carbon monoxide from WMO GAW surface stations.

MACC-II Final Report – October 2014
77 / 137
• Ground-based greenhouse gas observations from the ICOS project and TCCON network.
• NDACC network real-time data provided by the NORS project.
Figure 9.6 provides examples of the evaluation of ozone and NO2. For more details we refer to the reports.
Figure 9.6. (left) MNMB (%) of ozone in the free troposphere (750-200 hPa in the tropics and 750-300 hPa elsewhere) of MACC o-suite against aggregated sonde data in 4 different regions. (right) Time series of average tropospheric NO2 columns [1015 molec cm-2] from SCIAMACHY (up to March 2012) and GOME-2 (from April 2012 onwards) compared to model results for Europe. Examples taken from the NRT validation report edition 10 of May 2014.
9.3 Validation of the MACC global reanalysis During MACC-II the global reanalysis for the years 2003-2010 was extended with the years 2011 and 2012. Validation reports have been produced every 6 months during the production of the reanalysis. The last issue of the MACC-II reanalysis report is called "Validation report of the MACC reanalysis of global atmospheric composition: Period 2003-2012".
The validation reports are publicly available at: www.copernicus-atmosphere.eu/services/aqac/global_verification/ validation_reports/.
For a good understanding of the validation results it is important to know which aspects of the global assimilation system are constrained by the observations, and which aspects are covered by the validation datasets used. This is summarised in Table 9.1. Figures 9.7 and 9.8 show two examples from the validation report, indicating changes in the analysis time series. The datasets used to validate the reanalysis have been discussed in section 9.2, and the structure of the reports in section 9.1.

MACC-II Final Report – October 2014
78 / 137
Table 9.1. Overview of the trace gas species and aerosol aspects discussed in this MACC-II reanalysis validation report. Shown are the datasets assimilated in the MACC reanalysis (second column) and the datasets used for validation (third column). Green colors indicate that substantial data is available to either constrain the species in the analysis, or substantial data is available to assess the quality of the analysis. Yellow boxes indicate that measurements are available, but that the impact on the analysis is not very strong or indirect (second column), or that only certain aspects are validated (third column).
Species, vertical range
Assimilation Validation
Aerosol, optical properties
MODIS Aqua/Terra AOD AOD, Ångström, PM10: AERONET, GAW, Skynet, AMMA
Aerosol, speciation
- Sulphate aerosol only: SO2, SO4
(EMEP/EBAS)
O3, stratosphere
MLS, MIPAS, GOME, OMI, SBUV/2, SCIAMACHY
Sonde, ACE-FTS, lidar, MWR, OSIRIS, BASCOE and MSR analyses
O3, UT/LS
Indirectly constrained by limb and nadir sounders
MOZAIC/IAGOS, sonde
O3, free troposphere
Indirectly constrained by limb and nadir sounders
MOZAIC/IAGOS
O3, PBL / surface
- Surface ozone: GAW, EMEP
CO, UT/LS
- MOZAIC/IAGOS
CO, free troposphere
IASI, MOPITT MOZAIC/IAGOS, MOPITT, IASI
CO, PBL / surface
Indirectly constrained by satellite IR sounders
Surface CO: GAW, NOAA/GMD
NO2, troposphere
SCIAMACHY, partially constrained (short lifetime)
SCIAMACHY, GOME-2
HCHO
- SCIAMACHY, GOME-2
SO2
GOME-2, OMI, SCIAMACHY (Individual volcanic eruptions)
-
Stratosphere, other than O3
- NO2 column only: SCIAMACHY, GOME-2
Troposphere, other species
- Campaigns only

MACC-II Final Report – October 2014
79 / 137
Figure 9.7. Example from the reanalysis validation report. Monthly mean ozone bias (MACC reanalysis minus observations) with respect to ozone sondes at Hohenpeissenberg (47.5°N, 11E°) for the period Jan. 2003 to Dec. 2012. Scale in %. The plot clearly shows a bias in tropospheric ozone that developed during 2004-2008, and the improvement of the analyses afterwards. See the reanalysis validation report for more detail.
Figure 9.8. Example from the reanalysis validation report. CO total columns simulated by MACC reanalysis and MOZART stand-alone run for the 2003-2012 period compared with MOPITT v4 and IASI observations averaged over Europe and the East Asia regions. It shows the change in CO when IASI data were included in the analyses.
9.4 Validation of other MACC services
9.4.1 The ozone multi-sensor 30-year reanalysis
The Ozone Multi-Sensor reanalysis (MSR version 1, van der A et al., 2010) consists of global ozone column field time series, for the period 1979-2008, on a grid with 1.5 x 1 degree resolution and with a time interval of 6 hours. This data set is produced by assimilating all independent satellite column observation data sets publicly available (12 data sets in total). These satellite retrievals have been calibrated against a "ground-truth" consisting of ozone column measurements from the network of Brewer and Dobson instruments.
In the report with title "Validation report of the MACC 30-year multi-sensor reanalysis of ozone columns, Period 1979-2008", the MSR fields are compared with individual Brewer-Dobson measurements, and with individual satellite observations. Observation-minus-forecast statistics is used to study the internal consistency of the ozone analyses and the satellite data. Because the same data sets are used to construct the MSR, it should be noted that this is not a fully independent validation.
9.4.2 Comparing regional and global ozone analyses
MACC-II has created consistent reanalysis databases of the atmosphere for various chemical compounds using state-of-the-art atmospheric modeling and data assimilation on the global scale and also with an ensemble of regional air quality analysis systems over Europe. This

MACC-II Final Report – October 2014
80 / 137
study concentrates on the evaluation of modeled surface ozone over the European domain using ground-based measurements. It is summarized in the document entitled "Validation report on the comparison of surface ozone in the global (2003-2010) and regional re-analyses (2011) over Europe".
An analysis of the impact of assimilation in the MACC global reanalysis has been performed using various statistical indices and temporal cycles for the period 2003-2010. The assimilation improves the bias of the model in all selected regions but some issues in the seasonality of the ozone were tracked and discussed. A second activity compared the MACC-II regional air quality reanalysis with the global MACC reanalysis using data for 2011. Both regional and global simulations are based on data assimilated, but the global MACC reanalysis was corrected using only satellite data with limited information close to the surface. On the other hand, the ensemble of the regional models assimilated observational data from the surface, including ozone, which leads to considerable improvements with respect to ground-based observations.

MACC-II Final Report – October 2014
81 / 137

MACC-II Final Report – October 2014
82 / 137
10. Data assimilation for European air quality (EDA)
10.1 Objectives
Building on developments of R-EDA in MACC, EDA’s principal objective is to assure increasing and skilful use of new trace gas and aerosol measurements or retrievals, within a scenario of changing earth observation data compositions, retrieval versions and model configurations. These developments were provided for prototype operational use in MACC-II subprojects ENS and EVA.
The ability to provide analysed chemical fields, along with locally and temporally resolved error estimates, is essential, making use of a multi-model ensemble approach.
Assimilated chemical constituents include all routinely measured species and particulate matter, irrespective of direct or indirect data provision. The resulting analyses of the chemical state of the atmosphere are required to be chemically consistent, that is to preserve the integrity of natural balance within chemical families.
While in MACC-I R-EDA activities laid the foundations for prototype operational chemical data assimilation (DA) procedures, with primary focus on in situ data, this proposal aims to (i) improve the regional DA system with respect to an extended or partly novel set of remote sensing data and in situ observations, (ii) generalise and refine the core data assimilation capacities of individual air quality models in terms of operational stability, accuracy, and reliability, (iii) validate the assimilation system with refined methods and algorithms, and (iv) provide for validity of the data assimilation in case of extraordinary geophysical or atmospheric events.
More specifically, the following objectives were achieved:
• Extended data suite to be assimilated from space borne sensors;
• The prototype operational data assimilation algorithms were improved in terms of operational stability, robustness, and accuracy;
• The quality of the data assimilation products was assessed;
• The data assimilation algorithm was enabled to account for special or hardly predictable events. These include mineral dust outbreaks, forest fire emissions, and volcanic emissions.
10.2 Strategy
Building on existing code, partners further developed their own data assimilation code individually, which are of variational or complexity reduced Kalman filter type, both of BLUE. In analogy to the multi-model ensembles used in R-EVA and R-ENS, the diversity of existing assimilation algorithms at individual centres was maintained, apart from further developments, where exchange of modules and common improvements were implemented. This ensures continuity from MACC and previous achievements.
The following chemistry data assimilation algorithms were used in MACC-II:
• RIUUK: The 3D or 4D-variational data assimilation method including extension for emission rate inversion is applied, dependent on objective. With the diffusion

MACC-II Final Report – October 2014
83 / 137
approach, a sophisticated covariance modelling method is operational, as observation operators for a number of satellite sensors, including CALIOP.
• LISA: The Ensemble Kalman Filter (CHIMERE-EnKF) using a square root formulation (instead of directly perturbing observations) is applied for the ozone assimilation of surface and satellite data. Also, assimilation of NO2 satellite data is applied; work on surface NO2 observations is planned for emission corrections at hourly scales.
• KNMI/TNO: Ensemble Kalman filter with specification of uncertainty of model parameters (emissions, boundary conditions, deposition rate).
• FMI: For variational schemeAQ analyses, currently O3, NO2, SO2 are assimilated hourly (PM in preparation). For emissions inversion, work has focused on identification of pollen sources, with a season-wide assimilation window.
• MF-CNRM/CERFACS: the algorithm is based on the 3D-Variational data assimilation method. It is configured to optimize the initial condition of chemical species with one-hour forecast/analysis cycles. It allows the assimilation of in-situ measurements, vertical profiles and partial/total columns of gas/aerosols. Full 3D background error covariances are modelled with a diffusion equation approach and are specified with ensemble simulations.
• The MATCH data assimilation system at SMHI is a 3D variational scheme solved in spectral space. The spectral background errors are derived by the NMC approach for a three-month training period. Observation operators are included for in-situ observations and satellite data such as AIRS, GOME2, IASI, MODIS, MOPITT and OMI.
• EMEP at met.no uses intermittent 3D VAR data assimilation of NO2 columns from OMI and surface concentrations from in situ NO2 measurements near-real time. Data assimilation for AOD is coded in EMEP for all PM variables that contribute to AOD.
While EDA primarily serves ENS and EVA, it is also linked with the MACC-II subprojects Integrated global data assimilation, production and services (GDA), Global reactive gases (GRG), Global aerosols (AER), Acquisition of observations (OBS), Emissions (EMI), and Fire data assimilation (FIR). Apart from the core data flow by OBS, information from these subprojects was expertise, and coded information of mostly auxiliary data (in terms of assimilation parlance). This collaboration ensures that EDA partners were provided with the same advanced databases from related sub-projects.
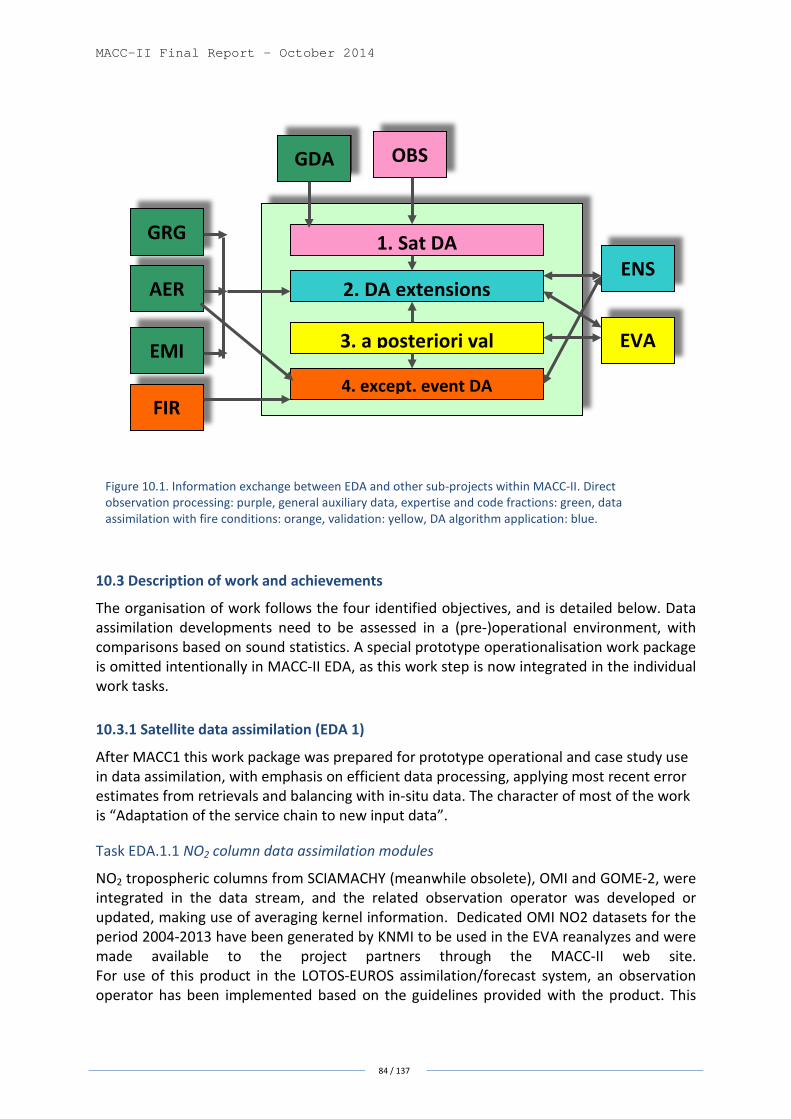
MACC-II Final Report – October 2014
84 / 137
10.3 Description of work and achievements
The organisation of work follows the four identified objectives, and is detailed below. Data assimilation developments need to be assessed in a (pre-)operational environment, with comparisons based on sound statistics. A special prototype operationalisation work package is omitted intentionally in MACC-II EDA, as this work step is now integrated in the individual work tasks.
10.3.1 Satellite data assimilation (EDA 1)
After MACC1 this work package was prepared for prototype operational and case study use in data assimilation, with emphasis on efficient data processing, applying most recent error estimates from retrievals and balancing with in-situ data. The character of most of the work is “Adaptation of the service chain to new input data”.
Task EDA.1.1 NO2 column data assimilation modules
NO2 tropospheric columns from SCIAMACHY (meanwhile obsolete), OMI and GOME-2, were integrated in the data stream, and the related observation operator was developed or updated, making use of averaging kernel information. Dedicated OMI NO2 datasets for the period 2004-2013 have been generated by KNMI to be used in the EVA reanalyzes and were made available to the project partners through the MACC-II web site. For use of this product in the LOTOS-EUROS assimilation/forecast system, an observation operator has been implemented based on the guidelines provided with the product. This
ENS
EVA
FIR
AER
GRG
GDA OBS
EMI
1. Sat DA
2. DA extensions
3. a posteriori val
4. except. event DA
Figure 10.1. Information exchange between EDA and other sub-projects within MACC-II. Direct observation processing: purple, general auxiliary data, expertise and code fractions: green, data assimilation with fire conditions: orange, validation: yellow, DA algorithm application: blue.

MACC-II Final Report – October 2014
85 / 137
has been applied for EURAD-IM (RIUUK) as well, while for GOME-2 own developments were taken.
Care was taken that errors due to limited model top height do not degrade the assimilation result. Since NO2 and O3 are closely related, CERFACS evaluated the impact of the analyses of those gases using the 3D-VAR “Valentina” suite.
The work package goals were accomplished by all the partners involved (RIUUK, CNRS-LISA, MF-CNRM, MET.NO, SMHI, CERFACS, KNMI). Eventually additional work was permanently under way, motivated either to adopt software upgrades from KNMI developments and experiences, or to introduce feedback from ENS and EVA. Specifically, the complementation of the NO2 tropospheric column assimilation is introduced to the following assimilation systems, while surface observations remain assimilated at the same time.
Figure 10.2. Example of OMI tropospheric NO2 product provided to MACC regional model systems by KNMI (left). Calculated bias (observations – model) for 15th August 2009 with CHIMERE. The bias varies between (-10 and 10) *1015 molecules/cm2 (right). Task EDA1.2 MOPITT data assimilation module
CO data from MOPITT was used to ingest a coarse tropospheric CO profile. The impact of MOPITT data assimilation was evaluated by in situ observations. MOPITT data were also taken as opportunity to update model boundary values, as an alternative to global model boundary data. The workpackage’s goals were accomplished by all the partners involved (RIUUK, SMHI).
Figure 10.3. CO mixing ratio at 900hPa for June 15, 2012 as simulated with the EURAD-IM system. Left: pure forecast without assimilation, middle: 3d-var assimilation of MOPITT CO profiles, right: differences between forecast and assimilation run.

MACC-II Final Report – October 2014
86 / 137
Task EDA.1.3 IASI data assimilation module
IASI data was integrated in the data stream, and related observation operator was developed or updated, and used to upgrade free tropospheric ozone values. CNRS-LISA has continued assimilation of IASI ozone observations, to consolidate and optimize assimilation work performed already in MACC-I. Beyond this, CNRS-LISA provided a IASI ozone product, for example partial tropospheric 0-6 km ozone columns, over the GEMS – MACC area for assimilation in regional CTM’s. The averaging kernel, major part of the observation operator, is part of the product (Eremenko et al., 2008, Dufour, 2009, Zyryanov et al., 2010). Other partners used the FORLI or SOFRID ozone products. The workpackage’s goals were accomplished by all the partners involved (RIUUK, CNRS-LISA, CERFACS, SMHI).
Figure 10.4. MOCAGE model (red) and ozonesondes (black) O3 profiles during the summer pollution episode (average of 14 profiles over Europe during 6-12 July 2010). From left to right and from top to bottom: i) free model simulation ii) IASI data assimilated (SOFRID product) iii) surface AIRBASE data assimilated iv) both IASI and surface data assimilated. Task EDA.1.4 MODIS, SEVIRI AOD data assimilation module
AOD from MODIS, SEVIRI, was integrated in the data stream and used to update particulate matter values. The related AOD observation operator of the aerosol module of the chemistry model (and its adjoint) was developed and integrated in the DA algorithm. The workpackage’s goals were accomplished by all the partners involved (RIUUK, MET.NO, SMHI, TNO).

MACC-II Final Report – October 2014
87 / 137
Figure 10.5. AOD for the 29th of June 2012 (upper left) forecasted by MOCAGE, (upper right) MODIS observations, (lower left) with assimilation of MODIS AOD in MOCAGE-Valentina (assimilation cycles started on the 15th of June 2012) and (lower right) from MSG/SEVIRI observations (independent measurements). 10.3.2 Assimilation algorithm extension (EDA 2)
This work package introduces a couple of improvements of the assimilation algorithm, which substantially extends its applicability, while improving robustness, and stability. The work is made in the frame of “Making minor improvements to existing production systems to maintain performance”. The final task “investigates performance problems arising” from preoperational experiences.
Task EDA.2.1 aerosol data assimilation
The aerosol data assimilation was either introduced or refined to address the following issues: the Observation-minus-model difference in AOD was adjusted not simply by a suitable factor applied to all components. Rather, the adjustment is introduced according to the height dependent forecast error variances. Further a regularisation of the aerosol components is introduced by a constraining function to assure realistic portions of aerosol components. In the case of Met.No, a delay in operational application is incurred due to missing parallelisation of the aerosol data assimilation scheme, which is only available in sequential form.
Task EDA.2.2 bias correction scheme
The bias correction scheme accounts for typical (probably time dependent) model biases as found by own evaluation, or EVA and ENS evaluation. The bias correction scheme may follow suggestions according to (Dee and Uppala, 2009). The scheme needs continuous

MACC-II Final Report – October 2014
88 / 137
evaluation, at least after major model upgrades. The related work is accomplished in the following way:
• RIUUK: The bias correction scheme rests on input analyses from Rapid Miner bias analyses. Most notably, the NO, NO2 bias is visible, as expected, with respect to non-representative observations of that species. The correction scheme is variational.
• LISA: The Ensemble Kalman Filter (CHIMERE-EnKF) using a square root formulation (instead of directly perturbing observations) is applied with bias correction scheme.We identified a systematic bias of CHIMERE-ENKF assimilation system in the morning and evening (7 a.m. and 7p.m. – localized for the suburban stations in the Pô Valley and S-E Europe; Gaubert et al, 2013). Simple bias correction has been tested following this findings but the more complex technique of the augmented state vector should be tested.
• MET.NO.: The bias correction scheme is based on Dee et al. (2005) and Dee and Uppala (2009). The latter is simpler than Dee et al., but is coded in such a way that it can be extended to Dee et al. formalism. Currently it is being tested for operationalization.
The workpackage’s goals were accomplished by all the partners involved (RIUUK, CNRS-LISA, MET.NO).
Task EDA.2.3 Dynamic covariance evolution
The work task focuses on the optimal exploitation of background/forecast information from ensemble runs and the related formulation as covariances. The forecast/background error covariance matrix will be made flow dependent. This is done either by application of the “NMC”-method or by exploitation of the ENS model ensemble, or by exploitation of the model ensemble used for the Ensemble Kalman filter. The choice is based on individual partners’ assimilation algorithm configuration. Special set-ups are also admissible: For example for CNRS-LISA, the model ensemble used in the ENKF method is used. The aim is to have a model ensemble, which is physically sound taking into account uncertainty in meteorology, emissions, chemistry, deposition, and boundary conditions. This ensemble will be refined with respect to MACC-I. The evolution of the uncertainty fields will be analysed. The workpackage’s goals were accomplished by all partners involved (RIUUK, CNRS-LISA, CERFACS, SMHI).

MACC-II Final Report – October 2014
89 / 137
Figure 10.6. Illustration of the background errors statistics in terms of standard deviation for PM10, CO, O3 and NO2 at the lowest model level.
Task EDA.2.4 4D-var emission inversion
The emission data inversion procedure based on the EURAD-IM 4D-var scheme is applied to identify emission correction factors, according to Elbern et al. (2007), but using the MACC-II grid configuration. Emission factors to be improved comprise observed species in the first place, but also not observed, yet influenced by chemical coupling.
Working on the emission part of the EURAD-IM system, the adjoint code for the emission estimation has been adapted to the new EURAD-IM emission module. Applying this emission module makes the assimilation more accurate, due to the detailed distribution of emissions in time and height per source (based on the SNAP codes) and per grid box.
Two representative case studies have been identified to estimate correction factors to the MACC-II TNO emission inventory: a summer ozone episode, from 07-16/07/2010, and a long lasting winter aerosol episode, from 15/01-03/02/2012.
As a control and to account for fine scale structures, the use of the nesting technique with high horizontal resolution is applied, starting with Europe as mother domain, with 15 km resolution, going down to the first nest covering Central Europe with 5 km resolution and ending with the area of Northrhine Westphalia in 1 km resolution.

MACC-II Final Report – October 2014
90 / 137
Both ground (AIRBASE) observations of NO2, NO, SO2, CO and O3, and satellite observations of O3 (IASI), NO2 (OMI), and CO (MOPITT) are assimilated.
Figure 10.7. Emission correction factors inferred by EURAD-IM for the photochemistry reference case July 2010, given TNO emissions for a working day as background values. Emission correction factors for NO2 (left), SO2 (middle), and CO (right). In most areas, an increase of emission rates is analysed.
Task EDA.2.5 prototype operationalisation update due to EVA and ENS feedback
The work included here was reserved for activities perceived as necessary following the evaluation of experiences from sub-projects ENS and EVA, which are not comprised in other deliverables. Regional, seasonal or weather dependent deficiencies are identified, which are due to the set-up of the data assimilation algorithm. The continuous evaluation on a weekly and monthly basis, as given on the MACC-II website presented by ENS, proved useful in finding a first approach to systematic deficiencies.
These activities include software proven too time consuming, boundary layer height dependent and chemical covariances, and similar features. In summary the following experiences are reflected:
Correct specification of covariance parameters such as spatial and temporal length scales, and correlations between chemical components is a key task in any data assimilation system. Optimal values of these parameters for a specific application are usually not optimal for other applications too. Assimilation systems should therefore more and more aim at adaptively changing those parameters throughout experiments, in order to obtain the best possible result at every time step.
10.3.3 A posteriori validation (EDA 3)
In this work packages the typical state of the art approaches of a posteriori validation of data assimilation algorithms are comprised. While testing of developments for individual components of other work tasks are part of the related work packages, the overall validation of the data assimilation algorithms is performed in this work package. On the basis that all partners used some type of best linear unbiased estimator as data assimilation algorithm, it must be noted, that only least square type optima can be considered. (Other skill scores were applied in EVA.) The first validation activity makes use of χ2-validation with spatial and temporal adjustments. Further on, case studies with NRT data withheld for control are performed. All work in this package is to guarantee the quality of deliverables. Task EDA.3.1 χ2-validation regionally and seasonally resolved
Models perform differently well in different regions subject to emission impact and seasons or weather conditions. Likewise, the observation representativeness may vary. The χ2−

MACC-II Final Report – October 2014
91 / 137
testing activities ensure a proper balance between the observation and forecast error covariance and are used to validate the mutual consistency of background (forecast) error covariance matrices and observation error covariance matrices, thereby only being able to proof a necessary, yet not sufficient condition. The database for assimilation was restricted to NRT operational data. The following validation algorithms were implemented:
• RIUUK: Within the 3D-variational data assimilation set-up, the χ2−validation is used to validate the consistency of covariance matrices by surface observations, representing different scenarios of chemical regimes. This has been successfully attained by detailed validation and adjustments of background errors in most cases. Interference with covariance modelling results must be taken into account.
• LISA: The Ensemble Kalman Filter (CHIMERE-EnKF) using a square root formulation (instead of directly perturbing observations) is applied for the ozone assimilation of surface and satellite data. The χ2−validation was implemented first, but is replaced by more sophisticated Desroziers diagnostic (Gaubert, 2013).
• KNMI/TNO: Within the ensemble Kalman filter the post processing for the assimilation system around the LOTOS-EUROS model has been adapted to provide χ2 validations for different station classifications. The tested classifications are those identified by the EVA reanalysis subproject. The χ2 analysis of assimilation results revealed in some cases clear discrepancies between the assumed uncertainty in the result, and the actual difference between simulations and observations. The discrepancies are typically regionally and seasonally dependent; the LOTOS-EUROS system was for example shown to underestimate NO2 columns consistently in northern Italy during winter. This result has led to the implementation of spatially varying covariance parameters.
• MF-CNRM/CERFACS: the algorithm is based on the 3D-Variational data assimilation method, where χ2 validation is routinely performed and graphics of chi-square hourly values are produced daily. Results vary significantly as a function of the chemical species, the season and the hour of the day. Model biases and representativeness errors were found to have a large influence on these statistics, which complicates their interpretation in terms of BLUE analysis.
• The MATCH data assimilation system at SMHI is a 3D variational scheme solved in spectral space, where the Chi-square analysis is routinely conducted in order to follow up the behaviour of the analysis scheme. The chi-square test is evaluated on an observation by observation basis that enables easy visualization of the lateral differences of the χ2 metric.
• EMEP at met.no uses intermittent 3D VAR data assimilation, with the chi-squared validation regionally and seasonally resolved.
• FMI uses a 3D-Var assimilation scheme with seasonally and diurnally varying covariance parameters. The covariance model has been recalibrated using the diagnostics of Desroziers, which resulted in improvements in both analysis scores and χ2 diagnostics.

MACC-II Final Report – October 2014
92 / 137
Figure 10.8. The (χ2/ Nobs) consistency indicator for hourly analyses of O3 (left) and NO2 (right) in year 2012. The values in blue and green are shown for the first-guess and revised assimilation setups, respectively. Note the different scales for O3 and NO2.
Task EDA3.2 case study analyses with non-NRT data
Two test episode types, a fairly moderate aestival photochemical standard case and a hibernal case with significantly elevated aerosol concentrations were analysed with the prototype operational data assimilation algorithm. Following a survey of episodes during the MACC era, the time span of 07.07.2010 - 20.07.2010 was identified for the former, and the time span 15.01.2012 – 03.02.2012 for the latter.
As for the data, an expanded validated data set, the observations of which are not available in NRT, is taken for a more comprehensive control. These data comprise EBAS data from the ACTRIS data server, and WOUDC (World Ozone and Ultraviolet radiation Data Centre), to ensure a thorough QA/QC validation. While the episode selection was solely devoted to suitable atmospheric chemistry conditions, no external case study data were available, as was with IAGOS data.
The basis of ground-based in situ sites are, as far as applicable in Europe, rural, and are confined to not much more that 20 stations, dependent on the chemical compound observed. Further, ozone radiosondes are taken for comparison.
The results will be presented in a dedicated Report. For convenience a short survey is given here in terms of average value plots over all EBAS stations with available observations, vertical profiles of analysed and forecasted ozone for Uccle, and Lerwick.

MACC-II Final Report – October 2014
93 / 137
Figure 10.9. (Top): Average over all EBAS/NILU stations for the time period 07.07.2010 00:00 UTC - 20.07.2010 23:00 UTC. Hourly O3 concentrations are in µg.m-3. Analyses and models are inclined to underpredict/-analyse high peak ozone values. Late nocturnal under prediction is mostly due to overly effective titration of ozone by NO, induced by simulated too stable/too low boundary layer. (Bottom) Average over all EBAS/NILU stations for the time period 15.1.2012 00:00 UTC – 3.2.2012 23:00 UTC. Hourly PM10 concentrations are in µg.m-3.
Figure 10.10. Analysis and forecast for ozone at 14.07.2010 with vertical profiles at Uccle, Belgium at 11:33 UTC (left) and Lerwick, UK, at 11:00 UTC (right). Ozone O3 mixing ratio in ppb, height z in pressure levels in hPa.

MACC-II Final Report – October 2014
94 / 137
Figure 10.11. Analysis and forecast for ozone at 14.07.2010 with ozone vertical profiles at Hohenpeissenberg, Germany at 18:29 UTC (left) and Lindenberg, Germany at 18:00 UTC (right) . Ozone O3 mixing ratio are in ppb, height z are in pressure levels in hPa.
10.3.4 Mineral dust, volcano and fire data assimilation (EDA 4)
This work package comprises the development of measures to address data assimilation modifications for special transient atmospheric conditions. These include biomass burning, mineral dust events, and, based on recent experiences in Europe through the Eyjafjöll eruption, volcanic emissions. This work package engages in “Developing suitable solutions and upgrades to maintain product delivery”, while exceptional events occur.
Task EDA4.1 wild fire data assimilation module
The wild fire data assimilation module is completed by RIUUK, and includes an extended data assimilation algorithm to identify the chemistry models’ change toward local fire emissions, estimate the forecast errors, and perform the data assimilation procedure. To comply with the global models’ system, biomass burning emissions calculated by the Global Fire Assimilation System (GFASV1.0) have been implemented in the EURAD-IM data assimilation system. The assimilation of GFAS data has been successfully tested on the 2010 Russian peat fires and has been subsequently implemented in the EURAD-IM pre-operational air quality analysis (see WP 105). Figure 12 shows PM10 time-series averaged over all available Finnish AIRBASE measurement sites during the 2010 Russian peat fires. On days with long-range transport of air pollutants originating from Russian peat fires, the strong negative bias of EURAD.IM results has been significantly reduced.
SMHI: Wild fire emissions and mineral dust lateral boundaries are now in operation (voluntarily).
Other models in EDA without formal commitment applied the similar approach. Work accomplished.

MACC-II Final Report – October 2014
95 / 137
Figure 10.12. PM10 time-series averaged over all available Finnish measurement sites from July 23 to August 13, 2010. Black: EURAD-IM background, blue: predicted by EURAD-IM with GFAS wild fire emission data included, red: observations.
Task EDA.4.2 mineral dust data assimilation module
The mineral dust data assimilation module implies the identification of the chemistry models’ change toward mineral dust load, dust controlled lateral boundary values obtained from global models (sub-project AER), and performance of the data assimilation procedure.
Task EDA.4.3 volcanic emission data assimilation
The data assimilation algorithm is extended to identify the chemistry models’ change toward volcanic emission load and, if applicable, volcanic emission controlled lateral boundary values obtained from global models, estimate the forecast errors, adapt the covariance formulation, and perform the data assimilation procedure.
RIUUK: The EURAD-IM is applying a derivative of the mineral dust module with a volcanic eruption column simulator, to account for a flexible height and time source function. In addition to AOD retrieval systems integrated in EURAD-IM earlier, a LIDAR observation operator for ground based and satellite borne (CALIOP) data has been installed. The system has been applied and validated for the Eyjafjöll 2010 and Etna December 2013 eruption, the latter being a voluntary contribution to the ESA VAST project.
MF-CNRM and SMHI: volcanic dust assimilation systems are based on related implementations for AOD.
10.4 References cited
Dee, D. P., Bias and data assimilation, Q.J.R. Meteorol. Soc., 131: 3323–3343, doi: 10.1256/qj.05.137, 2005.
Dee, D. P. and Uppala, S., Variational bias correction of satellite radiance data in the ERA-Interim reanalysis, Q.J.R. Meteorol. Soc., 135: 1830–1841. doi: 10.1002/qj.493, 2009.
Dufour, G. et al., IASI observations of seasonal and day-to-day variations of tropospheric ozone over three highly populated areas of China: Beijing, Shanghai, and Hong Kong, Atmos. Chem. Phys., 10, 3787-3801, doi:10.5194/acp-10-3787-2010, 2010.

MACC-II Final Report – October 2014
96 / 137
Eremenko, M. et al., Tropospheric ozone distributions over Europe during the heat wave in July 2007 observed from infrared nadir spectra recorded by IASI, Geophys. Res. Lett., 35, L18805, doi:10.1029/2008GL034803, 2008.
Elbern H. et al., Emission rate and chemical state estimation by 4-dimensional variational inversion, Atmos. Chem. Phys., 7, 3749-3769, 2007.

MACC-II Final Report – October 2014
97 / 137
11. Regional Ensemble Air Quality Forecasting (ENS) The ENS sub-project primarily focuses on the delivery and the verification of the prototype operational European-scale regional Nearly Real Time (NRT) air-quality services. In direct continuation from MACC, this service is based upon an ensemble of forecasts and analyses performed at seven centers in Europe, recognized for their continuing experience in providing routine operational or pre-operational forecasts at the scale of Europe for several years. The assimilation and forecast suites employed in MACC-II are CHIMERE (operated by INERIS, France), EMEP (operated by MET.NO, Norway), EURAD-IM (operated by RIUUK, Germany), LOTOS-EUROS (operated by KNMI, Netherlands), MATCH (operated by SMHI, Sweden), MOCAGE (operated by MF-CNRM, France) and SILAM (operated by FMI, Finland).
Every day, forecasts for each hour and analyses for each hour for the day before are produced by the seven designated centers. The results of the seven individual forecasts and analyses are processed centrally at MF-CNRM by computing ensemble products on a 0.1° latitude x 0.1° longitude grid and a series of verification products, and by displaying the regional NRT products on the MACC-II web platform.
The individual forecasts/analyses make use ECMWF IFS operational forecast data for their meteorological forcings, anthropogenic and fire emissions from EMIS and FIR subprojects, as well as the chemical boundary conditions provided by GDA subproject for chemical compounds and by AER for aerosols. The seven regional air quality assimilation systems producing the analyses have been further developed during MACC-II based on the research work done in EDA subproject, in particular on the combined use of surface and satellite-based observations.
Within MACC-II project, the following extensions of the regional product portfolio were achieved, based on the users’ recommendations:
• The European domain has been enlarged from 15°W-35°E 35°N-70°N to 25°W-45°E 30°N-70°N. It now fully covers a large European continent. This extension was put in place in November 2012.
• The 72h forecasts run in MACC have been extended to 96h in MACC-II, still with hourly outputs. This extension was also put in place in November 2012.
• Based on the MACC developments, birch pollen 96h forecasts at surface have been produced daily since the 2013 season (from 1st of March to 30th of June).
• The number of vertical levels for the daily forecasts has been increased: additionally to the levels provided in MACC (surface, 500m, 1000m and 3000m altitude), the 50m, 250m, 2000m and 5000m are provided since May 2014.
• The number of species provided for the daily forecast has also been increased: additionally to the MACC core species (ozone, NO2, SO2, PM2.5, PM10, CO), the following additional species are produced since June 2014: NO, NH3, total NMVOC (Non-Methane Volatil Organic Compounds), PANs (PAN+PAN precursors).
These last two extensions are mainly designed for users running air quality forecast models at fine scale. The choice of the number of added levels and added species is a compromise between the users’ requirements and an affordable production system.

MACC-II Final Report – October 2014
98 / 137
The whole set of extensions described above increases largely the data transfer volume and time, the processing time and the associated storage. This is why technical work was needed to optimize the seven individual production times, the data format and the ensemble processing to make forecast data available in the morning following MACC-II users’ requirements (now at 07UTC for the first 48h of the forecast).
For the daily analysis production, the seven systems assimilate mainly the observations from the European air quality monitoring stations. Thus, the delivery time of the analyses is tight to the time of availability of these observations. At the beginning of MACC-II, these data were acquired as in MACC, country by country, based on bilateral agreements. An important piece of work has been done in collaboration with OBS subproject to prepare the use of the EEA (European Environment Agency) NRT database instead of the country-by-country system. The EEA database gathers European air quality data in NRT. MF-CNRM now acquires on a daily basis these data from EEA, store them in the Météo-France operational database and use them for preparing a common dataset for assimilation in the seven individual models. Currently, the EEA does not obtain and thus cannot provide the air quality data early enough to allow the seven centers to produce forecasts starting on the previous day analysis.
The EEA NRT database is also used now for the calculations of the verification products instead of the data gathered country by country as done during MACC project. The verification procedures in MACC-II are in direct continuation of MACC. They include the production of maps and of statistical indicators on a daily basis displayed on the regional website and, additionally, 6-monthly dossiers for the seven individual models and the ensemble evaluating the seasonal (3 months) performances. The set of statistical indicators has been enlarged in MACC-II following VAL subproject recommendations. It now includes the normalized modified mean bias and the fractional gross error which are complementary to the mean bias, the root-mean square error and the correlation. An important evolution of the verification procedure for the forecast is the selection of the air quality monitoring stations to be used in the calculation of the statistical indicators. This selection is done to take into account the typology of measurement sites because there is no uniform and reliable metadata currently for all regions and countries. The data selection follows the work that has been carried out in MACC (Joly and Peuch, Atmos. Env., 2012) to build an objective classification of sites, based on the validated past measurements available in Airbase (EEA). This classification is used in order to restrict verification to the sites that have a sufficient spatial representativeness with respect to the model resolution (10-20 km). The statistical approach using only representative sites -according to the objective classification- is clearly the way forward (as it does not also thin too much the NRT data available), leading to a general significant improvement of the overall skill scores.
To complement this evaluation, special work was dedicated on the Mediterranean area, using for reference two models run by Mediterranean partners (AEMET and AUTH) at higher resolution over two domains of interest (Spain and Greece). This was in view of improving the skills of regional core service models in this specific area, which is recognized as challenging given the specificities of its dynamics and chemistry. This work is not intended to be operational but to document in a research approach the strength and weaknesses of the seven models and the ensemble. The AEMET and AUT model high resolution forecast maps are available daily on the MACC-II website. Additionally, semestrial reports have been provided including detailed analyses of case studies for the high resolution models and the

MACC-II Final Report – October 2014
99 / 137
ensemble, where/when higher resolution matters. This analysis was extended to the seven individual models in the last two reports.
An important research effort has been devoted in ENS to improve the modeling of the aerosols in view of better PM10 and PM2.5 forecasts and analyses. Each of the seven individual modeling groups has upgraded their MACC-II model versions with more detailed representations of the different aerosol components. Together with the use of the latest anthropogenic inventory provided by TNO for 2009 in the course of MACC-II, this has lead to very significant improvements of the PM10 performances indicators towards the end of MACC-II (as documented in the semestrial model dossiers), in particular on the mean bias, root mean square error, normalized modified mean bias and fractional gross error. This is illustrated in Figure 11.1.
Figure 11.1. PM10 mean bias in µm/m3 for spring (March/April/May) 2013 (left) and 2014 (right) as a function of the forecast time. Note that the scale is different in the two plots. Pollen modeling and forecast were also one of the important research activities in the ENS subproject. As part of the extension of the daily forecast to birch pollen since 2013 season, an evaluation of the 2013 production (individual models and ensemble) has been conducted based on a one-year agreement that has been negotiated with 6 EAN (European Aeroallergen Network) countries: Austria, Estonia, Germany, Finland, France, and Ukraine, - for operational access to their daily birch pollen observations. This evaluation has shown that the season start is among the best-predicted quantities. Season ending is much more difficult to predict. A known issue with the current birch source term is its variability, which is still difficult to predict. In parallel, FMI has developed during recent years in co-operation with EAN the primary biogenic aerosol particle emissions routines, in order to take into account new important allergenic taxa, namely grass, olive and ambrosia (Figure 10.2). The modeling of the source terms for these three pollen species have been made available for the MACC-II regional models. This work prepares future extensions of the regional service portfolio.
In parallel, a new research activity has been started in MACC-II in order to develop a CO2 modeling capability in the seven individual models, by coupling systems with surface models representing natural CO2 fluxes and by taking into account anthropogenic CO2 emissions. This is a first step towards carrying out future high-resolution flux inversions. All the seven

MACC-II Final Report – October 2014
100 / 137
individual models have not reached the same level of developments on the CO2 modeling activity. This work needs to be further pursued and consolidated in the future.
Figure 10.2. Examples of pollen concentration (in grains per m3) forecasted by SILAM model for birch (top left), olive (top right), grass (bottom left) and ambrosia (bottom right). The forecast products most used are the ensemble products. This is because, by essence, they are on average better than the individual models, although the individual forecast can be better than the ensemble at some locations and for some dates/times. The method currently used to build the ensemble for both the forecasts and the analyses is the median. Its main advantages are that it is robust because not sensible to outliers and it is computationally efficient since it only requires the seven individual model outputs. In MACC, a few alternative methods were explored. This work has been continued in MACC-II taking advantage of newly published approaches proposing ensemble methods for air quality forecasts. The first results of the comparison for ozone in summer have shown that the median method is generally the best method during daytime, but other methods have better performances at night (Figure 10.3). This work needs to be tested on longer time periods and other alternative methods can still be investigated.

MACC-II Final Report – October 2014
101 / 137
Figure 10.3. Comparison of three ensemble methods: root mean square error (left panel) and correlation (right panel) with surface ozone measurements. Green curves are for the median method, yellow curve for the method based on the root mean square errors from the day before (work done in MACC) and the pink curve for a method based on a decomposition in spectral components (from Galmarini et al. ACP, 2013). The MACC-II service is in the continuity of MACC but includes the organization of the transition from prototype operational services to an operational phase, post MACC-II. It is important to note that the funds given in MACC-II do not provide the possibility of a 7 days/7 days and 24h/24h monitoring. Consequently, the current system has to be regarded as the demonstrator of the fully operational system that is planned for the Copernicus atmosphere service phase. The NRT regional air-quality services are distributed over the seven production centers providing robustness and richness to the system, but requiring to organise the operations in a distributed context. Météo-France plays a central role in the European air quality production since it centralizes the seven model forecasts and analyses and the observations used for the assimilation, it produces the ensemble forecasts and analyses, the plots for the website, it develops/maintains the web site, it produces the files for the numerical data server and it develops/maintains the ftp numerical data server. Work has been done within MACC-II to consolidate the individual and central chains to increase their reliability based on operational procedures, software and databases similar to those used for Numerical Weather Prediction. At the end of MACC-II, most of the components are fully operational (demonstrator mode), the remaining ones being planned to be fully operational within MACC-III. The feasibility of a service certification under ISO 9001 standard has also been investigated.
All the work achieved in ENS subproject has required an important effort of coordination between the ENS partners but also with many other MACC-II subprojects, in particular with the other two regional subprojects EDA and EVA (with regular meetings). Moreover, attention was given to fulfill, as possible, the users’ needs thanks to collaborations with INT and POL subprojects. During the course of MACC-II, the number of users of the regional products has largely increased (above 100) together with the variety of applications based on the ENS products (research, operational, institutional and commercial).
The description of the current status of the ENS production chains is the subject of a paper in preparation to be submitted to the MACC-II GMD special issue.

MACC-II Final Report – October 2014
102 / 137
12. Validated Air Quality assessment (EVA) The so-called EVA services relate to detailed analysis of air quality over past situations thanks to validated material issued from observation networks, Earth observation and modelling. Therefore, a posteriori validated air quality assessments for Europe, based on re-analysed air pollutant concentration fields are proposed. “Re-analysis” means that simulations of air quality are performed by regional chemistry-transport models over past years and “improved” thanks to the assimilation of available validated in-situ and satellite observations. Re-analyses are compiled and commented in the MACC-II regional air quality assessment reports which describe, with a yearly frequency, the state and the evolution of background concentrations of air pollutants in European countries. Special care is given to regulatory pollutants characterised by the influence of long range transport, correctly caught by European scale modelling systems: ozone, nitrogen dioxide, particulate matter (PM10 and PM2.5). Focus on specific pollution episodes that happened during the year will be considered.
The EVA service is closely linked to the other two regional air quality services, ENS and EDA:
• The suite of models used in EVA is the same as the one developed and run in the ENS services to provide daily air quality forecasts and analyses. The seven models involved (and their upgraded versions) are exactly the same and concern CHIMERE (operated by INERIS, France), EMEP (operated by MET.NO, Norway), EURAD-IM (operated by RIUUK, Germany), LOTOS-EUROS (operated by KNMI, Netherlands), MATCH (operated by SMHI, Sweden), MOCAGE (operated by MF-CNRM, France) and SILAM (operated by FMI, Finland). As for ENS, an ensemble model is built up on the median of individual model results.
• Re-analyses are data assimilated model results performed by the data-assimilation modeling chains developed by each team in the EDA sub-project. Generally, in-situ observation data are issued from the AIRBASE database maintained by the European Environment Agency (EEA) to gather observations from all regulatory monitoring networks in the European Union are used. Some teams used more observations; especially RIUUK and KNMI who operationnaly assimilated satellite observations from NO2.
The EVA services are based on a high level of quality control. Indeed all individual models’ results as ensemble model’s results are evaluated against a set of observations that are not used in the data assimilation process. The set of observation data selected for verification and evaluation processes is defined before each yearly re-analysis process.
Within MACC-II project, two main challenges needed to be solved to implement operationally the EVA services:
• Development of the operational air quality re-analysis infrastructure by the individual modelling teams and development of by the coordinating team in charge of the ensemble calculation (INERIS)
• Production of the yearly validated assessment reports with a frequency and a delay compatible with the users’ needs. National agencies or policy bodies in charge of air quality management and monitoring are among the most active users of the service. During the users ‘ meetings and exchanges we had, they requested publication of the EVA assessments as soon as possible to get them for the regulatory reporting

MACC-II Final Report – October 2014
103 / 137
process according to the Air quality Directive (2008/50/EC). A lot of work had been done during MACC-II to satisfy such request and to define an optimal time line for service delivery.
12.1 Development of the operational infrastructure
Each modelling team involved in EVA (seven regional air quality models) had to develop by the end of MACC-II the operational infrastructure that provides air quality re-analyses for the past years. A lot of work has been done for the EDA and ENS projects as well. Within EDA, teams developed and evaluated data assimilation methods in their chemistry-transport model while evolution of the model parametrisations and model set-up (domain, input data...) was driven by ENS work plan. At the individual model level, EVA production was dependant of progress of work in both EDA and ENS sub-projects.
During the MACC-II project progress of work on data assimilation chain determined the level of operationality of the EVA process and in some sense the quality of the products. During the project three years were re-analysed: 2010, 2011 and 2012.
• For the 2010 EVA report, two modelling chains were not ready to produce re-analysis of air pollutant concentration fields and delivered only raw simulations. The other provided data assimilated fields but some were still under testing.
• For the 2011 report, all but one among the seven models were ready (but still not fully operational).
• At the beginning of 2014, when the teams started to process the 2012 re-analyses, all of them were ready and operational. For the first time, for the year 2012, all the individual modelling teams provided data assimilated results for at least two of the targeted pollutant, and it was possible to calculate more robust ensemble results for 2012 assessment report. Table below summarizes the characteristics of the re-analysis chains developed by the EVA modelling teams.
Moreover, the term “operational infrastructure” relies not only on the modelling chains, but also on the material components (supercomputing, secured space disk for archives...). Therefore MACC teams had to secure supercomputing systems to be able to bear the EVA production, which requires very high resources (one full year of simulations for a yearly report).
Data assimilation was not the only functionality for which the EVA teams realised development and upgrade during the project. They also work on:
• Operational use of forest fire emissions from the FIRE work package to improve PM re-analyses which could be very sensitive to this kind of emissions
• Use of aerosol boundary conditions from the AER work package
• Use of new sets of observation data selected with the support of the OBS work package. However a majority of models assimilated only in-situ observation data provided by the AIRBASE database. Only two teams were able to assimilate operationally satellite observations (RIUUK and KNMI). This was a matter of priority to allow teams to concentrate their work on model development.
However it should be noted that other datasets (for instance those provided by research air quality and atmospheric composition networks) were used to analyse air pollution levels and episodes that occurred in the years studied during the MACC-II period. In particular

MACC-II Final Report – October 2014
104 / 137
chemical composition of PM from the ACTRIS network and vertical distribution of air pollutant as available from the LIDAR EARLINET networks were considered.
INERIS was responsible about the re-analysis ensemble computation. It collected the model results provided by the EVA partners, run the post-processing procedures to build up ensemble reanalyses, perform an overall assessment of models performances (individual and ensemble) and produce automatically a set of indicators to be used in the EVA reports. This chain of treatment and evaluation process was developed and implemented by INERIS, and became fully operational in 2013.
12.2 Assessment report production and routine evaluation
Three assessment reports have been published during the project period, 2010, 2011 and 2012. However, the production process significantly speeded up over the last period project when the individual modelling systems became more and more operational. As a consequence, if the publication of the 2010 report took some time (about 18 months after the project started) because some modelling chains had to be upgraded in the first phase of the project and some principles (for instance data format to be used) needed to be fixed, the 2012 report was generated and published within a period of 6 months.
With the publication of the 2011 report it should be noted that for the first time since the publication of the 2007 assessment report, all but one among the modelling teams managed to run their data assimilation chains over the whole year for at least one pollutant to build up the expected air quality indicators. Consequently, the quality of the 2011 Ensemble maps resulting from the combination of individual “data assimilated” maps improved significantly compared to the previous years. However some results showed that the re-analysis modelling chains were still not fully validated. Teams still worked to make them more robust, and the results more accurate. The 2011 European air quality assessment results have been presented during the 1st MACC-II policy workshop held in November 2013 in Brussels. It was one of the first initiatives for the promotion of the EVA service products.
The EVA 2012 assessment report was published by summer 2014. This time, all the modelling teams provided data assimilated results for at least two pollutants. Therefore the EVA reports became more consistent and their quality improved. As examples, Figures 12.1 and 12.2 represent some results for PM10 indicators (annual mean and number of days when the daily limit value was exceeded) which are among the most sensitive results provided by the service (limit values for PM10 are still exceeded in several European countries while compliance should be respected since 2005!).

MACC-II Final Report – October 2014
105 / 137
Figure 12.1. 2012 Reanalysis of the PM10 annual average in Europe (Ensemble data assimilated chain of the MACC-II/EVA systems)
Figure 12.2. Number of days exceeding the 50 µg.m-3 threshold (daily average) simulated by the MACC-II/EVA system in 2012 For the three targeted years, a systematic evaluation of the individual models and ensemble model results have been conducted by INERIS, comparing the simulated concentrations of regulatory pollutants to actual observed concentrations. All the models are compared against the same set of observation data and following strictly the same process. Of course the set of stations used for the evaluation was different from the one selected for feeding data assimilation systems. For each re-analysed year, INERIS prepares the observation dataset to be used by the teams for data assimilation. It is reviewed according to the updated topology of the European networks. A set of data is also kept for the evaluation/ validation process. According to this process, INERIS sends feedback about each model’s behaviour to each modelling team and iterates with them to analyse models’ behaviour, and improvements and to validate the production. The Ensemble model results are also evaluated against the same set of observation data and considering the same performance

MACC-II Final Report – October 2014
106 / 137
indicators. Results are published in a specific “validation report” which compiles and comments those indicators. They refer to bias (difference between observations and model results), correlation coefficients, root mean square errors.
Globally, over the three years covered during the project, we have noted a significant improvement of the results provided by the teams, and by this way of the ensemble. The results are definitively in good agreement with the state of the art. In particular, this work gave the opportunity to establish a quantitative analysis of the added value of the data assimilation process. Performances related to PM10 results (for various station typologies) for the year 2012 are presented in the Figure 12.3 below. It is a Taylor diagram, which aims at representing on the same graph various performance indicators as the correlation coefficient (arc of the circle) and the root mean square error (internal mid-circles). Data assimilated results are grouped in the red ellipse. Improvement compared to raw results is clearly illustrated, and results are considered as very satisfactory with the data assimilated ensemble results getting a correlation coefficient with observations of about 0.7-0.8 and root mean square error (RMSE) ranging from 10 to 12 µg.m-3.
Histograms on represent for the years 2010, and 2012 the root means square error for all the models (individual and Ensemble, with and without data assimilation) for the ozone daily peak indicator, at urban stations in European regions.
This kind of graph show that the number of data assimilated models involved in the process improved, as the quality of the results.
Figure 12.3. Taylor diagram of MACC-II models’ simulations of the PM10 daily mean concentrations over the year 2012. Data assimilated results are noted with the “a” index.

MACC-II Final Report – October 2014
107 / 137
Figure 12.4. Root mean square error at urban stations calculated with all the EVA models for the years 2010 (top) and 2012 (bottom) over European regions: EUW= Western Europe, EUC= Central Europe, EUS= Southern Europe, EUN= Northern Europe, EUE= Eastern Europe. The EVA assessment reports have been presented to the European Environment Agency and the EIONET community, the network of national focal points for air quality monitoring coordinated by the EEA. It was welcome by those users. However they asked for facilities to use the EVA products (files of numerical data for instance).
The 2011 European air quality assessment results have been presented during the 1st MACC-II policy workshop held in November 2013 in Brussels. It was one of the first initiatives for the promotion of the EVA service towards a wider community of potential users. It was a successful initiative and feedbacks were very instructive. We understood that national and European (DG ENV, EEA) were ready to use those reports, provided that they are published in appropriate time according to the air quality reporting process set by the air quality Directive. This objective was achieved with the publication of the 2012 report in July 2014, with a delay comparable to the one used by the EEA or the EMEP monitoring program (www.emep.int) under the UN Convention on Long Range Trans-boundary Air pollution to publish their own assessments.
Time for publication of the EVA validated assessment reports is constrained by the time needed to get officially validated data from the AIRBASE database. Because publication of

MACC-II Final Report – October 2014
108 / 137
those data is issued from a regulatory process framed by the European Air Quality Directives, the time line is stringent, and data of year Y are reported to the EEA by October of year Y+1 and data are released at the beginning of year Y+2. This is the reason why we defined a process to publish an interim report for the year Y at the beginning of each year Y+1. It will be tested in the next phases of the implementation of the Copernicus Atmosphere services.
Through the website, it is important to give access not only to the commented maps of air quality indicators, but also to the numerical results. A selection of maps is published on the POL webpage (EVA products are considered as policy relevant ones). A lot of work has been done in collaboration of Météo-France (CNRM) who coordinates the ENS sub project to publish archives of numerical EVA data on a portal devoted to regional air quality projects in MACC. Before this initiative is achieved, numerical data were accessible at INERIS on demand.

MACC-II Final Report – October 2014
109 / 137
13. Policy-relevant applications (POL)
13.1 Introduction
During the transition towards the Copernicus Atmosphere Monitoring Service, the development of tools and provision of results have to occur according to the needs and requirements of users and potential users. Focussing on policy users in particular, the objectives of the sup-project POL in MACC-II were to further develop products that are of relevance to European air quality legislation, and to establish links between product developers, data providers and users.
The interaction between POL and its users was two-way, including user feedback to be taken into account in the development of our products. The provision and development of policy-relevant products also requires a considerable share of research and technical work.
The sections of this chapter proceed along the main lines of activity within POL, i.e. the technical development and maintenance of services, research activities, and the interaction with users (and potential users) of our products.
13.2 The product lines of POL
The main goals of POL in terms of product development were to provide information about:
• the efficiency of emission reduction measures to mitigate or to prevent air pollution episodes on the short term;
• the sources contributing to air pollution episodes in the past, and to predicted air-pollution in the near future.
Within POL two main products have been further developed to address these goals: the Green scenarios toolbox and the Source-receptor products.
13.2.1 The ‘Green Scenarios’ toolbox
The toolbox for emergency control scenarios, or “green scenarios”, is conceived to increase awareness of policy makers and the general public on the potential impact of emission reduction strategies that can limit the intensity of an air pollution episode, if these measures are decided a few days before the episode occurs. The toolbox has been developed by INERIS and provides, on a daily basis, European maps presenting the expected effect that short term measures on emissions from various activity sectors may have on predicted air pollution. Maps of concentrations of ozone, nitrogen dioxide, as well as particulate matter (PM) corresponding to various assumptions on emission reduction, are available. The simulations are performed as (up to) three days forecasts.
If measures are decided sufficiently in advance (several days before the episode occurs) and implemented over relevant geographical areas, they could avoid situations where limit values are exceeded. In this respect it is also important to distinguish control measures by emission sector. For example it is well-known that PM episodes in spring are due in most cases to high ammonium nitrate concentrations which result from both agricultural (ammonia) and traffic (NOx) emissions. Thus it would be more efficient to target those sectors during these episodes than the industrial sector.

MACC-II Final Report – October 2014
110 / 137
The toolbox considers four control scenarios, assuming emission reductions for road traffic, residential heating, agriculture, and industrial activities, respectively. The model calculations are done with the CHIMERE air quality model (which is part of the MACC-II regional model ensemble) using meteorological conditions from the ECMWF-IFS model, boundary conditions from the global MACC-II productions (Mozart and IFS-AER), and emission scenarios based on the MACC-II European emission inventory provided by TNO. The emission sectors are reduced by a fixed amount over the whole of Europe. As an example Figure 13.1 shows for 19 August 2014 the change in ozone and PM that would result from a 30% reduction in traffic and agricultural emissions, respectively, two days after implementation of these measures. The toolbox is accessible from the MACC-II Policy Portal at: http://www.gmes-atmosphere.eu/services/aqac/policy_interface/green_scenarios/. The Green scenarios toolbox is further described in Deliverable report D_133.2.
Figure 13.1. Change in daily maximum ozone (left) and PM2.5 (right) that would result from a 30% reduction in traffic and agricultural emissions, respectively, two days after implementation of these measures. Unit: μg.m-3.
13.2.2 Source-receptor calculations
Important questions concerning Air Quality policy include:
• What causes air pollution episodes? • Can they be prevented by local measures? • How much of the pollution is imported and from where?
The source-receptor products, available from the Policy Portal of MACC-II at: http://www.copernicus-atmosphere.eu/services/aqac/policy_interface/source_allocation/ are being developed to help answering these questions, in order to support short term action or to give hints on future legislation that can help prevent such episodes from re-occurring. The model calculations on which the product is based are performed by MET.NO with the EMEP MSC-W air quality model (which is part of the MACC-II regional model ensemble) using forecast meteorology from the ECMWF-IFS model and emission data from the MACC-II European emission inventory provided by TNO. Previously, MET Norway had done such calculations only on an annual-mean basis for past periods in the frame of the EMEP programme under the UN Convention on Long-range transported Air pollution, while

MACC-II Final Report – October 2014
111 / 137
now, in MACC and MACC-II, the calculations have been modified to (short-term) forecast mode.
Currently two types of source allocation can be provided, 'Country source-receptor calculations' and 'Regional source-receptor calculations'. The Country source-receptor calculations identify the main contributors to forecasted air pollution episodes in countries or in user-defined (rectangular) areas. For example, when the Air Quality forecasting system of MACC-II ENS predicts a high-ozone event within a given region, the tool can be used to identify the main contributors to this event in a quantitative manner. An example of this calculation is given on the webpage. Until now, as this calculation is computationally expensive the service is provided only on request, and multiple requests cannot be processed quickly yet. Regional source-receptor calculations, on the other hand, allow focus on selected agglomerations in Europe. For example, when the Air Quality forecasting system of MACC-II ENS predicts a high-ozone event for the Paris region, the tool can be used to quantify indigenous (from local sources) and transported contributions (from sources outside the Paris region) to this event. Until now this service is provided only for a small selection of urbanized regions on a weekly basis. An example case is shown in Figure 13.2 for a summer situation in Paris.
The Source-receptor products are further described in Deliverable report D_132.2.
Figure 13.2. Effect of a 15% reduction of emissions within Paris (left) and outside Paris (right) on PM10 levels within Paris in July 2014. Changes are given in percent, averaged over the Paris region.
13.3 Research in POL
POL also included elements of research which are relevant to Air quality legislation. For example it is well established in the scientific community that future climate change will affect air pollution. MET.NO conducted experiments were an air quality model was driven by climate data representative of present-day and future conditions.
For designing emission reduction protocols it is also important to have a good understanding of their efficiency in reducing air pollution. CNRS-LISA and INERIS conducted a number of air quality model runs, assuming different emission reduction measures, and compared them with the Gothenburg protocol.
13.3.1 Climate / Air quality interactions
The EMEP MSC-W model was run with climate data provided by the NorESM Earth system model for present-day conditions and for future (year 2050) conditions. All chemical species considered in this analysis (ozone, NOx and particulate matter) show clear responses to

MACC-II Final Report – October 2014
112 / 137
climate change. In most cases, emission reductions as projected in the future scenarios used overcompensate for the effect of climate change, leading to improvements of air quality in most cases. In some cases, e.g. particulate matter in arid areas, the effect of changes in wind speed and precipitation dominate through their effects on windblown dust. The results are presented in more detail in Deliverable report D_131.3, which also includes calculations of long-range transported air pollution for a present and future climate situation.
13.3.2 Future green scenarios
Using the CHIMERE air quality model, CNRS-LISA investigated the ability of the Gothenburg Protocol (http://www.unece.org/env/ lrtap/multi_h1.html) to improve air quality levels in Europe by year 2020. Regarding air quality standards, the Gothenburg scenario appears satisfactory as it removes primary and secondary air quality limit exceedances. However, the remaining peaks are still close to the regulatory limits. Furthermore, many areas of Europe still largely exceed the 50 μg.m-3 daily value for PM10 in the Gothenburg scenario. Finally, local-scale exposure may be much higher than the cell-averaged output concentration produced by the model for PM10 and NO2.
In addition effects various emission reduction measures on different sectors were investigated. The effects are highly variable depending on the species considered, the season and meteorological conditions, the region affected, and the emission sector that is controlled. For example, in the Po Valley, reductions in traffic emissions appear to be more efficient in reducing NO2 concentrations than in the BeNeLux area most of the times. PM levels can be efficiently reduced by controlling NH3 from agriculture; however, during intense pollution events only emission control of the industrial sector is able to significantly reduce peak concentrations.
From these results, it appears clear that only a combination the control of different emission sectors may help in efficiently reducing pollutant levels. More detailed presentations of these results are found in Deliverable reports D_133.1 and D_133.3.
13.4 Interaction with Air Quality policy users
The development of products relevant to policy depends strongly on feedback from policy users regarding the tools being developed and the results that are provided. Furthermore, for a service to be successful it is important to demonstrate the available tools and to promote their use.
The interaction with policy users was thus an important element of POL. Main activities during MACC-II were the development of a web interface, an overview of already existing users, and the organization of a workshop for users (and potential users) within the European Air Quality policy infrastructure.
13.4.1 The Policy User portal
During MACC-II, NILU and MET.NO established a web page to simplify access to policy-relevant products not only from POL but also from other subprojects of MACC-II, and to promote their use (e.g. ‘green scenarios’ toolbox, source-receptor calculations, chemical weather forecasts, and annual Air Quality assessments). In addition, information on POL

MACC-II Final Report – October 2014
113 / 137
activities that are relevant for policy users is presented (e.g. reports from the Policy User workshops). Since early 2012 this so-called MACC-II Policy Portal can be accessed at: http://www.copernicus-atmosphere.eu/services/aqac/policy_interface/.
13.4.2 User classification
Within MACC-II there have been many instances of interaction and collaboration with users, but it had not yet been systematically investigated who these users are, what kinds of organisations they represent, and for what purpose they use which products. The user classification done by EAA within POL was a first step in this direction. It is not a comprehensive or statistical analysis of the overall usage of MACC-II products, but reflects upon different approaches regarding the questions above and is intended to pave the way for future related studies.
The activity identified a number of long-term users that have been active since the ESA GMES Service Element PROMOTE and through MACC-II. Some users are, at the same time, also active as providers (e.g. the European Environment Agency, delivering in situ data to MACC-II but also using output from the project). Regarding the users of regional Air Quality services of MACC, 10 industrial users, 7 policy users, and 17 scientific users were identified through signed protocols and download statistics. The purposes of the downloaded data include (number of instances in parentheses):
• boundary conditions for other work (8); • commercial (1); • data processing/value adding/validation (6); • direct use for environmental information (6); • scientific studies (14).
More comprehensive lists of active users in different categories were provided in tabular form in Deliverable report D_134.3.
13.4.3 The 1st Policy User workshop of MACC-II
The 1st Policy user workshop of MACC-II took place on 27/28 November 2013. It was organized by the MACC-II partners NILU, INERIS, MET.NO and ECMWF and hosted by the Research Executive Agency in Brussels. It attracted about 40 participants from more than 10 different countries. The workshop started by an afternoon session where policy-relevant products of MACC-II (from POL but also from other sub-projects) were presented to the audience. In the second session, user cases were presented by users of MACC-II products, both from the policy and the scientific communities. A panel discussion followed where key speakers representing different user groups were invited to give their comments on the specific MACC-II products and on the policy relevance of MACC-II in general. Finally, group discussions were organized to receive comments from all participants on each of MACC-II’s main policy product lines: 1) daily chemical weather forecasts, 2) periodic reports on air quality status and exceedances, 3) information on scenarios, and 4) source allocation products. Participants were asked about their suggestions for improvement of existing services as well additions of new products.

MACC-II Final Report – October 2014
114 / 137
The workshop was a great success in the sense that increased interest in MACC-II products was generated, and valuable feedback from users and potential users was obtained to support the further development of our products and their tailoring to air quality policy use.
More detailed information (including the agenda, all workshop presentations, and a workshop report) can be found at the Policy Portal: http://www.copernicus-atmosphere.eu/services/aqac/policy_interface/first_pol_workshop/
13.5 Summary and outlook
Overall, POL has achieved its objectives. The policy-relevant products of MACC have been further developed and demonstrated in MACC-II, interfaces between providers and potential users have been established, and the usefulness of these products has been confirmed by the European air quality policy arena. Important feedback on available products was received during MACC-II, supporting further development of policy-relevant products in MACC-III.
Future challenges will be to find a balance between what is needed and what can be achieved given the current resources. Regarding the products of POL, the main limiting factor is the large computational requirement rather than a lack of scientific knowledge or fundamental technical capability. Also resources on the user side are limited.
Nevertheless, in MACC-III further development of products will occur in response to feedback from potential users to the extent possible and the interaction with users will be strengthened further by the organization of a second policy user workshop.

MACC-II Final Report – October 2014
115 / 137
14. Solar radiation services (RAD)
MACC combines monitoring and forecasting UV services with services for solar energy users relying on long-term databases of solar surface irradiance. These services make use of ozone, aerosol and total water vapour content (TWC) results based on global data assimilation and modelling together with Meteosat Second Generation capabilities for cloud monitoring.
Regarding the validation of the UV processor and prognostic aerosols, ground-based spectral data and near real time broadband COST UV index (UV-I) data were investigated. Moreover, a summary of efforts to find the areas where to improve the UV processor is given – this is a reaction on overestimations found in the shorter wavelengths inside the UV-B range. This is done by using a stand-alone version of the UV processor.
An assessment of direct and global irradiance forecast capabilities of nowadays ECMWF IFS system has been performed additionally.
The MACC-RAD information system commands the execution of the new Heliosat-4 method, and gives access to the Helioclim-4 database through two services: Helioclim-4 and McClear delivering time-series of irradiation. It includes a monitoring of the inputs databases relating to the atmosphere properties (MACC) and to the cloud properties (APOLLO), and a quality control of the consistency of the SSI products. The infrastructure adopted for the MACC-RAD information system is fully aligned with GEOSS (Global Earth Observation System of Systems) recommendations on interoperability. This ensures a wide dissemination of the results. The service McClear is fully operational since January 2014, and Helioclim-4 since April 2014. In July 2014 the MACC-RAD information system counts 110 active users for more than 14000 requests.
14.1 The Heliosat-4 method and processing chain
The Heliosat-4 method is based on the decoupling solution proposed by Oumbe et al. (2014) that results from MACC and MACC-II projects. It was demonstrated that the solar irradiance at ground level computed by a radiative transfer model can be approximated by the product of the irradiance under clear atmosphere and a modification factor due to cloud properties and ground albedo only. Changes in clear-atmosphere properties have negligible effect on the latter so that both terms can be calculated independently.
A fast clear-sky model called McClear (Lefèvre et al., 2013) was developed to estimate the down-welling direct and global irradiances received at ground level under clear skies. McClear implements a fully physical modelling replacing empirical relations or simpler models used before. It exploits the recent results on aerosol properties, and total column content in water vapour and ozone produced by the MACC project. It accurately reproduces the irradiance computed by the libRadtran reference radiative transfer model with a computational speed approximately 105 times greater by adopting the abaci, or look-up tables, approach combined with interpolation functions. It is therefore suited for geostationary satellite retrievals or numerical weather prediction schemes with many pixels or grid points, respectively.
Another result from MACC and MACC-II projects is that the vertical position and the geometrical thickness of a cloud both have a very small effect on the global irradiance. As a

MACC-II Final Report – October 2014
116 / 137
consequence, typical altitudes of clouds may be selected instead of updated and localized values. Four types of clouds -low, medium, high water/mixed phase, and thin cirrus- have been selected as this information is provided by the APOLLO for each pixel (3 km at nadir) and every 15 min with a mask cloud-free/cloudy and the cloud optical depth. Cloud coverage, i.e. the fraction of a pixel covered by a cloud is derived for each type of cloud separately. Similarly to McClear clear-sky irradiances, the McCloud cloudy sky irradiances are computed by the means of a look-up table approach combined with interpolation functions between the nodes of the tables.
The Heliosat-4 chain implements the Heliosat-4 method (Figure 14.1). Several data are received from various sources: MACC, DLR and NASA. Currently, the processing for producing a product is made on-request (on-the-fly).
Figure 14.1. Schematic representation of the HelioClim-4 chain for computing irradiance products. The three databases are part of the HelioClim-4 database. The term ‘near-real-time’ has to be interpreted as within 2 days.
Several types of quality control are performed in the HelioClim-4 workflow: 1) checking the smooth running of the product generation workflow in compliance with specifications, 2) checking the quality of the inputs to the Heliosat-4 method, 3) benchmarking the HelioClim-4 irradiance products against high quality measurements made in ground stations in order to provide estimates of the quality of the retrieved irradiance, 4) monitoring the consistency of this quality of product, and detecting possible trends. Figure 14.2 is an example of the automatic monitoring of the collection of data from ECMWF for total column content in ozone.
Source: MACCParameters: H2O, O3,
aerosol propertiesFrequency: daily
Database atmosphere
Source: DLRParameters: cloud properties
Frequency: 15 min
Database cloud
Source: MINES ParisTechParameters: BRDF model
parameters of ground albedoFrequency: climatology
Database albedo
McClearModel
McCloudModel
Heliosat-4 Method
Manual / automated requestfrom MACC site or SoDa
Service˝Near-real-time˝ processing

MACC-II Final Report – October 2014
117 / 137
Figure 14.2. Example of graph automatically created for monitoring the collection of data from ECMWF for total column content in ozone. Year is 2012. Each row corresponds to a month; days are in column. Each cell (month, day) is made of eight squares, corresponding to the 3 h values. Red means that data is missing, orange that data is present as a forecast with a horizon greater than 24 h, green that data is an analysis or a forecast less than 24 h. The blue square indicates the latest monitoring run.
Figure 14.3. Statistical distributions of 1 min values of Global Clear-sky irradiances for the last day (yellow) and the last week (orange) compared to the 2004-2012 reference (green), for each UT hour (left) and for the running month (right). Circle: mean value; middle line: median; box limits: percentiles 0.25 and 0.75; extreme lines denote the outliers.
A quality control of the consistency of SSI products is daily and automatically produced in the form of boxplots (Figure 14.3) for some selected areas where the past days SSI are compared to a reference period. A large discrepancy on current day global SSI compared to a reference period for these areas should suggest a failure in the HelioClim-4 workflow.
14.2 The MACC-RAD Information System
It constitutes the interface to users and commands the execution of the Heliosat-4 method on-the-fly. Through the information system (Figure 14.4), registered users (which have signed the Licence terms for MACC Products and Services) may access the two services: Helioclim-4 and McClear delivering time-series of irradiation. The MACC-RAD Web services

MACC-II Final Report – October 2014
118 / 137
1) are described in existing catalogues, 2) are deployed on the energy community portal (webservice-energy.org), 3) bear clear references and links to MACC and the Copernicus Atmospheric Service as a whole, and 4) can be invoked through the Web using GEOSS (Global Earth Observation System of Systems) standards.
Figure 14.4. Sketch of the MACC-RAD Information System and its integration as a GEOSS component
14.3 The HelioClim-4 and McClear services
The McClear service provides time-series of irradiation that should be observed in any place in the world at any time starting from 2004-01-01 if the sky were clear, i.e. cloudless. This service is in place since October 2012. It has been improved in terms of usability and is fully operational since January 2014.
The HelioClim-4 service provides time-series of irradiation at any place in the field of view of the Meteosat satellite, i.e. Europe, Africa, Atlantic Ocean, at any time starting from 2004-02-01 in the future, and from 2013-01-01 onwards in the current test phase. The service is in place since January 2014 and is operational since April 2014.
There are two means of access to each service. One is manual via a web interface located at www.soda-pro.com (Figure 14.5). The other is for automated access via computers and is documented at webservice-energy.org. Both HelioClim-4 and McClear are currently in the ‘MACC II - experimental routine production mode’.
GEOSS CSR
Request– AnswerRegistered
Operational SystemRadiation Database
webservice-energywebservice-energy.org
Catalog OGC CSWINSPIRE-compliant
OGC Web Services• Australia Climate• HelioClim-3• SOLEMI• MACC-RAD
SoDa Servicewww.soda-is.org
MACC-RAD Client

MACC-II Final Report – October 2014
119 / 137
Figure 14.5. Interface of the McClear client in the SoDa Service or MACC Web site. Through satisfaction questionnaires and/or training courses, we have been capable of identifying several users (37) working for 29 companies in solar energy (Figure 14.6). A second class of users is composed of 41 researchers and academics (PhD, MSc). The class “unknown type” comprises 32 users for which not enough information is available to put them in one of the first two classes.
Surprisingly large is the number of users from companies. Usually, companies do not build processes on services in infancy. We believe that the fame of the MACC products and of the actors behind the Information System: Armines, DLR and Transvalor, has helped in overcoming the initial reluctance. Several companies have established applications for automated access to McClear (mostly) and HelioClim-4. This explains the large number of access. The services benefit to European companies by far. Twenty-one companies are located in the European Union and one in Switzerland. Six companies are located in Northern America, five in USA and one in Canada. The last company is situated in South Korea.
14.4 User’s Guide for the MACC-RAD service
The User’s Guide documents the MACC-RAD service and the user-access procedures to the delivered products. It is a living one and to evolve as the service and its components evolve themselves.
Part A describes the communities of users, their expectations and gives an overview of the compliance of the MACC-RAD service with those. Part B presents the history of Heliosat methods, the legacy HelioClim-3 and SOLEMI databases as well as the methods used to convert satellite images into solar surface irradiance. Part C presents an overview of the new Heliosat-4 method, of the McClear and McCloud models, and the workflow in HelioClim-4 chain. Part D presents the procedure of quality control of the inputs to Heliosat-4, as well as the consistency of products estimates. Part E details the delivering

MACC-II Final Report – October 2014
120 / 137
products and describes the MACC-RAD information system and its integration as GEOSS component.
Figure 14.6. Top: number of registered active users for each class (left) and number of requests made in 2014 per class of users (right). Middle: usage of the McClear/HelioClim-4 services by companies (left) and by researchers and students (right) in percent of the number of respondents. A respondent may provide several answers. Bottom: means of access to data (left) end ranking of the services McClear/HelioClim-4 by users (right).
14.5 Evaluation of ECMWF irradiance forecasts with respect to solar energy users
The European Centre for Medium-Range Weather Forecasts (ECMWF) has recently changed its output variable selection in order to include direct irradiances. Additionally, the MACC near-real time services provide daily analysis and forecasts of various parameters based e.g. on new aerosol properties. The operational ECMWF/IFS forecast system will profit on the medium term from the MACC aerosol forecasts. Therefore, within the MACC-II project an
37
4132
29
Registered active users in 2014
From companies
Researchers / Academics
Unknown type
Number of companies12813
659
706
Number of requests made in 2014
by companies
by researchers / academics
by unknown type
33
3329
24
5 5
Usage of McClear/HelioClim-4 for companies(in percentage of respondents)
Monitoring solar plants
Resource assessment
Sizing solar plants, yield assessment
Improving development of models
Calibrating / monitoring pyranometers
Mapping resources
43
35
13
94 4
Usage of McClear/HelioClim-4 for others(in percentage of respondents)
Modelling solar plants, electricity management, heating demandImproving development of models
Resource assessment
Statistical analyses for climate
Mapping resources
Teaching in solar energy
21
620
5
Access to data
Web portal (companies)
WPS service (companies)
Web portal (others)
WPS service (others)
10
7
411
7
5
Ranking of service
Very good (companies)
Excellent (companies)
No answer (companies)Very good (others)
Excellent (others)
No answer (others)

MACC-II Final Report – October 2014
121 / 137
assessment of the current status is performed. A focus is laid on direct normal irradiance forecasts being needed by concentrating solar technologies and poorly evaluated so far.
Figure 14.7. Day ahead hourly DNI forecast verification – annual relative bias (line) based on daytime values only and together with the two-day persistence in dotted lines.
It was found that the inclusion of the new aerosol climatology in October 2003 improved both the GHI and DNI forecasts remarkably, while the change towards a new radiation scheme in 2007 had only minor and partly unfavourable impacts on the performance indicators. For GHI, larger RMSE values are found for broken/overcast conditions than for scattered cloud fields. For DNI, the findings are opposite with larger RMSE values for scattered clouds compared to overcast/broken cloud situations. The introduction of direct irradiances as an output parameter in the operational IFS version has not resulted in a general performance improvement compared to the widely used Skartveith and Olseth (1998) global to direct irradiance conversion scheme. Cloudy situations and especially thin ice cloud cases are forecasted much better, but large biases are introduced in clear sky cases –calling for the inclusion of the MACC-II aerosol scheme into the operational IFS system.
14.6 Prognostic aerosol validation for monitoring the input to the UV service
For monthly AOD, the ECMWF model tends to follow the AERONET measurements rather well, also representing the yearly cycle correctly for each of the sites (Figure 14.8a). Hourly values, however, exhibit a larger spread. In terms of correlation coefficient and relative mean bias, the best agreement between modeled and measured AOD340, 500 values is seen in biomass burning sites (Alta Floresta and Mongu). For these both sites, the ECMWF model is able to capture the burning season correctly, however, some occasional peaks are underestimated. The AOD for the dust sites included in our study also show rather good agreement with the AERONET observations, and the ECMWF model follows the seasonal pattern in the observed AOD fairly well. The urban sites have the lowest correlation and largest bias.

MACC-II Final Report – October 2014
122 / 137
Generally, a major feature of the model-measurements comparison is that the rMB (relative mean bias) is always smaller at 340 nm than at 500 nm, and the difference between rMB at 340 and 500 nm averaged over all stations is approximately 0.2. Thus, that indicates a rather strong wavelength-dependent feature of the performance of AOD in the MACC system.
Among all urban sites included in the comparison, Thessaloniki shows the largest difference between the performance of AOD340 and AOD500. This is seen also in the Ångström exponent, which is unrealistically low in the model, thus indicating this might have something to do with the overall combination of too little fine mode particles and too many coarse mode particles in the MACC system. This pattern is seen for almost all urban sites. We also analyzed the behavior of the Ångström exponent for the rest of the sites. The results show that the Ångström exponent in the MACC system is too low for all sites included in this study.
In addition, the wavelength-dependent difference between MACC AOD and AERONET-based AOD may be partly, but to a smaller extent, explained by the wavelength-independent optical properties of different aerosol types assumed in the model. For instance, the same refractive index was assumed for SO4 and OC. This assumption means that OC is not absorbing. However, recently there has been growing evidence that some of the organic species are strongly absorbing at UV wavelengths.
Figure 14.8. ECMWF AOD compared to AERONET AOD in Ispra. (a) Monthly mean AOD550 for the period 2003–2006. The modeled total AOD550 consists of five components: sea salt, (SS) dust (DU), organic carbon (OC), black carbon (BC), and sulphate (SO4). The corresponding monthly mean AOD550 from AERONET is shown with a black line (extrapolated using Ångström exponent at wavelength range of 440–870 nm). (b) Modeled AOD with respect to measured AOD at 340 nm (blue dots) and 500 nm (red dots). Data points include only observations, when AOD of both wavelengths are available. Black line represents 1:1 line. (c) Ratio (AODec / AODaer, green line) and absolute difference (AODec − AODaer, blue line) between modeled and measured AOD at 340 nm.
Figure 14.9 presents a comparison between the MACC coarse and fine AOD at 550 nm and AERONET SDA retrievals by showing the relative mean bias (rMB) and the correlation coefficient (CC) for all stations included in the study. The modeled coarse mode AOD550 is defined as SS+DU and fine mode AOD550 as OC+BC+SO4 and compared with measured coarse and fine mode AOD550. For most of the urban sites (blue squares), there is a clear underestimation in fine mode (empty squares) and overestimation in coarse mode AOD550 (color-filled squares). The rMB for fine mode AOD550 averaged over all urban sites

MACC-II Final Report – October 2014
123 / 137
(rMBF,urb) is -0.22; rMB for coarse mode AOD550 averaged over all urban sites (rMBC,urb) is 0.38. This indicates that there is too much coarse mode and too little fine mode particles in the MACC system.
Figure 14.9. Summary of aerosol validation statistics (rMB vs. CC) for modeled coarse (SS+DU) and fine (OC+BC+SO4) mode AOD550 compared to coarse and fine mode AOD550 from AERONET SDA. Filled shapes indicate coarse mode AOD550, whereas empty shapes indicate fine mode AOD550. Each point corresponds to a particular validation site: I – Ispra, M – Mongu, R – Ilorin, P – La Parguera, C – Capo Verde, K – Kampur, E – El Arenosillo, S – Solar Village, A – Alta Floresta, L – La Jolla, T – Thessaloniki, X – Xianghe.
14.7 UV service validation
Validation of UV irradiance has been carried out in MACC project and further in MACC-II. Here we show a good overall agreement between modelled and measured UV irradiances (Figure 14.10). The agreement is better for UVA wavelengths than for UVB with a significant difference in winter and summer months. Clear overestimation can be seen in San Diego at both UVA (320-400nm) and UVB (290-320nm) while underestimation in the rest of the UV sites.
The current understanding of the UV processor, based on the validation against ground-based measurements, is that it is able to estimate the UVA wavelengths relatively well, while it clearly overestimates the shortest wavelengths of UVB, particularly for the cases of lowest solar zenith angles. It is important to investigate the reason and correction for this overestimation, since those wavelengths are very crucial in the erythemal weighting, which in turn determines the UV index. Figure 14.11 shows the ratio spectrally, pointing out that the overestimation increases as the wavelength decreases towards 300nm (as the solar zenith angle decreases).

MACC-II Final Report – October 2014
124 / 137
Figure 14.10. Summary of UV irradiance validation statistics for UVB (290-320 nm – dark colour) and UVA (320-400 nm – light color) compared to measured values from NSF and EUVDB. Irradiances are calculated for summer (green circles) and winter (red circles) periods taking into account that the of Oct-May represents winter in Barrow, Jokioinen, Sodankylä, Thessaloniki, San Diego and summer at the same period in Palmer and McMurdo, whereas Jun-Sep represents winter in Palmer and McMurdo and summer in the rest of the months. Each point corresponds to a particular validation site: J – Jokioinen, M – McMurdo, P – Palmer, B – Barrow, S – Sodankylä, D – San Diego, T – Thessaloniki. This same pattern has been also confirmed by model-to-model comparisons, e.g. in the comparisons shown in the Figure 14.12. They show the model comparisons between the UV processor and uvspec of LibRadtran radiative transfer (Mayer et al., 1997). Both RT models are run with the same input and assuming as similar model setup as possible.
Figure 14.11. Ratio between ECMWF and Brewer irradiance in spectral sense for the same data, for averages of different solar zenith angle ranges in Thessaloniki, 2003-2004, for all sky situations and solar zenith angles larger than 17 degrees.
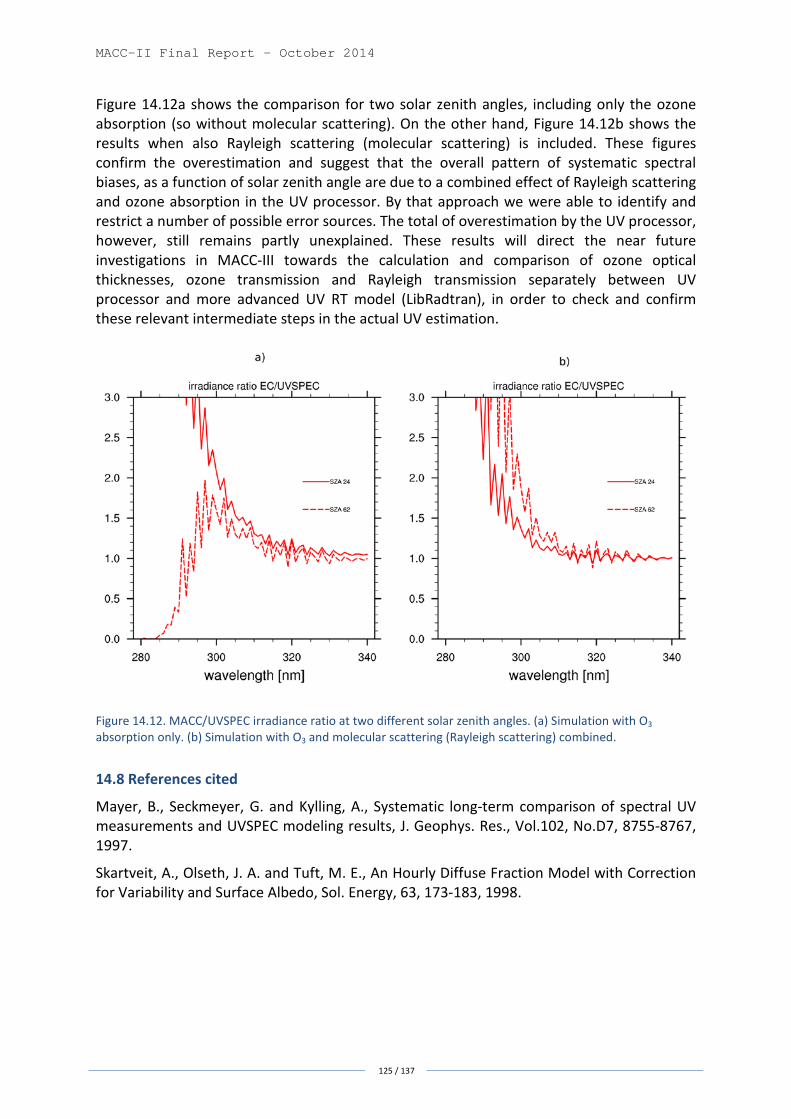
MACC-II Final Report – October 2014
125 / 137
Figure 14.12a shows the comparison for two solar zenith angles, including only the ozone absorption (so without molecular scattering). On the other hand, Figure 14.12b shows the results when also Rayleigh scattering (molecular scattering) is included. These figures confirm the overestimation and suggest that the overall pattern of systematic spectral biases, as a function of solar zenith angle are due to a combined effect of Rayleigh scattering and ozone absorption in the UV processor. By that approach we were able to identify and restrict a number of possible error sources. The total of overestimation by the UV processor, however, still remains partly unexplained. These results will direct the near future investigations in MACC-III towards the calculation and comparison of ozone optical thicknesses, ozone transmission and Rayleigh transmission separately between UV processor and more advanced UV RT model (LibRadtran), in order to check and confirm these relevant intermediate steps in the actual UV estimation.
Figure 14.12. MACC/UVSPEC irradiance ratio at two different solar zenith angles. (a) Simulation with O3 absorption only. (b) Simulation with O3 and molecular scattering (Rayleigh scattering) combined.
14.8 References cited
Mayer, B., Seckmeyer, G. and Kylling, A., Systematic long-term comparison of spectral UV measurements and UVSPEC modeling results, J. Geophys. Res., Vol.102, No.D7, 8755-8767, 1997.
Skartveit, A., Olseth, J. A. and Tuft, M. E., An Hourly Diffuse Fraction Model with Correction for Variability and Surface Albedo, Sol. Energy, 63, 173-183, 1998.

MACC-II Final Report – October 2014
126 / 137
15. User Interface activities (INT) The USER INTERFACE is essential and central to the entire link with users in MACC-II including understanding user requirements, coordinating user involvement, organizing a technical user interface (from Month 19), coordinating project communications and training activities, so that the entire MACC-II project reaches the best possible use of its products by its users.
The user interaction in MACC-II applied a hybrid approach between best practices in the satellite community (based on systematic analysis + documentation of user requirements and system specifications) and the NWP community (based on continuous monitoring of skill scores and communication with users). This reflects the need for continuous iteration and improvement of the understanding on provider and user side and assures a regular advancement of both capabilities.
In the first project period a complete revision of the concept for user interaction was conducted in order to allow higher automation of this process in view of increasing numbers of users. Consequently in the second period all elements of user interaction were upgraded and revised towards operationalization. This included user workshops, simple online user registration, specific negotiated Service Level Agreements, a revised MACC-II web portal including an online product catalogue and improved structure of service status / change information, documentation, and validation, operational user feedback documentation, interoperable technical user interfaces and harmonized standard compliant metadata. During MACC-II user feedback stimulated service evolution (reflected in updated service specifications).
In the meantime users of MACC-II services come from a wide range of countries, sectors and types of organisations. MACC-II users vary from ‘power’ users (requiring daily data) to users looking for specific data (area, time, species). Data access is fully open and free. The following table provides an overview of MACC-II users - some numbers are approximate, because user registration (name, institute/company, country) is not yet implemented for all data servers.
Service Number of Users/ Requests for data Global NRT Analyses & Forecasts ~ 200 users Regional NRT Analyses & Forecasts 125 users Global Reanalysis 1200 users Solar Radiation ~ 1000 requests/year Global ftp ~ 40 users Emissions, fire ~ 1700 users
MACC-II users can generally be split in commercial, governmental, science, and other; their distribution over the major MACC-II services is shown in Figure 15.1.

MACC-II Final Report – October 2014
127 / 137
Figure 15.1. Proportion of main user categories for global (left), regional (centre) and solar services (right). In MACC-II the full set of user documentation was integrated / updated: a comprehensive user requirements document as (one) input for the service specifications, a user feedback document (an example shown in Figure 15.2), a user queries summary, and reports from each of the three user meetings. The first user workshop was held in the UK, together with the GMES-PURE project looking for longer-term user needs and subsequent needs for evolution of the utilized satellite observations. The second user workshop was held in France. Both user workshops together with another dedicated policy user workshop organized by the POL sub-project brought valuable user feedback (enhanced understanding of user needs, confirmed usefulness of MACC-II products and services, needs for evolution). Several smaller meetings with individual users / groups were held. Overall it was found that smaller dedicated user workshops in different parts of Europe are most attractive for users and most beneficial for feedback to the service. The first meeting of the MACC-II User Advisory Board was conducted which led to helpful recommendations (e.g. building up of a working group to explore best ways of providing boundary conditions for regional models).
Figure 15.2. Example of a user feedback document.
The user feedback collected at the different levels of user interaction from direct contacts of the service leaders to general user workshops and feedback) was analysed and in some

MACC-II Final Report – October 2014
128 / 137
cases was met with service evolution. In other cases the requested update was beyond the scope of MACC-II or the technical feasibility (e.g. extending the regional ensemble to entire Russia or providing the complete set of all chemical species from the ensemble forecasts). Some examples of user induced service evolution are given here:
• EEA and downstream service partners (PASODOBLE) requested an increased area of European ensemble forecasts (entire Europe including Iceland, complete Black Sea) – in response the area of the ENS products was increased accordingly for all 7 models and the ensemble output.
• Downstream air quality services (PASODOBLE) expressed the need for earlier access in the morning to the boundary conditions so that they can fulfill their service timing needs. In response MACC increased the ensemble forecast length from 72 to 96 hours, which was appreciated by the user as a good solution (quality of the fourth day forecast is almost equal to the third day forecast). Furthermore in response to the need to ease the nesting of regional models (“full chemical output”) within the European ensemble, as a practical solution MACC-II increased the output from the European ensemble (5 more species, 4 more vertical layers).
• EEA and national environment agencies stated that the “Validated Assessment Reports” for European air quality were delivered far too late to be used in the compliance monitoring or State of the Environment reporting. In response MACC-II tested the provision of an “Interim Validated Assessment Report” relying on un-validated ground measurements.
• National environment actors expressed interest in higher resolved greenhouse gas datasets. In response increased horizontal resolution global CO2 inversions with a simplified model were provided.
• Based on experiences during first exercises in supporting measurement campaigns a dedicated website to register needs for campaign support in an efficient way was implemented.
• In response to frequent user requests for improved information, the website was improved to provide information on the operational status of services, changes in the production chains / algorithms and on the day-to-day status of services.
Intensive collaboration was achieved with the GMES-PURE project, which was analyzing long-term user requirements to assure a comprehensive approach towards users and towards short and long term evolution of the service specifications. Based on user feedback from the first user workshop, online user registration was simplified to simple user identification and acknowledgement of general license terms with no formal Service Level Agreement (SLA) necessary for general use of standard output. Specific SLAs remain important to document dedicated delivery agreed with selected power users; this mechanism will mainly be of use in the coming operational phase. So far, dedicated SLAs or similar agreements have been concluded with the following power users: obsAIRve, DWD, LMD, PASODOBLE and ENDORSE; a few more are in negotiation. The technical interfaces to MACC-II output were significantly advanced: metadata were harmonized between different MACC-II service lines and dissemination interfaces as well as with INSPIRE / GEO / WMO-WIS. In response to user requests the web portal contains one

MACC-II Final Report – October 2014
129 / 137
harmonized searchable catalogue for all products linking to the different technical interfaces, using the standard metadata and also linking to further documentation on the web portal. Standard compliant (OGC) inter-operable metadata interfaces and web services for the MACC-II products have been implemented: The integrated MACC-II catalogue at ECMWF, the global boundary conditions server at FZJ, the European interface (ensemble and validated assessments) at DLR’s WDC-RSAT based on the “interface to core” of the PASODOBLE downstream project, solar irradiance server McClear at Ecole de Mines to extract local irradiance time series. With support from MACC-II, a draft document on “Good Practices for Metadata In Air Quality and Atmospheric Composition” has been initiated under the auspices of the GEO Air Quality Community of Practice. This document contributes to establish community standards for lists of controlled vocabulary, which are key for the organisation and searchability of atmospheric composition datasets.
Figure 15.3. MACC-II OGC web service interface for European air quality products (ensemble forecasts and validated assessment) – data visualization, data access and metadata access.
Project communications were enhanced in collaboration with professionals (leaflets, videos, user branch at the website, press releases and publications in various media). MACC-II was presented in a number of conferences and user forums and, when invited, in Copernicus-related bodies. The originally planned communication officer could not be found, but resources were used to hire professional support to deliver public relations material. An operational (internal) interface was implemented to document, analyse and coordinate responses to user queries. The web portal was upgraded significantly based on intensive user interaction.

MACC-II Final Report – October 2014
130 / 137
Figure 15.4. MACC-II (internal) user query tracking support system and statistics of user queries. The objective of this work package was to co-ordinate training based on user demand and feedback. The MACC-II summer school “Atmospheric chemistry monitoring and forecasting” was held in Anglet, France, on 9-16 June 2013 with 64 participants and was well evaluated by participants. At this occasion, eTraining material was also produced by filming the various lectures. No further training (on top of eLearning material and summer school) was provided due to lack of interest from contacted user groups. However, during the second User Workshop in June 2014, users expressed an interest in having simple videos/animations available on the MACC-II web site showing how to retrieve data, how to use the provided validation to better interpret the data, and other basic data handling topics. These user requirements will be addressed within MACC-III.
Figure 15.5. MACC-II summer school participants’ country of origin (workplace).

MACC-II Final Report – October 2014
131 / 137
References
Agustí-Panareda, A., S. Massart, F. Chevallier, S. Boussetta, G. Balsamo, A. Beljaars, P. Ciais, N. M. Deutscher, R. Engelen, L. Jones, R. Kivi, J.-D. Paris, V.-H. Peuch, V. Sherlock, A. T. Vermeulen, P. O. Wennberg, and D. Wunch, Forecasting global atmospheric CO2, Atmos. Chem. Phys. Discuss., 14, 13909-13962, doi:10.5194/acpd-14-13909-2014.
Akritidis, D., P. Zanis; E. Katragkou, M. Schultz, I. Tegoulias, A. Poupkou, K. Markakis, I. Pytharoulis, T. Karacostas, Evaluating the impact of chemical boundary conditions on near surface ozone in regional climate air quality simulations over Europe, Atmospheric Research, 134, 116-130, http://dx.doi.org/10.1016/j.atmosres.2013.07.021, 2013.
Alexe, M., P. Bergamaschi, A. Segers, R. Detmers, A. Butz, O. Hasekamp, S. Guerlet, R. Parker, H. Boesch, C. Frankenberg, R. A. Scheepmaker, E. Dlugokencky, C. Sweeney, S. C. Wofsy and E. A. Kort, Inverse modeling of CH4 emissions for 2010–2011 using different satellite retrieval products from GOSAT and SCIAMACHY, Atmos. Chem. Phys. Discuss., 14, 11493–11539, 2014.
Andela, N., J. W. Kaiser, A. Heil, T. T. van Leeuwen, M. J. Wooster, G. R. van der Werf, S. Remy, and M. G. Schultz, Assessment of the Global Fire Assimilation System (GFAS v1), Tech. Memo. 702, ECMWF, Reading, UK, 2013.
Andela, N. and G. R. van der Werf, Recent trends in african fires driven by cropland expansion and el nino to la nina transition, Nature Climate Change, 2014.
Benedetti, A., L. T. Jones, A. Inness, J. W. Kaiser, and J.-J. Morcrette, Aerosols [in State of the Climate in 2012], Bull. Amer. Meteor. Soc., vol. 94, no. 8, pp. S34–S36, 2013.
Bergamaschi, P., S. Houweling, A. Segers, M. Krol, C. Frankenberg, R. A. Scheepmaker, E. Dlugokencky, S. Wofsy, E. Kort, C. Sweeney, T. Schuck, C. Brenninkmeijer, H. Chen, V. Beck and C. Gerbig, Atmospheric CH4 in the first decade of the 21st century, Inverse modeling analysis using SCIAMACHY satellite retrievals and NOAA surface measurements, J. Geophys. Res., doi:10.1002/jgrd.50480, 2013.
Bond, T.C., S. J. Doherty, D. W. Fahey, P. M. Forster, T. K. Berntsen, O. Boucher, B. J. DeAngelo, M. G. Flanner, S. J. Ghan, B. K ̈archer, D. Koch, S. Kinne, Y. Kondo, U. Lohmann, P. K. Quinn, M. C. Sarofim, M. Schultz, M. Schulz, C. Venkataraman, H. Zhang, S. Zhang, N. Bellouin, S. Guttikunda, P. K. Hopke, M. Z. Jacobson, J. W. Kaiser, Z. Klimont, J. P. Schwarz, D. Shindell, T. Storelvmo, S. G. Warren, and C. S. Zender, Bounding the role of black carbon in the climate system: A scientific assessment, J. Geophys. Res., vol. 118, pp. 1–173, 2013.
Ceamanos, X., Carrer, D., and J.-L. Roujean, Improved retrieval of direct and diffuse downwelling surface shortwave flux in cloudless atmosphere using dynamic estimates of aerosol content and type: application to the LSA-SAF project, Atmos. Chem. Phys., 14, 8209-8232, doi:10.5194/acp-14-8209-2014, 2014.
Cesnulyte, V., Lindfors, A. V., Pitkänen, M. R. A., Lehtinen, K. E. J., Morcrette, J.-J. and Arola, A., Comparing ECMWF AOD with AERONET observations at visible and UV wavelengths, Atmos. Chem. Phys., 14, 593-608, doi:10.5194/acp-14-593-2014, 2014.
Chevallier, F., T. Wang, P. Ciais, F. Maignan, M. Bocquet, A. Arain, A. Cescatti, J.-Q. Chen, H. Dolman, B. E. Law, H. A. Margolis, L. Montagni and E. J. Moors, What eddy-covariance flux measurements tell us about prior errors in CO2-flux inversion schemes, Global Biogeochem. Cy., 26, GB1021, doi:10.1029/2010GB003974, 2012.

MACC-II Final Report – October 2014
132 / 137
Chevallier, F. and C. W. O'Dell, Error statistics of Bayesian CO2 flux inversion schemes as seen from GOSAT, Geophys. Res. Lett., 40, 1252–1256, doi:10.1002/grl.50228, 2013.
Chevallier, F., On the parallelization of atmospheric inversions of CO2 surface fluxes within a variational framework, Geosci. Model. Dev., 6, 783-790, doi:10.5194/gmd-6-783-2013.
Chevallier, F., P. I. Palmer, L. Feng, H. Boesch, C. W. O'Dell and P. Bousquet, Toward robust and consistent regional CO2 flux estimates from in situ and space-borne measurements of atmospheric CO2, Geophys. Res. Lett., 41, doi:10.1002/2013GL058772, 2014.
Colette, A., Granier, C., Hodnebrog, Ø., Jakobs, H., Maurizi, A., Nyiri, A., Rao, S., Amann, M., Bessagnet, B., D'Angiola, A., Gauss, M., Heyes, C., Klimont, Z., Meleux, F., Memmesheimer, M., Mieville, A., Rouïl, L., Russo, F., Schucht, S., Simpson, D., Stordal, F., Tampieri, F., and Vrac, M.: Future air quality in Europe: a multi-model assessment of projected exposure to ozone, Atmos. Chem. Phys., 12, 10613-10630, doi:10.5194/acp-12-10613-2012, 2012.
Cuevas, E., C. Camino, A. Benedetti, S. Basart, E. Terradellas, J.M. Baldasano, J.-J Morcrette, B. Marticorena, P. Goloub, A. Mortier, A. Berjón, Y. Hernández, M. Gil-Ojeda and M. Schulz, The MACC-II 2007-2008 Reanalysis: Atmospheric Dust Evaluation and Characterization over Northern Africa and Middle East, submitted to Atmos. Chem. Phys. MACC special issue.
Diamantakis, M. and J. Flemming, Global mass fixer algorithms for conservative tracer transport in the ECMWF model, Geosci. Model Dev., 7, 965-979, doi:10.5194/gmd-7-965-2014, 2014.
Ebojie, F., von Savigny, C., Ladstätter-Weißenmayer, A., Rozanov, A., Weber, M., Eichmann, K.-U., Bötel, S., Rahpoe, N., Bovensmann, H. and J. P. Burrows, Tropospheric column amount of ozone retrieved from SCIAMACHY limb–nadir-matching observations, Atmos. Meas. Tech., 7, 2073-2096, doi:10.5194/amt-7-2073-2014, 2014.
Emili, E., Barret, B., Massart, S., Le Flochmoen, E., Piacentini, A., El Amraoui, L., Pannekoucke, O. and D. Cariolle, Combined assimilation of IASI and MLS observations to constrain tropospheric and stratospheric ozone in a global chemical transport model, Atmos. Chem. Phys., 14, 177-198, doi:10.5194/acp-14-177-2014, 2014.
Flemming, J., Inness, A., Jones, L., Eskes, H. J., Huijnen, V., Schultz, M. G., Stein, O., Cariolle, D., Kinnison, D. and Brasseur, G., Forecasts and assimilation experiments of the Antarctic Ozone Hole 2008, Atmos. Chem. Phys., 11 (5), 1961-1977, doi: 10.5194/acp-11-1961-2011.
Flemming, J., V.-H. Peuch, R. Engelen and J. Kaiser, A European global-to-regional that combines modeling: A novel forecasting system for atmospheric composition operates daily to forecast global air pollution, EM: Air and Waste Management Association’s Magazine for Environmental Managers, pp. 6–10, November 2013.
Flemming, J., V. Huijnen, J. Arteta, A. Inness, L. Jones, V.-H. Peuch, M. W. Schultz, A. Blechschmidt, A. Richter, A. Gaudel, O. Stein, R. Engelen, E. Katragkou, A. Tsikerdekis, A. Beljaars, P. Bechtold and M. Diamantakis, Atmospheric Chemistryin the Integrated Forecasting System of ECMWF, submitted to GMD, 2014.
Fortems-Cheiney, A., F. Chevallier, I. Pison, P. Bousquet, M. Saunois, S. Szopa, C. Cressot, T.P. Kurosu, K. Chance and A. Fried, The formaldehyde budget as seen by a global-scale multi-constraint and multi-species inversion system, Atmos. Chem. Phys., 12, 6699-6721, doi:10.5194/acp-12-6699-2012, 2012.
Freeborn, P., M. J. Wooster, D. P. Roy, and M. A. Cochrane, Quantification of MODIS fire radiative power (FRP) measurement uncertainty for use in satellite-based active fire characterization and biomass burning estimation, Geophysical Research Letters, 2014.

MACC-II Final Report – October 2014
133 / 137
Frost, G.J., P. Middleton, L. Tarrasón, C. Granier, A. Guenther, B. Cardenas, H. Denier van der Gon, G. Janssens-Maenhout, J.W. Kaiser, T. Keating, Z. Klimont, J.F. Lamarque, C. Liousse, S. Nickovic, T. Ohara, M.G. Schultz, U. Skiba, J. van Aardenne, Y. Wang, New Directions: GEIA's 2020 vision for better air emissions information, Atmospheric Environment, 81, 710-712, 2013.
Gaubert, B. et al., Regional scale ozone data assimilation using an ensemble Kalman filter and the CHIMERE chemical transport model, Geosci. Model Dev., 7, 283-302, doi:10.5194/gmd-7-283-2014, 2014.
Guevara, V., M., M. T. Pay, F. Martínez, A. Soret, H. Denier van der Gon, J. M. Baldasano, Inter-comparison between HERMESv2.0 and TNO-MACC-II emission data using the CALIOPE air quality forecast system (Spain), in press, Atmospheric Environment, 2014.
Huijnen, V., Williams, J. E., and Flemming, J., Modeling global impacts of heterogeneous loss of HO2 on cloud droplets, ice particles and aerosols, Atmos. Chem. Phys. Discuss., 14, 8575-8632, doi:10.5194/acpd-14-8575-2014, 2014.
Huijnen, V., Flemming, J., Kaiser, J. W., Inness, A., Leitão, J., Heil, A., Eskes, H. J., Schultz, M. G., Benedetti, A., Hadji-Lazaro, J., Dufour, G. and M. Eremenko, Hindcast experiments of tropospheric composition during the summer 2010 fires over western Russia, Atmos. Chem. Phys., 12, 4341-4364, doi:10.5194/acp-12-4341-2012, 2012.
Huneeus, N., F. Chevallier and O. Boucher, Estimating aerosol emissions by assimilating observed aerosol optical depth in a global aerosol model, Atmos. Chem. Phys., 12, 4585-4606, doi:10.5194/acp-12-4585-2012, 2012.
Huneeus, N., O. Boucher and F. Chevallier, Atmospheric inversion of SO2 and primary aerosol emissions for the year 2010, Atmos. Chem. Phys., 13, 6555-6573, doi:10.5194/acp-13-6555-2013, 2013.
Im, U., Bianconi, R., Solazzo, E., Kioutsioukis, I., Badia, A., Balzarini, A., Baro, R., Belassio, R., Brunner, D., Chemel, C., Curci, G., Flemming, J., Forkel, R., Giordano, L., Jimenez-Guerrero, P., Hirtl, M., Hodzic, A., Honzak, L., Jorba, O., Knote, C., Kuenen, J.J.P., Makar, P.A., Manders-Groot, A., Neal, L., Perez, J.L., Piravano, G., Pouliot, G., San Jose, R., Savage, N., Schroder, W., Sokhi, R.S., Syrakov, D., Torian, A., Werhahn, K., Wolke, R., Yahya, K., Zabkar, R., Zhang, Y., Zhang, J., Hogrefe, C., Galmarini, S., 2014a. Evaluation of operational online-coupled regional air quality models over Europe and North America in the context of AQMEII phase 2. Part I: Ozone. Atmospheric Environment, Submitted, 2014.
Im, U., Bianconi, R., Solazzo, E., Kioutsioukis, I., Badia, A., Balzarini, A., Baro, R., Belassio, R., Brunner, D., Chemel, C., Curci, G., Denier van der Gon, H.A.C., Flemming, J., Forkel, R., Giordano, L., Jimenez-Guerrero, P., Hirtl, M., Hodzic, A., Honzak, L., Jorba, O., Knote, C., Makar, P.A., Manders-Groot, A., Neal, L., Perez, J.L., Piravano, G., Pouliot, G., San Jose, R., Savage, N., Schroder, W., Sokhi, R.S., Syrakov, D., Torian, A., Werhahn, K., Wolke, R., Yahya, K., Zabkar, R., Zhang, Y., Zhang, J., Hogrefe, C. and Galmarini, S., 2014b. Evaluation of operational online-coupled regional air quality models over Europe and North America in the context of AQMEII phase 2. Part II: Particulate Matter. Atmospheric Environment, Submitted, 2014.
Inness, A., F. Baier, A. Benedetti, I. Bouarar, S. Chabrillat, H. Clark, C. Clerbaux, P. Coheur, R. J. Engelen, Q. Errera, J. Flemming, M. George, C. Granier, J. Hadji-Lazaro, V. Huijnen, D. Hurtmans, L. Jones, J. W. Kaiser, J. Kapsomenakis, K. Lefever, J. Leitao, M. Razinger, A. Richter, M. G. Schultz, A. J. Simmons, M. Suttie, O. Stein, J.-N. Th ́epaut, V. Thouret, M. Vrekoussis, C. Zerefos and the MACC team, The MACC reanalysis: an 8 yr data set of atmospheric composition, Atmos. Chem. Phys., vol. 13, no. 8, pp. 4073–4109, 2013.
Kaiser, J. W., Peuch, V.-H., Benedetti, A., Boucher, O., Engelen, R. J., Holzer-Popp, T., Morcrette, J.-J., and Wooster, M. J., The pre-operational GMES atmospheric service in MACC-II and its potential use

MACC-II Final Report – October 2014
134 / 137
of Sentinel-3 observations in Proc. 3rd MERIS/(A)ATSR and OCLI-SLSTR (Sentinel-3) Preparatory Workshop, number SP-708 in Special Publications, ESA, 2012.
Kaiser, J. W., Heil, A., Andreae, M. O., Benedetti, A., Chubarova, N., Jones, L., Morcrette, J.-J., Razinger, M., Schultz, M. G., Suttie, M. and van der Werf, G. R., Biomass burning emissions estimated with a global fire assimilation system based on observed fire radiative power, Biogeosciences, 9:527–554, 2012.
Kaiser, J. W. and van der Werf, G. R., Biomass Burning in State of the Climate in 2011], Bull. Amer. Meteor. Soc., vol. 93, no. 7, pp. S54–S55, 2012.
Kaiser, J. W. and G. R. van der Werf, Biomass burning [in State of the Climate in 2012], Bull. Amer. Meteor. Soc., vol. 94, no. 8, pp. S43–S45, 2013.
Kaiser, J. W. and G. R. van der Werf, Biomass burning [in State of the Climate in 2013], Bull. Amer. Meteor. Soc., vol. 95, no. 7, pp. S47–S49, 2013.
Kaiser, J. W., A. Heil, M. G. Schultz, S. Remy, O. Stein, G. R. van der Werf, M. J. Wooster, and W. Xu, Final report on implementation and quality of the D-FIRE assimilation system, Tech. Memo. 709, ECMWF, 2013.
Kaiser, J. W. and G. R. van der Werf, Biomass burning [in State of the Climate in 2014], Bull. Amer. Meteor. Soc., 2014.
Kaiser, J. W., N. Andela, J. Atherton, M. de Jong, A. Heil, R. Paugam, S. Remy, M. G. Schultz, G. R. van der Werf, T. T. van Leeuwen, and M. J. Wooster, Recommended fire emission service enhancements, Tech. Memo. 724, ECMWF, Reading, UK, 2014.
Keywood, M. and J. Kaiser, Igac/ileaps/wmo third workshop for the interdisciplinary biomass burning initiative, IGAC Newsletter, vol. 52, p. 8, August 2014.
Konovalov, I. B., E. V. Berezin, P. Ciais, G. Broquet, M. Beekmann, J. Hadji-Lazaro, C. Clerbaux, M. O. Andreae, J. W. Kaiser and E.-D. Schulze, Constraining CO2 emissions from open biomass burning by satellite observations of co-emitted species: a method and its application to wildfires in siberia,” Atmos. Chem. Phys. Discuss., vol. 14, no. 2, pp. 3099–3168, 2014.
Krol, M., W. Peters, P. Hooghiemstra, M. George, C. Clerbaux, D. Hurtmans, D. McInerney, F. Sedano, P. Bergamaschi, M. El Hajj, J. W. Kaiser, D. Fisher, V. Yershov and J.-P. Muller, How much CO was emitted by the 2010 fires around Moscow?, Atmos. Chem. Phys., vol. 13, no. 9, pp. 4737–4747, 2013.
Klein T., Kukkonen J, Dahl Å., Bossioli E., Baklanov A., Vik A. F., Agnew P., Karatzas K. D. and Sofiev M., Interactions of Physical, Chemical, and Biological Weather Calling for an Integrated Approach to Assessment, Forecasting, and Communication of Air Quality. Ambio, A journal of the Human Environment, DOI 10.1007/s13280-012-0288-z, http://www.springerlink.com/content/ 10g673264542519j/, 2012.
Kouznetsov, R. and Sofiev, M., A methodology for evaluation of vertical dispersion and dry deposition of atmospheric aerosols, J. Geophys. Res., 117. doi: 10.1029/2011JD016366, 2012.
Kuenen, J. J. P., Visschedijk, A. J. H., Jozwicka, M. and H. A. C. Denier van der Gon, TNO/MACC-II emission inventory; a multi-year (2003–2009) consistent high-resolution European emission inventory for air quality modelling, Atmos. Chem. Phys., 14, 10963-10976, doi:10.5194/acp-14-10963-2014, 2014.
Lammel, G., A. Heil, I. Stemmler, A. Dvorská and J. Klánová, On the contribution of biomass burning to POPs (PAHs and PCDDs) in air in Africa, Environ. Sci. Technol., vol. 47, pp. 11616–11624, 2013.
Leeuwen, T., W. Peters, M. Krol and G. Werf, Dynamic biomass burning emission factors and their impact on atmospheric CO mixing ratios, J. of Geophys. Res. Atmos., 2013.

MACC-II Final Report – October 2014
135 / 137
Lefever, K., van der A, R., Baier, F., Christophe, Y., Errera, Q., Eskes, H., Flemming, J., Inness, A., Jones, L., Lambert, J.-C., Langerock, B., Schultz, M. G., Stein, O., Wagner, A. and Chabrillat, S., Copernicus atmospheric service for stratospheric ozone: validation and inter-comparison of four near real-time analyses, 2009-2012, Atmos. Chem. Phys. Discuss., 14, 12461-12523, 2014.
Lefèvre, M., A. Oumbe, P. Blanc, B. Espinar, B. Gschwind, Z. Qu, L. Wald, M. Schroedter-Hormscheidt, C. Hoyer-Klick, A. Arola, A. Benedetti, J. W. Kaiser and J.-J. Morcrette, McClear: a new model estimating downwelling solar radiation at ground level in clear-sky conditions, Atmos. Meas. Tech., vol. 6, pp. 2403–2418, doi: 10.5194/amt-6-2403-2013, 2013.
Marécal, V. et al., A regional daily air quality forecasting system over Europe: the MACC-II ensemble system, in preparation for submission the GMD MACC-II special issue, 2014.
Massart, S., A. Agustí-Panareda, I. Aben, A. Butz, F. Chevallier, C. Crevoisier, R. Engelen, C. Frankenberg, and O. Hasekamp, Assimilation of atmospheric methane products in the MACC-II system: from SCIAMACHY to TANSO and IASI, Atmos. Chem. Phys., 14, 6139-6158, doi:10.5194/acp-14-6139-2014.
Migliavacca, M., A. Dosio, A. Camia, R. Hobourg, T. Houston-Durrant, J. W. Kaiser, N. Khabarov, A. A. Krasovskii, B. Marcolla, S. Miguel-Ayanz et al., Modeling biomass burning and related carbon emissions during the 21st century in Europe, J. of Geophys. Res. Biogeosci., vol. 118, no. 4, pp. 1732–1747, 2013.
Mulcahy, J. P., Walters, D. N., Bellouin, N. and S. F. Milton, Impacts of increasing the aerosol complexity in the Met Office global numerical weather prediction model, Atmos. Chem. Phys., 14, 4749-4778, doi:10.5194/acp-14-4749-2014, 2014.
Mulder, M. D., A. Heil, P. Kukučka, J. Klánová, J. Kuta, R. Prokeš, F. Sprovieri, and G. Lammel, "Air–sea exchange and gas–particle partitioning of polycyclic aromatic hydrocarbons in the Mediterranean," Atmos. Chem. Phys., vol. 14, pp. 8905–8915, 2014.
Oumbe, A., Qu, Z., Blanc, P., Lefèvre, M., Wald, L., and S. Cros, Decoupling the effects of clear atmosphere and clouds to simplify calculations of the broadband solar irradiance at ground level, Geosci. Model Dev., 7, 1661-1669, doi:10.5194/gmd-7-1661-2014, 2014.
Oumbe, A., Qu, Z., Blanc, P., Lefèvre, M., Wald, L. and S. Cros, Corrigendum to "Decoupling the effects of clear atmosphere and clouds to simplify calculations of the broadband solar irradiance at ground level" published in Geosci. Model Dev., 7, 1661–1669, 2014, Geosci. Model Dev., 7, 2409-2409, doi:10.5194/gmd-7-2409-2014, 2014.
Peng, S., S. Piao, P. Ciais, R. B. Myneni, A. Chen, F. Chevallier, A. J. Dolman, I. A. Janssens, J. Peñuelas, G. Zhang, S. Vicca, S. Wan, S. Wang and H. Zeng, Asymmetric effects of daytime and night-time warming on Northern Hemisphere vegetation, Nature, 501, 88-92, doi:10.1038/nature12434, 2013.
Pérez García-Pando, C., M.C. Stanton, P.J. Diggle, S. Trzaska, R.L. Miller, J.P. Perlwitz, J.M. Baldasano, E. Cuevas, P. Ceccato, P. Yaka and M.C. Thomson, Soil Dust Aerosols and Wind as Predictors of Seasonal Meningitis Incidence in Niger, Environ. Health Perspectives doi:10.1289/ehp.1306640, 2014.
Pouliot G., H.A.C. Denier van der Gon, J. Kuenen, J. Zhang, M. Moran, P. Makar, Analysis of the Emission Inventories and Model-Ready Emission Datasets of Europe and North America for Phase 2 of the AQMEII Project, submitted Atmospheric Environment, 2014.
Poulter, B., D. Frank, P. Ciais, R. B. Myneni, N. Andela, J. Bi, G. Broquet, J. G. Canadell, F. Chevallier, Y. Y. Liu, S. W. Running, S. Sitch and G. R. van der Werf, Contribution of semi-arid ecosystems to interannual variability of the global carbon cycle. Nature, doi:10.1038/nature13376, 2014.
Poupkou, A., K. Markakis, N. Liora, T. M. Giannaros, P. Zanis, U. Im, N. Daskalakis, S. Myriokefalitakis, J. W. Kaiser, D. Melas, M. Kanakidou, T. Karacostas, and C. Zerefos, A modeling study of the impact

MACC-II Final Report – October 2014
136 / 137
of the 2007 Greek forest fires on the gaseous pollutant levels in the Eastern Mediterranean, Atmos. Env., vol. 148, pp. 1–17, 2014.
Prank, M. Chapman, D.S. Bullock, J.M., Belmonte Soler, J. Berger, U., Dahl, A., Jäger, S., Kovtunenko, I., Magyar, D., Niemelä, S., Rantio-Lehtimäki, A., Rodinkova, V., Sauliene, I., Severova, E., Sikoparija, B. and Sofiev, M., An operational model for forecasting ragweed pollen release and dispersion in Europe, Agriculture and forest meteorology, doi: 10.1016/j.agrformet.2013.08.003, 182–183, 43–53, 2013.
Randerson, J. T., Chen, Y., Werf, G. R., Rogers, B. M. and Morton, D. C., Global burned area and biomass burning emissions from small fires, J. of Geophys. Res. Biogeosci., 117(G4), 2012.
Remy S. and J. W. Kaiser, “Daily global fire radiative power fields estimation from one or two MODIS instruments,” ACPD, vol. 14, pp. 20805–20844, 2014.
Schreier, S. F., A. Richter, J. W. Kaiser, and J. P. Burrows, “Fire emission rates of nox based on the empirical relationship between satellite-derived tropospheric NO2 and fire radiative power,” Atmos. Chem. Phys., vol. 14, pp. 2447–2466, 2014.
Sheel, V., L. K. Sahu, M. Kajino, M. Deushi, O. Stein and P. Nedelec, Seasonal and inter-annual variability of carbon monoxide based on MOZAIC observations, MACC reanalysis and model simulations over an urban site in India, J. Geophys. Res. Atmos., 119, 9123–9141, doi:10.1002/2013JD021425, 2014.
Siljamo, P., Sofiev, M., Filatova, E. , Grewling, L., Jäger, S., Khoreva, E., Linkosalo, T., Jimenez, S.O. , Ranta, H., Rantio-Lehtimäki, A., Svetlov, A., Veriankaite, L. , Yakovleva, E. and Kukkonen, J., A numerical model of birch pollen emission and dispersion in the atmosphere. Model evaluation and sensitivity analysis, Int. J. Biometeorology, 2012.
Sindelarova, K., Granier, C., Bouarar, I., Guenther, A., Tilmes, S., Stavrakou, T., Müller, J.-F., Kuhn, U., Stefani, P. and W. Knorr, Global data set of biogenic VOC emissions calculated by the MEGAN model over the last 30 years, Atmos. Chem. Phys., 14, 9317-9341, doi:10.5194/acp-14-9317-2014, 2014.
Soares, J., Sofiev, M., Hakkarainen, J., San Jose, R. and Perez, J. L., Uncertainties of wild-land fires emission in AQMEII phase 2 case study, submitted to Atmos. Environ., 2014.
Sofiev, M., Wildland Fires: Monitoring, Plume Modelling, Impact on Atmospheric Composition and Climate. Chapter 21 in Matyssek, R., Clarke, N., Cudlin, P., Mikkelsen, T.N., Tuovinen, J.-P. Wieser, G., Paoletti, E. Climate Change, Air Pollution and Global Challenges. Developments in Environmental Science, vol. 13. ISBN: 978-0-08-098349-3 ISSN: 1474-8177, Elsevier & Book Aid Intern., pp.451-474, 2013.
Sofiev, M., Vankevich, R., Ermakova, T. and Hakkarainen, J., Global mapping of maximum emission heights and resulting vertical profiles of wildfire emissions, Atmos. Chem. Phys., 13, 7039-7052, doi. 10.5194/acp-13-7039-2013, http://www.atmos-chem-phys.net/13/7039/2013/, 2013.
Sofiev, M., Ermakova, T., and Vankevich, R., Evaluation of the smoke injection height from wild-land fires using remote sensing data, Atmos. Chem. Phys., 12, 1995–2006, doi:10.5194/acp-12-1995-2012, www.atmos-chem-phys.net/12/1995/2012/, 2012.
Stein, O., Flemming, J., Inness, A., Kaiser, J.W. and Schultz, M.G. , Global reactive gases forecasts and reanalysis in the MACC project, Journal of Integrative Environmental Sciences, 9, Iss. sup1, 57-70, doi:10.1080/1943815X.2012.696545, 2012.
Stein, O., Schultz, M. G., Bouarar, I., Clark, H., Huijnen, V., Gaudel, A., George, M. and Clerbaux, C., On the wintertime low bias of Northern Hemisphere carbon monoxide found in global model simulations, Atmos. Chem. Phys., 14, 9295-9316, doi:10.5194/acp-14-9295-2014, 2014.

MACC-II Final Report – October 2014
137 / 137
Thompson, R. L., F. Chevallier, A. M. Crotwell, G. Dutton, R. L. Langenfelds, R. G. Prinn, R. F. Weiss, Y. Tohjima, T. Nakazawa, P. B. Krummel, L. P. Steele, P. Fraser, K. Ishijima and S. Aoki Nitrous oxide emissions 1999-2009 from a global atmospheric inversion, Atmos. Chem. Phys., 14, 1801-1817, doi:10.5194/acp-14-1801-2014, 2014.
van der A, R. J. , M. A. F. Allaart, and H. J. Eskes, Multi sensor reanalysis of total ozone, Atmos. Chem. Phys., 10, 11277-11294, doi:10.5194/acp-10-11277-2010, atmos-chem-phys.net/10/1127/2010/, 2010.
Vira, J. and M. Sofiev, On variational data assimilation for estimating the model initial conditions and emission fluxes for the short-term forecasting of SOx concentrations, Atmosph. Environ., 46, pp.318-328, doi:10.1016/j.atmosenv.2011.09.066, 2012.
Vira, J. and M. Sofiev, Assimilation of surface NO2 and O3 observations into the SILAM chemistry transport model, Geosci. Model Dev. Discuss., 7, 5589-5621, doi:10.5194/gmdd-7-5589-2014, 2014.
Wagner, A., A. Blechschmidt, I. Bouarar, E. Brunke, C. Clerbaux, M. Cupeiro, P. Cristofanelli, H. Eskes, H. Flentje, M. George, A. Hilboll, A. Inness, J. Kapsomenakis, A. Richter, L. Ries, W. Spangl, O. Stein, R. Weller and C. Zerefos, Evaluation of the MACC operational forecast system- potential and challenges of global near-real-time modelling with respect to reactive gases in the troposphere, submitted to Atmos. Chem. Phys. MACC special issue, 2014.
Wooster, M. J., Xu, W., and Nightingale, T., Sentinel-3 SLSTR active fire detection and FRP product: Pre-launch algorithm development and performance evaluation using MODIS and ASTER datasets, RSE, 120:236–254, 2012.
Zhang, F., J. Wang, C. Ichoku, E. J. Hyer, Y. Z., C. Ge, S. Su, X. Zhang, S. Kondragunta, J. W. Kaiser, C. Wiedinmyer, and A. da Silva, “Sensitivity of mesoscale modeling of smoke direct radiative effect to the emission inventory: a case study in northern sub-Saharan African region,” Environmental Research Letters, vol. 9, p. 075002, 2014.
Zyryanov, D. et al.: 3-D evaluation of tropospheric ozone simulations by an ensemble of regional Chemistry Transport Model, Atmos. Chem. Phys., 12, 3219-3240, doi:10.5194/acp-12-3219-2012, 2012.