final report on building resilience through innovation and...
TRANSCRIPT

Report No: AUS0000524.
WorldBuilding Resilience through Innovation and Open Data in Sub Saharan AfricaFinal Report
.November 19, 2018
.CLC
.
Page | 1

© 2017 The World Bank 1818 H Street NW, Washington DC 20433 Telephone: 202-473-1000; Internet: www.worldbank.org
Some rights reserved
This work is a product of the staff of The World Bank. The findings, interpretations, and conclusions expressed in this work do not necessarily reflect the views of the Executive Directors of The World Bank or the governments they represent. The World Bank does not guarantee the accuracy of the data included in this work. The boundaries, colors, denominations, and other information shown on any map in this work do not imply any judgment on the part of The World Bank concerning the legal status of any territory or the endorsement or acceptance of such boundaries.
Rights and Permissions
The material in this work is subject to copyright. Because The World Bank encourages dissemination of its knowledge, this work may be reproduced, in whole or in part, for noncommercial purposes as long as full attribution to this work is given.
Attribution—Please cite the work as follows: “World Bank. 2018. Building Resilience through Innovation and Open Data in Sub Saharan Africa. © World Bank.” All queries on rights and licenses, including subsidiary rights, should be addressed to World Bank Publications, The World Bank Group, 1818 H Street NW, Washington, DC 20433, USA; fax: 202-522-2625; e-mail: [email protected].
Page | 2

Building Resilience through Innovation and Open Data in Sub-Saharan Africa: Final report
Background Too often governments and communities are adversely affected by disasters simply because the most basic information for resilience is missing or inaccessible. For example: How much rain has fallen? Is my children’s school safe from earthquakes and flood? Which roads are underwater and inaccessible in a flood? How many communities will be affected by drought or flood during El Niño? Without this information, it is impossible to make informed decisions. Traditional approaches to collecting datasets necessary for this informed decision making typically take decades to collect, often rely on top-down approaches, and rarely enable communities to be part of the data gathering and its ultimate use. We can shift this paradigm by embracing impactful and innovative technologies.
GFDRR has been implementing its Open Data for Resilience Initiative (OpenDRI) since 2010 in more than 30 highly vulnerable countries (www.opendri.org). Engaging communities to map their own communities has proven to be a powerful and sustainable approach to building resilience, from Village Elders mapping community borders in Jakarta for the first time, to student volunteers mapping Kathmandu before and after the 2015 earthquake, to communities in flood hit Malawi mapping their own villages (village location and name, community facilities, roads etc.). The process also connects local mappers with the international community of “open mappers”, provides fundamental on-the-job training and ultimately provides a trained network of volunteers who can respond to map damaged areas when disasters strike and map exposure and vulnerabilities to anticipate future disaster impacts. After the 2010 Haiti earthquake, this approach mapped Port-au-Prince in 3 weeks, an effort that would have taken years, if not decades, using traditional approaches
Through its Challenge Fund, GFDRR has surfaced some of the most promising innovations that will ensure the right information is available when it’s needed. Too often the location and structural safety of schools is unknown until it is tragically destroyed by a landslide, an earthquake or another hazard. Creating this information can take time, but an innovation developed with UNESCO in Indonesia enables communities to evaluate school safety for themselves. Social media (such as Twitter) can now be harnessed to better understand and respond to local urban areas frequently affected by flood, an alternative to relying on expensive and often inaccurate flood maps or satellite imagery – an approach developed in the Philippines.
The Government of Belgium committed to building resilience through innovation in Sub-Saharan Africa through the allocation of EUR 600,000 in funding to the Global Facility for Disaster Reduction and Recovery (GFDRR) in December 2016.
Uganda, Niger, Tanzania, and Mozambique were selected to pilot innovations in disaster risk management. The innovations included novel approaches to risk assessment and the collection and visualization of hazard data in real-time from social media. Countries were selected based on the following criteria:
Page | 3
1) ongoing large-scale resilience programs that could harness the innovations and ensure their sustainability;
2) government partners who were enthusiastic and supportive of testing new approaches to data collection; and
3) local conditions that would allow for testing of the innovations (e.g. sufficient penetration of social media).
The program, which was to close December 2017, was extended for an additional 9 months to ensure the successful delivery of the country program activities.
Results
1. Mozambique:In Mozambique, the Government has prioritized improvements in school infrastructure to ensure the safety of children and the continuity of education in case of natural hazard events. However, there is limited data on the country’s school locations, construction types and conditions. This situation provided an opportunity to test an innovative methodology, developed by UNESCO, for training officials to collect critical data on schools. The Visual Inspection for Defining the Safety Upgrading Strategies (VISUS) methodology was piloted in the country in partnership with the Ministry of Education and Human Development (MINED) and the National Institute of Disaster Management (INGC). The VISUS methodology helps assess school safety using a holistic, multi-hazard approach that considers five components: site conditions, structural performance, local structural criticalities, non-structural components, and functional aspects.
Activities
Stakeholder meeting
To kick off the program, UNESCO held a stakeholder meeting in Maputo with the Ministry of Education and Human Development (MINED), the National Institute of Disaster Management (INGC), UN agencies, local NGOs, and the Eduardo Mondlane University (UEM) in September 2017. The purpose of the meeting was to introduce the VISUS methodology to stakeholders and to develop partnerships for its adaptation to the country context. The meeting also provided stakeholders with an opportunity to present their current work on school safety projects, programs and policy, and to ensure that the activities were streamlined. The direct outcome of the meeting was the establishment of a local committee that would oversee the implementation of the VISUS methodology in the country.
Development of country specific training materials
The VISUS methodology and approach was originally piloted in Indonesia and, therefore, needed to be adapted to the country context in Mozambique. The methodology was adapted to integrate new types of buildings, materials, location features and cost information appropriate for Mozambique. All the material was also translated into Portuguese.
Page | 4
To facilitate the collection of data on the schools, the team developed an open source mobile application for Android phones and trained the teams to use the tool to upload information in the field.
Training Series
A series of trainings on the VISUS methodology were delivered to distinct user groups from November to December 2017, including:
o Training for Decision Makers: The purpose of the course was to build the capacity of national institutions to better identify the strategies and investments needed to upgrade the level of school safety in the country. There were 26 participants in attendance, including stakeholders from both government and non-governmental organizations.
o Training for VISUS Trainers: To ensure the sustainability of the VISUS methodology in Mozambique, 10 professors from the civil engineering and architecture faculty of UEM, as well as technicians from the INGC and the MINED were trained on the scientific aspects of the methodology.
o Training for VISUS Surveyors: The team trained surveyors in charge of visiting the schools on the specific data to be collected for the school safety surveys. The training was attended by 30 students, mostly from the UEM faculty of engineering, as well as 10 professors and a technical staff from INGC.
School survey in the field
100 schools were surveyed in the Maputo province. The data collected by the surveyors were reviewed for accuracy by the SPRINT-Lab in close coordination with the local committee and UNESCO.
Final presentation
At a joint UNESCO and World Bank meeting on March 6, 2018, the results of the survey and recommendations emerging from it were presented to the Ministry of Education.The final reports on each of the schools was presented at the workshop. A visualization of the school survey results can also be accessed through a custom Google Maps interface, where they are open to the public (see Figure 1). For an example of a school survey report, see Figure 2.
Page | 5
Figure 1: All the data and information collected for the VISUS Mozambique Pilot Survey is available in a custom Google Maps interface
Page | 6
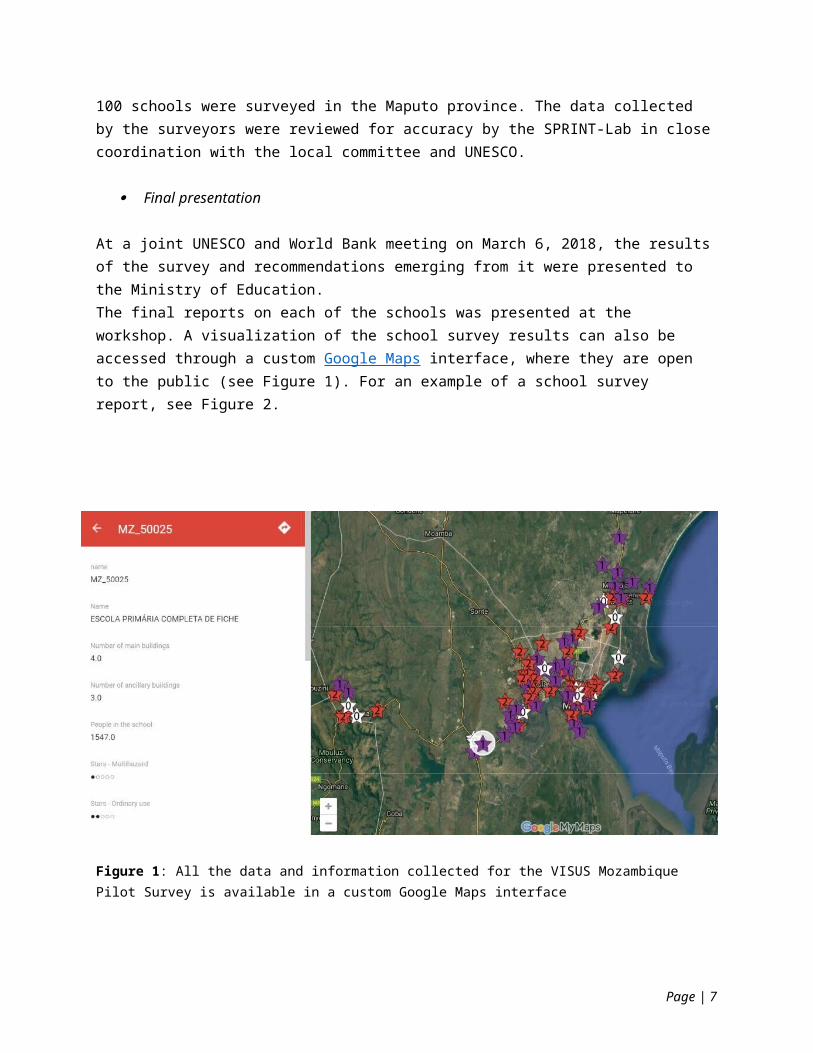
Figure 2: Example of a School Survey report from the VISUS Mozambique Pilot Survey in Maputo.
Page | 7

2. Tanzania: Urban flooding is a chronic challenge for residents, emergency responders, and city officials in Dar es Salaam, Tanzania. One of the main challenges for emergency response is knowing which areas are being impacted to effectively and quickly respond to those in need. Widespread use of social media and citizen reporting on floods provides a promising new opportunity to determine which areas have been impacted by floods in real time. Additionally, information and data mined from the media and other online sources can indicate which areas have been historically impacted by floods. For this project in Tanzania, the social enterprise FloodTags developed an online platform that utilizes machine learning to collect digital data on floods, which ultimately provides valuable situational awareness for the Tanzanian Red Cross. This approach highlighted the frequent yet small-scale flood events typically “invisible” to city and national authorities, but that tend to affect the poorest and most vulnerable.
Activities
The first activity to launch the project was a comprehensive survey by FloodTags on the availability of online media in the country. The team conducted a semantic analysis of online media content using a combination of supervised and unsupervised machine learning for event detection.
The team also worked closely with the Tanzanian Red Cross (TRC), the Tanzanian Meteorological Agency (TMA), and Disaster Management Department (under the Prime Minister’s office) to understand the needs on the ground.
Throughout this consultation period, the FloodTags team developed four use cases for the tools.
Deliverables:
Two online tools were developed for use in Tanzania:
The FloodTags Dashboard: An online dashboard to monitor and analyze flood information from online media, including social media
Impact Forecasting App: An online impact forecasting tool that translates meteorological forecasts into estimated flood impact
(i) FloodTags Dashboard
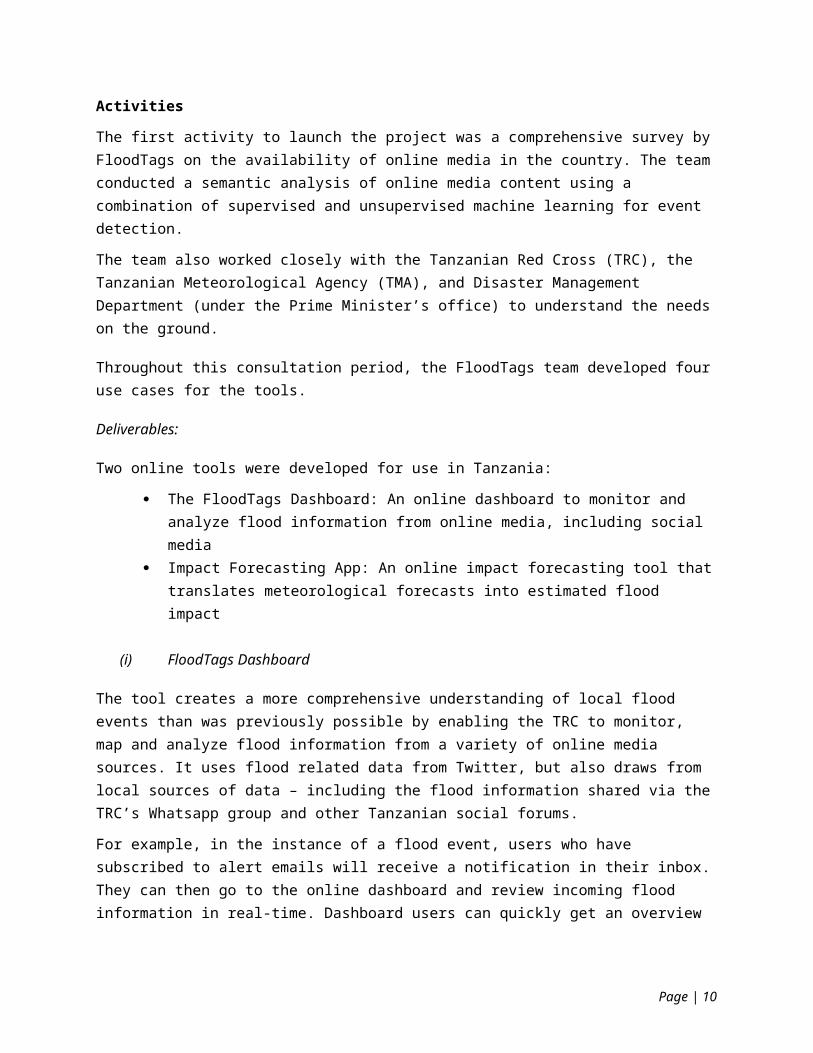
The tool creates a more comprehensive understanding of local flood events than was previously possible by enabling the TRC to monitor, map and analyze flood information from a variety of online media sources. It uses flood related data from Twitter, but also draws from local sources of data – including the flood information shared via the TRC’s Whatsapp group and other Tanzanian social forums.
For example, in the instance of a flood event, users who have subscribed to alert emails will receive a notification in their inbox. They can then go to the online dashboard and review
Page | 8

incoming flood information in real-time. Dashboard users can quickly get an overview of all available online flood information and analyze this information in detail.
Figure 3: Screenshot of the FloodTags Dashboard, floods in Dar Es Salaam.
(ii) Impact Forecasting App
While the first tool provides the TRC with information about what is going on in real-time, the Impact Forecasting App provides responders with projections about the expected impact of a given flood event. This information is derived from severe weather alerts released by the TMA.
Users interested in the expected impact of an impending flood event can search historical news articles for mentions of similar situations in the past and calculate the expected impact - including the number of causalities and people evacuated.
Users can follow the links to historical news articles to get an even more in-depth overview of the past event.
Dissemination of the tool
Page | 9
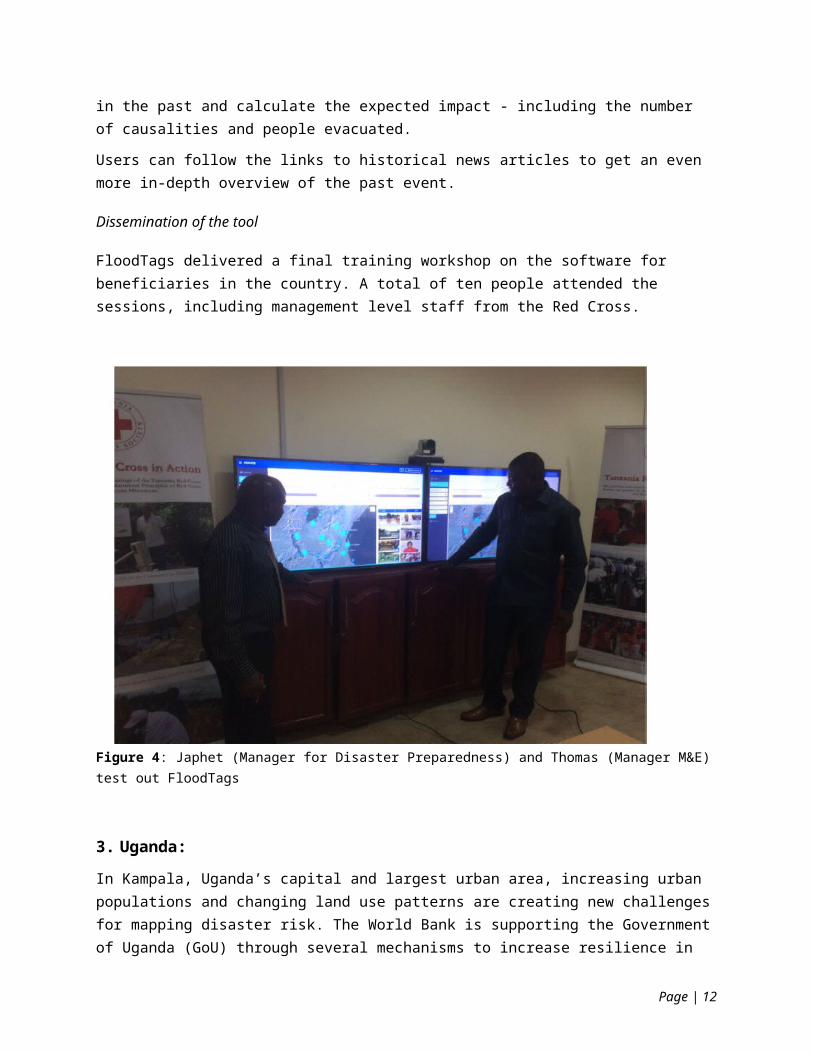
FloodTags delivered a final training workshop on the software for beneficiaries in the country. A total of ten people attended the sessions, including management level staff from the Red Cross.
Figure 4: Japhet (Manager for Disaster Preparedness) and Thomas (Manager M&E) test out FloodTags
3. Uganda: In Kampala, Uganda’s capital and largest urban area, increasing urban populations and changing land use patterns are creating new challenges for mapping disaster risk. The World Bank is supporting the Government of Uganda (GoU) through several mechanisms to increase resilience in Kampala and other urban areas by improving infrastructure and developing capacity for geospatial analysis. A common need is improved access to baseline data and risk information, enabling quicker decision-making processes. Baseline geographical data can be used to inform disaster risk reduction policy and interventions, and for efficient disaster response.
By creating up-to-date and detailed maps, it becomes possible to compile detailed, high-resolution risk profiles for locations and households affected. This information can enable communities to understand their environment and make informed decisions that increase disaster resilience.
The project had three main objectives:
Develop capacities within the Uganda Bureau of Statistics (UBOS), Kampala Capital City Authority (KCCA), and Office of the Prime Minister’s Department of Disaster
Page | 10

Preparedness and Management (OPM DDPM), for the use of innovative mapping tools, workflows, mobile data collection, and drones through trainings and access to an international community of mappers.
Conduct remote and field mapping of key priority areas identified by KCCA and OPM by engaging local communities, university students, and civil society.
Compile comprehensive baseline and exposure data (infrastructure, buildings, health facilities, drainage, etc.) for use in the creation of official disaster risk profiles.
Activities:
Following and improving upon the approach and methodology of the GFDRR Open Data for Resilience Initiative1 (OpenDRI), the following activities were conducted:
A technology specialist and a team of local and international OpenStreetMap experts were hired to conduct training for GoU staff, citizens and university students.
A multi-sector government team consisting of UBOS, KCCA, and OPM DDPM held several discussions on overall project needs, requirements, areas to be mapped, general work plan, and schedule, in coordination with KCCA’s disaster risk management requests.
Training materials were tailored to the specific needs of partners and the Ugandan context.
Local outreach: Uganda Open Mapping representatives participated in several Kampala conferences to inform others of the project and learn about relevant work in Uganda (World GIS Day at the National Data Forum; Ugandan Humanitarian Learning Platform symposium; GIS for Utilities Conference). Contacts at universities, civil society, technology hubs, and government networks have been consulted.
Deliverables completed:
Training and capacity building activities for UBOS started in December 2017, with KCCA, OPM, and other GoU agencies commencing in February 2018. The focus was on leveraging a set of innovative tools to modernize the mapping workflow.
Priority pilot areas were chosen by KCCA, in consultation with UBOS and OPM. Three villages in Ggaba Parish on Lake Victoria were selected due to high flood risk combined with rapid urban migration and development. Buildings were mapped remotely using satellite imagery. Then buildings, points of interest, and drains were surveyed using open source mobile phone apps to verify and expand on a specific set of features and attributes required for risk models.
The same area of interest in Kampala has been surveyed using a fixed-wing drone with a licensed local drone mapping firm (see Figures 7 and 8). KCCA and UBOS participated in the demonstration of the technology.
1 https://www.opendri.org
Page | 11
All the drone imagery, baseline map data and exposure information created during the project is available as open data through OpenAerialMap2, OpenStreetMap3 and a printed large format map atlas.
The Uganda Open Mapping project was incorporated into GFDRR’s Open Cities Africa initiative, facilitating knowledge sharing among 11 African cities working on projects with similar goals. A website was created to highlight the benefits and efficiencies of the innovations piloted.
A detailed blog post sharing the story and the approach was published on the OpenDRI website4.
The extended timeline requested by government counterparts helped to align this project with other initiatives ongoing in the country and ensure ownership and sustainability of the innovations implemented.
Figure 5: Top image: Training session at UBOS. Bottom image: Kicking off field mapping in Ggaba, working with community members and local stakeholders.
2 https://map.openaerialmap.org3 https://www.openstreetmap.org/#map=17/0.25566/32.63168&layers=H 4 https://opendri.org/uganda-open-mapping-for-resilience/
Page | 12

Figure 6: Local Parish Data Collectors and government professionals join forces for field data collection.
Page | 13
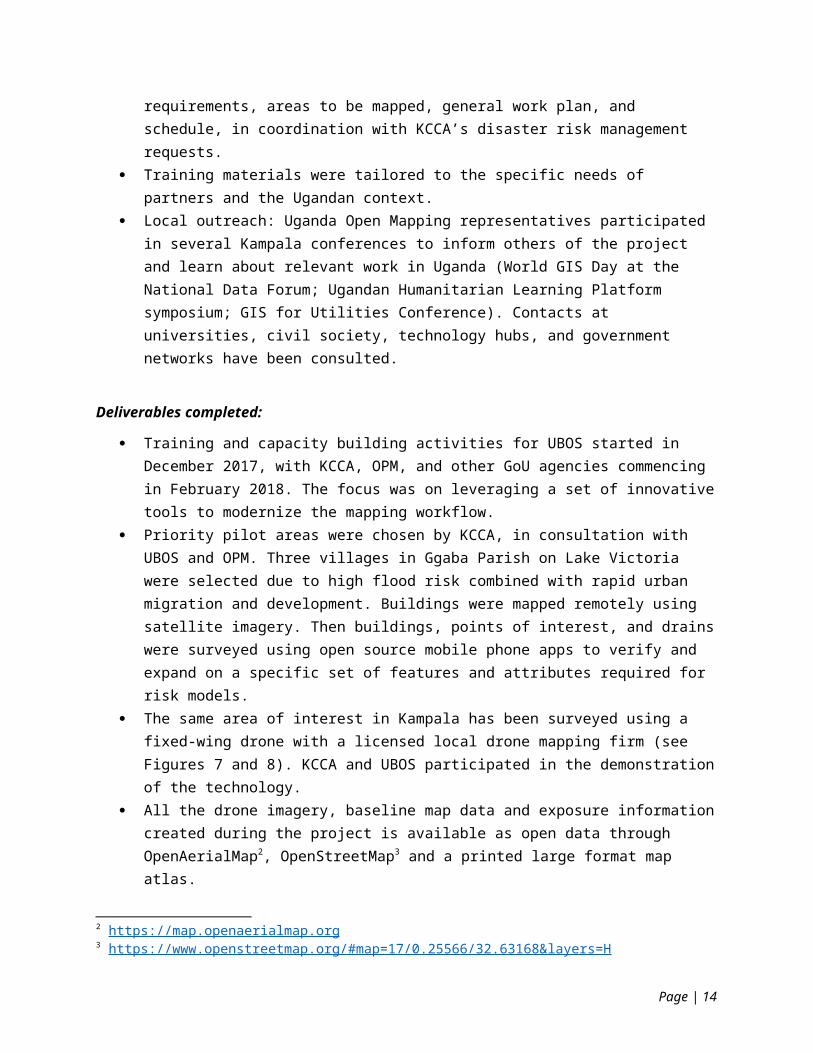
Figure 7: Drone Imagery for the Ggaba Parish
Figure 8: Drone Imagery for the Ggaba parish superimposed with the data collected through the community mapping activities
Page | 14
4. Niger: Robust flood data is critical to large scale investment in flood preparedness and risk reduction. In Niger, the government has recognized the power of innovation to develop and improve fundamental flood data and information. This data includes exposure data – buildings, roads, people, etc. – which can be collected through citizen engagement and open source tools such as OpenStreetMap.
Digital terrain models (the shape of the earth) are also fundamental to modeling floods, but current datasets lack the necessary resolution for these models. One way to address this is to employ high-resolution drones that can collect this data quickly and at low cost - an approach that has proven successful in Tanzania and Zanzibar.
Activities:
GFDRR and the World Bank provided technical support and guidance to the activities and ensured the integration of the outputs in the portfolio of ongoing World Bank financed projects, such as “Projet de Gestion de Catastrophe et de Dévelopement Urbain” (PGRCDU) and Climate Resilience Early Warning System (CREWS).
GFDRR provided support to local community mapping partners, OpenStreetMap Niger and Femmes&TIC, to ensure successful data collection for 15,000 households and infrastructure points. The data was collected using a mobile app survey.
A local innovation start-up Drone Africa Service was hired to use drones and microlight aircraft to collect high-resolution imagery and a digital elevation model. Drone Africa Service flew the micro aircraft in late November and the data was processed into imagery and a digital elevation model that are critical for the elaboration of flood maps (see Figure 9-10).
The team recently recorded a video highlighting the innovative aspects of the project’s data collection techniques and detailing the process of using drones for mapping. The video will be used to raise awareness of the project among local stakeholders, government representatives and the donor community. The video is available here: https://www.youtube.com/watch?v=602ND1Z8Zbc along with two detailed blog posts published on the World Bank5 and OpenDRI website6.
Two one-week training sessions on drone operation and air safety, attended by 20 stakeholders from the Government of Niger, took place in December and early January.
A training on participatory mapping technology such as OpenStreetMap was delivered to Niger government agencies and university students to enable further scale-up of the household and infrastructure data collection.
Imagery captured by micro aircraft flights has been processed and used to develop the high resolution digital elevation model. Vulnerability data collected by the field team has
5 http://blogs.worldbank.org/nasikiliza/understanding-niameys-flood-risk-through-open-source-mapping-drones-and-modeling6 https://opendri.org/addressing-flood-vulnerability-in-niamey-niger-west-africa/
Page | 15

been added to the model to better understand flood risk. The input and output data, as well as model will ultimately be shared on the Risques-Niger (http://risques-niger.org) platform.
Figure 9: Drones on display before a field data collection in Niamey (Courtesy of Aziz Kountché, Director, Drone Africa Services)
Page | 16

Figure 10: A drone image of Niamey. Photo: Aziz Kountché, Drone Africa Services. The imagery has been uploaded to OpenAerialMap (OAM), a platform for sharing and finding openly licensed satellite and aerial imagery. All images contributed in OAM are also automatically available in standard web service format for easy integration in any GIS software. This innovative open data system ensures rapid and efficient distribution of imagery to all stakeholders for DRM and mapping application.
Figure 11: Preliminary simulation of the 2012 floods in Niamey.
Page | 17