final report on solidaridad cleaner production progra m · pdf filefinal report on solidaridad...
TRANSCRIPT
www.solidaridadnetwork.org
Final Report on Solidaridad Cleaner Production Program
China
Table of contents
1. Background ..................................................................................................................................................... 2
2. Program concept .......................................................................................................................................... 4
2.1 Program objectives .............................................................................................................................. 4
2.2 Program duration ................................................................................................................................. 4
2.3 Mode of cooperation ........................................................................................................................... 4
2.4 Selection of participating companies ........................................................................................... 5
2.5 Expected benefits for participating companies ....................................................................... 7
3. Methodology ................................................................................................................................................... 7
3.1 Training workshops ............................................................................................................................ 8
3.2 Network Meeting .................................................................................................................................. 9
3.3 On-site visits ........................................................................................................................................... 9
4. Program timetable ..................................................................................................................................... 10
5. Key activities and outputs ...................................................................................................................... 12
5.1 Kick-off meeting .................................................................................................................................. 12
5.2 Baseline assessment .......................................................................................................................... 13
5.3 Training workshops .......................................................................................................................... 15
5.4 Network meeting ................................................................................................................................ 17
5.5 Information visit ................................................................................................................................. 18
6. Evaluation of achievements made by participating companies.............................................. 19
6.1 Achievements made by Company 1 ............................................................................................ 20
6.1.1 Cooperation with Company 1 ........................................................................................ 20
6.1.2 Activities and Achievements .......................................................................................... 21
6.1.3 Overall evaluation ............................................................................................................. 27
6.1.4 Plan for Continuous CP implementation ................................................................... 28
6.1.5 Suggestions from expert .................................................................................................. 29
6.2 Achievements made by Company 2 ............................................................................................ 29
6.2.1 Cooperation with Company 2 ........................................................................................ 29
6.2.2 Activities and Achievements .......................................................................................... 30
6.2.3 Overall evaluation ............................................................................................................. 35
6.2.4 Plan for Continuous CP implementation ................................................................... 37
6.2.5 Suggestions from the expert .......................................................................................... 37
6.3 Achievements made by Company 3 ............................................................................................ 38
6.3.1 Cooperation with Company 3 ........................................................................................ 38
6.3.2 Activities and Achievements .......................................................................................... 38
6.3.3 Overall evaluation ............................................................................................................. 43
6.3.4 Plan for Continuous CP implementation ................................................................... 45
6.4 Achievements made by Company 4 ............................................................................................ 45
6.4.1 Cooperation with Company 4 ........................................................................................ 45

6.4.2 Activities and Achievements .......................................................................................... 46
6.4.3 Overall evaluation ............................................................................................................. 49
6.4.4 Plan for continuous CP implementation.................................................................... 50
6.4.5 Recommendations from expert ..................................................................................... 50
7. Evaluation of the program by the companies ................................................................................. 51
8. Success factors and lessons learned ................................................................................................... 51
9. Conclusion ..................................................................................................................................................... 53
Annex 1 Schedule of program activity ................................................................................................... 54
Annex 2 – News article on closing event ............................................................................................... 55

1
Executive Summary The Ministry of Infrastructure and Environment has in 2008 initiated activities in view
of the LAP waste management plan to reduce the environmental impact of 8 materials /
supply chains, one of which is textiles. Within this framework, I&M has asked
Solidaridad to put forward a project proposal aiming to implement, monitor and
evaluate 5-7 pilot projects with brands or retailers active on the Dutch market to gain
insights in the scope for improvements and to identify what methodology could achieve
good results in an effective manner. This report describes this pilot project where 3
brands partnered with Solidaridad to support 5 suppliers, textile wet processing
factories (textile dyeing or washing mills), to identify and implement improvements.
The project combines tailor made support with group learnings, which in this project
has proven to be an effective and efficient method to build the capacity of the
participating factories. The key to success in addition to a programme that suits the
needs of the industry has proven to be 1) true commitment of the top management and
2) buyer engagement. While the request of the customer is an important driver to
participate in the project, if the top management does not recognise the benefits or the
necessity, the results achieved will be minimal. This was underlined by the
conversations with one company who dropped out of the programme at an early stage.
In China we see that the changing laws and regulations contribute to interest in
improvement programmes such as this one.
The 4 remaining suppliers participated in this project from November 2011 to
December 2012 with a closing Workshop in February 2013. In addition to the on-site
tailor made support, a variety of topics was addressed in workshops; including for
example the concept of Cleaner Production, effluent treatment and best practice
examples from China as well as best available technologies (BATs). The capacity
building programme aimed at establishing a basic management system internally
supporting the factory to work on continuous environmental improvements. During the
project the following was achieved by the four companies together:
Total no of measures implemented
by the 4 companies
34
Total investments (RMB) 7.88 million RMB invested
14 million RMB planned
Amount of water saved (t) 148,110
Amount of steam saved (t) 1,733
Amount of electricity saved (kWh) 18,762
Improvement options implemented ranged from installing metering equipment and
insulation, to replacing outdated and inefficient machinery and improving the handling
and storage of chemicals. At the closing workshop, all four participants shared the next
steps that their internal CP teams have identified for implementation, which is an
indication of the long term sustainability of the project with each of the participants.
Solidaridad in partnership with brands and their suppliers expects to launch a scale-up
of the programme in the Yangtze River Delta in the second half of 2013. The learnings of
this project have been instrumental in designing this scale up.

2
1. Background
Background to this project
The Ministry of Infrastructure and Environment has in 2008 initiated activities in view
of the LAP waste management plan to reduce the environmental impact of 8 materials /
supply chains. One of these supply chains is textiles. Within this framework, research
was done to identify the possibilities for sustainability improvements for brands and
retailers in the fashion industry. This research has brought interesting insights, but in
the closing meeting, it was also felt that in spite of the amount of information provided,
additional practical support would be desired to guide the brands on how to implement
these sustainability improvements.
Within this framework, I&M has asked Solidaridad to put forward a project proposal
aiming to implement, monitor and evaluate 5-7 pilot projects with brands or retailers
active on the Dutch market.
In consultation with the Working Group that is facilitated by AgencyNL, it was decided
to focus on China. A kick off meeting was organised on June 24, 2011 to inform Dutch
brands with an interest in the project and to motivate them to partner with Solidaridad.
Out of the brands interested, in October Tommy Hilfiger, G-Star and Primark decided to
partner in this pilot project. The kick off meeting and first training in China, Hangzhou,
was organised on 15 and 16 November 2011 with representation of the three brands
end the 5 suppliers they had nominated.
In view of the small number of (competing) brands participating and the sensitivity of
disclosing suppliers, it was agreed with the brands to not mention the supplier names
linked with their brand partners in this report. Solidaridad is of course willing to be fully
transparent to its donor and can disclose the names and locations of these to the
Ministry of I&M if desired.
Why the choice for China
China is today still the largest apparel manufacturer globally and an important sourcing
country for clothes sold in The Netherlands. The industry in China started to rapidly
grow from the early 1980’s, which also implies that there are numerous companies with
relatively set-ups with a large scope for improvement. Because of the importance of
China as a sourcing country for the Dutch sector, the sector associations in the working
group of AgencyNL advised to initiate this pilot in China.
Solidaridad moreover experienced in her work in China a need in the sector for support
on the identification of improvement options, particularly in view of increasing
government pressure, who in the past years increased its efforts to regulate the
performance of the textile industry. For instance, the 12th Five-Year Plan for the
Development of the Textile Industry (January 2012), defines specific environmental
targets and calls for concrete measures for upgrading management skills, promoting
new technologies, facilitating resource recycling and reuse, accelerating the elimination
of backward production capacity and stepping up pollution control.
The environmental responsibility of the Chinese textile and apparel Industry received
immense attention from stakeholders in 2011, following the start Detox Campaign of
Greenpeace. Greenpeace studies published since 2011 have provoked heated

3
discussions among stakeholders about ecological safety of products and supply chain
pollution control. But also local Chinese NGOs call for action. The report on Cleaning up
the Fashion Industry asks for elimination of hazardous chemicals in the supply chain as
well as for information disclosure by suppliers and brands.
Sustainability aspects of textile wet processing have – because of these governments and
NGO initiatives - been high on the agenda. The industry in China however lacks the
knowledge and resources to identify and implement improvements. This pilot project
aimed at establishing a basic internal management system oriented at continuity of the
identification and implementation of improvements. To achieve this, we trialled a
capacity building approach consisting of collective learning through technical
workshops and knowledge exchange network meetings, and tailor made consultancy
support to help identify specific solutions for each participating factory.
The fruitful collaboration experience between brands and Solidaridad in 2011 and 2012
has proven that great improvements can be achieved through commitment, partnership
and a result oriented approach. The companies who participated in the program have
achieved a triple-win in economic, social and environmental performance. This report
describes the details.

4
2. Program concept
2.1 Program objectives
Through a combination of training workshops and onsite technical support on cleaner
production among nominated companies, the program aimed to:
• Introduce effective approaches and methods for achieving measurable improvement
in energy saving, water saving, resource conservation, reduced pollution, and cost
reduction etc.;
• Explore specific problems encountered in the participating companies with regard
to energy saving and cleaner production;
• Share international and national best practices from textile and dyeing sector.
In addition, both Solidaridad and the brands expect that with the 12 months of support
offered, the participating companies develop a functional internal management system
to make continuous improvements.
2.2 Program duration
The duration of the program started in November 2011. The closing workshop took
place in February 2013.
2.3 Mode of cooperation
Solidaridad and the brands jointly implemented the activities in the 5 selected
companies based in Yangtze River Delta region. The participating companies selected
and implement their improvement measures on voluntary basis. Contributions and
responsibilities of each partner are outlined in table 2-1.
Table 2-1 Partners and their roles/responsibilities within the framework of
Solidaridad Cleaner Production Program
Partners Responsibilities and activities
Brands • Facilitation and assistance in identifying and contacting suitable
companies amongst its suppliers
• Joint evaluation of the participating companies together with
Solidaridad during program commencement and after completion
• Provide necessary facilitation and coordination in the course of program
implementation
Solidaridad With support from external short-term consultant(s), Solidaridad is
responsible for:
• Organizing and conducting training workshops and network meetings
• Conducting baseline assessments
• Offering onsite hands-on technical supports to participating companies
• Monitoring and evaluation of the activities implemented
Participating
companies
• Delegating adequate staff for participation in training workshops &
network meetings and bearing associated costs
• Voluntarily selecting and implementing activities on energy saving and
emission reduction based on the inputs received and tailored to the
enterprise’s specific needs
• Internal monitoring of activity implementation
• Reporting and internal/external communication of results achieved
5
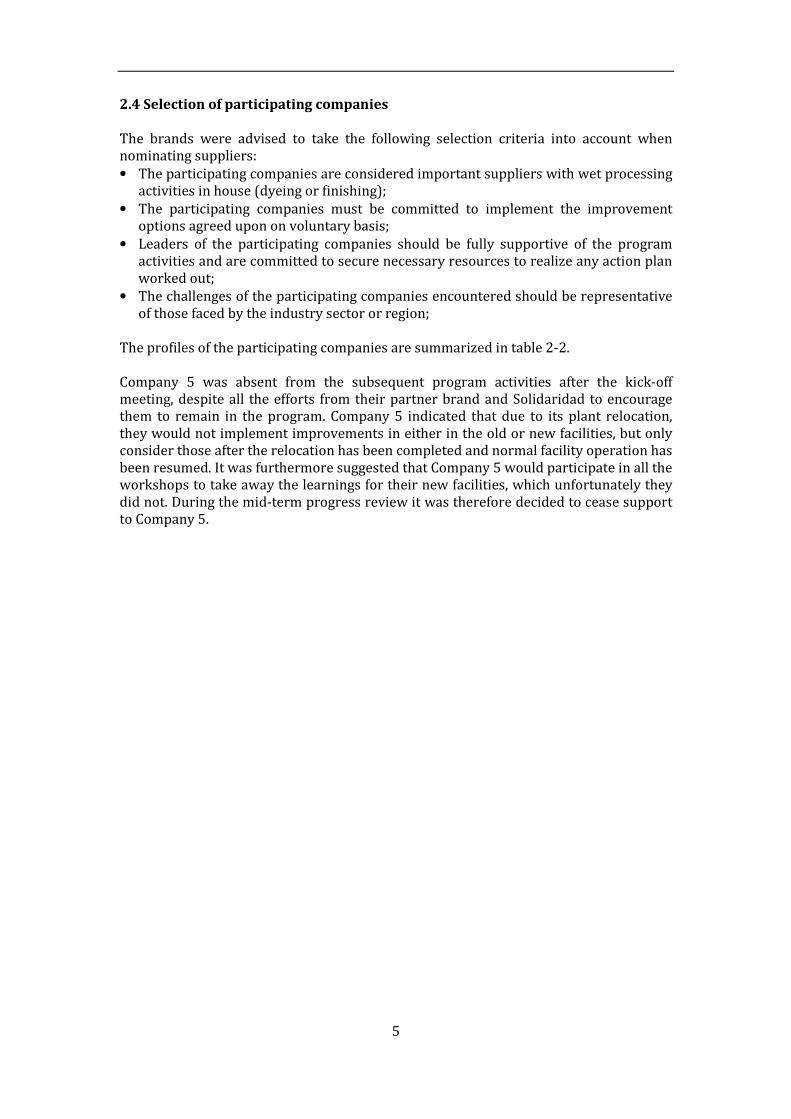
2.4 Selection of participating companies
The brands were advised to take the following selection criteria into account when
nominating suppliers:
• The participating companies are considered important suppliers with wet processing
activities in house (dyeing or finishing);
• The participating companies must be committed to implement the improvement
options agreed upon on voluntary basis;
• Leaders of the participating companies should be fully supportive of the program
activities and are committed to secure necessary resources to realize any action plan
worked out;
• The challenges of the participating companies encountered should be representative
of those faced by the industry sector or region;
The profiles of the participating companies are summarized in table 2-2.
Company 5 was absent from the subsequent program activities after the kick-off
meeting, despite all the efforts from their partner brand and Solidaridad to encourage
them to remain in the program. Company 5 indicated that due to its plant relocation,
they would not implement improvements in either in the old or new facilities, but only
consider those after the relocation has been completed and normal facility operation has
been resumed. It was furthermore suggested that Company 5 would participate in all the
workshops to take away the learnings for their new facilities, which unfortunately they
did not. During the mid-term progress review it was therefore decided to cease support
to Company 5.
6
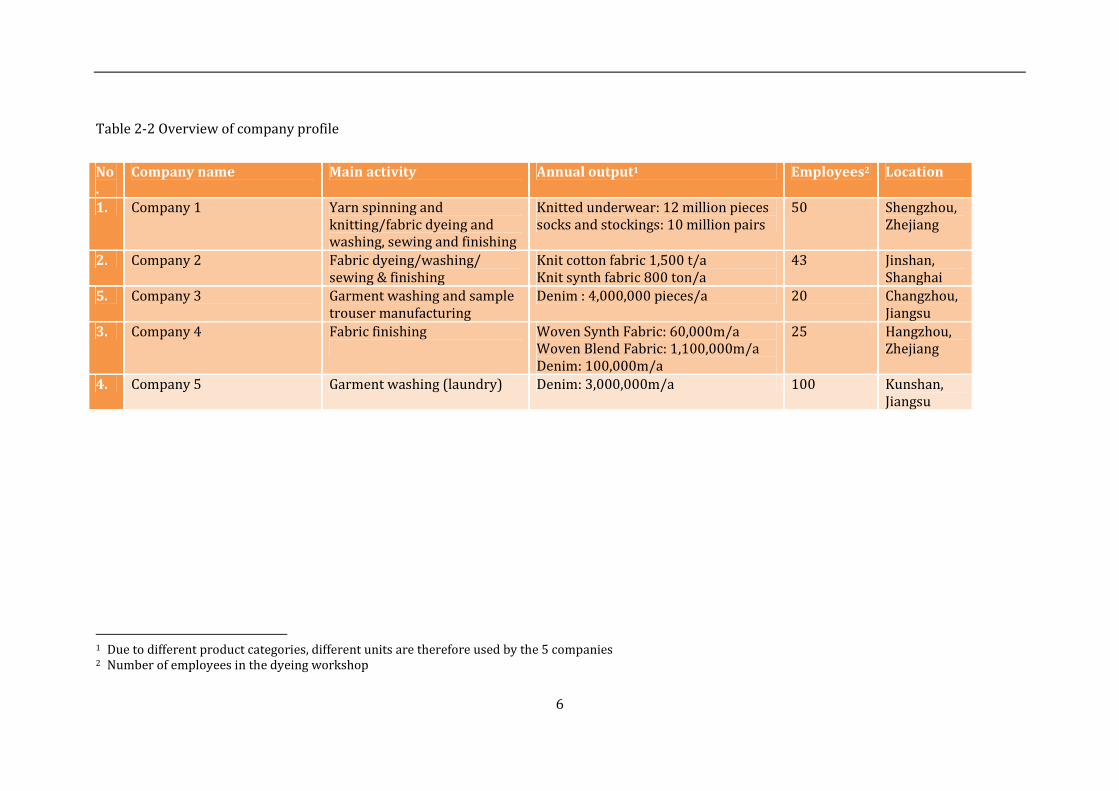
Table 2-2 Overview of company profile
1 Due to different product categories, different units are therefore used by the 5 companies 2 Number of employees in the dyeing workshop
No
.
Company name Main activity Annual output1 Employees2 Location
1. Company 1 Yarn spinning and
knitting/fabric dyeing and
washing, sewing and finishing
Knitted underwear: 12 million pieces
socks and stockings: 10 million pairs
50 Shengzhou,
Zhejiang
2. Company 2 Fabric dyeing/washing/
sewing & finishing
Knit cotton fabric 1,500 t/a
Knit synth fabric 800 ton/a
43 Jinshan,
Shanghai
5. Company 3 Garment washing and sample
trouser manufacturing
Denim : 4,000,000 pieces/a 20 Changzhou,
Jiangsu
3. Company 4 Fabric finishing
Woven Synth Fabric: 60,000m/a
Woven Blend Fabric: 1,100,000m/a
Denim: 100,000m/a
25 Hangzhou,
Zhejiang
4. Company 5 Garment washing (laundry) Denim: 3,000,000m/a 100 Kunshan,
Jiangsu
7
2.5 Expected benefits for participating companies
Through active participation in the capacity building program on cleaner production, the
following benefits were foreseen:
• Improved production efficiency;
• More efficient use of materials, water and energy;
• Lower costs for waste disposal and wastewater treatment;
• Improved occupational health and safety;
• Increased national and international competitiveness; and
• Enhanced reputation and image
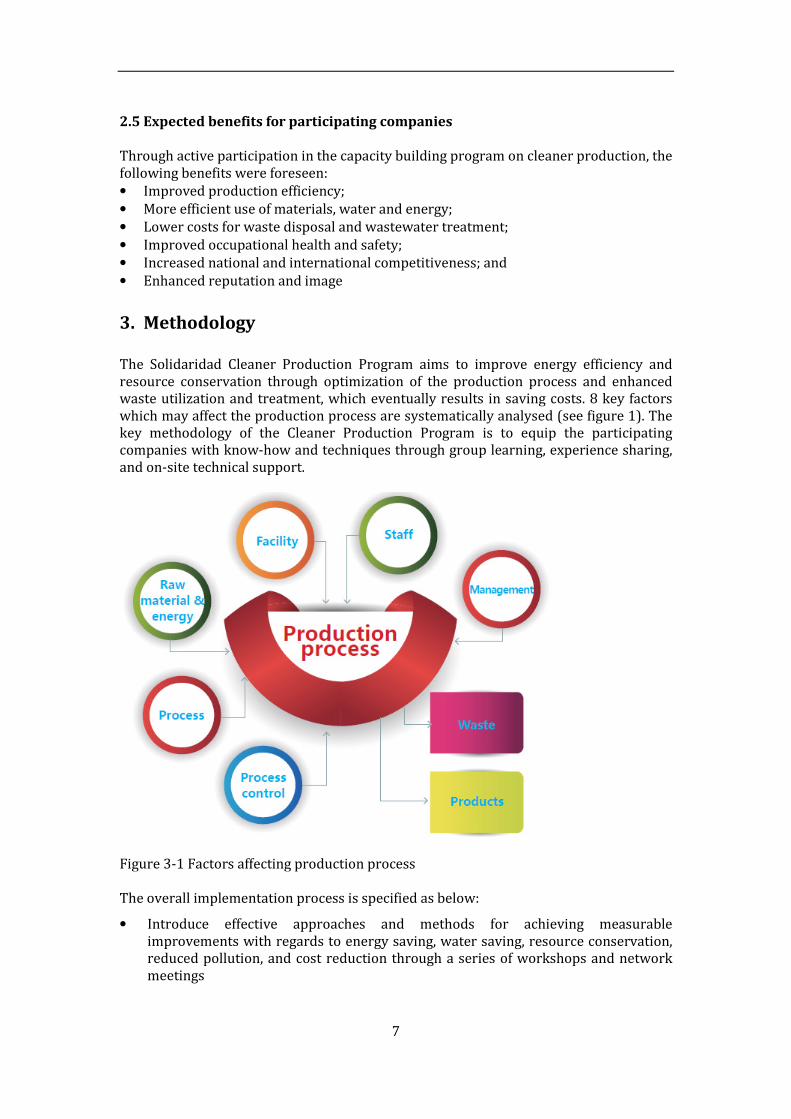
3. Methodology
The Solidaridad Cleaner Production Program aims to improve energy efficiency and
resource conservation through optimization of the production process and enhanced
waste utilization and treatment, which eventually results in saving costs. 8 key factors
which may affect the production process are systematically analysed (see figure 1). The
key methodology of the Cleaner Production Program is to equip the participating
companies with know-how and techniques through group learning, experience sharing,
and on-site technical support.
Figure 3-1 Factors affecting production process
The overall implementation process is specified as below:
• Introduce effective approaches and methods for achieving measurable
improvements with regards to energy saving, water saving, resource conservation,
reduced pollution, and cost reduction through a series of workshops and network
meetings
8
• Help participating companies to build capacity and set up a functioning internal
management system to seek continuous improvement
• Conduct a baseline assessment in all participating companies and identify room for
improvement
• Send in technical team on-site to offer hands-on support
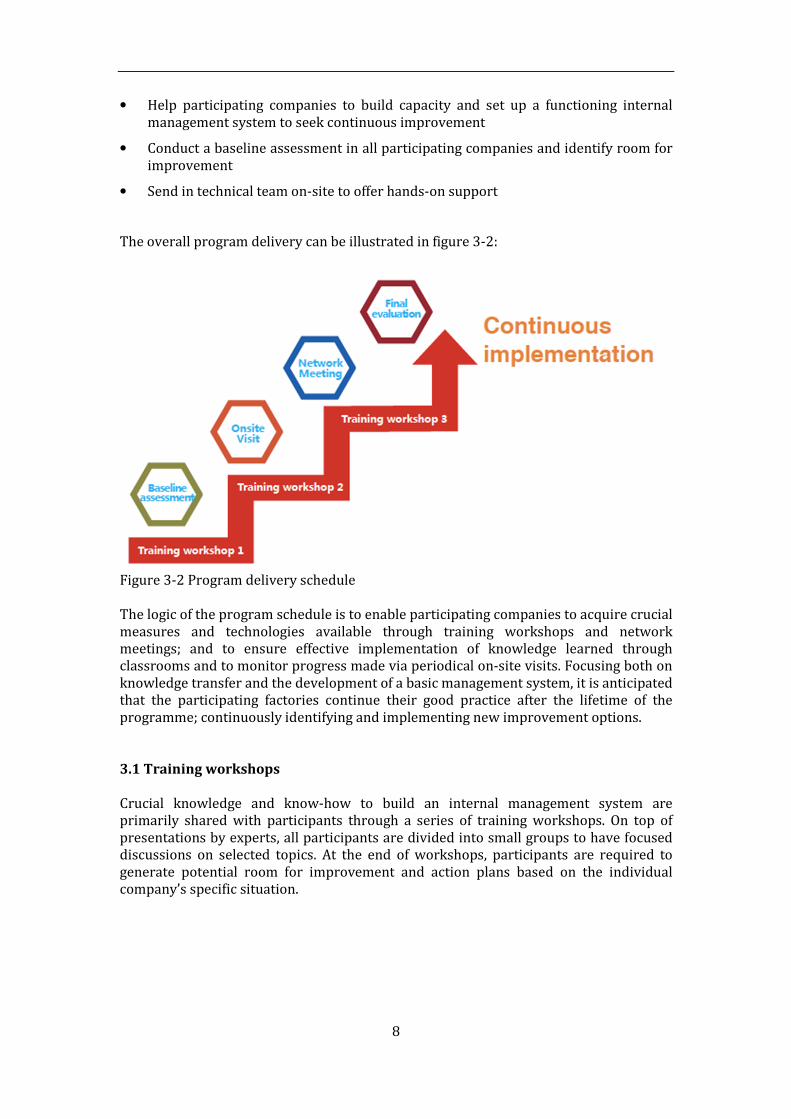
The overall program delivery can be illustrated in figure 3-2:
Figure 3-2 Program delivery schedule
The logic of the program schedule is to enable participating companies to acquire crucial
measures and technologies available through training workshops and network
meetings; and to ensure effective implementation of knowledge learned through
classrooms and to monitor progress made via periodical on-site visits. Focusing both on
knowledge transfer and the development of a basic management system, it is anticipated
that the participating factories continue their good practice after the lifetime of the
programme; continuously identifying and implementing new improvement options.
3.1 Training workshops
Crucial knowledge and know-how to build an internal management system are
primarily shared with participants through a series of training workshops. On top of
presentations by experts, all participants are divided into small groups to have focused
discussions on selected topics. At the end of workshops, participants are required to
generate potential room for improvement and action plans based on the individual
company’s specific situation.
9
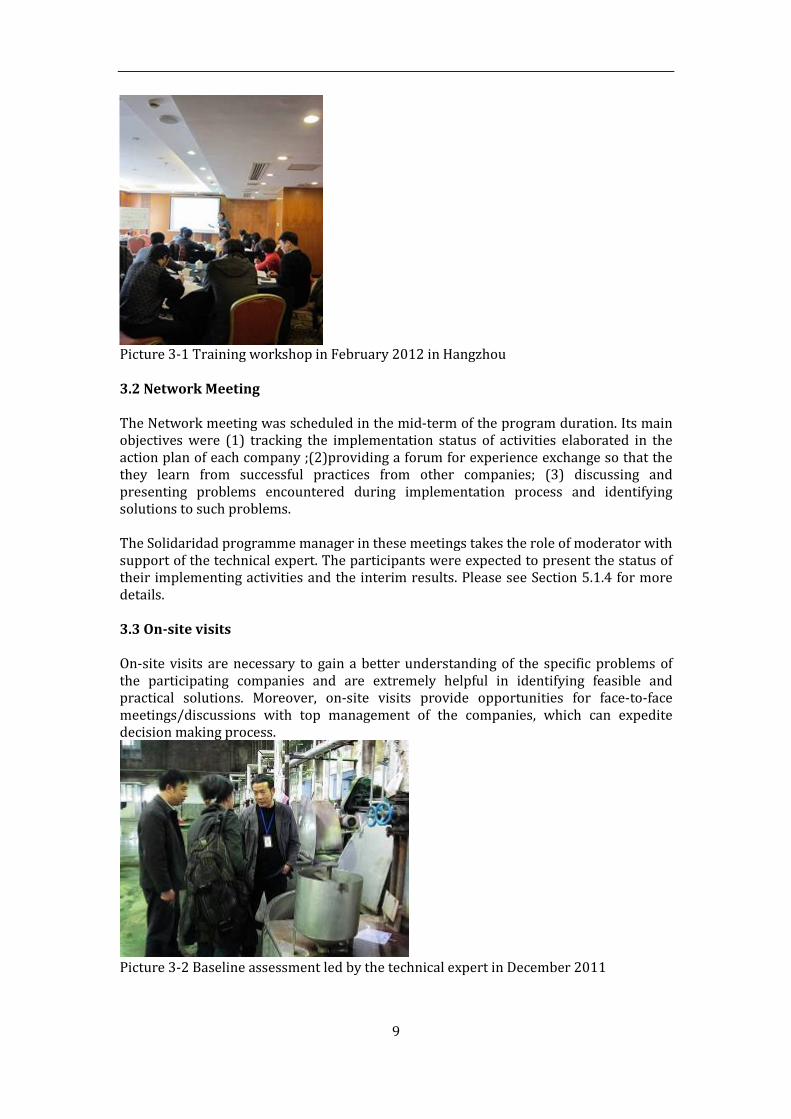
Picture 3-1 Training workshop in February 2012 in Hangzhou
3.2 Network Meeting
The Network meeting was scheduled in the mid-term of the program duration. Its main
objectives were (1) tracking the implementation status of activities elaborated in the
action plan of each company ;(2)providing a forum for experience exchange so that the
they learn from successful practices from other companies; (3) discussing and
presenting problems encountered during implementation process and identifying
solutions to such problems.
The Solidaridad programme manager in these meetings takes the role of moderator with
support of the technical expert. The participants were expected to present the status of
their implementing activities and the interim results. Please see Section 5.1.4 for more
details.
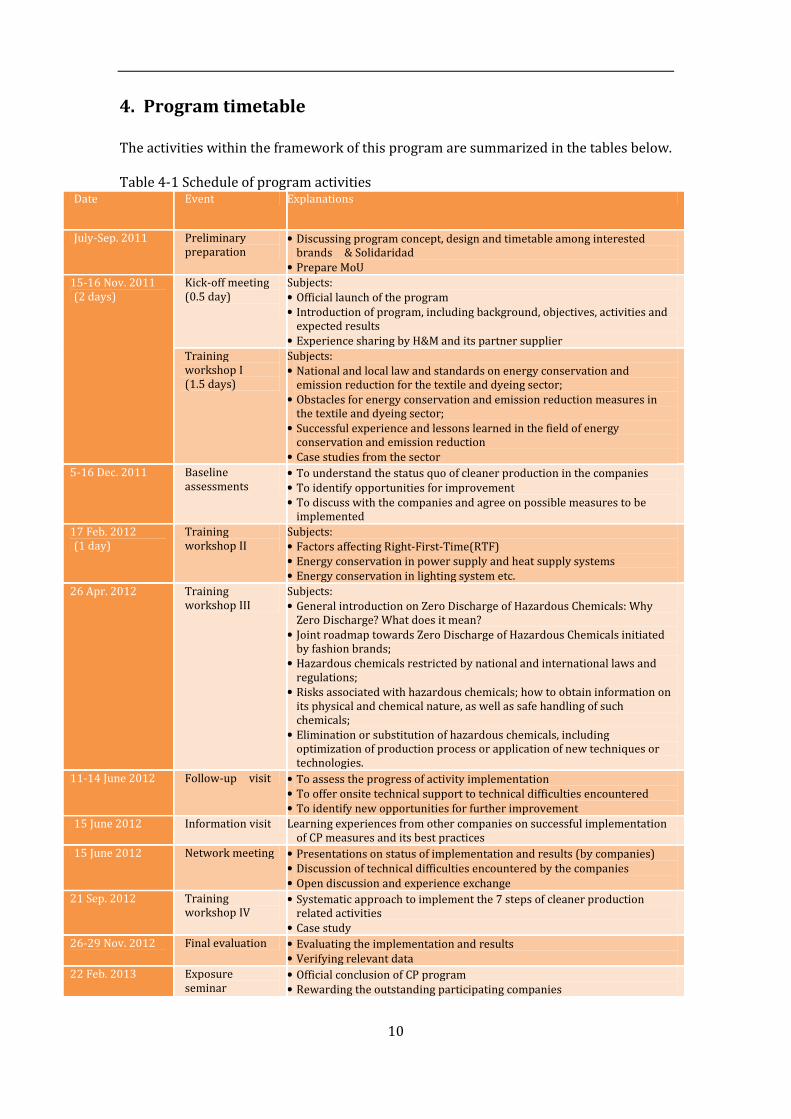
3.3 On-site visits
On-site visits are necessary to gain a better understanding of the specific problems of
the participating companies and are extremely helpful in identifying feasible and
practical solutions. Moreover, on-site visits provide opportunities for face-to-face
meetings/discussions with top management of the companies, which can expedite
decision making process.
Picture 3-2 Baseline assessment led by the technical expert in December 2011
10
4. Program timetable
The activities within the framework of this program are summarized in the tables below.
Table 4-1 Schedule of program activities Date Event Explanations
July-Sep. 2011 Preliminary
preparation • Discussing program concept, design and timetable among interested
brands & Solidaridad
• Prepare MoU
15-16 Nov. 2011
(2 days)
Kick-off meeting
(0.5 day)
Subjects:
• Official launch of the program
• Introduction of program, including background, objectives, activities and
expected results
• Experience sharing by H&M and its partner supplier
Training
workshop I
(1.5 days)
Subjects:
• National and local law and standards on energy conservation and
emission reduction for the textile and dyeing sector;
• Obstacles for energy conservation and emission reduction measures in
the textile and dyeing sector;
• Successful experience and lessons learned in the field of energy
conservation and emission reduction
• Case studies from the sector
5-16 Dec. 2011 Baseline
assessments • To understand the status quo of cleaner production in the companies
• To identify opportunities for improvement
• To discuss with the companies and agree on possible measures to be
implemented
17 Feb. 2012
(1 day)
Training
workshop II
Subjects:
• Factors affecting Right-First-Time(RTF)
• Energy conservation in power supply and heat supply systems
• Energy conservation in lighting system etc.
26 Apr. 2012 Training
workshop III
Subjects:
• General introduction on Zero Discharge of Hazardous Chemicals: Why
Zero Discharge? What does it mean?
• Joint roadmap towards Zero Discharge of Hazardous Chemicals initiated
by fashion brands;
• Hazardous chemicals restricted by national and international laws and
regulations;
• Risks associated with hazardous chemicals; how to obtain information on
its physical and chemical nature, as well as safe handling of such
chemicals;
• Elimination or substitution of hazardous chemicals, including
optimization of production process or application of new techniques or
technologies.
11-14 June 2012 Follow-up visit • To assess the progress of activity implementation
• To offer onsite technical support to technical difficulties encountered
• To identify new opportunities for further improvement
15 June 2012 Information visit Learning experiences from other companies on successful implementation
of CP measures and its best practices
15 June 2012 Network meeting • Presentations on status of implementation and results (by companies)
• Discussion of technical difficulties encountered by the companies
• Open discussion and experience exchange
21 Sep. 2012 Training
workshop IV • Systematic approach to implement the 7 steps of cleaner production
related activities
• Case study
26-29 Nov. 2012 Final evaluation • Evaluating the implementation and results
• Verifying relevant data
22 Feb. 2013 Exposure
seminar • Official conclusion of CP program
• Rewarding the outstanding participating companies
11
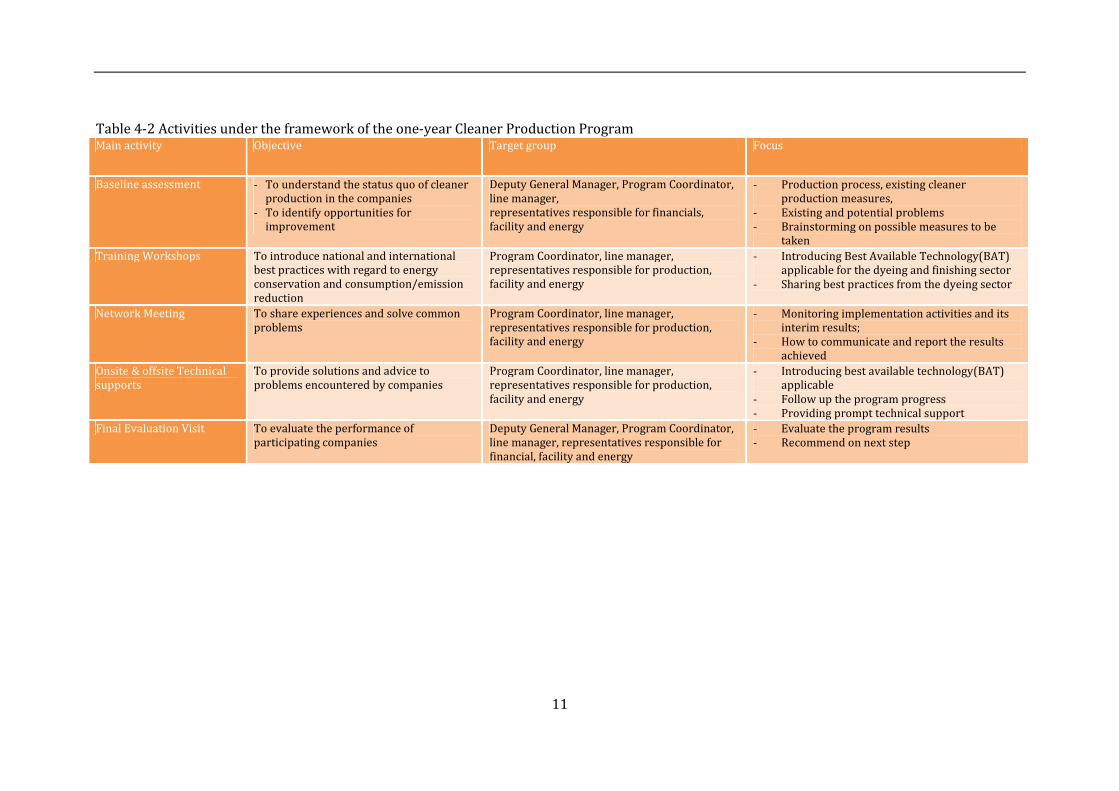
Table 4-2 Activities under the framework of the one-year Cleaner Production Program Main activity Objective Target group Focus
Baseline assessment - To understand the status quo of cleaner
production in the companies
- To identify opportunities for
improvement
Deputy General Manager, Program Coordinator,
line manager,
representatives responsible for financials,
facility and energy
- Production process, existing cleaner
production measures,
- Existing and potential problems
- Brainstorming on possible measures to be
taken
Training Workshops To introduce national and international
best practices with regard to energy
conservation and consumption/emission
reduction
Program Coordinator, line manager,
representatives responsible for production,
facility and energy
- Introducing Best Available Technology(BAT)
applicable for the dyeing and finishing sector
- Sharing best practices from the dyeing sector
Network Meeting To share experiences and solve common
problems
Program Coordinator, line manager,
representatives responsible for production,
facility and energy
- Monitoring implementation activities and its
interim results;
- How to communicate and report the results
achieved
Onsite & offsite Technical
supports
To provide solutions and advice to
problems encountered by companies
Program Coordinator, line manager,
representatives responsible for production,
facility and energy
- Introducing best available technology(BAT)
applicable
- Follow up the program progress
- Providing prompt technical support
Final Evaluation Visit To evaluate the performance of
participating companies
Deputy General Manager, Program Coordinator,
line manager, representatives responsible for
financial, facility and energy
- Evaluate the program results
- Recommend on next step
12
5. Key activities and outputs
5.1 Kick-off meeting
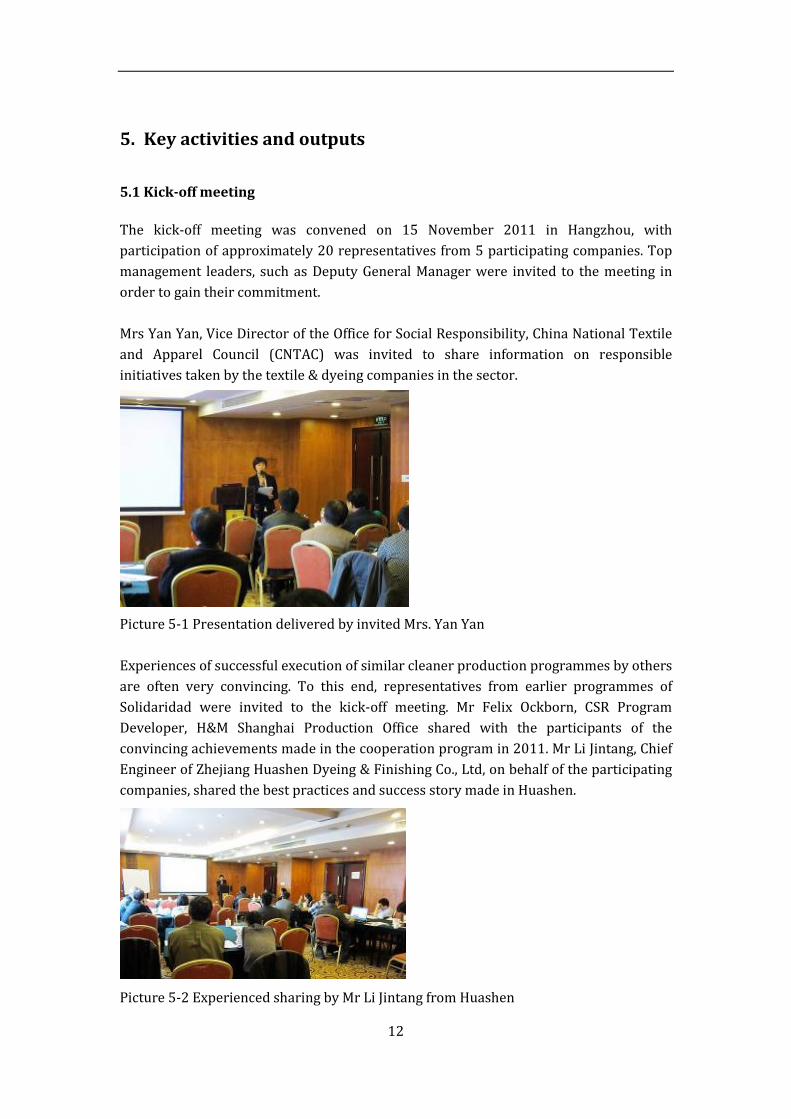
The kick-off meeting was convened on 15 November 2011 in Hangzhou, with
participation of approximately 20 representatives from 5 participating companies. Top
management leaders, such as Deputy General Manager were invited to the meeting in
order to gain their commitment.
Mrs Yan Yan, Vice Director of the Office for Social Responsibility, China National Textile
and Apparel Council (CNTAC) was invited to share information on responsible
initiatives taken by the textile & dyeing companies in the sector.
Picture 5-1 Presentation delivered by invited Mrs. Yan Yan
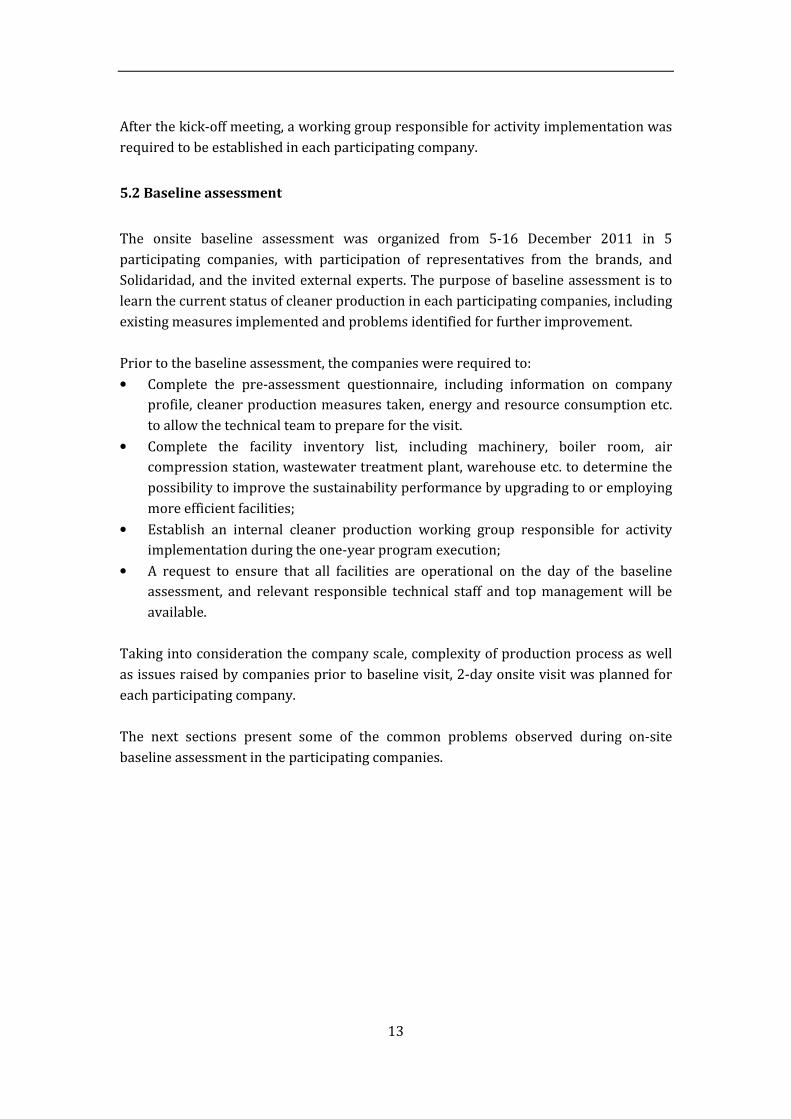
Experiences of successful execution of similar cleaner production programmes by others
are often very convincing. To this end, representatives from earlier programmes of
Solidaridad were invited to the kick-off meeting. Mr Felix Ockborn, CSR Program
Developer, H&M Shanghai Production Office shared with the participants of the
convincing achievements made in the cooperation program in 2011. Mr Li Jintang, Chief
Engineer of Zhejiang Huashen Dyeing & Finishing Co., Ltd, on behalf of the participating
companies, shared the best practices and success story made in Huashen.
Picture 5-2 Experienced sharing by Mr Li Jintang from Huashen
13
After the kick-off meeting, a working group responsible for activity implementation was
required to be established in each participating company.
5.2 Baseline assessment
The onsite baseline assessment was organized from 5-16 December 2011 in 5
participating companies, with participation of representatives from the brands, and
Solidaridad, and the invited external experts. The purpose of baseline assessment is to
learn the current status of cleaner production in each participating companies, including
existing measures implemented and problems identified for further improvement.
Prior to the baseline assessment, the companies were required to:
• Complete the pre-assessment questionnaire, including information on company
profile, cleaner production measures taken, energy and resource consumption etc.
to allow the technical team to prepare for the visit.
• Complete the facility inventory list, including machinery, boiler room, air
compression station, wastewater treatment plant, warehouse etc. to determine the
possibility to improve the sustainability performance by upgrading to or employing
more efficient facilities;
• Establish an internal cleaner production working group responsible for activity
implementation during the one-year program execution;
• A request to ensure that all facilities are operational on the day of the baseline
assessment, and relevant responsible technical staff and top management will be
available.
Taking into consideration the company scale, complexity of production process as well
as issues raised by companies prior to baseline visit, 2-day onsite visit was planned for
each participating company.
The next sections present some of the common problems observed during on-site
baseline assessment in the participating companies.
14
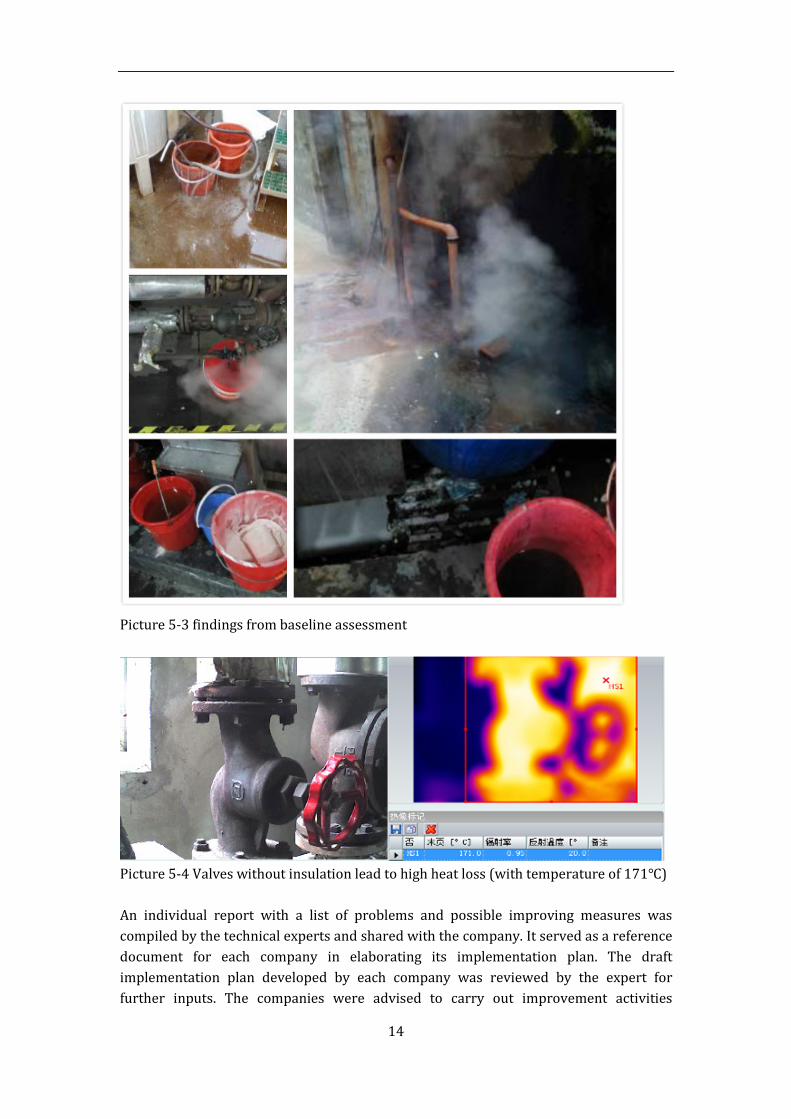
Picture 5-3 findings from baseline assessment
Picture 5-4 Valves without insulation lead to high heat loss (with temperature of 171℃)
An individual report with a list of problems and possible improving measures was
compiled by the technical experts and shared with the company. It served as a reference
document for each company in elaborating its implementation plan. The draft
implementation plan developed by each company was reviewed by the expert for
further inputs. The companies were advised to carry out improvement activities
15
according to the final plan and to regularly monitor the progress throughout the
implementation process to determine the needs for necessary adjustments.
The companies were also advised to collect, compare
and document information on program activities,
including measures implemented and results achieved.
This allows the company to develop report and to
effectively communicate the information with their
stakeholders within and outside the company,
particularly with the management.
5.3 Training workshops
(a) Training on cleaner production
In order to equip the participating companies with
necessary knowledge and know-how on the best
available technology or best practices on energy
conservation and emission reduction, 3 rounds of 1-day
cleaner production workshop were organized in
November 2011, mid- February and late September
2012, respectively in Hangzhou, Zhejiang (please see
Table 4-1 for more details), with participation of
approximately 20 representatives from 4 participating
companies.
During the training workshops, the following topics have been covered:
• A systematic approach of cleaner production in textile and dyeing companies;
• Energy saving in boilers;
• Insulation of heat system, reuse of condensate, wastewater heat recovery;
• Technology for wastewater treatment, process water recycling;
• Emission reduction technologies applied in dyeing sector, including minimization of
wastewater and off-gas discharge, alkali recycling etc. ;
• Factors influencing RFT (right first time dyeing);
• Developing cleaner production options by using checklists;
• National and local standards on energy conservation and emission reduction for the
printing and dyeing sector;
Real cases were shared with the participants by the trainer, not only by presenting the
need for improvement, but by providing them with reliable figures in relation to
investment costs and savings and sustainability improvements achieved. According to
the evaluation results, most participants valued the in-depth discussion sessions. They
provided concrete ideas on what needs to be considered when implementing
improvements.
Quotes from feedback forms
„......the general organization of the
training was very good; the content
is very practical and useful, though
very tight agenda. The invited
experts are very experienced and
knowledgeable. In one word,
superb“.
„........technical discussions during
training were very good,
information shared is helpful in real
practice and implementation“

16
Picture 5-5 Discussion and exchange session during training workshop
(b) Training on Zero Discharge of Hazardous Chemicals
Hazardous chemicals used in the fashion supply chain have drawn attention from the
public and NGOs. As we know that large varieties and amounts of dyestuff and auxiliary
agents containing hazardous substances such as PCP, ZeCP, APE, OPP etc. are used in the
dyeing and printing sector. Such hazardous chemicals have proven to cause threats to
the ecological environment and human health due to their nature of being persistent,
bio-accumulative, toxic and/or carcinogenic etc.
Fashion brands have not yet been able to effectively eliminate hazardous chemicals from
their supply chains. To ensure that our partner companies are well aware of this ‘hot
topic’, within the framework of Solidaridad’s Cleaner Production Program, a one-day
training workshop on “Towards Zero Discharge of Hazardous Chemicals in Dyeing and
Printing Sector” was organized for the participating companies and their partner brands
on 26 April 2012 in Hangzhou, China. The following topics were addressed:
• General introduction on Zero Discharge of Hazardous Chemicals: Why Zero
Discharge? What does it mean?

17
• Joint roadmap towards Zero Discharge of Hazardous Chemicals by fashion brands;
• Hazardous chemicals which are restricted by national and international laws and
regulations;
• Risks associated with hazardous chemicals; how to obtain information on its
physical and chemical nature, as well as safe handling of such chemicals;
• Elimination or substitution of hazardous chemicals, including optimization of
production process or application of new techniques or technologies
Dyestuff manufacturer Dystar China was invited to share information on
environmentally-friendly and energy efficient dyestuff and auxiliary agents.
Evaluation of training workshops
Evaluation forms were distributed to all participants at the end of each training session
to obtain feedback on content, quality of the trainer, the organization and logistics, and
to gain suggestions on how to improve future trainings. .
In general, the trainings were positively rated by all participants. It shows on average,
that more than 70% of participants strongly agree that the workshop addressed the
issues they wanted to know about, 86.3% strongly agree that the training provided
useful techniques and information on energy savings, emission reduction and cleaner
production. The information provided, was believed to be applicable in their daily
practice. 80% of participants strongly agree that the trainer effectively presented the
materials in a clear and organized manner. 80% participants strongly agree that in
overall, the training was very good, and it will help them do their job better, and such
trainings are worthwhile and should be conducted on a regular basis.
5.4 Network meeting
In order to learn the progress of program implementation and the specific needs from
the companies, and to provide a platform to share good practices, a one-day cleaner
production network meeting was convened on 16 June 2012 in Hangzhou, during which
the companies were invited to present the progress and intermediate achievements
have been made since the kick-off meeting in November 2011.
During the network meeting, each company was required:
• to present progress of the activities described in the action plan, and preliminary
results achieved;
• to present other improvement measures (which are not included in the action plans)
implemented, and their results;
• to summarize problems encountered during activity implementation;
• to discuss solutions to the problems encountered;
• to raise other issues which need to be addressed in the programme.

18
Each company was given 30 minutes; 15 minutes for presentation, and 15 minutes for
discussion and Q&A.
The presentations showed that all companies have made real efforts, both in terms of
financial and human resources, to implement measures to improve the environmental,
social and economic performance. The measures were facility-, production process-,
management-, and process control related. With support and guidance from the external
experts invited, the companies constantly adjusted their implementation plans by taking
into consideration their specific needs and best technology and experiences available.
During the Q&A session, the following issues were thoroughly discussed:
• Pros and cons of different types of insulation materials;
• Pros and cons of different types of steam traps;
• National or sector requirements, e.g. code of design on environmentally dyeing
factories.
The factories sometimes encountered challenges to convince the factory management to
invest in high cost / high impact improvements. One reason is the economic situation of
the apparel sector in China, due to globalisation and the economic recession in Western
markets. Another challenge comes from the relocation policy of the Chinese government.
Out of the 5 factories 2 already know that they have to shift to a different industrial area.
5.5 Information visit
In order to learn from earlier experiences in implementation of the cleaner production,
and to facilitate knowledge exchange with other companies, an information visit to
Zhejiang Huili Dyeing & Finishing Co., Ltd, one of the leading dyeing factories in Zhejiang,
was organized on 15 June 2012. The visit was an eye opener for the participants,
particularly the water recycling set-up with membrane technology, at Huili. The Chinese
government is expected to increase the requirements for the textile industry for water
recycling. Currently, in this region, the water recycling requirements is 35%.
Picture 5-6 Information visit in Huili
19
6. Evaluation of achievements made by participating companies
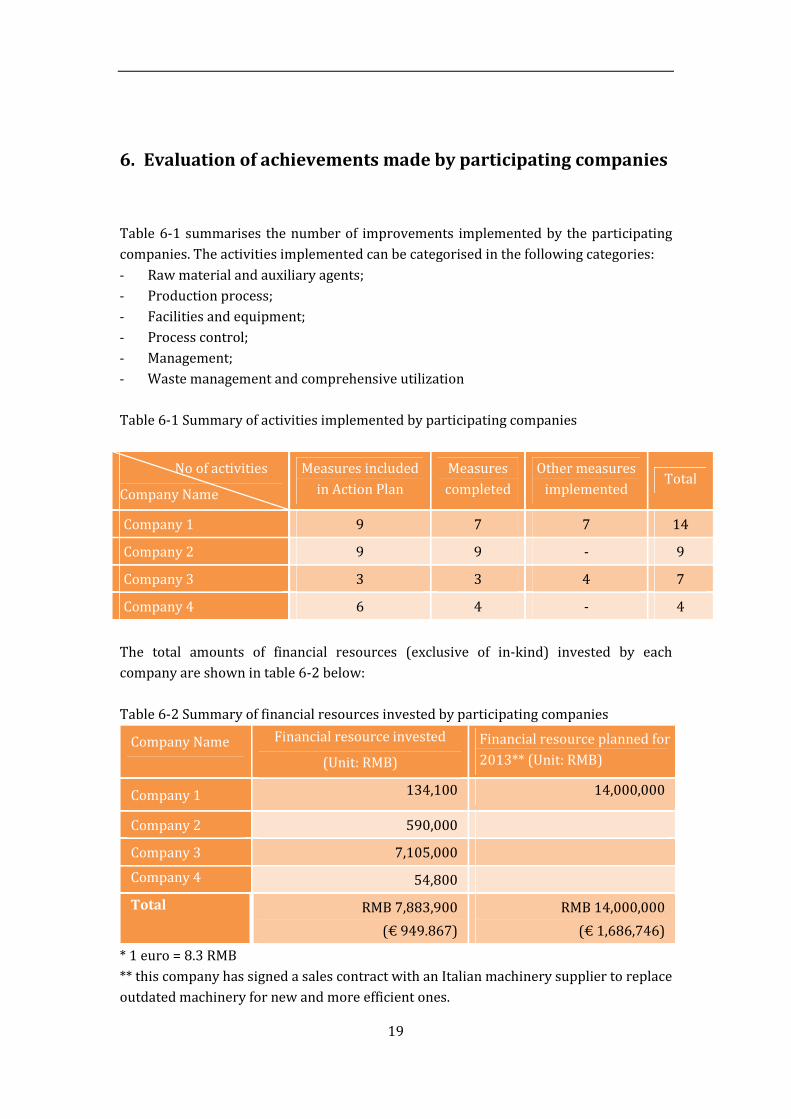
Table 6-1 summarises the number of improvements implemented by the participating
companies. The activities implemented can be categorised in the following categories:
- Raw material and auxiliary agents;
- Production process;
- Facilities and equipment;
- Process control;
- Management;
- Waste management and comprehensive utilization
Table 6-1 Summary of activities implemented by participating companies
No of activities
Company Name
Measures included
in Action Plan
Measures
completed
Other measures
implemented Total
Company 1 9 7 7 14
Company 2 9 9 - 9
Company 3 3 3 4 7
Company 4 6 4 - 4
The total amounts of financial resources (exclusive of in-kind) invested by each
company are shown in table 6-2 below:
Table 6-2 Summary of financial resources invested by participating companies
Company Name Financial resource invested
(Unit: RMB)
Financial resource planned for
2013** (Unit: RMB)
Company 1 134,100 14,000,000
Company 2 590,000
Company 3 7,105,000
Company 4 54,800
Total RMB 7,883,900
(€ 949.867)
RMB 14,000,000
(€ 1,686,746)
* 1 euro = 8.3 RMB
** this company has signed a sales contract with an Italian machinery supplier to replace
outdated machinery for new and more efficient ones.
20
In order to effectively measure and analyse energy resource consumption, all companies
were expected to achieve 3rd tier metering system (metering on process level) by the
end of the program, i.e. installation of water, steam and electricity meters to key energy
consumption units. Till the date of final evaluation, all companies except Company 4
have achieved this basic requirement.
6.1 Achievements made by Company 1
6.1.1 Cooperation with Company 1
Company 1 is a company that produces underwear, socks and stockings. Over 80% of
the production is exported. The part of the company that we focused on in the project
was the dyeing section (knitted fabric). The dyeing section employs around 50 people
and has an annual production of approximately 12 million pieces of underwear and 10
million pairs of socks and stockings.
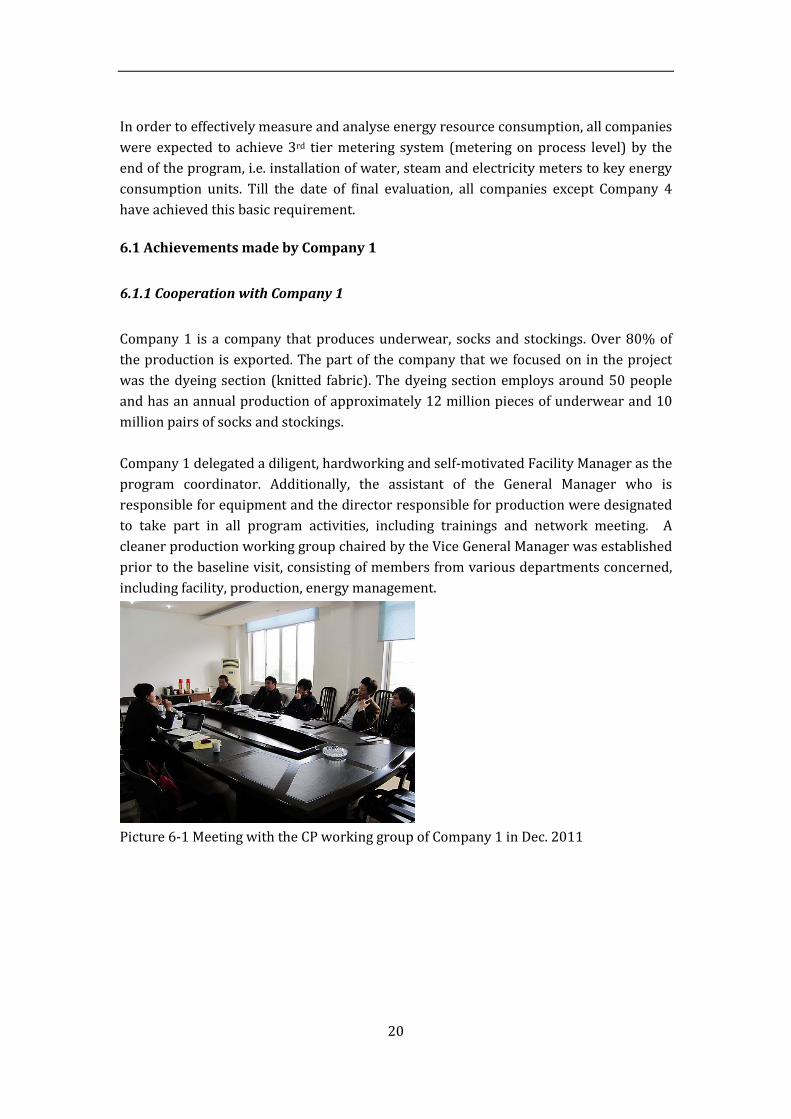
Company 1 delegated a diligent, hardworking and self-motivated Facility Manager as the
program coordinator. Additionally, the assistant of the General Manager who is
responsible for equipment and the director responsible for production were designated
to take part in all program activities, including trainings and network meeting. A
cleaner production working group chaired by the Vice General Manager was established
prior to the baseline visit, consisting of members from various departments concerned,
including facility, production, energy management.
Picture 6-1 Meeting with the CP working group of Company 1 in Dec. 2011

21
Picture 6-2 Data verification during final evaluation visit
6.1.2 Activities and Achievements
Before participating in the cleaner production program, some measures on improving
energy and water efficiency had been implemented in Company 1, including for
example,
• Hot air from the exhaust fan from the weaving workshop is drained to the air inlet
pipe of the air conditioner so as to reduce energy consumption, particularly in
winter.
• Heat of tailing gas from the stenter is drained into the water tank to increase the
water temperature before supplying it to the weaving unit, particularly in winter
season.
• Installation of Variable Frequency Speed Adjusting Energy Saving Unit on
production facilities such as Core Spun Spinning Frame, Cone Winding Machine etc.
• Installation of T5 energy saving lights in workshops and offices, only limited
number of T8 lights are remained.
Company 1 developed and prioritized a detailed implementation plan based the
recommendations in the baseline assessment report developed by the expert.
Table: Summary of implemented improving measures recommended by the expert.
No. Description Remarks
1 Improving the metering system Total investment: RMB 21,500
2 Reuse of tailing gas of stenter in
bleaching process
Completed, total investment: RMB
16,000
3 Replacement of O-shaped valves to
eliminate compressed air leakage
Completed with significant results.
Total investment: RMB 22,000
4 Modification of steam traps and Completed, total investment: RMB

22
by-pass valve next to the drying
machine
25,500
5 Improvement of chemical storage room Completed, total investment: RMB
4,100
6 Elimination of dyeing machines with
high water and energy consumption
Entered into contract with dyeing
machine suppliers, will be installed in
early Apr. 2013. Expected total
investment: RMB 13 million.
7 Insulation of steam pipes, valves and
high-temperature dyeing machines
Completed, total investment: RMB
5,000.
8 Selection of energy efficient steam
traps to effectively control steam
leakage
17 steam traps were replaced.
9 Heat recovery from wastewater Will not be implemented presently
The following table shows the implemented improvements identified by the Company 1
itself.
No. Description Remarks
1 Recovery of heat from air compressor Completed the feasibility study report.
Will not be implemented presently
2 Modification of inlet water pipes on
dyeing machine A
Completed, total investment: RMB
15,000
3 Recycling of clean hot water from Completed, total investment: RMB
5,000
4 Separation of clean and wastewater
steams in the dyeing workshop
Completed, total investment: RMB
20,000
5 Improving the efficiency and accuracy
of sample dyeing
Implemented.
6 Awareness raising of workers re.
operational procedures and product
quality Implemented. Has been included into
daily management. RFT has increased
by 18%. 7 Increasing awareness among R&D staff
re. RFT (right first time)
After one-year implementation, remarkable results have been achieved. Some measures
implemented by Company 1 are summarized below in more detail:
a) Reuse of tailing gas of stenter in bleaching process
Approximately 30% of steam remained in the exhaust gas generated from the stenters
in the finishing workshop was directly discharged without being re-use, which caused
enormous heat loss amounting to 304 ton/annum, which is equivalent to steam cost of
RMB 60,800 Yuan. A collection tank with volume of 15 tons was constructed outside the
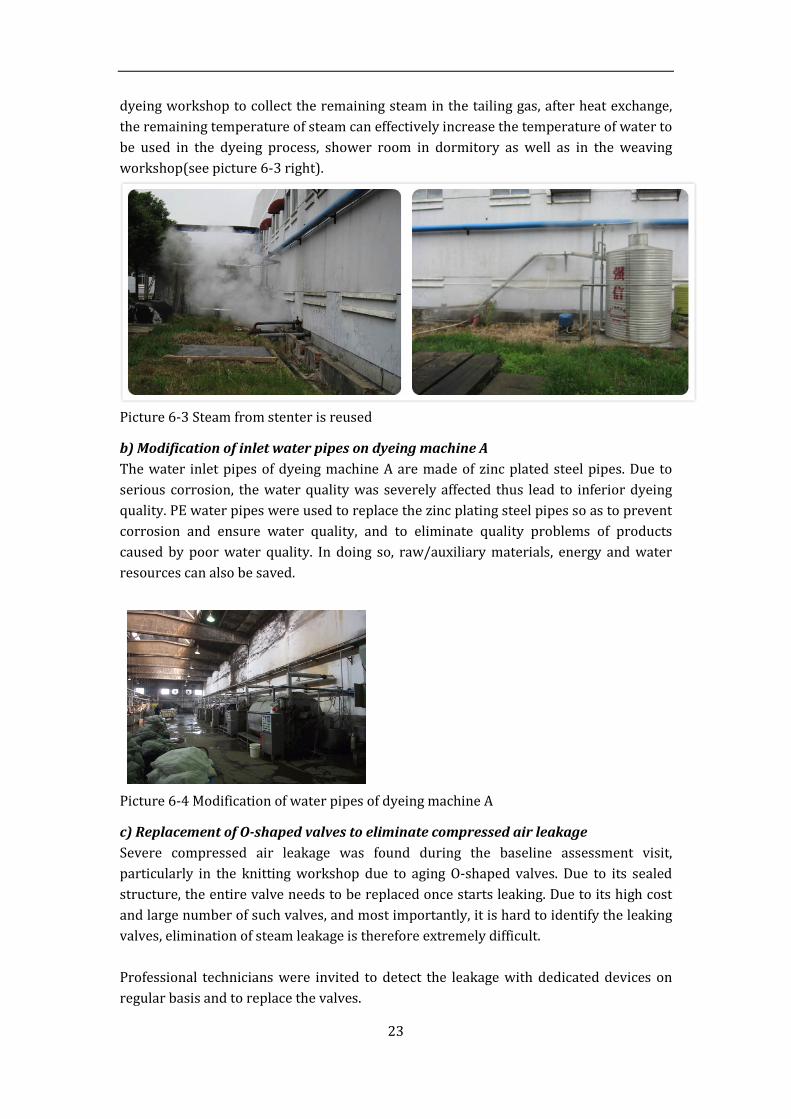
23
dyeing workshop to collect the remaining steam in the tailing gas, after heat exchange,
the remaining temperature of steam can effectively increase the temperature of water to
be used in the dyeing process, shower room in dormitory as well as in the weaving
workshop(see picture 6-3 right).
Picture 6-3 Steam from stenter is reused
b) Modification of inlet water pipes on dyeing machine A
The water inlet pipes of dyeing machine A are made of zinc plated steel pipes. Due to
serious corrosion, the water quality was severely affected thus lead to inferior dyeing
quality. PE water pipes were used to replace the zinc plating steel pipes so as to prevent
corrosion and ensure water quality, and to eliminate quality problems of products
caused by poor water quality. In doing so, raw/auxiliary materials, energy and water
resources can also be saved.
Picture 6-4 Modification of water pipes of dyeing machine A
c) Replacement of O-shaped valves to eliminate compressed air leakage
Severe compressed air leakage was found during the baseline assessment visit,
particularly in the knitting workshop due to aging O-shaped valves. Due to its sealed
structure, the entire valve needs to be replaced once starts leaking. Due to its high cost
and large number of such valves, and most importantly, it is hard to identify the leaking
valves, elimination of steam leakage is therefore extremely difficult.
Professional technicians were invited to detect the leakage with dedicated devices on
regular basis and to replace the valves.

24
Figure 6-5 Replacement of O-shaped valves
The achieved results are shown in table below:
Table 6-3 Comparison of operational efficiency of air compressors
Year
Item
Jan.-Oct.
2011 Jan.-Oct. 2012
Difference %
Electricity consumption of air compressors (kWh) 1,664,000 1,379,800 - 17.0%
Compressed air generation(m3) 14,833,990 1,312,009 - 11.5%
Production output(t) 809 750 - 7,3
Electricity consumption per unit output of
compressed air generation (kWh/1,000 m3)
112 105 - 6,3%
Electricity consumption of air compressor per unit
production output(kWh/t)
2,057 1,840 - 10,5%
It can be seen from table 6-3 that comparing with Jan. - Oct. 2011, the electricity
consumption of air compressor and the electricity consumption per unit output of
compressed air generation have been reduced by 10.5 % and 6.3%, respectively. In the
period of Jan. –Oct. 2012, a total of 162,750kWh of electricity has been saved. A total
investment of RMB 22,137, resulted in cost savings of RMB 131,800; the return on
investment (ROI) is 0.18 years.
d) Selection of energy efficient steam traps to effectively control steam leakage
The steam traps in Company 1 require frequent repair and replacement due to its
high steam leakage rate and short life-span. The workers usually open the by-pass
valves to shorten the time for temperature rising, whereas at the same time, steam
is discharged directly into the working environment, which lead to severe steam
wastage.
By selecting good quality steam straps, steam leakage rates have been reduced, and
the by-pass valves have been closed so as to avoid steam wastage by malpractice.
25
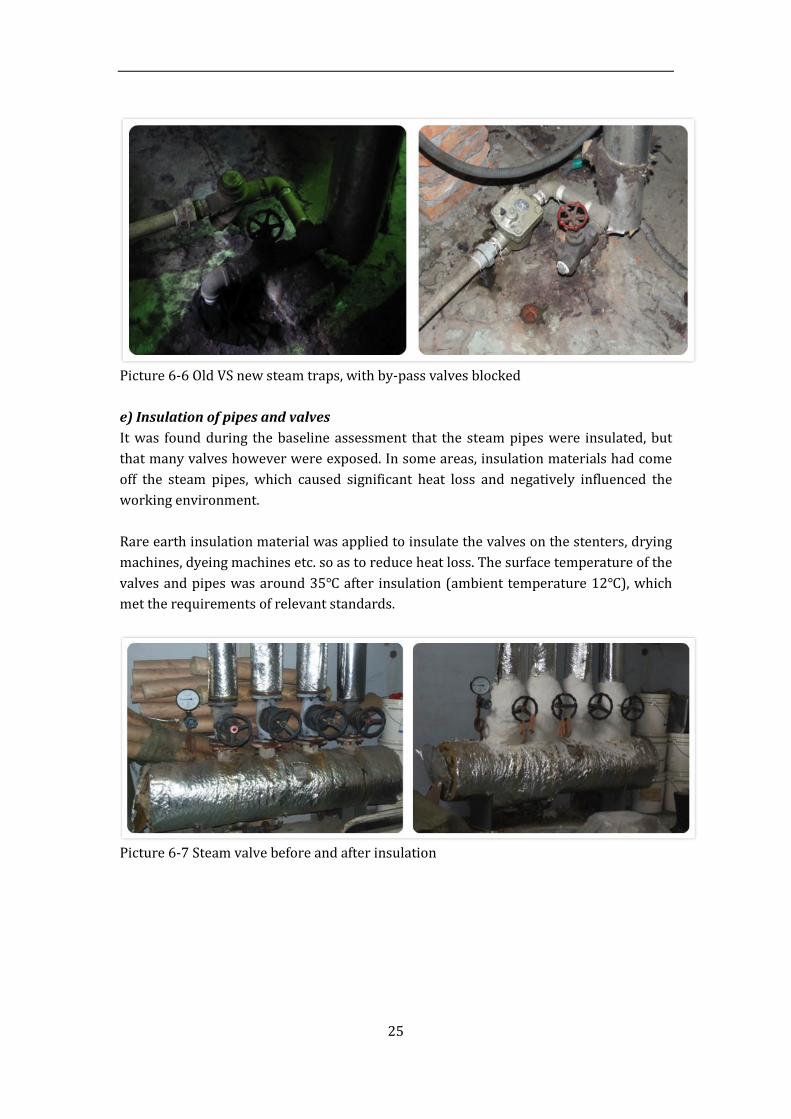
Picture 6-6 Old VS new steam traps, with by-pass valves blocked
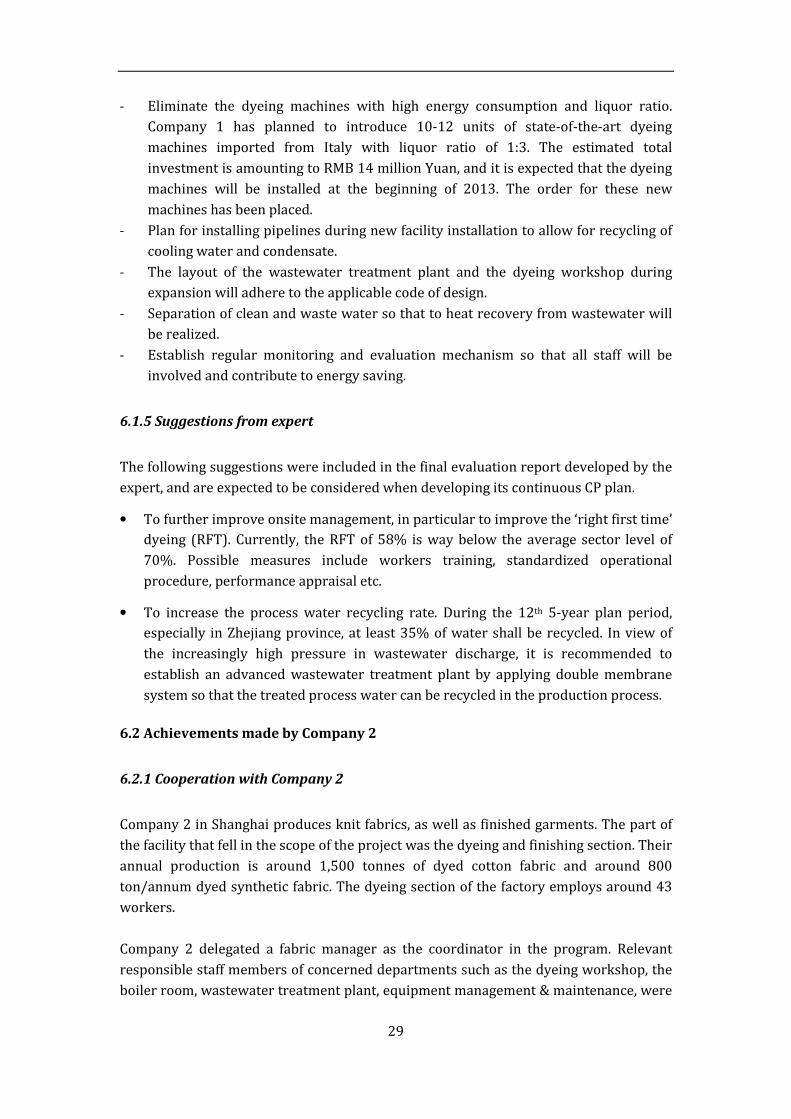
e) Insulation of pipes and valves
It was found during the baseline assessment that the steam pipes were insulated, but
that many valves however were exposed. In some areas, insulation materials had come
off the steam pipes, which caused significant heat loss and negatively influenced the
working environment.
Rare earth insulation material was applied to insulate the valves on the stenters, drying
machines, dyeing machines etc. so as to reduce heat loss. The surface temperature of the
valves and pipes was around 35℃ after insulation (ambient temperature 12℃), which
met the requirements of relevant standards.
Picture 6-7 Steam valve before and after insulation

26
Picture 6-8 Insulation of pipes with rare earth material
f) Improvement of chemical storage room
The dyestuff and measuring room was not separated from the mixing area and the
dyeing workshop, which caused contamination of raw material and semi-finished
products by flying dust, which resulted in quality issues of dyed fabrics. The liner of
dyestuff packaging was not sealed and the chemicals tend to be exposed to moisture
which affects the accuracy of chemical and dyestuff measurement, thus eventually
affects the dyeing quality.
The dyestuff store room was separated with partitions, and chemicals and dyestuff were
separately stored so as to improve accuracy of chemical measurement, see picture 6-9.
Picture 6-9 Chemical storage room before and after improvement
g) Measures to improve RFT
The defect rate of the dyeing workshop was as high as 15%, of which, 7-8% was
caused by flaws made in the workshops, including color staining, color tone, color
deviation, color fastness fail to meeting requirements etc. The right first time dyeing
(RFT), on average is 40%. This means that on average 60% of the fabrics need to be

27
re-dyed. During the project implementation, improving RFT was considered one of the
key implementation measures. Activities included:
• daily meeting in dyeing workshop to analyze the key problems in relation to
product quality;
• develop training materials on common problems affecting product quality and its
solutions;
• provide trainings to all workers involved in chemical measuring, process control
and softening process;
• provide trainings on factors affecting RFT to R&D staff;
• monthly evaluation of R&D staff to identify the problem encountered and its
solutions.
After implementation, the average RFT in the dyeing workshop was improved from 40%
in 2011 to 58% in 2012.
6.1.3 Overall evaluation
The evaluation was done by analyzing the data on production output, energy
consumption and resource consumption of Company 1 from Jan. to Oct. in 2012.
Comparisons of key performance indicators before and after implementation are shown
in the tables below.
Table 6-4 Energy and water consumption in 2011 & 2012
Item Name Unit Jan. –Nov.
2011
Jan.- Oct.
2012
Difference
Output Knitted fabric t 871 751 -14%
Resource
consumption
Electricity kWh 256,840 202,800 -21%
Steam T 14,966 12,266 -18%
Fresh water T 270,878 216,146 -20%
Comprehensive
energy consumption
(equivalent)
tce 1,451 1,226
-16%
Energy/
resource
consumption
per unit
output
Electricity
consumption kWh/t 295 270
-8%
Steam T /t 17 16 -6%
Water T /t 311 288 -7%
Comprehensive
energy consumption
(equivalent)
tce/t 1.67 1.63
-2,4%

28
Table 6-6 Benchmarking after implementation
Items Jan.-Sep. 2012 Benchmarking results
Comprehensive
energy consumption
per unit
output(tce/t)
1.63
>>>>1.5, Fails to meet the requirements of access
conditions for dyeing industry stipulated by the
Ministry of Industry and Information Technology <<<<1.8, met the 3rd class (i.e. basic level for
national CP)of CP standards
Water consumption
per unit
output(m3/t)
288
>>>>130, Fails to meet the requirements of access
conditions for dyeing industry by the Ministry of
Industry and Information Technology >>>>150, Fails to meet the 3rd class (i.e. basic level
for national CP)of CP standards
It can be seen from the table above that the comprehensive energy consumption and
water consumption per unit output reduced by 1.9% and 7.4%, respectively. Compared
with Jan.-Nov. 2011, during the period of Jan. –Oct. 2012, the energy saving achieved is
equivalent to 15 tons of standard coal, 17,260 tons of water, equivalent to 10 tons of
CO2, 0.25 tons of SO2 , 15,000 tons of wastewater and 6.3 tons of COD.
Though water and energy consumption has been reduced, these two indicators have not
met the access conditions for the dyeing and printing sector by the Ministry of Industry
and Information Technology. The main reasons are as follows:
• The reasonably old dyeing machines have a high liquor ratio. The 6 units of dyeing
machines without temperature and water level controls, have a liquor ratio of more
than 1:28. Due to high quality requirements from Japanese customers, and long
processing time, water and energy consumption therefore increased.
• Due to high quality requirements, the RFT, comparing with other factories in the
sector, is 20% lower than average. Frequent repair, stripping and re-dyeing lead to
much higher energy and water consumption.
• At present no water reuse is applied. Options for cooling water and condensate
recycling proposed were not implemented, thus water consumption per unit output
remained high.
• Most measures were implemented after June 2012.The data collected has not totally
reflected the impact of such implementation measure.
6.1.4 Plan for Continuous CP implementation
Company 1 has developed the following CP plan:
- Further improve the energy management system, in particular continuously
monitoring those departments/workshops are high in energy consumption;
29
- Eliminate the dyeing machines with high energy consumption and liquor ratio.
Company 1 has planned to introduce 10-12 units of state-of-the-art dyeing
machines imported from Italy with liquor ratio of 1:3. The estimated total
investment is amounting to RMB 14 million Yuan, and it is expected that the dyeing
machines will be installed at the beginning of 2013. The order for these new
machines has been placed.
- Plan for installing pipelines during new facility installation to allow for recycling of
cooling water and condensate.
- The layout of the wastewater treatment plant and the dyeing workshop during
expansion will adhere to the applicable code of design.
- Separation of clean and waste water so that to heat recovery from wastewater will
be realized.
- Establish regular monitoring and evaluation mechanism so that all staff will be
involved and contribute to energy saving.
6.1.5 Suggestions from expert
The following suggestions were included in the final evaluation report developed by the
expert, and are expected to be considered when developing its continuous CP plan.
• To further improve onsite management, in particular to improve the ‘right first time’
dyeing (RFT). Currently, the RFT of 58% is way below the average sector level of
70%. Possible measures include workers training, standardized operational
procedure, performance appraisal etc.
• To increase the process water recycling rate. During the 12th 5-year plan period,
especially in Zhejiang province, at least 35% of water shall be recycled. In view of
the increasingly high pressure in wastewater discharge, it is recommended to
establish an advanced wastewater treatment plant by applying double membrane
system so that the treated process water can be recycled in the production process.
6.2 Achievements made by Company 2
6.2.1 Cooperation with Company 2
Company 2 in Shanghai produces knit fabrics, as well as finished garments. The part of
the facility that fell in the scope of the project was the dyeing and finishing section. Their
annual production is around 1,500 tonnes of dyed cotton fabric and around 800
ton/annum dyed synthetic fabric. The dyeing section of the factory employs around 43
workers.
Company 2 delegated a fabric manager as the coordinator in the program. Relevant
responsible staff members of concerned departments such as the dyeing workshop, the
boiler room, wastewater treatment plant, equipment management & maintenance, were
30
invited to form the CP working group, and was invited to participate in the meetings
during visits. Briefing and debriefing with the top management was a standard routine.
Picture 6-10 meeting with the program coordinator of Company 2
6.2.2 Activities and Achievements
Before participating in the cleaner production program, some measures on improving
energy and water efficiency had been implemented in Company 2, for example,
• Cooling water generated from dyeing machine was reused in the dyeing process.
The amount of water reused is up to 75,690 m3 /d.
• A steam generator was installed onto organic heat carrier boiler which generates
1t/h steam approx, and dye to which up to 7,440 t/a of steam can be saved.
• Insulation materials applied to the steam distribution system, covering the main
and auxiliary steam pipes to minimize heat loss.
• The enzyme catalase was used to remove the remaining H2O2 after bleaching
process.
• One step process of de-sizing and scouring and bleaching was applied to reduce
processing time and save water and energy.
• Automatic measuring and weighing system has been installed to ensure the
accuracy and to reduce chemical wastage.
During the project implementation, the following measures were implemented:
a) Installation of measuring system
3 tier measuring system have been installed. Data on electricity, steam, coal and water
consumption were collected on monthly basis. An energy management system has been
established, with a designated responsible person assigned with clear description of
roles and responsibilities. The total investment of such measure was 15,000 Yuan.
b) Detection of water and steam leakage on regular basis
Following measures were taken to minimize water and steam leakage:
• Established regular water and steam leakage detection and monitoring

31
mechanism (covering places such as dyeing workshop, wastewater treatment
plant, dormitory, boiler room etc.)
• Regularly monitor and promptly eliminate water and steam leakage
• Gradually replace cast iron bibcock which are no longer allowed to be used
Picture 6-11 Differences in good housekeeping in different sections of the workshop
before and after the improvements (Water and steam leakage)
Picture 6-12 dyeing workshop after improvement
c) Regularly assess the compressed air system and leakage detection
Company 2 developed a preventive maintenance system for compressed air:
• Developed system to detect compressed air leakages, focusing on connections, valves,
sealing units etc.
• Promptly replace the wearing parts and selecting high quality pneumatic valves;
• Regularly assess and adjust the air compressor to ensure its economical operation
thus reduce energy consumption.
After the implementation, there were no signs of compressed air leaking onsite.
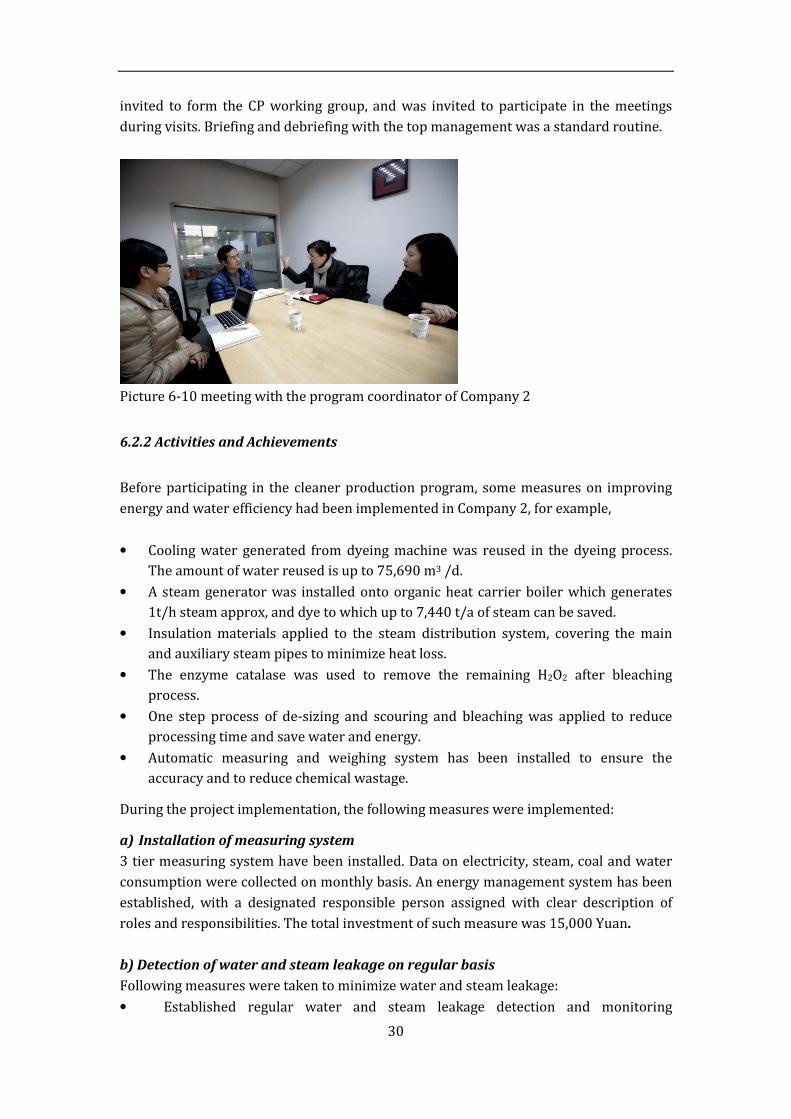
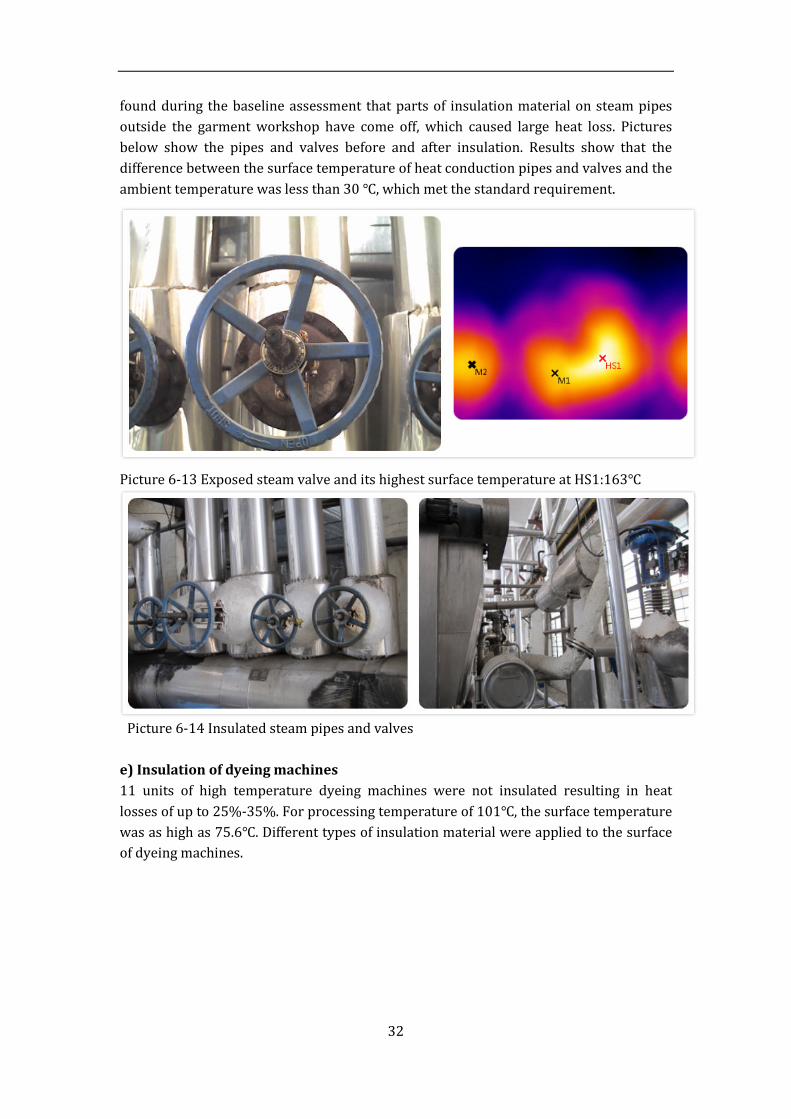
d) Insulation of steam pipes, valves and flanges
Though the main and auxiliary steam pipes haven been insulated, steam valves and
flanges and heat conduction pipes were not insulated and exposed. In addition, it was
32
found during the baseline assessment that parts of insulation material on steam pipes
outside the garment workshop have come off, which caused large heat loss. Pictures
below show the pipes and valves before and after insulation. Results show that the
difference between the surface temperature of heat conduction pipes and valves and the
ambient temperature was less than 30 ℃, which met the standard requirement.
Picture 6-13 Exposed steam valve and its highest surface temperature at HS1:163℃
Picture 6-14 Insulated steam pipes and valves
e) Insulation of dyeing machines
11 units of high temperature dyeing machines were not insulated resulting in heat
losses of up to 25%-35%. For processing temperature of 101℃, the surface temperature
was as high as 75.6℃. Different types of insulation material were applied to the surface
of dyeing machines.

33
Picture 6-15 Dyeing machines before and after insulation
The monitored surface temperature during final evaluation showed that the surface
temperature of pipes without insulation was 91.4℃, whereas the surface temperature of
insulated pipes was 51.3℃ (with temperature of 113 ℃ inside the dyeing chamber).
please see picture below. It has proven that such insulation can significantly reduce heat
loss.
Picture 6-16 comparison of surface temperature with and without insulation
f) Phase out 4 units of old dyeing machines with high liquor ratio
The 4 dyeing machines shown in picture below (Left) were with service life of more than
15 years, and a liquor ratio of over 1:10 which have been listed in the Guiding
Catalogue for Industrial Structure Adjustments (Version 2011). The 4 units of dyeing
machines have been phased out, and were replaced with enclosed hood dyeing
machines, with total investment of RMB 435,000 Yuan. It is expected that it will result in
10% of water saving and 5% of steam saving.
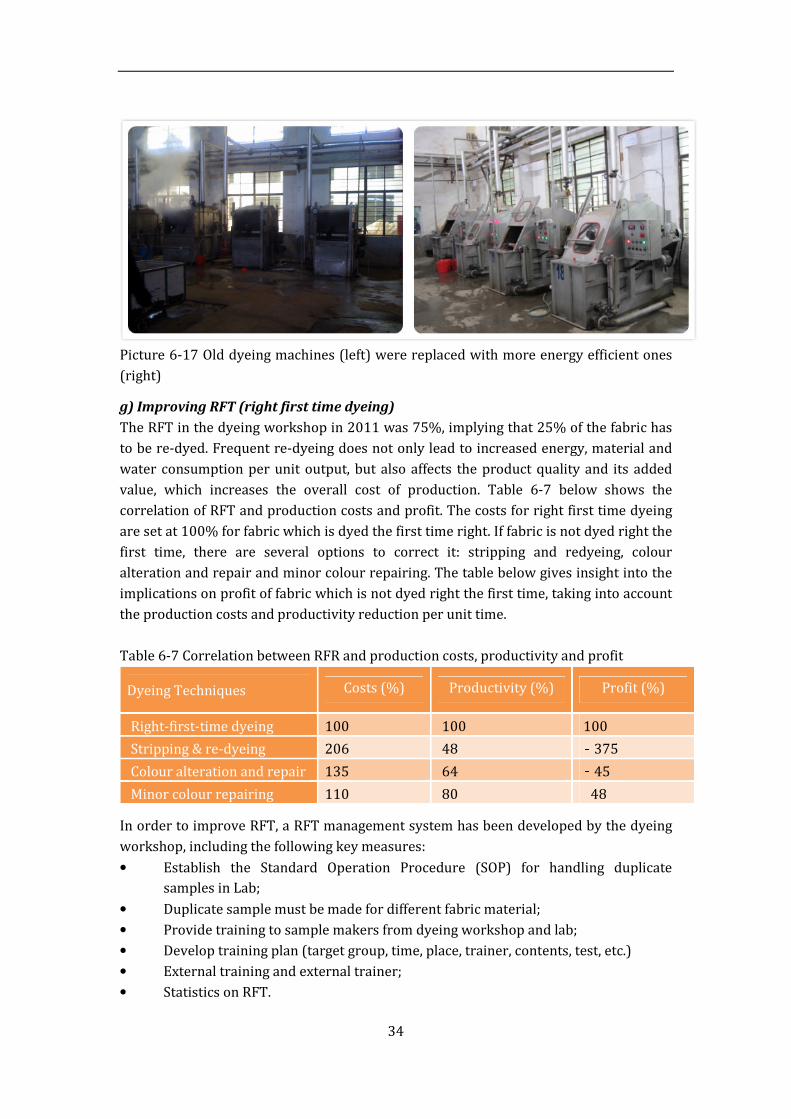
34
Picture 6-17 Old dyeing machines (left) were replaced with more energy efficient ones
(right)
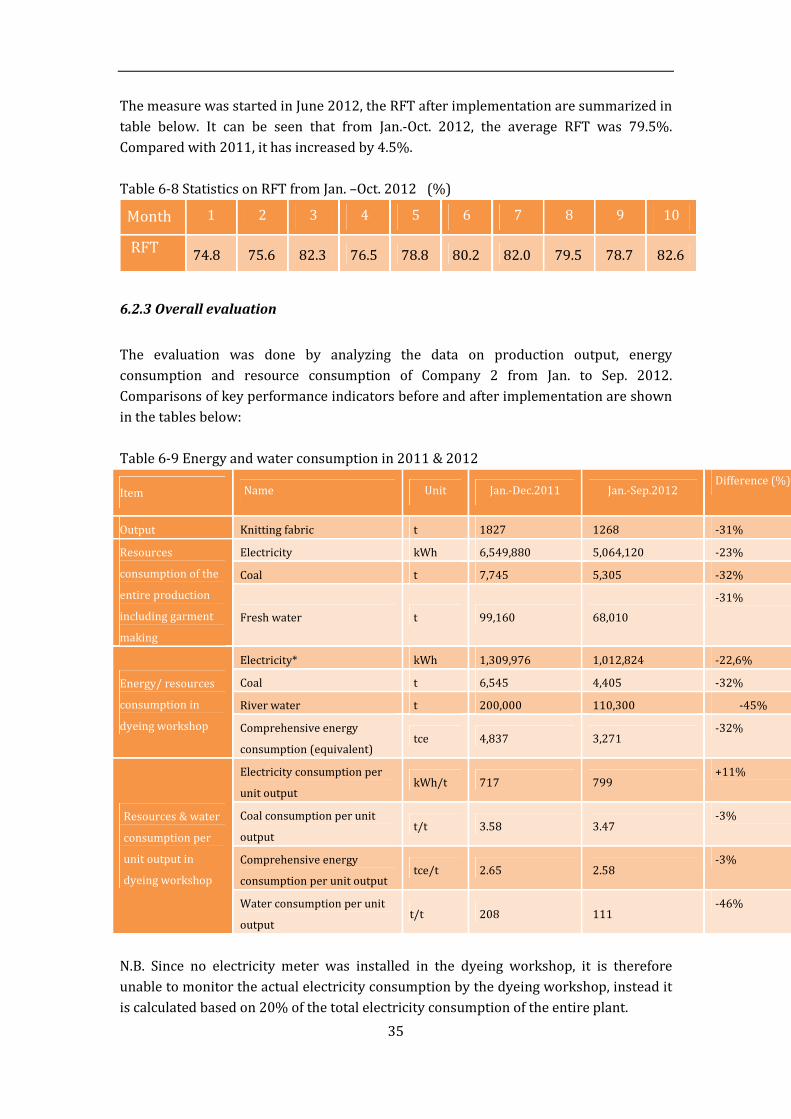
g) Improving RFT (right first time dyeing)
The RFT in the dyeing workshop in 2011 was 75%, implying that 25% of the fabric has
to be re-dyed. Frequent re-dyeing does not only lead to increased energy, material and
water consumption per unit output, but also affects the product quality and its added
value, which increases the overall cost of production. Table 6-7 below shows the
correlation of RFT and production costs and profit. The costs for right first time dyeing
are set at 100% for fabric which is dyed the first time right. If fabric is not dyed right the
first time, there are several options to correct it: stripping and redyeing, colour
alteration and repair and minor colour repairing. The table below gives insight into the
implications on profit of fabric which is not dyed right the first time, taking into account
the production costs and productivity reduction per unit time.
Table 6-7 Correlation between RFR and production costs, productivity and profit
Dyeing Techniques Costs (%) Productivity (%) Profit (%)
Right-first-time dyeing 100 100 100
Stripping & re-dyeing 206 48 -375
Colour alteration and repair 135 64 -45
Minor colour repairing 110 80 48
In order to improve RFT, a RFT management system has been developed by the dyeing
workshop, including the following key measures:
• Establish the Standard Operation Procedure (SOP) for handling duplicate
samples in Lab;
• Duplicate sample must be made for different fabric material;
• Provide training to sample makers from dyeing workshop and lab;
• Develop training plan (target group, time, place, trainer, contents, test, etc.)
• External training and external trainer;
• Statistics on RFT.
35
The measure was started in June 2012, the RFT after implementation are summarized in
table below. It can be seen that from Jan.-Oct. 2012, the average RFT was 79.5%.
Compared with 2011, it has increased by 4.5%.
Table 6-8 Statistics on RFT from Jan. –Oct. 2012 (%)
Month 1 2 3 4 5 6 7 8 9 10
RFT 74.8 75.6 82.3 76.5 78.8 80.2 82.0 79.5 78.7 82.6
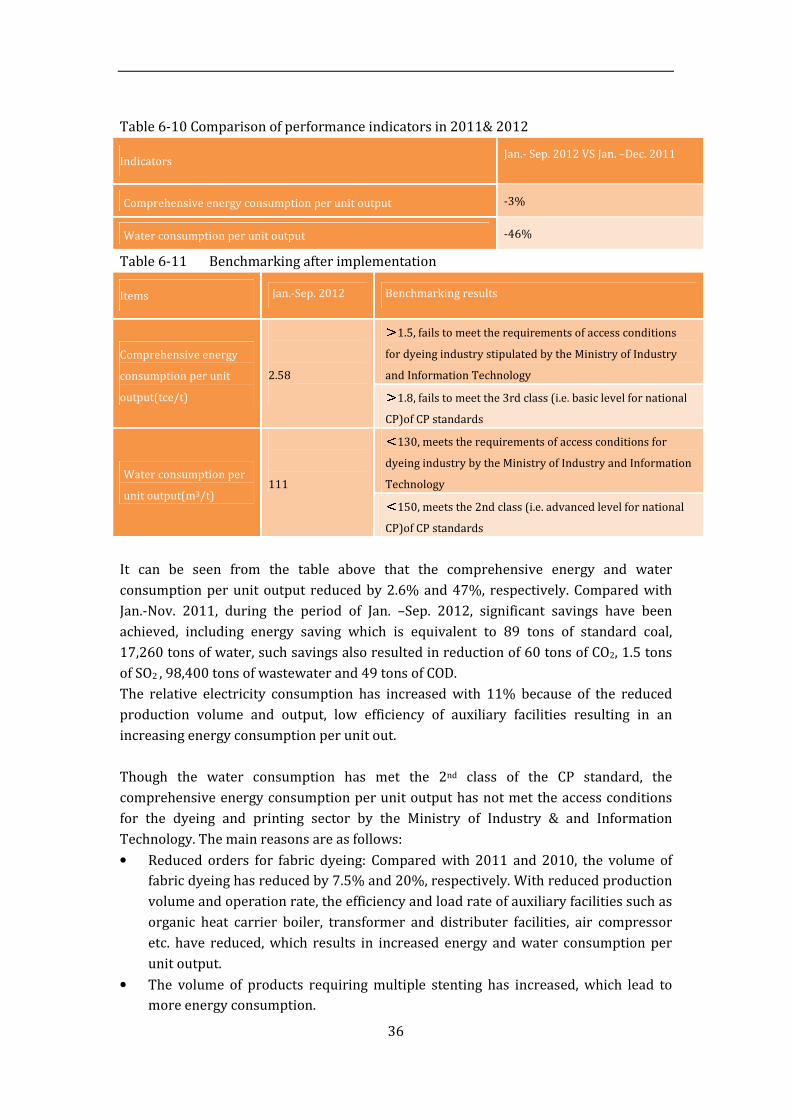
6.2.3 Overall evaluation
The evaluation was done by analyzing the data on production output, energy
consumption and resource consumption of Company 2 from Jan. to Sep. 2012.
Comparisons of key performance indicators before and after implementation are shown
in the tables below:
Table 6-9 Energy and water consumption in 2011 & 2012
Item Name Unit Jan.-Dec.2011 Jan.-Sep.2012 Difference (%)
Output Knitting fabric t 1827 1268 -31%
Resources
consumption of the
entire production
including garment
making
Electricity kWh 6,549,880 5,064,120 -23%
Coal t 7,745 5,305 -32%
Fresh water t 99,160 68,010
-31%
Energy/ resources
consumption in
dyeing workshop
Electricity* kWh 1,309,976 1,012,824 -22,6%
Coal t 6,545 4,405 -32%
River water t 200,000 110,300 -45%
Comprehensive energy
consumption (equivalent) tce 4,837 3,271
-32%
Resources & water
consumption per
unit output in
dyeing workshop
Electricity consumption per
unit output kWh/t 717 799
+11%
Coal consumption per unit
output t/t 3.58 3.47
-3%
Comprehensive energy
consumption per unit output tce/t 2.65 2.58
-3%
Water consumption per unit
output t/t 208 111
-46%
N.B. Since no electricity meter was installed in the dyeing workshop, it is therefore
unable to monitor the actual electricity consumption by the dyeing workshop, instead it
is calculated based on 20% of the total electricity consumption of the entire plant.
36
Table 6-10 Comparison of performance indicators in 2011& 2012
Indicators Jan.- Sep. 2012 VS Jan. –Dec. 2011
Comprehensive energy consumption per unit output -3%
Water consumption per unit output -46%
Table 6-11 Benchmarking after implementation
Items Jan.-Sep. 2012 Benchmarking results
Comprehensive energy
consumption per unit
output(tce/t)
2.58
>>>>1.5, fails to meet the requirements of access conditions
for dyeing industry stipulated by the Ministry of Industry
and Information Technology >>>>1.8, fails to meet the 3rd class (i.e. basic level for national
CP)of CP standards
Water consumption per
unit output(m3/t)
111
<<<<130, meets the requirements of access conditions for
dyeing industry by the Ministry of Industry and Information
Technology <<<<150, meets the 2nd class (i.e. advanced level for national
CP)of CP standards
It can be seen from the table above that the comprehensive energy and water
consumption per unit output reduced by 2.6% and 47%, respectively. Compared with
Jan.-Nov. 2011, during the period of Jan. –Sep. 2012, significant savings have been
achieved, including energy saving which is equivalent to 89 tons of standard coal,
17,260 tons of water, such savings also resulted in reduction of 60 tons of CO2, 1.5 tons
of SO2 , 98,400 tons of wastewater and 49 tons of COD.
The relative electricity consumption has increased with 11% because of the reduced
production volume and output, low efficiency of auxiliary facilities resulting in an
increasing energy consumption per unit out.
Though the water consumption has met the 2nd class of the CP standard, the
comprehensive energy consumption per unit output has not met the access conditions
for the dyeing and printing sector by the Ministry of Industry & and Information
Technology. The main reasons are as follows:
• Reduced orders for fabric dyeing: Compared with 2011 and 2010, the volume of
fabric dyeing has reduced by 7.5% and 20%, respectively. With reduced production
volume and operation rate, the efficiency and load rate of auxiliary facilities such as
organic heat carrier boiler, transformer and distributer facilities, air compressor
etc. have reduced, which results in increased energy and water consumption per
unit output.
• The volume of products requiring multiple stenting has increased, which lead to
more energy consumption.

37
• With improved RFT and increased efforts for water measurement and monitoring,
water consumption in dyeing process has reduced significantly.
6.2.4 Plan for Continuous CP implementation
Company 2 has developed its plan for continuous CP implementation, including:
• Further improve its energy management system;
• Regularly check water and steam leakage to eliminate resource wastage;
• Water saving in staff dormitory;
• Continue monitoring the air compressor system. The 2 units of air compressor
with low efficiency will be considered to be replaced by frequency variable air
compressors. In addition, the air compressor room will be expanded to ensure its
stable operation;
• Regularly monitor the carbon content remained in coal slag. The boiler supplier
will be contacted to monitor the temperature of off gas, automatic combustion
system will be installed onto boiler if applicable.
• Further improve RFT;
• Phase out coal boiler and use clean energy by 2015;
• Regularly monitor and change heat conduction oil when required.
6.2.5 Suggestions from the expert
With total investment of RMB 590,000 Yuan, the implemented action plan has resulted
in convincing savings, including 89 tons of standard coal, 123,000 tons of water and
98,300 tons of wastewater discharge. Economically, such energy and resource savings
are equivalent to a total of RMB 405,000 Yuan of cost saving, including, RMB 94,000
Yuan of energy cost, RMB 123,000 Yuan of water costs, and RMB 188,000 Yuan of
wastewater discharge fee. In addition, economic benefit achieved from improved RFT
will lead to at least 10% of production cost saving.
From the analysis of the energy consumption structure, it can be noticed that coal
accounts for 96% of its overall energy. To this end, improving the operational efficiency
of the boiler will be the key to reduce coal consumption. The automatic combustion
control system ensures economic operation of boiler by appropriately adjusting the
parameters, such as speed of grate and the temperature of combustion chambers, thus
achieving electricity and coal savings. The total investment of the installation is
approximately RMB 60,000 Yuan, it can result in savings including 410t/a of coal, 3.9 t/a
of SO2 emission. Following please see the cost and benefit analysis.
Investment RMB 60,000 Yuan
Annual savings RMB 307,500 Yuan
ROI 0.26 years
38
6.3 Achievements made by Company 3
6.3.1 Cooperation with Company 3
Company 3 is a woven trouser producer, with a focus on jeans. Company 3 produces
around 4.000.000 pieces per year. The scope of the project was on the wet processes,
washing and sample dyeing. In this section of Company 3 around 20 people are
operating the processes.
Company 3 delegated a motivated staff of its marketing department as the coordinator
for the program. Meetings during on-site visits were always chaired by the Vice General
Manager who took an active role in the discussions. Relevant staff of departments
concerned were invited to participate in the meetings. The company is committed to
environmental protection and occupational health and safety, according to cases
referred to and statements made informally by several employees during the on-site
visits. It should be noted that Company 3 signed up for the program nearly 4 months
after the official kick-off of the program. Thanks to the great efforts and commitment of
the Company 3 team, great achievements were made within limited program
implementation duration.
6.3.2 Activities and Achievements
Before participating in the cleaner production program, some measures on improving
energy and water efficiency had been implemented in Company 3, for example,
• Installed soft starter and variable frequency and energy saving devices onto the 2
units of air compressor.
• Provided workers with guiding manual on safe handling of chemicals to avoid
environmental accidents caused by improper handling of chemicals.
• Hydrogen peroxide enzyme was used to remove the remaining H2O2 after bleaching
process.
• Using enzyme NBG and LW-1613 in denim surface washing.
Based on the recommendations from the expert and the needs of Company 3, the
following measures were selected and implemented.
a) Selection of energy efficient steam traps to effectively control steam leakage
During the baseline assessment, steam leakages from steam valves, drying cabinet
and the drying machines were observed. Thorough Steam trap leakage detection
was performed by the professional technicians from Shanghai Nengjia Technology
Co., Ltd and the findings are shown in table below:
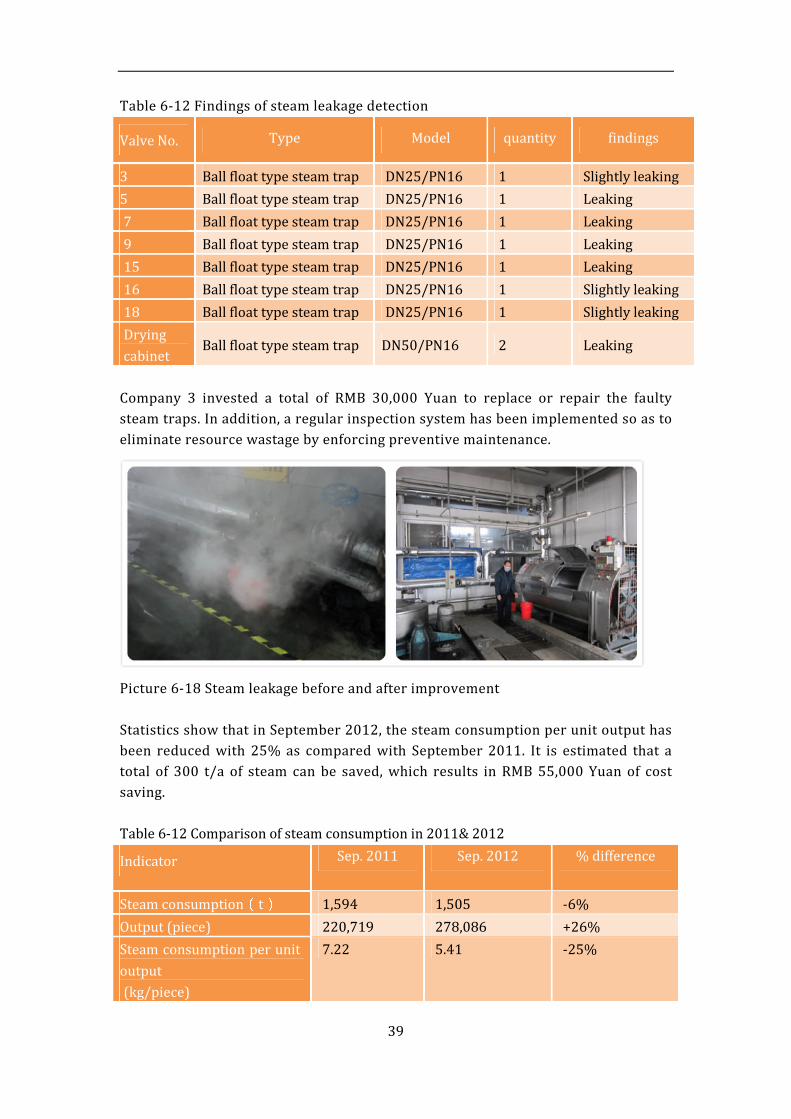
39
Table 6-12 Findings of steam leakage detection
Valve No. Type Model quantity findings
3 Ball float type steam trap DN25/PN16 1 Slightly leaking
5 Ball float type steam trap DN25/PN16 1 Leaking
7 Ball float type steam trap DN25/PN16 1 Leaking
9 Ball float type steam trap DN25/PN16 1 Leaking
15 Ball float type steam trap DN25/PN16 1 Leaking
16 Ball float type steam trap DN25/PN16 1 Slightly leaking
18 Ball float type steam trap DN25/PN16 1 Slightly leaking
Drying
cabinet Ball float type steam trap DN50/PN16 2 Leaking
Company 3 invested a total of RMB 30,000 Yuan to replace or repair the faulty
steam traps. In addition, a regular inspection system has been implemented so as to
eliminate resource wastage by enforcing preventive maintenance.
Picture 6-18 Steam leakage before and after improvement
Statistics show that in September 2012, the steam consumption per unit output has
been reduced with 25% as compared with September 2011. It is estimated that a
total of 300 t/a of steam can be saved, which results in RMB 55,000 Yuan of cost
saving.
Table 6-12 Comparison of steam consumption in 2011& 2012
Indicator Sep. 2011 Sep. 2012 % difference
Steam consumption(t) 1,594 1,505 -6%
Output (piece) 220,719 278,086 +26%
Steam consumption per unit
output
(kg/piece)
7.22 5.41 -25%
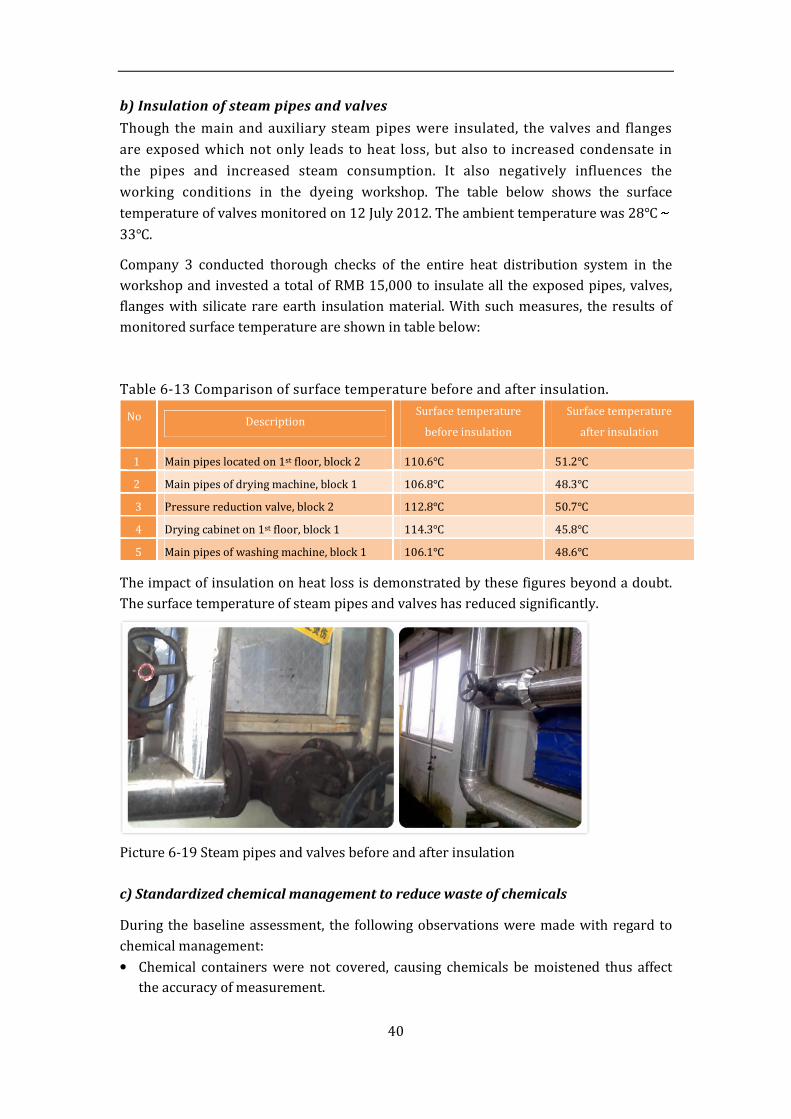
40
b) Insulation of steam pipes and valves
Though the main and auxiliary steam pipes were insulated, the valves and flanges
are exposed which not only leads to heat loss, but also to increased condensate in
the pipes and increased steam consumption. It also negatively influences the
working conditions in the dyeing workshop. The table below shows the surface
temperature of valves monitored on 12 July 2012. The ambient temperature was 28℃~33℃.
Company 3 conducted thorough checks of the entire heat distribution system in the
workshop and invested a total of RMB 15,000 to insulate all the exposed pipes, valves,
flanges with silicate rare earth insulation material. With such measures, the results of
monitored surface temperature are shown in table below:
Table 6-13 Comparison of surface temperature before and after insulation.
No Description Surface temperature
before insulation
Surface temperature
after insulation
1 Main pipes located on 1st floor, block 2 110.6℃ 51.2℃
2 Main pipes of drying machine, block 1 106.8℃ 48.3℃
3 Pressure reduction valve, block 2 112.8℃ 50.7℃
4 Drying cabinet on 1st floor, block 1 114.3℃ 45.8℃
5 Main pipes of washing machine, block 1 106.1℃ 48.6℃
The impact of insulation on heat loss is demonstrated by these figures beyond a doubt.
The surface temperature of steam pipes and valves has reduced significantly.
Picture 6-19 Steam pipes and valves before and after insulation
c) Standardized chemical management to reduce waste of chemicals
During the baseline assessment, the following observations were made with regard to
chemical management:
• Chemical containers were not covered, causing chemicals be moistened thus affect
the accuracy of measurement.
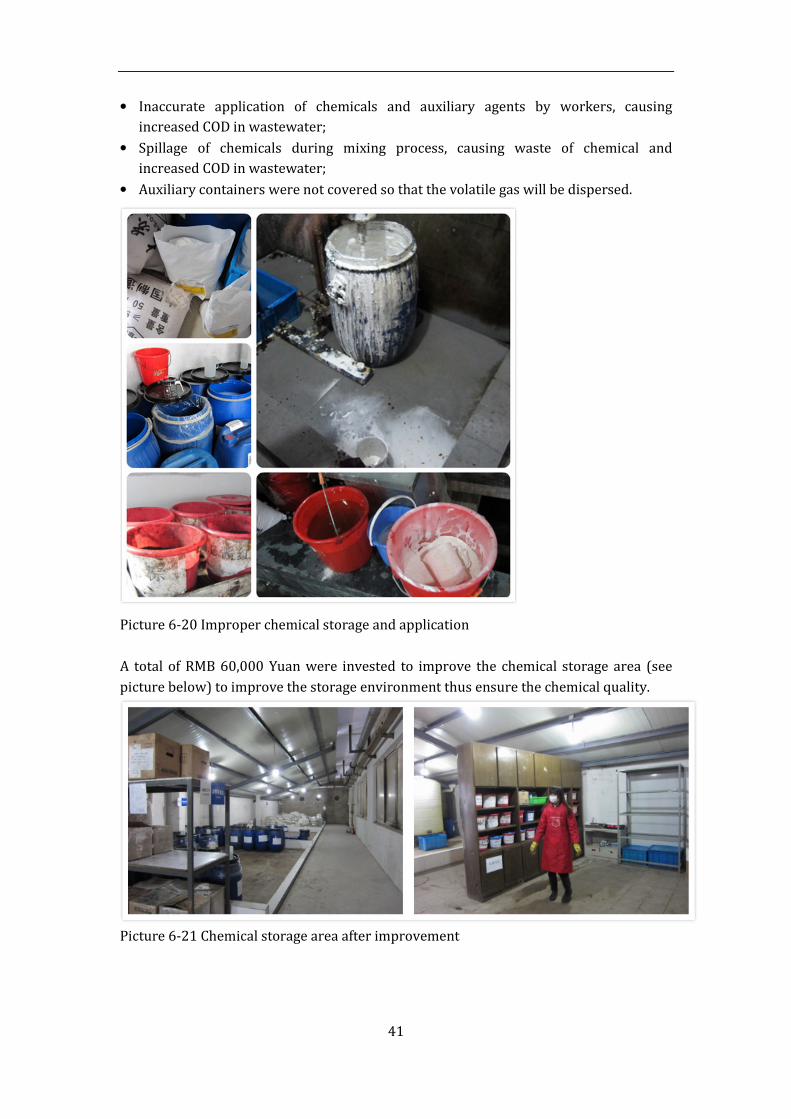
41
• Inaccurate application of chemicals and auxiliary agents by workers, causing
increased COD in wastewater;
• Spillage of chemicals during mixing process, causing waste of chemical and
increased COD in wastewater;
• Auxiliary containers were not covered so that the volatile gas will be dispersed.
Picture 6-20 Improper chemical storage and application
A total of RMB 60,000 Yuan were invested to improve the chemical storage area (see
picture below) to improve the storage environment thus ensure the chemical quality.
Picture 6-21 Chemical storage area after improvement

42
d) Upgrading production facilities to improve resource and energy efficiency
1. phase out old drying machines
The old drying machines were purchased in 2003 and 2007, with the capacity of 40
pieces in every 50 minutes’ processing. In 2012, a total of 1 million Yuan were invested
to replace the old drying machines with energy efficient ones (model: GZZ-100BF).
According to the flow meter installed, this resulted in 90% steam has savings.
Picture 6-22 Old VS energy efficient drying machine
Table 6-14 Comparison of steam consumption of two types of drying machines
Facility model Working temperature Working time Steam flow(m3)
Industry drying machine 80ºC 60” 0.6845
GZZ-100BF drying machine 80ºC 60” 0.0646
2. Installation of ozone bleaching machine
A unit of ozone bleaching machine was purchased in 2012 to replace the industrial
washing machine. With such installation, sodium hypochlorite is no longer needed as
oxidation agent in the bleaching process, and water consumption has reduced by 50%,
which significantly reduced wastewater and pollutants generation.
43
Picture 6-23 Ozone bleaching machine (left) & dewatering machine (right)
3. Installation of laser machine
The hand brushing process not only requires large number of workers, but also
generates lots of flying dust. In 2012, an imported laser machine was introduced to
replace hand brushing which improves both product quality and work efficiency.
Picture 6-24 Laser machine to replace hand brushing
A total of RMB 6 million Yuan has been invested for facility upgrading by end of 2012.
6.3.3 Overall evaluation
The evaluation was done by analyzing the data on production output, energy
consumption and resource consumption of Company 3 from Jan. to Oct. 2012.
Comparisons of key performance indicators before and after implementation are shown
in the tables below:

44
Table 6-15 Energy and water consumption in 2011 & 2012
Items Name Unit Jan.- Dec.
2011
Jan.-Oct.
2012
%
difference
Output Jeans 10,000
pieces
250
(3,000t)
215
(2,616t)
-14%
Resource & energy
consumption
Electricity 10,000
kWh 261 244
-7%
Steam T 19,678 15,821 -20%
Fresh water 10,000 t 33.5 28.7 -14%
Comprehensive energy consumption tce 2,179 1,795 -18%
Energy and fresh
water
consumption per
unit output
Electricity consumption per unit output kWh /t 869 934 +7%
Steam consumption per unit output t /t 6.56 6.05 -8%
Comprehensive energy consumption per
unit output tce/t 0.726 0.686
-6%
Water consumption per unit output t /t 112 109 -3%
Table 6-16 Comparison of performance indicators in 2011& 2012
Indicators Jan.-Oct. 2012 VS 2011
Comprehensive energy consumption per unit output -5.5%
Water consumption per unit output -2.7%
Table 6-17 Benchmarking after implementation
Items Jan.-Oct. 2012 Benchmarking results
Comprehensive energy
consumption per unit
output(tce/t)
0.686
<<<<1.5, met the requirements of access conditions for dyeing
industry stipulated by the Ministry of Industry and
Information Technology <<<<1.8, met the 1st class (i.e. advanced level for international
CP)of CP standards
Water consumption per
unit output(m3/t)
109
<<<<130, met the requirements of access conditions for dyeing
industry by the Ministry of Industry and Information
Technology <<<<150, met the 2nd class (i.e. advanced level for national
CP)of CP standards
From the data, it shows that after participating in the CP project, the comprehensive
energy consumption and water consumption per unit output has reduced by 5.5% and
2.7%, respectively. Comparing with 2011, from Jan. - Oct. 2012, a total of 105 tons of
standard coal have been saved. In addition, other savings also include: 7,850 tons of
water, 70 tons of CO2, 1.73 tons of SO2, and 6,700 tons of wastewater and 6.7 tons of
COD.

45
Economically, with a total investment of RMB 7.105 million Yuan, a total of RMB
240,400 Yuan of cost savings have been achieved, including RMB 203,000 Yuan of
energy (steam) cost, RMB 17,300 Yuan of water cost (including cost for freshwater and
ion exchange), and RMB 20,100 Yuan of wastewater discharge fee.
6.3.4 Plan for Continuous CP implementation
The next step for Company 3 with regard to CP implementation is to incorporate the
options recommended by expert however has not been implemented, into the
continuous CP plan, including:
Table 6-18 Plans for continuous CP implementation
NO. Name Description Objectives Timetable
1 Condensates
recycling
To drain the condensate
generated (11,500 t/a, with
temperature of 85℃~95℃) to the
soft water tank to be recycled in
the washing workshop so as to
save soft water and steam.
Expected savings:
Water: 10,000 m3/a
Steam: 1,200t/a
Wastewater: 8,000
m3/a
Mar.-Apr.
2013
2 Phasing out
industrial
drying machine
To replace the ordinary industrial
drying machine with energy
efficient ones (model: GZZ-100BF)
which are expected to achieve 50%
of energy saving and 90% of steam
saving.
Expected savings:
Steam: 3,000t/a May 2013-
May 2014
6.4 Achievements made by Company 4
6.4.1 Cooperation with Company 4
Company 4 processes woven fabrics, synthetics and blends. The scope of the
improvement work covered the dyeing and finishing workshop. The company was
suffering from a strong production decrease. In 2010, they had continuous production (3
shifts of 8 hours), but in the last year the activities were mainly sample dyeing and
finishing. Regulations determine that the factory, located in the city area, can discharge
only 25000 m3 per year, which makes operations challenging for a wet processing
factory. Because of the strong drop in production and focus on sample processing mainly,
the efficiency of the factory has come down considerably.
Woven Synth Fabric: 60,000m/a
Woven Blend Fabric: 1,100,000m/a
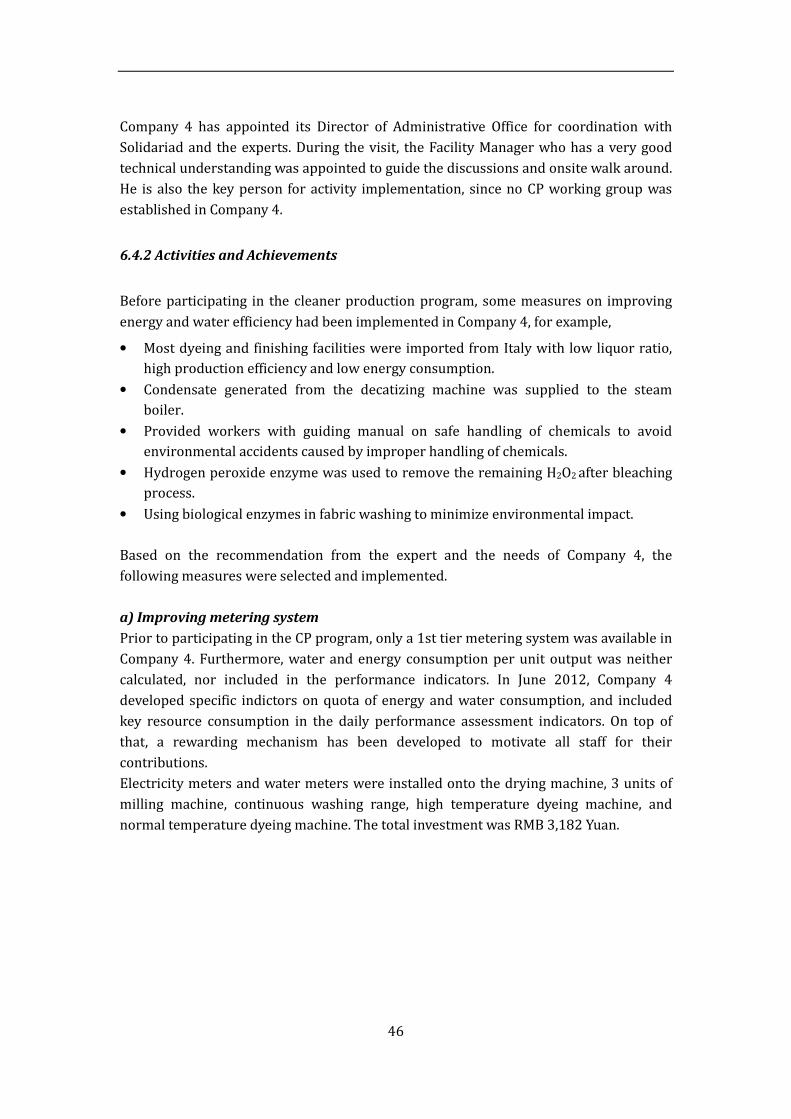
46
Company 4 has appointed its Director of Administrative Office for coordination with
Solidariad and the experts. During the visit, the Facility Manager who has a very good
technical understanding was appointed to guide the discussions and onsite walk around.
He is also the key person for activity implementation, since no CP working group was
established in Company 4.
6.4.2 Activities and Achievements
Before participating in the cleaner production program, some measures on improving
energy and water efficiency had been implemented in Company 4, for example,
• Most dyeing and finishing facilities were imported from Italy with low liquor ratio,
high production efficiency and low energy consumption.
• Condensate generated from the decatizing machine was supplied to the steam
boiler.
• Provided workers with guiding manual on safe handling of chemicals to avoid
environmental accidents caused by improper handling of chemicals.
• Hydrogen peroxide enzyme was used to remove the remaining H2O2 after bleaching
process.
• Using biological enzymes in fabric washing to minimize environmental impact.
Based on the recommendation from the expert and the needs of Company 4, the
following measures were selected and implemented.
a) Improving metering system
Prior to participating in the CP program, only a 1st tier metering system was available in
Company 4. Furthermore, water and energy consumption per unit output was neither
calculated, nor included in the performance indicators. In June 2012, Company 4
developed specific indictors on quota of energy and water consumption, and included
key resource consumption in the daily performance assessment indicators. On top of
that, a rewarding mechanism has been developed to motivate all staff for their
contributions.
Electricity meters and water meters were installed onto the drying machine, 3 units of
milling machine, continuous washing range, high temperature dyeing machine, and
normal temperature dyeing machine. The total investment was RMB 3,182 Yuan.
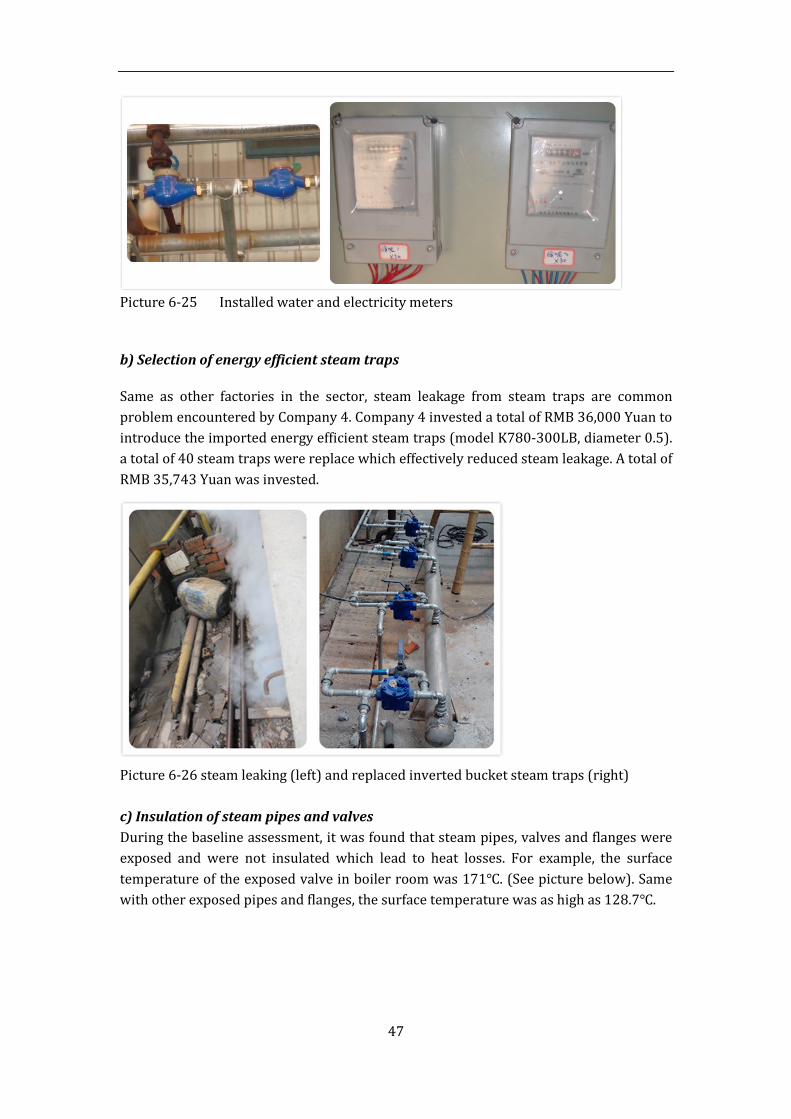
47
Picture 6-25 Installed water and electricity meters
b) Selection of energy efficient steam traps
Same as other factories in the sector, steam leakage from steam traps are common
problem encountered by Company 4. Company 4 invested a total of RMB 36,000 Yuan to
introduce the imported energy efficient steam traps (model K780-300LB, diameter 0.5).
a total of 40 steam traps were replace which effectively reduced steam leakage. A total of
RMB 35,743 Yuan was invested.
Picture 6-26 steam leaking (left) and replaced inverted bucket steam traps (right)
c) Insulation of steam pipes and valves
During the baseline assessment, it was found that steam pipes, valves and flanges were
exposed and were not insulated which lead to heat losses. For example, the surface
temperature of the exposed valve in boiler room was 171℃. (See picture below). Same
with other exposed pipes and flanges, the surface temperature was as high as 128.7℃.
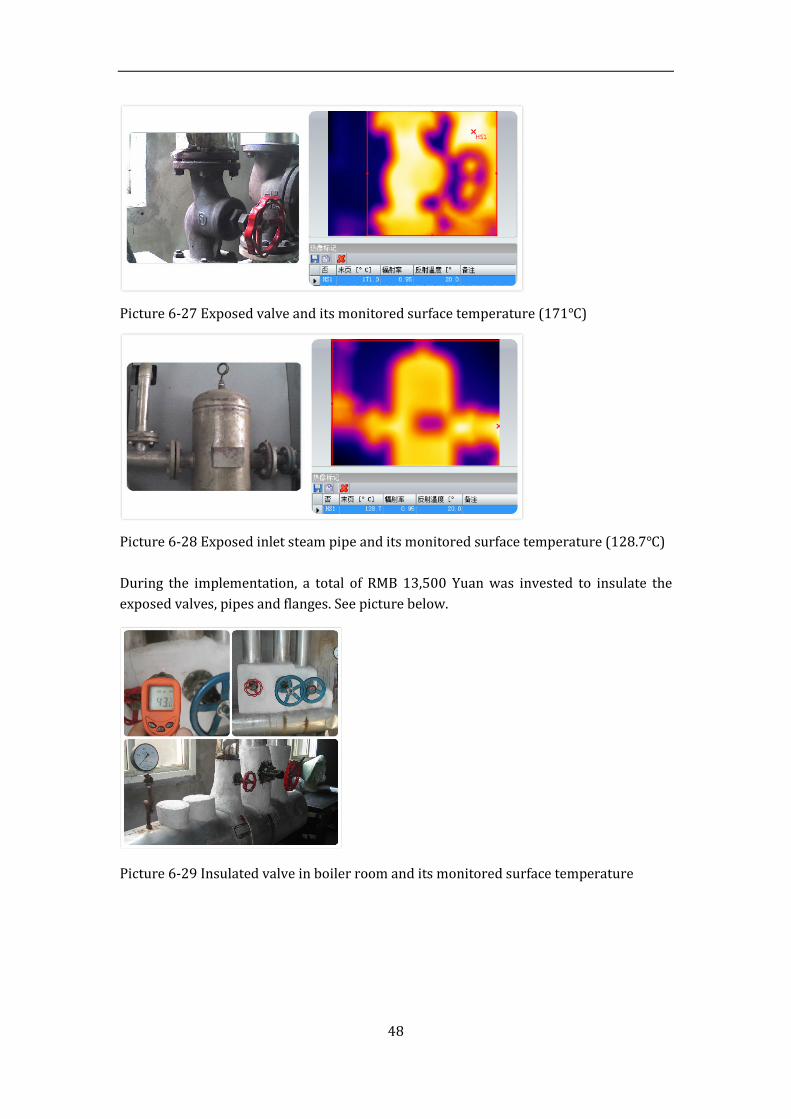
48
Picture 6-27 Exposed valve and its monitored surface temperature (171℃)
Picture 6-28 Exposed inlet steam pipe and its monitored surface temperature (128.7℃)
During the implementation, a total of RMB 13,500 Yuan was invested to insulate the
exposed valves, pipes and flanges. See picture below.
Picture 6-29 Insulated valve in boiler room and its monitored surface temperature
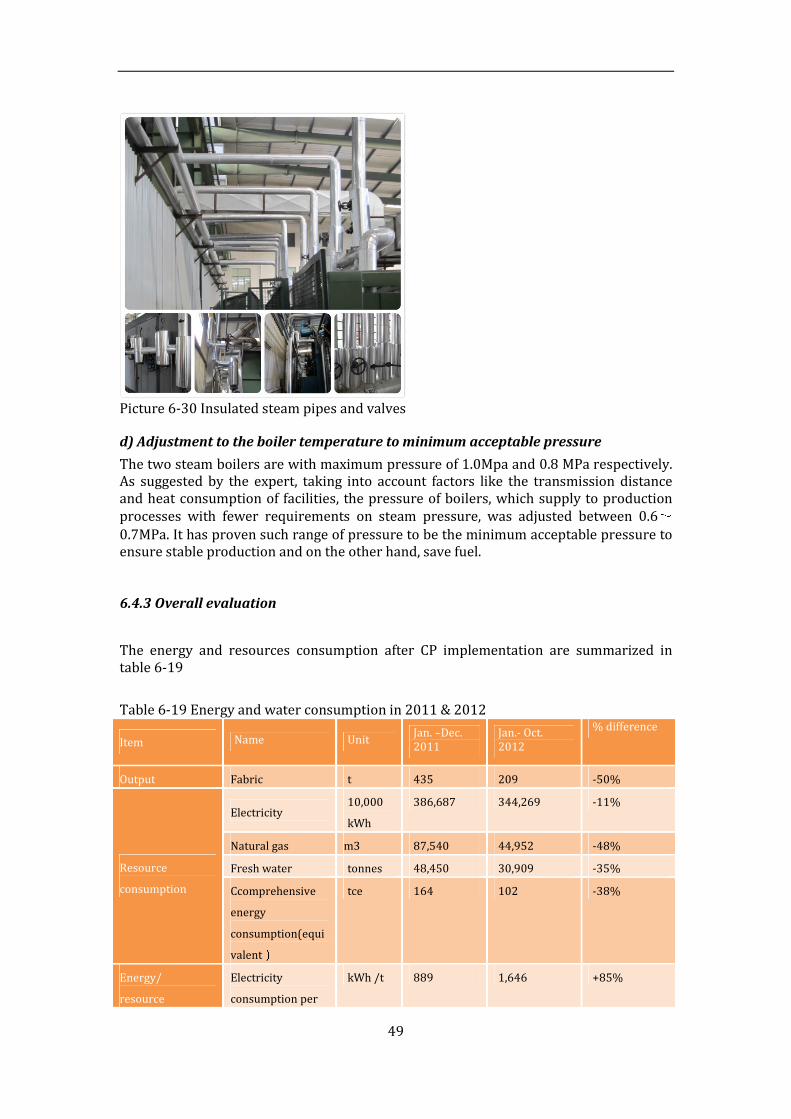
49
Picture 6-30 Insulated steam pipes and valves
d) Adjustment to the boiler temperature to minimum acceptable pressure
The two steam boilers are with maximum pressure of 1.0Mpa and 0.8 MPa respectively.
As suggested by the expert, taking into account factors like the transmission distance
and heat consumption of facilities, the pressure of boilers, which supply to production
processes with fewer requirements on steam pressure, was adjusted between 0.6~0.7MPa. It has proven such range of pressure to be the minimum acceptable pressure to
ensure stable production and on the other hand, save fuel.
6.4.3 Overall evaluation
The energy and resources consumption after CP implementation are summarized in
table 6-19
Table 6-19 Energy and water consumption in 2011 & 2012
Item Name Unit Jan. –Dec.
2011
Jan.- Oct.
2012
% difference
Output Fabric t 435 209 -50%
Resource
consumption
Electricity 10,000
kWh
386,687 344,269 -11%
Natural gas m3 87,540 44,952 -48%
Fresh water tonnes 48,450 30,909 -35%
Ccomprehensive
energy
consumption(equi
valent)
tce 164 102 -38%
Energy/
resource
Electricity
consumption per
kWh /t 889 1,646 +85%

50
Item Name Unit Jan. –Dec.
2011
Jan.- Oct.
2012
% difference
consumption per
unit output
unit output
Natural gas per
unit output
m3/t 201 215 +2,5%
Comprehensive
energy
consumption
(equivalent) per
unit output
tce/t 0.377 0.488 +30%
Water
consumption per
unit output
t /t 111 148 +33%
Comparing the above results for 2011 and 2012, demonstrates that the energy and
water consumption per unit output has increased 29% and 33%, respectively. It is
mainly due to the reduction of the production (46.8%). Low productivity and
insufficient operation of auxiliary facilities such as air compressor and boiler, increase
electricity, natural gas and water consumption per unit output. Furthermore, there were
hardly production activities in the 2nd half of 2012, and for most measures
implemented after July 2012; the potential impact of implementation is therefore not
reflected in the data.
6.4.4 Plan for continuous CP implementation
After participating in the CP program, the management decided to include CP into its
daily management activities, and the following plan for continuous CP implementation
has been developed:
• Develop a practical energy management system, including: energy management,
energy measurement, energy consumption statistics and assessment etc.
• Consider to recycle condensate when production increases so as to save natural gas
and freshwater, and to reduce wastewater discharge.
6.4.5 Recommendations from expert
It is suggested to adjust the number facilities (especially the air compressor and boiler)
operational according to the status of production in the workshop so as to reduce
energy consumption. Furthermore, the transformer with model of S7-500/10 has been
listed in the Guiding Catalogue for Industrial Structure Adjustments (Version 2011)
which needs to be replaced. It is suggested to discuss with the village committee – from
whom they rent the factory building and premises - to replace the transformer with
energy efficient ones, such as the S13 series.
51
7. Evaluation of the program by the companies
Though the companies were not requested to evaluate the program in writing, most
companies verbally expressed during the training workshops and onsite visits that they
have benefitted from the program by having learnt how to take a more systematic
approach to implement cleaner production. The issues addressed by the program are
useful and applicable in their daily practices. Most of the participants mentioned that
supports provided by the invited experts were valued by the companies.
The feedback from the participating factories includes:
- A request for more exposure visits, in particular to those factories with outstanding
environmental performance to learn from regional best practices;
- The training workshops provided useful and practical information and experiences,
the participants would like to participate in more trainings in future
- The discussion and knowledge exchange during the trainings was found particularly
useful, but sometimes the time of the trainings is too short.
- The programme activities are conducive to improving overall facility management.
8. Success factors and lessons learned
The new policy which was announced in 2012 in the 12th 5 year plan on Energy Saving
and Emission Reduction contributed to the success of the project since the project
offered external expertise which contributes to meeting the targets set:
• Energy consumption per unit GDP reduced by 16%;
• CO2 emission per unit GDP reduced by 17%;
• Total pollutants discharge, COD, and SO2 emission, reduced by 8%.
• NOx and NH3-N discharge reduced by 10 percent In addition the Catalogue of Outdated Products and Equipment for Elimination in
Some Industrial Sectors and the Catalogue of High Energy Consumption Machinery &
Electric Equipment (Products) for Elimination distributed by the Ministry of Industry
and Information Technology specifies the equipment and products must be eliminated
and need to be replaced with energy efficiency ones. This policy is updated regularly and
particularly relevant to the textile and dyeing sector where it is specified that dyeing
machines with a liquor ratio of more than 1:10 shall be phased out.
The local authorities also came up with tough measures to improve the environmental
performance of the textile sector. For example, in the official document distributed by
the Provincial People’s Government of Zhejiang, a total of 58 mandatory measures were
included in order to achieve the ambitious goal of at least 25% reduction of COD and
NH3-N and at least 35% of water recycling rate by June 2014.
With such stringent actions from national and local authorities, factories need to
constantly identify improvement measures by systematically assess its improvement
potentials internally, and seek for external support if necessary.
In addition to the pressure from the government, the following success factors
contributed to the achievements made by all the participating companies:
• Support and interest from the brands: continuous involvement has proven to
contribute to the progress achieved. It also gives a positive and clear message to the

52
participating companies regarding the significance of their efforts in improving the
social and environmental performance.
• The topics are relevant: the information provided is concrete and convincing, which
makes the foreseen improvements attractive and foreseen measures economically
viable. Given the very limited time that the participants can spare for the training,
and different production processes applied in each company, selecting the contents
of common interest is a challenging task. Questionnaires were sent out to the
participating companies in advance to ask for feedback on training contents, and
such feedbacks were communicated with the trainer for designing the training
materials.
• Good combination of participants: It is important that the participating
representatives have comparable positions and are closely involved in the
processes. Most participants are responsible for production-, equipment-, or
energy-related issues; the technical capacity they have is conducive to facilitating
discussions with each other and with the trainer.
• Training skills and practical experience of the trainer: the trainer proved to have
vast experience in closely working with dyeing mills in the field of cleaner
production and energy saving, and she is able to illustrate the cases with relatively
reliable figure, and most importantly, she is able to and willing to share her
personal opinions based on her own experience and results of her investigation,
instead of merely quoting the textbooks or doing sales talks.
• Involvement of all staff: it is essential to involve all staff in the company to make
contributions in energy saving and emission reduction. It is also vital to establish an
incentive mechanism to motivate and reward the staff for their continuous efforts
and contribution.
• Commitment from companies and their top management: most companies are
committed to make the improvements, it is worth mentioning that in many
companies, the top management level are very supportive to provide necessary
input, which is conducive to achieve the set goals.
A learning point from Company 5 who dropped out of the programme after the kick off
meeting, was that if the brand pressure is the main reason for signing up to an
improvement programme, it will be very difficult to motivate the factory to participate.
Another learning point is that ideally the group size is better, around 12 and in a closer
geographical location. A bigger group will allow for more cross learnings between the
different companies.
In the current programme all the workshops and technical explanations of best available
techniques or improvement options were provided in Chinese. To allow for expansion of
the impact, beyond the direct participants, it would be desirable to have printed or
online resources available for the sector in Chinese – which is something Solidaridad
plans to include in its scaling up programme. Provision of reliable suppliers of good
quality equipment and technical advisors would also be something the participants
would value. We now already see that after the programme ended 2 out of the 4
companies have approached the experts they were introduced to, to continue
improvement work.
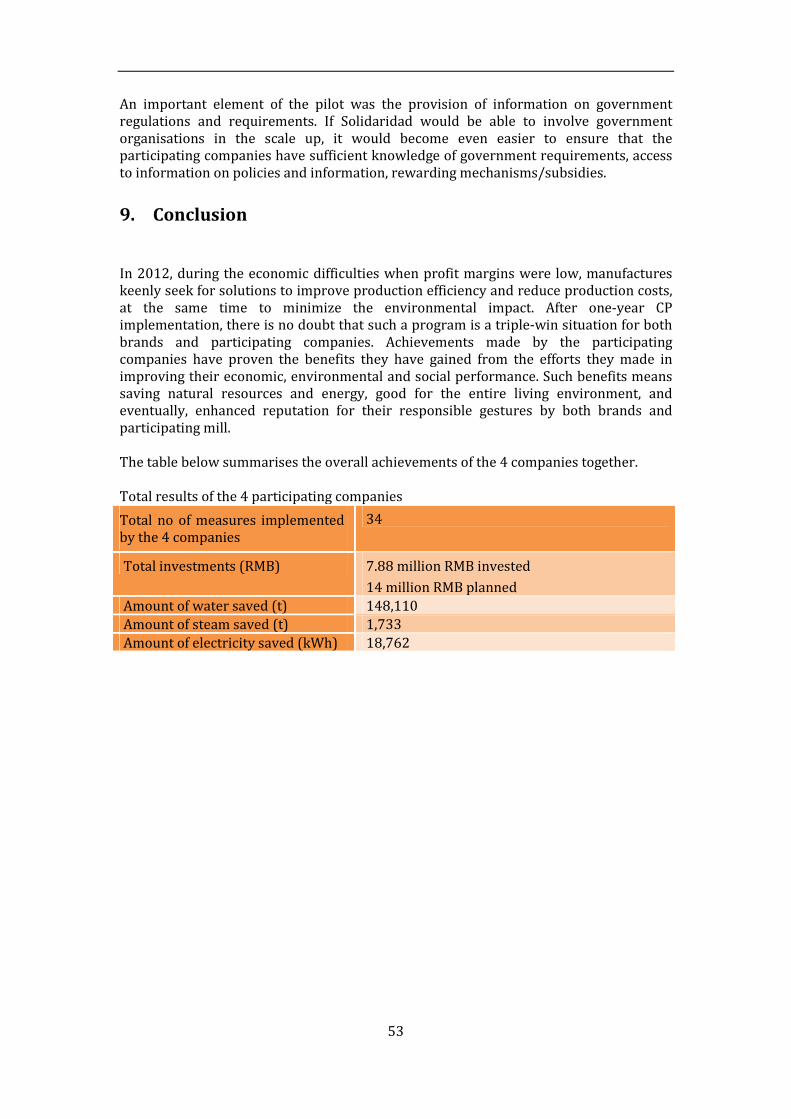
53
An important element of the pilot was the provision of information on government
regulations and requirements. If Solidaridad would be able to involve government
organisations in the scale up, it would become even easier to ensure that the
participating companies have sufficient knowledge of government requirements, access
to information on policies and information, rewarding mechanisms/subsidies.
9. Conclusion
In 2012, during the economic difficulties when profit margins were low, manufactures
keenly seek for solutions to improve production efficiency and reduce production costs,
at the same time to minimize the environmental impact. After one-year CP
implementation, there is no doubt that such a program is a triple-win situation for both
brands and participating companies. Achievements made by the participating
companies have proven the benefits they have gained from the efforts they made in
improving their economic, environmental and social performance. Such benefits means
saving natural resources and energy, good for the entire living environment, and
eventually, enhanced reputation for their responsible gestures by both brands and
participating mill.
The table below summarises the overall achievements of the 4 companies together.
Total results of the 4 participating companies
Total no of measures implemented
by the 4 companies
34
Total investments (RMB) 7.88 million RMB invested
14 million RMB planned
Amount of water saved (t) 148,110
Amount of steam saved (t) 1,733
Amount of electricity saved (kWh) 18,762
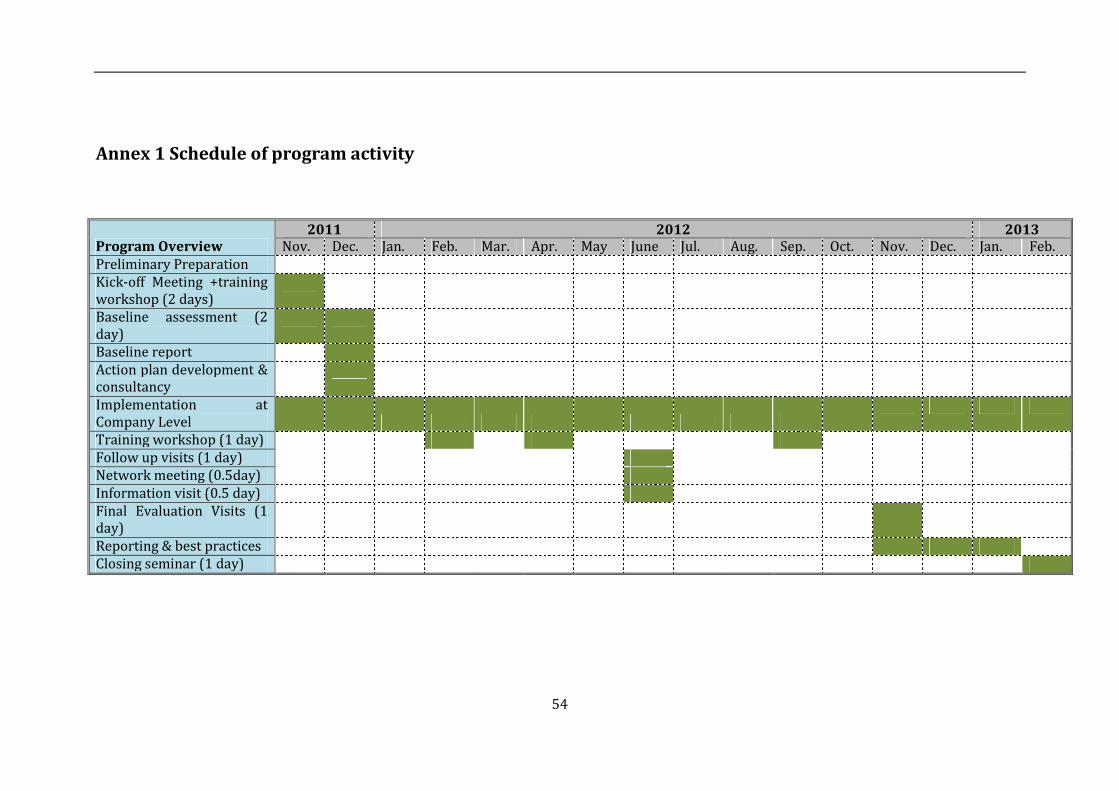
54
Annex 1 Schedule of program activity
Program Overview 2011 2012 2013
Nov. Dec. Jan. Feb. Mar. Apr. May June Jul. Aug. Sep. Oct. Nov. Dec. Jan. Feb.
Preliminary Preparation Kick-off Meeting +training
workshop (2 days)
Baseline assessment (2
day)
Baseline report Action plan development &
consultancy
Implementation at
Company Level
Training workshop (1 day) Follow up visits (1 day) Network meeting (0.5day) Information visit (0.5 day) Final Evaluation Visits (1
day)
Reporting & best practices Closing seminar (1 day)
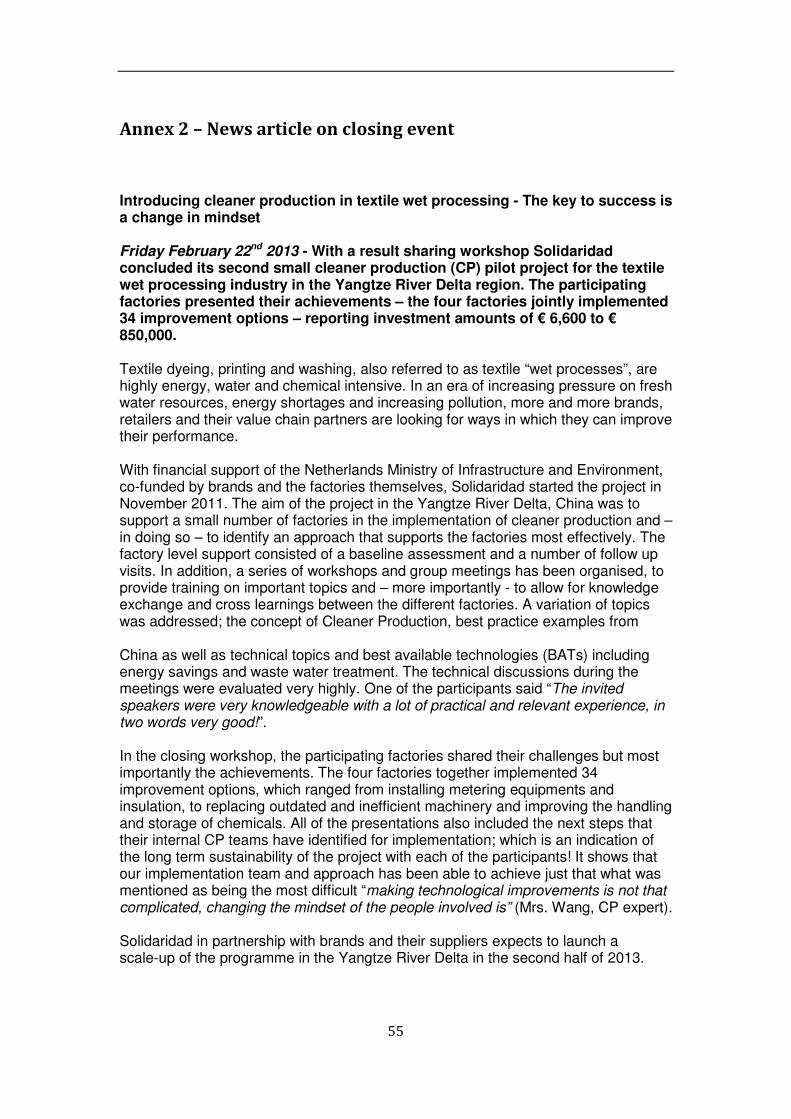
55
Annex 2 – News article on closing event
Introducing cleaner production in textile wet processing - The key to success is a change in mindset Friday February 22nd 2013 - With a result sharing workshop Solidaridad concluded its second small cleaner production (CP) pilot project for the textile wet processing industry in the Yangtze River Delta region. The participating factories presented their achievements – the four factories jointly implemented 34 improvement options – reporting investment amounts of € 6,600 to € 850,000. Textile dyeing, printing and washing, also referred to as textile “wet processes”, are highly energy, water and chemical intensive. In an era of increasing pressure on fresh water resources, energy shortages and increasing pollution, more and more brands, retailers and their value chain partners are looking for ways in which they can improve their performance. With financial support of the Netherlands Ministry of Infrastructure and Environment, co-funded by brands and the factories themselves, Solidaridad started the project in November 2011. The aim of the project in the Yangtze River Delta, China was to support a small number of factories in the implementation of cleaner production and – in doing so – to identify an approach that supports the factories most effectively. The factory level support consisted of a baseline assessment and a number of follow up visits. In addition, a series of workshops and group meetings has been organised, to provide training on important topics and – more importantly - to allow for knowledge exchange and cross learnings between the different factories. A variation of topics was addressed; the concept of Cleaner Production, best practice examples from China as well as technical topics and best available technologies (BATs) including energy savings and waste water treatment. The technical discussions during the meetings were evaluated very highly. One of the participants said “The invited speakers were very knowledgeable with a lot of practical and relevant experience, in two words very good!”. In the closing workshop, the participating factories shared their challenges but most importantly the achievements. The four factories together implemented 34 improvement options, which ranged from installing metering equipments and insulation, to replacing outdated and inefficient machinery and improving the handling and storage of chemicals. All of the presentations also included the next steps that their internal CP teams have identified for implementation; which is an indication of the long term sustainability of the project with each of the participants! It shows that our implementation team and approach has been able to achieve just that what was mentioned as being the most difficult “making technological improvements is not that complicated, changing the mindset of the people involved is” (Mrs. Wang, CP expert). Solidaridad in partnership with brands and their suppliers expects to launch a scale-up of the programme in the Yangtze River Delta in the second half of 2013.