final report pre-feasibility study report ii-7 project … · 2019-03-27 · the preparatory study...
TRANSCRIPT

Ministry of Agriculture Republic of Peru
THE PREPARATORY STUDY ON
PROJECT OF THE PROTECTION OF FLOOD PLAIN AND VULNERABLE RURAL
POPULATION AGAINST FLOOD IN THE REPUBLIC OF PERU
FINAL REPORT
PRE-FEASIBILITY STUDY REPORT II-7 PROJECT REPORT
(MAJES-CAMANA RIVER)
March 2013
JAPAN INTERNATIONAL COOPERATION AGENCY (JICA)
YACHIYO ENGINEERING CO., LTD.
NIPPON KOEI CO., LTD. NIPPON KOEI LATIN AMERICA –
CARIBBEAN Co., LTD.


Composition of Final Report
I. Feasibility Study Report
I-1 Program Report
I-2 Project Report (Cañete River)
I-3 Project Report (Chincha River)
I-4 Project Report (Pisco River)
I-5 Project Report (Majes-Camana River )
I-6 Supporting Report
Annex – 1 Metrology /Hydrology /Run-off Analysis
Annex – 2 Inundation Analysis
Annex – 3 River Bed Fluctuation Analysis
Annex-4 Flood Control Plan
Annex – 5 Forecasting and Warning System in Chira River
Annex – 6 Sediment Control
Annex – 7 Afforestation and Vegetation Recovery Plan
Annex – 8 Plan and Design of Facilities
Annex – 9 Construction Planning and Cost Estimate
Annex – 10 Socio-economy and Economic Evaluation
Annex – 11 Environmental and Social Considerations/ Gender
Annex – 12 Technical Assistance
Annex – 13 Stakeholders Meetings
Annex – 14 Implementation Program of Japanese Yen Loan Project
Annex-15 Drawings
I-7 Data Book
II. Pre- Feasibility Study Report
II-1 Program Report
II-2 Project Report (Chira River)
II-3 Project Report (Cañete River)
II-4 Project Report (Chincha River)
II-5 Project Report (Pisco River)
II-6 Project Report (Yauca River)
II-7 Project Report (Majes-Camana River ) (This Report)


Manta
Guayaquil
Cuenca
Ambato
Tumbes
Loja
Talara
Sullana
Paita
Piura
Chiclayo
Iquitos
Leticia
Rio Branco
Cobija
Pucallpa
Huaraz
Santa Lucia
Tarapoto
Moyobamba
Yurimaguas
Benjamin Constant
Chimbote
Huacho
Callao
Tingo Maria
Huanuco
Cerro de Pasco
Pisco
Ica
Nazca
Huancayo
Huancavelia
Matarani
Ilo
Arica
Oruro
Guaqui
Puno
Juliaca
Moquegua
Desaguadero
Cusco
Puerto Maldonado
Ayacucho
Quillabamba
Abancay
Tacna
Cruzeiro do SulCajamarca
Chachapoyas
Trujillo
Salaverry
Goyllarisquizga
Arequipa
PIURAピウラ州 LORETO
UCAYALI
MADRE DE DIOS
CUSCO
PUNOICA
イカ州
AREQUIPA
アレキパ州
AYACUCHO
LIMAリマ州
JUNIN
PASCO
HUANUCO
ANCASH
SANMARTIN
LAMBAYEQUE
CAJAMAROA
AMAZON AS
TUMBES
LA LIBERTAD
HUANCAVELICA
APURIMAC
MOQUEGUA
TACNA
COLOMBIA
B R A Z I L
BOLIVIA
ECUADOR
CHILE
La Paz
Lima
Quito
Machupicchu(ruins)
SOUTHPASIFICOCEAN
Lago Titicaca
Lago Poopo
Amazon
Putumayo
Rio
Rio Jurua
Amazon
Rio
Ben
i
Rio Purus
Rio Madre de Dios
Rio Alto Purus
Rio Caquata
Rio JapuraiRio Napo
Rio Yavari
Rio Ucayal i
Rio Pastaza
Rio Mararion
Rio U
rubamba
Rio M
ararion
Rio H
uallaga
Rio Apurimac
Boundary representation isnot necessarily authoritative
78 72
78 72
18
12
6
0
LegendInternational boundary
Province boundary
National capital
Department capital
Railroad
Road 0
0 100
100 200 Km
200 Miles
Transverse Mercator Projection, CM71°w
P E R U
Project Area (関連州)
Taget Rivers (対象河川)
Chiraチラ川
Caneteカニェテ川
Chinchaチンチャ川
Piscoピスコ川
Yaucaヤウカ川
Camana/Majesカマナ川/マヘス川
Cumbazaクンバサ川
Icaイカ川
Location Map
Objective Study Basin
Excluded Study Basin


Abbreviation Abbreviation Official Name or meaning
ANA Water National Authority (Autoridad Nacional del Agua) ALA Water Local Authority (Autoridad Local del Agua) C/B Cost-Benefit relation (Cost-Benefit Ratio) GDP PBI (Producto Bruto Interno) (Gross Domestic Product) GIS Sistema de información geográfica
(Geographic Information System) DGAA Dirección General de Asuntos Ambientales (Environmental Affairs
General Direction) DGFFS Dirección General de Forestal y de Fauna Silvestre (Forestry and
Fauna General Direction) DGIH Dirección General de Infraestructura Hidráulica (Hydraulic
Infrastructure General Direction) DGPM Dirección General de Programación Multianual del Sector Público
(Public Sector Multiannual Program General Direction) DNEP Dirección Nacional de Endeudamiento Público (Public Indebtedness
National Direction) DRA Dirección Regional de Agricultura (Agriculture Regional Direction) EIA Estudio de impacto ambiental (Environmental Impact Assessment -
EIA) FAO Organización de las Naciones Unidas para la Agricultura y la
Alimentación (Food and Agriculture Organization of the United Nations)
F/S Estudio de Factibilidad (Feasibility Study) GORE Gobiernos Regionales (Regional Governments) HEC-HMS Sistema de Modelado Hidrológico del Centro de Ingeniería
Hidrológica (Hydrologic Model System from the Hydrology Engineer Center)
HEC-RAS Sistema de Análisis de Ríos del Centro de Ingeniería Hidrológica (Hydrologic Engineering Centers River Analysis System)
IGN Instituto Geográfico Nacional (National Geographic Institute) IGV Impuesto General a Ventas (TAX) INDECI Instituto Nacional de Defensa Civil (Civil defense National Institute) INEI Instituto Nacional de Estadística (Statistics National Institute) INGEMMET Instituto Nacional Geológico Minero Metalúrgico (Metallurgic Mining
Geologic National Institute) INRENA Instituto Nacional de Recursos Naturales (Natural Resources National
Institute) IRR Tasa Interna de Retorno (Internal Rate of Return - IRR) JICA Agencia de Cooperación Internacional del Japón
(Japan International Cooperation Agency) JNUDRP Junta Nacional de Usuarios de los Distritos de Riego del Perú
(Peruvian Irrigation Disctrict Users National Board) L/A Acuerdo de Préstamo (Loan Agreement) MEF Ministerio de Economía y Finanzas (Economy and Finance Ministry) MINAG Ministerio de Agricultura (Agriculture Ministry) M/M Minuta de Discusiones (Minutes of Meeting)

NPV VAN (Valor Actual Neto) (NET PRESENT VALUE) O&M Operación y mantenimiento (Operation and maintenance) OGA Oficina General de Administración (Administration General Office) ONERRN Oficina Nacional de Evaluación de Recursos Naturales (Natural
Resources Assessment National Office) OPI Oficina de Programación e Inversiones (Programming and Investment
Office) PE Proyecto Especial Chira-Piura (Chira-Piura Special Project) PES PSA (Pago por Servicios ambientales) (Payment for Environmental
Services) PERFIL Estudio del Perfil (Profile Study) Pre F/S Estudio de prefactibilidad (Pre-feasibility Study) PERPEC Programa de Encauzamiento de Ríos y protección de Estructura de
Captación (River Channeling and Protection of Collection Structures Program)
PRONAMACHIS
Programa Nacional de Manejo de Cuencas Hidrográficas y Conservación de Suelos (Water Basins Management and Soil Conservation National Program)
PSI Programa Sub Sectorial de irrigaciones (Sub-Sectorial Irrigation Program)
SCF Factor de conversión estándar (Standard Conversion Factor) SENAMHI Servicio Nacional de Meteorología y Hidrología (Meteorology and
Hydrology National Service) SNIP Sistema Nacional de Inversión Pública (Public Investment National
System) UF Unidades Formuladoras (Formulator Units) VALLE Llanura aluvial, llanura de valle (Alluvial Plain, Valley Plain) VAT Impuesto al valor agregado (Value added tax)

THE PREPARATORY STUDY
ON
PROJECT OF THE PROTECTION OF FLOOD PLAIN AND VULNERABLE RURAL
POPULATION AGAINST FLOODS IN THE REPUBLIC OF PERU
FINAL REPORT
PRE-FEASIBILITY STUDY REPORT
II-7 PROJECT REPORT
(MAJES-CAMANA RIVER)
Table of Contents
Location Map Abbreviation
1. EXECUTIVE SUMMARY ...................................................................................................... 1-1
1.1 Project Name .............................................................................................................................. 1-1
1.2 Project’s Objective ................................................................................................................... 1-1
1.3 Supply and Demand Balance ..................................................................................................... 1-1
1.4 Structural Measures ................................................................................................................... 1-2
1.5 Non-structural measures ............................................................................................................ 1-4
1.6 Technical support ....................................................................................................................... 1-5
1.7 Costs ........................................................................................................................................... 1-5
1.8 Social Assessment ...................................................................................................................... 1-5
1.9 Sustainability Analysis ............................................................................................................... 1-8
1.10 Environmental Impact ................................................................................................................ 1-9
1.11 Execution plan ......................................................................................................................... 1-10
1.12 Institutions and management ................................................................................................... 1-10
1.13 Logical Framework ................................................................................................................... 1-11
1.14 Middle and Long Term Plans ................................................................................................... 1-12
2. GENERAL ASPECTS ............................................................................................................. 2-1
2.1 Name of the Project ................................................................................................................... 2-1

2.2 Formulator and Executor Units .................................................................................................. 2-1
2.3 Involved entities and Beneficiaries Participation ....................................................................... 2-1
2.4 Framework ............................................................................................................................... 2-4
3. IDENTIFICATION .................................................................................................................. 3-1
3.1 Diagnosis of the current situation .............................................................................................. 3-1
3.2 Definition of Problem and Causes ........................................................................................... 3-64
3.3 Objective of the Project ........................................................................................................... 3-68
4. FORMULATION AND EVALUATION ................................................................................ 4-1
4.1 Definition of the Assessment Horizon of the Project ............................................................... 4-1
4.2 Supply and Demand Analysis .................................................................................................... 4-1
4.3 Technical Planning ..................................................................................................................... 4-6
4.4 Costs ......................................................................................................................................... 4-29
4.5 Social Assessment .................................................................................................................... 4-31
4.6 Sensitivity Analysis .................................................................................................................. 4-38
4.7 Sustainability Analysis ............................................................................................................. 4-41
4.8 Environmental Impact .............................................................................................................. 4-42
4.9 Execution Plan ......................................................................................................................... 4-55
4.10 Institutions and Administration .............................................................................................. 4-58
4.11 Logical framework of the eventually selected option ............................................................ 4-63
4.12 Middle and long term Plan ....................................................................................................... 4-64
5. CONCLUSIONS ...................................................................................................................... 5-1

Preparatory study on the protection program for valleys and rural communities vulnerable to floods in Peru
Profile Study Report (Pre-feasibility level),Majes-Camana River
1-1
1. EXECUTIVE SUMMARY 1.1 Project Name “Protection program for valleys and rural communities vulnerable to floods Implementation of prevention measures to control overflows and floods of Majes-Camana River, Arequipa department.” 1.2 Project’s Objective The ultimate impact that the project is design to achieve is to alleviate the vulnerability of valleys and the local community to flooding and boost local socioeconomic development. 1.3 Supply and Demand Balance It has been calculated the theoretical water level in case of flow design flood based on the transversal lifting data of the river with an interval of 500m, in the Majes-Camana river watershed, assuming a design flood flow equal to the flood flow with a return period of 50 years. Then, we determined the dike height as the sum of the design water level plus the dike’s free board. This is the required height of the dike to control the damages caused by design floods and is the indicator of the demand of the local community. The height of the existing dike or current ground height is the required height to control the current flood damages, and is the indicator of the current offer. The difference between the dike design height (demand) and the height of the embankment or ground at present (supply) is the difference or gap between demand and supply.
Table 1.3-1 shows the average water levels floods, calculated with a return period of 50 years, of the required height of the dike (demand) to control the flow by adding the design water level plus the free board of the dike; of dike height or current ground height (supply), and the difference between these two (difference between demand and supply) of the river. Then, in Table 4.2-2 the values at each point are shown. The current height of the dike or the current ground height is greater than the required height of the dike, at certain points. In these, the difference between supply and demand is considered null.

Preparatory study on the protection program for valleys and rural communities vulnerable to floods in Peru
Profile Study Report (Pre-feasibility level),Majes-Camana River
1-2
Table 1.3-1 Demand and supply analysis
Watershed
Dike Height / current land
(supply)
Theoretical water level
with a return period of 50 years
Dike Freeboard
Required dike's height
(demand)
Diff. demand/supply
Left bank Right bank
Left bank Right bank
① ② ③ ④ ⑤=③+④ ⑥=⑤-① ⑦=⑤-② Majes-Camaná 401.90 405.19 399.43 1.20 400.63 1.21 0.88
1.4 Structural Measures Structural measures are a subject that must be analyzed in the flood control plan covering the entire watershed. The analysis results are presented in section 4.12 “medium and long term plan” This plan proposes the construction of dikes for flood control throughout the watershed. However, the case of Majes-Camana River requires a large project investing at a extremely high cost, far beyond the budget for this Project, which makes this proposal it impractical. Therefore, assuming that the dikes to control floods throughout the whole basin will be constructed progressively over a medium and long term period. Here is where this study focused on the most urgent works, priority for flood control. (1) Design flood flow The Methodological Guide for Protection Projects and/or Flood Control in Agricultural or Urban Areas(Guia Metodologica para Proyectos de Proteccion y/o Control de Inundaciones en Áreas Agricolas o Urbanas, 3.1.1 Horizonte de Proyectos)prepared by the Public Sector Multi Annual Programming General Direction (DGPM) of the Ministry of Economy and Finance (MEF) recommends a comparative analysis of different return periods: 25, 50 and 100 years for the urban area and 10, 25 and 50 years for rural and agricultural land. Considering that the present Project is aimed at protecting the rural and agricultural land, the design flood flow is to be determined in a return period of 10 years to 50 years in the mentioned Guide. The maximum discharge in the past in Majes-Camana watershed is less than the flood discharge with return period of 50-year. However it seems that the flood discharge with return period of 50-year caused large damages. Since the flood control facilities in Peru not well developed, it is true that the past floods caused much disaster so that the facilities should be safe for the same scale of flood with return period of 50 years, therefore the design flood discharge in this Project is to be the discharge with return period of 50-year.

Preparatory study on the protection program for valleys and rural communities vulnerable to floods in Peru
Profile Study Report (Pre-feasibility level),Majes-Camana River
1-3
The relation among flood discharge with different return period, damage caused by the floods and inundation areas is analyzed in the basin. The results are that the more the return periods of flood increase the more inundation area and damage amount increase in the basin, however the increase tendency of damage with project is more gentle compared with former two items, and the reduction of damage with project reaches to maximum in the case of the flood with return period of 50 years within the cases of flood with less return period of 50 years. As shown in the above section, the design flood discharge with return period of 50-year is more than the maximum flood in the past, and absolute damage reduction amount in the design discharge is largest among the probable flood discharge less than with return period of 50-year, and economic viability of the design flood is confirmed.
(2) Selection of prioritized flood prevention works We applied the following five criteria for the selection of priority flood control works.
Demand from the local community (based on historical flood damage) Lack of discharge capacity of river channel (including the sections affected by
the scouring) Conditions of the adjacent area (conditions in urban areas, farmland, etc.). Conditions and area of inundation (type and extent of inundation according to
inundation analysis) Social and environmental conditions (important local infrastructures)
Based on the river survey, field investigation, discharge capacity analysis of river channel, inundation analysis, and interviews to the local community (irrigation committee needs, local governments, historical flood damage, etc...) a comprehensive evaluation was made applying the five evaluation criteria listed above. After that we selected a total of seven (7) critical points (with the highest score in the assessment) that require flood protection measures. Concretely, since the river cross sectional survey was carried out every 500m interval and discharge capacity analysis and inundation analysis were performed based on the survey results, the integral assessment was also done for sections of 500 meters. This sections have been assessed in scales of 1 to 3 (0 point, 1 point and 2 points) and the sections of which score is more than 6 were selected as prioritized areas. The lowest limit (6 points) has been determined also taking into account the budget available for the Project in general

Preparatory study on the protection program for valleys and rural communities vulnerable to floods in Peru
Profile Study Report (Pre-feasibility level),Majes-Camana River
1-4
1.5 Non-structural measures 1.5.1 Reforestation and vegetation recovery (1) Basic Policies The reforestation plan and vegetation recovery that meets the objective of this project can be divided into: i) reforestation along river structures, and ii) reforestation in the upper watershed. The first has a direct effect on flood prevention expressing its impact in a short time, while the second one requires high cost and a long period for its implementation, as indicated later in the section “1.12 (2) Reforestation Plan and vegetation recovery”, and also it is impractical to be implemented within the framework of this project. Therefore, this study focused on the first alternative. (2) Regarding reforestation along river structures This alternative proposes planting trees along the river structures, including dikes and bank protection works.
Objective: Reduce the impact of flooding of the river when an unexpected flood or narrowing of the river by the presence of obstacles, using vegetation strips between the river and the elements to be protected.
Methodology: Create vegetation stripes of a certain width between the river and river structures.
Execution of works: Plant vegetation on a portion of the river structures (dikes, etc.).
Maintenance after reforestation: Maintenance will be taken by irrigation committees under their own initiative.
The width, length and area of reforestation along river structures are 11m, 29.0 km and 18.3 ha respectively. 1.5.2 Sediment control plan The sediment control plan must be analyzed within the general plan of the watershed. The results of the analysis are presented in section 1.12 “Medium and long term plan (3)”. To sum up, the sediment control plan for the entire watershed requires a high investment cost, which goes far beyond the budget of this project, which makes it impractical to adopt. The bed variation analysis has shown that the volume of sediment dragged in the Majes-Camana river watershed is high, and therefore the bed variation (sediment volume) is also large. However, seeing the average height of the bed, there has only been a variation of approximately 0.2 m in 50 years, and the entry of sediments seem to have almost no impact on the downstream bed. So, we conclude that it is necessary to take special measures to control sediment.

Preparatory study on the protection program for valleys and rural communities vulnerable to floods in Peru
Profile Study Report (Pre-feasibility level),Majes-Camana River
1-5
1.6 Technical support Based on the technical proposals of structural and nonstructural measures, it is also intends to incorporate in this project technical assistance to strengthen the measures. The objective of the technical assistance is to “improve the capacity and technical level of the local community, to manage risk to reduce flood damage in selected valleys.” Technical assistance will cover the Majes-Camana river watershed. Aiming to train characteristics of the watershed, courses for one will be prepared. The beneficiaries are the representatives of the committees and irrigation groups from each watershed, governments employees (provincial and district), local community representatives, local people etc. Qualified as participants in the training, people with ability to replicate and disseminate lessons learned in the courses to other community members, through meetings of the organizations to which they belong. In order to carry out the technical assistance goal, the three activities propose the following:
- Bank protection activity and knowledge enhancement on agriculture and natural environment
- Community disaster prevention planning for flood damages
- Watershed (slope) management against fluvial sedimentation 1.7 Costs In the Table 1.7-1 the costs of this Project in Majes-Camana watershed is shown. The cost of the watersheds is around 97.2 million soles.
Table 1.7-1 Project Cost (1,000 soles)
ConstructionCost
Detail DesignCost
ConstructionSupervision
Cost
EnvironmentalCost
Sub totalAfforestation
CostFlood Alert
System Cost
Majes-Camana 83,228 4,161 8,323 832 96,544 451 0 219 97,214
Total
Structural Cost Non-structural cost
WatershedTechnicalAssistance
Cost
1.8 Social Assessment (1) Benefits The benefits of flood control are the reduction of losses caused by floods which would be achieved by the implementation of the project and is determined by the difference between the loss amount without project and with project. Specifically, to determine the

Preparatory study on the protection program for valleys and rural communities vulnerable to floods in Peru
Profile Study Report (Pre-feasibility level),Majes-Camana River
1-6
benefits, first the amount of losses by floods is calculated from different return periods (between 2 and 50 years), assuming that flood control works will last 50 years, and then the average annual reduction loss amount is determined from the reduction of losses from different return periods. In Tables 1.8-1 and 1.8-2 show the average annual amount of reduction loss that would be achieved by implementing this project, expressed in costs at private prices and costs at social prices.
Table 1.8-1 Annual average damage reduction amount (at private prices)
s/1000
事業を実施しな
い場合①
事業を実施した
場合②
軽減額
③=①-②
Without Project
①With project ②
Damage
reduction
③=①-②
1 1.000 0 0 0 0 0
2 0.500 0 0 0 0 0.500 0 0
5 0.200 47,669 10,021 37,648 18,824 0.300 5,647 5,647
10 0.100 76,278 21,316 54,962 46,305 0.100 4,631 10,278
25 0.040 111,113 34,254 76,859 65,911 0.060 3,955 14,232
50 0.020 190,662 63,532 127,130 101,994 0.020 2,040 16,272
MAJES-CAMANA
Accumulation of
⑥ = Annual
average damage
reduction
年平均被害額
④×⑤
Annual average
damage ⑥
区間確率
⑤
Section
probability
流域
Basin
流量規模
Return period
超過確率
Probability
被害額 (Total damage - miles de S/.)
区間平均被害
額
④
Average
damage
Table 1.8-2 Annual average damage reduction amount (at social prices) s/1000
事業を実施しな
い場合①
事業を実施した
場合②
軽減額
③=①-②
Without Project
①With project ②
Damage
reduction
③=①-②
1 1.000 0 0 0 0 0
2 0.500 0 0 0 0 0.500 0 0
5 0.200 48,468 10,435 38,033 19,016 0.300 5,705 5,705
10 0.100 78,194 21,738 56,456 47,244 0.100 4,724 10,429
25 0.040 116,730 36,455 80,275 68,366 0.060 4,102 14,531
50 0.020 206,459 70,838 135,621 107,948 0.020 2,159 16,690
MAJES-CAMANA
年平均被害額
④×⑤
Annual average
damage ⑥
Accumulation of
⑥ = Annual
average damage
reduction
区間平均被害
額
④
Average
damage
区間確率
⑤
Section
probability
流域
Basin
流量規模
Return period
超過確率
Probability
被害額 (Total damage - miles de S/.)
(2) Social assessment results The objective of the social assessment in this study is to evaluate the efficiency of investments in the structural measures using the method of cost-benefit relation (C/B) from the point of view of national economy. To do this, we determined the economic evaluation indicators (C/B relation, Net Present Value-NPV, and Internal return rate - IRR). The benefits of the evaluation period were estimated, from the first 15 years since the start of the project. Because, from these 15 years, two are from the work execution period, the evaluation was conducted for the 13 years following the completion of works.

Preparatory study on the protection program for valleys and rural communities vulnerable to floods in Peru
Profile Study Report (Pre-feasibility level),Majes-Camana River
1-7
In Tables 1.8-3 and 1.8-4 the costs at private prices and at social prices resulting from this project assessment are shown. It is noted that the project will have enough economic effect.
Table 1.8-3 Social Assessment (costs at private prices)
Watershed
Gathered Average Annual Benefit
Gathered Average Annual
Benefit (in 15 years)
Project Cost
O&M Cost
Cost/Benefit Relation
Net Present Value (NPV)
Internal Return Rate
(IRR)
Majes-Camana 211.538,859 95.526,756 97.214,077 5.409,816 1.09 8.174,200 12%
Table 1.8-4 Social Assessment (costs at social prices)
Watershed
Gathered Average Annual Benefit
Gathered Average Annual
Benefit (in 15 years)
Project Cost
O&M Cost
Cost/Benefit Relation
Net Present Value (NPV)
Internal Return Rate
(IRR)
Majes-Camana 216.973,372 97.980,874 80.819,553 4.497,057 1.35 25.359,988 16%
Below are the positive effects of the Project that are difficult to quantify in economic values. ① Contribution to local economic development to alleviate the fear to economic
activities suspension and damages ② Contribution to increase local employment opportunities thanks to the local
construction project ③ Strengthening the awareness of local people regarding damages from floods and
other disasters ④ Contribution to increase from stable agricultural production income, relieving
flood damage ⑤ Rise in farmland prices
From the results of the economic evaluation presented above, it is considered that this project will substantially contribute to the development of the local economy.

Preparatory study on the protection program for valleys and rural communities vulnerable to floods in Peru
Profile Study Report (Pre-feasibility level),Majes-Camana River
1-8
1.9 Sustainability Analysis This project will be co-managed by the central government (through the DGIH), irrigation committees and regional governments, and the project cost will be covered with the respective contributions of the three parties. Usually the central government (in this case, the DGIH) assumes 80%, the irrigation commissions 10% and regional governments 10%. However, the percentages of the contributions of these last two are decided through discussions between both parties. On the other hand, the operation and maintenance (O & M) of completed works is taken by the irrigation committees. Therefore, the sustainability of the project is depends on the profitability of the project and the ability of O & M of irrigation committees. (1) Profitability We have seen that Majes-Camana river watershed is sufficiently profitable and sustainable. The amount of investment required is estimated at S / 97.2 million soles (cost at private prices). It is a cost-effective project with a C/B relation of 1.35, a relatively high IRR of approximately 16% and NPV of S/.25. 4millones soles. (2) Operation and maintenance costs The annual cost of operation and maintenance required for the project, having as base year 2008 is estimated at 416,140 soles, which corresponds to 0.5% of the construction cost of the project (83,228,000 soles) in the Majes-Camana river watershed. On the other hand, the operating expenses average in the last two years of irrigation committees is 1,911,708. When considering that the annual cost of operation and maintenance represents 22% of the annual irrigation budget, the project would be sustainable enough because of the financial capacity of these committees to maintain and operate the constructed works. Table 1.9-1 presents the budget of the irrigation committees in the Majes-Camana river watershed in recent years.
Table 1.9-1 Irrigation committee’s budget
Rivers Annual Budget (Unit/ S) 2006 2007 2008 2009 2010
Majes-Camana 1.959.302,60 1.864.113,30

Preparatory study on the protection program for valleys and rural communities vulnerable to floods in Peru
Profile Study Report (Pre-feasibility level),Majes-Camana River
1-9
1.10 Environmental Impact (1)Procedure of Environmental Impact Assessment
Projects are categorized in three scales, based on the significance level of the negative and positive impacts, and each sector has an independent competence on this categorization. The Project holder should submit the Environmental Impact Statement (DIA, in Spanish) for all Projects under Category I. The project holder should prepare an EIA-sd or an EIA-d if the Project is categorized under Category II or III, respectively, to be granted the Environmental Certification from the relevant Ministry Directorate.
First, the Project holder applies for the Project classification, by submitting the Preliminary Environmental Assessment (PEA). The relevant sector assesses and categorizes the Project. The Project’s PEA that is categorized under Category I becomes an EID, and those Projects categorized under Category II or III should prepare an EIA-sd or EIA-d, as applicable.
The preliminary environmental assessment (EAP) for Majes-Camana river was carried out between September 2011 and November 2011and by a consulting firm registered in the Ministry of Agriculture (CIDES Ingenieros S.A.). EAP for Majes-Camana was submitted to DGIH December 20, 2011 by JICA Study Team and from DGIH to DGAA January 4, 2012. DGAA is still under assessment on Majes-Camana watershed, (2)Results of Environmental Impact Assessment The procedures to review and evaluate the impact of the natural and social environment of the Project are the following. First, we reviewed the implementation schedule of the construction of river structures, and proceeded to develop the Leopold matrix.
The impact at environmental level (natural, biological and social environment) was evaluated and at Project level (construction and maintenance stage). The quantitative levels were determined by quantifying the environmental impact in terms of impact to nature, manifestation possibility, magnitude (intensity, reach, duration and reversibility). The EAP showed that the environmental impact would be manifested by the implementation of this project in the construction and maintenance stages, mostly, it is not very noticeable, and if it were, it can be prevented or mitigated by appropriately implementing the management plan environmental impact.
On the other hand, the positive impact is very noticeable in the maintenance stage, which manifests at socioeconomic and environmental level, specifically, in greater security and reduced vulnerability, improved life quality and land use.

Preparatory study on the protection program for valleys and rural communities vulnerable to floods in Peru
Profile Study Report (Pre-feasibility level),Majes-Camana River
1-10
1.11 Execution plan Table 1.11-1 presents the Project execution plan.
Table 1.11-1 Execution plan
1.12 Institutions and management The institutions and its administration in the investment stage and in the operation and maintenance stage after the investment shown in the Figures 1.12-1 and 1.12-2.
Figure 1.12-1 institutions related to the implementation of the project (investment stage)
JICA
MEF (Economy and Finance
Ministry)
IRRIGATION SUBSECTORIAL PROGRAM
Engineer Consultant Companies
Works Contractors Company and Goods
Providers
PSI
DGPM/DNEP
Works, Reforestation and Training Environmental Works and
monitoring Supervision Works Construction and
Goods Providers
Works and goods contracts Consultants Contract
Loan Contracts
Resource loan Agreements
Planning and Budget Office
Budget
MINAG (Agriculture
Ministry) DGAA
EIA Approves

Preparatory study on the protection program for valleys and rural communities vulnerable to floods in Peru
Profile Study Report (Pre-feasibility level),Majes-Camana River
1-11
Figure 1.12-2 institutions related to the implementation of the project (operation and maintenance phase of post-investment)
1.13 Logical Framework Table 1.13-1 presents the logical framework of the final selected alternative.
Table 1.13-1 Logical framework of the final selected alternative
Narrative Summary Verifying Indicators Verifying Indicators Media Preliminary Conditions
Superior Goal
Promote socioeconomic local development and contribute in communities’ social welfare.
Improve local productivity, generate more jobs, increase population’s income and reduce poverty index
Published statistic data Scio-economic and policy stability
Objectives
Relief the high vulnerability of valleys and local continuity to floods
Types, quantity and distribution of flood control works, population and beneficiaries areas
Monitoring annual calendar works and financial plan, budget execution control
Ensure the necessary budget, active intervention from central and regional governments, municipalities, irrigation communities, local population, etc.
Expected results
JICA
MEF (Economy and Finance Ministry)
USERS BOARD
MINAG (Agriculture Ministry)
ANA-ALA
Sectorists
DNEP
Loan debt service
Loan debt service
Promote and support projects’ structures
Technical –Operative Support
Operation and Maintenance
Unit
Budget Management Service quality regulations
Operation and Maintenance
PSI

Preparatory study on the protection program for valleys and rural communities vulnerable to floods in Peru
Profile Study Report (Pre-feasibility level),Majes-Camana River
1-12
Reduction of areas and flooded areas, functional improvement of intakes, road destruction prevention, irrigation channels protection, bank erosion control and Poechos dike safety
Number of areas and flooded areas, water intake flow variation, road destruction frequency, bank erosion progress and watershed’s downstream erosion.
Site visits, review of the flood control plan and flood control works reports and periodic monitoring of local inhabitants
Maintenance monitoring by regional governments, municipalities and local community, provide timely information to the superior organisms
Activities
Component A: Structural Measures
Dikes rehabilitation, intake and bank protection works, road damages prevention, construction of 28 works, including dike’s safety
Detailed design review, works reports, executed expenses
Ensure the works budget, detailed design/works execution/good quality works supervision
Component B: Non-Structural Measures
B-1 Reforestation and vegetation recovery
Reforested area, coastal forest area
Works advance reports, periodic monitor by local community
Consultants support, NGO’s, local community, gathering and cooperation of lower watershed community
Component C: Disaster prevention and capabilities development education
Number of seminars, trainings, workshops, etc
Progress reports, local governments and community monitoring
Predisposition of the parties to participate, consultants and NGO’s assessments
Project’s execution management
Project’s management Detailed design, work start order, work operation and maintenance supervision
Design plans, work’s execution plans, costs estimation, works specifications, works management reports and maintenance manuals
High level consultants and contractors selection, beneficiaries population participation in operation and maintenance
1.14 Middle and Long Term Plans While it is true that due to the limited budget available for the Project, this study is focused mainly on the flood control measures analysis that must be implemented urgently. It is considered necessary to timely implement other necessary measures within a long term. In this section we will discuss the medium and long term plans.
(1) Flood Control General Plan There are several ways to control floods in the entire watershed, for example, the building of dams, retarding basin, dikes or a combination of these. The options to build dams or retarding basin are not viable because in order to answer to a flood flow with a return period of 50 years, enormous works would be necessary to be built. So, the study was focused here on dikes’ construction because it was the most viable option.
Flood water level was calculated in the watershed adopting a designed flood flow with a return period of 50 years. At this water level, freeboard was added in order to determine the required dikes height. After, sections of the rivers where the dikes or ground did not reach the required

Preparatory study on the protection program for valleys and rural communities vulnerable to floods in Peru
Profile Study Report (Pre-feasibility level),Majes-Camana River
1-13
height were identified. These sections, altogether, add up to approx.136km. Also, from maintaining these works, annually a dragged of the rivers has to be done in the sections where, according to the bed fluctuation analysis the sediment gathering is elevating the bed’s height. The volume of sediments that shall be eliminated annually was determined in approximately 11,000 m3.
In Tables 1.14-1 and 1.14-2 the flood control general plan project cost is shown as well as the social assessment results in terms of private and social costs.
Table 1.14-1 Project Cost and Social Assessment of the general flood control plan
(private prices costs)
年平均被害軽減額評価期間被害
軽減額(15年)事業費 維持管理費 B/C NPV IRR(%)
Annual Average
Damage Reduction
Damage Reduction in
Evaluation
Period(15years)
Project Cost O&M CostCost Benefit
Ration
Net Present
Value
Internal Return
of Rate
Majes-Camana 285,833,001 129,076,518 465,857,392 29,096,617 0.31 -291,140,628 -
Table 1.14-2 Project Cost and Social Assessment of the general flood control plan (social prices costs)
年平均被害軽減額
評価期間被害
軽減額(15年)事業費 維持管理費 B/C NPV IRR(%)
Annual Average
Damage Reduction
Damage Reduction in
EvaluationPeriod(15years)
Project Cost O&M CostCost Benefit
Ration
Net Present
Value
Internal Return
of Rate
Majes-Camana 294,878,168 133,161,136 374,549,343 23,393,680 0.39 -204,693,450 -
In case of executing flood control works in the watershed, the works is not viable economically, and the Projects’ cost would elevate to 465.9 million soles, which is a huge amount for this project..
(2) Reforestation Plan and Vegetation Recovery The forestry option was analyzed, in a long term basis, to cover every area that requires being
covered with vegetation in the upper watershed. The objective is improving this areas’ infiltration capacity, reduce of surface water and increase semi-underground and underground water. So, the flood maximum flow will be decreased, also it could be possible to increase the water reserve in the mountain areas and prevent and soothe floods. The areas to be reforested will be the afforested areas or where the forest mass in the water infiltration areas has been lost.
In Table 1.14-3 the area to be afforested and the project’s cost for the watershed is shown.
These were calculated based on forestry plan of Chincha River. The total surface would be approximately 307,000hectares and in order to forest them the required time would be from 98 years and 829.2 million soles. To sum up, the Project has to cover an extensive area, with an investment of much time and at a high cost.

Preparatory study on the protection program for valleys and rural communities vulnerable to floods in Peru
Profile Study Report (Pre-feasibility level),Majes-Camana River
1-14
Table 1.14-3 General Plan for forestry on upper stream watersheds
Watershed Forestry Area
(ha) A
Required Period for the project
(years) B
Required Budget (1,000soles)
C
Majes- Camana 307,210 98 829,201
(3) Sediment Control Plan
As long term sediment control plan, it is recommended to perform necessary works on the upper watershed. These works will mainly consist of dams and bank protection. In Table 1.14-4 the estimate work cost is shown. There are two costs, one for executing works in the entire watershed and another one for executing works only in prioritized areas.
All the chosen watersheds for this Project are big. So, if bank protection works and sediment control dams want to be built, not only the works’ cost would elevate but also a very long period of investment would have to be done in the watershed. This means that its positive impact will be seen in a long time.
Table 1.14-4 Projects’ General Costs of the Sediment Control Installations
Upstream the Watershed
Watersheds
Areas
Bank Protection Bands Dams Works direct cost (total)
Project Cost (in millions de s/.)
Qty. (km)
Works direct costs (million s/.)
Qty. (No.)
Works direct costs (million s/.)
Qty. (No.
Works direct costs (million s/.)
Majes-Camana
Totally 264 S/.282 26 S/.1 123 S/.165 S/.448 S/.843Prioritized areas 264 S/.282 26 S/.1 81 S/.105 S/.388 S/.730

Preparatory study on the protection program for valleys and rural communities vulnerable to floods in Peru
Profile Study Report (Pre-feasibility level),Majes-Camana River
2-1
2. GENERAL ASPECTS 2.1 Name of the Project “Protection program for valleys and rural communities vulnerable to floods Implementation of prevention measures to control overflows and floods of Majes-Camana River, Arequipa department” 2.2 Formulator and Executor Units (1) Formulator Unit Name: Hydraulic Infrastructure General Direction, Agriculture Ministry Responsible: Orlando Chirinos Hernan Trujillo General Director of the Water Infrastructure General Direction Address: Av. Benavides N° 395 Miraflores, Lima 12 - Peru Phone: (511) 4455457 / 6148154 Email: [email protected] (2) Executor Unit Name: Sub-sectorial Irrigation Program, Agriculture Ministry Manager: Jorge Zúñiga Morgan Executive Director Address: Jr. Emilio Fernandez N° 130 Santa Beatriz, Lima-Peru Phone: (511) 4244488 Email: [email protected] 2.3 Involved entities and Beneficiaries Participation Here are the institutions and entities involved in this project, as well as beneficiaries. (1) Agriculture Ministry (MINAG) MINAG, as manager of natural resources of watersheds promotes agricultural development in each of them and is responsible of maintaining the economical, social and environmental to benefit agricultural development. To accomplish effectively and efficiently this objective, the MINAG has been working since 1999 in the River Channeling and Collection Structures Protection Program (PERPEC). The river disaster prevention programs that are been carried out by regional governments are funded

Preparatory study on the protection program for valleys and rural communities vulnerable to floods in Peru
Profile Study Report (Pre-feasibility level),Majes-Camana River
2-2
with PERPEC resources. 1) Administration Office (OA) - Manages and executes the program’s budget - Establishes the preparation of management guides and financial affairs 2) Hydraulic Infrastructure general Direction (DGIH) - Performs the study, control and implementation of the investment program - Develops general guidelines of the program together with OPI 3) Planning and Investment Office (OPI) - Conducts the preliminary assessment of the investment program - Assumes the program’s management and the execution of the program’s budget - Plans the preparation of management guides and financial affairs 4) Irrigation Sub-Sectorial Program (PSI) - Carries-out the investment program approved by OPI and DGPM (2) Economy and Finance Ministry (MEF) Public Sector’s Multiannual Programming General Direction (DGPM) Is in charge of approving public investment works according to procedures under the Public Investment National System (SNIP) to assess the relevance and feasibility of processing the disbursement request of the national budget and the loan from JICA. (3) Japan’s International Cooperation Agency (JICA) It is a Japanese government institution with the objective of contributing in the socioeconomic development of developing countries through international cooperation. JICA has extended financial assistance to carry out pre-feasibility and feasibility studies of this Project. (4) Regional Governments (GORE) Regional governments assume the promotion of integrated and sustainable regional development following the national and regional plans and programs, trying to increase public and private investment, generating employment opportunities, protecting citizens rights and ensuring equal opportunities. The regional governments’ participation with their possible financial support is a very important factor to ensure the Project’s sustainability. (5) Irrigation Commission Currently there are 42 irrigation commissions in the Majes-Camana River Watershed. These

Preparatory study on the protection program for valleys and rural communities vulnerable to floods in Peru
Profile Study Report (Pre-feasibility level),Majes-Camana River
2-3
have expressed a strong desire for the starting of works because these will help constructing dikes, protecting margins, repairing water intakes, etc. These commissions are currently suffering major damages due to rivers flooding. Next, a brief overview of the Majes-Camana River Watershed is described (for more details, see Section 3.1.3). Currently, the operation and maintenance of dikes, margin protection works, irrigation intakes and channels linked to agricultural land and irrigation systems in the Watershed, are mainly made by irrigation commissions and their members, with the assistance of local governments.
Majes River Watershed Camana River Watershed
Number of irrigation blocks: 17 17 Number of Irrigation Commissions:
45 38
Irrigated Area: 7,505 ha 6,796ha Beneficiaries: 2.519 producers 3,388 producers
(6) Meteorology and Hydrology National Service (SENAMHI) It is an agency from the Environment Ministry responsible for all activities related to meteorology, hydrology, environment and agricultural meteorology. Take part in global level monitoring, contributing to sustainable development, security and national welfare, and gathering information and data from meteorological stations and hydrological observation. (7) Civil Defense National Institute (INDECI) INDECI is the main agency and coordinator of the Civil Defense National System. It is responsible for organizing and coordinating the community, elaborating plans and developing disaster risk’s management processes. Its objective is to prevent or alleviate human life loss due to natural and human disasters and prevent destruction of property and the environment. (8) Water National Authority (ANA) It is the highest technical regulating authority in charge of promoting, monitoring and controlling politics, plans, programs and regulations regarding sustainable use of water resources nationwide. Its functions include sustainable management of these resources, as well as improving the technical and legal framework on monitoring and assessment of water supply operations in each region. Along with maintaining and promoting a sustainable use of water resources, it is also responsible for conducting the necessary studies and developing main maintenance plans,

Preparatory study on the protection program for valleys and rural communities vulnerable to floods in Peru
Profile Study Report (Pre-feasibility level),Majes-Camana River
2-4
national and international economic and technical cooperation programs. (9) Agriculture Regional Directorates (DRA’s) Agricultural regional addresses fulfill the following functions under the respective regional government: 1) Develop, approve, assess, implement, control and manage national agriculture policies, sectorial plans as well as regional plans and policies proposed by municipalities 2) Control agriculture activities and services fitting them to related policies and regulations, as well as on the regional potential 3) Participate in the sustainable management of water resources agreeing with the watershed’s general framework, as well as the policies of the Water National Authority (ANA) 4) Promote the restructure of areas, market development, export and agricultural and agro-industrial products consumption 5) Promote the management of: irrigation, construction and irrigation repair programs, as well as the proper management and water resources and soil conservation 2.4 Framework 2.4.1 Background (1) Study Background The Republic of Peru (hereinafter “Peru”) is a country with high risk of natural disasters such as earthquakes, Tsunamis, etc. Among these natural disasters there are also floods. In particular, El Niño takes place with an interval of several years and has caused major flood of rivers and landslides in different parts of the country. The most serious disaster in recent years due to El Niño occurred in the rainy season of 1982-1983 and 1997-1998. In particular, the period of 1997-1998, the floods, landslides, among others left loss of 3,500 million of dollars nationwide. The latest floods in late January 2010, nearby Machupicchu World Heritage Site, due to heavy rains interrupted railway and roads traffic, leaving almost 2,000 people isolated. In this context, the central government has implemented El Niño phenomenon I and II contingency plans in 1997-1998, throughout the Agriculture and Livestock Ministry (MINAG) in order to rebuild water infrastructures devastated by this phenomenon. Next, the Hydraulic Infrastructure General Direction (DGIH) of the Agriculture Ministry (MINAG) began in 1999 the River Channeling and Collection Structures Protection Program (PERPEC) in order to protect villages, farmlands, agricultural infrastructure, etc located within flood risk areas. The program consisted of financial support for regional government to carry out works of margin protection. In the multiyear PERPEC plan between 2007-2009 it had been intended to execute a total of 206 margin protection works nationwide. These projects were designed to withstand

Preparatory study on the protection program for valleys and rural communities vulnerable to floods in Peru
Profile Study Report (Pre-feasibility level),Majes-Camana River
2-5
floods with a return period of 50 years, but all the works have been small and punctual, without giving a full and integral solution to control floods. So, every time floods occur in different places, damages are still happening. MINAG developed a “Valley and Rural Populations Vulnerable to Floods Protection Project” for nine watersheds of the five regions. However, due to the limited availability of experiences, technical and financial resources to implement a pre-investment study for a flood control project of such magnitude, MINAG requested JICA’s help to implementation this study. In response to this request, JICA and MINAG held discussions under the premise of implementing it in the preparatory study scheme to formulate a loan draft from AOD of JICA, about the content and scope of the study, the implementation’s schedule, obligations and commitments of both parties, etc. expressing the conclusions in the Discussions Minutes (hereinafter “M/D”) that were signed on January 21 and April 16, 2010. This study was implemented on this M/D. (2) Progress of Study The Profile Study Report for this Project at Program’s level for nine watersheds of five regions has been elaborated by DGIH and sent to the Planning and Investment Office (OPI) on December 23, 2009, and approved on the 30th of the same month. Afterwards, DGIH presented the report to the Public Sector Multiannual Programming General Direction (DGPM) of the Economy and Finance Ministry (MEF) on January 18, 2010. On March 19th, DGPM informed DGIH about the results of the review and the correspondent comments. The JICA Study Team began the study in Peru on September 5th, 2010. At the beginning, nine watersheds were going to be included in the study. One, the Ica River was excluded of the Peruvian proposal leaving eight watersheds. The eight watersheds were divided into two groups: Group A with five watersheds and Group B with three watersheds. The study for the first group was assigned to JICA and the second to DGIH. Group A includes Chira, Cañete, Chincha, Pisco and Yauca Rivers’ Watersheds and Group B includes the Cumbaza, Majes and Camana Rivers’ Watersheds. The JICA Study Team conducted the profile study of the five watersheds of Group A, with an accurate pre-feasibility level and handed DGIH the Program Report of group A and the reports of the five watershed projects by late June 2011. Also, the feasibility study has already started, omitting the pre-feasibility study. For the watersheds of Group B which study corresponded to DGIH, this profile study took place between mid-February and early March 2011 (and not with a pre-feasibility level, as established in the Meetings Minutes), where Cumbaza River Watershed was excluded because it was evident that it would not have an economic effect. The report on the Majes and Camana rivers watersheds were delivered to OPI, and OPI official comments were received through

Preparatory study on the protection program for valleys and rural communities vulnerable to floods in Peru
Profile Study Report (Pre-feasibility level),Majes-Camana River
2-6
DGIH on April 26th, indicating that the performed study for these two watersheds did not meet the accuracy level required and it was necessary to study them again. Also, it was indicated to perform a single study for both rivers because they belong to a single watershed (Majes-Camana). On the other hand, due to the austerity policy announced on March 31st, prior to the new government assumption by new president on July 28th, it has been noted that it is extremely difficult to obtain new budget, DGIH has requested JICA on May 6th to perform the prefeasibility and feasibility studies of the Majes-Camana Watershed. JICA accepted this request and decided to perform the mentioned watershed study modifying for the second time the Meeting Minutes (refer to Meetings Minutes Second Amendment about the Initial Report, Lima, July 22nd, 2011) So, the JICA Study Team began in August the prefeasibility study for the watershed above mentioned, which was completed in late November. This report corresponds with the pre-feasibility study of the Majes-Camana watershed project, of Group B. The feasibility study wants to be finished by mid-January 2012, and the feasibility study for all selected watersheds around the same dates. Remember that DGIH processed on July 21st, the SNIP registration of four of the five watersheds from JICA (except Yauca), based on projects reports at pre-feasibility level (according to the watersheds). DHIG decided to discard Yauca River due to its low impact in economy. 2.4.2 Laws, regulations, policies and guidelines related to the Program This program has been elaborated following the mentioned laws and regulations, policies and guidelines: (1) Water Resources Law N° 29338 Article 75 .- Protection of water The National Authority, in view of the Watershed Council, must ensure for the protection of water, including conservation and protection of their sources, ecosystems and natural assets related to it in the regulation framework and other laws applicable. For this purpose, coordination with relevant government institutions and different users must be done. The National Authority, throughout the proper Watershed Council, executes supervision and control functions in order to prevent and fight the effects of pollution in the oceans, rivers and lakes. It can also coordinate for that purpose with public administration, regional governments

Preparatory study on the protection program for valleys and rural communities vulnerable to floods in Peru
Profile Study Report (Pre-feasibility level),Majes-Camana River
2-7
and local governments sectors. The State recognizes as environmentally vulnerable areas the headwater watersheds where the waters originate. The National Authority, with the opinion of the Environment Ministry, may declare protected areas the ones not granted by any right of use, disposition or water dumping. Article 119 .- Programs flood control and flood disasters The National Authority, together with respective Watershed Board, promotes integral programs for flood control, natural or manmade disasters and prevention of flood damages or other water impacts and its related assets. This promotes the coordination of structural, institutional and necessary operational measures. Within the water planning, the development of infrastructure projects for multi-sectorial advantage is promoted. This is considered as flood control, flood protection and other preventive measures. (2) Water Resources Law Regulation N° 29338 Article 118 .- From the maintenance programs of the marginal strip The Water Administrative Authority, in coordination with the Agriculture Ministry , regional governments, local governments and water user organizations will promote the development of programs and projects of marginal strips forestry protection from water erosive action. Article 259 º .- Obligation to defend margins All users have as duty to defend river margins against natural phenomenon effects, throughout all areas that can be influenced by an intake, whether it is located on owned land or third parties’ land. For this matter, the correspondent projects will be submitted to be reviewed and approved by the Water National Authority. (3) Water Regulation Article 49. Preventive measures investments for crop protection are less than the recovery and rehabilitation cost measures. It is important to give higher priority to these protective measures which are more economic and beneficial for the country, and also contribute to public expenses savings. Article 50. In case the cost of dikes and irrigation channels protection measures is in charge of family production units or it exceeds the payment capacity of users, the Government may pay part of this cost. (4) Multi-Annual Sectorial Strategic Plan of the Agriculture Ministry for the period 2007-2011 (RM N° 0821-2008-AG)

Preparatory study on the protection program for valleys and rural communities vulnerable to floods in Peru
Profile Study Report (Pre-feasibility level),Majes-Camana River
2-8
Promotes the construction and repair of irrigation infrastructure works with the premise of having enough water resources and their proper use. (5) Organic Law of the Agriculture Ministry, N° 26821 In Article 3, it is stipulated that the agricultural sector is responsible for executing river works and agricultural water management. This means that river works and water management for agricultural purposes shall be paid by the sector. (6) Guidelines for Peruvian Agricultural Policy - 2002, by the Policy Office of MINAG Title 10 - Sectorial Policies “Agriculture is a high risk productive activity due to its vulnerability to climate events, which can be anticipated and mitigated... The damage cost to infrastructure, crops and livestock can be an obstacle for the development of agriculture, and as consequence, in the deterioration of local, regional and national levels.” (7) River Channeling and Collection Structures Protection Program, PERPEC The MINAG’s DGIH started in 1999 the River Channeling and Collection Structures Protection Program (PERPEC) in order to protect communities, agricultural lands and facilities and other elements of the region from floods damages, extending financial support to margin protection works carried out by regional governments.

Preparatory study about the protection program for valleys and rural communities vulnerable to floods in Peru
Profile Study Report (Pre-feasibility level),Majes-Camana River
3-1
3. IDENTIFICATION
3.1 Diagnosis of the current situation
3.1.1 Nature
(1) Location
Figure 3.1.1-1 shows the location map of the Majes – Camana River
Figure 3.1.1-1 Objective River for the Study
(2) Watershed overall description
The Majes – Camana River runs 700 m to the south of the Capital of Lima. It is the river running at the most southern point of all the rivers object of the present Study and belongs to the Arequipa Region. The watershed surface is of 17,000 km2 approximately and 60% of it is

Preparatory study about the protection program for valleys and rural communities vulnerable to floods in Peru
Profile Study Report (Pre-feasibility level),Majes-Camana River
3-2
located above 4,000 m.a.s.l. The area object of the Project is approximately 100km from the river mouth, which is below 2,000 m.a.s.l, representing 20% of the total surface of the watershed.
The limit between Majes and Camana is located approximately 40 km from the rivers’ mouth. From this point downstream the river is called “Camana” and “Majes” from this limit upstream. The slope of the riverbed is approximately 1/200 in Camana and 1/100 in Majes. Its width varies between 100 and 200 meters in Camana and between 200 and 500 meters in Majes. The river is wider in the upper part because, while in the lower part (Camana) the water course has been stabilized with dikes built by the irrigation commission, in the upper watershed (Majes) there are no sufficient dikes constructed.
Annual rainfalls show a clear tendency to increase in upper areas. This trend is such that they are of approximately 50 mm below 1,000 m.a.s.l and more than 500 mm above 4,000 m.a.s.l The flow is abundant and the superficial water (fluvial) does not run out even in dried seasons.
As to vegetation, upper areas of more than 4,000 m.a.s.l represent 60% of the total area are covered by wetlands, while the lower areas below 2,000 m.a.s.l are desert. Flat lands along the river are being used, mostly for agriculture, particularly for irrigated rice crops.
3.1.2 Socio-economic conditions of the Study Area
(1) Administrative Division and Surface
The Majes – Camana River is located in the provinces of Castilla and Camana in the Arequipa Region. Table 3.1.2-1 shows the main districts surrounding this river, with their corresponding surface.
Table 3.1.2-1 Districts surrounding the Majes – Camana River with areas Region Province District Area (Km2)
Uraca 713.83Aplao 640.04Huancarqui 803.65Camana 11.67Nicolas de Pierola 391.84Mariscal Caceres 579.31Samuel Pastor 113.4Jose Maria Quimper 16.72
Arequipa
Castilla
Camana
(2) Population and number of households
The following Table 3.1.2-2 shows how population varied within the period 1993-2007. In 2007, from 44,175 inhabitants, 91% (40,322 inhabitants) lived in urban areas while 9% (3,853 inhabitants) lived in rural areas.
Population is increasing in all districts. However, while the urban area registers an annual medium increase of 2.8% to 3.4%, exceeding the national average, the rural area experiments a decrease of -1.3% to -6.6%.

Preparatory study about the protection program for valleys and rural communities vulnerable to floods in Peru
Profile Study Report (Pre-feasibility level),Majes-Camana River
3-3
Table 3.1.2-2 Variation of the urban and rural population
Urban % Rural % Total Urban % Rural % Total Urban Rural
Uraca 2,664 37% 4,518 63% 7,182 1,953 29% 4,698 71% 6,651 2.20% -0.30%
Aplao 4,847 45% 4,004 55% 8,851 2,928 35% 5,334 65% 8,262 3.70% -2.00%
Huancarqui 1,191 18% 254 82% 1,445 1,047 65% 555 35% 1,602 0.90% -5.40%
8,702 49.80% 8,776 50.20% 17,478 5,928 36% 10,587 64% 16,515 2.80% -1.30%
Camana 14,642 1% 116 99% 14,758 13,284 94% 809 6% 14,093 0.70% -13.00%
Nicolas de Pierola 5,362 88% 703 12% 6,065 4,688 88% 613 12% 5,301 1.00% 1.00%
Mariscal Caceres 4,705 86% 758 14% 5,463 2,562 67% 1,253 33% 3,815 4.40% -3.50%
Samuel Pastor 12,004 91% 1,138 9% 13,142 2,285 26% 6,501 74% 8,786 12.60% -11.70%
Jose Maria Quimper 3,609 76% 1,138 24% 4,747 2,426 74% 870 26% 3,296 2.90% 1.90%
40,322 91.30% 3,853 8.70% 44,175 25,245 72% 10,046 28% 35,291 3.40% -6.60%
Variation (%)
Castilla
Total
Camana
Total
Province District2007 Total Population 1993 Total Population
Source: Prepared by JICA Study Team, Statistics National Institute- INEI, 2007 and 1993 Population and Housing Census.
Table 3.1.2-3 -4 shows the number of households and members per home in 2007. Apparently
Huancarqui has fewer members per household (3.36 persons) while Jose Maria Quimper has a greater number with 4.4; remaining districts vary between 3,6 and 4,1 persons.
The number of members per family is around 4,1 persons, with exception of Nuevo Imperial, with a lower Figure of 3.77.
Table 3.1.2-3 Number of households and families in Castilla
Uraca Aplao HuancarquiPopulation (inhabitants) 7,182 8,851 1,445Number of households 1,760 2,333 430Number of families 1,887 2,416 434Members per household (persons/household) 4.08 3.79 3.36Members per family (persons/family) 3.81 3.66 3.33
VariablesDistrict
Table 3.1.2-4 Number of households and families in Camana
Population (inhabitants) 14,758 6,065 5,463 13,142 4,747Number of households 3,845 1,680 1,394 3,426 1,078Number of families 4,066 1,738 1,448 3,554 1,108Members per household (persons/household 3.84 3.61 3.92 3.84 4.4Members per family (persons/family) 3.63 3.49 3.77 3.7 4.28
VariablesDistrict
Camana Nicolas de Pierola
Mariscal Caceres
Samuel Pastor
Jose Maria Quimper
(3) Occupation
Table 3.1.2-5, shows occupation lists of local inhabitants itemized by sector. It highlights the primary sector in all districts representing between 23 and 65% of the
economically active population (EAP).

Preparatory study about the protection program for valleys and rural communities vulnerable to floods in Peru
Profile Study Report (Pre-feasibility level),Majes-Camana River
3-4
Table 3.1.2-5 Occupation in Castilla
persons % Persons % Persons %Economically Active Pop. 1/ 3,343 100 3,618 100 649 100
a) Primary sector 2,174 65.03 1,966 54.34 413 63.64b) Secondary sector 160 4.79 251 6.94 40 6.16c) Tertiary sector 1,009 30.18 1,401 38.72 196 30.2
Source: National Institute of Statistics - INEI, 2007 Population and Housing Census.1/ Primary sector: agriculture, livestock, forest and fishery; secondary: mining, construction, manufacturing; tertiary: services and others
EAP Uraca Aplao Huancarqui
Table 3.1.2-6 Occupation in Camana
persons % persons % persons % persons % persons %Economically Active Pop. 1/ 5,237 100 6,292 100 1,463 100 1,888 100 2,348 100a) Primary sector 1,749 33 1,469 23 548 37 1,181 63 1,125 48b) Secondary sector 624 12 473 8 127 9 88 5 167 7c ) Tertiary sector 2,864 55 4,350 69 788 54 619 33 1,056 45Source: National Institute of Statistics –INEI, 2007 Population and Housing.1/ Primary sector: agriculture, livestock, forest and fishery; secondary: mining, construction, manufacturing; tertiary: services and others
PEADistrict
Samuel Pastor Camana Jose Maria Quimper Mariscal Cáceres Nicolas de Pierola
(4) Poverty index
Table 3.1.2-7, -8 shows the poverty index. 25 % to 27 % of the districts’ population belongs to the poor segment, and 3.8% to 4.4% belong to extreme poverty. Particularly, the Huancarqui district stands out for its high poverty percentage with 33.1%, and 6,9% of extreme poverty.
Table 3.1.2-7 Poverty index in Castilla
Persons % Persons % Persons % Persons %
Total Population (inhab.) 8,851 1,445 7,182 17,478.00 100
Poor 2,153 24.3 480 33.1 1,731 24.1 4,364 25
Extreme Poverty 358 4.1 98 6.9 305 4.3 761 4.4
Variable /Indicator
District (Castilla)
Aplao Huancarqui Uraca Total
Table 3.1.2-8 Poverty index in Camana
Persons % Persons % Persons % Persons % Persons % Persons %
Total Population (inhab) 5,463 13,142 6,065.00 4,747.00 14,758.00 44,175.00 100
Poor 1,927 35.2 4,410.00 33.5 1,494.00 24.6 979 24.9 3,013.00 20.4 11,823 26.8
Extreme Poverty 391 7.4 629 4.9 221 3.8 140 3.7 303 2.1 1,684 3.8
Variable /Indicator
District (Canana)
Mariscal Caceres Samuel pastor Nicolas de Pierola Jose Maria Quimper Camana Total

Preparatory study about the protection program for valleys and rural communities vulnerable to floods in Peru
Profile Study Report (Pre-feasibility level),Majes-Camana River
3-5
(5) Type of housing
Tables 3-1.2-9 and 3-1.2-10 show data on Castilla and Camana housing. The walls of the houses in Castilla are made 46% of bricks or cement, and 43% of adobe and mud. The floor is made 96% of earth or cement. The public drinking water service covers 50%, while the sewage service is scarcely 45.5% in Huancarqui. The average electrification rate is 86%.
In Camana, walls are made 65% bricks or cement, and 4% with adobe and mud. The floor is made
of 98% earth or cement. The public drinking water service covers more than 50% while the sewage service is less than 50%, with exception of Camana. The average electrification rate is 84%.
Table 3.1.2-9 Type of housing in Castilla
Households % Households % Households %
Number of Households
Common houses with residents 1,760 86 2,333 75.3 430 63
Wall material
Brick or cement 999 56.8 820 35.1 106 24.7
Adobe and mud 195 11.1 1,067 45.7 237 55.1
With walls of quincha and wood 521 29.6 332 14.2 78 18.1
Other 45 2.6 114 4.9 9 2.1
Floor material
Earth 687 39 831 35.6 195 45.3
Cement 996 56.6 1,381 59.2 226 52.6
Tile, terrazzo tile, parquet or polished wood, wood, boards 71 4 106 4.5 7 1.6
Other 6 0.3 15 0.6 2 0.5
Drinking water system
Public service in the house 1,216 69.1 1,483 63.6 255 59.3
Public service out of the house but within the building 86 4.9 228 9.8 20 4.7
Public sink 115 6.5 34 1.5
Sewage and latrine service
Public sewage service in the house 472 26.8 705 30.2 193 44.9
Public sewage service within the building 26 1.5 58 2.5 4 0.9
Cesspit/ latrine 753 42.8 875 37.5 153 35.6
Houses with lighting system
Public network 1,505 85.5 1,790 76.7 340 79.1
HOUSEHOLD
Households in special houses with present occupants 1,887 100 2,416 100 434 100
Head of household
Man 1,477 78.3 1,839 76.1 335 77.2
Woman 410 21.7 577 23.9 99 22.8
Home appliances
Has three or more home appliances or equipment 541 28.7 683 28.3 113 26
Information and communication service
Has landline telephone or mobile 1,353 71.7 1,301 53.8 242 55.8
Variable/IndicatorDistricts
Uraca Aplao Huancarqui
Source: Prepared by JICA Study Team, Statistics National Institute- INEI, 2007 Population and Housing Census.

Preparatory study about the protection program for valleys and rural communities vulnerable to floods in Peru
Profile Study Report (Pre-feasibility level),Majes-Camana River
3-6
Table 3.1.2-10 Type of housing in Camana
Households % Households % Households % Households % Households
Number of Households
Common houses with residents 3,426 69.7 3,845 90.7 1,078 74.7 1,394 70 1,680
Wall material
Brick or cement 1,956 57.1 2,942 76.5 674 62.5 664 47.6 986
Adobe and mud 66 1.9 175 4.6 20 1.9 28 2 78
With walls of quincha and wood 716 20.9 427 11.1 226 21 172 12.3 419
Other 688 20.1 301 7.8 158 14.7 530 38 197
Floor material
Earth 1,780 52 961 25 487 45.2 841 60.3 792
Cement 1,432 41.8 2,335 60.7 547 50.7 530 38 806
Tile, terrazzo tile, parquet or polished wood, wood, boards 154 4.5 514 13.4 38 3.5 16 1.1 70
Other 60 1.8 35 0.9 6 0.6 7 0.5 12
Drinking water system
Public service in the house 1,987 58 3,028 78.8 732 67.9 774 55.5 957
Public service out of the house but within the building 231 6.7 236 6.1 108 10 160 11.5 323
Public sink 851 24.8 164 4.3 13 1.2 9 0.6 57
Sewage and latrine service
Public sewage service in the house 1,466 42.8 2,816 73.2 181 16.8 243 17.4 778
Public sewage service within the building 104 3 246 6.4 24 2.2 5 0.4 208
Cesspit/latrine 1,144 33.4 360 9.4 526 48.8 763 54.7 463
Houses with lighting system
Public network 2,734 79.8 3,556 92.5 935 86.7 1,017 73 1,284
HOUSEHOLD
Households in special houses with present occupants 3,554 100 4,066 100 1,108 100 1,448 100 1,738
Home appliances
Has three or more home appliances or equipment 997 28.1 1,902 46.8 360 32.5 304 21 524
Information and communication service
Has landline telephone or mobile 2,297 64.6 3,586 88.2 790 71.3 654 45.2 1,073
Variable/Indicador Samuel Pastor Camana Jose Maria Quimper Mariscal Caceres Nicolas d
Source: Prepared by JICA Study Team, Statistics National Institute–INEI, 2007 Population and Housing Census.

Preparatory study about the protection program for valleys and rural communities vulnerable to floods in Peru
Profile Study Report (Pre-feasibility level),Majes-Camana River
3-7
(6) GDP
Peru’s GDP in 2009 was S./392,565,000,000. The growth rate in the same year was of + 0.9 % compared with the previous year with the
poorest level within 11 years. Itemized by regions, Ica registered a growth of 3,8 %, Piura 2.0 %, Lima 0.4 % and Arequipa
0.2 %. Particularly Ica and Piura regions registered Figures that were beyond the national average.
INEI Source – National Accounts National Direction
Figure 3.1.2-1 Growth rate of GDP per region (2009/2008)
The table below shows the contribution of each region to the GDP. Lima Region represents almost half of the total, that is to say 44.8%. Arequipa contributed with 5.3 %, Piura 4.6 % and Ica 2.9 %. Taxes and duties contributed with 7.2 % and 0.4 %, respectively.

Preparatory study about the protection program for valleys and rural communities vulnerable to floods in Peru
Profile Study Report (Pre-feasibility level),Majes-Camana River
3-8
INEI Source – National Accounts National Direction
Figure 3.1.2-2 Region contribution to GDP
The GDP per capita in 2009 was of S/.13,475. The Table below shows data per region: Lima S/.17,800, Arequipa S/.17,200, Ica S/.15,600 and Piura S/.10,200. The first three regions exceeded the national average, with exception of Piura.
INEI Source – National Accounts National Direction
Figure 3.1.2-3 GDP per capita (2009)

Preparatory study about the protection program for valleys and rural communities vulnerable to floods in Peru
Profile Study Report (Pre-feasibility level),Majes-Camana River
3-9
Table 3.1.2-7 shows the variation along the years of the GDP per capita per region, during the last 9 years (2001-2009). The GDP national average increased in 44% within nine years from 2001 until 2009. The Figures per region are: +83.9 % for Ica, +54.2 % for Arequipa, +48.3 % for Piura y +42.9 % for Lima. Figures in Table 3.1.2-11 were established taking 1994 as base year.
Table 3.1.2-11 Variation of the GDP per capita (2001-2009) (1994 Base year, S/.)
INEI Source – National Accounts National Direction
3.1.3 Agriculture
Next is a summarized report on the current situation of agriculture in the Watershed of the Majes – Camana River, including irrigation commissions, crops, planted area, performance, sales, etc.
(1) Irrigation Sectors
Table 3.1.3-1 and 3.1.3-2 shows basic data on the irrigation commissions of the Majes River and the Camana River, respectively. In the first one there are 45 irrigation sectors, 17 irrigation commissions with 2,519 beneficiaries. The surface managed by these sectors reach a total of 7,505 hectares.
In the watershed of the Camana River there are 38 irrigation sectors, 17 irrigation commissions with 3,388 beneficiaries. The surface managed by these sectors amounts 6,796 hectares.

Preparatory study about the protection program for valleys and rural communities vulnerable to floods in Peru
Profile Study Report (Pre-feasibility level),Majes-Camana River
3-10
Table 3.1.3-1 Basic data of the irrigation commissions in the Majes River No de
Beneficiaries
ha % (Person)
Las Joyitas Las Palmas 8.08 0.11% 4
Andamayo 94.35 1.26% 25
Luchea 35.26 0.47% 24
Ongoro 368.13 4.91% 65
Huatiapilla 367.26 4.89% 75
La Central 406.57 5.42% 66
El Castillo 623.05 8.30% 73
La Banda 4.15 0.06% 3
Jaran 3.52 0.05% 6
Huanco Iquiapaza 4.46 0.06% 11
Huatiapilla Baja 103.62 1.38% 23
Alto Huatiapa 44.47 0.59% 20
Bajo Huatiapa 19.11 0.25% 8
Quiscay 17.84 0.24% 1
San Isidro 10.53 0.14% 3
Beringa 109.07 1.45% 80
La Collpa 14.93 0.20% 14
Huancarqui 342.56 4.56% 211
Cosos Cosos 125.43 1.67% 92
Aplao 232.26 3.09% 145
Bajos Aplao 11.50 0.15% 5
Caspani 20.54 0.27% 18
La Real 172.07 2.29% 125
Monte los Apuros Monte los Apuros 370.86 4.94% 160
Alto Maran Trapiche 131.78 1.76% 53
La Revilla Valcarcel 151.01 2.01% 50
Tomaca 296.32 3.95% 54
El Rescate 92.34 1.23% 41
Uraca Uraca 688.81 9.18% 239
Alto Cantas 162.87 2.17% 74
Bajo Cantas 147.09 1.96% 47
Sogiata Sogiata 522.66 6.96% 154
San Vicente 230.68 3.07% 100
Caceres 57.31 0.76% 12
Pitis 93.10 1.24% 53
Escalerillas 155.61 2.07% 74
Sarcas Toran 777.69 10.36% 195
Hinojosa Pacheco 1.00 0.01% 2
Medrano 12.29 0.16% 7
La Cueva 6.24 0.08% 6
Callan Jaraba 37.91 0.51% 10
Sahuani 58.47 0.78% 17
Paycan 24.44 0.33% 6
Vertiente 2.29 0.03% 3
El Granado El Granado 345.45 4.60% 65
7,504.98 100% 2,519Total
Ongoro
Ongoro Bajo
Beringa
Huancarqui
Aplao
La Real
Querulpa
Tomaca
Cantas Pedregal
San Vicente
Pitis
Sarcas Toran
Majes
Irrigation Commissions Irrigation sectors Irrigated areas River
Source: Prepared by JICA Study Team, Users Board of Camana-Majes, September 2011

Preparatory study about the protection program for valleys and rural communities vulnerable to floods in Peru
Profile Study Report (Pre-feasibility level),Majes-Camana River
3-11
Table 3.1.3-2 Basic data of irrigation commissions in the Camana River No de
Beneficiaries
ha % (Person)
Huamboy 28.23 0.42% 8
Puccor 13.30 0.20% 2
Pillistay 13.91 0.20% 6
Nueva Esperanza 27.31 0.40% 19
Socso 52.97 0.78% 15
Socso Medio 21.27 0.31% 12
Casias-Sillan 45.32 0.67% 20
Sonay Sonay 110.48 1.63% 34
Pisques Pisques 86.82 1.28% 39
Soto 16.29 0.24% 4
Characta 174.35 2.57% 54
Naspas-Pampata 130.31 1.92% 21
Pampata-Baja 164.77 2.42% 27
Tirita 15.67 0.23% 12
Montes Nuevos 49.41 0.73% 26
La Bombon 402.38 5.92% 265
Gordillo 8.14 0.12% 9
La Era 1.44 0.02% 4
La Rama Era I 45.53 0.67% 37
Toma Davila 58.20 0.86% 11
El Alto El Alto 314.57 4.63% 128
Los Molinos Los Molinos 435.97 6.41% 295
El Medio 477.98 7.03% 231
Los Castillos 44.36 0.65% 48
Flores 4.73 0.07% 5
El Desague 45.56 0.67% 55
La Lurin 17.35 0.26% 11
La Chingana 51.27 0.75% 33
La Valdivia 323.86 4.77% 196
La Deheza La Deheza 336.71 4.95% 228
La Gamero La Gamero 356.04 5.24% 257
El Molino El Molino 370.29 5.45% 302
El Cuzco El Cuzco 290.02 4.27% 261
Montes Nuevos Montes Nuevos 192.46 2.83% 123
Huacapuy Huacapuy 23.12 0.34% 21
Mal Paso-Sta. Elizabeth 1070.90 15.76% 296
1er y 2do Canal Aereo 872.79 12.84% 202
Jahuay 102.11 1.50% 71
6,796.19 100% 3,388
Pampata
Total
Socso-Sillan
Characta
La Bombon
El Medio
La Valdivia
Pucchun
Camana
Irrigation Commission Irrigation Sectors Irrigated areas River
Source: Prepared by JICA Study Team, Users Board of Camana-Majes, September 2011

Preparatory study about the protection program for valleys and rural communities vulnerable to floods in Peru
Profile Study Report (Pre-feasibility level),Majes-Camana River
3-12
(2) Main crops
Table 3.1.3-3 shows the variation between 2004 and 2009 of the planted surface and the performance of main crops.
In the Majes – Camana River Watershed, in 2004 the planted area, performance and sales decreased, but later increased so that during the period 2008-2009 profits were of S/.188,596,716. Main crops in this watershed were represented by: rice, beans, onions, corn and pumpkins.
Table 3.1.3-3 Sowing and sales of main crops
Sown surface (ha) 6,216 6,246 6,211 6,212 6,224
Unit performance (kg/Ha) 12,041 13,227 12,841 13,370 13,823
Harvest (Kg) 74,844,450 82,617,571 79,753,422 83,057,334 86,032,532
Unit price (S/./kg) 0.92 0.65 0.80 1.10 0.70
Sales (S/.) 68,868,814 53,701,421 63,802,738 91,354,778 60,222,772
Sown surface (ha) 4,458 4,433 3,947 4,045 3,886
Unit performance (kg/Ha) 1,630 1,660 1,745 1,743 1,920
Harvest (Kg) 7,264,349 7,359,607 6,888,684 7,051,876 7,460,849
Unit price (S/./kg) 2.93 2.44 3.03 4.12 3.85
Sales (S/.) 21,304,797 17,970,689 20,888,054 29,058,175 28,746,981
Sown surface (ha) 2,063 1,958 2,168 2,331 1,886
Unit performance (kg/Ha) 40,552 32,073 41,231 46,034 35,840
Harvest (Kg) 83,659,519 62,798,588 89,388,731 107,304,225 67,594,277
Unit price (S/./kg) 0.58 0.38 0.71 0.43 1.37
Sales (S/.) 48,800,305 24,067,447 63,582,270 46,002,256 92,290,918
Sown surface (ha) 50 30 34 618 558
Unit performance (kg/Ha) 4,192 3,500 3,680 5,670 4,580
Harvest (Kg) 209,600 105,000 125,120 3,503,916 2,555,501
Unit price (S/./kg) 0.85 0.80 1.00 0.90 0.75
Sales (S/.) 178,160 84,000 125,120 3,153,524 1,918,916
Sown surface (ha) 193 223 217 129 159
Unit performance (kg/Ha) 29,341 34,419 32,869 40,346 42,789
Harvest (Kg) 5,662,900 7,675,350 7,132,607 5,204,624 6,803,456
Unit price (S/./kg) 0.36 0.30 0.30 0.41 0.26
Sales (S/.) 2,056,542 2,295,721 2,123,348 2,154,472 1,786,014
Sown surface (ha) 55 35 38 29 44
Unit performance (kg/Ha) 60,800 59,435 59,962 60,675 58,332
Harvest (Kg) 3,344,000 2,080,242 2,278,540 1,759,566 2,566,613
Unit price (S/./kg) 0.08 0.10 0.10 0.10 0.25
Sales (S/.) 267,520 208,024 227,854 175,957 633,487
Sown surface (ha) 51 40 27 19 51
Unit performance (kg/Ha) 16,980 17,694 18,053 18,201 18,223
Harvest (Kg) 865,998 707,742 487,426 345,824 929,377
Unit price (S/./kg) 0.30 0.40 0.61 0.32 0.58
Sales (S/.) 259,799 283,097 296,066 111,028 536,123
Sown surface (ha) 39 38 22 22 65
Unit performance (kg/Ha) 31,538 26,368 27,866 27,524 32,091
Harvest (Kg) 1,230,000 1,002,000 613,045 605,531 2,085,916
Unit price (S/./kg) 0.50 0.50 0.46 0.83 0.63
Sales (S/.) 615,000 501,000 281,443 500,939 1,310,597
Sown surface (ha) 5 45 36 11 48
Unit performance (kg/Ha) 29,000 38,951 30,584 34,963 36,310
Harvest (Kg) 145,000 1,752,790 1,101,025 384,597 1,742,875
Unit price (S/./kg) 0.50 0.38 0.73 0.45 0.41
Sales (S/.) 72,500 662,165 804,360 173,418 714,942
Sown surface (ha) 29 30 13 14 40
Unit performance (kg/Ha) 9,862 17,265 12,920 13,087 13,718
Harvest (Kg) 286,000 517,938 167,960 183,218 548,708
Unit price (S/./kg) 0.30 0.40 0.40 0.47 0.80
Sales (S/.) 85,800 207,175 67,184 86,112 438,966
Otros Sown surface (ha) 95 153 204 190 116
Sown surface (ha) 13,254 13,231 12,917 13,620 13,077
Harvest (Kg) 177,511,816 166,616,828 187,936,560 209,400,711 178,320,104
Sales (S/.) 142,509,238 99,980,740 152,198,437 172,770,659 188,599,716
Sweet Corn
Potato
Tomato
Watermelon
Total
2006-2007 2008-2009
Paddy Rice
Dried beans
Onion
2007-2008
Chala Corn
Pumpkin
Variables 2004-2005 2005-2006
Corn

Preparatory study about the protection program for valleys and rural communities vulnerable to floods in Peru
Profile Study Report (Pre-feasibility level),Majes-Camana River
3-13
Figure 3.1.3-1 Planted Surface
Figure 3.1.3-2 Harvest
Figure 3.1.3-3 Sales

Preparatory study about the protection program for valleys and rural communities vulnerable to floods in Peru
Profile Study Report (Pre-feasibility level),Majes-Camana River
3-14
3.1.4 Infrastructure
(1) Road Infrastructures
Table 3.1.4-1 shows road infrastructures in the watershed of the Majes River. In total there are 981.291 km of roads, 282.904 km of them (28.8 %) are national roads, 208.163 km (21.2 %) regional roads, and 490.223 km (50.0 %) municipal roads.
Table 3.1.4-2 shows road infrastructures in the watershed of the Camana River. In total there are 574,039 km of roads, 143.608 km of them (25.0 %) area national roads, 365.940 km (63.8 %) regional roads, and 64.491 km (11.2 %) municipal roads.
Table 3.1.4-1 Basic data of road infrastructure in the Majes River
Asphalted Trail Road Gravel Road PathNational Road 282.904 28.83% 64.400 173.842 44.662
Regional roads 208.164 21.21% 2.727 205.437
Municipal roads
490.223 49.96% 10.321 479.902
Total 981.291 100.00% 64.400 184.163 2.727 685.339
Roads Total Length (Km)Paving (Km)
Table 3.1.4-2 Basic data of road infrastructure in the Camana River
Asphalted Trail Road Gravel Road PathNational Road 143.608 25.02% 114.748 28.860
Regional roads 365.940 63.75% 16.100 82.610 267.230
Municipal roads
64.491 11.23% 1.040 6.677 56.774
Total 574.039 100.00% 131.888 118.147 324.004
Roads Total Length (Km)Paving (Km)
(2) Irrigation systems
Table 3.1.4-3 shows data on existing irrigation systems in watershed of the Majes - Camana River. There are 58 water inlets and 79 water direct inlets. Besides, there are 58 main channels, 128 primary ones, 54 secondary and 5 tertiary. Main channels have an accumulated length of 167.24 km. Lagged channels amount 3.498 km, while 334.019 km have no lagging. (3) PERPEC
Table 3.1.4-4 shows implemented projects by PERPEC between 2006 and 2009.

Prep
arat
ory
stud
y ab
out t
he p
rote
ctio
n pr
ogra
m fo
r va
lleys
and
rura
l com
mun
ities
vul
nera
ble
to fl
oods
in P
eru
P
rofi
le S
tudy
Rep
ort (
Pre
-fea
sibi
lity
leve
l),M
ajes
-Cam
ana
Riv
er
3-15
Tabl
e 3.
1.4-
3 Pr
esen
t con
ditio
ns o
f irr
igat
ion
chan
nels
Nu
mbe
rNu
mbe
rLo
ng. d
e
ofof
Dire
ctC.
D.La
gged
Rust
ic
Wat
er In
lets
Wat
er In
lets
Hous
ing
inle
tsN°
of s
luic
egat
esLa
tera
l inl
ets
N° o
f slu
iceg
ates
(Km
s.)
(Km
s.)
(Km
s.)
55
6335
2525
525
60
30.0
640.
363
69.6
00
36
490
40
34
10
9.84
10.
600
11.5
86
20
290
20
22
00
5.53
00.
000
7.88
0
12
370
40
14
30
3.97
60.
000
9.14
0
10
472
62
16
10
5.93
30.
000
9.66
0
20
391
101
210
30
7.40
10.
000
20.4
83
30
360
100
310
122
7.65
30.
000
29.1
80
30
470
10
31
00
6.66
40.
000
7.60
4
20
710
90
29
31
6.50
80.
360
12.8
84
04
00
00
00
00
0.00
00.
000
0.00
0
11
662
71
17
51
4.94
10.
000
16.7
66
08
00
00
00
00
0.00
00.
000
0.00
0
52
782
40
54
00
7.43
90.
000
10.4
57
43
710
30
43
00
5.22
50.
000
6.94
4
10
349
31
13
71
7.93
00.
090
20.8
86
823
480
10
81
10
8.01
10.
000
8.61
6
10
420
80
18
20
7.65
00.
000
16.9
20
09
00
00
00
00
0.00
00.
000
0.00
0
10
260
73
17
20
3.92
50.
000
9.65
5
22
210
00
20
00
3.10
00.
000
3.10
0
20
334
61
26
40
4.77
02.
085
15.5
12
20
970
50
25
10
6.25
20.
000
11.3
85
11
80
00
10
00
0.16
00.
000
0.16
0
62
762
80
68
20
18.8
010.
000
28.4
12
111
100
00
10
00
0.94
00.
000
0.94
0
10
150
30
13
10
4.52
60.
000
6.24
9
5879
1,04
357
126
3458
126
545
167.
240
3.49
833
4.01
9
SARC
AS -
TORA
N
EL G
RANA
DO TO
TAL
QUE
RULP
A
URAC
A
SOG
IATA
SAN
VICE
NTE
CANT
AS P
EDRE
GAL
PITI
S
MO
NTE
LOS
PURO
S
1er.
2do.
3er.
ONG
ORO
ONG
ORO
BAJ
O
BERI
NGA
COSO
S
APLA
O
HUAN
CARQ
UI
TOM
ACA
LA R
EAL
IRRI
GAT
ION
COM
MIS
SIO
NN°
of I
ntak
es a
nd s
luic
egat
es a
t CD
leve
lNu
mbe
r of c
hann
els
Tota
l Sys
tem
Len
gth
C.D.

Prep
arat
ory
stud
y ab
out t
he p
rote
ctio
n pr
ogra
m fo
r va
lleys
and
rura
l com
mun
ities
vul
nera
ble
to fl
oods
in P
eru
P
rofi
le S
tudy
Rep
ort (
Pre
-fea
sibi
lity
leve
l),M
ajes
-Cam
ana
Riv
er
3-16
Ta
ble
3.1.
4-4
Proj
ects
impl
emen
ted
by P
ER
PEC
Dep
arta
men
tP
rovi
nce
Dis
tric
tT
ow
n
120
06A
requ
ipa
Cam
ana
Oco
ñaH
uant
ayC
onfo
rmac
ion
de D
ique
0.27
Km
150,
000.
00
220
06A
requ
ipa
Cas
tilla
Apl
ao y
Ura
caE
l Gra
nado
Roc
kfill
Dik
e0.
2K
m.
607,
186.
00
320
06A
requ
ipa
Cam
ana
Qui
lca
El P
lata
nal
Con
form
acio
n de
Diq
ue0.
36K
m.
81,3
05.0
0
420
06A
requ
ipa
Cas
tilla
Apl
aoE
l Mon
teC
onfo
rmac
ion
de D
ique
0.34
Km
.96
,000
.00
520
06A
requ
ipa
Cam
ana
Mar
iano
Nic
olas
V
alca
rcel
Jayh
uich
eR
ockf
ill D
ike
0.27
Km
.14
9,99
2.00
620
06A
requ
ipa
Cam
ana
Oco
ñaZ
urita
Con
form
acio
n de
Diq
ue0.
3K
m.
151,
484.
00
720
06A
requ
ipa
Cam
ana
Oco
ñaS
anta
Rita
Con
form
acio
n de
Diq
ue0.
3K
m.
149,
487.
00
820
07A
requ
ipa
Cas
tilla
Apl
ao, H
uanc
arqu
iQ
ueru
lpa
Tom
aca
Bre
akw
ater
with
Roc
k0.
67K
m38
0,23
3.00
920
07A
requ
ipa
Cam
ana
Qui
lca
El P
lata
nal
Bre
akw
ater
with
Roc
k0.
42K
m25
9,17
4.00
1020
08A
requ
ipa
Cas
tilla
Apl
aoLo
s P
uros
Con
stru
ctio
n of
Dik
e an
d B
reak
wat
ers
0.18
Km
117,
215.
00
1120
08A
requ
ipa
Cam
ana
Oco
ñaS
anta
Rita
Con
stru
ctio
n of
Dik
e an
d B
reak
wat
ers
0.23
Km
97,0
66.0
0
1220
08A
requ
ipa
Cas
tilla
U
raca
San
Vic
ente
y
Sac
ram
ento
Con
stru
ctio
n of
Dik
e an
d B
reak
wat
ers
0.3
Km
124,
952.
00
1320
08A
requ
ipa
Cam
ana
Nic
olas
de
Pie
rola
S
onay
Des
colm
atac
ion
y co
nfor
mac
ion
de d
ique
0.4
Km
230,
058.
00
1420
08A
requ
ipa
Cam
ana
Oco
ñaH
uanc
anR
ockf
ill D
ike
0.26
Km
123,
352.
00
1520
08A
requ
ipa
Cam
ana
Oco
ñaH
uant
ayR
ockf
ill D
ike
0.28
Km
117,
348.
00
Con
stru
ctio
n of
Coa
stal
Def
ense
- Q
uilc
a V
alle
y S
ecto
r
Maj
es R
iver
Coa
stal
Def
ense
- M
onte
s S
ecto
r
Con
stru
ctio
n of
Coa
stal
Def
ense
- O
coña
Val
ley,
Jay
huic
he S
ecto
r
Con
stru
ctio
n of
roc
kfill
dik
e -
Zur
ita S
ecto
r
Con
stru
ctio
n of
Coa
stal
Def
ense
- O
coña
Val
ley,
San
ta R
ita S
ecto
r
Con
stru
ctio
n of
Pro
visi
onal
Coa
stal
Def
ense
Con
stru
cció
n in
the
Maj
es R
iver
- L
os
Pur
os S
ecto
r, A
plao
Dis
tric
t, P
rovi
nce
of C
astil
la -
Are
quip
a (
Con
tinge
ncy)
Con
stru
ctio
n of
Pro
visi
onal
Coa
stal
Def
ense
in th
e O
coña
Riv
er -
San
ta R
ita
Sec
tor,
Oco
ña D
istr
ict,
Pro
vinc
e of
Cam
ana
- A
requ
ipa
(Con
tinge
ncy)
Con
stru
ctio
n of
Pro
visi
onal
Coa
stal
Def
ense
in th
e M
ajes
Riv
er -
San
Vic
ente
and
S
acra
men
to S
ecto
rs, U
raca
Dis
tric
t, P
rovi
nce
of C
astil
la -
Are
quip
a (
Con
tinge
ncy)
Con
stru
ctio
n of
roc
kfill
dik
e -
Son
ay S
ecto
r (P
reve
ntio
n)
Con
stru
ctio
n of
coa
stal
def
ense
- A
ncha
lo H
uaca
n S
ecto
r -
Oco
ña V
alle
y
(Pre
vent
ion)
Con
stru
ctio
n of
Roc
kfill
Dik
e -
Hua
ntay
Sec
tor
- O
coña
Val
ley
(Pre
vent
ion)
Con
stru
ctio
n of
coa
stal
def
ense
- Q
ueru
lpa
Tom
aca
Sec
tors
Con
stru
ctio
n of
dik
e w
ith b
reak
wat
ers
- E
l Pla
tana
l Sec
tor,
Qui
lca
Dis
tric
t, P
rovi
nce
of C
aman
a -
Are
quip
a
To
tal C
ost
(S
/.)
Con
stru
ctio
n of
a R
ockf
ill D
ike
- H
uant
ay S
ecto
r
Con
stru
ctio
n of
bre
akw
ater
s an
d ro
ckfil
l dik
es in
the
Maj
es V
alle
y
Nº
YEAR
Wo
rkL
oca
tio
nD
escr
ipti
on

Preparatory study about the protection program for valleys and rural communities vulnerable to floods in Peru
Profile Study Report (Pre-feasibility level),Majes-Camana River
3-17
3.1.5 Real flood damages
(1) Damages on a nationwide scale
Table 3.1.5-1 shows the present situation of flood damages during the last five years (2003-2007) in the whole country. As observed, there are annually dozens to hundreds of thousands of flood affected inhabitants.
Table 3.1.5-1 Situation of flood damages
Total 2003 2004 2005 2006 2007Disasters Cases 1,458 470 234 134 348 272Víctims persons 373,459 118,433 53,370 21,473 115,648 64,535Housing loss victims persons 50,767 29,433 8,041 2,448 6,328 4,517Decesased individuals persons 46 24 7 2 9 4Partially distroyed houses Houses 50,156 17,928 8,847 2,572 12,501 8,308
Totally distroyed Houses 7,951 3,757 1,560 471 1,315 848Source : SINADECI Statistical Compendium
Peru has been hit by big torrential rain disasters caused by the El Niño Phenomenon. Table 3.1.5-2 shows damages suffered during the years 1982-1983 and 1997-1998 with extremely serious effects. Victims were approximately 6,000,000 inhabitants with an economic loss of about US$ 1,000,000,000 in 1982-1983. Likewise, victims number in 1997-1998 reached approximately 502,461 inhabitants with economic loss of US$ 1,800,000,000. Damages in 1982-1983 were so serious that they caused a decrease of 12 % of the Gross National Product.
Table 3.1.5-2 Damages Damages 1982-1983 1997-1998 Persons who lost their homes 1.267.720 - Victims 6.000.000 502.461 Injured - 1.040 Deceased 512 366 Missing persons - 163 Partially destroyed houses - 93.691 Totally destroyed houses 209.000 47.409 Partially destroyed schools - 740 Totally destroyed schools - 216 Hospitals and health centers partially destroyed
- 511
Hospitals and health centers totally destroyed
- 69
Damaged arable lands (ha) 635.448 131.000 Head of cattle loss 2.600.000 10.540 Bridges - 344 Roads (km) - 944 Economic loss ($) 1.000.000.000 1.800.000.000
“–“: No data

Preparatory study about the protection program for valleys and rural communities vulnerable to floods in Peru
Profile Study Report (Pre-feasibility level),Majes-Camana River
3-18
(2) Disasters in the watersheds object of this study
Table 3.1.5-3 summarizes damages occurred in the Arequipa region.
Table 3.1.5-3 Disasters in the Arequipa Region Years 1995 1996 1997 1998 1999 2000 2001 2002 2003 2004 2005 2006 2007 2008 2009 2010 Total Media
LANDSLIP 1 1FLOOD 5 5COLLAPSE 1 1 1 1 4LANDSLIDE 1 1 1 2 1 1 4 3 4 2 1 2 23AVALANCHE 6 1 7 14 3 2 4 2 2 1 9 3 54
TOTAL SEDIMENT DISASTER 6 2 7 15 4 5 6 2 4 3 11 4 1 0 10 7 87 5TOTAL FLOOD 3 1 42 6 44 2 15 3 1 2 2 3 0 1 3 3 131 8
3.1.6 Results on the visits to Study Sites
JICA Study Team made some technical visits to the selected watersheds and identified some challenges on flood control through visits and interviews to regional government authorities and irrigation associations on damages suffered in the past and the problems each watershed is currently facing.
(1) Interviews
1) Camana River
(General conditions of the watershed)
The jurisdiction area of Camana covers from the river mouth to 39 km upstream
The dike was constructed thirty years ago by the irrigation commission, but there
are various eroded parts
99% of rice crops are commercialized in Lima’s market
Flow is measured once a day. The maximum historical flow was form 1.200 to
1.500 m3/s. Floods last almost a week
There are some colonial ruins in the upper area at the left riverbank between km 2
and 6
(On critical points)
○ Obstruction of the river mouth
The formation of the gravel bank in the river mouth caused by beach waves
obstructs water flow in the river mouth (obstruction in the river mouth). The
construction of a longitudinal dike along the sea side has been considered in order
to control this situation. The gravel bank disappeared with floods and reappeared
between June and December
The path km 2,5 – km 4,5 burst its banks the same year El Niño Phenomenon hit,
1998. The right bank also did burst in the past
Riverbed elevation

Preparatory study about the protection program for valleys and rural communities vulnerable to floods in Peru
Profile Study Report (Pre-feasibility level),Majes-Camana River
3-19
○ Path with lower dike (left bank between km 6 and km 7,5).
The dike at the left bank is particularly low between km 6 – 7,5 (LA BOMBOM)
There are arable lands between the dike at the left bank and the river downstream
in the Camana Bridge that can eventually be removed for being illegal. As to the
arable lands outside the dike, the negotiation might be complicated
The riverbed has elevated more than a meter
○Erosion in the riverbank around the channel (left bank between km 12– 13)
There is an arm water inlet for Camana’s drinking water by km 13
There is a channel that goes from the water inlet along the river. The river’s left
bank is seriously eroded at km12, endangering the adjacent channel
○ Scour of bridge piers (by km 26)
There is a local community at the right bank of the river, by km 26 (SONAI) with
40 households. There is a suspension bridge constructed a year ago with semi-
eroded piers because of floods, presenting collapse risks with following floods
○ Other parts presenting problems
The left bank dike at km 3 is eroded and has been provisionally repaired
There is an unprotected part at km 14,2
There is a path whose left bank is being eroded at km 19 (CHARACTA)
The left bank dike at km 26,5 is eroded
A left bank dike at km 28 needs to be constructed
Arable lands at km 29 of the left bank are eroded (CULATA DE SIYAN)
The left bank at km 30 is being eroded and needs protection (FUNDO CASIAS)
A dike at km 33,5 needs to be constructed given that annually the water inlet and
the irrigation channels get flooded
A 1km dike needs to be constructed at the right bank of km 34
A 2km dike needs to be constructed at km 37,5 downstream in order to protect the
water inlet and adjacent arable lands (80 ha) of the left bank (HUAMBOY)
A 1km dike needs to be constructed at km 39 downstream in order to protect the
water inlet and adjacent arable lands (80 ha) of the right bank (HUAMBOY)
2) Majes River
(Critical points)
○ Areas overflowing (right bank at km 104)
A 500m dike needs to be constructed at the right bank
Elements to be protected: arable lands (ONGORO BAJO)
Landslide occurred on 1977 left arable lands buried at river banks. Accumulated
sediment in the river course was dragged downstream by river level rise
○ Fluvial erosion (right river bank, km 101)
Arable lands were eroded by 1997 floods

Preparatory study about the protection program for valleys and rural communities vulnerable to floods in Peru
Profile Study Report (Pre-feasibility level),Majes-Camana River
3-20
The elements to be conserved are arable lands (HUATIAPILLA BAJA)
The current dike (600 m) at the right river bank needs to be extended between 500
and 800 m
○ Fluvial erosion (right river bank, km 88,5)
River banks have been eroded by the floods in February 2011 dragging also part of
a house (which is still being occupied)
The elements to be conserved are arable lands and houses (BERINGA)
The existing dike (1 km) as well as protection works at the right river bank need to
be prolonged 600 m
○ Dike erosion (right river bank, km 84,5)
The dike at the right river bank is being progressively eroded year by year, and if
measures are not taken, this could affect the adjacent bridge (Huancarqui Bridge)
The dike has been repaired in an improvised way, but it needs a pertinent measure
as river bank protection, etc
The elements to be conserved are arable lands and the bridge (APLAO)
The town of Aplao, the biggest city hall in Majes, has 18 thousand inhabitants, and
Huancarqui at the other side of the river, crossing the bridge, has 5 thousand
inhabitants
○ Unprotected stretch (right river bank, between km 70,5 and km 71)
Currently an 800m dike is being constructed financed by the regional government.
However, other 1,3 km are considered to be built in order to protect approximately
30 houses located in lower lands of the lower watershed
Last August 2010, the area was flooded after eight years
The elements to be conserved are arable lands and private houses (EL DEQUE)
There is an irrigation channel upstream, conducting water to arable lands (700 ha)
downstream. The water inlet is being eventually repaired, to be finished in 15 days
Big rocks for river bank protection are extracted and transported from a quarry in
Aplao
○ Overflowed stretch (both river banks, between km 60 and km 62)
It is necessary to construct 2km dikes at the left river bank and 1,5 dikes at the
right river bank
Elements to be conserved are arable lands (Pitis at the left river bank and San
Vicente at the right river bank)
○ Overflowed stretch (left river bank, between km 58 and km 58.5k)
A dike needs to be constructed at the left river bank
The elements to be conserved are arable lands (ESCALERILLAS)
○ Fluvial erosion (left river bank between km 55 and km 56.5k)
Agriculture lands are being progressively eroded year by year by floods
Elements to be conserved are arable lands (SARCAS)

Preparatory study about the protection program for valleys and rural communities vulnerable to floods in Peru
Profile Study Report (Pre-feasibility level),Majes-Camana River
3-21
Part of the area has been flooded in 1998 by 1.500 m3/s floods, forcing three small
communities to move from lower lands to upper ones
The river overflowed in February 2011 by floods of 800 m3/s
○Other parts presenting problems
A dike is looked to be built at the left river bank, between km 81,5 and km 82
(HUANCARUQUI)
A dike is looked to be built at the right river bank, between km 81,5 and km 82
(CASPANI)
Parts between km 75–km 75,5k and km 71–km 71,5 are unprotected at the left
river bank (TOMACA)
The stretch km 73,5 – km 74 is unprotected at the right river bank (QUERULPA)
A dike is looked to be built at the left river bank, between km 49 and km 51,5
(PAMPA BLANCA)
(2) Description of the visit to the study sites Figure 3.1.6-1 shows pictures of main sites visited.

Preparatory study about the protection program for valleys and rural communities vulnerable to floods in Peru
Profile Study Report (Pre-feasibility level),Majes-Camana River
3-22
Figure -3.1.6-1 Visit to the Study Site (Camana River)
Figu
re -3
.1.6
-1(2
) V
isit
to th
e Fi
eld
Site
(Maj
es R
iver
)

Preparatory study about the protection program for valleys and rural communities vulnerable to floods in Peru
Profile Study Report (Pre-feasibility level),Majes-Camana River
3-23
Figure 3.1.6-2 Visit to the Study Site (Majes River)

Preparatory study about the protection program for valleys and rural communities vulnerable to floods in Peru
Profile Study Report (Pre-feasibility level),Majes-Camana River
3-24
(3) Challenges and measures The following table shows challenges and possible solution measures for flood control
considered at this moment, based on the results of technical visits.
1) Challenge 1: Deterioration of the existing dike caused by fluvial erosion (km 0 - 5 of the Camana River)
Current situation and challenges
・The existing dike which control corresponds to the Irrigation Commission of Camana has been constructed about 30 years ago with their own resources. There are several eroded parts
・ The dike is low upstream and downstream of Camana Bridge at km 6, putting at flood risk arable lands and urban area
Main elements to be conserved
・Urban area of Camana ・Arable lands (main crop: rice)
Basic measures ・Construction of dikes and riverbank protection
Figure 3.1.6-3 Local conditions related with Challenge 1 (Camana River)

Preparatory study about the protection program for valleys and rural communities vulnerable to floods in Peru
Profile Study Report (Pre-feasibility level),Majes-Camana River
3-25
2) Challenge 2: Fluvial erosion impact on the drinking water inlet (Camana River, km 12)
Current situation and challenges
・There is an inlet for the drinking water service to Camana at km 13, as well as a channel along the river
・Currently the left bank at km 12 is eroded and if not taking correct measures, this could affect the adjacent channel
Main elements to be conserved
・Channel for drinking water
Basic measures ・Reinforcement of the existing dike and riverbank protection
Figure 3.1.6-4 Local conditions related with Challenge 2 (Camana River)

Preparatory study about the protection program for valleys and rural communities vulnerable to floods in Peru
Profile Study Report (Pre-feasibility level),Majes-Camana River
3-26
3) Challenge 3: Overflow of the narrow upper stretch (Majes River, km 60-km 62) Current situation and challenges
・The hydraulic capacity is reduced given the narrowing of the river, causing flood damages on arable lands of the upper areas
・There is a new bridge at the narrow area of the river. Parts are unprotected at both banks presenting high overflow risks
Main elements to be conserved
・Arable lands (main crop: rice)
Basic measures ・Construction of dikes and river bank protection
Figure 3.1.6-5 Local conditions related with Challenge 3 (Majes River)

Preparatory study about the protection program for valleys and rural communities vulnerable to floods in Peru
Profile Study Report (Pre-feasibility level),Majes-Camana River
3-27
4) Challenge 4: Overflowing towards rural zone (Majes River km 70.5–km 71)
Current situation and challenges
・There is a community, Deque, along the riverside, in the narrow section, 30 houses in the low lands
・Even though it is true that the higher section of this community is protected by a dike, there is a section downstream which is unprotected, with higher risk of overflowing
・There is a water intake to supply irrigation water to 700ha of crop land, which is also exposed to flood risk
Main elements to be conserved
・Houses, water intake for irrigation ・Croplands (main crop: rice)
Basic measures ・Construction of dikes and protection of banks
Figure 3.1.6-6 Local conditions related to Challenge 4 (Majes River)

Preparatory study about the protection program for valleys and rural communities vulnerable to floods in Peru
Profile Study Report (Pre-feasibility level),Majes-Camana River
3-28
5) Challenge 5: Impact of fluvial erosion to the bridge (Majes River km 84.5)
Current situation and challenges
・The dike of the right bank is progressively eroded year by year, and if no measure is taken, it could affect the next bridge downstream (Huancariqui bridge)
・This bridge is an important path which connects Aplao, the larger town of Majes (with a population of 18 thousand inhabitants), and Huancarqui (with a population of 5 thousand inhabitants)
Main elements to be conserved
・Bridge (Huancarqui) ・Croplands (main crop: rice)
Basic measures ・Construction of dikes and protection to the banks
Figure 3.1.6-7 Local Conditions related to Challenge 5 (Majes River)

Preparatory study about the protection program for valleys and rural communities vulnerable to floods in Peru
Profile Study Report (Pre-feasibility level),Majes-Camana River
3-29
6) Challenge 6: Damages from fluvial erosion to the community (Majes River km 88-km 88.5)
Current situation and challenges
・The river banks are progressively eroded per year due to the risings and floods of February 2011, which dragged a house
・ Currently, the banks are unprotected and if the appropriate measures are not taken, it may worsen the damages, so taking measures is urgently needed
Main elements to be conserved
・Houses ・Croplands (main crop: rice)
Basic measures ・Construction of dikes and protection to the banks
Figure 3.1.6-8 Local conditions related to Challenge 6 (Majes River)
Riv
er)

Preparatory study on the protection program for valleys and rural communities vulnerable to floods in Peru
Profile Study Report (Pre-feasibility level),Majes-Camana River
3-30
3.1.7 Current situation of vegetation and reforestation
(1) Current Vegetation
The most recent study1 about the classification of vegetation is that carried out by FAO on 2005, with the collaboration of National Institute of Natural Resources of the Ministry of Agriculture (INRENA2 in Spanish).
In this study the 1995 Forest Map was used as database and its Explanatory Guide3 prepared by INRENA and the Forest General Direction. Likewise, during the 70’s the National Planning Institute and the National Bureau of Natural Resources Evaluation (ONERN in Spanish) prepared the Budget, Evaluation and Use of Natural Resources of the Coast which describes the classification of the vegetation and the coast flora.
Pursuant to the 1995 Forest Map and its explanations, the distribution of the watersheds extend from the coast to the Andean mountains; usually, they feature different vegetal coverage according to the altitude (see Table 3.1.7-1.). In this watersheds, the zones from coast up to the 2,500msnm (Cu, Dc) have scarce vegetation, and they are featured by arid lands mainly covered by grass and cactus; some meters above in altitude, there are only scarce bushes disseminated in the area. In zones from 2,500 m.a.s.l up to 3,500 m.a.s.l, small bushy forests are formed thanks to the optimal rainfall, while in higher altitude areas the low temperature hardens the vegetal growth, so grassy species mainly grow on it. Although the bushes forming thicket generally reach up to 4 m high, in zones close to the rivers, high trees are mainly develop.
Table 3.1.7-1 List of representative vegetable forming in the watersheds extending from the coast to the Andean mountains
Symbol Life Zone Distribution of Altitude Rainfall Representative Vegetation 1)Cu Coast Crop Lands Coast Almost none. Coastal crops 2)Dc Coast Desert 0~1,500 m.a.s.l Almost none, there are
mist zones. Almost none, there are vegetation slopes
3)Ms Dry Thicket 1,500~3,900 m.a.s.l 120~220mm Cactus and grass 4)Msh Subhumid Forest North-center: 2,900~3,500 m.a.s.l
Inter Andean 2,000~3,700 m.a.s.l 220~1,000mm Perennial bushes, less than 4m high
5)Mh Humid Forest North: 2,500~3,400 m.a.s.l South 3,000~3,900 m.a.s.l
500~2,000mm Perennial bushes, less than 4m high
6)Cp Puna grass Approx 3,800 m.a.s.l No description Gramineae 7)Pj Scrubland 3,200~3,300 m.a.s.l
Center-South up to 3,800 m.a.s.l South zone with low rainfall: less than 125mm East springs: higher than 4,000mm
Gramineae
8)N Ice-capped mountains
- -
Source: Prepared by the JICA Team base don the Forest Map. 1995
Each life zone is described below.
(i) Cu (Coastal crops) Cultivated lands of the coast region developed in fluvial influence zones.
1 Use of Landsat-TM (Data from 1999 y 2000). 2 Subsequently, INRENA was dissolved and its functions were assumed by the Wild Forest and Fauna General Direction. 3 Use of Landsat-MSS (Data from 1998).

Preparatory study on the protection program for valleys and rural communities vulnerable to floods in Peru
Profile Study Report (Pre-feasibility level),Majes-Camana River
3-31
(ii) Dc (Coastal Desert) It covers surface of 10,01% (128.575km2) of the Peruvian territory, it extends along the
Peruvian coast, from Tumbes to Tacna. It includes from sea level up to approximately 1.500msnm. The weather is arid and warm in summer (December-March), mist in winter (May-September). In areas with altitude of 700m.a.s.l to 1.000msnm vegetal formations called hills may appear. Besides the hills, it is common to see that in years with strong mists, tiny grass of few centimeters cover the surface, especially in the South of Peru. Close to the rivers, bushes appear.
(iii) Ms (Dry Thicket) It covers 2,18% (28.026Km2) of Peruvian territory, it is distributed from the first
elevations of the west spring of Tumbes. In Tacna, located in the South extreme of Peru, it reaches 3.900 m.a.s.l. In central and south zones, this bush appears at 1.500 m.a.s.l, and includes the medium areas of Andean western spring. Annual average temperature is 11°C~25°C, while annual average rainfall ranges from 120 to 220mm, except a High Andean sector of Tacna where the annual average temperature and rainfall are lower than 6°C and 125mm respectively. The extreme weather conditions the vegetal presence; it limits it to cactus and grass. The bushes growing in this zone completely eliminate leaves and the grass also disappeared as a way to counteract the prolonged period of drought, thus recovering the greenness in rainy season. (iv) Msh (Sub-humid Forest)
It covers 2,91% (37.278Km2) of Peruvian territory. It is distributed after the dry thicket, located from 2.900m.a.s.l to 3.500m.a.s.l in North-Central zones, and in the inter-Andean valleys from 2.000m.a.s.l to 3.700m.a.s.l. Annual average temperature ranges from 9oC to 18oC and the annual average rainfall ranges from 220mm to 1.000mm. The dominant bushes in this zone are perennial and generally do grow more than 4m.
(v) Mh (Humid Forest) It covers 3,17% (40.777Km2) of the Peruvian territory, located between 2.500m.a.s.l and
3.400m.a.s.l in the North Zone, while in the Center-South zones, it is located between 3,000m.a.s.l and 3.900m.a.s.l; that means, between the Sub-humid Forest and high Andean grasslands. The annual average temperature ranges from 6°C to 14°C, the annual average rainfall is from 500 to 2.000mm, except in some zones where the rainfall reaches 4,000mm. The bush community of this zone is characterized by its perennial foliage and its high level of resistance to low temperatures and drought; it does not grow higher than 4m. Small woods are formed in inaccessible places.
(vi) Cp (Puna grass) It covers a surface of 1,89% (24,249km2) of the Peruvian territory and it is located in the
high and cold zones of the Andes, generally above 3,800m.a.s.l in the Center-South zones. The Pj (Scrubland) zone is also located in the same climactic zone. It is feature by the

Preparatory study on the protection program for valleys and rural communities vulnerable to floods in Peru
Profile Study Report (Pre-feasibility level),Majes-Camana River
3-32
predominant presence of gramineae, then Cyperaceae, Juncaceae and Leguminoceae.
(vii) Pj (Scrublands) It coves the cold high Andean surfaces, from 3.200m.a.s.l to 3.300m.a.s.l, except for
center-south zones where it reaches 3.800m.a.s.l. The weather is variable, and in the south it is more arid than in the Center and North, such as that zone which annual rainfall is lower than 125mm, while in the east springs there are places with more than 4.000mm of rainfall. The temperature ranges from 1,5°C and 6°C. Gramineae dominate and form scrublands. In the south, such as Arequipa, a mixed community of herbaceae and bushes known as tolars is seen. However, these vegetal communities are overexploited and degraded for energy purposes.
(viii) Nv: Ice-Capped Mountains The distribution of the vegetal formations in the Majes-Camana River watershed is similar
to that from the abovementioned zones, except that the vegetal formations representative from this watershed differ from the other remaining four watersheds in three aspects: i) they do not have cost crops (Cu), ii) There are hills (Lo), iii) there are moors (Bf).
The explanations in this watershed only and not in the remaining watersheds are the following. In Figure 1.1.5 the vegetal formations map of Majes-Camana watershed appears.
(ix) Lo:Hills4 It appears from 0 to 1,000msnm. It covers from the north coast dessert of Peruvian North
to Chile. In winter (May to September) the mist comino from the sea allows the development of plant communities. It is characterized by predominant species such as Tillandsia spp, tara (Caesalpinea spinosa), Amancaes flower (Ismene amancae), cactus (Haageocereus spp.),
Clover (Oxalis spp.), wild potato (Solanum spp), among others. On the other side, the coast dessert is 11% of Peruvian territory, 2.000Km along of the coast from north to south, besides the area is 14.000Km2. The area of the coast hills in the study watershed could not be found.
(x) Bf:Moors5 It appears from 3.900 to 4.800 m.a.s.l, which topography includes plain lands, slight
slopes or with slight depressions. They appear where the ground water is shallow, where there are springs and a permanent supply of water the entire year, by means of run-off that
4 (Source1) Proyecto Atiquipa http://www.lomasdeatiquipa.com/lomas.htm (Source 2) Plan Maestro de la Reserva Nacional de Lomas de Lachay (2003 – 2007) http://www.sernanp.gob.pe/sernanp/archivos/biblioteca/publicaciones/RN_Lachay/Plan_maestro_2003-2007_RN%20Lachay.
pdf 5 (Source 1) Cosecha de agua, Una práctica ancestral. Manejo sostenible de las praderas naturals, DESCO (Centro de Estudio
y Promocion de desarrollo) HP:http://www.descosur.org.pe/publicaiones/Manual004.pdf HP:http://www.desco.org.pe/quienessomos.shtml (Source) Monografia: Biodiversidad del Valle del Colca (Arequipa),Wilmer Paredes HP:http://www.monografias.com/trabajos53/biodiversidad-colca/biodiversidad-colca2.shtml

Preparatory study on the protection program for valleys and rural communities vulnerable to floods in Peru
Profile Study Report (Pre-feasibility level),Majes-Camana River
3-33
come from the ice-capped mountains or by springs. It is characterized by the predominant species such as champa (Distichia muscoides), sillu - sillu (Alchemilla pinnata), libro-libro (Alchemilla diplophylla), chillihua (Festuca dolichophylla), crespillos (Calamagrostis
curvula), tajlla (Lilecopsis andina), sora (Calamagrostis eminens), ojho pilli (Hipochoeris
stenocephala), amog others. These plants are low, the American Camelids (llama, alpaca, vicuna and guanaco) feed themselves with them.
Figure 3.1.7-1 Distribution of the vegetation (Majes-Camana River watershed) (Source: INRENA, Prepared by the JICA Team based on the Forest Map. 1995)
(2) Area and distribution of vegetation
Rio Camana-Majes watershed compared the results of 1995 INRENA study to tose of SIG, and the area percentage of the watershed of each classification of vegetation was obtained. (See Table 3.1.7-2).

Preparatory study on the protection program for valleys and rural communities vulnerable to floods in Peru
Profile Study Report (Pre-feasibility level),Majes-Camana River
3-34
Table 3.1.7-2 Area of each classification of vegetation (Majes-Camana River watershed) Distribution Classification of vegetation
Lo Dc Ms Msh Mh Bf Nv Pj Total Area of distribution of vegetation (km2) 104,54 3108,12 1570,08 1334,76 155,20 66,16 641,44 10069,21 17.049,51
Watershed area percentage (%) 0,6 18,2 9,2 7,8 0,9 0,4 3,8 59,1 100,0
Source: Prepared by the JICA Team based on the INRENA1995 Forest Map of
If the classification is added to this result, Table 3.1.7-3 is obtained. The characteristic of the vegetation
classification of the Majes-Camana River watershed consists of low percentages of thicket areas (less than
9%); on the other hand, there are high percentages of scrublands (less than 60%). The altitude of high
watershed of Rio Majes consists of more than 4.000m.a.s.l, which cover most of the scrublands.
Table 3.1.7-3 Area and percentages of each classification of vegetation gathered (Majes-Camana river watershed)
EE
Desserts and
others (Lo,Dc)
Dry thicket (Ms)
Scrublands(Msh, Mh)
High elevation hills(Cp/Pj)
Ice-capped
mountain (N)
Total
Vegetation area (km2) 3.212,66 1.570,08 1.489,96 10.135,37 641,44 17.049,51
Watershed area percentage (%) 18,8 9,2 8,7 59,4 3,8 99,9
(3) Forest area variation
Although a detailed study on the variation of the forest area in Peru has not been performed yet, the National Reforestation Plan Peru 2005-2024, Annex 2 of INRENA shows the areas deforested per department until 2005. These areas subject matter of this study are included in the regions of Arequipa, Ayacucho, Huancavelica, Ica, Lima and Piura, but they only belong to these regions partially. Table 3.1.7-4 shows the Figures accumulated areas deforested in these regions.
However, in relation to the Arequipa Region, data are not available.
Table 3.1.7-4 Area Deforested Until 2005
Department Area (ha) Area deforested accumulated (ha) and the percentage of such area in the department area (%)
Post-Felling Situation Non used Area (ha)
Used area(ha)
Arequipa 6.286.456 - - -
Source: National Reforestation Plan, INRENA, 2005
The variation of the distribution of vegetation was analyzed per watershed, comparing the SIG to the data from the FAO study performed in 2005 (prepared based on satellite figures from 2000) and the results of the 1995 INRENA study (prepared base on satellite figures from 1995). (See Table 3.1.7-5).
From 1995 to 2000, the semi-humid and humid thicket diminished on 30km2 (2,3%) and 5km2
(3,2%) respectively, scrublands (Pj), ice-capped mountains (Nv) have significantly diminished on 364km2 (3,6%) and 60km2 (9,4%) respectively, moors (Bf) are increasing approximately on 12km2 (18,2%). The area with higher increase is the coast dessert (Dc) approximately on 40km2 (13%).

Preparatory study on the protection program for valleys and rural communities vulnerable to floods in Peru
Profile Study Report (Pre-feasibility level),Majes-Camana River
3-35
Table 3.1.7-5 Changes in the areas of distribution of vegetation from 1995 to 2000 (Majes-Camana river Watershed)
Area Classification of vegetation Lo Dc Ms Msh Mh Bf Pj Nv
1995 (km2) (a) 104,54 3.108,12 1.570,08 1.334,76 155,20 66,16 10.069,21 641,44 2000 (km2) (b) 131,55 3.512,24 1.586,48 1.304,54 150,25 78,18 9.705,02 581,25 Changes (b-a) (km2) (c) 27,01 404,12 16,40 -30,22 -4,95 12,02 -364,19 -60,19 Change percentage (%) (c/a) 25,8 13,0 1,0 -2,3 -3,2 18,2 -3,6 -9,4
Source: Prepared by the JICA Study Team based on the studies performed by the INRENA 1995 and FAO 2005
(4) Current situation of forestation
The National Reforestation Plan (INRENA, 2005) registers forestation per department from 1994 to 2003, from which the history data corresponding to the environment of this study was searched (See Table 3.1.7-6). It is observed that the reforested area increased in 1994, drastically decreasing later. Arequipa, Ica and Lima are departments located in the coast zone with scarce rainfall, thus the forestation possibility is limited, besides the scarce forest demand.
Table 3.1.7-6 History registry of forestation 1994-2003 (formerly Department) (Units: ha)
Department 1994 1995 1996 1997 1998 1999 2000 2001 2002 2003 TotalArequipa 3.758 435 528 1.018 560 632 nr 37 282 158 7.408
Source: National Reforestation Plan, INRENA, 2005
According to the information obtained by jeans of the interviews by Agrorural, the experiences of forestation appear in Table 3.1.7-7. Forestation has been performed in 4 places, all of them very small areas, and mainly experimental forestation. On the other hand, ONG Nature Conservancy currently performs vegetation recovery activities in the hills of Peruvian coast.
Table 3.1.7-7 Forestation Experiences (Department of Arequipa) Year Place of plantation Executing unit Planted
Species Area (ha) Observations
1992 Arequipa Univ. Nac. San Agustín Native species 2
Forest Diagnosis and possibilities
2004 Usuña, Bellavista District of Polobaya, Prov. Arequipa AGRORURAL eucalyptus,
pine, cypress 3
2005 Arequipa University Thesis Pepper tree 0,5 Source: Prepared by the JICA Study Team based on the interview to AGORURAL
3.1.8 Current situation of the soil erosion
(1) Information gathering and basic data preparation
1) Information Gathering
During this study the data and information indicated in Table 3.1.8-1 was collected in other to know the current situation of the sediment production behind the Study Area.

Preparatory study on the protection program for valleys and rural communities vulnerable to floods in Peru
Profile Study Report (Pre-feasibility level),Majes-Camana River
3-36
Table 3.1.8-1 List of collected information Forms Prepared by: Topographic map (Scale 1/50.000)
Shp INSTITUTO GEOGRAFICO NACIONAL
Topographic map (Scale 1/100.000)
Shp,dxf INSTITUTO GEOGRAFICO NACIONAL
Topographic map (Scale 1/250.000)
SHP Geologic data systems
Topographic map (Scale 1/100.000)
Shock Wave INGEMMET
30 m grid data Text NASA River data SHP ANA Watershed data SHP ANA Erosion potential risk map SHP ANA Soils map SHP INRENA Vegetal coverage map SHP2000
PDF1995 DGFFS
Rainfall data Text Senami
2) Preparation of basic data
The following data was prepared using the collected material. Details appear in Annex 6.
- Hydrographic watershed map (zoning by third order valleys) - Slope map - Geological Map - Erosion and slope map - Erosion and valley order map - Soil map - Isohyets map
(2) Analysis of the causes of soil erosion
1) Topographic characteristics
i) Surface pursuant to altitudes
Table 3.1.8-2 and Figure 3.1.8-1 show the percentage of surface according to altitudes of Majes-Camana River watersheds. The Cañete River and Majes-Camana river watersheds are characterized for a percentage of watersheds located at more than 4,000 m.a.s.l. The hills at this height are little pronounced and several ice-capped mountains and reservoirs are distributed in the zone. This part of the Majes-Camana River watershed is large and has plentiful and large hydrological resources compared to other watersheds. The altitudes between 4,000 and 5,000 m.a.s.l represent 53% of total surface.

Preparatory study on the protection program for valleys and rural communities vulnerable to floods in Peru
Profile Study Report (Pre-feasibility level),Majes-Camana River
3-37
Table 3.1.8-2 Surface according to altitude
Altitude (msnm)
Area (km2 ) Majes-Camana
0 – 1000 1040,56
1000 – 2000 2618,77
2000 – 3000 1277,54
3000 – 4000 2305,64
4000 – 5000 9171,56
5000 – More 635,44
TOTAL 17049,51 Maximum Altitude 5821
Source: Prepared by the JICA Study Team based on the 30 m grid data
Figure 3.1.8-1 Surface according to altitude
ii) Zoning according to slopes
Table3.1.8-3 and Figure 3.1.8-2 show the slopes in Majes-Camana River watershed.
Table 3.1.8-3 Slopes and surface
Watershed slope ( % )
Majes-Camana Area (km2) Percentage
0 - 2 869,75 5%
2 - 15 6210,54 36%
15 - 35 5452,97 32%
More than 35 4516,25 26%
TOTAL 17049,51 100%

Preparatory study on the protection program for valleys and rural communities vulnerable to floods in Peru
Profile Study Report (Pre-feasibility level),Majes-Camana River
3-38
Figure 3.1.8-2 Slopes and surface
iii) River-bed slope
Table 3.1.8-4 and Figure 3.1.8-3 show the slope in every river and the length of streams including tributaries. Figure 3.1.8-4 shows the general relation of the movement of sediments and the river-bed slope. Supposedly, sections with more than 33.3 % of slope tend to produce higher amount of sediments, and hillsides with slopes between 3.33 % and 16.7 %, accumulate sediments easier.
Table 3.1.8-4 River-bed Slope and total length of stream
River-bed slope ( % )
Majes-Camana
0,00 - 1,00 263,45
1,00 - 3,33 1953,19
3,33 - 16,67 7511,73
16,67 - 25,00 1383,17
25,00 - 33,33 761,15
33,33 – More 1425,65
TOTAL 13298,34
Figure 3.1.8-3 River-bed Slope and total length of streams

Preparatory study on the protection program for valleys and rural communities vulnerable to floods in Peru
Profile Study Report (Pre-feasibility level),Majes-Camana River
3-39
Figure 3.1.8-4 River-bed slope and sediment movement pattern
2) Rainfall
Isohyets’ maps of each watershed were prepared, based on the isohyets maps prepared by SENAMHI using the rainfall data collected during 1965-1974. Figure 3.1.8-5 shows the isohyets map (annual rainfall) of Majes-Camana River watershed.
Annual rainfall in the area subject to flood analysis ranges from 0 to 50 mm. The annual mean rainfall in the zone of 4000 – 5000 m.a.s.l of the southeast ranges from 500 to 750 mm.
Source: Prepared by the JICA Study Team based on the SENAMHI data
Figure 3.1.8-5 Isohyet Map of the Majes-Camana river watershed
0 order valley More than first order valley
Subject to conservation
Approx. 1/30 Approx. 1/6 Generation
Approx. 1/3 Approx. 1/4
Run-off. Sediment..
Entrainment Sediment flow

Preparatory study on the protection program for valleys and rural communities vulnerable to floods in Peru
Profile Study Report (Pre-feasibility level),Majes-Camana River
3-40
3) Erosion
The characteristics of erosion of the watershed in general are presented below. This is divided in three large natural regions: Coast (Area A), Mountain/Suni (Area B), and Puna (Area C). Figure 3.1.8-6 shows the corresponding weather and the rainfalls. It is observed that the area most sensitive to erosion is Mountain/Suni where the pronounced topography without vegetal coverage predominates.
Figure 3.1.8-6 summarizes the watershed characteristics. Below 1,000 m.a.s.l, vegetation is scarce and rainfall is reduced (Area A). There is little erosion. Between 1,000 and 4,000 m.a.s.l, topography is pronounced and uncovered, that means, it has no vegetal coverage (Area B). Rainfall is not high, but it is deduced that in this is where higher amount of erosion happens. Above 4,000 m.a.s.l, the rainfall is high and the temperature is low. The lands are covered by bushes which adapt to local weather, likewise, the relief is not pronounced, so the erosion volume is reduced (Areas C).
Figure 3.1.8-6 Relation between the erosion volume and the different causes
(3) Identification of the zones more vulnerable to erosion
The erosion map prepared by ANA considers the geology, hill sloping and rainfalls. Supposedly, the erosion depth depends on the hillside slope, and in such sense the erosion map and the slope map are consistent. Thus, it is deduced that the zones more vulnerable to erosion according to the erosion map are those were most frequently erosion happens within the corresponding watershed.
The Majes-Camana watershed is characterized because its topography is very varied between 1,000 and 4,000 m.a.s.l. Colca Canyon considered one of the deepest valleys of the world is in this zone.

Preparatory study on the protection program for valleys and rural communities vulnerable to floods in Peru
Profile Study Report (Pre-feasibility level),Majes-Camana River
3-41
Table 3.1.8-5 Slopes according to altitudes of the Majes-Camana river watershed
Figure 3.1.8-7 Slopes according to altitudes of Majes-Camana River
(4) Production of sediments
1) Results of the geological study
The study results are described below.
・ A canyon of approximately 800 m from the soil has been formed, the river flows in the middle. The
valley width is 4,2km, the river width is 400m (see Figure 3.1.8-10). It has the characteristics of a
terrain setting similar that of Yauca Watershed; however, the depth and the width of Camana-Majes
Watershed is larger
・ In the mountain surface there is no vegetation, the formation of clastic material deposits is observed,
which are detached due to collapse or eolic erosion (See Figure 3.1.8-16)
・ The Mesozoic sedimentary rock is the main one in the production patterns, mainly due to the mechanism of fall of large amounts of gravel and eolic fracture and erosion. As shown in the picture,
there is no vegetation deeply rooted by the sediment entrainment in common time (see Figure 3.1.8-10 and Figure 3.1.8-16)
・ In the case of the section subject of this study, the valley base width is broad (111km from the river mouth, in the intersection of Andamayo), the formation of low lands were observed in the beds. IN
these places, the sediments dragged from the hillsides do not enter directly to the stream, but are
Watershed Slope
Altitudes (m)
total 0 - 1000 1000 - 2000 2000 - 3000 3000 - 4000 4000 - 5000 5000 - More
Majes- Camana
0 - 2 140,95 15% 158,22 17% 14,72 2% 78,54 8% 480,22 51% 61,23 7% 140,95 2 - 15 446,73 7% 1164,54 18% 350,89 5% 560,22 9% 3850,12 59% 128,91 2% 446,73
15 - 35 222,03 4% 622,51 12% 399,92 8% 673,63 13% 3014,22 59% 154,69 3% 222,03 More
than 35 230,75 5% 677,32 15% 537,05 12% 993,25 22% 1823,81 40% 290,08 6% 230,75

Preparatory study on the protection program for valleys and rural communities vulnerable to floods in Peru
Profile Study Report (Pre-feasibility level),Majes-Camana River
3-42
deposited on the terrace. Thus, the most of sediments entering the river are probably produced by the
eroded terraces deposits or accumulated sediments due to the alteration of bed (see Figure 3.1.8-16)
・ In the higher watershed, fewer terraces were observed and dragged sediments to the hillsides directly
enter to the river, although in a reduced amount (see Figure 3.1.8-16)
・ According to the interviews, the situation of the sediment generation of the study section sub-watersheds is showed below. On the other hand, it was said that there was sediment entrainment
from upstream silting to the flow, however, this fact was not observed
・ In the canyon, terraces have been developed; terrace bottoms are in contact with the flow channel in several points. It may be considered that the ordinary water current (including small and medium
floods during rainy season) brings sediments
0
500
1000
1500
0 1000 2000 3000 4000 5000 6000
Figure 3.1.8-8 Cross-section of Majes watershed (50km approx. from the mouth)
Table 3.1.8-6 Generation of the water alluvium upstream Majes river
No River name Distance Situation
1 Cosos Figure 3.1.8-11 Figure 3.1.8-12
88km approx.
In rainy season, once per month, alluvium are generated which, due to the sediment entrainment, obstruct rural (=local) highways. The situation may be restored in a day. Sometimes it affects the water pipelines.
2
Ongoro Figure 3.1.8-13
103km approx.
In 1998, an alluvium was generated, 2 persons died due to the sediment entrainment. It took one month to recover the damages in the irrigation channels. 30 minutes before, approximately 8 families listened from the mountain a sound anticipating the alluvium, which helped them to evacuate. These 8 families currently live in the same place of the disaster. The main river of the Majes river is very large and the bed has not been silted. An NGO supported the restoration of the irrigation channels.
3
San Francisco Figure 3.1.8-14
106km approx.
In 1998, an alluvium was generated, producing damages in the irrigation channels. It took one month to temporary restore it and 4 years for restoration. The amount of the alluvium with sand sediment has been 10m. high approximately.
4 Jorón Figure 3.1.8-15
106km approx.
The alluvium was generated and the sediments were entrained to the main river. The sand sediment alluvium was 10m high. It is thought it entrained 100.000 to 1.000.000 m3 of sediments.
Majes River

Preparatory study on the protection program for valleys and rural communities vulnerable to floods in Peru
Profile Study Report (Pre-feasibility level),Majes-Camana River
3-43
Figure 3.1.8-9 Location of the alluvium generation
Figure 3.1.8-10 Situation around Km 60 (formation of the valley approximately 5km width)
Figure 3.1.8-11 Situation of the sediment silting in Cosos river(Approx. 900m width)
1. Cosos
2 Ongoro
3 San Fransico
4 Joron

Preparatory study on the protection program for valleys and rural communities vulnerable to floods in Peru
Profile Study Report (Pre-feasibility level),Majes-Camana River
3-44
Figure 3.1.8-12 Rural (=local) highway crossing the Cosos river (in rainy season the sediments cover the rural highway, however, it is restored in a day)
Figure 3.1.8-13 Situation of Ongoro (in 1998, 2 persons died due to the alluvium)
Figure 3.1.8-14 Situation of the sediment deposition in the San Francisco river (obstruction of irrigation channels due to the disaster. The walls of the highway are the soil and sand sediments at
that time)
Figure 3.1.8-15 Situation of Jorón river (alluvium sediments arrived up to the main river in 1998)
Figure 3.1.8-16 Situation around the Km110 mouth (It may be deduced that there is low affluence of
sediments from hillsides to the river channel)
Figure 3.1.8-17 Intersection of the Camana river and Andamayo river (Andamayo river is an
overflow channel)

Preparatory study on the protection program for valleys and rural communities vulnerable to floods in Peru
Profile Study Report (Pre-feasibility level),Majes-Camana River
3-45
2) Relation of the damages by sediment and rainfall
In 1998, several damages were produced due to sediments in the Camana-Majes watershed. Due to that,
a rainfall study was made on 1998. The rainfall data is obtained by the hydrographic analysis of Annex 1 of
the Support Report. The pluviometric stations closest to the where the sediments were identified were
verified (Table 3.1.8-7), thus obtaining the information of years with probability of higher rainfall and the
larger amount of rain days on 1998, as shown in Table 3.1.8-8. In Chuquibamba 15 year rainfall
precipitation data have been observed, in Pampacola, 25 years, in Aplao and Huambo only 2 years.
In general, during the powerful El Niño Phenomenon of 1982-1983 and 1998, has occurred almost every 50
years6, it considered 50 year rainfall; therefore, it was determined that the sediment damages were due to these rainfall.
Table 3.1.8-7 List of Pluviometric Station to check rainfall
Coordinates
Station Latitude Length Altitude (m.a.s.l)
Aplao 16° 04'10 72° 29'26 625
Chuquibamba 15° 50'17 72° 38'55 2839
Huambo 15° 44'1 72° 06'1 3500
Pampacolca 15° 42'51 72° 34'3 2895
Table 3.1.8-8 Probability of rainfall in every Pluviometric Station and the larger amount of rainfall
per day in 1998
Station Rainfall for T (years) Rainfall in
1998 2 5 10 25 50 100 200
Aplao 1,71 5,03 7,26 9,51 10,71 11,56 12,14 1,20
Chuquibamba 21,65 36,96 47,09 59,89 69,39 78,82 88,21 82,00
Huambo 22,87 30,14 34,96 41,05 45,57 50,05 54,52 25,30
Pampacolca 21,13 29,11 34,40 41,08 46,04 50,95 55,86 42,40
6 (Source) Lorenzo Huertas DILUVIOS ANDINOS A TRAVÉS DE LAS FUENTES DOCUMENTALES - COLECCIÓN
CLÁSICOS PERUANOS 05/2003

Preparatory study on the protection program for valleys and rural communities vulnerable to floods in Peru
Profile Study Report (Pre-feasibility level),Majes-Camana River
3-46
Figure 3.1.8-18 Location of the Pluviometric Station
3) Production forecast and sediments entrainment
It is expected that the amount of sediment production and entrainment will vary depending of the dimension of factors such as rainfall, volume of flow, etc.
Since a quantitative sequential survey has not been performed, nor a comparative study, here we show some qualitative observations for an ordinary year, a year with a rainfall similar to that of El Niño and one year with extraordinary overflow. The scope of this Study is focused on a rainfall with 50 year return period, as indicated in the Figure below, which is equivalent to the rainfall producing the sediment flow from the tributaries.
(i) An ordinary year ・ Almost no sediments are produced from the hillsides
・ Sediments are produced by the encounter of water current with the sediment deposit detached from the hillsides and deposited at the bottom of terraces
・ It is considered that the entrainment is produced by this mechanism: the sediments accumulated in the sand banks within the bed are pushed and transported downstream by

Preparatory study on the protection program for valleys and rural communities vulnerable to floods in Peru
Profile Study Report (Pre-feasibility level),Majes-Camana River
3-47
the bed change during low overflows (see Figure 3.1.8-19)
Figure 3.1.8-19 Production and entrainment of sediments in an ordinary year
(ii) When torrential rains with magnitude similar to that of the El Niño happen (50 years return period)
Pursuant to the interviews performed in the locality, every time El Niño phenomenon occurs the tributary sediment flow occurs. However, since the bed has enough capacity to regulate sediments, the influence on the lower watershed is reduced. ・ The amount of sediments entrained varies depending on the amount of water running by
the hillsides ・ The sediment flow from the tributaries reaches to enter to the main river ・ Since the bed has enough capacity to regulate the sediments, the influence in the
watershed is reduced
Figure 3.1.8-20 Production and entrainment of sediments during the torrencial rainfall of
magnitude similar to that of El Niño (1:50 year return period)

Preparatory study on the protection program for valleys and rural communities vulnerable to floods in Peru
Profile Study Report (Pre-feasibility level),Majes-Camana River
3-48
(iii) Large magnitude overflows (which may cause the formation of terraces similar to those existing now), with a 1:10.000 year return period
In the coast, daily rainfall with 100 years of probability are approximately 50 mm, so land slides entrained by water scarcely occur currently. However, precisely since there are few rains, when torrential rainfall occurs, there is a high potential of water sediment entrainment.
If we suppose that rainfall occurs with extremely low possibilities, for example, 1:10.000 years, we estimate that the following situation would happen (see Figure 3.1.8-21).
・ Sediment entrainment from hillsides, by the amount congruent with water amount ・ Exceeding sediment entrainment from the bank and bottom of hillsides by the amount
congruent with the water amount, provoking landslides which may close streams or beds ・ Destruction of the natural embankments of beds closed by the sediments, sediment flow by
the destruction of sand banks ・ Formation of terraces and increase of sediments in the beds of lower watershed due to the
large amount of sediments ・ Overflowing in section between alluvial cone and critical sections, which may change the bed.
Figure 3.1.8-21 Production of sediments in large overflowing (geologic scale)

Preparatory study on the protection program for valleys and rural communities vulnerable to floods in Peru
Profile Study Report (Pre-feasibility level),Majes-Camana River
3-49
3.1.9 Run off analysis
(1) Rainfall data
1) Current rainfall monitoring system
The current rainfall data collection system used for the discharge analysis was reviewed; besides, the necessary rainfall data was collected and processed for such analysis. Rainfall data was obtained from SENAMHI and ELECT.PERU.
Tables 3.1.9-1~2 and Figure 3.1.9-1 indicate the rainfall monitoring points and the data collected according to the period in Majes-Camana River watershed.
In Majes-Camana river watershed rainfall monitoring is performed in 48 stations (including those currently non-operative), since 1964.
However, it should be mentioned that in some points it was not possible to obtain the accurate data, due to a prolonged lapse where the data collection was stopped in some stations or for any other reasons. Thus, the discharge analysis was carried out using data from 38 stations which registered data relatively accurate. These stations are those indicated in Table 3.1.9-1.

Preparatory study on the protection program for valleys and rural communities vulnerable to floods in Peru
Profile Study Report (Pre-feasibility level),Majes-Camana River
3-50
Table 3.1.9-1 List of rainfall monitoring stations (Majes-Camana river watershed)
Andahua 15° 29'37 72° 20'57 3528Aplao 16° 04'10 72° 29'26 645Ayo 15° 40'45 72° 16'13 1956Cabanaconde 15° 37'7 71° 58'7 3379Camaná 16° 36'24 72° 41'49 15Caravelí 15° 46'17 73° 21'42 1779Chachas 15° 29'56 72° 16'2 3130Chichas 15° 32'41 72° 54'59.7 2120Chiguata 16° 24'1 71° 24'1 2943Chinchayllapa 14° 55'1 72° 44'1 4497Chivay 15° 38'17 71° 35'49 3661Choco 15° 34'1 72° 07'1 3192Chuquibamba 15° 50'17 72° 38'55 2832Cotahuasi 15° 22'29 72° 53'28 5088Crucero Alto 15° 46'1 70° 55'1 4470El Frayle 16° 05'5 71° 11'14 4267Huambo 15° 44'1 72° 06'1 3500Imata 15° 50'12 71° 05'16 4445La Angostura 15° 10'47 71° 38'58 4256La Joya 16°35'33 71°55'9 1292La Pampilla 16° 24'12.2 71° 31'.6 2400Lagunillas 15° 46'46 70° 39'38 4250Las Salinas 16° 19'5 71° 08'54 4322Machahuay 15° 38'43 72° 30'8 3150Madrigal 15° 36'59.7 71° 48'42 3262Orcopampa 15° 15'39 72° 20'20 3801Pampa de Arrieros 16° 03'48 71° 35'21 3715Pampa de Majes 16° 19'40 72° 12'39 1434Pampacolca 15° 42'51 72° 34'3 2950Pampahuta 15° 29'1 70° 40'33.3 4320Pillones 15° 58'44 71° 12'49 4455Porpera 15° 21'1 71° 19'1 4152Pullhuay 15° 09'1 72° 46'1 3113Salamanca 15° 30'1 72° 50'1 3303Sibayo 15° 29'8 71° 27'11 3827Sumbay 15° 59'1 71° 22'1 4294Tisco 15° 21'1 71° 27'1 4175Yanaquihua 15° 46'59.8 72° 52'57 2815

Preparatory study on the protection program for valleys and rural communities vulnerable to floods in Peru
Profile Study Report (Pre-feasibility level),Majes-Camana River
3-51
Table 3.1.9-2 Period of rainfall data collection (Majes-Camana river watershed) Estaciones
meteorológicas AÑ
O19
6419
6519
6619
6719
6819
6919
7019
7119
7219
7319
7419
7519
7619
7719
7819
7919
8019
8119
8219
8319
8419
8519
8619
8719
8819
8919
9019
9119
9219
9319
9419
9519
9619
9719
9819
9920
0020
0120
0220
0320
0420
0520
0620
0720
0820
0920
1020
11
Socabaya
Chiguata
Pillones
Las Salinas
Santo Tomás
La Pulpera
Sumbay
Porpera
Pampa de Arrieros
Lagunillla
Caylloma
La Angostura
Sibayo
Yauri
Chivay
Pampahuta
Codoroma
Cotahuasi
Caraveli
Chuquibamba
Pampacolca
Pampa de Majes
Camaná
Aplao
La Pampilla
Yanaquihua
Imata
Cabanaconde
Salamanca
Crucero Alto
La Joya
Machahuay
Huanca
Chinchas
Chinchayllapa
El Frayle
Tisco
Puica
Pullhuay
Andahua
Orcopampa
Chachas
Ayo
Choco
Huambo
Madrigal
Yanacancha
Yanque

Preparatory study on the protection program for valleys and rural communities vulnerable to floods in Peru
Profile Study Report (Pre-feasibility level),Majes-Camana River
3-52
Figure 3.1.9-1 Monitoring stations location map (Majes-Camana River watershed)
2) Isohyet map
Figure 3.1.9-2 shows a map of the isohyet of Majes-Camana River watershed. This watershed is characterized by the considerable variation of the annual rainfall depending on the zones, with a minimum of 50mm and a maximum of 750 mm approximately. The rainfall is lower when it is closer to the Pacific coast (low watershed), and it increases as the altitudes increase (high watershed).
The annual rainfall in the low watershed, subject to the control of floods, is reduced ranging from 50 to 200 mm.

Preparatory study on the protection program for valleys and rural communities vulnerable to floods in Peru
Profile Study Report (Pre-feasibility level),Majes-Camana River
3-53
Figure 3.1.9-2 Isohyet Map (Majes-Camana River watershed)
(2) Rainfall analysis
1) Methodology
The statistic hydrologic calculation was made using the rainfall data collected from several stations, to determine the rainfall with 24 hour return period in every station.
Several models of distribution of return periods were tested and the most adequate one was adopted. Thus, the precipitation with 24 hours return period was determined with this model.
The statistic hydrologic models were.
・ Normal distribution (Normal) ・ Normal logarithmic distribution (Log Normal) ・ Log Pearson Typo III distribution (the log Pearson III) ・ Gumbel distribution (Gumbel)
2) Results of the rainfall analysis of return period– t
The rainfall of several stations are shown below and the reference point of each watershed, according to return periods.
Table 3.1.9-3 shows the monitoring points and the rainfall with 24 hour return period in the reference point (Socsi Station). Figure 3.1.9-3 shows the map of isohyets of rainfall with 50 year return period.

Preparatory study on the protection program for valleys and rural communities vulnerable to floods in Peru
Profile Study Report (Pre-feasibility level),Majes-Camana River
3-54
Table 3.1.9-3 Rainfall with 24 hour return period (Majes-Camana river watershed)
Station Latitude LongitudeAltitude (masl)
2 5 10 25 50 100 200
Andahua 15° 29'37 72° 20'57 3538 24.30 31.33 34.83 38.29 40.33 42.02 43.43Aplao 16° 04'10 72° 29'26 625 1.71 5.03 7.26 9.51 10.71 11.56 12.14Ayo 15° 40'45 72° 16'13 1950 10.28 16.43 20.51 25.66 29.48 33.27 37.05Cabanaconde 15° 37'7 71° 58'7 3369 26.58 37.88 45.89 56.58 64.95 73.67 82.79Camaná 16° 36'24 72° 41'49 29 3.18 7.16 9.79 13.11 15.58 18.03 20.46Caravelí 15° 46'17 73° 21'42 1757 7.67 16.07 22.60 31.46 38.30 45.21 52.15Chachas 15° 29'56 72° 16'2 3130 22.21 28.60 32.08 35.83 38.24 40.37 42.30Chichas 15° 32'41 72° 54'59.7 2120 16.28 23.47 27.01 30.37 32.23 33.67 34.80Chiguata 16° 24'1 71° 24'1 2945 18.88 29.98 37.33 46.40 52.94 59.27 65.42Chinchayllapa 14° 55'1 72° 44'1 4514 23.12 31.21 36.57 43.34 48.37 53.35 58.32Chivay 15° 38'17 71° 35'49 3663 24.50 32.74 38.20 45.09 50.21 55.29 60.35Choco 15° 34'1 72° 07'1 3160 16.10 22.92 27.45 33.16 37.39 41.60 45.79Chuquibamba 15° 50'17 72° 38'55 2839 21.65 36.96 47.09 59.89 69.39 78.82 88.21Cotahuasi 15° 22'29 72° 53'28 5086 21.20 29.97 35.78 43.12 48.56 53.96 59.35Crucero Alto 15° 46'1 70° 55'1 4486 25.33 31.66 35.20 39.10 41.67 44.02 46.17El Frayle 16° 05'5 71° 11'14 4110 22.33 29.95 35.43 42.89 48.83 55.12 61.82Huambo 15° 44'1 72° 06'1 3500 22.87 30.14 34.96 41.05 45.57 50.05 54.52Imata 15° 50'12 71° 05'16 4451 28.35 37.09 42.87 50.18 55.60 60.98 66.34La Angostura 15° 10'47 71° 38'58 4260 35.90 45.89 53.22 63.31 71.46 80.18 89.57La Joya 16°35'33 71°55'9 1279 1.22 4.74 7.89 11.93 14.65 16.98 18.92La Pampilla 16° 24'12.2 71° 31'.6 2388 12.65 21.64 27.66 35.01 40.23 45.20 49.94Lagunillas 15° 46'46 70° 39'38 4385 28.55 34.30 37.75 41.81 44.67 47.40 50.05Las Salinas 16° 19'5 71° 08'54 3369 18.05 25.72 30.80 37.22 41.98 46.70 51.41Machahuay 15° 38'43 72° 30'8 3000 21.06 29.80 34.71 40.03 43.45 46.46 49.14Madrigal 15° 36'59.7 71° 48'42 3238 23.63 30.07 33.66 37.59 40.17 42.50 44.63Orcopampa 15° 15'39 72° 20'20 3805 21.51 29.58 36.83 48.66 59.81 73.37 89.92Pampa de Arrieros 16° 03'48 71° 35'21 3720 18.86 32.08 40.82 51.88 60.07 68.21 76.32Pampa de Majes 16° 19'40 72° 12'39 1442 2.07 6.68 10.56 15.55 18.98 22.04 24.69Pampacolca 15° 42'51 72° 34'3 2895 21.13 29.11 34.40 41.08 46.04 50.95 55.86Pampahuta 15° 29'1 70° 40'33.3 4317 34.18 39.66 42.87 46.58 49.14 51.57 53.89Pillones 15° 58'44 71° 12'49 4428 24.00 32.95 38.88 46.36 51.92 57.43 62.92Porpera 15° 21'1 71° 19'1 4142 27.40 40.61 49.37 60.42 68.63 76.77 84.88Pullhuay 15° 09'1 72° 46'1 3098 24.47 32.43 37.63 44.15 48.97 53.77 58.60Salamanca 15° 30'1 72° 50'1 3153 19.86 26.64 31.13 36.81 41.02 45.20 49.36Sibayo 15° 29'8 71° 27'11 3839 31.25 38.61 42.98 48.06 51.59 54.93 58.13Sumbay 15° 59'1 71° 22'1 4300 25.43 35.57 43.10 53.56 62.08 71.26 81.17Tisco 15° 21'1 71° 27'1 4198 33.41 42.74 51.24 65.12 78.15 93.95 113.15Yanaquihua 15° 46'59.8 72° 52'57 2834 20.70 35.78 45.76 58.38 67.74 77.03 86.29
Precipitation for T (years)Coordinates
Figure 3.1.9-3 Map of isohyets of a 50 years period rainfall (Majes-Camana river watershed)
(3) Run off analysis
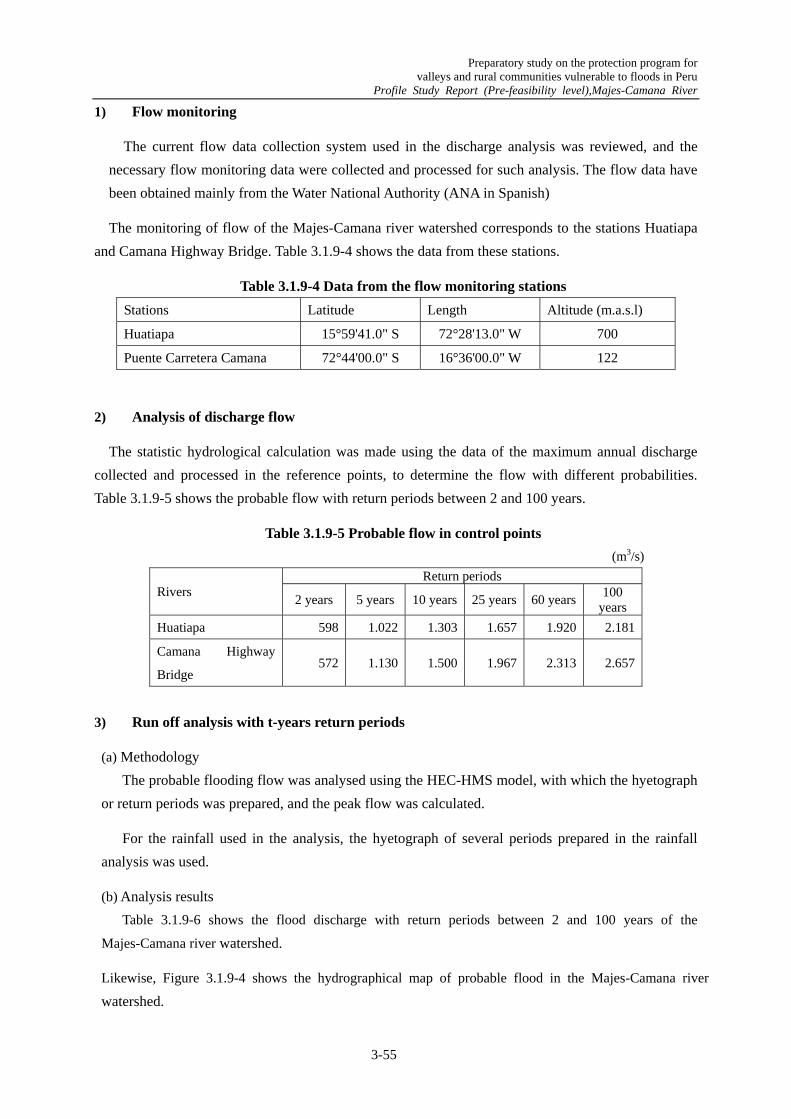
Preparatory study on the protection program for valleys and rural communities vulnerable to floods in Peru
Profile Study Report (Pre-feasibility level),Majes-Camana River
3-55
1) Flow monitoring
The current flow data collection system used in the discharge analysis was reviewed, and the necessary flow monitoring data were collected and processed for such analysis. The flow data have been obtained mainly from the Water National Authority (ANA in Spanish)
The monitoring of flow of the Majes-Camana river watershed corresponds to the stations Huatiapa and Camana Highway Bridge. Table 3.1.9-4 shows the data from these stations.
Table 3.1.9-4 Data from the flow monitoring stations Stations Latitude Length Altitude (m.a.s.l)
Huatiapa 15°59'41.0" S 72°28'13.0" W 700
Puente Carretera Camana 72°44'00.0" S 16°36'00.0" W 122
2) Analysis of discharge flow
The statistic hydrological calculation was made using the data of the maximum annual discharge collected and processed in the reference points, to determine the flow with different probabilities. Table 3.1.9-5 shows the probable flow with return periods between 2 and 100 years.
Table 3.1.9-5 Probable flow in control points (m3/s)
Rivers Return periods
2 years 5 years 10 years 25 years 60 years 100 years
Huatiapa 598 1.022 1.303 1.657 1.920 2.181
Camana Highway
Bridge 572 1.130 1.500 1.967 2.313 2.657
3) Run off analysis with t-years return periods
(a) Methodology
The probable flooding flow was analysed using the HEC-HMS model, with which the hyetograph or return periods was prepared, and the peak flow was calculated.
For the rainfall used in the analysis, the hyetograph of several periods prepared in the rainfall analysis was used.
(b) Analysis results
Table 3.1.9-6 shows the flood discharge with return periods between 2 and 100 years of the
Majes-Camana river watershed.
Likewise, Figure 3.1.9-4 shows the hydrographical map of probable flood in the Majes-Camana river watershed.

Preparatory study on the protection program for valleys and rural communities vulnerable to floods in Peru
Profile Study Report (Pre-feasibility level),Majes-Camana River
3-56
Table 3.1.9-6 Flood flow according to the return periods (Peak flow: Reference point)
(m3/s) Return period Rivers 2 years 5 years 10 years 25 years 50 years 100 years Huatiapa 270 728 1.166 1.921 2.659 3.586
Figure 3.1.9-4 Hydrograph of Majes-Camana river
3.1.10 Analysis of inundation
(1)River surveys
Prior to the flood analysis, the transversal survey or Majes-Camana river was performed as well as the longitudinal survey of dikes. Table 3.1.10-1 shows the results of the surveys in the river subject of this Study.
In order to obtain the topographic data for the analysis of the flooding zones, the results of the true measurement results indicated in Table 3.1.10-1 were used as a complement, using the satellite figures data.

Preparatory study on the protection program for valleys and rural communities vulnerable to floods in Peru
Profile Study Report (Pre-feasibility level),Majes-Camana River
3-57
Figure 3.1.10-1 Idea of unidimensional model
Table 3.1.10-1 Summary of the river surveys
Survey Unit Quantity Notes
1. Control points survey
Majes-Camana river No. 13
2. Dikes transversal
survey 250m Interval, only one shore
Majes-Camana river km 143
3. River transversal
survey 500m Interval
Majes-Camana river km 86
4. Benchmarks
Type A No. 13 Every control point
Type B No. 130 130km x one point/km
(2) Flood analysis methods
Since the DGIH carried out the flood analysis of the profile study at a program level using the HEC-RAS model, for this Study, we decided to used this method, and review and modify it, if necessary.
1)Analysis basis Normally, for the flooding analysis the following three methods are used. ① Varied flow unidimensional model ② Tank model ③ Varied flow horizontal bidimensional model
The time and cost required by each method vary considerably, so only the most efficient method will be chosen, which guarantees the necessary accurateness degree for the preparation of the floodable zone maps.
Table 3.1.10-2 shows the characteristics of each analysis method. From the results of the simulation

Preparatory study on the protection program for valleys and rural communities vulnerable to floods in Peru
Profile Study Report (Pre-feasibility level),Majes-Camana River
3-58
performed by DGIH, it is known that the rivers have a slope between 1/100 and 1/300, so initially the varied flow one-dimensional model was chosen assuming that the floods were serious. However, we considered the possibility that the overflowed water extends within the watershed in the lower watershed, so for this study the variable regimen horizontal bi-dimensional model was used to obtain more accurate results
Table 3.1.10-2 Methodology of flooding analysis Analysis methods Vary flow unidimensional model Tank model Varied flow bi-dimensional horizontal
model Basic concept of the flood zone definition
In this method, the flood zone is considered to be included in the river bed, and the flood zone is determined by calculating the water level of the bed in relation to the maximum flooding flow
This method manages the flood zone and bed separately, and considers the flooding zone as a closed body. This closed water body is called pond where the water level is uniform. The flood zone is determined in relation to the relationship between the overflowed water from the river and entered to the flood zone, and the topographic characteristics of such zone (water level– capacity– surface).
This method manages the flood zones and the bed separately, and the flood zone is determined by analyzing the bidimensional flow of the behaviour of water entered to the flood zone.
Approach
Characteristics It is applicable to the floods where the overflowed water runs by the flood zone by gravity; that means, current type floods. This method must manage the analysis area as a protected area (without dikes).
Applicable to blocked type floods where the overflowed water does not extend due to the presence of mountains, hills, embankments, etc. The water level within this closed body is uniform, without flow slope or speed. In case there are several embankments within the same flood zone, it may be necessary to apply the pond model in series distinguishing the internal region.
Basically, it is applicable to any kina of flood. Reside the flood maximum area and the water level, this method allows reproducing the flow speed and its temporary variation. It is considered as an accurate method compared with other methods, and as such, it is frequently applied in the preparation of flood irrigation maps. However, due to its nature, the analysis precision is subject to the size of the analysis model grids.
2) Inundation analysis method
Figure 3.1.10-2 shows the conceptual scheme of the variable regimen horizontal bi-dimensional model.
The bedn and the flood as a whole
Flood zone
Flood zone Flood zone, Bed
Limit
Bed

Preparatory study on the protection program for valleys and rural communities vulnerable to floods in Peru
Profile Study Report (Pre-feasibility level),Majes-Camana River
3-59
4.外力条件
越水
カルバート
1.上流端条件整備計画モデル等による推定ハイドログラフ
2.下流端条件水位データ(朔望平均満潮位等)
破堤
盛土
1.はん濫原モデル
◆はん濫原内は平面二次元計算によりはん濫流の拡散形態を把握する。◆50m四方のメッシュ形状に分割し、各メッシュに標高、粗度、盛土構造物といったはん濫流に影響を与える情報を入力する。
2.河道モデル
◆各横断面の断面特性を把握◆一次元不定流計算により各断面の流量ハイドログラフを把握◆計算条件は、浸水想定区域図作成時の河道計算条件と整合を図る。
3.破堤・越水モデル
◆各断面は破堤開始水位に達したら即破堤する◆破堤幅、越流幅を設定◆破堤地点におけるはん濫流量を時系列計算し、はん濫原に供給する
◆はん濫解析モデルイメージ
Figure 3.1.10-2 Conceptual scheme of the overflow analysis model
(3) Discharge capacity analysis
The current discharge capacity of the beds was estimated based on the results of the river survey and applying the HEC-RAS method, which results appear in Figure 3.1.10-3. This Figure also shows the flooding flows of different return periods, which allow evaluating in what points of the Majes-Camana river watershed flood may happen and what magnitude of flood flow may they have.
Overflow analysis model
2. Bed model Identify the characteristics of every section Prepare the hydrographical study of the flow
of every section applying the varied flow unidimensional model.
Apply the same calculation base applied for the bed calculation in the preparation of the floodable zone map.
1. Floodable zones model For the flood zone, identify the pattern of water flow
extension by applying the horizontal bidimensional model.
Section the zone in a 50m × 50m grid, enter the features that may have an effect on the water flow, for instance, altitudes, roughness, embankments, etc.
Embankment
Box-culvert
Overflow
Dike breakage
3. Dike breakage and water overflow model Each section is immediately broken once
they arrive to the beginning of the breakage level.
Define the dike breakage overflow and the width
Make the temporary calculation of the overflow charge in the dike breakage point and provide the data to the floodable zones.
1. Conditions of the high watershed shore Hydrographical study mathematically calculated y applying the rehabilitation Project model.
4. External forces
1. Conditions of the low watershed shore Data of the water level (médium level of water in the high tide)

Preparatory study on the protection program for valleys and rural communities vulnerable to floods in Peru
Profile Study Report (Pre-feasibility level),Majes-Camana River
3-60
Figure 3.1.10-3(1) Current discharge capacity of Majes River
Figure 3.1.10-3(2) Current discharge capacity of Camana River

Preparatory study on the protection program for valleys and rural communities vulnerable to floods in Peru
Profile Study Report (Pre-feasibility level),Majes-Camana River
3-61
(4)Inundation area
As a reference, Figures 3.1.10-4 show the results of the inundation area calculation in the Majes-Camana river watershed compared to the flooding flow with a 50 year return period.
Figure 3.1.10-4(1) Inundation area of Majes-Camana river

Preparatory study on the protection program for valleys and rural communities vulnerable to floods in Peru
Profile Study Report (Pre-feasibility level),Majes-Camana River
3-62
(50 year period floods)
Figure 3.1.10-4(2) Inundation area of Majes-Camana river
(50 year period floods) (2)

Preparatory study on the protection program for valleys and rural communities vulnerable to floods in Peru
Profile Study Report (Pre-feasibility level),Majes-Camana River
3-63
Figure 3.1.10-4(3) Inundation area of Majes-Camana river (50 year period floods) (3)

Preparatory study on the protection program for valleys and rural communities vulnerable to floods in Peru
Profile Study Report (Pre-feasibility level),Majes-Camana River
3-64
3.2 Definition of Problem and Causes 3.2.1 Problems of flood control measures in the Study Area Based on the results of the Majes-Camana River, the main problem on flood control was identified, as well as the structures to be protected, which results are summarized in Table 3.2.1-1.
Table 3.2.1-1 Problems and conservation measures of flood control works
Problems Overflowing Dike
erosionBanks erosion
Non-working intake
Non-working derivation
works Without
dikes Sediment in
bed Lack of width
Structures to be
protected
Agricultural lands ○ ○ ○ ○ ○ ○ ○
Irrigation channels ○ ○
Urban area ○ ○ ○
Roads ○
Bridges ○
3.2.2 Problem causes Next, the main problem and its direct and indirect causes for flood control in the Study Area are described: (1) Main Problem Valleys and local communities highly vulnerable to floods (2) Direct and indirect causes Table 3.2.1-2 shows the direct and indirect causes of the main problem

Preparatory study on the protection program for valleys and rural communities vulnerable to floods in Peru
Profile Study Report (Pre-feasibility level),Majes-Camana River
3-65
Table 3.2.1-2 direct and indirect causes of the main problem
Direct cause 1. Excessive flood flow 2. Overflowing 3.Insufficient maintenance of control works
4. Insufficient communitarian activities for flood control
Indirect causes
1.1 Frequent occurrence of extraordinary weather (El Niño, etc..)
2. Lack of flood control works
3.1 Lack of maintenance knowledge and skills
4.1 Lack of knowledge and flood prevention techniques
1.2 Extraordinary rains in the middle and upper basins
2.2 Lack of resources for the construction of works
3.2 Lack of training in maintenance
4.2 Lack of training in flood prevention
1.3 Vegetation cover almost zero in the middle and upper basins
2.3 Lack of plans for flood control in basins
3.3 Lack of dikes and banks repair
4.3 Lack of early warning system
1.4 Excessive sediment dragging from the upper and middle river levee
2.4 Lack of dikes 3.4 Lack of repair works and referral making
4.4 Lack of monitoring and collection of hydrological data
1.5 Reduction of hydraulic capacity of rivers by altering slopes, etc.
2.5 Lack of bed channel width
3.5 Use of illegal bed for agricultural purposes
2.6 Accumulation of sediments in beds
3.6 Lack of maintenance budget
2.7 Lack of width at the point of the bridge construction
2.8 Elevation of the bed at the point of the bridge construction
2.9 Erosion of dikes and banks
2.10 Lack of capacity for the design of the works
3.2.3 Problem Effects (1) Main Problem Valleys and local communities highly vulnerable to floods (2) Direct and indirect effects Table 3.2.3-1 shows the direct and indirect effects of the main problem

Preparatory study on the protection program for valleys and rural communities vulnerable to floods in Peru
Profile Study Report (Pre-feasibility level),Majes-Camana River
3-66
Table 3.2.3-1 Direct and indirect effects of the main problem
Direct Effects
1. Agriculture Damages
2. Direct damages to the community
3. Social infrastructure damages
4. Other economical damages
Indirect Effects
1.1 Agriculture and livestock damage
2.1 Private property and housing loss
3.1 Roads destruction 4.1 Traffic interruption
1.2 Agricultural lands loss
2.2 Industries and facilities loss
3.2 Bridges loss 4.2 Flood and evacuations prevention costs
1.3 Irrigation channels destruction
2.3 Human life loss and accidents
3.3 Running water, electricity, gas and communication infrastructures’ damages
4.3 Reconstruction costs and emergency measures
1.4 Work destruction and derivation
2.4 Commercial loss 4.4 Work loss by local
inhabitants
1.5 Dikes and banks erosion 4.5 Communities
income reduction
4.6 Life quality degradation
4.7 Loss of economical dynamism
(3) Final effect The main’s problem final effect is the community socio-economic impediment development of the affected area. 3.2.4 Causes and effects diagram Figure 3.2.4-1 shows the causes and effects diagram done based on the above analysis results.

Preparatory study on the protection program for valleys and rural communities vulnerable to floods in Peru
Profile Study Report (Pre-feasibility level),Majes-Camana River
3-67
Figure 3.2.4-1 Causes and effects diagram

Preparatory study on the protection program for valleys and rural communities vulnerable to floods in Peru
Profile Study Report (Pre-feasibility level),Majes-Camana River
3-68
3.3 Objective of the Project The final impact that the Project wants to achieve is to alleviate the vulnerability of valleys and local community to flooding and promote local economic development. 3.3.1 Solving measures for the main problem (1) Main objective Soothe the valleys and local community to flooding vulnerability. (2) Direct and indirect measures In table 3.3.1-1, direct and indirect solutions measures for the problem are shown. Table 3.3.1-1 Direct and indirect solution measures to the problem Direct measures
1. Analyze and relieve excessive flood flow
2. Prevent overflow 3. Full compliance with maintenance of flood control works
4. Encourage community flood prevention
Indirect measures
1.1 Analyze extraordinary weather (El Niño, etc..)
2.1 Construct flood control works
3.1 Strengthen maintenance knowledge and skills
4.1 Strengthen knowledge and skills to prevent flooding
1.2 Analyze extraordinary rainfall in the upper and middle basins
2.2 Provide resources for the works construction
3.2 Reinforce training maintenance
4.2 Running flood prevention training
1.3 Planting vegetation on the upper and middle basins
2.3 Develop plans for flood control basins
3.3 Maintain and repair dikes and banks
4.3 Creating early warning system
1.4 Relieve Excessive sediment entrainment from the upper and middle river dikes
2.4 Build dikes 3.4 Repair intake and derivation works
4.4 Strengthen monitoring and water data collection
1.5 Take steps to alleviate the reduction in hydraulic capacity of rivers by altering slopes, etc.
2.5 Extends the width of the channel
3.5 Control the illegal use of bed for agricultural purposes
2.6 Excavation of bed 3.6 Increase the maintenance budget
2.7 Extending the river at the bridge’s construction
2.8 Dredging at the point of the bridge construction
2.9 Control dikes and banks erosion
2.10 Strengthen the capacity for works design
3.3.2 Expected impacts for the main’s objective fulfillment (1) Final Impact The final impact that the Project wants to achieve is to alleviate the vulnerability of the valleys and the local community to floods and promoting local socio-economic development.

Preparatory study on the protection program for valleys and rural communities vulnerable to floods in Peru
Profile Study Report (Pre-feasibility level),Majes-Camana River
3-69
(2) Direct and indirect impacts In table 3.3.2-1 direct and indirect impacts expected to fulfill the main objective to achieve the final impact are shown.
Table 3.3.2-1 direct and indirect impacts Direct Impacts
1. Agricultural damage relief
2. Relief of direct harm to the community
3. Relief of social infrastructure damage
4. Relief of other economic damage
Indirect Impacts
1.1 Relief to crops and livestock damage
2.1 Housing and private properties loss prevention
3.1 Road destruction prevention
4.1 Traffic interruption prevention
1.2 Relief for farmland loss
2.2 Prevention of Industries and facilities establishments
3.2 Prevention of bridges loss
4.2 Reducing costs of flood prevention and evacuation
1.3 Prevention of the destruction of irrigation channels
2.3 Prevention of accidents and human life loss
3.3 Running water, electricity, gas and communication infrastructures’ relief
4.3 Cost reduction of the reconstruction and emergency measures
1.4 Prevention of destruction works of intake and derivation
2.4 Commercial loss relief
4.4 Increase of local community hiring
1.5 Dikes and banks erosion relief
4.5 Community income increase
4.6 Life quality improvement
4.7 Economic activities development
3.3.3 Measures - objectives – impacts Diagram In Figure 3.3.3-1 the measures - objectives – impacts diagram is shown.

Preparatory study on the protection program for valleys and rural communities vulnerable to floods in Peru
Profile Study Report (Pre-feasibility level),Majes-Camana River
3-70
Figure 3.3.3-1 Measures - objectives – impacts diagram

Preparatory study on the protection program for valleys and rural communities vulnerable to floods in Peru
Profile Study Report (Pre-feasibility level),Majes-Camana River
4-1
4. FORMULATION AND EVALUATION
4.1 Definition of the Assessment Horizon of the Project
The Project’s assessment horizon will be of 15 years, same as the one applied on the Program Profile Report.
4.2 Supply and Demand Analysis
The theoretical water level was calculated considering flowing design flood discharge based on river cross sectional survey executed with a 500m interval, in each Watershed, considering a flood discharge with a return period of 50 years. Afterwards, the dike height was determined as the sum of the design water level plus the freeboard of dike.
This is the dike height required to prevent damages caused by design floods and represents the local community demand indicator.
The height of the existing dike or the height of the present ground is that required to prevent present flood damages, and represents the present supply indicator.
The difference between the design dike (demand) and the height of the present dike or ground represents the difference or gap between demand and supply.
Table 4.2-1 shows the averages of flood water level calculated with a return period of 50 years in “3.1.9 Run-off Analysis”; of the required dike height (demand) to control the discharge adding the design water level plus the freeboard dike; the dike height or that of the present ground (supply), and the difference between these last two (difference between demand-supply) of the river. Then, Table 4.2-2 shows values of each point in Majes-Camana river. The dike height or that of the present ground is greater than the required dike height, at certain points. In these, the difference between supply and demand was considered null.
Table 4.2-1 Watershed Demand and Supply
Left Right Left Right
① ② ③ ④ ⑤=③+④ ⑥=⑤-① ⑦=⑤-②
Majes-Camana River
401.90 405.19 399.43 1.20 400.63 1.21 0.88
Basin
Theoretical water level with a 50-year return
period
Bordo libre dike
Dike height required
(demand)
Diff. Demand/supplyPresent dike / ground
height (supply)
Table 4.2-2 Demand and Supply according to the calculation
Distance (km)
Dike Height / current land (supply) Theoretical
water level with a return period of 50 years
Dike Freeboard
Required dike's height (demand)
Diff. demand/supply
Left bank Right bank Left bank Right bank
① ② ③ ④ ⑤ =③+④ ⑥ =⑤-① ⑦ =⑤-②
0.0 5.26 4.99 4.26 1.20 5.46 0.20 0.47
0.5 6.25 6.05 7.87 1.20 9.07 2.82 3.03
1.0 8.01 8.70 9.00 1.20 10.20 2.20 1.51
1.5 11.64 11.22 11.46 1.20 12.66 1.03 1.44
2.0 13.01 12.62 13.83 1.20 15.03 2.01 2.41
2.5 15.09 22.64 16.21 1.20 17.41 2.33 0.00
3.0 18.47 23.25 18.41 1.20 19.61 1.14 0.00
3.5 20.47 23.68 21.60 1.20 22.80 2.33 0.00
4.0 22.57 21.29 24.18 1.20 25.38 2.81 4.09

Preparatory study on the protection program for valleys and rural communities vulnerable to floods in Peru
Profile Study Report (Pre-feasibility level),Majes-Camana River
4-2
4.5 25.45 26.89 28.55 1.20 29.75 4.30 2.86
5.0 28.79 27.41 29.28 1.20 30.48 1.69 3.07
5.5 31.35 38.06 31.09 1.20 32.29 0.94 0.00
6.0 32.90 51.69 33.33 1.20 34.53 1.63 0.00
6.5 35.90 46.14 36.20 1.20 37.40 1.50 0.00
7.0 37.81 43.39 37.80 1.20 39.00 1.19 0.00
7.5 41.14 45.63 40.65 1.20 41.85 0.71 0.00
8.0 43.87 49.52 44.85 1.20 46.05 2.18 0.00
8.5 47.06 50.55 46.56 1.20 47.76 0.70 0.00
9.0 48.70 58.23 50.02 1.20 51.22 2.52 0.00
9.5 52.00 57.35 51.99 1.20 53.19 1.19 0.00
10.0 55.01 60.22 56.33 1.20 57.53 2.52 0.00
10.5 58.19 60.00 60.66 1.20 61.86 3.67 1.86
11.0 60.14 60.96 61.08 1.20 62.28 2.14 1.32
11.5 62.71 71.89 63.29 1.20 64.49 1.78 0.00
12.0 67.26 71.79 66.17 1.20 67.37 0.11 0.00
12.5 69.14 71.54 69.35 1.20 70.55 1.41 0.00
13.0 71.82 71.53 73.27 1.20 74.47 2.65 2.94
13.5 73.31 89.35 77.82 1.20 79.02 5.71 0.00
14.0 77.69 84.03 79.39 1.20 80.59 2.90 0.00
14.5 78.61 94.88 80.04 1.20 81.24 2.63 0.00
15.0 82.06 90.00 82.76 1.20 83.96 1.90 0.00
15.5 83.91 94.56 84.47 1.20 85.67 1.76 0.00
16.0 87.18 88.81 88.44 1.20 89.64 2.46 0.83
16.5 90.33 99.09 90.58 1.20 91.78 1.45 0.00
17.0 91.77 93.73 93.92 1.20 95.12 3.35 1.39
17.5 95.34 101.83 95.91 1.20 97.11 1.77 0.00
18.0 98.31 99.56 98.93 1.20 100.13 1.82 0.57
18.5 100.52 107.63 101.84 1.20 103.04 2.52 0.00
19.0 104.47 112.23 104.09 1.20 105.29 0.82 0.00
19.5 106.02 116.45 107.45 1.20 108.65 2.63 0.00
20.0 109.64 118.45 109.15 1.20 110.35 0.70 0.00
20.5 111.77 120.01 111.15 1.20 112.35 0.58 0.00
21.0 116.33 116.11 114.30 1.20 115.50 0.00 0.00
21.5 121.18 123.21 117.68 1.20 118.88 0.00 0.00
22.0 119.60 126.53 120.62 1.20 121.82 2.22 0.00
22.5 123.59 130.43 124.72 1.20 125.92 2.33 0.00
23.0 125.50 150.14 126.50 1.20 127.70 2.20 0.00
23.5 128.40 131.49 128.75 1.20 129.95 1.55 0.00
24.0 130.06 130.94 131.68 1.20 132.88 2.82 1.94
24.5 133.45 132.02 135.07 1.20 136.27 2.82 4.25
25.0 137.05 134.85 139.29 1.20 140.49 3.44 5.64
25.5 139.43 141.44 141.12 1.20 142.32 2.89 0.88
26.0 140.95 142.25 142.13 1.20 143.33 2.38 1.08
26.5 146.60 142.12 144.14 1.20 145.34 0.00 3.22
27.0 167.92 146.57 147.99 1.20 149.19 0.00 2.62
27.5 165.14 147.71 150.66 1.20 151.86 0.00 4.15
28.0 157.32 152.67 155.19 1.20 156.39 0.00 3.72
28.5 155.64 155.76 155.94 1.20 157.14 1.50 1.38

Preparatory study on the protection program for valleys and rural communities vulnerable to floods in Peru
Profile Study Report (Pre-feasibility level),Majes-Camana River
4-3
29.0 158.95 162.66 158.75 1.20 159.95 1.00 0.00
29.5 162.56 182.70 161.21 1.20 162.41 0.00 0.00
30.0 164.97 172.07 165.42 1.20 166.62 1.65 0.00
30.5 167.68 173.08 169.28 1.20 170.48 2.80 0.00
31.0 170.61 182.03 171.02 1.20 172.22 1.61 0.00
31.5 173.60 180.56 173.86 1.20 175.06 1.46 0.00
32.0 177.87 185.81 178.25 1.20 179.45 1.58 0.00
32.5 181.11 182.27 180.41 1.20 181.61 0.50 0.00
33.0 180.74 183.57 181.88 1.20 183.08 2.34 0.00
33.5 185.23 183.68 184.86 1.20 186.06 0.83 2.38
34.0 187.81 187.85 188.42 1.20 189.62 1.81 1.77
34.5 204.28 197.86 192.73 1.20 193.93 0.00 0.00
35.0 193.16 199.85 194.37 1.20 195.57 2.41 0.00
35.5 204.46 213.40 198.32 1.20 199.52 0.00 0.00
36.0 199.68 203.21 199.82 1.20 201.02 1.34 0.00
36.5 202.82 220.00 203.04 1.20 204.24 1.42 0.00
37.0 205.50 213.29 205.60 1.20 206.80 1.30 0.00
37.5 208.96 224.00 209.78 1.20 210.98 2.02 0.00
38.0 222.38 225.00 214.08 1.20 215.28 0.00 0.00
38.5 232.41 216.82 216.42 1.20 217.62 0.00 0.80
39.0 225.78 224.00 220.59 1.20 221.79 0.00 0.00
39.5 222.90 224.90 222.59 1.20 223.79 0.89 0.00
40.0 231.24 254.46 227.05 1.20 228.25 0.00 0.00
40.5 238.75 229.19 229.55 1.20 230.75 0.00 1.56
41.0 243.35 232.04 232.29 1.20 233.49 0.00 1.45
41.5 244.83 235.47 236.38 1.20 237.58 0.00 2.11
42.0 250.73 239.16 239.64 1.20 240.84 0.00 1.68
42.5 255.17 244.44 243.29 1.20 244.49 0.00 0.05
43.0 259.78 246.46 247.32 1.20 248.52 0.00 2.06
43.5 260.99 249.74 251.27 1.20 252.47 0.00 2.73
44.0 254.07 255.56 254.58 1.20 255.78 1.71 0.22
44.5 256.54 355.37 257.93 1.20 259.13 2.58 0.00
45.0 260.61 413.49 261.38 1.20 262.58 1.97 0.00
45.5 263.51 369.98 264.29 1.20 265.49 1.98 0.00
46.0 266.25 315.14 267.09 1.20 268.29 2.04 0.00
46.5 269.88 270.01 270.11 1.20 271.31 1.43 1.30
47.0 275.60 274.95 274.85 1.20 276.05 0.45 1.10
47.5 289.11 286.44 277.15 1.20 278.35 0.00 0.00
48.0 286.18 312.30 280.65 1.20 281.85 0.00 0.00
48.5 283.73 291.87 285.08 1.20 286.28 2.55 0.00
49.0 287.36 292.03 288.27 1.20 289.47 2.11 0.00
49.5 290.36 292.12 291.58 1.20 292.78 2.42 0.66
50.0 295.18 298.86 296.58 1.20 297.78 2.60 0.00
50.5 299.70 307.87 301.11 1.20 302.31 2.61 0.00
51.0 305.12 310.49 304.75 1.20 305.95 0.83 0.00
51.5 308.74 309.00 308.60 1.20 309.80 1.06 0.80
52.0 312.36 312.50 312.59 1.20 313.79 1.43 1.29
52.5 313.91 347.19 316.41 1.20 317.61 3.69 0.00
53.0 319.46 324.98 319.00 1.20 320.20 0.74 0.00

Preparatory study on the protection program for valleys and rural communities vulnerable to floods in Peru
Profile Study Report (Pre-feasibility level),Majes-Camana River
4-4
53.5 322.86 324.29 322.40 1.20 323.60 0.74 0.00
54.0 325.34 339.40 326.95 1.20 328.15 2.81 0.00
54.5 329.86 346.99 331.71 1.20 332.91 3.05 0.00
55.0 332.90 372.91 333.24 1.20 334.44 1.54 0.00
55.5 336.67 369.23 337.83 1.20 339.03 2.36 0.00
56.0 344.01 388.32 343.71 1.20 344.91 0.90 0.00
56.5 348.44 371.67 347.35 1.20 348.55 0.10 0.00
57.0 353.00 356.86 351.82 1.20 353.02 0.01 0.00
57.5 357.06 360.00 356.44 1.20 357.64 0.58 0.00
58.0 362.04 369.90 360.06 1.20 361.26 0.00 0.00
58.5 365.00 366.31 365.47 1.20 366.67 1.67 0.37
59.0 370.06 390.29 369.36 1.20 370.56 0.50 0.00
59.5 374.33 371.96 373.78 1.20 374.98 0.65 3.01
60.0 378.14 374.96 377.08 1.20 378.28 0.13 3.32
60.5 382.86 381.01 382.15 1.20 383.35 0.49 2.34
61.0 385.73 387.67 385.88 1.20 387.08 1.35 0.00
61.5 389.13 390.16 390.92 1.20 392.12 3.00 1.96
62.0 395.20 395.05 396.15 1.20 397.35 2.14 2.30
62.5 402.87 400.16 400.78 1.20 401.98 0.00 1.82
63.0 406.88 405.88 405.13 1.20 406.33 0.00 0.45
63.5 411.27 411.54 411.52 1.20 412.72 1.45 1.18
64.0 416.36 416.12 415.60 1.20 416.80 0.44 0.68
64.5 420.47 420.33 420.31 1.20 421.51 1.04 1.18
65.0 422.49 425.54 424.98 1.20 426.18 3.68 0.63
65.5 429.42 428.00 428.42 1.20 429.62 0.20 1.62
66.0 437.95 432.88 433.71 1.20 434.91 0.00 2.03
66.5 437.32 439.27 439.56 1.20 440.76 3.44 1.49
67.0 445.23 444.37 444.65 1.20 445.85 0.63 1.48
67.5 449.17 449.58 449.11 1.20 450.31 1.14 0.74
68.0 454.82 454.48 453.78 1.20 454.98 0.16 0.51
68.5 457.23 459.54 458.19 1.20 459.39 2.16 0.00
69.0 461.75 463.52 461.17 1.20 462.37 0.62 0.00
69.5 466.00 465.64 466.76 1.20 467.96 1.95 2.32
70.0 475.66 469.12 470.59 1.20 471.79 0.00 2.67
70.5 476.00 475.57 475.38 1.20 476.58 0.58 1.01
71.0 480.07 480.00 480.20 1.20 481.40 1.33 1.40
71.5 484.80 484.00 484.65 1.20 485.85 1.05 1.85
72.0 487.93 494.51 488.85 1.20 490.05 2.12 0.00
72.5 492.57 492.89 494.18 1.20 495.38 2.82 2.49
73.0 497.47 496.99 498.13 1.20 499.33 1.86 2.33
73.5 504.05 504.44 504.69 1.20 505.89 1.84 1.45
74.0 508.89 509.79 510.50 1.20 511.70 2.81 1.91
74.5 515.17 514.14 514.48 1.20 515.68 0.52 1.55
75.0 520.15 520.23 519.38 1.20 520.58 0.43 0.35
75.5 524.58 524.75 524.23 1.20 525.43 0.85 0.67
76.0 528.22 529.44 528.72 1.20 529.92 1.70 0.49
76.5 531.64 534.26 533.01 1.20 534.21 2.57 0.00
77.0 535.15 535.13 537.47 1.20 538.67 3.52 3.55
77.5 540.28 542.37 541.29 1.20 542.49 2.22 0.12

Preparatory study on the protection program for valleys and rural communities vulnerable to floods in Peru
Profile Study Report (Pre-feasibility level),Majes-Camana River
4-5
78.0 545.08 546.72 547.02 1.20 548.22 3.15 1.50
78.5 552.44 551.73 552.29 1.20 553.49 1.05 1.76
79.0 557.05 556.80 556.82 1.20 558.02 0.98 1.22
79.5 562.51 562.79 561.58 1.20 562.78 0.27 0.00
80.0 563.91 567.45 565.45 1.20 566.65 2.73 0.00
80.5 571.02 572.31 570.74 1.20 571.94 0.93 0.00
81.0 574.60 574.68 575.96 1.20 577.16 2.56 2.48
81.5 581.23 581.25 581.78 1.20 582.98 1.76 1.73
82.0 587.36 585.34 587.25 1.20 588.45 1.09 3.11
82.5 593.38 607.08 592.59 1.20 593.79 0.41 0.00
83.0 598.15 595.22 596.35 1.20 597.55 0.00 2.34
83.5 603.56 601.15 602.55 1.20 603.75 0.19 2.60
84.0 606.51 607.41 606.72 1.20 607.92 1.41 0.51
84.5 609.11 610.58 610.80 1.20 612.00 2.89 1.42
85.0 622.61 615.37 615.33 1.20 616.53 0.00 1.16
85.5 628.43 620.06 620.78 1.20 621.98 0.00 1.92
86.0 645.54 627.56 627.88 1.20 629.08 0.00 1.52
86.5 632.65 633.82 631.44 1.20 632.64 0.00 0.00
87.0 635.86 636.22 635.60 1.20 636.80 0.94 0.58
87.5 641.45 639.17 639.84 1.20 641.04 0.00 1.87
88.0 644.21 650.70 644.88 1.20 646.08 1.87 0.00
88.5 657.62 650.10 652.00 1.20 653.20 0.00 3.10
89.0 667.85 656.55 656.84 1.20 658.04 0.00 1.49
89.5 668.63 660.78 660.48 1.20 661.68 0.00 0.90
90.0 673.44 664.19 664.26 1.20 665.46 0.00 1.27
90.5 697.69 670.28 668.61 1.20 669.81 0.00 0.00
91.0 686.00 671.51 672.09 1.20 673.29 0.00 1.78
91.5 685.08 675.39 677.11 1.20 678.31 0.00 2.92
92.0 682.72 695.65 683.08 1.20 684.28 1.56 0.00
92.5 687.29 685.90 687.24 1.20 688.44 1.15 2.54
93.0 696.78 693.52 691.40 1.20 692.60 0.00 0.00
93.5 697.53 698.07 696.20 1.20 697.40 0.00 0.00
94.0 704.83 723.65 701.45 1.20 702.65 0.00 0.00
94.5 717.41 715.23 705.35 1.20 706.55 0.00 0.00
95.0 714.48 711.75 707.79 1.20 708.99 0.00 0.00
95.5 709.48 710.99 711.90 1.20 713.10 3.62 2.11
96.0 713.23 720.86 715.03 1.20 716.23 3.00 0.00
96.5 718.39 724.80 719.89 1.20 721.09 2.70 0.00
97.0 724.98 723.32 723.54 1.20 724.74 0.00 1.42
97.5 726.65 730.79 728.63 1.20 729.83 3.18 0.00
98.0 731.07 735.05 732.51 1.20 733.71 2.64 0.00
98.5 744.51 735.62 736.96 1.20 738.16 0.00 2.54
99.0 748.48 740.07 742.15 1.20 743.35 0.00 3.28
99.5 746.53 746.62 747.23 1.20 748.43 1.90 1.81
100.0 765.13 752.28 751.97 1.20 753.17 0.00 0.89
100.5 757.25 757.09 758.02 1.20 759.22 1.97 2.13
101.0 773.81 762.97 763.84 1.20 765.04 0.00 2.07
101.5 772.00 770.41 771.41 1.20 772.61 0.61 2.20
102.0 787.47 774.78 775.79 1.20 776.99 0.00 2.21

Preparatory study on the protection program for valleys and rural communities vulnerable to floods in Peru
Profile Study Report (Pre-feasibility level),Majes-Camana River
4-6
102.5 789.63 788.67 780.50 1.20 781.70 0.00 0.00
103.0 797.97 785.87 785.38 1.20 786.58 0.00 0.71
103.5 790.00 788.37 790.71 1.20 791.91 1.91 3.54
104.0 794.00 792.84 794.60 1.20 795.80 1.80 2.96
104.5 807.88 799.11 799.42 1.20 800.62 0.00 1.51
105.0 813.04 803.88 804.74 1.20 805.94 0.00 2.06
105.5 817.72 811.80 811.40 1.20 812.60 0.00 0.80
106.0 821.32 822.80 819.76 1.20 820.96 0.00 0.00
106.5 836.00 838.53 824.77 1.20 825.97 0.00 0.00
107.0 838.79 865.15 829.33 1.20 830.53 0.00 0.00
107.5 833.74 837.90 834.59 1.20 835.79 2.05 0.00
108.0 839.44 840.38 840.27 1.20 841.47 2.03 1.09
108.5 856.86 850.08 846.01 1.20 847.21 0.00 0.00
109.0 864.52 849.96 850.89 1.20 852.09 0.00 2.13
109.5 872.07 859.31 857.34 1.20 858.54 0.00 0.00
110.0 866.43 865.82 864.47 1.20 865.67 0.00 0.00
110.5 881.45 872.36 871.32 1.20 872.52 0.00 0.16
111.0 881.73 878.24 878.10 1.20 879.30 0.00 1.06
111.5 949.26 892.01 887.60 1.20 888.80 0.00 0.00
112.0 912.40 904.94 894.99 1.20 896.19 0.00 0.00
112.5 904.46 911.05 895.00 1.20 896.20 0.00 0.00
113.0 907.55 912.94 901.88 1.20 903.08 0.00 0.00
113.5 916.04 920.44 904.26 1.20 905.46 0.00 0.00
114.0 923.28 921.43 911.74 1.20 912.94 0.00 0.00
114.5 929.36 925.09 916.79 1.20 917.99 0.00 0.00
115.0 929.96 929.64 918.22 1.20 919.42 0.00 0.00
115.5 933.64 931.67 922.65 1.20 923.85 0.00 0.00
Average 401.90 405.19 399.37 1.20 400.57 1.21 0.89
4.3 Technical Planning
4.3.1 Structural Measures
As structural measures it is necessary to prepare a flood control plan for the whole Watershed. The later section 4.12 “Medium and Long Term Plan” and 4.12.1 “General Flood Control Plan” details results on the analysis. This plan proposes the construction of dikes for flood control in the entire Watershed. However, in the case of each watershed, a big project needs to be set up investing very high costs, far beyond those considered in the budget of the present Project, which makes it difficult to take this proposal. Therefore, supposing the flood control dikes in the whole watershed are to be built progressively within a medium and long term plan, hereinafter they would be focused on the study of more urgent and priority works for flood prevention.
(1) Design flood discharge
1) Guideline for flood control in Peru The Methodological Guide for Projects on Protection and/or Flood Control in Agricultural or Urban Areas prepared by the Public Sector Multiannual Programming General Direction (DGPM) of the Economy and Finance Ministry (MEF) recommends to carry out the comparative analysis of different return periods: 25 years, 50 years and 100 years for the urban area, and 10 years, 25 years and 50 years for rural area and agricultural lands.

Preparatory study on the protection program for valleys and rural communities vulnerable to floods in Peru
Profile Study Report (Pre-feasibility level),Majes-Camana River
4-7
Considering that the present Project is focused on the protection of rural and agricultural areas, the design flood discharge should be the discharge with return period of 10year to 50-year.
2) Maximum discharge in the past and design flood discharge
The yearly maximum discharge in the watershed is as shown in Figure-4.3.1. Based on the figure, the maximum discharge in the past can be extracted as shown in the Table- 4.3.1-1 together with the flood discharges with different return periods.
The maximum discharge in the past in Majes-Camana watershed is less than the flood discharge with return period of 50-year. However it seems that the flood discharge with return period of 50-year caused large damages.
Since the flood control facilities in Peru not well developed, it is true that the past floods caused much disaster so that the facilities should be safe for the same scale of flood with return period of 50 years, therefore the design flood discharge in this Project is to be the discharge with return period of 50-year.
Table‐4.3.1-1 Flood discharge with different return period(m3/sec)
Watershed 2-year 10-year 25-year 50-year 100-yearMax. inthe Past
Majes-Camana 270 1,166 1,921 2,659 3,586 2,021
Figure- 4.3.1-1 Yearly Max. Discharge (Majes-Camana)
3) Relation among probable flood, Damage and inundation area
The relation among probable flood, Damage and inundation area in each watershed are shown in the Figure-4.3.1-2.
Based on the figures the following facts can be expressed.
① The more increase probable flood discharge, the more increase inundation area (green line in the figure).
② The more increase probable flood discharge, the more increase damage (red line in the figure).
③ According to increase of probable flood discharge, the damage with project increase gently (blue line in the figure).
④ According to increase of probable flood discharge, damage reduction (difference between red line and blue line) increase steadily, and it reaches maximum at the probable flood of 50- year within the scope of study.
As shown in the above section, the design flood discharge with return period of 50-year is more than the maximum flood in the past, and absolute damage reduction amount in the design discharge is largest among the probable flood discharge less than with return period of 50-year, and economic

Preparatory study on the protection program for valleys and rural communities vulnerable to floods in Peru
Profile Study Report (Pre-feasibility level),Majes-Camana River
4-8
viability of the design flood is confirmed.
Figure-4.3.1-2 Probable Flood Discharge, Damage Amount and Inundation Area
(Majes-Camana river)
(2) Topographical survey
The topographical survey was carried out in selected places for the execution of structural measurements (Table 4.3.1-2). The preliminary design of control works was based on these topographical survey results.
Table 4.3.1-2 Quantities of Topographical Survey River Topographical Uplift Transverse Uplift
Majes - Camana
S = 1/2.500 S = 1/100, 100 m interval Ha km 193 21,3
(3) Selection of flood protection works with high priority
1) Basic Guidelines
For the selection of priority flood protection works, the following elements were considered:
Demand from the local community (based on historical flood damage) Lack of discharge capacity of river channel (including the sections affected by the scouring) Conditions of the adjacent area (conditions in urban areas, farmland, etc.). Conditions and area of inundation (type and extent of inundation according to inundation
analysis) Social and environmental conditions (important local infrastructures)
Based on the river survey, field investigation, discharge capacity analysis of river channel, inundation analysis, and interviews to the local community (irrigation committee needs, local governments, historical flood damage, etc.) a comprehensive evaluation was made applying the five evaluation criteria listed above. After that we selected a total of seven (7) critical points (with the highest score in the assessment) that require flood protection measures. Concretely, since the river cross sectional survey was carried out every 500m interval and discharge capacity analysis and inundation analysis were performed based on the survey results, the integral

Preparatory study on the protection program for valleys and rural communities vulnerable to floods in Peru
Profile Study Report (Pre-feasibility level),Majes-Camana River
4-9
assessment was also done for sections of 500 meters. This sections have been assessed in scales of 1 to 3 (0 point, 1 point and 2 points) and the sections of which score is more than 6 were selected as prioritized areas. The lowest limit (6 points) has been determined also taking into account the budget available for the Project in general Table 4.3.1-3 details evaluated aspects and assessment criteria.
Table 4.3.1-3 Assessment Aspects and Criteria
Assessment Aspects Description Assessment Criteria Demand of local population
● Flood damages in the past ● Demand of local population and producers
・Flooding area with big floods in the past and with great demand from local community (2 points)
・Demand of local population (1 point) Lack of discharge capacity (bank scouring)
● Possibility of river overflow given the lack of discharge capacity
● Possibility of dike and bank collapse due to scouring
・Extremely low discharge capacity (discharge capacity with return period of 10 years or less) (2 points)
・Low discharge capacity (with return period of less than 25 years) (1 point)
Conditions of surrounding areas
● Large arable lands, etc. ● Urban area, etc. ● Assessment of lands and infrastructure close to the river.
・Area with large arable lands (2 points) ・Area with arable lands mixed with towns, or big
urban area (2 points) ・Same configuration as the previous one, with
shorter scale (1 point) Inundation conditions
● Inundation magnitude ・Where overflow extends on vast surfaces (2 points)
・Where overflow is limited to a determined area (1 point)
Socio-environmental conditions (important structures)
● Intake of the irrigation system, drinking water, etc. ● Bridges and main roads (Carretera Panamericana, etc.)
・Where there are important infrastructures for the area (2 points)
Where there are important infrastructures (but less
than the first ones) for the area (regional roads, little intakes, etc.) (1 point)
2) Selection results Figure 4.3.1-3 details assessment results of the river, as well as the selection results of flood protection priority works.

Prep
arat
ory
stud
y on
the
prot
ectio
n pr
ogra
m fo
r
valle
ys a
nd ru
ral c
omm
uniti
es v
ulne
rabl
e to
floo
ds in
Per
u
Pro
file
Stu
dy R
epor
t (P
re-f
easi
bili
ty l
evel
),M
ajes
-Cam
ana
Riv
er
4-10
Figu
re 4
.3.1
-3 S
elec
tion
resu
lts o
f pri
oriti
zed
flood
pro
tect
ion
wor
ks in
Maj
es-C
aman
a R
iver

Preparatory study on the protection program for valleys and rural communities vulnerable to floods in Peru
Profile Study Report (Pre-feasibility level),Majes-Camana River
4-11
3) Basis of Selection The existing dike in Camana river presents an advanced degree of obsolescence, and numerous eroded sections can be observed. Currently, overflow occurs mainly in the upstream reach (Majes river), reducing the impact in this area. However, once this problem is solved in the upstream reach, impact would increase in this area, extending inundation area. Likewise, at 13km there are a water supply intake to the urban area of Camana and a water channel along the river. Given that currently the left bank in the 12 km of the river is eroded and feared that the effect might strike the adjacent channel. On the other hand, there are many sections without dike in Majes river so that damage by inundation and lost of farmland occur in every year. Therefore in Camana river the rehabilitation and raising of existing dike is the most important in the left bank area which has large potential of damage, and in Majes river the embankment in the area without dike and with frequent flood damage is to be executed with priority. The flood protection works in Majes river will affect the Camana river, therefore the order of the works should be carefully considered.
Table 4.3.1-4 Selected sections bases to execute works (Majes-Camana River)
No Location Basis of Selection ① 0.0km-4.5km
(left bank)
In this section the existing dike is deteriorated and eroded sections are observed scattering here and there. At present inundation in this area is reduced due to inundation in upstream area (Majes river), however when the flood protection work in the upstream will progress, which will affect this area increasing inundation area. [Characteristics of the section] ● Section where it is important to solve the obsolescence issue in the
existing dike and increase its height. ● Section where inundation in the left bank can affect the urban area of
Camana as well as its adjoining vast arable lands. ● Section where inundation risk increases associated with the
development of flood protection work in the upstream reach. [Elements to be protected] ○ Large arable lands extending in the left bank ○ Urban area of Camana city [Method of Protection] ▼It is characteristics of Camana river that once the flood discharge over
the discharge with scale of 50-years, damage increases become serious so that the protection works are to be safe for the discharge with return period of 50-years.
▼Embankment with bank protection is to be executed in the section of insufficient dike height, utilizing the existing dikes.
② 7.5km-9.5km (left bank)
In this section the existing dike is deteriorated and eroded sections are observed scattering here and there. At present inundation in this area is reduced due to inundation in upstream area (Majes river), however when the flood protection work in the upstream will progress, which will affect this area increasing inundation area. [Characteristics of the section] ● Section where it is important to solve the obsolescence issue in the
existing dike and increase its height. ● Section where inundation in the left bank can affect the urban area of
Camana as well as its adjoining vast arable lands. ● Section where inundation risk increases associated with the

Preparatory study on the protection program for valleys and rural communities vulnerable to floods in Peru
Profile Study Report (Pre-feasibility level),Majes-Camana River
4-12
development of flood protection work in the upstream reach. [Elements to be protected] ○ Large arable lands extending in the left bank ○ Urban area of Camana city [Method of Protection] ▼It is characteristics of Camana river that once the flood discharge over
the discharge with scale of 50-years, damage increases become serious so that the protection works are to be safe for the discharge with return period of 50-years.
▼Embankment with bank protection is to be executed in the section of insufficient dike height, utilizing the existing dikes.
③ 11.0km-17.0km (left bank)
In this section the existing dike is deteriorated and eroded sections are observed scattering here and there. The intake for drinking water of Camana urban area is constructed at 13km and conveyance channel along river. The left bank at 12km is eroded and feared that the effect might strike the adjacent channel. [Characteristics of the section] ● Section where it is important to solve the obsolescence issue in the
existing dike and increase its height. ●Section where inundation causes serious damage to the conveyance
channel of drinking water. [Elements to be protected] ○ Channel (of drinking water service) in the left bank [Method of Protection] ▼At present inundation in this area is reduced due to inundation in
upstream area (Majes river), however when the flood protection work in the upstream will progress, which will affect this area increasing damage in this area. The conveyance channel along the river will be also affected. In case that the channel is destroyed, the damage will be serious, therefore it will be safe in the flood with return period of 50-year.
▼Embankment with bank protection is to be executed to secure the discharge capacity in the section of insufficient dike height, utilizing the existing dikes.
④ 48.0km-50.5km (left bank)
This is a section with most insufficient discharge capacity in the river that inundates easily with small flooding and causes big damages in accordance with increase of the flood discharge. [Characteristics of the section] ●Section where it is important to build a dike to keep necessary discharge
capacity and to protect the secondary wide farmland in Majes area . [Elements to be protected] ○ Arable lands extending in the left bank (maximum area of inundation n) [Method of Protection] ▼Inundation occurs at the flood with return period of 5-year and the damage
become heavily at the flood with return period of 50-year, so that the flood protection work is implemented for the latter flood flowing down safely.
▼The combination of protection work of ④and ⑤ can increase the effect of facilities.
⑤ 52.0km-56.0km This is a section with most insufficient discharge capacity in the river that

Preparatory study on the protection program for valleys and rural communities vulnerable to floods in Peru
Profile Study Report (Pre-feasibility level),Majes-Camana River
4-13
(left bank) inundates easily with small flooding and causes big damages in accordance with increase of the flood discharge. The whole area was inundated in flooding in 1998 and damaged heavily. [Characteristics of the section] ●Section where it is important to build a dike to keep necessary discharge
capacity and to protect the secondary wide farmland in Majes area . [Elements to be protected] ○ Arable lands extending in the left bank (secondary wide farmland in
Majes area with the maximum area of inundation) [Method of Protection] ▼Inundation occurs at the flood with return period of 5-year and the damage
become heavily at the flood with return period of 50-year, so that the flood protection work is implemented for the latter flood flowing down safely.
▼The combination of protection work of ④and ⑤ can increase the effect of facilities.
⑥ 59.0km-62.5km (right bank) 59.5km-62.5km (left bank)
It is a narrow section where discharge capacity is insufficient, causing frequent flood damages in arable lands in the upstream section. There is a road bridge in the narrowness, and no dike in the adjacent area. [Characteristics of the section] ● Section where it is important to build a dike to keep necessary discharge
capacity and to protect the maximum farmland in Majes area. [Elements to be protected] ○ Arable lands in both banks of the selected stretch (largest arable lands in
Majes) [Method of Protection] ▼Inundation occurs at the flood with return period of 5-year and the damage
become heavily at the flood with return period of 50-year, so that the flood protection work is implemented for the latter flood flowing down safely.
▼The combination of protection work of ⑥ and ⑦ can increase the effect of facilities.
⑦ 65.0km-66.5km (right bank) 64.5km-66.5km (left bank)
This is a section with most insufficient discharge capacity in the river that inundates easily with small flooding and causes big damages in accordance with increase of the flood discharge. [Characteristics of the section] ● Section where it is important to build a dike to keep necessary discharge
capacity and to protect the maximum farmland in Majes area. [Elements to be protected] ○ Arable lands in both banks of the selected stretch (largest arable lands in
Majes) [Method of Protection] ▼Inundation occurs at the flood with return period of 5-year and the damage
become heavily at the flood with return period of 50-year, so that the flood protection work is implemented for the latter flood flowing down safely.
▼The combination of protection work of ⑥ and ⑦ can increase the effect of facilities.

Preparatory study on the protection program for valleys and rural communities vulnerable to floods in Peru
Profile Study Report (Pre-feasibility level),Majes-Camana River
4-14
(4) Location of prioritized flood control works In Figure 4.3.1-4 ~ Figure 4.3.1-5 the location of prioritized flood control works in indicated in each watershed and in the Table- 4.3.1-5 the summary of flood control works is indicated..
Figure 4.3.1-4 Prioritezed flood control works in Majes river
Figure 4.3.1-5 Prioritezed flood control works in Camana river

Preparatory study on the protection program for valleys and rural communities vulnerable to floods in Peru
Profile Study Report (Pre-feasibility level),Majes-Camana River
4-15
Table 4.3.1-5 Summary of Facilities
MC
10.0k-4.5k Inundation
Top W;4.0m h;2.0m-3.0m Slope;1:3 L;
4,500m0.0km-4.5km (left bank)
MC
27.5k-9.5k Inundation
Top W;4.0m h;2.0m-3.0m Slope;1:3 L;
2,000m7.5km-9.5km (left bank)
MC
311.0k-17.0k Inundation
Top W;4.0m h;2.0m-3.0m Slope;1:3 L;
6,000m11.0k-17.0k(left bank)
MC
448.0k-50.5k Inundation
Top W;4.0m h;2.0m-3.0m Slope;1:3 L;
2,500m48.0km-50.5km (left bank)
MC
552.0k-56.0k Inundation
Top W;4.0m h;2.0m-3.0m Slope;1:3 L;
4,o00m52.0k-56.0k(left bank)
MC
6
59.0k-62.5k
59.5k-62.5k
Inundation
/erosion
Top W;4.0m h;2.0m-3.0m Slope;1:3 L;
6,500m
59.0km-62.5km (left bank)
59.5km-62.5km. (right bank)
MC
7
65.0k-66.5k
64.5k-66.5kInundation
Top W;4.0m h;2.0m-3.0m Slope;1:3 L;
3,500m
65.0km.-66.5 km.(right bank)
64.5km.-66.5 km. (left bank)
Majes-
Camana
Crop land
(rice、others)
Dike(no dike
section)
Revetment
Basin Location Counter Measure Objective SectionSummary of FacilityPreservation
Object
(5) Standard section of the dike
1) Width of the crown
The width of the dike crown was defined in 4 meters, considering the dike stability when facing design overflows, width of the existing dike, and width of the access road or that of local communication.
2) Dike structure
The dike structure has been designed empirically, taking into account historic disasters, soil condition, condition of surrounding areas, etc.
Dikes are made of soil in all the Watersheds. Although there is a difference in its structure varying from area to area, this can be summarized as follows, based on the information given by the administrators interviewed:
① The gradient of the slope is mainly 1:2 (vertical: horizontal relationship); the form may vary depending on rivers and areas.
② Dike materials are obtained from the river bed in the area. Generally these are made of sand/gravel ~sandy soil with gravel, of reduced plasticity. As to the resistance of the materials, we cannot expect cohesiveness.
③ The Watershed of the Cañete River is made of loamy soil with varied pebble, relatively compacted.
④ The lower stretch of the Sullana weir of the Chira River is made of sandy soil mixed with silt. Dikes have been designed with a “zonal-type” structure where material with low permeability is placed on the riverside of the dike and the river; material with high permeability is placed on landside of the dike. However, given the difficulty to obtain material with low permeability, it has been noticed that there is lack of rigorous control of grain size distribution in supervision of construction.
⑤ When studying the damaged sections, significant differences were not found in dike material or in the soil between broken and unbroken dike. Therefore, the main cause of destruction has been water overflow.
⑥ There are groins in the Chira and Cañete rivers, and many of them are destroyed. These are made of big rocks, with filler material of sand and soil in some cases, what may suggest that destruction must been caused by loss of filler material.
⑦ There are protection works of banks made of big rocks in the mouth of the Pisco River. This structure is extremely resistant according to the administrator. Material has been obtained from quarries, 10 km. away from the site.

Preparatory study on the protection program for valleys and rural communities vulnerable to floods in Peru
Profile Study Report (Pre-feasibility level),Majes-Camana River
4-16
Therefore, the dike should have the following structure. ① Dikes will be made of material available in the zone (river bed or banks). In this case, the
material would be sand and gravel or sandy soil with gravel, of high permeability. The stability problems forecasted in this case are as follows.
i) Infiltrate destruction caused by piping due to washing away fine material ii) Sliding destruction of slope due to infiltrate pressure
In order to secure the stability of dike the appropriate standard section should be determined by infiltration analysis and stability analysis for sliding based on unit weight, strength and permeability of embankment material.
② The angle of internal friction will be between 30º ~35º if the material to be used is sandy
soil with low cohesiveness. The stable gradient of the slope of an embankment executed with material with low cohesiveness is determined as: tanθ=tanφ/n (where “θ” is gradient of the slope; “φ” is angle of internal friction and “n” is 1.5 ,safety factor). The stable slope required for an angle of internal friction of 30° is determined as: V:H=1:2.6 (tanθ=0.385). Taking into consideration this theoretical value, a gradient of the slope of 1:3.0 was considered, with more gentle inclination than the existing dikes, considering the results of the discharge analysis, the prolonged time of the design flood discharge (more than 24 hours), the fact that most of the dikes with slope of 1:2 have been destroyed, and the relative resistance in case of overflow due to unusual flooding. The infiltration analysis and stability analysis of dike based on the soil investigation and martial tests are not performed in this Study so that the slope is determined by simple stability analysis assuming the strength factors of dike material estimated by field survey of material and by adding some safety allowance. And the slope of dike in Japan is generally 1:2.0 in minimum, however the average slope will be more than 1:3.0 because the dike has several steps in every interval of 2m~3m of height.
③ The dike slope by the riverside must be protected for it must support a fast water flow given
the quite steep slope of the riverbed. This protection will be executed using big stones or big rocks easily to get in the area, given that it is difficult to get connected concrete blocks . The size of the material was determined between 30cm and 1m of diameter, with a minimum protection thickness of 1m, although these values will be determined based on flow speed of each river.
3) Freeboard of the dike The dike is made of soil material, and as such, it generally turns to be an weak structure when
facing overflow. Therefore, it is necessary to prevent water overflow, to a lower water rise than the design discharge. So it is necessary to keep a determined freeboard when facing a possible increase in water level caused by the waves by the wind during water rise, tidal, hydraulic jump, etc. Likewise, it is necessary that the dikes have sufficient height to guarantee safety in surveillance activities and flood protection work , removal of logs and other carryback material, etc.
Table 4.3.1-9 shows guidelines applied in Japan regarding freeboard. Although in Peru there is a norm on freeboard, it has been decided to apply the norms applied in Japan, considering that rivers in both countries are alike.

Preparatory study on the protection program for valleys and rural communities vulnerable to floods in Peru
Profile Study Report (Pre-feasibility level),Majes-Camana River
4-17
Table-4.3.1-6 Design discharge and freeboard
Design discharge Freeboard
Less than 200 m3/s 0.6m More than 200 m3/s, less than500 m3/s 0.8m More than 500 m3/s, less than 2,000 m3/s 1.0 m More than 2,000 m3/s, less than 5,000 m3/s 1.2 m More than 5,000 m3/s, less than10,000 m3/s 1.5 m More than 10,000 m3/s 2.0 m
Figure 4.3.1-6 Standard dike section
4.3.2 Nonstructural measures
4.3.2.1 Reforestation and vegetation recovery
(1)Basic policies
The Reforestation and Vegetation Recovery Plan satisfying the goal of the present Project can be classified in: i) reforestation along river structures; and ii) reforestation in the high Watershed. The first one contributes directly to flood control and expresses its effect in short time. The second one demands a huge investment and an extended time, as detailed in the later section 4.12 “Medium and long term Plan”, 4.12.2 “Reforestation Plan and Vegetation Recovery”, what makes not feasible to implement it in the present Project. Therefore, the analysis is here focused only in option i).
(2) Reforestation plan along fluvial structures
This proposal consists in planting trees along fluvial structures such as protection works of banks, dikes, etc.
a) Objective: Reduce impact of river overflow when water rise occurs or when river narrowing is produced by the presence of obstacles, by means of vegetation borders between the river and the elements to be protected.
b) Methodology: Create vegetation borders of a certain width between fluvial structures and the river.
c) Work execution: Plant vegetation at a side of the fluvial structures (dikes, etc.)
d) Maintenance post reforestation: The maintenance will be assumed by irrigator commissions by own initiative.
Policies for the afforestation plan to be applied in constructions on the riverbanks are detailed below. Figures 4.3.2.1-1 and 4.3.2.1-2 show afforestation plan conceptual diagrams. There are two types of afforestation. In case A-type forestation cannot be applied in the Watershed of the Majes-Camana River, B-Type afforestation will do it. In the Watersheds, with exception of the before mentioned, A-Type afforestation will be used.

Preparatory study on the protection program for valleys and rural communities vulnerable to floods in Peru
Profile Study Report (Pre-feasibility level),Majes-Camana River
4-18
Figure 4.3.2.1-1 Conceptual Diagram Afforestation in the Riverside structures (A Type) (Source: JICA Study Team)
Figure 4.3.2.1-2 Conceptual Diagram Afforestation of riverside structures (B Type) (Source: JICA Study Team)
In the Watershed of the Camana River, channels along the existing dikes have been built, and most of rice fields are covered with water. According to the interview to the Board of Users, land owners would not agree with A-Type afforestation (11-meter width afforestation) for it would reduce the arable area. Therefore afforestation is seen as a difficult issue. That is why in case the land cannot be acquired, B-Type afforestation is proposed as well as afforestation of channels for its conservation.
(3) Reforestation and Vegetation Recovery Plan along River Structures
This plan consists of conforming vegetation borders along river structures, serving as buffer zone in case for some reason water overflows the dike, etc. during water rise.
1) Structure (afforestation location)

Preparatory study on the protection program for valleys and rural communities vulnerable to floods in Peru
Profile Study Report (Pre-feasibility level),Majes-Camana River
4-19
i) A Type In Peru the most common pattern for afforestation is with equilateral triangles. This project
also uses this model by planting trees with 3-meter intervals (Figure 4.3.2.1-3). If this method is used, the interval of trees vertical to the dike will be 2.6m and in the case of zigzag arrangement, the width will be 1.3m of which interval can stop the bolder with diameter of 1m or dissipate the energy of the boulder. And 4 lines of trees can increase the effect. Thus the width of plantation zone will be 11 m adding the allowance to 10.4 m.
(Source: JICA Study Team)
Figure 4.3.2.1-3 Conceptual Diagram Afforestation in the Riverside structures (A Type)
ii) B Type: in the current situation, afforestation is applied with a 1meter interval parallel to the channel. In this plan this afforestation will be applied. Figure 4.3.2.1-4 shows the location of the afforestation design plan.
(Source: JICA Survey)
Figure 4.3.2.1-4 Conceptual Diagram Afforestation in the Riverside structures (B type)
2) Species to be afforested
Species to be planted along the river were selected applying the following criteria and submitted to an overall assessment.

Preparatory study on the protection program for valleys and rural communities vulnerable to floods in Peru
Profile Study Report (Pre-feasibility level),Majes-Camana River
4-20
① Species with adequate properties to grow and develop in the riverside (preferably native)
② Possibility of growing in plant nurseries ③ Possibility of wood and fruit use ④ Demand of local population ⑤ Native species (preferably)
After making a land survey, a list of planted or indigenous species of each zone was firstly made. Then, a list of species whose plants would grow in seedbeds, according to interviews made to plant growers, was prepared. Priority was given to the aptitude of local conditions and to plant production precedents, leaving as second priority its usefulness and demand or if they were native species or not. Table 4.3.2.1-1 shows the assessment criterion.
Table 4.3.2.1-1 Assessment criterion for forest species selection Assessment Criterion 1 2 3 4 5
Ass
essm
ent p
oint
s
A In situ testing (natural or reforested growth) Major production
Possible use as wood or for fruit production
Water demand by the Users Committee, among others
Local specie
B Growth has not been checked in situ, however it adapts in the zone
Sporadic production Possible use as wood or for fruit production
There is NO water demand by the Users Committee
No local specie
C None of the above Possible reproduction but not usual
No use as wood nor fruit - -
D Unknown Not produced Unknown - -
(Source: JICA Study Team)
Table-4.3.2.1-2 shows a list of selected species applying these assessment criterions. ⊚ marks
main species, ○ are those species that would be planted with a proportion of 30% to 50%. This proportion is considered to avoid irreversible damages such as plagues that can kill all the trees.
Table 4.3.2.1-2 Selection of forest species
Watershed Forest species Majes- Camana Watershed
Willow (⊚), Casuarina (○)
In the Watershed of the Majes-Camana River the main afforestation specie is the Willow. This
specie adapts very well in highly humid environments and there is experience in afforestation activities in the zone. This specie is generally afforested by the Users Board. However, the Willow and the Callacas are found between the seashore up to 1.5km, and still its growth is not optimal. This is due to the tide impact, for what it is proposed to replace the Willow with the Casuarina, given that the later one adapts better in salty zones. In the area there is abundance of Callacas, but they do not grow in plant nurseries. In the Watershed of the Majes- Camana River most of the fields are rice crop fields, therefore water level is high and the soil is clay soil. For this reason, the Eucalyptus is not apt for afforestation in this zone, since it may wither.
3) Volume of the Reforestation and Vegetation Recovery Plan
The afforestation plan has been selected as it is mentioned in the location and type of species plan, in the dikes and bank protection along the riverside. The width of the A-type afforestation is of 11 meters; in the case of the sedimentation well, afforestation occurs in places where river water does not pass through. In the case of B-type afforestation, it has been calculated to afforest two

Preparatory study on the protection program for valleys and rural communities vulnerable to floods in Peru
Profile Study Report (Pre-feasibility level),Majes-Camana River
4-21
lines along the dike, with 1-meter interval.
Following Table 4.3.2.1-3 shows the construction estimating for the Afforestation and Recovery of Vegetation Cover Plan for Watersheds.
Table 4.3.2.1-3 Amount of Afforestation/Vegetation Recovery Plan (Riparian Afforestation)
N° Location (bank)
Length Width Area Quantity Distribution according to the specie (unit)
(m) (m) (ha) (unit) Willow Casuarina Total B Type
Camana-1 Left 1.500 - - 3.000 1.500 1.500 3.000Camana-1 Left 3.000 - - 6.000 6.000 - 6.000Camana-2 Left 2.000 - - 4.000 4.000 - 4.000Camana-3 Left 6.000 - - 12.000 12.000 - 12.000
A Type Majes-4 Left 2.500 11 2,8 8.288 8.288 - 8.288Majes-5 4.000 11 4,4 13.024 13.024 - 13.024Majes-6 Right 3.500 11 3,9 11.544 11.544 - 11.544Majes-6 3.000 11 3,3 9.768 9.768 - 9.768Majes-7 Right 1.500 11 1,7 5.032 5.032 - 5.032Majes-7 Left 2.000 11 2,2 6.512 6.512 - 6.512
Camana-Majes River Total
18,3 79.168 79.168 1.500 79.168
(Source: JICA Study Team)
4) Areas subject to the Reforestation and Vegetation Recovery Plan
In areas subject to the Reforestation/Vegetation Recovery Plan along river structures, the structure arrangement is similar everywhere. See section 4.5.1.3(2).
5) Execution costs of the Reforestation and Vegetation Recovery Plan
Execution costs of works for the Reforestation and Vegetation Recovery Plan were estimated as follows:
- Planting unitary cost (planting unitary cost + transportation) - Labor cost
Planting providers may include i) AGRORURAL or ii) private providers. For reforestation along rivers private providers will be requested.
For labor unitary cost estimation, common labor unitary cost is proposed to be applied for riverside reforestation.
i) Planting unitary cost Planting unitary cost was defined as detailed in Table 4.3.2.1-4, based on information obtained through interviews to private providers. Given that planting prices and transportation cost varies per provider, an average Figure was applied.
Table 4.3.2.1-4 Unitary cost of plants Watersheds Species Unitary cost (unitary price +
transportation) (in Soles/plant) Majes- Camana River
Sauce 2.5 Casuarinaceae 2.8

Preparatory study on the protection program for valleys and rural communities vulnerable to floods in Peru
Profile Study Report (Pre-feasibility level),Majes-Camana River
4-22
ii) Labor cost Reforestation work performance ratio was determined in 40 trees/person-day according to
the information gathered through interviews to AGRORURAL and to irrigator commissions. As to riverside reforestation, the labor unitary cost will be 33.6 Soles/man-day. In the high Watershed 16.8 Soles/man-day, corresponding to half of the first one.
iii) Reforestation execution cost Work costs for the afforestation and vegetation cover recovery plan in the riverside structures are detailed in Table 4.3.2.1-5. The total cost of works is 504,745 Soles.
To carry out the afforestation plan a construction company is required for the execution of riverside structures. Like work construction cost, 88% of direct costs is allocated to indirect costs.
Table 4.3.2.1-5 Afforestation work cost (afforestation in riverside structures)
Nº Work location
Afforestation work cost (Soles) Direct work cost Indirect
Cost TOTAL Planting cost Sowing cost Direct cost Total 29 MC-1 7.950 2.520 126 10.596 9.346 19,94230 MC-1 15.000 5.040 252 20.292 17.898 38,19031 MC-2 10.000 3.360 168 13.528 11.932 25,46032 MC-3 30.000 10.080 504 40.584 35.795 76,37933 MC-4 20.720 6.962 348 28.030 24.722 52,75234 MC-5 32.560 10.940 547 44.047 38.849 82,89635 MC-6 28.860 9.697 485 39.042 34.435 73,47736 MC-6 24.420 8.205 410 33.035 29.137 62,17237 MC-7 12.580 4.227 211 17.018 15.010 32,02838 MC-7 16.280 5.470 274 22.024 19.425 41,449
Camana-Majes Watershed 198,370 66.501 3.325 268.196 236.549 504.745
(Source: JICA Study Team)
6) Implementation process plan
The Process Plan of afforestation works in riverbanks is part of the river structure, thus the same will be considered for the Construction Plan of the River Structure. Afforestation works should generally start at the beginning of the rainy season or just before, and must end approximately one month before the season finishes. However, there is scarce rain in the coastal area; therefore there is no effect of dry and rainy seasons. For the sake of afforestation, it is most convenient is to take advantage of water rise, but according to the Construction Schedule of the river structure there are no major afforestation issues in seasons where water level is low. The simple gravity irrigation system can be used to irrigate just planted plants during approximately the first 3 months until water level rises. This irrigation is performed using perforated horse which is a field technique actually carried out in Poechos dam area
4.3.2.2 Sediment Control Plan
(1) Importance of the Sediment Control Plan
Below flood control issues in selected Watersheds are listed. Some of them relate to sediment control. In the present Project an overall flood control plan covering both the high and the low Watershed is prepared. The study for the preparation of the Sediment Control Plan comprised the whole Watershed.
Flood water overflows bank and inundates. Rivers have a steep slope of 1/30 to 1/300. The flow speed is high, as well as the sediment transport capacity. The accumulation of large quantities of sediment and the consequent elevation of
the river bed aggravate flood damages.

Preparatory study on the protection program for valleys and rural communities vulnerable to floods in Peru
Profile Study Report (Pre-feasibility level),Majes-Camana River
4-23
There is a great quantity of sediment accumulated on the river bed forming plural sandbar. The flow route and the flow collision point are unstable, causing route change and consequently, change of flow collision point.
Riverside is highly erodible, causing a decrease of adjacent farming lands, destruction of regional roads, etc., for what they should be duly protected.
Big stones and rocks cause damages and destruction of water intakes.
(2) Sediment Control Plan (structural measures)
The sediment control plan suitable for the present sediment movement pattern was analyzed. Table 4.3.2.2-1 details basic guidelines.
Table 4.3.2.2-1 Basic guidelines of the Sediment Control Plan Conditions Typical year Precipitations with 50-year return
period
Sediment transport impact
Bank erosion and river bed change Bank erosion and river bed change Sediment flow from ravines
Measures Erosion control → Bank protection Control of riverbed variation → compaction of ground, bands (compaction of ground in the alluvial cone, bands)
Erosion control → bank protection Riverbed variation control →compaction of ground, bands (compaction of ground in the alluvial cone, bands) Sediment flow → protection of slopes, sediment control dams
Figure 4.3.2.2-1 Sediment control works

Preparatory study on the protection program for valleys and rural communities vulnerable to floods in Peru
Profile Study Report (Pre-feasibility level),Majes-Camana River
4-24
1) Sediment control plan in the high Watershed The later section 4.12 “Medium and long term Plan” 4.12.3 “Sediment Control Plan” details the sediment control plan covering the whole high Watershed. This plan will require an extremely long time with huge costs, what makes it quite not feasible. Therefore, it must be executed progressively within the medium and long term.
2)Sediment control plan in the low Watershed We observed that building sediment control dams covering the whole Watershed will demand huge costs. Therefore, the same calculation was done but reducing its scope to just the lower Watershed of the river. In this process, analysis results on riverbed variation were taken into consideration, also included in the present study.
3) Riverbed fluctuation analysis results
- The analysis results of river bed fluctuation is as shown below. The average riverbed raising shows the average of raise in the objective section in future 50 years. The average bed height has been increasing, so basically it is concluded that this is the general trend. The total variation volume of the bed and sediment transport is augmenting in the Majes-Camana river.
Total volume of dragged sediment (in thousands of m3) 20,956 Annual average of dragged sediment (in thousands of m3) 419 Total volume of riverbed variation (in thousands of m3) 5,316 Annual average of variation of riverbed height (m) 0.2
- Majes-Camana is the most susceptible to the accumulation of sediment. This tendency coincides to the field hearing results and actual riverbed conditions.
- One of the reasons why the Majes-Camana river discharges a relatively large amount of sediment is in the vast watershed area compared with other rivers, and the great magnitude of floods, what makes this river to transport large amounts of sediment downstream. While the variation of the bed (volume of sediment) is great too, looking at the average height of the bed, only 0.2 meters has changed in 50 years, and is therefore considered that the entry of sediments won’t affect much the river downstream. Therefore, it is considered that it is not necessary to take a special sediment control measure. However the sediment disaster will happen suddenly and locally so that the required river channel maintenance work will be examined with monitoring of river bed sedimentation.
4.3.3 Technical Assistance
Based on the proposals on flood control measures, a component on technical assistance is proposed
in order to strengthen risk management capabilities in the Program.
(1) Component objective
The component objective in the Program is the “Adequate capability of local population and professionals in risk management application to reduce flood damages in Watersheds”.
(2) Target area
The target area for the implementation of the present component is the Majes-Camana watershed.
In the execution stage, the implementation has to be coordinated with local authorities in the watershed. However, each authority has to execute those activities related with the characteristics of the watershed to carry out an adequate implementation.

Preparatory study on the protection program for valleys and rural communities vulnerable to floods in Peru
Profile Study Report (Pre-feasibility level),Majes-Camana River
4-25
(3) Target population
Target populations will represent irrigator associations and other community groups, provincial, district and local community governments and local people in the watershed, considering the limited capacity to receive beneficiaries of this component.
Participants are those with skills to widespread technical assistance contents of local populations in the watershed.
Besides, the participation of women has to be considered because currently only few ones participate in technical assistance opportunities.
(4) Activities
In order to achieve the above purpose, the following 3 components of study and training is to be carried out.
Component 1: Knowledge on River Bank Protection Actions in consideration of Agriculture and Natural Enviornment
Course a) River Bank Operation and Maintenance b) River Bank Plant Management c) Erosion Prevention and Mitigation Natural Resource Management
Objectives a) In this project, local populations learn suitable technology to operate and give maintenance to constructions and works from prior projects.
b) Local populations learn suitable technology on river bank plants and vegetation for flooding control purposes.
c) Local populations learn suitable technology on erosion and natural resources for flooding control purposes.
Participants a) Engineers and / or technicians from local Governments b-c) Engineers and / or technicians from local Governments and Water Users Associations,
Community representatives Times a) 12 times in all (every six (6) hours)
b) 12 times in all (every five (5) hours) c) 26 times in all (every three (3) hours)
Lecturers a) Contractors of constructions and works, Engineers from MINAG and / or the Regional Government
b-c) Engineers from MINAG and / or the Regional Government, College professors (From universities, institutes, NGOs, etc.)
Contents a-1) Suitable operation and maintenance technology for constructions and works from prior projects
a-2) Suitable operation and maintenance technology for constructions and works in this project
b-1) River bank protection with the use of plants b-2) The importance of river bank vegetation in flooding control b-3) Types of river bank plants and their characteristics c-1) Evaluation of the erosion conditions c-2) Evaluation of natural resource conditions
c-3) Erosion approach for flooding control c-4) Natural resource approach for flooding control c-5) Environmental consideration approach
c-6) Use of water resources c-7) Alternatives for suitable farming crops
Component 2: Preparation of Commnity Disaster Management Plan for Flood Control Course a) Risk management Plan Formulation
b) Detailed Risk management Plan Formulation

Preparatory study on the protection program for valleys and rural communities vulnerable to floods in Peru
Profile Study Report (Pre-feasibility level),Majes-Camana River
4-26
Objectives a) Local populations gain knowledge and learn technology to prepare a flooding control plan
b) Ditto Participants a-c) Engineers and / or technicians from local Governments and Water Users
Associations, Community representatives
Times a) 19 times in all (every four (4) hours) b) 34 times in all (every five (5) hours) c) 24 times in all (every five (5) hours)
Lecturers a-c) Engineers from MINAG and / or the Regional Government, Community Development Expert, Facilitator (local participation )
Contents a-1) Flooding control plan preparation manuals a-2) Current condition analyses for flooding control a-3) Community development alternatives by means of local participation a-4) Workshop for flooding control plan preparation b-1) Community activity planning in consideration of ecological zoning b-2) Risk management b-3) Resource management c-1) Preparation of community disaster management plan c-2) Joint activity with local governments, users’ association, etc.
Component 3: Basin Management for Anti – River Sedimentation Measures
Courses a) Hillside Conservation Techniques b) Forest Seedling Production c) Forest Seedling Planting d) Forest Resource Management and Conservation
Objectives a) Local populations learn suitable technology on hillside conservation for flooding control purposes
b) Local populations learn suitable technology on forest seedling production c) Local populations learn suitable technology on forest seedling planting d) Local populations learn suitable technology on forest resource management and
conservation Participants a-d) Engineers and / or technicians from local Governments and Water Users
Associations, Community representatives and Local People
Times a) 12 times in all (every five (5) hours) b-d) 40 times in all for three (3) “Courses on Basin Management for Anti - River Sedimentation Measures” (every five (5) hours)
Lecturers a-d) Engineers from MINAG and / or the Regional Government, College professors (From universities, institutes, NGOs, etc.)
Contents a-1) Soil characteristics and conservation on hillsides a-2) Hillside agroforestry system a-3) Animal herding system on hillsides a-4) Reforestation with traditional vegetation and plants a-5) Hillside conservation and alleviation alternatives b-1) A selection of plants that are suitable to the local characteristics
b-2) Forest seedling production technology
b-3) Control carried out by the local population’s involvement c-1) Candidate areas for forestation c-2) Forest plantation control technology c-3) Forest plantation soil technology c-4) Control carried out by the local population’s involvement
d-1) Forestation for flooding control purposes
d-2) Forest plantation control technology
d-3) Forest plantation output technology
d-4) Control carried out by the local population’s involvement

Preparatory study on the protection program for valleys and rural communities vulnerable to floods in Peru
Profile Study Report (Pre-feasibility level),Majes-Camana River
4-27
(5) Direct cost and period
The direct cost for the above activities is as shown in the Table 4.3.3-1. The total cost for the objective basin is estimated as 144,050 soles, and the brake down of the unit cost is as shown in the Annex-12, Appendix No.5. And the period required for study and training is assumed to be as same as the construction period of 2 years.
Table 4.3.3-1 Contents of technical assistance and direct cost
Item Activities
1.0Knowledge on river bank protection action inconsideration of agricu lture and naturalenvironment
1.1 Workshop on operation and maintenance of facilites event 9,300 1 9,3001.2 Workshop on river bank plantation management event 9,300 1 9,300
Prevention and mitigation for erosion event 9,300 1 9,300Natural resources management event 9,300 1 9,300
2.0Preparation of community disastermanagement plan for f lood control
2.1 Workshop on risk management plan event 8,370 1 8,3702.2 Details of 2.1 event
Community activity planning in consideration ofecological zoning
event 12,200 1 12,200
Risk management event 12,200 1 12,200Resource management event 12,200 1 12,200Preparation of community disaster managementplan
event 12,200 1 12,200
2.3 Preliminary flood forecasting and warning eventRisk management and early warning system event 9,300 1 9,300Joint activity with local government, users'association, etc.
event 5,580 1 5,580
3.0Hillside management for river sedimentationprevention
3.1 Field works for hillside conservation technique event 7,500 1 7,500Forest seedling productions event 7,900 1 7,900Forest planatation setting up event 7,900 1 7,900Forest resource management and conservation 7,900 1 7,900
3.2 Difusion of posters and leaflet 3,600 1 3,600Total 144,050
UnitUnit
price(soles)No.ofbasin
Amount(soles)
(6)Implementation Plan
The Hydraulic Infrastructure General Direction (DGIH-MINAG) executes this component as the executing unity in cooperation with the Agriculture Regional Direction (DRA), the Board of Users and related Institutions. In order to execute the activities efficiently the following has to be considered:
・ For the implementation of the present component, the DGIH-MINAG will coordinate actions with the Central Management Unit responsible for each Watershed, as well as with Regional Managements of Agriculture (DRA).
・ For the Project administration and management, the DGIH-MINAG will coordinate actions with PSI-MINAG (Sub-sector Irrigation Program with extensive experience in similar projects).

Preparatory study on the protection program for valleys and rural communities vulnerable to floods in Peru
Profile Study Report (Pre-feasibility level),Majes-Camana River
4-28
・ Considering there are some local governments that have initiated the preparation of a similar crisis management plan through the corresponding civil defense committee, under the advice of the National Institute of Civil Defense (INDECI) and local governments, the DGIH-MINAG must coordinate so that these plans be consistent with those existing in each Watershed.
・ Training courses will be managed and administered by irrigator associations (particularly the unit of skills development and communications) with the support of local governments in each Watershed, to support timely development in each town.
・Experts in disaster management departments in each provincial government, ANA, AGRORURAL, INDECI, etc. as well as (international and local) consultants will be in charge of course instruction and facilitation.

Preparatory study on the protection program for valleys and rural communities vulnerable to floods in Peru
Profile Study Report (Pre-feasibility level),Majes-Camana River
4-29
4.4 Costs 4.4.1 Cost Estimate (at private prices) (1) Project Costs Components Project costs include the following: ① Work direct costs = total number of works by type × unit price ② Common provisional works = ① x 10% ③ Construction cost -1 = ① + ② ④ Miscellaneous = ③ x 15% ⑤ Benefits = ③ x 10% ⑥ Construction cost -2 = ③+④+⑤ ⑦ Tax = ⑥ x 18% (IGV) ⑧ Construction cost = ⑥+⑦ ⑨ Environmental measures cost = ⑧x1% ⑩ Detailed design cost = ⑧ x 5% ⑪ Works supervision cost = ⑧x10% ⑫ Project Cost = ⑧+⑨+⑩+⑪ (2) Work direct costs In the Table 4.4.1-1 a summary of direct costs for structural measures is presented for the Majes-Camana River basin. (3) Project Costs The project cost is estimated in 97.2 million soles as shown in the Table 4.4.1-2. It includes reforestation and vegetation recovery costs and technical assistance. The annual operation and maintenance cost of completed works is approximately 0.5% of the constructin cost. Table 4.4.1-1 Summary Table of the work’s direct cost (at private prices)

Preparatory study on the protection program for valleys and rural communities vulnerable to floods in Peru
Profile Study Report (Pre-feasibility level),Majes-Camana River
4-30
Table 4.4.1-2 Project cost at private prices (In soles)
4.4.2 Cost Estimate (at social prices) (1) Work direct costs In the Table 4.4.2-1 a summary of direct costs for structural measures is presented for the Majes-Camana River basin. The works’ direct cost at private prices was turned into social prices applying the conversion factor. (2) Project Costs The project cost is estimated in 80.8 million soles as shown in Table 4.4.2-2. It includes reforestation and vegetation recovery costs, construction of early warning system and technical assistance, before converting from private prices.
Table 4.4.2-1 Summary of the work’s direct cost (at social prices)
Table 4.4.2-2 Project cost at social prices

Preparatory study on the protection program for valleys and rural communities vulnerable to floods in Peru
Profile Study Report (Pre-feasibility level),Majes-Camana River
4-31
4.5 Social Assessment 4.5.1 Private prices costs (1) Benefits Flood control benefits are flood loss reduction that would be achieved by the implementation of the Project and is determined by the difference between the amount of loss with and without Project. Specifically, in order to determine the benefits that will be achieved by the works’ construction. First, the flood amount per flood loss of the different return periods (between 2 to 50 years) is calculated; assuming that the flood control works have a useful life of 50 years. To finish, determine the annual average amount of the loss reduction from the loss amount of different return periods. The Methodological Guideline for Protection and/or Flood Control Projects in agricultural or urban areas, 4.1.2p-105) establishes similar procedures. Above find the description of the procedures to determine concrete benefits ① Determine the flood loss amount in the flood area by analyzing the magnitude of overflow that occurs without the Project for each return period (between 2 and 50 years)
② After, determine the amount of flood loss in the flood area by analyzing the magnitude of overflow that occurs when flood control priority works are built . ③ Determine the difference between ① and ②. Add the benefits of other works different than
dikes (intakes, roads and dams protection, etc.) in order to determine the total profits “Benefits of the Project” are considered as the sum of direct loss amount caused by overflow and indirect loss caused by the destruction of structures in vulnerable sections (farmland loss, interruption of traffic, etc.) 1) Method of loss amount calculation In this study, the amount of loss from direct and indirect damages to the variables listed in Table 4.5.1-1 was determined.
Table 4.5.1-1 Flood loss amount calculation variables Loss Variables Description
(1) Direct ① Crops Crops in flooding season
The amount of crop loss by flooding is determined by multiplying the damage % regarding water depth and the number of days flooded
Agricultural land and infrastructure (channels, etc.) Crop loss amount is determined by multiplying the damage %
regarding water depth and the number of days flooded ② Hydraulic Works Loss amount due to hydraulic structures destruction (intakes,
channels, etc.). ③ Road Infrastructures Flood damage related to road infrastructure is determined by

Preparatory study on the protection program for valleys and rural communities vulnerable to floods in Peru
Profile Study Report (Pre-feasibility level),Majes-Camana River
4-32
the damage in transport sector ④ Housing
Residential and industrial buildings It is calculated applying the loss coefficient depending on the flood depth Housing: residential and industrial buildings; household goods: furniture, household appliances, clothing, vehicles, etc. Flood damages in housing, commercial buildings, assets and inventories (buildings and assets) is determined applying the loss coefficient according to the flood depth
⑤ Public Infrastructures
Determine the loss amount in roads, bridges, sewers, urban infrastructures, schools, churches and other public facilities
Determine the loss amount in public works by applying the correspondent coefficient to the general assets loss amount
⑥ Public Services Electricity, gas, water, rail, telephone, etc. (2) Indirect ① Agriculture Estimate the loss caused by irrigation water interruption due to
the damage of hydraulic structures Determine the construction and repair costs of hydraulic
structures such as direct year costs ② Traffic Interruption Estimate the loss lead by traffic interruption due to damages on
flooded roads Determine road’s repair and construction costs as damage
direct cost
A. Direct loss Direct loss is determined by multiplying the damage coefficient according to the flood depth as the asset value. B. Indirect Loss Indirect loss is determined taking into account the impact of intakes and damaged roads. Below, calculation procedures are described. a. Dams damage The loss amount due to dam damage is calculated by adding the direct loss (dam’s rehabilitation and construction) and the indirect loss amount (harvest loss due to the interruption of irrigation water supply) ① Calculating the infrastructure cost Works Cost = construction cost per water unit taken × size (flow, work length) Unit cost of the work: for intakes and channels, it is required to gather information on the water intake volume of the existing work and the works’ execution cost (construction or repair). The unit cost is calculated by analyzing the correlation among them both. It was estimated that the work will be completely destroyed by the flow with a return period of 10 years. ② Crop loss Annual earnings are determined according to the crops grown in the correspondent irrigation district. Annual Profit = (crops selling - cost) × frequency of annual harvest Crop Sale = planted area (ha) x yield (kg/ha) × transaction unit price

Preparatory study on the protection program for valleys and rural communities vulnerable to floods in Peru
Profile Study Report (Pre-feasibility level),Majes-Camana River
4-33
Cost = unit cost (s/ha) × planted area (ha) b. Road infrastructure damage Determine the loss due to traffic interruption. Amount of loss = direct loss + indirect loss Direct loss: road construction cost (construction, rehabilitation) Indirect Loss: opportunity loss cost due to road damage (vehicle depreciation + staff expenses loss) Then, a 5 days period takes place of non-trafficability (usually in Peru it takes five days to complete the rehabilitation of a temporary road) 2) Loss estimated amount according to disasters in different return periods In table 4.5.1-2 the amounts of loss with and without Project are shown. These are estimated for disasters of different return periods in the Majes-Camana River. Table 4.5.1-2 Loss Estimated Value (at private prices) (s./ 1,000)
2 05 47,669
10 76,27825 111,11350 190,662
Total 425,7222 05 10,021
10 21,31625 34,25450 63,532
Total 129,123
With Project
Without Project
tCase Majes-Camana
3) Loss amount (annual average) expected to be reduced by the Project The annual average loss amount that is expected to be reduced by the Project by the total annual average loss amount occurred as flow multiplying the amount of loss reduction occurred as flow for the corresponding flood probabilities. Considering that floods happen probabilistically, the annual benefit is determined as the annual average amount of loss reduction. Next find the procedures of calculation.

Preparatory study on the protection program for valleys and rural communities vulnerable to floods in Peru
Profile Study Report (Pre-feasibility level),Majes-Camana River
4-34
Table 4.5.1-3 Loss reduction annual average amount
Probabilities Loss Amount Average path’s
loss Paths’
Probabilities
Loss reduction annual average
amount Without Project With Project Loss
Reduction
1/1 D0 = 0
(D0+D1)/2 1-(1/2) = 0,500 d1 = (D0+D1)/2 x 0,67 1/2 L1 L2 D1 = L1-L2
(D1+D2)/2 (1/2)-(1/5) = 0,300
d2 = (D1+D2)/2 x 0,300 1/5 L3 L4 D2 = L3-L4
(D2+D3)/2 (1/5)-(1/10) = 0,100
d3 = (D2+D3)/2 x 0,100 1/10 L5 L6 D3 = L5-L6
(D3+D4)/2 (1/10)-(1/20) = 0,050
d4 = (D3+D4)/2 x 0,050 1/20 L7 L8 D4 = L7-L8
(D4+D5)/2 (1/20)-(1/30) = 0,017
d5 = (D4+D5)/2 x 0,017 1/30 L9 L10 D5 = L9-L10
(D5+D6)/2 (1/30)-(1/50) = 0,013
d6 = (D5+D6)/2 x 0,013 1/50 L11 L12 D6 = L11-L12
(D6+D7)/2 (1/50)-(1/100) = 0,010
d7 = (D6+D7)/2 x 0,010 1/100 L13 L14 D7 = L13-L14
Foreseen average annual amount of loss reduction d1+d2+d3+d4+d5+d6+d7
In Table 4.5.1-4 Results of loss amount calculus are presented (annual average), which are expected to be reduced when implementing the Project in the Majes-Camana River Basin.
Table 4.5.1-4 Annual average of loss reduction amount (Private prices)
(2) Social Assessment 1) Assessment’s objective and indicators The social assessment’s objective in this Study is to evaluate investment’s efficiency in structural measures using the analysis method of cost-benefit (C/B) from the national economy point of view. For this, economic assessment indicators were determined (relation C/B, Net Present Value - NPV and IRR). The internal return rate (IRR) is an indicator that denotes the efficiency of the project’s investment. It is the discount rate to match the current value of the project’s generated cost regarding the benefit’s current value. It is the discount rate necessary so the Net Present Value (NPV) equals zero and the relation C/B equals one. It

Preparatory study on the protection program for valleys and rural communities vulnerable to floods in Peru
Profile Study Report (Pre-feasibility level),Majes-Camana River
4-35
also indicates the percentage of benefits generated by such investment. The internal return rate used in the economic assessment is called “economical internal return rate (EIRR)”. The market price is turned into the economical price (costs at social prices) eliminating the impact of market distortion. The IRR, C/B relation and NPV are determined applying mathematical expressions shown in the Table below. When IRR is greater than the social discount rate, the relation C/B is greater than one and NPV is greater than zero, it is considered that the project is efficient from the national economic growth point of view.
Table 4.5.1-5 Analysis assessment indicators of cost-benefit relation Indicators Definition Characteristics
Net Present Value (NPV)
n
ii
in
ii
i
r
C
r
BNPV
11 11
- Allows comparing net benefit magnitude performed by the project
- It varies depending on the social discount rate
Cost-Benefit Relation (C/B)
B /C Bi
1 r ii1
n
Ci
1 r ii1
n
- Allows comparing the investment efficiency by the magnitude of benefit per investment unit
- Varies depending on the social discount rate
Economical Internal Return Rate (EIRR)
Bi
1 r ii1
n
Ci
1 r ii1
n
- Allows knowing the investment efficiency comparing it to the social discount rate
- Does not vary depending on the social discount rate
Where Bi: benefit per “i” year / Ci: cost per “i” year / r: social discount rate (11 %) / n: years of assessment
2) Assumptions Next, find the assumptions of every indicator used from the economical assessment i) Assessment Period The assessment period is set between 2013 and 2027 (15 years after construction works started). This Project implementing schedule is the following: 2012: Detailed Design 2013-2014: Construction 2013-2027: Assessment Period ii) Standard Conversion Factor (SCF) The standard conversion factor (SCF) is the relationship between socioeconomic prices established along the border and national private prices of all goods in a country’s economy. It is used to convert goods and services prices purchased in the local market at affordable prices. In this Study the following SCF values were used: Dams 0.804 Gabions 0.863 Intakes 0.863 TAX (Peruvians use IGV) is not taken into account in the conversion of market prices to

Preparatory study on the protection program for valleys and rural communities vulnerable to floods in Peru
Profile Study Report (Pre-feasibility level),Majes-Camana River
4-36
socioeconomic prices. iii) Other preliminary conditions Price level: 2010 Social discount rate: 10% Annual maintenance cost: 0.5% of construction cost 3) Cost-benefit relation analysis (C/B) A comparison of the total cost and total benefit of flood control works converted to present values applying the social discount rate was performed. In this case, the total cost is the addition of construction, operation and maintenance costs. The total benefit is the loss amount that was reduced due to the works. For this, a base year was established for the conversion into the current value at the moment of the assessment, and the assessment period was set for the next 15 years from the beginning of the Project. The total cost was determined adding-up the construction, operation and maintenance costs of the works converted into present values; and the total benefit adding-up the annual average loss amount turned into current values. In table 4.5.1-6 results of calculations C/B, NPV and IRR to private prices is shown. Table 4.5.1-6 Social Assessment (C/B, NPV, IRR) (at private prices)
年平均被害軽減額評価期間被害 軽減額(15年)
事業費 維持管理費 C/BNet Present Value
(NPV)Internal Rate of
Return (IRR)
Accumulated Average Annual Benefit
Accumulated Average Annual Benefit (in 15
years)Project's Cost O&M Cost
Cost/Benefit Relation
NPV IRR
Majes-Camana 211,538,859 95,526,756 97,214,077 5,409,816 1,09 8,174,200 12%
流域名
4.5.2 Costs at social prices (1) Benefits 1) Estimated loss amount according to different return periods In table 4.5.2-1 the amounts of loss with and without Project are shown. These are estimated for disaster of different return periods in the Majes-Camana River Watershed.

Preparatory study on the protection program for valleys and rural communities vulnerable to floods in Peru
Profile Study Report (Pre-feasibility level),Majes-Camana River
4-37
Table 4.5.2-1 Estimated loss amount (at social prices) (s./1,000)
2 05 48,468
10 78,19425 116,73050 206,459
Total 449,8512 05 10,435
10 21,73825 36,45550 70,838
Total 139,466
Majes-Camana
With Project
Without Project
tCase
2) Loss amount (annual average) is expected to be reduced with the Project In table 4.5.2-2 results of loss amount calculation (annual average) that are expected to reduce to implement the Project in the Majes-Camana River are shown. Table 4.5.2-2 Annual average of loss reduction amount (Private prices)
s/1000
事業を実施しない場合①
事業を実施した場合②
軽減額③=①-②
Without Project ①
With ProjectMitigated damages
③=①-②
1 1.000 0 0 0 0 0
2 0.500 0 0 0 0 0.500 0 0
5 0.200 48,468 10,435 38,033 19,016 0.300 5,705 5,705
10 0.100 78,194 21,738 56,456 47,244 0.100 4,724 10,429
25 0.040 116,730 36,455 80,275 68,366 0.060 4,102 14,531
50 0.020 206,459 70,838 135,621 107,948 0.020 2,159 16,690
Majes- Camana
年平均被害額の累計=年平均被害軽減期待額 Annual Medial
Damage
年平均被害額④×⑤
Average value of the
damages flow
区間確率 ⑤
Probability incremental
value
流域 Watershed
流量規模 Return Period
超過確率 Probability
被害額 (Total damage - thousands of S/.)
区間平均被害額 ④
Damage Avergare
(2) Social Assessment In table 4.5.2-3 results of the calculation C/B, NPV and IRR at social prices are shown.
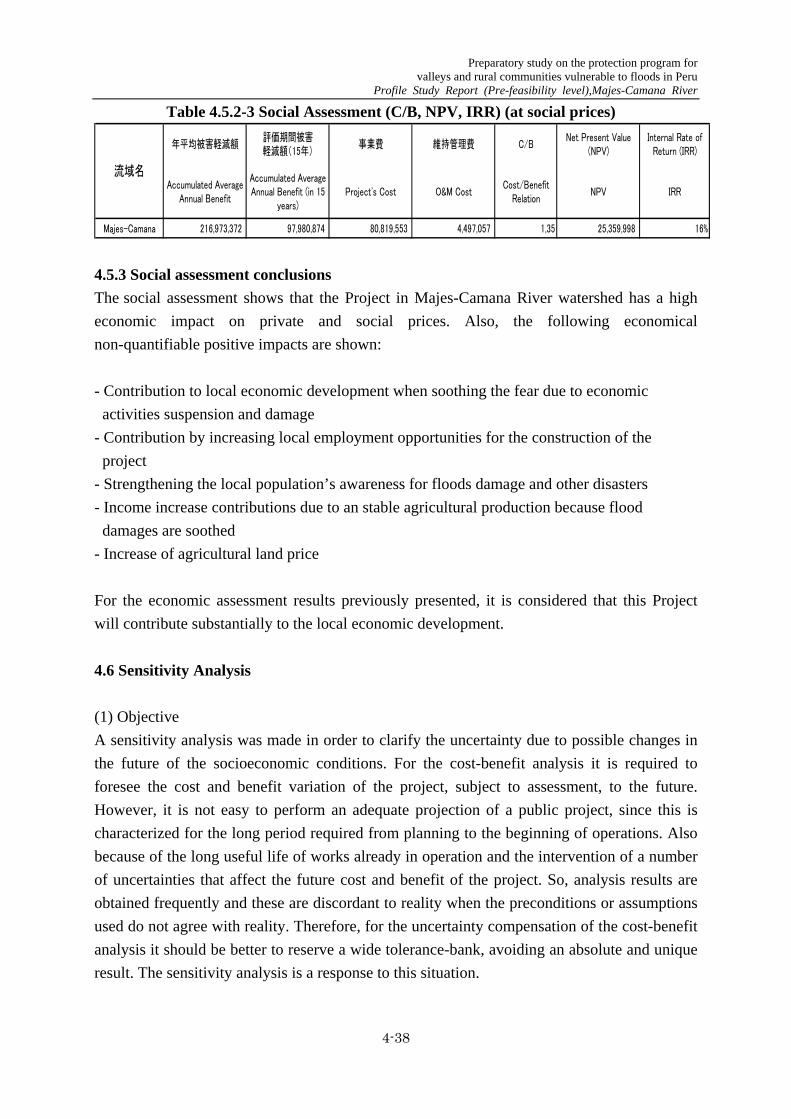
Preparatory study on the protection program for valleys and rural communities vulnerable to floods in Peru
Profile Study Report (Pre-feasibility level),Majes-Camana River
4-38
Table 4.5.2-3 Social Assessment (C/B, NPV, IRR) (at social prices)
年平均被害軽減額評価期間被害 軽減額(15年)
事業費 維持管理費 C/BNet Present Value
(NPV)Internal Rate of
Return (IRR)
Accumulated Average Annual Benefit
Accumulated Average Annual Benefit (in 15
years)Project's Cost O&M Cost
Cost/Benefit Relation
NPV IRR
Majes-Camana 216,973,372 97,980,874 80,819,553 4,497,057 1,35 25,359,998 16%
流域名
4.5.3 Social assessment conclusions The social assessment shows that the Project in Majes-Camana River watershed has a high economic impact on private and social prices. Also, the following economical non-quantifiable positive impacts are shown: - Contribution to local economic development when soothing the fear due to economic activities suspension and damage - Contribution by increasing local employment opportunities for the construction of the project
- Strengthening the local population’s awareness for floods damage and other disasters - Income increase contributions due to an stable agricultural production because flood damages are soothed
- Increase of agricultural land price For the economic assessment results previously presented, it is considered that this Project will contribute substantially to the local economic development. 4.6 Sensitivity Analysis (1) Objective A sensitivity analysis was made in order to clarify the uncertainty due to possible changes in the future of the socioeconomic conditions. For the cost-benefit analysis it is required to foresee the cost and benefit variation of the project, subject to assessment, to the future. However, it is not easy to perform an adequate projection of a public project, since this is characterized for the long period required from planning to the beginning of operations. Also because of the long useful life of works already in operation and the intervention of a number of uncertainties that affect the future cost and benefit of the project. So, analysis results are obtained frequently and these are discordant to reality when the preconditions or assumptions used do not agree with reality. Therefore, for the uncertainty compensation of the cost-benefit analysis it should be better to reserve a wide tolerance-bank, avoiding an absolute and unique result. The sensitivity analysis is a response to this situation.

Preparatory study on the protection program for valleys and rural communities vulnerable to floods in Peru
Profile Study Report (Pre-feasibility level),Majes-Camana River
4-39
The objective of the sensitivity analysis is to provide the cost-benefit analysis results a determined margin that will allow a proper managing of the project’s implementation, give numbers to the population and achieve greater accuracy and reliability of the project’s assessment results. (2) Sensitivity Analysis 1) General description of the sensitivity analysis There are three methods of the sensitivity analysis, as indicated in Table 4.6-1.
Table 4.6-1 Sensitivity Analysis Methods
Methods Description Products Variables sensitivity analysis It consists in changing only one
predetermined variable (precondition or hypothesis), to assess how the analysis result is affected
Bank values from the analysis when a precondition or hypothesis varies
Better and worst alternatives It consists in defining the cases in which the analysis results are improved or worsen when changing the main pre-established preconditions or hypothesis to assess the analysis result bank
Bank values from the analysis when the main precondition or hypothesis vary
Monte Carlo It consists in knowing the probability distribution of the analysis results by simulating random numbers of Monte Carlo simulation of pre-established preconditions and hypothesis
Probable results distribution when all main precondition or hypothesis vary
2) Description of the sensitivity analysis In this project the sensitivity analysis method of the variables usually used in public works investments was adopted. Next, the scenarios and economic indicators used in the sensitivity analysis are shown.
Table 4.6-2 Cases subjected to the sensitivity analysis and economic indicators Indicators Variation bank according to factors Economic indicators to be evaluated
Construction cost In case the construction cost increases in 5 % and 10 %
IRR, NPV, C/B
Benefit In case of reducing the benefit in 5 % and 10 %
IRR, NPV, C/B
Social discount rate
In case of increase and reduction of the discount social rate in 5 % respectively
NPV, C/B

Preparatory study on the protection program for valleys and rural communities vulnerable to floods in Peru
Profile Study Report (Pre-feasibility level),Majes-Camana River
4-40
3) Results of the sensitivity analysis In table 4.6-3 the results of the sensitivity analysis of each assessed case to private and social prices is shown.
Table 4.6-3 Results of the sensitivity analysis of IRR, C/B and NPV Case 1 Case 2 Case 3 Case 4 Case 5 Case 6
Cost increase 5%
Cost increase 10%
Benefit reduction 5%
Benefit redcution 10%
Discount rate increase 5%
Discount rate increase 10%
IRR (%) 12% 11% 10% 11% 10% 12% 12%B/C 1,09 1,04 0.99 1.04 0.98 0.84 1.47
NPV(s) 8,174,200 3,806,572 nagative 561,055 3,397,862 negative 1.378,475egative 12,860,682 44,424,771IRR (%) 16% 15% 14% 15% 14% 16% 16%B/C 1.35 1.28 1.23 1.28 1.21 1.04 1.82
NPV(s) 25,359,998 21,728,954 18,097,910 20,460,954 15,561,910 2,658,312 63,876,226
Social prices
Private prices
Base Case
MAJES-CAMANA
Watershed Variables
MAJES-CAMANA
(3) Assessment of the sensitivity analysis The impact of socioeconomic conditions changes to the Project, has shown that in some cases (Case 2, Case 4 and Case 5) the Project does not show an economic impact regarding private prices costs, but it does show in the social prices costs, since a determined change in costs, benefits and discount rate does not affect much the IRR, C/B and NPV levels.

Preparatory study on the protection program for valleys and rural communities vulnerable to floods in Peru
Profile Study Report (Pre-feasibility level),Majes-Camana River
4-41
4.7 Sustainability Analysis This project will be co-managed by the central government (through the DGIH), irrigation committees and regional governments. Also, the project cost will be covered with the respective contributions of the three parties. Usually the central government (in this case, the DGIH) takes the 80%, irrigation commissions 10% and regional governments 10%. However, the percentages of the contributions of these last two are decided through discussions between both parties. On the other hand, the operation and maintenance (O & M) of the completed works is assumed by the irrigation committee. So, the sustainability of the project depends on the profitability of the Project and the ability of the irrigation committees for O & M. Table 4.7-1 presents the data of the budget for irrigation committees River Watershed Majes-Camana in recent years. Table 4.7-1 Project Budget of the irrigation commissions
Rivers Annual Budget (In soles) 2006 2007 2008 2009 2010
Majes-Camana River 1.959.302,60 1.864.113,30
(1) Profitability The project in Majes-Camana river Watershed is sufficiently profitable and highly sustainable. The investment amount in this watershed is estimated in 97.1 million soles at private prices. However, the C/B relation is 1.35, the internal return rate is high (approx. 16%), and the NPV is estimated in 25.43 million soles. These Figures show that the project's economic efficiency is very high. (2) Cost of operation and maintenance The annual cost of operation and maintenance required for the project, having as a base year 2008 is estimated at 416,140 soles, corresponding to 0.5% of the project construction cost (83,228,000 soles). On the other hand, the average operating expenses in 2009 and 2010 of the irrigation commissions was 1,911,708 soles. When considering that the annual operation and maintenance cost represents 22% of the annual irrigation commissions, the project would be sustainable enough according to the financial capacity of these committees to maintain and operate the constructed works.

Preparatory study on the protection program for valleys and rural communities vulnerable to floods in Peru
Profile Study Report (Pre-feasibility level),Majes-Camana River
4-42
4.8 Environmental Impact 4.8.1 Procedure of Environmental Impact Assessment Projects are categorized in three scales, based on the significance level of the negative and positive impacts, and each sector has an independent competence on this categorization. The following table shows the environmental management instruments that are required for each category. The Project holder should submit the Environmental Impact Statement (DIA, in Spanish) for all Projects under Category I. The project holder should prepare an EIA-sd or an EIA-d if the Project is categorized under Category II or III, respectively, to be granted the Environmental Certification from the relevant Ministry Directorate.
Table 4.8.1-1 Project Categorization and Environmental Management Instruments
Description Required Environmental Management Instrument
Category I It includes those Projects that when carried out, they cause no significant negative environmental impacts whatsoever.
PEA that is considered a DIA after the assessment for this category
Category II It includes those Projects that when carried out, they can cause moderate environmental impacts, and their negative effects can be removed or minimized through the adoption of easily applicable measures.
Semi-Detailed Environmental Impact Assessment (EIA-sd)
Category III It includes those Projects than can cause significant quantitative or qualitative negative environmental impacts because of their characteristics, magnitude and/or location. Therefore, a deep analysis is required to revise those impacts and set out a relevant environmental management strategy.
Detailed Environmental Impact Assessment (EIA-d)
Source: Prepared by the JICA Study Team based on the SEIA Law (2001)
The next graph shows the Environmental Document’s Classification, the Environmental

Preparatory study on the protection program for valleys and rural communities vulnerable to floods in Peru
Profile Study Report (Pre-feasibility level),Majes-Camana River
4-43
Document’s Assessment, and the Environmental Certification. Document
ClassificationEvaluación de Documentos Ambientales
Issuance of Environmental Certification
Evaluation of EIA‐sd in 40 working
days.
Correction of raised comments in 30 workind days.
Evaluation of EIA‐sd in 70 working
days.
Correction of raised comments in 30 workind days.
Issuance of Environmental Certification in 20
days
Issuance of Environmental
Certification in 20 days
The minimun deadlines for issuance of Environmental Certification are 30 days for DIA, 90 days for EIA‐sd, and 120 days for EIA‐d.
Preparation and Submission of
PEA
Project categoraization in 30 working days
after PEA submittance Submission,
evaluation and approval of DIA
Category I
Category II
Category III
Preparation, evaluation
and approval of
TOR
Preparation, evaluation
and approval of
TOR
Preparation of EIA‐sd
Preparation of EIA‐d
Preparation of Environmental Document
EIA‐sd Approval
EIA‐d Approval
Approval of Environmen
tal Documents
Issuance of Environmental Certification
Source: Prepared by the JICA Study Team based on the SEIA Regulations (2009)
Figure 4.8.1-1 Process to Obtain the Environmental Certification First, the Project holder applies for the Project classification, by submitting the Preliminary Environmental Assessment (PEA). The relevant sector assesses and categorizes the Project within the next 30 working days after the document’s submission. The Project’s PEA that is categorized under Category I becomes an EID, and those Projects categorized under Category II or III should prepare an EIA-sd or EIA-d, as applicable. There are cases in which the relevant sector prepares the Terms of Reference for these two studies, and submits them to the holder. There are other cases in which the holder prepares the Terms of Reference and these are approved by the relevant sector, based on the interview with DGAA. Number of working days required for EIA-sd revision and approval is 90, and number of working days required for EIS-d is 120; however, these maximum deadlines may be extended. The progress of the environmental impact study is as shown below.
The JICA Study Team subcontracted a local Consultant (CIDE Ingenieros S.A.), and a Preliminary Environmental Assessment (PEA) was carried out from September to October 2011for Majes-Camana river.
EAP for Majes- Camana was submitted to DGIH from JICA on December 20, 2012. DGIH submitted it on January 4, 2012.
EAP for 4 rivers except Yauca river was examined by DGAA, and DGAA issued their comments on EAP to DGIH. JICA Study Team revised EAP upon the comments and submitted them to DGAA on September 21, 2011. DGAA completed examination on the revised EAP and issued approval letter on 4 rivers in which DGAA classified 4 rivers into

Preparatory study on the protection program for valleys and rural communities vulnerable to floods in Peru
Profile Study Report (Pre-feasibility level),Majes-Camana River
4-44
Category I. Therefore the additional environmental impact analysis for 4 rivers is not required. Although EAP of the Majes-Camana river is still under examination of DGAA, the EAP of the river will be also classified into Category I because the flood prevention facilities in the river are similar to those of antecedent 4 rivers.
The positive and negative environmental impact associated with the implementation of this project was confirmed and evaluated, and the plan for prevention and mitigation measures are prepared by EAP results, field investigation and hearing by JICA Study Team.
The proposed works in this project include: the reparation of existing dikes, construction of new dikes, riverbed excavation, bank protection works and so on. Table 4.8.1-2 describes “Work Description” to be considered in the Environmental Impact section.
Table 4.8.1-2 Works Description
MC
10.0k-4.5k Inundation
Top W;4.0m h;2.0m-3.0m Slope;1:3 L;
4,500m0.0km-4.5km (left bank)
MC
27.5k-9.5k Inundation
Top W;4.0m h;2.0m-3.0m Slope;1:3 L;
2,000m7.5km-9.5km (left bank)
MC
311.0k-17.0k Inundation
Top W;4.0m h;2.0m-3.0m Slope;1:3 L;
6,000m11.0k-17.0k(left bank)
MC
448.0k-50.5k Inundation
Top W;4.0m h;2.0m-3.0m Slope;1:3 L;
2,500m48.0km-50.5km (left bank)
MC
552.0k-56.0k Inundation
Top W;4.0m h;2.0m-3.0m Slope;1:3 L;
4,o00m52.0k-56.0k(left bank)
MC
6
59.0k-62.5k
59.5k-62.5k
Inundation
/erosion
Top W;4.0m h;2.0m-3.0m Slope;1:3 L;
6,500m
59.0km-62.5km (left bank)
59.5km-62.5km. (right bank)
MC
7
65.0k-66.5k
64.5k-66.5kInundation
Top W;4.0m h;2.0m-3.0m Slope;1:3 L;
3,500m
65.0km.-66.5 km.(right bank)
64.5km.-66.5 km. (left bank)
Majes-
Camana
Crop land
(rice、others)
Dike(no dike
section)
Revetment
Basin Location Counter Measure Objective SectionSummary of FacilityPreservation
Object
Source: JICA Study Team
4.8.2 Methodology In order to identify environmental impacts of the works to be executed in the different watersheds, we developed identification impact matrixes for watershed. First, the operation and activities for each project based on typical activities of “hydraulic works” construction were determined. Afterwards, the concrete activities type was determined which will be executed for each work that will be developed in the watersheds. Then, to evaluate Socio-environmental impacts the Leopold matrix was used.

Preparatory study on the protection program for valleys and rural communities vulnerable to floods in Peru
Profile Study Report (Pre-feasibility level),Majes-Camana River
4-45
Table 4.8.2-1 Evaluation Criterion - Leopold Matrix
Index Description Valuation “Na” nature It defines whether change in
each action on the means is positive or negative
Positive (+) : beneficial Negative (-): harmful
Probability of Occurrence “P.O.”
It includes the probability of occurrence of the impact on the component
High (>50 %) = 1.0 Medium (10 – 50 %) = 0.5 Low (1 – 10 %) = 0.2
Magnitude
Intensity (In) It indicates the magnitude of change in the environmental factor. It reflects the degree of disturbance
Negligible (2) Moderate intensity (5) Extreme Disturbance (10)
Extension “Ex” It indicates the affected surface by the project actions or the global scope on the environmental factor.
Area of indirect influence: 10 Area of direct influence: 5 Area used up by the works: 2
Duration “Du” It refers to the period of time when environmental changes prevail
10 years: 10 5 – 10 years : 5 1 – 5 years: 2
Reversibility “Rev”
It refers to the system’s capacity to return to a similar, or an equivalent to the initial balance.
Irreversible: 10 Partial return: 5 Reversible: 2
Source: Prepared based on PEAs of 6 Basins
Table 4.8.2-2 Impact Significance Degrees
SIA Extent of Significance≤ 15 Of little significance
15.1 - 28 Significant ≥ 28 Very significant
Source: Prepared based on PEAs of 6 Basins
4.8.3 Identification, Description and Social Environmental Assessment (1) Identification of social environmental impacts
In the following matrix (construction/operation stages) in the Watersheds, elaborated based on the report analysis of the Preliminary Environmental Assessment.

Preparatory study on the protection program for valleys and rural communities vulnerable to floods in Peru
Profile Study Report (Pre-feasibility level),Majes-Camana River
4-46
Table 4.8.3-1 Impact Identification Matrix (Construction and Operation Stage) – Majes-Camana River
Work 1-7 1-7 1-7 1-7 1-7 1-7 1-7 1-7 1-7
En
viro
nm
en
t
Com
pone
nt
Env
ironm
enta
l Fac
tors
Act
ivit
y
Labo
r R
ecru
itmen
t
Site
pre
para
tion
wor
k (C
lear
ing,
land
gr
adin
g, L
evel
led)
Dig
ging
and
mov
emen
t of
Lan
d
Civ
il W
ork
(Con
cret
ing)
I&O
of
ston
e pi
ts a
nd m
ater
ial
prod
uctio
n pl
ants
DM
E I
&O
Cam
ps w
ork
I&O
Car
riage
Sta
ff
Tra
nspo
rtat
ion
of m
achi
nery
, eq
uipm
ent,
mat
eria
ls a
nd s
uppl
ies
N N N N N N 6 0
N N N N N N N 7 0
Noise N N N N N N N N 8 0
N N 2 0
N N N 3 0
N N N 3 0
0 0
N 1 0
N N N 3 0
N N 2 0
N 1 0
N N 2 0
N N 2 0
Esthetic N N 2 0
P N N N 3 1
0 0P 0 1
0 0
2 8 5 3 9 9 3 4 4 45 2
96 % 4 %
Construction Stage
To
tal
Neg
ativ
e
Total
Percentage of positive and negative
Socio-economic
Visual landscape
SocialQuality of life
Vulnerability - Security
EconomicPEA
Biotic
FloraTerrestrial flora
Aquatic flora
FaunaTerrestrial fauna
Aquatic fauna
Calidad del agua superficial
Cantidad de agua superficial
PhysiographyMorfología fluvial
Morfología terrestre
Current land use
To
tal
Po
siti
ve
Physique
AirPM-10 (Particulate matter)
Gas emissions
Noise
SoilSoil fertility
Land Use
Water
N: Negative, P:Positive Source: Prepared by the JICA Study Team
En
viro
nm
ent
Co
mp
on
ent
Environmental Factors
0 0
0 0
Noise 0 0
0 0
0 0
0 0P P P P P P P 0 7N N N N N N N 7 0N N N N N N N 7 0
0 0
0 0
0 0N N N N N N N 7 0
Esthetic P P P P P P P 0 7P P P P P P P 0 7P P P P P P P 0 7
0 0P P P P P P P 0 7
8 8 8 8 8 8 8 21 35
38 % 63 %
Operation Stage
Total
Percentage of positive and negative
Dik
eP
oint
7
To
tal
Neg
ativ
e
Socio-economic
Visual landscape
SocialQuality of life
Vulnerability - Security
EconomicPEA
Current land use
Biotic
FloraTerrestrial flora
Aquatic flora
FaunaTerrestrial fauna
Aquatic fauna
WaterCalidad del agua superficial
Cantidad de agua superficial
PhysiographyMorfología fluvial
Morfología terrestre
To
tal
Po
siti
ve
Physique
AirPM-10 (Particulate matter)
Gas emissions
Noise
SoilSoil fertility
Land Use
Dik
eP
oint
1
Dik
eP
oint
2
Dik
eP
oint
3
Dik
eP
oint
4
Dik
eP
oint
5
Dik
eP
oint
6
Wo
rks
N: Negative, P:Positive Source: Prepared by the JICA Study Team

Preparatory study on the protection program for valleys and rural communities vulnerable to floods in Peru
Profile Study Report (Pre-feasibility level),Majes-Camana River
4-47
On the Majes-Camana River basin, based on the impact identification results for the construction stage, a total number of 47 interactions have been found. 45 of these interactions (97 %) correspond to impacts that will be perceived as negative, and 2 (3 %) correspond to impacts that will be perceived as positive. In addition, 56 interactions have been found for the operation stage; 21 of these interactions (37.5%) correspond to impacts that will be perceived as negative, and 35 (62.5 %) correspond to impacts that will be perceived as positive.
(2) Environmental and Social Impact Assessments
Environmental and social impacts are assessed with the methodology that was explained in 4.8.2 Methodology. The following tables show the environmental and social assessment results for each basin, during the construction and operation stages.
Table 4.8.3-2 Environmental Impact Assessment Matrix – Majes-Camana River
Operation Stage
Acciones del proyecto
Labo
r R
ecru
itmen
t
Site
pre
para
tion
wor
k (C
lear
ing,
land
gr
adin
g, L
evel
led)
Dig
ging
and
ref
illin
g in
riv
ersi
de
Civ
il W
ork
(Con
cret
ing)
I&O
of
ston
e pi
ts a
nd m
ater
ial
prod
uctio
n pl
ants
DM
E I
&O
Cam
ps w
ork
I&O
Car
riage
Sta
ff
Tra
nspo
rtat
ion
of m
achi
nery
, eq
uipm
ent,
mat
eria
ls a
nd s
uppl
ies
PM-10 (Particulate matter) 0.0 -12.0 -12.0 0.0 -18.0 -18.0 0.0 -12.0 -12.0 0.0
Gas emissions 0.0 -11.5 -11.5 -11.5 -11.5 -11.5 0.0 -11.5 -11.5 0.0
Noise Noise 0.0 -15.0 -12.0 -12.0 -15.0 -15.0 -15.0 -15.0 -15.0 0.0
Soil fertility 0.0 -11.5 0.0 0.0 -14.2 -14.2 0.0 0.0 0.0 0.0
Land Use 0.0 -14.2 0.0 0.0 -15.0 -15.0 0.0 0.0 0.0 0.0
Calidad del agua superficial 0.0 0.0 -12.0 0.0 -15.0 0.0 0.0 0.0 0.0 0.0
Cantidad de agua superficial 0.0 0.0 0.0 -9.0 0.0 0.0 -15.0 0.0 0.0 26.0
Morfología fluvial 0.0 0.0 0.0 0.0 -23.0 0.0 0.0 0.0 0.0 -25.5
Morfología terrestre 0.0 -33.0 -15.0 0.0 0.0 -28.0 0.0 0.0 0.0 -25.5
Terrestrial flora 0.0 -28.0 0.0 0.0 0.0 -22.5 0.0 0.0 0.0 0.0
Aquatic flora 0.0 -14.5 0.0 -14.5 0.0 0.0 0.0 0.0 0.0
Terrestrial fauna 0.0 -24.2 0.0 0.0 0.0 -22.5 0.0 0.0 0.0 0.0
Aquatic fauna 0.0 0.0 -14.5 0.0 -15.0 0.0 0.0 0.0 0.0 -25.5
Esthetic Visual landscape 0.0 0.0 0.0 0.0 -12.0 -12.0 0.0 0.0 0.0 36.0
Quality of life 17.0 0.0 0.0 0.0 0.0 0.0 -17.5 -17.5 -17.5 36.0
Vulnerability - Security 0.0 0.0 0.0 0.0 0.0 0.0 0.0 0.0 0.0 36.0
PEA 17.0 0.0 0.0 0.0 0.0 0.0 0.0 0.0 0.0 0.0
Current land use 0.0 0.0 0.0 0.0 0.0 0.0 0.0 0.0 0.0 36.0
MC1-MC7
MC1-MC7
MC1-MC7
Construction Stage
MC1-MC7
MC1-MC7
MC1-MC7
The Majes-Camaná River Basin
MC1-MC7
MC1-MC7
MC1-MC7
MC
1-M
C7
Physique
Air
Soil
Water
Physiography
Biotic
Flora
Fauna
Socio-economic
Social
Economic
Me
dio
Co
mp
on
en
te
Puntos de Obras: Factores Ambientales
0-15.0 Little significant 0-15.0 Little significant
15.1-28.0 Significant 15.1-28.0 Significant
28.1- Very significant 28.1- Very significant
Grade of Positive Impacts Grade of Negative Impacts
Source: Prepared based on PEAs of 6 Basins

Preparatory study on the protection program for valleys and rural communities vulnerable to floods in Peru
Profile Study Report (Pre-feasibility level),Majes-Camana River
4-48
It must be pointed out that in the Majes-Camaná River basin 11 out of a total of 14 negative impacts have been quantified as significant, and 1 has been quantified as very significant, during the construction stage. Meanwhile, 3 significant negative impacts have been quantified as during the operation stage.
During the construction stage, the works site preparation component will significantly affect the land morphology. During the operation stage, river morphology and aquatic fauna will be significantly affected all the point, where the dikes will be built.
The Environmental Management Plan will be detailed in 3 Environmental Management Plans for Probable Impacts.
During the construction stage, actions that will generate most significant negative impacts include: “Site Works Preparation and Clearance”, “Riverbed Excavation and Embankment”, and “Surplus Material Deposits Operation (DME, in Spanish).” “Site works Preparation and Clearance” will bring about a significant modification to the land morphology, whereas “Riverbed Excavation and Filling” will bring about a significant modification to river morphology.
During the operation stage, hydraulic infrastructure works that will bring about most significant negative environmental impacts include “Riverbed excavation and embankment” that will cause a modification to the river morphology and subsequently, decreased river habitability conditions that will directly impact the aquatic fauna.
Most significant positive impacts are related to all works to be constructed along the river basins, and are directly related to improve the quality of the lives of the population around the area of influence, improve the “Current Use of land / soil”, improve the security conditions, and reduce vulnerability at social and environmental levels.
4.8.4 Socio-Environmental Management Plans
The objective of the Socio-Environmental Plans is to internalize both positive and negative significant and very significant environmental impacts that are related to the Project’s construction and operation stages, so that prevention and/or mitigation of significant and very significant negative impacts, preservation of environmental heritage, and Project sustainability are ensured.
During the construction stage, Projects of all the basin have set out the following measures: “Local Hiring Program”, “Works Sites Management and Control Program”, “Riverbed Diversion Program”, “Riverbank Excavation and Filling Management”, “Riverbed Excavations and Filling Management”, “Quarry Management”, “DME Management”, “Camp and Site Residence Standards”, and “Transportation Activity Management.” During the operation stages, Projects for the basin have considered the development of activities with regard to “Riverbed and Aquatic Fauna Management”. These activities should develop riverbed conditioning downstream the intervention points, for erosion probabilities to be reduced, and habitability conditions to be provided for aquatic fauna species. The following are measures related to those negative impacts to be mitigated or those positive impacts to be

Preparatory study on the protection program for valleys and rural communities vulnerable to floods in Peru
Profile Study Report (Pre-feasibility level),Majes-Camana River
4-49
potentiated. Overall measures have been established for the basin, based on the impacts, as identified in the basin.
Table 4.8.4-1 Environmental Impact and Prevention/Mitigation Measures
Item Impact Counter Measures PeriodManagement of riverdiversion and cofferingManagement of bankexcavation and bankingManagement of riverbedexcavation and back fillingManagement of bankexcavation and bankingManagement of riverbedexcavation and back fillingManagement of quarry siteManagement ofconstruction siteManagement of largeamount of excavated ordredged materialManagement ofconstruction siteManagement of largeamount of excavated anddredged material
Aquatic faunaManagement of riverbedexcavation and back filling
O/M period
Management ofconstruction siteManagement of largeamount of excavated anddredged materialManagement ofconstruction siteManagement of largeamount of excavated anddredged materialManagement of labor andconstruction officeManagement of traffic ofconstruction vehicleEmployment plan of localpeople
Population ofeconomic activity
Employment plan of localpeople
Terrestrial flora
Biologicalenvironment
Socialenvironment
Quality of life
Constructionperiod
Constructionperiod
Water quality ofsurface water
River topography
Other topography
Dust
Naturalenvironment
Terrestrial fauna
Source: JICA Study Team

Preparatory study on the protection program for valleys and rural communities vulnerable to floods in Peru
Profile Study Report (Pre-feasibility level),Majes-Camana River
4-50
4.8.5 Monitoring and Control Plan
(1) Follow up and monitoring plan
The follow-up plan has to implement firmly the management of environmental plan. The monitoring plan is to be carried out to confirm that the construction activity fulfill the environmental standard such as Environmental Quality Standards (EQS) either or Maximum Permissible Limits (MPL). And the monitoring and control must be carried out under the responsibility of the project’s owner or a third party under the supervision of the owner.
· Construction stage During the construction period of the projects to be done in the 4 watersheds, the Monitoring and Control Plan will be directed to the verification of the fulfillment measures designed as part of the environmental monitoring plan and the verification of the fulfillment of laws and regulation of the Peruvian Legislation. The following aspects will also be monitored:
Water Quality and Biological Parameters: Water quality and biodiversity parameters control shall be performed at downstream of these works must be monitored. In the following table the profile of this plan is shown.
Table 4.8.5-1 Monitoring to Water Quality and Biological Parameters
Item Unit
Measured Value (Mean)
Measured Value
(Max.)
Country’s Standards
pH pH “National Standard for Water Quality” D.S. No. 002-2009 MINAM
TSS mg/l BOD/COD mg/l DO mg/l Total Nitrogen mg/l Heavy Metals mg/l Temperature oC
Biological Diversity indices: Shannon; Pielou; richness and abundance
[Measurement Points] -50 meters upstream the intervention points -50 meters downstream the intervention points -100 meters downstream the intervention points [Frequency] Quarterly [Person in charge of Implementation] DGIH-MINAG, or a third party under the project holder's supervision Source: JICA Study Team

Preparatory study on the protection program for valleys and rural communities vulnerable to floods in Peru
Profile Study Report (Pre-feasibility level),Majes-Camana River
4-51
Air Quality: During impact analysis, in the projects to be developed in the 4 watersheds no significant impacts will be seen in the activities related to hydraulic infrastructure works. However, the generation of dust and atmospheric contaminant emissions always affects the working area and the workers and inhabitants health. So, it is recommended to monitor air quality.
Table 4.8.5-2 Monitoring to Air Quality
Item Unit Measured Value
(Mean)
Measured Value (Max.)
Peruvian Standards (D.S. No 074-2001-PCM)
Referred International
Standards SO2 “National Standard for Air
Quality” D.S. No.074-2001-PCM
National Ambient Air Quality Standards (NAAQS) (Updated in 2008)
NO2 CO O3 PM-10 PM-2.5 [Measurement Points] *02 stations per monitoring point: Windward and downwind (upwind and against the wind direction) -1 point at the working zones -1 point at a quarry, away from the river (the largest and / or the closest point to a populated area) -1 point at a D.M.E. (the largest and / or the closest point to a populated area) [Frequency] Quarterly [Person in charge of the Implementation] DGIH-MINAG, or a third party under the project holder's supervision Source: JICA Study Team
Noise Quality Likewise, it is proposed to perform a noise monitoring at the potential receptors located near the noise emission spots towards the working sites, in the next table 4.9.4-3, the terms are described.
Table 4.8.5-3 Monitoring to Noise Quality
Item Unit Measured
Value (Mean)
Measured Value (Max.)
Country’s Standards
Referred International Standards
Noise level LAeqT (dB(A))
National Environmental Quality Standards for noise (EQS) - S.N. N° 085-2003-PCM
-IEC 651/804 – International -IEC 61672- New Law: Replaces IECs 651/804-ANSI S 1.4 – America
[Measurement Point] Monitoring to acoustic contamination levels will be carried out at the potential receivers that are located around the noise emission points per work front. 01 point per potential receiver will be monitored. [Frequency] Every two months during construction phase [Person in charge of the Implementation] DGIH-MINAG, or a third party under the project holder's supervision
Source: JICA Study Team

Preparatory study on the protection program for valleys and rural communities vulnerable to floods in Peru
Profile Study Report (Pre-feasibility level),Majes-Camana River
4-52
· Operation Stages Regarding works impact of all projects, it is mainly recommended to monitor biologic parameters and water quality as river topography and the habitat of aquatic life.
Table 4.8.5-4 Monitoring to Water Quality (Operation Stage)
Item Unit
Measured Value (Mean)
Measured Value
(Max.)
Country’s Standards
pH pH “National Standard for Water Quality” D.S. No. 002-2009 MINAM
TSS mg/l BOD/COD mg/l DO mg/l Total Nitrogen mg/l Heavy Metals mg/l Temperature oC
Biological Diversity indices: Shannon; Pielou; richness and abundance
[Measurement Points] -50 meters upstream the intervention points -50 meters downstream the intervention points -100 meters downstream the intervention points [Frequency] Quarterly in first two years of operation phase [Person in charge of Implementation] DGIH-MINAG, or a third party under the project holder's supervision
Source: JICA Study Team (2) Closure or Abandon Plan Closure or abandon plans have been made for each watershed. These will be executed at the end of construction activities and involves the removal of all temporary works and restoration of intervened and/or affected areas as a result of the works execution. The restoration includes the removal of contaminated soil, disposal of waste material, restoration of soil morphology and restoration with vegetation of intervened sites.
(3) Citizen Participation Citizen participation plans have been made for each watershed, which must be executed before and during construction and when the works are completed. The recommended activities are:
• Before works: Organize workshops in the surrounding community‘s area near the project and let them know what benefits they will have. Informative materials in communities, which will explain the profile, lapse, objectives, benefits, etc. of the Project • During works execution: Give out information on the construction progress. Responding complaints generated from the local community during works execution. For this, a consensus

Preparatory study on the protection program for valleys and rural communities vulnerable to floods in Peru
Profile Study Report (Pre-feasibility level),Majes-Camana River
4-53
wants to be previously achieved with the community in order to determine how claims will be met • When works are completed: Organize workshops to inform about works completion. Works delivery to the local community inviting local authorities for the transfer of goods, which means the work finished. 4.8.6 Cost for the environmental impact management Next, direct costs of previously mentioned measures to mitigate environmental impacts in the Majes-Camana River Watershed are shown. In any case, it is necessary to determine in detail these measures’ budget for each watershed in the detailed design stage.
Table 4.8.6-1 Direct costs of measures to manage environmental impact Actions Unit Qty Unitary price
(S/.) Subtotal (S/.) Total (s/.)
Sign for vehicles entrance Month 6 S/. 1.400,0 S/. 8.400,0 S/. 8.400,0Industrial weaste transportation Month 6 S/. 4.200,0 S/. 25.200,0 S/. 25.200,0Project sites landscape protection measures Month 6 S/. 2.800,0 S/. 16.800,0 S/. 16.800,0Operation and maintenance of construction equipment Month 6 S/. 1.960,0 S/. 11.760,0 S/. 11.760,0
Measures for staff noise protection Month 6 S/. 1.120,0 S/. 6.720,0 S/. 6.720,0Functioning expenses to implement environmental impact mitigation measures Month 6 S/. 4.480,0 S/. 26.880,0 S/. 26.880,0Soil and air contaminant prevention capacity development Month 6 S/. 2.520,0 S/. 15.120,0 S/. 15.120,0
Bed and aquatic fauna monitoring S/. 11.239,2Diversity indicators monitoring times 3 S/. 672,0 S/. 2.016,0 Water flow monitoring times 3 S/. 588,0 S/. 1.764,0 Tº, pH, OD monitoring times 3 S/. 571,2 S/. 1.713,6 DBO monitoring times 3 S/. 638,4 S/. 1.915,2 Total solids dissolve monitoring (SDT) times 3 S/. 638,4 S/. 1.915,2 Total suspended solids monitoring (SST) times 3 S/. 638,4 S/. 1.915,2
Air and noise quality monitoring S/. 37.500,0Gas emissions monitoring times 3 S/. 4.500,0 S/. 13.500,0 Dust monitoring times 3 S/. 5.000,0 S/. 15.000,0 Noise monitoring times 3 S/. 3.000,0 S/. 9.000,0 Total S/. 159.619,2
4.8.7 Conclusions and Recommendations (1) Conclusions
According to the Preliminary Environmental Appraisals to the basin, most impacts identified during the construction and operation stages were found out to be of little significance.

Preparatory study on the protection program for valleys and rural communities vulnerable to floods in Peru
Profile Study Report (Pre-feasibility level),Majes-Camana River
4-54
Significant and very significant negative impacts can be controlled or mitigated, as long as suitable Environmental Management Plans are carried out. In addition, the Project will be implemented in the short term, as environmental conditions will be quickly restored. However, the execution of a follow – up and monitoring plan is important, and in the event that unexpected impacts are generated, immediate mitigation measures must be taken.
In addition, significant positive impacts are also present, especially during the operation stage. These positive impacts include: An enhanced security / safety and a decreased vulnerability at social and environmental levels; an improved quality of life among the population in the area of influence, and an improved “Current use of land / soil”.
(2) Recommendations
1) We mainly recommend that the beginning of the construction activities coincides with the beginning of the dry seasons in the region (May to November) when the level of water is very low or the river dries up. Each river characteristics / features should be taken into account, that is, that the Majes-Camana Rivers are year - round rivers. At the same time, the crop season cycle in the areas of direct influence should be taken into account, so that traffic jams caused by the large trucks and farming machinery is prevented.
2) It is recommended that the Project holder (DGIH) should define the limit of river area during detailed design stage, and identify the people who live within the river area illegally. Continually the DGIH should carry on the process of land acquisition based on the Land Acquisition Low, which are; Emission of Resolution for land acquisition by the State, Proposition of land cost and compensation for land owner, Agreement of the State and land owner, Payment, archaeological assessment certification.
3) DGIH has to promote the process to obtain the CIRA in the detail design stage. The process to be taken is i) Application form, ii) Copies of the location drawings and outline drawings, iii) voucher, iv) Archaeological Assessment Certificate.
4) The participation of the women in the workshops can be promoted through the existing women group such as Vaso de Leche. Finally, the DGAA will submit the resolutions (Environmental Permissions) for the basin. The project will have been categorized as “Category I”, which means that the project is not required to carry out neither EIA-sd nor EIA-d, although the EAP report of Majes-Camana Basin is under examination by DGAA-MINAG.
4.9 Execution Plan The Project’s Execution Plan will review the preliminary schedule, which includes the following components. For pre-investment stage: full execution of pre-feasibility and

Preparatory study on the protection program for valleys and rural communities vulnerable to floods in Peru
Profile Study Report (Pre-feasibility level),Majes-Camana River
4-55
feasibility studies to obtain SNIP’s approval in the pre-investment stage; for the investment stage: signing of loans (L/A), consultant selection, consulting services (detailed design and elaboration of technical specifications), constructor selection and work execution. For the post-investment stage: ⑦ Works’ completion and delivery to water users associations and beginning of the operation and maintenance stage. (1) Review by the Public Investment National System (SNIP) In Peru, the Public Investment National System (SNIP hereinafter) is under operation. This reviews the rationality and feasibility of public investment projects, and will be applied to this Project. In SNIP, among previous studies to an investigation, it will be conducted in 3 stages: profile study (study on the project’s summary), pre-feasibility and feasibility. SNIP was created under Regulation N° 27293 (published on June 28, 2000) in order to achieve efficient use of public resources for public investment. It establishes principles, procedures, methods and technical regulations to be fulfilled by central/regional governments in public investment scheme plans and executed by them. SNIP, as described below, is all public works projects which are forced to perform a 3-stage pre-investment study: profile study, pre-feasibility and feasibility, and have them approved.
However, following the Regulation amendment in April 2011, the execution of pre-feasibility study of the intermediate stage was considered unnecessary; but in return, a study based on primary data during the profile study is requested. The required precision degree throughout
all stages of the study has hardly changed before and after this modification.
Figure 4.9-1 SNIP Cycle Project
Before investement Investement After investement
Project/Program Idea Simple Profile Study Detailed
design/Technical Specifications
Operation and maintenance
Profile Study
Execution Assessment afterexecution Pre-feasibility Study
Feasibility Study
(Source: DGPM HP)
Retro-feed
Project Cycle

Preparatory study on the protection program for valleys and rural communities vulnerable to floods in Peru
Profile Study Report (Pre-feasibility level),Majes-Camana River
4-56
In order to carry out this Project, which is a project composed by several programs, pre-investment studies at investments’ programs level are required to be performed and also have them approved. Although the procedure is quite different in each stage, in SNIP procedures, the project’s training unit (UF) conducts studies of each stage, the Planning and Investment Office (OPI) assesses and approves the UF’s presented studies and requests Public Sector Multi-Annual Programming General Direction (hereinafter referred DGPM) to approve feasibility studies and initiation of following studies. Finally DPGM evaluates, determines and approves the public investment’s justification.
Figure 4.9-2 Related Institutions to SNIP
Due to the comments of examining authorities (OPI and DGPM) to FU, it will be necessary to prepare correspondent responses and improve the studies. Since these authorities officially admit applications after obtaining definitive answers, there are many cases in which they take several months from the completion of the study report until the completion of the study. In this execution plan it is scheduled to present the pre-feasibility report in February 2011 and the feasibility report in April 2011. (2) Yen loan contract Once the feasibility studies reports are submitted and examined in SNIP, discussions on the loan in yen will begin. It is estimated to be a period of 6 months for procedures. (3) Procedure of the project’s execution After the documents are assessed by SNIP and a loan agreement between Japan (JICA) and the Peruvian counterpart is signed, a consultant will be selected. The consulting service includes the development of detailed design and technical specifications, the contractors’
Economy and Finances Ministery(MEF)
UF (Formulator Units) OPI DGPM Perform profile, pre-feasibilityand feasibility Studies Improve Studies regarding OPIand DGPM comments
Assess each study Approve RequestDGPM to approve feasibilitystudy / of the beginning ofnext stage
Approve feasibilityStudies on each stage
(See Regulation No.001-2009-EF/68.01.)

Preparatory study on the protection program for valleys and rural communities vulnerable to floods in Peru
Profile Study Report (Pre-feasibility level),Majes-Camana River
4-57
selection and the work’s supervision. Table 4.9-1 presents the Project’s overall schedule. 1) Consultant selection: 3 months, builder selection: 3 months 2) Develop detailed design and technical specifications of the work’s period
① River and re-forestation works along these works
Detailed design and technical specifications elaboration: 6 months Working Period: 2 years
② Capacity Building
It will be executed on the same work period of river facilities. Detailed design and technical specifications elaboration: 6 months Working Period: 2 years
Table 4.9-1 Implementation Plan
4.10 Institutions and Administration Peruvian institutions regarding the Project’s execution and administration are the Agriculture Ministry, Economy and Finance Ministry and Irrigation Commission, with the following roles for each institution:

Preparatory study on the protection program for valleys and rural communities vulnerable to floods in Peru
Profile Study Report (Pre-feasibility level),Majes-Camana River
4-58
Ministry of Agriculture (MINAG) *The Ministry of Agriculture (MINAG) is responsible for implementing programs and
the Hydraulic Infrastructure General Direction (DGIH) is responsible for the technical administration of the programs. The Hydraulic Infrastructure General Direction (DGIH) is dedicated to the coordination, administration and supervision of investment programs.
* In investment stage, the PSI(Programa Subsectorial de Irrigaciones, Ministerio de Agricultura) is dedicated to calculate project costs, detail design and supervision of the works execution.
* The Planning and Investment Office (OPI) from the Agriculture Ministry is the one responsible for pre-feasibility and feasibility studies in the pre-investment stage of DGIH projects and requests approval of DGPI from the Economy and Finance Ministry (MEF).
* The General Administration Office of the Agriculture Ministry (OGA-MINAG) along with the Public Debt National Direction (DNEP) of the Economy and Finance Ministry is dedicated to financial management. It also manages the budget for procurement, commissioning works, contracting, etc. from the Agriculture Ministry.
* The Environmental Affairs General Direction (DGAA) is responsible for reviewing and approving the environmental impact assessment in the investment stage.
Economy and Finance Ministry (MEF) * The DGPI approves feasibility studies. It also confirms and approves the conditions of loan contracts in yen. In the investment stage, it gives technical comments prior to the
project execution. * Financial management is in charge of DNEP from the Economy and Finance Ministry and
OGA-MINAG. *The Public Debt National Direction (DNEP) of the Economy and Finance Ministry
administers expenses in the investment stage and post-investment operation.
Irrigation Commission * Responsible for the operation and maintenance of facilities at the post-investment operation stage.
The relationship between the involved institutions in the Project’s execution is shown in Figures 4.10-1 and 4.10-2. In this Project, the investment stage (Project execution) corresponds to PSI from MINAG. The PSI is currently performing JBIC projects, etc. and in case of beginning a new project, it forms the correspondent Project Management Unit (UGP), who is responsible of choosing the consulting firm, hire construction services, works supervision, etc. The following figure describes the structure of the different entities involved in the Project’s execution stage.

Preparatory study on the protection program for valleys and rural communities vulnerable to floods in Peru
Profile Study Report (Pre-feasibility level),Majes-Camana River
4-59
Figure 4.10-1 Related Agencies in Implementation Stage of Project
The main operations in the post-investment stage consist of operation and maintenance of the built works and the loan reimbursement. The O & M of the works will be assumed by the respective irrigation commission. Likewise, they should pay the construction costs in credits mode. Next, the relationship of different organizations involved in post-project implementation stage is detailed.
Figure 4.10-2 Related Agencies in Operation Stage of Project
(1) DGIH 1) Role and Functions The Hydraulic Infrastructure General Direction is in charge of proposing public policies, strategies and plans aimed to promoting water infrastructure development, according with

Preparatory study on the protection program for valleys and rural communities vulnerable to floods in Peru
Profile Study Report (Pre-feasibility level),Majes-Camana River
4-60
the Water Resources National Policy and the Environmental National Policy. Water Infrastructure development includes studies, works, operation, maintenance and construction risk management, fit-out, improve and expand dams, intakes, river beds, irrigation channels, drains, meters, outlets, groundwater wells and modernize plot irrigation. 2) Main functions a. Coordinate with the planning and budget office to develop water infrastructure and
propose sectorial and management policies on infrastructure development. Monitor and assess the implementation of sectorial policies related to hydraulic infrastructure development
b. Propose government, region and provinces intervention regulations, as part of sectorial policies
c. Verify and prioritize hydraulic infrastructure needs d. Promote and develop public investment projects at the hydraulic infrastructure profile
level e. Elaborate technical regulations to implement hydraulic infrastructure projects f. Promote technological development of hydraulic infrastructure g. Elaborate operation and maintenance technical standards for hydraulic infrastructure
(2) PSI 1) Function The Irrigation Sub-sectorial Program (PSI) is responsible of executing investment projects. A respective management unit is formed for each project. 2) Main functions a. Irrigation Sub-sectorial Program - PSI, under the Agriculture Ministry, is a body with
administrative and financial autonomy. It assumes the responsibility of coordinating, managing and administering involved institutions in projects in order to meet goals and objectives proposed in investment projects
b. Also, it coordinates the disbursements of foreign cooperation agencies financing, such as JICA.
c. The Planning, Budget and Monitoring Office of PSI is responsible for hiring services, elaborating investment programs, as well as project execution plans. These Project preparation works are executed by hiring “in-house” consultants.
d. Likewise, it gathers contractors, makes a lease, executes works and implements supply projects, etc.
e. Contract management is leaded by the Planning, Budget and Monitoring Office 3) Budget In Table 4.10-1 the PSI budget for 2011 is shown.

Preparatory study on the protection program for valleys and rural communities vulnerable to floods in Peru
Profile Study Report (Pre-feasibility level),Majes-Camana River
4-61
Table 4.10-1 PSI Budget (2011)
Programs / Projects / Activities PIM (S/.)
JBIC Program (Loan Agreement EP-P31) 69.417.953
Program - PSI Sierra (Loan Agreement 7878-PE) 7.756.000
Direct management works 1.730.793
Southern Reconstruction Fund (FORSUR) 228.077
Crop Conversion Project (ARTRA) 132.866
Technified Irrigation Program (PRT) 1.851.330
Activity- 1.113819 small farmers... 783.000
PSI Management Program (Other expenses) 7.280.005
TOTAL 89,180,024
4) Organization PSI is confirmed by 235employees, from which 14 are assigned for JBIC Projects and 29 technicians and assistants are working under them.
Table 4.10-2 PSI Payroll
Central Level Data from May 31, 2011
CAS Servic. and Consult. TOTAL
Main Office 61 43 104
Zonal Office LIMA 12 24 36
Zonal Office AREQUIPA 14 12 26
Zonal Office CHICLAYO 17 13 30
Zonal Office TRUJILLO 13 26 39
TOTAL 117 118 235
In Figure 4.10-3, PSI organization is detailed:

Preparatory study on the protection program for valleys and rural communities vulnerable to floods in Peru
Profile Study Report (Pre-feasibility level),Majes-Camana River
4-62
Figure 4.10-3 Organization of PSI 4.11 Logical framework of the eventually selected option In Table 4.11-1 the logical framework of the definite selected option is shown.
Table 4.11-1 Logical framework of the definite selected option
Narrative Summary Verifying IndicatorsVerifying Indicators
Media
Preliminary
Conditions
Superior Goal
Promote
socioeconomic local
development and
contribute in
communities’ social
welfare.
Improve local
productivity, generate
more jobs, increase
population’s income
and reduce poverty
index
Published statistic dataScio-economic and
policy stability
Objectives
Relief the high
vulnerability of valleys
and local continuity to
floods
Types, quantity and
distribution of flood
control works,
population and
beneficiaries areas
Monitoring annual
calendar works and
financial plan, budget
execution control
Ensure the necessary
budget, active
intervention from
central and regional
governments,
municipalities,
irrigation communities,

Preparatory study on the protection program for valleys and rural communities vulnerable to floods in Peru
Profile Study Report (Pre-feasibility level),Majes-Camana River
4-63
local population, etc.
Expected results
Reduction of areas and
flooded areas,
functional
improvement of
intakes, road
destruction prevention,
irrigation channels
protection, bank
erosion control and
Poechos dike safety
Number of areas and
flooded areas, water
intake flow variation,
road destruction
frequency, bank
erosion progress and
watershed’s
downstream erosion.
Site visits, review of
the flood control plan
and flood control
works reports and
periodic monitoring of
local inhabitants
Maintenance
monitoring by regional
governments,
municipalities and
local community,
provide timely
information to the
superior organisms
Activities
Component A:
Structural Measures
Dikes rehabilitation,
intake and bank
protection works, road
damages prevention,
construction of 28
works, including dike’s
safety
Detailed design review,
works reports,
executed expenses
Ensure the works
budget, detailed
design/works
execution/good quality
works supervision
Component B:
Non-Structural
Measures
B-1 Reforestation and
vegetation recovery
Reforested area,
coastal forest area
Works advance reports,
periodic monitor by
local community
Consultants support,
NGO’s, local
community, gathering
and cooperation of
lower watershed
community
Component C: Disaster
prevention and
capabilities
development education
Number of seminars,
trainings, workshops,
etc
Progress reports, local
governments and
community monitoring
Predisposition of the
parties to participate,
consultants and NGO’s
assessments
Project’s execution
management

Preparatory study on the protection program for valleys and rural communities vulnerable to floods in Peru
Profile Study Report (Pre-feasibility level),Majes-Camana River
4-64
Project’s management
Detailed design, work
start order, work
operation and
maintenance
supervision
Design plans, work’s
execution plans, costs
estimation, works
specifications, works
management reports
and maintenance
manuals
High level consultants
and contractors
selection, beneficiaries
population
participation in
operation and
maintenance
4.12 Middle and long term Plan Up to this point, only flood control measures have been proposed and these must be executed most urgently, due to the limitations on the available budget for this Project. However, there are other measures that must be performed in the long term framework. In this section we will be talking about the middle and long term flood control plan.

Preparatory study on the protection program for valleys and rural communities vulnerable to floods in Peru
Profile Study Report (Pre-feasibility level),Majes-Camana River
4-65
4.12.1 Flood Control General Plan There are several ways to control floods in the entire watershed, for example building dams, reservoirs, dikes or a combination of these. In case of building a dam, assuming that this will reduce the flood peak (maximum flow) with a 50 year return period reaching an equivalent flow of 10 return years. It will be necessary to build a dam with a 48.6 million m3 capacity, which is quite an oversized number. Usually upstream of an alluvial area, there is a rough topography, and in order to build a dam with enough capacity, a very high dam need to be built, which implies investing a large amount (more than 10,000 million of yen in each dam). Also, it would take between three to five years to identify the dam site, perform geological survey, material assessment and conceptual design. The impact on the local environment is huge. So, it is considered inappropriate to include the dam analysis option in this Study. Likewise, the option of building a retarding basin would be hardly viable for the same reasons already given for the dam, because it would be necessary to build a great capacity reservoir and it is difficult to find a suitable location because most of the flat lands along the river’s downstream are being used for agricultural purposes. So, its analysis has been removed from this Study. Therefore, we will focus our study in the construction of dams because it is the most viable option. (1) Plan of the river 1) Discharge capacity An estimation was done on the discharge capacity of the current flow of this river based on longitudinal and cross sectional survey of the river, which results are shown in the section 3.1.10, Figure 3.1.10-3 and Figure 3.1.10-4. 2) Inundation characteristics The inundation analysis of Majes-Camana river was performed. In the section 3.1.10, Figure 3.1.10-5 and in Figure 3.1.10-6 the inundation condition for flood with probabilities of 50 years is shown. It overflows at the vicinity of 5km from the river mouth, and the flood flow spreads greatly in the left-bank side. In middle stream and upstream areas, It overflows in lowland plain, and flood flow stagnates by the surrounded hills and mountains. 3) Design flood level and dike’s standard section The design flood level was determined in the flood water level with a return period of 50 years,

Preparatory study on the protection program for valleys and rural communities vulnerable to floods in Peru
Profile Study Report (Pre-feasibility level),Majes-Camana River
4-66
and the dike’s standard section will be determined as already mentioned in section 4.3.1, 5), 1). In the section 4.2, Table 4.2-2 and Table 4.2-3 the theoretical design flood level and the required height of the dike’s crown is shown. 4) Dikes’ Alignment Considering the current conditions of existing dikes the alignment of the new dikes was defined. Basically, the broader possible river width was adopted to increase the discharge capacity and the retard effect. In Figure 4.12.1-1 the current channel and the setting alignment method of a section where the current channel has more width is explained schematically. In a normal section, the dike’s crown has the same height to the flood water level with a return period of 50 years plus free board, while in the sections where the river has greater width, double dikes be constructed with inner consistent dike alignment and continuous with normal sections upstream and downstream. The crown height is equal to the flood water level with a return period of 50 years. The external dike’s crown height is equal to flood water level with a return period of 50 years, so in case the river overflows the internal dike, the open gap between the two dikes will serve to store sediments and retarding water.
Figure 4.12.1-1 Definition of dike alignment

Preparatory study on the protection program for valleys and rural communities vulnerable to floods in Peru
Profile Study Report (Pre-feasibility level),Majes-Camana River
4-67
5) Plan and section of river
The plan and longitudinal section of river are as shown in the Figure 4.12.1-2, and -4.12.1-3 respectively.
Majes River
Camana River
Figure 4.12.1-2 Plan of Majes-Camana River

Preparatory study on the protection program for valleys and rural communities vulnerable to floods in Peru
Profile Study Report (Pre-feasibility level),Majes-Camana River
4-68
Figure 4.12.1-3 Majes-Camana River Longitudinal Profile
6) Dike’s construction plan Next, basic policies for the dike’s construction plan on the Majes-Camana River are shown: - Build dikes that allow flood flow safe passage with a return period of 50 years - The dikes will be constructed in areas where overflowing water will enter the dike, according to the flood simulation - The dikes will be placed in the sections above mentioned, where the design water level exceeds the existing dike’s height or the ground level within the dike - The dike’s height is defined in the flood water level with a return period of 50 years plus the free board Table 4.12.1-1 and Figure 4.12.1-4 show the dike’s construction plan on the Majes-Camana River.
Table 4.12.1-1 Dike’s Construction Plan
River Name Improvement Section Shortage for Design Height
(m) Dike Plan Dike Length
(km)
Majes-Camana River Left bank side 0.0k-108.0k 1.77 Dike h=2.0m
Revetment h=3.0m
79.5 Right bank side 0.0k-111.0k 1.81 56.5 Total 1.79 136.0
Tramo a ser mejorado Izq. 0,0k-108,0k Dre. 0,0k-111,0k

Preparatory study on the protection program for valleys and rural communities vulnerable to floods in Peru
Profile Study Report (Pre-feasibility level),Majes-Camana River
4-69
Figure 4.12.1-4 Layout of dike in Majes-Camana River
Left bank 0.0k-111.0k
Right bank 0.0k-108.0k

Preparatory study on the protection program for valleys and rural communities vulnerable to floods in Peru
Profile Study Report (Pre-feasibility level),Majes-Camana River
4-70
7) Project Cost In Tables 4.12.1-2 and 4.12.1-3 works’ direct costs in private prices and the Project’s cost are shown. Also, the cost of the project in social prices is presented in Table 4.12.1-4.
Table 4.12.1-2 Works directs cost (at private prices)
Construction of dike Revetment protectionB1 H1 B2 A B1 H2 B2 A
3.0 1.0 8.5 5.8 1.0 1.0 2.4 10.83.0 2.0 14.0 17.0 1.0 2.0 2.9 13.43.0 3.0 19.5 33.8 1.0 3.0 3.4 16.53.0 4.0 25.0 56.0 1.0 4.0 3.9 20.13.0 5.0 30.5 83.8 1.0 5.0 4.4 24.33.0 1.5 11.3 10.7 1.0 6.0 4.9 28.9
1.0 1.5 2.6 12.01.0 10.0 6.9 52.4
Quantity Unit Unit PriceDirectConstructionCost/ 1m
DirectConstructionCost/ 1km
Dike length
Direct
Constructioncost
(Sol) (Sol) (103 Soles) (km) (10
3 Soles)
Majes 17.0 m3 10.0 170.0 170.0 136.0 23,120.0Camana 16.5 m3 100.0 1,650.0 1,650.0 224,400.0
River Basin
RevetmentEmbankment
H1
4m
1m
Dike
1:3.01:3.0
1:2.51.75m
H2Revetment protection
B1

Prep
arat
ory
stud
y ab
out t
he p
rote
ctio
n pr
ogra
m fo
r
valle
ys a
nd ru
ral c
omm
uniti
es v
ulne
rabl
e to
floo
ds in
Per
u
Pro
file
Stu
dy R
epor
t (P
re-f
easi
bilit
y le
vel)
,Maj
es-C
aman
a R
iver
4-71
Tabl
e 4.
12.1
-3
Proj
ects
’ Cos
t (at
pri
vate
pri
ces)
( s
oles
)
Cost
oD
irecto
Cost
o d
e O
bras
Tem
pora
les
Cost
ode
Obr
asG
asto
sO
pera
tivo
sU
tilid
adC
ost
o T
ota
lIn
frae
stru
ctu
raIG
VC
ost
o T
ota
lO
bra
Impa
cto
Am
bienta
lExp
edi
ente
Tecnic
oS
upe
rvis
ión
流域
名直
接工
事費
計共
通仮
設費
工事
費諸
経費
利益
構造
物工
事費
税金
建設
費環
境影
響詳
細設
計施
工管
理費
構造
物・事
業費
(1)
(2)
= 0
.1 x
(1)
(3)
= (
1)
+ (
2)
(4)
= 0
.15 x
(3)
(5)
= 0
.1 x
(3)
(6)
= (
3)+
(4)+
(5)
(7
) = 0
.18 x
(6)
(8)
= (
6)+
(7)
(9)=
0.0
1 x
(8)
(10)
= 0
.05 x
(8)
(11)
= 0
.1 x
(8)
(12)
= (
8)+
(9)+
(10)+
(11)
MA
JES
-C
AM
AN
A247,5
20,0
00
24,7
52,0
00
272,2
72,0
00
40,8
40,8
00
27,2
27,2
00
340,3
40,0
00
61,2
61,2
00
401,6
01,2
00
4,0
16,0
12
20,0
80,0
60
40,1
60,1
20
465,8
57,3
92
No
mbre
de
la C
ue
nc
a
CO
ST
OS
A P
RE
CIO
S P
RIV
AD
OS
- T
OT
AL
民間
価格
-
洪水
防御
施設
のみ
CO
ST
O D
IRE
CT
OC
OS
TO
IN
DIR
EC
TO
INF
RA
ES
TR
UC
TU
RA
HID
RA
UL
ICA
Cost
o T
ota
l
Tabl
e 4.
12.1
-4
Proj
ects
’ Cos
t (at
soci
al p
rice
s)
( sol
es)
Dir
ect
Cost
Com
mon
Tem
pora
ryW
ork
Cost
Const
ructi
on
Cost
Ove
rhead
cost
Pro
fit
Str
uctu
reC
onst
ructi
on
Cost
Tax
(IG
V)
Const
ructi
on C
ost
Envi
ronm
ent
Cost
Deta
il D
esi
gnC
ost
Const
ructi
on
Supe
rvis
ion
Cost
流域
名直
接工
事費
計共
通仮
設費
工事
費諸
経費
利益
構造
物工
事費
税金
建設
費環
境影
響詳
細設
計施
工管
理費
構造
物・事
業費
(1)
(2)
= 0
.1 x
(1)
(3)
= (
1)
+ (
2)
(4)
= 0
.15 x
(3)
(5)
= 0
.1 x
(3)
(6)
= (
3)+
(4)+
(5)
(7
) = 0
.18 x
(6)
(8)
= (
6)+
(7)
(9)=
0.0
1 x
(8)
(10)
= 0
.05 x
(8)
(11)
= 0
.1 x
(8)
(12)
= (
8)+
(9)+
(10)+
(11)
MA
JES
-C
AM
AN
A199,0
06,0
80
19,9
00,6
08
218,9
06,6
88
32,8
36,0
03
21,8
90,6
69
273,6
33,3
60
49,2
54,0
05
322,8
87,3
65
3,2
28,8
74
16,1
44,3
68
32,2
88,7
36
374,5
49,3
43
Dir
ec
t C
ost
Indir
ec
t C
ost
To
tal
Pro
jec
t C
ost

Preparatory study about the protection program for valleys and rural communities vulnerable to floods in Peru
Profile Study Report (Pre-feasibility level),Majes-Camana River
4-72
2) Operation and Maintenance Plan The operation and maintenance cost was calculated identifying the trend of the sedimentation and erosion bed based on the one-dimensional analysis results of the bed variation, and a long-term operation and maintenance plan was created. The current river course has some narrow sections where there are bridges, farming works (intakes, etc.) and there is a tendency of sediment gathering upstream of these sections. Therefore, in this project there is a suggestion to increase the discharge capacity of these narrow sections in order to avoid as possible upstream and in the bed (main part) sedimentation, together with gathering sediments as much as possible when floods over a return period of 50 years occur. 1) Bed variation analysis Figure 4.12.1-5 shows the results of the Bed variation analysis of the Majes-Camana River for the next fifty years. From this figure a projection of the bed’s sedimentation and erosion trend and its respective volume can be made. 2) Sections that need maintenance In table 4.12.1-5 possible sections that require a process of long-term maintenance in the Majes-Camana River watershed is shown. 3) Operation and maintenance cost Next the direct work cost at private prices for maintenance (bed excavation) required for each watershed in the next 50 years is shown. Direct Work Cost At private prices: 530,000 m3 x 10 = 5,300,000 soles Tables 4.12.1-6 and 4.12.1-7 show a 50 year Project cost at private and social prices.

Preparatory study about the protection program for valleys and rural communities vulnerable to floods in Peru
Profile Study Report (Pre-feasibility level),Majes-Camana River
4-73
Table 4.12.1-5 Sections which bed must be excavated in a programmed way
River Excavation extension Maintenance method
Majes-Camana Section 1 Section: km 12,0- km 13,0 EarthVolume: 70.000 m3
It is a section where the bed can be considerably elevated with few sediment amount due to its narrowness. It is recommended to perform an annual periodic dredging to reduce its impact on the intake
Section 2 Section: km100,0-km 101,0 EarthVolume: 460.000 m3
It is a widen section, where great amounts of sediments gather. Periodic dredging of this section would also help to control the middle watershed’s bed elevation. Is is an area where periodic dredging must be performed from the flood control’s point of view
* Sediments volume that will gather in a 50 year period
Figure 4.12.1-5 Section that requires maintenance (Majes-Camana River)
Table 4.12.1-6 Excavation Works cost for a 50 year bed (at private prices)
Watershed Direct Cost Temporary works cost
Works Cost Operative Expenses
Utility Total Cost of Infrastructure
TAX Total work
costEnvironmental
Impact Technical FIle Supervision Total Cost Total Cost
流域名 直接工事費計 共通仮設費 工事費 諸経費 利益 構造物工事費 税金 建設費 環境影響 詳細設計 施工管理費 事業費
(1) (2) = 0.1 x (1) (3) = (1) + (2) (4) = 0.15 x (3) (5) = 0.1 x (3)(6) =
(3)+(4)+(5) (7) = 0.18 x
(6)(8) = (6)+(7) (9)=0.01 x (8)
(10) = 0.05 x (8)
(11) = 0.1 x (8) (12) = (8)+(9)+(10)+(11) (13) = (12)/50
Majes-Camana 5,300 530 5,830 875 583 7,288 1,312 8,599 86 430 860 9,975 200
Table 4.12.1-7 Excavation Works cost for a 50 year bed (at social prices)
Watershed Direct Cost Temporary works cost
Works Cost Operative Expenses
Utility Total Cost of Infrastructure
TAX Total work
costCorrection
factorWorks Total
costEnvironmental
Impact Technical FIle Supervision Total Cost Total Cost
流域名 直接工事費計 共通仮設費 工事費 諸経費 利益 構造物工事費 税金 建設費 環境影響 詳細設計 施工管理費 事業費
(1) (2) = 0.1 x (1) (3) = (1) + (2) (4) = 0.15 x (3) (5) = 0.1 x (3)(6) =
(3)+(4)+(5) (7) = 0.18 x
(6)(8) = (6)+(7) CF (10) = 0.01*(8) (9)=0.01 x (8)
(10) = 0.05 x (8)
(11) = 0.1 x (8) (12) = (8)+(9)+(10)+(11) (13) = (12)/50
Majes-Camana 5,300 530 5,830 875 583 7,288 1,312 8,599 0,804 6,914 69 345 691 8,020 180

Preparatory study about the protection program for valleys and rural communities vulnerable to floods in Peru
Profile Study Report (Pre-feasibility level),Majes-Camana River
4-74
(3) Social Assessment 1) Private prices cost a) Damage amount Table 4.12.1-8 shows the damage amount calculated analyzing the overflow caused by floods in the Majes-Camana River with return periods between 2 and 50 years.

Preparatory study about the protection program for valleys and rural communities vulnerable to floods in Peru
Profile Study Report (Pre-feasibility level),Majes-Camana River
4-75
Table 4.12.1-8 Amount of damage for floods of different return periods
b) Damage reduction annual average Table 4.12.1-8 shows the damage reduction annual average of each watershed calculated with the data of Table 4.12.1-9. c) Project’s Cost and the operation and maintenance cost Table 4.12.1-3 shows the projects’ cost. Also, the annual operation and maintenance (O & M) cost for dikes and bank protection works can be observed in the table. This is calculated from the 0.5% of the construction cost plus the bed excavation annual average cost indicated in Table 4.12.1-6. d) Economic evaluation In Table 4.12.1-10 the results of economic assessment are shown.
Table 4.12.1-9 Damage Reduction Annual Average
事業を実施しな
い場合①
事業を実施した
場合②
軽減額
③=①-②
Without Project
①With project ②
Damage
reduction
③=①-②
1 1.000 0 0 0 0 0
2 0.500 0 0 0 0 0.500 0 0
5 0.200 47,669 0 47,669 23,834 0.300 7,150 7,150
10 0.100 76,278 0 76,278 61,973 0.100 6,197 13,348
25 0.040 111,113 0 111,113 93,696 0.060 5,622 18,969
50 0.020 190,662 0 190,662 150,887 0.020 3,018 21,987
Accumulation of⑥ = Annual
average damage
reduction
年平均被害額④×⑤
Annual average
damage ⑥
区間確率⑤
Section
probability
流域
Basin
流量規模
Return period
超過確率
Probability
被害額 (Total damage - miles de S/.)
区間平均被害
額
④
Average
damage
MAJES-CAMANA
Return period (t) Majes-Camana
2 0
5 47.669
10 76.278
25 111.113
50 190.662
Damages in Thousand S/.被害額(千ソーレス)

Preparatory study about the protection program for valleys and rural communities vulnerable to floods in Peru
Profile Study Report (Pre-feasibility level),Majes-Camana River
4-76
Table 4.12.1-10 Economic assessment results (private prices costs)
年平均被害軽減額評価期間被害 軽減額(15年)
事業費 維持管理費 C/BNet Present Value
(NPV)Internal Rate of
Return (IRR)
Accumulated Average Annual Benefit
Accumulated Average Annual Benefit (in 15
years)Project's Cost O&M Cost
Cost/Benefit Relation
NPV IRR
Majes-Camana 285,833,001 129,076,518, 465,857,392 29,096,617 0.31 negative 291140628 none
流域名
2) Social prices cost a) Damage amount Table 4.12.1-11 shows the damage amount calculated analyzing the overflow caused by floods in the Majes-Camana River with return periods between 2 and 50 years in each watershed.
Table 4.12.1-11 Amount of damage for floods of different return periods
Damages in Thousand S/. 被害額(千ソーレス)
Return Period (t) Majes-Camana
2 0
5 48.468
10 78.194
25 116.730
50 206.459
b) Damage reduction annual average Table 4.12.1-11 shows the damage reduction annual average of each watershed calculated with the data of Table 4.12.1-9. c) Project’s Cost and the operation and maintenance cost Table 4.12.1-4 shows the projects’ cost. Also, the annual operation and maintenance (O & M) cost for dikes and bank protection works can be observed in the table. This is calculated from the 0.5% of the construction cost, as well as the bed excavation annual average cost indicated in Table 4.12.1-7.

Preparatory study about the protection program for valleys and rural communities vulnerable to floods in Peru
Profile Study Report (Pre-feasibility level),Majes-Camana River
4-77
d) Economic evaluation In Table 4.12.1-13 the results of economic assessment are shown.
Table 4.12.1-12 Damage Reduction Annual Average
事業を実施しな
い場合①
事業を実施した
場合②
軽減額
③=①-②
Without Project
①With project ②
Damage
reduction
③=①-②
1 1.000 0 0 0 0 0
2 0.500 0 0 0 0 0.500 0 0
5 0.200 48,468 0 48,468 24,234 0.300 7,270 7,270
10 0.100 78,194 0 78,194 63,331 0.100 6,333 13,603
25 0.040 116,730 0 116,730 97,462 0.060 5,848 19,451
50 0.020 206,459 0 206,459 161,594 0.020 3,232 22,683
MAJES-CAMANA
社会価格
Accumulation of⑥ = Annual
average damage
reduction
年平均被害額④×⑤
Annual average
damage ⑥
区間確率⑤
Section
probability
流域
Basin
流量規模
Return period
超過確率
Probability
被害額 (Total damage - miles de S/.)
区間平均被害額
④
Average
damage
Table 4.12.1-10 Economic assessment results (social prices costs)
年平均被害軽減額評価期間被害
軽減額(15年)事業費 維持管理費 B/C NPV IRR(%)
Annual AverageDamage Reduction
Damage Reduction inEvaluation
Period(15years)
Project Cost O&M CostCost Benefit
RationNet Present
ValueInternal Return
of Rate
Majes-Camana 294,878,168 133,161,136 374,549,343 23,393,680 0.39 -204,693,450 -
(4) Conclusions The economic assessment result shows that the Project has negative economic impact in terms of cost on both private and social prices, in addition to that the required cost is extremely high (465.9 million soles), so that this Project is difficult to be adopted.
4.12.2 Reforestation and Recovery of Vegetation Plan (1) Reforestation of the upper watershed Long-term reforestation in all areas considered to be critical of the upper watershed is recommended. So, a detail analysis of this alternative will be explained next. 1) Basic Policies � Objectives: Improve the water source area’s infiltration capacity, reduce surface soils water flow and at the same time, increase water flow in intermediate soils and ground-water level. Because of the above mentioned, water flow is interrupted in high flood season, this increases water resources in mountain areas, reduces and prevents floods increasing with it the amount and greater flow of ground-water level, reducing and preventing floods � Forestry area: means forestry in areas with planting possibilities around watersheds with

Preparatory study about the protection program for valleys and rural communities vulnerable to floods in Peru
Profile Study Report (Pre-feasibility level),Majes-Camana River
4-78
water sources or in areas where forest area has decreased. Based on the Forestry Plan for Chincha River Watershed developed by AgroRural, areas that may have forestry projects executed relatively in short-term and with success probabilities have been selected � Forestry method: local people plantations. Maintenance is done by promoters, supervision and advisory is leaded by NGOs. � Maintenance after forestry: Maintenance is performed by the sow responsible in the community. For this, a payment system (Payment for Environmental Services) will be created by downstream beneficiaries � Observations: After each thinning the area will have to be reforested, keeping and preserving it in a long-term sustainable way. An incentive for community people living upstream of the watershed shall be designed. The forest is preserved after keeping and reforesting it after thinning, this also helps in the support and prevention of floods. For this, it is necessary that local people are aware, encourage people downstream, promote and spread the importance of forests in Peru during the project’s execution. 2) Selection of forestry area In case of executing forestry upstream the watershed, as mentioned in “1) Basic Policies”, the activities are executed by local people. In this case, the community will forest during their spare time from their agricultural activities. However, the community mostly lives in the highlands performing their farming and cattle activities in harsh natural conditions. Therefore, it is difficult to tell if they have the availability to perform forestry. So, finding comprehension and consensus of the inhabitants will take a long time. 3) Time required for the reforestation project Since it is a small population, the workforce availability is reduced. So, the work that can be carried out during the day is limited, and the work efficiency would be very low. The JICA Study Team estimated the time required to reforest the entire area throughout the population in the areas within the reforestation plan, plant quantity, work efficiency, etc. According to this estimate, it will take 14 years to reforest approximately 40,000 hectares from the Chincha River Watershed. When estimating the required time for other watersheds, by simply applying this rate to the respective watershed area, we obtained that reforestation in Majes-Camana River Watershed will take 98 years. 4) Total reforestation volume in the upper watershed and project’s period and cost It has been estimated that the surface needed to be reforested in the Majes-Camana River Watershed, as well as the execution cost, having as reference Chincha River Watershed project reforestation data. According to this estimate, the area to be reforested is approximately a total

Preparatory study about the protection program for valleys and rural communities vulnerable to floods in Peru
Profile Study Report (Pre-feasibility level),Majes-Camana River
4-79
of 307,000 hectares. The required period is 98 years, and the cost is calculated in 829 million soles. In other words, investing a great amount of time and money is required to reforest.
Table 4.12.2-1 Upstream Watershed Forest General Plan
Watershed Forestry Area (ha)A
Required period for the project
(years) B
Required budget (soles)
C
Majes-Camana 307.210 98 829.200.856 Chincha Project Cost per hectare: = 2.699,13 (soles /ha) (Calculation Example: Majes-Camana River Watershed) 307.210 / 44.075 x 14 = 98 (years) 307.210 x 2.699,13 = 829.200.856 (ha)
(Source: JICA Study Team) 5) Conclusions The objective of this project is to execute the most urgent works and give such a long period for reforestation which has an indirect effect with an impact that takes a long time to appear would not be consistent with the proposed objective for the Project. Considering that 98 years and invested 829 million soles are required, we can say that it is impractical to implement this alternative in this project and that it shall be timely executed within the framework of a long-term plan after finishing this project. 4.12.3 Sediment control plan For the long-term sediment control plan, it is recommended to execute the necessary works in the upper watershed. The Sediment Control Plan in the upper watershed will mainly consist in construction of sediment control dikes and bank protection works. In Figure 4.12.3-1 the sediment control works disposition proposed to be executed throughout the watershed is shown. The cost of Majes-Camana River works was estimated focusing on: a) covers the entire watershed, and b) covers only the priority areas, analyzing the disposition of works for each case. The results are shown in Table 4.12.3-1. Due to the Majes-Camana River extension, the construction cost for every alternative would be too high in case of carrying-out the bank protection works, erosion control dikes, etc. Apart from requiring a considerably long time. This implies that the project will take a long time to show positive results. So, it is decided that it is impractical to execute this alternative within this project and should be timely executed within the framework of a long-term plan, after finishing this project.

Preparatory study about the protection program for valleys and rural communities vulnerable to floods in Peru
Profile Study Report (Pre-feasibility level),Majes-Camana River
4-80
Table 4.12.3-1 Upper watershed sediment control works execution estimated costs
Watershed Approach Bank Protection Strip Sediment control dike Total works
direct cost Project Cost (Millions S/.)Vol.
(km) Direct Cost (Million S/.)
Vol. (units)
Direct Cost (Million S/.)
Vol. (units)
Direct Cost (Million S/.)
Majes- Camana
All Watershed 264 S/.282 26 S/.1 123 S/.165 S/.448 S/.843Prioritized
Section 264 S/.282 26 S/.1 81 S/.105 S/.388 S/.730

Preparatory study about the protection program for valleys and rural communities vulnerable to floods in Peru
Profile Study Report (Pre-feasibility level),Majes-Camana River
4-81
Figure 4.12.3-1 Sediment control works location Majes-Camana River Watershed


Preparatory study on the protection program for valleys and rural communities vulnerable to floods in Peru
Profile Study Report (Pre-feasibility level),Majes-Camana River
5-1
5. CONCLUSIONS The selected alternative for flood control in this Study is structurally safe. Also, the social assessment showed a sufficiently high economic value. Its environmental impact is reduced. The implementation of this Project will contribute to relief the high vulnerability of valleys and local community to floods, and will also contribute to the local economic development. Therefore, we conclude to implement it as quickly as possible.
