final report - michigan.gov€¦ · state of michigan department of consumer & industry...
TRANSCRIPT
STATE OF MICHIGAN Department of Consumer & Industry Services
Project: Development of Technologies to Improve Cold Start Performance of Ethanol Vehicles
GRANT NO. PLA-00-48
Final Report
June 11, 2001
Prepared by:
Dr. Gregory W. Davis, P.E.
Director of the Automotive Engine Research Laboratory & Associate Professor of Mechanical Engineering
Mechanical Engineering Department Kettering University
1700 W. Third Avenue Flint MI 48504-4898
Phone: (810) 762-9886
Fax: (810) 762-9509
2
Table of Contents
Acknowledgements ............................................................................................. 3
Project Objectives................................................................................................ 4
Background ..................................................................................................... 4
Work Accomplished ............................................................................................ 6
Acquisition of a Hot Methane Testing Apparatus............................................. 6
Design and Construction of an Environmental Cold-Soak Engine Chamber ..... 8
Conversion of a Gasoline Fueled, Buick 3800 engine to E85 operation............ 9
Cold-Start Performance and Emissions Testing Of E85 Fueled Engines......... 10
Initial Cold-Start Testing............................................................................ 10
Test Procedure ....................................................................................... 11
Hydrogen Injection System .................................................................... 12
Cold Start Testing Results ...................................................................... 12
Controlled Laboratory Engine Testing ....................................................... 14
Develop Preliminary Designs for an On-Board Hydrogen Reformer .............. 17
Background ............................................................................................... 17
Hydrogen Reformer Design ....................................................................... 18
Development of Initial SetUp Parameters................................................... 19
Experimental Procedure ............................................................................. 21
Analysis of Data Gathered ......................................................................... 23
Conclusion Regarding the Use of the Pre-existing Reformer ...................... 27
Development of Model used to Evaluate Experimental Data .......................... 28
Model Input Parameters ............................................................................. 28
Impact of the Project.......................................................................................... 30
References......................................................................................................... 32
Appendix........................................................................................................... 33

3
Acknowledgements
This project was conducted with the support of the U.S. Department of Energy Grant Number CLGL-00-003 and the Michigan Department of Consumer & Industry Services (CIS)-Biomass Energy Program. Opinions, findings, conclusions or recommendations expressed herein do not necessarily reflect the views of the DOE or CIS.
The author would also like to thank the many students and staff of Kettering University who helped to make this project successful.

4
Project Objectives
The primary goal of this project was to develop cold start technologies for E85 engine operation. Specifically, this project focused on the use of hydrogen enrichment to improve the cold start performance of an engine using E85 fuel. The lowest level of hydrogen fueling that provided acceptable performance and emissions was identified and found to be approximately 8% by volume. This information was then used to initiate the design and development a hydrogen reformation system.
This project contains the following major phases:
1. Identify and acquire Hot, wet, Methane emissions analysis equipment.
2. Design and build an environmental cold-soak engine chamber.
3. Convert a Buick 3800 engine (already acquired) to E85 operation.
4. Conduct cold-start performance on the engine.
5. Evaluate the performance, modify equipment/operating parameters and repeat if necessary.
6. Report results of the proof-of-concept.
7. Develop preliminary designs for an on-board hydrogen reformer.
Background Ethanol Vehicles exhibit poor cold start performance. Below 11° Celsius, ethanol will not form a rich enough fuel vapor-air mixture to support combustion. Additional technology must be employed to provide acceptable cold start performance. This project will focus on the development of hydrogen fuel enrichment technology to aid in the cold start performance of an engine operating on E85 (85% ethanol, 15% gasoline).
Currently, vehicles rely on the addition of 15% gasoline (E85) to provide some relief during cold temperature conditions. The addition of 15% gasoline to the ethanol helps to alleviate the cold-start problem, by allowing the vehicle to start primarily on the vaporized gasoline compounds. In order to take advantage of the limited amount of gasoline present, the vehicle must be started using an extremely rich overall fuel-air mixture, producing significant levels of unburned hydrocarbon emissions. Further, E85 alone will not allow reliable cold-starts below about 0 ºC (based upon actual testing conducted during the 1998-99 Ethanol Vehicle Challenges). Clearly, this problem has the potential to inhibit the use of ethanol for transportation in Michigan.
5
This project was focused on one of the most promising areas for cold-start improvement, which is the use of hydrogen addition to the E85 fuel during cold-starts. Hydrogen does not need to be vaporized and it has an extremely fast burn rate, making it an excellent choice as a cold starting supplemental fuel. Further, hydrogen is unique among alternative fuels in its ability to burn over a wide range of air-fuel mixtures thus helping to minimize emissions.
The ability to burn at low concentrations and with fast flame speed is a mixed blessing as it means that hydrogen leakage poses an explosion hazard. Further, hydrogen is difficult to keep contained due to its small molecular structure. This poses the additional problem of the high likelihood of leakage. Finally, hydrogen exists in the low density gaseous state under normal temperatures and pressures. In order to achieve acceptable mass quantities of hydrogen, it must either be stored in another form, or under very high pressures. Because of these issues, the on-board storage of hydrogen is a difficult problem, which will limit its near-term use in automotive technology.
Additionally, the use of hydrogen as a separate fuel during cold starts would require the development of two fuel systems, which would most likely be objectionable to the customer from both a cost and convenience perspective. Therefore, hydrogen must be generated directly from the ethanol-based fuel using an on-board reformer.
Operating the vehicle solely on hydrogen during cold starts would require large amounts of hydrogen and thus it would require either an extremely large hydrogen reformer or an on-board hydrogen storage system would again have to be used. Viewing the difficulties with these two options, an experimental effort was made to determine the minimum amount of hydrogen, which can be used to provide acceptable cold start performance at –17.8° C (0° F).
The supplementation of alcohol fuels by adding small quantities of hydrogen can extend the lean-limit equivalent ratio while maintaining a sufficiently high flame speed. In this way, the fuel is used more efficiently, using only a small quantity of hydrogen. During the late 1920’s, the Zeppelin Company researched using hydrogen/gasoline mixtures in airship engines, focusing on extending the travel range of the dirigibles [1].
Using hydrogen to supplement gasoline, the Jet Propulsion Laboratory obtained lower nitrogen oxides (NOx) emissions and improved engine thermal efficiency[2]. The use of hydrogen permitted operation under leaner conditions than could be supported when using gasoline alone. Hydrogen was supplied from bottled hydrogen or from a prototype fuel reformer.
M.J.Grieve, J.E.Kirwan, and A.A.Quader developed an on-board reformer for a gasoline engine at the Delphi R&D Center [3]. The Delphi concept for on-board reforming keeps the reformer as small as possible, and it is designed to work with the 3-way catalytic after-treatment system. This system was not used to aid in cold startability, but was used solely to minimize emissions during engine operation.
6
K. D. Isherwood et al developed a partial oxidation system to improve cold start performance and emissions [4,5]. The program was conducted in two phases. The first phase demonstrated the feasibility of using partial oxidation to improve cold start by starting an engine on a simulated POX system (SIM-POX). The objective of the second phase was to develop a prototype cold-start POX system on a light duty vehicle engine. Fuel utilized in the experiments was a fuel grade ethanol (E95). This fuel is considerably more difficult to cold-start than E85, limiting the success of the POX system. Isherwood, et al, started an engine solely off of the reformate produced in the reformer. The fuel used for the present project is E85, which is better for cold-starts, and is more readily available than E95; thus it is the most practical desired blend of ethanol for transportation. Because of this, a smaller reformer can be used to supplement the regular intake, not replace it. This leads to a simpler, more practical system.
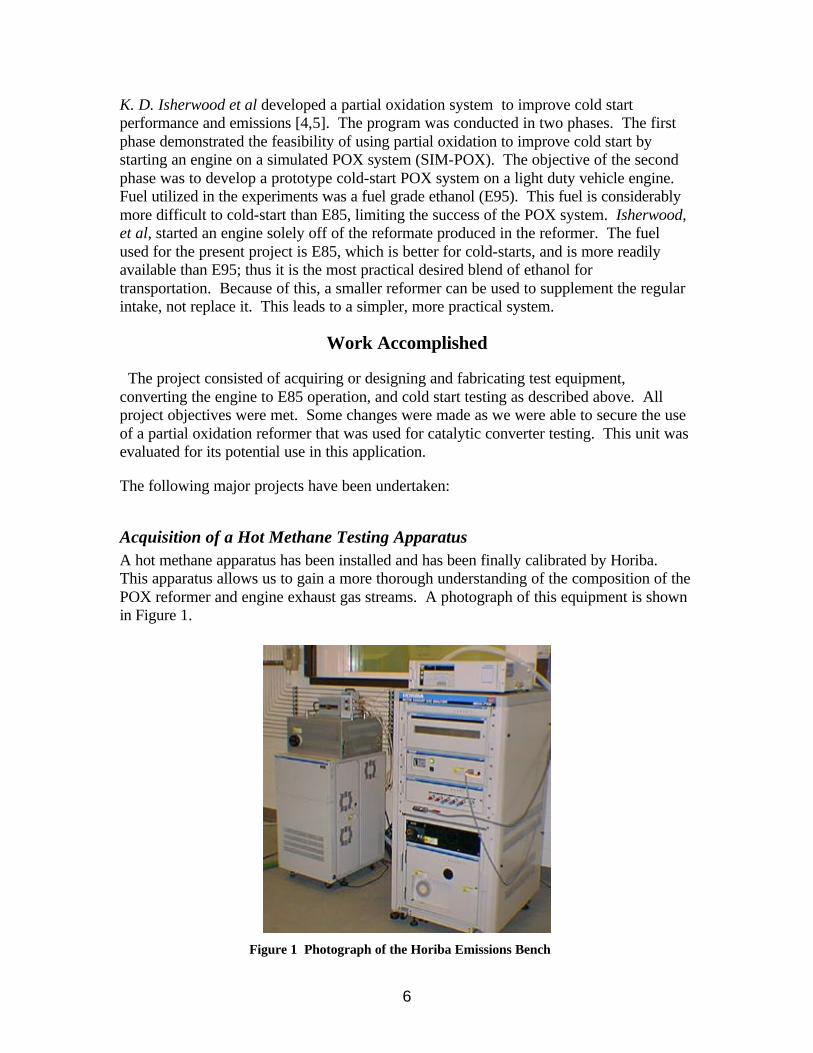
Work Accomplished
The project consisted of acquiring or designing and fabricating test equipment, converting the engine to E85 operation, and cold start testing as described above. All project objectives were met. Some changes were made as we were able to secure the use of a partial oxidation reformer that was used for catalytic converter testing. This unit was evaluated for its potential use in this application.
The following major projects have been undertaken:
Acquisition of a Hot Methane Testing Apparatus A hot methane apparatus has been installed and has been finally calibrated by Horiba. This apparatus allows us to gain a more thorough understanding of the composition of the POX reformer and engine exhaust gas streams. A photograph of this equipment is shown in Figure 1.
Figure 1 Photograph of the Horiba Emissions Bench
7
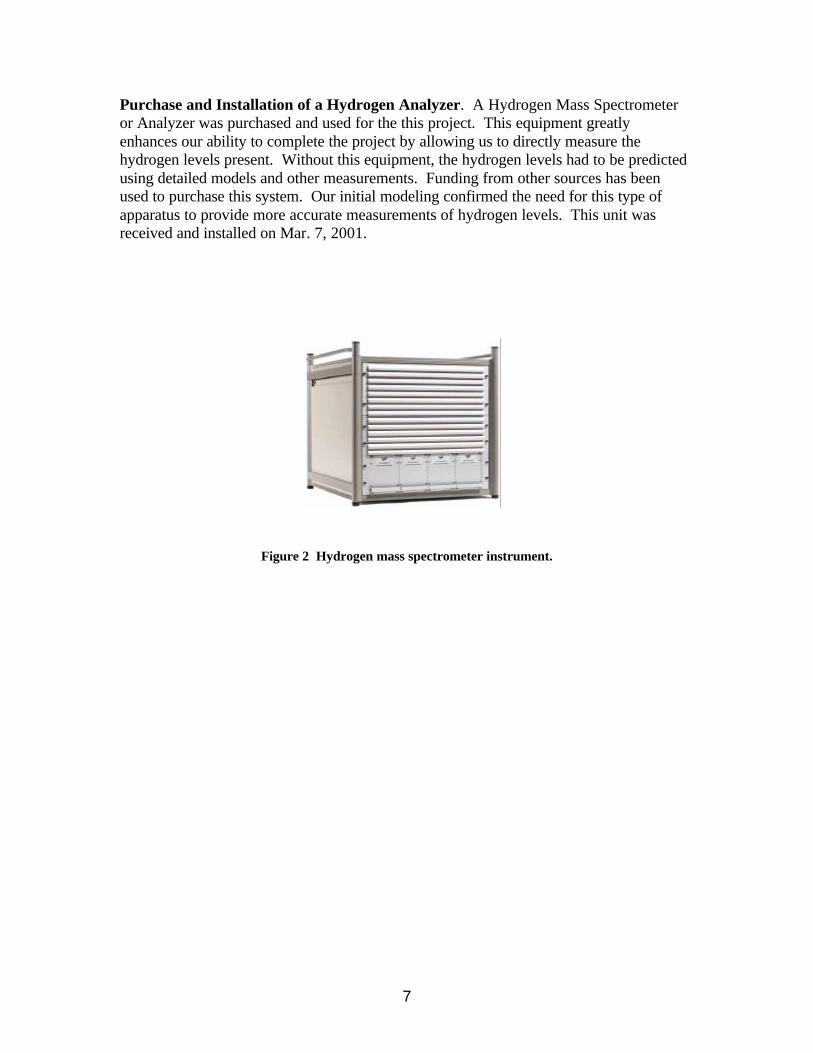
Purchase and Installation of a Hydrogen Analyzer. A Hydrogen Mass Spectrometer or Analyzer was purchased and used for the this project. This equipment greatly enhances our ability to complete the project by allowing us to directly measure the hydrogen levels present. Without this equipment, the hydrogen levels had to be predicted using detailed models and other measurements. Funding from other sources has been used to purchase this system. Our initial modeling confirmed the need for this type of apparatus to provide more accurate measurements of hydrogen levels. This unit was received and installed on Mar. 7, 2001.
Figure 2 Hydrogen mass spectrometer instrument.

8
Design and Construction of an Environmental Cold-Soak Engine Chamber An environmental cold-soak chamber was designed and built in order to provide controlled conditions for testing E85 engines. A conceptual drawing of this chamber is shown in Figure 3. The walls, floor and ceiling of the chamber are made from three layers of standard building foam board insulation partially encapsulated in sheet aluminum to add durability. A simple heat transfer model of the design was made in order to estimate cooling time required to reach final soak temperature based upon two different initial temperatures. This resistor model is shown in Figure 4. Based upon this analysis, a time of 1 hour is required to cool the engine and chamber from an initial temperature of 32° C (90° F) to –17.8° C (0° F). If the engine is warm, an initial temperature of 121° C (250° F), the time required to cool down to –17.8° C (0° F) goes up to 2.5 hours. This data was used to help determine the time required to prepare for each test.
8ft 4ft
engine
8f
1/2ft
Figure 3 Schematic of Cold-Soak Chamber
Figure 4 Heat Transfer Resistor Model
1/4hA1
1/2hA2
L/4KA1
L/2KA2
1/4hA1
1/2hA2
1/6hiAengi
Rengi ≈ 0 Note: A1 is the area of one of the side walls A2 is the area of the top and the bottom
9
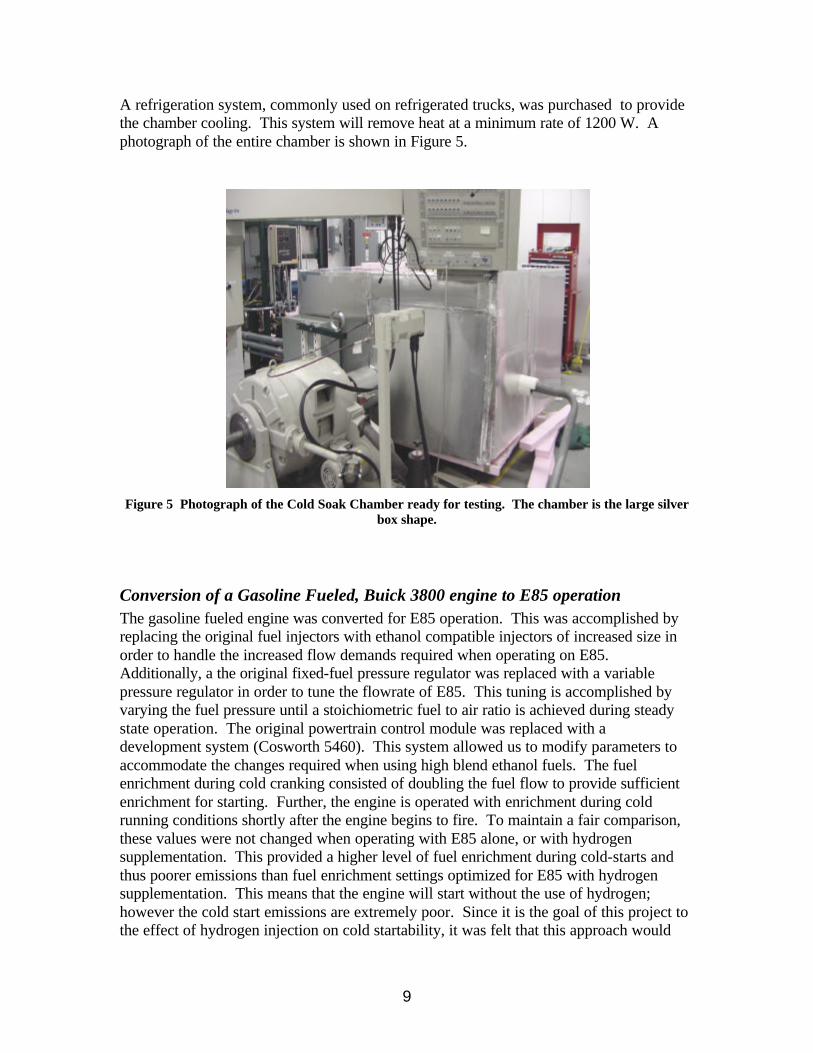
A refrigeration system, commonly used on refrigerated trucks, was purchased to provide the chamber cooling. This system will remove heat at a minimum rate of 1200 W. A photograph of the entire chamber is shown in Figure 5.
Figure 5 Photograph of the Cold Soak Chamber ready for testing. The chamber is the large silver box shape.
Conversion of a Gasoline Fueled, Buick 3800 engine to E85 operation The gasoline fueled engine was converted for E85 operation. This was accomplished by replacing the original fuel injectors with ethanol compatible injectors of increased size in order to handle the increased flow demands required when operating on E85. Additionally, a the original fixed-fuel pressure regulator was replaced with a variable pressure regulator in order to tune the flowrate of E85. This tuning is accomplished by varying the fuel pressure until a stoichiometric fuel to air ratio is achieved during steady state operation. The original powertrain control module was replaced with a development system (Cosworth 5460). This system allowed us to modify parameters to accommodate the changes required when using high blend ethanol fuels. The fuel enrichment during cold cranking consisted of doubling the fuel flow to provide sufficient enrichment for starting. Further, the engine is operated with enrichment during cold running conditions shortly after the engine begins to fire. To maintain a fair comparison, these values were not changed when operating with E85 alone, or with hydrogen supplementation. This provided a higher level of fuel enrichment during cold-starts and thus poorer emissions than fuel enrichment settings optimized for E85 with hydrogen supplementation. This means that the engine will start without the use of hydrogen; however the cold start emissions are extremely poor. Since it is the goal of this project to the effect of hydrogen injection on cold startability, it was felt that this approach would
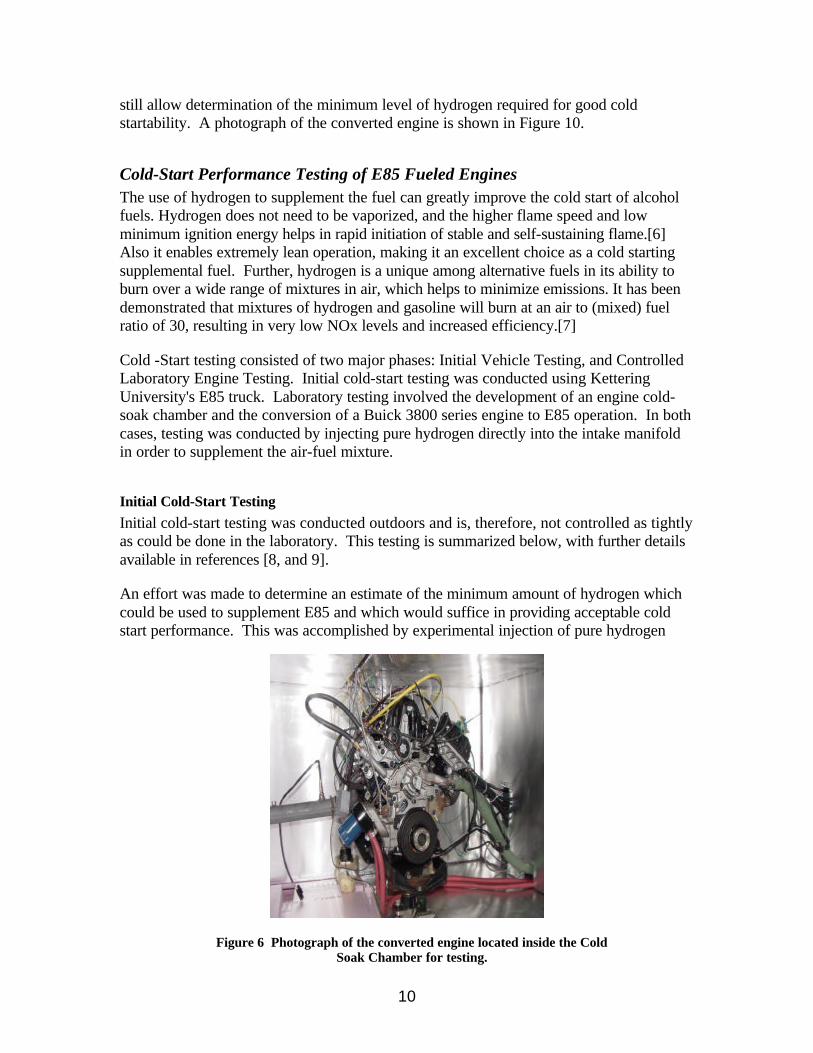
10
still allow determination of the minimum level of hydrogen required for good cold startability. A photograph of the converted engine is shown in Figure 10.
Cold-Start Performance Testing of E85 Fueled Engines The use of hydrogen to supplement the fuel can greatly improve the cold start of alcohol fuels. Hydrogen does not need to be vaporized, and the higher flame speed and low minimum ignition energy helps in rapid initiation of stable and self-sustaining flame.[6] Also it enables extremely lean operation, making it an excellent choice as a cold starting supplemental fuel. Further, hydrogen is a unique among alternative fuels in its ability to burn over a wide range of mixtures in air, which helps to minimize emissions. It has been demonstrated that mixtures of hydrogen and gasoline will burn at an air to (mixed) fuel ratio of 30, resulting in very low NOx levels and increased efficiency.[7]
Cold -Start testing consisted of two major phases: Initial Vehicle Testing, and Controlled Laboratory Engine Testing. Initial cold-start testing was conducted using Kettering University's E85 truck. Laboratory testing involved the development of an engine cold-soak chamber and the conversion of a Buick 3800 series engine to E85 operation. In both cases, testing was conducted by injecting pure hydrogen directly into the intake manifold in order to supplement the air-fuel mixture.
Initial Cold-Start Testing
Initial cold-start testing was conducted outdoors and is, therefore, not controlled as tightly as could be done in the laboratory. This testing is summarized below, with further details available in references [8, and 9].
An effort was made to determine an estimate of the minimum amount of hydrogen which could be used to supplement E85 and which would suffice in providing acceptable cold start performance. This was accomplished by experimental injection of pure hydrogen
Figure 6 Photograph of the converted engine located inside the Cold Soak Chamber for testing.
11
into the intake stream of a dedicated E85 fuelled vehicle. Results from experiments performed on a dedicated E85 fuelled vehicle with hydrogen as supplemental fuel are reported.
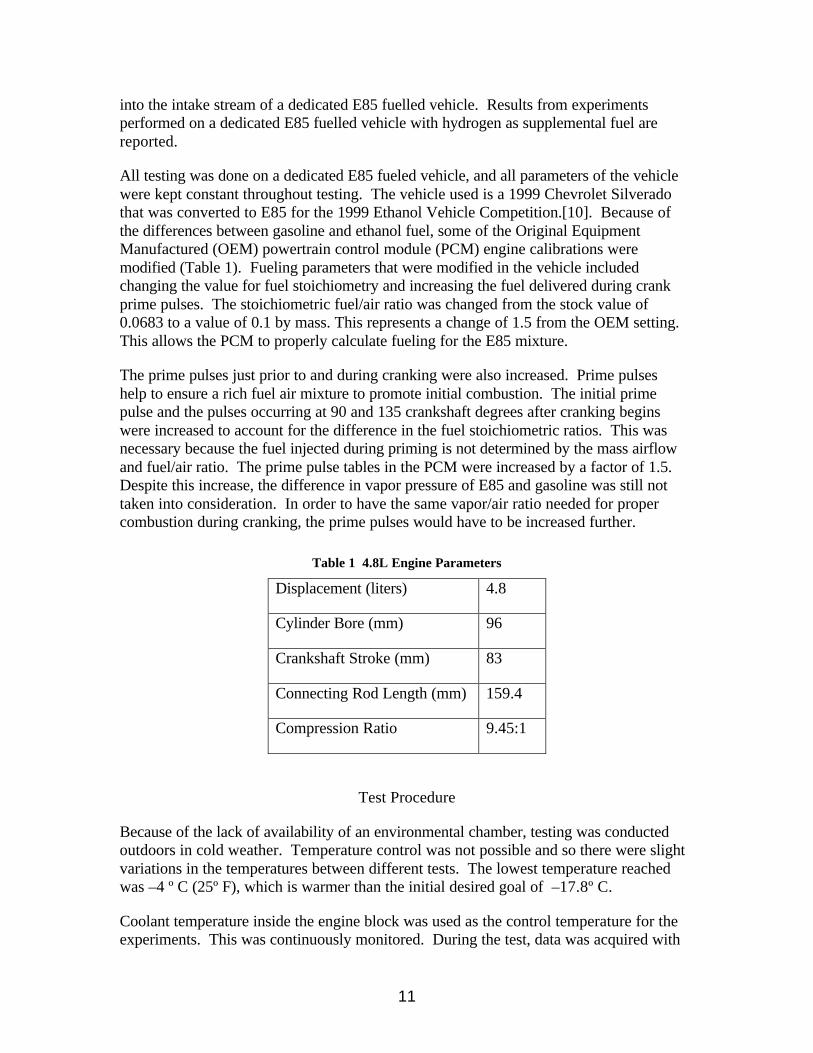
All testing was done on a dedicated E85 fueled vehicle, and all parameters of the vehicle were kept constant throughout testing. The vehicle used is a 1999 Chevrolet Silverado that was converted to E85 for the 1999 Ethanol Vehicle Competition.[10]. Because of the differences between gasoline and ethanol fuel, some of the Original Equipment Manufactured (OEM) powertrain control module (PCM) engine calibrations were modified (Table 1). Fueling parameters that were modified in the vehicle included changing the value for fuel stoichiometry and increasing the fuel delivered during crank prime pulses. The stoichiometric fuel/air ratio was changed from the stock value of 0.0683 to a value of 0.1 by mass. This represents a change of 1.5 from the OEM setting. This allows the PCM to properly calculate fueling for the E85 mixture.
The prime pulses just prior to and during cranking were also increased. Prime pulses help to ensure a rich fuel air mixture to promote initial combustion. The initial prime pulse and the pulses occurring at 90 and 135 crankshaft degrees after cranking begins were increased to account for the difference in the fuel stoichiometric ratios. This was necessary because the fuel injected during priming is not determined by the mass airflow and fuel/air ratio. The prime pulse tables in the PCM were increased by a factor of 1.5. Despite this increase, the difference in vapor pressure of E85 and gasoline was still not taken into consideration. In order to have the same vapor/air ratio needed for proper combustion during cranking, the prime pulses would have to be increased further.
Table 1 4.8L Engine Parameters
Displacement (liters) 4.8
Cylinder Bore (mm) 96
Crankshaft Stroke (mm) 83
Connecting Rod Length (mm) 159.4
Compression Ratio 9.45:1
Test Procedure
Because of the lack of availability of an environmental chamber, testing was conducted outdoors in cold weather. Temperature control was not possible and so there were slight variations in the temperatures between different tests. The lowest temperature reached was –4 º C (25º F), which is warmer than the initial desired goal of –17.8º C.
Coolant temperature inside the engine block was used as the control temperature for the experiments. This was continuously monitored. During the test, data was acquired with
12
the use of General Motors Tech 2 (TECH2) device that communicates and displays values read by the PCM. Snapshots were recorded for each test and were exported to a PC for analysis. For consistency in analyses, additional parameters were measured and recorded. These additional parameters are listed and explained below.
• Crank Start: First time the Engine Speed (RPM) recorded by the TECH2 was more than zero.
• Engine Start: The Engine Speed (RPM) reached 500 rpm and remained above that value.
• Engine Temperature, Air Temperature and Battery Voltage: as read from TECH2.
In order to estimate the effect of hydrogen addition, the time of cranking was recorded with no hydrogen and then for different percentages of hydrogen injection. During testing, hydrogen injection was initiated at the same time as engine cranking. The ignition was held in the start position with the starter turning the motor until the engine was started or was assumed to be started. If the engine stalled, a restart was required.
To eliminate the detrimental effects of changes in battery voltage at cold temperatures, the battery was continuously charged to maintain the same voltage during each test.
Hydrogen Injection System
The hydrogen was injected into the engine intake manifold. This was accomplished by the use of the exhaust gas recirculation (EGR) port and the addition of a tube fitting. This did not change the EGR operation because the EGR valve is normally closed during cold start.
Because hydrogen is highly flammable, helium was used to set the flow control and for purging the system. The desired flow rate for hydrogen was first determined using helium, then the actual level of hydrogen injection was measured during the test. Also, after each run and before shutting down the engine, helium was discharged through the passage to purge any remaining hydrogen. This ensured safe operation during the experiments.
Cold Start Testing Results
During cold start testing the data alone does not yield a complete representation of the test unless it is combined with the driver’s subjective evaluation. The driver is able to determine engine roughness and drivability better than any parameter that can be measured and reported; therefore, the following figure must be viewed along with the subjective evaluation found in the text.
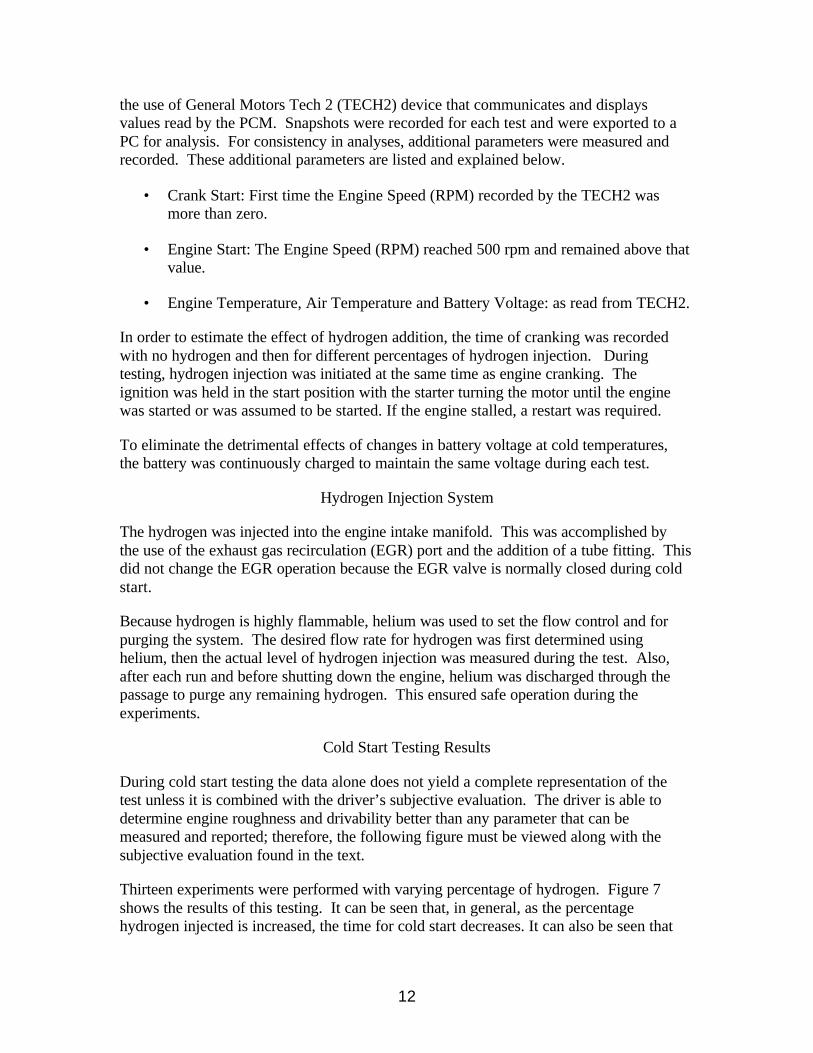
Thirteen experiments were performed with varying percentage of hydrogen. Figure 7 shows the results of this testing. It can be seen that, in general, as the percentage hydrogen injected is increased, the time for cold start decreases. It can also be seen that
13
when the percent hydrogen is high the variability of the data is low, but the opposite is true for when the percent hydrogen is low.
0
5
10
15
20
25
0 2 4 6 8 10 12 14
% Hydrogen
Cra
nk
Tim
e (s
ec)
Figure 7 Effect of Hydrogen Addition on Cold-Start Cranking Times
There are a few possible reasons for the data variations. These include: test inconsistencies, battery voltage, air temp, fuel temperature, and the hydrogen ratio variation with increase in engine speed.
Inconsistencies in the testing schedule such as the engine stalling or not starting immediately can cause the human tester to mistakenly release the key, requiring a re-start. When a re-start occurs during the test, additional fuel prime pulses are added during the start, which results in richer mixtures. Basically, when a re-start is done during a test, the engine has more fuel available to evaporate and combust; thus shortening total cranking time. This re-start, however, is unpleasant to the customer and results in poor hydrocarbon emissions. Subjectively, then, this level of hydrogen injection is unacceptable.
The battery voltage was easily controllable and the battery was fully charged throughout all the experiments so it did not vary significantly.
The air temperature affects the density of the air and thus dictates the mass flow rate. All the calculations were based on volume. A significant difference in air temperature results in a percentage of hydrogen that is not be same on mass basis even if the same volume percentage is chosen.
14
The temperature of the fuel will influence the amount of fuel vapor that will be produced. A higher fuel temperature will produce more fuel vapor and thus will assist the cold start.
The actual percentage of hydrogen seen at the combustion chamber is not constant; it varies with engine speed and flow rate. With an increase in engine speed, the actual percentage of hydrogen decreases. This behavior is very critical when the amount of hydrogen is just enough to initiate combustion. For example, 5% hydrogen (based on 165 RPM) will then go below the lean flammability limit of hydrogen, which is 4% by volume in air [6], when the engine speed increases to about 200 RPM.
It was seen during testing, that when the desired level of hydrogen was set close to the lean limit of 4% hydrogen, the engine came close to starting, but it then immediately stalled or stumbled, forcing the operator to restart. This is due to the drop in hydrogen ratio as the engine speed increases, drawing in more air, while the hydrogen rate was steady.
Based upon all of the data, including subjective evaluation, the minimum level of hydrogen supplementation for cold start improvements is about 8% by volume. This level yielded fast starts with no objectionable engine stalls or stumbles.
Controlled Laboratory Engine Testing
In order to provide a more accurate estimate of the minimum level of hydrogen injection required to provide acceptable cold-starts, laboratory testing was conducted. This testing involved the use of an engine cold-soak environmental chamber that was designed and constructed for this project as described earlier. With this chamber, the engine cold-soak temperature could be accurately maintained down to near -6 °C (21 °F). This allowed us to test the concept at more consistent temperatures than those achieved during the initial testing phases.
The engine used for this study is a Buick 3800 Series II, V-6 engine which is very representative of engines currently in use in passenger automobiles. The engine develops 200 hp at 5200 rpm, with a maximum torque of 225 lb-ft at 4000 rpm. The specifications of this engine are presented in Table 2. The engine intake was modified in order to provide a location for hydrogen injection and to draw combustion air from the chamber. Other changes were made to accommodate testing of high-blend ethanol fuels, and are described earlier in this report.
15
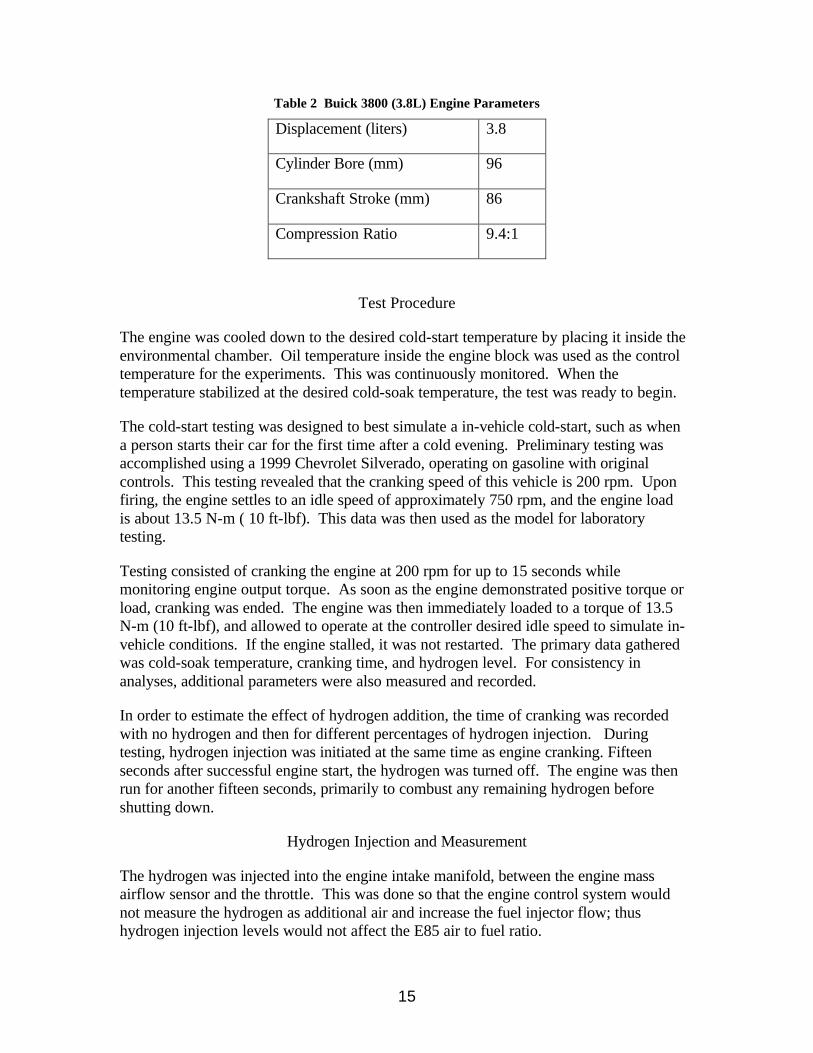
Table 2 Buick 3800 (3.8L) Engine Parameters
Displacement (liters) 3.8
Cylinder Bore (mm) 96
Crankshaft Stroke (mm) 86
Compression Ratio 9.4:1
Test Procedure
The engine was cooled down to the desired cold-start temperature by placing it inside the environmental chamber. Oil temperature inside the engine block was used as the control temperature for the experiments. This was continuously monitored. When the temperature stabilized at the desired cold-soak temperature, the test was ready to begin.
The cold-start testing was designed to best simulate a in-vehicle cold-start, such as when a person starts their car for the first time after a cold evening. Preliminary testing was accomplished using a 1999 Chevrolet Silverado, operating on gasoline with original controls. This testing revealed that the cranking speed of this vehicle is 200 rpm. Upon firing, the engine settles to an idle speed of approximately 750 rpm, and the engine load is about 13.5 N-m ( 10 ft-lbf). This data was then used as the model for laboratory testing.
Testing consisted of cranking the engine at 200 rpm for up to 15 seconds while monitoring engine output torque. As soon as the engine demonstrated positive torque or load, cranking was ended. The engine was then immediately loaded to a torque of 13.5 N-m (10 ft-lbf), and allowed to operate at the controller desired idle speed to simulate in-vehicle conditions. If the engine stalled, it was not restarted. The primary data gathered was cold-soak temperature, cranking time, and hydrogen level. For consistency in analyses, additional parameters were also measured and recorded.
In order to estimate the effect of hydrogen addition, the time of cranking was recorded with no hydrogen and then for different percentages of hydrogen injection. During testing, hydrogen injection was initiated at the same time as engine cranking. Fifteen seconds after successful engine start, the hydrogen was turned off. The engine was then run for another fifteen seconds, primarily to combust any remaining hydrogen before shutting down.
Hydrogen Injection and Measurement
The hydrogen was injected into the engine intake manifold, between the engine mass airflow sensor and the throttle. This was done so that the engine control system would not measure the hydrogen as additional air and increase the fuel injector flow; thus hydrogen injection levels would not affect the E85 air to fuel ratio.

16
Hydrogen concentrations were directly measured using a mass spectrometer tuned to see hydrogen. The sample was drawn directly from the intake after the throttle valve.
The desired level of hydrogen injection was adjusted prior to the actual test by operating the engine at 200 rpm while measuring the level of hydrogen present in the intake. A metering valve was used to regulate the hydrogen injection rate.
Because hydrogen is highly flammable, many precautions were taken. First, the injection of hydrogen was accomplished using a solenoid valve which was only open during engine cranking. Further, when the hydrogen was not needed, the tank valves were manually closed to minimize the risk of leaks. Thus, the hydrogen system was only opened for a maximum of 15 seconds per test. Further, the cold-soak chamber was ventilated immediately following each test for an extended period to ensure no hydrogen buildup within the chamber.
Cold Start Testing Results
The laboratory results served to confirm our initial findings. The effect of hydrogen supplementation on cold cranking time is shown in Figure 8. As shown the effect of hydrogen injection is dramatic, decreasing cold cranking times by up to 80%. Upon looking at the figure, it is apparent that the effect of hydrogen injection becomes less dramatic around a level of 9%. This is close to what was found earlier; therefore the minimum level of hydrogen required to provide acceptable starts is 8%.
0
20
40
60
80
100
120
0 2 4 6 8 10 12 14 16 18
Hydrogen (%)
Co
ld C
ran
kin
g T
ime
(%)
Figure 8 Effect of Hydrogen Supplementation on Cold Cranking Time

17
Develop Preliminary Designs for an On-Board Hydrogen Reformer The focus of this task shifted somewhat as we able to secure the use of a reformer which had originally been designed for other use. The focus of this task then shifted to an evaluation of the suitability of this device for use in our project. This work is summarized below, more details can be found in references.
Background
Since the distribution and storage of hydrogen most likely will remain difficult for the near future, on-board formation of hydrogen or hydrogen rich fuel offers the best short term outlook. Hydrogen can be generated by either adding energy in an endothermic reaction, or by using some of the energy of the fuel in an exothermic reaction. Endothermic reformers include thermal decomposition of the base fuel, steam reformers where steam is injected into the fuel, and exhaust gas reformation where exhaust is added to the fuel. Exothermic reformers decompose the base fuel by partially oxidizing (POX) it in a rich atmosphere. Reference 6 presents an excellent review of endothermic and some POX reformers.
Endothermic reformers have been demonstrated to produce effective lean engine operation resulting in both improved emissions, and fuel economy. One major limitation of endothermic reformers is their inability to perform well during cold starts, requiring some sort of on-board reformate storage system.
A more feasible approach for automotive applications is the use of an exothermic POX reformer. In this type of reactor the fuel is partially combusted to both provide both the energy requirements and the hydrogen rich reformate. This approach results in faster warm-up times, which are suitable for cold start operation without the need to provide on-board storage of reformate. Unfortunately, a portion of the fuel’s energy is consumed during the process, resulting in a lower heating value. This means that this type of reformer is probably best suited for fuel enrichment, not operation on 100% reformate.
Early work in this area resulted in the development of a small POX reformer utilizing a catalyst to lower reaction temperatures.[7] This unit, operating at 650 °C, produced an efficiency of 80% when operating just lean of the soot formation air-fuel ratio. By extending operation of the engine further into the lean range, the energy cost required to generate the reformate was more than offset by the improvements in engine efficiency.
More recent work has demonstrated the development and use of on-board POX reformers.[3, 4,11] The basic design of this under-hood reformer used a standard pulse-width fuel injector to supply fuel and a tangential air intake system to improve combustion stability. Ignition was accomplished through the use of a surface igniter of the type used for residential gas-fired heating systems. A heat exchanger was added to prevent the reformate temperature from exceeding 95 °C, in order to ensure high intake gas density and to prevent damage to the intake manifold. This system was added in parallel to the normal intake system, with reformate induction directly into the intake manifold. The system was sized in order to provide 100% reformate fueling during idle conditions; thus the main fuel system was not activated during the cold start, only the
18
reformer. A similar system was used in reference 11 for operation on methanol with similar improvements in cold start time.
Hydrogen Reformer Design
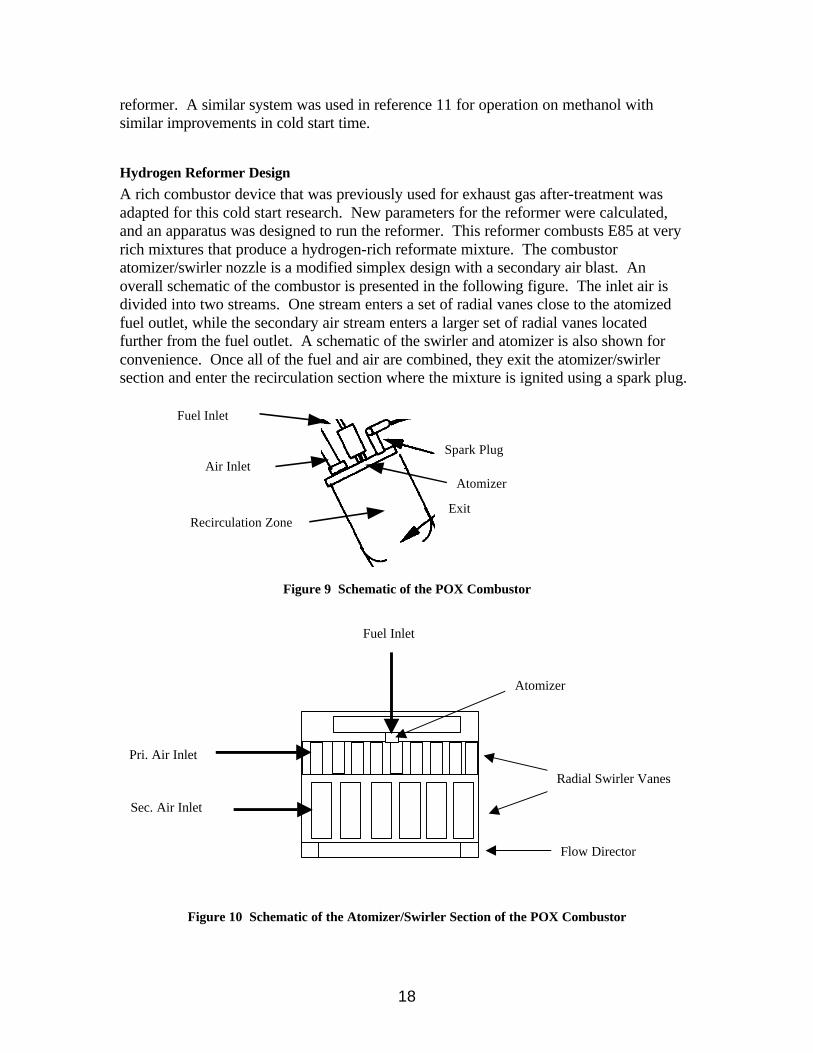
A rich combustor device that was previously used for exhaust gas after-treatment was adapted for this cold start research. New parameters for the reformer were calculated, and an apparatus was designed to run the reformer. This reformer combusts E85 at very rich mixtures that produce a hydrogen-rich reformate mixture. The combustor atomizer/swirler nozzle is a modified simplex design with a secondary air blast. An overall schematic of the combustor is presented in the following figure. The inlet air is divided into two streams. One stream enters a set of radial vanes close to the atomized fuel outlet, while the secondary air stream enters a larger set of radial vanes located further from the fuel outlet. A schematic of the swirler and atomizer is also shown for convenience. Once all of the fuel and air are combined, they exit the atomizer/swirler section and enter the recirculation section where the mixture is ignited using a spark plug.
Fuel Inlet
Air Inlet Spark Plug
Exit Recirculation Zone
Atomizer
Figure 9 Schematic of the POX Combustor
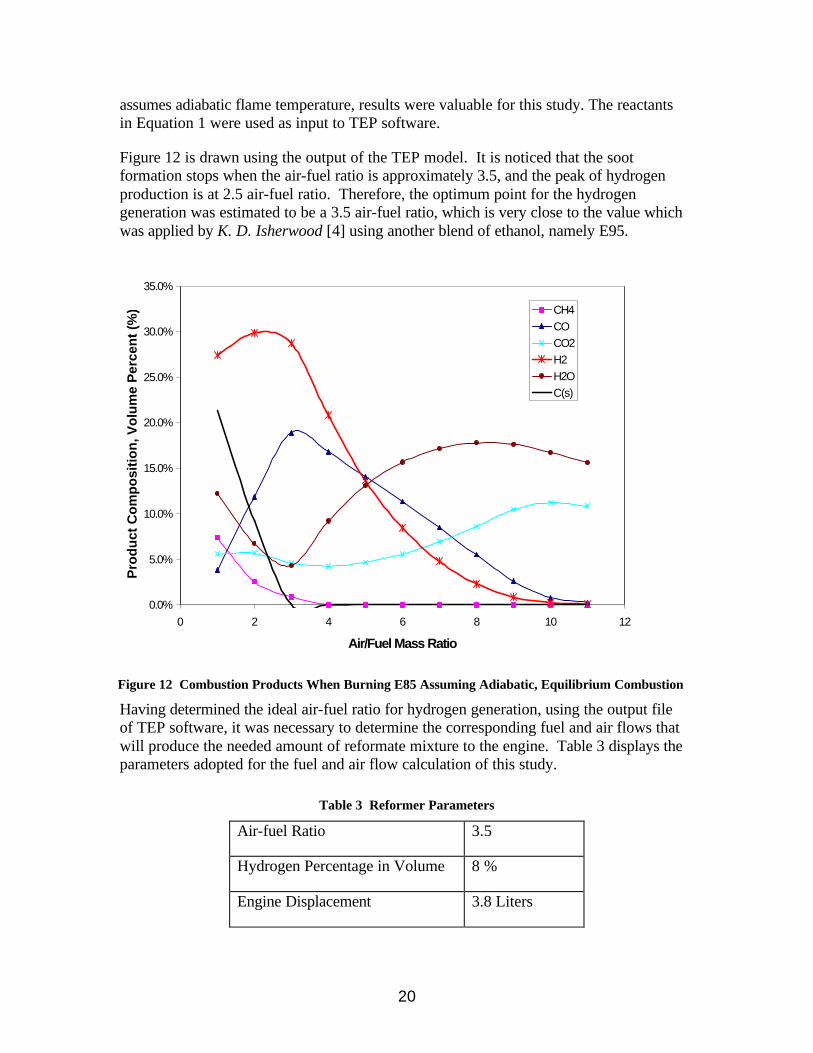
Figure 10 Schematic of the Atomizer/Swirler Section of the POX Combustor
Pri. Air Inlet
Sec. Air Inlet
Fuel Inlet
Atomizer
Radial Swirler Vanes
Flow Director

19
As the mixture leaves the swirler, it is tripped at the swirler outlet by a lip of slightly smaller inner diameter than the swirler itself called the flow director. This, combined with the radial velocity imparted on the mixture by the swirler, forces the mixture to spill out toward the liner walls of the combustor while traveling axially downstream. The outlet of the combustor has a reduced area causing the mixture to recirculate back towards to center of the liner. Several recirculations occur before all the fuel is consumed and the hot gas exits the combustor.
Swirl is very important in combustors of this design, as all combustion air enters the combustor through the swirler. This design requires that the burner aerodynamics be managed from this location. With a single location of air inlet, aerodynamics are controlled from just one point, which is different from gas turbine combustors which have the air added along the combustor liner, allowing the aerodynamics to be managed throughout the entire combustor.
Development of Initial SetUp Parameters
In order to estimate the air-fuel ratio which would produce the desirable amount of hydrogen in the mixture, combustion calculations have been made. The combustion process itself is very complex, since it includes several reactions occurring simultaneously and many parameters to be considered. To aid in the understanding of the partial oxidation process using E85 (Ethanol 85% and Gasoline 15 %), the following reaction equation is presented by assuming that there is no dissociation producing minor species.
C2H5OH + 0.15 C8H18 + a (O2 + 3.76 N2) → b CO2 + c CO + d H2O + e H2 + f O2 3.76 a N2 (1)
Combustion equilibrium software was used to find the ideal air-fuel ratios for the conditions established by this study. Several packages were evaluated; however just one commercial software package showed very good capabilities. The Thermo-chemical Equilibrium Program (TEP) [12] has a good chemical library in which all products and reactants properties were found. Although TEP only models chemical equilibrium and it
Recirculation zone
Liner
Combustor inlet
Figure 11 Combustor Liner or Recirculation Zone
20
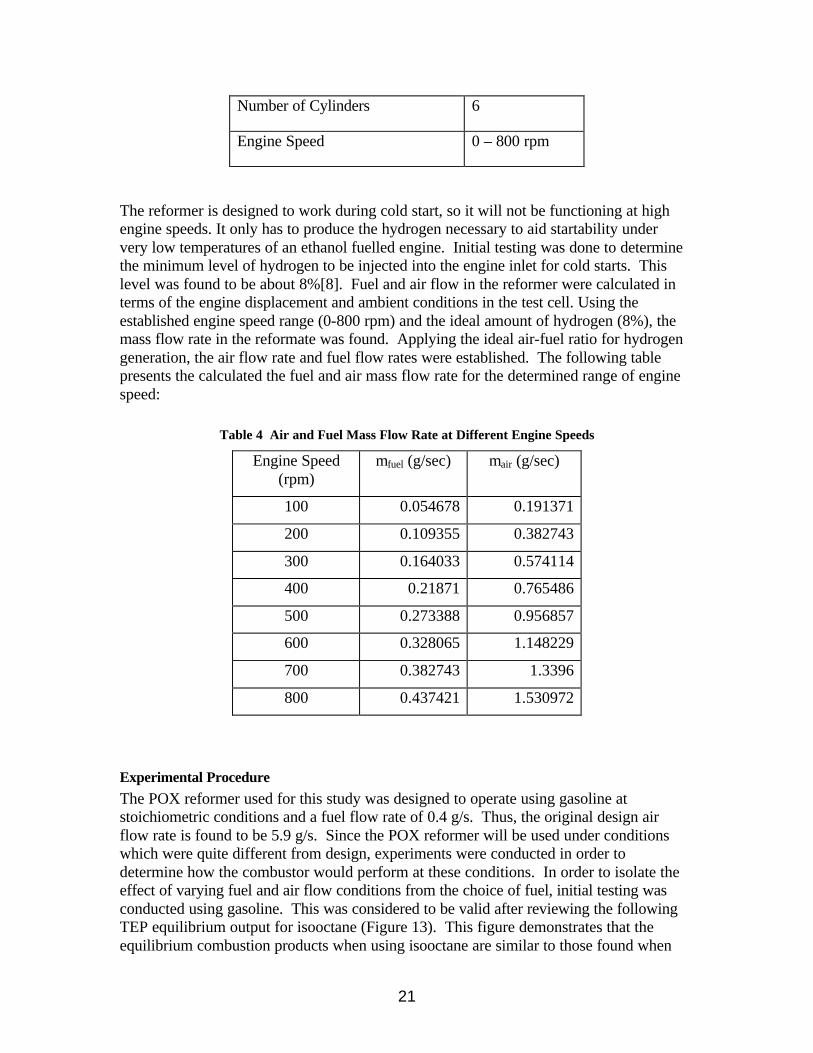
assumes adiabatic flame temperature, results were valuable for this study. The reactants in Equation 1 were used as input to TEP software.
Figure 12 is drawn using the output of the TEP model. It is noticed that the soot formation stops when the air-fuel ratio is approximately 3.5, and the peak of hydrogen production is at 2.5 air-fuel ratio. Therefore, the optimum point for the hydrogen generation was estimated to be a 3.5 air-fuel ratio, which is very close to the value which was applied by K. D. Isherwood [4] using another blend of ethanol, namely E95.
Having determined the ideal air-fuel ratio for hydrogen generation, using the output file of TEP software, it was necessary to determine the corresponding fuel and air flows that will produce the needed amount of reformate mixture to the engine. Table 3 displays the parameters adopted for the fuel and air flow calculation of this study.
Table 3 Reformer Parameters
Air-fuel Ratio 3.5
Hydrogen Percentage in Volume 8 %
Engine Displacement 3.8 Liters
0.0%
5.0%
10.0%
15.0%
20.0%
25.0%
30.0%
35.0%
0 2 4 6 8 10 12
Air/Fuel Mass Ratio
Pro
du
ct C
om
po
siti
on
, Vo
lum
e P
erce
nt
(%) CH4
COCO2H2H2OC(s)
Figure 12 Combustion Products When Burning E85 Assuming Adiabatic, Equilibrium Combustion
21
Number of Cylinders 6
Engine Speed 0 – 800 rpm
The reformer is designed to work during cold start, so it will not be functioning at high engine speeds. It only has to produce the hydrogen necessary to aid startability under very low temperatures of an ethanol fuelled engine. Initial testing was done to determine the minimum level of hydrogen to be injected into the engine inlet for cold starts. This level was found to be about 8%[8]. Fuel and air flow in the reformer were calculated in terms of the engine displacement and ambient conditions in the test cell. Using the established engine speed range (0-800 rpm) and the ideal amount of hydrogen (8%), the mass flow rate in the reformate was found. Applying the ideal air-fuel ratio for hydrogen generation, the air flow rate and fuel flow rates were established. The following table presents the calculated the fuel and air mass flow rate for the determined range of engine speed:
Table 4 Air and Fuel Mass Flow Rate at Different Engine Speeds
Engine Speed (rpm)
mfuel (g/sec) mair (g/sec)
100 0.054678 0.191371
200 0.109355 0.382743
300 0.164033 0.574114
400 0.21871 0.765486
500 0.273388 0.956857
600 0.328065 1.148229
700 0.382743 1.3396
800 0.437421 1.530972
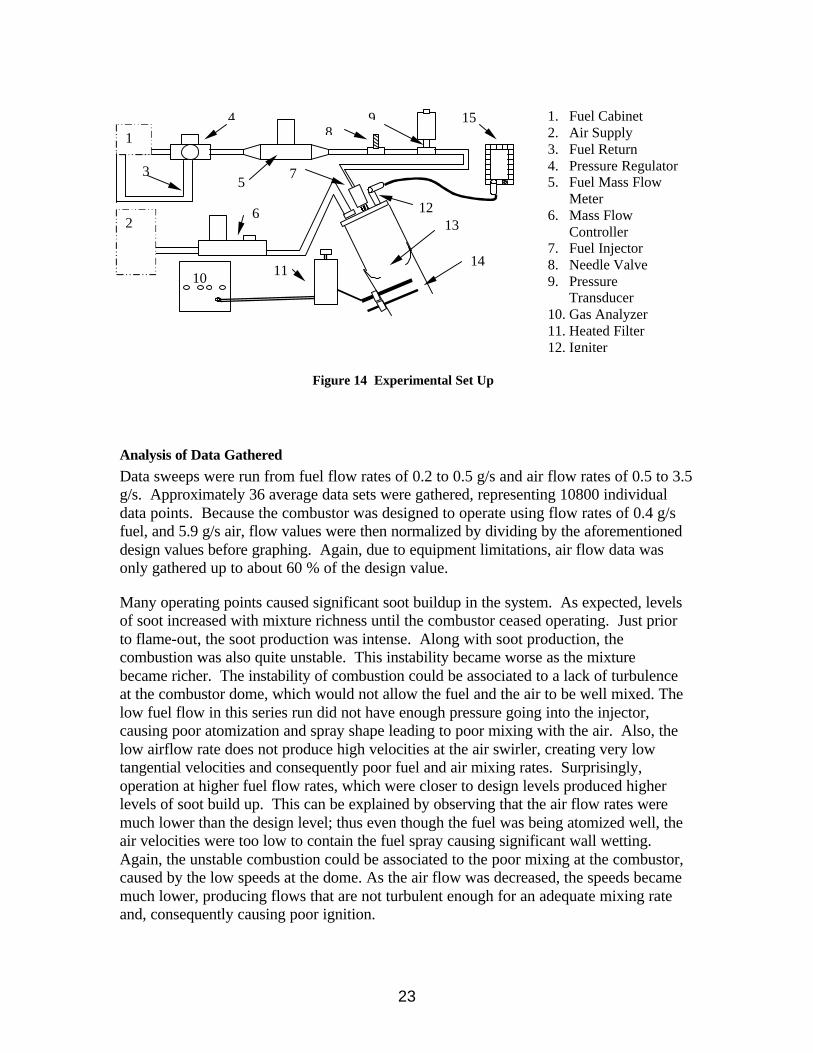
Experimental Procedure
The POX reformer used for this study was designed to operate using gasoline at stoichiometric conditions and a fuel flow rate of 0.4 g/s. Thus, the original design air flow rate is found to be 5.9 g/s. Since the POX reformer will be used under conditions which were quite different from design, experiments were conducted in order to determine how the combustor would perform at these conditions. In order to isolate the effect of varying fuel and air flow conditions from the choice of fuel, initial testing was conducted using gasoline. This was considered to be valid after reviewing the following TEP equilibrium output for isooctane (Figure 13). This figure demonstrates that the equilibrium combustion products when using isooctane are similar to those found when
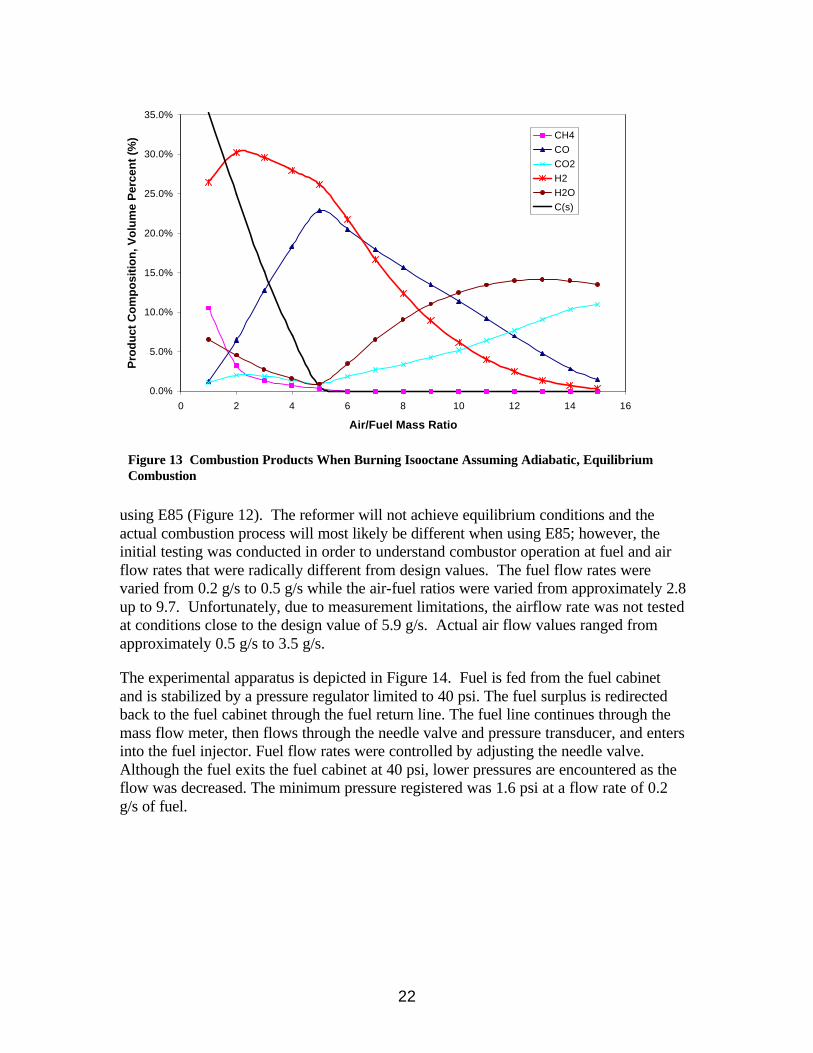
22
using E85 (Figure 12). The reformer will not achieve equilibrium conditions and the actual combustion process will most likely be different when using E85; however, the initial testing was conducted in order to understand combustor operation at fuel and air flow rates that were radically different from design values. The fuel flow rates were varied from 0.2 g/s to 0.5 g/s while the air-fuel ratios were varied from approximately 2.8 up to 9.7. Unfortunately, due to measurement limitations, the airflow rate was not tested at conditions close to the design value of 5.9 g/s. Actual air flow values ranged from approximately 0.5 g/s to 3.5 g/s.
The experimental apparatus is depicted in Figure 14. Fuel is fed from the fuel cabinet and is stabilized by a pressure regulator limited to 40 psi. The fuel surplus is redirected back to the fuel cabinet through the fuel return line. The fuel line continues through the mass flow meter, then flows through the needle valve and pressure transducer, and enters into the fuel injector. Fuel flow rates were controlled by adjusting the needle valve. Although the fuel exits the fuel cabinet at 40 psi, lower pressures are encountered as the flow was decreased. The minimum pressure registered was 1.6 psi at a flow rate of 0.2 g/s of fuel.
0.0%
5.0%
10.0%
15.0%
20.0%
25.0%
30.0%
35.0%
0 2 4 6 8 10 12 14 16
Air/Fuel Mass Ratio
Pro
du
ct C
om
po
siti
on
, Vo
lum
e P
erce
nt
(%) CH4
CO
CO2
H2
H2O
C(s)
Figure 13 Combustion Products When Burning Isooctane Assuming Adiabatic, Equilibrium Combustion
23
Analysis of Data Gathered
Data sweeps were run from fuel flow rates of 0.2 to 0.5 g/s and air flow rates of 0.5 to 3.5 g/s. Approximately 36 average data sets were gathered, representing 10800 individual data points. Because the combustor was designed to operate using flow rates of 0.4 g/s fuel, and 5.9 g/s air, flow values were then normalized by dividing by the aforementioned design values before graphing. Again, due to equipment limitations, air flow data was only gathered up to about 60 % of the design value.
Many operating points caused significant soot buildup in the system. As expected, levels of soot increased with mixture richness until the combustor ceased operating. Just prior to flame-out, the soot production was intense. Along with soot production, the combustion was also quite unstable. This instability became worse as the mixture became richer. The instability of combustion could be associated to a lack of turbulence at the combustor dome, which would not allow the fuel and the air to be well mixed. The low fuel flow in this series run did not have enough pressure going into the injector, causing poor atomization and spray shape leading to poor mixing with the air. Also, the low airflow rate does not produce high velocities at the air swirler, creating very low tangential velocities and consequently poor fuel and air mixing rates. Surprisingly, operation at higher fuel flow rates, which were closer to design levels produced higher levels of soot build up. This can be explained by observing that the air flow rates were much lower than the design level; thus even though the fuel was being atomized well, the air velocities were too low to contain the fuel spray causing significant wall wetting. Again, the unstable combustion could be associated to the poor mixing at the combustor, caused by the low speeds at the dome. As the air flow was decreased, the speeds became much lower, producing flows that are not turbulent enough for an adequate mixing rate and, consequently causing poor ignition.
4 9
3
10
5
8
6
7
15
11
12 13
1
2
14
1. Fuel Cabinet 2. Air Supply 3. Fuel Return 4. Pressure Regulator 5. Fuel Mass Flow
Meter 6. Mass Flow
Controller 7. Fuel Injector 8. Needle Valve 9. Pressure
Transducer 10. Gas Analyzer 11. Heated Filter 12. Igniter
Figure 14 Experimental Set Up
24
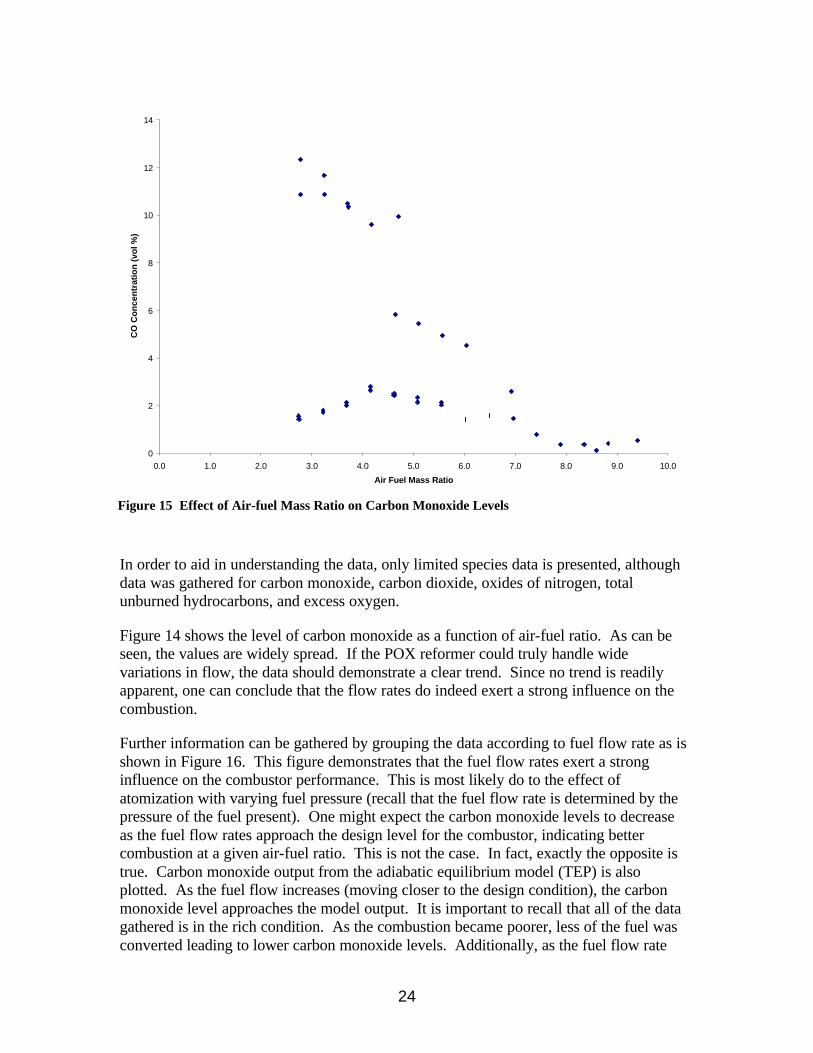
In order to aid in understanding the data, only limited species data is presented, although data was gathered for carbon monoxide, carbon dioxide, oxides of nitrogen, total unburned hydrocarbons, and excess oxygen.
Figure 14 shows the level of carbon monoxide as a function of air-fuel ratio. As can be seen, the values are widely spread. If the POX reformer could truly handle wide variations in flow, the data should demonstrate a clear trend. Since no trend is readily apparent, one can conclude that the flow rates do indeed exert a strong influence on the combustion.
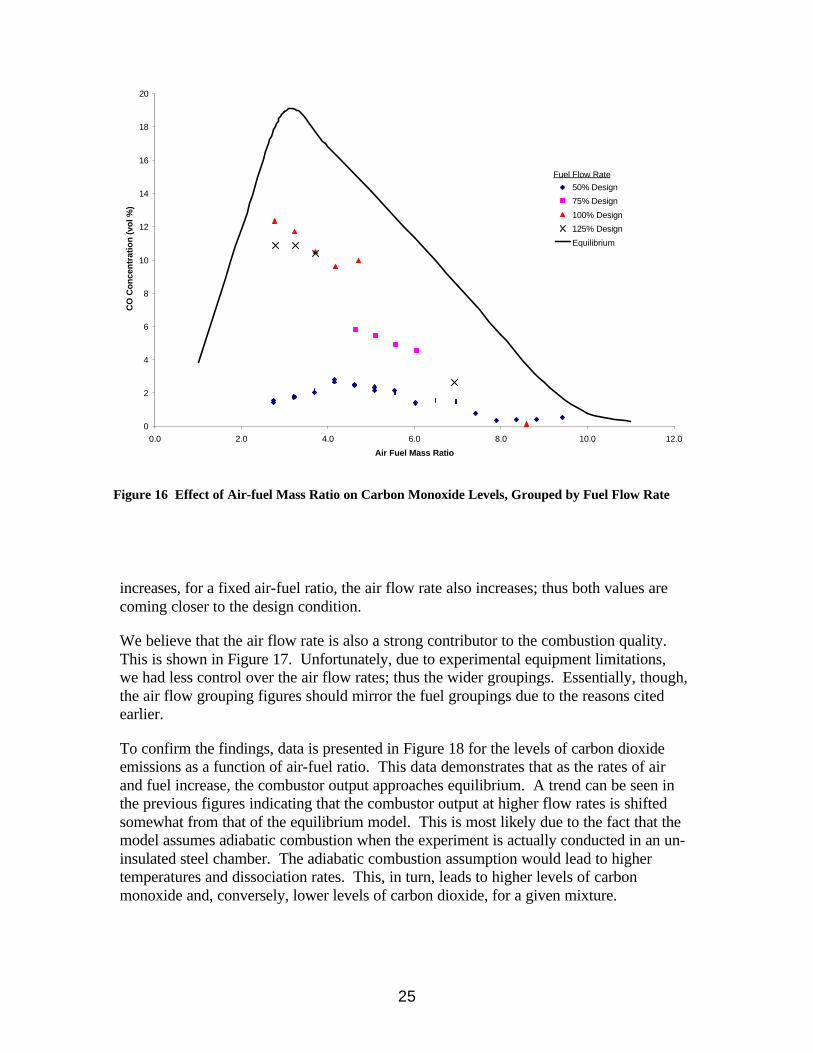
Further information can be gathered by grouping the data according to fuel flow rate as is shown in Figure 16. This figure demonstrates that the fuel flow rates exert a strong influence on the combustor performance. This is most likely do to the effect of atomization with varying fuel pressure (recall that the fuel flow rate is determined by the pressure of the fuel present). One might expect the carbon monoxide levels to decrease as the fuel flow rates approach the design level for the combustor, indicating better combustion at a given air-fuel ratio. This is not the case. In fact, exactly the opposite is true. Carbon monoxide output from the adiabatic equilibrium model (TEP) is also plotted. As the fuel flow increases (moving closer to the design condition), the carbon monoxide level approaches the model output. It is important to recall that all of the data gathered is in the rich condition. As the combustion became poorer, less of the fuel was converted leading to lower carbon monoxide levels. Additionally, as the fuel flow rate
0
2
4
6
8
10
12
14
0.0 1.0 2.0 3.0 4.0 5.0 6.0 7.0 8.0 9.0 10.0
Air Fuel Mass Ratio
CO
Co
nce
ntr
atio
n (
vol %
)
Figure 15 Effect of Air-fuel Mass Ratio on Carbon Monoxide Levels
25
increases, for a fixed air-fuel ratio, the air flow rate also increases; thus both values are coming closer to the design condition.
We believe that the air flow rate is also a strong contributor to the combustion quality. This is shown in Figure 17. Unfortunately, due to experimental equipment limitations, we had less control over the air flow rates; thus the wider groupings. Essentially, though, the air flow grouping figures should mirror the fuel groupings due to the reasons cited earlier.
To confirm the findings, data is presented in Figure 18 for the levels of carbon dioxide emissions as a function of air-fuel ratio. This data demonstrates that as the rates of air and fuel increase, the combustor output approaches equilibrium. A trend can be seen in the previous figures indicating that the combustor output at higher flow rates is shifted somewhat from that of the equilibrium model. This is most likely due to the fact that the model assumes adiabatic combustion when the experiment is actually conducted in an un-insulated steel chamber. The adiabatic combustion assumption would lead to higher temperatures and dissociation rates. This, in turn, leads to higher levels of carbon monoxide and, conversely, lower levels of carbon dioxide, for a given mixture.
0
2
4
6
8
10
12
14
16
18
20
0.0 2.0 4.0 6.0 8.0 10.0 12.0
Air Fuel Mass Ratio
CO
Co
nce
ntr
atio
n (
vol %
)
50% Design
75% Design
100% Design
125% Design
Equilibrium
Fuel Flow Rate
Figure 16 Effect of Air-fuel Mass Ratio on Carbon Monoxide Levels, Grouped by Fuel Flow Rate

26
0
2
4
6
8
10
12
14
16
18
20
0.0 2.0 4.0 6.0 8.0 10.0 12.0
Air Fuel Mass Ratio
CO
Co
nce
ntr
atio
n (
vol %
)
0.09 < Air Flow < 0.215
0.22 < Air Flow < 0.34
0.34 < Air Flow < 0.59
Equilibrium
Normalized Air Flow
Figure 17 Effect of Air-fuel Mass Ratio on Carbon Dioxide Levels, Grouped by Fuel Flow Rate
Figure 18 Effect of Air-fuel Mass Ratio on Carbon Monoxide Levels, Grouped by Air Flow Rate
0
2
4
6
8
10
12
14
16
0.0 2.0 4.0 6.0 8.0 10.0 12.0
Air Fuel Mass Ratio
CO
2 C
on
cen
trat
ion
(vo
l %)
50% Design
75% Design
100% Design
125% Design
Equilibrium
Fuel Flow Rate
27
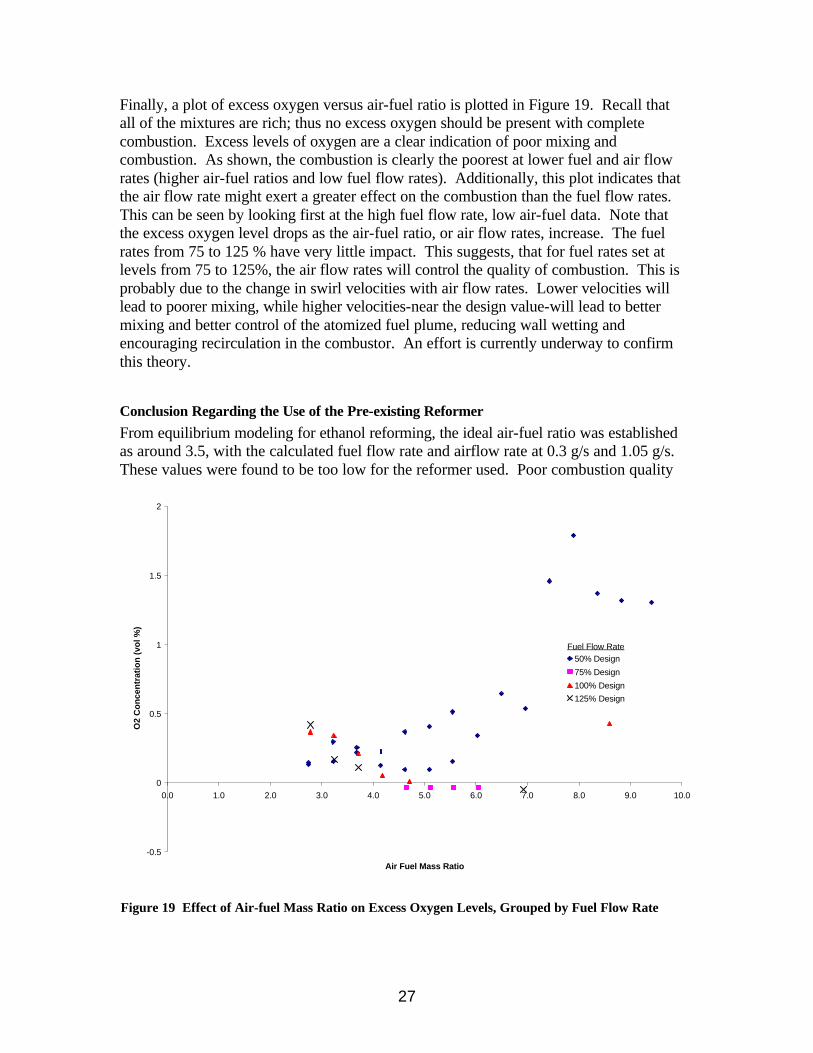
Finally, a plot of excess oxygen versus air-fuel ratio is plotted in Figure 19. Recall that all of the mixtures are rich; thus no excess oxygen should be present with complete combustion. Excess levels of oxygen are a clear indication of poor mixing and combustion. As shown, the combustion is clearly the poorest at lower fuel and air flow rates (higher air-fuel ratios and low fuel flow rates). Additionally, this plot indicates that the air flow rate might exert a greater effect on the combustion than the fuel flow rates. This can be seen by looking first at the high fuel flow rate, low air-fuel data. Note that the excess oxygen level drops as the air-fuel ratio, or air flow rates, increase. The fuel rates from 75 to 125 % have very little impact. This suggests, that for fuel rates set at levels from 75 to 125%, the air flow rates will control the quality of combustion. This is probably due to the change in swirl velocities with air flow rates. Lower velocities will lead to poorer mixing, while higher velocities-near the design value-will lead to better mixing and better control of the atomized fuel plume, reducing wall wetting and encouraging recirculation in the combustor. An effort is currently underway to confirm this theory.
Conclusion Regarding the Use of the Pre-existing Reformer
From equilibrium modeling for ethanol reforming, the ideal air-fuel ratio was established as around 3.5, with the calculated fuel flow rate and airflow rate at 0.3 g/s and 1.05 g/s. These values were found to be too low for the reformer used. Poor combustion quality
-0.5
0
0.5
1
1.5
2
0.0 1.0 2.0 3.0 4.0 5.0 6.0 7.0 8.0 9.0 10.0
Air Fuel Mass Ratio
O2
Co
nce
ntr
atio
n (
vol %
)
50% Design
75% Design
100% Design
125% Design
Fuel Flow Rate
Figure 19 Effect of Air-fuel Mass Ratio on Excess Oxygen Levels, Grouped by Fuel Flow Rate
28
and excessive soot build up occurs in this region. A fuel flow rate of 0.3 g/s or 75% of the design value was found to be acceptable. However, the associated air flow rate, which is only about 19% of design, was found to be much too low to support reliable combustion. The most likely reason for this is due to the lower swirl velocities which would lead to lower mixing and a loss of control over the mixture plume This will lead to wall wetting and poor recirculation in the combustor. Further work is underway to increase secondary air velocities by reducing the flow area in the secondary air inlet vanes of the swirler assembly. It is hoped that a compromise condition of higher than 3.5 air-fuel ratio combined with a reduced flow area will result in acceptable performance with this reformer. Additionally, the combustor or recirculation zone may also have to be shortened to encourage recirculation at lower flow rates. This device, with some modifications should prove to be an acceptable POX reformer for use in aiding cold-starts when using E85.
Development of Model used to Evaluate Experimental Data An algorithm has been developed that allows the user to take data that can easily measured in a typical automotive emissions laboratory to calculate a more complete species composition of POX reformer exhaust. This method was developed to estimate the hydrogen from a rich combustion device, but it can also be applied to an internal combustion engine that is under normal running conditions. This system has allowed us to find and fix errors in the experimental apparatus. This work is summarized below, greater detail can be found in Reference 13.
Model Input Parameters
The data that is used for input into the model was taken using Kettering University’s engine test cell. These parameters are typical of these that are measured in an automotive emissions laboratory. Table 5 lists the data that was taken from the combustor operation and is input into the algorithm.
Table 5 Model Input Parameters
Parameter Symbol Units
Mass Flow Rate of Fuel Wf gm/sec
Volume Flow Rate of Wet Air
Qwa L/min
Absolute Humidity Ratio
ωabs gm/kg
Concentration of CO2 ConcCO2 %
29
Concentration of CO ConcCO %
Concentration of O2 ConcO2 %
Concentration of NOx ConcNOx ppm
Concentration of THC ConcTHC ppm
Concentration of CH4 ConcCH4 ppm
Exhaust Temp Texh K
Flow rates of dry air and fuel are measured as they are used by the combustor. The concentrations of the individual species are taken from a Horiba MEXA-7100 emissions bench. Depending on the analyzer, the sample is either measured wet or dry. Measuring wet means that the sample remains hot by means of heaters to leave the water in vapor form in the exhaust sample. Depending on the species and method of testing the species, allowing the water to condense out of the sample would change the concentrations of the species reported from the instrument. The two species that are measured wet are the Total Hydrocarbons (THC) and Methane (CH4). The other species are measured dry. Using a sample cooler that is set to 5 °C the sample chills fast enough that the water condenses out.
The last input parameter is the temperature of the exhaust. This is measured using a 1/16” radiation-shielded exposed-junction thermocouple. This type of thermocouple is the most accurate way to measure temperature from exhaust gas.
Using the aforementioned input data, the model can then be used to estimate the level of hydrogen that has been produced. The governing reaction assumed in the model is:
2 2 2 2
2 2 2 2 2
4
( * * * * )
* * * * * *
* * *p p p
x y z abs
x x y z
C H O n O A N B CO C H O
a CO b CO c H d H O e O f N
g NO h C H O i CH
ω+ + + + →
+ + + + + +
+ + (2)
In order to determine the number of moles of hydrogen in the exhaust products, we will assume that the dominant dissociation reaction is the water-gas shift reaction. The water gas shift is a chemical reaction that is common during the combustion of a hydrocarbon fuel with air. It is assumed that at the high temperatures and pressure in the exhaust cylinder during the combustion of a rich mixture or air and fuel the CO2 and H2O in the mixture dissociate, creating some H2 and some CO. This is described by the following chemical equation for the water/gas reaction.
30
2 2 2CO H CO H O+ → + (3)
The water gas shift equation
This algorithm was then used in an equilibrium calculation that allows the user to take data that can easily measured in a typical automotive emissions laboratory to calculate a more complete species composition of POX reformer exhaust. This method was developed to estimate the hydrogen from a rich combustion device, but it can also be applied to an internal combustion engine that is under normal running conditions. This model as been verified against published data. An effort is now underway to gather experimental data – including a direct measurement of the hydrogen level using a narrow band mass spectrometer. This data will be used to further develop the model for rich combustion.
Impact of the Project
This project clearly demonstrates the potential for using hydrogen supplementation to assist cold starts when using E85 fuel. The minimum level of hydrogen which provided acceptable cold starts was found to be approximately 8%. Since hydrogen is difficult to store, it needs to be produced as needed to be a practical solution to the problem. This project demonstrated the design and use of a partial oxidation reformer, operating using E85, that could be used to generate hydrogen on demand. The use of hydrogen, generated using a partial oxidation reformer, will provide an acceptable solution to the cold start problem encountered when using E85 fuel. Further, the cold start emissions when using such a system can be greatly minimized. Ongoing research will allow us to quantitatively predict the reduction in emissions that can be achieved when using such a system.
Dissemination of this work is an ongoing process. I have been actively seeking to work with industry on this project, and have made presentation to one of the major automotive makers and one supplier. Additionally, all of this work has been published and presented as shown below:
• Davis, G. W., Singh, S., Heil, E. T., “Hydrogen Supplemented E85 For Cold Start Improvement,” Proceedings of the 2000 Global Powertrain Congress, Detroit MI, 2000.
• Davis, G. W., Heil, E. T., Rust, R., “Ethanol Vehicle Cold Start Improvement
When Using A Hydrogen Supplemented E85 Fuel,” Proceedings paper No. AIAA-2000-2849, 35th Intersociety Energy Conversion Engineering Conference, 2000
• Heil, E. T., Davis, G. W., Wu, J., "Determination Of The Concentration Of Hydrogen Produced Using A Cold Start Partial Oxidation Hydrogen Reformer For An E85 Fueled Engine," Proceedings of IECEC ‘01 36th Intersociety Energy
31
Conversion Engineering Conference, Savannah, Georgia, IECEC2001-ES-38, 2001
Further, additional works have been submitted for publication:
• Davis, G. W., “Using On-Board Hydrogen Reformation of E85 Fuel to Improve Cold-Start Performance of an Engine,” Abstract Submitted to the 2002 Global Powertrain Congress, September 24-26, 2002
• Davis, G. W., “Optimizing Hydrogen Production using a Partial Oxidation Reformer Operating with E 85 Fuel,” Abstract for Submission to the 39th Intersociety Energy Conversion Engineering Conference, July 28-August 1, 2002, Washington, D. C., 2002

32
References
1. K. H. Weil, “The hydrogen IC Engine – Its Origins and Future in the Emerging Energy – Transportation – Environment Systems,” SAE Paper 729212, 1972. 2. “JPL Final Report on EPA – Supported Studies Related to Ultralean Combustion in Spark Combustion Engine with Hydrogen Addition,” Rough Draft, Jet Propulsion Laboratory, Pasadena, California, November 1974. 3. Grieve, M. J., et al, “Integration of a Small Onboard Reformer to a Conventional Gasoline Internal Combustion Engine System to Enable a Practical and Robust Nearly-Zero Emission Vehicle,” 1999 Global Powertrain Congress, Stuttgart, GE, 1999. 4. Isherwood, K. D., et al, “Using On-board Fuel Reforming by Partial Oxidation to Improve SI Engine Cold-Start Performance and Emissions,” SAE 980939, 1998. 5. “Partial Oxidation for Improved Cold Starts in Alcohol-Fueled Engines: Phase II Topical Report,” National Renewable Energy Laboratory, Subcontract Number YCC-5-14050-01, April 1998. 6 Jamal, Y., et. al., “On-Board Generation of Hydrogen-Rich Gaseous Fuels – A Review”. Int. J. Hydrogen Energy. Vol 19, No. 7. 7 Houseman, J., et. al., “On-Board Hydrogen Generator for a Partial Hydrogen Injection Internal Combustion Engine”, SAE-740600, 1974. 8 Davis, G. W., Singh, S., Heil, E. T., “Hydrogen Supplemented E85 For Cold Start Improvement,” Proceedings of the 2000 Global Powertrain Congress, Detroit MI, 2000. 9 Davis, G. W., Heil, E. T., Rust, R., “Ethanol Vehicle Cold Start Improvement When Using A Hydrogen Supplemented E85 Fuel,” Proceedings paper No. AIAA-2000-2849, 35th Intersociety Energy Conversion Engineering Conference, 2000. 10 Davis, G. W., et. al., “The Development and Performance of a High Blend Ethanol Fueled Vehicle”. FCC – 00FCC-100. 11 Hodgson, J. W., et al, “Improving the Cold Start Performance of Alcohol Fueled Engines Using a Rich Combustor Device,” SAE 981359, 1998. 12 “Thermo-Chemical Equilibrium Program,” SEA Software Inc., 1999. 13 Heil, E. T., Davis, G. W., Wu, J., "Determination Of The Concentration Of Hydrogen Produced Using A Cold Start Partial Oxidation Hydrogen Reformer For An E85 Fueled Engine," Proceedings of IECEC ‘01 36th Intersociety Energy Conversion Engineering Conference, Savannah, Georgia, IECEC2001-ES-38, 2001.

Appendix