final report team d peristaltic pump · final report team d peristaltic pump me 340.4 chris garneau...
TRANSCRIPT

Final Report Team D Peristaltic Pump
ME 340.4
Chris Garneau Kevin McNamara
Jae Chung
May 3, 2006 Problem Statement
An insufficient supply of potable water is a grave problem for many nations around the world. Some regions lack access to drinking water due to dry conditions created by hot, sunny weather and low annual precipitation. Other nations have an ample supply of water, but cannot afford filtration systems that produce clean drinking water. An affordable, practical, and efficient way of filtering water is greatly needed.
The challenge for this project is to design and manufacture a sub‐scale pump prototype to be used in a water filtration system. The system must pump a minimum of one gallon of water per minute, and it must provide sufficient delivery pressure to push the water through the system. The system must be manufactured at minimal cost, and so the prototype will be made with specified, limited resources. Since abundant sunshine is available in regions of the world where this system will be in use, the system will be powered with batteries charged by a solar‐cell system, provided by a partner company.
Project Plan
Planning for the design and construction of the pump consumed a considerable amount of development time. Considering that time to develop a working pump to meet the requirements was very limited, this project plan emphasized general development activities and allowed for flexibility. It established a tentative schedule, determined the design process steps, assigned tasks and responsibilities, evaluated resources, and estimated a risk plan. See Appendix A for the project schedule in the form of a Gantt Chart, created once the team organized and prioritized various aspects of the project.
The first stage of the design process was identifying customer needs. Most of the needs were given in the form of design constraints, however some research was also completed in order to understand the mission and scope of the project. Target product specifications were then determined from the customer needs. From these specifications and needs a needs‐metrics matrix was created. See Appendix B.
The next stage in the process was generating product concepts. This phase consumed a considerable amount of time. It began by clarifying the problem, and then
1

performing an external search for ideas. The team explored patents and available pump products that might be of use in designing the pump. The team then searched internally by brainstorming product concepts. After searching for ideas, the team systematically explored those ideas by evaluating them with respect to project needs.
After evaluating potential ideas, a concept was selected on which to focus. The selection was narrowed down to three main types of pumps: peristaltic, piston, and centrifugal (see Appendix L for reference). Factors such as economic feasibility, theoretical performance, and suitability for the intended purpose of pumping potable water were considered. The findings from this stage are presented in the ‘Design Concepts’ section of this document.
The next stage in the pump development process was establishing the specifications and geometry of the pump to create a prototype. The pump was then constructed, and the final specification and performance determined. Details of this may be found in the ‘System Design’ section of the report.
Besides very limited time to complete this project and build the pump, there were also very limited physical resources. There was a five‐dollar limit for the motor(s) for the pump and an additional five‐dollar restriction for all other materials not available on campus. This limitation restricted the construction to primarily machined parts. Four cubic inches of model material (ABS plastic) was also allotted that could have been used to create a rapid‐prototyped part.
Every member of the team was devoted to successful completion of the project. The team believed that the success or failure of the project fell on each and every member, not upon one alone. In this spirit, the team divided tasks and responsibilities as equitably as possible throughout the entire project, while keeping in mind that every member had specific strengths that they may contribute. The team divided the production of various components among team members to produce the pump most efficiently, but built and tested the pump together.
The team anticipated that various things might have gone wrong in the design and/or construction of our pump. The team took actions to minimize the risk of unsuccessful completion of the project. First and foremost, the team selected a design that is theoretically simple and relatively easy to machine, in the hopes of avoiding long lines at the machine shop. However, this was still a major limiting factor in construction, so the team visited the machine shop during off‐hours and also divided the fabrication tasks among members to facilitate quick construction time. Running over budget was also a concern, so the team fabricated as many parts as possible, reserving purchased components only for when making them or using recycled parts was unfeasible (as with bearings). The team was also unsure how frictional effects would impact the design, so the team paid close attention to friction points. See the ‘System Design’ and ‘Discussion of Results’ sections for details regarding how friction impacted the design.
2

Concept Generation
The first task of concept generation was problem decomposition. A black‐box model was created to visualize the problem decomposition, as in Figure 1.
Figure 1: Black‐box Model
Before the team could start generating ideas for the pump, an extensive external search was performed to determine what ideas were already on the market. There were several patents that gave the team insight into the development of different types of pumps. See Appendix C. The team also researched pumps that are currently being sold at McMaster Carr and Cole‐Parmer. See Appendix D for some of these pumps.
After this external search, the team chose to pursue a positive displacement‐type pump. Foremost among the advantages of this type of pump is significantly easier design, resulting in a (theoretically) better approximation of final performance. Positive displacement pumps are also self‐priming (able to draw in water without external intervention), whereas dynamic pumps are not.
The first type of positive displacement pump considered was a linear‐piston design, as shown in Figure 2. This is the simplest type of positive‐displacement pump in which a fixed amount of water is drawn in and expelled during each cycle. The team did not pursue this design further due to the extensive machining that would have been required to make it work. Friction and tolerancing would have been significant hurdles in the design. Sharp corners along with sudden expansions would have had to be eliminated as well. The team was also concerned about the need for a tight seal between the piston and cylinder, which could leak if too loose or create too much friction if too tight. Also of concern was the need to purchase two check valves to ensure proper flow.
Figure 2: Linear Piston Concept
3

The second type of positive displacement pump considered was a peristaltic design, as shown in Figure 3. This type of pump works by moving two or more rollers around a bent piece of flexible tubing to push fluid through. The vacuum created in the wake of the roller acts to draw in more fluid to allow the cycle to continue. This type of pump is self‐sealing and requires no valves to operate.
Figure 3: Peristaltic Concept
The third type of pump considered was the centrifugal pump, to provide a reference point for comparison. The positive and negative aspects of centrifugal pump design and performance were explored so that the team could be sure that it was choosing the best type of pump.
The team elected to pursue the peristaltic design due to its simplicity and the advantages mentioned above. Also, since the fluid does not contact any portion of the pump except for the inside of the flexible tubing, this type of pump is very well suited for the sanitary pumping of water. The tube may also be easily replaced as it wears or becomes dirty.
Concept Selection
The team used screening and scoring matrices to choose a concept. The AHP (Analytic Hierarchy Process) methodology was used to determine weighting factors. The results appear in Appendix E. System Design
System design consisted of finding an optimal design using an analytical model, determining theoretical performance, selecting materials, and developing the prototype through CAD drawings of components and assemblies. Once the prototype was constructed, actual flow rate was determined, and the final performance curves adjusted accordingly. Consideration of Design for Manufacture/Assembly as well as ethical and environmental concerns followed.
4

System design began by assessing all of the physical variables of the peristaltic pump configuration, namely case diameter (D), tubing diameter (d), tubing length (L), gear ratio (R), friction in the gears, friction at the axle, friction where the rollers connect to the arms, and rolling friction between the roller and tubing. Dependent variables were then considered, which include flow rate (Q), rotational speed (N), power (P), and motor current (I). Some of the physical variables were eliminated from the possible design space (thus set at a fixed value) because they were deemed insignificant or too hard to change. These include tubing length (limited by pump design and requirements), friction coefficients, and roller diameter. Rolling friction and friction in the gears were estimated to be negligible and were not considered in the design. Strictly speaking, number of motors is another variable, however all analyses will assume use of a single motor, with modifications to this assumption later.
To establish an analytical model using these parameters, it is necessary to consider the relation among the various parameters. System design is guided by determining the system operating point (or set of points), established by equating available power provided by the motor to power required by the system. Supplied motor power is a function of rotational speed and gear ratio* only, since the manufacturer’s curves specify the properties of the motor. Required system power depends on the energy lost to friction as well as the system head. Energy lost to friction is a function of case diameter and rotational speed. System head is a function of tubing length, case diameter, tubing diameter, and rotational speed. Flow rate, the ultimate measure of performance, is a result of the rotational speed set by the operating point as well as case diameter and tubing diameter. These relations are summarized in Eq. 1.a – 1.c for clarity.
),,(
),,,(
),(sup
NdDQQ
NdDLPPPP
NRPP
systemfrictionrequired
plied
=
=+=
=
).1().1().1(
cba
The next step in developing the design space is to restrict the values of the varying parameters by assuming a reasonable range of values, guided by considering cost, available parts and material, size, and performance. The range of values considered are: D = {3, 4, 5, 6} in., d = {0.25, 0.3125, 0.375} in., R = {5, 10, 20, 30, 40, 50}, N = {0 : 350} rpm. L is fixed at 6.25 ft (input + output).
Equations derived from fluid mechanics determine the flow rate and required system head, and equations from classical mechanics determine friction effects. Additional relations determine motor characteristics. See Appendix F for explanation of the equations used in this analysis and how to use them to tabulate results. The result of graphing the dependent variables against the full range of values listed above is shown in Appendix G. Figures G.1 – G.3 show estimated flow rate curves and Figures G.4 – G.6 show theoretical power requirement curves, along with motor power curves. The points of intersection of required power curves with motor curves in Figures G.4 – G.6 are the
* The interface between motor and pump is taken to be after the gear reduction. Therefore, gears are considered to be an integral part of the motor, and this is why different motor curves are created for different gear ratios. This simplifies the graphs.
5

operating points of the pump. Motor current is plotted in Figures G.7 – G.12. Note that these are theoretical predictions. As noted later, actual performance differs considerably.
Inspecting the graphs in Appendix G gives valuable insight into system behavior. Flow rate is strong function of both d and D, so these properties should be maximized within reason. Required power is a strong function of friction, but not head, so friction effects should be minimized as much as possible. Additionally, power is a stronger function of D than d, so increasing D to increase performance will take a higher toll on power required than increasing d. Finally, from a power equivalency standpoint, the system can operate at several gear ratios, with lower ratios simply requiring more current.
The team chose a single configuration to build and test. Case diameter was set at 5 in, a reasonable compromise between size and performance. Gear ratio R was set at 40:1, so as to provide ample power over the desired operating range. Tubing diameter d was set at 0.375”. The resulting theoretical behavior is plotted below in Figures 4 and 5.
Figure 4:
D=5 in.Pump Requirements (Req'd System Head + Friction)
0
1
2
3
4
5
6
0 50 100 150 200 250 300 350
Rotation Speed (rpm)
Pow
er (W
) System Requirements(Uncorrected)
Motor (40:1): Nominal V
Figure 5:
Flow Rate at D=5 in.
0
0.5
1
1.5
2
2.5
3
3.5
0 50 100 150 200 250 300 350
Rotation Speed (rpm)
Flow
Rat
e (g
pm)
d=0.375 in.
From Figure 4, the operating point should be around N = 250 rpm. From Figure 5
with N = 250 rpm, a theoretical flow rate of about 1.9 gpm is predicted.
6

The next step in designing the pump was to construct a physical model of the pump, specifying both the appearance and structure of components as well as materials used. Appendix H contains all CAD models of the system. A summary of required materials and components, along with projected cost, appears in Appendix I.
The pump’s casing was constructed with layered aluminum sheet cut to specification on the water jet cutter and welded together (see Figure H.1). Originally, the team’s design called for the pump casing to be made from rapid prototyped ABS plastic (see Figure H.2). However, upon visiting the Learning Factory, the TA’s there advised the team not to rapid prototype the casing due to lengthy build time. This would have caused significant build delays, possibly up to two weeks, so the plan was modified to use aluminum casing instead, which could be cut to sufficiently accurate dimensions on the water jet cutter.
Note that accurate welding of the pieces is extremely important, so that the arm rotates without contacting the case at any point. Any misalignment at the axis will cause significant deviations at the rollers. The team had to re‐drill and re‐center the holes in the side pieces several times to achieve correct alignment.
A hose connector is required to join the 0.375” ID latex tubing to the 0.25” ID outlet tubing. This proved to be a difficult component to find, as local hardware stores and most online merchants carry only hose splices for equal‐diameter tubing. Therefore, this part was rapid prototyped using ABS plastic. The accompanying CAD file is found in Figure H.3. Leakage was a problem, so this connection had to be glued together.
The arms were machined from aluminum using the water jet cutter (see Figure H.4). They were made as small and lightweight as possible while still providing necessary rigidity. The rollers (Figure H.5) were also machined out of aluminum, using a lathe. The roller diameter is 1 in.
Friction was a concern from the beginning, and so steps were taken to minimize its effects in the design. Friction was reduced between each arm and roller by using a bearing. JB Weld was used to attach a 5/16 in. rod to each arm, and the bearing then attached in the middle of this rod. The roller was machined to have interference fit with the bearing, and pressed on to the bearing in the center of the rod. A #8 threaded post was inserted through the middle of each arm. A nylon spacer separated the arms in the middle. See Figure H.6 for a CAD representation of the arm assembly.
Friction was reduced between the thread post and the casing by using a nylon spacer through which the rod passed on each side of the arm, spinning within another nylon spacer glued to the aluminum case. Nylon washers separate the spacer from the nut, which securely hold the assembly in place in the middle of the casing with a small amount of play. See Figure H.7 for the CAD of the casing and arm assembly or Figure 7 below for a close‐up photo of the assembly.
The casing was then mounted to a piece of wood with cable ties. The motors were glued (using JB Weld) to the aluminum casing using screw‐type hose clamps. A worm (N=1) was attached to each motor that meshed with a threaded spur gear (N=40) mounted to the threaded rod with nuts to achieve a gear reduction of 40:1. The motors were then wired, in parallel, with a switch and batteries. See Figures 6 and 7.
Dimensioned drawings for all machined components appear in Appendix J.
7

Figure 6: Pump Photograph
Figure 7: Pump Photograph
Figure 8: Pump Photograph (Close‐up)
8

Upon building and testing the pump, the team realized that the effects of friction, particularly in the worm gears, were grossly underestimated. Additionally, two motors were used in the actual construction instead of the one used in the design. The only way to account for these factors was by measurement of performance, and subsequent introduction of an empirical correction factor. The following describes the process of determining the scaling factors and revising the performance curves.
When provided with design voltage (4.5 V), the measured flow rate was 1.07 gpm. According to Figure 5, this corresponds to a rotational speed of about 150 rpm (assumed to be fairly accurate due to its simple calculation). Referencing Figure G.11, the current drawn by one motor at 40:1 reduction with 150 rpm is around 3 amps. During testing, a current of 4 amps was observed, indicating that in practice, wiring two motors in parallel does not simply mean that current (and torque) is doubled. Since torque is linearly correlated with current for DC motors, scaling torque by a factor equal to the observed ratio of two‐motor to one‐motor current should provide an accurate estimation of actual torque produced by the motors. The same ratio may then be used to scale total brake horsepower by an equal amount (since P = T*N). This ratio is I2‐motors/I1‐motor = 4/3.
Since the operating point occurs around 150 rpm, not the predicted 250 rpm, the system curve must also be scaled. This is done by trial and error using Excel until the system curve intersects the corrected motor power curve at 150 rpm, as in Figure 9 for the corrected system requirements curve. The scaling factor for system requirements turns out to be around 5. Figure 9, which plots corrected motor and system curves, together with Figure 5 that predicts flow rate, represent final specification of system performance.
Figure 9: Corrected Power Curves
D=5 in.Pump Requirements (Req'd System Head + Friction)
0123456789
1011
0 50 100 150 200 250 300 350
Rotation Speed (rpm)
Pow
er (W
)
Theoretical SystemRequirements
System Requirements(Corrected)
2 Motors (40:1): 5.4 V
2 Motors (40:1): 4.5 V
2 Motors (40:1): 3.6 V
As a final note, Figures 9 and 5 indicate that reducing voltage to 3.6 volts, as done in off‐design testing, yields a flow rate around 0.75 gpm, which is close to the measured flow rate of 0.56 gpm. The discrepancy is due to the fact that the input (latex) hose was kinked for several seconds during this testing.
9

Design for Manufacturing (DFM) is an engineering concept where, in order to maximize the profit margin, manufacturing cost of a product is minimized without sacrificing product quality. To facilitate cost reductions, manufacturing costs as well as the costs of assembly and supporting production were estimated for our product. For the final prototype, the case, wheel arms, and rollers were made from aluminum. Overall, the pump is fairly heavy because of all the aluminum parts, but there is also sufficient stability and rigidity. Also, because these aluminum parts were machined manually, they exactly matched (they were ‘customized’ for) our needs dimensionally. However, because of additional machining as well as the welding used to put the case together, the manufacturing cost was increased. Future analysis would focus on making the case both lighter and simpler to manufacture, reducing cost.
Design for Assembly (DFA) is similar to DFM, but assembly cost and complexity is considered. The assembly cost could be reduced significantly if the pump were to be mass‐produced. Welding and other machining required to manufacture the parts could be performed by machines or at least put on an assembly line, and the assembly cost would be reduced in the long run. Additionally, aspects of the design itself should be improved to make assembly faster and easier. Sharp corners in the case should be reduced to avoid injury, and a better, faster method of inserting the pump head into the case would have to be developed. Once these improvements would be made, it is likely that up to 95% of the pump could be produced automatically and with repeatability.
Ethics and environmental concerns always need to be of utmost importance for the design of all products. However, these concerns are even greater when the product is a pump designed to bring safe drinking water to underdeveloped areas of the world.
The peristaltic pump design has been described in great detail in this report. One of the most unique features of this pump’s design is that the water never leaves the tube while being pumped. The inlet end of the tube can be placed directly in the water and the outlet end of the tube attached directly to the filter. Because the water never touches anything but the tube, this type of pump is generally known for being used in situations where sanitation or isolation is very important. In fact, peristaltic pumps are typically used in the medical, pharmaceutical, food, and beverage industries. The cleanliness of the peristaltic pump makes it well‐suited for the delivery of water for people to drink.
Another important aspect of the peristaltic pump is that the tube, which is so important to the cleanliness of the pump, can be completely replaced. With most pumps, if the pump were used inappropriately or if after time it became too contaminated to use, there is no way to replace the contaminated part of the pump. With the peristaltic pump the tube can be replaced for a very low price, and is easy enough to install that no professionals would be needed to help the people who are using the pump.
The peristaltic pump has great ethical implications for pumping clean water for people, however there is one environmental concern that needs to be addressed. The current design of the peristaltic pump has a very rudimentary manual lubrication system. This current method means that lubrication could be damaging to the environment and to the people in the area, since it is applied by hand and could potentially be spread due to centripetal force generated by the spinning gears. Although this is a current environmental concern it can be easily fixed with more time for
10

development. A possible improvement would be to install an automatic dispenser and housing for the gears, so there is no way the lubrication could be spread.
The primary mission of Industrial Design is to design the aspects of a product that relate to the user: namely aesthetics and ergonomics. Aesthetics are important for consumers because they differentiate the product visually. Visually attractive products naturally have a greater appeal to consumers. Aesthetics were not of extreme importance in the design and construction of this pump. A box for the switch was made to enhance appearance and painting the wooden base and aluminum case was also considered. However, there was no suitable color and type of paint available, so the plan to paint the pump was cancelled.
There are numerous types of ergonomic needs. As for ease of use, this pump is as easy to operate as it can get. With one hose to suck in water from the reservoir, and another outlet hose, using the pump is as simple as putting the two hoses into respective containers and flipping the switch. The user interactions required are minimal during operation, only requiring flipping the switch on and off. Maintenance turned out to be troublesome. Due to the nature of the pump’s operational mechanism, a lot of lubrication was required at the gears. While pumping water, the unit would slow down unless further lubrication was applied at the gears. Further analysis would focus on improving ease of maintenance.
Economic Analysis
See Appendix K for analysis of cost and economics.
The peristaltic pump is designed to help people in developing countries who do not have access to clean water. More than 1 billion people worldwide lack access to clean water. Because of contact with unclean water, approximately 25,000 deaths occur each day. To put this in perspective, in all of the United States of America only 5,500 people die each day from all causes (old‐age, disease, violence, sanitation). This pump was made as inexpensively as possible, while still trying to create a pump that is durable and easy to use.
This pump was designed and manufactured by three experienced mechanical engineers, whose salary is $60,000 per year. Taking into account a five day work week and an eight hour work day these engineers earned $28.85 each. This means that for every hour spent working on this pump it costs $86.55 to pay for all three of these engineers time.
The total cost of the pump at 100,000 units per year, with material, time, manufacturing, and marketing taken into account, is $17.94 per pump. The price should be as low as possible, but some profit needs to be generated if the pumps can continue to be produced. With this in mind we sent a gross margin of 25%. This gross margin is less than most industries, but this margin will result in enough profit to continue producing this pump for at least an addition five years. At this gross margin the selling price of the pump is $23.92.
This price may not appear to be very low, because most families in developing countries that need this pump would not be able to afford it on their own. However, upon closer inspection and analysis this price is more than reasonable. This pump is
11

designed to pump and filter one gallon of water per minute. Also, because it will be using solar power, there are no restrictions on how often the pump can be used. With these figures it is not unreasonable to assume that 50 people could use a single pump to filter their water. Even if there was only one pump in an entire village of over 100 people this pump would be able to handle the load, pumping 60 gallons of clean water every hour if necessary.
The direct cost of the prototype is $41.85, as calculated on the bill of materials in Appendix I. Externally purchased components appear in Table I.1 and components available or manufactured on campus appear in Table I.2. Costs for materials in I.2 are estimated.
Results
As mentioned previously, at design point the flow rate was measured to be 1.07 gallons per minute (gpm) during testing. At the off‐design point the predicted flow rate was 1.4 gpm and the actual flow rate was 0.56 gpm, resulting in a 152% margin of error between the analytical predication and measured performance. This was due simply to the fact that the team believed it had to use the theoretical predictions and not the corrected curves appearing in Figure 9. Had Figure 9 been used to predict a flow rate of 0.75 gpm, the off‐design margin of error would have been only about 34%. See ‘System Design’ for a more thorough comparison of analytical and experimental results. Discussion of Results
Overall, the prototype worked very well, achieving the highest flow rate in the class during testing. However, there were some problems experienced during manufacturing. The design had to be continually modified to deal with problems and ensure adequate performance, as noted throughout this report. These include having to redesign the entire case to use aluminum instead of plastic, re‐center the holes in the case due to a misaligned weld, remedy a leaking hose connection, and continually grease the gears to counteract higher‐than‐expected friction effects. The tube not being attached to the casing also caused problems during operation.
Most of the discrepancy between theoretical and predicted performance lies in the huge amount of friction in the worm‐gear mesh, which was grossly underestimated at the start. The assumption of negligible friction in gears was clearly wrong. Excessive friction in the gears had a couple consequences. The first was that it made the pump a lot slower. The pump was not getting close to a competitive flow rate with the high friction in the gears, so an improvement was necessary. The improvement that made the most sense was to apply some form of lubricant to the gears to reduce the amount of friction. The first lubrication the team tried was WD‐40. However, this type of lubrication only helped reduce friction for one or two revolutions of the gear, because the lubrication was just too thin. The next type of lubrication used was a much thicker lubrication and reduced the amount of friction in the gears dramatically and lasted for several revolutions before it needed to be reapplied. The excessive friction also impacted performance prediction, and so a “friction factor” had to be introduced to account for this unexpected effect, as outlined in ‘System Design’.
12

The steadiness, or rather the unsteadiness, of the tube running through the peristaltic pump also proved to be a problem. The rotating arm in the peristaltic pump caused the tube to move and shift, and there was also nothing supporting the tube at the top of the pump when the arm was not at the peak point of its rotation. See Figure 10 for an illustration. This problem was easily corrected by adding a wood support for the tube, as visible in Figures 6 and 7. This wood support was connected to the wood base and supported the tube in the pump and limited the amount of shifting.
Figure 10: Tubing Attachment Problem Illustration
Adjustments made to fix the few problems experienced would not have a
significant impact on manufacturability. For initial adjustments to be made, some parts had to be pre‐assembled, and final adjustments required assembly of the entire unit. These aspects would increase the time and cost of manufacturing. However, even with the adjustments, approximately 95% of the pump can be completely manufactured automatically and with repeatability.
Lastly, the final cost was increased because of these adjustments and because of extra materials. The wood needed to create the support for the tube does not add much cost. However, the lubrication system for the gears will increase the final cost of the pump considerably, mainly because the lubrication would have to be refilled, and so a reasonable amount would need to be shipped with the unit.
Conclusion and Recommendations
We learned a lot from this project. First and foremost, we got some experience with the design process in general. Design is a very important aspect of engineering and there are very few opportunities for students to learn about and experience the formal design process. We also learned a lot about technical reports. Preparing this final report and all of the prerequisite reports gave us a glimpse into what kind of detail will be necessary for reports we write in the future, as professional engineers. Another thing we learned from this project was the application of knowledge we have acquired through our mechanical engineering course work. Fluid mechanics was a very useful course, and taught us a lot, but projects like this one allow for students to truly begin to understand and grasp the concepts that were taught in class. We also learned a great deal about the process that goes on in order to create rapid prototyped parts. Rapid prototyping was something that no one in our group had any experience with, and allowed us to learn something completely new. Lastly, this project gave us the opportunity to learn more about working as a team to complete a project. This is not the first or only class to
13

promote the idea of team projects, but any experience we can get working in teams will help us in the future.
The only improvements we can suggest would be to encourage more groups to take advantage of the resources that can be found in The Learning Factory. The rapid prototyping was a great aspect of this project and our group took that aspect a step further, by also using the water‐jet and other tools in The Learning Factory. Besides making our pump more professional looking, and much more true to the original design, we also learned about an amazing process that we otherwise would never have been exposed to. We think all of the groups should have been encouraged more to pursue this option. The timeline and expectations/specifications for the project were a serious issue with this assignment, however. In the future, we might suggest moving the start of the project back a couple weeks to allow more time for both machining and report writing. Also, clearly defining all of the expectations at the beginning of the project would be a great help.
References
Machine Design. Robert L. Norton. 3rd Edition. Prentice Hall. Chapters 11 and 12.
Design of Machinery, An Introduction to the Synthesis and Analysis of Mechanisms and Machines. Robert L. Norton. 3rd Edition. McGraw Hill. Chapter 9.
Fluid Mechanics: Fundamentals and Applications. Yunus A. Cengal and John M. Cimbala. McGraw Hill. Chapters 8 and 14.
Product Design and Development. Karl T. Ulrich and Steven D. Eppinger. 3rd Edition. McGraw Hill. Chapters 3‐7,10‐12, and 14.
http://en.wikipedia.org/wiki/Peristaltic_pump
http://www.ethoswater.com/index.cfm?objectid=6406649E‐F1F6‐6035‐B59D53E360F38354
http://www.mcmaster.com/
http://www.colepalmer.com/
14

Appendix A: Gantt Chart
0
0
0
0
1
0
0
1
0
0
1
6
8
6
8
8
12
12
10
14
7
5
0
1
20
19
8
1
2/14 2/24 3/6 3/16 3/26 4/5 4/15 4/25 5/5 5/15
0.1 Begin Project
1.1 Search literature for any regulatory requirements
1.2 Generate concept requirements
1.3 Find products currently on the market
1.4 Create a list of customer needs
1.5 Revise Problem Statement based on needs
2.1 Functionally decompose the project
2.2 External Search (patents/current products)
2.3 Generate concepts
2.4 Select promising concept(s)
3.1 Analyses of concepts / Proposal & Motor Selection
3.2 Perform simulations
3.3 Material selection/availability
3.4 Component selection/availability
3.5 CAD Drawings (Checked with INSIGHT)
3.6 System Design Report
4.1 Purchase materials and off the shelf components
4.2 Machine/manufacture components
4.3 Assemble Prototype
5.1 Develop testing protocol
5.2 Perform tests
5.3 Competition
6.1 Preparation of first progress report
6.2 Preparation of project proposal
6.3 Preparation of second progress report
6.4 Preparation of final report
6.5 Preparation of final presentation (Poster)
7.0 End Project

Appendix B: Needs‐metrics Matrix
Metric
1) Pressure attained
2) Current and Voltage N
ecessary
3) Total cost
4) Total M
ass
5) Tim
e requ
ired to activate/de
activ
ate
6) Pum
ps at least 1 gallon pe
r minute
7) Total time requ
ired to set‐up
8) W
ater con
tamination test
9) Total time before fa
ilure
10) B
ending strength
Need
1) Is self priming •
2) Runs using supplied batteries (solar power) •
3) Is affordable for impoverished countries •
4) Can be transported easily •
5) Can easily be turned on/off •
6) Pumps water at adequate rate •
7) Can be set‐up easily •
8) Keeps water clean •
9) Lasts a long time •
10) Is durable •

Appendix C: External Search Results (Patents)
US 7,001,153 B2
PERISTALTIC INJECTOR PUMP LEAK MONITOR
William M. McDowell, Garden Grove, Calif. (US); and John T. Nguyen, San Dimas, Calif. (US)
Assigned to Blue‐White Industries, Huntington Beach, Calif. (US)
Filed on Jun. 30, 2003, as Appl. No. 10/610,364.
Prior Publication US 2004/0265154 A1, Dec. 30, 2004
Int. Cl. F04B 53/04 (2006.01); F04B 43/12 (2006.01)
U.S. Cl. 417—63 18 Claims
1. A peristaltic pump having a pump leak monitor, comprising: a pump housing defining an interior volume, said interior volume having a bottom end portion configured for capturing and containing a fluid; a flexible tube disposed within said interior volume of said housing; a plurality of rollers mounted on a rotatable carrier for carrying said rollers in a substantially circular path, said rollers being positioned for engagement with said tube; a pair of electrical contacts disposed a long said bottom end portion of said interior volume and positioned for immersion in the fluid; a measurement device electrically coupled to said pair of electrical contacts and adapted for measuring a conductivity of the fluid; and a processor for comparing the measured conductivity of the fluid with a stored range of conductivity.

US 6,901,911 B2
PUMP AND HYDRAULIC SYSTEM WITH LOW PRESSURE PRIMING AND OVER PRESSURIZATION AVOIDANCE FEATURES
Michael D. Anderson, East Peoria, Ill. (US); Dennis H. Gibson, Chillicothe, Ill. (US); Michael E. Pickell, Metamora, Ill. (US); Jerry A. Wear, East Peoria, Ill. (US); and
Matthew D. Friede, Fort Wayne, Ind. (US)
Assigned to Caterpillar Inc, Peoria, Ill. (US)
Filed on Jul. 31, 2002, as Appl. No. 10/212,136.
Prior Publication US 2004/0020463 A1, Feb. 05, 2004
Int. Cl.7F02M 37/04
U.S. Cl. 123—446 18 Claims
1. A liquid pump comprising: a pump body having disposed therein an outlet area, at least
one pumping chamber and an inlet area; a check valve separating the outlet area from the at least one pumping chamber; at least one pump piston moveably positioned in said pump body; and an electro‐hydraulic controller attached to said pump body and being moveable between a first position at which said pump piston displaces fluid in a large proportion to said outlet area relative to said inlet area, and a second position at which said pump piston displaces fluid in a small proportion to said outlet area relative to said inlet area, and including a mechanical biaser operable to bias said electro‐hydraulic controller toward said first position, and including a biasing hydraulic surface oriented in opposition to said mechanical biaser for hydraulic biasing toward said second position, and including a control hydraulic surface oriented in opposition to said biasing hydraulic surface; said control hydraulic surface is exposed to fluid pressure in a control volume fluidly connected to said outlet area; said biasing hydraulic surface is exposed to fluid pressure in a biasing volume fluidly connected to said outlet area; and said control volume and said biasing volume are fluidly connected to said outlet area via a pressure reduction valve that is located downstream from the check valve.

US 6,953,321 B2
CENTRIFUGAL PUMP WITH CONFIGURED VOLUTE
Aleksander S. Roudnev, De Forest, Wis. (US); Ronald J. Bourgeois, Sun Prairie, Wis. (US); and Ricardo Augusto Abarca Melo, Santiago (Chile)
Assigned to Weir Slurry Group, Inc., Madison, Wis. (US)
Filed on Dec. 31, 2002, as Appl. No. 10/335,584.
Prior Publication US 2004/0126228 A1, Jul. 01, 2004
Int. Cl.7F04D 7/04
U.S. Cl. 415—197 19 Claims
1. A centrifugal pump of the volute type comprising a pump casing with a suction side and a drive side, a circular portion extending between a cutwater region and a throat region, a discharge nozzle extending tangentially from the circular portion, and an impeller positioned within the pump casing and a drive shaft axially connected to the impeller for rotating the impeller within the pump casing about an axis, the pump casing having a contoured volute region formed along the outer periphery of the circular portion of the pump casing extending from the cutwater region to the throat region of the pump casing, the contour of the volute region, in axial cross section, being such that in a section of the circular portion extending from beyond said cutwater to said throat region the drive side of the casing is formed with two radii of curvature separated by a convex portion, the suction side of the casing is formed with a single radius of curvature and said outer periphery of said pump casing extending between said drive side and said suction side is curved relative to said axis and the curvature of said curved outer periphery changes about the arc of the circular portion extending from said cutwater region to said throat region.

Appendix D: Pump Examples
Flexible Impeller pump from McMaster Carr:
Gear pump from McMaster Carr:
Jet Pump from McMaster Carr:
Peristaltic Pump from Cole‐Parmer:
Centrifugal Pump from Cole‐Parmer:

Appendix E: Concept Screening and Selection
Explanation of Criteria
1. Minimum 1 gpm – Will the pump deliver at least one gallon of water per minute?
2. Low friction – How much friction is there in the pump? Less friction is desirable.
3. Weight – How heavy is the pump? This is related to the amount and the types of materials used to construct the pump.
4. Estimated Cost – How much will it cost to construct the pump? This is related to the types of materials used, and the difficulty of the construction.
5. Complexity – How complex is the pump? Simpler pump will be easier, quicker, and generally more inexpensive to build.
6. Design Time – How much time will be required to finish concept generating / selecting processes, design the concept and actually start manufacturing? The longer design time equals overall longer production time and cost.
7. Sanitation – How clean will the water run through pump be? Lubricating oil can significantly contaminate the water running through the pump.
8. Vibration / Noise – How bad is the vibration and noise produced by the pump under operation?
9. Maintenance – How easy is the pump maintenance? This depends on the complexity of the pump and other factors.
10. Durability – How long will the pump last? Will any part of the pump be needed to be replaced?
11. Self‐Priming – Does the pump have the ability to purge air and create a vacuum, allowing the water to begin flowing, without requiring the pump to be filled with water beforehand?
12. Risk of failure – Is the pump prone to critical failure of parts from exceeding stress? Can any part of the pump fail to cause malfunctioning?

Table E.1: Concept Screening Matrix
Concepts (Pump types)
Selection Criteria A: Piston B: Peristaltic C: Centrifugal
Minimum 1 gpm
Low friction
Weight
Estimated Cost
Complexity
Design Time
Sanitation
Vibration / Noise
Maintenance
Durability
Self‐Priming
Risk of failure
0
‐
‐
‐
‐
+
‐
‐
‐
‐
+
‐
0
‐
+
+
0
+
+
‐
+
0
+
‐
0
0
0
0
0
0
0
0
0
0
0
0
Sum +’s
Sum 0’s
Sum –‘s
2
1
9
6
3
3
0
15
0
Net Score
Rank
Continue?
‐7
#3
Yes
+3
#1
Yes
0
#2
Yes
Note: There are only three concepts, and all three were continued in order for the concept scoring matrix (Table 2) to select a concept.

Here, weightings for each of the aforementioned criteria are determined by AHP (Analytical Hierarchy Process) methodology.
Table E.2: Preferences on Objectives
Table E.3: Weights on Objectives
The weighting factors appearing in the “Average” column above correspond to the values appearing in Table E.4 for the “Weight” column.

Table E.4: Concept Scoring Matrix
Concepts (Pump Types)
A: Piston B: Peristaltic C: Centrifugal Selection Criteria
Weight Rating Weighted Score
Rating Weighted Score
Rating Weighted Score
Minimum 1 gpm
22.0% 5 1.10 5 1.10 5 1.10
Low friction 11.2% 1 0.11 3 0.34 4 0.45 Weight 7.3% 2 0.15 4 0.29 3 0.22 Estimated Cost 4.6% 2 0.09 4 0.18 3 0.14 Complexity 7.1% 2 0.14 3 0.21 3 0.21 Design Time 14.0% 3 0.42 4 0.56 2 0.28 Sanitation 2.6% 2 0.05 5 0.13 4 0.10 Vibration / Noise
2.0% 2 0.04 2 0.04 4 0.08
Maintenance 1.8% 3 0.05 5 0.09 4 0.07 Durability 1.8% 2 0.04 3 0.05 3 0.05 Self‐Priming 12.7% 4 0.51 4 0.51 1 0.13 Risk of failure 12.8% 2 0.26 3 0.39 2 0.26
Total 2.70 3.51 3.09
Rank # #3 #1 #2
Continue? No Yes, develop No

Appendix F: Equations for Tabulating Theoretical Performance
Note: Unit conversions will not be discussed but they play an essential role in obtaining the correct solution!
• Flow Rate
For a variety of D and d, create a table in Excel with the following columns: V (volume displaced per revolution), N (rotational speed), Q (flow rate). Variables V and Q may be found as follows:
NVQ
DdV
•=
⎟⎠⎞
⎜⎝⎛=
22
2π
• Required Power (Head loss)
For a variety of D and d and a set ν (kinematic viscosity), create a table in Excel with the following columns: N, Q, v (average fluid velocity), Re (Reynold’s number), f (friction factor), hL (head loss), WHP (work horsepower). Variables v, Re, f, hL, and WHP may be found as follows:
ν
π
vD
dQv
=
⎟⎠⎞
⎜⎝⎛
=
Re
2
2
L
L
gQhWHPg
vdLfh
ρ=
⎟⎟⎠
⎞⎜⎜⎝
⎛⎟⎠⎞
⎜⎝⎛=
2
2
Note that f is found using the Swamee‐Jain equation as opposed to the more common Colebrook equation or Moody chart. This is because the Swamee‐Jain equation is of explicit form, which is much easier to program into Excel. Differences between the equations are unlikely to cause a significant change in performance prediction.
• Required Power (Friction loss)
Draw the friction forces and torques on the arm:

In general, torque is defined by:
rF •=τ
And so, in this case:
21221121 22 NrNrrFrFtotal μμτττ +=+=+=
When only one roller is in contact with the tubing:
21221121 NrNrrFrFtotal μμτττ +=+=+=
This creates a time‐varying torque. Bearing friction and axle friction coefficients are estimated to be 0.015 and 0.2, respectively. N is estimated to be about 12 lb (estimated using a handheld force meter). Plotting this torque over time for one complete cycle (time for each half‐cycle is normalized to 1) and estimating the curves to be sine waves:
Friction Torque for One Cycle (D=3)
0
0.01
0.02
0.03
0.04
0.05
0.06
0.07
0 0.5 1 1.5 2
t (Each half-cycle normalized to 1)
Torq
ue (f
t-lb) Total Torque
Average Torque

To determine the ratio of the sine curve to the constant curve, consider the geometry of the arm when the roller (assumed to be 1” diameter) is just beginning to contact the tubing:
°=−°°=
°==⇒= −
2.1062180 ;8.732
9.36)8.0(cos5.20.2)cos( 1
θθ
θθ
The ratio of 73.8: 106.2 is equivalent to the ratio of length of arc in contact with the tubing and that not in contact. When normalized to 1, these values are 0.41 and 0.59, which are the relative times for each part of the curve, as plotted above. The values of torque plotted above are just representative (for D=3 in.) The equation for the sine curve is: )7.7sin()()/2sin()()2sin()( minmaxminmaxminmax tTTTtTTftTTT −=−=−= ππ .
Since neither maximum nor minimum friction are representative of the actual friction during operation, an average value (integrated over time) must be found. This is plotted on the graph above. In reality, the motor may “hunt” for an operating point due to the varying torque, but approximating torque by the average should provide adequate predictions.
Returning to the original goal of finding power lost to friction, for each D, create a table in Excel with the following columns: T (average friction torque, as found above), and N. Variable Pfric may be found as follows:
NTvFPfric •=•=
Total power may then be calculated by summing Pfric and WHP, found above.
• Motor Power
For various values of R and N = {0 : 12000}, create a table in Excel with the following columns: N, BHP (brake horsepower), I (current; determined by manufacturer’s curve), NG (geared speed; dependent on R). Variables BHP and NG may be found as follows:
NRNNBHP
G •=•= τ
Plot provided BHP and I as a function of NG to create motor power curves for each R.

Appendix G: Theoretical Performance Graphs
Figure G.1
Flow Rate: d=0.25" (ID)
0
0.5
1
1.5
2
2.5
3
3.5
0 50 100 150 200 250 300 350
Rotation Speed (rpm)
Flow
Rat
e (g
pm)
D=6 in.D=5 in.D=4 in.D=3 in.
Figure G.2
Flow Rate: d=0.3125" (ID)
0
0.5
1
1.5
2
2.5
3
3.5
0 50 100 150 200 250 300 350
Rotation Speed (rpm)
Flow
Rat
e (g
pm)
D=6 in.D=5 in.D=4 in.D=3 in.
Figure G.3
Flow Rate: d=0.375" (ID)
0
0.5
1
1.5
2
2.5
3
3.5
0 50 100 150 200 250 300 350
Rotation Speed (rpm)
Flow
Rat
e (g
pm)
D=6 in.D=5 in.D=4 in.D=3 in.

Figure G.4
d = 0 . 2 5 " ( ID )P u m p R e q u i r e m e n t s ( R e q 'd S y s t e m H e a d + F r ic t io n )
0
1
2
3
4
5
6
0 5 0 1 0 0 1 5 0 2 0 0 2 5 0 3 0 0 3 5 0
R o t a t i o n S p e e d ( r p m )
Pow
er (W
)
D = 6 in .D = 5 in .D = 4 in .D = 3 in .M o t o r : 5 : 1M o t o r : 1 0 : 1M o t o r : 2 0 : 1M o t o r : 3 0 : 1M o t o r : 4 0 : 1M o t o r : 5 0 : 1
Figure G.5
d = 0 .3 1 2 5 " ( I D )P u m p R e q u i r e m e n t s ( R e q 'd S y s t e m H e a d + F r i c t i o n )
0
1
2
3
4
5
6
0 5 0 1 0 0 1 5 0 2 0 0 2 5 0 3 0 0 3 5 0
R o t a t io n S p e e d ( r p m )
Pow
er (W
)
D = 6 in .D = 5 in .D = 4 in .D = 3 in .M o to r : 5 :1M o to r : 1 0 :1M o to r : 2 0 :1M o to r : 3 0 :1M o to r : 4 0 :1M o to r : 5 0 :1
Figure G.6
d = 0 . 3 7 5 " ( I D )P u m p R e q u i r e m e n t s ( R e q 'd S y s t e m H e a d + F r i c t i o n )
0
1
2
3
4
5
6
0 5 0 1 0 0 1 5 0 2 0 0 2 5 0 3 0 0 3 5 0
R o t a t i o n S p e e d ( r p m )
Pow
er (W
)
D = 6 in .D = 5 in .D = 4 in .D = 3 in .M o t o r : 5 : 1M o t o r : 1 0 : 1M o t o r : 2 0 : 1M o t o r : 3 0 : 1M o t o r : 4 0 : 1M o t o r : 5 0 : 1

Figure G.7 Figure G.8
5:1
0
1
2
3
4
5
6
0 50 100 150 200 250 300 350
Speed (rpm)
Pow
er (W
)
0
1
2
3
4
5
6
7
Cur
rent
(A)
Pow er
Current
10:1
0
1
2
3
4
5
6
0 50 100 150 200 250 300 350
Speed (rpm)
Pow
er (W
)
0
1
2
3
4
5
6
7
Cur
rent
(A)
Pow er
Current
Figure G.9 Figure G.10
20:1
0
1
2
3
4
5
6
0 50 100 150 200 250 300 350
Speed (rpm)
Pow
er (W
)
0
1
2
3
4
5
6
7
Cur
rent
(A)
Pow er
Current30:1
0
1
2
3
4
5
6
0 50 100 150 200 250 300 350
Speed (rpm)
Pow
er (W
)
0
1
2
3
4
5
6
7
Cur
rent
(A)
Pow er
Current
Figure G.11 Figure G.12
40:1
0
1
2
3
4
5
6
0 50 100 150 200 250 300 350
Speed (rpm)
Pow
er (W
)
0
1
2
3
4
5
6
7
Cur
rent
(A)
Pow er
Current
50:1
0
1
2
3
4
5
6
0 50 100 150 200 250 300 350
Speed (rpm)
Pow
er (W
)
0
1
2
3
4
5
6
7
Cur
rent
(A)
Pow er
Current

Appendix H: CAD Models
Figure H.1: Welded Aluminum‐Sheet Casing (4 Pieces)
Figure H.2: Original Casing Design

Figure H.3: Hose Connector
Figure H.4: Arm
Figure H.5: Roller

Figure H.6: Arm Assembly
Figure H.7: Casing and Arm Assembly

Appendix I: Bill of Materials
Table I.1: Externally Purchased Components
Component Material Cost Per Unit Quantity Total Cost Pump Tubing Latex $0.97/ft. 2.5 ft. $2.43
Source: McMaster.com, Item No. 5234K51 Bearings (8x16x5 mm)
Steel $0.99/ea. 2 $1.98
Source: Bocabearings.com, Item No. 99MR688‐2RS Spacers: ¼” x 0.14 x½” ½” x 0.375 x 5/8”
Nylon Nylon
$0.28/ea $0.28/ea
1 1 (cut to fit)
$0.28 $0.28
Source: Lowe’s, Item No. 136911 and 136990 DC Motor N/A $1.59/ea. 2 $3.18
Source: Jameco.com, Item No. 232080 Materials Total: $4.97 Motors Total: $3.18
Table I.2: Internally Available Components
Component Material Quantity Source Est. Cost Hose Splice ABS Plastic 0.171 cu. in. Learning Factory
(Stratasys FDM 2000) $1.40 ($8/cu. in.)
Casing: Middle ½” Al Sheet 2 x 1.94 cu. in. Learning Factory (Omax 2626 water jet)
$3.88 ($1/cu. in.)
Casing: Side 1/8” Al Sheet 2 x 1.28 cu. in. Learning Factory (Omax 2626 water jet)
$2.56 ($1/cu. in.)
Arm 1/8” Al Sheet 2 x 0.16 cu. in. Learning Factory (Omax 2626 water jet)
$0.32 ($1/cu. in.)
Rollers Al Round 2 x 0.27 cu. in. Learning Factory (Machined on lathe)
$0.54 ($1/cu. in.)
Spacer: 3/8” x 0.15 x ¼”
Nylon 2 ME Instrument Room (Erector Set spacer)
$0.50
Small Washers Nylon 2 Learning Factory $0.25 #8 Hex Nuts Steel 4 Learning Factory $0.50 Rod (5/16”) Steel 1.25 in. Learning Factory $0.75 Thread post/bolt Steel 1 ME Instrument Room $0.50 Hose Clamp Steel 2 Learning Factory $0.50 Switch/Wiring N/A N/A ME Instrument Room $1.00 Output Tubing Plastic 3 ft. Instructor Provided $1.00 Rechargeable Batteries & Case
N/A 1 case, 4 batteries
Instructor Provided $20.00
Estimated Total: $33.70
Total from Table I.1 + I.2: $41.85

Appendix J: Machined Parts Drawings


Appendix K: Economic Analysis

Figure K.1
Present Value of Payments
0.00
500000.00
1000000.00
1500000.00
2000000.00
2500000.00
3000000.00
3500000.00
0 1 2 3 4 5 6Year
Cum
ulat
ive
Valu
e ($
)
10% 15% 20% Cumulative Value
Appendix L: Pump and Motor Reference
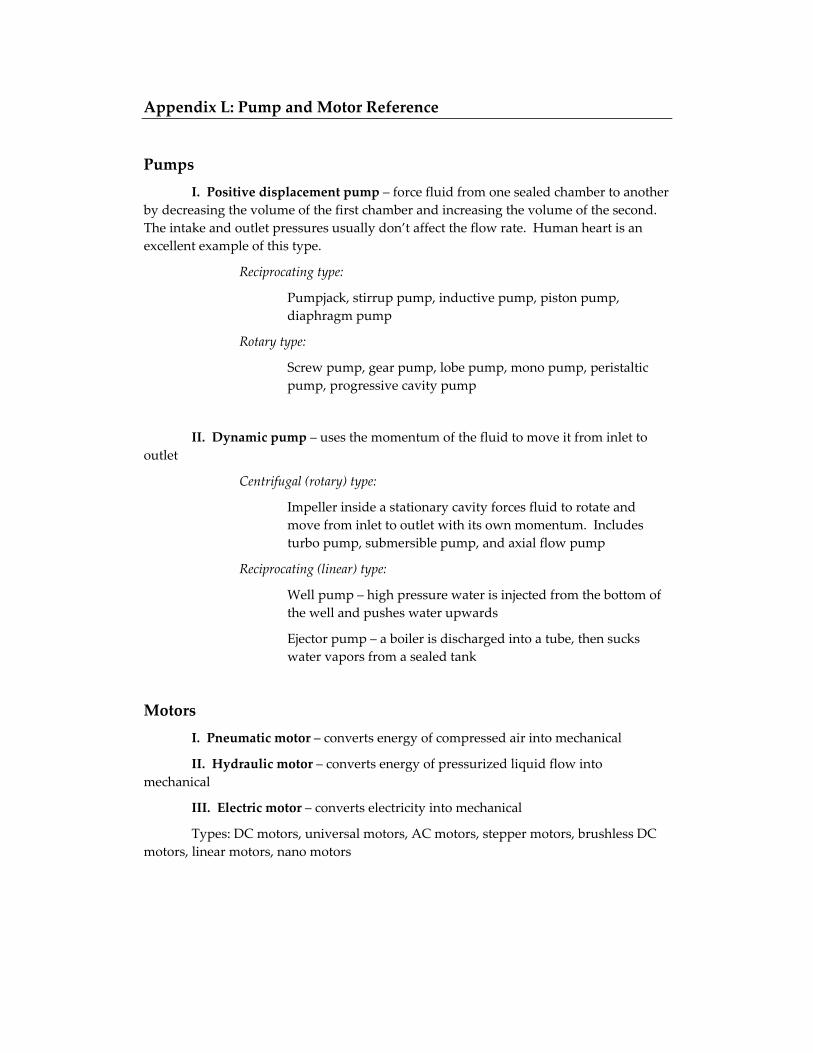
Pumps I. Positive displacement pump – force fluid from one sealed chamber to another
by decreasing the volume of the first chamber and increasing the volume of the second. The intake and outlet pressures usually don’t affect the flow rate. Human heart is an excellent example of this type.
Reciprocating type:
Pumpjack, stirrup pump, inductive pump, piston pump, diaphragm pump
Rotary type:
Screw pump, gear pump, lobe pump, mono pump, peristaltic pump, progressive cavity pump
II. Dynamic pump – uses the momentum of the fluid to move it from inlet to outlet
Centrifugal (rotary) type:
Impeller inside a stationary cavity forces fluid to rotate and move from inlet to outlet with its own momentum. Includes turbo pump, submersible pump, and axial flow pump
Reciprocating (linear) type:
Well pump – high pressure water is injected from the bottom of the well and pushes water upwards
Ejector pump – a boiler is discharged into a tube, then sucks water vapors from a sealed tank
Motors I. Pneumatic motor – converts energy of compressed air into mechanical
II. Hydraulic motor – converts energy of pressurized liquid flow into mechanical
III. Electric motor – converts electricity into mechanical
Types: DC motors, universal motors, AC motors, stepper motors, brushless DC motors, linear motors, nano motors