final report template - hudson river
TRANSCRIPT

NEIWPCC Final Report Form June 2018
Final Report
NEIWPCC Job Code: Project Code: Contractor:
0323-003 2016-024 New York-New Jersey Harbor & Estuary Program
Prepared By: Rosana Da Silva, Water Quality Manager
Project Period: August 29, 2016 – June 30, 2018
Date Submitted: Date Approved:
May 2018 June 2018
This is a NEIWPCC funded project
Stopping Trash Where It Starts
Contact Information ──────────────────────────────────────────────────────────────────
New York-New Jersey Harbor & Estuary Program
17 Battery Place, Suite 915, New York, NY 10004
Tel: (212) 483-7667, Fax: (212) 924-8325, Email: [email protected]

Stopping Trash Where It Starts
Page 2 of 24
This project was funded by an agreement awarded by the United States Environmental Protection Agency to the New England Interstate Water Pollution Control Commission (NEIWPCC) in partnership with the New York-New Jersey Harbor & Estuary Program. Although the information in this document may have been funded wholly or in part by the United States Environmental Protection Agency (under agreement I96275701), it has not undergone the Agency’s publications review process and therefore, may not necessarily reflect the views of the Agency and no official endorsement should be inferred. The viewpoints expressed here do not necessarily represent those of the New York-New Jersey Harbor & Estuary Program. NEIWPCC, or EPA, nor does mention of trade names, commercial products, or causes constitute endorsement or recommendation for use.

Stopping Trash Where It Starts
Page 3 of 24
Executive Summary The New York-New Jersey Harbor & Estuary Program (HEP) and Montclair State University’s Passaic River Institute (PRI) proposed to collect data from 35 locations in New Jersey on the types, sources, and conditions leading to litter generation and dispersal in order to target reduction strategies in the Passaic River Watershed. The Passaic River Watershed Stopping Trash Where It Starts project engaged two community groups, Friends of Bonsal Preserve and NY/NJ Baykeeper, to lead citizen scientists to conduct litter surveys along the main stem of the Passaic River and its tributaries. The work builds upon a 2016 study by Columbia University supported by the New York City Department of Environmental Protection and undertaken in collaboration with HEP. The objectives of this project include characterizing and identifying trash focusing on floatables entering local waterways and local conditions contributing to trash dispersal in order to target specific actions for reducing trash at the source. The work builds on Columbia University’s 2016 data collection efforts in New York City by implementing the protocol in additional areas in New Jersey to:
• Better characterize local sources and types of floatable debris to the greater New York-New Jersey Harbor Estuary;
• Utilize the data collected at each location to help identify the most effective source
reduction actions, including voluntary source control, preventative and reactive policy options, and targeted public awareness and education campaigns; and
• Creates and evaluates a model for engaging citizens and stewardship organizations
in identifying sources of litter and showcasing this project to educate local businesses and residents about trash impacts and solutions to encourage responsible vendor and consumer behavior and stewardship.
Ultimately, this project provides data on the most prominent sources and types of litter to inform pollution prevention measures to reduce marine debris in the estuary. The results of the Passaic River Watershed litter survey conducted in 2017 and the results from Columbia University’s 2016 study provide a snapshot of floatable debris in the estuary consisting largely of single-use, disposable plastics. Together, these two studies provide insight to address effective source reduction actions to include voluntary source control, preventative and reactive policy opportunities, and targeted public awareness and education campaigns. This project led to the development of a trash reduction toolkit for New York-New Jersey communities to provide municipalities and community groups’ guidance in taking action to reduce floatable debris from entering the estuary utilizing the data collected from both the Passaic River Watershed and the New York City study. HEP is now extending the use of the protocol to the Bronx and Harlem River Watershed. This work, supported by HEP staff and dedicated funding from EPA, will further enable HEP goal of reducing trash before it enters our shared waterways.

Stopping Trash Where It Starts
Page 4 of 24
Table of Contents
Page
Executive Summary ..................................................................... 3
1 Project Synopsis ............................................................ 5
2 Tasks Completed ........................................................... 5
3 Methodology ................................................................ 14
4 Quality Assurance Tasks Completed ........................ 16
5 Deliverables Completed .............................................. 16
6 Conclusions ................................................................. 17
7 References ................................................................... 19
8 Appendices .................................................................. 21
8.1 Quality Assurance Project Plan: Stopping Trash Where It Starts ........................................................................................ 21
8.2 NY/NJ Baykeeper’s Litter Reduction in Urban Communities Communications and Outreach Toolkit ................................. 21
8.3 HEP’s A Trash Reduction Toolkit for NY-NJ Communities .. 21 8.4 Site Survey Photographs ........................................................ 21 8.5 Stopping Trash Where It Starts Results Spreadsheet .......... 24

Stopping Trash Where It Starts
Page 5 of 24
1 Project Synopsis New York and New Jersey have taken measures to address marine debris through the municipal separate sewer system (MS4) and combined sewer overflow (CSO) permits. Both states capture and remove marine debris through floating barriers, skimmer vessels, netting or screening facilities, as well as source control programs such as street sweeping and stewardship programs (i.e., adopt-a-catch-basin, adopt-a-beach or clean streets-clean beaches). These efforts solely address the issue of trash once it becomes marine debris. In 2014, an estimated total of $59M was spent on marine debris waste management activities in the Hudson-Raritan Estuary (Kim, et al., 2015). While efforts to clean up floatable debris will continue to be necessary, pollution prevention options are more sustainable and rational manner of tackling the issue. The U.S. Environmental Protection Agency (EPA) Region 2 and the New York City Department of Environmental Protection (NYCDEP) collaborated with Columbia University in 2016 to design a street litter survey protocol to collect information about the type, quantity, and sources of street litter. The litter survey, developed with input from HEP, aimed to highlight the causes of floatable debris and provide an understanding to develop effective source reduction strategies (NYC Environmental Protection, 2016). In an effort to extend this approach to New Jersey, and explore additional pollution prevention opportunities throughout the estuary, the Stopping Trash Where It Starts project focused on developing a litter survey and protocol for New Jersey, targeting six (6) municipalities in the Passaic River Watershed. Led by HEP and PRI staff, with the assistance of the Lower Passaic Urban Waters Partnership, a data collection protocol and datasheet was created; QA/QC of volunteer-collected data, including the creation of a QAPP was achieved; a training was delivered to local organizations; raw data was analysed for this report and community presentations; a trash reduction toolkit for NY-NJ communities was developed and presented to local communities. Upon approval of the QAPP in September 2017, local community groups (Montclair State University, NY/NJ Baykeeper, and Friends of Bonsal Preserve) completed a training in October 2017 and conducted 70 litter surveys along 35 sites with seven (7) local volunteers (from Hackensack Riverkeeper and the Ironbound Community Corporation) during the months of October and December to collect data in the Passaic River Watershed on the types, sources and conditions leading to litter generation and dispersal. 2 Tasks Completed Task 1 – Refinement of data collection protocol for litter survey, site selection and QAPP development – QAPP approved and signed on September 27, 2017 (signature page inset right) A kick-off meeting was held at Montclair State University on February 27, 2017 to discuss tasks, logistics, and the involvement of various community groups. NYCDEP provided HEP and PRI with Columbia University’s 2016 litter survey protocol as the basis for the Passaic River Watershed litter survey. PRI completed the refinement of the data collection protocol for the litter survey including a tally matrix. PRI completed the process of initial site selection using the established criteria available in appendix 3 of the QAPP (Appendix 8.1) which included distance to the main stem of

Stopping Trash Where It Starts
Page 6 of 24
the Passaic River, impervious surface area, and other GIS criteria. Local community groups also had the opportunity to weigh in on initial selected sites to ensure appropriate locations heavily impacted by trash were surveyed. The project team selected a total of 35 sites in the Passaic River watershed; 24 sites along the Western Lower Passaic River, six (6) along the Second River, and five (5) along the Third River covering six (6) municipalities (Belleville, Bloomfield, Clifton, Newark, Nutley, and Passaic) as shown in Figure 1.
Figure 1: Passaic River Watershed Litter Survey Points and Surveyed Segments PRI conducted scouting for each proposed study site and evaluated sites with community partners; NY/NJ Baykeeper surveyed sites along the main stem of Passaic River in Newark and Friends of Bonsal Preserve surveyed sites along the Third River. A total of five sites for each community partner/supervisor was identified, and the remaining 25 sites were led by Montclair State University. The final QAPP was fully approved and signed on September 27, 2017 (Appendix 8.1). The following day, PRI delivered a day training workshop to instruct community members on how to conduct a litter survey as outline in the QAPP. A total of 19 participants attended the training workshop. During this training PRI provided each community partner/supervisor with at least one iPad and one GPS unit for data collection as well as water-proof datasheets to use if needed. Fillable PDF files were created and uploaded onto the iPads for field data collection.
Stopping Trash Where It Starts
Page 7 of 24
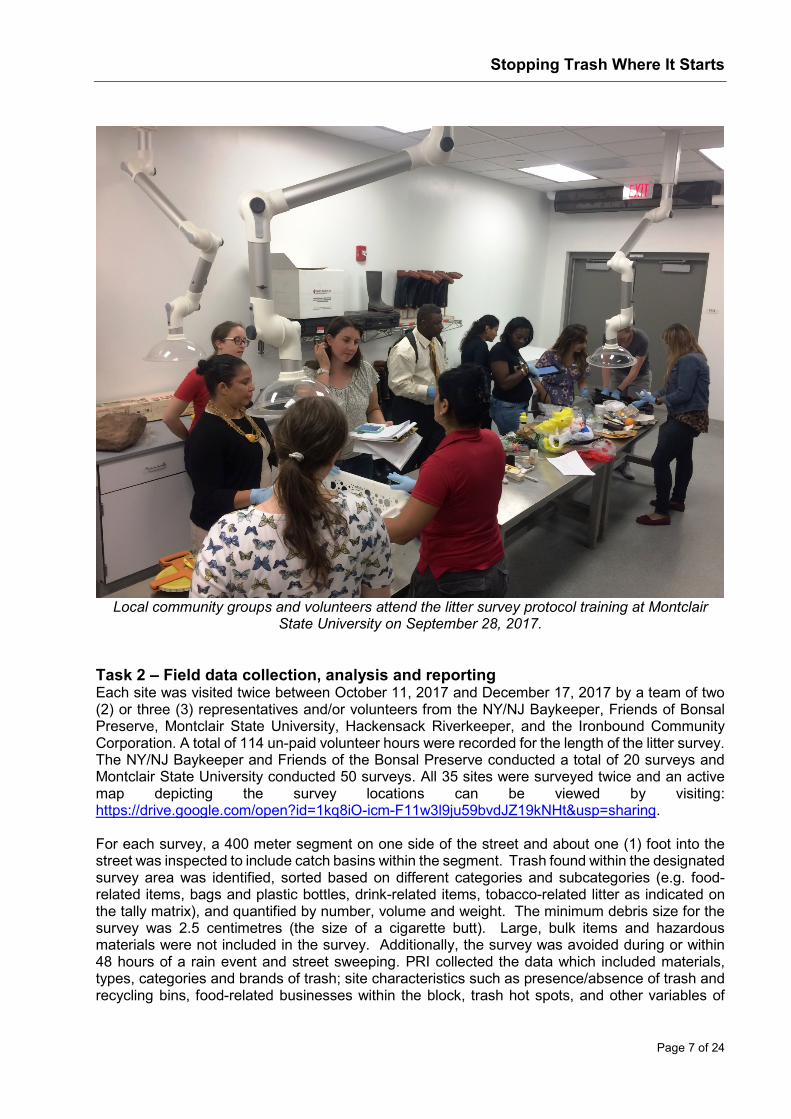
Local community groups and volunteers attend the litter survey protocol training at Montclair
State University on September 28, 2017. Task 2 – Field data collection, analysis and reporting Each site was visited twice between October 11, 2017 and December 17, 2017 by a team of two (2) or three (3) representatives and/or volunteers from the NY/NJ Baykeeper, Friends of Bonsal Preserve, Montclair State University, Hackensack Riverkeeper, and the Ironbound Community Corporation. A total of 114 un-paid volunteer hours were recorded for the length of the litter survey. The NY/NJ Baykeeper and Friends of the Bonsal Preserve conducted a total of 20 surveys and Montclair State University conducted 50 surveys. All 35 sites were surveyed twice and an active map depicting the survey locations can be viewed by visiting: https://drive.google.com/open?id=1kq8iO-icm-F11w3l9ju59bvdJZ19kNHt&usp=sharing. For each survey, a 400 meter segment on one side of the street and about one (1) foot into the street was inspected to include catch basins within the segment. Trash found within the designated survey area was identified, sorted based on different categories and subcategories (e.g. food-related items, bags and plastic bottles, drink-related items, tobacco-related litter as indicated on the tally matrix), and quantified by number, volume and weight. The minimum debris size for the survey was 2.5 centimetres (the size of a cigarette butt). Large, bulk items and hazardous materials were not included in the survey. Additionally, the survey was avoided during or within 48 hours of a rain event and street sweeping. PRI collected the data which included materials, types, categories and brands of trash; site characteristics such as presence/absence of trash and recycling bins, food-related businesses within the block, trash hot spots, and other variables of

Stopping Trash Where It Starts
Page 8 of 24
interest. The full list of types of data collected is available in Appendices 1-4 of the QAPP (Appendix 8.1).
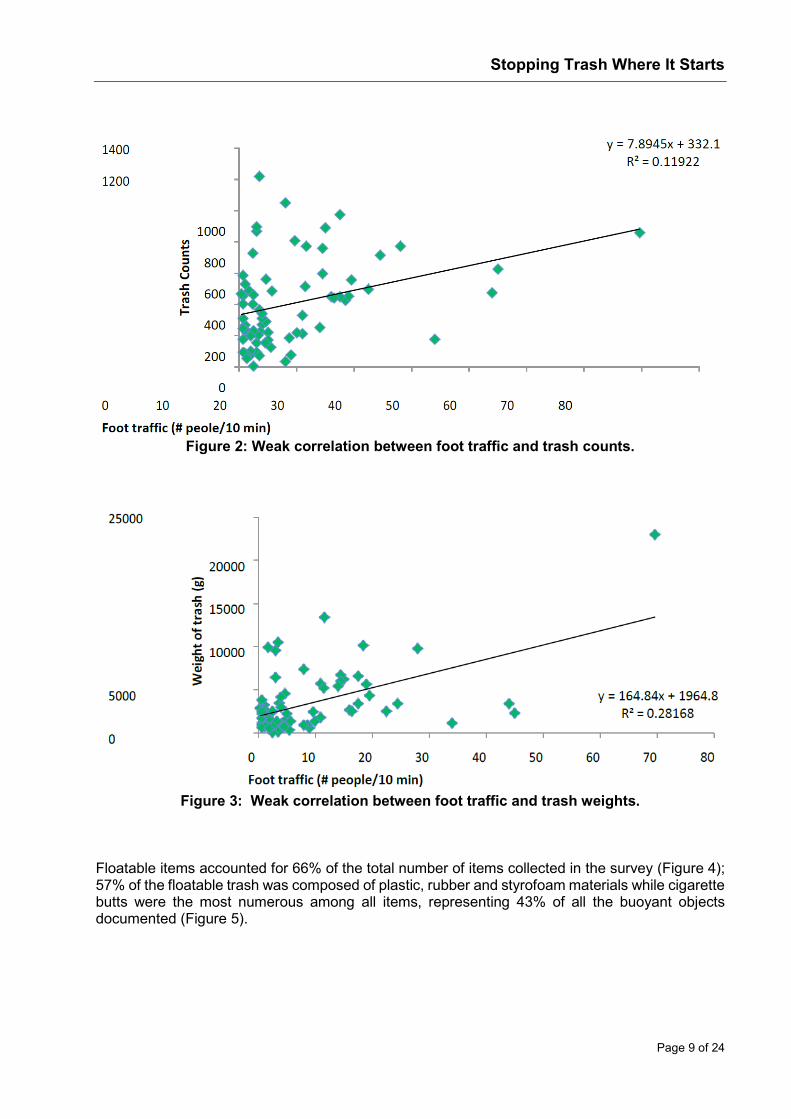
Friends of Bonsal Preserve, Hackensack Riverkeeper, and volunteers survey site PR_16 in Clifton, New Jersey. A total of 28,431 items were collected during the 70 visits at the 35 sites. On average, 406 items were documented during each site visit. The average weight was recorded at 3.5 kilograms and a volume at 67,679 cubic centimeters (cm3). The volume ranged from 616 to 683,090 cm3 and the total volume collected was 4,737,520 cm3. Per the survey protocol, volunteers also recorded vehicle and foot traffic during site visits. Upon analysis in Figures 2 and 3, no correlation was found between trash volume and foot traffic (R2=0.011) or vehicle traffic (R2=0.009); weak correlations were found between foot traffic and trash weight (R2=0.282) and trash count (R2=0.119). The results suggest that foot traffic seemed to impact the amount of trash on the street more than the vehicle traffic in the study.
Stopping Trash Where It Starts
Page 9 of 24
Figure 2: Weak correlation between foot traffic and trash counts.
Figure 3: Weak correlation between foot traffic and trash weights.
Floatable items accounted for 66% of the total number of items collected in the survey (Figure 4); 57% of the floatable trash was composed of plastic, rubber and styrofoam materials while cigarette butts were the most numerous among all items, representing 43% of all the buoyant objects documented (Figure 5).

Stopping Trash Where It Starts
Page 10 of 24
Figure 4: Percent floatable items documented at study sites by increasing precent order in Passaic (blue), Clifton (orange), Nutley (yellow), Bloomfield (green), Belleville (grey), and
Newark (light orange).
Figure 5: Floatable items during trash counts per study site
Food/drink related items accounted for 32% of the total items documented in the Passaic River Watershed survey with varying percentages per site (Figure 6). Initial efforts were made for brand annotation during survey but raw data from tally forms were inconsistent based upon the varying

Stopping Trash Where It Starts
Page 11 of 24
volunteers. Community group supervisors and volunteers were to collect trash in the field and later sort materials in a lab or facility to allow for photographs and an accurate count of items. The photographs of sorted materials per site would have provided a visual analysis for brand abundance, but one community group did not follow the recommended protocol. This created an inconsistency between photographed sites and limited the identification of overall abundant brands in the survey. It is recommended that future surveys improve communication amongst community group supervisors and the project manager to ensure protocols are being met as outlined.
Figure 6: Percent of food/drink related trash per survey site Comparable to the survey conducted in New York City boroughs, the most prevalent items found in the trash survey in the Passaic River Watershed was single-use, disposable plastic packaging and food/drink related items (Cortes, Kim, Rubin, & Villela de Faria, 2016). Based on national beach clean-up surveys, single-use plastics and food-related wrapping make up one-third to two-thirds of all marine debris (United States Environmental Protection Agency, 2018). Further analysis on the number of food-related businesses and the number of food-related trash counts showed a weak correlation (R2=0.1535). Per site, an 800 by 800 meter squared quadrant using the middle of the segment as a midpoint identified a total of 229 food-related businesses (Figure 7). Newark and Passaic had the highest numbers of food-related businesses. Upon removing the number of restaurants (n=80) with the assumption that a consumer is less likely to exit a restaurant and litter, the correlation between food-related business and food-related trash counts increase slightly (R2=0.1792) and still show a weak correlation (Figure 8).

Stopping Trash Where It Starts
Page 12 of 24
Figure 7: Total number of food-related businesses within an 800 by 800 meter squared
quadrant across 35 sites
Figure 8: Total number of food/drink-related items per neighbouring food/drink-related businesses within a 1600 m² quadrant for all sites
Task 3 – Outreach campaign and communication of results The NY/NJ Baykeeper began preliminary work on collecting publications and example campaigns for targeted public awareness and education post-litter surveys. NY/NJ Baykeeper developed a Litter Reduction in Urban Communities Communications and Outreach Toolkit to deliver during outreach programs and encourage the adoption of pollution prevention strategies (Appendix 8.2). Four (4) outreach programs to 110 participants were delivered to several schools (Table 1) that highlighted the litter survey protocol to include the methodology, initial results, and lessons learned. NY/NJ Baykeeper utilized the communications outreach toolkit to encourage students to take action in preventing plastic pollution.
80
16
1140
26
14
10
88
16
Restaurants
Café
Gas Stations w/ConvenientStores
Grocery Stores
Pub/Bar/Tavern
Liquor Stores
Convenient Stores
Fast Food
R² = 0.1535
0100200300400500600700800
0 20 40 60 80# of
food
/drin
k-re
late
d tr
ash
item
s at e
ach
site
Food/drink-related businesses
R² = 0.1792
0100200300400500600700800
0 10 20 30 40
# of
food
/drin
k-re
late
d tr
ash
item
s at e
ach
site
Food/drink-related businesses (discluding resturants)

Stopping Trash Where It Starts
Page 13 of 24
Table 1: Community Presentations on Litter Survey Results by NY/NJ Baykeeper Date Sponsor/Host # of Participants January 18, 2018 New Jersey City University
Jersey City, NJ 50
February 27, 2018 Heritage Middle School Livingston, NJ
30
March 1, 2018 East Side High School Newark, NJ
20
March 6, 2018 Parsons New School New York, NY
10
To assist municipalities and community organizations to move forward with trash reduction strategies, HEP developed A Trash Reduction Toolkit for NY-NJ Communities (Appendix 8.3) which provides an overview of the various communication campaigns and policy considerations now being undertaken in the region as well as national sources of information. For communities interested in conducting their own litter survey, the toolkit provides detailed instructions and recommendations on how to conduct a litter survey and encourages communities to share results to HEP in an effort to reduce data gaps in the estuary. Informal meetings were scheduled with two (2) municipalities and one (1) municipal conference call in the study area to highlight the results of the project and encourage municipalities to adopt recommendations outlined in the toolkit. Attempts were made to secure meetings with an additional municipality, but was unsuccessful. A total of seven (7) attendees participated in the community-focused meetings (Table 2) and were interested in incorporating the recommendations of the litter survey into municipal-focused surveys. Municipalities were interested in prioritizing educational campaigns and learning about NYC’s Adopt-A-Basket program to improve sanitation’s response to overflowing bins. Table 2: Community-Focused Meetings on Litter Survey Results and Recommendations Date Sponsor/Host # of Participants June 15, 2018 City of Newark’s Office of Sustainability and the
Department of Public Works, Newark, NJ 4
June 19, 2018 City of Passaic’s Business Administrator, Department of Public Works, and the Environmental Commission, Passaic, NJ
2
June 29, 2018 Township of Belleville, Engineer, Belleville, NJ (conference call)
1
HEP delivered a presentation on the Effective Integration of Trash Free Waters (TFW) into National Estuary Program Work on March 14, 2018 in Washington, DC during the EPA and National Estuary Program (NEP) Training Workshop. HEP will continue dialogues with TFW partners and EPA NEP staff to advance activities that prevent aquatic trash pollution. The toolkit developed by HEP as part of this project has been shared with EPA. HEP will extend the use of the protocol and toolkit to the Bronx and Harlem River Watershed through dedicated funding from EPA in 2018.

Stopping Trash Where It Starts
Page 14 of 24
3 Methodology All surveys were conducted using the same methodology indicated in the QAPP and recorded using the same datasheets to ensure a high degree of comparability between sites. Litter amount, type and site conditions were recorded using the datasheets found in the QAPP (tally form inset right) and were submitted electronically using fillable PDF forms to PRI. PRI and HEP Project Managers reviewed 10% of the data to verify completeness and reasonableness of the data entered into the datasheets by the community group supervisor and volunteer. Teams also used paper versions of the datasheets in case they were unable to submit the forms electronically. All survey days were avoided within 48 hours after street sweeping, trash collection schedules, and after a rain event. Each team consisted of a community group supervisor (who participated in the PRI training) and at least one additional individual with a preference of three (3) individuals per team for safety reasons and an additional level of data verification. Each team utilized a Garmin etrex 10 GPS unit (precision of less than 4 meters in radius) and an iPad with fillable PDF datasheets pre-downloaded. In addition, teams were provided with clipboards, a white board, pens, erasable marker, work gloves/latex gloves, safety vests, a trash picker, trash/recycling bags, and a site ID list (street names delimiting the area to be surveyed and indicative coordinates). A total of 35 sites were identified and surveyed twice resulting to 70 surveys led by a community group supervisor from Montclair State University (MSU), Friends of Bonsal Preserve (Bonsal), or NY/NJ Baykeeper (Baykeeper). Photographs in Appendix 8.4 highlight field work conducted as part of this project. The site name, ID, location and community group lead is listed in Table 3 (Figure 1 for spatial context). Survey sites were identified within areas that were impacted by trash, close to public shorelines, other environmentally sensitive areas, accessible, as well as special consideration to include low and high income communities and land use/land cover. Table 3: Site Survey Locations
Site Name Site ID Latitude (middle point)
Longitude (middle point) Municipality Community
Group Lead Park PR_01 40.810184 -74.140381 Nutley MSU/Bonsal Lister PR_06 40.740807 -74.132872 Newark Baykeeper Monroe PR_07 40.868583 -74.114691 Passaic MSU Cortlandt PR_08 40.782795 -74.150044 Belleville MSU/Bonsal Forth PR_10a 40.757119 -74.171914 Newark MSU Virginia PR_12 40.869694 -74.11641 Passaic MSU Centre PR_14 40.807504 -74.140184 Nutley MSU Delawanna PR_16 40.828209 -74.124353 Clifton MSU/Bonsal Chester a PR_21 a 40.768378 -74.164587 Newark MSU Commercial PR_26 40.733451 -74.160873 Newark Baykeeper Westervelt PR_32 40.847664 -74.123186 Passaic MSU

Stopping Trash Where It Starts
Page 15 of 24
Roosevelt PR_34 40.801754 -74.142232 Belleville MSU Stratford PR_37 40.819215 -74.135735 Nutley MSU/Bonsal South PR_39 40.860854 -74.114691 Passaic MSU/Bonsal South bis PR_42 40.86125 -74.112612 Passaic MSU Oxford PR_47 40.732442 -74.145676 Newark Baykeeper Rutgers PR_50 40.786244 -74.148175 Belleville MSU Raymond PR_53 40.734335 -74.145685 Newark MSU/Bonsal Palmer PR_60 40.844705 -74.125328 Passaic MSU Seabury PR_64 40.770811 -74.158571 Newark Baykeeper Mill PR_80 40.781006 -74.150874 Belleville MSU/Bonsal Chapel PR_89 40.737996 -74.142017 Newark MSU/Bonsal Third PR_93 40.758289 -74.167184 Newark Baykeeper Ackerman PR_95a 40.876438 -74.128845 Clifton MSU Cleveland SR_02a 40.783008 -74.152993 Belleville MSU/Bonsal Mill bis SR_03 40.791219 -74.174466 Belleville MSU/Bonsal Smallwood SR_05 40.794057 -74.173691 Belleville MSU/Bonsal Mill tris SR_09 40.783456 -74.15971 Belleville MSU/Bonsal WUP SR_14 40.78749 -74.162126 Belleville/Nutley MSU/Bonsal Montgomery SR_15 40.793151 -74.181117 Bloomfield MSU/Bonsal Allwood TR_09 40.832989 -74.141597 Clifton MSU/Bonsal Washington TR_14 40.825226 -74.139161 Nutley MSU Oak TR_16 40.828786 -74.131782 Clifton MSU/Bonsal Brookfield TR_17 40.825104 -74.150688 Nutley MSU Kingsland TR_18 40.824068 -74.13539 Clifton MSU/Bonsal
All survey locations consisted of a 400 meter stretch of road, one (1) foot into the street and only on one side of the street. The starting point for the survey was recommended to be a particular cross-street identified on Google Maps and coordinates taken with the Garmin etrex 10 GPS unit. A buffer distance of 300 meters from the nearest waterway was considered upon selecting sites; specifically, if assessing multiple waterbodies variations of sites along the main stem of the Passaic River and its tributaries were considered. PRI randomly identified over 180 sites. Upon an in person-scouting to verify access and good representation of the survey parameters, 35 sites were selected for the study (Table 3). Consideration of flood areas, slope, surface runoff, impervious surfaces, and structures versus empty spaces or lots were also considered during the selection process. Litter surveys were conducted in October through December 2017 with no particular day of the week identified. Litter surveys were avoided during major wet weather events, street sweeping, and trash pickup schedules in each municipality. Trash was collected by the surveyors on site, but bulk items and hazardous materials were avoided. A surveyor was responsible for annotating uncollected materials for all site visits on site and tallying the collected items in an off-site location. A second surveyor was responsible to walk along the sidewalk to count vehicles and people passing in the designated study area for a total of 10 minutes. Collected items were then properly disposed of by the teams and the datasheets were submitted to PRI for analysis.

Stopping Trash Where It Starts
Page 16 of 24
4 Quality Assurance Tasks Completed For quality control measures, HEP and PRI primarily relied on the standardized methodology and protocols outlined in approved QAPP (Appendix 8.1). HEP required community group supervisors and Montclair State University volunteers to participate in a training event. The community group supervisor was responsible for ensuring that the volunteers followed protocols on the day of the data collection and communication with the QA manager. Although the training was aimed to provide quality control among all sites, several issues arose. Weight measurements were inconsistently recorded from survey team to survey team. In addition, reviewing records found inconsistent counts from the first to the second survey on the number of trash bins and storm drains at the same site. Recommendations for training improvements and uniform survey protocols include:
• Providing at least 1 decimal place for weight measurements from all surveyors. • Counting trash bins and storm drains to include counts on both sides of the street (not just
on the surveyed segment). • Conducting trash counts to complete the tally form in an indoor facility rather than collecting,
tallying, and documenting trash in the field. This provides additional time to dedicate to site visits given that site visits are limited due to project constraints such as street sweeping, trash removal, and rain events.
• Clearly defined trash collection limits. Trash should only be collect from within the segment study area from the edge of a building or fence to the end of a curb and one (1) foot or end of storm drain equivalent into the street. Volunteers are discouraged from collecting trash in the street, front yards, or vacant lots as this is a survey and not a public service.
HEP required a community group supervisor to be in attendance of all survey events to ensure protocols were followed. PRI, as the QA manager, extended communications to each community group supervisor to check in and during calls, the QA manager was able to address some issues such as clarifying trash collection limits. As the QA manager received completed tally forms, clarifications were requested from the community group supervisor and/or volunteer. Request for responses were not always received by the QA manager. All data was recorded in the same datasheets as outlined in the QAPP for comparability analysis between sites. A before and after photograph of each site was taken as part of the survey form protocol (additional photographs can be viewed in Appendix 8.4). The community group supervisors that followed protocol by sorting trash off-site, took photographs of sorted trash by materials. The photographs provided a reference point for brand abundance, but not all volunteers conducted the survey in this manner. This created an inconsistency between sites and limited the identification of the most abundant brands in the survey. It is recommended that the QA manager dedicate time for communication with community group supervisors to confirm survey date, review protocol directions before the survey date, be on call during survey dates, and review tally forms after completed field work. 5 Deliverables Completed Deliverable Activity Metric Result
Reports Reporting on the 10th of Jan, Apr, July, Oct; final in June
2018
6 quarterly reports + final report 6 completed and final

Stopping Trash Where It Starts
Page 17 of 24
Litter Protocol QAPP EPA/NEIWPCC approved Approved QAPP Approved September
27, 2017
Site Selection Criteria for site selection in
the Passaic River Watershed
Approved QAPP Approved September 27, 2017
Trash Assessments
Local community groups and volunteers trained on
QA/QC plan
Day-training, required by two (2) community
groups
Completed by PRI on September 28, 2017,
19 attendees including Friends of Bonsal
Preserve and NY/NJ Baykeeper
Local community groups and volunteers conduct litter
survey
10 sites surveyed twice
20 site surveys completed between
October 11 - December 17, 2017 by
Friends of Bonsal Preserve and NY/NJ
Baykeeper
MSU and volunteers conduct litter survey
25 sites surveyed twice
50 site surveys completed between
October 11 -December 17, 2017 by
MSU
Analysis PRI staff to analyze raw data
Identified types of trash by location and
similarities/differences of results in NY/NJ
Completed March 30, 2018
Pollution Prevention
Presentations
Presentations delivered to local communities on
pollution prevention efforts
Number of events and participants
4 events to a total of 110 participants, led by NY/NJ Baykeeper
between January 18 – March 6, 2018
Two (2) - Three (3) presentations to
municipalities affected by the project
Completed between June 15-20, 2018
Toolkit for Community
Groups
Toolkit/user’s manual for trash reduction Approved Toolkit Completed May 31,
2018
Trash Free Waters
Partnership Connection
Review findings and possible next steps with
TFW
Presentation and shared final report
Presentation completed March 14, 2018; Final report and toolkit shared June 29,
2018 6 Conclusions Overall, both studies conducted in New York City boroughs and the Passaic River Watershed concluded with identical recommendations of educating local businesses and residents about trash impacts and solutions to encourage responsible vendor and consumer behaviour and stewardship.

Stopping Trash Where It Starts
Page 18 of 24
The most effective way to prevent marine debris is to prevent waste, specifically single-use, disposable plastics such as bottles, bags, straws, stirrers, and food/dink related wrapping (United States Environmental Protection Agency, 2018). The results of the Passaic River Watershed survey suggest trash reduction strategies should focus on pro-environmental behaviour changes or actions targeting smokers (to reduce cigarette litter) and consumers or producers of food/drink related litter (Cortes, Kim, Rubin, & Villela de Faria, 2016). Pro-environmental behaviour is defined as a set of actions or conscience decisions by an individual that reduce the negative impact of human activity on the environmental or enhance the quality of the environment (Sawitri, 2015). Through educational campaigns, communities can begin to increase the individual’s awareness to the harmful impacts of single-use, disposable plastics to begin broadening their environmental awareness and increase pro-environmental behaviours. It is recommended that a focused campaign or outreach materials targeting residential neighbourhoods or schools on the reduction of single-use, disposable plastics or food/drink related plastics will reduce marine debris in the harbor (NY/NJ Baykeeper, 2016) (UNEP and GRID-Arendal, 2016). Media campaigns and outreach to encourage pro-environmental behaviours in the harbor and estuary can amplify singular events such as beach or river clean ups. Communities in New York and New Jersey are encouraged to explore media campaigns that target the reduction of single-use, disposable plastics and refer to New York City’s Don’t Trash Our Waters and NY/NJ Baykeeper’s Plastic Pollution Reduction campaigns. Expanding on GreeNYC, a marketing and data-driven program aimed to change behaviour through campaigns and events, NYCDEP created a Don’t Trash Our Waters campaign focusing on specific neighbourhoods where street litter is a persistent challenge in municipal separate sewer system (MS4) areas (NYC Environmental Protection, 2016). For example, a targeted anti-littering campaign was implemented in Coney Island in 2017. The campaign promotes local residents and businesses to play a role in keeping waterways trash-free by generating less trash (i.e., Zero Waste Pledge, The B.Y.O. Movement Pledge), guidelines for keeping streets clean, adopt-a-basket (notify sanitation team when bins are full), and organize clean ups (NYC Environmental Protection, 2018) (NYC Sanitation, 2016). NYCDEP, Mayor’s Office of Sustainability, and the New York City Department of Sanitation are exploring partnership opportunities with other city departments and private partners to promote reusable items (NYC Environmental Protection, 2016). Partnerships with local businesses and vendors can improve waste management strategies by placing of trash bins near exits along with anti-littering signs, adopt alternatives to single-use, disposable plastics, or offering discounts to patrons who bring their own reusable items such as bags or mugs. New Jersey’s litter-abatement program, created by the Clean Communities Act in 1986, established the New Jersey Clean Communities to provide funding to 558 municipalities and 21 counties to support clean up, enforcement, and education throughout the state. Like New York, the New Jersey Clean Communities administers adopt-a-beach and adopt-a-highway program to develop partnerships with local businesses, organizations, or residents to reduce marine debris. The program generates $20 million each year by placing a tax on fifteen categories of businesses that may produce litter-generating products and distributes funds to municipalities and counties (New Jersey Clean Communities, 2018). Although clean ups are ongoing in both states, an anti-littering campaign at a local level can increase pro-environmental behaviour to reduce street litter and marine debris. Alternatively to a municipal-led campaign, organizations can also be successful in engaging local businesses and residents with an anti-littering campaign. For example, the NY/NJ Baykeeper’s Plastics Pollution Reduction campaign focuses on communities and local businesses to reduce single-use plastics through alternative plastic pollution prevention strategies, social media campaigns such as #SkipTheStraw, #BeTheSolution2PlasticPollution, and #BreakThePlasticHabit, and a guidance document to become a straw-free ambassador (NY/NJ Baykeeper, 2017).

Stopping Trash Where It Starts
Page 19 of 24
In addition to education and outreach, municipalities are recommended to consider supporting local or state laws that expands on the recycling law to reduce single-use, disposable plastics from becoming marine debris. Municipalities and states across the country have implemented plastic bag bans and plastic bag fees to reduce plastic pollution from entering streets, sewerage systems, and waterways. In New York, Governor Andrew M. Cuomo’s Plastic Bag Task Force was established to provide recommendations on plastic bag policies which led to state senators’ introduction of a bill (S7760) in 2018 that would ban plastic carryout bags and place a ten-cent fee on all carryout bags (Krueger, 2018; Fallon, 2017). In New Jersey, several variations of a plastic bag ban (A4552, A1218) have been introduced since 2007, but have not made it to the governor’s desk. With Governor Phil Murphy’s election, environmentalists anticipate a successful bill will be bought forward as several New Jersey municipalities have already passed such laws (Zimmer, 2018; Warren, 2018). Most recently, the Borough of Monmouth Beach passed local ordinance No. 2018-02 in Chapter 3 Section 3.17 to ban single-use plastic bags, straws and food containers, as well as take-out Styrofoam boxes (Strunsky, 2018). The ordinance, passed on May 22, defines that no business or store shall provide any single-use, plastic carryout bags, polystyrene foam containers and/or plastic straws to a customer at the check stand, cash register, point of sale, or other point of departure for the purpose of transporting products or goods out of the business or store, with only one exception to business or stores for the sale of bait. Taking effect on June 1, the ordinance includes fines of up to $2,400 but warnings will be issues for initial violations (Strunsky, 2018). Unlike other municipalities in New Jersey, this is the first ordinance that tackles bags, straws, and containers and should serve as a model ordinance for other communities across the harbor. With a goal of reducing sources and developing solutions for trash and floatables in the estuary, HEP will engage the Bronx & Harlem Rivers Urban Waters Federal Partnership and the EPA Trash Free Waters initiative to expand on characterizing and identifying trash and floatables entering local waterways. Building on the work supported by NEIWPCC in the Passaic River Watershed, HEP has dedicated $25,000 and staff time to expand the litter survey protocol in the Bronx and Harlem River Watershed in 2018. HEP will work with PRI, the Urban Water Ambassador, and local community groups to better understand the sources and root causes of litter reaching the estuary while also promoting the toolkit and campaigns outlined in this report for citizen action. 7 References Cortes, F., Kim, J., Rubin, S., & Villela de Faria, J. (2016). Stopping Trash Where it Starts: A Project
to Mitigate Floatable Trash in New York City Waterways through Targeted Street Litter Reduction. New York City: Columbia University School of International and Public Affairs and Data Science Institute.
Fallon, S. (2017, February 2). Efforts to curb plastic-bag litter face major opposition. Retrieved from
NorthJersey.com: https://www.northjersey.com/story/news/environment/2017/02/02/efforts-curb-plastic-bag-litter-faces-big-opposition/97290430/
Kim, B. R., et al. (2015). Quantifying the Financial Costs to Communities of Managing Trash in the
Hudson-Raritan Estuary. New York: Columbia University Earth Institute. Krueger, L. (2018, February 26). The New York State Senate. Retrieved from Krueger And
Hoylman Announce Bill Addressing Plastic Bag Pollution:

Stopping Trash Where It Starts
Page 20 of 24
https://www.nysenate.gov/newsroom/press-releases/liz-krueger/krueger-and-hoylman-announce-bill-addressing-plastic-bag
New Jersey Clean Communities. (2018, February 10). Overview. Retrieved from New Jersey
Clean Communities: https://www.njclean.org/nj-clean-communities/overview NY/NJ Baykeeper. (2016). NY-NJ Harbor Estuary Plastic Collection Report. Retrieved from
Preventing Plastic Pollution: http://nynjbaykeeper.org/wp-content/uploads/2016/02/NYNJBaykeeper-Plastics-Report-February-2016-2.pdf
NY/NJ Baykeeper. (2017). Preventing Plastic Pollution. Retrieved from How to Become a Straw-
Free Ambassador: http://nynjbaykeeper.org/wp-content/uploads/2017/11/STRAWFREESEPTFINAL.pdf
NYC Environmental Protection. (2016, February). Trash Free NYC Waters: A Plan to Reduce
Marine Debris Through a Media Campaign. Retrieved from http://www.nyc.gov/html/dep/pdf/water_sewer/trash-free-nyc-waters-media-campaign-plan.pdf
NYC Environmental Protection. (2018). How You Can Help Keep our Waterways Trash Free.
Retrieved from Don't Trash Our Waters: http://www.nyc.gov/html/dep/html/harborwater/trash-free-waters-citizens.shtml
NYC Sanitation. (2016). Zero Waste. Retrieved from New York City Sanitation:
http://www1.nyc.gov/assets/dsny/site/our-work/zero-waste Sawitri, D. H. (2015). Pro-Environmental Behavior from a Social Cognitive Theory Perspective.
Proceida Environmental Sciences, 27-33. Strunsky, S. (2018, May 23). Plastic or paper? Not a choice anymore under N.J. Shore town ban.
Retrieved from NJ.com: http://www.nj.com/monmouth/index.ssf/2018/05/plastic_or_paper_no_choice_anymore_under_monmouth.html
UNEP and GRID-Arendal. (2016). Marine Litter Vital Graphics. Retrieved from United Nations
Environment Programme and GRID-Arendal: www.grida.no/publications/60 United States Environmental Protection Agency. (2018, March 7). Trash-Free Waters. Retrieved
from https://www.epa.gov/trash-free-waters Warren, M. S. (2018, May 8). More towns are saying no to plastic bags. Is a statewide bag ban
coming? Retrieved from NJ.com: http://www.nj.com/news/index.ssf/2018/05/towns_across_nj_are_banning_plastic_bags_will_a_st.html
Zimmer, R. (2018, January 23). Plastic bag ban: Will Phil Murphy lead the way in NJ? Retrieved
from app: https://www.app.com/story/news/local/land-environment/2018/01/23/plastic-bag-ban-nj-phil-murphy/1025754001/

Stopping Trash Where It Starts
Page 21 of 24
8 Appendices 8.1 Quality Assurance Project Plan: Stopping Trash Where It Starts
https://www.dropbox.com/s/1rji8xvbmtdjndy/8.1_HRF_QAPP_AquaticTrash_Final_Signed.pdf?dl=0
8.2 NY/NJ Baykeeper’s Litter Reduction in Urban Communities
Communications and Outreach Toolkit
https://www.dropbox.com/s/4hfhbuswmvh2q2i/8.2_NYNJ%20Baykeeper%20Litter%20Reduction%20in%20Urban%20Communities.pdf?dl=0
8.3 HEP’s A Trash Reduction Toolkit for NY-NJ Communities
https://www.dropbox.com/s/aeu3ka5na7esf8u/8.3_A%20Trash%20Reduction%20Toolkit%20for%20NY-NJ%20Communities_FINAL.pdf?dl=0
8.4 Site Survey Photographs
Montclair State University assistants collect litter in segment PR_12 (Virginia) during their litter
survey.

Stopping Trash Where It Starts
Page 22 of 24
Teams of three utilize a clipboard, iPad, and a Garmin 10 GPS unit to verify the location of their
survey segments.
Teams utilized container to record height and weight of collected litter following the litter survey
protocol.

Stopping Trash Where It Starts
Page 23 of 24
One foot into the street was included in the 400 meter segment to capture litter caught in catch
basins.
Off-site sorting and tallying of collected items by Montclair State University volunteers.

Stopping Trash Where It Starts
Page 24 of 24
8.5 Stopping Trash Where It Starts Results Spreadsheet
https://www.dropbox.com/s/mudyrk5ricbfdq3/8.5_Stopping%20Trash%20Where%20It%20Starts%20Results%20Spreadsheet.pdf?dl=0