final report to the legislature minnesota taconite …
TRANSCRIPT

1
FINAL REPORT TO THE LEGISLATURE
MINNESOTA TACONITE WORKERS HEALTH STUDY
DATE: November 24, 2014
TO: Sen. David Tomassoni, chair
Senate Jobs and Economic Growth Committee
317 Capitol
Sen. Tony Lourey, chair
Senate Health and Human Services Finance Division
120 Capitol
Sen. Kathy Sheran, chair
Senate Health, Human Services and Housing Committee
120 Capitol
Rep. Tim Mahoney, chair
House Jobs and Economic Development Finance & Policy Committee
591 State Office Building
Rep. Sheldon Johnson, chair
House Labor, Workplace and Regulated Industries
549 State Office Building
Rep. Tom Huntley, chair
Health and Human Services Finance Committee
585 State Office Building
Rep. Tina Liebling, chair
House Health and Human Services Policy Committee
367 State Office Building
FROM: John R. Finnegan, Jr., dean and professor (E-mail: [email protected]; Phone: 612 625
1179)
Jeffrey Mandel, associate professor, principal investigator (E-mail: [email protected];
Phone: 612 626 9308)
COPIES: Iron Range Legislative Delegation
Rep. David Dill
Rep. Mary Murphy
Sen. Tom Bakk
Rep. John Persell
Rep. Tom Anzelc
Sen. Tom Saxhaug
Rep. Carly Melin
Rep. Jason Metsa
This document is made available electronically by the Minnesota Legislative Reference Library as part of an ongoing digital archiving project. http://www.leg.state.mn.us/lrl/lrl.asp

2
November 24, 2014
Dear Legislators:
We are pleased to present the final report on our research regarding the health status of taconite
workers.
This report covers the assessments made by the University of Minnesota School of Public Health
(SPH). The Natural Resources Research Institute will be submitting a separate report on the
environmental characterization work that they have been doing. This report contains the SPH’s
efforts in occupational exposure, mortality and cancer incidence, case-control studies and the
respiratory health survey of taconite workers and spouses. The final NRRI report will be submitted
under separate cover.
In some study areas, peer-reviewed papers have been published. Others are being prepared for
journal submission and are available in the appendix of this report. We remain committed to open
communication and transparency. We plan to hold at least one additional stakeholder meeting
through the Minnesota Taconite Workers Lung Health Partnership on December 1, 2014 and will
continue to update our website, www.taconiteworkers.umn.edu as studies become published.
We would be delighted to discuss the report at a convenient time.
We would like to thank those current and former workers who participated in our screening study.
We’d also like to thank the companies and union officials for cooperating with several parts of this
work. Finally, thank you for the opportunity to advance scientific knowledge on this critical issue
facing Minnesota.
John R. Finnegan, Jr., PhD Jeffrey H. Mandel, MD, MPH
Professor and Dean Associate Professor
Principal Investigator

3
FINAL REPORT TO THE LEGISLATURE
MINNESOTA TACONITE WORKERS HEALTH STUDY
Table of Contents Page Number
Acknowledgement………………………………………………………………… .......4
Abbreviations Used in Report……………………………………………………...... 5-6
Overall Summary……………………………………………………………………..7-8
Executive Scientific Summary………………………………………………………8-14
Occupational Exposure Assessment Component Summary………………………..15-18
Mortality Study Component Summary……………………………………………..19-20
Cancer Incidence Study Component Summary…………………………………….21-22
Mesothelioma Case-Control Study Component Summary………………………....23-26
Lung Cancer Case-Control Study Component Summary………………………..…27-29
Respiratory Health Survey Component Summary………………………………….30-32
Appendices Listing and manuscript status……………………………………………..33

4
ACKNOWLEDGEMENT
This project is the result of the concerted effort of the entire Lung Health Partnership. The list of
contributors to this effort are many and include the University of Minnesota investigators, graduate
students, study coordinators and professional staff, the Minnesota Department of Health, the
company representatives from U.S. Steel, Cliffs Natural Resources and Arcelor-Mittal, the United
Steel Workers Union representatives, the legislators involved in the initial funding of this
undertaking, particularly the Iron Range delegation and the participants of the Respiratory Health
Survey. Our gratitude is extended to all of the people from these groups who contributed to this
effort and, in so doing, helped in the effort to improve the taconite mining industry of Minnesota.

5
ABREVIATIONS USED IN THIS REPORT
ACGHI American Conference of Governmental Industrial Hygienist
BMI Body Mass Index
CVD Cardiovascular Disease
CI Confidence Interval
CF Conversion Factors
EBSD Electron Back Scattered Diffraction
EDS Energy Dispersive X-ray Spectroscopy
EDXA Energy Dispersive X-ray Analysis
EMP Elongate Mineral Particle
ICD International Classification of Disease
ISO International Standards Organization
LTAS Life Table Analysis System
MCE Mixed Cellulose Ester
MCSS Minnesota Cancer Surveillance System
MDH Minnesota Department of Health
MIR Mesabi Iron Range
MRHAP Mineral Resources Health Assessment Program
MSHA Mine Safety and Health Administration
NAAQS National Ambient Air Quality Standard
NDI National Death Index
NIOSH National Institute of Occupational Safety and Health
NMRD Non-malignant Respiratory Disease
NRRI Natural Resources Research Institute

6
OEL Occupational Exposure Limit
PCM Phase Contrast Microscopy
PEL Permissible Exposure Limit
PIXE Proton Induced X-ray Spectroscopy
PM Particulate Matter
RHS Respiratory Health Survey
SAED Selected Area Electron Diffraction
SEG Similar Exposure Group
SEM Scanning Electron Microscopy
SMR Standardized Mortality Rate
SSA Social Security Administration
TEM Transmission Electron Microscopy
TSP Total Suspended Particulate
TWA Time Weighted Average
TWHS Taconite Worker Health Study
UMN University of Minnesota
UMD University of Minnesota Duluth
UMTC University of Minnesota Twin Cities

7
Taconite Workers Health Study: Final Report to the Minnesota Legislature
I. Overall General Summary
The following is a general summary of the Taconite Workers Health Study. Details may be found in
the rest of the report and in the full component reports in the appendix.
In 2008, the University of Minnesota School of Public Health, at the request of the Minnesota Legislature, launched the Taconite Workers Health Study. The request was prompted by the discovery of an unusual number of cases of mesothelioma, a rare cancer of the lung lining, in Minnesota taconite workers. The study asked three questions to assess occupational risks to taconite workers. The investigation has now concluded and below is a snapshot of its findings. 1. Is working in the taconite industry associated with mesothelioma and/or with other diseases, respiratory or non-respiratory?
Taconite workers had higher than expected death rates from three diseases: mesothelioma, a cancer of the lining around the lung, lung cancer and heart disease, when compared to people in Minnesota.
The vast numbers of other disease categories were not higher than expected or were not felt to have an occupational basis.
2. What factors, particularly dust from taconite operations, are associated with mesothelioma and other respiratory diseases?
The length of time people worked in the industry was linked to higher levels of mesothelioma but not lung cancer.
Exposure to a fiber-like mineral, referred to as elongate mineral particle (EMP), was linked to mesothelioma but not lung cancer. EMP exposure, as defined in this study, could be from either dust generated in mining and processing or from commercial asbestos exposure.
Workers with above-average exposure to dust containing EMPs were twice as likely to develop mesothelioma as workers with below-average exposures.
3. Are workers at risk for common dust-related lung diseases and are their spouses at risk for the same diseases due to their partners working in the industry?
A screening of current and former taconite workers and their spouses was conducted in 2010-11 and revealed x-ray evidence of dust-related scarring of the lung and lung lining (pleura) in workers.
There was a link from EMP exposure in workers to scarring of the pleura. Spouses of taconite workers had comparable evidence of lung scarring on chest x-ray,
to what’s been reported for the broader general public. Conclusions The studies identified links to mesothelioma from working in the taconite industry and exposure to
EMPs. The role of a specific EMP type of exposure is not clear. The overall risk for mesothelioma
is low compared to other disease frequencies. Taconite worker spouses, as a group, showed a low
frequency of lung disease on chest x-ray, comparable to the general population.

8
The authors of this report have made recommendations for taconite workers, the mining companies,
unions and the Iron Range health care community, designed to assist in the safeguarding of future worker health. The complete report may be found at www.taconiteworkers.umn.edu. You may direct questions about the study to 800-646-9255.

9
II. Taconite Workers Health Study
Executive Scientific Summary
The Taconite Workers Health Study (TWHS) was funded by the State of Minnesota and began in
2008. The study was conducted in response to earlier findings by the Minnesota Department of
Health (MDH), which described an apparent excess of mesothelioma within a cohort of iron ore
workers. The taconite cohort originated from work done at the University of Minnesota (UMN) in
the 1980s. At that time, all workers in the iron ore industry were identified, and included around
68,000 individuals from both taconite and hematite industries. The original cohort and subgroups
have been used in several studies contained in this report. This is the final report to the legislature
on the main questions asked of the study investigators in 2008 and for which these studies were
designed.
An apparent excess of mesothelioma within the taconite cohort was identified by linking the cohort
to the state’s cancer surveillance system. Mesothelioma is considered a “sentinel disease,” in that its
presence suggests the possibility of other diseases occurring from the same exposure. Almost
always, the exposure related to mesothelioma is asbestos, referred to in this report as elongate
mineral particles (EMPs) of the asbestiform type. A prevalent mineralogy unique to the eastern
Mesabi Range is the non-asbestiform EMP.
Since EMPs of the asbestiform type are also strongly related to lung cancer and lung scarring, also
known as non-malignant respiratory disease (NMRD), UMN researchers thought that all of these
diseases should be evaluated. Unfortunately, no one study design accounts for all of these
conditions. Accordingly, the research team developed a multi-pronged strategy which included the
following study designs: 1) an assessment of the major exposures from dust in taconite operations
(EMPs, silica and respirable dust) 2) a mortality (cause-of-death) study to examine a variety of
diseases and their frequency 3) an incidence study for all cancer types 4) mesothelioma and lung
cancer case-control studies where exposures to dusts from the workplace could be studied in more
detail and 5) a medical screening of current and former workers (and spouses) for NMRD. This last
study included information on other exposures and on smoking. Although all of these study types
are important, the case-control studies are generally accepted as the most insightful investigations.
Collectively, all of these studies form the TWHS. Additional investigations were conducted by the
Natural Resources Research Institute (NRRI) and were done to characterize exposures in the non-
working community. The final NRRI report will be submitted under separate cover.
The collective TWHS approach was designed to answer three specific questions:
1. Is working in the taconite industry associated with mesothelioma and/or other diseases,
respiratory and non-respiratory?
2. What factors, particularly exposure to dust from taconite operations, are associated with
mesothelioma and other respiratory diseases?
3. Are spouses of taconite workers at risk for respiratory diseases as a result of their partners
working in the industry?
As of this writing, we are providing insights to each of these questions. As in most investigations of
this nature, this work has also raised additional questions, which go beyond the original scope of
10
this work. Several of these new issues are being pursued through additional grant procurement or
are mentioned in the list of recommendations at the end of the Executive Summary.
These are the unique findings from each of the TWHS components:
Occupational exposure assessment
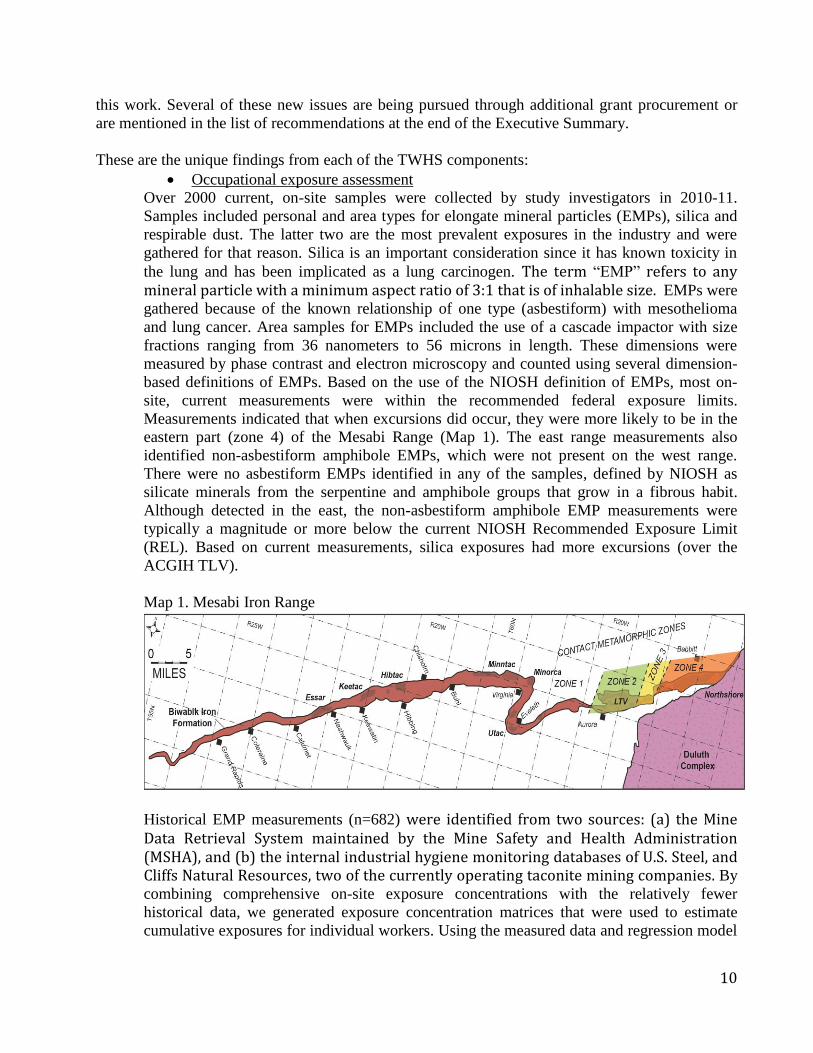
Over 2000 current, on-site samples were collected by study investigators in 2010-11.
Samples included personal and area types for elongate mineral particles (EMPs), silica and
respirable dust. The latter two are the most prevalent exposures in the industry and were
gathered for that reason. Silica is an important consideration since it has known toxicity in
the lung and has been implicated as a lung carcinogen. The term “EMP” refers to any mineral particle with a minimum aspect ratio of 3:1 that is of inhalable size. EMPs were
gathered because of the known relationship of one type (asbestiform) with mesothelioma
and lung cancer. Area samples for EMPs included the use of a cascade impactor with size
fractions ranging from 36 nanometers to 56 microns in length. These dimensions were
measured by phase contrast and electron microscopy and counted using several dimension-
based definitions of EMPs. Based on the use of the NIOSH definition of EMPs, most on-
site, current measurements were within the recommended federal exposure limits.
Measurements indicated that when excursions did occur, they were more likely to be in the
eastern part (zone 4) of the Mesabi Range (Map 1). The east range measurements also
identified non-asbestiform amphibole EMPs, which were not present on the west range.
There were no asbestiform EMPs identified in any of the samples, defined by NIOSH as
silicate minerals from the serpentine and amphibole groups that grow in a fibrous habit.
Although detected in the east, the non-asbestiform amphibole EMP measurements were
typically a magnitude or more below the current NIOSH Recommended Exposure Limit
(REL). Based on current measurements, silica exposures had more excursions (over the
ACGIH TLV).
Map 1. Mesabi Iron Range
Historical EMP measurements (n=682) were identified from two sources: (a) the Mine Data Retrieval System maintained by the Mine Safety and Health Administration (MSHA), and (b) the internal industrial hygiene monitoring databases of U.S. Steel, and Cliffs Natural Resources, two of the currently operating taconite mining companies. By
combining comprehensive on-site exposure concentrations with the relatively fewer
historical data, we generated exposure concentration matrices that were used to estimate
cumulative exposures for individual workers. Using the measured data and regression model

11
estimates, we reconstructed the exposure for each similar exposure group (SEG) for each
mine and for each year between 1955 and 2010 for all three exposure types. Based on these
estimates, EMP exposures were likely to have been higher in the earlier days of the industry.
This exposure information was then used in the case-control and Respiratory Health Survey
studies.
Occupational cohort mortality study
To obtain a general picture of mortality in the cohort, a standardized (by age and gender)
analysis of the causes of death was undertaken for those individuals who worked a year or
more in the taconite industry and who were born in 1920 or later. Approximately 31,000
individuals were included in this investigation. This study did not contain information on
exposure measurements or smoking. Three causes of mortality were significantly higher
than expected, compared to causes of death for the rest of Minnesota, not including the
counties that include the Mesabi Range. These included mesothelioma, lung cancer and
cardiovascular death. Mesothelioma was a rare disease in comparison to other disease frequencies in the cohort. These three diseases were all elevated at sites across the Mesabi
Range.
Cancer incidence study
A standardized incidence ratio (SIR) analysis was undertaken for the cohort, to determine
cancer morbidity using the Minnesota Cancer Surveillance System (MCSS). This added to
the mortality analysis because it included people who were diagnosed with cancer but living
for study purposes and allowed an analysis of more detailed subtypes of cancer. A total of
5,700 cancers were identified in the study cohort including 51 mesotheliomas and 973 lung
cancers. The incidence of cancer types in the cohort was compared to that of other
Minnesotans. After adjusting for out-of-state migration, the SIR for lung cancer and
mesothelioma was 1.3 (95% CI: 1.2-1.4) and 2.4 (95% CI: 1.8-3.2) respectively. Other
elevated cancers included stomach (SIR = 1.4, 95% CI: 1.1-1.6), laryngeal (SIR = 1.4, 95%
CI: 1.1-1.7), and bladder (SIR = 1.1, 95% CI: 1.0-1.2). Adjusting with a bias factor for
smoking attenuated the lung cancer SIR (SIR = 1.1, 95% CI: 1.0-1.1). No variation in risk
was seen for subtypes of lung cancer.
Mesothelioma case-control study
This case-control study originated within the occupational mortality cohort (nested study). It
was designed to evaluate whether exposures from within the taconite industry, specifically
EMPs, could explain some or all of the excess number of mesotheliomas. For 57 cases that
worked in the taconite industry, each year worked in the industry resulted in a 3% increase
of mesothelioma frequency. Cumulative exposure to EMPs (NIOSH 7400 definition) was
associated with a 10% increase in mesothelioma for each EMP/cc/year of employment. One
EMP/cc/year could be 10 years of average exposure to 0.1 EMP/cc or 1 year of average
exposure to 1.0 EMP/cc. This finding was marginally significant, statistically. There were
approximately twice the numbers of cases for the group in the upper exposure range
compared to the lower range, using the median exposure as the dividing point. Assessing the
impact of small fibers was complicated by a high correlation with other EMP definitions.
Lung cancer case-control study

12
This case-control study originated within the occupational mortality cohort (nested study). It
attempted to identify exposures from within the taconite industry that could explain some or
all of the excess number of lung cancers. Cases and controls were assessed for exposure to
EMPs and to silica, both of which have been associated with risk for lung cancer in other
studies. Lung cancer cases (n=1706) were identified through the cohort mortality study and
through linkage with the Minnesota Cancer Surveillance System. Through the latter case
identification process, histological cell type was available for each lung cancer for 973
cases. For the overall lung cancer group, exposure to EMPs and silica were not associated
with cases. For the cell-specific group, no cell type was associated with these exposures.
Evaluation by work location on the Mesabi Range (east vs. west range) did not reveal
significant differences. Smoking information was not available for this study.
Respiratory Health Survey (RHS)
In order to better understand the most typical exposures in the industry and their impact on
common lung conditions, a screening of current and former taconite workers was conducted.
This study utilized data obtained by the exposure assessment (above). Smoking information
was also available through the use of an occupational/medical questionnaire. The screening
included spouses of workers, to assess the likelihood of “take-home” exposures. There were
1188 workers who participated and 496 spouses in the complete screening
(occupational/medical history, pulmonary function testing and chest x-ray). Within the
worker group restrictive lung function on spirometry, an indication of dust exposure
occurred in 4.5 % of those workers screened. Obstructive lung function occurred in 16.8%
with another 2.9% having mixed (obstructive and restrictive) function. Chest x-ray
abnormalities, defined by a consensus of two B-readers, suggested that abnormalities of the
lung substance, another indication of dust exposure, occurred in 5.4% of those workers
screened. Also in workers 16.7% demonstrated pleural abnormalities. Spousal chest x-rays
showed 0.6% parenchymal findings and 4.5% pleural abnormalities, suggesting a similar
amount of abnormalities as described within the general population (Appendix 8).
Associations with cumulative silica and respirable dust, using onsite and historical estimates,
were not revealing. Exposure to EMP was associated with pleural abnormalities, most likely
suggesting exposure to asbestiform EMPs in the past.
Original Questions of Interest:
1. Is working in the taconite industry associated with mesothelioma and/or other diseases,
respiratory and non-respiratory?
The mortality and cancer incidence investigations were important in assessing whether other
diseases were occurring in excess within the entire industry of taconite workers. In the mortality
study, excesses were found for mesothelioma, lung cancer and cardiovascular mortality (specifically
from ischemic heart disease). (Mesothelioma most often occurs in the setting of asbestiform EMP
exposure and is addressed in question 2.) Lung cancer has a high attributable risk from smoking,
which in other studies accounts for 80% or more of cases. The case-control study of lung cancer,
where workplace exposures were evaluated in detail, did not show EMP or silica exposure
associated with the lung cancer cases. Increased cardiovascular mortality was an unexpected
finding, given that most work forces are healthier than the general population and usually have
lower cardiovascular mortality than the reference population. This finding could indicate that a
lifestyle issue is contributing to cardiovascular mortality but could also indicate exposure to small

13
particulates, which have recently been found to increase mortality from this disease. It was not
investigated further. Other causes of death were comparable to the overall Minnesota population. In
the cancer incidence evaluation, other disease categories that occurred higher than expected
included laryngeal, bladder and stomach. The first two also have associations with smoking but
bladder cancer has also been associated with some occupational exposures (certain dyes). Asbestos
has been included in this group, although the suggestion for additional research by the investigators
was made (Silverman, 1989(1)
). Stomach cancer studies have shown the strongest risk factor to be
from H. pylori infection with smoking also playing a role (Shibata and Parsonnet, 2006(2)
. An
occupational basis for stomach cancer has not been demonstrated. Other than these disease
categories, with the likely explanations above, the cohort did not have higher observed numbers of
death or other cancers compared to a Minnesota population of the same age and gender.
2. What factors, particularly exposure to dust from taconite operations, are associated
with mesothelioma and other respiratory diseases?
Study findings suggest that mesothelioma risk is linked to length of time employed in the industry.
The role of specific dusts from taconite operations in the mesothelioma cases is less clear. An
association with exposure to EMPs (type not specified) was demonstrated with twice the number of
mesotheliomas occurring in the high exposure group vs. the low. Because mesothelioma is a rare
disease it is helpful to consider these results in the context of lifetime risk of mesothelioma. An
average person who lives to be 80 years old has on average a 0.144 percent chance of developing
mesothelioma in their lifetime, or about 1.4 cases per 1,000 individuals. A taconite miner who
worked for 30 years in the taconite industry has on average a 0.333 percent chance of getting
mesothelioma in their lifetime or about 3.33 cases per 1,000 taconite miners working for 30 years
and living to be 80 years old. Even though attempts were made to control for the effect of commercial asbestos exposure, the investigators were not able to state with certainty that the
association with EMPs and mesothelioma was related to the ore dust or to the use of commercial
asbestos or both. The predominant exposure in this industry is to shorter, non-asbestiform EMPs, in
the range of 1-3 microns (µm) in length. EMPs in this category have been described as less
pathogenic than longer, asbestiform EMPs. However, in this study we found that shorter EMPs
were highly correlated with longer EMPs, making it difficult to determine size-related effects.
Analyses of where cases worked showed higher rates for mesothelioma in the western most portion
of the Mesabi Iron Range (zones 1 and 2) compared to east. However, this finding did not correlate
with the exposure concentrations that were measured and/or estimated in the east and west range
plants and remains unexplained. Exposure to dust from taconite operations as a cause of the excess
lung cancer is not supported by the case-control study for lung cancer. In that study, no significant
relationship was found between the case group (lung cancer) and cumulative EMP exposure. There
was an association found between pleural abnormalities in current and former taconite workers
(Respiratory Health Survey) and cumulative EMP exposure that could indirectly support the
mesothelioma-cumulative EMP association. The importance of this finding in support of the
mesothelioma cases having a potential association to dusts from taconite operations requires further
evaluation.
(1)Silverman DT, Levin LI, Hoover RN. Occupational risks of bladder cancer in the United States: I. White men. J Natl Cancer Inst 1989, 81:1472-
1480
(2)Shibata A, Parsonnet J. Chapter 37: Stomach Cancer. In Cancer Epidemiology and Prevention, 3rd Edition (2006). Edited by Schottenfeld and Fraumeni. Oxford University Press. New York, N.Y. Pages 707-720

14
3. Are spouses of taconite workers at risk for respiratory diseases as a result of their
partners working in the industry?
Based on the screening findings from the Respiratory Health Survey, spouses had a low prevalence
of chest x-ray and spirometry abnormalities. There was no indication that spouses had high
exposures to dusts generated from mining based on findings measured by spirometry and chest x-
ray. Although exposures in the communities could obviously have changed over the years, the
current exposure potential in the communities appears to be low, based on these findings.
Given the combined assessments from all TWHS investigations, the following recommendations
are suggested:
1. If not currently being undertaken, comprehensive exposure assessment and monitoring for
the major exposures in the industry should be done routinely for a broad cross-section of
workers.
2. If not already in place, electronic data systems that involve exposure monitoring and
employment (e.g. job groupings) should be updated with the idea of using these data for
future epidemiological purposes.
3. Given the rate of death from cardiovascular disease, efforts to control known risk factors
should be made by the companies, unions and communities. Consideration of the potential
for cardiovascular disease to be related to dust exposure should be made.
4. The cause of death study should be updated every five years or so, using the existing
mortality statistics available from the Minnesota Department of Health.
5. The state’s cancer surveillance system (MCSS) should update the cohort’s mesothelioma
and lung cancer listing periodically. This could be done as a routine function of MCSS,
without the incorporation of more complicated exposure data. Depending on the frequency
of findings from this investigation, additional exposure-disease studies could be considered.
6. Given the known hazards in mining, the process of avoiding exposures generated in the
mining and processing of taconite ore is critical. Exposure avoidance is the most effective
way to minimize disease risk. Improvement in engineering exposure control technology
should continue to be a priority. Educational activities involving the use of personal
protective equipment (PPE) should also continue. The use of PPE in unusual circumstances
where exposure potential is high and/or unknown should be included in these activities.
Consideration should be given to mandatory use of PPE in high-exposure circumstances, if
not in effect already.
7. Given the potential for lung disease to be impacted by workplace exposures and smoking, a
comprehensive approach should be placed on smoking cessation, if this is not already in
place.
8. Given the higher potential for dust-related lung disease in this industry, consideration should
be given to an evaluation of existing medical surveillance (monitoring) programs with an
emphasis on participation rates by exposure potential categories. This could include an
independent review of existing company chest x-rays, by experienced B-readers, to further
clarify the magnitude of NMRD in workers.
9. Consideration should also be given to identifying a post-1982 cohort and evaluating it with
exposure and epidemiology approaches.
10. In view of community health concerns, a reevaluation of spouses should be considered in the
future.

15
III. Taconite Workers Health Study
Exposure Assessment Study (component summary)
The workplace exposure assessment strategy was to gather exposure information from all existing
mining sites that could be used in epidemiologic investigations. This was done using a combination
of current, on site measurements, historical measurements taken by the mining companies and
measurements obtained by the Mining Safety and Health Administration as part of their regulatory
function. Exposure assessment involved three major exposures that included elongate mineral
particles (EMPs), respirable dust and respirable silica.
The three main goals for the exposure assessment effort related to EMPs were:
1. Assess present-day exposures of workers to EMPs in dust from taconite operations in
relation to current occupational exposure limits;
2. Assess historical exposures of workers to EMPs in the taconite industry for the time period
1955-present;
3. Evaluate existing practices and methods to reduce worker exposures in this industry and,
where appropriate, suggest improvements in these methods.
Present day exposures to EMPs are addressed in Hwang et al., 2013 (Appendix 1). Briefly, 28
unique, similarly exposed work groups (SEGs) were established from approximately 180 job
descriptions. The SEGs were consistent across all mines. Personal samples were collected for
exposures at six active mines in the Mesabi Iron Range for each of the 28 SEGs. The samples were
analyzed using the NIOSH 7400 method (phase contrast microscopy) along with the NIOSH 7402
method (transmission electron microscopy) for 20% of the samples. Methods incorporated
additional methods to distinguish amphibole from non-amphibole EMPs and, if amphibole, whether
they were asbestiform or non-asbestiform types. (Some of these methods were for study purposes
and did not represent the approach used in the regulation of EMPs.) Findings from these samples
(n=1298) indicated that, for many SEGs in several mines, the exposure levels of total EMP were
higher than the NIOSH Recommended Exposure Limit (REL) for EMPs. However, the total EMP
classification does not necessarily refer to regulated asbestiform EMP because the NIOSH 7400
method can’t differentiate between asbestiform and non-asbestiform EMPs. In fact, there were no
asbestiform EMPs identified in any of the onsite samples. The concentrations of amphibole EMPs
were well-controlled across all mines and were a magnitude lower than the concentrations of total
EMPs, indicating that amphibole EMPs are not major components of taconite EMPs (Figures 1 and
2). Although the eastern Mesabi Iron Range was the only area where amphibole EMP was found,
the levels were all under the recommended exposure limit.
Different dimensions of elongate mineral particles (EMPs) have been proposed as being relevant to
respiratory health end-points such as mesothelioma and lung cancer. A methodology for converting
personal EMP exposures measured using the NIOSH 7400/7402 methods to exposures based on
other size-based definitions was developed (Hwang et al., 2014; appendix 2). The highest fractions
of EMP concentrations were found for EMPs that were 13 µm in length and 0.2 0.5 µm in width.
Therefore, the current standard NIOSH method 7400, which only counts EMP > 5 µm in length and
≥ 3 in aspect ratio, will underestimate shorter EMP exposures. At the same time, there was a high
degree of correlation between the exposures estimated according to the different size-based metrics.

16
The second major component of the exposure assessment involved the reconstruction of historical
EMP measures, also to be used for epidemiologic purposes. A person’s total exposure was
comprised of the current exposure plus their historical exposure, summed to provide a cumulative
exposure measure (EMP/cc/years). Some of the historical data for EMP measurements involving
early time periods were sparse. This was particularly true for the time prior to the regulatory era
(pre-1970s). This was also a time when exposure control methodology was not as effective as
current control methods. This suggested that exposures were likely to have been higher in the earlier
part of the taconite industry’s history. Around 700 historical EMP measurements were extracted
from databases maintained by the mining companies and the Mine Safety and Health
Administration (MSHA). The NIOSH 7400 method was used to estimate total cumulative EMP
exposure. Using the measured data with regression model estimates for those times where
measurements were not present, exposures were reconstructed for each SEG by mine for each year
between 1955 and 2010 (Hwang et al., 2014; Appendix 2). Results of this approach showed
sizeable slope, indicating significant time dependency.
The third major component of the exposure assessment involved the measures of exposures to
respirable dust (RD) and respirable silica (RS) (Appendix 3). Personal samples (n=679) were
collected to assess the present-day exposure levels of workers to RD and RS at the six active
taconite mines. RD and RS concentrations were measured using NIOSH 0600 and NIOSH 7500
methods, respectively. The concentrations of RD in all mines fell below the ACGIH TLV. The
concentrations of RS in crushing and concentrating processes were higher than those measured in
the other mining processes, and some were higher than the ACGIH TLV for RS. The highest
concentrations of RS were generally found in the crushing departments for all mines. The
concentrating department may have reduced the levels of RS significantly, as well as lowered the
percentage of quartz in RD in the pelletizing department. There was little to no variability between
the six mines for either RD or RS exposures because the taconite mining and milling processes are
similar across all mines. Reconstruction of historical exposures to respirable dust and silica was
carried out in a manner similar to that for EMPs. As in the case of EMPs, the historical
measurements made by the companies were fewer compared to the onsite comprehensive exposure
assessment carried out as part of this study.
In these surveys, we also evaluated the efficacy of existing exposure control measures including
primary engineering controls (enclosures, ventilation, and particle collectors), work practice and
administrative controls, and personal protective equipment. We toured the control systems of all
the mines. We measured air velocity into selected enclosures and in selected ducts in four mines,
and have compared our findings to the American Conference of Government Industrial Hygienists
(ACGIH) ventilation guidelines. In general, the types of installed controls match ACGIH
guidelines, although the velocity into some enclosures is lower than recommended. We have arrived
at the following conclusions: (a) Engineering controls are appropriate for normal operations; (b)
Miners may be exposed to elevated dust levels when making repairs or performing maintenance; (c)
Atypical conditions may lead to significant exposures, and respiratory protection should be used
under atypical conditions that contribute to excessive exposures whenever feasible.

17
Figure 1. Box plot of total EMP for each SEG in mines A–F (the horizontal line indicates the
NIOSH REL for EMP = 0.1 particles cm−3).

18
Figure 2. Scatter plot of amphibole EMP concentrations for each SEG in mines A-F (the horizontal
line indicates the NIOSH REL for EMP = 0.1 particles/cm3
(A)
EM
P c
on
ce
ntr
ation
(pa
rtic
les/c
m3)
Crushing Mining
Concentrating
Pelletizing
Shop Stationary Shop mobile Office
(B)
EM
P c
on
ce
ntr
ation
(pa
rtic
les/c
m3)
Crushing Mining
Concentrating
Pelletizing
Shop
Stationary Shop mobile Office
(D)
EM
P c
on
ce
ntr
ation
(pa
rtic
les/c
m3)
Crushing Mining
Concentrating
Pelletizing
Shop
Stationary Shop mobile Office
(C)
EM
P c
on
ce
ntr
ation
(pa
rtic
les/c
m3)
Crushing Mining
Concentrating
Pelletizing
Shop
Stationary Shop mobile Office
EM
P c
on
ce
ntr
ation
(pa
rtic
les/c
m3)
(E)
Crushing Mining
Concentrating
Pelletizing
Shop
Stationary Shop mobile Office
EM
P c
on
ce
ntr
ation
(pa
rtic
les/c
m3)
(F)
Crushing Mining
Concentrating
Pelletizing
Shop
Stationary Shop mobile Office
NIOSH REL= 0.1
19
IV. Taconite Workers Health Study
Mortality Study (component summary)
The goal of the mortality study was to determine the causes of death among the taconite mining
cohort. This provided a measure of which diseases miners died from and the relative frequencies of
these causes of death. Mortality studies are generally useful types of investigations to get a
perspective of a group’s mortality experience and to see if people in the group are dying from any
disease category more often than those in a comparison group. This study did not use specific
exposure measurements nor did it have smoking information available.
The detailed report for this study is included in the appendices (Allen et al., 2014; Appendix 4).
This study first determined the vital status of each member of the cohort. For those who died, death
certificates were obtained from the state health departments where the death occurred. Once the
death certificate was obtained, the causes of death were categorized in a standardized way. The
standardized mortality ratio (SMR) was determined, based on the observed number of deaths within
a disease category compared to the age, sex and disease specific expected numbers of death in the
general population of Minnesota. An SMR greater than 1.0 implies more deaths in the cohort than
expected. An SMR less than 1.0 implies fewer deaths in the cohort than expected. If the 95%
confidence interval excludes one, the finding is statistically significant.
Mortality was evaluated between the years 1960 and 2010 for all miners employed by one of the
existing mining companies in 1983. The cohort included 31,067 workers with at least one year of
employment. Among this group, there were 9094 deaths in total, 949 of which were from lung
cancer and 30 were from mesothelioma. The “all-cause” mortality was higher than expected, with
an SMR of 1.04 (95% CI=1.02-1.04). Mortality was also higher than expected for mesothelioma,
which had an SMR of 2.77 (95% CI=1.87-3.96). The SMR for trachea/bronchus/lung cancer in this
cohort of miners was 1.16 (95% CI=1.09-1.24). The death rate for cardiovascular disease was 1.10
(95% CI=1.06-1.14), including hypertensive heart disease (SMR=1.81, 95% CI=1.39-2.33) and
ischemic heart disease (SMR=1.11, 95% CI=1.07-1.16). These findings did not vary by duration of
employment in this analysis. The frequency of mesothelioma deaths was low in comparison to other
disease frequencies. The vast majority of remaining disease categories occurred as expected (Table
IV-1).
This study provides evidence that taconite workers may be at increased risk for mortality overall
and more specifically from lung cancer, mesothelioma, and cardiovascular disease. Occupational
exposures during taconite mining operations may be associated with these increased risks, but non-
occupational exposures may also be important contributors. Additional investigation of the
cardiovascular disease findings appears warranted and risk factor reduction strategies for
cardiovascular diseases should be considered further.

20
Table IV-1. Selected SMRs for Minnesota Taconite Workers with ≥ 1 year employment*
Underlying Cause of Death Observed Expected SMR 95% CI
All Causes 9,094 8,764.69 1.04 1.02-1.06
All Cancers 2,710 2,609.86 1.04 1.00-1.08
Respiratory 981 846.74 1.16 1.09-1.23
Larynx 26 23.84 1.09 0.71-1.60
Trachea, bronchus, lung 949 815.67 1.16 1.09-1.24
Pleura 1 1.81 0.55 0.01-3.08
Mesothelioma 30 10.82 2.77 1.87-3.96
Heart diseases 2,676 2,435.81 1.10 1.06-1.14
Hypertensive heart disease 62 34.17 1.81 1.39-2.33
Ischemic heart disease 2,185 1,964.93 1.11 1.07-1.16
Cerebrovascular disease 391 384.30 1.02 0.92-1.12
Hypertension w/o heart disease 35 52.80 0.66 0.46-0.92
Respiratory Diseases 582 621.19 0.94 0.86-1.02
COPD 363 369.89 0.98 0.88-1.09
Asbestosis 1 2.90 0.35 0.01-1.92
Silicosis 1 1.09 0.91 0.02-5.09
Transportation injuries 339 329.15 1.03 0.92-1.15
Other injury 239 221.75 1.08 0.95-1.22
Violence 289 258.41 1.12 0.99-1.26
*adjusted for age, calendar period, and sex

21
V. Taconite Workers Health Study
Cancer Incidence Study (component summary)
The purpose of this investigation was to evaluate cancer morbidity among Minnesota Taconite
mining industry workers. This assessment is designed to evaluate all cancers, including those
which may be successfully treated. The full report is contained in Appendix 5.
Cancer morbidity between 1988 and 2010 was evaluated in a cohort of 40,720 Minnesota taconite
mining workers employed between 1930 and 1983 and who were alive at the beginning of the
state’s cancer surveillance system in 1988. Standardized incidence ratios (SIRs) with 95%
confidence intervals (CI) were determined by comparing observed numbers of incident cancers with
frequencies in the Minnesota Cancer Surveillance System. SIRs for lung cancer by histological
subtypes were also estimated. SIRs were adjusted to account for out-of-state migration and a bias
factor was estimated to adjust smoking related cancers. An SIR greater than 1.0 implies more
disease than expected; an SIR less than 1.0 implies less disease than expected. If the 95%
confidence interval excludes 1.0, the finding is statistically significant.
A total of 5,700 cancers were identified in the study cohort including 51 mesotheliomas and 973
lung cancers. After adjusting for out-of-state migration, the SIR for lung cancer and mesothelioma
was 1.3 (95% CI: 1.2-1.4) and 2.4 (95% CI: 1.8-3.2) respectively. Other elevated cancers included
stomach (SIR = 1.4, 95% CI: 1.1-1.6), laryngeal (SIR = 1.4, 95% CI: 1.1-1.7), and bladder (SIR =
1.1, 95% CI: 1.0-1.2) (Table V-1). Among the lung cancers, SIRs for adenocarcinoma (SIR = 1.2,
95% CI: 1.1-1.4), squamous cell (SIR = 1.3, 95% CI: 1.2-1.5) non-specified (SIR = 1.6, 95% CI:
1.4-1.8), and other (SIR = 1.4, 95% CI: 1.1-1.8) were elevated. This study did not have information
available for smoking. Instead, an adjustment was made with a bias factor for smoking. This
attenuated the lung cancer SIR (SIR = 1.1, 95% CI: 1.0-1.1).
Taconite workers have an increased cancer incidence for mesothelioma, lung, laryngeal, stomach
and bladder cancer. Adjustment for smoking attenuates but does not completely eliminate the lung
cancer risk in this population. Bladder cancer may be occupational in origin and has been linked to
certain dyes as well as smoking. Asbestos has a weak link to bladder cancer and is questionably
related causally. Stomach cancer studies have shown the strongest risk factor to be from H. pylori
infection with smoking also playing a role. Asbestos has been shown to be a risk factor in some
studies although a strong occupational basis for stomach cancer has not been demonstrated. Other
than these disease categories, with the likely explanations above, the cohort did not have higher
observed numbers of other cancers compared to a Minnesota population of the same age and
gender. The extent to which mining-related exposures contribute to disease burden for
mesothelioma and lung cancer was further investigated in the case-control study.
.

22
Table V-1. Selected SIRs for Minnesota Taconite Workers
Cancer Observed Expected SIR* 95% CI
Mesothelioma 51 21.1 2.4 1.8-3.2
Lung 973 750.9 1.3 1.2-1.4
Esophagus 87 76.9 1.1 0.9-1.4
Kidney 170 178.2 1.0 0.8-1.1
Larynx 94 68.6 1.4 1.1-1.7
Liver & bile duct 52 49.4 1.1 0.8-1.4
Oral 172 162.5 1.1 0.9-1.2
Pancreas 120 105.9 1.1 0.9-1.4
Stomach 105 77.7 1.4 1.1-1.6
Bladder 363 338.5 1.1 1.0-1.2
*Adjusted for age, gender, calendar period, and out-of-state migration

23
VI. Taconite Workers Health Study
Mesothelioma Case-Control Study (component summary)
A detailed evaluation of mesothelioma cases and exposures was performed, the full report for which
is in Appendix 6. The goals for this component included the following:
1. To examine the association between length of work in the taconite mines and the risk of
mesothelioma.
2. To examine the association between exposure to EMPs in taconite mining and the risk of
mesothelioma, looking at overall EMP exposure and EMP exposure within each geological
zone to see if geological differences along the Mesabi Range impact mesothelioma risk.
This initial part of this evaluation required the identification of all cases in the mortality study and
combining these with cases identified in the Minnesota Cancer Surveillance System from 1988
onward. From these sources, 80 cases were identified. Four controls were selected from the
taconite cohort for each case, matched on age and without evidence of mesothelioma at the time of
the case diagnosis or death. A detailed assessment of exposure to elongate mineral particles (EMP)
was made in cases and controls, using the exposure approach described in Hwang et al., 2013. In
short, data from exposure monitoring and work histories were combined to estimate the cumulative
EMP exposures in case and control groups. Work history information was available from the 1950s
through 1982 and was originally abstracted by University of Minnesota investigators in the 1980s.
This information was used in the current investigation after records were reassessed. In the current
investigation, attempts were made to exclude time worked in the hematite mining industry, which
preceded the taconite industry and for which no exposure information was available. This study did
not have information available on smoking, but smoking is not associated with mesothelioma.
Results indicated that the rate for mesothelioma was related to years of employment in the industry
(Table VI-1). For each year worked the risk for mesothelioma increased by 3%. For workers who
worked 20 years, their rate for mesothelioma would equate to a 60% increase.
An analysis of mesothelioma risk by EMP concentration was undertaken. The EMPs in this
analysis were measured by the NIOSH 7400 method, which counts all EMP over 5 microns (µm) in
length, 0.25 µm or more in diameter, with an aspect ratio (ratio of length to width) of 3:1 or greater.
Exposures were estimated across all sites and by specific mineralogical zone (Table VI-2). Results
suggested higher EMP exposures in the eastern-most mineralogical zone.
The rate ratio (RR) for mesothelioma across all sites was increased about 10% for each
(EMP/cc/year of exposure (Table VI-3). With this metric, an individual exposed to 1 EMP/cc/year
has a 10% increase in the RR. This could be a workplace average of 1.0 EMP for one year or 0.1
EMP for 10 years. This finding was of borderline statistical significance. When assessed by high
EMP exposure category (greater than or equal to the median exposure) vs. low exposure category
(less than the median), the risk nearly doubled. Because mesothelioma is a rare disease it is helpful
to consider these results in the context of lifetime risk of mesothelioma. An average person who
lives to be 80 years old has on average a 0.144 percent chance of developing mesothelioma in their
lifetime, or about 1.4 cases per 1,000 individuals. A taconite miner who worked for 30 years in the
taconite industry has on average a 0.333 percent chance of getting mesothelioma in their lifetime or
about 3.33 cases per 1,000 taconite miners working for 30 years and living to be 80 years old.

24
Analysis by zone indicated a higher RR in the western-most zones. However, the west was
measured to have had the lowest exposure, bringing into question the possibility of uncontrolled
confounding in this assessment. These RRs were adjusted for age, employment in hematite,
potential for commercial asbestos exposure, and exposures in other zones.
Table VI-1. Overall and zone-specific rate ratio estimates for mesothelioma by years of
employment in taconite
Cases Controls RR
1 95% CI
2
Taconite Years 57 184 1.03 1.00-1.06
Any hematite 48 212 0.99 0.94-1.04
High3 vs. low
Low employment High employment
28
29
97
87
1.00
1.15
--
0.62-2.11
Years employment (tertiles)
< 2 years (REF)
>2 to < 12 years
12+ years
16
17
25
66
55
63
1.00
1.45
1.78
--
0.64-3.27
0.84-3.75
Zone 1 Taconite years 184
744
1.05 1.00-1.11
Zone 2 Taconite years 314
584
1.06 1.02-1.09
Zone 4 Taconite years 124
664
0.97 0.92-1.02
1 The rate ratio is interpreted as the relative increase in the frequency of mesothelioma associated with a one unit
increase in the exposure for continuous measures of exposure, e.g. years of employment, or compared to the reference
category (designated as 1.0). The rate ratio was adjusted for age, and years of employment in hematite. 2 95% CI= 95% confidence interval
3 The high group represents workers with employment duration greater than that of the case median duration
4 Cases and controls may have worked in more than one zone
In this analysis, attempts were made to assess other exposure definitions, since the most common
exposure was to shorter EMPs. It was found that the other definitions, which included the Suzuki
definition, the Chatfield and the cleavage fragment were all highly correlated, which limited further
understanding of the role these size-specific EMPs may have played. Also in question was the role
of asbestiform vs. non-asbestiform EMP. The former, although more pathogenic, cannot be
identified with the NIOSH 7400 measurement method. No asbestiform EMP was found in the
onsite occupational exposure assessment (above). Another limitation of this analysis was the lack of
measured data on exposure to commercial asbestos, which would also be measured by the NIOSH
7400 method, is not distinguishable from the other EMP types using that method, and may have
played a role in the elevated RR in this investigation.
In summary the results from this case-control study suggested an association between duration of
employment in the taconite industry and risk of mesothelioma. There was also an association with
mesothelioma and exposure to cumulative EMPs, as measured by the NIOSH 7400 method. Due to

25
high correlations between the different EMP definitions, the specific details of size and type of
EMP exposure (asbestiform, non-asbestiform) could not be further ascertained. The potential for
residual effects from exposure to commercial asbestos in the taconite industry or elsewhere could
not be entirely ruled out.
Table VI-2. Overall and zone specific cumulative exposure estimates (EMP/cc-year) for
mesothelioma cases and controls who ever worked in taconite operations1,2
1 Measured by NIOSH 7400 method
2 Cases and controls may have worked in more than one zone.
3 Cumulative exposures for the median and 75
th percentile were expressed as EMP/cc/year.
Cases Controls
N Median
3 75th
Percentile3 N Median
3 75th
Percentile3
Overall 57 1.15 2.95 184 0.24 2.63
Zone 1 18 0.22 0.73 74 0.12 0.18
Zone 2 31 1.88 2.95 58 0.58 2.61
Zone 4 12 1.10 3.23 66 2.09 5.97
26
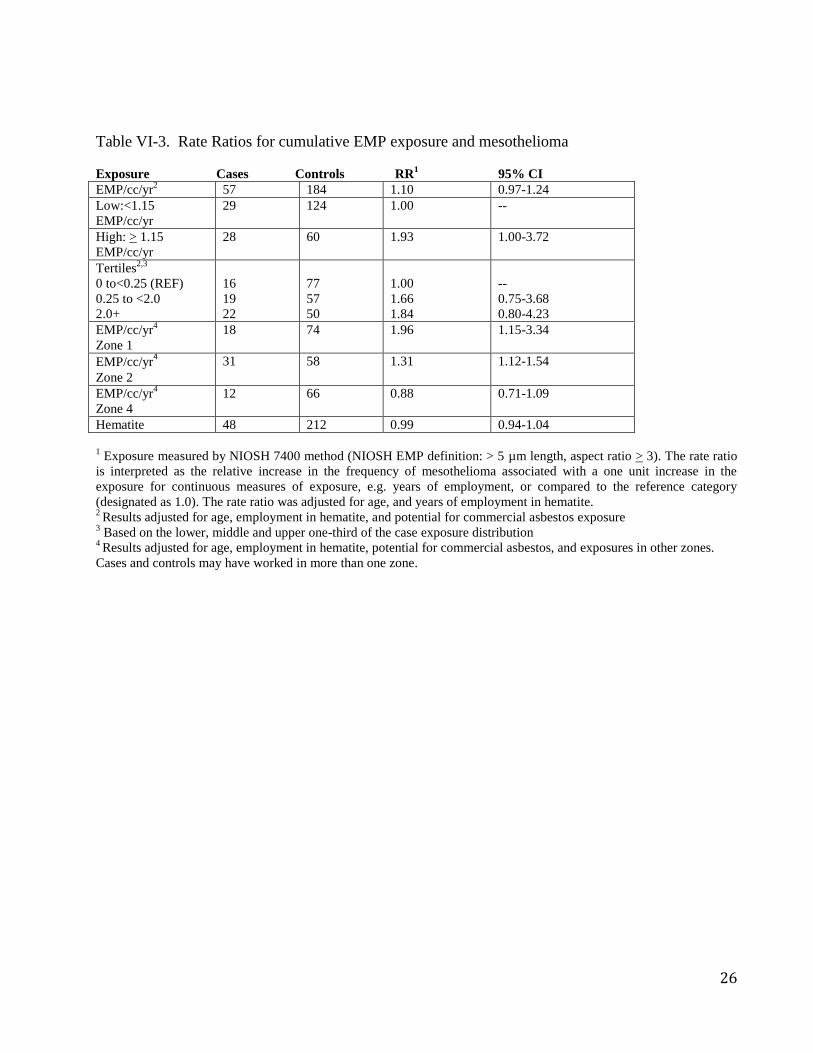
Table VI-3. Rate Ratios for cumulative EMP exposure and mesothelioma
Exposure Cases Controls RR1 95% CI
1 Exposure measured by NIOSH 7400 method (NIOSH EMP definition: > 5 µm length, aspect ratio > 3). The rate ratio
is interpreted as the relative increase in the frequency of mesothelioma associated with a one unit increase in the
exposure for continuous measures of exposure, e.g. years of employment, or compared to the reference category
(designated as 1.0). The rate ratio was adjusted for age, and years of employment in hematite. 2 Results adjusted for age, employment in hematite, and potential for commercial asbestos exposure
3 Based on the lower, middle and upper one-third of the case exposure distribution
4 Results adjusted for age, employment in hematite, potential for commercial asbestos, and exposures in other zones.
Cases and controls may have worked in more than one zone.
EMP/cc/yr2
57
184 1.10 0.97-1.24
Low:<1.15
EMP/cc/yr
29 124 1.00 --
High: > 1.15
EMP/cc/yr
28 60 1.93 1.00-3.72
Tertiles2,3
0 to<0.25 (REF)
0.25 to <2.0
2.0+
16
19
22
77
57
50
1.00
1.66
1.84
--
0.75-3.68
0.80-4.23
EMP/cc/yr4
Zone 1
18 74 1.96 1.15-3.34
EMP/cc/yr4
Zone 2
31 58 1.31 1.12-1.54
EMP/cc/yr4
Zone 4
12 66 0.88 0.71-1.09
Hematite 48
212 0.99 0.94-1.04

27
VII. Taconite Workers Health Study
Lung Cancer Case-Control Study (component summary)
A case-control study of lung cancer was performed to further examine the association between
employment duration, elongate mineral particle (EMP) exposure and silica exposure in the
taconite mining industry. The full report for this study is in Appendix 7. The study of lung cancer
was nested within a cohort of Minnesota taconite iron mining workers employed by any of the
seven mining companies in operation in 1983. Lung cancer cases were identified by vital
records and cancer registry data through 2010. Two age-matched controls were selected from
risk sets of cohort members alive and lung cancer free at the time of case diagnosis. Calendar
time specific exposure estimates were made for each similarly exposed job group (SEG) and
used to estimate workers cumulative exposures. Odds ratios (OR) and 95% confidence intervals
(CI) were estimated using logistic regression. Lung cancer risk was evaluated by total time
worked, and cumulative EMP and silica exposure modeled continuously and by quartile.
A total of 1,706 cases, each matched to approximately two controls, were included in the
analysis (Table VII-1). After adjusting for work in hematite mining, asbestos exposure, silica
exposure and sex, the OR for total duration of employment was 0.99 (95% CI: 0.96-1.01) (Table
VII-2). The ORs for total exposure were 0.94 (95% CI: 0.89-1.01) for EMPs and 1.22 (95% CI:
0.81-1.83) for silica. The risk of lung cancer did not appear to change with increasing exposure
when examined by quartiles (Table VII-2).
This study suggests that taconite mining exposures do not increase the risk for the development
of lung cancer.

28
Table VII-1. Characteristics of cases and controls
CASES (N=1706) CONTROLS (N=3381)
N (%) N (%)
Sex
Male 1637 (95.96) 3183 (94.14)
Female 69 (4.04) 198 (5.86)
Ore type
Taconite only 668 (39.16) 1239 (36.67)
Hematite only 738 (43.26) 1530 (45.28)
Taconite & hematite 300 (17.58) 610 (18.05)
Ever worked by zone
Zone 1 347 (20.34) 642 (18.99)
Zone 2 366 (21.45) 618 (18.28)
Zone 4 327 (19.17) 699 (20.67)
Mean Mean
Years of employment
Taconite 7.67 8.52
Hematite 3.57 3.67
Years of taconite employment by
zone
Zone 1 7.38 7.60
Zone 2 5.41 7.11
Zone 4 8.81 9.27
(EMP/cc)-years
Total 1.48 1.68
Zone 1 0.52 0.52
Zone 2 1.17 1.54
Zone 4 2.51 2.60
Silica (mg/m3)-years
Total 0.2809 0.3070
Years of employment by department
Mining 1.28 1.36
Crushing 0.16 0.20
Concentrating 0.19 0.22
Pelletizing 0.25 0.23
Shop mobile 2.59 2.98
Shop stationary 0.68 0.71
Office 0.30 0.65
Missing/unknown 0.48 0.46
General mine 0.69 0.47
General plant 0.38 0.44
General shop 0.68 0.79

29
Table VII- 2. Risk of lung cancer by employment duration, cumulative EMP, and cumulative
silica exposure
OR 95% CI
Employment duration
Taconite yearsa 0.99 0.96-1.01
Hematite yearsb 0.99 0.98-1.01
Duration by Departmentc
Mining 0.99 0.97-1.01
Crushing 0.96 0.88-1.05
Concentrating 0.99 0.93-1.06
Pelletizing 1.02 0.97-1.07
Shop Mobile 0.99 0.98-1.01
Shop Stationary 1.01 0.98-1.05
Office 0.95 0.92-0.99
Total Exposure
EMP/cc/yearsa 0.95 0.89-1.01
Silica mg/m3/years
d 1.22 0.81-1.83
EMP/cc/years quartilese
Q1 1
Q2 1.00 0.79-1.25
Q3 0.98 0.77-1.24
Q4 0.82 0.57-1.19
Unexposedf 0.81 0.67-0.98
Silica mg/m3/years quartiles
g
Q1 1
Q2 1.04 0.84-1.29
Q3 0.95 0.74-1.22
Q4 0.97 0.70-1.35
Unexposedf 0.81 0.68-0.98
a Adjusted for hematite exposure, silica exposure, asbestos exposure, and gender
b Adjusted for taconite exposure, silica exposure, asbestos exposure, and gender
c Adjusted for years in unknown SEGs, hematite, general mine, general plant, general shop, gender, and asbestos
d Adjusted for taconite exposure, hematite exposure, asbestos exposure, and gender
e Lower cut point for Q1-4 = 0, 0.1298, 0.4527, and 2.353 EMP/cc/years
f Worked only in hematite production and did not have taconite exposure
g Lower cut point for Q1-4 = 0, 0.0373, 0.2064, 0.5189 mg/m3/years

30
VIII. Taconite Workers Health Study
Respiratory Health Survey (component summary)
The goal of the Respiratory Health Survey (RHS) was to assess non-malignant respiratory disease
(NMRD) by the degree of lung function impairment (spirometry) and anatomical abnormality
(chest x-ray) that existed within taconite workers and spouses. In general, the results from this
investigation are useful for assessing the prevalence of lung abnormalities and functional
impairment in workers and spouses, who could have “take home” exposures. The full report for the
RHS is contained in Appendix 8.
This study assessed a common lung ailment, NMRD, also known as pneumoconiosis, determined
on the basis of chest x-ray and spirometry findings. Measured exposure information to elongate
mineral particles (EMPs), silica and respirable dust was available from the prior exposure
assessment (Hwang et al., 2013, 2014; Appendix1, 2, 3). Since NMRD is not contained in any of
the public data bases collected by the Minnesota Department of Health, this approach required the
collection of information by the study research team. A cross-sectional screening of current and
former workers and their spouses was undertaken in Virginia, MN in 2010-11. Spouses were
included because of reports in the medical literature concerning spousal risk and occupational dust
exposure through take home exposure. Each participant filled out a detailed occupational and
health questionnaire which included information on where they worked, when they worked and
which job they had. The type of work prior to the taconite industry job was also included in the
questionnaire, as was a smoking history. Based on the work history, calendar time specific
exposure estimates were made for every job and used to estimate workers’ cumulative exposures.
Rate ratios (RR) and 95% confidence intervals were estimated using Poisson regression for
duration worked and cumulative exposure for all exposure types.
There were 1188 workers and 496 spouses who participated in the complete screening (medical
history, pulmonary function testing and chest x-ray). There were another 134 individuals who
filled out the medical questionnaire but who did not participate in the medical testing. The total
number of participants was 1818. A random sample of 3310 workers was invited to participate.
Non-response is being investigated further but it is known that those individuals who were younger
and who lived further than 2 hours away participated at lower frequencies than older workers who
lived closer. This is likely because of work responsibilities of younger workers as well as
distances required to get to the testing facility, which in some cases could have been over three
hours by car.
Within the workers, restrictive lung function on spirometry, the type of abnormality associated
with dust exposure, occurred in 4.5 % of those screened. Obstructive lung function occurred in
16.8% with another 2.9% having mixed (obstructive and restrictive) function. Chest x-ray
abnormalities, defined by a consensus of two B-readers, suggested that parenchymal abnormalities
(> 1/0), as seen in dust-exposure, occurred in 5.4% of those screened with another 16.7% with
pleural abnormalities. Spousal chest x-rays showed 0.6% parenchymal findings, and 4.5% pleural
abnormalities. Spousal findings compare to other descriptions of pleural abnormalities in the non-

31
working population of western countries, which have been described to be in the range of 1-
6.8%(3)
.
Cumulative silica and cumulative respirable dust exposures, determined with onsite and historical
exposure estimates, were not associated with spirometry or chest x-ray abnormalities. Exposure to
EMP was associated with pleural abnormalities, suggesting the likely exposure to asbestiform
EMPs in the past. For workers who were employed in the industry over 21 years the rate of
pleural abnormalities increased by 60%, compared to those working less than 21 years. Pleural
abnormalities had a graded response to years employed in the industry, with the rate ratio
increasing to 1.84 (95% CI=1.11-3.07) for working 35 or more years (Table VIII-1). For workers
with cumulative EMP exposure greater than the median, the rate of pleural abnormalities nearly
doubled (RR=1.93, 95% CI=1.32-2.83) (Appendix 8).
In summary, this survey of taconite workers and spouses demonstrated increased findings of both
pleural and parenchymal abnormalities in workers compared to spouses. Spousal risk for lung
disease appeared to be comparable to what would be expected in the general population. Despite
the lack of association with estimated cumulative silica and respirable dust, the parenchymal
findings on chest x-ray are consistent with exposure to a mixed mineral dust. Worker abnormalities
for pleural disease were related to length of employment in the taconite industry and to EMP
exposure. The specific type of EMP exposure could not be determined in this evaluation. The
pleural findings were not specific to mineralogical zone.
(3) Hillerdal G. Pleural plaques: incidence and epidemiology, exposed workers and the general population: a review. Indoor and Built
Environment 1997, 6:86-95.

32
Table VIII-1. Pleural abnormality associated with duration of taconite employment (years)
and duration of taconite employment in each Iron Range Zone
Exposure Abnormalities
Yes/No
Pleural
RRd
Pleural
95%CI
Overall Employmentb
Employment duration 198/980 1.02 1.00-1.04
Hematite 15/43 1.01 0.95-1.07
Duration Quartileb
0 < years < 21 40/342 1.00 ---
21 to < 30 50/248 1.39 0.86-2.26
30 to < 35 57/218 1.65 1.02-2.65
35+ years
51/172 1.84 1.11-3.07
Zone Analysisc
Employment duration-Zone 1 116/606 1.02 1.0-1.04
Employment duration-Zone 2 73/339 1.03 1.01-1.05
Employment duration-Zone 4 45/248 1.01 0.99-1.03
a Pleural abnormality defined as abnormality consistent with pneumoconiosis.
b Results adjusted for age, gender, BMI, smoking status, hematite years, and outside occupation with high
probability of asbestos exposure
c Results adjusted for age, gender, BMI, smoking status, hematite years, outside occupation with high probability of
asbestos exposure, and duration in other zones
d Rate ratio is interpreted as the relative increase in the frequency of abnormality associated with a one unit increase
in the exposure for continuous measures of exposure, e.g.) years of employment, or compared to the reference
category (designated as 1.0).

33
Appendices
The following manuscripts are included in the Legislative Report. They are in various stages of
publication, as indicated below. The papers to be submitted will have additional editing before
publication, but are not expected to differ substantively. At the time of this report, first authors
are listed as the graduate students working on the respective studies.
Appendix 1. Published paper: Comprehensive Assessment of Exposures to Elongate Mineral Particles in the Taconite Mining Industry (Hwang et al., 2013) Appendix 2. Published paper: The Relationship between Various Exposure Metrics for
Elongate Mineral Particles (EMP) in the Taconite Mining and Processing Industry (Hwang et al.,
2014)
Appendix 3. To be submitted: A Comprehensive Assessment of Present-Day Exposures to
Respirable Dust and Silica in the Taconite Mining Industry (Hwang et al.)
Appendix 4. Published paper: Mortality Experience among Minnesota Taconite Mining
Industry Workers (Allen et al., 2014)
Appendix 5. To be submitted: Cancer Incidence among Minnesota Taconite Mining Industry
Workers (Allen et al.)
Appendix 6. To be submitted: A Case-Control Study of Mesothelioma in Taconite Miners
Exposed to Elongate Mineral Particles (EMPs) (Lambert et al.)
Appendix 7. To be submitted: Lung Cancer Risk among Minnesota Taconite Mining Workers
(Allen et al.)
Appendix 8. To be submitted: Medical Screening and Exposure Assessment of Current and Former
Workers in the Taconite Industry of Minnesota and Spouses (Odo et al.)

Ann. Occup. Hyg., Vol. 57, No. 8, pp. 966–978, 2013© The Author 2013. Published by Oxford University Press
on behalf of the British Occupational Hygiene Societydoi:10.1093/annhyg/met026
966
Comprehensive Assessment of Exposures to Elongate Mineral Particles in the Taconite Mining IndustryJooyEon HwAng, guruMurTHy rAMACHAndrAn*, PETEr C. rAynor, BruCE H. AlExAndEr and JEffrEy H. MAndEl
Division of Environmental Health Sciences, School of Public Health, University of Minnesota, MMC 807, 420 Delaware Street SE, Minneapolis, MN 55455, USA
Received 4 March 2013; in final form 22 April 2013; accepted 30 April 2013; Advance Access publication 22 June 2013
Since the 1970s, concerns have been raised about elevated rates of mesothelioma in the vicinity of the taconite mines in the Mesabi Iron range. However, insufficient quantitative exposure data have hampered investigations of the relationship between cumulative exposures to elongate mineral particles (EMP) in taconite dust and adverse health effects. Specifically, no research on exposure to taconite dust, which includes EMP, has been conducted since 1990. This article describes a comprehensive assessment of present-day exposures to total and amphibole EMP in the taconite mining industry. Similar exposure groups (SEgs) were established to assess present-day exposure levels and buttress the sparse historical data. Personal samples were collected to assess the present-day levels of worker exposures to EMP at six mines in the Mesabi Iron range. The samples were analyzed using national Institute for occupational Safety and Health (nIoSH) methods 7400 and 7402. for many SEgs in several mines, the exposure levels of total EMP were higher than the nIoSH recommended Exposure limit (rEl). However, the total EMP classification includes not only the asbestiform EMP and their non-asbestiform mineral analogs but also other minerals because the nIoSH 7400 cannot differentiate between these. The concentrations of amphibole EMP were well controlled across all mines and were much lower than the concentrations of total EMP, indicating that amphibole EMP are not major components of taconite EMP. The levels are also well below the nIoSH rEl of 0.1 EMP cc−1. Two different approaches were used to evaluate the variability of exposure between SEgs, between workers, and within workers. The related con-structs of contrast and homogeneity were calculated to characterize the SEgs. Contrast, which is a ratio of between-SEg variability to the sum of between-SEg and between-worker variability, pro-vides an overall measure of whether there are distinctions between the SEgs. Homogeneity, which is the ratio of the within-worker variance component to the sum of the between-worker and within-worker variance components, provides an overall measure of how similar exposures are for workers within an SEg. using these constructs, it was determined that the SEgs are formed well enough when grouped by mine for both total and amphibole EMP to be used for epidemiological analysis.
Keywords: elongate mineral particles; exposure assessment; exposure variability; fiber measurement; similar exposure groups; taconite
IntroductIon
Since the 1970s, concerns about occupational health have intensified in both the taconite mining
industry and the communities adjacent to the mines in the Mesabi Iron Range in north-eastern Minnesota (Axten and Foster, 2008; Wilson et al., 2008). Minnesota counties in the vicinity of taco-nite mining operations have been found to have elevated age-adjusted rates for mesothelioma (Case et al., 2011). The elevated rates challenge conven-tional understanding because mineralogical data
*Author to whom correspondence should be addressed. Tel: +1-612-626-5428; fax: +1-612-626-4837; e-mail: [email protected]
at University of M
innesota,Walter L
ibrary Serial Processing on Novem
ber 19, 2013http://annhyg.oxfordjournals.org/
Dow
nloaded from
Appendix 1

Assessment of exposures to elongate mineral particles 967
suggest that the ore body comprised primarily non-asbestiform cleavage fragments which have not been thought to have high potential for disease (Berry and Gibbs, 2008; Gamble and Gibbs, 2008; Mossman, 2008). For the last three decades, ongo-ing and unresolved concerns about health risks from taconite mining have been driven, in part, by limited epidemiological assessments and insuf-ficient quantitative exposure data. Concerns about the elevated rates of mesothelioma in the Mesabi mining cohort led to epidemiological investiga-tions evaluating the relationship between cumu-lative exposures to components of taconite dust and mesothelioma, lung cancer, and non-malig-nant respiratory disease. However, no research on exposure to taconite dust, which includes elongate mineral particles (EMP), has been conducted since 1990 (Sheehy and McJilton, 1990).
The results presented here are part of a larger epidemiological study assessing the respiratory health effects of exposure to components of taco-nite dust. This article describes our approach to comprehensively assess present-day exposure lev-els to total and amphibole EMP in the taconite mining industry. The term ‘total EMP’ refers to any mineral particle with a minimum aspect ratio of 3:1 that is of inhalable, thoracic, or respirable size, while the term ‘amphibole EMP’ refers to a subset of double chain silicate minerals (crocido-lite, amosite, anthophyllite, tremolite, and actino-lite) that can be asbestiform or non-asbestiform (NIOSH, 2011). Asbestiform EMP are likely to be thinner, longer, and more flexible than non-asbestiform EMP, with layers parallel to those from ‘native (unprocessed) samples’ (Addison and McConnell, 2008). Although the chemical composition of asbestiform and non-asbestiform EMP can be the same, they differ in their ‘habit’ or morphology (Langer et al., 1979).
The first and most critical step of our exposure assessment involves the classification of work-ers into similar exposure groups (SEGs). SEGs can be used to efficiently assess exposure levels based on job titles, locations, tasks, and proce-dures rather than individual workers (Bullock and Ignacio, 2006). Workers who have similar exposure profiles and whose tasks involve similar procedures and materials are grouped together in a single SEG. The success of a grouping strat-egy depends on the between-group variability, between-worker variability, and within-worker variability. To reduce exposure misclassification errors in subsequent epidemiological studies, it is important that the exposure distributions of
SEGs be distinct from each other and homoge-neous within (Kromhout and Heederik, 1995). This requires a detailed characterization of between-SEG and within-SEG exposure vari-ability. However, the sparseness of the available historical exposure data precludes such an analy-sis for taconite workers. A detailed assessment of present-day exposure levels was carried out to understand exposure variability, which enabled the development of better-formed SEGs.
The mineralogy of the Mesabi Iron Range changes from east to west, with the three taco-nite mining companies owning five operating mines in the western and one in the eastern zone. Amphiboles are mainly detected in the east. Phyllosilicates such as minnesotaite, greenalite, and stilpnomelane, which are not regulated as asbestiform or amphibole EMP, dominate the west (McSwiggen and Morey, 2008; Zanko et al., 2008). The amphiboles in the east are principally of the cummingtonite–grunerite series and include some actinolite (ferroactinolite). Amphiboles and phyllosilicates form two distinct groups of miner-als, defined by fundamental differences in their internal crystalline structure. The structure of phyllosilicates is based on sheets of linked silicon tetrahedra. Fibers of phyllosilicate minerals are created when these sheets curl to form tubes. The crystalline structure of amphiboles is based on chains of silicon tetrahedra. The silicate miner-als that form EMP have different morphologies in the east; however, the vast majority of the amphi-boles are non-asbestiform EMP (Wilson et al., 2008; Zanko et al., 2008). Due to the distinct metamorphic mineralogical characteristics of the eastern versus the western zones, workers in the two zones may potentially be exposed to different types of EMP.
The goals of this article are (i) to assess the pre-sent-day levels of exposure to EMP in the taconite industry across the two mineralogical zones, (ii) to estimate the between-SEG, between-worker, and within-worker components of variability in EMP exposures, (iii) to use the components of variabil-ity to assess whether the SEG are distinct from each other and relatively homogeneous within, and (iv) to evaluate the impact of variability on the exposure estimates for the SEGs that will be used in the epidemiological studies. We also exam-ined whether SEGs developed for total EMP are valid for amphibole EMP and if the same set of SEGs can be used for workers in the mineralogi-cally distinct eastern and western zones of the Mesabi Iron Range.
at University of M
innesota,Walter L
ibrary Serial Processing on Novem
ber 19, 2013http://annhyg.oxfordjournals.org/
Dow
nloaded from
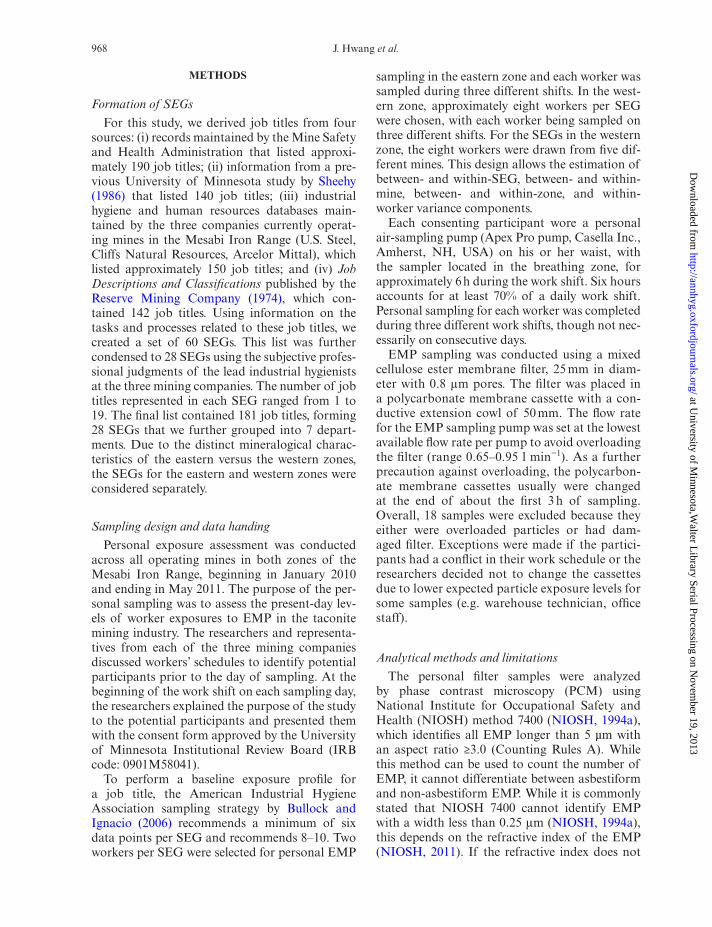
968 J. Hwang et al.
Methods
Formation of SEGs
For this study, we derived job titles from four sources: (i) records maintained by the Mine Safety and Health Administration that listed approxi-mately 190 job titles; (ii) information from a pre-vious University of Minnesota study by Sheehy (1986) that listed 140 job titles; (iii) industrial hygiene and human resources databases main-tained by the three companies currently operat-ing mines in the Mesabi Iron Range (U.S. Steel, Cliffs Natural Resources, Arcelor Mittal), which listed approximately 150 job titles; and (iv) Job Descriptions and Classifications published by the Reserve Mining Company (1974), which con-tained 142 job titles. Using information on the tasks and processes related to these job titles, we created a set of 60 SEGs. This list was further condensed to 28 SEGs using the subjective profes-sional judgments of the lead industrial hygienists at the three mining companies. The number of job titles represented in each SEG ranged from 1 to 19. The final list contained 181 job titles, forming 28 SEGs that we further grouped into 7 depart-ments. Due to the distinct mineralogical charac-teristics of the eastern versus the western zones, the SEGs for the eastern and western zones were considered separately.
Sampling design and data handing
Personal exposure assessment was conducted across all operating mines in both zones of the Mesabi Iron Range, beginning in January 2010 and ending in May 2011. The purpose of the per-sonal sampling was to assess the present-day lev-els of worker exposures to EMP in the taconite mining industry. The researchers and representa-tives from each of the three mining companies discussed workers’ schedules to identify potential participants prior to the day of sampling. At the beginning of the work shift on each sampling day, the researchers explained the purpose of the study to the potential participants and presented them with the consent form approved by the University of Minnesota Institutional Review Board (IRB code: 0901M58041).
To perform a baseline exposure profile for a job title, the American Industrial Hygiene Association sampling strategy by Bullock and Ignacio (2006) recommends a minimum of six data points per SEG and recommends 8–10. Two workers per SEG were selected for personal EMP
sampling in the eastern zone and each worker was sampled during three different shifts. In the west-ern zone, approximately eight workers per SEG were chosen, with each worker being sampled on three different shifts. For the SEGs in the western zone, the eight workers were drawn from five dif-ferent mines. This design allows the estimation of between- and within-SEG, between- and within-mine, between- and within-zone, and within-worker variance components.
Each consenting participant wore a personal air-sampling pump (Apex Pro pump, Casella Inc., Amherst, NH, USA) on his or her waist, with the sampler located in the breathing zone, for approximately 6 h during the work shift. Six hours accounts for at least 70% of a daily work shift. Personal sampling for each worker was completed during three different work shifts, though not nec-essarily on consecutive days.
EMP sampling was conducted using a mixed cellulose ester membrane filter, 25 mm in diam-eter with 0.8 μm pores. The filter was placed in a polycarbonate membrane cassette with a con-ductive extension cowl of 50 mm. The flow rate for the EMP sampling pump was set at the lowest available flow rate per pump to avoid overloading the filter (range 0.65–0.95 l min−1). As a further precaution against overloading, the polycarbon-ate membrane cassettes usually were changed at the end of about the first 3 h of sampling. Overall, 18 samples were excluded because they either were overloaded particles or had dam-aged filter. Exceptions were made if the partici-pants had a conflict in their work schedule or the researchers decided not to change the cassettes due to lower expected particle exposure levels for some samples (e.g. warehouse technician, office staff).
Analytical methods and limitations
The personal filter samples were analyzed by phase contrast microscopy (PCM) using National Institute for Occupational Safety and Health (NIOSH) method 7400 (NIOSH, 1994a), which identifies all EMP longer than 5 µm with an aspect ratio ≥3.0 (Counting Rules A). While this method can be used to count the number of EMP, it cannot differentiate between asbestiform and non-asbestiform EMP. While it is commonly stated that NIOSH 7400 cannot identify EMP with a width less than 0.25 μm (NIOSH, 1994a), this depends on the refractive index of the EMP (NIOSH, 2011). If the refractive index does not
at University of M
innesota,Walter L
ibrary Serial Processing on Novem
ber 19, 2013http://annhyg.oxfordjournals.org/
Dow
nloaded from

Assessment of exposures to elongate mineral particles 969
differ from the substrate material or the count-ing medium, the resolution is low, and vice versa (Kenny and Rood, 1987). Rooker et al. (1982) have shown that under proper calibration and use of appropriate mounting media, EMP with widths of 0.15 μm were measured using PCM. Kenny and Rood (1987) measured widths of 0.125 μm under PCM.
In contrast, the NIOSH method 7402 by trans-mission electron microscopy (TEM; NIOSH, 1994b) is used to identify EMP that meet the PCM counting criteria. This method includes expanded characterization of elemental compo-sition with energy dispersive X-ray analysis and crystalline structure by selected area electron diffraction. Therefore, it can identify EMP that are amphiboles or chrysotile. While laboratories typically claim to distinguish between asbestiform and non-asbestiform EMP using TEM, a more conservative assessment is that this method can identify amphibole versus non-amphibole EMP (in addition to chrysotile EMP), especially in the heterogeneous mixture of particles found in the taconite industry in Minnesota.
As indicated previously, two samples per work shift were collected for most participants on three different days. The results from the two samples were combined to calculate a single time-weighted average concentration for the shift for each partic-ipant. While all personal EMP samples were ana-lyzed using NIOSH 7400, at least one sample per worker was randomly chosen to be analyzed using NIOSH 7402. Thus, while all of the filter samples underwent analysis using NIOSH 7400, ~18% of the samples underwent additional analysis using NIOSH 7402. For the NIOSH 7402 analysis, sam-ples were analyzed by indirect preparation, which included suspension in solution, sonication, and re-filtration. For all personal samples, we used
only one-fourth or half of the filter depending on the analysis methods chosen, and the remain-ing three-forth or half has been archived at the University of Minnesota.
Table 1 lists the number of personal samples analyzed using both NIOSH 7400 and NIOSH 7402 for each mine and zone. In addition, one blank sample per sampling day was obtained for NIOSH 7400 quality control for a total of 243. Further, one blank sample per NIOSH 7402 sam-pling day was obtained for quality control for a total of 66. Table 1 also shows the percentage of samples with EMP levels that fell below the limit of detection (LOD), as measured by NIOSH 7400 and NIOSH 7402. Overall, many of the samples had levels less than the LOD, especially the NIOSH 7402 samples in the western zone. If all the measurements for a given SEG were below the LOD, summary statistics such as the arith-metic and geometric means (GM) and geometric standard deviations (GSD) were not reported. If at least one sample for an SEG in a particular mine was above the LOD, then summary statis-tics were calculated by assuming that censored data were represented by one half of the LOD.
Only three chrysotile asbestiform EMP (0.24% of all EMP samples) were identified by the NIOSH 7402 analysis. These were excluded from our analyses, leaving only amphibole—specifically cummingtonite–grunerite and actinolite—and non-amphibole EMP in our data set. Using the NIOSH 7400 and 7402 results, average concentra-tions of EMP identified as total and amphibole for each SEG in each mine were calculated. This estimate was then applied to all of the NIOSH 7400 samples for that SEG in that mine to obtain personal exposure levels to NIOSH 7402 amphi-bole EMP when the samples had at least one value above LOD for that SEG.
Table 1. Number of personal samples and percent of samples less than LOD by mine and mineralogical zone.
Zone Mine Workers Samples analyzed by PCMa
% <LOD by PCM Samples analyzed by TEMb
% <LOD by TEM
Eastern A 56 266 7.1 102 68.6
Western B 34 197 68.5 34 100.0
C 38 218 53.2 36 100.0
D 34 203 37.0 34 100.0
E 48 267 20.6 47 100.0
F 22 129 48.8 22 100.0
Total 232 1298 — 275 —
aPersonal samples analyzed by NIOSH 7400 PCM, counting all EMP with length >5 µm and aspect ratio >3.0.bPersonal samples analyzed by NIOSH 7402 TEM, counting only amosite, non-amosite and chrysotile EMP with length >5 µm and aspect ratio >3.0.
at University of M
innesota,Walter L
ibrary Serial Processing on Novem
ber 19, 2013http://annhyg.oxfordjournals.org/
Dow
nloaded from

970 J. Hwang et al.
C
Cij
ij
( , )
( ,
NIOSH 74 2 amphibole EMP
NIOSH 74 tota
0
00= ll EMP
NIOSH amphibole EMP
NIOSH 7400, total E
)
( , )
(×C
Ci
i
7402
MMP) (1)
for C, concentration (particles per cubic centime-ter); C , average concentration (particles per cubic centimeter); i, SEG in a mine; j, observation.
Statistical analysis methods
Of the 28 SEGs, 27 SEGs were monitored. We were not able to monitor the Janitor SEG because all janitors in the current taconite mining industry are independent contractors and not employed by the mining companies. A t-test was used to deter-mine which SEGs differed between the two zones for each EMP classification (Table 2). Of the 27 SEGs, 21 were present in both zones for statisti-cal evaluations. To ensure that at least one of the 27 SEGs is different from the others and that the exposures within each SEG are homogeneous, two different approaches were used to evaluate the variability of exposure between SEGs, between workers, and within workers.
One-way analysis of variation. We used a simple one-way analysis of variation (ANOVA) model to compare the log-transformed estimated exposures Yij of each SEG.
Y X
i jij ij y i ij= = + +
= … = …
log for
1 2 27 and 1 2
( )
, , , , , ,
µ α ε
,, 24 (2)
where Xij = exposure concentration of the ith SEG at the jth observation for each SEG, µy = overall mean of Yij, αi = random devia-tion of the ith SEG’s true exposure from µy, and εij = random deviation of the jth observation from the ith SEG’s true exposure. Equation (2) assumes that the εij is independently and identi-cally distributed with a normal distribution. This model was used to determine if the differences between the SEGs were statistically significant. A pairwise comparison of the SEGs was used to identify which SEGs were significantly different from each other.
Contrast and homogeneity. Kromhout and Heederik (1995) proposed a two-way nested random-effects ANOVA model for estimating between-SEG, between-worker, and within-worker
variance components using the log-transformed exposure concentrations. The variance compo-nents were constructed using PROC NESTED with a nested structure of data set as follows:
Y Xikn ikn y ik
ikn ikn
= = +
+ +
log
for the observations
( ) µ α
β εii k
n
= = …= …
1 2 27 1 2 4 and
1 2 6
, , ..., , , , , ;
, , , (3)
where Xikn, nth observation of exposure concen-tration for the kth worker of the ith SEG; µy, over-all mean of Yikn; αi, random deviations of the ith SEG’s true exposure from µy; βik, random devia-tions of the ith SEG’s kth worker’s true exposure from µy, i (mean exposure of the ith SEG); and εikn, random deviations of the nth observation for the ith SEG’s kth worker from µy, ik (mean exposure of the kth worker in the ith SEG). The random deviations (αi, βik, and εikn) are assumed to be nor-mally distributed with zero means and variances ( σα
2 , σβ2 , and σε
2 , respectively). These vari-ances are mutually uncorrelated and estimated as variance components ( S BGy
2 , Sy2
BW, and S WWy2 ,
respectively).According to Kromhout and Heederik (1995),
contrast (ε) is a ratio of between-SEG variabil-ity to the sum of between-SEG and between-worker (i.e. within SEG) variability and provides an overall measure of whether there are distinc-tions between the SEGs and is given as follows:
Contrast ( )S
S SBG
BG BW
ε =+y
y y
2
2 2 (4)
When the between-SEG variance component ( S BGy
2 ) approaches 0, the contrast value approaches 0, indicating that the SEGs are similar and not dis-tinct from each other. When the between-worker variance component within the SEG (S BWy
2 ) approaches 0, the contrast value approaches 1, indicating that between-SEG variability are domi-nant and implying that at least one SEG is distinct from the others.
Analogously, we can define homogeneity (η) to provide an overall measure of how similar the exposures are for workers within an SEG. It is defined as the ratio of the within-worker variance component to the sum of the between-worker and within-worker variance components, and is given as follows:
at University of M
innesota,Walter L
ibrary Serial Processing on Novem
ber 19, 2013http://annhyg.oxfordjournals.org/
Dow
nloaded from

Assessment of exposures to elongate mineral particles 971
Homogeneity ( ) S
S +SWW
BW WW
η = y
y y
2
2 2 (5)
When the within-worker variance component (S WWy
2 ) is small compared with the between-worker variability, homogeneity approaches 0, indicating that the exposures of the workers within each SEG are heterogeneous. When the between-worker variance component (S BWy
2 ) is small, homogeneity approaches 1.
The statistical analyses were conducted for total and amphibole EMP. Significance was defined by P values of 0.05 or lower. All analyses reported
here were conducted using SAS version 9.3 (SAS Institute, Cary, NC, USA).
results
The results of t-tests used to determine the dif-ferences between the zones by SEG are shown in Table 2. When a SEG was not present in both zones, the P value could not be calculated. Sixty-two per-cent (13 of 21) of the SEGs were significantly dif-ferent between the zones for total EMP. For the amphibole EMP exposures in the western zone, all the data were less than the LOD. Additionally, eight SEGs in the eastern zone contained all data
Table 2. Arithmetic mean (particles per cubic centimeter) in each zone and t-test results (P value) by EMP classification for each SEG.
Department SEG Total EMP (particles cm−3) Amphibole EMP (particles cm−3)
East West P value East West P value
Mining Basin operator — 0.053 — — <LOD —
Mining operator 1 0.065 0.015 <0.0001 <LOD <LOD NA
Mining operator 2 0.097 0.031 0.0016 0.004 <LOD NA
Rail road 0.072 — — <LOD — —
Crushing Crusher maintenance 0.194 0.044 <0.0001 0.026 <LOD NA
Crusher operator 0.193 0.038 <0.0001 0.030 <LOD NA
Operating technician 0.341 0.014 <0.0001 0.110 <LOD NA
Concentrating Concentrator maintenance 0.207 0.058 <0.0001 0.030 <LOD NA
Concentrator operator 0.176 0.023 <0.0001 0.024 <LOD NA
Pelletizing Balling drum operator 0.050 0.077 0.9371 0.010 <LOD NA
Dock man 0.206 0.085 0.0014 0.020 <LOD NA
Furnace operator 0.066 0.040 0.0141 0.015 <LOD NA
Pelletizing maintenance 0.067 0.073 0.0852 <LOD <LOD NA
Pelletizing operator 0.109 0.095 0.1739 0.014 <LOD NA
Shop (mobile)a Boiler technician — 0.041 — — <LOD —
Carpenter — 0.064 — — <LOD —
Electrician 0.309 0.077 <0.0001 0.063 <LOD NA
Lubricate technician 0.145 0.033 0.0006 0.016 <LOD NA
Maintenance technician 0.043 0.031 0.0919 <LOD <LOD NA
Pipefitter/Plumber — 0.048 — — <LOD —
Repairman — 0.064 — — <LOD —
Supervisor 0.064 0.045 0.3246 0.012 <LOD NA
Shop (stationary)b Auto mechanic 0.118 0.023 <0.0001 <LOD <LOD NA
Lab analyst 0.114 0.030 <0.0001 <LOD <LOD NA
Warehouse technician 0.018 0.041 0.3243 0.004 <LOD NA
Office/control room Control room operator 0.021 0.017 0.5269 <LOD <LOD NA
Office staff 0.009 0.016 0.0546 <LOD <LOD NA
Numbers in boldface indicate statistically significant differences between eastern and western zone (P < 0.05).<LOD, samples containing LOD; NA, data containing LOD in either one of two zones.aShop (mobile) refers to those SEGs whose work is more likely done in multiple places in the plants.bShop (stationary) refers to those SEGs whose work is more likely done in a single workplace.
at University of M
innesota,Walter L
ibrary Serial Processing on Novem
ber 19, 2013http://annhyg.oxfordjournals.org/
Dow
nloaded from

972 J. Hwang et al.
less than the LOD. Therefore, we did not test for differences between two zones for amphibole EMP. Both the total and amphibole EMP classifica-tions had substantially different arithmetic mean exposures between the two zones. Only four SEGs (balling drum operator, pelletizing maintenance, warehouse technician, and office staff) were found to have higher total EMP exposures in the western zone, but none of these four were significantly dif-ferent between the two zones (P > 0.05).
Total and amphibole EMP concentrations
The box plots in Fig. 1 show the total EMP concentrations by SEG across all mines. The concentration of total EMP in mine A tended to be higher than in the mines in the western zone. For most of the SEGs in the various mines, the arithmetic mean (the X in the box plot) was greater than the median (the middle line in the box plot), indicating a non-normal, skewed distribution.
Table 3 shows the GM and GSD of total EMP concentration by SEG in all mines. Table 4 sum-marizes the amphibole EMP concentration by SEG in the eastern zone (mine A). Since all amphibole EMP concentrations are less than the LOD in the western zone, we do not present the GM and GSD estimates. The GM for each SEG in mine A was markedly less for amphibole EMP than for total EMP.
The measured amphibole EMP concentrations by SEG across all mines are illustrated using scat-ter plots in Fig. 2. Figure 2 shows that, with a few exceptions in mine A, the concentrations of amphibole EMP were lower than the NIOSH Recommended Exposure Limit (REL) of 0.1 particles cm−3 for EMP by roughly an order of magnitude.
Comparison of EMP exposure differences
To explore the EMP exposure differences between the SEGs, a pairwise comparison of the SEGs within each mine was performed. The loga-rithms of the estimated EMP exposures were used in a simple one-way ANOVA model. In each mine, at least two of the SEG means were significantly different for total EMP (P < 0.0005).
Comparison of SEG variance components
Table 5 shows the between-SEG (S2BG), between-
worker (S2BW), and within-worker (S2
WW) variance components as absolute values and as percentage of total variance (sum of the three components),
as well as the contrast (ε) and homogeneity (η) val-ues for total EMP by mine in both geologic zones.
dIscussIon
The available historical data on exposure of workers to taconite EMP are sparse and typi-cally based on NIOSH 7400. They are insufficient for assessing exposure variability in any detail. Our detailed measurements allow for a study of the components of variance of exposure, that in turn, allows the creation of well-formed SEGs and reducing the likelihood of exposure misclas-sification (Nieuwenhuijsen, 1997; Ramachandran, 2005). Moreover, this analysis identifies notable heterogeneity of exposure to total EMP in the taconite mining industry.
Levels of total and amphibole EMP
This is the first study to report on the con-centrations of total and amphibole EMP in the taconite mining industry. Overall, higher con-centrations of total EMP were found in mine A, including the highest exposure of 2.2 parti-cles cm−3, ~ 22 times greater than the REL (0.1 particles cm−3) for EMP. The lowest concentra-tion of total EMP was found in mine F, and the total EMP exposure concentrations for all SEGs in this mine were lower than the NIOSH REL. The concentrations of amphibole EMP were much less than the concentrations of total EMP, indicating that amphibole EMP are not major components of taconite EMP. In general, the amphibole EMP concentrations were lower than the NIOSH REL, except for a few SEGs in mine A. Three individual measurements exceeded the NIOSH REL of the amphibole EMP.
Comparison of eastern and western zones
Overall, the exposure levels were higher in the eastern zone than in the western zone. The differ-ences in the exposure levels support the idea of considering the SEGs in the eastern and western zones separately for the larger epidemiology study, and are consistent with the geological differences between the zones. For both total and amphibole EMP categories, the SEG with the highest expo-sure level in the eastern zone was operating techni-cian (Table 2). In the western zone, the pelletizing operator was the SEG with the highest exposure levels for total EMP (Table 2). More than half of the SEGs had significantly different levels of total EMP exposures between the eastern and western
at University of M
innesota,Walter L
ibrary Serial Processing on Novem
ber 19, 2013http://annhyg.oxfordjournals.org/
Dow
nloaded from
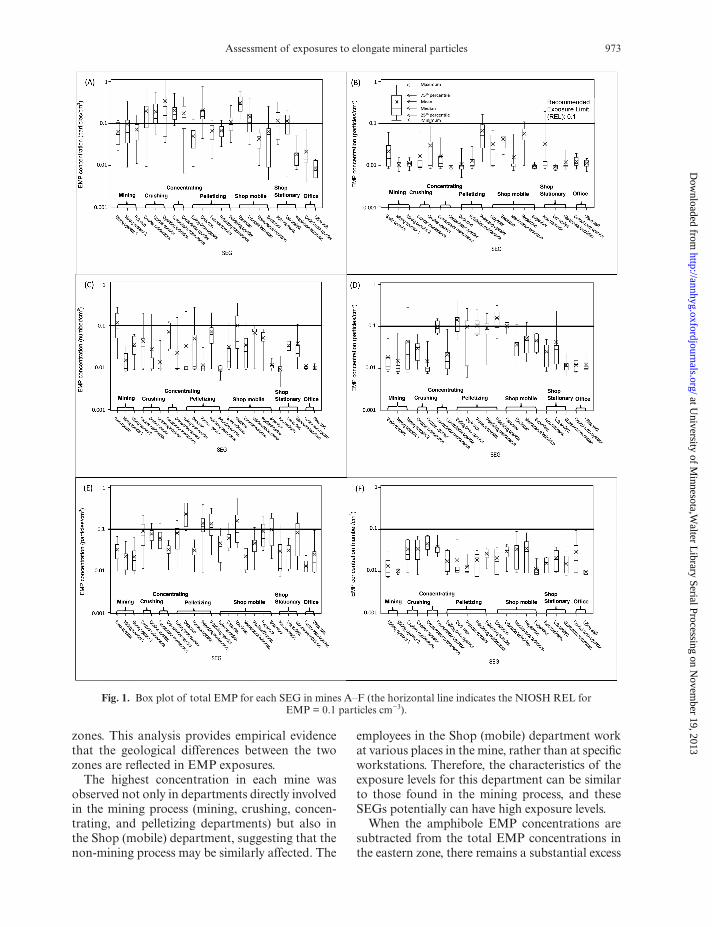
Assessment of exposures to elongate mineral particles 973
zones. This analysis provides empirical evidence that the geological differences between the two zones are reflected in EMP exposures.
The highest concentration in each mine was observed not only in departments directly involved in the mining process (mining, crushing, concen-trating, and pelletizing departments) but also in the Shop (mobile) department, suggesting that the non-mining process may be similarly affected. The
employees in the Shop (mobile) department work at various places in the mine, rather than at specific workstations. Therefore, the characteristics of the exposure levels for this department can be similar to those found in the mining process, and these SEGs potentially can have high exposure levels.
When the amphibole EMP concentrations are subtracted from the total EMP concentrations in the eastern zone, there remains a substantial excess
fig. 1. Box plot of total EMP for each SEG in mines A–F (the horizontal line indicates the NIOSH REL forEMP = 0.1 particles cm−3).
at University of M
innesota,Walter L
ibrary Serial Processing on Novem
ber 19, 2013http://annhyg.oxfordjournals.org/
Dow
nloaded from

974 J. Hwang et al.
of non-amphibole EMP concentration. This is significantly higher than the non-amphibole EMP concentration in the western zone for most SEGs. It is possible that this difference in non-amphibole oncentrations between the zones is related to the mineralogy. As described earlier, there are distinct metamorphic mineralogical differences between the zones. Phyllosilicates are prevalent in the west-ern zone, while amphiboles are prevalent in the eastern zone. However, an analysis of how mineral-ogy affects the non-amphibole EMP concentration is beyond scope of this study.
Analysis of between-SEG and between-worker variabilities
The SEGs formed for this analysis identify workers with similar exposures; however, the expo-sures to EMP do not vary across all SEGs an only
certain SEGs contribute significantly to variance. The between-SEG variance component was higher than the between-worker variance component in the eastern zone. Therefore, at least one of the SEGs is significantly different from the other SEGs in the eastern zone. However, the others may still not be distinguishable. Within the western zone, the between-SEG variance component was highest in mine D and the between-worker variance compo-nent was highest in mine F for total EMP.
Much higher contrast was observed in the eastern zone (0.740) than in the western zone (0.130). Since the western zone included five dif-ferent mines, each SEG included exposures from five different mines, leading to higher between-worker (or within-SEG) variability, which in turn led to lower contrast. In particular, the between-SEG variance component was low in
Table 3. Summary statistics of total EMP for each SEG measured in A–F mines (GM unit: particles per cubic centimeter).
Department SEG A B C D E F
GM GSD GM GSD GM GSD GM GSD GM GSD GM GSD
Mining Basin operator — — 0.017 1.96 0.089 2.40 0.014 1.94 0.028 1.88 — —
Mining operator 1 0.054 1.96 0.010 1.25 0.013 1.80 0.012 1.81 0.019 1.78 0.012 1.76
Mining operator 2 0.057 3.14 0.011 1.27 0.030 2.04 0.025 2.73 0.018 1.95 0.010 1.14
Rail road 0.054 2.53 — — — — — — — — — —
Crushing Crusher maintenance 0.131 2.70 0.013 1.95 0.026 2.68 0.025 1.85 0.068 2.29 0.027 2.13
Crusher operator 0.157 1.95 0.018 2.66 0.015 2.43 0.012 1.91 0.071 1.51 0.027 2.13
Operating technician 0.140 3.53 — — 0.012 1.67 — — — — — —
Concentrating Concentrator maintenance
0.180 1.71 0.013 1.77 0.060 2.01 0.093 1.42 0.048 2.16 0.042 1.57
Concentrator operator 0.116 3.06 0.009 1.08 0.013 2.27 0.016 2.07 0.029 1.69 0.035 1.50
Pelletizing Balling drum operator 0.042 1.90 — — 0.015 2.79 0.119 1.77 0.063 2.23 0.015 1.86
Dock man 0.155 2.12 0.010 1.48 0.024 3.28 0.049 4.48 0.187 1.88 0.014 2.04
Furnace operator 0.056 1.94 — — 0.010 1.45 0.091 1.65 0.028 1.64 0.012 1.49
Pelletizing maintenance 0.061 1.56 0.012 1.45 0.057 2.14 0.077 2.00 0.103 2.57 0.016 1.98
Pelletizing operator 0.094 1.77 0.050 2.32 0.009 1.39 0.140 1.72 0.104 2.21 0.024 1.52
Shop (mobile)a Boiler technician — — — — 0.020 2.63 — — 0.034 2.39 — —
Carpenter — — 0.023 2.50 — — 0.100 1.26 0.054 1.65 — —
Electrician 0.279 1.62 0.036 1.71 0.057 3.06 0.029 2.04 0.104 2.51 0.017 2.06
Lubricate technician 0.104 2.43 — — 0.025 2.40 — — — — 0.026 1.72
Maintenance technician 0.036 2.04 0.012 1.80 0.054 2.66 0.041 2.15 0.019 1.85 0.025 2.32
Pipefitter/Plumber — — — — 0.042 2.28 — — 0.039 1.91 — —
Repairman — — 0.050 1.85 — — — — 0.070 2.07 0.023 2.81
Supervisor 0.034 3.70 0.010 1.17 0.011 1.29 0.041 1.64 0.073 2.22 0.011 1.39
Shop (stationary)b
Auto mechanic 0.086 2.34 0.015 2.85 0.009 1.48 0.020 2.12 0.019 2.49 0.015 1.49
Lab analyst 0.093 2.23 0.009 1.14 0.033 1.28 0.026 2.41 0.025 2.06 0.018 1.91
Warehouse technician 0.015 1.82 0.011 1.46 0.027 2.48 0.011 1.51 0.053 2.86 0.013 1.71
Office/control room
Control room operator 0.008 1.65 0.011 1.34 0.010 1.13 0.011 1.42 0.018 2.15 0.010 1.10
Office staff 0.016 2.18 0.012 1.37 0.011 1.29 0.012 1.36 0.012 1.45 0.021 2.35
aShop (mobile) refers to those SEGs whose work is more likely done in multiple places in the plants.bShop (stationary) refers to those SEGs whose work is more likely done in a single workplace.
at University of M
innesota,Walter L
ibrary Serial Processing on Novem
ber 19, 2013http://annhyg.oxfordjournals.org/
Dow
nloaded from
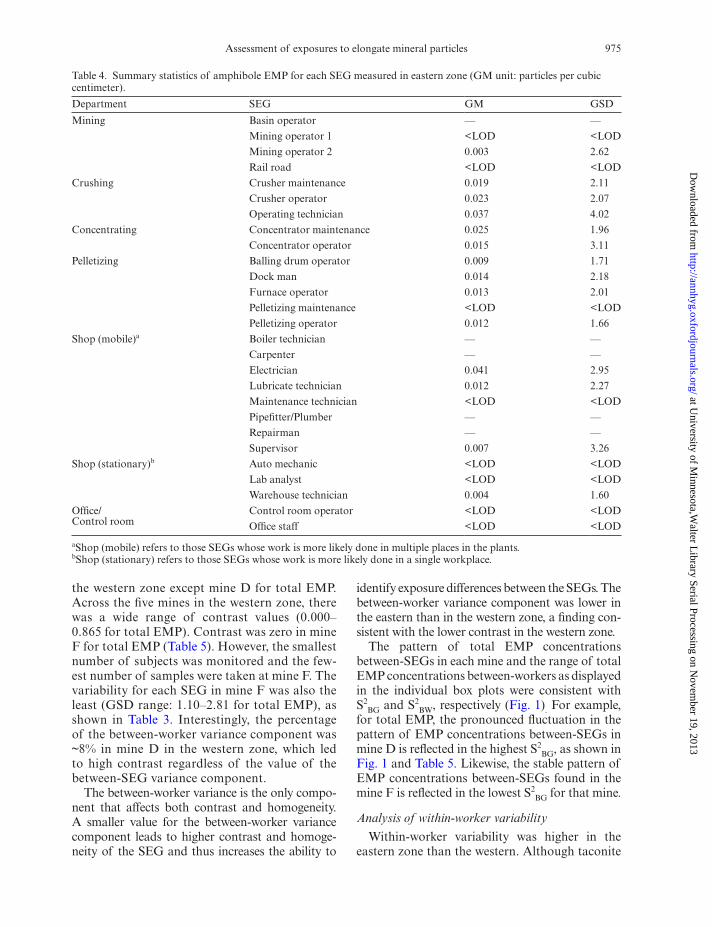
Assessment of exposures to elongate mineral particles 975
the western zone except mine D for total EMP. Across the five mines in the western zone, there was a wide range of contrast values (0.000–0.865 for total EMP). Contrast was zero in mine F for total EMP (Table 5). However, the smallest number of subjects was monitored and the few-est number of samples were taken at mine F. The variability for each SEG in mine F was also the least (GSD range: 1.10–2.81 for total EMP), as shown in Table 3. Interestingly, the percentage of the between-worker variance component was ~8% in mine D in the western zone, which led to high contrast regardless of the value of the between-SEG variance component.
The between-worker variance is the only compo-nent that affects both contrast and homogeneity. A smaller value for the between-worker variance component leads to higher contrast and homoge-neity of the SEG and thus increases the ability to
identify exposure differences between the SEGs. The between-worker variance component was lower in the eastern than in the western zone, a finding con-sistent with the lower contrast in the western zone.
The pattern of total EMP concentrations between-SEGs in each mine and the range of total EMP concentrations between-workers as displayed in the individual box plots were consistent with S2
BG and S2BW, respectively (Fig. 1). For example,
for total EMP, the pronounced fluctuation in the pattern of EMP concentrations between-SEGs in mine D is reflected in the highest S2
BG, as shown in Fig. 1 and Table 5. Likewise, the stable pattern of EMP concentrations between-SEGs found in the mine F is reflected in the lowest S2
BG for that mine.
Analysis of within-worker variability
Within-worker variability was higher in the eastern zone than the western. Although taconite
Table 4. Summary statistics of amphibole EMP for each SEG measured in eastern zone (GM unit: particles per cubic centimeter).
Department SEG GM GSD
Mining Basin operator — —
Mining operator 1 <LOD <LOD
Mining operator 2 0.003 2.62
Rail road <LOD <LOD
Crushing Crusher maintenance 0.019 2.11
Crusher operator 0.023 2.07
Operating technician 0.037 4.02
Concentrating Concentrator maintenance 0.025 1.96
Concentrator operator 0.015 3.11
Pelletizing Balling drum operator 0.009 1.71
Dock man 0.014 2.18
Furnace operator 0.013 2.01
Pelletizing maintenance <LOD <LOD
Pelletizing operator 0.012 1.66
Shop (mobile)a Boiler technician — —
Carpenter — —
Electrician 0.041 2.95
Lubricate technician 0.012 2.27
Maintenance technician <LOD <LOD
Pipefitter/Plumber — —
Repairman — —
Supervisor 0.007 3.26
Shop (stationary)b Auto mechanic <LOD <LOD
Lab analyst <LOD <LOD
Warehouse technician 0.004 1.60
Office/Control room
Control room operator <LOD <LOD
Office staff <LOD <LOD
aShop (mobile) refers to those SEGs whose work is more likely done in multiple places in the plants.bShop (stationary) refers to those SEGs whose work is more likely done in a single workplace.
at University of M
innesota,Walter L
ibrary Serial Processing on Novem
ber 19, 2013http://annhyg.oxfordjournals.org/
Dow
nloaded from

976 J. Hwang et al.
processes are similar across all mines currently, the responsibilities for similar job classifications varied slightly between the mines due to the presence or absence of unionization, number of employees, and management. For instance, the workers at mine A, the sole mine in the eastern zone, are non-unionized, and the tasks performed by workers with the same job titles vary more
depending on the work shift. Censored data, or values less than the LOD, also impact estimated within-worker variability. A higher percentage of values below the LOD were observed in the west-ern zone, which led to the lower estimated within-worker variability.
The highest S2WW was observed in mine D and the
lowest in mine B for total EMP. Overall, S2WW was
fig. 2. Scatter plot of amphibole EMP for each SEG in mines A–F (the horizontal line indicates the NIOSH REL for EMP = 0.1 particles cm−3).
at University of M
innesota,Walter L
ibrary Serial Processing on Novem
ber 19, 2013http://annhyg.oxfordjournals.org/
Dow
nloaded from
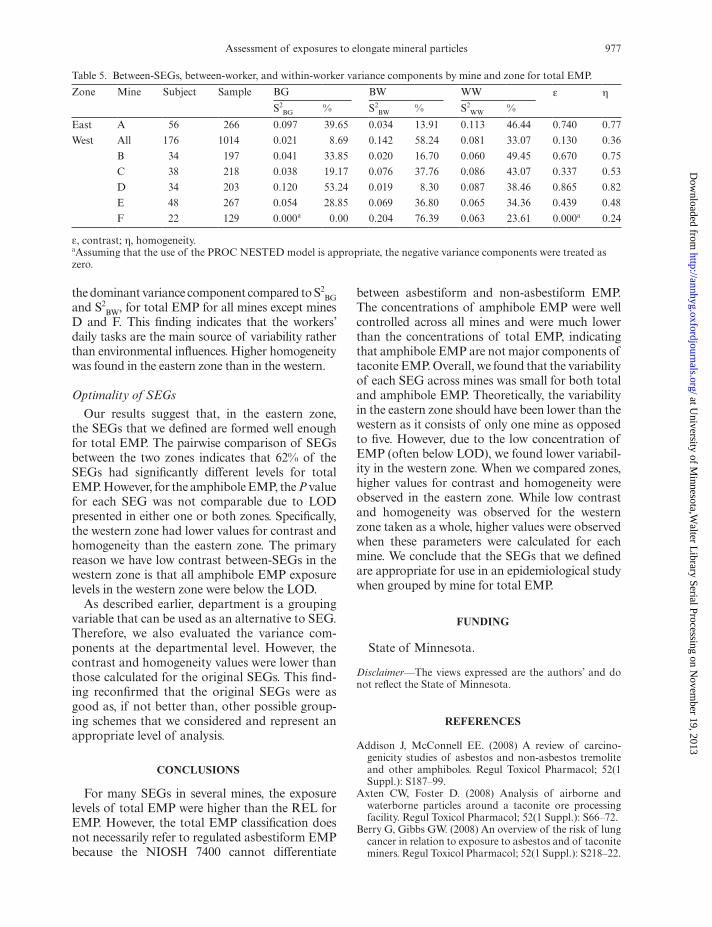
Assessment of exposures to elongate mineral particles 977
the dominant variance component compared to S2BG
and S2BW, for total EMP for all mines except mines
D and F. This finding indicates that the workers’ daily tasks are the main source of variability rather than environmental influences. Higher homogeneity was found in the eastern zone than in the western.
Optimality of SEGs
Our results suggest that, in the eastern zone, the SEGs that we defined are formed well enough for total EMP. The pairwise comparison of SEGs between the two zones indicates that 62% of the SEGs had significantly different levels for total EMP. However, for the amphibole EMP, the P value for each SEG was not comparable due to LOD presented in either one or both zones. Specifically, the western zone had lower values for contrast and homogeneity than the eastern zone. The primary reason we have low contrast between-SEGs in the western zone is that all amphibole EMP exposure levels in the western zone were below the LOD.
As described earlier, department is a grouping variable that can be used as an alternative to SEG. Therefore, we also evaluated the variance com-ponents at the departmental level. However, the contrast and homogeneity values were lower than those calculated for the original SEGs. This find-ing reconfirmed that the original SEGs were as good as, if not better than, other possible group-ing schemes that we considered and represent an appropriate level of analysis.
conclusIons
For many SEGs in several mines, the exposure levels of total EMP were higher than the REL for EMP. However, the total EMP classification does not necessarily refer to regulated asbestiform EMP because the NIOSH 7400 cannot differentiate
between asbestiform and non-asbestiform EMP. The concentrations of amphibole EMP were well controlled across all mines and were much lower than the concentrations of total EMP, indicating that amphibole EMP are not major components of taconite EMP. Overall, we found that the variability of each SEG across mines was small for both total and amphibole EMP. Theoretically, the variability in the eastern zone should have been lower than the western as it consists of only one mine as opposed to five. However, due to the low concentration of EMP (often below LOD), we found lower variabil-ity in the western zone. When we compared zones, higher values for contrast and homogeneity were observed in the eastern zone. While low contrast and homogeneity was observed for the western zone taken as a whole, higher values were observed when these parameters were calculated for each mine. We conclude that the SEGs that we defined are appropriate for use in an epidemiological study when grouped by mine for total EMP.
FundIng
State of Minnesota.
Disclaimer—The views expressed are the authors’ and do not reflect the State of Minnesota.
reFerences
Addison J, McConnell EE. (2008) A review of carcino-genicity studies of asbestos and non-asbestos tremolite and other amphiboles. Regul Toxicol Pharmacol; 52(1 Suppl.): S187–99.
Axten CW, Foster D. (2008) Analysis of airborne and waterborne particles around a taconite ore processing facility. Regul Toxicol Pharmacol; 52(1 Suppl.): S66–72.
Berry G, Gibbs GW. (2008) An overview of the risk of lung cancer in relation to exposure to asbestos and of taconite miners. Regul Toxicol Pharmacol; 52(1 Suppl.): S218–22.
Table 5. Between-SEGs, between-worker, and within-worker variance components by mine and zone for total EMP.
Zone Mine Subject Sample BG BW WW ε ηS2
BG % S2BW % S2
WW %
East A 56 266 0.097 39.65 0.034 13.91 0.113 46.44 0.740 0.77
West All 176 1014 0.021 8.69 0.142 58.24 0.081 33.07 0.130 0.36
B 34 197 0.041 33.85 0.020 16.70 0.060 49.45 0.670 0.75
C 38 218 0.038 19.17 0.076 37.76 0.086 43.07 0.337 0.53
D 34 203 0.120 53.24 0.019 8.30 0.087 38.46 0.865 0.82
E 48 267 0.054 28.85 0.069 36.80 0.065 34.36 0.439 0.48
F 22 129 0.000a 0.00 0.204 76.39 0.063 23.61 0.000a 0.24
ε, contrast; η, homogeneity.aAssuming that the use of the PROC NESTED model is appropriate, the negative variance components were treated as zero.
at University of M
innesota,Walter L
ibrary Serial Processing on Novem
ber 19, 2013http://annhyg.oxfordjournals.org/
Dow
nloaded from

978 J. Hwang et al.
Bullock W, Ignacio J. (2006) A strategy for assessing and managing occupational exposures. Fairfax, VA: AIHA. ISBN: 1-931504-69-5.
Case BW, Abraham JL, Meeker G et al. (2011) Applying definitions of “asbestos” to environmental and “low-dose” exposure levels and health effects, particularly malignant mesothelioma. J Toxicol Environ Health B Crit Rev; 14: 3–39.
Gamble JF, Gibbs GW. (2008) An evaluation of the risks of lung cancer and mesothelioma from exposure to amphi-bole cleavage fragments. Regul Toxicol Pharmacol; 52(1 Suppl.): S154–86.
Kenny L, Rood A. (1987) A direct measurement of the vis-ibility of amosite asbestos fibres by phase contrast opti-cal microscopy. Ann Occup Hyg; 31: 261–4.
Kromhout H, Heederik D. (1995) Occupational epidemiol-ogy in the rubber industry: implications of exposure vari-ability. Am J Ind Med; 27: 171–85.
Langer AM, Maggiore CM, Nicholson WJ et al. (1979) The contamination of Lake Superior with amphibole gangue minerals. Ann N Y Acad Sci; 330: 549–72.
McSwiggen PL, Morey GB. (2008) Overview of the min-eralogy of the Biwabik Iron Formation, Mesabi Iron Range, northern Minnesota. Regul Toxicol Pharmacol; 52(1 Suppl.): S11–25.
Mossman BT. (2008) Assessment of the pathogenic poten-tial of asbestiform vs. nonasbestiform particulates (cleav-age fragments) in in vitro (cell or organ culture) models and bioassays. Regul Toxicol Pharmacol; 52(1 Suppl.): S200–3.
Nieuwenhuijsen MJ. (1997) Exposure assessment in occu-pational epidemiology: measuring present exposures with an example of a study of occupational asthma. Int Arch Occup Environ Health; 70: 295–308.
NIOSH. (1994a) NIOSH manual of analytical meth-ods (NMAM) 7400, fourth edition: ASBESTOS and OTHER FIBERS by PCM, issue 2. NIOSH.
NIOSH. (1994b) NIOSH manual of analytical methods (NMAM) 7402, fourth edition: ASBESTOS by TEM, issue 2. NIOSH.
NIOSH. (2011) Asbestos fibers and other elongate min-eral particles: state of the science and roadmap for research. Current intelligence bulletin 62. Cincinnati, OH: NIOSH.
Ramachandran G. (2005) Occupational exposure assess-ment for air contaminants. Boca Raton, FL: CRC Press. ISBN: 1-56670-609-2.
Reserve mining company. (1974) Job descriptions and classi-fications: united steelworkers of America and Reserve min-ing company. Minneapolis, MN: Reserve mining company.
Rooker SJ, Vaughan NP, Guen, JM. (1982) On the visibil-ity of fibers by phase contrast microscopy. Am Ind Hyg Assoc; 43: 505–15.
Sheehy J. (1986) Reconstruction of occupational exposures to silica containing dusts in the taconite industry. Doctoral dissertation. Minneapolis, MN: University of Minnesota.
Sheehy J, McJilton C. (1990) Reconstruction of thirty years of free silica dust exposure in the taconite industry. VIIth International Pneumoconiosis Conference, Part II. Sampling and control of mineral dust, Pittsburgh, pp. 1001–06.
Wilson R, McConnell EE, Ross M et al. (2008) Risk assessment due to environmental exposures to fibrous particulates associated with taconite ore. Regul Toxicol Pharmacol; 52(1 Suppl.): S232–45.
Zanko LM, Niles HB, Oreskovich JA. (2008) Mineralogical and microscopic evaluation of coarse taconite tailings from Minnesota taconite operations. Regul Toxicol Pharmacol; 52(1 Suppl.): S51–65.
at University of M
innesota,Walter L
ibrary Serial Processing on Novem
ber 19, 2013http://annhyg.oxfordjournals.org/
Dow
nloaded from
This article was downloaded by: [University of Minnesota Libraries, Twin Cities]On: 01 April 2014, At: 09:46Publisher: Taylor & FrancisInforma Ltd Registered in England and Wales Registered Number: 1072954 Registered office: Mortimer House,37-41 Mortimer Street, London W1T 3JH, UK
Journal of Occupational and Environmental HygienePublication details, including instructions for authors and subscription information:http://www.tandfonline.com/loi/uoeh20
The Relationship between Various Exposure Metrics forElongate Mineral Particles (EMP) in the Taconite Miningand Processing IndustryJooyeon Hwang a , Gurumurthy Ramachandran a , Peter C. Raynor a , Bruce H. Alexander a &Jeffrey H. Mandel aa Division of Environmental Health Sciences, School of Public Health , University ofMinnesota , MMC 807, 420 Delaware Street SE, Minneapolis , MN , 55455 , USAAccepted author version posted online: 10 Feb 2014.Published online: 10 Feb 2014.
To cite this article: Jooyeon Hwang , Gurumurthy Ramachandran , Peter C. Raynor , Bruce H. Alexander & Jeffrey H. Mandel(2014): The Relationship between Various Exposure Metrics for Elongate Mineral Particles (EMP) in the Taconite Mining andProcessing Industry, Journal of Occupational and Environmental Hygiene, DOI: 10.1080/15459624.2014.890287
To link to this article: http://dx.doi.org/10.1080/15459624.2014.890287
Disclaimer: This is a version of an unedited manuscript that has been accepted for publication. As a serviceto authors and researchers we are providing this version of the accepted manuscript (AM). Copyediting,typesetting, and review of the resulting proof will be undertaken on this manuscript before final publication ofthe Version of Record (VoR). During production and pre-press, errors may be discovered which could affect thecontent, and all legal disclaimers that apply to the journal relate to this version also.
PLEASE SCROLL DOWN FOR ARTICLE
Taylor & Francis makes every effort to ensure the accuracy of all the information (the “Content”) containedin the publications on our platform. However, Taylor & Francis, our agents, and our licensors make norepresentations or warranties whatsoever as to the accuracy, completeness, or suitability for any purpose of theContent. Any opinions and views expressed in this publication are the opinions and views of the authors, andare not the views of or endorsed by Taylor & Francis. The accuracy of the Content should not be relied upon andshould be independently verified with primary sources of information. Taylor and Francis shall not be liable forany losses, actions, claims, proceedings, demands, costs, expenses, damages, and other liabilities whatsoeveror howsoever caused arising directly or indirectly in connection with, in relation to or arising out of the use ofthe Content.
This article may be used for research, teaching, and private study purposes. Any substantial or systematicreproduction, redistribution, reselling, loan, sub-licensing, systematic supply, or distribution in anyform to anyone is expressly forbidden. Terms & Conditions of access and use can be found at http://www.tandfonline.com/page/terms-and-conditions
[Appendix 2]

ACCEPTED MANUSCRIPT
ACCEPTED MANUSCRIPT 1
The Relationship between Various Exposure Metrics
for Elongate Mineral Particles (EMP) in the Taconite Mining and Processing Industry
JOOYEON HWANG, GURUMURTHY RAMACHANDRAN, PETER C. RAYNOR,
BRUCE H. ALEXANDER, and JEFFREY H. MANDEL
Division of Environmental Health Sciences, School of Public Health, University of Minnesota,
MMC 807, 420 Delaware Street SE, Minneapolis, MN 55455, USA
Keywords: elongate mineral particles (EMP), taconite, size-based definitions for EMP
exposures, NIOSH 7400
Word Count: 5,061
ABSTRACT
Different dimensions of elongate mineral particles (EMP) have been proposed as being relevant
to respiratory health end-points such as mesothelioma and lung cancer. In this article, a
methodology for converting personal EMP exposures measured using the NIOSH 7400/7402
methods to exposures based on other size-based definitions has been proposed and illustrated.
Area monitoring for EMP in the taconite mines in Minnesota's Mesabi Iron Range was
conducted using a Micro Orifice Uniform Deposit Impactor (MOUDI) size-fractionating sampler.
EMP on stages of the MOUDI were counted and sized according to each EMP definition using
an indirect-transfer transmission electron microscopy (ISO Method 13794). EMP were identified
using energy-dispersive x-ray and electron diffraction analysis. Conversion factors between the
Dow
nloa
ded
by [
Uni
vers
ity o
f M
inne
sota
Lib
rari
es, T
win
Citi
es]
at 0
9:46
01
Apr
il 20
14
ACCEPTED MANUSCRIPT
ACCEPTED MANUSCRIPT 2
EMP counts based on different definitions were estimated using (1) a linear regression model
across all locations and (2) a location-specific ratio of the count based on each EMP definition to
the NIOSH 7400/7402 count. The highest fractions of EMP concentrations were found for EMP
that were 13 µm in length and 0.2 0.5 µm in width. Therefore, the current standard NIOSH
method 7400, which only counts EMP > 5 µm in length and ≥ 3 in aspect ratio, may
underestimate amphibole EMP exposures. At the same time, there was a high degree of
correlation between the exposures estimated according to the different size-based metrics.
Therefore, the various dimensional definitions probably do not result in different dose-response
relationships in epidemiological analyses. Given the high degree of correlation between the
various metrics, a result consistent with prior research, a more reasonable metric might be the
measurement of all EMP irrespective of size.
INTRODUCTION
A number of studies have been published on the relationship between exposure to asbestiform
“fibers” and health effects such as lung cancer and mesothelioma. Since the term “fiber” has
been controversial in the context of asbestos (1)
, the National Institute for Occupational Safety
and Health (NIOSH) has recently proposed the use of the term “elongate mineral particles” or
EMP to refer to mineral particles with a minimum aspect ratio of 3:1 that are of inhalable,
thoracic, or respirable size (2)
.
The current regulations for asbestiform EMP are based on length (≥ 5 µm) and aspect ratio (> 3:1)
measured using the NIOSH Method 7400, a counting protocol that has been criticized as lacking
Dow
nloa
ded
by [
Uni
vers
ity o
f M
inne
sota
Lib
rari
es, T
win
Citi
es]
at 0
9:46
01
Apr
il 20
14

ACCEPTED MANUSCRIPT
ACCEPTED MANUSCRIPT 3
a scientific basis (3, 4)
. EMP dimensions are important because: (1) the different sizes of EMP
penetrate to and deposit in different regions of the lung, (2) the macrophages cannot remove
EMP from the lung when they are longer than the macrophage diameter, and (3) the lung cannot
function properly when thinner EMP deposit in the alveolar region of the lung (5)
. Other EMP
characteristics related to toxic health effects include the morphological habit, chemical
composition, and activity (5, 6, 7)
.
Minnesota counties in the vicinity of taconite mining operations have been found to have
elevated age-adjusted rates for mesothelioma (8)
, a disease thought to be associated with exposure
to asbestiform EMP. Studies measuring EMP dimensions have been relatively scarce (9)
.
However, due to the characteristics of the ore body, non-asbestiform EMP are a potentially major
source of exposure and therefore, adverse health effects may be linked also to non-asbestiform
EMP. To date, no study has conducted an extensive assessment of the relationship between non-
asbestiform EMP and adverse health effects in taconite mining industry. In general, non-
asbestiform cleavage fragments have not been thought to have high potential for disease (7, 10, 11)
.
In the taconite mining industry, cleavage fragments refer to the fractured mineral EMP created
during the crushing and fracturing process (2)
. Because no standard definition exists,
distinguishing cleavage fragments from asbestiform EMP is challenging (12)
. Even if a given
EMP counting criterion is met, standard methods such as phase contrast microscopy (NIOSH
method 7400) (13)
or transmission electron microscopy (NIOSH method 7402) (14)
cannot
distinguish between non-asbestiform cleavage fragments and asbestiform EMP. Researchers
Dow
nloa
ded
by [
Uni
vers
ity o
f M
inne
sota
Lib
rari
es, T
win
Citi
es]
at 0
9:46
01
Apr
il 20
14

ACCEPTED MANUSCRIPT
ACCEPTED MANUSCRIPT 4
have found that non-asbestiform cleavage fragments are inactive in in vitro bioassays and that
they have less strength and flexibility in morphologic analyses (6, 7)
. A linear relationship has
been found to exist between the width and length of cleavage fragments, while no such relation
exists in asbestiform EMP (15)
. The term "amphibole EMP" refers to a subset of double chain
silicate minerals that can be asbestiform or non-asbestiform (2, 15)
. Cleavage fragments are likely
thicker than asbestiform EMP, while asbestiform EMP are likely to be longer and more flexible
(4).
Because of the difficulty in distinguishing between asbestiform and non-asbestiform EMP, the
relationship between the size of non-asbestiform EMP and carcinogenic lung disease is still not
well understood (2)
. Although the chemical composition of asbestiform and non-asbestiform EMP
can be the same, they differ in their habit or morphology (16, 17)
. Asbestiform EMP are
"polyfilamentous" whereas non-asbestiform EMP display a "multidirectional" pattern (15)
.
No consensus exists regarding the most health-relevant, dimension-based exposure metric for
EMP. Stanton et al. (18)
ascribed carcinogenicity to EMP with a length greater than 8 µm and a
diameter less than 0.25 µm. Berman et al. (19)
suggested that asbestos EMP greater than 5 µm in
length contributed to lung tumor risk, while those less than 5 µm did not contribute to the risk. A
panel of experts convened by the Agency for Toxic Substances and Disease Registry (1)
concluded that asbestos and synthetic vitreous fibers shorter than 5 μm are unlikely to cause
cancer in humans. Chatfield (20)
proposed a protocol that defined asbestiform EMP as those with
widths between 0.04 μm and 1.5 μm in width and aspect ratio between 20 and 1000; EMP that
Dow
nloa
ded
by [
Uni
vers
ity o
f M
inne
sota
Lib
rari
es, T
win
Citi
es]
at 0
9:46
01
Apr
il 20
14

ACCEPTED MANUSCRIPT
ACCEPTED MANUSCRIPT 5
did not fall in these ranges are considered non-asbestiform EMP including cleavage fragments.
The Occupational Safety and Health Administration (21)
also defined the cleavage fragments as
those with aspect ratio less than 20.
Other researchers have argued against ruling out the effect of short fibers. Suzuki et al. (22)
concluded that shorter (≤ 5 μm) and thinner EMP (≤ 0.25 μm) were more strongly associated
with malignant mesothelioma through analysis of lung and mesothelial tissues in human patients.
Dement et al. (23)
showed that exposures to EMPS with all combinations of dimensions (lengths
ranging from < 1.5 µm to > 40 µm and widths ranging from < 0.25 µm to > 3.0 µm) were highly
associated with lung cancer and asbestosis. This result led them to conclude that the traditional
method, which only counts EMP longer than 5 μm, may be deficient. In fact, shorter EMP also
contribute to health-relevant work exposures, a contribution that may be important (24)
.
Table 1 summarizes the dimension-based EMP definitions that will be used in this paper. In
Figure 1, the same four size-based EMP definitions are compared using a typical sample
collected for this study. Each graph shows the same particle counts from five stages of a Micro
Orifice Uniform Deposit Impactor (MOUDI) cascade impactor (Model 125R MOUDI-II, MSP
Co., Shoreview, MN), overlaid by a polygon that indicates one of the size-based definitions.
There are no overlapping areas between the NIOSH and Suzuki et al. definitions or the Chatfield
EMP and Cleavage Fragment definitions. Typically, few EMP were identified by the NIOSH and
Chatfield definitions, while many were identified by the Suzuki and Cleavage fragment
Dow
nloa
ded
by [
Uni
vers
ity o
f M
inne
sota
Lib
rari
es, T
win
Citi
es]
at 0
9:46
01
Apr
il 20
14

ACCEPTED MANUSCRIPT
ACCEPTED MANUSCRIPT 6
definitions. A lack of consensus on the appropriate exposure metric can partially explain the
different exposure-response relationships obtained in an epidemiological study (25)
.
The aims of this study were to: 1) determine the size distribution by length and width of EMP as
measured using the MOUDI in different representative locations in each of the six taconite mines
currently operating in the Mesabi Iron Range; 2) develop a methodology to determine the
relationships between the standard NIOSH Methods 7400/7402-based EMP exposure metric to
the other dimension-based EMP exposure metrics.
The current research was carried out as part of an epidemiological study investigating the
relationship between exposures to EMP during the mining and processing of taconite ore and
respiratory diseases.
METHODS
Sampling sites
The mineralogy of the Mesabi Iron Range in northeastern Minnesota changes from east to west
with distinct metamorphic mineralogical zones. In the eastern zone, the iron ore contains
amphibole, whereas the ore in the western zone contains predominantly phyllosilicates that are
not regulated as asbestiform or amphibole EMP (26, 27)
.
Dow
nloa
ded
by [
Uni
vers
ity o
f M
inne
sota
Lib
rari
es, T
win
Citi
es]
at 0
9:46
01
Apr
il 20
14

ACCEPTED MANUSCRIPT
ACCEPTED MANUSCRIPT 7
Based on the mineralogical characteristics of the two zones, taconite mining may potentially lead
to exposures to different types of EMP. Our exposure assessment strategy attempted to capture
this difference. Currently, one mine operates in the eastern zone (mine A) and five mines in the
western zone (mines B, C, D, E, and F). The first criterion for the sampling design was to
determine locations for area sampling representing the eastern and western zones that generally
corresponded to the similar exposure groups (SEGs), the basis for personal sampling (28)
. The
term location is used to refer to physical places where the area measurements were obtained for
each SEG. Table 2 lists the number of area MOUDI samples taken and the number of locations
sampled by mine.
Sampling design
Area samples, taken during normal operating conditions at locations representative of each SEG,
were collected in up to two samples per location. The samples were obtained using a MOUDI
impactor. The cut sizes of the 13 impactor stages ranged from 0.010 µm to 10 µm. Based on
observations of stage loading and to be able to assess a broad range of aerodynamic particle size
intervals within a budget that limited the number of samples, we chose stages 3, 5, 7, 9 and 11 –
corresponding to size intervals of 3.2-5.6 µm, 1.0-1.8 µm, 0.32-0.56 µm, 0.10-0.18 µm, and
0.032-0.056 µm, respectively – for further microscopic analysis. The inlet flow rate from the
attached vacuum pump (Model R 5, Busch USA, Virginia Beach, VA, USA) was ~10 L/min and
the duration of each sample was 4 hours. The impaction plate used a hydrophilic polycarbonate
membrane filter (Isopore Co., Billerica, MA, USA) suitable for analyzing the chrysotile,
Dow
nloa
ded
by [
Uni
vers
ity o
f M
inne
sota
Lib
rari
es, T
win
Citi
es]
at 0
9:46
01
Apr
il 20
14

ACCEPTED MANUSCRIPT
ACCEPTED MANUSCRIPT 8
amphibole, and non-amphibole EMP on each stage. The after-filter for the impactor used
polytetrafluoroethylene (PTFE) filters with laminated PTFE supports (SKC Inc., Eighty Four,
PA, USA).
Analytical methods
The ISO 13794 method, adopted to analyze the impactor samples, provides details of EMP
dimension, structure type, and mineral type for each EMP regardless of the EMP dimension (29)
.
ISO 13794 immerses the whole filter in water and re-filters the particles suspended in the water
through a secondary filter. Thus, the particles are indirectly but evenly distributed across the
surface of the secondary filter. Eypert_Blaison et al. (33)
compared previous studies in which the
direct versus the indirect methods of measuring EMP were used. They found that the indirect
method resulted in higher measurements of EMP than the direct, suggesting several reasons for
the difference. With the indirect method, large structures can be separated by calcinations,
ultrasonic dispersion, and re-dispersion procedures during TEM preparation (32)
. Conversely,
with the direct method, organic debris can hide EMP because the filters are not ashed (34)
.
Eypert_Blaison et al. (33)
also compared studies in which the direct versus the indirect methods of
measuring chrysotile were used, finding that the direct method resulted in higher measurements
than the polycarbonate indirect method although the majority of EMP in this study were
amphibole. They pointed out that EMP can be lost during evaporation using indirect method,
while the EMP density for an overloaded filter is underestimated using the direct method.
Dow
nloa
ded
by [
Uni
vers
ity o
f M
inne
sota
Lib
rari
es, T
win
Citi
es]
at 0
9:46
01
Apr
il 20
14

ACCEPTED MANUSCRIPT
ACCEPTED MANUSCRIPT 9
However, they did not identify any differences between the two methods due to EMP size
distribution.
The resolution limit of ISO 13794 is 0.3 µm in length and 0.1 µm in width, and we counted all
fibers > 0.3 µm in length with an aspect ratio > 3. Therefore, our data have both counts and sizes
of each EMP for each of the MOUDI stages analyzed in each location. All analyses were carried
out at an American Industrial Hygiene Association-accredited laboratory (EMSL Analytical Inc.,
Minneapolis, MN, USA).
ISO 13794 classifies EMP into three distinct categories: chrysotile, amphibole, and non-
amphibole EMP. The non-amphibole EMP do not include the chrysotile EMP. The amphibole
EMP were further classified into five types: amosite/cummingtonite-grunerite,
crocidolite/riebeckite, tremolite asbestiform/tremolite, anthophyllite asbestiform/ anthophyllite,
and actinolite asbestiform/actinolite. The transmission electron microscopy (TEM) method for
identifying each EMP using ISO 13794 was the same as that used for NIOSH Method 7402 (14)
,
based on the diffraction pattern and chemical spectrum for each EMP. Each type of amphibole
EMP has a certain ratio of Na, Mg, Si, Ca, and Fe. EMP that did not fit in either the chrysotile or
amphibole category were classified as non-amphibole.
Dow
nloa
ded
by [
Uni
vers
ity o
f M
inne
sota
Lib
rari
es, T
win
Citi
es]
at 0
9:46
01
Apr
il 20
14
ACCEPTED MANUSCRIPT
ACCEPTED MANUSCRIPT 10
Data management
The impactor data were used to determine the distribution of EMP sizes and derive the
relationships between various dimension-based EMP exposure metrics. The assessment of
cumulative exposure according to these metrics will enable epidemiological testing of various
hypotheses regarding the health-relevance of different sizes of EMP.
Since only five chrysotile EMP (also known as a common commercial asbestiform EMP) were
found from a total of 2931 identified EMP, we excluded these particles from further analysis.
While EMP analysis using TEM can distinguish between amphibole and non-amphibole EMP, it
cannot distinguish between asbestiform and non-asbestiform EMP. Therefore, in this paper,
“total EMP” refers to both amphibole and non-amphibole/non-chrysotile EMP and “amphibole
EMP” refers to amosite/cummingtonite-grunerite and actinolite asbestiform/actinolite EMP
(which were the only types of amphiboles found in our samples).
For each sample, grid openings were analyzed for EMP until either the 100th particle was
counted or the required analytical sensitivity was achieved, whichever occurred first (29)
. The
EMP count was normalized by the number of grid openings analyzed in each substrate for each
location by zone. If more than one sample was obtained at a location in a mine, we tallied the
EMP for all samples and then divided by the corresponding number of samples to obtain the
average EMP count for that location. If a sampled location was representative of more than one
SEG, we assigned the data from the sampled location to all the relevant SEGs.
Dow
nloa
ded
by [
Uni
vers
ity o
f M
inne
sota
Lib
rari
es, T
win
Citi
es]
at 0
9:46
01
Apr
il 20
14

ACCEPTED MANUSCRIPT
ACCEPTED MANUSCRIPT 11
Because we analyzed only selected stages, the non-analyzed stages were estimated as an
arithmetic average of the two adjacent stages. As we show later, this interpolation was justifiable
because the counts of EMP on alternate MOUDI stages were not significantly different. Only the
data from stages 3 to 11 were considered because EMP were not analyzed on stages 1, 2, 12, and
13. Size-integrated EMP counts for an impactor sample were the sum of the counts for all stages
between 3 and 11. Total (or amphibole) EMP were counted for each stage using dimension-
based metrics. We converted the normalized EMP count from number of particles to
concentration (particles/cm3) by dividing the number of EMP per sample by the product of the
grid opening area and the number of grid openings observed, multiplying by the effective area of
the secondary filter, and then dividing by the sampled air volume.
Statistical analyses
All analyses reported here were conducted using SAS version 9.3 (SAS Institute, Cary, NC,
USA). Statistical significance was defined by levels of 0.05 or lower.
A two-way ANOVA was used to examine whether concentration differences between stages of
the MOUDI are significant for each location. We started with two main effects (impactor stage
and location) and then included the interaction of impactor stage and location to see if the
interaction term was significant. In addition, Tukey’s studentized range was used for pair-wise
comparisons of the log of the number concentration of EMP collected on each stage.
Dow
nloa
ded
by [
Uni
vers
ity o
f M
inne
sota
Lib
rari
es, T
win
Citi
es]
at 0
9:46
01
Apr
il 20
14

ACCEPTED MANUSCRIPT
ACCEPTED MANUSCRIPT 12
The associations between NIOSH 7400 and various total EMP concentration metrics such as
Suzuki, Chatfield, and Cleavage Fragments were assessed (a) using a simple linear regression
based on the log-transformed exposure concentrations across all locations in the eastern zone
(Equation 1) and (b) the ratio of the log-transformed exposure concentrations according to each
alternative metric and the NIOSH 7400 metric across all locations in the western zone (Equation
2). Since no amphibole EMP were counted by the NIOSH metrics in the western zone, the
regression approach characterizes an overall conversion factor for total EMP across locations in
each zone:
CDefinition=a1 (CNIOSH EMP )b for total and amphibole EMP in the eastern zone
(Equation 1)
CDefinition=a2 (CNIOSH EMP) for total EMP in the western zone
(Equation 2)
where CDefinition = concentration of total EMP that meet a specific size definition, CNIOSH EMP =
concentration of total EMP that meet the NIOSH 7400 definition, a1= intercept based on linear
regression between the log-transformed concentrations CDefinition and CNIOSH EMP, b = slope based
on the linear regression, and a2 = ratio of concentration of each size EMP definition to NIOSH
7400 definition based on linear regression.
Dow
nloa
ded
by [
Uni
vers
ity o
f M
inne
sota
Lib
rari
es, T
win
Citi
es]
at 0
9:46
01
Apr
il 20
14

ACCEPTED MANUSCRIPT
ACCEPTED MANUSCRIPT 13
The second approach characterizes the ratio of each size-based EMP definition to NIOSH 7400
and 7402 by location (Equation 3). In this way there is a separate conversion factor for each
location for both total and amphibole EMP in both zones.
CDefinition = aiCNIOSH EMP for the ith
location
(Equation 3)
RESULTS
To assess the relationship between the EMP size distribution and stages, we performed pair-wise
comparisons of the counts on the various stages. Ten stage comparisons (combinations of stages
3, 5, 7, 9, and 11) were carried out for both the total and amphibole EMP concentration. Only
two pair-wise stage comparisons (stages 5 vs. 9, and 5 vs. 11) out of 10 in the eastern zone and
one pair-wise stage (stages 3 vs. 11) out of 10 in the western zone were significantly different at
α = 0.05. The interaction of location and stage was not a significant variable in either geologic
zone (p-value: 0.9980 in the east, 0.3967 in the west). When the model was run without the
interaction term, the two main effects (stage and location) were significant variables in both
zones.
Considerable differences between the two geological zones were found for total and amphibole
EMP. Figure 2 shows the combined EMP concentration of stages 3 through 11 by location in the
eastern zone, with a reference line indicating the NIOSH recommended exposure limit (REL) of
Dow
nloa
ded
by [
Uni
vers
ity o
f M
inne
sota
Lib
rari
es, T
win
Citi
es]
at 0
9:46
01
Apr
il 20
14

ACCEPTED MANUSCRIPT
ACCEPTED MANUSCRIPT 14
0.1 particles/cm3 for EMP. The reference line is shown only as a benchmark, and not to show
compliance as the MOUDI measurements are area samples obtained over 4 hours. However, the
total EMP classification does not necessarily refer to regulated asbestiform EMP, because the
NIOSH 7400 cannot differentiate between asbestiform and non-asbestiform EMP and also refers
to a very specific range of lengths and widths. We only present EMP results in the eastern zone
because the concentrations of EMP in the eastern zone are markedly higher than that in the
western zone. The highest exposure location per department was selected in Figures 2 – 3 (all
locations are available in the online supplement). Pair-wise comparisons using a t-test indicated
that average total and amphibole EMP concentrations at similar locations were significantly
different between the two zones (p-value < 0.0001).
When a location had a high concentration of total EMP, there was also a high concentration of
amphibole EMP (e.g., location corresponding to Railroad SEG). In the eastern zone, the highest
concentration for total and amphibole EMP was found in the location corresponding to
Operating technician SEG, which was at least 2.4 times higher than the second highest
concentration found in the Railroad location. In the western zone, the location corresponding to
the Boiler technician SEG was the only location in which the concentration of total EMP
exceeded the NIOSH recommended exposure limit (REL) of 0.1 EMP/cm3, while none of the
locations had amphibole EMP concentrations exceeding the REL.
The total and amphibole EMP concentrations for the four different size-based definitions in the
eastern zone are shown in Figure 3. Again, the reference line indicates the REL for EMP and the
Dow
nloa
ded
by [
Uni
vers
ity o
f M
inne
sota
Lib
rari
es, T
win
Citi
es]
at 0
9:46
01
Apr
il 20
14
ACCEPTED MANUSCRIPT
ACCEPTED MANUSCRIPT 15
y-axis scale for amphibole EMP is different than for total EMP. Much lower concentrations were
observed for the NIOSH and Chatfield definitions than the Suzuki, in which shorter EMP are
counted. The highest concentrations for total and amphibole EMP were observed for the
Cleavage Fragment definition. Again, the location corresponding to Operating technician SEG
had the highest EMP concentration for all size-based definitions. In the western zone, we
observed substantially lower concentrations of both total and amphibole EMP for all definitions.
For total EMP, the concentration levels for most of the locations in the eastern zone were above
the REL, while all but one location in the western zone had concentration levels below the REL.
Figure 3 indicates that the relative magnitudes of the concentrations of total and amphibole EMP
at selected locations were similar using the different exposure definitions. It is emphasized that
the EMP concentrations in this paper are not personal exposure samples; therefore, the values do
not necessarily mean that workers are exposed above the REL.
Figure 4 provides the coefficients of determination (R2) between various dimension-based EMP
definitions for total and amphibole EMP in the eastern zone for log-transformed concentration
data. High R2 were found for total and amphibole EMP (R
2 ranges: 0.90 - 0.98 and 0.84 - 0.99,
respectively), consistent with the pattern of concentrations across locations according to the
different EMP definitions in the eastern zone displayed in Figure 3. The slightly lower
correlation among definitions for amphibole EMP might be taken as an indication that the
concentrations based on these definitions are more independent, the low amphibole EMP
concentration in the western zone support such an interpretation. The coefficients of
determination for total EMP concentration in the western zone with log-transformed
Dow
nloa
ded
by [
Uni
vers
ity o
f M
inne
sota
Lib
rari
es, T
win
Citi
es]
at 0
9:46
01
Apr
il 20
14
ACCEPTED MANUSCRIPT
ACCEPTED MANUSCRIPT 16
concentration data are shown in Figure 5. Except for one coefficient of determination between
the Suzuki and Cleavage Fragment definitions (R2 = 0.88), the coefficients of determination for
total EMP in the western zone were low (R2
= 0.14 - 0.58).
A regression model (Equation 1) was derived to relate EMP log-concentrations based on NIOSH
7400 to the log-concentrations based on each of the other size-based EMP definitions for total
and amphibole EMP (Table 3). This regression equation is applicable across all locations for
total EMP in the eastern zone. However, the regression coefficients for both the intercept and
slope were not significant for total EMP in the western zone. Therefore, we used a different
regression model (Equation 2) to determine a ratio of concentration based on each size-based
definition to NIOSH 7400 EMP concentration across all locations in the western zone.
The regression coefficients for both total and amphibole EMP in the eastern zone were calculated
for uncertainty estimates. The 95% confidence intervals are only shown for the slope. The largest
range for the slope estimates was found for the amphibole Chatfield EMP (95% CI= 0.296,
1.707). The concentrations of amphibole EMP in the western zone identified by NIOSH 7400
were zero, except at the location corresponding to the Concentrator operator SEG (0.0002
particles/cm3). Therefore, no regression parameters were estimated for amphibole EMP in the
western zone.
Table 4 shows the ratios of EMP concentrations based on the Suzuki, Chatfield, and Cleavage
fragment definitions to EMP concentration based on the NIOSH 7400 and 7402 definitions, by
location for total and amphibole EMP in both zones. Many of these ratios for amphibole EMP
Dow
nloa
ded
by [
Uni
vers
ity o
f M
inne
sota
Lib
rari
es, T
win
Citi
es]
at 0
9:46
01
Apr
il 20
14

ACCEPTED MANUSCRIPT
ACCEPTED MANUSCRIPT 17
are not available in the western zone because amphibole EMP were not observed in the MOUDI
measurements in this zone. For both total and amphibole EMP, the ratios for the Cleavage
Fragment definition generally have the largest values, followed by those for the Suzuki and
Chatfield definitions. Also, the ratios for total EMP tend to be larger than those for amphibole
EMP.
Figure 6 presents the size distribution by length and width of total EMP for six representative
locations (one in each department except office/control room) in the eastern zone. For each
location, the fraction of the total EMP in each of 25 categories (5 lengths x 5 widths) was
calculated. The sum of the fractions of amosite/cummingtonite-grunerite (black) and non-
amphibole/non-chrysotile EMP (gray) over all the categories is equal to one. Interestingly, the
size distribution category 1- 3 µm in length and 0.2 - 0.5 µm in width contained the highest
fraction of total EMP for all locations in the eastern zone.
DISCUSSION
This study is the first comprehensive assessment of the size distributions of EMP in the six
currently operating mines in the Mesabi Iron Range. In addition, this is the first attempt to
understand the relationships between exposures based on different EMP exposure metrics.
Dow
nloa
ded
by [
Uni
vers
ity o
f M
inne
sota
Lib
rari
es, T
win
Citi
es]
at 0
9:46
01
Apr
il 20
14

ACCEPTED MANUSCRIPT
ACCEPTED MANUSCRIPT 18
Comparison between total and amphibole EMP by zones
The concentrations of both total and amphibole EMP were much higher in the eastern zone than
in the western, which is consistent with the geological differences between the zones. Higher
amphibole EMP concentrations are found in the mining processes than in the shop areas. Both
total and amphibole Cleavage Fragment concentrations are clearly higher in the mining
processes, consistent with the generation of cleavage fragments in the mining and processing of
ore. Some of these EMP may conform to the regulatory fiber definition of length greater than 5
µm and aspect ratio of at least 3:1 even if they are not asbestiform in habit.
Comparison between various dimension-based EMP exposure metrics
We found that relative magnitudes of concentrations across locations were similar for the
different dimension-based EMP definitions in the eastern zone, a similarity that was more
obvious in the mining processes (e.g., mining, crushing, concentration, and pelletizing) than in
the shop area. Even though the measured levels of total and amphibole EMP concentrations
using each size-based definition were different, the metrics themselves were highly correlated in
our study. The high correlation among these EMP concentration metrics will limit the ability of
epidemiological analyses in determining relative differences in health effect due to exposure to
different EMP metrics. In other words, the effects of correlated relationships are not identifiable.
Quinn et al. (25)
showed that the ranges of the R2
for different size-based EMP definitions were
0.02-0.89. They explained the impact of relationships among the alternative definitions in
epidemiologic analysis. If one EMP definition is more closely related to the health effects, there
Dow
nloa
ded
by [
Uni
vers
ity o
f M
inne
sota
Lib
rari
es, T
win
Citi
es]
at 0
9:46
01
Apr
il 20
14

ACCEPTED MANUSCRIPT
ACCEPTED MANUSCRIPT 19
would be a loss of power using another EMP definition. Dement et al. (23)
showed that exposures
to various combinations of EMP dimensions (lengths ranging from < 1.5 µm to > 40 µm and
widths ranging from < 0.25 µm to > 3.0 µm) were all highly associated with lung cancer and
asbestosis. This could be because of correlation between the exposures based on various length
and width combinations in that study. Stayner et al. (30)
also conceded that the main limitation of
their study about the fiber dimension in an asbestos textile plant was the high degree of
correlation between size-specific cumulative exposure measures.
Relationship between NIOSH and other definitions
We assessed both the concentration and size distribution of EMP using different size-based
definitions to understand the relationships among these exposure metrics. The various size-based
definitions resulted in different EMP counts, implying that the specific definition used had a
significant effect on the EMP exposure levels. The relationships developed from this analysis
will be used to convert historical personal exposure data measured by NIOSH 7400 to the
alternative exposure metrics for use in epidemiological analyses.
Quinn et al. (25)
and Dement et al. (23)
presented an “adjustment factor” or a simple ratio of PCM
to TEM for the EMP dimension categories. In our study, the relationship between each EMP
dimension index and the NIOSH 7400 definition was created by 1) a location-specific ratio, and
2) a regression model based on data across all locations. The regression equation led to ratios
that were in the same range as the location-specific ratios.
Dow
nloa
ded
by [
Uni
vers
ity o
f M
inne
sota
Lib
rari
es, T
win
Citi
es]
at 0
9:46
01
Apr
il 20
14

ACCEPTED MANUSCRIPT
ACCEPTED MANUSCRIPT 20
The ratios varied by zone. The high ratios and wide range for total EMP using the Cleavage
Fragment definition in the western zone indicate that cleavage fragments are a greater percentage
of what is in the western zone. On the other hand, ratios for amphibole EMP detected using the
Chatfield definition in the eastern zone had a narrow range, indicating that relatively few
Chatfield EMP in this zone. We also found that the short EMP metrics (Suzuki and Cleavage
fragments) were more likely to have high ratios. Thus, exposures based on these metrics are
likely to be greater than those measured by the standard analytical methods that do not count
short EMP.
Taconite EMP size distribution
The highest count fractions of EMP concentration were found for particles with 1 - 3 µm in
length and 0.2 - 0.5 µm across locations. This refers to short EMP and is a subset of the Suzuki
and Cleavage Fragment definitions. Dodson et al. (31)
concluded that asbestos EMP of all lengths
induce pathological responses and cautioned against ignoring EMP shorter than 5 µm in length,
as they constitute most of the contributions of EMP to exposure. In our measurements, most of
the EMP are shorter than 5 µm in length and 1 µm in width. The NIOSH methods only count
EMP greater than 5 µm in length; thus, shorter EMP are not counted. No significant differences
existed in the EMP length and width distributions across locations.
Dow
nloa
ded
by [
Uni
vers
ity o
f M
inne
sota
Lib
rari
es, T
win
Citi
es]
at 0
9:46
01
Apr
il 20
14

ACCEPTED MANUSCRIPT
ACCEPTED MANUSCRIPT 21
Limitations of this study
This study was conducted using area measurements with limited number of samples for each
location in each mine to understand the relationship between the various exposure metrics that
can then be applied to personal exposure measurements based on NIOSH 7400. Ideally, each
personal sample would have been analyzed using ISO 13794 to obtain EMP counts according to
each exposure metric. However, this approach was not feasible due to budgetary constraints.
Furthermore, the area samples from stages 1, 2, 12, 13 were not analyzed, and the potential
impact of this might underestimate the EMP exposures. However, the area measurements
provided useful insights, chief among them that the exposures based on various metrics were
significantly correlated with each other. Since asbestiform and non-asbestiform amphibole EMP
are chemically identical, our data based on TEM analysis cannot distinguish between them. This
method includes expanded characterization of elemental composition with energy dispersive X-
ray analysis and crystalline structure by selected area electron diffraction. While laboratories
typically claim to distinguish between asbestiform and non-asbestiform EMP using TEM, a more
conservative assessment is that this method can identify amphibole versus non-amphibole EMP
(in addition to chrysotile EMP). For instance, although the contracted laboratory used the terms
"amosite" and "actinolite", common in asbestos terminology, "amosite” can mean either amosite
(asbestiform) or cummingtonite-grunerite (non-asbestiform). The Chatfield definition can
classify each amphibole EMP into asbestiform and non-asbestiform categories using TEM. It is
important to note, however, that asbestiform amphibole EMP can typically be identified using
scanning electron microscopy. However, these methods have not been extensively validated.
Dow
nloa
ded
by [
Uni
vers
ity o
f M
inne
sota
Lib
rari
es, T
win
Citi
es]
at 0
9:46
01
Apr
il 20
14

ACCEPTED MANUSCRIPT
ACCEPTED MANUSCRIPT 22
While we expect that most of amphibole EMP are likely non-asbestiform in the Iron Range, this
is based on past studies (9, 27)
.
CONCLUSIONS
Many size-based definitions have been proposed for assessing concentrations of EMP. We chose
four different EMP dimensional definitions, including the NIOSH standard method to understand
the relationships between these metrics. These four have been proposed as being relevant to
respiratory diseases such as mesothelioma and lung cancer. Conversion factors were calculated
using both simple linear regressions across all locations and the ratio of the exposure according
to each definition to the NIOSH 7400 definition for each location, and these two approaches
yielded similar results.
Both the total and amphibole EMP concentrations were much higher in the eastern zone than in
the western zone. The highest fractions of EMP concentrations were found for EMP that were 1-
3 µm in length and 0.2 - 0.5 µm in width, which is a subset of Suzuki and Cleavage Fragment
definitions. Therefore, the EMP counts based on the current standard NIOSH 7400 method are
much lower than counts based on shorter EMP.
Similar exposure patterns were observed based on different EMP size definitions, consistent with
the high degree of correlation between these EMP exposures. Therefore, the independent effects
of the EMP of these various sizes will not be identifiable in epidemiological analysis. Given the
Dow
nloa
ded
by [
Uni
vers
ity o
f M
inne
sota
Lib
rari
es, T
win
Citi
es]
at 0
9:46
01
Apr
il 20
14

ACCEPTED MANUSCRIPT
ACCEPTED MANUSCRIPT 23
high degree of correlation between the various metrics, consistent with previous work by other
researchers, a more reasonable metric might be to measure all EMP irrespective of size.
ACKNOWLEGEMENT
This study was funded by the State of Minnesota. The authors also thank the taconite mining
companies for their help and support.
Dow
nloa
ded
by [
Uni
vers
ity o
f M
inne
sota
Lib
rari
es, T
win
Citi
es]
at 0
9:46
01
Apr
il 20
14

ACCEPTED MANUSCRIPT
ACCEPTED MANUSCRIPT 24
REFERENCES
1. Eastern Research Group. (2003). Report on the Expert Panel on Health Effects of Asbestos
and Synthetic Vitreous Fibers: The Influence of Fiber Length, Lexington, MA
2. NIOSH. (2011). Asbestos fibers and other elongate mineral particles: State of the science and
roadmap for research, Current intelligence bulletin 62, DHHS(NIOSH) Publication No.
2011-159. Intelligence. Cincinnati, Ohio.
3. Wylie, A., Bailey, K., Kelse, J., & Lee, R. (1993). The importance of width in asbestos fiber
carcinogenicity and its implications for public policy. American Industrial Hygiene
Association Journal, 54(5), 239 –252.
4. Addison, J., & McConnell, E. E. (2008). A review of carcinogenicity studies of asbestos and
non-asbestos tremolite and other amphiboles. Regulatory Toxicology and Pharmacology:
52(1 Suppl), pp.S187-99, 2008.
5. Baron, P. A. (2003). Measurement of Fibers. NIOSH Manual of Analytical Methods,
(NIOSH/DART), 143–166.
Dow
nloa
ded
by [
Uni
vers
ity o
f M
inne
sota
Lib
rari
es, T
win
Citi
es]
at 0
9:46
01
Apr
il 20
14
ACCEPTED MANUSCRIPT
ACCEPTED MANUSCRIPT 25
6. Wylie AG. (1990). Discriminating amphibole cleavage fragments from asbestos: Rationale
and methodology. Proceedings VII pneumoconiosis conference (Pittsburgh, Pennsylvania,
USA, 23–26 August1988), DHHS (NIOSH), Cincinnati, OH, USA, Publication no. 90-108,
part II.
7. Mossman, B. T. (2008). Assessment of the pathogenic potential of asbestiform vs.
nonasbestiform particulates (cleavage fragments) in in vitro (cell or organ culture) models
and bioassays. Regulatory Toxicology and Pharmacology : RTP, 52(1 Suppl), S200–3.
8. Case, B. W., Abraham, J. L., Meeker, G., Pooley, F. D., & Pinkerton, K. E. (2011). Applying
definitions of “asbestos” to environmental and “low-dose” exposure levels and health effects,
particularly malignant mesothelioma. J of Toxicol and Environ Health, Part B, 14: 3-39,
2011.
9. Wilson, R., McConnell, E. E., Ross, M., Axten, C. W., & Nolan, R. P. (2008). Risk
assessment due to environmental exposures to fibrous particulates associated with taconite
ore. Regulatory Toxicology and Pharmacology : RTP, 52(1 Suppl), S232–45.
10. Berry, G., & Gibbs, G. W. (2008). An overview of the risk of lung cancer in relation to
exposure to asbestos and of taconite miners. Regulatory Toxicology and Pharmacology :
RTP, 52(1 Suppl), S218–22.
Dow
nloa
ded
by [
Uni
vers
ity o
f M
inne
sota
Lib
rari
es, T
win
Citi
es]
at 0
9:46
01
Apr
il 20
14

ACCEPTED MANUSCRIPT
ACCEPTED MANUSCRIPT 26
11. Gamble, J. F., & Gibbs, G. W. (2008). An evaluation of the risks of lung cancer and
mesothelioma from exposure to amphibole cleavage fragments. Regulatory Toxicology and
Pharmacology : RTP, 52(1 Suppl), S154–86.
12. Axten, C. W., & Foster, D. (2008). Analysis of airborne and waterborne particles around a
taconite ore processing facility. Regulatory Toxicology and Pharmacology : RTP, 52(1
Suppl), S66–72.
13. NIOSH. (1994a). NIOSH manual of analytical methods (NMAM) 7400, fourth edition:
ASBESTOS and OTHER FIBERS by PCM, issue 2.
14. NIOSH. (1994b). NIOSH manual of analytical methods (NMAM) 7402, fourth edition:
ASBESTOS by TEM, issue 2.
15. Bailey, K., Kelse, J., Wylie, A., & Lee, R. (2003). The asbestiform and nonasbestiform
mineral growth habit and their relationship to cancer studies a pictorial presentation.
16. Langer, a M., Maggiore, C. M., Nicholson, W. J., Rohl, a N., Rubin, I. B., & Selikoff, I. J.
(1979). The contamination of Lake Superior with amphibole gangue minerals. Annals of the
New York Academy of Sciences, 330, 549–72.
Dow
nloa
ded
by [
Uni
vers
ity o
f M
inne
sota
Lib
rari
es, T
win
Citi
es]
at 0
9:46
01
Apr
il 20
14

ACCEPTED MANUSCRIPT
ACCEPTED MANUSCRIPT 27
17. Berndt, M. E., & Brice, W. C. (2008). The origins of public concern with taconite and human
health: Reserve Mining and the asbestos case. Regulatory Toxicology and Pharmacology :
RTP, 52(1 Suppl), S31–9.
18. Stanton, M., Layard, M., Tegerls, A., Miller, E., May, M., Morgan, E., & Smith, A. (1981).
Relation of particle dimension to carcinogenicity in amphibole asbestoses and other fibrous
minerals. Journal of National Cancer Institute, 67(5), 965–975.
19. Berman, W., Crump, K., Chatfield, E., Davis, J., & Jones, A. (1995). The sizes, shapes, and
mineralogy of asbestos structures that induce lung tumors or mesothelioma in AF/HAN rats
following inhalation. Risk Analysis, 15(No. 2).
20. Chatfield, E. (2009). A procedure for quantitative description of fibrosity in amphibole
minerals, Oral presentation, ASTM Michael E. Beard Asbestos Conference, January 28-29,
20120, San Antonio, Texas.
21. OSHA. (1998). OSHA method ID-160. Occupational Safety and Health Administration.
22. Suzuki, Y., Yuen, S., & Ashley, R. (2005). Short, thin asbestos fibers contribute to the
development of human malignant mesothelioma: pathological evidence. International Journal
of Hygiene and Environmental Health, 208(3), 201–210.
Dow
nloa
ded
by [
Uni
vers
ity o
f M
inne
sota
Lib
rari
es, T
win
Citi
es]
at 0
9:46
01
Apr
il 20
14

ACCEPTED MANUSCRIPT
ACCEPTED MANUSCRIPT 28
23. Dement, J. M., Kuempel, E. D., Zumwalde, R. D., Smith, R. J., Stayner, L. T., & Loomis, D.
(2008). Development of a fibre size-specific job-exposure matrix for airborne asbestos fibres.
Occupational and environmental medicine, 65(9), 605–12.
24. Dement, J., Harris, R., Symons, M., & Shy, C. (1983). Exposures and mortality among
chrysotile asbestos workers. Part II: Mortality. Am J Ind Med., (4(3)), 421–33.
25. Quinn, M. M., Smith, T. J., Eisen, E. a, Wegman, D. H., & Ellenbecker, M. J. (2000).
Implications of different fiber measures for epidemiologic studies of man-made vitreous
fibers. American journal of industrial medicine, 38(2), 132–9.
26. McSwiggen, P.L., and Morey, G.B. (2008) Overview of the mineralogy of the Biwabik Iron
Formation, Mesabi Iron Range, northern Minnesota: Regulatory Toxicology and
Pharmacology : RTP; 52(1 Suppl), S11-25.
27. Zanko, L. M., Niles, H. B., & Oreskovich, J. A. (2008). Mineralogical and microscopic
evaluation of coarse taconite tailings from Minnesota taconite operations. Regulatory
toxicology and pharmacology : RTP, 52(1 Suppl), S51–65.
28. Hwang, J., Ramachandran, G., Raynor, P. C., Alexander, B. H., & Mandel, J. H. (2013). A
Comprehensive Assessment of Exposures to Elongate Mineral Particles (EMP) in the
Taconite Mining Industry. Ann Occup Hyg, doi: 10.1093/annhyg/met026.
Dow
nloa
ded
by [
Uni
vers
ity o
f M
inne
sota
Lib
rari
es, T
win
Citi
es]
at 0
9:46
01
Apr
il 20
14

ACCEPTED MANUSCRIPT
ACCEPTED MANUSCRIPT 29
29. ISO. (1999). Ambient Air-Determination of Asbestos Fibres-Indirect-Transfer Transmission
Electron Microscopy Method (ISO 13794). Geneva, Switzerland.
30. Stayner, L., Kuempel, E., Gilbert, S., Hein, M., & Dement, J. (2008). An epidemiological
study of the role of chrysotile asbestos fibre dimensions in determining respiratory disease
risk in exposed workers. Occupational and environmental medicine, 65(9), 613–9.
31. Dodson, R. F., Atkinson, Ã. M. A. L., & Levin, J. L. (2003). Asbestos Fiber Length as
Related to Potential Pathogenicity : A Critical Review. Online, 297, 291–297.
32. Chesson, J., & Hatfield, J. (1990). Comparison of airborne asbestos levels determined by
transmission electron microscopy, using direct and indirect transfer techniques. United States
Environmental Protection Agency Report 560/5-89-0004. Washington D.C: Office of Toxin
substnaces, US EPA.
33. Eypert-Blaison, C., Veissiere, S., Rastoix, O., & Kauffer, E. (2010). Comparison of direct
and indirect methods of measuring airborne chrysotile fibre concentration. The Annals of
occupational hygiene, 54(1), 55–67.
34. Sebastien, P. (1985). Assessing asbestos exposure in buildings. In E. Chatfield (Ed.),
Asbestos fibres measurement in building atmospheres (pp. 139–51). Ontario, Canada:
Dow
nloa
ded
by [
Uni
vers
ity o
f M
inne
sota
Lib
rari
es, T
win
Citi
es]
at 0
9:46
01
Apr
il 20
14

ACCEPTED MANUSCRIPT
ACCEPTED MANUSCRIPT 30
Ontario Research Foundation.
Figure 1 Comparison of total EMP count for four dimension-based EMP exposure metrics by
MOUDI impactor stage for the Crusher Maintenance location in mine A. The black boxes
indicate the dimension-based EMP exposure metrics based on each definitions.
Dow
nloa
ded
by [
Uni
vers
ity o
f M
inne
sota
Lib
rari
es, T
win
Citi
es]
at 0
9:46
01
Apr
il 20
14

ACCEPTED MANUSCRIPT
ACCEPTED MANUSCRIPT 31
Figure 2 Total and amphibole EMP concentration by selected location in the eastern zone (line indicates the NIOSH REL for
NIOSH 7400/7402 EMP= 0.1 particles/cm3)
Dow
nloa
ded
by [
Uni
vers
ity o
f M
inne
sota
Lib
rari
es, T
win
Citi
es]
at 0
9:46
01
Apr
il 20
14

ACCEPTED MANUSCRIPT
ACCEPTED MANUSCRIPT 32
Figure 3 Total and amphibole EMP concentration by size-based definitions in eastern zone (line indicates the NIOSH REL for
NIOSH 7400 EMP = 0.1 particles/cm3)
Dow
nloa
ded
by [
Uni
vers
ity o
f M
inne
sota
Lib
rari
es, T
win
Citi
es]
at 0
9:46
01
Apr
il 20
14

ACCEPTED MANUSCRIPT
ACCEPTED MANUSCRIPT 33
Figure 4 Coefficients of determination between (a) total and (b) amphibole EMP definitions in the eastern zone
Mining
Crushing Concentrating
Pelletizing
Shop mobile
Shop stationary
Office
Mining
Crushing Concentrating
Pelletizing
Shop mobile
Shop stationary
Office
Mining
Crushing Concentrating
Pelletizing
Shop mobile
Shop stationary
Office
Mining
Crushing Concentrating
Pelletizing
Shop mobile
Shop stationary
Office
NIOSH
EMP
Suzuki
EMP
Chatfield
EMP
Cleavage
fragments
R2=0.94 R
2=0.93 R
2=0.97
R2=0.94 R
2=0.98
R2=0.90
NIOSH
EMP
Suzuki
EMP
Chatfield
EMP
Cleavage
fragments
R2=0.84
R2=0.99 R
2=0.87
R2=0.85 R
2=0.94 R
2=0.92
(a) (b)
NIOSH
EMP
Suzuki
EMP
Chatfield
EMP
Cleavage
fragments
R2=0.14 R
2=0.44 R
2=0.26
R2=0.88 R
2=0.58
R2=0.38
Dow
nloa
ded
by [
Uni
vers
ity o
f M
inne
sota
Lib
rari
es, T
win
Citi
es]
at 0
9:46
01
Apr
il 20
14

ACCEPTED MANUSCRIPT
ACCEPTED MANUSCRIPT 34
Figure 5. Coefficients of determination between total EMP definitions in the western zone Dow
nloa
ded
by [
Uni
vers
ity o
f M
inne
sota
Lib
rari
es, T
win
Citi
es]
at 0
9:46
01
Apr
il 20
14

ACCEPTED MANUSCRIPT
ACCEPTED MANUSCRIPT 35
Figure 6. EMP size distribution by location in eastern zone. The height of the bar in each cell represents the fraction of the total
EMP for that combination of length and width.
Maintena
nce
Lab
analyst
Pelletizin
g
Concentr
ator
Rail Operati
ng
Dow
nloa
ded
by [
Uni
vers
ity o
f M
inne
sota
Lib
rari
es, T
win
Citi
es]
at 0
9:46
01
Apr
il 20
14

ACCEPTED MANUSCRIPT
ACCEPTED MANUSCRIPT 36
Table 1 Characteristics of four dimension-based EMP metrics
a PCM: Phase contrast microscopy
TEM: Transmission electron microscopy
Table 2 Number of MOUDI samples and locations by mine
Size-based definition Width
(µm)
Length
(µm)
Aspect ratio Analysis
methods a
NIOSH EMP - > 5 ≥ 3 PCM, TEM
Suzuki et al. EMP W ≤ 0.25 ≤ 5 - PCM, TEM
Chatfield EMP 0.04 < W < 1.5 - 20 < AR < 1000 TEM
Cleavage fragment - - AR ≤ 20 TEM
Mine # MOUDI samples # Locations
A 23 17
B 14 14
C 20 16
D 12 11
E 15 15
F 8 8
Dow
nloa
ded
by [
Uni
vers
ity o
f M
inne
sota
Lib
rari
es, T
win
Citi
es]
at 0
9:46
01
Apr
il 20
14

ACCEPTED MANUSCRIPT
ACCEPTED MANUSCRIPT 37
Table 3 Regression coefficient equations between NIOSH and other definitions for total EMP in eastern zone
CDefinitiona Total EMP Amphibole EMP
Easte (95% CI) West
b East (95% CI) West
c
CSuzuki EMP 3.83CNIOSH EMP 0.744
(95% CI= 0.543, 0.945)
13.0CNIOSH EMP 6.40CNIOSH EMP 1.089
(95% CI= 0.829, 1.349)
NAd
CChatfield EMP 0.501CNIOSH EMP 0.894
(95% CI= 0.600, 1.189)
1.46CNIOSH EMP 0.328CNIOSH EMP 1.011
(95% CI= 0.269, 1.707)
NA
CCleavage fragment 8.28CNIOSH EMP0.819
(95% CI= 0.662, 0.977)
14.9CNIOSH EMP 11.9CNIOSH EMP 1.062
(95% CI= 0.788, 1.335)
NA
a Concentration of all ISO 13794 EMP that meet a specific EMP size definition.
b Regression coefficients from both intercept and slope are not statistically significant at p-value = 0.5.
c Concentrations of amphibole by NIOSH are zero in the western zone except at the Concentrator operator location.
d Not applicable (NA) because no regression parameters are estimated for amphibole EMP in the western zone."
e The 95% confidence intervals are only shown for the slope (appearing as the exponent in this table).
Dow
nloa
ded
by [
Uni
vers
ity o
f M
inne
sota
Lib
rari
es, T
win
Citi
es]
at 0
9:46
01
Apr
il 20
14

ACCEPTED MANUSCRIPT
ACCEPTED MANUSCRIPT 38
Table 4. Ratios of EMP concentrations based Suzuki, Chatfield, and Cleavage Fragment definitions to EMP concentrations
based on NIOSH 7400 and 7402 definitions
Departme
nt
Location Total EMP Amphibole EMP
East West East West
Suzu
ki
Chatfi
eld
Cleava
ge
Suzu
ki
Chatfi
eld
Cleava
ge
Suzu
ki
Chatfi
eld
Cleava
ge
Suzu
ki
Chatfi
eld
Cleava
ge
Mining Basin
operator . . . . . . . . a . . . .
Mining
operator 1 . . . . . . . . . . . .
Mining
operator 2 . . . . . . . . . . . .
Rail road 6.0 0.48 12 . . . 8.2 0.19 20 . . .
Crushing Crusher
maintenance 7.6 0.60 12 8.4 0.51 14 6.5 0.68 11 . . .
Crusher
operator 6.0 0.69 12 4.5 0.67 7.7 3.9 0.30 9.5 — — —
Operating
technician 6.0 0.67 13 . . . 5.7 0.45 11 . . .
Concentrat
ing
Concentrator
maintenance 7.5 1.1 10 24 1.0 47 3.2 0.14 6.7 — — —
Concentrator
operator . . . 57 2.8 71 . . . 2.0 0 3.8
Pelletizing Balling drum
operator — — — 43 6.0 50 — — b — — — —
Dock man — — — 0.0 0 1.0 — — — — — —
Furnace
operator 6.2 0.35 14 7.1 1.3 11 2.4 0.29 6.7 — — —
Dow
nloa
ded
by [
Uni
vers
ity o
f M
inne
sota
Lib
rari
es, T
win
Citi
es]
at 0
9:46
01
Apr
il 20
14

ACCEPTED MANUSCRIPT
ACCEPTED MANUSCRIPT 39
Pelletizing
maintenance 11 0.43 21 5.7 0.57 14 — — — — — —
Pelletizing
operator 14 1.9 18 5.8 0.86 7.0 6.5 0.75 12 — — —
Shop
mobile
Boiler
technician . . . — — — . . . — — —
Carpenter . . . 4.8 0 5.8 . . . — — —
Electrician — — — — — — — — — — — —
Lubricate
technician . . . . . . . . . . . .
Maintenance
technician 31 1.0 39 31 2.0 36 3.3 0 c 12 — — —
Pipefitter/Plu
mber . . . . . . . . . . . .
Repairman . . . — — — . . . — — —
Supervisor . . . . . . . . . . . .
Shop
stationary
Auto
mechanic — — — 41 2.3 50 — — — — — —
Lab analyst 11 0.70 16 16 4.0 19 4.8 0 9.2 — — —
Warehouse
technician — — — 18 2.0 14 — — — — — —
Office/Co
ntrol room
Control room
operator — — — — — — — — — — — —
Office staff 7. 7 0 13 4.3 1.0 8.0 0 0 3.7 — — — a : No samples/
b : NIOSH is zero /
c : Suzuki, Chatfield, or Cleavage fragment is zero.
Dow
nloa
ded
by [
Uni
vers
ity o
f M
inne
sota
Lib
rari
es, T
win
Citi
es]
at 0
9:46
01
Apr
il 20
14

1
A Comprehensive Assessment of Present-Day Exposures to Respirable Dust and Silica
in the Taconite Mining Industry
JOOYEON HWANG, GURUMURTHY RAMACHANDRAN, PETER C. RAYNOR,
BRUCE H. ALEXANDER, and JEFFREY H. MANDEL
Division of Environmental Health Sciences, School of Public Health, University of Minnesota,
MMC 807, 420 Delaware Street SE, Minneapolis, MN 55455, USA
ABSTRACT
This study assessed the present-day levels of exposure to respirable dust (RD) and respirable
silica (RS) in taconite mines and evaluated how the mining process influences exposure
concentrations. Personal samples (n=679) were collected to assess the present-day exposure
levels of workers to RD and RS at six mines on the Mesabi Iron Range. The RD and RS
concentrations were measured using NIOSH 0600 and NIOSH 7500, respectively. Between-mine,
between-SEG, and within-SEG components of variability for RD and RS exposures were
estimated using a one or two-way nested random-effects ANOVA model. The concentrations of
RD in all mines fell below the ACGIH TLV for RD. With a few exceptions, the concentrations
of RS in the crushing and concentrating processes were higher than those measured in the other
mining processes, as well as higher than the ACGIH TLV for RS. The magnetic separation and
flotation processes in the concentrating department may have reduced the levels of RS
significantly, and lowered the percentage of quartz in RD in the pelletizing department. There
was little variability among the six mines or between the two mineralogically distinct zones for
either RD or RS exposures. The between-SEG variability for RD did not differ across mines
Appendix 3

2
except that significantly smaller between-SEG variability for RS was observed in one of the
mines. This finding could be the result of the characteristics of the taconite rock, seasonal effects
during sampling, or the tasks assigned for each job in that mine.

3

4
INTRODUCTION
The potential relationship between taconite dust and health risks on northeastern Minnesota's
Mesabi Iron Range has raised concerns in the taconite mining industry and surrounding
communities. Respirable dust and silica are the most common dust components observed during
the taconite mining processes – drilling, crushing, feeding, and transferring. Respirable dust is
the fraction of inhaled dust that can penetrate into the alveolar region of the respiratory tract
using a sampler following the respirable criterion curve (ACGIH, 2013) that has a 50% sampling
efficiency for particles with an aerodynamic diameter of 4 µm. Respirable silica, which is a sub-
fraction of respirable dust, consists of two mineral forms: crystalline (free silica) and amorphous.
The crystalline form has three subgroups: quartz, tridymite, and cristobalite (Steenland &
Stayner, 1997), the most common of which is quartz. In our study, we focused on crystalline
quartz.
Exposure to the crystalline forms of silica in industrial settings has long been associated with the
development of silicosis, a fibrotic pulmonary disease (Hayumbu et al., 2008; Pelucchi et al.,
2006; Steenland & Sanderson, 2001; Archer et al., 2002; Chen et al., 2001; Collins et al., 2005).
Although the United States Geological Survey (USGS, 2013) reported that quartz production in
the U.S. dramatically increased between 1968 and 1988 (from 30 to 389 tons), production
dropped (from 464 to 189 tons) between 1989 and 2000, and data were not available after 2001.

5
Although the National Institute for Occupational Safety and Health (NIOSH, 2012) found that
the number of deaths from silicosis has decreased by a factor 10 between 1968 and 2007, several
hundred deaths per year continue as does the non-lethal lung impairment related to silica
exposure. A radiographic study of taconite miners in 1980 found several cases of silicosis but no
other significant abnormalities or diseases (Clark et al., 1980). Higgins et al. (1981) studied the
taconite workers in the Reserve Mining Company and found no association between mortality
and lifetime exposure to either respirable dust or respirable silica and concluded that the taconite
miners did not have an elevated risk of mortality. However, these were small studies with
limitations in exposure assessment and disease latency.
Only a few studies have investigated measured exposure to respirable dust and respirable silica
in the taconite mining industry. Sheehy (1986) found that respirable silica exposures in the
taconite industry often exceeded 0.1 mg/m3, which was the NIOSH REL at that time. Sheehy and
McJilton (1990) reported that the concentrations of silica-containing dust were above acceptable
limits in mines, crushers, and concentrators, but not in pellet plants. The limits referenced
included the Recommended Exposure Limit (REL), set by NIOSH, and the Permissible Exposure
Limit (PEL), set by the Mine Safety and Health Administration (MSHA). Quartz silica
concentrations ranged from less than 0.04 to 0.11 mg/m3, and no tridymite or cristobalite was
found in any of the samples (McJilton, 1984). Since the 1990s, exposure levels to respirable dust
and respirable silica have not been studied in the taconite mining industry.

6
Concentrations of respirable dust and respirable silica can vary across taconite processes. In this
article, we focus on the taconite mining processes, sub-grouped by department (mining, crushing,
concentrating, and pelletizing). In the mining step, the hard taconite rock is broken up by
dynamite. Production trucks haul the taconite rocks directly to the crushing plant, where a large
amount of dust is generated as the crushing step in processing begins. The ore is crushed to about
10 cm in diameter in the primary crusher and to smaller sizes in the secondary or tertiary crusher.
The size of the crushed ore varies by the type of crusher and mine, The crushing process
produces a noticeable amount of dust. Next, in the concentrating department, the rock is mixed
with water and ground in rotating mills until it becomes a fine powder. A magnetic separator
then removes the waste rock (called "tailings") from the iron-bearing grains of taconite powder
(called "concentrate"). Flotation processes separate lighter silica-containing particles from
heavier iron-containing particles that settle out. The last milling process, pelletizing, removes
water from the concentrated iron slurry and then mixes the slurry with bentonite clay and/or
limestone in large rotating cylinders to make pellets about 1 cm in diameter. The pellets are dried
and hardened by heating to 1300 ºC. Although this last process is dry, silica is less likely to be
present in the dust after the concentrating process.
The goals of this paper are (1) to assess the present-day exposures to respirable dust (RD) and
respirable silica (RS) in all active mines within the Minnesota taconite mining industry; (2) to
estimate the between-mine, between- SEG (similar exposure group), and within-SEG
components of variability for RD and RS exposures; and (3) to evaluate the influence of the
taconite mining and processing on exposures to RD and RS. To assess exposure concentrations

7
of these dust components, we conducted personal air sampling across all the operating mines in
the Mesabi Iron Range. Currently, one mine operates in the eastern zone (mine A) and five mines
in the western zone (mines B, C, D, E, and F).
METHODS
Formation of SEGs
SEGs can be used to assess exposures more efficiently using job titles, locations, tasks, and
procedures (Bullock & Ignacio 2006).We created a historical exposure database, which listed job
titles and areas according to tasks and processes. The job titles were mainly derived from (i)
records maintained by MSHA; (ii) information from a previous study (Sheehy, 1986) that listed
140 job titles; (iii) industrial hygiene and human resources databases maintained by the three
companies currently operating mines on the Mesabi Iron Range (U.S. Steel, Cliffs Natural
Resources, Arcelor Mittal) which listed approximately 150 job titles; and (iv) Job Descriptions
and Classifications, published by the Reserve Mining Company (1974) which contained 142 job
titles. Using information on the tasks and processes related to these job titles, we created a set of
60 SEGs. This list was further condensed to 28 SEGs using the subjective professional
judgments of the lead industrial hygienists at the three mining companies. The number of job
titles represented in each SEG ranged from 1 to 19. The final list contained 181 job titles,
forming 28 SEGs that we further grouped into seven departments. The final list contained 181
job titles, forming 28 SEGs that we further grouped into seven departments (Hwang et al., 2013).

8
Sampling design and data handling
An assessment of personal exposures was conducted across six currently operational mines on
the Mesabi Iron Range beginning in January 2010 and ending in May 2011. Prior to the day of
sampling, the researchers and representatives from the mining companies discussed workers’
schedules and identified potential participants. At the beginning of the work shift on each
sampling day, the researchers explained the purpose of the study and presented the potential
participants with the consent form approved by the University of Minnesota Institutional Review
Board (IRB code: 0901M58041).
To perform a baseline exposure assessment for a job title, the American Industrial Hygiene
Association (AIHA) sampling strategy (Bullock & Ignacio, 2006) recommends that a minimum
of 6, but preferably 8 to 10, exposure samples be obtained per SEG. Two workers per SEG were
selected for personal sampling in the eastern zone; approximately eight workers per SEG were
chosen in the western zone. Each consenting participant wore a personal air-sampling pump
(Apex Pro pump, Casella Inc., Amherst, NH, USA) on his or her waist, with the sampler located
in the breathing zone, for approximately six hours, which accounts for at least 70% of a daily
work shift. Personal sampling for each worker was completed during three different work shifts,
though not necessarily on consecutive days. One blank sample per sampling day (approximately
14% of the samples) was collected for quality control.
Each sample for RD and RS was obtained using a single filter cassette. We used a 5-m pore
size, 37-mm diameter polyvinyl chloride (PVC) membrane filter and 3-piece filter cassettes with

9
a 37-mm aluminum cyclone (SKC Inc., Eighty Four, PA, USA) for sampling. The flow rate for
the sampling pump was calibrated at 2.5 liter/min.
Analytical methods and limitations
The RD concentration, based on the mass of the respirable dust fraction, was calculated using
NIOSH 0600 Respirable particulates not otherwise regulated gravimetric (NIOSH, 1998). The
RS analysis was performed using NIOSH 7500 Crystalline silica X-ray diffraction (NIOSH,
2003). These NIOSH methods stipulate that particles collected by the filter not exceed a mass of
2 mg because the collected particles could then block the filter, resulting in a lower airflow rate
than that in the calibrated air sample. We excluded three samples that were overloaded with
particles and six that exhibited a low sampling volume from further data analysis.
If all of the measurements for a given SEG fell below the limit of detection (LOD), summary
statistics such as the arithmetic and geometric means and geometric standard deviations were
reported as “<LOD”. If at least one sample for an SEG in a particular mine had measurements
above the LOD, then summary statistics were calculated under the assumption that censored data
were represented by one half of the LOD.
Statistical analysis methods
Of the 28 SEGs, 27 were monitored. We were not able to monitor the Janitor SEG because all of
the janitors currently working in the taconite mining industry are independent contractors.

10
Furthermore, not all 27 SEGs were represented in each mine. For instance, some mines have
detailed job titles that correspond to an SEG (e.g., Boiler technician), but others have no
corresponding jobs or tasks.
For each SEG, we used a simple one-way ANOVA model to determine if there were significant
differences between mines for each SEG. The dependent variables were RD and RS,
respectively. The log-transformed estimated exposures Yij of each mine were expressed as
Yij = log (Xij) = µy + αi + εij for i = 1, 2, …, 6, and j = 1, 2,…, 12
(Equation 1)
where Xij = exposure concentration of the ith
mine at the jth
observation for each SEG, µy =
overall mean of Yij, αi = random deviation of the ith
mine’s true exposure from µy, and εij =
random deviation of the jth
observation from the ith
mine’s true exposure. Equation 1 assumes
that the εij are independently and identically distributed with a normal distribution. In addition to
the one-way ANOVA, Tukey's Studentized Range test was used for pair-wise comparison of
exposures within each mine by SEG to determine homogeneity.
A one-way nested random-effects ANOVA model was used for estimating between-SEG (BG)
and within-SEG (WG) variance components using the log-transformed exposure concentrations.
Ykj = log (Xkj) = µy + αk + εkj for the observations k = 1, 2, …, 27, and j =1, 2, …, 12

11
(Equation 2)
where Xkj = jth
observation of exposure concentration for the kth
SEG, µy = overall mean of Ykj,
αk = random deviations of the kth
SEG’s true exposure from µy, and εkj = random deviations of
the jth
observation for kth
SEG from µy, k (mean exposure of the kth
SEG). The random deviations
αk and εkj are assumed to be normally distributed with zero means and variances σ2
α and σ2
ε,
respectively. These variances are mutually uncorrelated and estimated as variance components
Sy2
BG and Sy2
WG, respectively.
A two-way nested random-effects ANOVA model was used for estimating between-mine (BM),
between-SEG (BG), and within-SEG (WG) variance components using the log-transformed
exposure concentrations.
Yikj = log (Xikj) = µy + αi + βik + εikj for the observations i =1, 2, ...6, k = 1, 2, …, 27, and
j =1, 2,…, 12 (Equation 3)
where Xikj = jth
observation of exposure concentration for the kth
SEG of the ith
mine, µy = overall
mean of Yikj, αi = random deviations of the ith
mine’s true exposure from µy, βik = random
deviations of the ith
mine’s kth
SEG’s true exposure from µy, i (mean exposure of the ith
mine),
and εikj = random deviations of the jth
observation for the ith
mine’s kth
SEG from µy, ik (mean
exposure of the kth
SEG in the ith
mine). The random deviations αi, βik, and εikj are assumed to be
normally distributed with zero means and variances σ2
α, σ2
β, and σ2
ε, respectively. These

12
variances are mutually uncorrelated and estimated as variance components Sy2
BM, Sy2
BG, and
Sy2
WG, respectively.
All analyses reported here were conducted using SAS version 9.3 (SAS Institute, Cary, NC,
USA). The variance components for each model (Equations 2 and 3) were determined using
PROC NESTED. The statistical analyses were conducted for RD and RS. Significance was
defined by p-values of 0.05 or lower.
RESULTS
Respirable dust (RD) and respirable silica (RS) concentrations
Table 1 lists the number of personal samples analyzed using both NIOSH 0600 and NIOSH 7500
for each mine. The total number of samples and the number of blanks were 679 and 132,
respectively. The blanks did not show any dust or silica above limits of detection (LOD), so they
were not used further in our analyses. Table 1 also shows the percentage of samples that had RD
and RS levels below the limit of detection (LOD), as measured by NIOSH 0600 and NIOSH
7500, respectively. Overall, many of the RD samples had levels lower than the LOD across all
mines (ranges: 39-74%), and most of the RS samples had levels lower than the LOD (ranges: 50-
79%). Table 2 shows the geometric means (GM) and geometric standard deviations (GSD) of
RD concentrations by SEG in all mines. The highest and lowest GMs were found in mine A
(0.608 mg/m3 for Balling drum operator, 0.059 mg/m
3 for Supervisor). Except for a few SEGs,
most of the GSDs were less than 3, indicating moderate variability. The highest GSD was found

13
for Dock man in mine D, which only had two measured values that differed widely (< 0.1 and
1.1 mg/m3). In mine A, Office staff was the only SEG in which all samples had RD
concentrations less than the LOD. The other five mines had multiple SEGs (~ 6–12) in which all
measurements fell below the LOD.
Similarly, Table 3 summarizes the RS concentration by SEG in all mines. The highest GM
(0.133 mg/m3) was found for Operating technician in mine C, and the highest GSD (5.22) was
found for Mining operator 1 in mine A. Even if the RD concentration was less than the LOD for
a given SEG, the RS concentration did not necessarily fall below the LOD for that same SEG,
and vice versa. For instance, all samples for the Crusher maintenance SEG in mine D had RD
concentrations less than the LOD, but not all RS concentrations were less than the LOD. For the
Pelletizing operator SEG in mine A, all samples had RS concentrations less than the LOD, but
not RD.
While mineralogical differences lead to different exposure levels for elongated mineral particles
(EMP) (Hwang et al., 2013), respirable dust and respirable silica do not differ between the two
zones. Although our sampling strategy took into account the two different mineralogical zones,
we found no differences between them for most of the SEGs. Using Equation 1 to explore the
differences in RD and RS exposure levels across mines, the p-values by SEG indicated groups
for which there was a significant difference between at least two of the mines (see Table 2 and
Table 3, respectively). Twelve SEGs had at least two mines with significantly different means
for RD (p-values: <0.0005). Only seven SEGs had at least two mines with significantly different

14
means for RS. We did not calculate p-values when no mines or only one mine had concentrations
above the LOD.
The distribution of RD and RS concentrations is illustrated by box-plots in Figure 1 and Figure
2. The RD concentrations in all mines were below the ACGIH TLV of 3 mg/m3 for RD (Figure 1
and Table 2). With a few exceptions, the RD concentrations in the milling processes (crushing,
concentration, and pelletizing) tended to be higher than those in the non-milling processes
(mining, shop (stationary), and office/control room). For many of the SEGs, the box-plot
displays almost non-existent variability (e.g., Basin operator SEG in mine B) because the
maximum and minimum values for the SEG were similar or equal because most of the samples
had concentrations less than the LOD. The RS concentrations by mine across all SEGs are shown
in Figure 2 and Table 3. Except for a few exceptions in mines B and D, the concentrations of RS
in the crushing and/or concentration processes were higher than the ACGIH TLV for RS (0.025
mg/m3), as well as higher than those measured in the rest of the taconite processes.
Comparison of SEG variance components
Table 4 shows the between-mine (S2
BM), between-SEG (S2
BG), and within-SEG (S2
WG) variance
components for RD and RS by mine, as well as the percentage of the total variance (the sum of
the components) contributed by each component. Equation 2 was used to calculate the absolute
values of S2
BG and S2
WG which were also expressed as percentages of the total variance
(assuming that total variance was the sum of only the between- and within-SEG components).

15
Equation 3 was used to calculate the absolute values of S2
BM, S2
BG, and S2
WG, which were also
expressed as percentages of the total variance (assuming that total variance was the sum of all
three components). The between-mine variance was a small portion of the total variance for both
RD and RS (3.4% and 2.1 %, respectively). In other words, there was little variability among the
six mines. Overall, mine A had the highest S2
TOTAL (0.199) for RD, a finding that is consistent
with the number of large GSDs (>3) for several SEGs (see Table 2). Mine B had the highest
S2
TOTAL (0.202) for RS, a similarly consistent finding given the number of SEGs with large
GSDs (see Table 3).
Comparison of percent of quartz by department
The department, a grouping variable that can be utilized as an alternative to SEG, was used to
compare the correlation of RD and RS as well as percent of quartz. After excluding all samples
with values less than the LOD for both RD and RS, we calculated the coefficient of
determination (R2) between RD and RS concentrations by department across all mines (see
Figure 3). The value of R2
decreased substantially from 0.51 in Crushing department to 0.02 in
Concentrating department. With the exception of the Concentrating department, the RD and RS
concentrations in all departments have a significant positive relationship. The low correlation
found in the Concentrating department may indicate that the RS concentrations are more
independent from the RD as the concentrating processes remove the silica. To calculate the
percentage of silica in the respirable dust in each department, we divided the RS concentration
(mg/m3) by the RD concentration (mg/m
3). Our results indicate that the mean percentage of

16
quartz was approximately 14% across all departments except for the Pelletizing department,
where the percentage dramatically dropped to 5% (see Figure 4). As mentioned earlier, the
magnetic separator and flotation processes in the Concentrating department remove the silica
including quartz. Therefore, the respirable dust in the Pelletizing department has a lower
percentage of quartz.
DISCUSSION
Levels of RD and RS
Overall, the highest average concentrations of RD were found in mine A. Mine F had the lowest
average concentration of RD, 0.116 mg/m3, which is approximately 2 times lower than the
average of 0.252 mg/m3
in mine A. The differences in processes between these two mines were
not significant. Mine F was the smallest in terms of production capacity (smaller by a factor of
two than the next lowest mine). No single RD exposure concentration was higher than the TLV
in any of the mines. The highest individual exposure level of 2.30 mg/m3 was found in the
Maintainence technician SEG in Mine E, a value lower than the ACGIH TLV for RD (3 mg/m3)
(see Figure 1). Overall, between-mine differences for the RD across all SEGs were almost
nonexistent (S2
BM=0.005).
All mines had some SEGs above the ACGIH TLV for RS (0.025 mg/m3) (see Figure 2). Mine B
had the highest average (across all SEGs) concentration of RS (0.025 mg/m3) while mine D had
the lowest (0.010 mg/m3). As we can see in Figure 1, the highest concentrations of RD were

17
often observed in either the Pelletizing or Crushing departments,which are inherently dusty
operations. The highest concentrations of RS were consistently observed in the Crushing
department (Figure 2) but not also in the Pelletizing department. The silica is a part of the ore
during the crushing process but has been removed before the pelletizing step. For instance, the
RS concentration in the Crushing department ranged from the minimum of 0.003 mg/m3
for the
Crusher maintenance SEG in mine A to the maximum of 0.280 mg/m3
for the Operating
technician SEG in mine C (Figure 2). The highest concentration of RS in mine D was found in
the Shop (mobile) SEG; the Crusher maintenance SEG had a similar concentration. The RS
concentrations were generally higher at the beginning of the taconite process, i.e., in the Mining
and Crushing departments. The magnetic separator and flotation processes in the Concentrating
department reduced the levels of RS significantly. This pattern was consistent across all mines.
Sheehy (1986) found that the greatest potential for overexposure to respirable silica occurred in
the mining (drill operator), crushing (crusher helper), and concentrating (primary attendant,
concentrator laborer) departments; these departments correspond to the Mining operator 1,
Crusher operator, and Concentrator operator SEGs respectively in the present work. However, it
was unclear whether the specific job tasks performed by the concentrator laborer occurred before
or after the magnetic separation processes.
Between-mine variability by process
The taconite mining and milling processes are very similar in all mines; thus, the levels of
exposure to RD and RS during these processes display only a few significant differences across
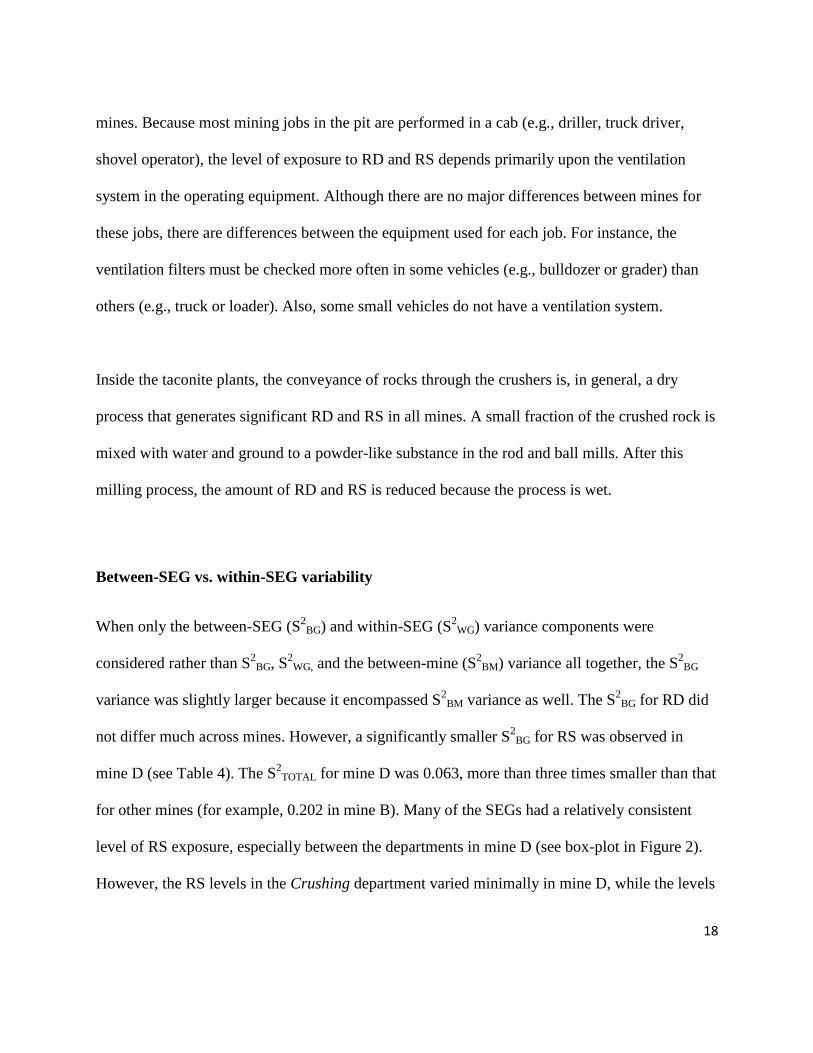
18
mines. Because most mining jobs in the pit are performed in a cab (e.g., driller, truck driver,
shovel operator), the level of exposure to RD and RS depends primarily upon the ventilation
system in the operating equipment. Although there are no major differences between mines for
these jobs, there are differences between the equipment used for each job. For instance, the
ventilation filters must be checked more often in some vehicles (e.g., bulldozer or grader) than
others (e.g., truck or loader). Also, some small vehicles do not have a ventilation system.
Inside the taconite plants, the conveyance of rocks through the crushers is, in general, a dry
process that generates significant RD and RS in all mines. A small fraction of the crushed rock is
mixed with water and ground to a powder-like substance in the rod and ball mills. After this
milling process, the amount of RD and RS is reduced because the process is wet.
Between-SEG vs. within-SEG variability
When only the between-SEG (S2
BG) and within-SEG (S2
WG) variance components were
considered rather than S2
BG, S2
WG, and the between-mine (S2
BM) variance all together, the S2
BG
variance was slightly larger because it encompassed S2
BM variance as well. The S2
BG for RD did
not differ much across mines. However, a significantly smaller S2
BG for RS was observed in
mine D (see Table 4). The S2
TOTAL for mine D was 0.063, more than three times smaller than that
for other mines (for example, 0.202 in mine B). Many of the SEGs had a relatively consistent
level of RS exposure, especially between the departments in mine D (see box-plot in Figure 2).
However, the RS levels in the Crushing department varied minimally in mine D, while the levels

19
in the Crushing department in the other mines varied much more. In contrast, the levels of RS in
all other departments varied less across mines. All of the RD concentrations for the Crushing
department in mine D fell below the LOD because the crusher operator works in a relatively
clean crusher control operating room at this mine. The work environment of the crusher operator
is different in mine A, where the crusher operators are more exposed to the work done in the
nearby crusher building.
Mine D is located at the end of the western zone of the Mesabi Iron Range and is the farthest
mine from mine A. Therefore, the characteristics of the taconite rock in mine D and mine A are
most different among the six mines. As one goes from mine D to mine A, the taconite rock
changes from soft to hard. Thus, mine D only needs a primary crusher, because the taconite rock
is much softer, whereas mine A has a primary and secondary crusher. Thus, differing taconite
characteristics might contribute to lower RS concentrations in the mining process in mine D. In
addition, sampling was conducted in mine D in June 2010, which had 21 rainy days (Minnesota
Department of Natural Resources, 2013), a factor that may have contributed to lower RD and RS
concentrations by droplet suppression and also the smaller S2
TOTAL.
CONCLUSIONS
In Minnesota taconite mining operations, respirable dust (RD) and respirable silica (RS) levels
vary little between the two mineralogically distinct zones. No single RD exposure concentration
was higher than the ACGIH TLV in any of the mines, whereas the concentrations of RS were
often greater than the TLV for RS. The highest concentrations of RS were generally found in the

20
Crushing departments for all mines. The processes in the Concentrating department may have
reduced the levels of RS significantly, as well as lowered the percentage of quartz in RD in the
Pelletizing department. There was little to no variability between the six mines for either RD or
RS exposures because the taconite mining and milling processes are similar across all mines. The
between-SEG variability for RD did not differ much among mines. However, significantly
smaller between-SEG variability for RS was observed in mine D. This finding could result from
the characteristics of the taconite rock, seasonal effects during sampling, or the tasks assigned for
each job.
Acknowledgement: This study was funded by the State of Minnesota by a project grant to the University of Minnesota. The
opinions expressed are those of the authors and do not represent the State of Minnesota.

21
REFERENCES
ACGIH (2013). Threshold Limit Values for Chemical Substances and Physical Agents
and Biological Exposure Indices. ACGIH, Cincinnnaiti, OH.
Archer, J. D., Cooper, G. S., Reist, P. C., Storm, J. F., & Nylander-French, L. A. (2012).
Exposure to respirable crystalline silica in eastern North Carolina farm workers.
AIHA journal: a journal for the science of occupational and environmental health
and safety, 63(6), 750–5. Retrieved from
http://www.ncbi.nlm.nih.gov/pubmed/12570084
Bullock, W., & Ignacio, J. (2006). A strategy for assessing and managing occupational
exposures. Fairfax, VA: AIHA.
Chen, W., Zhuang, Z., Attfield, M. D., Chen, B. T., Gao, P., Harrison, J. C., Fu, C., Chen,
J, & Wallace, W. E. (2001). Exposure to silica and silicosis among tin miners in
China: exposure-response analyses and risk assessment. Occupational and
environmental medicine, 58(1), 31–7. Retrieved from
http://www.pubmedcentral.nih.gov/articlerender.fcgi?artid=1740032&tool=pmcentr
ez&rendertype=abstract
Clark, T., Harrington, V., Asta, J., Morgan, W., & Sargent, E. (1980). Respiratory effects
of exposure to dust in taconite mining and processing. Am Rev Respir Dis., 121(6),
959–966.
Collins, J. F., Salmon, A. G., Brown, J. P., Marty, M. a, & Alexeeff, G. V. (2005).
Development of a chronic inhalation reference level for respirable crystalline silica.
Regulatory toxicology and pharmacology: RTP, 43(3), 292–300.
doi:10.1016/j.yrtph.2005.08.003
Hayumbu, P., Robins, T. G., & Key-Schwartz, R. (2008). Cross-sectional silica exposure
measurements at two Zambian copper mines of Nkana and Mufulira. International
journal of environmental research and public health, 5(2), 86–90. Retrieved from
http://www.ncbi.nlm.nih.gov/pubmed/18678921
Higgins, I., Glassman, J., & Oh, M. (1981). The effect of taconite dust exposure on the
health of employees of Reserve Mining Company: Mortality, respiratory symptoms
and chest radiography. University of Michigan. Ann Arbor, MI.
Hinds, W. C. (1999). Aerosol Technology: Properties, Behavior, and Measurement of
Airborne Particles. Hoboken, NJ: John Wiley & Sons, Inc.

22
McJilton, C. (1984). Mineral resources health assessment program, Chapter 3: Industrial
hygiene assessment in Final report, 1981-1984. University of Minnesota.
Minnesota Department of Natural Resources. (2013). Climate Data Retrieval. Retrieved
June 27, 2013, from http://climate.umn.edu/hidradius/radius.asp
NIOSH. (1998). NIOSH manual of analytical methods (NMAM) 0600, fourth edition:
Respirable particulates not otherwise regulated gravimetric, Issue 3.
NIOSH. (2003). NIOSH manual of analytical methods (NMAM) 7500, fourth
edition:Crystalline silica X-ray diffraction, Issue 4.
NIOSH. (2012). Work-Related Lung Disease Surveillance System (eWoRLD). Ref.No.
2012F03-01. U.S. Department of Health and Human Services, Public Health Service,
Centers for Disease Control and Prevention, National Institute for Occupational
Safety and Health, Division of. Retrieved from
http://www2a.cdc.gov/drds/WorldReportData/FigureTableDetails.asp?FigureTableI
D=2595&GroupRefNumber=F03-01
Pelucchi, C., Pira, E., Piolatto, G., Coggiola, M., Carta, P., & La Vecchia, C. (2006).
Occupational silica exposure and lung cancer risk: a review of epidemiological
studies 1996-2005. Annals of oncology: official journal of the European Society for
Medical Oncology / ESMO, 17(7), 1039–50. doi:10.1093/annonc/mdj125
Reserve mining company. (1974). Job descriptions and classifications: United
steelworkers of America and Reserve mining company. MN.
Sheehy, J. (1986). Reconstruction of occupational exposures to silica containing dusts in
the taconite industry. University of Minnesota.
Sheehy, J., & McJilton, C. (1990). Reconstruction of thirty years of free silica dust
exposure in the taconite industry. VIIth International Pneumoconiosis Conference,
Part II, DHHS (NIOSH) Publication No. 90-108 Part II, Sampling and control of
mineral dust, 10(Pittsburgh), 1001–1006.
Steenland, K., & Sanderson, W. (2001). Lung cancer among industrial sand workers
exposed to crystalline silica. American journal of epidemiology, 153(7), 695–703.
Retrieved from http://www.ncbi.nlm.nih.gov/pubmed/11282798
Steenland, K., & Stayner, L. (1997). Silica, asbestos, man-made mineral fibers, and
cancer. Cancer causes & control: CCC, 8(3), 491–503. Retrieved from
http://www.ncbi.nlm.nih.gov/pubmed/9498906

23
United States Geological Survey (USGS). (2013). Historical Statistics for Mineral and
Material Commodities in the United States. U.S. Geological Survey 140, Data Series
01-006, Supersedes Open-File Report. Retrieved from
http://minerals.usgs.gov/ds/2005/140/index.html

24
Table 1 Number of personal samples and percent of samples < limit of detection (LOD)
by mine and mineralogical zone
a Personal respirable dust (RD) samples analyzed by NIOSH 0600.
b Personal respirable silica (RS) samples analyzed by NIOSH 7500.
Zone Mine Workers Number of
RD/RS Samples
% <LOD
of RD a
% <LOD
of RS b
Eastern A 56 161 39 50
Western B 34 101 48 50
C 38 113 47 56
D 34 100 69 79
E 48 139 68 65
F 22 65 74 72
Total 232 679

25
Table 2 Summary statistics of respirable dust for each SEG measured in all mines (GM unit: mg/m3)
a Shop (mobile) refers to those SEGs whose work is more likely done in multiple places in the plants. b Shop (stationary) refers to those SEGs whose work is more likely done in a single workplace. c . indicates no measurement. d <LOD indicates all samples containing below LOD. e Numbers in boldface indicate statistically significant differences among mines (P<0.05).
Department SEG A B C D E F P-
values e
GM GSD GM GSD GM GSD GM GSD GM GSD GM GSD
Mining Basin operator . c . <LOD
d <LOD
0.088 2.10 <LOD
<LOD
<LOD
<LOD
. . NA
Mining operator 1 0.090 3.23 <LOD <LOD
<LOD
<LOD
<LOD
<LOD
<LOD
<LOD
<LOD
<LOD
NA
Mining operator 2 0.083 1.96 0.184 3.00 <LOD <LOD
0.065 1.49 0.092 1.98 <LOD
<LOD
0.1380
Rail road 0.095 4.14 . . . . . . . . . . NA
Crushing Crusher maintenance 0.280 2.39 0.135 1.57 0.279 2.11 <LOD <LOD
0.175 2.50 0.164 1.14 0.0095
Crusher operator 0.225 2.53 0.355 2.42 0.099 1.66 <LOD <LOD
0.186 2.78 0.201 1.19 0.0387
Operating technician 0.225 1.21 . . 0.563 1.73 . . . . . . 0.0064
Concentrating Concentrator maintenance 0.252 3.75 0.157 1.76 0.252 1.36 0.078 1.84 0.087 1.78 0.190 3.24 0.1206
Concentrator operator 0.093 1.70 0.172 1.83 0.136 1.68 <LOD <LOD
0.122 2.47 <LOD
<LOD
0.0140
Pelletizing Balling drum operator 0.608 1.86 0.196 1.63 0.284 1.56 0.246 1.53 0.161 2.62 0.0028
Dock man 0.258 2.39 0.172 2.81 <LOD <LOD
0.235 8.90 0.092 2.07 <LOD
<LOD
0.0377
Furnace operator 0.513 1.67 0.420 2.22 0.126 1.94 0.171 2.54 0.095 2.02 0.0029
Pelletizing maintenance 0.593 1.83 0.155 1.82 0.243 1.36 0.186 2.81 0.134 2.04 0.086 1.54 0.0031
Pelletizing operator 0.323 1.49 0.330 1.91 0.201 1.34 0.285 1.35 0.169 1.87 0.346 1.65 0.1678
Shop(mobile)a
Boiler technician . . . . <LOD <LOD
. . <LOD
<LOD
. . NA
Carpenter . . 0.091 2.23 . . <LOD <LOD
0.139 2.62 . . 0.6130
Electrician 0.097 1.92 <LOD <LOD
0.102 2.17 0.157 2.12 0.069 1.41 <LOD
<LOD
0.0469
Lubricate technician 0.068 1.57 . . 0.163 1.89 . . . . <LOD <LOD
0.0065
Maintenance technician 0.152 2.52 0.125 2.84 <LOD <LOD
0.159 2.34 0.180 5.26 0.212 2.99 0.7348
Pipefitter/Plumber . . . . 0.103 1.72 . . <LOD <LOD
. . NA
Repairman . . 0.175 1.79 . . . . 0.077 1.99 <LOD <LOD
0.0290
Supervisor 0.059 1.70 <LOD <LOD
<LOD
<LOD
<LOD
<LOD
0.061 1.60 <LOD
<LOD
0.8962
Shop
(stationary)b
Auto mechanic 0.113 2.24 0.111 2.12 0.075 1.62 0.103 1.79 0.062 1.40 0.075 1.72 0.4767
Lab analyst 0.106 1.70 0.259 1.23 <LOD <LOD
0.069 1.31 <LOD
<LOD
<LOD
<LOD
0.0001
Warehouse technician 0.064 1.72 <LOD <LOD
<LOD
<LOD
<LOD
<LOD
0.070 1.33 <LOD
<LOD
0.5491
Office/
Control room
Control room operator 0.080 1.99 <LOD <LOD
<LOD
<LOD
<LOD
<LOD
<LOD
<LOD
<LOD
<LOD
NA
Office staff <LOD <LOD
<LOD
<LOD
<LOD
<LOD
<LOD
<LOD
0.076 2.05 <LOD
<LOD
NA
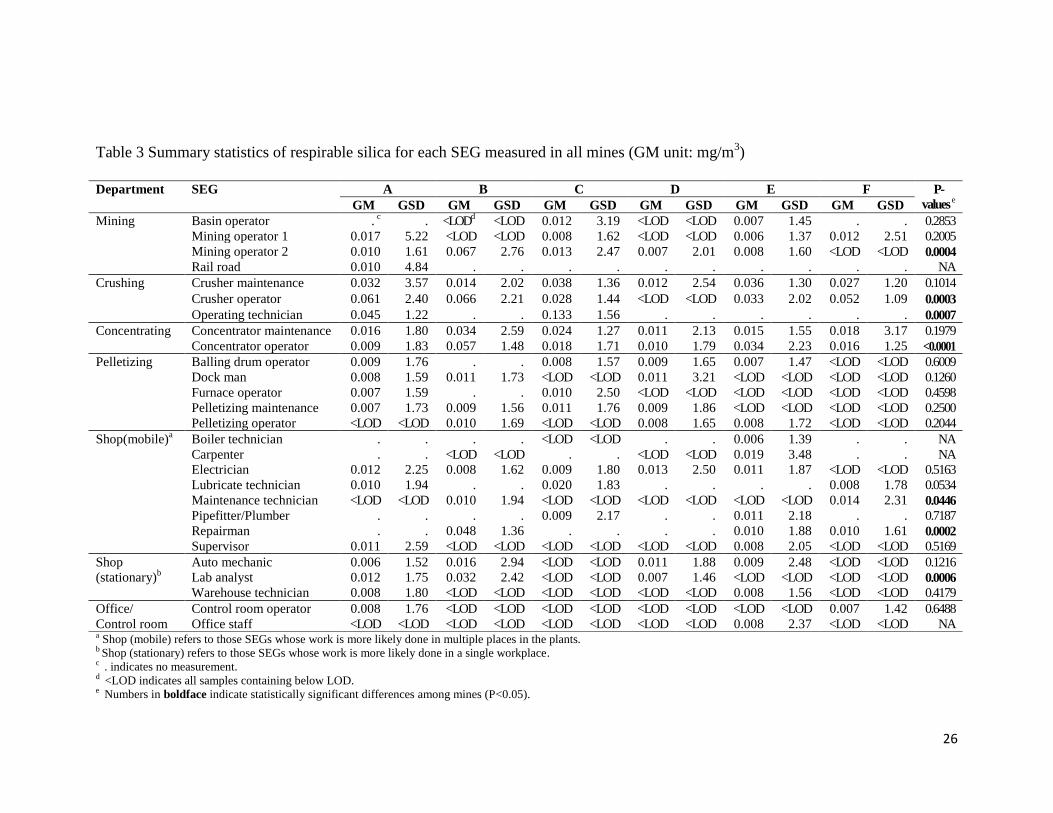
26
Table 3 Summary statistics of respirable silica for each SEG measured in all mines (GM unit: mg/m3)
a Shop (mobile) refers to those SEGs whose work is more likely done in multiple places in the plants. b Shop (stationary) refers to those SEGs whose work is more likely done in a single workplace. c . indicates no measurement. d <LOD indicates all samples containing below LOD. e Numbers in boldface indicate statistically significant differences among mines (P<0.05).
Department SEG A B C D E F P-
values e
GM GSD GM GSD GM GSD GM GSD GM GSD GM GSD
Mining Basin operator . c . <LOD
d <LOD
0.012 3.19 <LOD
<LOD
0.007 1.45 . . 0.2853
Mining operator 1 0.017 5.22 <LOD <LOD
0.008 1.62 <LOD
<LOD
0.006 1.37 0.012 2.51 0.2005
Mining operator 2 0.010 1.61 0.067 2.76 0.013 2.47 0.007 2.01 0.008 1.60 <LOD <LOD
0.0004
Rail road 0.010 4.84 . . . . . . . . . . NA
Crushing Crusher maintenance 0.032 3.57 0.014 2.02 0.038 1.36 0.012 2.54 0.036 1.30 0.027 1.20 0.1014
Crusher operator 0.061 2.40 0.066 2.21 0.028 1.44 <LOD <LOD
0.033 2.02 0.052 1.09 0.0003
Operating technician 0.045 1.22 . . 0.133 1.56 . . . . . . 0.0007
Concentrating Concentrator maintenance 0.016 1.80 0.034 2.59 0.024 1.27 0.011 2.13 0.015 1.55 0.018 3.17 0.1979
Concentrator operator 0.009 1.83 0.057 1.48 0.018 1.71 0.010 1.79 0.034 2.23 0.016 1.25 <0.0001
Pelletizing Balling drum operator 0.009 1.76 . . 0.008 1.57 0.009 1.65 0.007 1.47 <LOD <LOD
0.6009
Dock man 0.008 1.59 0.011 1.73 <LOD <LOD
0.011 3.21 <LOD
<LOD
<LOD
<LOD
0.1260
Furnace operator 0.007 1.59 . . 0.010 2.50 <LOD <LOD
<LOD
<LOD
<LOD
<LOD
0.4598
Pelletizing maintenance 0.007 1.73 0.009 1.56 0.011 1.76 0.009 1.86 <LOD <LOD
<LOD
<LOD
0.2500
Pelletizing operator <LOD <LOD
0.010 1.69 <LOD
<LOD
0.008 1.65 0.008 1.72 <LOD
<LOD
0.2044
Shop(mobile)a
Boiler technician . . . . <LOD <LOD
. . 0.006 1.39 . . NA
Carpenter . . <LOD <LOD
. . <LOD
<LOD
0.019 3.48 . . NA
Electrician 0.012 2.25 0.008 1.62 0.009 1.80 0.013 2.50 0.011 1.87 <LOD <LOD
0.5163
Lubricate technician 0.010 1.94 . . 0.020 1.83 . . . . 0.008 1.78 0.0534
Maintenance technician <LOD <LOD
0.010 1.94 <LOD
<LOD
<LOD
<LOD
<LOD
<LOD
0.014 2.31 0.0446
Pipefitter/Plumber . . . . 0.009 2.17 . . 0.011 2.18 . . 0.7187
Repairman . . 0.048 1.36 . . . . 0.010 1.88 0.010 1.61 0.0002
Supervisor 0.011 2.59 <LOD <LOD
<LOD
<LOD
<LOD
<LOD
0.008 2.05 <LOD
<LOD
0.5169
Shop
(stationary)b
Auto mechanic 0.006 1.52 0.016 2.94 <LOD <LOD
0.011 1.88 0.009 2.48 <LOD
<LOD
0.1216
Lab analyst 0.012 1.75 0.032 2.42 <LOD <LOD
0.007 1.46 <LOD
<LOD
<LOD
<LOD
0.0006
Warehouse technician 0.008 1.80 <LOD <LOD
<LOD
<LOD
<LOD
<LOD
0.008 1.56 <LOD
<LOD
0.4179
Office/
Control room
Control room operator 0.008 1.76 <LOD <LOD
<LOD
<LOD
<LOD
<LOD
<LOD
<LOD
0.007 1.42 0.6488
Office staff <LOD <LOD
<LOD
<LOD
<LOD
<LOD
<LOD
<LOD
0.008 2.37 <LOD
<LOD
NA

27
Table 4 Between-mine, between-SEG, and within-SEG variance components across mine
and by mine for respirable dust and respirable silica
Classification
Mine Subject Sample Total b BM
BG WG
S2TOTAL S
2BM % S
2BG % S
2WG %
RD All a 232 679 0.144 0.005 3.4 0.063 43.5 0.077 53.1
All 232 679 0.144 0.067 46.6 0.077 53.4
A 56 161 0.199 0.093 46.7 0.106 53.3
B 34 101 0.133 0.054 40.6 0.079 59.5
C 38 113 0.149 0.097 65.0 0.052 35.0
D 34 100 0.105 0.049 47.3 0.055 52.7
E 48 139 0.115 0.028 24.5 0.087 75.5
F 22 65 0.093 0.051 54.7 0.042 45.3
RS All a 232 679 0.147 0.003 2.1 0.071 48.4 0.073 49.5
All 232 679 0.147 0.074 50.3 0.073 49.7
A 56 161 0.184 0.072 39.4 0.111 60.6
B 34 101 0.202 0.135 66.7 0.067 33.3
C 38 113 0.177 0.119 67.0 0.058 33.0
D 34 100 0.063 0.001 1.4 0.062 98.6
E 48 139 0.114 0.050 43.6 0.064 56.4
F 22 65 0.090 0.056 61.5 0.035 38.5 a This variance components include between-mine. b Total variance components (S2
TOTAL) are sum of partitioned BM, BG, and WG variance components.

Figure 1 Box plots for respirable dust for each SEG in all mines (the horizontal line indicates
the ACGIH TLV for RD = 3 mg/m3)
(A) (B)
(C) (D)
(E) (F)
Crushing Concentrating
Pelletizing
Shop
Stationary Shop mobile Crushing
Concentrating
Pelletizing
Shop
Stationary Shop mobile
Crushing Mining
Concentrating
Pelletizing
Shop
Stationary Shop mobile
Crushing Mining Concentrating
Pelletizing
Shop
Stationary Shop mobile
Crushing Mining
Concentrating
Pelletizing
Shop
Stationary Shop mobile Office Crushing Mining
Concentrating
Pelletizing
Shop
Stationary Shop mobile
Office
Office Office
Mining Mining Office Office
RD
co
nce
ntr
ation
(m
g/m
3)
Office
Office
Office
Office Mining Mining Office
ACGIH TLV for RD:
3 mg/m3
RD
co
nce
ntr
ation
(m
g/m
3)
RD
co
nce
ntr
ation
(m
g/m
3)

Figure 2 Box plots for respirable silica for each SEG in all mines (the horizontal line indicates
the ACGIH TLV for RS = 0.025 mg/m3)
Office
(A) (B)
(C) (D)
(E) (F)
Crushing Concentrating
Pelletizing
Shop
Stationary Shop mobile Crushing
Concentrating
Pelletizing
Shop
Stationary Shop mobile
Crushing Mining
Concentrating
Pelletizing Shop
Stationary
Shop mobile Crushing Mining Concentrating
Pelletizing
Shop
Stationary Shop mobile
Crushing Mining
Concentrating
Pelletizing
Shop
Stationary Shop mobile Office Crushing Mining
Concentrating
Pelletizing
Shop
Stationary Shop mobile
Mining Office Mining Office
Office
Office
ACGIH TLV for RS: 0.025 mg/m
3
Office

Figure 3 Coefficient of determination (R2) between respirable dust and respirable silica by
department across all mines
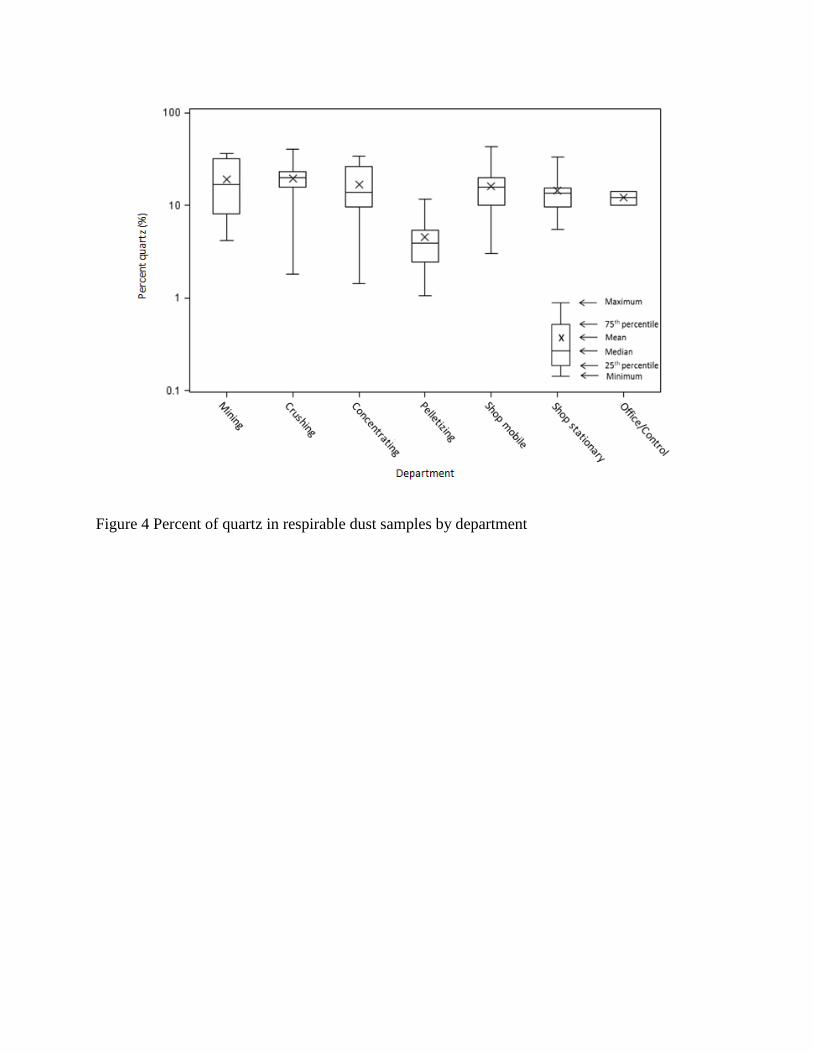
Figure 4 Percent of quartz in respirable dust samples by department

ORIGINAL ARTICLE
Mortality experience among Minnesota taconitemining industry workersElizabeth M Allen,1 Bruce H Alexander,1 Richard F MacLehose,2
Gurumurthy Ramachandran,1 Jeffrey H Mandel1
1Division of EnvironmentalHealth Sciences, University ofMinnesota, Minneapolis,Minnesota, USA2Division of Epidemiology,University of Minnesota,Minneapolis, Minnesota, USA
Correspondence toDr Bruce H Alexander,University of Minnesota,School of Public Health,Division of EnvironmentalHealth Sciences, 420 DelawareStreet SE, MMC 807,Minneapolis, MN 55455, USA;[email protected]
Received 21 November 2013Revised 3 April 2014Accepted 20 April 2014
To cite: Allen EM,Alexander BH,MacLehose RF, et al. OccupEnviron Med PublishedOnline First: [please includeDay Month Year]doi:10.1136/oemed-2013-102000
ABSTRACTObjective To evaluate the mortality experience ofMinnesota taconite mining industry workers.Methods Mortality was evaluated between 1960 and2010 in a cohort of Minnesota taconite mining workersemployed by any of the seven companies in operation in1983. Standardised mortality ratios (SMR) wereestimated by comparing observed deaths in the cohortwith expected frequencies in the Minnesota population.Standardised rate ratios (SRR) were estimated using aninternal analysis to compare mortality by employmentduration.Results The cohort included 31 067 workers with atleast 1 year of documented employment. Among those,there were 9094 deaths, of which 949 were from lungcancer, and 30 from mesothelioma. Mortality from allcauses was greater than expected in the Minnesotapopulation (SMR=1.04, 95% CI 1.02 to 1.04). Mortalityfrom lung cancer and mesothelioma was higher thanexpected with SMRs of 1.16 for lung cancer (95% CI1.09 to 1.23) and 2.77 for mesothelioma (95% CI 1.87to 3.96). Other elevated SMRs included those forcardiovascular disease (SMR=1.10, 95% CI 1.06 to1.14), specifically for hypertensive heart disease(SMR=1.81, 95% CI 1.39 to 2.33) and ischemic heartdisease (SMR=1.11, 95% CI 1.07 to 1.16). Results ofthe SRR analysis did not show variation in risk byduration of employment.Conclusions This study provides evidence that taconiteworkers may be at increased risk for mortality from lungcancer, mesothelioma, and some cardiovascular disease.Occupational exposures during taconite miningoperations may be associated with these increased risks,but non-occupational exposures may also be importantcontributors.
BACKGROUND AND SIGNIFICANCEThe iron mining industry in Minnesota began inthe late 1800s with the discovery of hematite innortheastern Minnesota, within what is nowknown as the Mesabi Iron Range. Hematite, a high-grade ore, was excavated from the iron formationand shipped directly to steel mills. However, thehigh-grade ore became less abundant followingheavy demand for its use in World War II. In the1950s, with hematite reserves depleted, the miningand processing of low-grade taconite ore began.1
Since then, the taconite mining industry inMinnesota has become the largest supplier of ironore to the steel industry of the USA.2
Mining and processing of taconite iron oreresults in potential exposure to non-asbestiform
amphibole and non-amphibole elongate mineralparticles (EMP), respirable silica, quartz and dust,and cleavage fragments.3 The term ‘EMP’ refers toany mineral particle with a minimum aspect ratioof 3:1 that is of inhalable size. Cleavage fragmentsare fractured mineral EMPs created during thecrushing and fracturing process.4
The Mesabi Iron Range is approximately 2.5miles wide and 122 miles long and is divided intofour mineralogical zones.5 All zones have depositsof taconite along with quartz and iron silicates, butvary in the type of EMP.6 The ore body in theeastern range, known as zone 4, contains iron-richamphibole EMPs (primarily cummingtonite-grunerite), which is believed to be less than 1%fibrous.7 The western end of the range, zone 1,contains almost exclusively non-asbestiform EMPs,primarily of quartz hematite, siderite, chamositeand greenalite.6 8 Zone 2 is considered a transi-tional zone with some amphiboles appearing.5 Onemine operates in zone 4, one mine that is no longerin operation is located in zone 2, the remaining fivemines are located in zone 1 which is roughly thewestern-most two-thirds of the entire Mesabi IronRange. There is another mineralogical zone, zone 3,however, there are no mines located in this zone.The primary exposure in taconite operations is ofnon-asbestiform cleavage fragments however, due tothe mineralogical differences in the eastern versuswestern zones, workers in the two zones may beexposed to different types of mineral particles.3
There is an ongoing debate regarding these expo-sures and the health of miners which includes (1)whether the amphibole minerals mined in theeastern part of the iron range are a threat to humanhealth and (2) whether exposure to non-asbestiformminerals, including cleavage fragments, poses anyrisk to human health.4 9–12
The history of public concern of the health oftaconite miners and residents near the mining andprocessing facilities began in the early 1970s whenEMPs, determined to be primarily grunerite, pos-sibly including some asbestiform grunerite, werefound in Duluth’s drinking water supply as a resultof taconite tailings that were disposed of into LakeSuperior.8 13 This prompted studies of the potentialhealth effects from ingestion of Duluth waterwhich did not show increased risk of malignanttumours in either laboratory animals or humanpopulations.14 15 The earliest studies of the healthof taconite miners were carried out in the early1980s. The first study16 focused on a group ofminers from Reserve Mining Company. The
Allen EM, et al. Occup Environ Med 2014;0:1–6. doi:10.1136/oemed-2013-102000 1
Workplace OEM Online First, published on May 9, 2014 as 10.1136/oemed-2013-102000
Copyright Article author (or their employer) 2014. Produced by BMJ Publishing Group Ltd under licence.
group.bmj.com on July 16, 2014 - Published by oem.bmj.comDownloaded from Appendix 4

authors reported no increased risk of respiratory cancers amongthe 5751 miners. Later, studies were conducted in 1988 with anupdate in 199217 18 and, similarly, did not report an excess mor-tality among the 3431 workers from Erie and Minntac mines.In 1997, the Minnesota Department of Health CancerSurveillance System reported a 73% excess in cases of meso-thelioma among men in the northeastern region of Minnesotabetween 1988 and 1996 as compared with the rest of thestate.19 This resurrected the concern over whether exposuresfrom taconite mining and processing pose a threat to the healthof the workers.
To address these lingering uncertainties regarding the healthconsequences of taconite mining, we conducted a mortalitystudy of workers from multiple mines to characterise the overallhealth of the Minnesota taconite worker population.
METHODSStudy populationThe occupational cohort for this analysis was enumerated in theearly 1980s as part of the Mineral Resources Health AssessmentProgram (MRHAP). The program was developed by theUniversity of Minnesota, School of Public Health, with thesupport of the Iron Range Resources and Rehabilitation Board.This was done as part of an effort to further research on healtheffects of mining and mineral processing. Investigatorsassembled a database of 68 737 individuals from employmentrecords of the seven mines in operation in 1983, US SteelCorporation, Hanna Mining Company, Pickands-Mather andCompany, Reserve Mining Company, Eveleth TaconiteCompany, Inland Steel Company, and Jones and LaughlinCorporation.
In 2008, the University of Minnesota launched the TaconiteWorkers Health Study (TWHS). The current mortality analysiswas one component of the overall TWHS with an objective toupdate the health assessment of the cohort of 68 737 minerscollected by MRHAP in 1983. The cohort included taconiteworkers and those who had worked in the earlier hematitemining operations. To focus the study on workers most likely tohave been working after taconite mining began in the 1950s,the cohort used in this analysis was limited to those born in1920 or later, leaving 46 170 individuals. Of these, 1927 wereexcluded, including 477 whose only record on file was an appli-cation with no further evidence of employment, 679 whoserecords were insufficient for vital status follow-up, and 539 forwhom employment information was improbable, for example,began working at age 14 or younger. Those who died beforereference mortality rates were available (before 1960, n=232),were also excluded, leaving 44 243 workers. To focus onworkers with more stable employment in the taconite industry,this analysis was restricted to workers with at least 1 year ofdocumented employment giving a study population of 31 067workers. This exclusion removed workers who did not stay inthe industry, and also summer workers, often students who onlyworked a few months.
Vital status ascertainmentThe mortality analyses covered the period from 1960 (whencomplete reference mortality rates were available) through2010. The vital status of cohort members as of 31 December2010 was ascertained through several sources including theSocial Security Administration (SSA), the National Death Index(NDI), Minnesota Department of Health, and other state healthdepartments. Social security numbers and names of all cohortmembers were sent to the SSA and were returned with a vital
status of deceased, alive, or unknown, with the state of deathand date of death identified for decedents. Cohort memberswho died in Minnesota, or whose state of death was unknown,were sent to the Minnesota Department of Health to ascertaincauses of death. NDI, established in 1979, is a national deathregistry designed to facilitate health investigations. For thosewho died outside of Minnesota in the year 1979 or later, causesof death were obtained from NDI Plus. For individuals whodied before 1979, death certificates were obtained from thestate health department from the state in which the individualdied. Additional tracing was done on those whose vital statuswas unknown and, if found to be deceased, their death certifi-cates were obtained. Underlying and contributing causes ofdeath were coded to the International Classification of Disease(ICD) version current at the year of death. The ICD codes wereobtained directly from the Minnesota Department of Healthand the NDI. All other death certificates were reviewed andcoded by a nosologist.
Individuals who were identified as deceased, but whose deathcertificates were not found, were classified as ‘Presumed Dead’.The date of death provided by the SSA was recorded as the vitalstatus date and the cause of death was classified as ‘Unknown.’Individuals identified as ‘Unknown’ by the SSA were traced via acommercial tracing vendor that uses credit bureau addressupdates. For those who were found to have had recent addressactivity, their vital status was recorded as ‘Presumed Alive’ witha vital status date as the most recent date recorded from the webtracing tools. The vital status date for the remaining individualswith an unknown vital status was their last date of employment.
Given the size of the cohort, detailed abstraction of all workhistories in the cohort was not feasible, and duration of employ-ment was the primary exposure measure of interest. For thisanalysis, work records of cohort members were reviewed withthe first and last dates of employment abstracted, as well as thelast date of activity on the work record. In 4.5% of the data, thework records contained start dates but were missing end dates.In this case, the last date of activity was used as the end date tocalculate duration of employment. For roughly 92% of thestudy population, we also had location (zone 1, 2, or 4) ofemployment.
Data analysisThe mortality rate of the cohort was compared with that of theMinnesota population to estimate standardised mortality ratios(SMR), and 95% CIs adjusted for sex, and 5-year age and calen-dar period. Person-time at risk was accrued from the first dateof employment until the date of death or the end of thefollow-up period (31 December 2010). The expected number ofdeaths was calculated by applying age, calendar time, and cause-specific mortality rates of the Minnesota population to theperson-year observations of the study population. SMRs wereobtained by computing the ratio of the observed-to-expectednumber of deaths for the overall mortality and specific causes ofdeath. In addition to overall SMRs, workers with any evidenceof employment in zones 1, 2, and 4 were grouped and SMRsfor mesothelioma and lung cancer were estimated for each zone.
To further explore summary results for selected causes ofdeath from the SMR analysis, an internal analysis of mesotheli-oma, lung cancer, hypertensive heart disease, and ischemic heartdisease by duration of employment was undertaken.Mesothelioma was captured under ICD-10 code C45, lungcancer was captured under ICD-7 code 162, ICD-8 code 162,ICD-9 code 162, and ICD-10 codes C33 and C34, hypertensiveheart disease was captured under ICD-7 codes 440–443, ICD-8
2 Allen EM, et al. Occup Environ Med 2014;0:1–6. doi:10.1136/oemed-2013-102000
Workplace
group.bmj.com on July 16, 2014 - Published by oem.bmj.comDownloaded from

codes 400.1, 400.9, 402, and 404, ICD-9 codes 402 and 404,and ICD-10 codes I11 and I13, and ischemic heart disease wascaptured under ICD-7 code 420, ICD-8 codes 410–414, ICD-9codes 410–414 and 429.2, and ICD-10 codes I20, I21, I22,I24, I25, I51.3, and I51.6. Exposure categories were groupedby duration of employment into four exposure categories(1 year, 2–5 years, 6–14 years, and 15+ years). Those whoworked 2–5 years were considered most representative of tacon-ite workers with low but stable employment; those who workedless than 2 years were thought to be either transient workers orindividuals whose work records were incomplete. Therefore,the 2–5 year exposure group, representing 35% of the studycohort, was used as the reference. Standardised Rate Ratios(SRRs) were computed by standardising to the age and sex dis-tribution of the total study population. Taylor-series-based 95%CIs were calculated for each specific SRR. All SMRs and SRRswere calculated using the Life Table Analysis System (LTAS)V.3.0 software.20
RESULTSThis cohort of 31 067 taconite workers with at least 1 year ofdocumented employment was predominantly male (93%), con-tributed 1 152 966 person-years of observation, and experi-enced 9094 deaths. Their mean and median durations ofemployment were 9.4 and 6 years, respectively. Table 1 showsdemographic information of the entire cohort and for thosewith selected causes of death.
The mortality rates from all causes (SMR=1.04, 95% CI 1.02to 1.06) and all cancers (SMR=1.04, 95% CI 1.00 to 1.08)were higher than the Minnesota population. Among specificcancers, mortality rates for lung cancer (SMR=1.16, 95% CI1.09 to 1.24) and mesothelioma (SMR=2.77, 95% CI 1.87 to3.96) were significantly higher than expected. The mortalityrate for cardiovascular disease was also elevated (SMR=1.10,95% CI 1.06 to 1.14), specifically for hypertensive heart disease(SMR=1.81, 95% CI 1.39 to 2.33) and ischemic heart disease(SMR=1.11, 95% CI 1.07 to 1.16). Table 2 shows selectedSMRs for the taconite workers cohort. Only one death each forasbestosis and silicosis was observed.
The mortality rates were elevated for mesothelioma and lungcancer in all three zones of the iron range. Among the 20 282workers who ever worked in zone 1, the SMRs for mesotheli-oma and lung cancer were 1.85 (95% CI 0.98 to 3.16) and1.18 (95% CI 1.09 to 1.27) respectively. Among the 5580workers who ever worked in zone 2, the SMRs for mesotheli-oma and lung cancer were 7.38 (95% CI 4.30 to 11.82) and1.43 (95% CI 1.26 to 1.63) respectively. Among the 6501workers who ever worked in zone 4, the SMRs for mesotheli-oma and lung cancer were 3.17 (95% CI 1.37 to 6.25) and1.23 (95% CI 1.07 to 1.40), respectively.
The internal analysis of mesothelioma, lung cancer, hyperten-sive heart disease, and ischemic heart disease by duration ofemployment showed elevated but imprecise SRRs when compar-ing those with 6–14 years, and 15+ years, to those with 2–5documented work years for hypertensive heart disease. Therewas no significant elevation in SRRs for mesothelioma, ischemicheart disease and lung cancer (table 3).
DISCUSSIONIn this study of Minnesota taconite iron ore miners, an overallhigher than expected mortality rate from all causes wasobserved among taconite workers. Specifically, elevated causesof death from respiratory cancers (including lung cancer andmesothelioma) and cardiovascular disease (including
hypertensive heart disease and ischemic heart disease) wereidentified. These rates were elevated in all three zones of theiron range for mesothelioma and lung cancer. An internal ana-lysis comparing the association between duration of employ-ment and these causes of death did not show a statisticallysignificant elevation in risk for any duration of employment cat-egory for mesothelioma, lung cancer, hypertensive heart diseaseand ischemic heart disease mortality.
Studies of the morbidity and mortality of miners were firstcarried out in the early 1980s. Higgins et al16 followed a cohortof 5751 men employed at Reserve Mining Company from 1952to 1976. The study showed no increases in observed respiratorycancers compared to the USA and Minnesota. Cooper et al17 18
studied mortality through 1988 in a cohort of 3431 maleworkers from Erie and Minntac mines between 1959 and 1977.Total observed deaths were fewer than expected when comparedto US and Minnesota death rates. The investigators reported nosignificantly elevated SMRs for any cause of death. Thoughthese first studies of the health of taconite miners did not showincreased risk of mortality, it is important to note that meso-thelioma was not captured systematically in mortality registriesuntil 1999 when the ICD V.10 was introduced giving mesotheli-oma a unique ICD code. Additionally, the follow-up times werenot long enough to capture many of the potential cases giventhe relatively long latency period which, for mesothelioma, isestimated to have a median duration of 32 years.21 Aside fromthese two studies that followed a small number of workers overa relatively short amount of time, there has been no comprehen-sive look at the health of taconite miners across the entireMesabi iron range.
Several occupational studies have been conducted that evalu-ate the health risk to workers exposed to non-asbestiform EMPsin other occupational settings. These include studies of talcminers in upstate New York and Homestake gold miners inSouth Dakota. In a 2002 mortality study of talc miners, Hondaet al22 reported an excess in mortality from all cancers, lungcancer, ischemic heart disease, and non-malignant respiratorydisease. A 2012 follow-up commentary argued that talc oreexposure also increases the risk of mesothelioma,11 though thatconclusion has been debated.12 Though the authors argue, thelack of an exposure-response relationship indicates the lungcancer excess may not be related to talc ore dust; rather it mightbe explained by a relatively high smoking rate in the popula-tion,22 it is unlikely that confounding by smoking accounts fullyfor the lung cancer excess observed in the study.4 The results ofthese studies have been argued further, as the composition ofindustrial-grade talc has been redefined. Industrial-grade talcdeposits are a complex mixture of mineral particles that varysubstantially and may rarely include asbestos fibers.23 Price23
argues that elevated rates of mesothelioma found in New Yorktalc miners are a result of previous occupational exposure tocommercial asbestos. Several studies of miners at the Homestakegold mine in South Dakota were done in the 1970s and1980s.24–26 An excess of respiratory cancer was reported in theearliest study,24 and a small excess of lung cancer was reported inthe studies by McDonald et al25 and Steenland and Brown. 26
The results of these studies suggest a weak association betweendust exposure and lung cancer and like the studies of talcminers, no dose-response relationship was observed.4 Thestudies of New York talc miners and Homestake gold minerscannot definitively conclude whether exposure to non-asbestiform minerals poses any risk to human health.
The elevated risk of lung cancer and mesothelioma as a resultof exposure to asbestiform EMPs is well documented in the
Allen EM, et al. Occup Environ Med 2014;0:1–6. doi:10.1136/oemed-2013-102000 3
Workplace
group.bmj.com on July 16, 2014 - Published by oem.bmj.comDownloaded from

literature.4 27–29 However, risk of exposure to non-asbestiformampbibole and non-amphibole EMPs as found in taconitemining operations, is not understood, and evidence of their tox-icity is inconclusive.4 Our results indicate an increased risk formesothelioma and lung cancer among taconite workers with atleast 1 year of employment, but no exposure-response associ-ation for duration of employment was detected. Mortality fromcardiovascular disease, specifically hypertensive heart diseaseand ischemic heart disease, were also increased. Major riskfactors for the development of heart disease include hyperten-sion, diabetes and cholesterol. Lifestyle factors, such assmoking, physical activity, and diet also play a role in diseaserisk. This study result suggests that lifestyle factors likely con-tribute to disease burden in this working population. However,occupational risk cannot be ruled out entirely. Other workplacefactors, such as stress, noise, vibration, extreme temperature andshift work, may also affect cardiovascular disease risk.30 31
Additionally, environmental factors, such as particulate air pollu-tion, have also been shown to increase the risk of cardiovascularevents from short and long-term exposure,32–36 and elevatedcardiovascular mortality has been identified in other workingcohorts.37 Thus, a combination of workplace and lifestylefactors may be contributing to the excess in cardiovasculardisease in this taconite workers cohort.
The following limitations should be considered when inter-preting the results of this analysis. Instead of specific exposuremeasurements for this analysis, duration of employment in thetaconite mining industry was meant as a proxy for exposure
averaged across all jobs and locations on the range. Our estimateof employment duration was measured as the last date ofemployment minus the start date. This crude measure ofemployment duration does not take into account any gaps inwork history which could result in employment duration mis-classification. Individuals who appear to have worked more than15 years may have a much shorter cumulative work historywhen considering gaps in employment. We did not have accessto information on some confounding variables, most notablysmoking status which is a major risk factor for lung cancer andcardiovascular disease. Though we could not adjust for smokingin this analysis, it is possible that smoking explains at least someof this excess risk in lung cancer mortality especially given thatworking cohorts typically have higher smoking rates than thegeneral population, and because of the high attributable risk forsmoking.38 Smoking however, is not a risk factor for mesotheli-oma, thus, the high mortality ratio of mesothelioma suggeststhat there may be occupational exposures to account for someof the increased risk of these diseases.
The risk of mesothelioma may also be underestimated, as thespecific ICD code for this disease was not available until 1999,thus, earlier cases were misclassified as another disease. Thelower percentage of mesothelioma cases, as compared to othercauses of death (table 1) of those who were hired prior to 1950,the earliest exposed, may represent this misclassification. Theseundercounted mesotheliomas may have had more hematiteexposure or exposure to the taconite processes in their earlierwork. However, identifying other potential mesothelioma cases
Table 1 Characteristic of taconite workers with selected causes of death
Selected cause of death
Mesothelioma Lung cancerHypertensiveheart disease
Ischemic heartdisease Total cohort
N Per cent N Per cent N Per cent N Per cent N Per cent
Duration of employment (years)1 4 13.33 123 12.96 6 9.68 241 11.03 4353 14.012–5 8 26.67 250 26.34 14 22.58 576 26.36 10 839 34.896–14 6 20.00 239 25.18 18 29.03 545 24.94 9072 29.2015+ 12 40.00 337 35.51 24 38.71 823 37.67 6803 21.90
SexMale 30 100.0 915 96.42 58 93.55 2143 98.08 28 860 92.90Female 0 0 34 3.58 4 6.45 42 1.92 2202 7.09
Unknown 0 0 0 0 0 0 0 0 5 0.02Age at hire (yrs)<20 12 40.00 247 26.03 15 24.19 628 28.74 11 635 37.4520–29 14 46.67 494 52.05 34 54.84 1163 53.23 15 962 51.3830–39 4 13.33 165 17.39 10 16.13 312 14.28 2851 9.1840+ 0 43 4.53 3 4.84 82 3.75 619 1.99
Decade of hire<1950 6 20.00 289 30.45 20 32.26 799 36.57 4557 14.671950–1959 17 56.67 442 46.58 21 33.87 954 43.66 9072 29.201960–1969 6 20.00 143 15.07 14 22.58 272 12.45 6897 22.201970–1979 1 3.33 72 7.59 6 9.68 157 7.19 10 332 33.26>1980 0 3 0.32 1 1.61 3 0.14 209 0.67
Vital statusAlive 20 814 67.00Dead 30 100.0 949 100.0 62 100.0 2185 100.0 8952 28.82Presumed alive 1157 3.72Presumed dead 144 0.46
Total 30 100.0 949 100.0 62 100.0 2185 100.0 31 067 100.0
4 Allen EM, et al. Occup Environ Med 2014;0:1–6. doi:10.1136/oemed-2013-102000
Workplace
group.bmj.com on July 16, 2014 - Published by oem.bmj.comDownloaded from

using previously used rubrics39 would not change the interpret-ation that taconite workers have elevated rates of mesothelioma.It is also important to note that the cases were identified asprimary causes of death, and do not capture incident cases orcontributing causes of death and, therefore, do not accuratelyreflect the total disease burden in the cohort.
Although the SMR for mesothelioma was elevated, theinternal analysis did not identify an association by duration ofemployment. One possible explanation of this is if the elevatedrisk of mesothelioma is related to work in the taconite industry,that risk may not be a function of time, rather a function of spe-cific exposures while performing certain job tasks. Likewise, theinternal analysis did not show an increased risk of lung cancer,hypertensive heart disease, and ischemic heart disease by dur-ation of employment, suggesting that other lifestyle factors arepotentially contributing to the elevated SMRs. These resultscould also have been affected by the crude employment dur-ation measure resulting in misclassification of time worked.
The analysis by zone was a cursory examination of the riskacross the iron range, since it evaluated any work in a zone. Itdoes not allow for comparison of risk between zones, but onlysuggests the risk of mesothelioma and lung cancer is elevated
with employment in each zone of the iron range. We limited theanalysis to iron mining workers who were born in 1920 or laterand who had at least 1 year of documented employment.Restricting the cohort further to those born in 1930 or later(excluding an additional 8504 workers) in order to potentiallybetter focus on taconite mining did not substantially change theresults and interpretation of this study (lung cancer SMR=1.15,95% CI 1.04 to 1.27, mesothelioma SMR=3.59, 95% CI 2.16to 5.60). Examination of the entire cohort of 44 243 indivi-duals, including those with less than 1 year of documentedemployment, likewise did not substantially change the resultsand interpretation of this study (lung cancer SMR=1.20, 95%CI 1.14 to 1.27, mesothelioma SMR=2.89, 95% CI 2.11 to3.87).
This study has some notable strengths, including the large sizeand long follow-up of the cohort and the high proportion ofworkers whose vital status was ascertained. Vital status wasfound on 98% of the eligible cohort, and few workers (4%)were excluded from the analysis due to data quality problems.Additionally, this study captured mortality from mesothelioma;early mortality studies of taconite workers were unable to evalu-ate mesothelioma until 1999 when ICD-10 became available.
Table 2 Selected SMRs for Minnesota Taconite Workers with ≥1 year employment*
Underlying cause of death Observed Expected SMR 95% CI
All causes 9094 8764.69 1.04 1.02 to 1.06All cancers 2710 2609.86 1.04 1.00 to 1.08Respiratory 981 846.74 1.16 1.09 to 1.23Larynx 26 23.84 1.09 0.71 to 1.60Trachea, bronchus, lung 949 815.67 1.16 1.09 to 1.24Pleura 1 1.81 0.55 0.01 to 3.08Mesothelioma 30 10.82 2.77 1.87 to 3.96
Heart diseases 2676 2435.81 1.10 1.06 to 1.14Hypertensive heart disease 62 34.17 1.81 1.39 to 2.33Ischemic heart disease 2185 1964.93 1.11 1.07 to 1.16Cerebrovascular disease 391 384.30 1.02 0.92 to 1.12Hypertension w/o heart disease 35 52.80 0.66 0.46 to 0.92
Respiratory Diseases 582 621.19 0.94 0.86 to 1.02COPD 363 369.89 0.98 0.88 to 1.09Asbestosis 1 2.90 0.35 0.01 to 1.92Silicosis 1 1.09 0.91 0.02 to 5.09
Transportation injuries 339 329.15 1.03 0.92 to 1.15Other injury 239 221.75 1.08 0.95 to 1.22Violence 289 258.41 1.12 0.99 to 1.26
*Adjusted for age, calendar period, and sex.SMR, Standardised mortality ratios.
Table 3 Standardised rate ratios by duration of employment, adjusted for age, calendar period, and sex
Employment duration (years)
Cause of death
Mesothelioma Lung cancerHypertensive heartdisease Ischemic heart disease
Obs SRR (95% CI) Obs SRR (95% CI) Obs SRR (95% CI) Obs SRR (95% CI)
1 4 1.14 (0.34 to 3.81) 123 1.01 (0.81 to 1.26) 6 0.90 (0.34 to 2.41) 241 0.88 (0.76 to 1.03)2–5 (ref) 8 1.0 250 1.0 14 1.0 576 1.06–14 6 0.77 (0.26 to 2.25) 239 1.01 (0.85 to 1.21) 18 1.29 (0.63 to 2.63) 545 0.99 (0.88 to 1.11)15+ 12 1.08 (0.44 to 2.67) 337 0.94 (0.79 to 1.13) 24 1.84 (0.82 to 4.11) 823 0.98 (0.88 to 1.10)
SRR, Standardised rate ratios.
Allen EM, et al. Occup Environ Med 2014;0:1–6. doi:10.1136/oemed-2013-102000 5
Workplace
group.bmj.com on July 16, 2014 - Published by oem.bmj.comDownloaded from
This study allowed us to characterise the mortality of the entireMinnesota mining population as compared to the rest ofMinnesota, as well as capture information specific to whereminers worked by zone which has not been done before. Theanalysis identifies a need for future studies with more refinedexposure estimates to evaluate the extent to whichmining-related exposures specifically contribute to diseaseburden and will be the next step in our evaluation of the healthof taconite mining workers.
CONCLUSIONIn summary, this analysis suggests taconite workers may be atincreased risk for mortality from some cancers and cardiovascu-lar diseases. Duration of employment did not appear to be asso-ciated with the mortality risk. However, based on the limitedway exposure potential was evaluated, we cannot say for surewhat the role of actual workplace exposures play in the diseaseexcess. Additional investigation is warranted.
What this paper adds
▸ Mining and processing of taconite results predominantly inexposure to non-asbestiform amphibole and non-amphiboleminerals.
▸ The health risks of these exposures are uncertain.▸ Increased mortality rates from mesothelioma, lung cancer
and some cardiovascular disease among taconite workerswere observed.
Acknowledgements The authors thank Alan Bender and Allan Williams of theMinnesota Department of Health for thoughtful input. The authors would also liketo acknowledge the efforts made by study staff members Richard Hoffbeck, DianeKampa, Nancy Pengra, and Leslie Studenski.
Contributors All authors participated in the study design, analysis, andinterpretation of the data. All authors assisted in revision and approved the finalmanuscript.
Funding This study was funded by the State of Minnesota. The views expressed arethe authors’ and do not reflect the State of Minnesota. EM Allen was supported inpart by the Midwest Center for Occupational Safety and Health training grant CDC/NIOSH 2T42 OH008434.
Competing interests None.
Ethics approval Ethics approval for this study was provided by the Universityof Minnesota Institutional Review Board.
Provenance and peer review Not commissioned; externally peer reviewed.
REFERENCES1 Berndt ME, Brice WC. The origins of public concern with taconite and human
health: reserve mining and the asbestos case. Regul Toxicol Pharmacol 2008;52(S1):S31–9.
2 Minnesota Department of Natural Resources. Digging in MN minerals: Taconite2011 (Retrieved 22 August 2011). http://www.dnr.state.mn.us/education/geology/digging/mining.html
3 Hwang J, Gurumurthy R, Raynor P, et al. Comprehensive assessment of exposuresto elongate mineral particles in the taconite mining industry. Ann Occup Hyg2013;57:966–78.
4 Department of Health and Human Services, National Institute for OccupationalSafety and Health. Asbestos fibers and other elongate mineral particles: State of thescience and roadmap for research, 2011: Publication No. 2011-159.
5 McSwiggin PL, Morey GB. Overview of the mineralogy of the Biwabik IronFormation, Mesabi Iron Range, northern Minnesota. Regul Toxicol Pharmacol2008;52(S1):S11–25.
6 Jirsa MA, Miller JD, Morey GB. Geology of the Biwabik Iron Formation and DuluthComplex. Regul Toxicol Pharmacol 2008;52(S1):S5–10.
7 Wilson R, McConnell EE, Ross M, et al. Risk assessment due to environmentalexposures to fibrous particulates associated with taconite ore. Regul ToxicolPharmacol 2008;52(S1):S232–45.
8 Langer AM, Maggiore CM, Nicholson WJ, et al. The contamination of Lake Superiorwith amphibole gangue minerals. Ann NY Acad Sci 1979;330:549–72.
9 Williams C, Dell L, Adams R, et al. State-of-the-science assessment of non-asbestosamphibole exposure: is there a cancer risk? Environ Geochem Health 2013;35:357–77.
10 Yang H-Y, Shie R-H, Chen P-C. Carving of non-asbestiform tremolite and the risk oflung cancer: a follow-up mortality study in a historical nephrite processing cohort.Occup Environ Med 2013;70:852–7.
11 Finkelstein MM. Malignant Mesothelioma Incidence Among Talc Miners and Millersin New York State. Am J Ind Med 2012;868(April):863–8.
12 Nolan RP, Gamble JF, Gibbs GW. Letter to the editor on commentary: malignantmesothelioma incidence among talc miners and millers in New York state by M MFinkelstein. Am J Ind Med 2013;56:1116–18.
13 Gamble JF, Gibbs GW. An evaluation of the risks of lung cancer and mesotheliomafrom exposure to amphibole cleavage fragments. Regul Toxicol Pharmacol 2008;52(S1):S154–86.
14 Hilding AC, Hilding DA, Larson DM, et al. Biological effects of ingested amositeasbestos, taconite tailings, diatomaceous earth and Lake Superior water in rats.Arch Environ Health 1981;36:298–303.
15 Levy BS, Sigurdson E, Mandel J, et al. Investigating possible effects of asbestos incity water: surveillance of gastrointestinal cancer incidence in Duluth, Minnesota.Am J Epidemiol 1976;103:362–8.
16 Higgins IT, Glassman JH, Oh MS, et al. Mortality of Reserve Mining Companyemployees in relation to taconite dust exposure. Am J Epidemiol 1983;118:710–19.
17 Cooper WC, Wong O, Graebner R. Mortality of workers in two Minnesota taconitemining and milling operations. J Occup Med 1988;30:506–11.
18 Cooper WC, Wong O, Trent LS, et al. An updated study of taconite miners andmillers exposed to silica and non-asbestiform amphiboles. J Occup Med1992;34:1173–80.
19 Minnesota Cancer Surveillance System Epidemiology Report. Cancer incidence ratesin Northeastern Minnesota. Minnesota Department of Health, 1999.
20 Centers for Disease Control and Prevention. Life Table Analysis System. 2013.http://www.cdc.gov/niosh/ltas
21 Lanphear BP, Buncher CR. Laten period for malignant mesothelioma ofoccupational origin. J Occup Med 1992;34:718–21.
22 Honda Y, Beall C, Delzell E, et al. Mortality among workers at a Talc miningand milling facility. Ann Occup Hyg 2002;46:575–85.
23 Price B. Industrial-grade talc exposure and the risk of mesothelioma. Crit RevToxicol 2010;40:513–30.
24 Gillam JD, Dement JM, Lemen RA, et al. Mortality patterns among hard rock goldminers exposed to an Asbestiform mineral. Ann N Y Acad Sci 1976;336–44.
25 McDonald JC, Gibbs GW, Liddel FDK, et al. Mortality after long exposure tocummingtonite-grunerite. Am Rev Respir Dis 1978;118:271–7.
26 Steenland K, Brown D. Mortality study of gold miners exposed to silica andnonasbestiform amphibole minerals: an update with 14 more years of followup.Am J Ind Med 1995;27:217–29.
27 McDonald JC, McDonald AD. The epidemiology of mesothelioma in historicalcontext. Eur Respir J 1996;9:1932–42.
28 Robinson BWS, Musk AW, Lake RA. Malignant mesothelioma. Lancet2005;366:397–408.
29 Robinson BM. Malignant pleural mesothelioma: an epidemiological perspective.Ann Cardiothorac Surg 2012;1:491–6.
30 Kawachi I, Colditz GA, Stampfer MJ, et al. Prospective study of shift work and riskof coronary heart disease in women. Circulation 1995;92:3178–82.
31 Price AE. Heart disease and work. Heart 2004;90:1077–84.32 Brook RD, Rajagopalan S, Pope CA, et al. Particulate matter air pollution and
cardiovascular disease: an update to the scientific statement from the AmericanHeart Association. Circulation 2010;121:2331–78.
33 Dockery DW, Pope CA, Xu X, et al. An Association between Air Pollution andMortality in Six U.S. Cities. N Engl J Med 1993;329:1753–9.
34 Miller KA, Siscovick DS, Sheppard L, et al. Long-term exposure to air pollution andincidence of cardiovascular events in women. N Engl J Med 2007;356:447–58.
35 Pope CA III, Burnett RT, Thurston GD, et al. Cardiovascular mortality and long-termexposure to particulate air pollution: epidemiological evidence of generalpathophysiological pathways of disease. Circulation 2004;109:71–7.
36 Bhatnagar A. Environmental cardiology: studying mechanistic links betweenpollution and heart disease. Cir Res 2006;99:692–705.
37 Gallagher LG, Ray RM, Li W, et al. Occupational exposures and mortality fromcardiovascular disease among women textile workers in Shanghai, China. Am J IndMed 2012;55:991–9.
38 Centers for Disease Control and Prevention. Current cigarette smoking prevalenceamong working adults-United States 2004–2009. MMWR Morb Mortal Wkly Rep2011;60:1305–9.
39 Sullivan PA. Vermiculite, respiratory disease, and asbestos exposure in Libby,Montana: update of a Cohort Mortality Study. Environ Health Perspect2007;115:579–85.
6 Allen EM, et al. Occup Environ Med 2014;0:1–6. doi:10.1136/oemed-2013-102000
Workplace
group.bmj.com on July 16, 2014 - Published by oem.bmj.comDownloaded from

doi: 10.1136/oemed-2013-102000 published online May 9, 2014Occup Environ Med
Elizabeth M Allen, Bruce H Alexander, Richard F MacLehose, et al. taconite mining industry workersMortality experience among Minnesota
http://oem.bmj.com/content/early/2014/05/09/oemed-2013-102000.full.htmlUpdated information and services can be found at:
These include:
References http://oem.bmj.com/content/early/2014/05/09/oemed-2013-102000.full.html#ref-list-1
This article cites 34 articles, 11 of which can be accessed free at:
P<P Published online May 9, 2014 in advance of the print journal.
serviceEmail alerting
the box at the top right corner of the online article.Receive free email alerts when new articles cite this article. Sign up in
Notes
(DOIs) and date of initial publication. publication. Citations to Advance online articles must include the digital object identifier citable and establish publication priority; they are indexed by PubMed from initialtypeset, but have not not yet appeared in the paper journal. Advance online articles are Advance online articles have been peer reviewed, accepted for publication, edited and
http://group.bmj.com/group/rights-licensing/permissionsTo request permissions go to:
http://journals.bmj.com/cgi/reprintformTo order reprints go to:
http://group.bmj.com/subscribe/To subscribe to BMJ go to:
group.bmj.com on July 16, 2014 - Published by oem.bmj.comDownloaded from

1
Cancer Incidence among Minnesota Taconite Mining Industry Workers
Objective: To evaluate cancer morbidity among Minnesota Taconite mining industry workers.
Methods: Cancer morbidity between 1988 and 2010 was evaluated in a cohort of 40,720 Minnesota
taconite mining workers employed between 1930 and 1983. Standardized incidence ratios (SIRs) with
95% confidence intervals (CI) were determined by comparing observed numbers of incident cancers
with frequencies in the Minnesota Cancer Surveillance System. SIRs for lung cancer by histological
subtypes were also estimated. SIRs were adjusted to account for out-of-state migration and a bias
factor was estimated to adjust smoking related cancers.
Results: A total of 5,700 cancers were identified in the study cohort including 51 mesotheliomas and
973 lung cancers. After adjusting for out-of-state migration, the SIR for lung cancer and mesothelioma
were 1.3 (95% CI: 1.2-1.4) and 2.4 (95% CI: 1.8-3.2) respectively. Other elevated cancers included
stomach (SIR = 1.4, 95% CI: 1.1-1.6), laryngeal (SIR = 1.4, 95% CI: 1.1-1.7), and bladder (SIR = 1.1, 95% CI:
1.0-1.2). Among the lung cancers, SIRs for adenocarcinoma (SIR = 1.2, 95% CI: 1.1-1.4), squamous cell
(SIR = 1.3, 95% CI: 1.2-1.5) non-specified (SIR = 1.6, 95% CI: 1.4-1.8), and other (SIR = 1.4, 95% CI: 1.1-1.8)
were elevated. Adjusting with a bias factor for smoking attenuated the lung cancer SIR (SIR = 1.1, 95%
CI: 1.0-1.1).
Conclusions: Taconite workers have an increased risk for certain cancers. Adjustment for smoking
attenuates but does not eliminate the risk of lung cancer in this population. Lifestyle and work-related
factors may play an important role in elevated morbidity. The extent to which mining-related exposures
contribute to disease burden is being further investigated.
BACKGROUND AND SIGNIFICANCE
Full scale taconite mining began in northeastern Minnesota in the 1950s along the 120 mile long
Mesabi Iron Range. This open pit mining is a multi-stage process that involves blasting rock with
dynamite, crushing the rock down to a fine powder, magnetically extracting the iron, and reforming the
more concentrated product into iron ore pellets. This process generates a significant amount of dust
that results in potential exposure to long and short non-asbestiform amphibole and non-amphibole
elongate mineral particles (EMPs), respirable silica, quartz, and cleavage fragments.[Hwang, 2013]
Several studies have examined the risk of exposure to non-asbestiform EMPs[Steenland and Brown,
1995; Honda et al., 2002; Gillam et al., 1976 McDonald et al., 1978], but the toxicity of these exposures
Appendix 5

2
is uncertain.[DHHS, 2011] A limited number of animal studies in this field have provided evidence to
suggest that non-asbestiform amphiboles might pose different risks than asbestos,[Davis et al, 1991;
Mossman 1990; Mossman, 2008] but that risk remains unclear.[DHHS, 2011; Finkelstein, 2012, Nolan,
2013]
Elevated age-adjusted rates of mesothelioma have been reported in northeastern Minnesota
counties in proximity to where taconite is mined. [NIOSH, 2008] This apparent increase in cases has
been concerning to the mining communities. Despite community-wide health concerns and the lack of
knowledge of these potential health effects, there is limited health research related to taconite mining
industry workers. Several small-scale mortality studies conducted in the early 1980s and 1990s
produced null findings. [Higgins, 1983; Cooper, 1988; Cooper, 1992] A larger mortality study in the
population used for this analysis found an excess of death from lung cancer and mesothelioma. In this
study, we examine incident cancers in a taconite workers cohort.
METHODS
Study population
The study cohort was enumerated in the early 1980s as part of the Mineral Resources Health
Assessment Program (MRHAP). The program was developed by the University of Minnesota, School of
Public Health, along with the Iron Range Resources and Rehabilitation Board. Its goals were to develop
expertise concerning hazards of the mining and processing of minerals in Minnesota and to research
health effects of mining and mineral processing. Investigators assembled a database of 68,737
individuals who had ever worked in one of the mines in operation in 1983. (Allen et al., 2014) Work
history information was collected through 1983, though some individuals worked beyond this point.
In 2008, the University of Minnesota launched the Taconite Workers Health Study (TWHS).
[UMN TWHS, 2013] One objective of the TWHS was to update the health assessment of the cohort of
68,737 miners collected by MRHAP in 1983. The cohort included both taconite workers and those who
had also worked in the earlier hematite mining operations. In order to capture workers who were most
likely to have been working after taconite mining began in the 1950s, the cohort was limited to those
born in 1920 or later, reducing the cohort size to 46,170 individuals. An additional 1,691 were excluded
including 477 whose only record on file was an application with no further evidence of employment, 679
whose vital status remained unknown after follow-up, and 535 for whom employment information was
improbable, e.g. began working at age fourteen or younger. For this analysis of cancer incidence, the
cohort was further restricted to individuals living to at least 1988 when the Minnesota Cancer

3
Surveillance System would capture the incident cases, which eliminated 3,759 workers who were
deceased before 1988. The final study cohort included 40,720 individuals.
Cancer Incidence
To identify incident cancers, the cohort was linked to the Minnesota Cancer Surveillance System
(MCSS). The MCSS is Minnesota’s statewide, population-based cancer registry that collects histological
information of newly diagnosed cancers on all Minnesota residents. The system was established in 1988
by state statute as a mandatory reporting system to monitor cancers in Minnesota, inform health
professionals, answer the public’s questions, and promote cancer research. Cancer incidence including
date of diagnosis, cancer site, and histology were obtained for cohort members matched to the MCSS.
Data analysis
The cancer morbidity analyses covered the period from 1988 (when the Minnesota Cancer
Surveillance System began collecting data) through 2010. The cancer rate of the cohort was compared
with that of the Minnesota population to estimate standardized cancer incidence ratios (SIRs) and 95%
confidence intervals (CIs) adjusted for sex, and five-year age and calendar period. Person-time at risk
was accrued from January 1, 1988 until cancer diagnosis date, date of death, or the end of the follow-up
period (December 31, 2010). For individuals with more than one diagnosis of the same cancer, they
were followed only to the date of first diagnosis. The expected number of cancers was calculated by
applying age, calendar time, and sex specific cancer rates of the Minnesota population to the person-
year observations of the study population. SIRs were obtained by computing the ratio of the observed-
to-expected number of cancers. Selected cancers of interest were mesothelioma, lung, esophageal,
kidney, laryngeal, liver and bile duct, oral, pancreatic, stomach, and bladder cancers. These cancers
were of interest to study investigators because of their association with asbestos exposure. DHHS, 2011;
National Tox Program 2011; ATSDR] All SIRs were computed using STATA 12.1 software.
We further explored lung cancer incidence by histological type. Lung cancer in the study and
reference populations were grouped into one of five subtypes: adenocarcinoma, squamous cell, small
cell, other/rare (including large cell), and non-specified carcinomas. The International Classification of
Diseases for Oncology (ICD-O) histology code groupings were determined by study investigators. These
groupings can be found in Appendix Table A. Standardized incidence ratios and 95% CIs were estimated
for each of the five lung cancer histological subtypes.
Accurate estimation of cancer incidence rates in the study population requires individuals to
remain in the state of Minnesota, and thus under MCSS surveillance. In order to adjust for potential
migration, out-of-state deaths were used as an estimate of out-of-state migration by age group in the
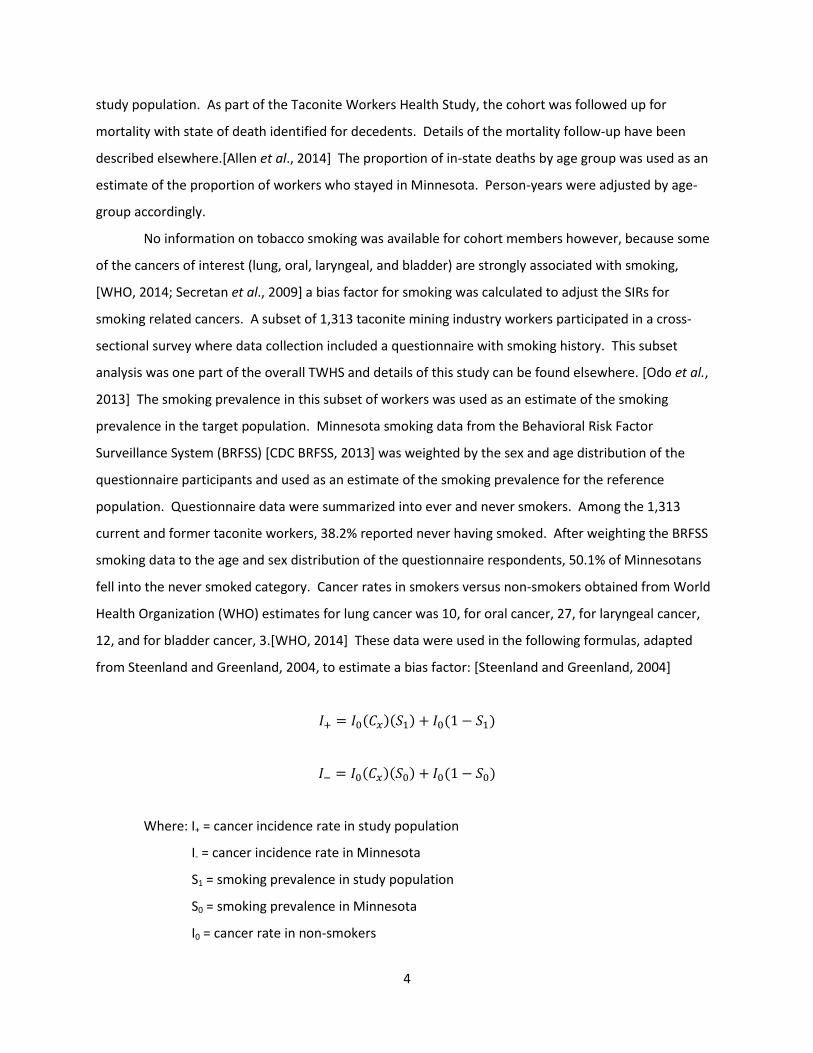
4
study population. As part of the Taconite Workers Health Study, the cohort was followed up for
mortality with state of death identified for decedents. Details of the mortality follow-up have been
described elsewhere.[Allen et al., 2014] The proportion of in-state deaths by age group was used as an
estimate of the proportion of workers who stayed in Minnesota. Person-years were adjusted by age-
group accordingly.
No information on tobacco smoking was available for cohort members however, because some
of the cancers of interest (lung, oral, laryngeal, and bladder) are strongly associated with smoking,
[WHO, 2014; Secretan et al., 2009] a bias factor for smoking was calculated to adjust the SIRs for
smoking related cancers. A subset of 1,313 taconite mining industry workers participated in a cross-
sectional survey where data collection included a questionnaire with smoking history. This subset
analysis was one part of the overall TWHS and details of this study can be found elsewhere. [Odo et al.,
2013] The smoking prevalence in this subset of workers was used as an estimate of the smoking
prevalence in the target population. Minnesota smoking data from the Behavioral Risk Factor
Surveillance System (BRFSS) [CDC BRFSS, 2013] was weighted by the sex and age distribution of the
questionnaire participants and used as an estimate of the smoking prevalence for the reference
population. Questionnaire data were summarized into ever and never smokers. Among the 1,313
current and former taconite workers, 38.2% reported never having smoked. After weighting the BRFSS
smoking data to the age and sex distribution of the questionnaire respondents, 50.1% of Minnesotans
fell into the never smoked category. Cancer rates in smokers versus non-smokers obtained from World
Health Organization (WHO) estimates for lung cancer was 10, for oral cancer, 27, for laryngeal cancer,
12, and for bladder cancer, 3.[WHO, 2014] These data were used in the following formulas, adapted
from Steenland and Greenland, 2004, to estimate a bias factor: [Steenland and Greenland, 2004]
( )( ) ( )
( )( ) ( )
Where: I+ = cancer incidence rate in study population
I- = cancer incidence rate in Minnesota
S1 = smoking prevalence in study population
S0 = smoking prevalence in Minnesota
I0 = cancer rate in non-smokers

5
Cx = cancer rate in smokers versus non-smokers
A bias factor for smoking was estimated with I+/I- and smoking related cancers were divided by
this bias factor to adjust for potential differences in smoking between the study and reference
populations. Using the smoking prevalence estimates in the study population, the Minnesota general
population, and the cancer rates among smokers versus non-smokers, the bias factor for four of the
smoking related cancers (lung, laryngeal, oral, and bladder cancers) was estimated.
RESULTS
This cohort of Minnesota taconite mining industry workers was predominantly male (93%) with
an average work history of 6.5 years. Among the 40,720 workers, 5,700 cancers were identified by
MCSS (5408 for men and 292 for women). Of those, 973 lung cancers and 51 mesotheliomas were
identified.
After adjusting for age, sex, calendar period, and out-of-state migration, the cohort members
experienced elevated rates of mesothelioma (SIR = 2.4, 95% CI: 1.8-3.2), lung (SIR = 1.3, 95% CI: 1.2-1.4),
laryngeal (SIR = 1.4, 95% CI: 1.1-1.7), stomach (SIR = 1.4, 95% CI: 1.1-1.6), and bladder (SIR = 1.1, 95% CI:
1.0-1.2) cancers. SIRs and 95% CIs for selected cancers of interest are summarized in table 1.
Table 1. Selected SIRs for Minnesota Taconite Workers
Cancer Observed Expected SIR* 95% CI
Mesothelioma 51 21.1 2.4 1.8-3.2
Lung 973 750.9 1.3 1.2-1.4
Esophagus 87 76.9 1.1 0.9-1.4
Kidney 170 178.2 1.0 0.8-1.1
Larynx 94 68.6 1.4 1.1-1.7
Liver and bile duct 52 49.4 1.1 0.8-1.4
Oral 172 162.5 1.1 0.9-1.2
Pancreas 120 105.9 1.1 0.9-1.4
Stomach 105 77.7 1.4 1.1-1.6
Bladder 363 338.5 1.1 1.0-1.2
*Adjusted for age, sex, calendar period, and out-of-state migration

6
A closer look at lung cancer by histological subtypes showed that among the 973 incident lung
cancers, 313 were adenocarcinomas, 260 were squamous cell carcinomas, 138 were small cell
carcinomas, 201 were non-specified lung cancers, and 61 were other or rare types of lung cancer. SIRs
were elevated for adenocarcinoma (SIR = 1.2, 95% CI: 1.1-1.4), squamous cell (SIR = 1.3, 95% CI: 1.2-1.5),
non-specified (SIR = 1.6, 95% CI: 1.3-1.8), and rare cancers (SIR = 1.3, 95% CI: 1.0-1.7) after adjusting for
age, sex, calendar period, and out-of-state migration. Table 2 shows SIRs for lung cancer by histological
subtype.
Table 2. SIRs for lung cancer by histological subtype
Lung cancer histological subtype N SIR*
Adenocarcinoma 313 1.2 (1.1, 1.4)
Squamous cell 260 1.3 (1.2, 1.5)
Small Cell 138 1.1 (1.0, 1.3)
Non-specified 201 1.6 (1.3, 1.8)
Rare/other (including large cell) 61 1.3 (1.0, 1.7)
Total 973 1.3 (1.2, 1.4)
*Adjusted for age, sex, calendar period, and out-of-state migration
The estimated bias factors for lung, laryngeal, oral, and bladder cancers were 1.2, 1.2, 1.2, and
1.1 respectively. The bias factor for lung cancer (1.2) was similar to the one estimated in the adapted
example (1.18) from Steenland and Greenland, 2004. After adjustment using the smoking bias factor,
the SIR for lung cancer was attenuated but remained above what would be expected in the Minnesota
population (SIR = 1.1, 95% CI: 1.0-1.2). The rates of laryngeal, oral, and bladder cancers were as
expected in the Minnesota population after the bias factor adjustment (laryngeal SIR = 1.1, 95% CI: 0.9-
1.4, oral SIR = 0.9, 95% CI: 0.7-1.0, bladder SIR = 1.0, 95% CI: 0.9-1.1). Though the effect of smoking on
lung cancer risk by histological subtype varies, squamous and small cell carcinomas are found to be the
most strongly associated with smoking (Khuder, 2001). The same sensitivity analysis was applied to
squamous and small cell carcinomas. The SIRs were attenuated to what would be expected in the
Minnesota population for both squamous (SIR = 1.1, 95% CI: 0.9-1.2) and small cell carcinoma (SIR = 0.9,
95% CI: 0.8-1.1). SIRs with adjustments for smoking are summarized in table 3.

7
Table 3. SIRs for smoking related cancers before and after bias factor adjustment for smoking.
Cancer SIR* 95% CI Smoking adjusted SIR**
95% CI
Lung 1.3 1.2-1.4 1.1 1.0-1.2
Squamous cell 1.3 1.2-1.5 1.1 0.9-1.2
Small cell 1.1 1.0-1.3 0.9 0.8-1.1
Larynx 1.4 1.1-1.7 1.1 0.9-1.4
Oral 1.1 0.9-1.2 0.9 0.7-1.0
Bladder 1.1 1.0-1.2 1.0 0.9-1.1
*Adjusted for age, sex, calendar period, and out-of-state migration
**Bias factor for lung, laryngeal, oral and bladder cancers = 1.2, 1.2, 1.2, and 1.1 respectively
DISCUSSION
In this analysis of cancer incidence among Minnesota taconite mining industry workers, there
were higher than expected rates of certain cancers as compared to the general Minnesota population,
specifically for mesothelioma, lung, laryngeal, stomach, and bladder cancers. Each lung cancer by
histological subtype showed an increased SIR. A sensitivity analysis to account for differences in
smoking rates between the study and reference populations attenuated the association between
laryngeal, bladder, and oral cancers substantially as well as squamous cell and small cell carcinomas of
the lung. However, even after smoking bias adjustment, the overall lung cancer SIR remained elevated.
In total, these data support an elevated SIR for those cancers that have historically had the strongest
relationship to asbestos and EMP exposure. These observations are in a population of workers exposed
to a variety of mineral dusts including asbestiform and non-asbestiform elongate mineral particles.
The strong association between asbestos exposure and mesothelioma and lung cancer is well
documented [DHHS, 2011; McDonald and McDonald, 1996; Robinson et al., 2005; Robinson, 2012]
however, the toxicity of their non-asbestiform analogs is not understood. Results from recent studies
have suggested that exposure to non-asbestiform EMPs does not have high potential for disease
[Mossman 2008; Berry and Gibbs, 2008; Gamble and Gibbs, 2007] however, NIOSH has specifically
identified non-asbestiform EMPs as a needed area of research. [DHHS, 2011] Non-asbestiform EMPs are
included in NIOSH recommended exposure limits due to technical limitations of routine EMP
assessments and uncertainty about the potential toxicity of non-asbestiform fibers. There is
inconclusive evidence in epidemiological studies of New York talc miners [Honda et al., 2002] and
Homestake gold miners [Gillam et al., 1976; McDonald et al., 1978; Steenland and Brown, 1995], and
evidence from animal studies suggests that fiber dimension, and not composition, is the major

8
determinant of carcinogenicity for mineral fibers. There remains a need to determine conclusively
whether non-asbestiform amphibole mineral particles that are chemically similar to asbestos, but with
different physical forms that are also capable of causing disease.[DHHS, 2011] These mineral particles,
including low-levels of non-asbestiform mineral particles, are present in taconite mining operations.
Additionally, the predominant exposure potential during the mining and processing of taconite is of
short mineral particles, less than five microns in length.[Hwang et al., 2013] These short mineral
particles are currently not included in NIOSH regulatory standards[DHHS, 2011; OSHA] and have not
been studied to the extent that regulated particles have been.[Aust et al., 2011]
We observed elevated SIRs for all types of lung cancer. Small-cell lung cancer is rarely observed
in never-smokers[Pallis and Syrigos, 2013] while adenocarcinoma is the predominant histological type in
never-smokers.[Pallis and Syrigos, 2013; Toh et al., 2006] Moreover, adenocarcinoma has been shown
to be the most common histological subtype in asbestos-exposed individuals.[Raffn et al., 1993; de Klerk
et al., 1996] The results of our study show that of the 973 lung cancers identified in the study cohort,
138 were small-cell and 313 were adenocarcinoma. The smoking adjusted results suggest that smoking
habit does not account for all of the lung cancer excess in this population. Occupational exposures may
also contribute to the elevation in cancer incidence.
The earliest studies of taconite mining exposures focused on ingestion exposure and showed no
association between cancers and EMP ingestion.[Hilding et al., 1981; Levy et al., 1976] These were
followed by mortality assessments in specific mining companies.[Higgins et al., 1983; Cooper et al.,
1988; Cooper et al., 1992] Though these mortality studies did not show a significant excess in
respiratory cancers, they had small study populations, short follow-up periods and thus limited
statistical power. In 2007, the Minnesota Department of Health reported a 73% excess in cases of
mesothelioma for men in northeastern Minnesota between 1988 and 1996,[MCSS, 1999] consistent
with the elevated SIR reported here. The cause of this excess remains unknown.
The few studies of other occupational cohorts who experience exposures to non-asbestiform
mineral particles have been inconclusive. Talc miners in upstate New York and gold miners in South
Dakota experience potential exposures to non-asbestiform EMPs. The studies of talc miners reported an
excess in mortality from all cancers, lung cancer, ischemic heart disease, and non-malignant repiratory
disease, however a lack of exposure-response relationship was seen. Studies of the Homestake gold
mine in South Dakota published in the 1970s and 1980s reported an excess of respiratory cancer and a
small excess of lung cancer[Gillam et al., 1976; McDonald et al., 1978; Steenland and Brown, 1995] with
no observed dose-response relationship, suggesting a weak association between dust exposure and lung
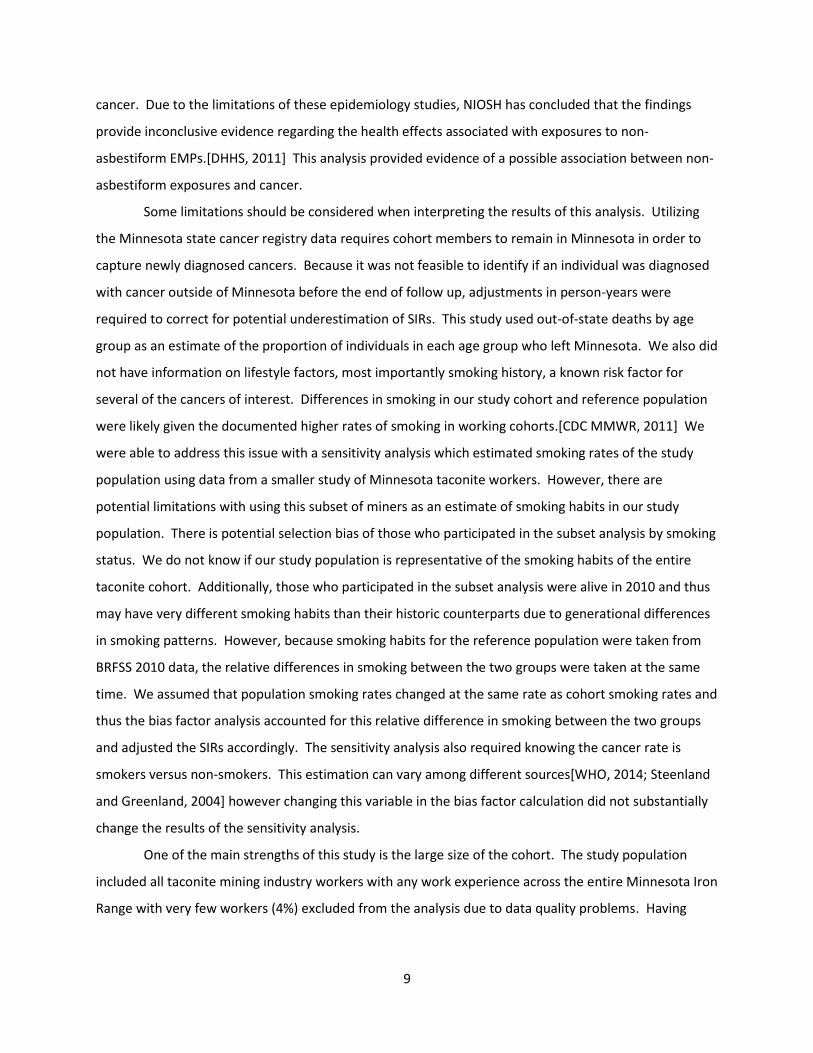
9
cancer. Due to the limitations of these epidemiology studies, NIOSH has concluded that the findings
provide inconclusive evidence regarding the health effects associated with exposures to non-
asbestiform EMPs.[DHHS, 2011] This analysis provided evidence of a possible association between non-
asbestiform exposures and cancer.
Some limitations should be considered when interpreting the results of this analysis. Utilizing
the Minnesota state cancer registry data requires cohort members to remain in Minnesota in order to
capture newly diagnosed cancers. Because it was not feasible to identify if an individual was diagnosed
with cancer outside of Minnesota before the end of follow up, adjustments in person-years were
required to correct for potential underestimation of SIRs. This study used out-of-state deaths by age
group as an estimate of the proportion of individuals in each age group who left Minnesota. We also did
not have information on lifestyle factors, most importantly smoking history, a known risk factor for
several of the cancers of interest. Differences in smoking in our study cohort and reference population
were likely given the documented higher rates of smoking in working cohorts.[CDC MMWR, 2011] We
were able to address this issue with a sensitivity analysis which estimated smoking rates of the study
population using data from a smaller study of Minnesota taconite workers. However, there are
potential limitations with using this subset of miners as an estimate of smoking habits in our study
population. There is potential selection bias of those who participated in the subset analysis by smoking
status. We do not know if our study population is representative of the smoking habits of the entire
taconite cohort. Additionally, those who participated in the subset analysis were alive in 2010 and thus
may have very different smoking habits than their historic counterparts due to generational differences
in smoking patterns. However, because smoking habits for the reference population were taken from
BRFSS 2010 data, the relative differences in smoking between the two groups were taken at the same
time. We assumed that population smoking rates changed at the same rate as cohort smoking rates and
thus the bias factor analysis accounted for this relative difference in smoking between the two groups
and adjusted the SIRs accordingly. The sensitivity analysis also required knowing the cancer rate is
smokers versus non-smokers. This estimation can vary among different sources[WHO, 2014; Steenland
and Greenland, 2004] however changing this variable in the bias factor calculation did not substantially
change the results of the sensitivity analysis.
One of the main strengths of this study is the large size of the cohort. The study population
included all taconite mining industry workers with any work experience across the entire Minnesota Iron
Range with very few workers (4%) excluded from the analysis due to data quality problems. Having

10
mortality data including state of death for the study population allowed for an estimation of out-of-state
migration which can be challenging for other cancer incidence studies of this nature.
CONCLUSION
In summary, this analysis suggests that Minnesota taconite mining industry workers are at risk
for development of mesothelioma, lung cancer, and other cancers. The elevated risk of lung and other
cancers may be due to elevated smoking and other unmeasured confounders among the workers.
However, because confounding variables were not measured and workplace exposure measurements
were not evaluated in this analysis, we cannot say for sure if actual work place exposures contribute to
that excess in cancer incidence. A detailed examination of taconite workplace exposures is warranted.
Acknowledgement: This study was funded by the State of Minnesota by a project grant to the University of Minnesota. The
opinions expressed are those of the authors and do not represent the State of Minnesota.

11
References
1. Agency for Toxic Substances and Disease Registry. Toxicological Profile for Asbestos. September
2001. Retrieved January 28, 2014, from: http://www.atsdr.cdc.gov/toxprofiles/tp61.pdf.
2. Allen E, Alexander B, MacLehose R, et al. Mortality Experience Among Minnesota Taconite
Mining Industry Workers, Occupational and Environmental Medicine. Accepted for publication;
date pending.
3. Aust AE, Cook PM, Dodson RF. Morphological and chemical mechanisms of elongate mineral
particle toxicities. J Toxicol Environ Health B Crit Rev 2011;14:40-75.
4. Berry G, Gibbs GW. An overview of the risk of lung cancer in relation to exposure to asbestos
and of taconite miners. Regul Toxicol Pharmacol 2008;52(S1):S218-22.
5. Centers for Disease Control and Prevention. Current cigarette smoking prevalence among
working adults-United States 2004-2009. MMWR Morb Mortal Wkly Rep 2011;60(38):1305-
1309.
6. Centers for Disease Control and Prevention. Behavioral Risk Factor Surveillance System 2013.
Available from: http://www.cdc.gov/brfss/data_tools.htm.
7. Cooper WC, Wong O, Graebner R. Mortality of workers in two Minnesota taconite mining and
milling operations. J Occup Med 1988;30(6):506-511.
8. Cooper WC, Wong O, Trent LS, et al. An updated study of taconite miners and millers exposed
to silica and non-asbestiform amphiboles. J Occup Med 1992;34(12):1173-1180.
9. Davis JM, Addison J, McIntosh C, et al. Variations in the carcinogenicity of tremolite dust
samples of differing morphology. Ann NY Acad Sci 1991;643:473-490.
10. Department of Health and Human Services, National Institute for Occupational Safety and
Health. Asbestos fibers and other elongate mineral particles: State of the science and
roadmap for research, 2011: Publication No. 2011-159.

12
11. Finkelstein MM. Malignant Mesothelioma Incidence Among Talc Miners and Millers in New
York State. Am J Ind Med 2012;868(April):863–868.
12. Gamble JF, Gibbs GW. Evaluation of the risks of lung cancer and mesothelioma from exposure
to amphibole cleavage fragments. Regul Toxicol Pharmacol 2007;52(S1):S154-S186.
13. Gillam JD, Dement JM, Lemen RA, et al. Mortality Patterns Among Hard Rock Gold Miners
Exposed to an Asbestiform Mineral. Ann N Y Acad Sci 1976;336–344.
14. Higgins IT, Glassman JH, Oh MS, et al. Mortality of Reserve Mining Company employees in
relation to taconite dust exposure. Am J Epidemiol 1983;118(5):710-9.
15. Hilding AC, Hilding DA, Larson DM, et al. Biological effects of ingested amosite asbestos,
taconite tailings, diatomaceous earth and Lake Superior water in rats. Arch Environ Health
1981;36:298-303.
16. Honda Y, Beall C, Delzell E, et al. Mortality among Workers at a Talc Mining and Milling Facility.
Ann Occup Hyg 2002;46(7):575–585.
17. Hwang J, Gurumurthy R, Raynor P, et al. Comprehensive Assessment of Exposures to Elongate
Mineral Particles in the Taconite Mining Industry. Ann Occup Hyg 2013;doi:10.1093.
18. Khuder SA. Effect of cigarette smoking on major histological types of lung cancer: a meta-
analysis. Lung Cancer 2001 Feb-Mar;31(2-3):139-48.
19. de Klerk, NH, Musk AW, Eccles J et al. Exposure to crocidolite and the incidence of different
histological types of lung cancer. Occup Environ Med 1996;53:157-159.
20. Levy BS, Sigurdson E, Mandel J, et al. Investigating possible effects of asbestos in city water:
surveillance of gastrointestinal cancer incidence in Duluth, Minnesota. Am J Epidemiol
1976;103:362-368.
21. Minnesota Cancer Surveillance System Epidemiology Report. Cancer incidence Rates in
Northeastern Minnesota. Minnesota Department of Health, 1999.

13
22. McDonald JC, Gibbs GW, Liddel FDK, et al. Mortality after long exposure to cummingtonite-
grunerite. Am Rev Respir Dis 1978;118:271-277.
23. McDonald JC, McDonald AD. The epidemiology of mesothelioma in historical context. Eur
Respir J 1996;9(9):1932–1942.
24. Mossman B, Sesko A. In vitro assays to predict the pathogenicity of mineral fibers. Toxicology
1990;60:53-61.
25. Mossman BT. Assessment of the pathogenic potential of asbestos vs. nonasbestiform
particulates (cleavage fragments) in in vitro (cell or organ culture) models and bioassays. Regul
Toxicol Pharmacol 2008;52(S1):S200-3.
26. National Institute for Occupational Safety and Health. Malignant mesothelioma: Counties with
highest age-adjusted death rates (per million population), U.S. residents age 15 and over,
2000-2004. Work-Related Lung Disease (WoRLD) Surveilllance Report Update, 2008:
http://www2.cdc.gov/drds/WorldReportData/FigureTableDetails.asp?FigureTableID=901andG
roupRefNumber=T07-10, accessed January 17, 2014.
27. National Toxicology Program. Asbestos. In: Report on Carcinogens. Twelfth Edition. U.S.
Department of Health and Human Services, Public Health Service, National Toxicology
Program, 2011.
28. Nolan RP, Gammble JF, Gibbs GW. Letter to the editor on commentary: malignant
mesothelioma incidence among talc miners and millers in New York state by M M Finkelstein.
Am J Ind Med 2013;56(9):1116-8.
29. Odo NU, Majdel JH, Perlman DM, et al. Estimates of restrictive ventilator defect in the mining
industry. Considerations for epidemiological investigations: a cross-sectional study. BMJ Open
2013; 3:e002561 doi:10.1136/bmjopen-2013-00256.

14
30. Occupational Safety and Health Association. OSHA Standards 1910.1001 Asbestos. Available at
https://www.osha.gov/pls/oshaweb/owadisp.show_document?p_table=standardsandp_id=9
995. Accessed J.
31. Pallis AG, Syrigos KN. Lung cancer in never smokers: disease charateristics and risk factors. Crit
Rev Oncol Hematol 2013 Dec;88(3):494-503 .
32. Raffn E, Lynge E, Korsgaard B. Incidence of lung cancer by histological type among asbestos
cement workers in Denmark. Br J Ind Med 1993 January;50(1):85-89.
33. Robinson BWS, Musk AW, Lake RA. Malignant mesothelioma. Lancet 2005;366(9483):397–
408.
34. Robinson BM. Malignant pleural mesothelioma: an epidemiological perspective. Ann
Cardiothorac Surg 2012;1(4):491–6.
35. Secretan B, Straif K, Baan R, et al. A review of human carcinogens-Part E: tobacco, areca nut,
alcohol, coal smoke, and salted fish. The Lancet Oncol 2009;10:1022-4.
36. Steenland K, Greenland S. Monte Carlo Sensitivity Analysis and Bayesian Analysis of Smoking
as an Unmeasured Confounder in a Study of Silica and Lung Cancer. Am J Epidemiol
2004;160:384-392.
37. Steenland K, Brown D. Mortality study of gold miners exposed to silica and nonasbestiform
amphibole minerals: an update with 14 more years of followup. Am J Ind Med 1995;27:217-
229.
38. Toh CK, Gao F, Lim WT, et al. Never-smokers with lung cancer: epidemiologic evidence of a
distinct disease entity. Journal of Clinical Oncology 2006;24:2245-51.
39. University of Minnesota. Taconite workers health study 2013. Available from:
http://taconiteworkers.umn.edu/

15
40. World Health Organization. Tobacco Free Initiative 2014. Available from:
http://www.who.int/tobacco/research/cancer/en/.

16
APPENDIX Table A. Lung cancer major histology groupings
Histology ICD-O code count
ADENOCARCINOMA 313 Acinic Cell Adenocarcinoma 85503 1 Adenocarcinoma NOS 81403 263 Bronchiolo-Alveolar Adenocarcinoma 82503 23 Bronchiolo-Alveolar Mucinous 82533 1 Bronchiolo-Alveolar non-mucinous 82523 4 Mixed Cell Adenocarcinoma 83233 1 Mucin Producing Adenocarcinoma 84813 11 Clear Cell Adenocarcinoma 83103 1 Mucinous Adenocarcinoma 84803 5 Papillary Adenocarcinoma NOS 82603 3
SMALL CELL CARCINOMA 139 Combined Small Cell Carcinoma 80453 2 Intermediate Cell Small Cell Carcinoma 80443 5 Neuroendocrine Carcinoma 82463 9 Oat Cell Carcinoma 80423 4 Small Cell Tumor 80023 1 Small Cell Carcinoma NOS 80413 118
SQUAMOUS CELL CARCINOMA 258 Basaloid Squamous Cell Carcinoma 80833 1 Squamous Cell Carcinoma Spindle Cell 80743 1 Squamous Cell Carcinoma Keratinizing 80713 9 Squamous Cell Carcinoma Non- Keratinizing 80723 10 Squamous Cell Carcinoma 80703 237
NON-SPECIFIED 202 Neoplasm Malignant 80003 19 Non-Small Cell Carcinoma 80463 97 Carcinoma NOS 80103 68 Undifferentiated Carcinoma 80203 11 Carcinoid Tumor 82403 4 Atypical Carcinoid Tumor 82493 1 Tumor cells Malignant 80013 2
RARE/OTHER 61 Anaplastic Carcinoma 80213 2 Spindle Cell Carcinoma 80323 1 Large Cell Carcinoma NOS 80123 38 Large Cell Carcinoma rhabdoidphenotype 80143 1 Adenosquamous Carcinoma 85603 12 Fibrous histiocytoma 88303 1 Large Cell Neuroendocrine Carcinoma 80133 5 Sarcome NOS 88003 1

1
A Case-Control Study of Mesothelioma in Taconite Miners Exposed to Elongate Mineral
Particles (EMPs)
Background
During the past several decades, Minnesota’s taconite industry has been plagued by controversy
over potential health problems. Concerns were initially expressed in the 1970s regarding the
disposal of taconite waste rock, which contained fibrous minerals, into Lake Superior and
ultimately into the city of Duluth’s drinking water (Wilson et al., 2008). In follow-up of this
issue, occupational studies were conducted that did not demonstrate evidence of disease excess
(Cooper et al., 1988, 1992; Higgins et al., 1983). In 2007, the Minnesota Department of Health
identified an apparent excess of mesothelioma in a cohort of taconite miners (MDH Report,
2007), using the state’s cancer registry to identify cases. This finding was confirmed in a general
cohort mortality analysis, which indicated a 2.77 fold increase in the rate of mesothelioma in
taconite industry workers when compared to the rest of Minnesota (Allen et al., 2014). While
this finding suggested that people working in the industry were at higher risk for mortality from
mesothelioma, it did not reveal specifically how work in the industry may be related to this risk.
The present report attempts to determine further details about the role of the workplace in this
finding.
Assessments of workplace mineral exposure and lung disease have been hampered by a
confusing terminology that may deal with different measurement techniques and/or different
definitions of exposure. As an example, although mesothelioma has been strongly linked to
asbestos exposure, the term “asbestos” may have different meanings. It may have a commercial
connotation, as the six regulated types of asbestos [chrysotile (serpentine) and five types of
amphiboles: anthophyllite, tremolite, cummingonite-grunerite (amosite), riebeckite (crocidolite)
and actinolite] may be used in various industrial applications. From a mineralogical view, all
types may exhibit the “asbestiform” habit (morphology), meaning they can be separated in their
natural environmental state into hair-like fibers along the longitudinal axis (Gunter et al., 2007).
The asbestiform type has the highest potential for lung exposure. All regulated types may also
exist naturally in a non-asbestiform habit, with lower lung exposure potential. The term “fiber”
is another ambiguous term, as mineralogical and regulatory definitions of fiber are inconsistent.
The mineralogical definition refers to the smallest elongate crystalline unit that can be separated
from a bundle or appears to have grown individually in that shape. Polycrystalline aggregates of
mineral fibers give rise to a fibrous habit, one specific type of which is referred to as
“asbestiform”.
Use of the term “elongate mineral particle” (EMP) has been employed to clarify some of the
confusion around the use of these terms (NIOSH, 2011). An EMP refers to any mineral that has
an aspect ratio (length to width ratio) of 3:1 or greater. EMPs may be classified as amphibole or
non-amphibole and amphibole EMPs may be further described as asbestiform or non-asbestiform
(NIOSH, 2011). Mineral composition, dimension and habit are important parameters in the
definition of EMPs. The regulatory definition of “fiber” is based solely on dimensional criteria
and refers to particles with aspect ratios of at least 3:1 and a length greater than 5 µm (NIOSH
Method 7400, 2003). EMPs defined in this way are counted with the use of phase contrast
Appendix 6
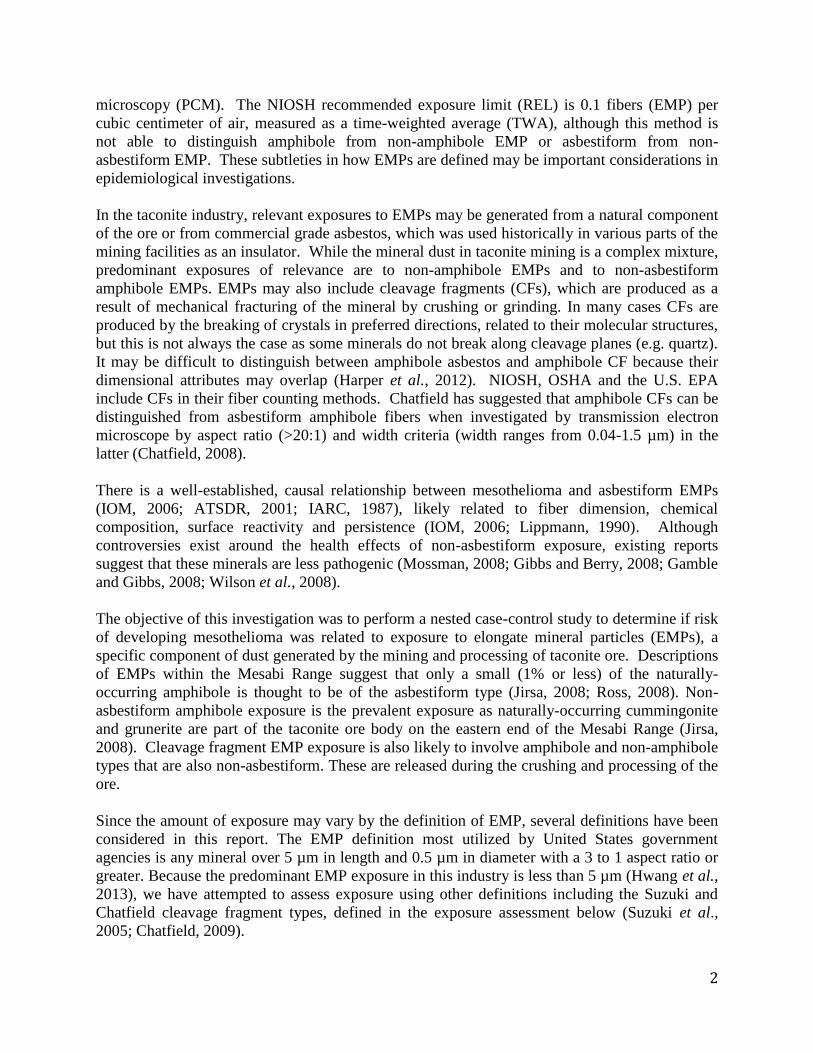
2
microscopy (PCM). The NIOSH recommended exposure limit (REL) is 0.1 fibers (EMP) per
cubic centimeter of air, measured as a time-weighted average (TWA), although this method is
not able to distinguish amphibole from non-amphibole EMP or asbestiform from non-
asbestiform EMP. These subtleties in how EMPs are defined may be important considerations in
epidemiological investigations.
In the taconite industry, relevant exposures to EMPs may be generated from a natural component
of the ore or from commercial grade asbestos, which was used historically in various parts of the
mining facilities as an insulator. While the mineral dust in taconite mining is a complex mixture,
predominant exposures of relevance are to non-amphibole EMPs and to non-asbestiform
amphibole EMPs. EMPs may also include cleavage fragments (CFs), which are produced as a
result of mechanical fracturing of the mineral by crushing or grinding. In many cases CFs are
produced by the breaking of crystals in preferred directions, related to their molecular structures,
but this is not always the case as some minerals do not break along cleavage planes (e.g. quartz).
It may be difficult to distinguish between amphibole asbestos and amphibole CF because their
dimensional attributes may overlap (Harper et al., 2012). NIOSH, OSHA and the U.S. EPA
include CFs in their fiber counting methods. Chatfield has suggested that amphibole CFs can be
distinguished from asbestiform amphibole fibers when investigated by transmission electron
microscope by aspect ratio (>20:1) and width criteria (width ranges from 0.04-1.5 µm) in the
latter (Chatfield, 2008).
There is a well-established, causal relationship between mesothelioma and asbestiform EMPs
(IOM, 2006; ATSDR, 2001; IARC, 1987), likely related to fiber dimension, chemical
composition, surface reactivity and persistence (IOM, 2006; Lippmann, 1990). Although
controversies exist around the health effects of non-asbestiform exposure, existing reports
suggest that these minerals are less pathogenic (Mossman, 2008; Gibbs and Berry, 2008; Gamble
and Gibbs, 2008; Wilson et al., 2008).
The objective of this investigation was to perform a nested case-control study to determine if risk
of developing mesothelioma was related to exposure to elongate mineral particles (EMPs), a
specific component of dust generated by the mining and processing of taconite ore. Descriptions
of EMPs within the Mesabi Range suggest that only a small (1% or less) of the naturally-
occurring amphibole is thought to be of the asbestiform type (Jirsa, 2008; Ross, 2008). Non-
asbestiform amphibole exposure is the prevalent exposure as naturally-occurring cummingonite
and grunerite are part of the taconite ore body on the eastern end of the Mesabi Range (Jirsa,
2008). Cleavage fragment EMP exposure is also likely to involve amphibole and non-amphibole
types that are also non-asbestiform. These are released during the crushing and processing of the
ore.
Since the amount of exposure may vary by the definition of EMP, several definitions have been
considered in this report. The EMP definition most utilized by United States government
agencies is any mineral over 5 µm in length and 0.5 µm in diameter with a 3 to 1 aspect ratio or
greater. Because the predominant EMP exposure in this industry is less than 5 µm (Hwang et al.,
2013), we have attempted to assess exposure using other definitions including the Suzuki and
Chatfield cleavage fragment types, defined in the exposure assessment below (Suzuki et al.,
2005; Chatfield, 2009).

3
Methods
The protocol for this study was reviewed and approved annually by the Human Subjects
Committee of the University of Minnesota Institutional Review Board. All data in this study
were held under strict control for the protection of confidentiality and privacy.
Study Design
We conducted a nested case-control study of mesothelioma in a cohort of taconite iron mining
workers. The cohort was enumerated by the University of Minnesota in 1983 and included
68,737 individuals who ever worked in the iron ore mining industry sometime before 1983. This
study was called the Mineral Resources Health Assessment Program (MRHAP). In the present
effort, the previously-identified cohort was followed for vital status and causes of death were
obtained through 2007. Vital status was ascertained using the Social Security Administration,
the National Death Index, the Minnesota Department of Health, and death certificates obtained
from the state where death occurred. All deaths were coded to the International Classification of
Disease (ICD) codes in effect at the time of death. The cohort contained individuals from the
following mining companies: Eveleth Taconite Company, Hanna Mining Company, Inland Steel
Company, Jones and Laughlin, Pickands-Mather, which became Erie Mining Company (which
later became LTV Mining), Hibbing Taconite Company, Reserve Mining Company (which later
became Northshore Mining Company), and U.S. Steel Company.
Mesothelioma Case and Control Identification
All cases and controls were nested within the MRHAP cohort, and had to have evidence of
employment in the taconite mining industry. Mesothelioma cases were identified using two
sources, the Minnesota Cancer Surveillance System (MCSS) and death certificate records.
MCSS has pathologically confirmed cancer information dating back to 1988 for cancer cases
diagnosed within the state of Minnesota. Four controls were selected for each case using an
incidence density sampling approach. For each case, controls were selected from those cohort
members of similar age (years of birth +/- two years) who were alive and without a diagnosis of
mesothelioma on the date of diagnosis or death of the case. Five controls were eliminated from
the study due to lack of employment in mining, giving 315 controls, 80 cases and a total study
population of 395 miners.
Exposure Assessment
Years worked along with on-site and historical EMP measurements and work histories were used
to estimate cumulative EMP exposures. The initial step in the assessment of current exposures
was to identify the major job titles in connection with taconite ore mining and processing
(Hwang et al., 2013). From these job titles, a list was developed of 28 unique, similarly exposed
groups (SEGs), which occurred in all of the mines.
Personal and area exposures to EMPs were sampled on site in 2010 and 2011 by study
investigators and counted using the NIOSH 7400 (PCM) method. Two workers were sampled
per SEG in the eastern zone, while eight workers per SEG were sampled in the western zone to
account for the multiple mines in this zone. Three exposure measurements for each sampled
worker were obtained. On-site exposure monitoring was conducted within all six active mines
within zones 1 and 4 (Figure 1). Zones 2 and 3 had no active mines at the time of the exposure
monitoring for this investigation.

4
For personal monitoring, volunteers wore an air-sampling pump for six-hours during their work
shift. PCM was used for counting EMPs on all samples with 20% of the samples also analyzed
using NIOSH 7402 (TEM). This latter method can detect EMPs that are 0.25-0.5 µm in diameter
and may provide more accurate counting with small diameters that could be missed by PCM.
The NIOSH 7402 method included an expanded characterization of elemental composition with
energy dispersive x-ray analysis (EDXA) and crystalline structure by selected area electron
diffraction (SAED). In this way, EMPs that were amphiboles or chrysotile could be identified.
The estimates of percent amphibole EMPs obtained for a given SEG analyzed using NIOSH
7402 were then applied to the remaining samples in that SEG which were analyzed using only
the NIOSH 7400 method. The difference between these two measurements (i.e. between total
EMPs and amphibole EMPs) provided an estimate of non-amphibole EMPs that included
cleavage fragments.
Area air monitoring was conducted for each SEG using a cascade impactor (nano-MOUDI
Model 125R, MSP Corp., Shoreview, MN) that was capable of collecting size-fractionated
samples between 32 nm to greater than 5600 nm in aerodynamic diameter. EMPs had
dimensions measured with an indirect-transfer (ISO 13794) TEM method. Identification of
amphibole EMPs was accomplished using EDXA (Energy Dispersive X-ray Analysis) (Hwang
et al., 2014). Each MOUDI sample was obtained as a 4-hour time-weighted average. With the
use of these area samples and measurement techniques, EMPs could be counted by several
definitions, including the NIOSH definition (length > width by at least 3:1 and length > 5 µm;
the Suzuki definition (width < 0.25 µm, length < 5 µm; the Chatfield definition (width < 0.04
µm, aspect ratio > 20; the cleavage fragment definition (everything not categorized as Chatfield
EMPs with aspect ratio < 20). Regression estimates were made between the personal and area
counts based on the NIOSH definition and the alternate definitions. These regression
relationships derived from area measurements were then applied to the current and historical
personal measurements (NIOSH 7400) to obtain sets of personal exposures based on the
different definitions of interest. The personal exposures were then used to compute cumulative
exposures based on the definition of interest (Hwang et al., 2014).
Work History
The work records from MRHAP for all cases and controls were abstracted to record, in
increasing order of detail, the company, mine, department, and specific job titles with respective
start and stop dates through 1982, the last date that work history information from MRHAP was
available. Mining job titles varied across companies and time, and were standardized to the
greatest extent possible. Job title abbreviations were expanded and duplicate job titles removed.
Once job titles were standardized, mapping phrases for each job title were created and used to
assign jobs to similarly-exposed groups (SEGs). If information from the job title was not
sufficient to classify to a specific SEG, the job was assigned to an SEG using department
information. For some work records, the job titles were missing or were too vague to be
assigned to a specific SEG. Three additional SEGs (general mine, general plant or general shop)
were created for jobs that could be broadly classified at the departmental level. Job titles that
couldn’t be assigned to a general or specific SEG or were missing were assigned a mine-specific
“unknown” SEG.

5
A job-exposure matrix was created using the SEGs to estimate an EMP exposure value for each
individual and each EMP definition in the following way. Historical EMP measurements
(n=682) were extracted from databases maintained by the three active mining companies (six
sites), the Mine Safety and Health Administration and a previous exposure assessment done by
the University of Minnesota in the 1980s (Sheehy, 1986). These were combined with present-day
EMP concentrations (n=1298). Using the measured data and a time-varying regression model,
we reconstructed the exposure history for each SEG by mine for each year between 1955 and
2010. The reconstruction allowed for the assignment of exposures based on historical estimates
for which we had no direct measurement data. Each SEG had a daily exposure estimate, based
on a time weighted average (TWA) for an 8-hour day. The exposure values for department level
SEGs were based on the average of other SEGs in that department. Exposures for unknown
SEGs were an average of all SEGs in that mine for that year.
Each case and control’s work history was combined with the job-exposure matrix to generate
each individual’s cumulative EMP occupational exposure. Using the work history for each case
and control, a cumulative exposure value was calculated by the summation of the exposure value
for each SEG multiplied by the time spent working in that SEG to give the cumulative exposure
for a worker in EMP/cc/days. This value was divided by 365 to convert it to EMP/cc/years.
Exposure to commercial asbestos and dust from hematite operations may have also occurred
among workers as this material was used throughout the industry historically for construction
purposes. There were also some process specific jobs that may have used commercial asbestos
directly. Commercial asbestos could have included serpentine chrysotile, as well as amphiboles.
The potential for exposure to commercial asbestos was categorized as low, medium or high for
each specific SEG. Expert industrial hygienists reviewed all jobs in each SEG and scored each
SEG as having a high, medium or low probability of working with commercial asbestos and the
subsequent frequency of exposure. The classifications were also reviewed by industrial
hygienists in the taconite industry to validate jobs with potential commercial asbestos exposure.
A consensus was developed for each classification. The estimates of commercial asbestos
exposure for each individual were summarized as ever working in one of these jobs with high,
medium, or low exposure, and the cumulative time working at each level. Ever/never
classifications were also made for analytic purposes.
A portion of the taconite cohort worked in the earlier hematite industry. As hematite is a high-
grade iron ore, it does not require the extensive processing and concentrating techniques used in
taconite, and does not have the same exposures as the taconite industry. Hematite mining work
histories were distinguished from taconite. Historical data on mining operations and yearly
taconite production totals were used to determine a taconite start date for each company (1950s
and 1960s, depending on the company). Jobs held before the taconite start dates were assigned
to a specific hematite SEG.
Data Analysis
The cases and controls were compared by year of first employment, gender, type of ore mining,
zones of employment, and departments of employment. They were compared by employment
duration (years) across the Iron Range and by cumulative exposure, as EMP/cc/years, across the
range and by specific zone worked. Categories were formed based on whether miners had ever

6
worked in a geological zone, controlling for time worked in other zones. Since no on-site EMP
measurements were available for the mine in the intermediate mineralogical zone, and since this
zone is also known to contain amphibole EMPs, the eastern zone measures within SEGs were
used to estimate historical exposures in this zone.
Rate ratios and 95% confidence intervals were estimated using separate logistic regression
models to estimate the association between risk of mesothelioma and both duration of
employment in taconite operations and cumulative exposure to EMPs. The association between
mesothelioma and cumulative EMP/cc/years for each specific EMP definition categorized as
high, medium and low (using tertiles), and high and low (median split) was evaluated. Rate
ratios were also estimated for employment and EMP exposure by specific Iron Range
mineralogical zone to see if associations varied by zone. The estimates of exposure to
commercial asbestos were included in the models of cumulative EMP exposure and
mesothelioma to control for potential confounding. Length of time employed in hematite mining
was also included in all statistical models to account for any effects from this type of mining.
Models were estimated with no latency, where all obtained exposures were included, and with
20-year latency. In the latter instance, only exposures that occurred at least twenty years prior to
the date of case diagnosis or death were accounted for in the model (20-year lag). Although
smoking information was not available in this assessment, smoking has not been associated with
risk for mesothelioma.
Results
Exposure assessment
Results from the occupational exposure assessment for current levels have been published in
detail elsewhere (Hwang et al., 2013). Briefly, using the NIOSH 7400 counting method, the
exposure level for total EMPs was higher than the NIOSH Recommended Exposure Limit (REL)
in several SEGs for several mines. However, these measures do not reflect only regulated EMPs
as this method is unable to distinguish asbestiform and non-asbestiform EMPs. The
concentrations of amphibole EMPs were much lower than the concentrations of total EMPs,
indicating that amphibole EMPs is not a major component of total EMPs generated in taconite
operations. Amphibole EMP concentrations that were detected were almost exclusively limited
to the eastern Mesabi Range and, with a few exceptions, were lower than the NIOSH REL of 0.1
fibers/cm-3
by an order of magnitude.
Study population
Standardized mortality ratios (SMRs) are presented elsewhere (Allen et al., 2014). Records from
MCSS identified 63 mesothelioma cases and an additional 17 cases outside of Minnesota and not
captured by MCSS. A total of 80 cases and 315 controls were included in the analysis (Table 1).
All of the cases were male with females making up 5% of controls. The median year of birth for
both cases and controls was 1927. Cases and controls who ever worked in Zone 2 or Zone 4
were slightly younger than those who ever worked in Zone 1. Approximately one-third of cases
and one-fourth of controls worked in both taconite and hematite mining. A larger proportion of
cases worked exclusively in taconite, while a larger proportion of controls worked exclusively in
hematite. The largest percentage of cases occurred in workers who ever worked in Zone 2. The

7
departments in which the greatest number of both cases and controls worked at some point were
the mining and shop departments. Among those who worked in the taconite industry 22 percent
of cases and 11 percent of controls ever held a job with probable high commercial asbestos
exposure. The median years of employment in these high exposure jobs were 6.5 years for cases
and 1.4 years for controls.
The median length of employment in all iron ore mining and in taconite mining specifically was
longer for cases, while the median length of employment in hematite was longer for controls
(Table 2). Median length of taconite employment was greatest in Zone 1 for both cases and
controls. Within departments, median length of employment was greatest for cases in the mining
and shop departments versus the shop and office departments for controls.
Table 3 lists characteristics of cases and controls by exposure definition and by zone of the Iron
Range. More cases worked in zone 2 whereas the highest exposure estimates occurred in zone 4.
The rate of mesothelioma increased slightly for each additional year worked in taconite mining
(Table 4). The rate ratio of 1.03 represents, on average, a three percent increase in the risk of
mesothelioma for each additional year worked in the taconite industry. The risk of mesothelioma
was increased with duration of employment in both Zone 1 and Zone 2, but was not associated
with employment duration in Zone 4. The rate ratio estimates for taconite years were adjusted
for years in hematite mining. Models that incorporated a 20 year lagged exposure had similar
results as models without lagged exposure.
EMP exposures among cases and controls
Table 5 lists cumulative exposure estimates for cases and controls overall and by mineralogical
zone, using the NIOSH 7400 method. Cases had higher exposure estimates than controls in
western zones but not in the eastern zone. This pattern persisted for each EMP definition.
Higher exposure to EMPs, as defined by the NIOSH 7400 measurement method, was associated
with increased risk of mesothelioma. Each additional EMP/cc/year of exposure was associated
with an elevated but not statistically significant risk of mesothelioma (RR=1.10, 95% CI=0.97-
1.24) (Table 6). When the cumulative exposure was divided into high and low based on the
median cumulative exposures of the cases, the rate of mesothelioma was 1.93 times greater for
workers in the highest exposure category relative to those in the lowest (95% CI=1.00-3.72).
When the cumulative exposure was categorized as high, medium and low based on tertiles, the
rate ratio increased incrementally, although none were statistically significant. As with duration
of employment, the associations varied across zones in a parallel fashion. The effect estimates
for EMP/cc/year were adjusted for years in hematite mining and years of employment with high
probability of exposure to commercial asbestos. Using other classifications of commercial
asbestos exposure (ever/never) did not change the interpretation of the models, nor did use of the
20 year lagged exposure data.
Excluding the 17 female controls did not change the associations appreciably. For example,
removing the 17 female controls resulted in a rate ratio of 1.02 (95% CI=1.0-1.05) for each year
worked in the industry (vs. 1.03 with female controls in the analysis). Without female controls,
the rate ratio for cumulative exposure using EMP/cc/years was 1.07 (95% CI=0.97-1.17)
compared to 1.10 (95% CI=0.97-1.24) with them included.

8
Although the NIOSH 7400 measurement of EMPs (> 5 µm) is the measure used by United States
government agencies, in this setting it was not the most frequent EMP exposure type. The most
frequent EMP dimensions were between 1-3 µm in length and 0.2-0.5 µm in width (Figure 2).
We attempted to assess the risk with these smaller EMP exposures. The correlation coefficients
between the EMP definitions were distinctly high and ranged from 0.6-0.96. Using the Suzuki
EMP definition (<5 µm length; < 0.25 µm width), risk for mesothelioma was not elevated in the
analysis that included all zones (RR=0.99, 95% CI=0.98-1.0). Rate ratios by zone appeared to
be elevated in the west and intermediate geological areas (zones 1 and 2). The rate ratios for
cleavage fragment EMP exposure estimates paralleled the Suzuki findings without evidence of
increased risk in the overall analysis (RR=0.99, 95% CI=0.99-1.0) and with increased risk
estimates for zones 1 and 2 (RR=1.05, 95% CI=1.01-1.10 for zone 1; RR=1.10, 95% CI=1.04-
1.16 for zone 2) but not for zone 4 (RR=0.99, 95% CI=0.98-1.0). The rate ratios for the
Chatfield EMPs (long EMPs) paralleled the NIOSH definition with elevated rate ratios in the
overall analysis (RR=1.05, 95% CI=0.89-1.25) and in zones 1 and 2 (RR=1.73, 95% CI=1.06-
2.83 for zone 1; RR= 1.56, 95%CI=1.16-2.09 for zone 2) but not for zone 4 (RR=1.0, 95%
CI=0.95-1.05). Due to the high degree of correlation between these definitions, we were not able
to estimate the independent effects of each EMP type.
Discussion
In this analysis of workers employed in the taconite mining industry of Minnesota, an overall
association was observed between duration of employment in taconite mining operations and rate
of mesothelioma. There was also some evidence of an increased rate of mesothelioma with
increasing exposure to EMPs as identified by several measurement definitions. However, these
definitions were highly correlated and did not distinguish amphibole from non-amphibole or
asbestiform from non-asbestiform EMPs. The high correlation by EMP type limited the ability to
distinguish the individual effects of the different EMP definitions.
The results for employment duration showed an association corresponding to an average of a 3
percent increase in the risk of mesothelioma with each additional year of employment in taconite
operations. These excess cases are not exposure-specific. The overall rate of mesothelioma was
also associated with cumulative EMP (NIOSH 7400 definition) exposure. For each EMP/cc/year
of exposure the rate of mesothelioma increased approximately 10 percent. This measure of
cumulative exposure is based on time and intensity of exposure. One EMP/cc/year is equivalent,
for example, to one year working at an average of 1.0 EMP/cc or 10 years working at an average
0.1 EMP/cc. Workers above the median level of exposure had approximately twice the rate of
mesothelioma as those below the median level. This analysis lends support to the hypothesis that
workers who had higher cumulative exposure to EMPs had a higher rate of mesothelioma.
However, the absolute risk for mesothelioma in the cohort was small compared to other disease
frequencies. Because mesothelioma is a rare disease it is helpful to consider these results in the
context of lifetime risk of mesothelioma. An average person who lives to be 80 years old has on
average a 0.144 percent chance of developing mesothelioma in their lifetime, or about 1.4 cases
per 1,000 individuals. A taconite miner who worked for 30 years in the taconite industry has on
average a 0.333 percent chance of getting mesothelioma in their lifetime or about 3.33 cases per
1,000 taconite miners working for 30 years and living to be 80 years old.

9
When the NIOSH EMP definition was used in the zone-specific analyses, there was evidence of
increased risks within Zones 1 and 2, but not Zone 4. This pattern was not consistent with the
estimated levels of EMP exposures which were lowest in zone 1 than the other zones for both
cases and controls (Tables 5, 6). The incongruity of this finding could suggest the impact of
uncontrolled confounding factors and points to the need for further study of zone-specific results.
The overall rate with the other definitions was not elevated (RRSuzuki=0.99, 95%CI=0.98-1.00)
and (RRcleavage fragment=0.99, 95%CI=0.99-1.00).
Amphibole asbestiform EMP exposures are known causes of mesothelioma. Although amphibole
EMP exposures exist in the eastern Iron Range zone, these are believed to be predominantly of
the non-asbestiform variety (Gamble and Gibbs, 2008; Ross et al., 2008; Wilson et al., 2008), a
type that has not had clearly-established mesothelioma or lung cancer risk associated with
exposure in studies of Homestake gold miners and New York talc workers (Steenland and
Brown, 1995; Gamble, 1993 and 2008; Honda et al., 2002; Finkelstein, 2012; Nolan et al.,
2013).
Limitations
Similar to the circumstances involving other industries, the early study period (1950s and 1960s)
was a time when exposures were likely to have been the highest, as the facilities were new and
not as well equipped with dust control technologies, and where exposure measurements were less
frequently taken. This time was also in advance of the regulatory era in the United States and, as
a result, we have limited data to use in dose reconstructions for this period.
The cases in this study were identified from death certificates and via a state cancer registry.
Additional cases may have occurred outside of Minnesota prior to 1999, the year ICD-10 went
into effect, and which was the first edition to include a code for mesothelioma mortality. Cases
may also have occurred within Minnesota prior to 1988, the initial year for the state’s cancer
surveillance system. Since mesothelioma mortality codes first existed in ICD-10, death cases
identified prior to this time may have existed but lacked accompanying population estimates and
couldn’t be used to estimate observed and expected values. Use of additional algorithms to
enumerate possible cases was done and revealed one additional cancer of the pleura and 14
connective tissue cancers (Sullivan, 2007). There was potential for mesothelioma to exist within
these categories, but no further information was available on them and they were not used in any
of the analyses.
There have been two occupational cohorts in northeastern Minnesota with documented increases
in mesothelioma rates, the cohort of miners addressed in this study and the Conwed cohort with
asbestiform EMP exposures (MDH Report, 2007). Through the assistance of the Minnesota
Department of Health, we were able to identify whether workers in the mining cohort also
worked in that industry. No such cases were found.
While several factors could lead to the exposures being categorized higher or lower, the exposure
reconstruction was based on all available work history without regard to case or control status.
Due to important gaps in exposure measures, particularly during the early years of the industry,
there was a potential for exposure misclassification. In this study, since work histories were
abstracted without knowledge of case status, misclassification should be non-differential.

10
However, it is also possible that job information was collected in error systematically, creating
the potential for differential bias. In fact, we were not able to state which way this
misclassification occurred, if it was a factor.
The risk associated with non-asbestiform dust exposure is obviously dependent on adequate
control of asbestiform minerals. The facilities were constructed in the 1950s and 60s, a time
when commercial asbestos materials were not regulated and were regularly used in many
industrial applications. The analysis of EMP exposures controlled for potential commercial
asbestos exposure in the jobs held in the taconite industry, but the ability to do this was limited
by the absence of data on the amount of exposure and type of commercial asbestos used. We had
no evidence that our classification approach was flawed. Nevertheless, it is possible that
exposure to commercial asbestos remained as a residual confounding variable in this assessment.
Strengths
There are a number of strengths in this study. The exposure assessment, especially the current,
on-site component, was comprehensive. It was, in fact, the first to be incorporated into an
epidemiologic investigation within Minnesota’s taconite industry. On-site exposures were
obtained for all active mines utilizing both traditional phase contrast and electron microscopy.
The potential impact from non-taconite mining exposures (hematite) was controlled in the
analysis. Even though smoking information was not available for cases or controls, smoking has
not been demonstrated as a risk for mesothelioma. The study population was large which enabled
the examination of a rare disease like mesothelioma. Finally, the follow-up of the cohort and
ascertainment of vital status was thorough.
CONCLUSION
The results from this case-control study suggested an association between duration of
employment in the taconite industry and risk of mesothelioma. There was also an association
with mesothelioma and exposure to cumulative EMPs, as measured by the NIOSH 7400 method.
Due to high correlations between the different EMP definitions, the specific details of size and
type of EMP exposure (asbestiform, non-asbestiform) could not be further ascertained. The
effect of exposure to commercial asbestos could not be completely ruled out as a factor in this
finding.
Acknowledgements This study was funded by the State of Minnesota. The views expressed are the authors’ and do not reflect the State of Minnesota.
The authors would like to thank the following individuals who were instrumental in the conduct of this investigation: Leslie Studenski, Richard
Hoffbeck, Nancy Pengra, Diane Kampa, of the Taconite Workers Health Study Group and Drs. Alan Bender and Allan Williams from the Minnesota Department of Health. Finally, the authors would like to thank the mining companies who provided data on work histories and
exposure and made the conduct of this investigation feasible.

11
References
Agency for Toxic Substances and Disease Registry (ATSDR), 2001. Toxicological Profile for
Asbestos. ATSDR; Centers for Disease Control.
Allen EM, Alexander BH, MacLehose RF, Ramachandran G, Mandel JH. Mortality experience
among Minnesota taconite mining industry workers. Occup Environ Med, Occup Environ Med.
2014 May 9. doi: 10.1136/oemed-2013-102000. [Epub ahead of print] PMID:24816518
Chatfield EJ. A procedure for quantitative description of fibrosity
in amphibole minerals. Presentation delivered at the ASTM
Johnson Conference, Burlington, VT, 2008.
Cooper WC, Wong O, Graebner R. Mortality of workers in two Minnesota
taconite mining and milling operations. J Occup Med 1988, 30(6):506-511.
Cooper WC, Wong O, Trent LS, Harris F. An updated study of taconite
miners and millers exposed to silica and non-asbestiform amphiboles. J
Occup Med, 1992, 34(12):1173-1180.
Finkelstein MM. Malignant mesothelioma incidence among talc miners and millers in New York
State. AJIM 2012, 55(10):863-8. (doi: 10.1002/ajim.22063. Epub 2012 Apr 27.)
Gamble JF. A nested case control study of lung cancer among New York talc workers.
International Arch. Occup. Env Hlth 1993, 64:449-456.
Gamble JF, Gibbs GW. An evaluation of the risks of lung cancer and mesothelioma from
exposure to amphibole cleavage fragments. Regulatory Toxicology and Pharmacology2008, 52
(1 supp):154-186.
Gibbs GW, Berry G. Mesothelioma and asbestos. Regulatory Toxicology and Pharmacology
2008, 52 (1 supp):223-231.
Gunter ME, Belluso E, Mottana A. Amphiboles: environmental and health concerns. Reviews in
Mineralogy and Geochemistry 2007, 67:453-516.
Harper M, Lee EG, Slaven JE, Bartley DL. An inter-laboratory study to determine the
effectiveness of procedures for discriminating amphibole asbestos fibers from amphibole
cleavage fragments in fiber counting by phase-contrast microscopy. Ann Occup. Hygiene 2012,
56(6):645-659.
Higgins IT, Glassman JH, Oh MS, Cornell RG. Mortality of Reserve Mining Company
employees in relation to taconite dust exposure. Am J Epidemiol 1983, 118: 710-719.
Hinds WC. Aerosol Technology-Properties, Behavior and Measurement of Airborne Particles,
2nd
Edition (1999) John Wiley and Sons, Inc., New York, NY, p. 9.
12
Honda Y, Beall C, Delzell E, Oestenstad K, Brill I, Matthews R. Mortality among workers at a
talc mining and milling facility. Ann Occup Hyg 2002, 46:575-585.
Hwang J, Ramachandran G, Raynor PC, Alexander BH, Mandel JH. A comprehensive
assessment of exposures to elongate mineral particles (EMPs) in the taconite mining industry.
Ann Occup Hyg Published Online First: 22 June 2013. Doi:10.1093/annhyg/met026.
Hwang J, Ramachandran G, Raynor PC, Alexander BH, Mandel JH. The Relationship between Various Exposure Metrics for Elongate Mineral Particles (EMPs) in the Taconite Mining and Processing Industry. J Occup Environ Hyg. 2014 Feb 10. [Epub ahead of print].
International Agency for Research on Cancer (IARC), 1987. Overall Evaluation of
Carcinogenity: An Updating of IARC Monographs, Supplement 7. Lyon, France: World Health
Organization.
Institute of Medicine of the National Academies, 2006. Background information on asbestos. In:
Asbestos: Selected cancers committee on asbestos: Selected health effects 49-61.
Jirsa MA, Miller JD, Morey GB. Geology of the Biwabik Iron Formation and Duluth Complex.
Regul Toxicol Pharmacol 2008, 52:S5-S10.
Lippmann M. Effects of fiber characteristics on lung deposition, retention, and disease. Environ
Health Perspectives 1990; 88:311-317.
Minnesota Department of Health. Mesothelioma in Northeastern Minnesota and Two
Occupational Cohorts: 2007 Update. Available at:
http://www.health.state.mn.us/divs/hpcd/cdee/mcss/ documents/nemeso1207.pdf. Accessed July
10, 2013.
Mossman BT. Assessment of the pathogenic potential of asbestiform vs. nonasbestiform
particulates (cleavage fragments) in in vitro (cell or organ culture) models and bioassays.
Regulatory Toxicology and Pharmacology 2008, 52 (1 supp): 200-203.
NIOSH Current Bulletin No. 62. Asbestos Fibers and Other Elongate Mineral Particles: State of
the Science and Roadmap for Research (Revised Edition). Department of Health and Human
Services, Centers for Disease Control and Prevention, National Institute for Occupational Safety
and Health. April, 2011.
NIOSH. NIOSH Manual of Analytical Methods: Asbestos and Other Fibers by PCM 7400.
Avaliable at:http://www.cdc.gov/niosh/docs/2003-154/pdfs/7400.pdf. NOISH. NIOSH Manual of Analytical Methods: Asbestos by TEM 7402. Available at
http://www.cdc.gov/niosh/docs/2003-154/pdfs/7402.pdf.
Nolan RP, Gamble JF, Gibbs GW. Letter to the Editor on Commentary: Malignant

13
Mesothelioma Incidence Among Talc Miners and Millers in New York State by MM Finkelstein.
AJIM 2013 56:1116–1118.
Ross M, Nolan RP, Nord GL. The search for asbestos within the Peter Mitchell
taconite iron ore mine, near Babbitt, Minnesota. Regul Toxicol Pharmacol 2008,
52 (1 suppl):43-40.
Sheehy JW, McJilton CE. Development of a model to aid in reconstruction of
historical silica dust exposures in the taconite industry. Am Ind Hyg Assoc J,
1987 48: 914–918.
Steenland K, Brown D. Mortality study of gold miners exposed to silica and non-asbestiform
amphibole minerals: an update with 14 more years of follow-up. Am J Ind Med 1995, 27:217-
229.
Sullivan PA. Vermiculite, Respiratory Disease, and Asbestos Exposure in Libby, Montana:
Update of a Cohort Mortality Study. Environ Health perspect 2007, 115(4):579-585.
Suzuki Y, Yuen SR, Ashley R. Short, thin asbestos fibers contribute to the
development of human malignant mesothelioma: pathological evidence. Int J
Hyg Environ Health, 2005 208:201-210.
University of Minnesota Report to the Legislature, 2013. Available at:
http://www.taconiteworkers.umn.edu.
Wilson R, McConnell EE, Ross M, Axten CW, Nolan RP. Risk assessment due to environmental
exposures to fibrous particulates associated with taconite ore. Regulatory Toxicology and
Pharmacology 2008, 52 (1 supp): 232-245.

14
Table 1. Demographic and work history characteristics of mesothelioma cases and controls
Cases Controls
N Median N Median
Birth Year 80 1927 315 1927
First Year of employment
Overall 80 1953 315 1952
Ever worked Zone 1 45 1948 220 1950
Ever worked Zone 2 33 1957 64 1957
Ever worked Zone 4 12 1957 66 1956
N % N %
Gender
Female 0 0 17 5.4
Male 80 100 298 94.6
Type of Ore Mining
Hematite and Taconite 25 31.3 81 25.7
Hematite only 23 28.7 131 41.6
Taconite only 32 40.0 103 32.7
Taconite Mineralogical Zone
Ever worked Zone 1 18 22.5 74 23.5
Ever worked Zone 2 31 38.8 58 18.4
Ever worked Zone 4 12 15.0 66 21.0
Department –Ever worked
Mining 20 25.0 73 23.2
Crushing 6 7.5 37 11.7
Concentrating 12 15.0 35 11.1
Pelletizing 14 17.5 43 13.7
General Plant 0 0.0 7 2.2
Shop Mobile 33 41.3 82 26.0
Shop Stationary 9 11.3 35 11.1
General Shop 0 0 3 1.0
Office 4 5.0 20 6.3
Unknown/Missing 16 20.0 63 20.0
Hematite 48 60.0 212 67.3
Commercial Asbestos Exposure*
High exposure 13 22.8 35 11.1
Low/Moderate 44 77.2 149 80.9
*Commercial asbestos exposure estimated for SEGs in taconite processing only.

15
Table 2. Years of employment in all taconite mining operations, by zone, and in specific
departments in taconite production for mesothelioma cases and controls
Cases Controls
N Median Min Max N Median Min Max
Ore Type
All Mining 80 4.05 0.01 35.23 315 2.42 0.003 37.31
Hematite 48 0.69 0.01 27.69 212 1.29 0.003 29.74
Taconite 57 8.1 0.01 31.06 184 6.79 0.003 30.62
Geologic Zone
Zone 1 18 11.68 0.05 31.06 74 8.75 0.01 22.21
Zone 2 31 6.02 0.06 26.00 58 1.95 0.01 28.61
Zone 4 12 2.4 0.01 27.09 66 6.11 0.003 30.62
Department
Mining 20 4.53 0.07 22.36 73 1.12 0.01 24.58
Crushing 6 1.36 0.19 3.51 37 0.65 0.01 13.68
Concentrating 12 0.53 0.03 7.67 35 0.49 0.02 17.30
Pelletizing 14 0.49 0.01 12.24 43 0.44 0.003 14.50
General Plant 0 0 0 0 7 0.08 0.01 5.33
Shop Mobile 33 5.75 0.01 24.87 82 4.79 0.003 30.62
Shop Stationary 9 6.18 1.29 30.66 35 1.15 0.02 22.02
General Shop 0 0 0 0 3 0.41 0.08 2.93
Office 4 1.74 0.32 9.21 20 4.2 0.03 25.36
Unknown 16 1 0.01 11.31 63 1.74 0.01 19.77
Hematite 48 0.69 0.01 27.69 212 1.29 0.003 29.74

16
Table 3. Descriptive findings and cumulative EMP exposure estimates by definition for cases
and controls who worked in taconite
Cases (n=80) Controls (n=315)
Type of Ore Mining (%)
Hematite Only
Taconite & Hematite
Taconite Only
23 (28.7)
25 (31.3)
32 (40)
131 (41.6)
81 (25.7)
103 (32.7)
TACONITE WORKERS Cases (n=57) Controls (n=184)
Gender (%)
Female
Male
0 (0.0)
57(100.0)
9 (4.9)
175 (95.1)
Geologic Zone Ever Worked (%)
Zone 1
Zone 2
Zone 4
18 (31.6)
31 (54.4)
12 (21.1)
74 (40.2)
58 (31.5)
66 (35.9)
Mean years in SEGs with high
commercial asbestos score1 7.1 4.0
Mean Chatfield EMP/cc/years2
Overall
Zone 1
Zone 2
Zone 4
1.5
1.2
1.4
1.6
1.3
0.3
0.9
2.4
Mean Suzuki EMP/cc/years3
Overall
Zone 1
Zone 2
Zone 4
16.8
20.0
7.5
34.8
23.2
1.9
5.0
58.3
Mean Cleavage EMP/cc/years3
Overall
Zone 1
Zone 2
Zone 4
10.8
10.2
4.9
23.5
16.6
1.2
3.2
42.0 1 SEGs with a high commercial asbestos score are crusher maintenance, furnace operator,
electrician, carpenter, auto mechanic, pipefitter/plumber, and lubricate technician 2 Measured by NIOSH 7400 method
3 Converted to personal results from NIOSH 7400 using ISO 13794 method
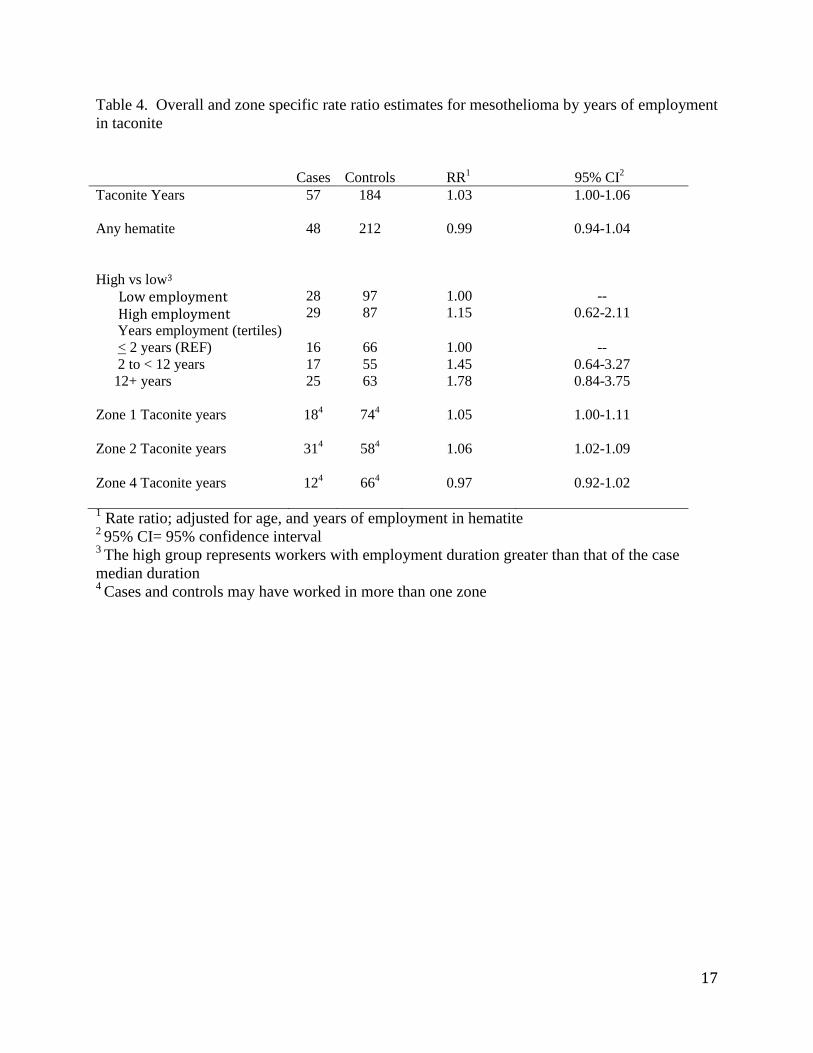
17
Table 4. Overall and zone specific rate ratio estimates for mesothelioma by years of employment
in taconite
Cases Controls RR
1 95% CI
2
Taconite Years 57 184 1.03 1.00-1.06
Any hematite
48 212 0.99 0.94-1.04
High vs low3
Low employment High employment
28
29
97
87
1.00
1.15
--
0.62-2.11
Years employment (tertiles)
< 2 years (REF)
2 to < 12 years
12+ years
16
17
25
66
55
63
1.00
1.45
1.78
--
0.64-3.27
0.84-3.75
Zone 1 Taconite years 184
744
1.05 1.00-1.11
Zone 2 Taconite years 314
584
1.06 1.02-1.09
Zone 4 Taconite years 124
664
0.97 0.92-1.02
1 Rate ratio; adjusted for age, and years of employment in hematite
2 95% CI= 95% confidence interval
3 The high group represents workers with employment duration greater than that of the case
median duration 4
Cases and controls may have worked in more than one zone

18
Table 5. Overall and zone specific cumulative exposure estimates (EMP/cc)-years for
mesothelioma cases and controls who ever worked in taconite operations1,2
1
Measured by NIOSH 7400 method 2
Cases and controls may have worked in more than one zone 3
Cumulative exposures for median and 75th
percentile expressed as EMP/cc-year
Cases Controls
N Median
3 75th
Percentile3 N Median
3 75th
Percentile3
Overall 57 1.15 2.95 184 0.24 2.63
Zone 1 18 0.22 0.73 74 0.12 0.18
Zone 2 31 1.88 2.95 58 0.58 2.61
Zone 4 12 1.10 3.23 66 2.09 5.97

19
Table 6. Rate Ratios for cumulative EMP exposure in taconite and mesothelioma
Exposure Cases Controls RR1 95% CI
EMP/cc/yr2
57
184 1.10 0.97-1.24
Low: <1.153
EMP/cc/yr
29 124 1.00 --
High: > 1.153
EMP/cc/yr
28 60 1.93 1.00-3.72
Tertiles2,4
0 to<0.25 (REF)
0.25 to <2.0
2.0+
16
19
22
77
57
50
1.00
1.66
1.84
--
0.75-3.68
0.80-4.23
EMP/cc/yr5
Zone 1
18 74 1.96 1.15-3.34
EMP/cc/yr5
Zone 2
31 58 1.31 1.12-1.54
EMP/cc/yr5
Zone 4
12 66 0.88 0.71-1.09
Hematite 48
212 0.99 0.94-1.04
1 Measured by NIOSH 7400 method (NIOSH EMP definition: > 5 µm length, aspect ratio > 3) 2 Results adjusted for age, employment in hematite, and potential for commercial asbestos exposure 3 Based on the upper and lower half of the case exposure distribution 4 Based on the lower, middle and upper one-third of the case exposure distribution 5 Results adjusted for age, employment in hematite, potential for commercial asbestos, and exposures in other zones. Cases and
controls may have worked in more than one zone.

20
Figure 1.

21
Figure 2. Occurrence of EMP dimensions for six SEGs within the taconite mining industry
Operating technician
Rail road
Concentrator maintenance
Pelletizing maintenance
Lab analyst Maintenance technician

22

1
Lung Cancer Risk among Minnesota Taconite Mining Workers
ABSTRACT
Objective: To examine the association between employment duration, elongate mineral particle (EMP)
exposure, and silica exposure and the risk of lung cancer in the taconite mining industry.
Methods: We conducted a nested case control study of lung cancer within a cohort of Minnesota
taconite iron mining workers employed by any of the mining companies in operation in 1983. Lung
cancer cases were identified by vital records and cancer registry data through 2010. Two age-matched
controls were selected from risk sets of cohort members alive and lung cancer free at the time of case
diagnosis. Calendar time-specific exposure estimates were made for every job and were used to
estimate workers’ cumulative exposures. Odds ratios (OR) and 95% confidence intervals (CI) were
estimated using conditional logistic regression. We evaluated lung cancer risk by total work duration
and by cumulative EMP and silica exposure modeled continuously and by quartile of the exposure
distribution.
Results: A total of 1,706 cases and 3,381 controls were included in the analysis. After adjusting for
work in hematite mining, asbestos exposure, and sex, the OR for total duration of employment was 1.00
(95% CI: 0.96-1.01). The ORs for total exposure were 0.94 (95% CI: 0.89-1.01) for EMPs and 1.22 (95%
CI: 0.81-1.83) for silica. The risk of lung cancer did not appear to change with increasing exposure when
examined by quartiles.
Conclusions: This study suggests that the estimated taconite mining exposures do not increase the risk
for the development of lung cancer.
Appendix 7

2
BACKGROUND
Taconite mining is an open pit, multi-stage process that involves blasting rock with explosives,
crushing it into small pieces, magnetically extracting iron, and reforming a more concentrated product
into high-grade iron ore pellets, the process of which can result in a dusty environment. The mining and
processing of taconite iron ore results in potential exposure to non-asbestiform amphibole and non-
amphibole elongate mineral particles (EMPs), respirable silica, and cleavage fragments.[Hwang et al.,
2013] The term ‘EMP’ refers to any mineral particle with a minimum aspect ratio of 3:1 that is of
inhalable size. Cleavage fragments are mineral EMPs created during the crushing and fracturing
process.[DHHS, 2011]
The Mesabi Iron Range, located in northeastern Minnesota, is a narrow belt approximately three
miles wide and 120 miles long, consisting of iron-rich sedimentary rocks. The mineralogy of the Mesabi
Iron Range changes from east to west and is broken into four distinct mineralogical zones.[McSwiggin et
al., 2008] All zones have deposits of taconite along with quartz and iron silicates, but vary in the type of
EMP.[Jirsa et al., 2008] The eastern part of the range, known as zone 4, contains iron-rich amphibole
EMPs, believed to be less than 1% fibrous [Wilson et al., 2008]. The western part of the range, known as
zone 1, includes approximately two-thirds of the entire Mesabi Iron Range and contains almost
exclusively non-asbestiform EMPs. Zone 2 is considered a transitional zone and contains some
amphiboles. There are no mines located in zone 3. The primary exposure in taconite operations is non-
asbestiform cleavage fragments however, due to the mineralogical differences in the zones, workers in
each zone may be exposed to different types of mineral particles.
The causal relationship between exposure to asbestiform EMPs minerals and lung cancer is well
documented.[DHHS, 2011; McDonald & McDonald, 1996; Robinson et al., 2005; Robinson, 2012]
However, evidence from epidemiological studies of workers exposed to non-asbestiform EMPs is
inconclusive. Since 1990, non-asbestiform EMPs have been included within the NIOSH recommended
3
exposure limits of asbestiform EMPs due to the inconclusive findings of epidemiological studies.[DHHS,
2011] These include studies of talc miners in upstate New York[Honda et al. 2002; Finkelstein, 2012;
Nolan et al., 2013), and gold miners in South Dakota.[Gillam et al, 1976; McDonald et al., 1978;
Steenland & Brown, 1995]
Historically, the association between silica and lung cancer has been debated but recent
occupational studies have provided evidence supporting the risk of lung cancer after silica exposure
(DHHS, 2011-120). In 1996, the International Agency for Research on Cancer concluded that respirable
silica was carcinogenic in occupational settings despite the lack of good-quality datasets available to
quantitatively evaluate the relationship.[IARC, 2012]
Health risks associated with taconite mining have been a concern to the public for several
decades, but few studies have evaluated the health of miners in Minnesota. In 1983, a mortality
analysis of 5,751 miners showed no increase in risk of respiratory cancer.[Higgins et al., 1983] A similar
mortality analysis of 3,431 workers published in 1988 and 1992, likewise did not report an excess of
mortality for any cause of death.[Cooper et al., 1988; Cooper et al., 1992] These early studies had small
study populations, focused on single mining companies, and had relatively short follow-up periods with
limited power. However, a recent comprehensive mortality analysis found elevated lung cancer
mortality among taconite mining workers.[Allen et al. 2014] No mortality study to date has evaluated
the association between quantitative exposure level and cancer risk.
The purpose of this study is to address uncertainties regarding the health consequences of
taconite mining by examining the association between employment duration, EMP exposure, and silica
exposure in the taconite mining industry with the risk of lung cancer. This study also provides a unique
opportunity to examine some of the key questions surrounding risk associated with exposure to non-
asbestiform EMP exposure.
METHODS

4
Study population and follow-up
We conducted a nested case-control study of lung cancer within a cohort of Minnesota taconite
iron mining workers as part of the Taconite Workers Health Study conducted by the University of
Minnesota.[www.taconiteworkers.umn.edu] The original cohort was enumerated in 1983 by the
University of Minnesota and included 68,737 individuals with any employment in the mining industry.
The earliest records were found to have sparse work history information, unreliable data for vital
records linkages and early workers would have spent a majority of their working life in hematite mining.
In order to restrict the cohort to those thought to have the most complete records and focus on
employment in taconite, the study cohort was limited to those born in 1920 or later leaving 46,170
individuals.
Lung cancer cases were identified by mortality records and cancer registry data through 2010.
The vital status and causes of death of cohort members were ascertained through several sources
including the Social Security Administration, the National Death Index (NDI), Minnesota Department of
Health, and other state health departments. The Minnesota Department of Health provided causes of
death for those who died within the state. For those who died outside of Minnesota in 1979 or later,
causes of death were obtained from NDI Plus. For those who died prior to the establishment of NDI Plus
in 1979, death certificates were obtained from state health departments. Underlying causes of death
were coded to the International Classification of Disease (ICD) version in place at the year of death. The
ICD codes were obtained directly from the Minnesota Department of Health and the NDI. All other
death certificates were reviewed and coded by a nosologist.
To identify incident cancers, the cohort was linked to the Minnesota Cancer Surveillance System
(MCSS). The MCSS, established in 1988 by state statute, is Minnesota’s statewide, population-based
cancer registry that collects histological information of newly diagnosed cancers on all Minnesota

5
residents. Incident cancers including date of diagnosis, cancer site and histology were obtained for
cohort members matched to the MCSS.
Selection of cases and controls
In this nested case-control study, all lung cancer cases identified via death record or MCSS were
included. Two controls for each case were selected using an incidence density sampling protocol.
Eligible controls were selected from risk-sets for each case by age (year of birth +/- five years) and were
alive without a lung cancer diagnosis on the date of death or date of diagnosis of their index case.
Exposure assessment
A job-exposure matrix was developed using work history records and quantitative, time-specific
exposure estimates for each job and department (specific job groupings) to generate a cumulative
exposure for each worker. Exposures for controls were truncated at the date of diagnosis or death of
the matched case. Details of the exposure assessment and historical reconstruction are provided
elsewhere[Hwang at al., 2013] and summarized below.
Mining industry jobs were condensed into 28 similarly exposed groups (SEGs) based on job title,
task, location, and procedure. The SEGs were used to systematically capture work history records and
link estimates of exposure to EMPs and respirable silica for the exposure data matrix. Quantitative
exposure estimates were derived from an exposure reconstruction that incorporated data from a
comprehensive exposure assessment conducted as part of the Taconite Workers Health Study and from
historical industrial hygiene monitoring data collected by Mine Safety and Health Administration (MSHA)
and the mining companies.[Hwang at al., 2013]
For the Taconite Workers Health Study exposure assessment, personal exposure measures were
collected for all SEGs in all operating mines in the Mesabi Iron Range between January 2010 and May
2011. Several workers per SEG were selected for sampling and each participant wore a personal air-
sampling pump for approximately six hours of a work shift on three separate occasions. The filter

6
samples were analyzed for EMPs by phase contrast microscopy which identifies all EMPs longer than 5
µm, with a diameter of 0.25 µm and with an aspect ratio ≥ 3. Respirable silica was analyzed using NIOSH
7500 Crystalline silica X-ray diffraction. The results from the samples were used to calculate a single
average concentration for the shift for each participant.
Historical exposures data were obtained from the Mine Data Retrieval System maintained by
MSHA and the internal databases of two currently operating taconite mining companies. Available
personal exposure data were used to create the historical reconstruction. Historical and current EMP
and respirable silica data were combined into a master database to estimate an SEG specific exposure.
Annual average exposures were estimated for each combinations of SEG, year, and mine using a time-
varying linear regression model. The final exposure matrix included seven mines, 28 SEGs, and 56 years
between 1955 and 2010. Five of the mines are located in zone 1, one mine is located in zone 4, and one
mine that is no longer in operation is located in zone 2.
Company work records were abstracted to collect job title, mine, and dates of employment. Job
titles were standardized and mapped into one of the original 28 SEGs. Additional SEGs were created at
the department level for jobs that had insufficient description to classify into a specific SEG. Jobs with
no specific information about where or what the individual did was classified into a missing/unknown
SEG. Exposure levels for department level SEGs were based on the average of other SEGs in that
department. Exposures for the missing/unknown SEG were an average of all SEGs within that mine.
Employment history was combined with the exposure matrix to estimate a cumulative exposure for
each worker. Each SEG had an EMP and silica concentration that differed by company and year. This
concentration was multiplied by the length of time spent working in the SEG and then summed to give a
cumulative EMP exposure for each workers measured in EMP/cc/years and a cumulative silica exposure
measured in mg/m3/years.

7
Many of the workers had employment history in the mining industry before taconite mining
began in the 1950s and 60s. The transition from hematite to taconite mining occurred at different times
for different companies. Historical data on mining operations and yearly taconite production totals was
used to determine the year in which taconite mining began for each company. Any jobs held prior to
that year were assigned to a hematite SEG for which EMP and silica exposure estimates were not
available.
It is possible that commercial asbestos was used throughout the mines for maintenance and
building and was a potential additional exposure to some of the workers. Each SEG was evaluated to
determine whether it involved potential exposure to commercial asbestos. A high or low commercial
asbestos score was assigned based on the likelihood and frequency of exposure for that SEG. These
scores were reviewed by industrial hygiene experts within the taconite industry. Time spent in an SEG
with a high probability of exposure to commercial asbestos was used as a covariate in the statistical
models (below).
Data analysis
Conditional logistic regression was used to estimate the odds ratios (OR) and 95% confidence
intervals (CI) for the association between taconite mining exposures and the development of lung
cancer. Because of the risk set sampling design, ORs from the logistic models are estimates of hazard
ratios. In the final models, ORs were adjusted for sex, hematite mining exposure (measured in years),
and number of years spent in SEGs believed to have the potential for high commercial asbestos.
Taconite mining exposure was characterized in three ways using separate regression models for each:
employment duration, cumulative EMP and cumulative silica exposure. Employment duration and EMP
exposure were examined in an overall and zone specific analysis divided into years worked or EMP
exposure in each zone of the iron range (zone 1, 2, or 4). Both EMPs and silica distributions were
incorporated into models by quartile and by continuous exposure. Analyses were repeated restricting

8
the cases to those only identified by death certificate, eliminating those only identified through MCSS
and thus living in Minnesota at the time of diagnosis.
The histological subtype of lung cancer was available for the cases identified by MCSS. Separate
analyses were done for each of five major histological subtypes: squamous cell, adenocarcinoma, small
cell, non-specified, and other/rare carcinomas.
All statistical analyses were conducted using SAS 9.2.
RESULTS
Follow-up of the 46,170 workers identified 1,725 cases corresponding to 3,450 controls. After
work history abstraction, 3 cases along with their 6 corresponding controls, and 4 additional controls
were excluded due to poor data quality, e.g. conflicting dates of birth in different records. Another 16
cases and their 32 corresponding controls along with an additional 27 controls were excluded because
the only record on file was an application of employment with no evidence of actual employment in the
taconite mining industry. The final analysis included 1,706 lung cancer cases and 3,381 controls. Of the
1,706 cases, 309 were identified only through MCSS, 723 were identified only through death certificates,
and 674 cases were identified by both MCSS and death certificates.
The general characteristics of the study population are presented in Table 1. The study
population was mostly male (96% of cases and 94% of controls). The mean duration of employment in
taconite mining of the cases and controls was 7.7 and 8.5 years respectively. The total cumulative
exposure of EMPs and silica was higher in the controls than in the cases (1.7 EMP/cc/years and 0.31
mg/m3/years for controls and 1.5 EMP/cc/years and 0.28 mg/m3/years for cases). Total employment
duration and cumulative EMP exposure was greatest in zone 4 for both cases and controls. The mobile
shop department had the greatest employment duration for both cases and controls followed by the
mining department.
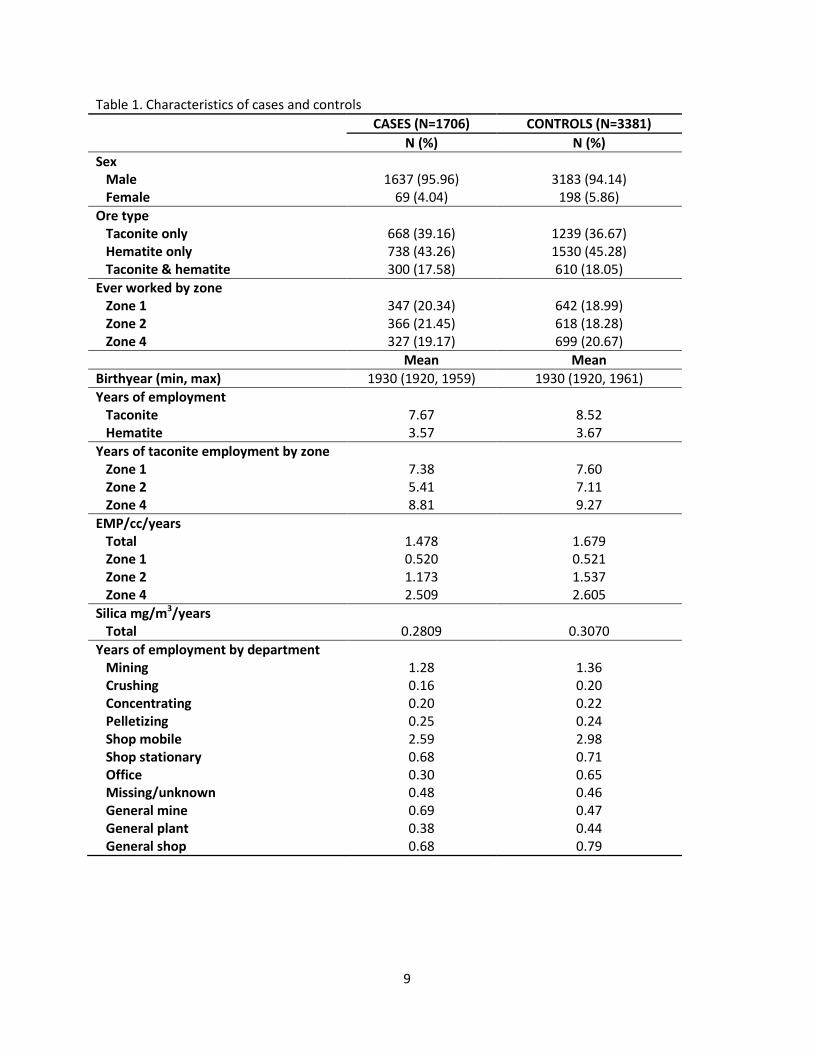
9
Table 1. Characteristics of cases and controls
CASES (N=1706) CONTROLS (N=3381)
N (%) N (%)
Sex Male 1637 (95.96) 3183 (94.14) Female 69 (4.04) 198 (5.86)
Ore type Taconite only 668 (39.16) 1239 (36.67) Hematite only 738 (43.26) 1530 (45.28) Taconite & hematite 300 (17.58) 610 (18.05)
Ever worked by zone Zone 1 347 (20.34) 642 (18.99) Zone 2 366 (21.45) 618 (18.28) Zone 4 327 (19.17) 699 (20.67)
Mean Mean
Birthyear (min, max) 1930 (1920, 1959) 1930 (1920, 1961)
Years of employment Taconite 7.67 8.52 Hematite 3.57 3.67
Years of taconite employment by zone Zone 1 7.38 7.60 Zone 2 5.41 7.11 Zone 4 8.81 9.27
EMP/cc/years Total 1.478 1.679 Zone 1 0.520 0.521 Zone 2 1.173 1.537 Zone 4 2.509 2.605
Silica mg/m3/years Total 0.2809 0.3070
Years of employment by department Mining 1.28 1.36 Crushing 0.16 0.20 Concentrating 0.20 0.22 Pelletizing 0.25 0.24 Shop mobile 2.59 2.98 Shop stationary 0.68 0.71 Office 0.30 0.65 Missing/unknown 0.48 0.46 General mine 0.69 0.47 General plant 0.38 0.44 General shop 0.68 0.79

10
Total duration of employment in taconite mining did not appear to increase the risk of lung
cancer (OR = 0.99, 95% CI: 0.96-1.01). The ORs for total exposure were 0.95 (95% CI: 0.89-1.01) for
EMPs and 1.22 (95% CI: 0.81-1.83) for silica. A decrease in ORs with increasing exposure was observed
across quartiles for EMP and silica exposure however, none of the quartiles exhibited a significant
increase in risk. As compared to quartile 1 exposure levels, those with no taconite exposure showed a
decrease in risk of lung cancer (EMP OR = 0.81, 95% CI: 0.67-0.98; silica OR = 0.81, 95% CI: 0.68-0.98).
Odds ratios and 95% CIs for the analysis by employment duration, total exposure, and exposure
quartiles can be found in table 2. The risk of lung cancer did not appear to change in any particular zone
of the iron range by employment duration or cumulative EMP exposure. Results of the analysis by zone
can be found in table 3. When we restricted the study population to the 1,397 cases identified through
death certificates and their corresponding controls, the results did not change substantially.

11
Table 2. Risk of lung cancer by employment duration, cumulative EMP, and cumulative silica exposure
OR 95% CI
Years of employment
Total Taconite yearsa 0.99 0.96-1.01 Hematite yearsb 0.99 0.98-1.01 By Departmentc Mining 0.99 0.97-1.01 Crushing 0.96 0.88-1.05 Concentrating 0.99 0.93-1.06 Pelletizing 1.02 0.97-1.07 Shop Mobile 0.99 0.98-1.01 Shop Stationary 1.01 0.98-1.05 Office 0.95 0.92-0.99
EMP exposure
Total EMP/cc/yearsa 0.95 0.89-1.01 By quartilese Q1 1 Q2 1.00 0.79-1.25 Q3 0.98 0.77-1.24 Q4 0.82 0.57-1.19 Unexposedf 0.81 0.67-0.98
Silica exposure
Total Silica mg/m3/yearsd 1.22 0.81-1.83 By quartilesg Q1 1 Q2 1.04 0.84-1.29 Q3 0.95 0.74-1.22 Q4 0.97 0.70-1.35 Unexposedf 0.81 0.68-0.98
a Adjusted for hematite exposure, silica exposure, asbestos exposure, and sex b Adjusted for taconite exposure, silica exposure, asbestos exposure, and sex c Adjusted for years in unknown SEGs, hematite, general mine, general plant, general shop, sex, and asbestos d Adjusted for taconite exposure, hematite exposure, asbestos exposure, and sex e Lower cut point for Q1-4 = 0, 0.1298, 0.4527, and 2.353 EMP/cc/years f Worked only in hematite production and did not have taconite exposure g Lower cut point for Q1-4 = 0, 0.0373, 0.2064, 0.5189 mg/m3/years

12
Table 3. Risk of lung cancer by employment duration and cumulative EMP exposure in each zone of the iron range
OR 95% CI
Taconite years by zonea Zone 1 1.01 0.97-1.04 Zone 2 0.99 0.96-1.02 Zone 4 0.99 0.96-1.01 EMP/cc/years by zonea Zone 1 1.00 0.87-1.16 Zone 2 0.94 0.85-1.02 Zone 4 0.95 0.89-1.01
a adjusted for hematite exposure, silica exposure, asbestos exposure, exposure in other zones, and sex
A total of 973 lung cancer cases were identified by MCSS and were included in the sub analysis
by histological subtype. No significant association was found with EMP or silica quartiles for squamous
cell, adenocarcinoma, small cell, non-specified, or other carcinomas of the lung. ORs were greatest for
squamous cell and non-specified carcinoma; however, none of these effects were statistically significant
and most were imprecise. Results of the analysis by histological subtype can be found in table 4.

13
Table 4. Risk of major histological subtypes of lung cancer by cumulative EMP and silica exposure
Odds Ratios (95% CIs)
Squamous N=258
Adeno N=313
Small cell N=139
Non-specified N=202
Other N=61
EMP/cc/years (quartiles)
a
Unexposedc 0.65 (0.40-1.06) 0.78 (0.50-1.22) 0.77 (0.37-1.60) 0.93 (0.53-1.64) 0.89 (0.33-2.43)
Q1 1 1 1 1 1
Q2 1.03 (0.58-1.82) 0.92 (0.55-1.53) 0.99 (0.46-2.14) 0.96 (0.49-1.90) 0.47 (0.13-1.67)
Q3 1.20 (0.66-2.20) 0.79 (0.46-1.36) 0.93 (0.41-2.06) 0.91 (0.47-1.74) 1.01 (0.33-3.07)
Q4 1.04 (0.42-2.58) 0.54 (0.23-1.30) 1.07 (0.31-3.70) 1.44 (0.56-3.72) 0.11 (0.01-1.04)
Silica
mg/m3/years (quartiles)
b
Unexposedc 0.67 (0.41-1.08) 0.78 (0.51-1.19) 0.64 (0.30-1.34) 1.06 (0.59-1.91) 1.24 (0.44-3.49)
Q1 1 1 1 1 1
Q2 1.11 (0.64-1.95) 0.92 (0.57-1.48) 0.76 (0.36-1.60) 1.15 (0.62-2.16) 2.10 (0.73-6.05)
Q3 1.25 (0.71-2.18) 0.96 (0.59-1.56) 0.71 (0.32-1.57) 1.57 (0.79-3.10) 0.99 (0.22-4.47)
Q4 1.28 (0.73-2.24) 0.96 (0.58-1.59) 0.98 (0.43-2.25) 1.72 (0.88-3.36) 1.90 (0.62-5.83)
a Adjusted for hematite exposure, silica exposure, asbestos exposure, and sex b Adjusted for hematite exposure, EMP exposure, asbestos exposure, and sex c Worked only in hematite production and did not have taconite exposure
DISCUSSION
We found little evidence of increased risk of lung cancer associated with duration of
employment, cumulative exposure to EMPs or cumulative exposure to silica. Due to geological
differences in the rock between zones of the iron range, a zone specific analysis was conducted to
evaluate whether or not risk of lung cancer differed by the unique exposure potential in each zone. The
zone specific analysis did not show substantial differences in risk for each zone, nor did the risk of lung
cancer increase with exposure in any particular zone of the iron range when examined by employment
duration, cumulative EMP or cumulative silica exposures. Adenocarcinoma has been shown to be the
most common histological subtype of lung cancer in asbestos-exposed individuals, although all types

14
have occurred.[Raffn et al., 1993; de Klerk et al., 1996] This would suggest that if non-asbestiform EMPs
did have a carcinogenic affect, it might also vary by histological subtype. In this analysis, histological
subtype did not show any increase in risk for any of the five major subtypes. This was true for both EMP
and silica exposure quartiles.
Previous analyses from the Taconite Workers Health Study showed an excess in mortality[Allen
et al., 2014] and cancer incidence in this taconite workers cohort. Specifically, standardized mortality
ratios and standardized incidence ratios were estimated comparing the all cause and cause specific
mortality and cancer rates in the overall cohort to the Minnesota population. Mortality was elevated for
mesothelioma (SMR = 2.8, 95% CI: 1.9-4.0) and lung cancer (SMR = 1.2, 95% CI: 1.1-1.2). Cancer
incidence was elevated for mesothelioma (SIR = 2.4, 95% CI: 1.8-3.2) and lung cancer (SIR = 1.3, 95% CI:
1.2-1.4). Results from the current analysis suggest that the increase in risk for mortality and incidence of
lung cancer in this study population is not associated with the exposures that were estimated in this
study, rather could be due to non-occupational exposures.
Lung cancer can have a relatively long latency period before diagnosis. Given that the work
history records were collected in 1983 and follow-up continued through 2010, much of the study
population (those diagnosed after 1993) had at least a 10 year lag built into the data analysis. However,
28% of the cases were diagnosed before 1993. The analyses were repeated using both a 10 and 20 year
lag but the study results and interpretations did not change substantially. Analyses were also repeated
restricting the cases to those only identified by death certificate. Cases identified through MCSS had to
be living in Minnesota at the time of diagnosis but it was not feasible to determine if controls were living
in Minnesota. This restricted analysis provided a potentially better comparison between cases and
controls due to similar follow-up potential. However, the study results did not change substantially with
this restricted analysis which included 1,397 cases identified through death certificates and their
corresponding controls.
15
Various types of asbestiform EMPs can differ chemically, but structurally they are all similar in
that they are highly fibrous silicate minerals that are crystallized in an asbestiform habit, causing them
to separate into long, thin, strong, flexible fibers.[Mossman, 2008; Gamble & Gibbs, 2008] Asbestiform
EMPs tend to have very large aspect ratios, generally >20:1 for fibers > 5µm in length.[Mossman, 2008]
In contrast, non-asbestiform EMPs have aspect ratios >3:1 and have widths much larger than
asbestiform fibers of the same length. Common non-asbestiform analogs of asbestiform EMPs may
share the same chemical composition but they do not share the same crystal structure. Cleavage
fragments, or fragments of EMPs that have broken along a cleavage plane, lack the tensile strength and
flexibility of asbestos. [Mossman, 2008] The health consequences of exposure to cleavage fragments
has not been comprehensively studied.[Gamble & Gibbs, 2008]
The strong association between asbestiform EMP exposure and lung cancer is well
documented[DHHS, 2011; McDonald & McDonald, 1996; Robinson et al., 2005; Robinson, 2012]
however, the toxicity of non-asbestiform EMPs is less studied. In vitro assessments have suggested that
non-asbestiform EMPs and cleavage fragments are less potent than asbestiform EMPs,[Mossman, 2008]
but epidemiology studies have been inconclusive. NIOSH has specifically identified non-asbestiform
EMPs as a needed area of research.[DHHS, 2011] Non-asbestiform EMPs are included in NIOSH
recommended exposure limits due to technical limitations of routine exposure assessments and
uncertainty about the potential toxicity of non-asbestiform EMPs. Research focused on exposure to
non-asbestiform EMPs has consisted largely of mortality studies within a few mining industries.
Previous studies of New York talc miners[Honda et al., 2002] and South Dakota gold miners[Gillam et al.,
1976; McDonald et al., 1978; Steenland & Brown, 1995] have shown inconclusive evidence of an
association between non-asbestiform EMPs and malignant lung disease. Results from some animal
studies have suggested that fiber dimension, and not composition, is the major determinant of
carcinogenicity for mineral fibers.[DHHS, 2011] There remains a need to determine whether non-

16
asbestiform EMPs in different physical forms are also capable of causing disease.[DHHS, 2011] These
mineral particles are present in taconite mining and processing operations, the predominant exposure
being non-asbestiform cleavage fragments, making Minnesota taconite miners an important population
for research. This study provides evidence to suggest that exposure to non-asbestiform EMPs is not a
major risk factor for the development of lung cancer.
Some limitations should be considered when interpreting the results of this analysis. Exposure
misclassification is a likely occurrence in this study. Despite an extensive effort to identify all available
exposure data, measurements were sparse for some time periods and some SEGs. The exposure
reconstruction relied on imputation and regression modeling to estimate historical exposure levels. The
results of the current analysis are dependent on the assumptions of our exposure reconstruction, such
as a linear trend in historical exposure levels. However, employment duration data, which are less likely
to be biased, may serve as a suitable proxy for EMP and silica exposures, provided that there were no
major changes in exposure potential over time. Results of employment duration analyses were similar
to those for EMP and silica.
Incorrect assignment of SEGs based on work records is another potential area for exposure
misclassification. Details in individual work records varied greatly including level of detail in job titles
and dates of employment. Though standardization of job titles was done to the greatest extent
possible, in many cases there was not enough information in the work record to assign specific SEGs. In
these cases general SEGs that averaged exposures across mines were used. Quality of work records
varied by mine, therefore SEG misclassification may have occurred in specific mines. This could have
masked any significant finding by zone.
Smoking is the major risk factor for lung cancer. However, to be a confounder for an internal
exposure response analysis, smoking must be differentially distributed by level of exposure. Though we
did not have smoking information for the study population there were data available on the smoking

17
habits from a survey of 1,186 current and former taconite workers conducted in 2010 as part of the
Taconite Workers Health Study. Roughly 75% of these individuals were in the cohort from which the
cases and controls were identified. We used these data to estimate the association between smoking
and EMP exposure as a means to assess the potential for confounding due to smoking. The SEG based
exposure algorithms were applied to the reported work histories from the 2010 survey study and
cumulative exposure was compared by smoking status (ever/never). Among the workers who
participated in the 2010 survey, the ‘ever’ smokers had higher mean cumulative exposure than the
‘never’ smokers (3.3 vs 2.5 EMP/cc/years and 0.5 vs 0.4 silica mg/m3/years). Working under the
assumption that the survey participants represent the study population, this would suggest it is unlikely
that differential smoking habits in the study population explains a lack of association between the
exposures and lung cancer. In fact, the direction of potential confounding would be to overestimate the
effect of taconite work exposures and lung cancer.[VanderWeele et al., 2008]
There are notable limitations to using the survey population to examine EMP exposure by
smoking. The survey participants had greater cumulative exposure levels than the study population,
they had to be alive in 2010, and they were subject to selection bias as we relied on volunteers for
participation. Despite these limitations, the survey participants are the only comparison group available
for identifying smoking variation among exposure levels.
Exposure to commercial asbestos is another known cause of lung cancer and was used regularly
in the early and mid-part of the century. It is likely that commercial asbestos was used in the building
and maintenance of taconite plants however there is limited information on its use and no quantitative
data on asbestos type or exposure level. This analysis accounted for commercial asbestos by relying on
industrial hygiene experts to identify the probability of exposure in each SEG and final models included
years of work in an SEG with a high probability of asbestos exposure. Without a quantitative measure of
commercial asbestos exposure, our estimate has potential for misclassification. For asbestos exposure

18
to have confounded an association between taconite mining exposures and lung cancer, the lower
exposure workers would have to have had high levels of asbestos exposure. However, asbestos
probability was assigned based on job descriptions, not exposure assessment. It is unlikely that
systematic misclassification occurred for only lower or higher exposed workers.
This study has notable strengths. The large study population provided enough statistical power
to examine the exposure disease relationship in various ways. The 2010 exposure assessment was the
most comprehensive assessment in the taconite mining industry. All mines in operation, departments,
and SEGs were represented in the assessment and direct measurements of EMPs were used for a
portion of the exposure assessment. The cohort from which the cases were identified was thorough and
included all taconite miners ever employed by seven mining companies up to 1983. Use of both
mortality records and Minnesota cancer surveillance allowed us to capture a near complete set of lung
cancer cases in the cohort. Work history information came directly from mining company records and
did not rely upon individual workers, eliminating the possibility of recall bias. The case-control design
allowed for comprehensive examination of lung cancer risk that has not been possible in previous
mortality studies of workers exposure to non-asbestiform EMPs.
CONCLUSIONS
This study provides evidence to suggest that exposure to non-asbestiform EMPs and to silica are
not major risk factors for development of lung cancer in this population of miners.

19
References
1. Allen EM, Alexander BH, MacLehose RF, Ramachandran G, Mandel JH. Mortality Experience
among Minnesota Taconite Mining Industry Workers. Occup Environ Med, accepted for
publication April 2014, awaiting citation.
2. Cooper WC, Wong O, Graebner R. Mortality of workers in two Minnesota taconite mining and
milling operations. J Occup Med 1988;30(6):506-511.
3. Cooper WC, Wong O, Trent LS, et al. An updated study of taconite miners and millers exposed to
silica and non-asbestiform amphiboles. J Occup Med 1992;34(12):1173-1180.
4. de Klerk, NH, Musk AW, Eccles J et al. Exposure to crocidolite and the incidence of different
histological types of lung cancer. Occup Environ Med 1996;53:157-159.
5. Department of Health and Human Services, National Institute for Occupational Safety and
Health. Asbestos fibers and other elongate mineral particles: State of the science and roadmap
for research, 2011: Publication No. 2011-159.
6. Department of Health and Human Services, National Institute for Occupational Safety and
Health. Silica, lung cancer, and respiratory disease quantitative risk. A project from the first 10
years of NORA: High Impact, Publication No. 2011-120.
7. Finkelstein MM. Malignant Mesothelioma Incidence Among Talc Miners and Millers in New York
State. Am J Ind Med 2012;868(April):863–868.
8. Gamble JF, Gibbs GW. Evaluation of the risks of lung cancer and mesothelioma from exposure
to amphibole cleavage fragments. Regul Toxicol Pharmacol 2007;52(S1):S154-S186.
9. Gillam JD, Dement JM, Lemen RA, et al. Mortality Patterns Among Hard Rock Gold Miners
Exposed to an Asbestiform Mineral. Ann N Y Acad Sci 1976;336–344.

20
10. Higgins IT, Glassman JH, Oh MS, et al. Mortality of Reserve Mining Company employees in
relation to taconite dust exposure. Am J Epidemiol 1983;118(5):710-9.
11. Honda Y, Beall C, Delzell E, et al. Mortality among Workers at a Talc Mining and Milling Facility.
Ann Occup Hyg 2002;46(7):575–585.
12. Hwang J, Gurumurthy R, Raynor P, et al. Comprehensive Assessment of Exposures to Elongate
Mineral Particles in the Taconite Mining Industry. Ann Occup Hyg 2013;doi:10.1093.
13. International Agency for Research on Cancer. IARC Monographs on the evaluation of
carcinogenic risks to humans, Vol 100C, Arsenic, Metals, Fibres, and Dust. International Agency
for Research on Cancer: Lyon, 2012.
14. Jirsa MA, Miller JD, Morey GB. Geology of the Biwabik Iron Formation and Duluth Complex.
Regul Toxicol and Pharmacol 2008;52(S1):S5-S10.
15. McDonald JC, Gibbs GW, Liddel FDK, et al. Mortality after long exposure to cummingtonite-
grunerite. Am Rev Respir Dis 1978;118:271-277.
16. McDonald JC, McDonald AD. The epidemiology of mesothelioma in historical context. Eur Respir
J 1996;9(9):1932–1942.
17. McSwiggin PL, Morey GB. Overview of the mineralogy of the Biwabik Iron Formation, Mesabi
Iron Range, northern Minnesota. Regul Toxicol and Pharmacol 2008;52(S1):S11-S25.
18. Mossman BT. Assessment of the pathogenic potential of asbestos vs. nonasbestiform
particulates (cleavage fragments) in in vitro (cell or organ culture) models and bioassays. Regul
Toxicol Pharmacol 2008;52(S1):S200-3.
19. National Institute of Occupational Safety and Health (NIOSH). Silica, lung cancer, and respiratory
disease quantitative risk. A project from the first 10 years of NORA: High Impact. DHHS (NIOSH)
Publication No. 2011-120.

21
20. Nolan RP, Gamble JF, Gibbs GW. Letter to the editor on commentary: malignant mesothelioma
incidence among talc miners and millers in New York state by M M Finkelstein. Am J Ind Med
2013;56(9):1116-8.
21. Raffn E, Lynge E, Korsgaard B. Incidence of lung cancer by histological type among asbestos
cement workers in Denmark. Br J Ind Med 1993 January;50(1):85-89.
22. Robinson BWS, Musk AW, Lake RA. Malignant mesothelioma. Lancet 2005;366(9483):397–408.
23. Robinson BM. Malignant pleural mesothelioma: an epidemiological perspective. Ann
Cardiothorac Surg 2012;1(4):491–6.
24. Steenland K, Brown D. Mortality study of gold miners exposed to silica and nonasbestiform
amphibole minerals: an update with 14 more years of followup. Am J Ind Med 1995;27:217-229.
25. Sogl M, Taeger D, Pallapies D, Bruning T, Dufey F, Schnelzer M, Straif K, Walsh L, Kreuzer M.
Quantitatie relationship between silica exposure and lung cancer mortality in German uranium
miners, 1946 – 2003. British Journal of Cancer, 2012; 107: 1188 – 1194.
26. VanderWeele TJ, Hernan MA, Robins JM. Causal directed acyclic graphs and the direction of
unmeasured confounding bias. Epidemiology 2008; 19(5):720-728.
27. Wilson R, McConnell EE, Ross M, et al. Risk assessment due to environmental exposures to
fibrous particulates associated with taconite ore. Regul Toxicol and Pharmacol 2008;52(S1):
S232-S245.

1
Medical Screening and Exposure Assessment of Current and Former Workers in the Taconite
Industry of Minnesota
Background
An investigation into the presence of non-malignant respiratory disease (NMRD) was conducted
within the taconite industry of Minnesota. Early investigation into the prevalence of NMRD in
taconite miners and controls was undertaken over 30 years ago (Clark et al., 1980; Higgins et al.,
1983). Although little NMRD was found in these early studies, the latency between dust and
NMRD was such that little was expected to occur at that time.
Because there are no public databases that address this disease category in Minnesota, it was
necessary to collect the information prospectively. NMRD, also referred to as pneumoconiosis, is
well-described in many jobs where dust control is difficult and refers to those disease processes
that typically result in a recognizable pattern of scarring/opacification of the lung substance
(parenchyma) or lung lining (pleura) on chest x-ray (Santos Antao, et al., 2007). As the scarring of
the lung ensues, physiologic changes may occur in the ability to move air in and out of the lungs.
The typical spirometry finding associated with parenchymal scarring is a restrictive pattern, with a
decrease in forced vital capacity (FVC) and in forced expiratory volume in one second (FEV1).
The former is the total amount of air expelled after a maximum inhalation. The latter is the
maximum amount of air expelled in one second. In general, the longer the exposure, and the higher
the exposure concentration, the more likely a worker is to develop NMRD.
Measurement of the main components of dust generated in taconite mining in this study included
asbestiform and non-asbestiform elongate mineral particles (EMPs), respirable silica and respirable
dust. An EMP refers to any mineral that has an aspect ratio (length to width ratio) of 3:1 or
greater. EMPs may be classified as amphibole or non-amphibole and amphibole EMPs may be
further described as asbestiform or non-asbestiform (NIOSH, 2011). Crystalline silica is a
component of the total respirable dust and also has a typical x-ray and spirometric pattern.
The goal of the Respiratory Health Survey (RHS) was to assess the association between exposure
to several dusts from taconite operations and NMRD, which was assessed using the degree of lung
physiology impairment (spirometry) and anatomical abnormality (chest x-ray). We conducted a
cross-sectional study of current and former workers and their spouses to do this.
Methods
The protocol for this study was reviewed and approved annually by the Human Subjects
Committee of the University of Minnesota Institutional Review Board. All data in this study
were held under strict control for the protection of confidentiality and privacy.
Study design
A cross-sectional survey of current and former taconite workers and spouses was conducted
during 2010 and 2011. The survey consisted of a detailed questionnaire, which included health,
Appendix 8

2
occupational, military and smoking histories, physiologic lung function (spirometry) and chest x-
ray evaluation for all participants.
Study population
The sampling frame for this study was assembled from lists of current and former workers
obtained from each of the six active mines and one inactive site. The sampling frame was
comprised of workers employed during the late 1980s until 2010 and totaled 16,990 individuals.
This group represented the larger industry since mines that closed were typically purchased by one
of three currently-active companies. From this population, a random sample was selected based on
age, with over sampling of older individuals to increase the chances of identifying dust-related
lung disease. The sample included workers who were currently or formerly employed at all seven
mines across the entirety of the Mesabi Range. Mines on the eastern end of the Range are known
to process an ore containing non-asbestiform amphiboles (Gamble and Gibbs, 2008). The western
mines process non-amphibole-containing ore. A sample size of 1200 workers was determined, on
the basis of respiratory symptoms in non-smoking, blue-collar workers, adjusting for gender, race,
height, weight and education (Petersen and Castellan, 1984), to adequately power this study.
Spouses were invited to participate given their potential secondary exposure and subsequent risk
(Ferrante, 2007; Magnani, 2001).
Study recruitment
In order to enroll 1200 workers, we attempted to contact 3310 individuals. All randomly selected
individuals were invited to participate in the study by mail. For those individuals who didn‟t
respond to three mailings, attempts were made to contact them by phone. After five attempts to
reach people by phone, no further recruitment efforts were undertaken. Workers were categorized
as “enrolled” (agreed to participate), “refused” (did not agree to participate), “withdrew”
(originally consented but later stopped their participation), or “non-responder” (no response from
recruitment letter or phone call). This last category did not distinguish whether workers received
letters and phone calls and ignored them, or whether their address and phone information was
incorrect.
Those who agreed to participate were scheduled for a two-hour clinical evaluation. They filled out
a self-administered questionnaire in advance that contained a medical, occupational, military and
smoking history. This also contained a list of common respiratory symptoms (ATS, 1994). All
individuals underwent informed consent. No remuneration, other than mileage reimbursement was
provided for participants. Driving distances and travel times to the survey clinic were calculated
using Google Maps Javascript API V3 (Google 2011).
Exposure assessment
One distinguishing characteristic of this study was in the use of work history information. The
case-control studies described previously in this report used information from an existing MRHAP
work history evaluation. Work history information in this study was obtained from questionnaires
administered by the investigative team, in advance of medical testing. Work histories obtained
directly from each participant, describing job titles, job locations, and dates of each job were used
to create a comprehensive list of job titles.

3
The exposure assessment process has been described elsewhere and is described briefly here
(Hwang et al., 2013 Hwang et al., 2014; Appendix 1, 2, 3). The goals for the exposure assessment
component of this research were to (a) identify the major tasks pertinent to the processing of
taconite ore, referred to as similarly exposed groups (SEGs); (b) assess current exposures of
workers to the relevant components of dust from taconite operations which included asbestiform
and non-asbestiform elongate mineral particles (EMPs), respirable silica, and respirable dust in
each SEG; (c) estimate historical exposures within each SEG from relevant components of dust
generated in taconite operations from 1953 to the present. Historical estimates were based on
measurements provided by the companies for all sites and measurements taken by the Mining
Safety and Health Administration (MSHA). The one inactive site did not have measurement data
available for it, except those taken by MSHA.
Several workers per SEG were selected for sampling. Each participant wore a personal air-sampler
for approximately six hours of a work shift on three separate occasions. The filter samples were
analyzed for EMPs by phase contrast microscopy which identifies all EMPs longer than 5 µm,
with a diameter of 0.25 µm and with an aspect ratio ≥ 3. Respirable silica was analyzed using the
NIOSH 7500 analytic method. The samples were used to calculate a single average concentration
for the shift per participant. For respirable dust, samples were analyzed with the NIOSH 0600
method.
Standardized exposure assessment approaches were used to assign each of 181 jobs across the
active mines to 28 similarly exposed groups (SEGs), in common to all plants. The SEG
information was combined with some 2000 on- site measurements that were made (Hwang et al.,
2013; Hwang et al., 2014; Appendix 1, 2, 3) for both area and personal samples using traditional as
well as more detailed methods for the assessment of EMPs, silica and total respirable dust. These
measures were combined with historical measures obtained from each of the mining companies
along with MSHA data to form a job (SEG)-exposure matrix for each year dating back to the
beginning of the industry and extending through 2010.
Each person‟s company work record was then linked to the list of SEGs, using a standardized
mapping approach. The exposure matrices could then be used to estimate each worker‟s exposure
to EMPs, silica and total respirable dust. Each person‟s SEG exposure (by type, concentration and
duration) was summed across all years worked in that SEG to obtain a cumulative exposure
estimate. This information was obtained within the eastern and western most zones of the Mesabi
Range. There were no active plants in the other zones (zones 2 and 3). Jobs with insufficient
information were assigned to a department SEG, which was the average exposure for all SEGs in
it. Jobs with no information were assigned to a missing SEG, which was the average for all SEGs
in the mine.
Cross-sectional screening
During the clinical evaluation, participants underwent informed consent followed by a brief history
and physical exam determining that they were fit for clinical testing. During this assessment,
participants had the following tests performed: standard spirometry, diffusion capacity for carbon
monoxide (DLCO), which includes the determination of alveolar volume, a venous blood draw of
20 ccs and a posterior-anterior (PA) chest x-ray.

4
Spirometry was measured using a dry rolling seal, volume displacement spirometer by technicians
trained in a two-day NIOSH-certified spirometry course. Regular quality checks of equipment and
monitoring of procedural performance of technicians was undertaken. Testing followed American
Thoracic Society (ATS)/European Respiratory Society (ERS) recommendations (Miller et al.,
2005), except that in this study, a minimum of five spirometry efforts was performed. Different
categories were assessed, based on whether ATS/ERS guidelines for “acceptability” and
“repeatability” of spirometric maneuvers were achieved. Standard reference equations were used
for the estimation of expected spirometric results (Hankinson, 1999). A participant was identified
as having “airflow/lung/spirometric obstruction” if the FEV1/FVC ratio was less than the lower
limit of normal (LLN) (Hankinson, 1999). Spirometric restriction was identified in those whose
FEV1/FVC ratio was greater than or equal to the LLN, but their FVC value was under the LLN. A
„”mixed pattern” was identified when both FEV1/FVC ratio and FVC values were under the LLN.
All spirometric restriction in this paper includes the mixed category. Borderline obstruction, which
may represent either a mild obstruction or a normal physiological variant, sometimes called
“dysanapsis” was identified by a low FEV1/FVC ratio plus an FEV1 over the LLN (Mead, 1980).
Certified radiologic technicians took all chest x-rays. All films were read blindly by two NIOSH-
certified B-Readers using ILO guidelines and standard images (ILO, 2000). For the purposes of
this study, parenchymal abnormalities were defined as the presence of small opacities of profusion
ILO category 1/0 or above, and pleural abnormalities defined as any finding consistent with
pneumoconiosis. When results from the two initial readers differed, a third certified B-reader
performed an arbitration reading. For parenchymal abnormalities a third read took place when the
two initial readers disagreed by more than two subcategories or one profusion category, or by more
than one level in the opacity and distribution questions. Results of chest x-rays are listed herein as
a consensus of two reads.
Statistical Analyses
Descriptive analyses examined the characteristics of workers who completed the questionnaire and
clinic visit. Separate analyses examined the characteristics of study responders versus non-
responders to explore possible selection bias. The association between employment duration in
taconite or cumulative exposure and NMRD on chest x-ray was estimated using Poisson
regression. Models were also used to estimate rate ratios and 95% confidence intervals for
restriction. Employment duration models examined the effect of years worked in operations across
the entire Iron Range, with separate models examining the effect of years worked within each of
four Iron Range zones (Figure 1). Cumulative exposure models examined exposure in all geologic
zones combined, with another model examining cumulative exposure within each zone. Since no
EMP exposure measurements were available for zone 2 and mineralogy was most similar to zone
4, those measurements were felt to best represent zone 2 EMP exposures. SAS Version 9.2 was
used to run all statistical models. Analyses were done controlling for age, gender, BMI, smoking
status, hematite years, commercial asbestos, outside occupation with high probability of asbestos
exposure and exposure in other zones.
Models incorporated continuous and categorical covariates for age and BMI. As hematite mining
does not require the same processing steps needed for taconite, and since no exposure data were
available for the hematite SEGs, models included the number of years spent in the hematite SEG
as a separate variable. Commercial asbestos was used in the maintenance and building of the

5
mines, but no quantitative data existed for commercial asbestos levels within the mines. To
account for potential commercial asbestos exposure in the mines, each SEG was assigned a
commercial asbestos score of low, medium, or high in a blinded fashion, by experienced industrial
hygienists, based on the likelihood and frequency of asbestos exposure. Potential non-taconite,
occupational asbestos exposure was assessed in the questionnaire, and a variable included in the
models that indicated whether an individual had ever been employed in an occupation with a high
potential for asbestos exposure.
Separate models were estimated for each of the NMRD outcomes, including spirometry, chest x-
rays (pleural and parenchymal abnormalities) and exertional dyspnea. Detailed analyses were
conducted for those endpoints that have been most consistently associated with dust exposure in
the literature, including restrictive lung disease (via spirometry) and parenchymal abnormalities
(via chest x-ray).
Results
We enrolled 1322 workers and 496 spouses (total of 1818 individuals). A total of 1,188 workers
and 496 spouses completed the questionnaire and clinical examination over a 14 month period.
Testing was performed at a central location on the Mesabi Iron Range, but even so, some
individuals had to travel over three hours to get to the test site. Individuals living within one hours
of the testing site made up 70% of the participants. Participants made up a lower percent of the
random sample between the ages of 35 and 45 years (7.7% vs. 21%) and a higher percent of the
random sample between the ages of 66 and 75 years (25.3% vs. 15.4%). Twenty percent of non-
participants lived more than two hours from the testing site compared to 12.0% in the participant
group. A group of 134 individuals responded to the questionnaire only without taking part in
medical testing. From the random sample, 725 individuals could not be located, either related to
incorrect address information or because of failure to respond to several mailings and five phone
calls. Table 1 lists demographic characteristics of participants and spouses.
A total of 233 workers underwent personal exposure monitoring. Since five of the six currently
operating mines were in the western zone, 177 of the workers were from this zone with the
remainder from the eastern zone. In general, results for EMP measurements (NIOSH 7400 method)
were below the recommended exposure limit (REL), with evidence of amphibole EMP present in
the eastern zone plant but not in the western zone plants (Hwang et al., 2013). Amphibole
exposures were well below the REL. No asbestiform amphiboles were found in these
measurements.
This study also assessed the present-day levels of exposure to respirable dust (RD) and respirable
silica (RS) in taconite mines. Personal samples (n=679) were collected to assess the present-day
exposure levels of workers to RD and RS at six mines on the Mesabi Iron Range. The silica and
respirable dust measurements indicated slightly higher concentrations in the eastern zone
(Appendix 3). The concentrations of RD in all mines fell below the ACGIH TLV for RD. With a
few exceptions, the concentrations of RS in the crushing and concentrating processes were higher
than those measured in the other mining processes with more excursions over the ACGIH TLV for
RS than other measured exposures (Appendix 3).
6
Table 2 contains a comparison of chest x-ray and spirometry findings between workers and
spouses. Workers had increased chest x-ray abnormalities in the lung substance (parenchyma) and
the tissue surrounding the lungs (pleura) compared to spouses. In workers, most parenchymal
abnormalities were in the 1/0 category (52%), with 28% in the 1/1 category, 7% read as 1/2, 3%
read as 2/1, 7% as 2/2 and 3% as greater than 2/2. Pleural findings were mostly described as
localized (53%), with 4% demonstrating obliteration of the costo-phrenic angle, 3% showing
localized calcification and less than 1% with diffuse pleural thickening. When comparing workers
and spouses with spirometry, abnormalities were comparable between these groups.
Table 3 lists demographic and exposure variables in workers by whether pleural or parenchymal
findings were present. Those workers with abnormalities involving either the pleural or
parenchyma were older, had higher rates of current and former smoking, had lower rates of having
never smoked, spent more time working in the taconite industry and had slightly higher amounts of
exposure to elongate mineral particle concentrations. Those with pleural abnormalities tended to
have higher BMI. Neither prior employment in a job with potential asbestiform EMP exposure nor
the geological taconite zone worked seemed to vary within those workers with or without lung
pleural or parenchymal abnormalities.
Table 4 demonstrates the association between duration of employment in the taconite industry and
parenchymal abnormality. The rate ratio was interpreted as the relative increase in the frequency of
abnormality associated with a one unit increase in the exposure for continuous measures of
exposure, e.g. years of employment, or compared to the reference category (designated as 1.0).
Duration of employment was not significantly related to parenchymal abnormalities in these
analyses.
Table 5 shows the relationship between exposures to EMP concentration-years to parenchymal
abnormalities. As with duration of employment, the findings don‟t indicate a statistically
significant association between these. When the exposures were categorized into two groups, high
and low, using the median exposure as the cutoff, the rate ratio of high exposure to low exposure
was 1.26. This finding was not statistically significant.
Tables 6 and 7 reveal the relationship between having pleural abnormalities with duration of
employment and cumulative exposure, respectively. Analyses for Tables 6 and 7 were done
controlling for age, gender, smoking, BMI, hematite years, commercial asbestos, outside
occupation with high probability of asbestos exposure and exposure in other zones. In this
analysis, the overall effect of employment duration showed an increased risk ratio (RR=1.02,
95% CI=1.0-1.04). This may be interpreted as a 2% increase in the risk of pleural abnormalities
for each year worked. For a worker employed 30 years or longer, the risk of pleural abnormality
was about 65% increased (RR=1.65, 95% CI=1.02-2.65). The overall relationship suggests a 6%
increased risk of abnormalities, per each EMP/cc/year of exposure (RR=1.06, 95% CI=1.0-1.12).
As an example, this could represent an exposure of 0.1 EMP/cc for 10 years or an exposure of
1.0 EMP/cc for one year. Looking at exposure concentrations at or greater than 1.16
EMP/cc/year nearly doubled the RR for pleural abnormalities (RR=1.93, 95% CI=1.32-2.83).
The effect appeared strongest in zone 2.

7
Table 8 demonstrates the association between having a restrictive pattern on spirometry, pleural
and parenchymal abnormalities and exposure to silica and respirable dust. In this analysis,
adjusting for age, gender, BMI, smoking, commercial asbestos exposure score, there were non-
significant increases in the RR for silica and, to a lesser extent, respirable dust. Neither silica nor
respirable dust had strong associations with chest x-ray or spirometric abnormalities. Exertional
dyspnea was also assessed as an endpoint. It also was not related to these exposures.
In an assessment of similarly exposed groups (SEGs), used to determine cumulative exposure for
each exposure type, an association with pleural, parenchymal or spirometric abnormalities was
not found, nor was one found with groupings of SEGs into broader categories, i.e. departments.
Examples of departments included mining, crushing, concentrating and pelletizing.
Discussion
This survey of current and former taconite workers allowed for collection of exposure, lung
function and imaging (chest x-ray) measurements, along with medical, occupational, military and
smoking history information in workers and their spouses. Chest x-ray and lung function testing
(spirometry) are the standard tests used to assess workers with dust exposure. This information
provided additional context concerning the potential effects of exposures in this industry.
The response rate of the survey was consistent with recent investigations of this type (Galea and
Tracy, 2007). The fact that individuals needed to drive several hours in some cases, without
remuneration other than mileage reimbursement, may have played an inhibitive role in
participation. Initial comparisons of responders and non-responders have shown that the former
group is more likely to have been over age 55 and to have lived closer to the testing facility (within
one hour). This may be because younger invitees were working and were unwilling to take time off
to participate. Given that 75% of the participants were over age 55, no longer working and able to
travel to the screening, they may represent a healthier group than the overall cohort. Over 90% of
the participants were male, which parallels the gender makeup of the complete cohort (Allen et al.,
2014). A formal comparison of these issues is currently under study.
Despite questions on generalizability to other work settings, inference may be made on the basis of
internal comparisons of workers to spouses. Based on chest x-ray evaluation alone, there is
evidence of non-specific parenchymal abnormalities in workers. Although not as dramatically
elevated as described in other industrial settings, it is higher than abnormalities found in spouses.
Work-related silica and respirable dust exposure did not appear to be strongly associated with
these abnormalities in our statistical models. Silica has a predilection for the lung parenchyma and
was measured as the exposure with the most excursions over the ACGIH TLV in the onsite
industrial hygiene assessment. However, the radiologic presentation is not classical of workers
highly exposed to silica and is more consistent with mixed dust exposure. In this assessment,
spouses do not appear to be at increased risk for chest x-ray abnormalities. The amount of their
chest x-ray abnormalities is consistent with reports of findings in the non-occupational setting
(Hillerdal, 1997). This is reassuring and suggests that current community exposures to dust from
taconite operations are not likely to result in increased risk beyond what would be expected in the
general population.
8
For workers, there was suggestion of an elevated risk for pleural abnormalities associated with
duration of employment and exposure to EMPs. Over 16% of worker participants had evidence of
pleural abnormalities by a consensus of B-readers, distinctly higher than spouses. It has also been
described in relation to lung function impairment (Schwartz et al., 1990; Broderick et al., 1992).
Pleural abnormalities can be complicated by other factors, including obesity (Sargent et al., 1984).
In statistical models that controlled for these factors, pleural abnormalities remained associated
with duration of employment as well as with exposure to EMPs. The most likely exposure that
would account for pleural abnormalities is asbestiform EMPs. In this study, we were not able to
distinguish which specific type of EMP was associated. Parenchymal abnormalities were not
consistently associated with either duration of employment or EMP exposure. The finding of a
restrictive pattern on spirometry was not strongly related to either duration of employment or EMP
exposure nor was dyspnea on exertion.
Strengths and limitations
Although we used the standard disease screening techniques, each of these medical tests has
shortcomings in terms of sensitivity, specificity and predictive value. The cross-sectional design
measured diseases at one point in time, which can limit the accuracy of diagnoses and
subsequent inference. The healthy worker survivor effect is a concern with this type of study
since the sickest workers may have died or been too sick to participate in this study.
Prior investigations in this industry have been limited by statistical power and the lack of
exposure assessment data. The current approach had adequate size to detect important
differences in exposed vs. unexposed groups. It also utilized spouses as an internal comparison to
workers. It used onsite monitoring data, company measures and MSHA compliance monitoring
data to project historical exposure estimates. The on-site measures were more complete and
could be tied directly to SEGs of interest. Since phase contrast microscopy, which was used to
analyze the onsite industrial hygiene samples for EMP, has a resolution of 0.25 µm, it is possible
that EMPs under this diameter would be missed, even if greater than 5 µm in length. However,
there is no indication that this potential misclassification would differ in those with or without
test abnormalities.
The exposure assessment was unique in the incorporation of several dust-related exposures
(EMP, silica, respirable dust). Despite the advantages of this exposure assessment approach, it
lacked differentiation of asbestiform and non-asbestiform EMP. Due to important gaps in
exposure measures, particularly during the early years of the industry, there was a potential for
exposure misclassification. While several factors could lead to the exposures being categorized
higher or lower, the exposure reconstruction was based on all available work history, without
regard to test findings. Since work histories were abstracted without knowledge of test status,
misclassification should be non-differential. However, it is also possible that job information
was created in some systematic way that enhanced the potential for differential bias. In fact, we
were not able to state which way this misclassification occurred, if it was a factor.
The findings of pleural abnormalities were more common in the western-most geological zones.
This is contrary to the exposure measures for EMPs, which were higher on the eastern zone
(Hwang et al., 2013). The incongruity of this finding could suggest the impact of uncontrolled
confounding factors and points to the need for further study of zone-specific results. In addition,

9
although amphibole EMP exposures exist in the eastern Iron Range zone, these are believed to be
predominantly of the non-asbestiform variety (Gamble and Gibbs, 2008; Ross et al., 2008;
Wilson et al., 2008), a type that did not have clearly-established disease associated with exposure
in studies of Homestake gold miners and New York talc workers (Steenland and Brown, 1995;
Gamble, 1993 and 2008; Honda et al., 2002; Finkelstein, 2012; Nolan et al., 2013).
Pleural abnormalities associated with non-asbestiform dust exposure are dependent on adequate
control of asbestiform minerals. The facilities were constructed in the 1950s and 60s, a time
when commercial asbestos materials were not strictly regulated and were used commonly in
many industrial applications. The analysis of EMP exposures controlled for potential commercial
asbestos exposure in the jobs held in the taconite industry, but the ability to do this was limited
by the absence of data on the amount of exposure and type of commercial asbestos. It is possible
that exposure to commercial asbestos remained as a residual confounding variable in this
assessment.
Conclusions
This survey of taconite workers and spouses demonstrated increased findings for both pleural and
parenchymal abnormalities in workers compared to spouses. Spouses did not appear to be at risk
for dust-related lung disease beyond what would be expected in the general population. The
parenchymal findings are consistent with dust exposure to a mixed dust including silica. Worker
abnormalities for pleural disease were related to length of employment in the taconite industry and,
to a lesser extent, to exposure to EMP. The specific type of EMP exposure could not be determined
in this evaluation.
Acknowledgement: This study was funded by the State of Minnesota by a project grant to the University of Minnesota. The
opinions expressed are those of the authors and do not represent the State of Minnesota. Special appreciation is extended to the
following individuals for their assistance: Leslie Studenski, Diane Kampa, Richard Hoffbeck, Nancy Pengra, Nancy Tekautz, Cole
Fisher, Karen Johnson, Jackie Zasadni, Barbara Fallos and Drs. Alan Bender and Allan Williams of the Minnesota Department of
Health, Division of Chronic Disease and Environmental Epidemiology.

10
References
Allen EM, Alexander BH, MacLehose RF, Ramachandran G, Mandel JH. Mortality experience
among Minnesota taconite mining industry workers. Occup Environ Med, Occup Environ Med.
2014 May 9. doi: 10.1136/oemed-2013-102000. [Epub ahead of print] PMID:24816518
American Thoracic Society (ATS) Standardization of spirometry: 1994 update . Am
J Respir Crit Care Med, 1995: 152:1107-1136.
Broderick A, Fuortes LJ, Merchant JA, et al. Pleural determinants of restrictive
lung function and respiratory symptoms in an asbestos-exposed population. Chest,
1992 101:684-691.
Clark TC, Harrington VA, Asta J, Morgan WK, Sargent EN. Respiratory effects of exposure to
dust in taconite mining and processing. Am Rev Respir Dis, 1980 121(6):959-966.
Ferrante D, Bertolotti M, Todesco A, Mirabelli D, Terracini B, Magnani C. Cancer mortality and
the incidence of mesothelioma in a cohort of wives of asbestos workers in Casale Monferrato,
Italy. Environ Health Perspect, 2007 115(10):1401-1405.
Finkelstein MM. Malignant mesothelioma incidence among talc miners and millers in New York
State. AJIM 2012, 55(10):863-8. (doi: 10.1002/ajim.22063. Epub 2012 Apr 27.)
Galea S, Tracy M. Participation rates in epidemiologic studies. Ann Epidemiology. 2007
17(9):643-653.
Gamble JF. A nested case control study of lung cancer among New York talc workers.
International Arch. Occup. Env Hlth 1993, 64:449-456.
Gamble JF, Gibbs GW. An evaluation of the risks of lung cancer and mesothelioma from
exposure to amphibole cleavage fragments. Regul Toxicol Pharmacol, 2008 52(1 Suppl):S154-
186.
Hankinson JL, Odencrantz JR, Fedan KB. Spirometric reference values from a
sample of the general U.S. population. Am J Respir Crit Care Med, 1999 159:179-
187.
Higgins IT, Glassman JH, Oh MS. The effect of taconite dust exposure on the health of
employees of Reserve Mining Company: Mortality, respiratory symptoms and chest radiography.
University of Michigan, Ann Arbor, MI. 1981.
Hillerdal G. Pleural plaques: incidence and epidemiology, exposed workers and the general
population: a review. Indoor and Built Environment 1997, 6:86-95.
Honda Y, Beall C, Delzell E, Oestenstad K, Brill I, Matthews R. Mortality among workers at a

11
talc mining and milling facility. Ann Occup Hyg 2002, 46:575-585.
Hwang J, Ramachandran G, Raynor PC, Alexander BH, Mandel JH. A comprehensive
assessment of exposures to elongate mineral particles (EMPs) in the taconite mining industry.
Ann Occup Hyg Published Online First: 22 June 2013. Doi:10.1093/annhyg/met026.
Hwang J, Ramachandran G, Raynor PC, Alexander BH, Mandel JH. The relationship between
various exposure metrics for elongate mineral particles (EMP) in the taconite mining and
processing industry. J Occup Environ Hyg. 2014;11(9):613-24. doi:
10.1080/15459624.2014.890287. PMID: 24512074
ILO Guidelines for the use of the International Labor Organization International
Classification of Radiographs of Pneumoconioses. Occupational Safety and Health
Series No. 22. Geneva International Labor Office, Geneva, Switzerland, revised
2000.
Magnani C, Dalmasso P, Biggeri A, Ivaldi C, Mirabelli D, Terracini B . Increased
risk of malignant mesothelioma of the pleura after residential or domestic exposure
to asbestos: a case-control study in Casale Monferrato, Italy. Environ Health Pers,
2001 109(9):915-919.
Mead J. Dysanapsis in normal lungs assessed by the relationship between maximal
flow, static recoil, and vital capacity. Am Rev Respir Disease 1980 121:339-342.
Miller MR, Hankinson J, Brusasco V, et al. Standardization of spirometry.
ATS/ERS task force: standardization of lung function testing. Eur REspir J 2005
26:319-338.
National Institute for Occupational Safety and Health (NIOSH). NIOSH manual of analytical
methods (NMAM) 7400. 4th
Edition: Asbestos and other fibers by PCM, Issue 2, 1994.
NIOSH Current Bulletin No. 62. Asbestos Fibers and Other Elongate Mineral Particles: State of
the Science and Roadmap for Research (Revised Edition). Department of Health and Human
Services, Centers for Disease Control and Prevention, National Institute for Occupational Safety
and Health. April, 2011.
Nolan RP, Gamble JF, Gibbs GW. Letter to the Editor on Commentary: Malignant
Mesothelioma Incidence Among Talc Miners and Millers in New York State by MM Finkelstein.
AJIM 2013 56:1116–1118.
Petersen M, Castellan RM. Prevalence of chest symptoms in non-exposed blue
collar workers. J Occup Med, 1984 26:367-374.
Ross M, Nolan RP, Nord GL. The search for asbestos within the Peter Mitchell
taconite iron ore mine, near Babbitt, Minnesota. Regul Toxicol Pharmacol 2008,
52 (1 suppl):43-40.

12
Santos Antao VC, Pinheiro GA, Parker JE. Lung diseases associated with silicates and other
dusts. Environmental and Occupational Medicine 4th
Edition (2007). Rom WE, Editor. Wolters
Kluwer/Lippincott Williams & Wilkins, Philadelphia, PA. Chapter 32, p. 525-542.
Sargent EN, Boswell W, Ralls P, et al. Subpleural fat pads in patients exposed to asbestos:
distinction from non-calcified pleural plaques. Radiology, 1984 152:273-277.
Schwartz DA, Fuortes LJ, Galvin JR, et al. Asbestos-induced pleural fibrosis and impaired lung
function. Am Rev Respir Dis, 1990 141:321-326.
Steenland K, Brown D. Mortality study of gold miners exposed to silica and nonasbestiform
amphibole minerals; an update with 14 more years of follow-up. Am J Ind Med, 1995 276:217-
229.
Wilson R, McConnell EE, Ross M, Axten CW, Nolan RP. Risk assessment due to environmental
exposures to fibrous particulates associated with taconite ore. Regulatory Toxicology and
Pharmacology 2008, 52 (1 supp): 232-245.
\

13
Table 1. Demographic profile of study participants and spouses
Participants Spouses
(n=1188) (n=455)
Mean age (yrs.)
60.0
59.7
Age groups (%)
35-45
46-55
56-65
66-75
75+
7.7
18.3
35.3
25.3
13.5
6.8
28.2
29.4
28.8
5.8
Mean BMI
31.4
30.9
Smoking (%)
Never
Current
Former
38
12
50
47
10
43
Gender (%)
Male
Female
90.8
9.2
3.1
96.9

14
Table 2. Summary of chest x-ray and spirometry findings in taconite workers and spouses
Chest x-ray Workers (n=1188) Spouses (n=455)
B-reader consensus
parenchymal abnormality
63 (5.3%) 3 (0.6%)
B-reader consensus pleural
abnormality
198 (16.7) 22 (4.5)
B-reader consensus x-ray
diffuse pleural thickening
12 (1.0) 0
B-reader consensus pleural
and parenchymal
abnormality
29 (2.5) 0
Spirometry (n=1084) (n=455)
Obstructiona 182 (16.8) 53 (11.6)
Restrictionb 49 (4.5) 20 (4.4)
Mixed diseasec 31 (2.9) 13 (2.8)
a
FEV1/FVC ratio was less than the lower limit of normal b
FEV1/FVC ratio was greater than or equal to the LLN and FVC value was under the LLN c
Both FEV1/FVC ratio and FVC values under the LLN

15
Table 3. Demographics and exposure levels of taconite workers by radiographic status
Characteristic Parenchymal Abnormality
Yes=63 No=1115
Pleural Abnormality
Yes=198 No=980
Working Status %
Former
Current
93.6
6.4
69.9
30.1
84.9
15.1
68.4
31.6
Gender %
Female
Male
1.6
98.4
9.6
90.4
2.0
98.0
10.6
89.4
Mean Age
67.9 60.1 65.6 59.5
Mean BMI
30.5 31.4 34.3 30.8
Smoking Status %
Current
Former
Never
15.9
61.9
22.2
11.7
48.3
40.0
8.1
66.7
25.2
12.7
45.5
41.8
Outside Asbestos Occupation %
No
Yes
76.2
23.8
77.9
22.1
74.2
25.8
78.5
21.5
Zone ever worked %
Zone 1
Zone 2
Zone 4
57.1
38.1
22.2
61.5
34.8
25.0
58.6
36.9
22.7
61.8
34.6
25.3
Mean years of taconite employment
Overall
Zone 1
Zone 2
Zone 4
29.0
25.9
22.7
24.1
25.3
20.8
19.2
21.2
28.5
22.7
24.9
24.5
24.9
20.7
18.2
20.8
Mean EMP/cc/year
Overall
Zone 1
Zone 2
Zone 4
3.8
2.3
3.1
5.7
2.9
1.5
2.4
4.6
3.9
2.0
3.7
5.9
2.8
1.5
2.2
4.5

16
Table 4. Parenchymal abnormalitya associated with duration of taconite employment
(years) and duration of taconite employment in each Iron Range Zone
Exposure Abnormalities
Yes/No Rate Ratio (RR)
e 95%CI
Overall Employmentb
Taconite employment duration 63/1115 1.02 0.99-1.04
Hematite employment duration 7/51 1.01 0.94-1.09
Duration Categoryb,c
0 < years < 22 15/425 1.00 ---
22+ years 48/690 1.38 0.75-2.56
Zone Analysisd
Employment duration-Zone 1 36/686 1.03 0.99-1.06
Employment duration-Zone 2 24/388 1.03 0.99-1.06
Employment duration-Zone 4 14/279 1.01 0.98-1.04
a Defined as profusion 1/0 or greater by B-reader consensus
b Results adjusted for age, gender, BMI, smoking status, hematite years, and outside occupation
with high probability of asbestos exposure c Duration category comparison of duration quartile 1 vs duration quartiles 2-4
d Results adjusted for age, BMI, hematite years, outside occupation with high probability of
asbestos exposure, and duration in other zones e
Rate ratio is interpreted as the relative increase in the frequency of abnormality associated with
a one unit increase in the exposure for continuous measures of exposure, e.g. years of
employment, or compared to the reference category (designated as 1.0).

17
Table 5. Parenchymal abnormalitya associated with cumulative EMP/CC/years in each
Iron Range Zone
Exposure Abnormalities
Yes/No RR
d 95%CI
Overall Employmentb
EMP/cc/year 63/1115 1.00 0.92-1.09
Hematite 7/51 1.01 0.93-1.08
Zone Analysisc
EMP/cc/year -Zone 1 36/686 1.06 0.92-1.23
EMP/cc/year -Zone 2 24/388 1.03 0.90-1.18
EMP/cc/year -Zone 4 14/279 0.99 0.90-1.09
a Defined as profusion 1/0 or greater by B-reader consensus
b Results adjusted for age, gender, BMI, smoking status, hematite years, commercial asbestos
exposure score, and outside occupation with high probability of asbestos exposure c Results adjusted for age, BMI, hematite years, commercial asbestos, outside occupation with
high probability of asbestos exposure, and exposure in other zones d
Rate ratio is interpreted as the relative increase in the frequency of abnormality associated with
a one unit increase in the exposure for continuous measures of exposure or compared to the
reference category (designated as 1.0).
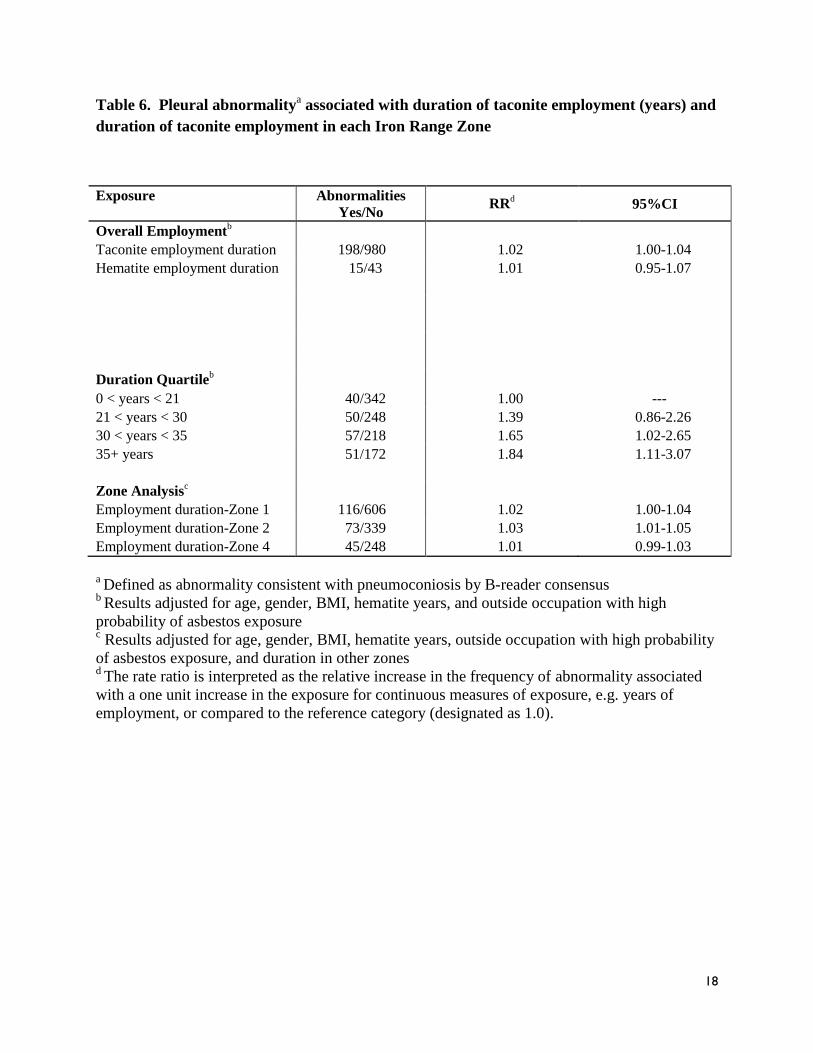
18
Table 6. Pleural abnormalitya associated with duration of taconite employment (years) and
duration of taconite employment in each Iron Range Zone
Exposure Abnormalities
Yes/No RR
d 95%CI
Overall Employmentb
Taconite employment duration 198/980 1.02 1.00-1.04
Hematite employment duration 15/43 1.01 0.95-1.07
Duration Quartileb
0 < years < 21 40/342 1.00 ---
21 < years < 30 50/248 1.39 0.86-2.26
30 < years < 35 57/218 1.65 1.02-2.65
35+ years 51/172 1.84 1.11-3.07
Zone Analysisc
Employment duration-Zone 1 116/606 1.02 1.00-1.04
Employment duration-Zone 2 73/339 1.03 1.01-1.05
Employment duration-Zone 4 45/248 1.01 0.99-1.03
a Defined as abnormality consistent with pneumoconiosis by B-reader consensus
b Results adjusted for age, gender, BMI, hematite years, and outside occupation with high
probability of asbestos exposure c Results adjusted for age, gender, BMI, hematite years, outside occupation with high probability
of asbestos exposure, and duration in other zones d
The rate ratio is interpreted as the relative increase in the frequency of abnormality associated
with a one unit increase in the exposure for continuous measures of exposure, e.g. years of
employment, or compared to the reference category (designated as 1.0).

19
Table 7. Pleural abnormalitya associated with cumulative EMP/cc/years and Iron Range
zone
Exposure Abnormalitiesa
Yes/No RR
f 95%CI
Overall Employmentb
EMP/cc/years 198/980 1.06 1.00-1.12
Hematite 15/43 1.01 0.96-1.07
Exposure Category b, c
0 < EMP/cc/years < 1.16 48/415 1.00 ---
1.16 + EMP/cc/years 150/565 1.93 1.32-2.83
Exposure Quartileb
0 < EMP/cc/years < 1.16 48/415 1.00 ---
1.16 < EMP/cc/years < 3.29 51/238 1.84 1.18-2.94
3.29 < EMP/cc/years < 5.89 49/176 2.22 1.42-3.63
5.89 + EMP/cc/years 50/151 1.78 1.11-2.98
Zone Analysisd
EMP/cc/year -Zone 1 116/606 1.09 0.99-1.21
EMP/cc/year -Zone 2 73/339 1.16 1.06-1.27
EMP/cc/year -Zone 4 45/248 1.04 0.97-1.10
Zone Analysisd,e
Quartiles 2-4 vs 1-Zone 1 62/205 vs 54/401 1.97 1.27-3.06
Quartiles 2-4 vs 1-Zone 2 56/168 vs 17/171 2.67 1.3-5.48
Quartiles 2-4 vs 1-Zone 4 38/195 vs 7/53 1.05 0.39-2.81
a Defined as abnormality consistent with pneumoconiosis as interpreted by B-reader consensus
b Results adjusted for age, gender, BMI, hematite years, commercial asbestos exposure score, and
outside occupation with high probability of asbestos exposure c Exposure category comparison of exposure quartile 1 vs exposure quartiles 2-4
d Results adjusted for age, gender, BMI, hematite years, commercial asbestos, outside occupation
with high probability of asbestos exposure, and exposure in other zones e For each zone, cumulative EMP/CC/years for quartiles 2-4 are compared to quartile 1
f The rate ratio is interpreted as the relative increase in the frequency of abnormality associated
with a one unit increase in the exposure for continuous measures of exposure, e.g. years of
employment, or compared to the reference category (designated as 1.0).

20
Table 8. Pleurala and parenchymal chest x-ray abnormality
b and restrictive pattern on
spirometryc associated with cumulative exposure to silica and respirable dust
Spirometric
Pleural Parenchymal Restrictionc
RRe
95% CI RRe 95% CI RR
e 95% CI
Cumulative silica
exposure in
mg/cc/years
1.06 0.85-1.31 0.97 0.60-1.57 1.19 0.81-1.75
Cumulative
respiratory dust
exposure in
mg/cc/yearsd
1.01 0.99-1.03 1.00 0.96-1.04 1.00 0.96-1.05
a Defined as abnormality consistent with pneumoconiosis by B-reader consensus
b Defined as consensus read of 1/0 or greater by ILO categorization
c Defined as FVC < LLN (includes mixed disease)
d Respirable dust is defined as total respiratory dust minus total silica dust
e The rate ratio is interpreted as the relative increase in the frequency of abnormality associated with a one
unit increase in the exposure for continuous measures of exposure, e.g. years of employment, or
compared to the reference category (designated as 1.0). The analysis was adjusted for age, gender,
BMI, smoking and commercial asbestos exposure score.

21
Figure 1.

22