taconite lab testing document - minnesota department of
TRANSCRIPT
Project No. MPR-6(023):
Use of Taconite Aggregates in Pavement Applications
Task F Report:
Laboratory Testing of Taconite Materials
Tim Clyne Ed Johnson Ben Worel
Minnesota Department of Transportation Office of Materials and Road Research
1400 Gervais Ave. Maplewood, MN 55109
July 2009

1
Introduction
The objective of this study is to demonstrate the use of fine and coarse taconite aggregate materials in hot mix asphalt, Portland cement concrete, and other pavement applications for both its constructability and field performance over time. This would help create a greater comfort level for the use of taconite aggregate and help promote its use in the state and around the nation. The specific goal of Task F is to perform laboratory tests on taconite aggregates and on pavements made out of taconite aggregates to establish how these materials will be used in the most appropriate manner for long-lasting roadways. Mn/DOT has the laboratory equipment and expertise to do this required material testing. Aggregate Testing
Three different aggregate materials were tested at the Mn/DOT Maplewood Lab. The aggregates were all used in test cells during the 2008 construction season. The specific aggregates tested are:
Railroad Ballast (aggregate base in Cell 23)
Ispat Tailings (HMA aggregate in Cell 6)
MinTac Tailings (HMA aggregate in Cell 6)
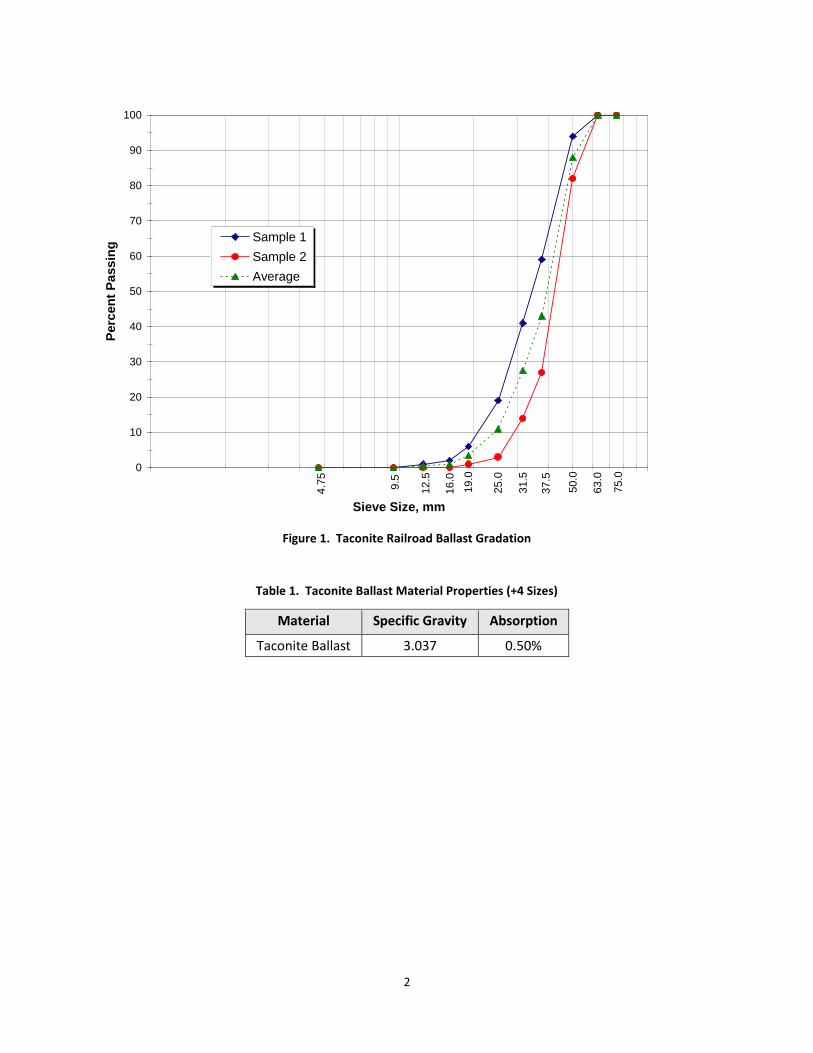
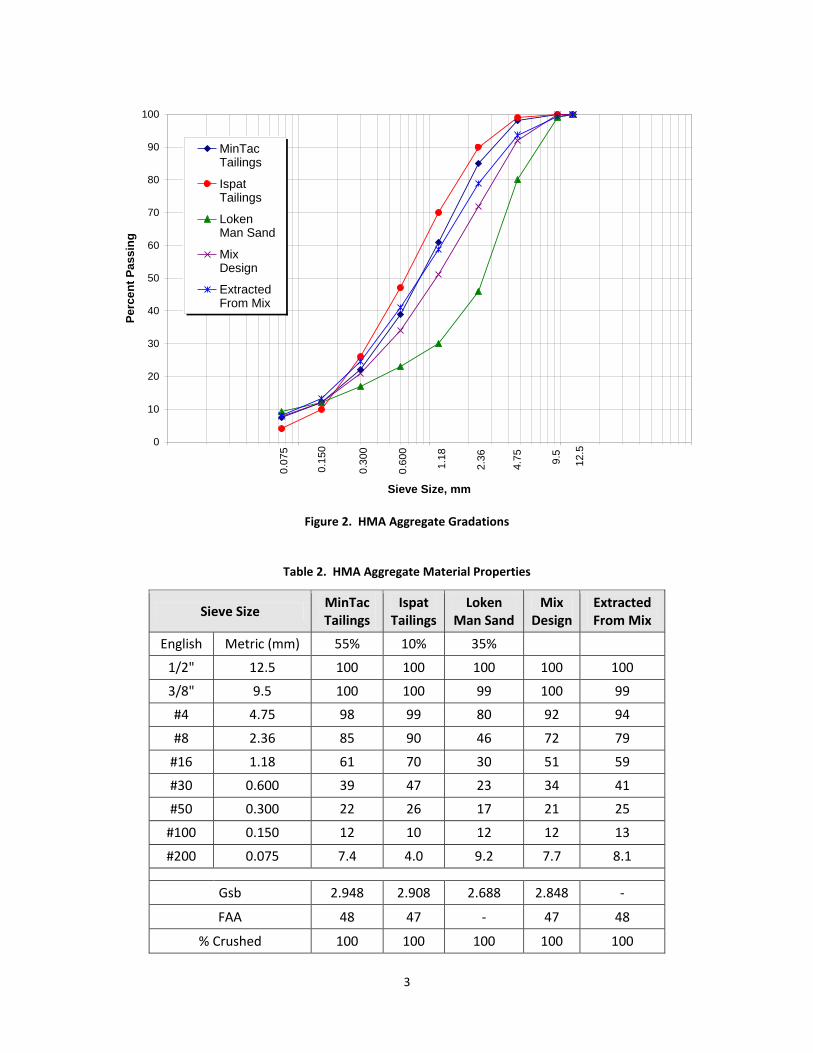
The ballast material was run though a few basic laboratory test procedures, namely gradation and specific gravity. The two tailings sources were run through these tests as well as additional tests relevant to asphalt mixtures including fine aggregate angularity (FAA) and percent crushed. These tests were run on the individual aggregates and on the combination of three aggregates used in the HMA, both during the mix design stage and extracted from actual loose mix sampled from MnROAD. The results of these tests are shown in the tables and figures below.
2
75
.0
63
.0
50
.0
37
.5
31
.5
25
.0
19
.0
16
.0
12
.5
9.5
4.7
5
0
10
20
30
40
50
60
70
80
90
100
Sieve Size, mm
Pe
rce
nt
Pa
ss
ing
Sample 1
Sample 2
Average
Figure 1. Taconite Railroad Ballast Gradation
Table 1. Taconite Ballast Material Properties (+4 Sizes)
Material Specific Gravity Absorption
Taconite Ballast 3.037 0.50%
3
12
.5
9.5
4.7
5
2.3
6
1.1
8
0.6
00
0.3
00
0.1
50
0.0
75
0
10
20
30
40
50
60
70
80
90
100
Sieve Size, mm
Pe
rce
nt
Pa
ssin
g
MinTacTailings
IspatTailings
LokenMan Sand
MixDesign
ExtractedFrom Mix
Figure 2. HMA Aggregate Gradations
Table 2. HMA Aggregate Material Properties
Sieve Size MinTac Tailings
Ispat Tailings
Loken Man Sand
Mix Design
Extracted From Mix
English Metric (mm) 55% 10% 35%
1/2" 12.5 100 100 100 100 100
3/8" 9.5 100 100 99 100 99
#4 4.75 98 99 80 92 94
#8 2.36 85 90 46 72 79
#16 1.18 61 70 30 51 59
#30 0.600 39 47 23 34 41
#50 0.300 22 26 17 21 25
#100 0.150 12 10 12 12 13
#200 0.075 7.4 4.0 9.2 7.7 8.1
Gsb 2.948 2.908 2.688 2.848 -
FAA 48 47 - 47 48
% Crushed 100 100 100 100 100

4
Asphalt Mixture Testing
The asphalt mixture from Cell 6 underwent a series of testing for both construction Quality Assurance and advanced performance. The tests were run at the Maplewood Lab and at several universities around the country. The following sections describe each test and the results that were obtained. Quality Assurance
The Mn/DOT Maplewood Lab performed an asphalt mix design with the two sources of taconite tailings along with a local manufactured sand product. Table 3 shows the laboratory test results from the mix design as well as the mixture sampled from the field. Table 4 shows the air voids from cores taken out of the roadway after placement and compaction.
Table 3. HMA Quality Assurance Test Results
Test Mix Design Field Sample
Binder Grade PG 64-22 PG 64-34
Design Gyrations 75 75
Air Voids 3.9% 4.2%
Asphalt Content 7.4% 7.5%
Voids in Mineral Aggregate (VMA) 20.3% 21.2%
Voids Filled with Asphalt (VFA) 80.8% 80.4%
Unit Weight 152.9 lb/ft3 151.3 lb/ft3
Fines/Effective AC 1.1 -
TSR 82% -
Adj. Asphalt Film Thickness 10.1 microns -
Table 4. Field Density Measurements
Core ID Gmb Gmm %
Density % Air Voids
Thickness, in
23.1 2.283
2.453
93.1 6.9 2.38
23.2C 2.322 94.7 5.3
23.2 2.336 95.2 4.8 2.50
23.3 2.196 89.5 10.5
23.3L* 2.224 90.7 9.3 2.25
23.4R* 2.302 93.8 6.2 2.00
Average 2.277 2.453 92.8 7.2 2.28
* Core taken along a longitudinal joint
5
Asphalt Pavement Analyzer
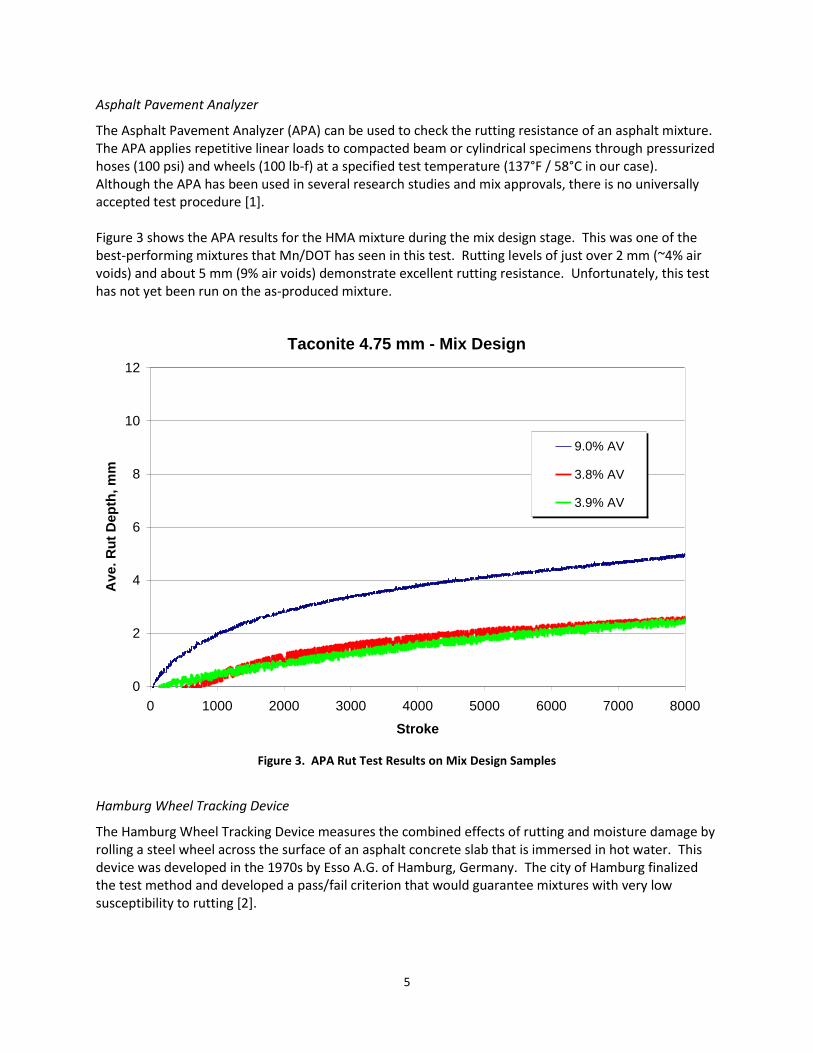
The Asphalt Pavement Analyzer (APA) can be used to check the rutting resistance of an asphalt mixture. The APA applies repetitive linear loads to compacted beam or cylindrical specimens through pressurized hoses (100 psi) and wheels (100 lb-f) at a specified test temperature (137°F / 58°C in our case). Although the APA has been used in several research studies and mix approvals, there is no universally accepted test procedure [1]. Figure 3 shows the APA results for the HMA mixture during the mix design stage. This was one of the best-performing mixtures that Mn/DOT has seen in this test. Rutting levels of just over 2 mm (~4% air voids) and about 5 mm (9% air voids) demonstrate excellent rutting resistance. Unfortunately, this test has not yet been run on the as-produced mixture.
Taconite 4.75 mm - Mix Design
0
2
4
6
8
10
12
0 1000 2000 3000 4000 5000 6000 7000 8000
Stroke
Ave
. R
ut
Dep
th,
mm
9.0% AV
3.8% AV
3.9% AV
Figure 3. APA Rut Test Results on Mix Design Samples
Hamburg Wheel Tracking Device
The Hamburg Wheel Tracking Device measures the combined effects of rutting and moisture damage by rolling a steel wheel across the surface of an asphalt concrete slab that is immersed in hot water. This device was developed in the 1970s by Esso A.G. of Hamburg, Germany. The city of Hamburg finalized the test method and developed a pass/fail criterion that would guarantee mixtures with very low susceptibility to rutting [2].

6
This device tests two asphalt slabs simultaneously with two reciprocating solid steel wheels (see Figure 4). Slabs are 320 mm long and 260 mm wide, and they can be 40, 80, or 120 mm thick. The wheels have a diameter of 203.5 mm and a width of 47 mm. The load is fixed at 685 Newtons, and the average contact stress given by the manufacturer is 203.5 MPa. Given that the contact area increases with rut depth, contact stress is variable. According to the manufacturer, a contact stress of 0.73 MPa approximates the stress produced by one rear tire of a double-axle truck. The average speed of each wheel is approximately 1.1 kilometers per hour. Each wheel travels approximately 230 mm before reversing direction, and the device operates at 53 ± 2 wheel passes per minute.
Figure 4. Hamburg Wheel Tracking Device
The 4.75 mm taconite mixture was run through the Hamburg device at the Texas Transportation Institute. The tests were run wet at 122°F (50°C). Table 5 shows the results from this test. Although this mixture performed extremely well in the APA rut tester, the Hamburg results were not particularly good, failing quicker than most of the other regular Superpave mixtures that were tested.
Table 5. Hamburg Wheel Tracking Results
Sample # Passes
to Failure Rut Depth at Failure, mm
1 6200 12.5
2 5500 12.5
3 5600 12.5
Average 5767 12.5
Semi Circular Bend (SCB)
The semi circular bend (SCB) test was developed recently at the University of Minnesota to investigate the resistance of asphalt mixtures to low temperature cracking (see Figure 5) [3]. It is based on fracture mechanics principles that have been successfully used to characterize other materials such as concrete, steel, and ceramics. The test is performed on specimens cut from gyratory cylinders or field cores, and it is used to calculate the fracture energy (area under the curve) and fracture toughness (computed from the peak load and the specimen geometry) of the materials tested as shown in Figure 6. Higher fracture energy and fracture toughness values translate to better low temperature cracking performance.

7
Figure 5. Semi Circular Bend (SCB) Test Setup
Gf
CMOD
Loa
d
Softening
Peak Load
Time to Peak Load
Gf
CMOD
Loa
d
Softening
Peak Load
Time to Peak Load
Figure 6. Schematic of Data from an SCB Test
Figure 7 shows a plot of the load vs. displacement curves from the SCB tests. Each curve represents an average of two or three test specimens. As the test temperature gets colder, the peak load increases and the total displacement decreases. Table 6 shows the average fracture energy and fracture toughness values at three test temperatures. The fracture energy was calculated by two different methods [3, 4] during the data analysis. Again as the temperature decreases, the fracture energy decreases but the fracture toughness increases. The HMA becomes more brittle at cold temperatures.

8
0.0
0.5
1.0
1.5
2.0
2.5
3.0
3.5
0 0.1 0.2 0.3 0.4 0.5 0.6 0.7 0.8 0.9
Load Line Displacement, mm
Lo
ad
, k
N
-36°C
-24°C
-12°C
Figure 7. SCB Load vs. LLD Curves
Table 6. SCB Summary Test Results
Temp(°C)
Gf (fracture energy) J/m2_Method 1
Gf (fracture energy) J/m2_Method 2
K(Ic) Stress intensity Factor MPa/m0.5
Average CV(%) Average CV(%) Average CV(%)
-12 1469.3 5.93% 1825.8 10.94% 0.424 3.28%
-24 789.4 15.94% 798.1 7.30% 0.855 8.53%
-36 326.0 8.94% 349.0 27.26% 0.918 0.11%
Indirect Tensile Creep & Strength (IDT)
The Superpave Indirect Tensile Test (IDT) is used to determine the creep compliance and indirect tensile strength of asphalt mixtures at low temperatures. These measurements can be used in performance prediction models to predict the low temperature thermal cracking potential of asphalt pavements. The IDT, shown in Figure 8, was developed under the Strategic Highway Research Program. It consists of a vertical loading device, specimen deformation measuring devices, an environmental chamber, and a data acquisition and control system.

9
Figure 8. Indirect Tensile Test Setup
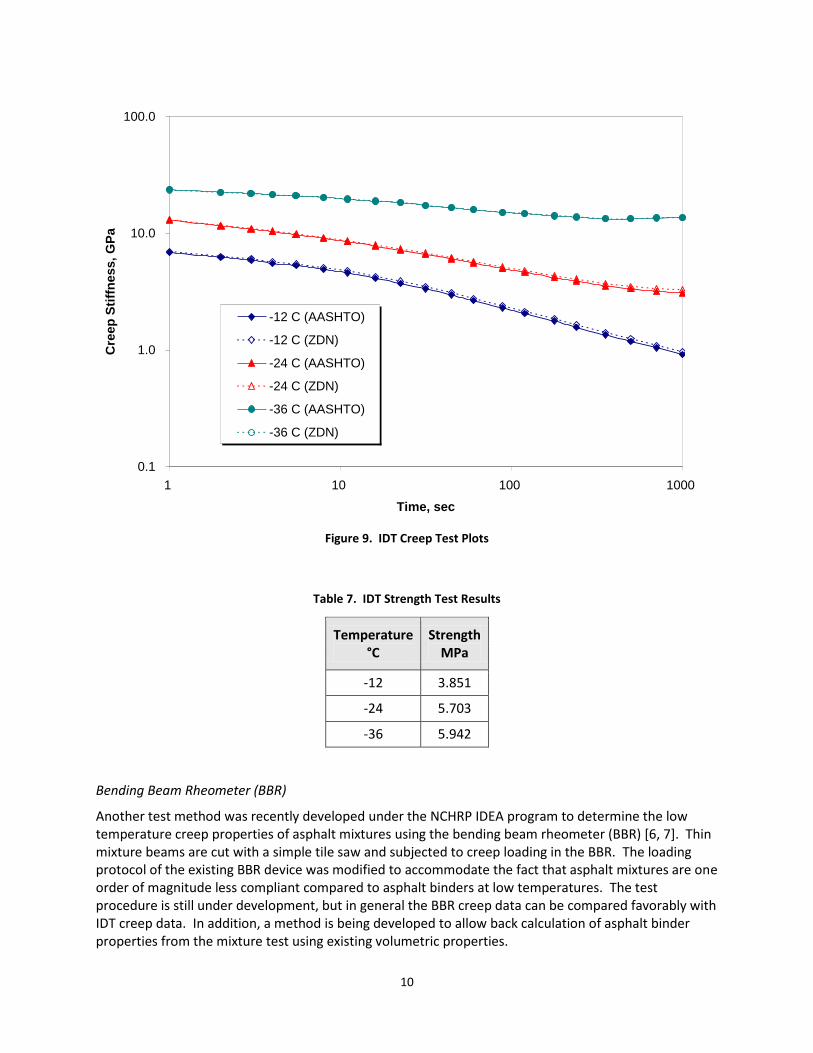
The specimens tested by the IDT can be cored from pavements or laboratory slabs, or can be prepared in the laboratory using the Superpave Gyratory Compactor. The specimens must have smooth, flat, parallel faces, to which metal "buttons" are glued. The extensometers are attached to these buttons. The standard specimen has a diameter of 150 mm and a thickness of 50 mm. Creep compliance and indirect tensile strength results at three temperatures are used for thermal cracking analyses. The testing sequence for the creep compliance test consists of cooling the specimen to the desired temperature, applying a compressive creep load for 1000 s, and measuring the time dependent deformation. Knowing the load and deformation as a function of time, the creep compliance (time dependent strain divided by the applied stress) of the material can be calculated. The indirect tensile strength of the specimen for thermal cracking analyses is determined by applying a load at a rate of 12.5 mm per minute of crosshead movement until the load starts to decrease because of specimen failure. Figure 9 and Table 7 show the IDT Creep and Strength test results, respectively. The creep stiffness was calculated by two different methods [5, 6]. The taconite mixture had the highest IDT strength values of any mixture tested from MnROAD. Data analysis is still underway. Ultimately, combining the creep and strength data will allow us to determine the critical cracking temperature, Tcr, of the mix.
10
0.1
1.0
10.0
100.0
1 10 100 1000
Time, sec
Cre
ep
Sti
ffn
es
s,
GP
a
-12 C (AASHTO)
-12 C (ZDN)
-24 C (AASHTO)
-24 C (ZDN)
-36 C (AASHTO)
-36 C (ZDN)
Figure 9. IDT Creep Test Plots
Table 7. IDT Strength Test Results
Temperature °C
Strength MPa
-12 3.851
-24 5.703
-36 5.942
Bending Beam Rheometer (BBR)
Another test method was recently developed under the NCHRP IDEA program to determine the low temperature creep properties of asphalt mixtures using the bending beam rheometer (BBR) [6, 7]. Thin mixture beams are cut with a simple tile saw and subjected to creep loading in the BBR. The loading protocol of the existing BBR device was modified to accommodate the fact that asphalt mixtures are one order of magnitude less compliant compared to asphalt binders at low temperatures. The test procedure is still under development, but in general the BBR creep data can be compared favorably with IDT creep data. In addition, a method is being developed to allow back calculation of asphalt binder properties from the mixture test using existing volumetric properties.
11
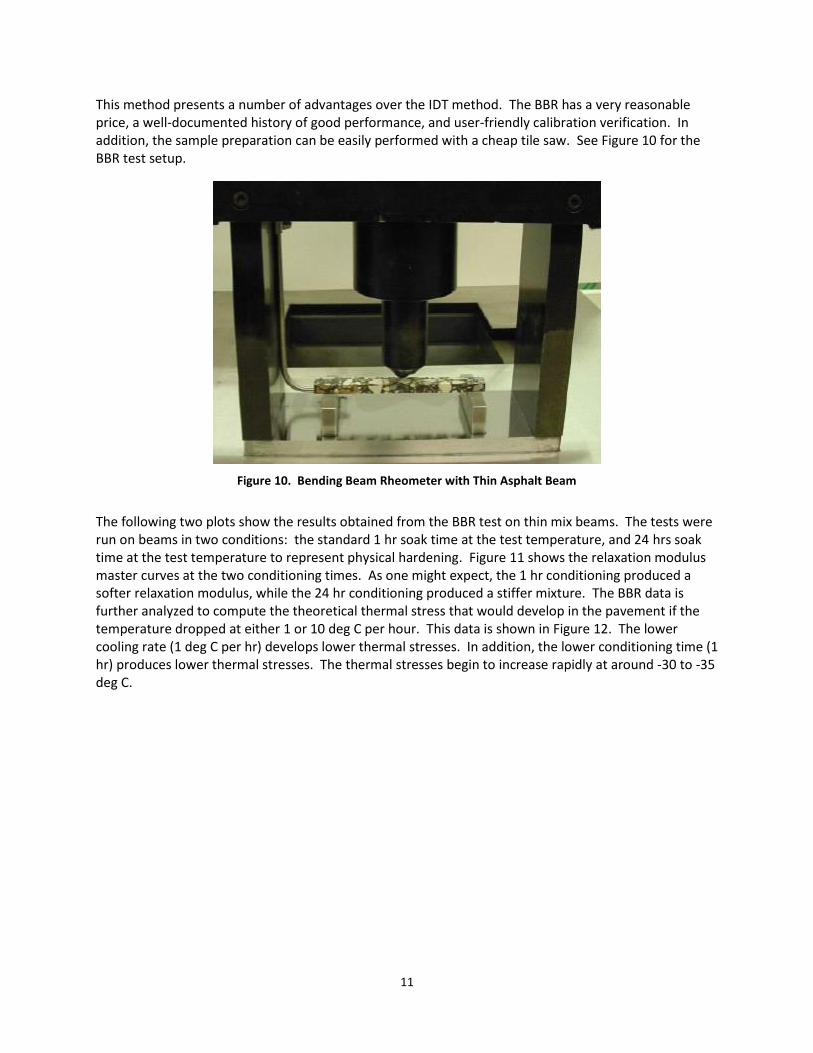
This method presents a number of advantages over the IDT method. The BBR has a very reasonable price, a well-documented history of good performance, and user-friendly calibration verification. In addition, the sample preparation can be easily performed with a cheap tile saw. See Figure 10 for the BBR test setup.
Figure 10. Bending Beam Rheometer with Thin Asphalt Beam
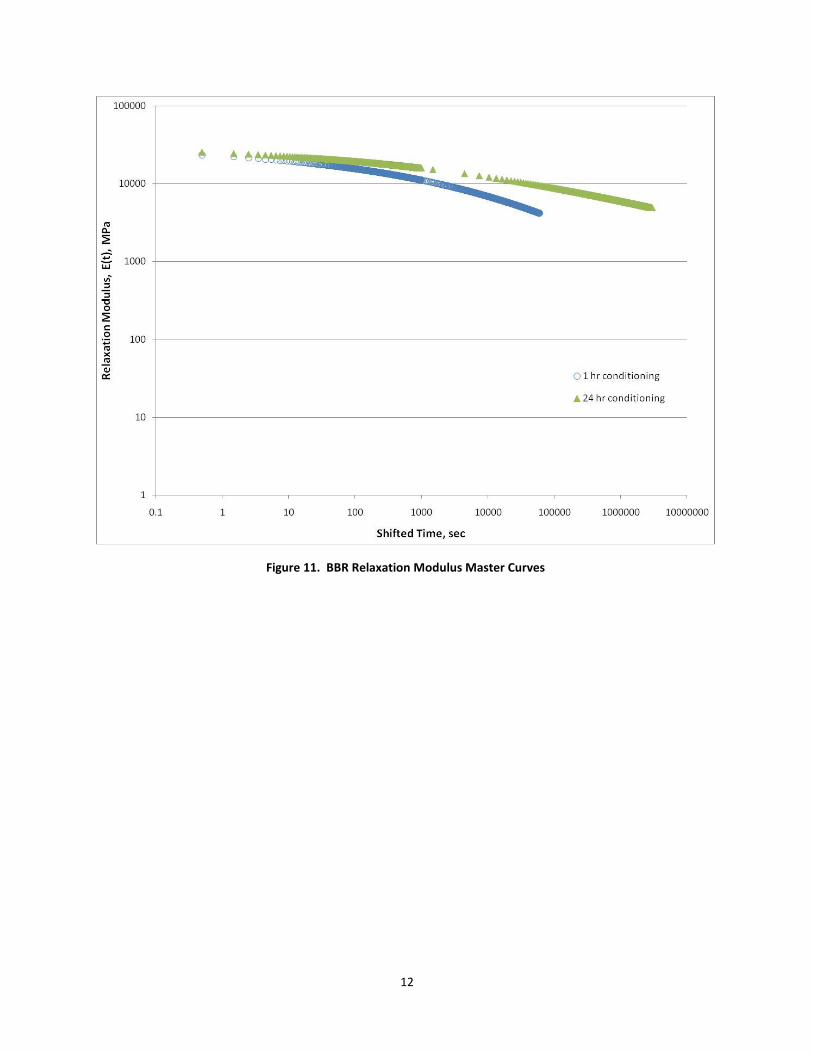
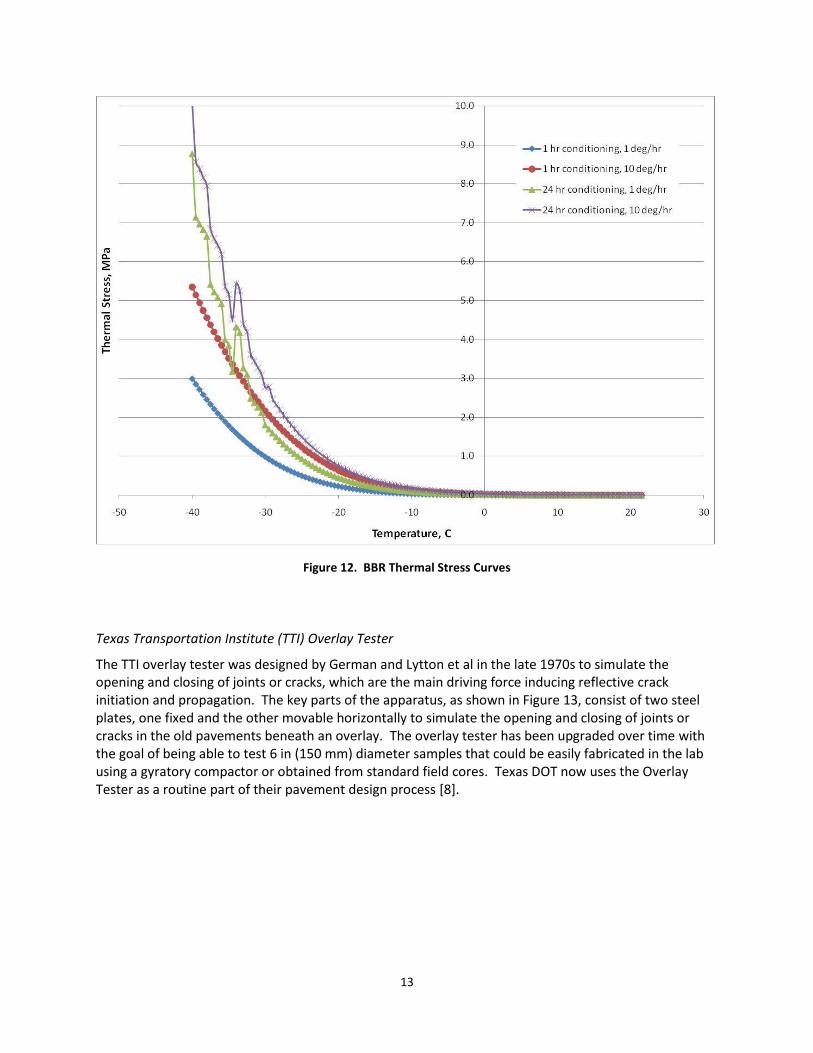
The following two plots show the results obtained from the BBR test on thin mix beams. The tests were run on beams in two conditions: the standard 1 hr soak time at the test temperature, and 24 hrs soak time at the test temperature to represent physical hardening. Figure 11 shows the relaxation modulus master curves at the two conditioning times. As one might expect, the 1 hr conditioning produced a softer relaxation modulus, while the 24 hr conditioning produced a stiffer mixture. The BBR data is further analyzed to compute the theoretical thermal stress that would develop in the pavement if the temperature dropped at either 1 or 10 deg C per hour. This data is shown in Figure 12. The lower cooling rate (1 deg C per hr) develops lower thermal stresses. In addition, the lower conditioning time (1 hr) produces lower thermal stresses. The thermal stresses begin to increase rapidly at around -30 to -35 deg C.
12
Figure 11. BBR Relaxation Modulus Master Curves
13
Texas Transportation Institute (TTI) Overlay Tester
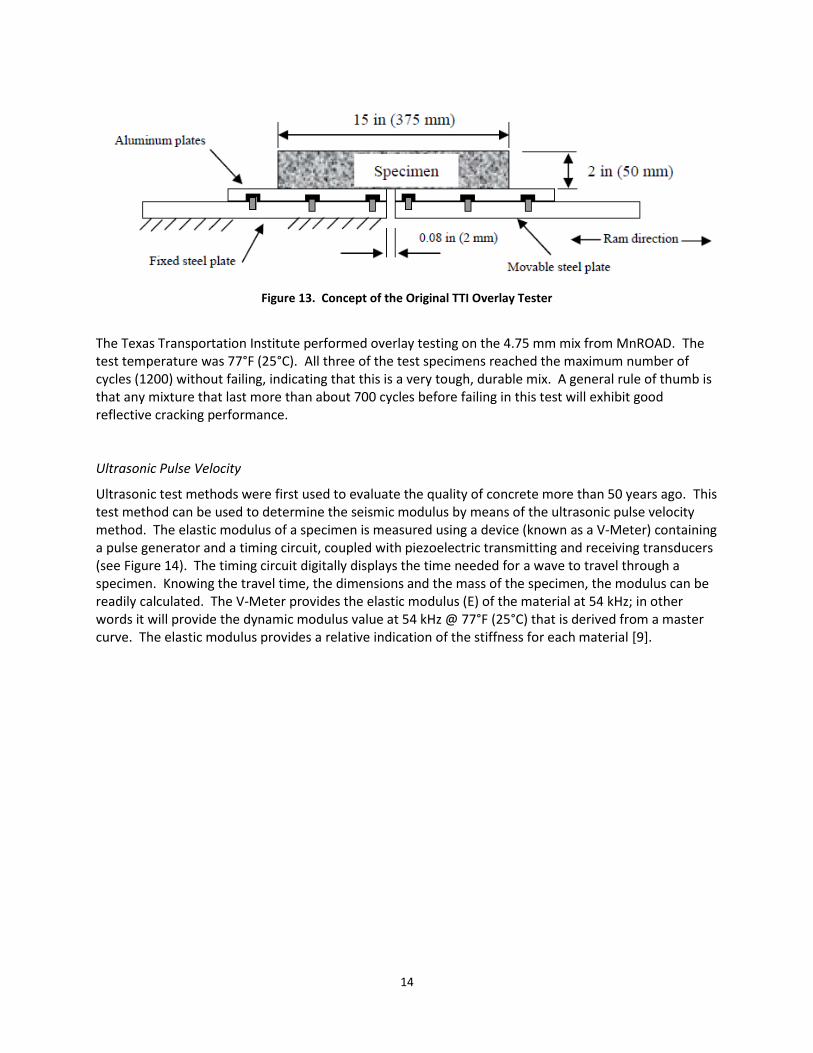
The TTI overlay tester was designed by German and Lytton et al in the late 1970s to simulate the opening and closing of joints or cracks, which are the main driving force inducing reflective crack initiation and propagation. The key parts of the apparatus, as shown in Figure 13, consist of two steel plates, one fixed and the other movable horizontally to simulate the opening and closing of joints or cracks in the old pavements beneath an overlay. The overlay tester has been upgraded over time with the goal of being able to test 6 in (150 mm) diameter samples that could be easily fabricated in the lab using a gyratory compactor or obtained from standard field cores. Texas DOT now uses the Overlay Tester as a routine part of their pavement design process [8].
Figure 12. BBR Thermal Stress Curves
14
Figure 13. Concept of the Original TTI Overlay Tester
The Texas Transportation Institute performed overlay testing on the 4.75 mm mix from MnROAD. The test temperature was 77°F (25°C). All three of the test specimens reached the maximum number of cycles (1200) without failing, indicating that this is a very tough, durable mix. A general rule of thumb is that any mixture that last more than about 700 cycles before failing in this test will exhibit good reflective cracking performance. Ultrasonic Pulse Velocity
Ultrasonic test methods were first used to evaluate the quality of concrete more than 50 years ago. This test method can be used to determine the seismic modulus by means of the ultrasonic pulse velocity method. The elastic modulus of a specimen is measured using a device (known as a V-Meter) containing a pulse generator and a timing circuit, coupled with piezoelectric transmitting and receiving transducers (see Figure 14). The timing circuit digitally displays the time needed for a wave to travel through a specimen. Knowing the travel time, the dimensions and the mass of the specimen, the modulus can be readily calculated. The V-Meter provides the elastic modulus (E) of the material at 54 kHz; in other words it will provide the dynamic modulus value at 54 kHz @ 77°F (25°C) that is derived from a master curve. The elastic modulus provides a relative indication of the stiffness for each material [9].

15
Figure 14. V-Meter Test Setup
Table 8 shows the test results from the V-Meter. Interestingly, the design modulus obtained from the test was the second-lowest of all of the MnROAD mixtures tested. It is unclear whether the test results are valid or if the taconite aggregates in the mix somehow affected the test results.
Table 8. Ultrasonic Pulse Velocity Test Data
Sample ID Design Modulus
from V-Meter, ksi Air Voids, %
HAM-A 551 7.1
HAM-B 539 7.1
HAM-C 530 7.1
HAM-D 542 6.9
HAM-E 523 7.3
HAM-F 533 7.0
OL-A 473 9.4
OL-B 481 9.1
OL-C 484 9.0
Average 517 7.8
Asphalt Binder Cracking Device
The Asphalt Binder Cracking Device (ABCD) has recently been developed at Ohio University to determine the low temperature cracking potential of an asphalt binders. ABCD is a simple test method whose operating principle is based on the differential thermal contraction between the metal ring and an asphalt binder placed outside of the ring. As the temperature is lowered, the test binder shrinks more
16
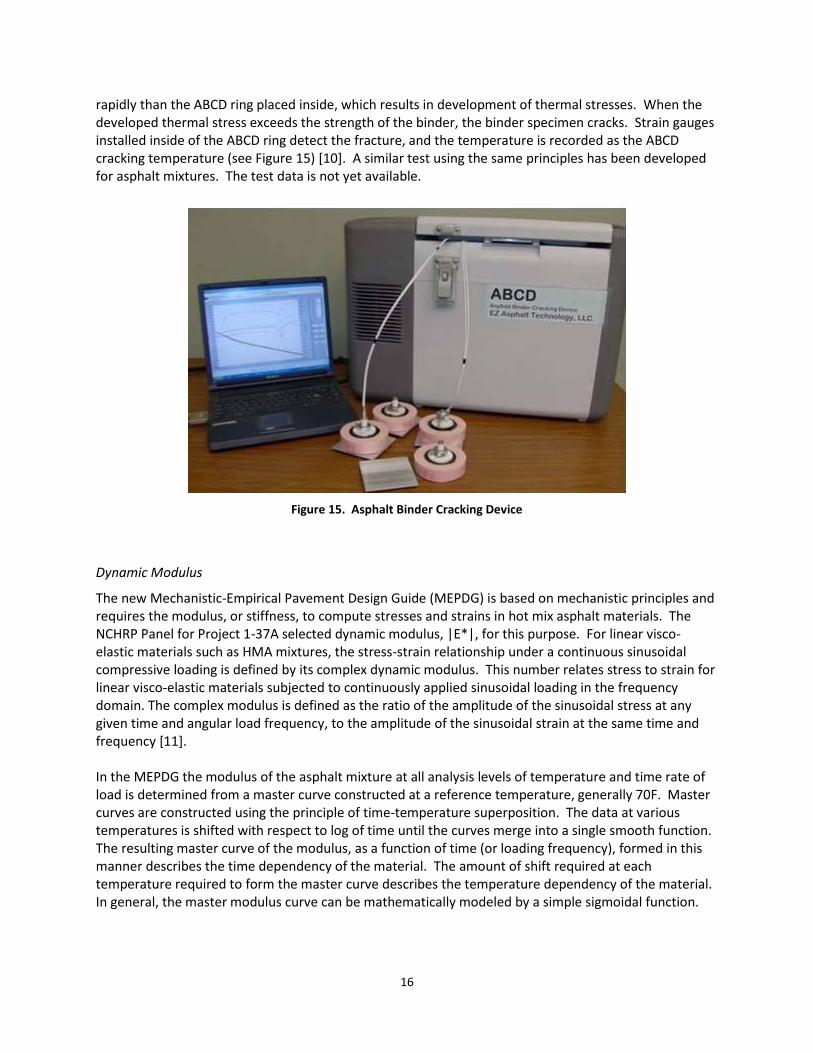
rapidly than the ABCD ring placed inside, which results in development of thermal stresses. When the developed thermal stress exceeds the strength of the binder, the binder specimen cracks. Strain gauges installed inside of the ABCD ring detect the fracture, and the temperature is recorded as the ABCD cracking temperature (see Figure 15) [10]. A similar test using the same principles has been developed for asphalt mixtures. The test data is not yet available.
Figure 15. Asphalt Binder Cracking Device
Dynamic Modulus
The new Mechanistic-Empirical Pavement Design Guide (MEPDG) is based on mechanistic principles and requires the modulus, or stiffness, to compute stresses and strains in hot mix asphalt materials. The NCHRP Panel for Project 1-37A selected dynamic modulus, |E*|, for this purpose. For linear visco-elastic materials such as HMA mixtures, the stress-strain relationship under a continuous sinusoidal compressive loading is defined by its complex dynamic modulus. This number relates stress to strain for linear visco-elastic materials subjected to continuously applied sinusoidal loading in the frequency domain. The complex modulus is defined as the ratio of the amplitude of the sinusoidal stress at any given time and angular load frequency, to the amplitude of the sinusoidal strain at the same time and frequency [11]. In the MEPDG the modulus of the asphalt mixture at all analysis levels of temperature and time rate of load is determined from a master curve constructed at a reference temperature, generally 70F. Master curves are constructed using the principle of time-temperature superposition. The data at various temperatures is shifted with respect to log of time until the curves merge into a single smooth function. The resulting master curve of the modulus, as a function of time (or loading frequency), formed in this manner describes the time dependency of the material. The amount of shift required at each temperature required to form the master curve describes the temperature dependency of the material. In general, the master modulus curve can be mathematically modeled by a simple sigmoidal function.

17
Materials have been collected to perform dynamic modulus tests at the Maplewood Lab. However, no test results are available at this time. Modified Lottman Test (AASHTO T 283)
Moisture susceptibility is a measure of how resistant an HMA mixture's internal asphalt binder-to-aggregate bond (cohesion) is to weakening in the presence of water. This weakening, if severe enough, can result in stripping and further pavement deterioration. In the modified Lottman test (AASHTO T 2839 two sets of HMA samples are subjected to an indirect tensile test. One set is conditioned by partial vacuum saturation with water, soaking in water for 24 hours and an optional freeze-thaw cycle. The other set is used as a control. The ratio of the average split tensile strength of the conditioned samples over the average indirect tensile strength of the unconditioned (control) samples is reported as the tensile strength ratio (TSR). Figure 16 shows the TSR test setup [12].
Figure 16. AASHTO T 283 Test Setup
Materials have been sampled for the modified Lottman test. However, no test results are available at this time.
18
Additional Tests
Additional HMA samples have been sent to the National Center for Asphalt Technology (NCAT) and the University of California Pavement Research Center for further testing. These groups will perform tests to characterize rutting potential, fatigue, stiffness, and permeability of the 4.75 mm mixture, among other material properties. The test data is not available at this time. Summary
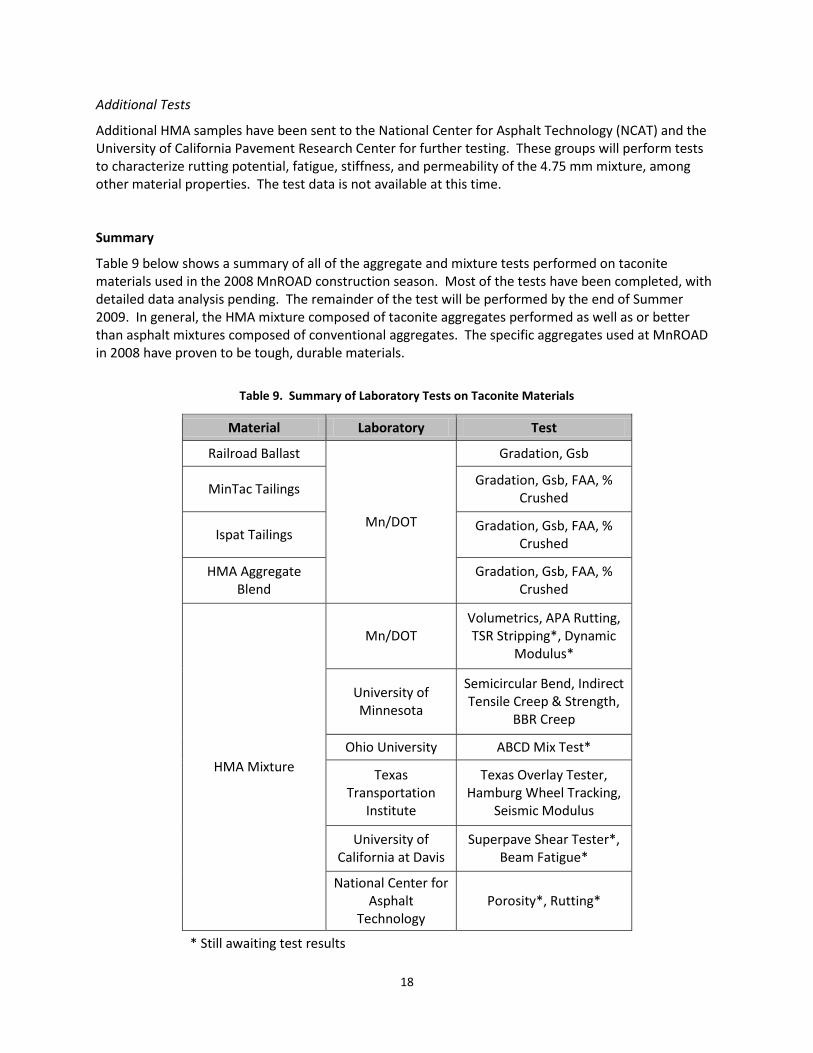
Table 9 below shows a summary of all of the aggregate and mixture tests performed on taconite materials used in the 2008 MnROAD construction season. Most of the tests have been completed, with detailed data analysis pending. The remainder of the test will be performed by the end of Summer 2009. In general, the HMA mixture composed of taconite aggregates performed as well as or better than asphalt mixtures composed of conventional aggregates. The specific aggregates used at MnROAD in 2008 have proven to be tough, durable materials.
Table 9. Summary of Laboratory Tests on Taconite Materials
Material Laboratory Test
Railroad Ballast
Mn/DOT
Gradation, Gsb
MinTac Tailings Gradation, Gsb, FAA, %
Crushed
Ispat Tailings Gradation, Gsb, FAA, %
Crushed
HMA Aggregate Blend
Gradation, Gsb, FAA, % Crushed
HMA Mixture
Mn/DOT Volumetrics, APA Rutting, TSR Stripping*, Dynamic
Modulus*
University of Minnesota
Semicircular Bend, Indirect Tensile Creep & Strength,
BBR Creep
Ohio University ABCD Mix Test*
Texas Transportation
Institute
Texas Overlay Tester, Hamburg Wheel Tracking,
Seismic Modulus
University of California at Davis
Superpave Shear Tester*, Beam Fatigue*
National Center for Asphalt
Technology Porosity*, Rutting*
* Still awaiting test results
19
References
1. Maupin, G. W., and D. W. Mokarem, Investigation of Proposed AASHTO Rut Test Procedure Using the Asphalt Pavement Analyzer, Virginia Transportation Research Council, Final Report VTRC 07-R11, October 2006.
2. <http://www.tfhrc.gov/pubrds/julaug98/evaluating.htm> Accessed June 25, 2009. 3. X. Li, Investigation of the Fracture Resistance of Asphalt Mixtures at Low Temperatures with a
Semi Circular Bend (SCB) Test, PhD Thesis, University of Minnesota, 2005. 4. M. Marasteanu et al, Investigation of Low Temperature Cracking in Asphalt Pavements-A
Transportation Pooled Fund Study, Minnesota Department of Transportation, Final Report MN/RC 2007-43, October 2007.
5. American Association of State Highway and Transportation Officials (AASHTO), T 322: Standard Method of Test for Determining the Creep Compliance and Strength of Hot-Mix Asphalt (HMA) Using the Indirect Tensile Test Device, Standard Specifications for Transportation Materials and Methods of Sampling and Testing, Part 2B: Tests, 26th Edition, 2007.
6. A. M. Zofka, Investigation of Asphalt Concrete Creep Behavior Using 3-Point Bending Test, PhD Thesis, University of Minnesota, July 2007.
7. <http://www.trb.org/TRBNet/ProjectDisplay.asp?ProjectID=2589> Accessed June 25, 2009. 8. Zhou, F., and T. Scullion, Overlay Tester: A Rapid Performance Related Crack Resistance Test,
Texas Transportation Institute, Report No. FHWA/TX-05/0-4467-2, October 2004. 9. S. Nazarian, Implementation of Seismic-Based Quality Management of Flexible Pavements, Texas
Department of Transportation, Report No. FHWA/TX-05/5-1735-01-1, February 2006. 10. S. Kim, “Direct Measurement of Asphalt Binder Thermal Cracking,” ASCE Journal of Materials in
Civil Engineering, Vol. 17, No. 6, December 2005 11. Dougan, C. E., Stephens, J. E. Mahoney, J., and G. Hansen, E* – Dynamic Modulus Test Protocol –
Problems and Solutions, Connecticut Department of Transportation, Report No. CT-SPR-0003084-F-03-3, March 2003.
12. <http://pavementinteractive.org/index.php?title=Moisture_Susceptibility> Accessed June 28, 2009.