liberation characteristics of taconite plant...
TRANSCRIPT
NRRI/
TR-2
007/12 LIBERATION CHARACTERISTICS OF
TACONITE PLANT FEEDS
By
Salih Ersayin July 2007 Technical Report NRRI/TR-2007/12 CMRL/TR-07-06 Natural Resources Research Institute University of Minnesota Duluth 5013 Miller Trunk Highway Duluth, MN 55811-1442 Coleraine Minerals Research Laboratory One Gayley Avenue PO Box 188 Coleraine, MN 55722
Recommended Citation Ersayin, S., 2007, Liberation characteristics of taconite plant feeds: University of Minnesota Duluth, Natural Resources Research Institute, Coleraine Minerals Research Laboratory, Technical Report NRRI/TR-2007/12, 31 p. Natural Resources Research Institute University of Minnesota, Duluth 5013 Miller Trunk Highway Duluth, MN 55811-1442 Telephone: 218-720-4272 Fax: 218-720-4329 e-mail: [email protected] Web site: http://www.nrri.umn.edu/egg ©2012 by the Regents of the University of Minnesota All rights reserved. The University of Minnesota is committed to the policy that all persons shall have equal access to its programs, facilities, and employment without regard to race, color, creed, religion, national origin, sex, age, marital status, disability, public assistance status, veteran status, or sexual orientation.
This publication is accessible from the home page of the Coleraine Minerals Research Laboratory or Economic Geology Group of the Center for Applied Research and Technology Development at the Natural Resources Research Institute, University of Minnesota, Duluth (www.nrri.umn.edu/cartd/cmrl or www.nrri.umn.edu/egg) as a PDF file readable with Adobe Acrobat 6.0.
Date of release: March 2012
1
Liberation Characteristics of Taconite Plant Feeds 1. INTRODUCTION Following the incorporation of the integrated grinding/liberation model and unit operation models compatible with such input data into the model library of Usim Pac, the Concentrator Modeling Center gained the capability to carry out simulations using liberation-based models. Such a move is expected to substantially improve the accuracy of simulations and provide data to plant operators to make more conscientious modifications in their plants. This requires liberation characteristics of a given ore/blend as an input. This project would generate a database for this purpose for three taconite mines on the Iron Range. The database would be useful for troubleshooting when a plant begins to have problems and a change in liberation characteristics is suspected. Under such circumstances, a repeat of a simple set of tests could identify any change in liberation characteristics. The database, combined with plant sampling data, could be used for defining optimum operating conditions for the new ore type. Simulations could then also be used to determine the optimum combinations of ore blends. The database would also serve as a benchmark for future variations in liberation characteristics. Three mines on the Iron Range, representing a variety of liberation characteristics, were selected for the study. Several ore horizons were sampled separately, and liberation characteristics of each ore horizon and/or typical blends processed by a particular plant were determined following a standard laboratory procedure. Primary mill discharge and final magnetic concentrate streams were also sampled while plants were processing one of the blends/ore types. Ore horizon and blend samples went through a standard size reduction process, while primary mill discharge and final magnetic concentrate samples were used as is. Size structures of samples were determined and size by size Davis tube tests were performed. Davis tube test products were analyzed for Satmagan iron. Data were then used for determination of liberation parameters, including effective grain size, volumetric grade, and dilution (% barren rock in feed). Liberation parameters calculated from ore horizons were compared to those from blends and primary mill discharges to determine how they could be correlated. The existence of a correlation between liberation characteristics and final magnetic concentrate was also examined. The names of the three mines and their respective ore horizons were kept confidential in this report. Separate reports including the actual names of respective ore horizons and blends were sent to each mine. The extent of test work
2
and number of samples for each mine differed from one to another. The objectives were to generate data that could be useful for plants, as well as obtaining a database; examining effectiveness of the liberation characterization test work and data analysis procedure; evaluating the correlation between the feed, primary mill discharge, and final concentrate liberation characteristics. 2. TEST PROCEDURE A standard test procedure was applied to primary mill feed and ore horizons/blends samples to prepare them for size by size Davis tube tests. This procedure involved gradual crushing down to 100% passing ¼-inch using a combination of jaw and roll crushers by screening fines in between the crushing stages. A test sample of 1000g was taken from the crushed ore, and was then ground wet for 5 minutes in an 8 by 9½-inch laboratory rod mill with 8423g of seasoned rod charge and three lifter bars each ½-inch high. The maximum rod diameter was ¾-inch, and grinding was performed at 60% solids by weight. A grinding time of 5 minutes was selected after initial testing to obtain a size structure similar to primary mill discharges in a typical taconite plant. Primary mill discharge and final magnetic concentrate samples were used without any further size reduction. Size by size Davis tube tests were performed for the following size fractions: +4, -4/8, -8/14, -14/28, -28/48, -48/100, -100/150, -150/200, -200/270, -270/400, -400/500 and -500 mesh. Tests on finisher concentrates were limited to sizes below 150 mesh. Following laboratory screening, approximately 10g of sample was taken from each size fraction for Davis tube tests. Davis tube tests were performed at standardized operating conditions: 2 amp of magnetic field; 0.4 gpm of water; 72 oscillation/min; and 10 min test duration. Only concentrate samples were collected. Their dry weight and Satmagan iron contents were determined. Since the liberation model is based on volumetric composition, specific gravities of magnetite and combined gangue minerals were also needed for the calculation of liberation characteristics. For this purpose, specific gravities of each sample, and their head Satmagan iron grades were also determined. An air pycnometer was used for specific gravity measurements. Based on previous test data, magnetite was assumed to have a specific gravity of 5.2 g/cm3 for all ore samples. Based on this assumption, the specific gravity of combined gangue minerals was calculated

3
for each ore sample using the measured Satmagan iron content and specific gravity of each ore sample. 3. LIBERATION MODEL AND PARAMETER DETERMINATION Details of the liberation model that was incorporated into Usim Pac are given elsewhere (Wiegel, 2006). It is known as the Gaudin random liberation model (GRLM), and is based on a concept of random breakage and liberation of particles in a cubic matrix. The current form of the model has three parameters; namely, effective mineral grain size, volumetric grade, and dilution ratio. Effective grain size refers to particle size below which a portion of the valuable mineral particles appears to be liberated. This parameter is determined by model fit to test data, and it was shown that it correlated well with the microscopic measurement of grain sizes (Wiegel, 1974). Dilution ratio is the proportion of barren rock in ore formation or in feed to a plant. This parameter could also be determined through test data. Liberation of a portion of gangue minerals at very coarse sizes is an indicator of existence of barren rocks in the ore. Volumetric grade refers to volumetric ratio of magnetite within ore, which excludes barren rocks or dilution in its calculation. Size by size Davis tube tests separate the free gangue in each size class. As a result of gangue liberation, the magnetite (Satmagan iron) grade of Davis tube concentrates increases as the particle size becomes finer. Data generated by such test work are then used to calculate the liberation parameters for a given ore. Parameter calculation is a model fitting procedure to data showing the variation of Satmagan iron content in Davis tube concentrates with particle size. According to the model, the fraction of liberated gangue particles for a given particle size fraction, PA, can be calculated by using the following equation:
323 )2(3)2).(1(2)1)(2(2)1(3 .).1(.3.)1(.3.)1( ++++++ +−+−+−= tA
ttA
ttA
tA VVVVPA εεεεεε
where, t : largest integer in αβ / β : particle size α : effective grain size ε : fractional remainder in t−)/( αβ
AV : volumetric grade of gangue
4
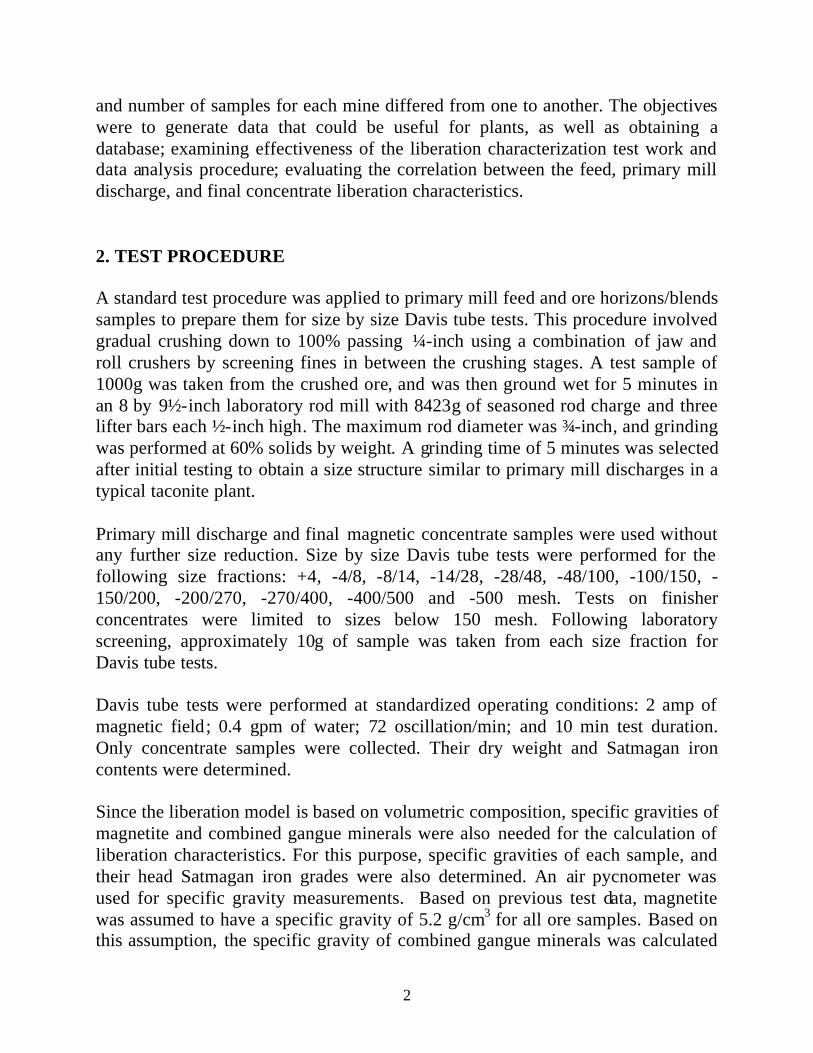
Then, Satmagan iron grade, iGM , (%) of a Davis tube concentrate for a size fraction of i is calculated by:
)1/(/).(1/(36.72 ABAiAi VPAVGM −−+= ρρ where,
BA ρρ , : specific gravities of gangue and magnetite respectively Typical Davis tube data and fit of the model are shown in Figure 1. The shape of the curve, particularly the point at which Satmagan iron grade of the Davis tube concentrate starts to increase with decreasing particle size, defines the effective grain size, while volumetric grade is determined from the plateau section on the right hand side. Dilution is calculated as the proportion of barren ore required to match the calculated volumetric grade with measured volumetric grade of the ore. As expected, calculated volumetric grade is always either equal to or higher than measured volumetric grade. The two being equal means there is no dilution nor any barren sections within the ore sample.
0
10
20
30
40
50
60
70
80
10 100 1000 10000
Particle Size (micron)
% M
ag F
e in
DT
Con
c.
Model
Actual
Figure 1. A typical set of liberation test data and fit of the liberation model.
5
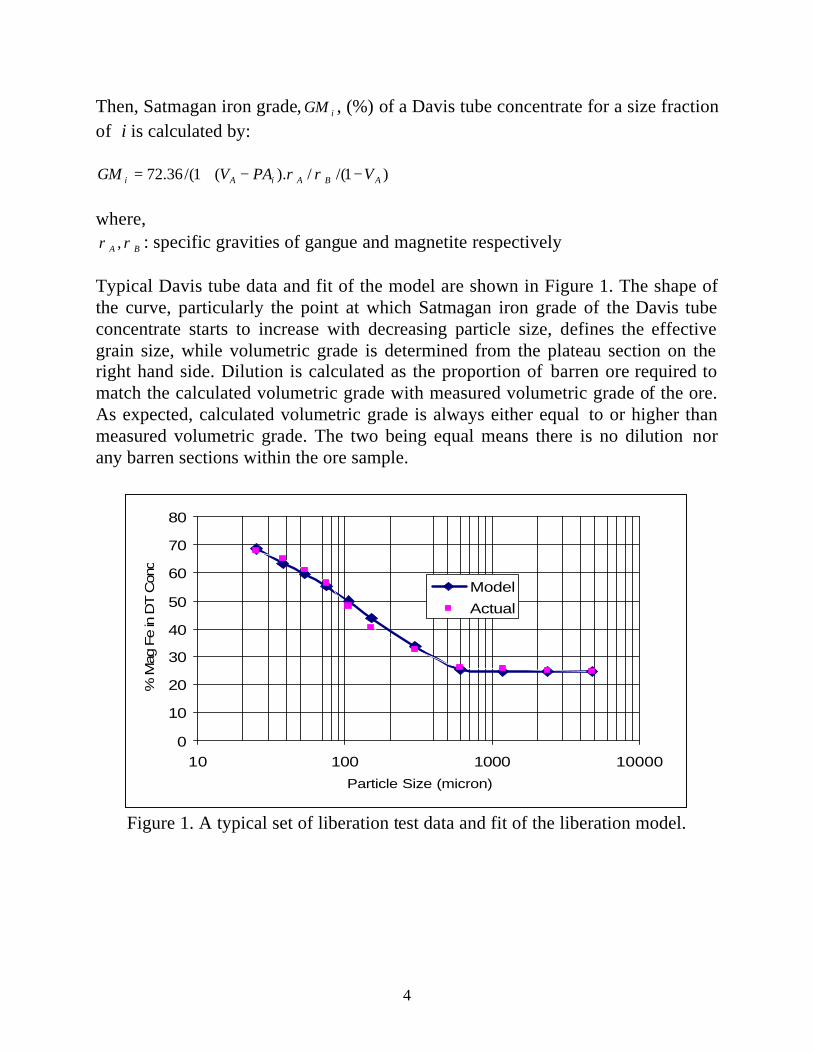
4. RESULTS As noted above, the test work included samples from three different mines and plants. Results obtained from each mine are separately presented below. Due to confidentiality of data, these mines are referred as Site 1, 2 and 3. 4.1 Site 1 The most extensive sampling was carried out at this mine site. Apart from plant feed and primary mill discharge samples for two different blends, 4 different ore horizons (OH) were sampled. Two different samples were taken from one of the ore horizons (OH-3A and OH-3B) representing different sections of the same ore body. Using ore horizon samples, artificial ore blends (AOB) were prepared to simulate two different ore blends fed to the plant (Blend 1 and 2). Results of Davis tube tests are presented in Appendix 1, and summarized in Figure 2. Calculated liberation parameters are presented in Table 1. Data indicate that liberation characteristics show large fluctuations within the same ore body. Effective grain size varied from 190 to 440 micron, while a smaller variation of 21.1 to 26.5% in volumetric grade was observed.
0.00
20.00
40.00
60.00
80.00
10 100 1000 10000
Particle Size (micron)
% M
ag F
e in
DT
Con
c. OH-1
OH-2
OH-3A
OH-3B
OH-4
AOB-B1
AOB-B2
Plant-B1 PMF
Plant-B1 PMD
Plant-B2 PMF
Plant-B2 PMD
Figure 2. Results of liberation characterization tests on samples from Site 1.
6
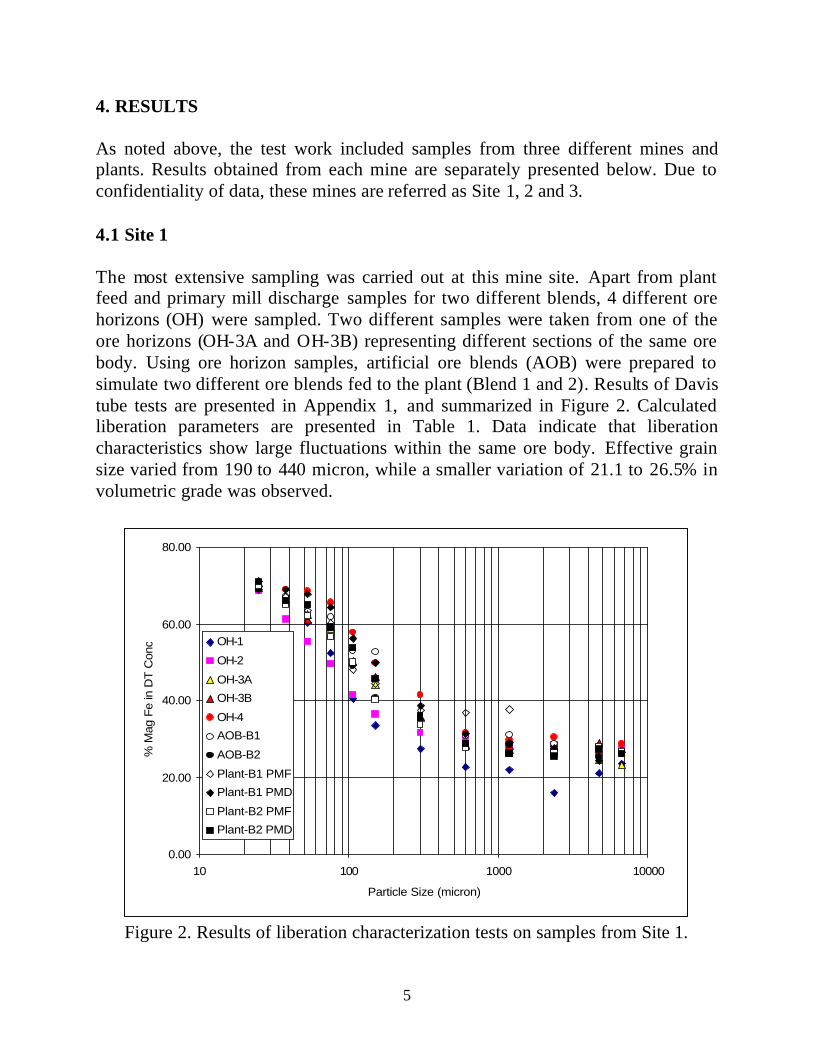
Table 1. Liberation model parameters of the samples taken from Site 1
Sample Effective Grain Size (micron)
Volumetric Grade
(%)
Dilution (%)
Ore Horizon 1 255 21.1 none Ore Horizon 2 190 26.2 none Ore Horizon 3A 310 22.5 5.0 Ore Horizon 3B 300 26.5 23.3 Ore Horizon 4 440 26.0 10.6 AOB- Blend 1 (30% OH2 + 70% OH4) 360 26.5 8.7 AOB- Blend 2 (30% OH1 + 70% OH3B) 300 26.0 20.7 Pri. Mill Feed: Blend 1 360 26.0 8.5 Pri. Mill Discharge: Blend 1 400 26.0 8.5 Pri. Mill Feed: Blend 2 300 24.0 7.1 Pri. Mill Discharge: Blend 2 330 24.0 8.9
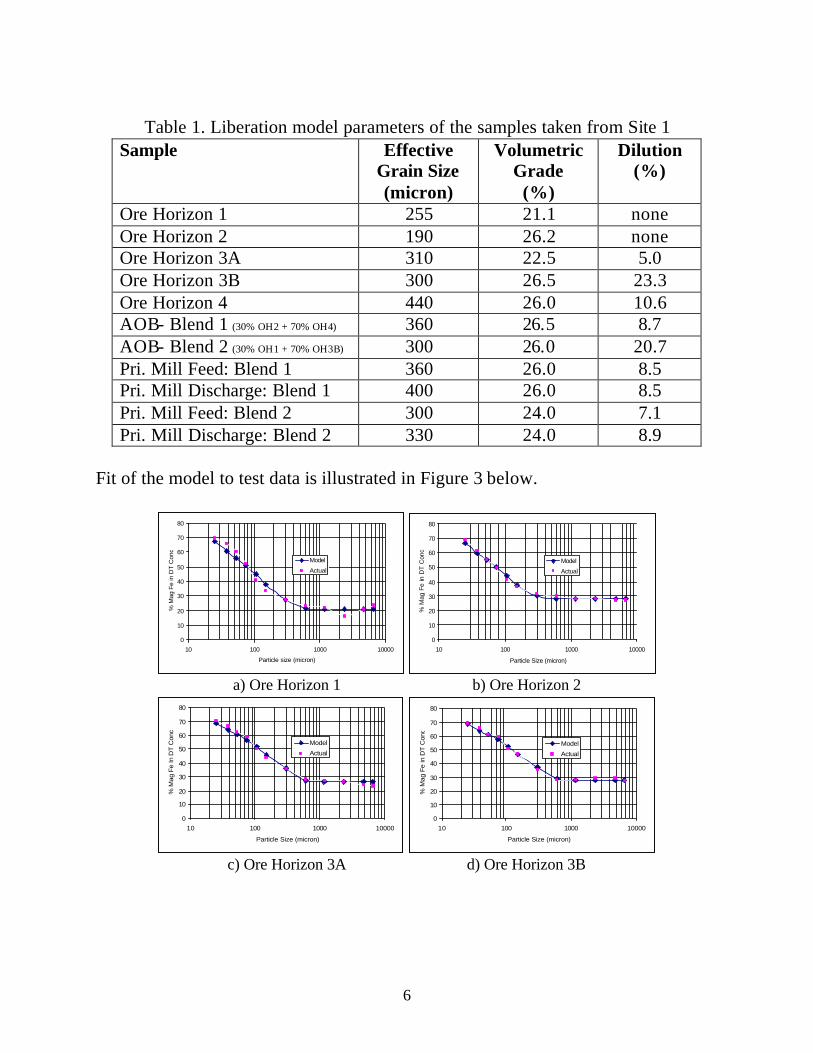
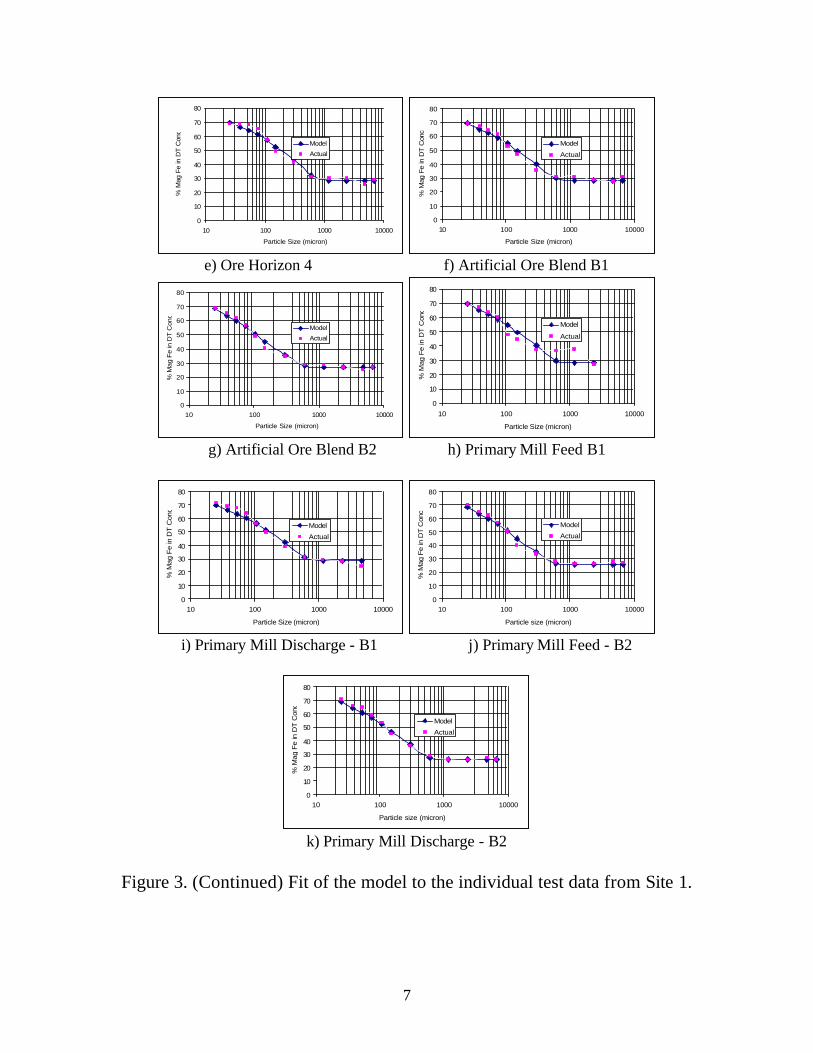
Fit of the model to test data is illustrated in Figure 3 below.
0
10
20
30
40
50
60
70
80
10 100 1000 10000
Particle size (micron)
% M
ag F
e in
DT
Con
c.
Model
Actual
0
10
20
30
40
50
60
70
80
10 100 1000 10000
Particle Size (micron)
% M
ag F
e in
DT
Con
c.
Model
Actual
a) Ore Horizon 1 b) Ore Horizon 2
0
10
20
30
40
50
60
70
80
10 100 1000 10000
Particle Size (micron)
% M
ag F
e In
DT
Con
c.
Model
Actual
0
10
20
30
40
50
60
70
80
10 100 1000 10000
Particle Size (micron)
% M
ag F
e in
DT
Con
c.
Model
Actual
c) Ore Horizon 3A d) Ore Horizon 3B
7
0
10
20
30
40
50
60
70
80
10 100 1000 10000
Particle Size (micron)
% M
ag F
e in
DT
Con
c.
Model
Actual
0
10
20
30
40
50
60
70
80
10 100 1000 10000
Particle Size (micron)
% M
ag F
e in
DT
Con
c.
Model
Actual
e) Ore Horizon 4 f) Artificial Ore Blend B1
0
10
20
30
40
50
60
70
80
10 100 1000 10000
Particle Size (micron)
% M
ag F
e in
DT
Con
c.
Model
Actual
0
10
20
30
40
50
60
70
80
10 100 1000 10000
Particle Size (micron) %
Mag
Fe
in D
T C
onc.
Model
Actual
g) Artificial Ore Blend B2 h) Primary Mill Feed B1
0
10
20
30
40
50
60
70
80
10 100 1000 10000
Particle Size (micron)
% M
ag F
e in
DT
Con
c.
Model
Actual
0
10
20
30
40
50
60
70
80
10 100 1000 10000
Particle size (micron)
% M
ag F
e in
DT
Con
c.
Model
Actual
i) Primary Mill Discharge - B1 j) Primary Mill Feed - B2
0
10
20
30
40
50
60
70
80
10 100 1000 10000
Particle size (micron)
% M
ag F
e in
DT
Con
c.
Model
Actual
k) Primary Mill Discharge - B2
Figure 3. (Continued) Fit of the model to the individual test data from Site 1.
8
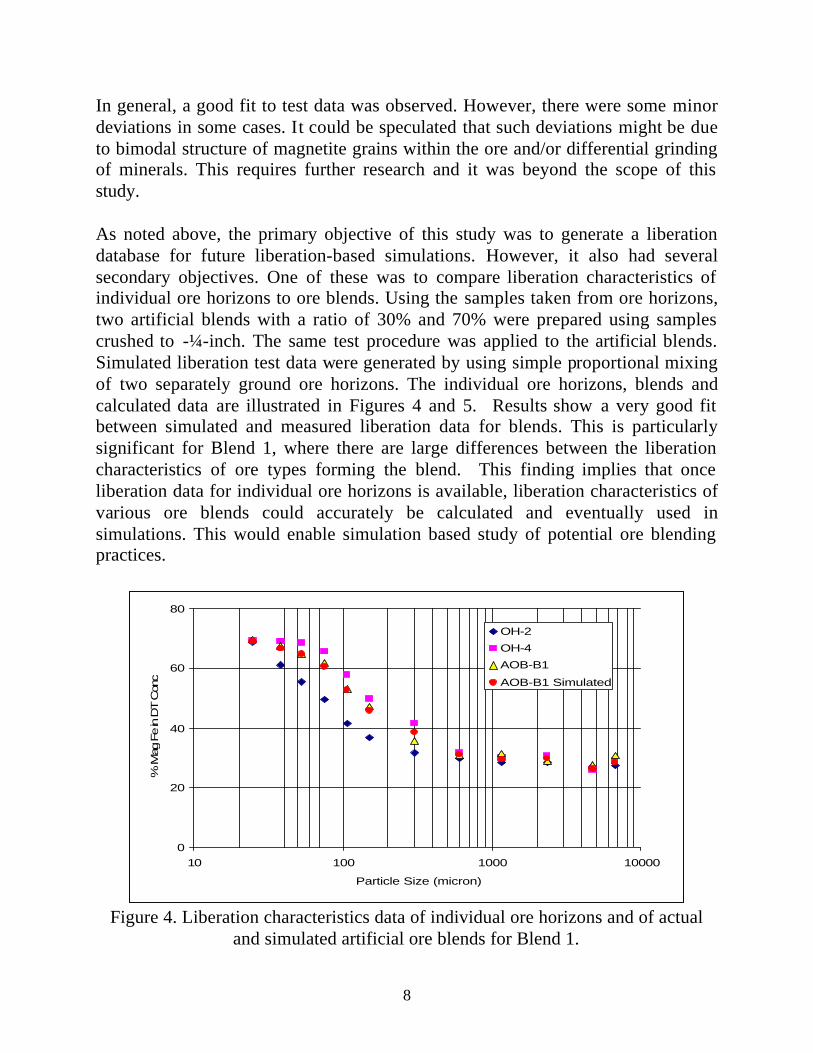
In general, a good fit to test data was observed. However, there were some minor deviations in some cases. It could be speculated that such deviations might be due to bimodal structure of magnetite grains within the ore and/or differential grinding of minerals. This requires further research and it was beyond the scope of this study. As noted above, the primary objective of this study was to generate a liberation database for future liberation-based simulations. However, it also had several secondary objectives. One of these was to compare liberation characteristics of individual ore horizons to ore blends. Using the samples taken from ore horizons, two artificial blends with a ratio of 30% and 70% were prepared using samples crushed to -¼-inch. The same test procedure was applied to the artificial blends. Simulated liberation test data were generated by using simple proportional mixing of two separately ground ore horizons. The individual ore horizons, blends and calculated data are illustrated in Figures 4 and 5. Results show a very good fit between simulated and measured liberation data for blends. This is particularly significant for Blend 1, where there are large differences between the liberation characteristics of ore types forming the blend. This finding implies that once liberation data for individual ore horizons is available, liberation characteristics of various ore blends could accurately be calculated and eventually used in simulations. This would enable simulation based study of potential ore blending practices.
0
20
40
60
80
10 100 1000 10000
Particle Size (micron)
% M
ag F
e in D
T C
onc.
OH-2
OH-4
AOB-B1
AOB-B1 Simulated
Figure 4. Liberation characteristics data of individual ore horizons and of actual
and simulated artificial ore blends for Blend 1.
9
0
20
40
60
80
10 100 1000 10000
Particle Size (micron)
% M
ag F
e in D
T C
onc.
OH-1
OH-4
AOB-B2
AOB-B2 Simulated
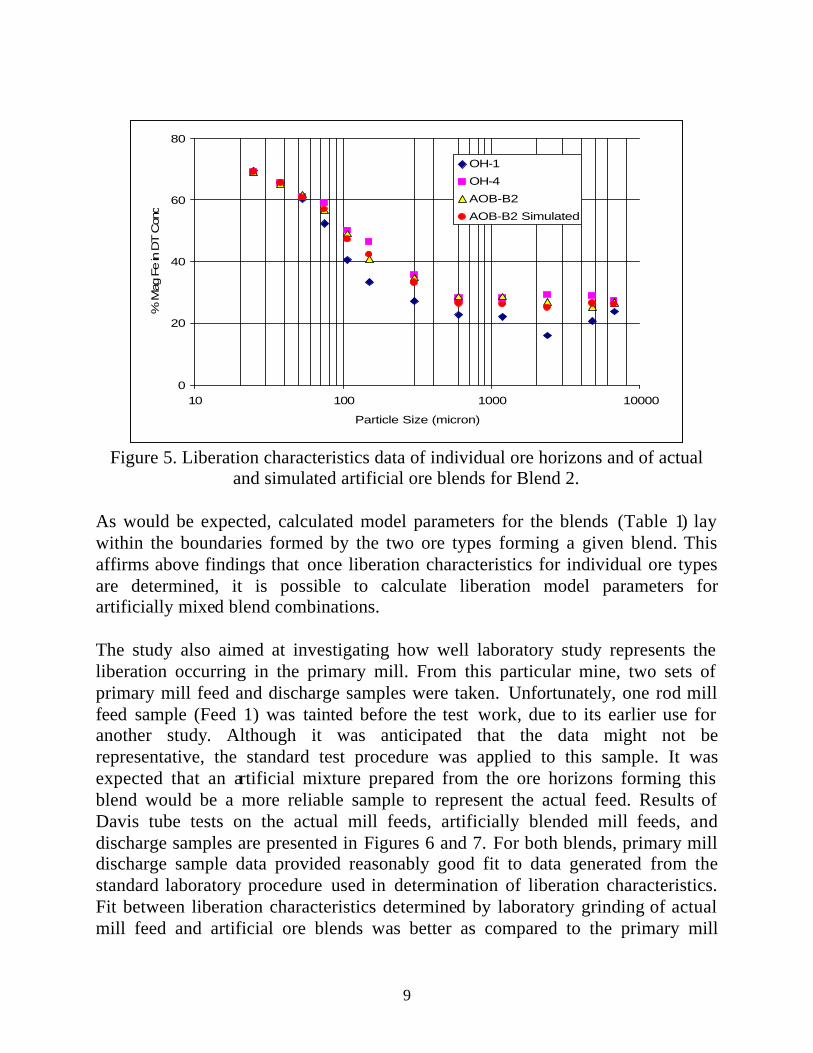
Figure 5. Liberation characteristics data of individual ore horizons and of actual
and simulated artificial ore blends for Blend 2. As would be expected, calculated model parameters for the blends (Table 1) lay within the boundaries formed by the two ore types forming a given blend. This affirms above findings that once liberation characteristics for individual ore types are determined, it is possible to calculate liberation model parameters for artificially mixed blend combinations. The study also aimed at investigating how well laboratory study represents the liberation occurring in the primary mill. From this particular mine, two sets of primary mill feed and discharge samples were taken. Unfortunately, one rod mill feed sample (Feed 1) was tainted before the test work, due to its earlier use for another study. Although it was anticipated that the data might not be representative, the standard test procedure was applied to this sample. It was expected that an artificial mixture prepared from the ore horizons forming this blend would be a more reliable sample to represent the actual feed. Results of Davis tube tests on the actual mill feeds, artificially blended mill feeds, and discharge samples are presented in Figures 6 and 7. For both blends, primary mill discharge sample data provided reasonably good fit to data generated from the standard laboratory procedure used in determination of liberation characteristics. Fit between liberation characteristics determined by laboratory grinding of actual mill feed and artificial ore blends was better as compared to the primary mill

10
discharge samples. Deviations in the fine size range imply that the plant mill produces slightly better liberation. This might be a result of preferential breakage taking place in the primary mill. Such difference between the laboratory procedure and the plant mill was also highlighted in the liberation model parameters presented in Table 1. Model fit produced slightly higher effective grain size for the primary mill discharge samples, whereas dilution appeared to be lower. Both of these could be a result of preferential grinding. However, the differences are relatively small. Therefore, it could be concluded that the laboratory procedure is reasonably accurate in determining liberation characteristics occurring in the primary grinding mill.
0
20
40
60
80
10 100 1000 10000
Particle Size (micron)
% M
ag F
e in
DT c
onc.
Plant-B1 PMF
Plant-B1 PMD
AOB-B1
Figure 6. A comparison of measured liberation characteristics of primary mill feed
(PMF), primary mill discharge (PMD), and artificial ore blend (AOB) samples for Blend 1.
11
0
20
40
60
80
10 100 1000 10000
Particle Size (micron)
% M
ag F
e In
DT
Con
c.Plant-B2 PMF
Plant-B2 PMD
AOB-B2
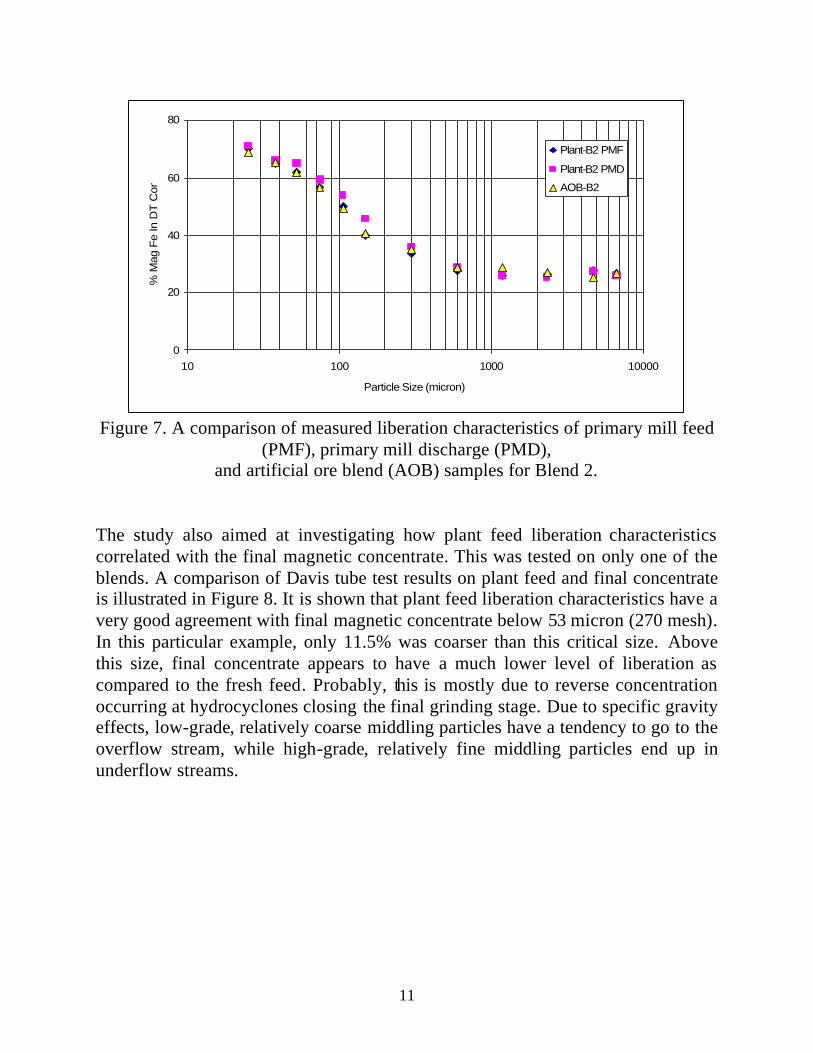
Figure 7. A comparison of measured liberation characteristics of primary mill feed
(PMF), primary mill discharge (PMD), and artificial ore blend (AOB) samples for Blend 2.
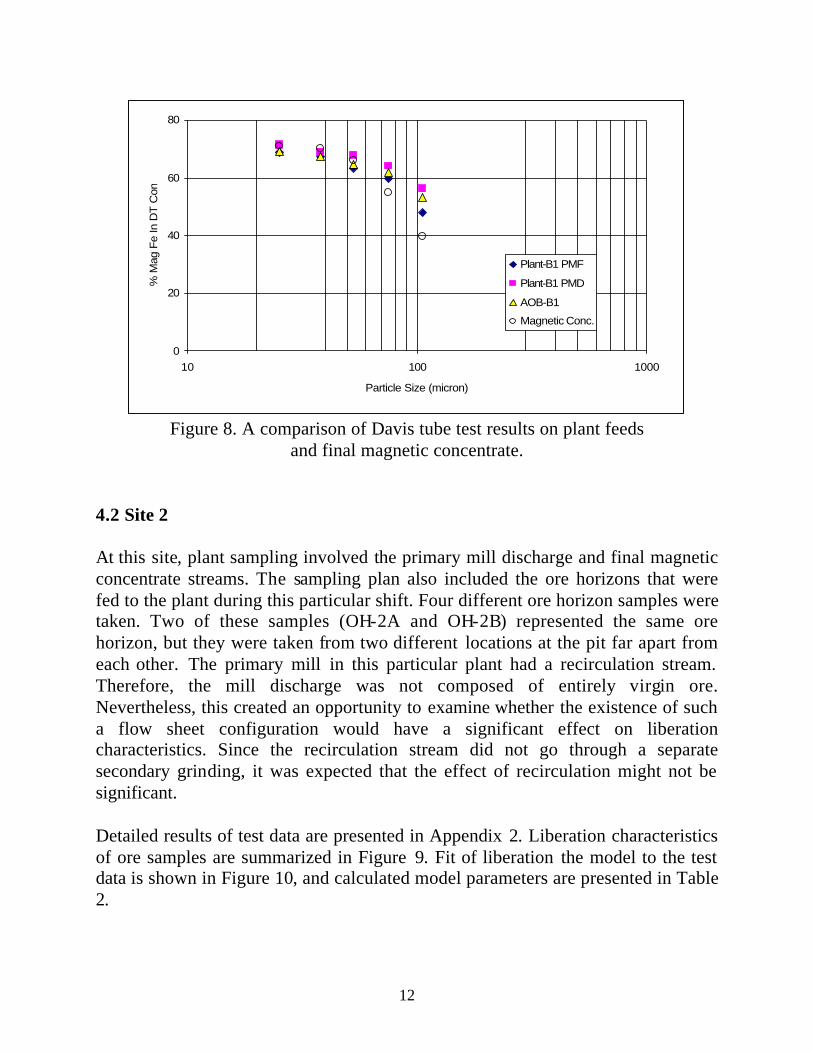
The study also aimed at investigating how plant feed liberation characteristics correlated with the final magnetic concentrate. This was tested on only one of the blends. A comparison of Davis tube test results on plant feed and final concentrate is illustrated in Figure 8. It is shown that plant feed liberation characteristics have a very good agreement with final magnetic concentrate below 53 micron (270 mesh). In this particular example, only 11.5% was coarser than this critical size. Above this size, final concentrate appears to have a much lower level of liberation as compared to the fresh feed. Probably, this is mostly due to reverse concentration occurring at hydrocyclones closing the final grinding stage. Due to specific gravity effects, low-grade, relatively coarse middling particles have a tendency to go to the overflow stream, while high-grade, relatively fine middling particles end up in underflow streams.
12
0
20
40
60
80
10 100 1000
Particle Size (micron)
% M
ag F
e In
DT
Con
c.
Plant-B1 PMF
Plant-B1 PMD
AOB-B1
Magnetic Conc.
Figure 8. A comparison of Davis tube test results on plant feeds
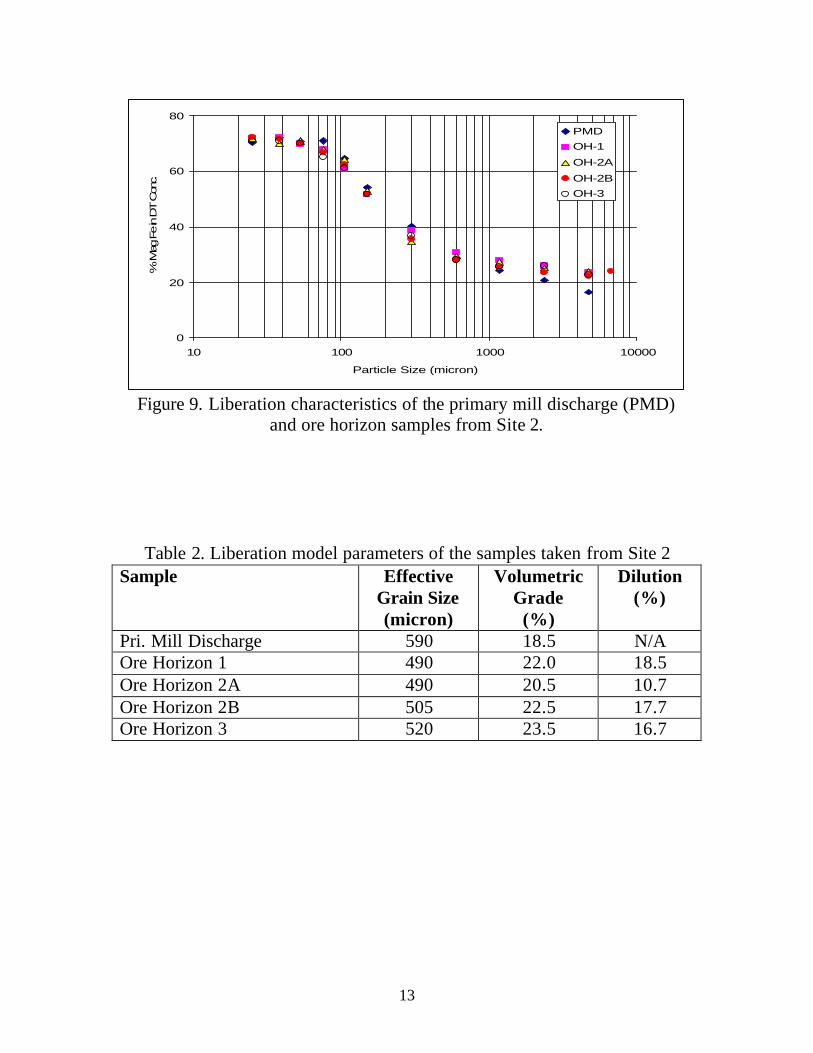
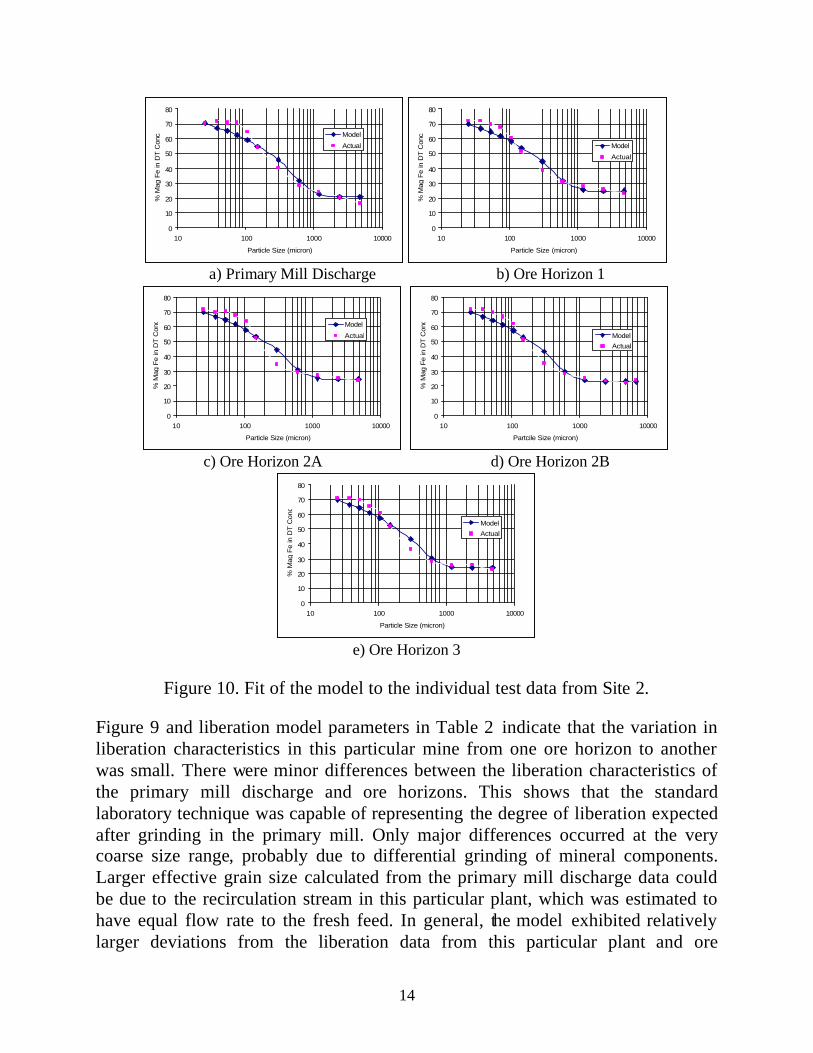
and final magnetic concentrate. 4.2 Site 2 At this site, plant sampling involved the primary mill discharge and final magnetic concentrate streams. The sampling plan also included the ore horizons that were fed to the plant during this particular shift. Four different ore horizon samples were taken. Two of these samples (OH-2A and OH-2B) represented the same ore horizon, but they were taken from two different locations at the pit far apart from each other. The primary mill in this particular plant had a recirculation stream. Therefore, the mill discharge was not composed of entirely virgin ore. Nevertheless, this created an opportunity to examine whether the existence of such a flow sheet configuration would have a significant effect on liberation characteristics. Since the recirculation stream did not go through a separate secondary grinding, it was expected that the effect of recirculation might not be significant. Detailed results of test data are presented in Appendix 2. Liberation characteristics of ore samples are summarized in Figure 9. Fit of liberation the model to the test data is shown in Figure 10, and calculated model parameters are presented in Table 2.
13
0
20
40
60
80
10 100 1000 10000
Particle Size (micron)
% M
ag F
e in
DT C
onc.
PMD
OH-1
OH-2A
OH-2B
OH-3
Figure 9. Liberation characteristics of the primary mill discharge (PMD)
and ore horizon samples from Site 2.
Table 2. Liberation model parameters of the samples taken from Site 2 Sample Effective
Grain Size (micron)
Volumetric Grade
(%)
Dilution (%)
Pri. Mill Discharge 590 18.5 N/A Ore Horizon 1 490 22.0 18.5 Ore Horizon 2A 490 20.5 10.7 Ore Horizon 2B 505 22.5 17.7 Ore Horizon 3 520 23.5 16.7
14
0
10
20
30
40
50
60
70
80
10 100 1000 10000
Particle Size (micron)
% M
ag F
e in
DT
Con
c. Model
Actual
0
10
20
30
40
50
60
70
80
10 100 1000 10000
Particle Size (micron)
% M
ag F
e in
DT
Con
c.
Model
Actual
a) Primary Mill Discharge b) Ore Horizon 1
0
10
20
30
40
50
60
70
80
10 100 1000 10000
Particle Size (micron)
% M
ag F
e in
DT
Con
c. Model
Actual
0
10
20
30
40
50
60
70
80
10 100 1000 10000
Partcile Size (micron)
% M
ag F
e in
DT
Con
c.
Model
Actual
c) Ore Horizon 2A d) Ore Horizon 2B
0
10
20
30
40
50
60
70
80
10 100 1000 10000
Particle Size (micron)
% M
ag F
e in
DT
Con
c.
Model
Actual
e) Ore Horizon 3
Figure 10. Fit of the model to the individual test data from Site 2.
Figure 9 and liberation model parameters in Table 2 indicate that the variation in liberation characteristics in this particular mine from one ore horizon to another was small. There were minor differences between the liberation characteristics of the primary mill discharge and ore horizons. This shows that the standard laboratory technique was capable of representing the degree of liberation expected after grinding in the primary mill. Only major differences occurred at the very coarse size range, probably due to differential grinding of mineral components. Larger effective grain size calculated from the primary mill discharge data could be due to the recirculation stream in this particular plant, which was estimated to have equal flow rate to the fresh feed. In general, the model exhibited relatively larger deviations from the liberation data from this particular plant and ore
15
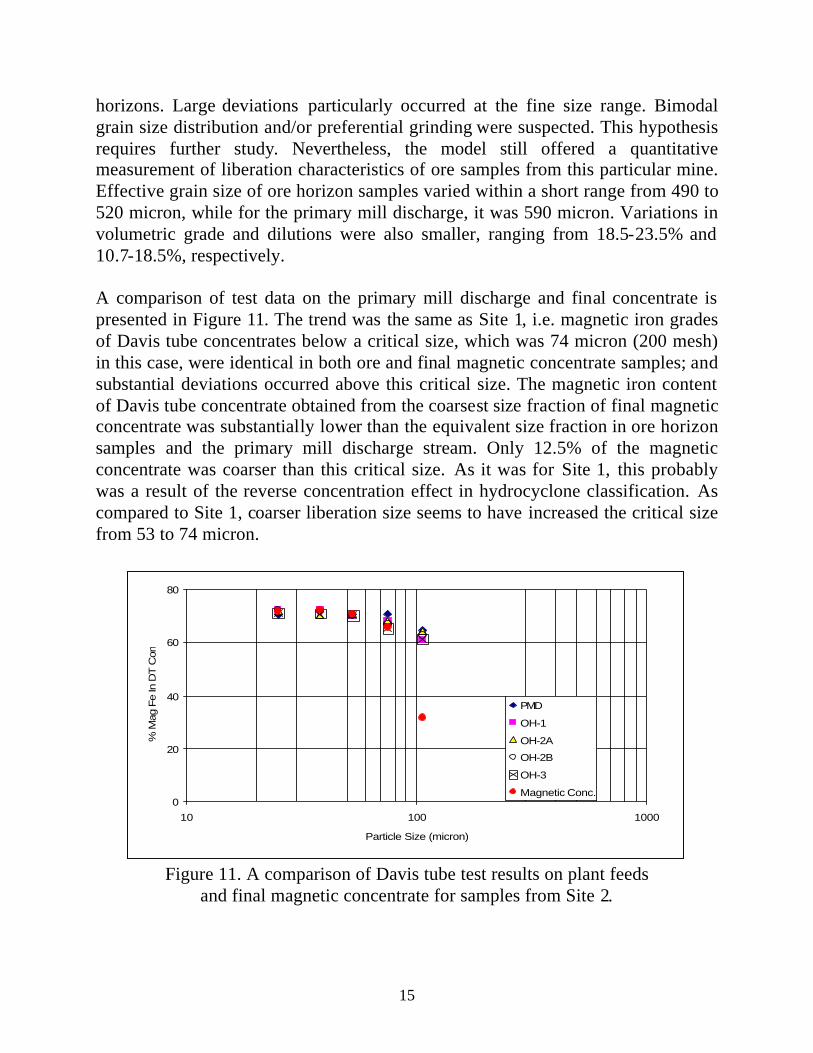
horizons. Large deviations particularly occurred at the fine size range. Bimodal grain size distribution and/or preferential grinding were suspected. This hypothesis requires further study. Nevertheless, the model still offered a quantitative measurement of liberation characteristics of ore samples from this particular mine. Effective grain size of ore horizon samples varied within a short range from 490 to 520 micron, while for the primary mill discharge, it was 590 micron. Variations in volumetric grade and dilutions were also smaller, ranging from 18.5-23.5% and 10.7-18.5%, respectively. A comparison of test data on the primary mill discharge and final concentrate is presented in Figure 11. The trend was the same as Site 1, i.e. magnetic iron grades of Davis tube concentrates below a critical size, which was 74 micron (200 mesh) in this case, were identical in both ore and final magnetic concentrate samples; and substantial deviations occurred above this critical size. The magnetic iron content of Davis tube concentrate obtained from the coarsest size fraction of final magnetic concentrate was substantially lower than the equivalent size fraction in ore horizon samples and the primary mill discharge stream. Only 12.5% of the magnetic concentrate was coarser than this critical size. As it was for Site 1, this probably was a result of the reverse concentration effect in hydrocyclone classification. As compared to Site 1, coarser liberation size seems to have increased the critical size from 53 to 74 micron.
0
20
40
60
80
10 100 1000
Particle Size (micron)
% M
ag F
e In
DT C
onc.
PMD
OH-1
OH-2A
OH-2B
OH-3
Magnetic Conc.
Figure 11. A comparison of Davis tube test results on plant feeds
and final magnetic concentrate for samples from Site 2.
16
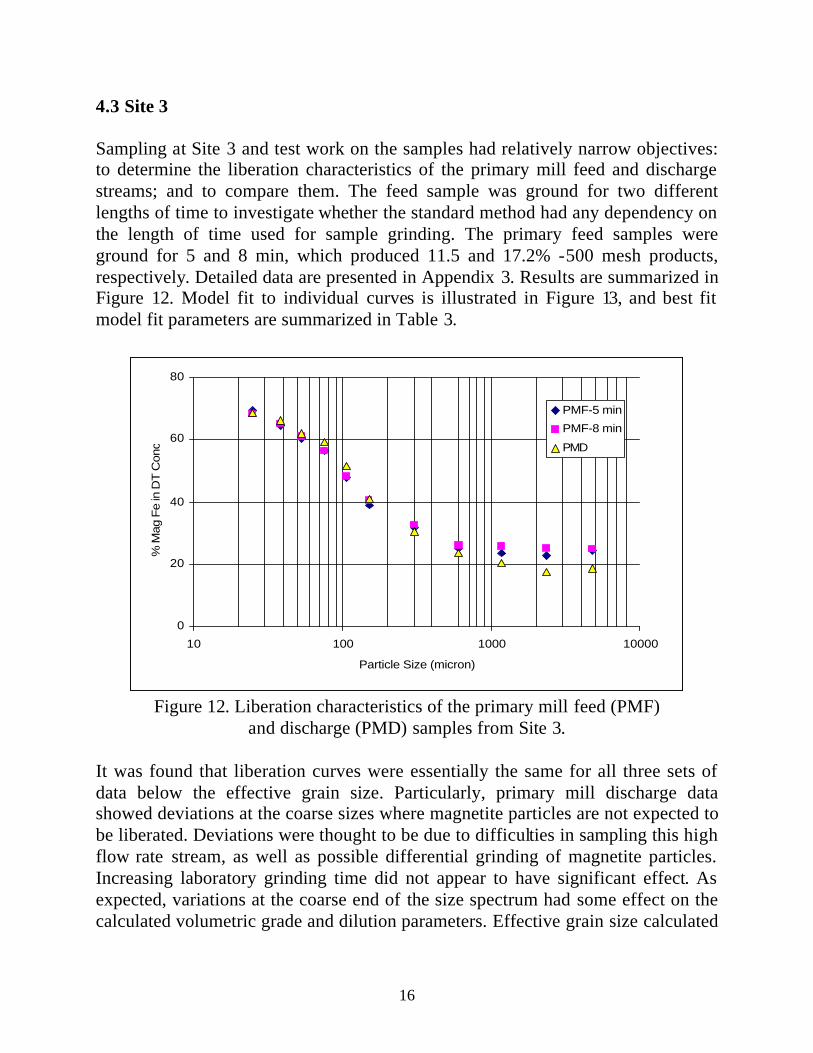
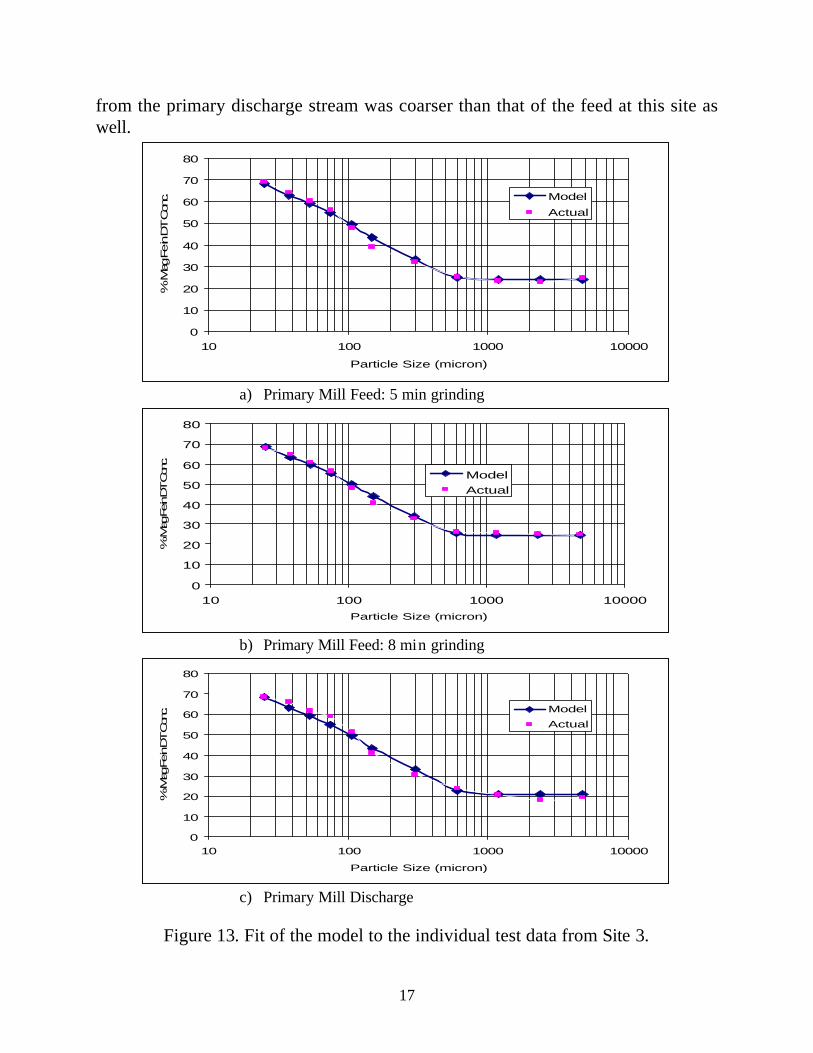
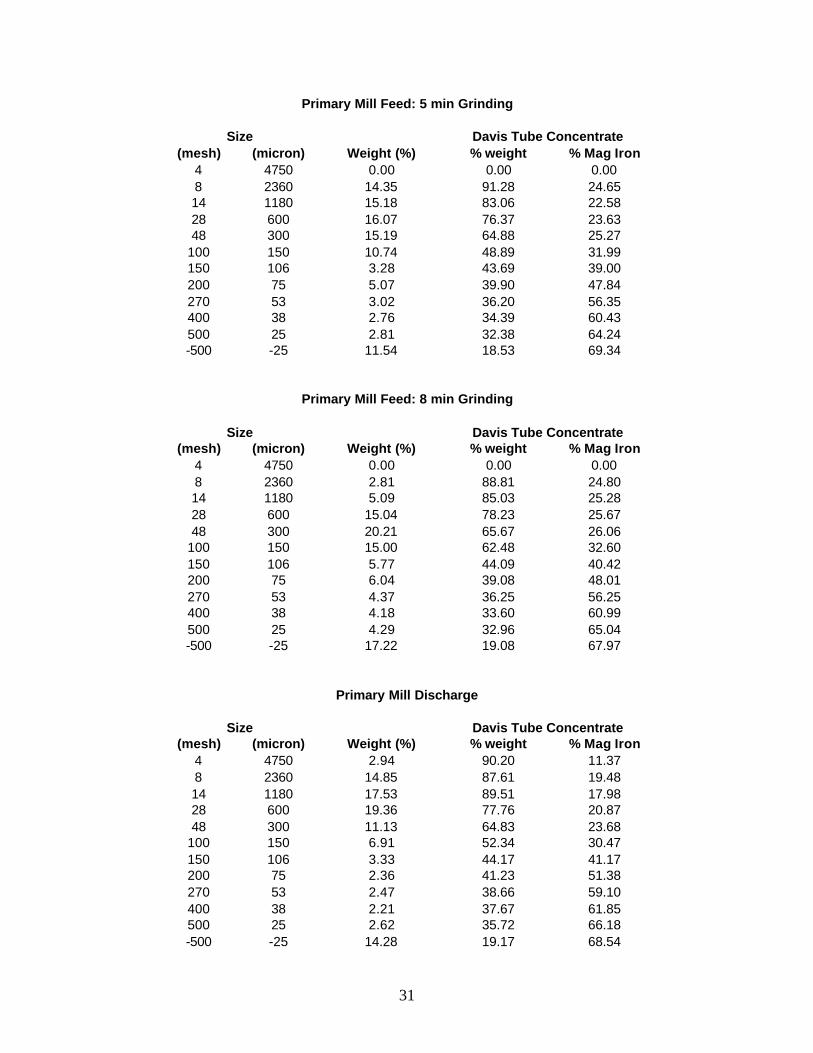
4.3 Site 3 Sampling at Site 3 and test work on the samples had relatively narrow objectives: to determine the liberation characteristics of the primary mill feed and discharge streams; and to compare them. The feed sample was ground for two different lengths of time to investigate whether the standard method had any dependency on the length of time used for sample grinding. The primary feed samples were ground for 5 and 8 min, which produced 11.5 and 17.2% -500 mesh products, respectively. Detailed data are presented in Appendix 3. Results are summarized in Figure 12. Model fit to individual curves is illustrated in Figure 13, and best fit model fit parameters are summarized in Table 3.
0
20
40
60
80
10 100 1000 10000
Particle Size (micron)
% M
ag F
e in
DT
Con
c.
PMF-5 min
PMF-8 min
PMD
Figure 12. Liberation characteristics of the primary mill feed (PMF)
and discharge (PMD) samples from Site 3. It was found that liberation curves were essentially the same for all three sets of data below the effective grain size. Particularly, primary mill discharge data showed deviations at the coarse sizes where magnetite particles are not expected to be liberated. Deviations were thought to be due to difficulties in sampling this high flow rate stream, as well as possible differential grinding of magnetite particles. Increasing laboratory grinding time did not appear to have significant effect. As expected, variations at the coarse end of the size spectrum had some effect on the calculated volumetric grade and dilution parameters. Effective grain size calculated
17
from the primary discharge stream was coarser than that of the feed at this site as well.
0
10
20
30
40
50
60
70
80
10 100 1000 10000
Particle Size (micron)
% M
ag F
e in DT C
onc. Model
Actual
a) Primary Mill Feed: 5 min grinding
0
10
20
30
40
50
60
70
80
10 100 1000 10000
Particle Size (micron)
% M
ag Fe in DT C
onc.
ModelActual
b) Primary Mill Feed: 8 min grinding
0
10
20
30
40
50
60
70
80
10 100 1000 10000
Particle Size (micron)
% M
ag Fe in DT C
onc. Model
Actual
c) Primary Mill Discharge
Figure 13. Fit of the model to the individual test data from Site 3.
18
Table 3. Liberation model parameters of the samples taken from Site 3 Sample Effective
Grain Size (micron)
Volumetric Grade
(%)
Dilution (%)
Pri. Mill Discharge 320 20.0 20.9 Pri. Mill Feed: 5 min Grinding 300 23.0 31.6 Pri. Mill Feed: 8 min Grinding 300 24.0 36.6
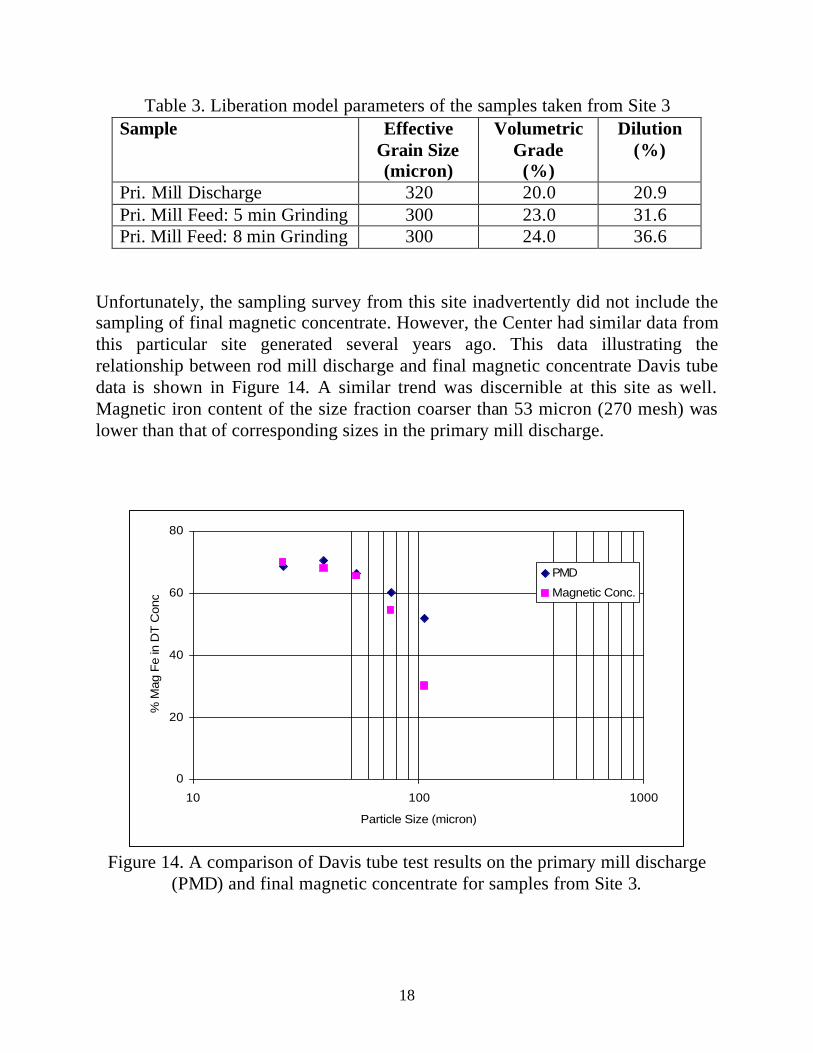
Unfortunately, the sampling survey from this site inadvertently did not include the sampling of final magnetic concentrate. However, the Center had similar data from this particular site generated several years ago. This data illustrating the relationship between rod mill discharge and final magnetic concentrate Davis tube data is shown in Figure 14. A similar trend was discernible at this site as well. Magnetic iron content of the size fraction coarser than 53 micron (270 mesh) was lower than that of corresponding sizes in the primary mill discharge.
0
20
40
60
80
10 100 1000
Particle Size (micron)
% M
ag F
e in
DT
Con
c.
PMD
Magnetic Conc.
Figure 14. A comparison of Davis tube test results on the primary mill discharge
(PMD) and final magnetic concentrate for samples from Site 3.
19
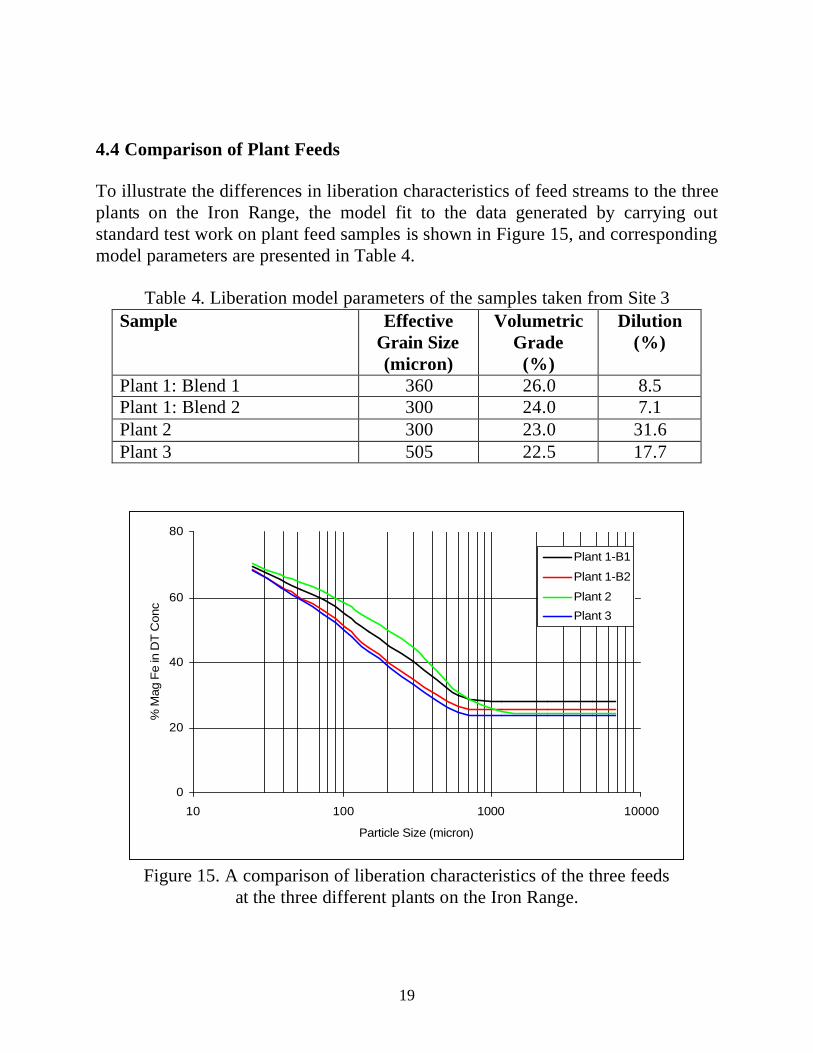
4.4 Comparison of Plant Feeds To illustrate the differences in liberation characteristics of feed streams to the three plants on the Iron Range, the model fit to the data generated by carrying out standard test work on plant feed samples is shown in Figure 15, and corresponding model parameters are presented in Table 4.
Table 4. Liberation model parameters of the samples taken from Site 3 Sample Effective
Grain Size (micron)
Volumetric Grade
(%)
Dilution (%)
Plant 1: Blend 1 360 26.0 8.5 Plant 1: Blend 2 300 24.0 7.1 Plant 2 300 23.0 31.6 Plant 3 505 22.5 17.7
0
20
40
60
80
10 100 1000 10000
Particle Size (micron)
% M
ag F
e in
DT
Con
c.
Plant 1-B1
Plant 1-B2
Plant 2
Plant 3
Figure 15. A comparison of liberation characteristics of the three feeds
at the three different plants on the Iron Range.
20
Data show that there are significant differences, particularly in terms of effective grain sizes, from one plant to another. Variations among the volumetric grades were relatively lower, probably due to plants having similar feed grades. The dilution factor, however, showed large variations from one mine to another ranging from 7.1 to 31.6%. 5. CONCLUSION This study used a standardized liberation characterization method and quantified the liberation characteristics of ore blends and ore horizons for three mines on the Iron Range. Standardized testing involved laboratory scale grinding of test samples, and size by size Davis tube tests on ground products. Data generated by this study can now be used for liberation-based simulations of these plants, as well as serving as benchmarks for monitoring variations in liberation characteristics in the future. Results showed that there could exist large variations in liberation characteristics of horizons mined by a particular mine, and between the ore blends processed at different plants. The study also examined:
1. The fit of the model to liberation data generated by the laboratory tests data and primary mill discharge stream data
2. Correlation between the laboratory test procedure and plant primary mill discharge liberation characteristics; laboratory scale simulation of liberation characteristics of ore blends;
3. Correlation between plant feed liberation characteristics and final magnetic concentrate from a given plant.
Liberation characteristics of ore blends processed by three plants on the Iron Range were also compared. Findings of this study are summarized below. The model, in general, provided satisfactory fit to liberation characterization data irrespective of its being generated by laboratory or plant primary mill grinding. However, the samples obtained form one site showed relatively larger deviations from the model. It is suggested that this could be due to bimodal grain size distribution in ore horizons in this particular site. Understanding the true cause of such deviations and its implications on the liberation model requires further study and was beyond the scope of this work. Preliminary work investigating plausible bimodal structure showed promising signs, but it was not conclusive. Standardized laboratory test data correlated well with the liberation characteristics determined using primary mill discharge stream in the plants. Despite a circulating
21
stream in one plant, laboratory test data fit very well to data from the primary mill discharge stream. Minor variations in effective grain size and volumetric grades were observed. Primary mill discharge streams consistently produced slightly larger effective grain sizes and had a tendency to have lower volumetric grades. These two observations were attributed to the preferential grinding in plant mills. Since differences were small, it is concluded that laboratory test procedures can reliably be used for the determination of liberation parameters. Results indicated that it is possible to estimate liberation characteristics of ore blends, once liberation characteristics of individual ore horizons are known. Artificially created laboratory blends correlated well with actual blends of plant feeds. This finding implies that it is possible to simulate the effects of different ore blends on plant performance, or use liberation-based simulation to determine the optimum ore blend for improved plant performance. This study also showed that Davis tube concentrate grades of fine size fractions in the final magnetic concentrate are almost the same as those of the primary grinding mill discharge stream. However, there is a critical size above which magnetic iron grades of Davis tube concentrates substantially decrease. This critical size appears to correlate with the effective grain size of the plant feed. It is postulated that such a decrease in Davis tube concentrate grades is a result of reverse concentration taking place in hydrocyclones and consequent preferential grinding of magnetite. Among the plants studied, the effective grain of plant feed blends varied from 300 to 590 microns, while volumetric grade showed much smaller variations between 22.5 and 26%. Dilution parameters also had a large range of variation, from 7.1 to 31.6%. REFERENCES Wiegel, R.L., 1974, Liberation in magnetite iron formations, Progress Report No. 30, Mineral Resources Research Center, University of Minnesota, pp24-83. Wiegel, R.L., 2006, The rationale behind the development of one model describing the size reduction/liberation of ores, in Advances in Comminution, Ed. S.K. Kawatra, SME, Littleton, CO, pp205-224.

22
APPENDIX 1
RESULTS OF LIBERATION CHARACTERIZATION TESTS ON SAMPLES FROM SITE 1

23
(mesh) (micron) Weight (%) % weight % Mag Iron4 4750 0.64 99.83 23.678 2360 3.87 99.60 20.9414 1180 10.17 96.50 16.0228 600 18.73 93.00 22.1048 300 17.91 84.40 22.72
100 150 12.89 73.20 27.29150 106 5.95 60.20 33.41200 75 4.12 49.80 40.58270 53 3.95 42.90 52.30400 38 3.53 39.70 60.34500 25 3.36 36.20 65.60-500 -25 14.89 21.70 69.61
(mesh) (micron) Weight (%) % weight % Mag Iron4 4750 3.08 96.71 27.268 2360 15.33 99.50 26.9214 1180 16.42 98.30 28.2328 600 17.32 97.80 28.3148 300 13.18 94.50 29.62
100 150 9.09 88.20 31.47150 106 4.10 78.50 36.55200 75 2.82 71.30 41.39270 53 2.78 57.10 49.49400 38 2.70 50.50 55.48500 25 2.60 43.20 61.19-500 -25 10.58 25.70 68.77
(mesh) (micron) Weight (%) % weight % Mag Iron4 4750 2.68 89.53 23.188 2360 20.02 86.62 24.5014 1180 17.55 91.17 26.8028 600 14.41 84.07 27.1948 300 12.43 74.98 28.62
100 150 8.89 63.39 35.72150 106 3.02 56.20 44.11200 75 3.83 51.24 50.08270 53 2.32 46.77 58.78400 38 2.38 43.05 62.34500 25 2.14 40.06 66.65-500 -25 10.34 35.17 70.68
Size Davis Tube Concentrate
Ore Horizon 3A
Size Davis Tube Concentrate
Size Davis Tube Concentrate
Ore Horizon 2
Ore Horizon 1
24
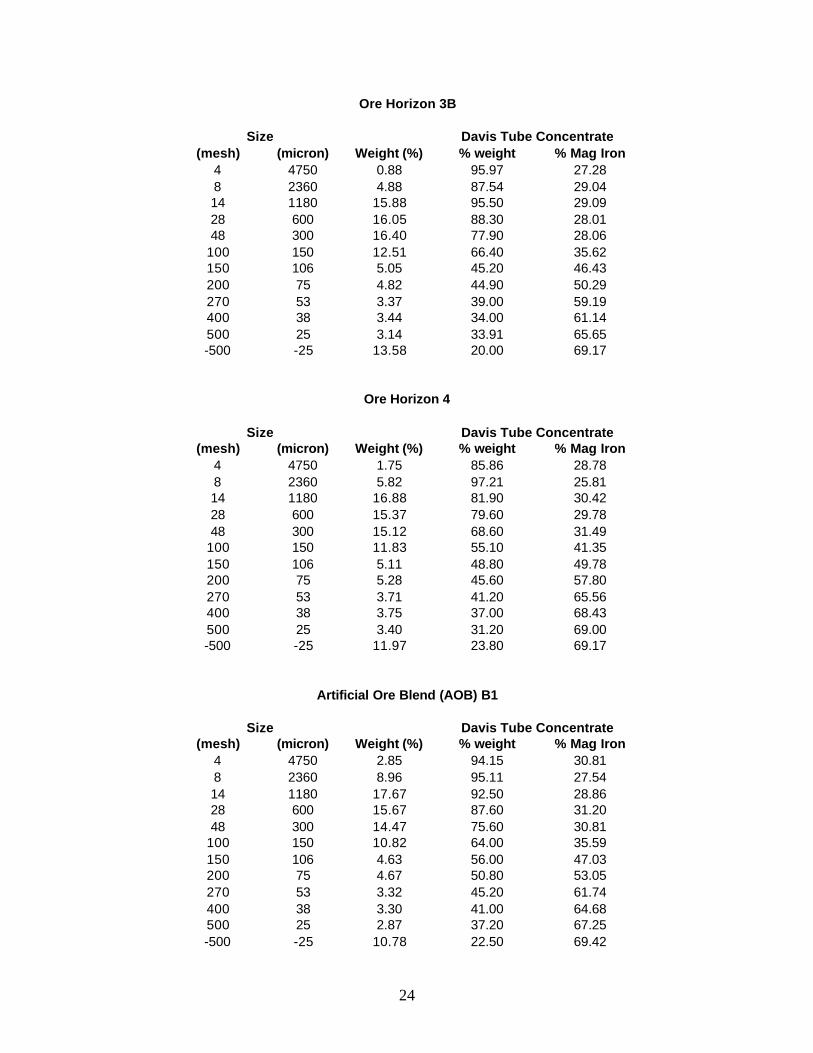
(mesh) (micron) Weight (%) % weight % Mag Iron4 4750 0.88 95.97 27.288 2360 4.88 87.54 29.0414 1180 15.88 95.50 29.0928 600 16.05 88.30 28.0148 300 16.40 77.90 28.06
100 150 12.51 66.40 35.62150 106 5.05 45.20 46.43200 75 4.82 44.90 50.29270 53 3.37 39.00 59.19400 38 3.44 34.00 61.14500 25 3.14 33.91 65.65-500 -25 13.58 20.00 69.17
(mesh) (micron) Weight (%) % weight % Mag Iron4 4750 1.75 85.86 28.788 2360 5.82 97.21 25.8114 1180 16.88 81.90 30.4228 600 15.37 79.60 29.7848 300 15.12 68.60 31.49
100 150 11.83 55.10 41.35150 106 5.11 48.80 49.78200 75 5.28 45.60 57.80270 53 3.71 41.20 65.56400 38 3.75 37.00 68.43500 25 3.40 31.20 69.00-500 -25 11.97 23.80 69.17
(mesh) (micron) Weight (%) % weight % Mag Iron4 4750 2.85 94.15 30.818 2360 8.96 95.11 27.5414 1180 17.67 92.50 28.8628 600 15.67 87.60 31.2048 300 14.47 75.60 30.81
100 150 10.82 64.00 35.59150 106 4.63 56.00 47.03200 75 4.67 50.80 53.05270 53 3.32 45.20 61.74400 38 3.30 41.00 64.68500 25 2.87 37.20 67.25-500 -25 10.78 22.50 69.42
Size Davis Tube Concentrate
Size Davis Tube Concentrate
Artificial Ore Blend (AOB) B1
Ore Horizon 4
Size Davis Tube Concentrate
Ore Horizon 3B
25
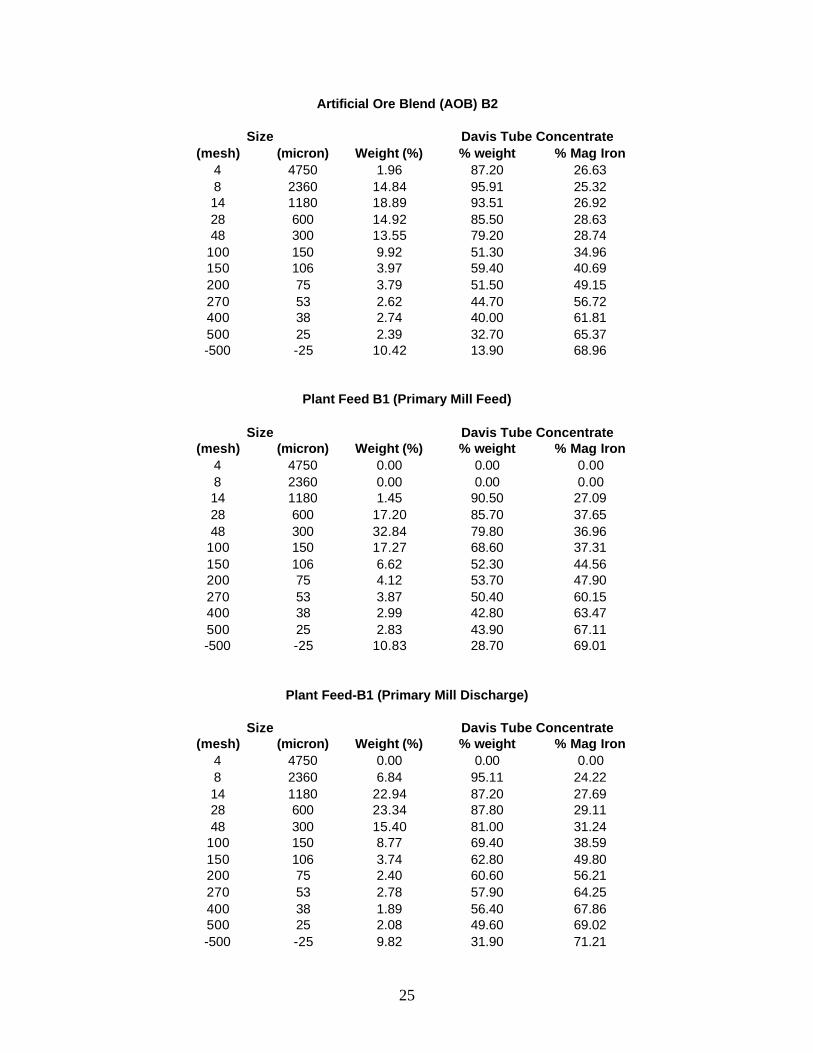
(mesh) (micron) Weight (%) % weight % Mag Iron4 4750 1.96 87.20 26.638 2360 14.84 95.91 25.3214 1180 18.89 93.51 26.9228 600 14.92 85.50 28.6348 300 13.55 79.20 28.74
100 150 9.92 51.30 34.96150 106 3.97 59.40 40.69200 75 3.79 51.50 49.15270 53 2.62 44.70 56.72400 38 2.74 40.00 61.81500 25 2.39 32.70 65.37-500 -25 10.42 13.90 68.96
(mesh) (micron) Weight (%) % weight % Mag Iron4 4750 0.00 0.00 0.008 2360 0.00 0.00 0.0014 1180 1.45 90.50 27.0928 600 17.20 85.70 37.6548 300 32.84 79.80 36.96
100 150 17.27 68.60 37.31150 106 6.62 52.30 44.56200 75 4.12 53.70 47.90270 53 3.87 50.40 60.15400 38 2.99 42.80 63.47500 25 2.83 43.90 67.11-500 -25 10.83 28.70 69.01
(mesh) (micron) Weight (%) % weight % Mag Iron4 4750 0.00 0.00 0.008 2360 6.84 95.11 24.2214 1180 22.94 87.20 27.6928 600 23.34 87.80 29.1148 300 15.40 81.00 31.24
100 150 8.77 69.40 38.59150 106 3.74 62.80 49.80200 75 2.40 60.60 56.21270 53 2.78 57.90 64.25400 38 1.89 56.40 67.86500 25 2.08 49.60 69.02-500 -25 9.82 31.90 71.21
Size Davis Tube Concentrate
Size Davis Tube Concentrate
Plant Feed-B1 (Primary Mill Discharge)
Plant Feed B1 (Primary Mill Feed)
Size Davis Tube Concentrate
Artificial Ore Blend (AOB) B2
26
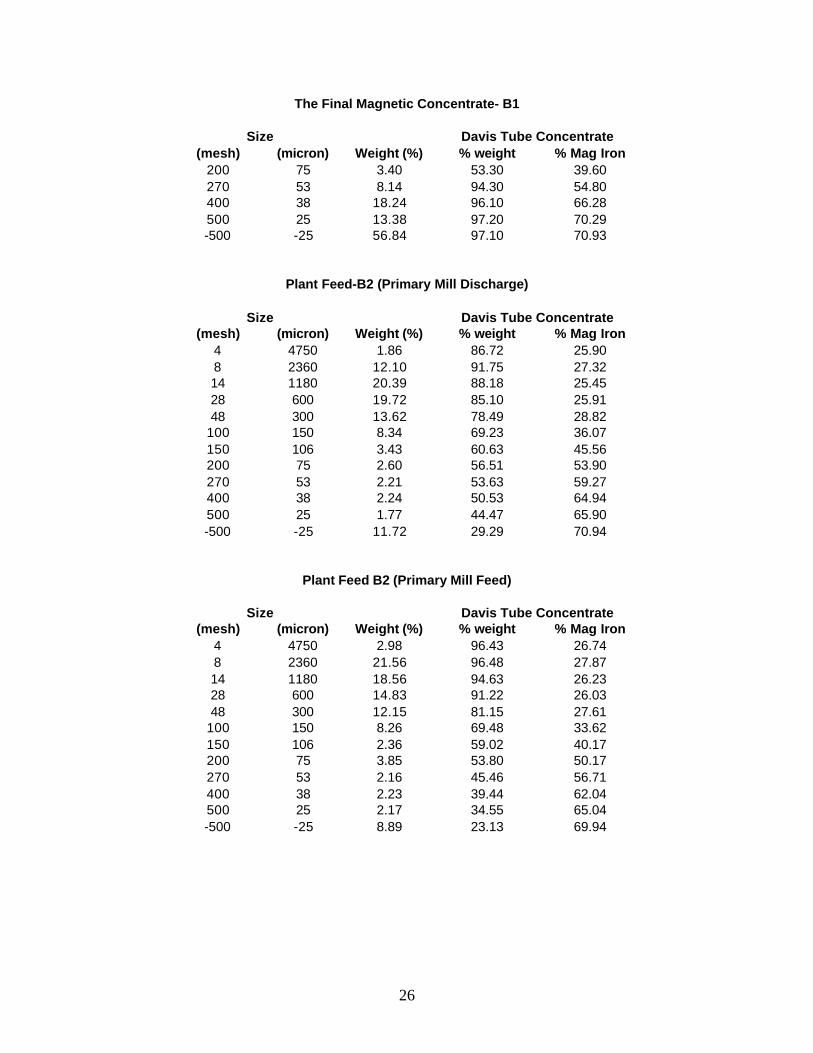
(mesh) (micron) Weight (%) % weight % Mag Iron200 75 3.40 53.30 39.60270 53 8.14 94.30 54.80400 38 18.24 96.10 66.28500 25 13.38 97.20 70.29-500 -25 56.84 97.10 70.93
(mesh) (micron) Weight (%) % weight % Mag Iron4 4750 1.86 86.72 25.908 2360 12.10 91.75 27.3214 1180 20.39 88.18 25.4528 600 19.72 85.10 25.9148 300 13.62 78.49 28.82
100 150 8.34 69.23 36.07150 106 3.43 60.63 45.56200 75 2.60 56.51 53.90270 53 2.21 53.63 59.27400 38 2.24 50.53 64.94500 25 1.77 44.47 65.90-500 -25 11.72 29.29 70.94
(mesh) (micron) Weight (%) % weight % Mag Iron4 4750 2.98 96.43 26.748 2360 21.56 96.48 27.8714 1180 18.56 94.63 26.2328 600 14.83 91.22 26.0348 300 12.15 81.15 27.61
100 150 8.26 69.48 33.62150 106 2.36 59.02 40.17200 75 3.85 53.80 50.17270 53 2.16 45.46 56.71400 38 2.23 39.44 62.04500 25 2.17 34.55 65.04-500 -25 8.89 23.13 69.94
Size Davis Tube Concentrate
Size Davis Tube Concentrate
Plant Feed B2 (Primary Mill Feed)
Plant Feed-B2 (Primary Mill Discharge)
Size Davis Tube Concentrate
The Final Magnetic Concentrate- B1
27
APPENDIX 2
RESULTS OF LIBERATION CHARACTERIZATION TESTS ON SAMPLES FROM SITE 2
28
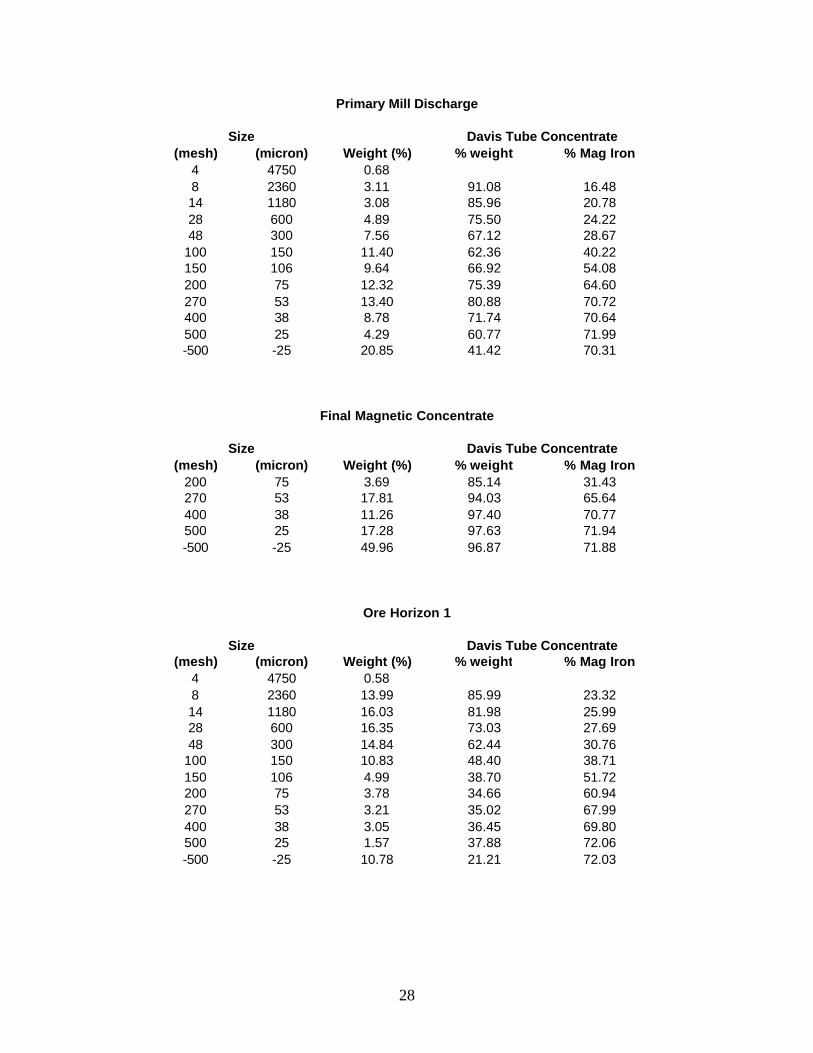
(mesh) (micron) Weight (%) % weight % Mag Iron4 4750 0.688 2360 3.11 91.08 16.4814 1180 3.08 85.96 20.7828 600 4.89 75.50 24.2248 300 7.56 67.12 28.67
100 150 11.40 62.36 40.22150 106 9.64 66.92 54.08200 75 12.32 75.39 64.60270 53 13.40 80.88 70.72400 38 8.78 71.74 70.64500 25 4.29 60.77 71.99-500 -25 20.85 41.42 70.31
(mesh) (micron) Weight (%) % weight % Mag Iron200 75 3.69 85.14 31.43270 53 17.81 94.03 65.64400 38 11.26 97.40 70.77500 25 17.28 97.63 71.94-500 -25 49.96 96.87 71.88
(mesh) (micron) Weight (%) % weight % Mag Iron4 4750 0.588 2360 13.99 85.99 23.3214 1180 16.03 81.98 25.9928 600 16.35 73.03 27.6948 300 14.84 62.44 30.76
100 150 10.83 48.40 38.71150 106 4.99 38.70 51.72200 75 3.78 34.66 60.94270 53 3.21 35.02 67.99400 38 3.05 36.45 69.80500 25 1.57 37.88 72.06-500 -25 10.78 21.21 72.03
Size Davis Tube Concentrate
Ore Horizon 1
Size Davis Tube Concentrate
Primary Mill Discharge
Size Davis Tube Concentrate
Final Magnetic Concentrate
29
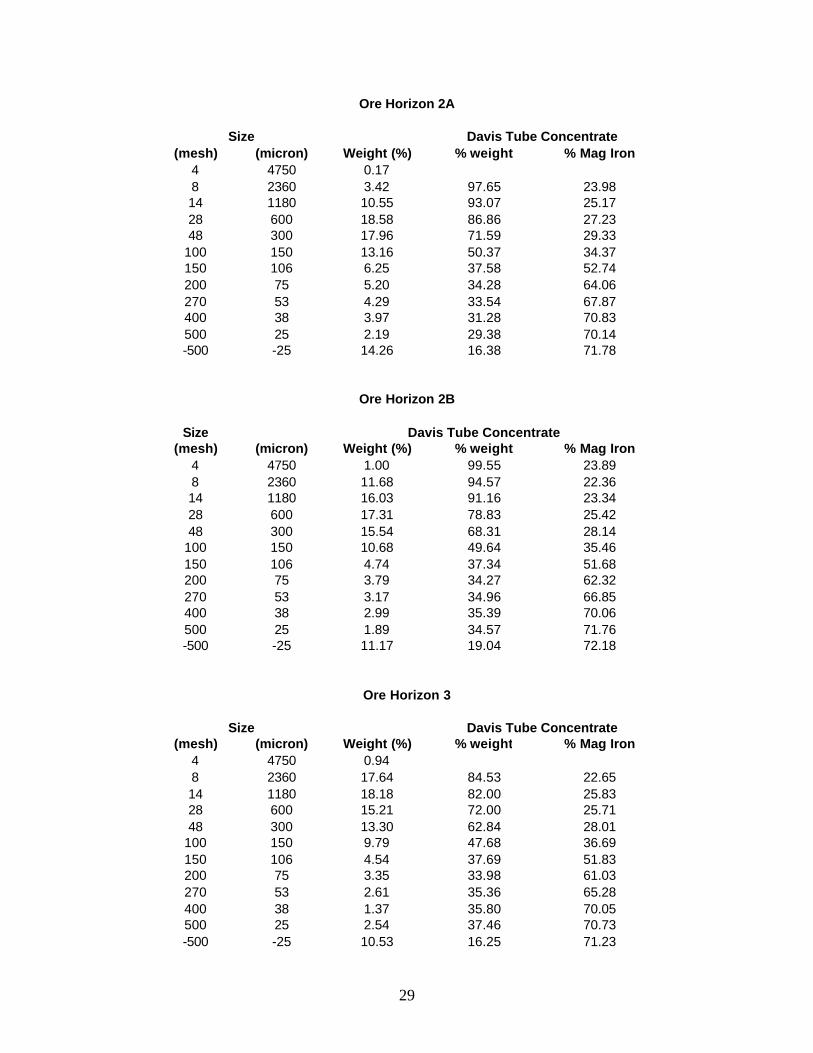
(mesh) (micron) Weight (%) % weight % Mag Iron4 4750 0.178 2360 3.42 97.65 23.9814 1180 10.55 93.07 25.1728 600 18.58 86.86 27.2348 300 17.96 71.59 29.33
100 150 13.16 50.37 34.37150 106 6.25 37.58 52.74200 75 5.20 34.28 64.06270 53 4.29 33.54 67.87400 38 3.97 31.28 70.83500 25 2.19 29.38 70.14-500 -25 14.26 16.38 71.78
Size Davis Tube Concentrate(mesh) (micron) Weight (%) % weight % Mag Iron
4 4750 1.00 99.55 23.898 2360 11.68 94.57 22.3614 1180 16.03 91.16 23.3428 600 17.31 78.83 25.4248 300 15.54 68.31 28.14
100 150 10.68 49.64 35.46150 106 4.74 37.34 51.68200 75 3.79 34.27 62.32270 53 3.17 34.96 66.85400 38 2.99 35.39 70.06500 25 1.89 34.57 71.76-500 -25 11.17 19.04 72.18
(mesh) (micron) Weight (%) % weight % Mag Iron4 4750 0.948 2360 17.64 84.53 22.6514 1180 18.18 82.00 25.8328 600 15.21 72.00 25.7148 300 13.30 62.84 28.01
100 150 9.79 47.68 36.69150 106 4.54 37.69 51.83200 75 3.35 33.98 61.03270 53 2.61 35.36 65.28400 38 1.37 35.80 70.05500 25 2.54 37.46 70.73-500 -25 10.53 16.25 71.23
Ore Horizon 2B
Ore Horizon 3
Size Davis Tube Concentrate
Ore Horizon 2A
Size Davis Tube Concentrate
30
APPENDIX 3
RESULTS OF LIBERATION CHARACTERIZATION TESTS ON SAMPLES FROM SITE 3
31
(mesh) (micron) Weight (%) % weight % Mag Iron4 4750 0.00 0.00 0.008 2360 14.35 91.28 24.6514 1180 15.18 83.06 22.5828 600 16.07 76.37 23.6348 300 15.19 64.88 25.27
100 150 10.74 48.89 31.99150 106 3.28 43.69 39.00200 75 5.07 39.90 47.84270 53 3.02 36.20 56.35400 38 2.76 34.39 60.43500 25 2.81 32.38 64.24-500 -25 11.54 18.53 69.34
(mesh) (micron) Weight (%) % weight % Mag Iron4 4750 0.00 0.00 0.008 2360 2.81 88.81 24.8014 1180 5.09 85.03 25.2828 600 15.04 78.23 25.6748 300 20.21 65.67 26.06
100 150 15.00 62.48 32.60150 106 5.77 44.09 40.42200 75 6.04 39.08 48.01270 53 4.37 36.25 56.25400 38 4.18 33.60 60.99500 25 4.29 32.96 65.04-500 -25 17.22 19.08 67.97
(mesh) (micron) Weight (%) % weight % Mag Iron4 4750 2.94 90.20 11.378 2360 14.85 87.61 19.4814 1180 17.53 89.51 17.9828 600 19.36 77.76 20.8748 300 11.13 64.83 23.68
100 150 6.91 52.34 30.47150 106 3.33 44.17 41.17200 75 2.36 41.23 51.38270 53 2.47 38.66 59.10400 38 2.21 37.67 61.85500 25 2.62 35.72 66.18-500 -25 14.28 19.17 68.54
Size Davis Tube Concentrate
Primary Mill Discharge
Size Davis Tube Concentrate
Primary Mill Feed: 5 min Grinding
Size Davis Tube Concentrate
Primary Mill Feed: 8 min Grinding