finance norway’s capital markets day … · • founder and co-owner og sparebank 1 gruppen a/s....
TRANSCRIPT
FINANCE NORWAY’S CAPITAL MARKETS DAY London March 10 2016
ECC banks, savings bank shares. Shares with a shock absorber

SpareBank1 SMN, Strong local footprint
3
Core market Overview
History
• MARKETS LEADER 200.000 retail customers and 14.000 corporates in Central Norway
• Norway’s second largest savings bank with total assets of 165 NOK billion
• Founder and co-owner og SpareBank 1 Gruppen A/S. • Forward looking strategy for digitalisation in
customer interfaces and bank operations.
Established in 1823 Regional bank for Mid-Norway since 1985 Listed Oslo Stock Exchange since 1994 SpareBank 1 Alliance from 1996 In Romsdal and Ålesund after acquisition of Romsdals
Fellesbank AS (2005), and BN Bank (2009)
History of strong value creation, 15% ROE last 20 yrs Q4 2015
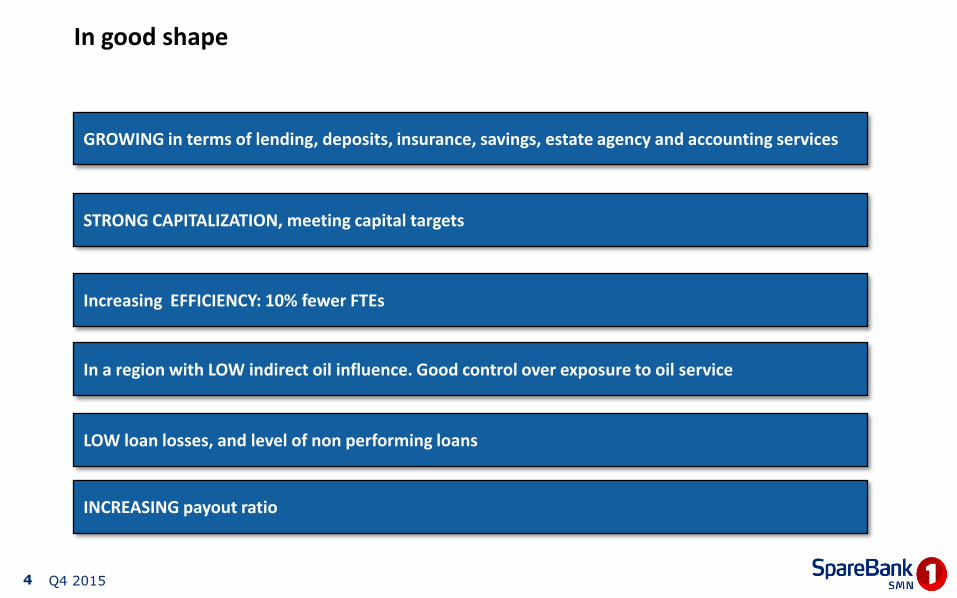
In good shape
Q4 2015
GROWING in terms of lending, deposits, insurance, savings, estate agency and accounting services
Increasing EFFICIENCY: 10% fewer FTEs
LOW loan losses, and level of non performing loans
In a region with LOW indirect oil influence. Good control over exposure to oil service
STRONG CAPITALIZATION, meeting capital targets
INCREASING payout ratio
4
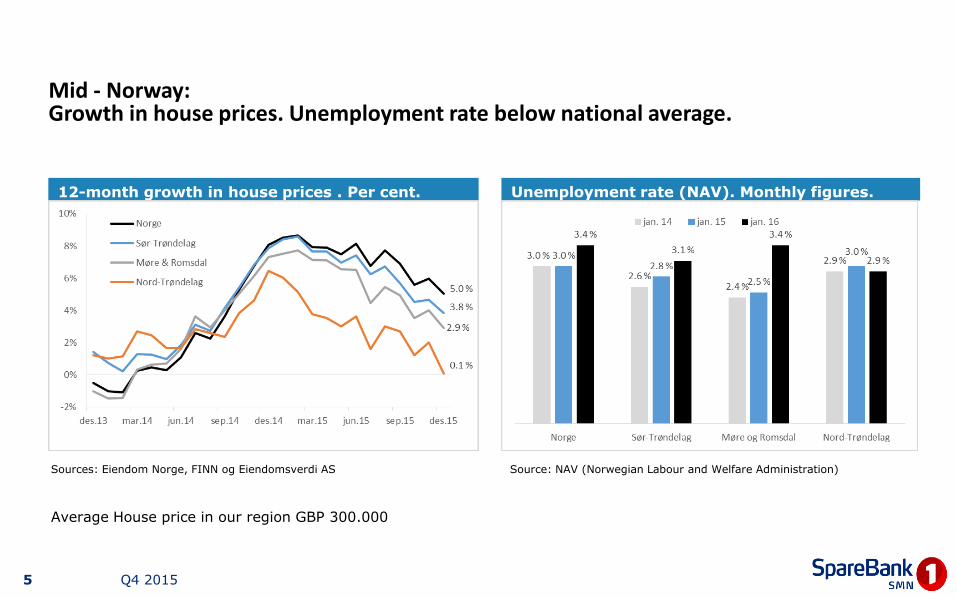
Mid - Norway: Growth in house prices. Unemployment rate below national average.
5
Unemployment rate (NAV). Monthly figures. Jan14 - Jan16
12-month growth in house prices . Per cent. Dec13 – Dec15
Sources: Eiendom Norge, FINN og Eiendomsverdi AS Source: NAV (Norwegian Labour and Welfare Administration)
Q4 2015
Average House price in our region GBP 300.000
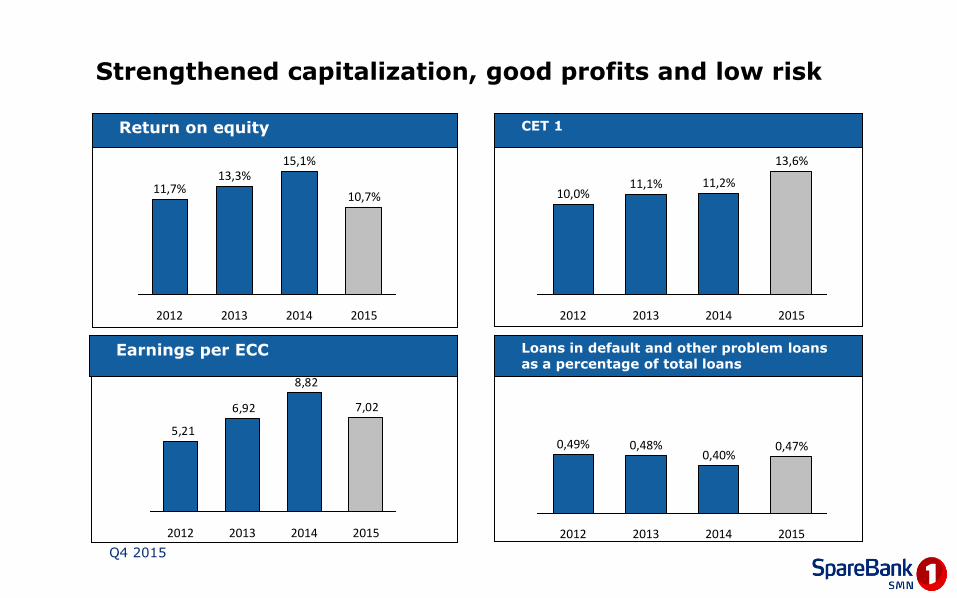
CET 1
Earnings per ECC
Return on equity
6
Loans in default and other problem loans as a percentage of total loans
Strengthened capitalization, good profits and low risk
Q4 2015
2015
10,7%
2014
15,1%
2013
13,3%
2012
11,7% 11,2%
2013
11,1%
2012
10,0%
2015
13,6%
2014
7,02
8,82
6,92
5,21
2015 2014 2013 2012
0,48%
2012
0,49%
2015
0,47%
2014
0,40%
2013
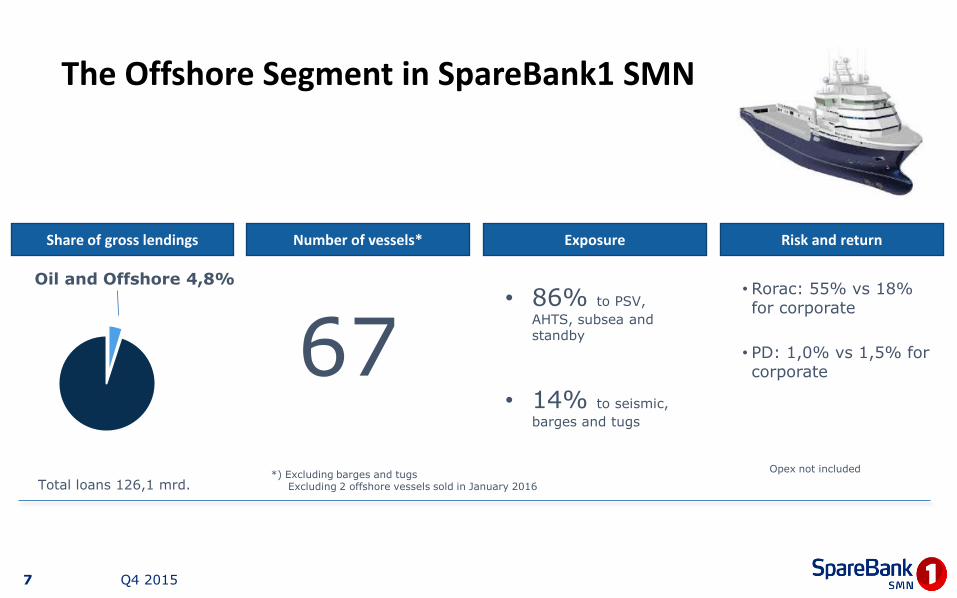
The Offshore Segment in SpareBank1 SMN
7
Oil and Offshore 4,8%
Share of gross lendings
Total loans 126,1 mrd.
Number of vessels* Exposure Risk and return
67 • Rorac: 55% vs 18% for corporate
• PD: 1,0% vs 1,5% for corporate
• 86% to PSV,
AHTS, subsea and standby
• 14% to seismic,
barges and tugs
*) Excluding barges and tugs Excluding 2 offshore vessels sold in January 2016
Opex not included
Q4 2015
Q4 2015
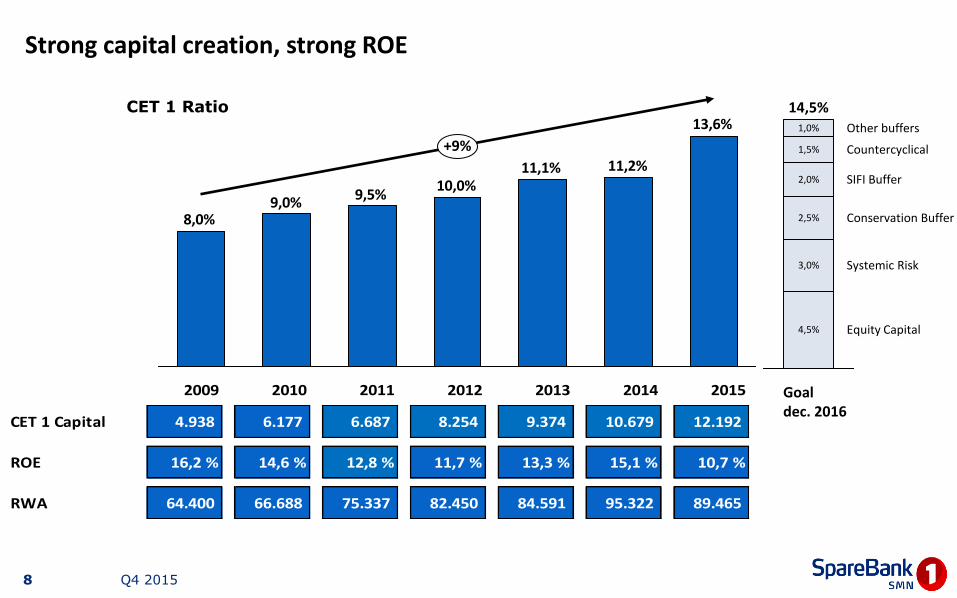
13,6%
11,2%11,1%10,0%
9,5%9,0%
8,0%
+9%
3,0%
2,0%
1,5%
4,5%
2,5%
Other buffers
SIFI Buffer
14,5%
Countercyclical
Goal dec. 2016
Systemic Risk
Equity Capital
Conservation Buffer
1,0%
CET 1 Ratio
Strong capital creation, strong ROE
2009 2010 2011 2012 2013 2014 2015
CET 1 Capital 4.938 6.177 6.687 8.254 9.374 10.679 12.192
ROE 16,2 % 14,6 % 12,8 % 11,7 % 13,3 % 15,1 % 10,7 %
RWA 64.400 66.688 75.337 82.450 84.591 95.322 89.465
8
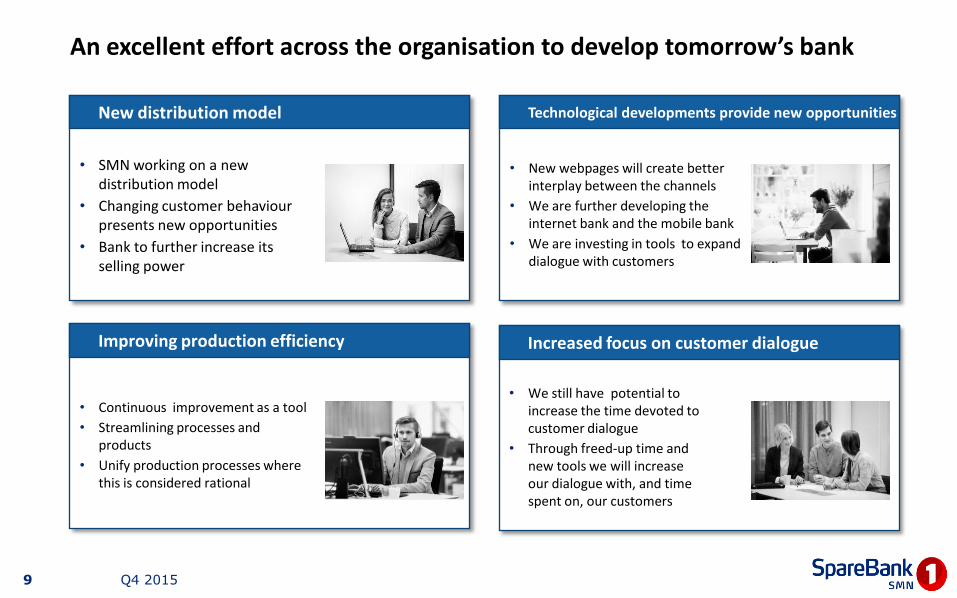
An excellent effort across the organisation to develop tomorrow’s bank
New distribution model
• SMN working on a new distribution model
• Changing customer behaviour presents new opportunities
• Bank to further increase its selling power
Improving production efficiency
• Continuous improvement as a tool
• Streamlining processes and products
• Unify production processes where this is considered rational
Technological developments provide new opportunities
• New webpages will create better interplay between the channels
• We are further developing the internet bank and the mobile bank
• We are investing in tools to expand dialogue with customers
Increased focus on customer dialogue
• We still have potential to increase the time devoted to customer dialogue
• Through freed-up time and new tools we will increase our dialogue with, and time spent on, our customers
Q4 2015 9
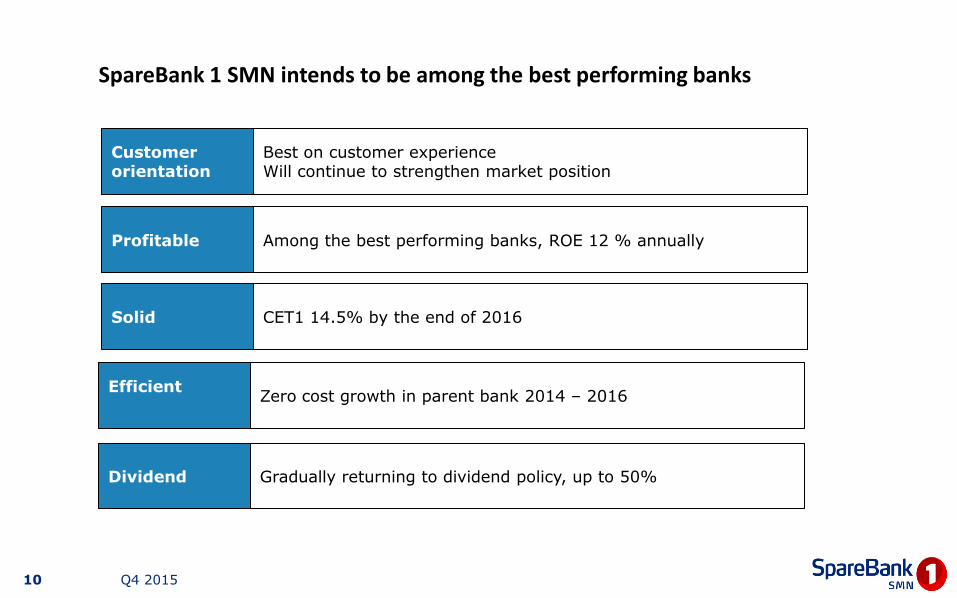
SpareBank 1 SMN intends to be among the best performing banks
Solid CET1 14.5% by the end of 2016
Efficient
Zero cost growth in parent bank 2014 – 2016
Dividend Gradually returning to dividend policy, up to 50%
Profitable Among the best performing banks, ROE 12 % annually
Customer orientation
Best on customer experience Will continue to strengthen market position
Q4 2015 10

SMN markets estimates, growing Book value
Q4 2015 11

Appendix
Q4 2015 12
13
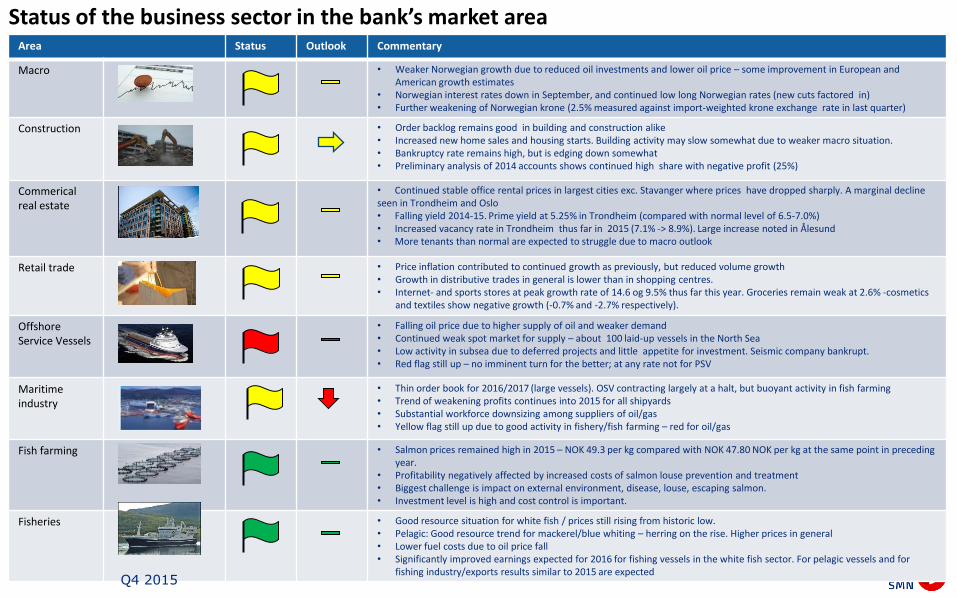
Area Status Outlook Commentary
Macro
• Weaker Norwegian growth due to reduced oil investments and lower oil price – some improvement in European and American growth estimates
• Norwegian interest rates down in September, and continued low long Norwegian rates (new cuts factored in) • Further weakening of Norwegian krone (2.5% measured against import-weighted krone exchange rate in last quarter)
Construction • Order backlog remains good in building and construction alike • Increased new home sales and housing starts. Building activity may slow somewhat due to weaker macro situation. • Bankruptcy rate remains high, but is edging down somewhat • Preliminary analysis of 2014 accounts shows continued high share with negative profit (25%)
Commerical real estate
• Continued stable office rental prices in largest cities exc. Stavanger where prices have dropped sharply. A marginal decline seen in Trondheim and Oslo • Falling yield 2014-15. Prime yield at 5.25% in Trondheim (compared with normal level of 6.5-7.0%) • Increased vacancy rate in Trondheim thus far in 2015 (7.1% -> 8.9%). Large increase noted in Ålesund • More tenants than normal are expected to struggle due to macro outlook
Retail trade • Price inflation contributed to continued growth as previously, but reduced volume growth • Growth in distributive trades in general is lower than in shopping centres. • Internet- and sports stores at peak growth rate of 14.6 og 9.5% thus far this year. Groceries remain weak at 2.6% -cosmetics
and textiles show negative growth (-0.7% and -2.7% respectively).
Offshore Service Vessels
• Falling oil price due to higher supply of oil and weaker demand • Continued weak spot market for supply – about 100 laid-up vessels in the North Sea • Low activity in subsea due to deferred projects and little appetite for investment. Seismic company bankrupt. • Red flag still up – no imminent turn for the better; at any rate not for PSV
Maritime industry
• Thin order book for 2016/2017 (large vessels). OSV contracting largely at a halt, but buoyant activity in fish farming • Trend of weakening profits continues into 2015 for all shipyards • Substantial workforce downsizing among suppliers of oil/gas • Yellow flag still up due to good activity in fishery/fish farming – red for oil/gas
Fish farming
• Salmon prices remained high in 2015 – NOK 49.3 per kg compared with NOK 47.80 NOK per kg at the same point in preceding year.
• Profitability negatively affected by increased costs of salmon louse prevention and treatment • Biggest challenge is impact on external environment, disease, louse, escaping salmon. • Investment level is high and cost control is important.
Fisheries
• Good resource situation for white fish / prices still rising from historic low. • Pelagic: Good resource trend for mackerel/blue whiting – herring on the rise. Higher prices in general • Lower fuel costs due to oil price fall • Significantly improved earnings expected for 2016 for fishing vessels in the white fish sector. For pelagic vessels and for
fishing industry/exports results similar to 2015 are expected
Status of the business sector in the bank’s market area
Q4 2015
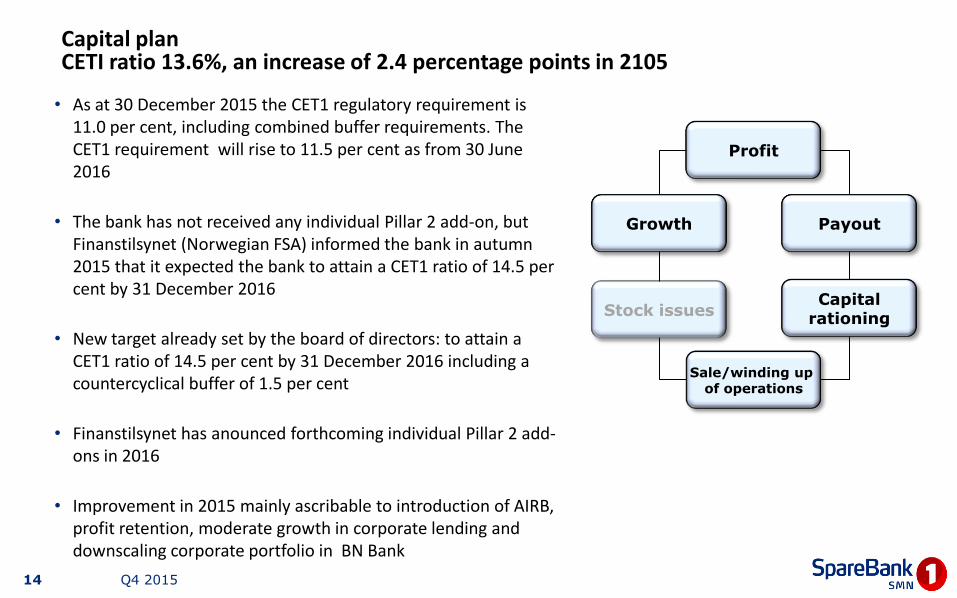
Capital plan CETI ratio 13.6%, an increase of 2.4 percentage points in 2105
• As at 30 December 2015 the CET1 regulatory requirement is 11.0 per cent, including combined buffer requirements. The CET1 requirement will rise to 11.5 per cent as from 30 June 2016
• The bank has not received any individual Pillar 2 add-on, but Finanstilsynet (Norwegian FSA) informed the bank in autumn 2015 that it expected the bank to attain a CET1 ratio of 14.5 per cent by 31 December 2016
• New target already set by the board of directors: to attain a CET1 ratio of 14.5 per cent by 31 December 2016 including a countercyclical buffer of 1.5 per cent
• Finanstilsynet has anounced forthcoming individual Pillar 2 add-ons in 2016
• Improvement in 2015 mainly ascribable to introduction of AIRB, profit retention, moderate growth in corporate lending and downscaling corporate portfolio in BN Bank
Profit
Payout
Capital rationing
Growth
Stock issues
Sale/winding up of operations
Q4 2015 14
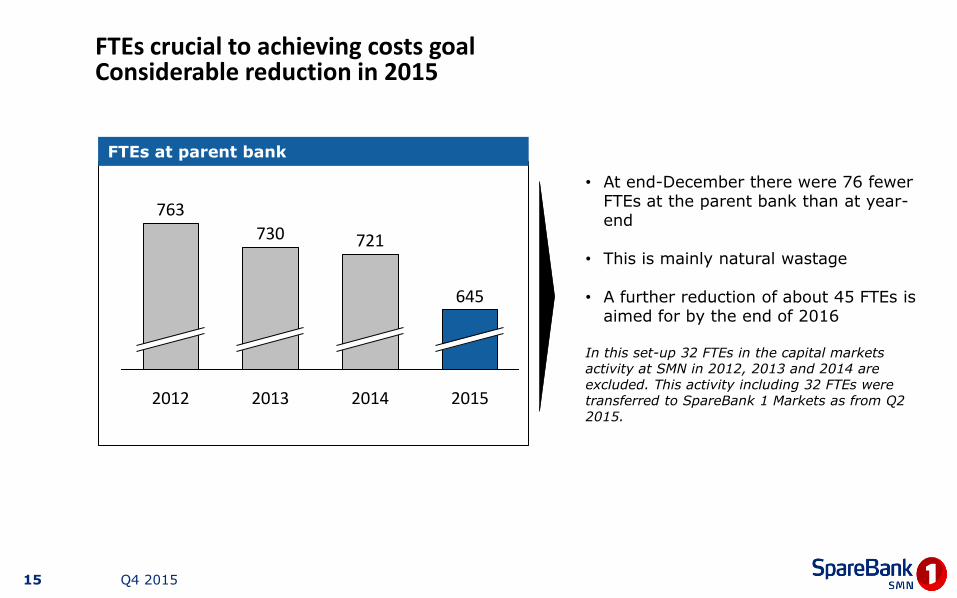
FTEs crucial to achieving costs goal Considerable reduction in 2015
FTEs at parent bank
• At end-December there were 76 fewer FTEs at the parent bank than at year-end
• This is mainly natural wastage
• A further reduction of about 45 FTEs is aimed for by the end of 2016
In this set-up 32 FTEs in the capital markets activity at SMN in 2012, 2013 and 2014 are excluded. This activity including 32 FTEs were transferred to SpareBank 1 Markets as from Q2 2015.
Q4 2015
2014
721
2013
730
2012
763
2015
645
15
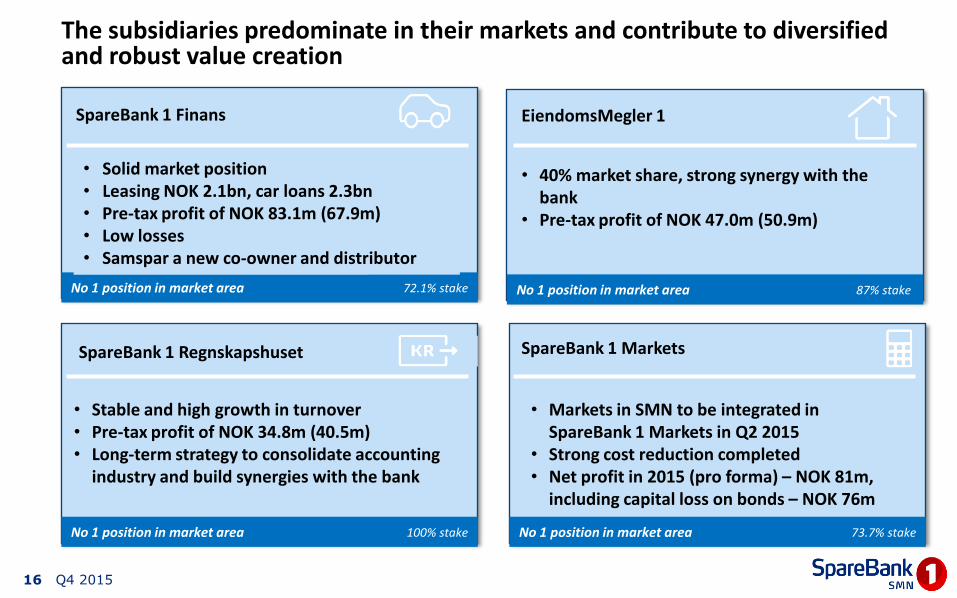
The subsidiaries predominate in their markets and contribute to diversified and robust value creation
Q4 2015
SpareBank 1 Finans EiendomsMegler 1
SpareBank 1 Regnskapshuset SpareBank 1 Markets
• 40% market share, strong synergy with the bank
• Pre-tax profit of NOK 47.0m (50.9m)
No 1 position in market area
• Solid market position • Leasing NOK 2.1bn, car loans 2.3bn • Pre-tax profit of NOK 83.1m (67.9m) • Low losses • Samspar a new co-owner and distributor
• Stable and high growth in turnover • Pre-tax profit of NOK 34.8m (40.5m) • Long-term strategy to consolidate accounting
industry and build synergies with the bank
• Markets in SMN to be integrated in SpareBank 1 Markets in Q2 2015
• Strong cost reduction completed • Net profit in 2015 (pro forma) – NOK 81m,
including capital loss on bonds – NOK 76m
No 1 position in market area
No 1 position in market area No 1 position in market area
72.1% stake 87% stake
100% stake 73.7% stake
16
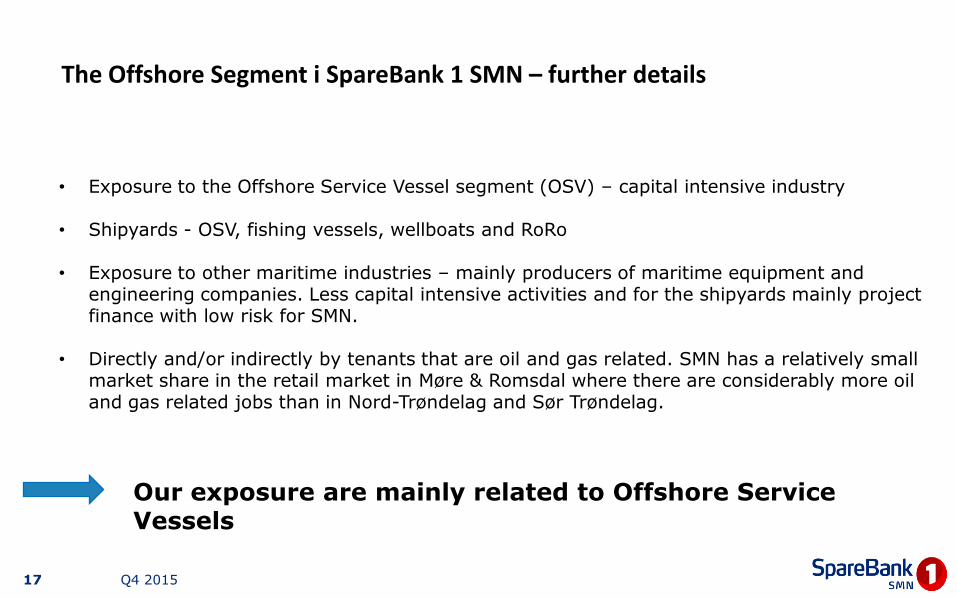
The Offshore Segment i SpareBank 1 SMN – further details
17
• Exposure to the Offshore Service Vessel segment (OSV) – capital intensive industry
• Shipyards - OSV, fishing vessels, wellboats and RoRo
• Exposure to other maritime industries – mainly producers of maritime equipment and
engineering companies. Less capital intensive activities and for the shipyards mainly project finance with low risk for SMN.
• Directly and/or indirectly by tenants that are oil and gas related. SMN has a relatively small market share in the retail market in Møre & Romsdal where there are considerably more oil and gas related jobs than in Nord-Trøndelag and Sør Trøndelag.
Our exposure are mainly related to Offshore Service Vessels
Q4 2015
Conclusion
• SMN’s corporate portfolio shows excellent diversification. About 5% of the bank’s total lending exposure is to petroleum-related activities. This is primarily financing of OSV vessels.
• Portfolio quality is broadly high – however the risk inherent in the OSV segment is also high.
• As of Q4 15, SMN has collectively assessed write-downs of NOK 376m, of which NOK 96m are related to retail borrowers. Losses related to petroleum-related activities are booked at NOK 132.5m, including collectively assesses write-downs of NOK 80m.
• Just under 10 persons are engaged in financing activities in the oil and offshore sector. This requires some leadership focus but does not remove the focus from the bank’s core business in general.
• SMN is very well positioned to withstand a further decline in the oil service market. This assessment is based on the bank's position as a secured creditor, its high level of collectively assessed loss provisions and its history of conservative practice as regards loss assessment. Given its very good earnings and CET1 capital ratio, SpareBank 1 SMN's loss-absorbing capacity is among the best in the market.
18 Q4 2015
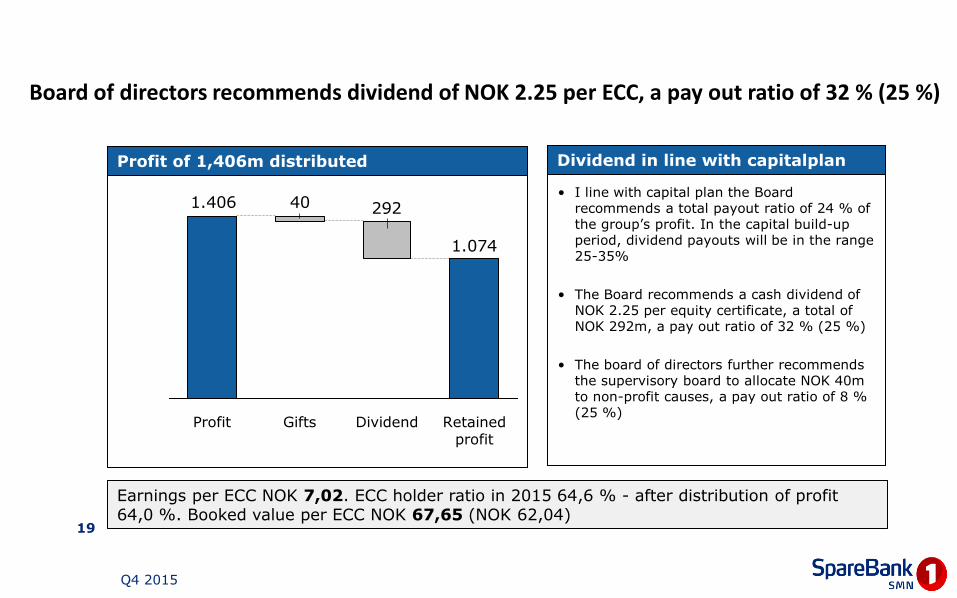
Board of directors recommends dividend of NOK 2.25 per ECC, a pay out ratio of 32 % (25 %)
• I line with capital plan the Board recommends a total payout ratio of 24 % of the group’s profit. In the capital build-up period, dividend payouts will be in the range 25-35%
• The Board recommends a cash dividend of NOK 2.25 per equity certificate, a total of NOK 292m, a pay out ratio of 32 % (25 %)
• The board of directors further recommends the supervisory board to allocate NOK 40m to non-profit causes, a pay out ratio of 8 % (25 %)
Dividend in line with capitalplan
19
Profit of 1,406m distributed
Earnings per ECC NOK 7,02. ECC holder ratio in 2015 64,6 % - after distribution of profit 64,0 %. Booked value per ECC NOK 67,65 (NOK 62,04)
1.074
292401.406
Dividend Retained profit
Gifts Profit
Q4 2015

OCI (other comprehensive income) strenghtens the Groups’s equity
• Items not reclassified to
profit/loss relate to pensions
• Items to be reclassified to profit/loss relate mainly to the gain on a transaction related to the sale of Visa Europe to Visa Inc.
• Strengthens the CET1 ratio by 23 points in 2015
OCI, NOKm
Q4 2015
Comments
2015 2014
Items that will not be reclassified to profit/loss
Actuarial gains and losses pensions 115 -117
Tax -28 31
Share of other comprehensive income of associates 36 -9
Total 123 -94
Items that will be reclassified to profit/loss
Available-for-sale financial assets 78 -2
Share of other comprehensive income of associates 1 0
Tax -1 0
Total 78 -2
Total other comprehensive income 201 -96
20
Financial results 4th quarter 2015

Net profit NOK 1,406m (1,782m, including gains Nets 156m)
Return on equity 10.7 % (15.1 %)
Result of core business NOK 1,318m (1,424m)
Cost growth parent bank 0.8 % (3.1%)
CET 1 13.6 % (11.2 %)
CET1 capital at 11.4% (10.3%)
2015
Growth in lending RM 9.0 % (7.6%) and CM 0.7 % (6.1%), deposits 5.6 % (8.5 %) last 12 months
Booked equity capital per ECC NOK 67.65 (62.04), profit per ECC NOK 7.02 (NOK 8.82)
Q4 2015 22

Q4 2015
Profit NOK 287m (375m)
ROE 8.4 % (12.1 %)
Result of core business NOK 279m (343m)
Growth in lending RM 2.4 % (2.1 %) and CM -1.4 % (5.6 %) in Q4 2015
Earnings per ECC NOK 1.45 (1.85)
Q4 2015 23

Key figures, quarterly CET 1
Earnings per ECC
Return on equity
FTEs parent bank
24 Q4 2015
7,4%
Q2 15
13,4%
Q1 15
14,1%
Q4 14
12,1%
Q4 15
8,4%
Q3 15 Q4 15
13,6%
Q3 15
13,2%
Q2 15
12,7%
Q1 15
12,3%
Q4 14
11,2%
1,451,26
2,132,18
1,85
Q4 14 Q4 15 Q3 15 Q2 15 Q1 15
645660672686721
Q1 15 Q2 15 Q3 15 Q4 14 Q4 15
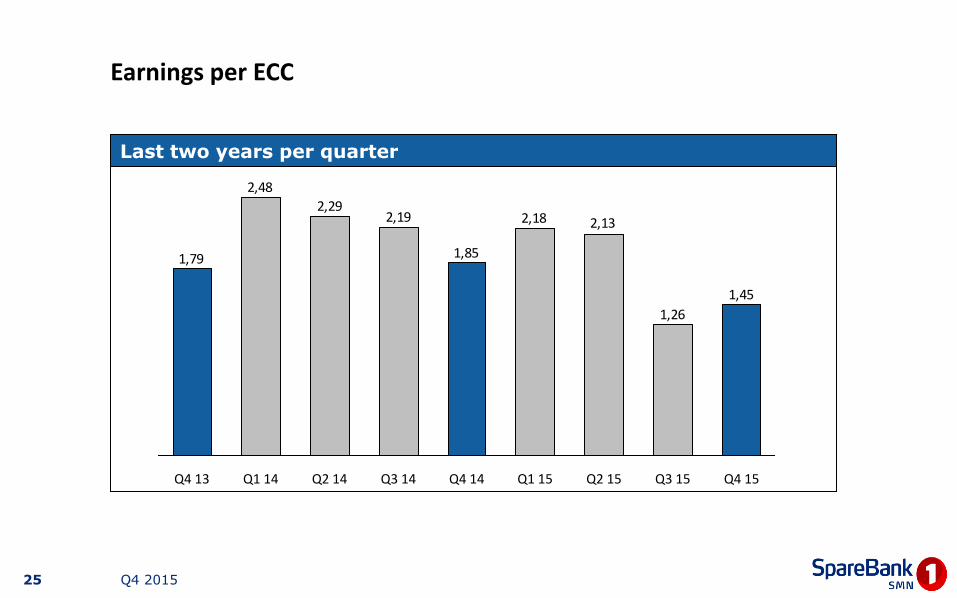
Earnings per ECC
Last two years per quarter
Q4 2015
1,45
1,26
2,132,18
1,85
2,192,29
2,48
1,79
Q2 15 Q3 15 Q1 15 Q4 14 Q3 14 Q2 14 Q1 14 Q4 13 Q4 15
25
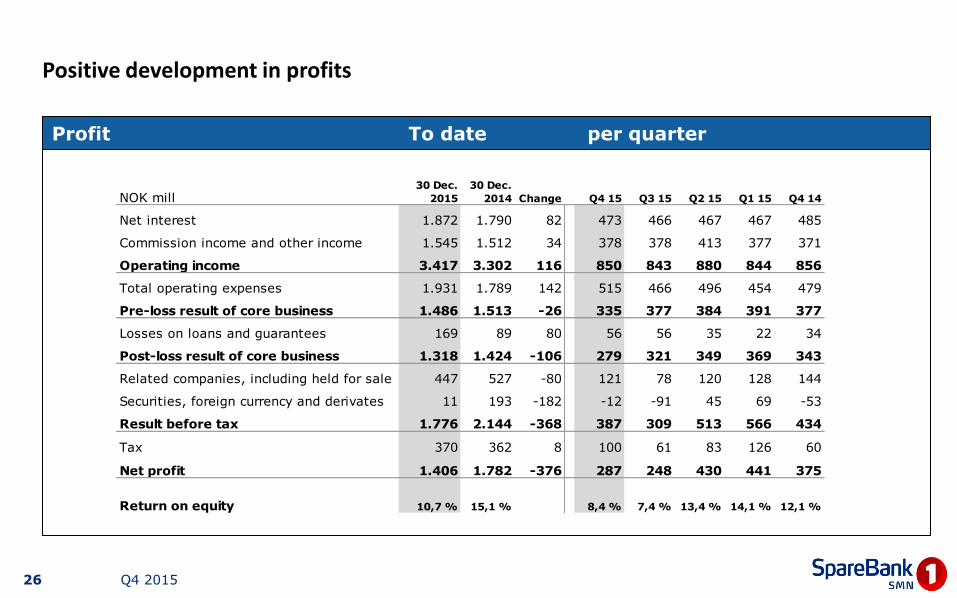
Positive development in profits
Profit To date per quarter
Q4 2015
NOK mill30 Dec.
2015
30 Dec.
2014 Change Q4 15 Q3 15 Q2 15 Q1 15 Q4 14
Net interest 1.872 1.790 82 473 466 467 467 485
Commission income and other income 1.545 1.512 34 378 378 413 377 371
Operating income 3.417 3.302 116 850 843 880 844 856
Total operating expenses 1.931 1.789 142 515 466 496 454 479
Pre-loss result of core business 1.486 1.513 -26 335 377 384 391 377
Losses on loans and guarantees 169 89 80 56 56 35 22 34
Post-loss result of core business 1.318 1.424 -106 279 321 349 369 343
Related companies, including held for sale 447 527 -80 121 78 120 128 144
Securities, foreign currency and derivates 11 193 -182 -12 -91 45 69 -53
Result before tax 1.776 2.144 -368 387 309 513 566 434
Tax 370 362 8 100 61 83 126 60
Net profit 1.406 1.782 -376 287 248 430 441 375
Return on equity 10,7 % 15,1 % 8,4 % 7,4 % 13,4 % 14,1 % 12,1 %
26
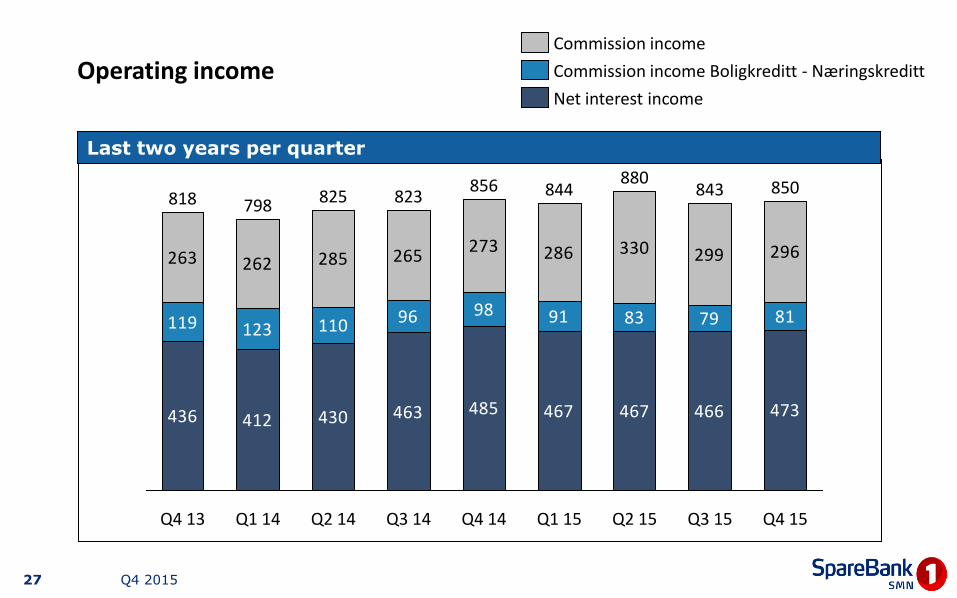
Operating income
Last two years per quarter
Q4 2015
436 412 430 463 485 467 467 466 473
119 123 110 96 98 91 83 79 81
263 262 285 265273 286 330 299 296
Q3 15
843
Q2 15
880
Q1 15
844
Q4 14
856
Q3 14
823
Q2 14
825
Q1 14
798
Q4 13
818
Q4 15
850
Net interest income
Commission income Boligkreditt - Næringskreditt
Commission income
27
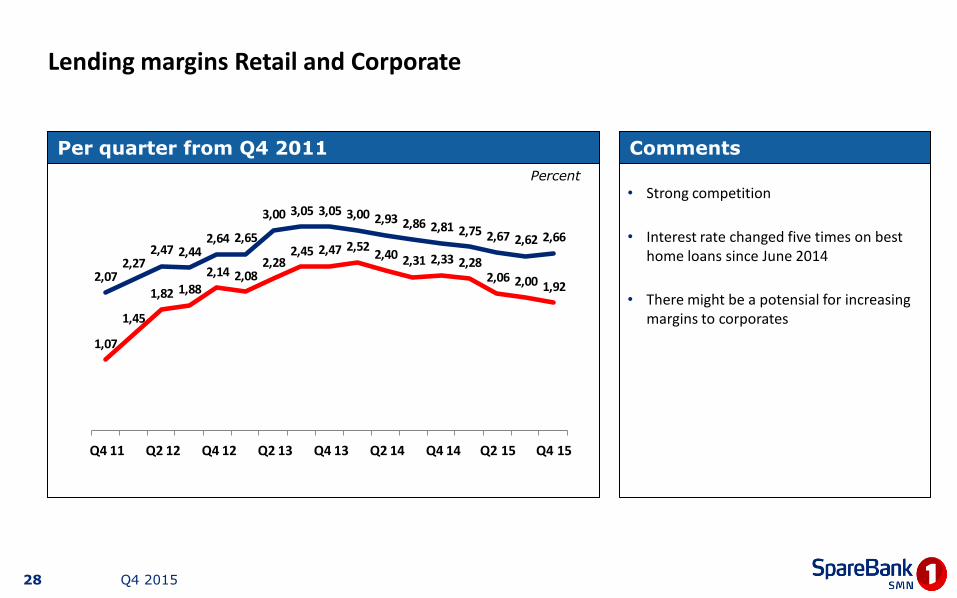
Lending margins Retail and Corporate
• Strong competition
• Interest rate changed five times on best home loans since June 2014
• There might be a potensial for increasing margins to corporates
Per quarter from Q4 2011 Comments
Percent
Q4 2015
1,07
1,45
1,82 1,88
2,14 2,082,28
2,45 2,47 2,522,40 2,31 2,33 2,28
2,06 2,00 1,922,07
2,272,47 2,44
2,64 2,65
3,00 3,05 3,05 3,00 2,93 2,86 2,81 2,75 2,67 2,62 2,66
Q4 11 Q2 12 Q4 12 Q2 13 Q4 13 Q2 14 Q4 14 Q2 15 Q4 15
28

RM
38%CM
38%
Boligkr.
25 %
Loans
Total growth lending 5.8 % last 12 months Lending RM +9.0 % last 12 months, 2.4 % in Q4 15
Lending CM +0.7 % in last 12 months, -1.4 % in Q4 15
Q4 2015
68,5 74,1 80,7
9,0% 8,2%
31.12.15 31.12.14 31.12.13
43,5 46,3 46,7
+6,5% +0,7%
31.12.15 31.12.14 31.12.13
29
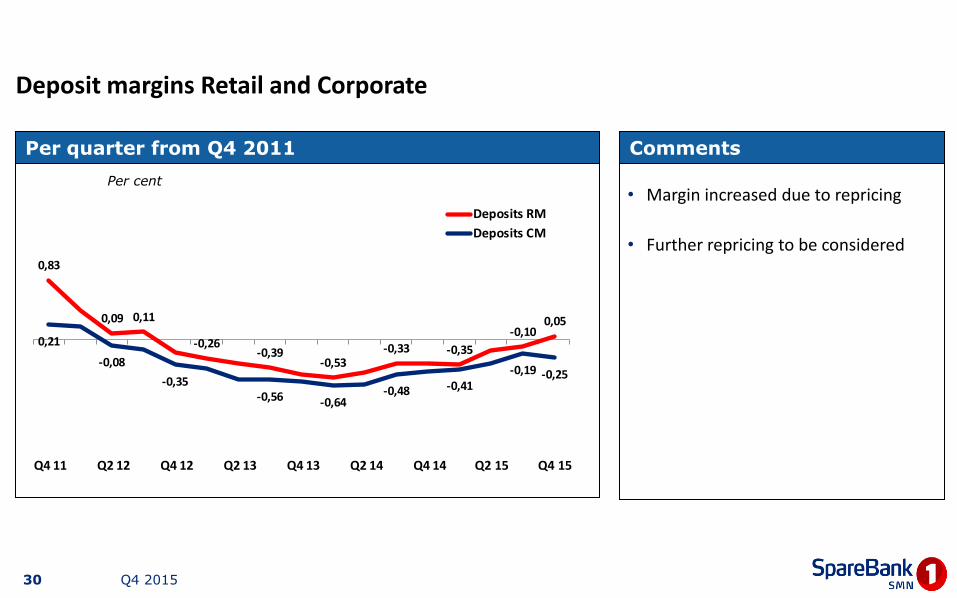
Deposit margins Retail and Corporate
• Margin increased due to repricing
• Further repricing to be considered
Per quarter from Q4 2011 Comments
Per cent
Q4 2015
0,83
0,09 0,11
-0,26-0,39
-0,53-0,33 -0,35
-0,100,05
0,21
-0,08
-0,35-0,56 -0,64
-0,48 -0,41-0,19 -0,25
Q4 11 Q2 12 Q4 12 Q2 13 Q4 13 Q2 14 Q4 14 Q2 15 Q4 15
Deposits RM
Deposits CM
30

Total growth deposits 5.6 % in 2015
Deposits RM + 6.9 %
Deposits CM + 4.6 %
Q4 2015
23,9 26,5 28,3
+6,9% +10,9%
31.12.15 31.12.14 31.12.13
32,1 34,2 35,8
+6,7% +4,6%
31.12.15 31.12.14 31.12.13
RM
44%
CM
56%
Deposits
31
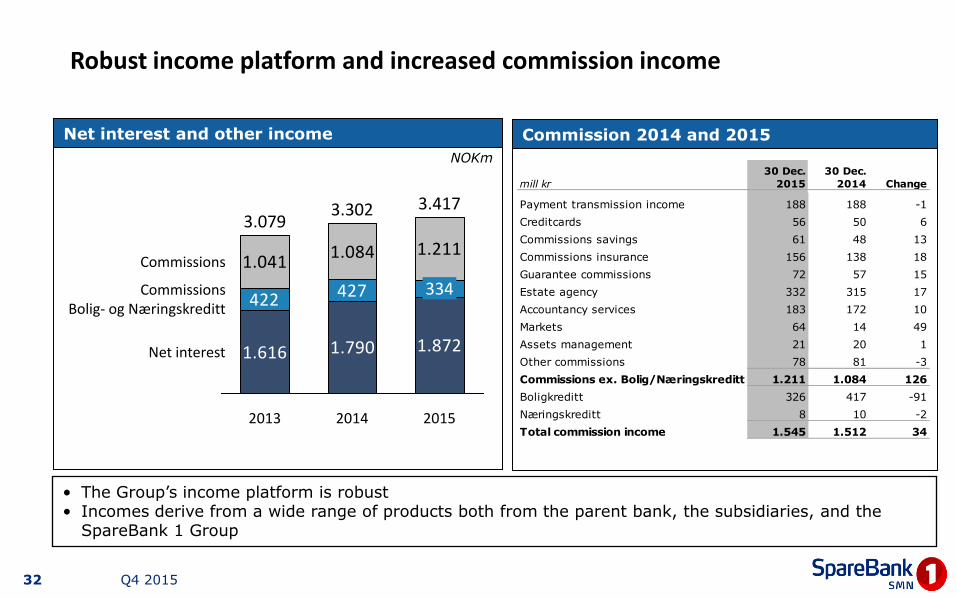
Robust income platform and increased commission income
NOKm
Net interest and other income
• The Group’s income platform is robust • Incomes derive from a wide range of products both from the parent bank, the subsidiaries, and the
SpareBank 1 Group
Commission 2014 and 2015
Q4 2015
1.616 1.790 1.872
422 427
1.0411.084 1.211
Net interest
2015
Commissions Bolig- og Næringskreditt
Commissions
3.417
334
2014
3.302
2013
3.079
mill kr
30 Dec.
2015
30 Dec.
2014 Change
Payment transmission income 188 188 -1
Creditcards 56 50 6
Commissions savings 61 48 13
Commissions insurance 156 138 18
Guarantee commissions 72 57 15
Estate agency 332 315 17
Accountancy services 183 172 10
Markets 64 14 49
Assets management 21 20 1
Other commissions 78 81 -3
Commissions ex. Bolig/Næringskreditt 1.211 1.084 126
Boligkreditt 326 417 -91
Næringskreditt 8 10 -2
Total commission income 1.545 1.512 34
32

Subsidiaries
Profit subsidiaries pre tax to date per quarter
Q4 2015
30 Dec.
2015
30 Dec.
2014 Change Q4 15 Q3 15 Q2 15 Q1 15 Q4 14
EiendomsMegler 1 Midt-Norge (87 %) 47,0 50,9 -3,9 7,5 10,3 21,3 7,8 8,7
SpareBank 1 Regnskapshuset SMN 34,8 40,5 -5,7 8,8 5,7 12,4 7,9 16,4
SpareBank 1 Finans Midt-Norge (90 %) 83,1 67,9 15,1 19,5 20,1 22,2 21,3 18,1
Allegro Kapitalforvaltning (90 %) 1,4 2,6 -1,2 -0,7 0,7 1,0 0,3 3,9
SpareBank 1 SMN Invest 38,6 1,7 36,9 5,6 20,0 12,1 0,9 -29,4
SpareBank 1 Markets (73 %) -84,1 - - -21,4 -52,6
33
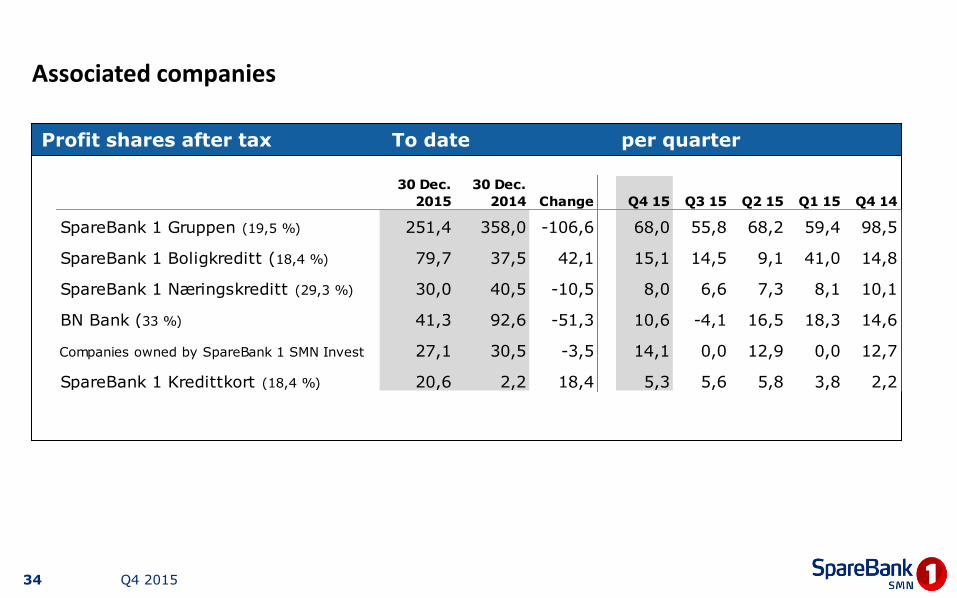
Associated companies
Profit shares after tax To date per quarter
Q4 2015
30 Dec.
2015
30 Dec.
2014 Change Q4 15 Q3 15 Q2 15 Q1 15 Q4 14
SpareBank 1 Gruppen (19,5 %) 251,4 358,0 -106,6 68,0 55,8 68,2 59,4 98,5
SpareBank 1 Boligkreditt (18,4 %) 79,7 37,5 42,1 15,1 14,5 9,1 41,0 14,8
SpareBank 1 Næringskreditt (29,3 %) 30,0 40,5 -10,5 8,0 6,6 7,3 8,1 10,1
BN Bank (33 %) 41,3 92,6 -51,3 10,6 -4,1 16,5 18,3 14,6
Companies owned by SpareBank 1 SMN Invest 27,1 30,5 -3,5 14,1 0,0 12,9 0,0 12,7
SpareBank 1 Kredittkort (18,4 %) 20,6 2,2 18,4 5,3 5,6 5,8 3,8 2,2
34
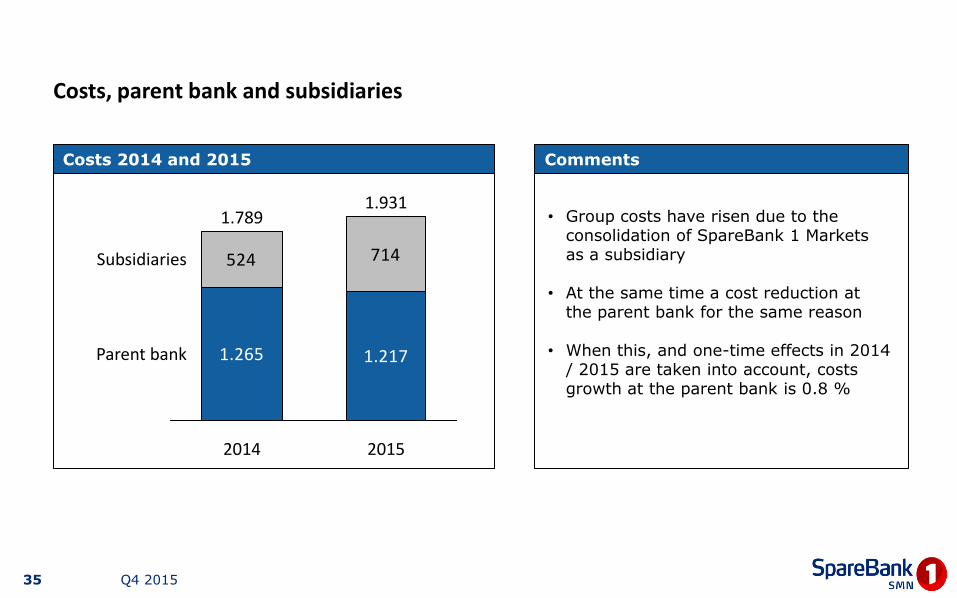
Costs, parent bank and subsidiaries
Costs 2014 and 2015
• Group costs have risen due to the consolidation of SpareBank 1 Markets as a subsidiary
• At the same time a cost reduction at the parent bank for the same reason
• When this, and one-time effects in 2014 / 2015 are taken into account, costs growth at the parent bank is 0.8 %
Comments
Q4 2015
1.265 1.217
524 714
2015
Subsidiaries
2014
Parent bank
1.789 1.931
35

Low losses , 169 mNOK, 0.14 % of total gross lending, including 82 mNOK, 0.07 %, collective losses provisions
Losses per quarter Distribution as of 31.12.2015 (ex. collective losses)
• Loan losses 0.14 % (0.08 %) of gross lending as of 31.12.2015
NOK mill
Q4 2015
66
5
11
CM
SMN Finans
RM
35
22
34
24
1517
32
26
51
31
5
Q4 15
56 57
Q3 15 Q2 15 Q1 15 Q4 14 Q3 14 Q2 14 Q1 14 Q4 13
36
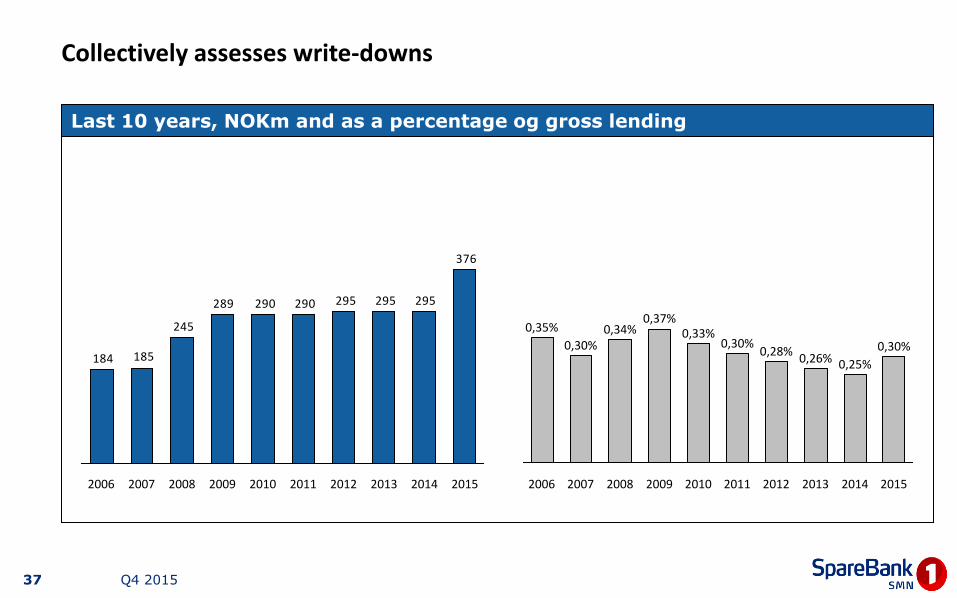
Collectively assesses write-downs
Q4 2015
376
295295295290290289
245
185184
2014 2015 2007 2006 2013 2012 2011 2010 2009 2008
Last 10 years, NOKm and as a percentage og gross lending
2011
0,30%
2009 2007
0,25%
2012
0,35% 0,34%
2010
0,30% 0,26%
2014 2015 2013 2006
0,28%
2008
0,30% 0,33%
0,37%
37

386
263
334 338
270237
287
218 205
157231
206 206
216226
368 448
399
0,34
0,240,29 0,29
0,220,19
0,230,17 0,16 0,10
0,30
0,50
0,70
0,90
1,10
1,30
1,50
0
200
400
600
800
1.000
1.200
1.400
Q4 13 Q1 14 Q2 14 Q3 14 Q4 14 Q1 15 Q2 15 Q3 15 Q4 15
Problem loans
Loans in default
Loans in default % of total loans
Defaults and other problem loans Low levels
Last two years, per quarter
Q4 2015 38
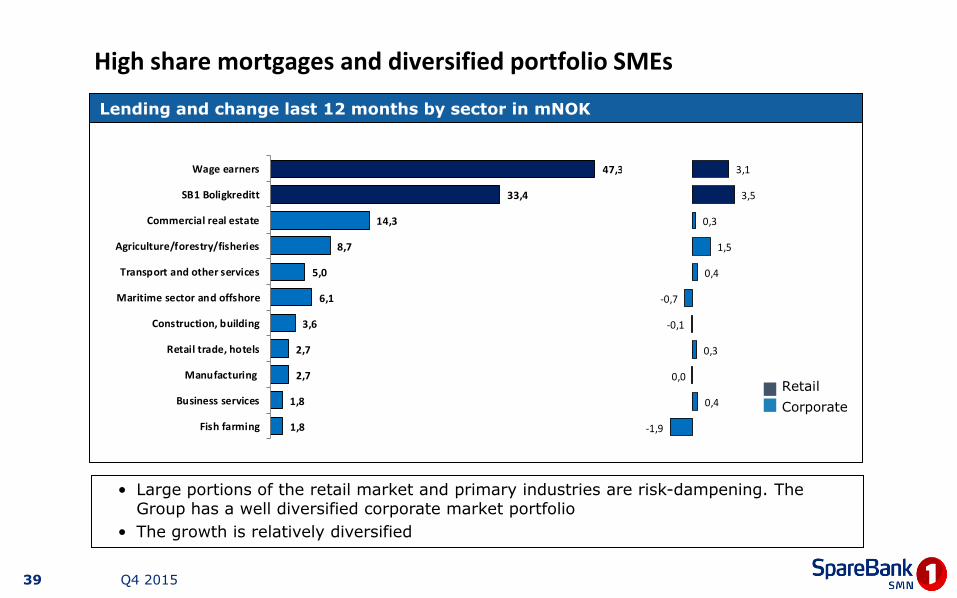
High share mortgages and diversified portfolio SMEs
Lending and change last 12 months by sector in mNOK
Corporate
Retail
• Large portions of the retail market and primary industries are risk-dampening. The Group has a well diversified corporate market portfolio
• The growth is relatively diversified
Q4 2015
1,8
1,8
2,7
2,7
3,6
6,1
5,0
8,7
14,3
33,4
47,3
Fish farming
Business services
Manufacturing
Retail trade, hotels
Construction, building
Maritime sector and offshore
Transport and other services
Agriculture/forestry/fisheries
Commercial real estate
SB1 Boligkreditt
Wage earners
-1,9
0,4
0,0
0,3
-0,1
-0,7
0,4
1,5
0,3
3,5
3,1
39

Balance sheet
Last three years
Q4 2015
30 Dec. 2015 30 Dec. 2014 30. Dec 2014
Funds available 21,4 20,1 20,1
Net loans 93,4 90,1 90,1
Securities 1,5 0,7 0,7
Investment in related companies 5,5 5,2 5,2
Goodwill 0,5 0,5 0,5
Other assets 9,5 9,4 9,4
TOTAL ASSETS 131,9 126,0 126,0
Capital market funding 43,3 42,1 42,1
Deposits 64,1 60,7 60,7
Othe liabilities 7,1 7,3 7,3
Subordinated debt 3,5 3,4 3,4
Equity 13,9 12,5 12,5
TOTAL DEBT AND EQUITY 131,9 126,0 126,0
in addition loans sold to Boligkreditt and Næringskreditt 33,4 29,9 29,9
40

Strengthened capital
Development CET 1 without transitional arrangements (Basel III)
Development CET1
Q4 2015
13,6%
11,2%
2013 2014 2015
11,1%
2012
10,0% 11,6% 11,2%
2013 2012
10,4%
2014 2015
15,0%
41
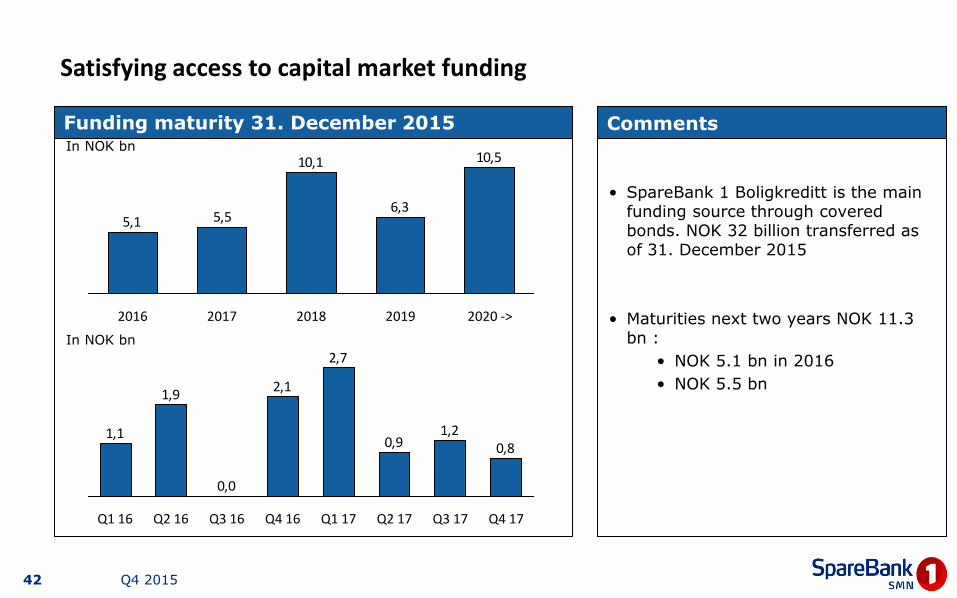
Satisfying access to capital market funding
Funding maturity 31. December 2015
• SpareBank 1 Boligkreditt is the main funding source through covered bonds. NOK 32 billion transferred as of 31. December 2015
• Maturities next two years NOK 11.3 bn :
• NOK 5.1 bn in 2016
• NOK 5.5 bn
Comments In NOK bn
In NOK bn
Q4 2015
10,5
6,3
10,1
5,55,1
2020 -> 2019 2018 2017 2016
0,81,2
0,9
2,7
2,1
0,0
1,9
1,1
Q1 16 Q2 16 Q2 17 Q1 17 Q3 16 Q4 16 Q3 17 Q4 17
42
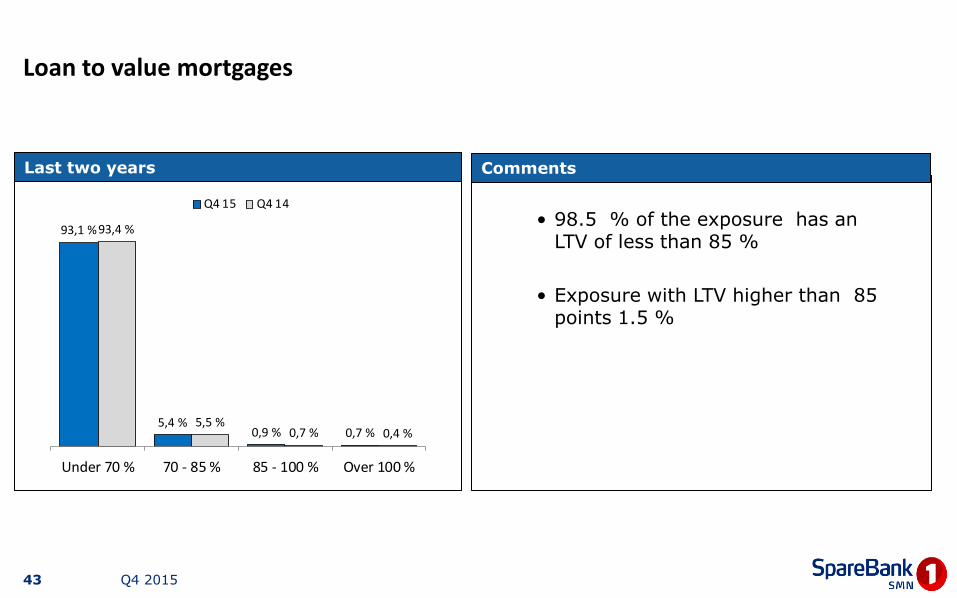
Loan to value mortgages
Comments Last two years
• 98.5 % of the exposure has an LTV of less than 85 %
• Exposure with LTV higher than 85 points 1.5 %
Q4 2015
93,1 %
5,4 %0,9 % 0,7 %
93,4 %
5,5 %0,7 % 0,4 %
Under 70 % 70 - 85 % 85 - 100 % Over 100 %
Q4 15 Q4 14
43
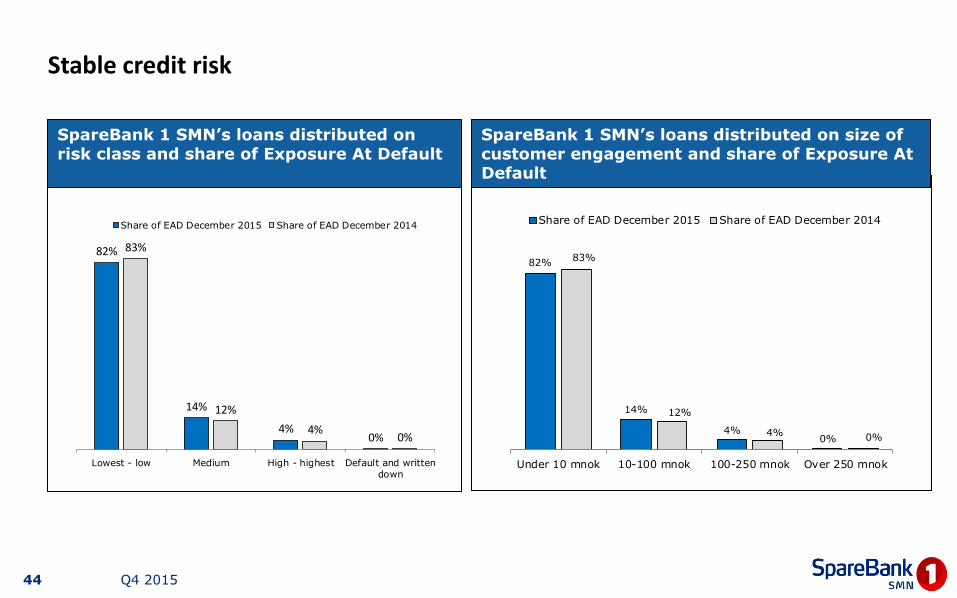
82%
14%
4%0%
83%
12%
4% 0%
Under 10 mnok 10-100 mnok 100-250 mnok Over 250 mnok
Share of EAD December 2015 Share of EAD December 2014
Stable credit risk
SpareBank 1 SMN’s loans distributed on size of customer engagement and share of Exposure At Default
SpareBank 1 SMN’s loans distributed on risk class and share of Exposure At Default
Q4 2015
82%
14%
4%0%
83%
12%
4%0%
Lowest - low Medium High - highest Default and written
down
Share of EAD December 2015 Share of EAD December 2014
44

Key figures
Last three years
Q4 2015
30 Dec. 2015 30 Dec. 2014 30 Dec. 2013
Net interest 1,46 1,52 1,40
Comm. income and net retur on fin. inv. 1,56 1,89 1,51
Operating expenses 1,50 1,52 1,57
Net profit as a percentage of ATA 1,52 1,89 1,34
CET 1 ratio 13,6 % 11,2 % 10,0 %
Core capital ratio 15,6 % 13,0 % 11,3 %
Capital adequacy 18,3 % 15,7 % 14,7 %
Growth in loans incl.Boligkreditt 5,8 % 7,3 % 10,2 %
Growth in deposits 5,6 % 8,5 % 9,2 %
Deposit-to-loan ratio 68 % 67 % 70 %
RM share loans 63 % 62 % 60 %
Cost-income ratio 50 % 44 % 54 %
Return of equity 10,7 % 15,1 % 11,7 %
Impairment losses ratio 0,14 % 0,08 % 0,06 %
45

Key figures ECC Including effects of issues
Last five years
Q4 2015
2015 2014 2013 2012 2011
ECC ratio 64,0 % 64,6 % 64,6 % 64,6 % 60,6 %
Total issued ECCs (mill) 129,83 129,83 129,83 129,83 102,76
ECC price 50,50 58,50 55,00 34,80 36,31
Market value (NOKm) 6.556 7.595 7.141 4.518 3.731
Booked equity capital per ECC 67,65 62,04 55,69 50,09 48,91
Post-tax earnings per ECC, in NOK 7,02 8,82 6,92 5,21 6,06
Dividend per ECC 2,25 2,25 1,75 1,50 1,85
P/E 7,19 6,63 7,95 5,99 6,68
Price / Booked equity capital 0,74 0,94 0,99 0,69 0,74
46
SMN home page and internet bank: www.smn.no
Hugin-Online: www.huginonline.no
Equity capital certificates in general:
www.grunnfondsbevis.no
CEO Finn Haugan Tel +47 900 41 002 E-mail: [email protected]
CFO Kjell Fordal Tel +47 905 41 672 E-mail: [email protected]
Switchboard Tel +47 07300
1. Quarter: 29. April 2015 2. Quarter: 11. august 2016 3. Quarter: 28. October 2016
SpareBank 1 SMN
7467 TRONDHEIM
Internett adresses: Financial calender 2016
Q4 2015 47