financial development and economic growth in nigeria ... · pdf filefinancial development and...
TRANSCRIPT

FINANCIAL DEVELOPMENT AND ECONOMIC GROWTH IN NIGERIA
Fidelis O. Ogwumike and Afees A. Salisu
Abstract
This paper examines the short run, long run and the causal relationship between
financial development and economic growth in Nigeria from 1975 to 2008. Using the
Bound test approach, this study finds a positive long run relationship between financial
development and economic growth in Nigeria. Financial intermediation- credit to
private sector, stock market and financial reforms exert significant positive impact on
economic growth. Further, analysis of the short run dynamics reveals that about 40%
of the resulting disequilibrium is captured each period indicating minimal deviations
from the equilibrium. In addition, the result of the VAR-Granger causality test lends
support to the supply-leading hypothesis. Therefore, appropriate regulatory and
macroeconomic policies that will foster the expansion and development of the Nigerian
financial institutions should be pursued by the relevant authority.
JEL Classification Codes: C21, C61, I32
Keywords: Financial reform, economic growth, bound-test, causality,
INTRODUCTION
The pursuit of economic growth and sustainable development is one of the core
macroeconomic goals in every nation. Economic growth is usually anchored on the
financial development of a country. This is underscored by the fact that an effective
financial system, in addition to the economic transformation role, provides the
possibility of better savings mobilisation and allocation of same for development
purpose (Levine, 1997). This can be achieved through increasing the level of
investment in general as well as in human resources in particular to induce and sustain
economic growth and development. The goal of financial development is to achieve
efficiency in the financial sector and engender financial deepening and economic
growth. Thus, in the present paper, we attempt to quantify the extent to which financial
development in Nigeria has enhanced economic growth.
Ogwumike and Salisu are both lecturers in the Department of Economics University of Ibadan.
Corresponding Author’s Email: [email protected]

Vol. 12, No.2 Journal of Monetary and Economic Integration
92
The question of the relationship between financial development and economic growth
has been widely addressed by economic literature. Notably,taking into consideration
the role of economic growth in fostering financial development and the role of financial
development in enhancing economic growth. In addition to the demand-following and
the supply-leading hypotheses, there is a third strand of arguments in the literature
which submits that there is a feedback relationship between financial development and
economic growth.2 In this paper, we also evaluate these hypotheses using appropriate
methodology in order to ascertain the one that reasonably captures the financial
development-growth nexus in Nigeria.
The extensive financial reforms initiated in Nigeria in 1987 as part of the Structural
Adjustment Porgramme (SAP) include the deregulation of foreign exchange market,
interest rates, rationalisation of credit controls, licensing of new banks and, institutional
and regulatory changes (Ikhide and Alawode, 2002). Further, since the return to
democracy in 1999, more far-reaching financial reforms have been initiated including
the pension fund, 2004; bank consolidation policy, 2005; insurance, 2007; and capital
market reform. These financial reforms were expected to foster an efficient financial
system that would encourage domestic savings and investment and hence engender
economic growth and development.
The concern in Nigeria is that financial institutions (mostly banks) have not performed
to expectations in terms of mobilising savings for financing long-term development
projects in the real sector (Adeoye and Adewuyi, 2005). Further, there is no apparent
and appreciable contribution of financial deepening to economic growth in the post-
SAP era (Ayadi, Adegbite and Ayadi, 2008 and Ayadi, 2009). However, as noted by
Nzotta and Okereke (2009), some studies on financial development and economic
growth in Nigeria relied on money market indicators (see Ogun, 1986; Oyejide, 1986;
Edo, 1995; Ndebbio, 2004; and Akinlo and Akinlo, 2007) and they established a
positive and significant relationship between financial development and economic
growth. Further, some of these studies have employed either theories and
methodologies that omit some of the direct (credit supply and real interest rate) and
indirect (stock market) channel(s), or models that ignore the short run effects.
Against this background, this study seeks to answer the following questions:
To what extent has financial development enhanced economic growth in
Nigeria?
What is the direction of causality between financial development and
economic growth in Nigeria?
2 Each relationship will be discussed in the literature review section with empirical evidence
provided.

Vol. 12, No.1 Fidelis O. Ogwumike and Afees A. Salisu
93
The primary objectives of this study are to re-examine the finance development-
economic growth puzzle by including non-money market indicators; and consequently,
the causality framework is extended to account for these indicators in testing for the
probable existence of demand-following or supply-leading hypothesis or the feedback
in Nigeria. Essentially, the Bounds test approach (developed by Persaran et al, 2001
and suitable for small sample size study) is employed to answer the first research
question. The multivariate causality however often referred to as VAR-Granger
causality test is used to attend to the second. The latter method helps to circumvent
probable biased and inconsistent inferences arising from restricting endogenous
variables in the pairwise causality test.
The rest of the paper is organised as follows: The next section discusses financial
systems and economic performance in Nigeria. This is followed by a review of the
theoretical and empirical evidences. The next section discusses the methodology.
Results and interpretations are presented just before the conclusion.
THE FINANCIAL SYSTEM AND ECONOMIC PERFORMANCE IN
NIGERIA
The Nigeria financial system has experienced intensive restructuring and rapid market-
oriented transformations since the adoption of the SAP in 1986. Prior to this time, the
financial system was regulated as evidenced by ceiling on interest rates and credit
expansion, high reserve requirements, selective credit policies and restriction of entry
into the banking industry. Following deregulation, the bank and non-bank financial
institutions witnessed unprecedented increase due to the incentives provided for growth
and expansion of financial institutions. For example, the number of banks rose from 41
in 1986 to 115 in 1997. Further, the number of bank branches rose from 1,323 in 1986
to 2,551 in 1997. Similarly, the number of community banks (microfinance banks)
increased from 169 in 1990 to 695 in 2009; and the number of specialised non-bank
financial institutions3 increased from 84 in 1990 to 242 in 2008.
This deregulation spurred competition in the industry, forcing many banks to adopt
various strategies required to consolidate their existence. Inefficiency in banking
operations, poor management and misallocation of resources as well as political
3These include 80 insurance companies, National Economic and Reconstruction Fund
(NERFUND), Nigeria Social Insurance Trust Fund (NSITF), National Deposit Insurance
company (NDIC), and Nigerian Stock Exchange (NSE) in 1990. The 242 non-bank financial
institutions in 2008 include 75 Finance Houses, 75 insurance companies, 5 discount houses, 81
primary mortgage institutions, NERFUND, NSITF, NDIC, NSE, NAICON, and PENCOM (see
CBN Statistical Bulletin, 2008).

Vol. 12, No.2 Journal of Monetary and Economic Integration
94
interference resulted in bank distress which further weakened the capacity of the
financial system in resource mobilisation. Hence, by 1991, government came up with
the policy of guided deregulation which resulted in pegging of lending and deposit
rates, placement of embargo on further licensing of banks, among other measures.
Following the adoption of universal banking in Nigeria in 2000, commercial and
merchant banks were merged and they became Deposit Money Banks (DMBs)4.The
Debt Management Office (DMO) established in 2000 also spurred investment in
Federal Government bonds. In 2005, banks consolidation policy was put in place,
which increased the minimum paid-up capital for commercial banks to N25b; and the
total number of banks fell from 85 to 25. The effect of the consolidation was to foster
the creation of larger banks having better access to fund market.
Deregulation of banking operations allowed entry and competition in the financial
system. For example, the share of commercial banks in savings mobilized fell gradually
from 99% in 1960 to 84% in 1985 and further to 70% in 1994. This trend indicates a
more diversified financial system in which other institutions such as microfinance or
community banks and merchant banks played major roles in deposit mobilisation and
investment financing. The average growth of saving between 1985 and 2000 was 26%
while the average before deregulation era (1975-1985) was 20%.This clearly indicates
a greater mobilisation during deregulation.
Another important direction of change in the financial environment is the development
of new financial instruments and increases in the number of equity traded in the capital
market. Banks and other financial market participants were able to raise funds from a
wide array of financial instruments. Although capital market reforms started as far back
as 1988 with the creation of second tier securities market, it was not until 1993 that
further deregulatory measures were taken by replacing pricing and other direct controls
with indirect controls. However, the 1999 reforms brought changes in the Securities
and Exchange Commission and enhanced listing disclosure and check insider trading.
Similarly, the foreign exchange market reform started in 1986 when a second-tier
foreign exchange market was established and since then, the market has continued to
witness several policy reversals and modifications to date. In 2000, reforms in the area
of foreign exchange deposit took place, allowing the public to receive foreign currency
4Banks were now allowed to complement their primary banking services with securities and
insurance businesses, that is, banks were empowered to carry out all banking and non-banking
services (such as issuing house business, underwriting, capital issue and participating in
clearing house activities).

Vol. 12, No.1 Fidelis O. Ogwumike and Afees A. Salisu
95
in a domiciliary account so as to ensure that such remittances were retained in savings
within the banking system.
In all, the capital market deregulation coupled with the banking sector reforms (in
particular, recapitalisation), foreign exchange and pension reforms ushered in an era of
rapid growth in the capital market (Ogwumike and Afangideh, 2008). For example,
market capitalisation rose from N6.8 billion in 1986 to N9,563.0 billion in 2008; and
the value of shares traded rose from N497.9 million in 1986 to N1.68 trillion in 2008.
What effects did financial development in Nigeria have on economic growth?
Evidences show that prior to SAP, the government through its low interest rate policy
tried to spur investments and growth of the economy. This era of low interest rate led
to negative real rates of interest on deposits as well as loans and hindered the proper
functioning of the financial system due to inability to mobilise savings and facilitate
investment5. The consequence was a serious economic disruption which resulted in
currency depreciation and external debt repayment problems as well as adverse
consequence on the volume and productivity of investment.
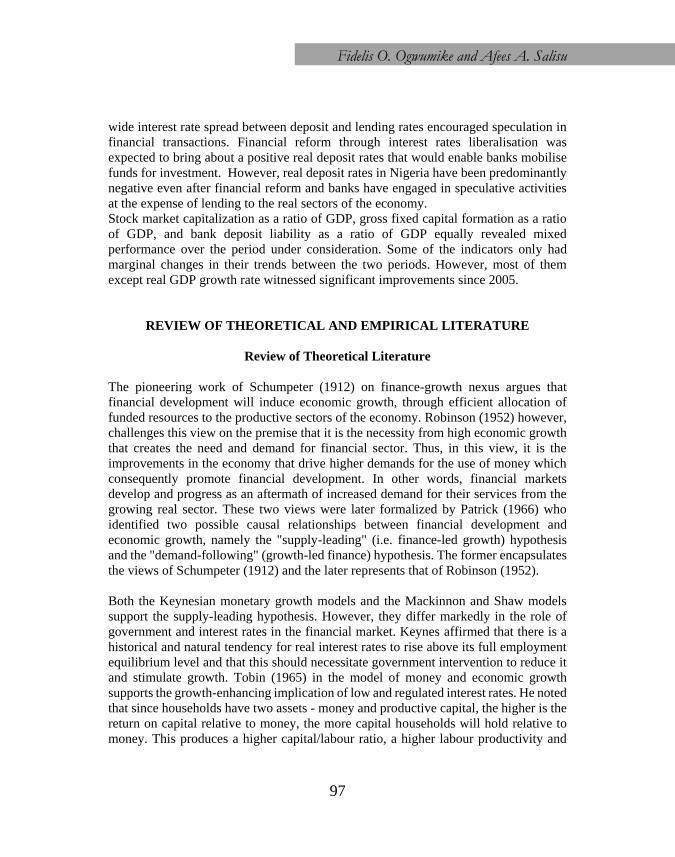
Figure 1 shows that over the period, the real deposit rate was predominantly negative
and lowest during the period of deregulation/guided deregulation (1987 to 1996).
Similarly, the real GDP growth rate was negative (at its lowest point) during the pre-
reform era until 1985 when a positive real GDP growth rate of 9.5% was achieved.
Interestingly, the period after financial reform was introduced in 1987 ushered in a
positive change in real GDP growth rate. The real GDP growth rate again worsened
during the period of guided deregulation starting from 1991. It attained the peak in
2002; and declined thereafter.
5For example, low lending rates encouraged less productive investments and discouraged savers
from holding domestic financial assets. Directed credits to priority sectors often resulted in
deliberate defaults given that serious action could not be taken against defaulters. In fact, such
loans are often seen as part of recipients’ share of the national cake.

Vol. 12, No.2 Journal of Monetary and Economic Integration
96
Figure 1: Selected Financial development indicators and real GDP growth rate
in Nigeria
Source: Graphed from data computed from Central Bank of Nigeria (2008) Statistical bulletin
Credit to the private sector as a percentage of GDP only attained its pre-reform level
around 1990/1991 and after 2005. In fact, this development could be attributed partly
to the divergence between deposit and lending rates. For example, the average interest
rate spread (i.e, average lending rate minus average deposit rate) worsened during the
period of deregulation. It rose from 1.0% in 1986 to 14.1% in 2005. The implications
of high lending rates and low deposit rates are obvious: low incentive to save as savings
are discouraged which negatively affect banks’ ability to mobilise funds. This in turn
affects investment which maintained a downward trend throughout the period except
between 2007 and 2008; and consequently retarded economic growth. Generally, the
Rat
es
in P
erc
en
tage
(%
)
Credit of Private Sector/GDP (%)
Real Deposit Rate (%)
GFCF/GDP (%)
Stock Market Capitalization/GDP (%)
GDP Growth Rate (%)
Bank Deposit Liability = M2 - Currency in Circulation/GDP (%)
Vol. 12, No.1 Fidelis O. Ogwumike and Afees A. Salisu
97
wide interest rate spread between deposit and lending rates encouraged speculation in
financial transactions. Financial reform through interest rates liberalisation was
expected to bring about a positive real deposit rates that would enable banks mobilise
funds for investment. However, real deposit rates in Nigeria have been predominantly
negative even after financial reform and banks have engaged in speculative activities
at the expense of lending to the real sectors of the economy.
Stock market capitalization as a ratio of GDP, gross fixed capital formation as a ratio
of GDP, and bank deposit liability as a ratio of GDP equally revealed mixed
performance over the period under consideration. Some of the indicators only had
marginal changes in their trends between the two periods. However, most of them
except real GDP growth rate witnessed significant improvements since 2005.
REVIEW OF THEORETICAL AND EMPIRICAL LITERATURE
Review of Theoretical Literature
The pioneering work of Schumpeter (1912) on finance-growth nexus argues that
financial development will induce economic growth, through efficient allocation of
funded resources to the productive sectors of the economy. Robinson (1952) however,
challenges this view on the premise that it is the necessity from high economic growth
that creates the need and demand for financial sector. Thus, in this view, it is the
improvements in the economy that drive higher demands for the use of money which
consequently promote financial development. In other words, financial markets
develop and progress as an aftermath of increased demand for their services from the
growing real sector. These two views were later formalized by Patrick (1966) who
identified two possible causal relationships between financial development and
economic growth, namely the "supply-leading" (i.e. finance-led growth) hypothesis
and the "demand-following" (growth-led finance) hypothesis. The former encapsulates
the views of Schumpeter (1912) and the later represents that of Robinson (1952).
Both the Keynesian monetary growth models and the Mackinnon and Shaw models
support the supply-leading hypothesis. However, they differ markedly in the role of
government and interest rates in the financial market. Keynes affirmed that there is a
historical and natural tendency for real interest rates to rise above its full employment
equilibrium level and that this should necessitate government intervention to reduce it
and stimulate growth. Tobin (1965) in the model of money and economic growth
supports the growth-enhancing implication of low and regulated interest rates. He noted
that since households have two assets - money and productive capital, the higher is the
return on capital relative to money, the more capital households will hold relative to
money. This produces a higher capital/labour ratio, a higher labour productivity and

Vol. 12, No.2 Journal of Monetary and Economic Integration
98
hence higher economic growth. Therefore, reducing interest rate, which is the return
on money, increases the pace of economic growth.
On the other hand, financial repression- controlled interest rate and high reserve
requirements are the main focus of McKinnon Shaw School. They argue that the policy
is harmful to long-run growth because it reduces the volume of fund available for
investment (Eschenbach, 2004).
Both McKinnon (1973) and Shaw (1973) contend that controlled lending and deposit
rates lead to non-price rationing of credit, which results into repressed financial system
and slow growth. They affirmed that financial reforms that liberalize the financial
market will lead to greater financial development. Also, that a financial liberalization
would not only propel financial allocation efficiency of credit from the unproductive
sectors to the productive sectors, but would deepen the financial sector savings
(deposits liabilities) role through a positive real interest rate. They termed this the
complementarity hypothesis between real money balance and investment. Essentially,
under this hypothesis, exogenous liberalization reforms will cause interest rate to be
positive, which in turn increases savings liabilities, and credit allocation efficiency that
eventually transform to real investments and increase output and economic growth.
The endogenous growth literature have reached similar conclusion that financial
intermediation has a positive effect on the steady-state growth (Greenwood and
Jovanovic 1990; Becivenga and Smith 1991; Pagano 1993); and that government
intervention in the financial system has a negative effect on the growth rate. In addition,
the endogenous growth theory predicts a positive relationship between real income,
financial depth and real interest rate (see also King and Levine, 1993).
As argued in the literature, financial intermediaries through debt intermediation
promote investment, which in turn, raises the level of output (Shaw, 1973; and Luintel
and Khan, 1999). Similarly, Levine and Zervos (1996) state that, stock market
promotes investment through the provision of long- term (working) capital which in
turn, raises output and growth. Likewise, Khan and Senhadji (2000) advocate the non-
exclusion of stock market contribution to economic growth, prior to which, the Levine
model (1991) contends that investment will be discouraged when market participants
(i.e. investors, accumulated idle saving) are risk averse with no capital/stock market to
look/invest in. Similarly, studies such as Atje and Jovanovich (1993), Greenwood and
Smith (1997), Levine and Zervos (1998), among others, suggest that stock market
liquidity is a catalyst for long-run growth in developing countries. Without a liquid
stock market, many profitable long-term investments would not be undertaken as
savers would be reluctant to tie up their investments for long periods of time.

Vol. 12, No.1 Fidelis O. Ogwumike and Afees A. Salisu
99
The view that financial development is an outcome of the growth in the real economy
was originally put forward by Robinson (1952) who stated that "where enterprise leads
finance follows". Interestingly, support for this view can also be found in the works of
Friedman and Schwartz (1963, cited in Demetriades and Hussein, 1996) on the demand
for money. They conclude that the causation would run from real GDP to financial
development, through the demand for money. The work of Patrick (1966) popularized
the “demand-following" hypothesis or the "growth-led finance” relationship. He
contends that the creation of modern financial institutions, their financial assets and
liabilities as well as services are in response to the demand for these services by
investors and savers in the real economy. In essence, economic growth depends on the
accumulation of input factors in the production process and technical progress; and
finance is one of this input factor, which affects both production and technical progress.
Patrick (1966) argues that the causation between financial development and economic
growth varies according to the stages of development process. He advocates that the
supply-leading pattern dominates the early stages of economic development, while the
demand-following dominates the later stages. With the possibility of a cyclical causal
relationship-feedback hypothesis, a two-way causal relationship between financial
development and economic performance may exist. In this hypothesis, it is asserted
that a country with a well-developed financial system could promote high economic
expansion just as Schumpeter (1912) suggest, through technological changes, product
and services innovation. This in turn creates higher demand on the financial
arrangements and services as noted by Levine (1997). Hence, the exact transmission
channels from finance to economic growth and in particular any estimate of their
quantitative impacts is still subject to considerable uncertainty.
Review of Empirical Literature
A number of empirical studies have attempted to test these hypotheses and their
findings have been mixed. Some of these studies have validated the supply-leading
hypothesis (see for example, King and Levine 1993; Levine and Zervos, 1996; Levine,
1997; Arestis et al., 2002; Christopoulos and Tsionas, 2004; and Acaravci et al., 2007).
Similarly, Akinlo and Egbetunde (2010) examine the long-run causal relationship
between financial development and economic growth in ten Sub-Saharan African
countries. The results show that financial development causes economic growth in four
countries, while growth Granger causes financial development in one country. The
results of the rest of the five countries support bi-directional causality. Similarly, Esso
(2010) in a study using ECOWAS countries found supply-leading relationship in three
countries, while growth causes financial development in one; and bi-directional
causality in two countries. Kargbo and Adamu (2009) in a study on the relationship
between financial development and economic growth in Sierra Leone the result
supports the supply-leading hypothesis. Shittu (2012) finds a positive relationship

Vol. 12, No.2 Journal of Monetary and Economic Integration
100
between financial intermediation and economic growth. While some others provide
evidence in favour of the demand-following hypothesis (see for example Lucas, 1988;
Stern, 1989; Chandavarkar, 1992; Gurgay et al., 2007 and Shahnoushi et al., 2008;
among others).
The feedback hypothesis has been supported by such empirical works by Levine
(1997), Luintel and Khan (1999) and Demetriades and Andrianova (2003). Odeniran
and Udeaja (2010) test the competing finance-growth nexus hypotheses using Granger
causality tests in a VAR framework. The results suggest bidirectional causality between
financial development and economic growth. Kolapo and Adaramola (2011) examined
the impact of capital market on economic growth in Nigeria. The evidence from this
study reveals that the activities in the capital market tend to drive economic growth.
The causality test results suggest a bi-directional causation between economic growth
and the value of transactions in the stock market and a unidirectional causality from
market capitalisation to economic growth. Osuji and Chigbu (2012) employ the
Granger Causality test, Co-integration and Error Correction Method (ECM) to
investigate the impact of financial development on economic growth Nigeria. The
Granger tests indicate a bi-causality between Money Supply (MS) and Economic
Growth (GDP).
Thus, the debate on finance-growth relationship is still on-going and therefore offers a
vacuum for future research. In addition to the consideration of both long-run and short-
run dynamics and the causal linkage between financial development and economic
growth in Nigeria, the present paper also captures both the direct effect (which works
through the price and quantity channel) and the indirect effect (through stock market
channel). Essentially, the Bounds test approach (developed by Persaran et al, 2001 and
suitable for small sample size study) and the multivariate causality however often
referred to as VAR-Granger causality test are employed to answer the research
questions.
METHODOLOGY
Model Specification
In line with the extant literature, we use financial depth, financial intermediation and
stock market capitalization to proxy financial development. Financial depth is
conceived to be positively related to real income and real interest rate as postulated in
the theoretical literature particularly in the McKinnon-Shaw models and the
endogenous growth literature (see Luintel and Khan, 1999). The complementarity
between money and capital supports the positive relationship between the level of
output and financial depth (McKinnon, 1973). As argued in the literature, financial

Vol. 12, No.1 Fidelis O. Ogwumike and Afees A. Salisu
101
intermediaries through debt intermediation promote investment, which in turn, raises
the level of output (see Shaw, 1973; and Luintel and Khan, 1999).
Similarly, Levine and Zervos (1996) state that, stock market promotes investment
through the provision of long- term (working) capital which in turn, raises output and
growth. Also, a positive real interest rate, increases financial depth through increased
volume of financial savings mobilization and by extension promotes growth through
increasing the volume and productivity of capital. A higher real interest rate exerts a
positive effect on the average productivity of physical capital by discouraging investors
from investing in low return projects. In addition, the endogenous growth theory
predicts a positive relationship between real income, financial depth and real interest
rate (see also King and Levine, 1993).
Based on the foregoing, and following Khan et al. (2005), the relationship between
growth and financial development can be specified as:
, , , , t tf BDL CPS RDR INVRGDP SMC (1)
Where:
RGDP = Real Gross Domestic Product
BDL = Bank Deposit Liability
CPS = Credit to the Private Sector
RDR = Real Discount Rate
INV = Investment
SMC = Stock Market Capitalisation
In this study, the effect of financial sector reform through the introduction of structural
adjustment programme in 1986 is examined. Thus, equation (1) is modified to include
a dummy variable as specified below:
, , , , ,t tf BDL CPS RDR INV SRGD MCP DUM (2)
To estimate equation (2), we take the natural logs of both sides which will result in the
following equation (3)
0 1 2 3 4 5 6 t t t t t t t tlnRGDP lnBDL lnCPS RDR lnINV lnSMC DUM u (3)
0, 0, 0, 0 0 lnBDL lnCPS RDR lnINV and lnSMC

Vol. 12, No.2 Journal of Monetary and Economic Integration
102
The dummy variable accounts for financial sector reform shifts in Nigeria. DUM = 0
from 1975 to 1985 and 1 from 1986 to 2008. Where tu denotes the white noise error
term, 0 is a constant parameter while 1 to 6 are parameter coefficients. Except
real deposit rate and the dummy, all the variables are expressed in logarithmic form.
Also, all coefficients are expected to be positive.
Banks deposit liabilities (BDL), our measure of financial depth, is calculated by taking
the difference between total liquid liabilities and currency in circulation divided by
nominal GDP. A higher ratio implies a greater financial intermediary development. The
standard measure of financial depth in the literature is the ratio of broad money to GDP
(i.e. M2/GDP). However, as stressed by Demetriades and Luintel (1996) and Luintel
and Khan (1999), this ratio measures the extent of monetisation rather than of financial
depth. They argue that in the developing countries, monetisation can be increasing
without financial development occurring. In line with this argument, we regard
M2/GDP as not an entirely satisfactory indicator of financial depth. We, therefore,
include an alternative financial depth as a ratio of total bank deposit liabilities to
nominal GDP (i.e. deducting currency in circulation from M2).
The use of CPS as an indicator of financial intermediary has some advantages. More
importantly,it excludes credit to the public sector as well as credit issued by the central
bank. Thus, it represents more accurately the role of financial intermediaries in
channelling fund to private market participants. De Gregorio and Guidotti (1995) argue
that CPS has a clear advantage over other measures of monetary aggregate such as M1,
M2 and/or M3 in that it reasonably captures the actual volume of funds channelled to
the private sector. This financial indicator (CPS) has been previously used in
investigating the relationship between financial development and economic growth in
Nigeria (see Olomola, 1994; and Nzotta and Okereke, 2009). We interpret higher
CPS/GDP as an indicator of more financial services and, therefore, greater financial
intermediation.
Real deposit rate (RDR) is calculated by taking the difference between the nominal
deposit rate and inflation rate. Investment (INV) is seen as the expenditure on fixed
assets (buildings, plant and machinery, vehicles, etc.), either for replacement or adding
to the stock of existing fixed assets. It is measured as the ratio of gross capital formation
to GDP. SMC is the ratio of stock market capitalization to GDP. The size of the stock
market is positively correlated with the ability to mobilise capital and diversify risk6 .
6 Other complementary measures of stock market size are the stock market liquidity and risk
diversification (Levine and Zervos, 1996). But, we have chosen market capitalization as a ratio

Vol. 12, No.1 Fidelis O. Ogwumike and Afees A. Salisu
103
Estimation Technique
Autoregressive Distributed (ARDL) Bounds Test Approach
This study employs the autoregressive distributed (ARDL) bounds test approach
proposed by Pesaran et al. (2001), based on unrestricted error correction model.
Compared to other cointegration procedures such as Engle and Granger (1987) and
Johansen and Juselius (1990), the bounds test approach appears to have gained
popularity in recent times for a number of reasons. First, the endogeneity problems and
inability to test hypotheses on the limited coefficients in the long run associated with
Engle-Granger method are avoided, that is, it has superior statistical properties on small
samples as it is relatively more efficient in small sample data sizes evident in most
developing countries. Second, the long run and short run parameters of the model are
estimated simultaneously. Third, all the variables are assumed to be endogenous.
Fourth, it does not require unit root testing usually employed to determine the order of
integration of variables. Lastly, whereas all the other methods require that the variables
in a time series regression are integrated of order one, I(1), only that of Pesaran et al.
(2001) could be used regardless of whether the underlying variables are I(0), I(1) or
fractionally integrated.
Nonetheless, to apply the bounds test, it is important to ensure that the variables under
consideration are not integrated at an order higher than one. In the presence of I(2)
variables, the critical values provided by Pesaran et al.(2001) are no longer valid. The
following ARDL representation of equation (3) will be estimated in order to test the
existence of long run relationship between economic growth and financial
development:
0 1 2 3 4 5
1 1 1 1 1
6 1 1 17 8 9 1 1 1
1
0 1 1
k k k k ki i i i i
t t i t i t i t i t i
i i i i i
ki
t i t t t t t
i
lnRGDP lnBDL lnCPS RDR lnINV lnSMC
lnRGDP lnBDL lnCPS RDR lnINV lnSMC
112 13 (4 )t t tlnRGDP DUM u
To determine the optimal lag length for the ARDL model in equation (4), lag selection
criteria such as the Schwarz Information Criteria (SIC) and Akaike Information
of GDP as it reflects the size of the market more than the liquidity or risk diversification
measures.

Vol. 12, No.2 Journal of Monetary and Economic Integration
104
Criterion (AIC) are employed and the lag combination that minimises these criteria is
the optimal lag for the model.
Investigating the presence of a long run relationship amongst the variables in equation
(4) given the chosen lag requires the use of the Wald test (or F-test) in which the joint
significance of the coefficients for lagged one variable is tested with F-statistics
calculated under the null. We perform a joint significance test, where the null
hypothesis (H0: β7 = β8 = β9 = β10 = β11 = β12 = β13 =0) against the alternative, (H1: at
least one of the parameters is not equal to zero).
Consequently, the computed F-statistic is then compared with the non-standard critical
bounds values reported by the Pesaran et al. (2001). If the computed F-statistic exceeds
the upper critical bounds value, then H0 is rejected. If the F-statistic lies below both the
upper and the lower critical bounds value, it implies that the null hypothesis of no
cointegration is not rejected. However, when the computed F-statistic falls or lies
between the critical lower and upper bounds values, then the test becomes inconclusive.
Once the cointegrating relationship is established, the short run dynamics is also
analyzed. The error correction model representation of the ARDL model is specified in
equation (5) below:
0 1 2 3 4
1 1 1 1
5 6 1
1 1
(5)
k k k ki i i i
t t i t i t i t i
i i i i
k ki i
t i t i t t
i i
lnRGDP lnRGDP lnBDL lnCPS RDR
lnINV lnSMC ECM
Where λ is the speed of adjustment parameter, ECM is the residual obtained from the
long run estimation and t is a white noise error term. In addition, we perform the
CUSUM and CUSUMSQ test for parameter stability.
Causality
To complement this study, we conduct a causality test to establish the direction of
causality between financial development (and hence the various measures of financial
development) and economic growth. Essentially, this test is employed to determine
whether the link between financial development and economic growth follows the
supply-leading hypothesis or demand leading hypothesis or both.
According to Granger (1968), a variable say y is said to granger cause another variable
say x if past and present values of y help to predict x. This is the traditional Granger-
Causality (based on a bi-variate relationship). However, this has its own limitations: a
two-variable granger causality test without considering the effect of other variables is

Vol. 12, No.1 Fidelis O. Ogwumike and Afees A. Salisu
105
subject to possible specification bias, as pointed out by Gujarati (1995), “...a causality
test is sensitive to model specification and the number of lags”. Therefore, the empirical
evidence of two-variable Granger causality may be biased when the number of
endogenous variables is more than two due to restriction of other endogenous variables
in the model. To this note, we consider the VAR Granger Causality test that allows for
several endogenous variables. The VAR Granger specification is given as:
1 2 3 4 5 6 1
1 1 1 1 1 1
1 2 3 4 5 6
1 1 1 1 1
(6)p p p p p p
t j t j j t j j t j j t j j t j j t j t
j j j j j j
p p p p p
t j t j j t j j t j j t j j t j j t j
j j j j j
bdl bdl rgdp cps rdr inv smc
rgdp rgdp bdl cps rdr inv smc
2
1
1 2 3 4 5 6 3
1 1 1 1 1 1
1 2 3 4 5
1 1 1 1
(7)
(8)
p
t
j
p p p p p p
t j t j j t j j t j j t j j t j j t j t
j j j j j j
p p p p
t j t j j t j j t j j t j j t j
j j j j
cps cps rgdp bdl rdr inv smc
rdr rdr rgdp bdl cps inv
6 4
1 1
1 2 3 4 5 6 5
1 1 1 1 1 1
1 2 3 4
1 1
(9)
(10)
p p
j t j t
j j
p p p p p p
t j t j j t j j t j j t j j t j j t j t
j j j j j j
p p
t j t j j t j j t j j t j
j j j
smc
inv inv rgdp bdl cps rdr smc
smc smc rgdp bdl cps
5 6 6
1 1 1 1
(11)p p p p
j t j j t j t
j j j
rdr inv
This multivariate causality test requires as a precondition, the estimation of a
corresponding VAR model as specified in equations 6 –11.
Data Sources
The study is based on annual data sourced from Central Bank of Nigeria (CBN)
Statistical Bulletin and Annual Report and Financial Statement (various years). Data
on stock market capitalisation was sourced from the Nigerian Stock Exchange Fact
Book (various years).
ESTIMATION RESULTS AND DISCUSSION
Although the ARDL approach to cointegration does not require the pre-testing of the
variables included in the model for unit root, the ADF unit root test is however
considered as this is necessary for VAR Granger causality test. The results are
presented in Appendix 1. Virtually all the variables in the model are stationary at first
difference and thus integrated of order 1 (i.e. I(1) series). Test of cointegration shows
that the computed F-statistic of 5.55 exceeds the lower and upper bounds critical values

Vol. 12, No.2 Journal of Monetary and Economic Integration
106
of 3.15 and 4.43, respectively at the 1 per cent significance level, using Pesaran et al
(2001). Thus, the null hypothesis of no cointegration is rejected, implying long run
relationship among rgdp, bdl, cps, rdr, inv, and smc7.
Table 1: Bounds Tests for the Existence of Cointegration
Dependent variable Critical
value
F-statistic = 5.55
Lower bound Upper bound
Frgdp(rgdp│bdl, cps,
rdr, inv, smc, dum)
1%
5%
10%
3.15
2.45
2.12
4.43
3.61
3.23
Notes: Asymptotic critical value bounds are obtained from Table CI (iii) case III: unrestricted
intercept and no trend for k = 6 (Pesaran et al, 2001).
Long and Short Run Dynamics
The long run coefficients are presented in Table 2. As shown, the estimates of bank
CPS, SMC and financial reform/deregulation (DUM) have the expected signs while the
BDL, INV and the RDR do not conform to the theoretical expectation. Four of the
variables are statistically significant at the one per cent while financial reform DUM is
significant at 5 per cent level. The RDR and BDL do not seem to impact significantly
on long run growth in Nigeria.
Observably, financial intermediation proxied by bank CPS is an important factor
contributing to economic growth in the Nigerian economy and is highly significant at
one per cent. The coefficient of financial intermediation indicates that in the long run,
a one per cent increase in financial intermediation increases real output by 0.90 per
cent. The results are contrary to the findings of Osuji and Chigbu (2012) for Nigeria.
Also, a one per cent rise in SMC increases real output growth by 0.57 per cent. The
coefficient of the RDR contributes an insignificant negative effect. This suggests that
RDR does not appear to have any significant contribution on aggregate output in the
country. Thus, it is logical to conclude that the low interest rate on deposits is not
encouraging to stimulate the required level of savings to boost investment and
economic growth in Nigeria.
7The test for cointegration was also carried out using Johanson cointegration test. A long run
relationship exists. While the trace test indicates three cointegrating equations at 1% level, the
max-eigenvalue test also indicates three cointegrating equations. With two cointegrating
equation(s) at 5% and one cointegrating equation at 1%.

Vol. 12, No.1 Fidelis O. Ogwumike and Afees A. Salisu
107
Table 2: Estimates of the Long Run Coefficients ARDL (1, 0, 0, 1, 1)
Dependent Variable: RGDP
Coefficient p-value
Const 10.5583 0.00001***
BDL -0.104503 0.67363
CPS 0.902922 0.00974***
RDR -0.00259726 0.57172
INV -0.957859 0.00009***
SMC 0.565489 0.00026***
DUM 0.58097 0.02275**
*** (**) critical values at 1% (5%). All variables are significant at 5% level
R-squared 0.889678
Adjusted R-squared 0.865162
F-statistic 36.28970 (0.000)
Durbin-Watson stat 1.445337 Source: Authors’ analysis
Although highly significant, the coefficient of investment, measured as Gross Fixed
Capital Formation to GDP has a negative value of – 0.96 per cent, indicating that
investment has not promoted economic growth in Nigeria. Notably, from existing
growth literature, investment share is mostly a robust variable explaining economic
growth. Previous studies have attributed this negative coefficient of investment in
relation to real output in the case of Nigeria to the following factors: (i) most public
sector infrastructure investments are not worthwhile; (ii) government implemented
public projects that turned out to be money-draining projects; (iii) government
contracts were awarded at inflated prices or completely abandoned after mobilisation
fees have been paid; (iv) there was looting of public funds which are central to savings
and investment; (v) low per capita income in Nigeria resulting in low private domestic
saving and thus may not be a major source of investment; (vi) frequent regime changes
and its attendant poor policy implementation, leading to lower long run investment;
(vii) public and private corrupt practices which divert scarce resources from productive
activities to unproductive activities arresting economic growth; and (viii) the frequent
use of deposits by Nigerian banks to trade in foreign exchange and government treasury
bills, among others, rather than channelling mobilized funds to the real sector of the
economy (see Soludo, 2004; Onwiodukokit and Adamu, 2005; Guseh and Oritsejafor,
2007; and Obamuyi, 2009).
Given the insignificant negative RDR, the estimated coefficient of financial depth
(BDL) is also negative (-0.11). Previous studies on Nigeria have also found this

Vol. 12, No.2 Journal of Monetary and Economic Integration
108
negative relationship between financial depth and the level of real output growth. For
example, Adeoye and Adewuyi (2005) show that financial depth measured by M2/GDP
lags behind the tempo of economic activities and may not have been the source of real
GDP growth in Nigeria. Adeoye and Adewuyi (op. cit) attributed this poor
performance of financial depth in Nigeria to three factors: (i) Macroeconomic
instability due to high inflation rates; (ii) removal of foreign exchange control without
appropriate measures to avoid rapid exchange rate depreciation; and (iii) the
introduction of treasury bill (TB) auctions which made TB rates more attractive to
larger depositors who opted for TBs at the expense of time deposits.
Finally, the coefficient of financial reform dummy though relatively small is significant
and positive (0.58). Financial reforms which ensued healthy competition and therefore
improved service delivery by the financial institutions in Nigeria appear to be growth-
oriented Nonetheless, concerted efforts geared towards improving the management of
the liberalisation process through effective monitoring and regulatory framework may
drive a higher impact of financial reforms on growth. .
Short Run Dynamics
Premised on the tenet that financial development reforms especially in developing
countries lack credibility and continuity, a short run analysis becomes unavoidable. The
results obtained from the short run dynamic are presented in Table 3.
The results show that the estimated lagged error correction term (ECMt-1) is negative
and highly significant. This supports the co integration among the variables represented
by equation (1). The feedback coefficient is -0.41, which suggests a fairly high speed
of adjustment to equilibrium after a shock. Approximately, 41 per cent of the
disequilibria from the previous year’s shock converge or adjust back to the long run
equilibrium in the current year. Also, at least one of the representations of each variable
in the error correction model is statistically significant although at different levels of
significance. For example, while ∆invt-1 and Δrgdpt-1 representing change in investment
and economic growth respectively are statistically significant at 5% and 1%, ∆rdrt-1,
∆cpst-1 and ,∆smct-1 denoting change in real deposit rate, credit to private sector and
stock market capitalization respectively are all significant at 10%. This suggests that
the impact of financial development on the real sector has lag effects.
Although, the short-run response of current RDR is positive, its contribution is small
and insignificant. This is justifiable in Nigeria because low deposit interest rate makes
savings unattractive as a sizeable proportion of income is spent on “consumer goods”.
Further, the changes in real output respond positively to the changes in SMC in the
short run. Therefore, increased access to long term financing may enhance the growth
process in Nigeria. However, changes in real output respond negatively to changes in

Vol. 12, No.1 Fidelis O. Ogwumike and Afees A. Salisu
109
BDL; thus, suggesting inefficient and weak financial intermediaries in the mobilization
of funds for productive activities.
Table 3: Error Correction Representation of ARDL Model (1, 0, 0, 1, 1, 1) selected
on the basis of AIC
Coefficient Std. Error t-ratio p-value
Const 0.0542039 0.0416698 1.3008 0.20742
ΔRGDPt-1 0.54113 0.161936 3.3416 0.00309***
ΔBDLt -0.0787969 0.14095 -0.5590 0.58205
ΔCPSt 0.347677 0.193879 1.7933 0.08735*
ΔRDRt 0.000717117 0.00214902 0.3337 0.74192
ΔRDRt-1 -0.0039473 0.00223683 -1.7647 0.09216*
ΔINVt -0.157638 0.179651 -0.8775 0.39016
ΔINVt-1 0.339038 0.160764 2.1089 0.04713**
ΔSMCt 0.0925685 0.16848 0.5494 0.58850
ΔSMCt-1 -0.297369 0.16564 -1.7953 0.08702*
ECMt-1 -0.412019 0.124025 -3.3221 0.00324***
Note: ***, ** and * represent level of significance at 1%, 5% and 10% respectively.
R-squared 0.561392 Adjusted R-squared 0.352531
F(10, 21) 2.687874 P-value(F) 0.027006
Log-likelihood 15.72400 Akaike criterion -9.448008
Schwarz criterion 6.675087 Durbin's Watson 0.168738
Stability Tests
We also performed CUSUM and CUSUMSQ stability test for estimated error
correction model. This is important in order to investigate whether the above long and
short run relationships found are stable for the entire period of study. The methodology
used is based on the Cumulative Sum (CUSUM) and the Cumulative Sum of Squares
(CUSUMSQ) tests proposed by Brown et al. (1975). Unlike the Chow test that requires
break point(s) to be specified, the CUSUM tests can be used even if we do not know
the structural break point. The CUSUM test uses the CUSUM of recursive residuals
based on the first n observations and is updated recursively and plotted against the

Vol. 12, No.2 Journal of Monetary and Economic Integration
110
break point. The CUSUMSQ makes use of the squared recursive residuals and follows
the same procedure.
Figure 2 shows that the plots of CUSUM and CUSUMSQ are within the five per cent
critical bound, thus providing evidence that the parameters of the model do not suffer
from any structural instability over the period of study. In other words, all the
coefficients in the error correction model are stable.
Fig. 2: CUSUM and CUSUMSQ Plots for Stability Tests

Vol. 12, No.1 Fidelis O. Ogwumike and Afees A. Salisu
111
Granger Causality Test Result:
The comprehensive report of the VAR granger causality is presented in the appendix.
Extract of the result is however shown in table 4 below for easy reference:
At 5 per cent level of significance, the VAR Granger causality test reveals that all the
financial development variables in the model jointly have a causal effect on economic
growth but not always individually (as “bdl, and cps” do not granger cause “rgdp”
individually). However, economic growth (rgdp) does not appear to granger cause
financial development. Overall, the causality result appears to support the view that
causality runs from financial development to economic growth and therefore, the
"supply-leading" hypothesis seems evident in Nigeria. This is in line with the findings
of Adelakun (2010) for Nigeria using the traditional bi-variate granger causality. The
results are contrary to the findings of Osuji and Chigbu (2012) and Samson and Elias
(2010) for Nigeria, who found a bi-directional causal relationship between economic
growth and financial development.
Table 4: Multivariate VAR Granger Causality Test Result
Equation
Variable
Equtn 6 Equtn 7 Equtn 8 Equtn 9 Equtn 10 Equtn 11
DUM BDL RGDP CPS RDR INV SMC
BDL D.V
(0.826)
{0.661}
(3.514)
{0.172}
(0.128)
{0.937}
(1.769)
{0.016}**
(2.623)
{0.269}
(2.136)
{0.343}
RGDP (0.6598)
{0.719} D.V (0.1227)
{0.9405}
(1.057)
{0.589}
(8.197)
{0.016}**
(0.134)
{0.854}
(0.026)
{0.986}
CPS (1.9338)
{0.380}
(3.4539)
{0.1779} D.V (0.111)
{0.945}
(1.8425)
{0.398}
(1.347)
{0.509}
(0.089)
{0.956}
RDR (3.9814)
{0.136}
(5.4172)
{0.066}*
(8.6548)
{0.013}** D.V (3.593)
{0.165}
(1.792)
{0.408}
(2.460)
{0.292}
INV (1.4452)
{0.485}
(9.808)
{0.00}***
(2.4424)
{0.2949}
(4.029)
{0.133} D.V
(0.014)
{0.992}
(6.550)
{0.037}
SMC (7.3328)
{0.025}**
(5.034)
{0.080}*
(3.7076)
{0.1566}
(0.375)
{0.829}
(5.3167)
{0.070}** D.V (1.974)
{0.372}
DUM (2.2686)
{0.321}
(1.507)
{0.470}
(0.3901)
{0.8228}
(2.913)
{0.233}
(0.9476)
{0.6226}
(0.445)
{0.800} D.V
ALL (26.608)
{0.008}***
(21.75)
{0.04}**
(31.774)
{0.001}***
(9.572)
{0.653}
(20.742)
{0.054}**
(8.769)
{0.722}
(22.19)
{0.03}**
NOTE: ( ) = Chi-Sq, { } = Prob, and D.V = Dependent Variable. ***, **, and * indicate
significance at 1, 5 and 10% respectively. Source: Authors’ Analysis.

Vol. 12, No.2 Journal of Monetary and Economic Integration
112
CONCLUSION AND POLICY IMPLICATIONS
This study examined the empirical relationship between financial development and
economic growth in Nigeria from 1975 to 2008, using Bound test Autoregressive
Distributed Lag (ARDL) approach. The results show that there exists a unique long run
relationship between financial development and economic growth. Thus, financial
development is an important determinant of economic growth in Nigeria. In the long
run, financial reform (though small), credit to private sector and stock market exerted
positive impact on economic growth. While financial depth- bank deposit liability and
real deposit rate (although insignificant) and investment showed a negative impact on
real income. However, in the short run, most of the variables were statistically
significant; thus, justifying evidence of lag effect between financial development and
economic growth. Also, we find a stable long run relationship between financial
development and economic growth, as indicated by the CUSUM and CUSUMSQ
stability tests.
Five interesting results are obtained from this study. First, financial development
enhances economic growth in Nigeria. In particular, credit to private sector and stock
markets in Nigeria have yielded positive and significant results. Second, we find
evidence of unidirectional causality running from financial development (particularly
stock market) to growth. This implies that the development of the Nigeria stock market
can significantly influence economic growth. Hence, capital market-based financial
system causes growth in Nigeria. Third, financial depth does not contribute to growth
in the reform era. Fourth, all financial development indicators have lag effects in the
short run. This suggests that the impact of financial development on the real sector is
not instantaneous. Finally, financial reform in Nigeria though with a positive impact in
the long run, may still require further improvements.
Based on the above findings, the following policy implications are conceived:
i. The role of deposit money banks in contributing to growth will remain an
illusion if banks continue to pursue trade in foreign exchange, invest in
government treasury bills and directly fund the importation of goods
(Onwioduokit and Adamu, 2005) at the expense of promoting viable and
efficient investment in the real sector of the economy. It is therefore
recommended that effective means of improving credit channels and
liquidity to private firms by banks should be encouraged by CBN.
ii. The long run relationship between financial development and economic
growth shows that the former is significant in promoting real income. Hence,

Vol. 12, No.1 Fidelis O. Ogwumike and Afees A. Salisu
113
policies should be directed towards promoting a more competitive
environment that enhances service delivery among financial institutions.
iii. Poor performance of financial reforms has been attributed to improper
sequencing of the reform agenda coupled with frequent policy reversals and
reintroduction (Ikhide and Alawode, (2002). Government should therefore
implement reforms that will enhance financial intermediation through stable
and sustainable real positive interest rates followed by sound
macroeconomic, monetary and fiscal policies targeted at low and sustainable
inflation rates.
iv. Equity market in Nigeria is not yet well-developed. Nonetheless, flow from
our causality results shows that stock market facilitates growth in Nigeria. In
order to spur a mature stock market in Nigeria and hence a higher level of
growth, we recommend policies geared towards the expansion and
development of the Nigerian stock market. For example, promoting a more
liberalised capital market will increase the efficiency of the stock market.
This will also ensure that stock prices truly reflect their fundamental worth
(values) or the expected future profitability of companies. Therefore,
resources can be effectively channeled to the most efficient and productive
companies, which will be better positioned to implement their investment
plans and hence, stimulate economic growth.

Vol. 12, No.2 Journal of Monetary and Economic Integration
114
REFERENCES
Acaravci, A., Ozturk, I. and Acaravci, S.K. 2007. Finance-growth nexus: Evidence
from Turkey. International Research Journal of Finance and Economics 11:
1450–2887. http://www.eurojournals.com/finance.htm.
Adelakun, O. J. 2010. Financial Sector Development and Economic Growth In Nigeria.
International Journal of Economic Development Research and Investment
Vol. 1, No 1, April 2010. Pp 25-41
Adeoye, B. W. and Adewuyi, A. O. 2005. Benefits and costs of financial sector
reforms: Nigeria’s experience. In: Cost and benefits of economic reforms in
Nigeria. Selected Paper for the 2005 Annual Conference of the Nigeria
Economic Society 4.1:Chap 16.
Akinlo, A. E. and Akinlo, O. 2007. Financial development, money, public expeniture
and national income in Nigeria. Journal of Social and Economic Development
vol. 1
Arestis, P. and Demetriades, P. 1997. Financial development and economic growth:
Accessing the evidence. The Economic Journal 107.442: 754 – 770.
Arestis, P., Demetriades P., Fahouh, B. and Mouratidis, K. 2002. The impact of
financial liberalisation policies on financial development: Evidence from
developing economies. January 2002.
Ayadi, F.S. 2009. Causality, In: Foreign Direct Investment and Economic Growth in
Nigeria. Repositioning African Business and development for the 21st Century
Simeon Sigue (Ed). Proceedings of the 10th Annual Conference. IAABD.
Ayadi, O.F., Adegbite, E.O. and Ayadi F.S. 2008. Structural adjustment, economic
sector development and economic prosperity in Nigeria. International
Research Journal of Finance and Economics 15.
Chandavarkar, A., 1992. Of finance and development: Neglected and unsettled
questions,
World Development 22, pp. 133-142.
Christopoulos, D.K. and Tsionas, E. 2004. Financial development and economic
growth: Evidence from panel unit root and cointegration tests. Journal of
Development Economics 73: 55-74.
De Gregorio, J. and Guidotti, P. 1995. Financial development and economic growth.
World Development 23.3:433-448.
Demetriades, P. O. and Andrianova, S. 2003. Finance and growth: What we know and
what we need to know. October, 19, 2003.
and Luintel, K.B. 1996. Financial development, economic growth and banking sector
controls: Evidence from India. The Economic Journals 106.435:359 – 374.
and Hussein, A.K. 1996. Does financial development cause economic growth? Time
series evidence from 16 countries. J. Dev. Econ., 51: 387-411.
Edo, S. E. 1995. An estimation of a model of long-term securities investment in
Nigeria. Economic and Financial Review.Vol 1 No. 12.

Vol. 12, No.1 Fidelis O. Ogwumike and Afees A. Salisu
115
Engle, R. F and Granger, C.W.I (1987) Cointegration and Error correction:
Representation, estimation and Testing. Econometrica, 55:251-276.
Fry, M.J. 1978. Money and Capital or Financial Deepening in Economic Development?
Journal of Money, Credit and Banking, November, 464-475.
Granger, C.W.J. 1969. Investigating causal relations by econometric models: cross
spectral methods. Econometrica, 37: 424-438.
Granger, C.W. 1986 .Developments in the study of contegrated economic variables.
Oxford Bulletin of Economics and Statistics 48:213-228
Gujaraiti, D. N. 1995. Basic Econometrics 3rd ed. McGraw-Hill, New York
Gurgay, E., VeliSafakli, O. and Tuzel, B. 2007. Financial development and economic
growth: Evidence from Northern Cyprus. International Research Journal of
Finance and Economics8©EuroJournals Publishing, Inc. 2007
http:///www.eurojournals.com/ finance.htm
Guseh, J. S and Oritsejafor, E. 2007. Government size, political freedom and economic
growth in Nigeria, 1960 – 2000. J. Third World Stud. March 22.
Ikhide, S.I. and Alawode, A.A. 2002. On the sequencing of financial liberalisation in
Nigeria. The South African Journal of Economics 70.1:95-127
Johansen, S and Juselius, K. 1990. Maximum likelihood estimation and inference on
cointegration – with application to the demand for money. Oxford Bulletin of
Economics and Statistics 52: 169-210.
Khan, M.A., Qayyum, A and Sheikh, S.A. 2005. Financial development and economic
growth: The case of Pakistan. The Pakistan Development Review 44: 4 Part II
(Winter 2005) 819 – 837.
King, R.G. and Levine, R. 1993. Finance and growth: Schumpeter might be right. The
Quarterly Journal of Economics 108, 717 – 737.
Levine, R and Zervos, S. 1996. Stock market development and long run growth. A
symposium issue on stock markets and economic development. The World Bank
Economic Review 10.2:323-339. Oxford Journals: Oxford University Press.
Levine, R. 1997. Financial development and economic growth: Views and Agenda.
Journal of Economic Literature 35: 688-726.
Lucas Jr., R.E. 1988. On the mechanics of economic development, Journal of Monetary
Economics 22, pp. 3-42.
Luintel, K. B. and Khan, M. 1999. A quantitative reassessment of the finance-growth
nexus; Evidence from a multivariate VAR. Journal of Development
Economics 60: 381-405.
Mckinnon, R.I. 1973. Money and capital in economic development. Washington, D.C.
Brookings Institute.
Ndebbio, J.E.U. 2004. Financial deepening, economic growth and development:
Evidence from selected Sub-Saharan African countries, African Economic
research Papers. No. 142, AER, Nairobi.
Nzotta, S.M. and Okereke, E.J. 2009. Financial deepening and economic development
of Nigeria: An empirical investigation. African Journal of Accounting,

Vol. 12, No.2 Journal of Monetary and Economic Integration
116
Economics, Finance and Banking Research 5.5
http://www.bcentral.cl/Estudios/DTBL/doctrab.htm.
Obamuyi, F.M. 2009. An investigation of the relationship between interest rates and
economic growth in Nigeria. Journal of Economics and International Finance
1.4: 093-098.
Ogun, O. D. 1986. A note on financial deepening and economic growth: Evidence from
Africa, Nigerian Journal of Social and Economic Studies vol. 28, No. 2.
Ogwumike, F.O. and Afangideh, U. J. 2008. Financial development and income
distribution in Nigeria. Journal of Monetary and Economic Integration
8.1:63-89
Olomola, S. A. 1994. Financial liberalisation and economic growth under Structural
Adjustment Programme in Nigeria.African Journal of Economic Policy 1.1
Onwioduokit, E. A. and Adamu, P. A. 2005. Financial liberalisation in Nigeria: An
assessment of eelative impact. In: Cost and Benefits of Economic Reforms in
Nigeria. Selected Paper for the 2005 Annual Conference of the Nigeria
Economic Society 4.1:Chap 14.
Oyejide, T. A. 1986. The financial system and economic growth: Evidence from Africa.
Nigerian Journal of Social and Economic Studies vol. 28, No. 2.
Osuji C. C and Chigbu, E.E 2012. An Evaluation Of Financial Development And
Economic Growth Of Nigeria: A Causality Test. Kuwait Chapter of Arabian Journal
of Business and Management Review. Vol. 1, No.10; June 2012. Pp 27-44
Patrick, H. T. 1966. Financial development and economic growth in underdeveloped
countries. Economic Development and Cultural Change 14.2:174–189. The
University of Chicago Press.
Pesaran, M.H., Shin, Y. and Smith, R. J. 2001. Bounds testing approaches to the
analysis of level relationships. Journal of Applied Econometrics 16:289-326.
Samson O.O and Elias A.Udeaja 2010. Financial Sector Development and Economic
Growth: Empirical Evidence from Nigeria. Economic and Financial Review.
Volume 48/3. September, 2010. Pp 91-124
Shahnoushi, N., Ebadi, A.G., Daneshvar, M., Shokri, E. and Motallebi, M. 2008.
Causality between financial development and economic growth in Iran. World
Applied Sciences Journal 4.5:736-740.
Shaw, E.S. 1973. Financial deepening in economic development. Oxford University
Press, New York.
Soludo, C. C. 2004. Consolidating the Nigerian banking industry to meet the challenges
of the 21st century. An address by the Governor of the Central Bank of Nigeria
at the Special Meeting of the Bankers’ Committee, Abuja, 6 July.
Stern, N. 1989. The economics of development: a survey. Econ. J., 99: 597-685.

Vol. 12, No.1 Fidelis O. Ogwumike and Afees A. Salisu
117
APPENDIX
Appendix 1: Augmented Dickey Fuller Test of Unit Roots
Variables Level (first
difference)
ADF critical 1% (5%) Order of
integration
Stationary
Rgdp -1.766151
(-5.77383)
-3.64342 (-2.954021)
-3.64342 (-2.954021)
I(1)
Non-stationary
Stationary
Bdl -1.306175
(-5.617117)
-3.64342 (-2.954021)
-3.64342 (-2.954021)
I(1) Non-stationary
Stationary
Cps -2.366272
(-5.373915)
-3.64342 (-2.954021)
-3.64342 (-2.954021)
I(1) Non-stationary
Stationary
Rdr -4.092583 -3.64342 (-2.954021)
I(0) Stationary
Inv -1.680999
(-4.8207)
-3.64342 (-2.954021)
-3.64342 (-2.954021)
I(1) Non-stationary
Stationary
Smc -0.254409
(-6.306457)
-3.661661 (-2.960441)
-3.653730 (-2.957110)
I(1) Non-stationary
Stationary Source: Computed by the authors
VAR Granger Causality Specification:
1 2 3 4 5 6 1
1 1 1 1 1 1
1 2 3 4 5 6
1 1 1 1 1
(1)p p p p p p
t j t j j t j j t j j t j j t j j t j t
j j j j j j
p p p p p
t j t j j t j j t j j t j j t j j t j
j j j j j
bdl bdl rgdp cps rdr inv smc
rgdp rgdp bdl cps rdr inv smc
2
1
1 2 3 4 5 6 3
1 1 1 1 1 1
1 2 3 4 5
1 1 1
(2)
(3)
p
t
j
p p p p p p
t j t j j t j j t j j t j j t j j t j t
j j j j j j
p p p
t j t j j t j j t j j t j j t j
j j j j
cps cps rgdp bdl rdr inv smc
rdr rdr rgdp bdl cps inv
6 4
1 1 1
1 2 3 4 5 6 5
1 1 1 1 1 1
1 2 3 4
1 1
(4)
(5)
p p p
j t j t
j j
p p p p p p
t j t j j t j j t j j t j j t j j t j t
j j j j j j
p p
t j t j j t j j t j j t
j j
smc
inv inv rgdp bdl cps rdr smc
smc smc rgdp bdl cps
5 6 6
1 1 1 1
(6)p p p p
j j t j j t j t
j j j j
rdr inv

Vol. 12, No.2 Journal of Monetary and Economic Integration
118
APPENDIX 2:
VAR Granger Causality Test Result
VAR Granger Causality/Block Exogeneity Wald Tests
Sample: 1975 2008
Included observations: 32
Dependent variable: RGDP
Excluded Chi-sq df Prob.
BDL 0.826737 2 0.6614
CPS 3.453877 2 0.1778
RDR 5.417169 2 0.0666
INV 9.808842 2 0.0074
SMC 5.034929 2 0.0807
DUM 1.507184 2 0.4707
All 21.75883 12 0.0403
Dependent variable: BDL
Excluded Chi-sq df Prob.
RGDP 0.659779 2 0.7190
CPS 1.933760 2 0.3803
RDR 3.981442 2 0.1366
INV 1.445193 2 0.4855
SMC 7.332820 2 0.0256
DUM 2.268625 2 0.3216
All 26.60874 12 0.0088
Dependent variable: CPS
Excluded Chi-sq df Prob.
RGDP 0.122673 2 0.9405
BDL 3.514217 2 0.1725
RDR 8.654840 2 0.0132
INV 2.442379 2 0.2949
SMC 3.707630 2 0.1566
DUM 0.390087 2 0.8228
All 31.77493 12 0.0015
Dependent variable: RDR
Excluded Chi-sq df Prob.
RGDP 1.057740 2 0.5893
BDL 0.128899 2 0.9376
CPS 0.111617 2 0.9457
INV 4.029493 2 0.1334
SMC 0.375164 2 0.8290

Vol. 12, No.1 Fidelis O. Ogwumike and Afees A. Salisu
119
DUM 2.913223 2 0.2330
All 9.572549 12 0.6534
Dependent variable: INV
Excluded Chi-sq df Prob.
RGDP 8.197907 2 0.0166
BDL 1.769129 2 0.4129
CPS 1.842458 2 0.3980
RDR 3.593599 2 0.1658
SMC 5.316692 2 0.0701
DUM 0.947564 2 0.6226
All 20.74233 12 0.0543
Dependent variable: SMC
Excluded Chi-sq df Prob.
RGDP 0.314066 2 0.8547
BDL 2.623620 2 0.2693
CPS 1.346975 2 0.5099
RDR 1.792863 2 0.4080
INV 0.014759 2 0.9926
DUM 0.445504 2 0.8003
All 8.769080 12 0.7225
n 3 is column 2 multiplied by 148 to convert current US dollar to Naira