financial development, inequality and poverty: some ... · significantly reduce income inequality...
TRANSCRIPT

WP/16/32
IMF Working Papers describe research in progress by the author(s) and are published to elicit comments and to encourage debate. The views expressed in IMF Working Papers are those of the author(s) and do not necessarily represent the views of the IMF, its Executive Board, or IMF management.
Financial Development, Inequality and Poverty:Some International Evidence
Sami Ben Naceur and RuiXin Zhang
2
IMF Working Paper
Institute for Capacity Development
Financial Development, Inequality and Poverty: Some International Evidence
Prepared by Sami Ben Naceur and RuiXin Zhang1
Authorized for distribution by Oussama Kanaan
February 2016
Abstract
This paper provides evidence on the link between financial development and income distribution. Several dimensions of financial development are considered: financial access, efficiency, stability, and liberalization. Each aspect is represented by two indicators: one related to financial institutions, and the other to financial markets. Using a sample of 143 countries from 1961 to 2011, the paper finds that four of the five dimensions of financial development can significantly reduce income inequality and poverty, except financial liberalization, which tends to exacerbate them. Also, banking sector development tends to provide a more significant impact on changing income distribution than stock market development. Together, these findings are consistent with the view that macroeconomic stability and reforms that strengthen creditor rights, contract enforcement, and financial institution regulation are needed to ensure that financial development and liberalization fully support the reduction of poverty and income equality.
JEL Classification Numbers: G10; G20; I30
Keywords: Financial Development; Income Inequality; Poverty Author’s E-Mail Address: [email protected]; [email protected]
1 The authors would like to thank Oussama Kanaan, May Khamis, Inutu Lukonga, Andrea Presbitero, Natalia Tamirisa, and participants at the IMF meeting on surveillance for helpful comments; Neil Hickey and Kia Penso for editorial assistance; Fatima Keaik and Rasha El-Askary for administrative assistance. All errors and omissions are our own.
This Working Paper should not be reported as representing the views of the IMF. The views expressed in this Working Paper are those of the author(s) and do not necessarily represent those of the IMF or IMF policy. Working Papers describe research in progress by the author(s) and are published to elicit comments and to further debate.

3
Contents Page
Abstract ......................................................................................................................................2
I. Introduction ............................................................................................................................4
II. Data and Methodology ..........................................................................................................5 A. The sample and variables ..........................................................................................5 B. Methodology .............................................................................................................6
III. Empirical Results .................................................................................................................8
IV. Conclusions........................................................................................................................11 Tables Table 1: Summary Statistics ....................................................................................................14 Table 2: Correlations................................................................................................................15 Table 3: Effects of Financial Access on Income Inequality ....................................................16 Table 4: Effects of Financial Deepening on Income Inequality ..............................................17 Table 5: Effects of Financial Efficiency on Income Inequality ...............................................18 Table 6: Effects of Financial Stability on Income Inequality ..................................................19 Table 7: Effects of Financial Liberalization on Income Inequality .........................................20 Table 8: Inequality-FD add Country income level interaction ................................................21 Table 9: Poverty-FD add Country income level interaction ....................................................22 Table 10: Inequality-FD add quality of institution interaction ................................................23 Table 11: Poverty-FD add quality of institution interaction ....................................................24 Table 12: Gini coefficient 5 year average sample ...................................................................25 Table 13: Poverty Gap 5 year average sample .........................................................................26 Appendix 1: Variable Definition and Data Source ..................................................................27 References ................................................................................................................................13

4
I. INTRODUCTION
The beneficial role of financial development in economic growth has been well documented; however, the literature on the nexus of financial development and income distribution is still nascent. Theories on the effect of financial development on income distribution offer conflicting predictions: one strand of the literature proposes an inverted-U relationship between finance and income inequality, while the other predicts a linear relationship. Greenwood and Jovanovic (1990) predict a nonlinear relationship between finance and inequality, wherein the distributional effect of financial development depends on the level of economic development. At early stages of development, only the rich can access financial services because of the fixed cost of joining the financial coalition, resulting in wider income inequality. As the economy develops, the financial system becomes more accessible and affordable to the poor because human capital replaces physical capital as the main driver of growth. Galor and Zeira (1993) and Galor and Moav (2004) posit a linear relationship between financial development and income distribution. They suggest that financial deepening eases credit constraints, which benefits low-income groups through the channels of human capital and capital accumulation. Although theory provides conflicting conclusions on the finance-inequality nexus, empirical works suggest that financial development contributes to reducing poverty and inequality. Cross-country evidence from Beck and others (2004), Beck and others (2007), Honohan (2004), Li and others (1998), and Rajan and Zingales (2003) suggests that expanding private credit can stimulate income growth for the poorest quintiles and reduce income inequality, strongly refuting the position of Greenwood and Jovanovic (1990). One similarity of these empirical works is the use of the ratio of private credit to GDP as a measure of financial development. Such an indicator covers only one dimension of financial development: financial system depth while overlooking access, efficiency, and stability. More recent papers attempted to include other dimensions of financial development. For example, Claessens and Perotti (2007) and Demirguc-Kunt and others (2008) found evidence supporting the importance of access to finance in reducing poverty and inequality. Jeanneney and Kpodar (2011) establish that financial instability worsens poverty; and Kunieda and others (2011) find that financial integration aggravates income inequality by benefiting the most privileged. Similarly, Furceri and Loungani (2015) study the impact of capital account openness on inequality and find that liberalizing domestic financial systems can aggravate income inequality, both in the short and medium run. This paper will help distinguish between the conflicting views on the link between finance and income distribution, by assessing the impact of the different dimensions of financial development on both the level of income inequality and the level of poverty, using a large

5
sample of 143 countries taken from the period 1961 to 2011. There are three key interrelated findings on the global sample. Strengthening financial access, depth, stability, and efficiency contributes to reducing income inequality and poverty, which is robust to different datasets and measurements. The results suggest also that financial sector liberalization, particularly capital account liberalization, widens inequality and the poverty gap. Financial institution development exerts a stronger impact on income distribution and poverty than financial market development.
The remainder of the paper is structured as follows: Section 2 describes the data and methodology. Section 3 presents the empirical results as well as the robustness checks, and Section 4 offers a conclusion.
II. DATA AND METHODOLOGY
A. The sample and variables
Our sample contains data on 143 countries, both developing and developed. Though not all the estimations cover the same time period, the sample spans from 1961 to 2011. We use measures of inequality, poverty, and financial sector development that have previously been used in the literature. Income inequality and poverty indicators are included as dependent variables and data are from the World Bank’s inequality and poverty database. The proxy for income inequality is measured by the commonly used Gini coefficient, which is a relative ratio of the areas on the Lorenz curve diagram. It is scaled from 0 to the 100th percentile in our dataset. Zero percent represents a perfectly equal outcome, in which each individual receives the same level of income; 100 percent represents extremely unequal distribution, where one person takes all the income in the economy. Though the Gini coefficient, to some degree, reflects the distribution of income, it is unable to show the welfare of the low-income group: the poverty level may be reduced with or without the Gini coefficient decreasing. To understand the role of financial development in combating poverty, the poverty gap index is also used in our estimations. The poverty gap measures the average income shortfall of the poor individual from the poverty line ($1.25 a day).2 To cover the five dimensions of financial sector development (access, depth, efficiency, stability, and liberalization), 10 variables from the Global Financial Development Database (GFDD) are used. Each dimension is measured by two variables, one related to financial institution development and the other to financial market development.
2 The poverty gap index is a better indicator than the poverty headcount ratio because it counts all the people below a poverty line and considers them equally poor (Sen 1976).

6
For access to financial services, we choose bank accounts per 1,000 adults and value traded of the top 10 trading companies to total value traded. The former measures bank access, while the latter reflects access to financial markets.
Financial depth is measured by two indicators: banks’ private credit to GDP and the stock market’s total value traded to GDP, which are the most widely used indicators for financial deepening. Higher values suggest deeper financial institutions and stock markets.
We select the net interest margin and the stock market turnover ratio as measures of financial efficiency. High net interest margins suggest low bank operating efficiency, while high turnover ratio (stock traded/capitalization) reflects an efficient financial market.
The stability of the financial system is measured by the ratio of regulatory capital to risk-weighted assets and the volatility of the stock price index. A high level of regulatory capital implies that banks have a lower probability of default, whereas a higher volatility of stock prices is indicative of a more unstable financial market.
For financial liberalization, two proxies are used: domestic liberalization and external liberalization. Using the financial reform database from Abiad, Detragiache, and Tressel (2008), we aggregate the index of credit control, interest rate control, entry barriers, and privatization to proxy for domestic financial reform. To measure external financial liberalization, we use the ratio of consolidated foreign claims of BIS-reporting banks to GDP, with larger values suggesting a more liberalized financial system. Finally, we control for several other variables that have been previously used as determinants of poverty and inequality: real GDP per capita, government expenditures to GDP, trade openness, and the inflation rate. Real GDP per capita is included to control for the economic growth effect, as the literature suggests a strong relationship between income distribution and economic development. The coefficient on GDP per capita is expected to be negative, because lower inequality and poverty are associated with a higher income level. Similarly, negative signs are expected on the coefficients of government expenditure to GDP and trade openness, which are included to capture the benefits of public spending and openness to foreign trade. According to Easterly and Fischer (2001), the coefficient on the inflation rate is expected to be positive, because inflation hurts the poor more than it hurts the rich.
B. Methodology
We follow the basic regression specification from the income distribution and financial development literature:
(1) Ginii ,t FD
i ,t
1Y
i ,t
2Infl
i ,t
3Trade
i ,t
4Gov
i ,t
i ,t

7
(2)
In this equation, and , represent the Gini coefficient and the poverty gap,
respectively. is the key explanatory vector that we are interested in; it covers the 10
indicators of financial development previously described: is expected to be negative3,
which implies that higher financial development can lower inequality and poverty. is the
log of GDP per capita used to control for the wealth effect, and we expect to be negative.
Infl, Trade, and Gov are a set of control variables representing inflation, trade openness, and
government size. Following the literature, is expected to be positive; and are
expected to be negative.
The relationship between financial development and income inequality and poverty might be a case of reverse causation. For example, a lower level of poverty implies that financial services are already more affordable and accessible to the poor, and thus, stimulating the development of the financial sector. Similarly, a narrower poverty gap or less income inequality might also promote economic growth according to the inverted-U pattern for the impact of income distribution on economic growth. Therefore, controlling for the possible reverse causation and simultaneity bias is essential for studying the impact of finance on inequality and poverty.
To control for endogeneity and reverse causation, we use instrumental variable (IV) regressions. Two types of instruments are used. The first set includes the lagged values of the endogenous variables (second lags and higher are used to avoid autocorrelation with the current error term). In the second set, we use instruments based on the theoretical and empirical finance and growth literature, such as ethnic fractionalization, linguistics, religious composition, and legal systems.
To check the validity of these instruments, we use Hansen’s J-test of the over-identifying restrictions. Under the null hypothesis, the instruments are uncorrelated with the error term, and the excluded instruments are valid instruments. 4 A rejection of the null hypothesis invalidates the instruments. We use also the LM under-identification test to check whether
3 Lower values for the value traded of the top 10 trading companies, overhead costs to total assets, and volatility
of stock price index indicate a more accessible, efficient and stable financial sector, respectively. Thus is
expected to be positively related to inequality and poverty for these variables.
4 The instruments are uncorrelated with the error term, and that the excluded instruments are correctly excluded from the estimated equation (Beck and Levine 2004).
Povgapi ,t FD
i ,t
1Y
i ,t
2Infl
i ,t
3Trade
i ,t
4Gov
i ,t
i ,t
,i tGini ,i tPovgap
,i tFD
,i tY
1
2
3
4
1
8
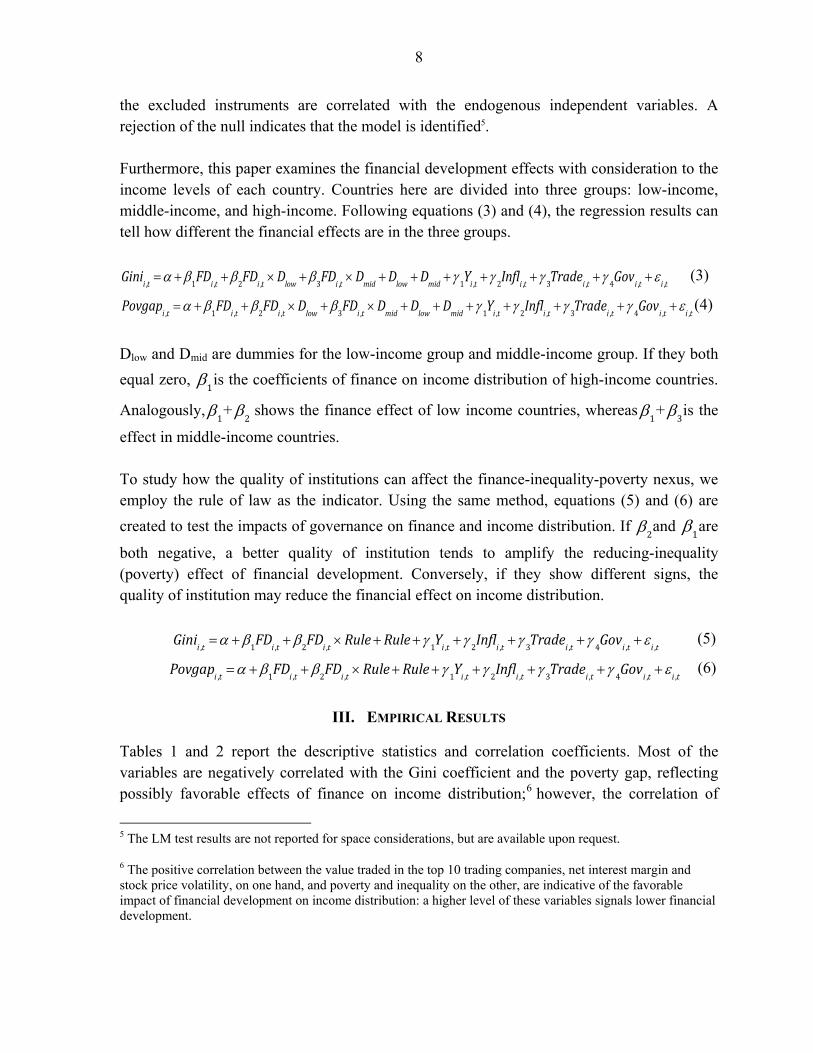
the excluded instruments are correlated with the endogenous independent variables. A rejection of the null indicates that the model is identified5. Furthermore, this paper examines the financial development effects with consideration to the income levels of each country. Countries here are divided into three groups: low-income, middle-income, and high-income. Following equations (3) and (4), the regression results can tell how different the financial effects are in the three groups.
(3)
(4)
Dlow and Dmid are dummies for the low-income group and middle-income group. If they both
equal zero, 1is the coefficients of finance on income distribution of high-income countries.
Analogously,1+
2 shows the finance effect of low income countries, whereas
1+
3is the
effect in middle-income countries. To study how the quality of institutions can affect the finance-inequality-poverty nexus, we employ the rule of law as the indicator. Using the same method, equations (5) and (6) are
created to test the impacts of governance on finance and income distribution. If 2and
1are
both negative, a better quality of institution tends to amplify the reducing-inequality (poverty) effect of financial development. Conversely, if they show different signs, the quality of institution may reduce the financial effect on income distribution.
(5)
(6)
III. EMPIRICAL RESULTS
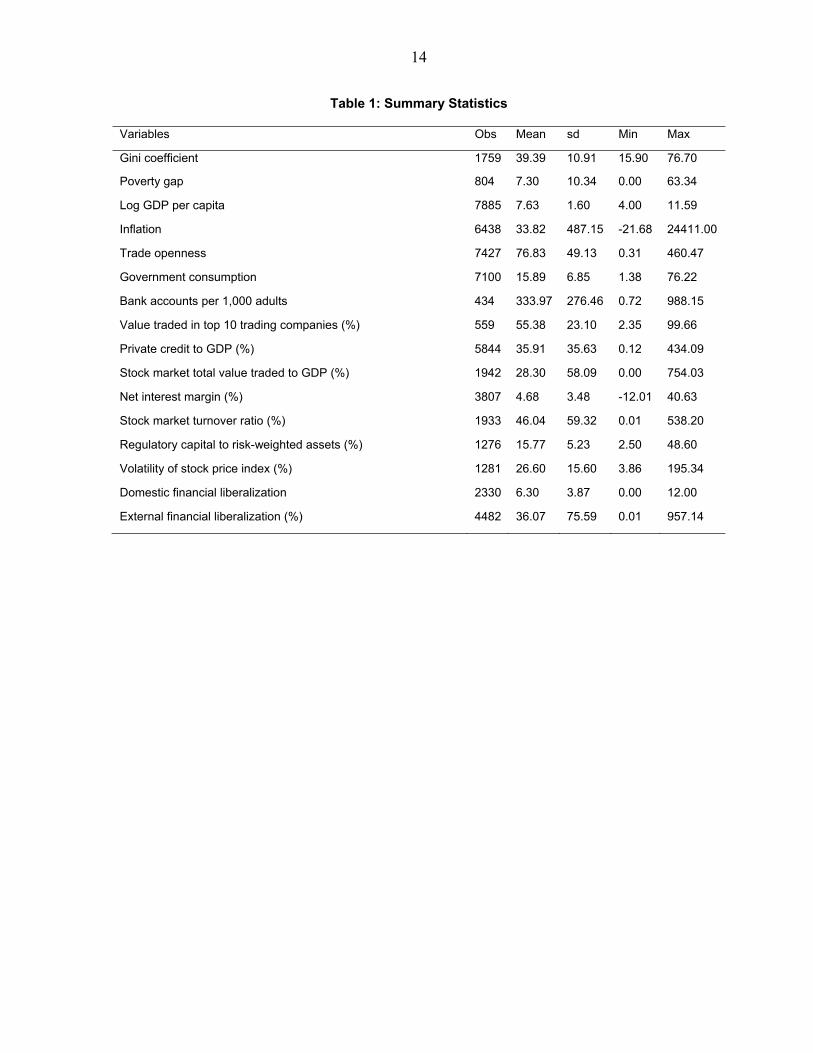
Tables 1 and 2 report the descriptive statistics and correlation coefficients. Most of the variables are negatively correlated with the Gini coefficient and the poverty gap, reflecting possibly favorable effects of finance on income distribution;6 however, the correlation of
5 The LM test results are not reported for space considerations, but are available upon request.
6 The positive correlation between the value traded in the top 10 trading companies, net interest margin and stock price volatility, on one hand, and poverty and inequality on the other, are indicative of the favorable impact of financial development on income distribution: a higher level of these variables signals lower financial development.
Ginii ,t
1FD
i ,t
2FD
i ,tD
low
3FD
i ,tD
midD
lowD
mid
1Y
i ,t
2Infl
i ,t
3Trade
i ,t
4Gov
i ,t
i ,t
Povgapi ,t
1FD
i ,t
2FD
i ,tD
low
3FD
i ,tD
midD
lowD
mid
1Y
i ,t
2Infl
i ,t
3Trade
i ,t
4Gov
i ,t
i ,t
Ginii ,t
1FD
i ,t
2FD
i ,tRuleRule
1Y
i ,t
2Infl
i ,t
3Trade
i ,t
4Gov
i ,t
i ,t
Povgapi ,t
1FD
i ,t
2FD
i ,tRuleRule
1Y
i ,t
2Infl
i ,t
3Trade
i ,t
4Gov
i ,t
i ,t

9
income distribution, with inflation and domestic/external financial liberalization, suggests a widening of income inequality and therefore more poverty.
Tables 3-7 list the effects on the Gini coefficient and poverty gap from all five financial aspects. This paper performs both OLS and IV regressions for each financial variable. In the IV results, suggested by the Hansen J-Statistics, we are unable to reject the null hypothesis that our instruments are uncorrelated with the error terms for all regressions, meaning that the instruments are appropriate.
The impact of financial access on income inequality and poverty is shown in Table 3. Results for the global sample using OLS (Column 1) and IV (Column 2) estimators suggest that increasing the number of bank accounts per 1,000 adults can reduce income inequality. Columns (3) and (4) report results on value traded in the top 10 trading companies as a market access variable. As larger values indicate less access to the financial market, the results show that value traded in the top 10 trading companies is less likely to affect income inequality. Columns (5) to (8) report similar effects of financial access on poverty. Both OLS and IV results support the poverty-alleviating effect of improving banking access. On average, an additional banking account opened per 1000 people tends to reduce the poverty gap by a percentage point of 0.007. In contrast to the results on access to financial institutions, none of the coefficients on the market access variable are shown to be statistically significant in reducing poverty.
Table 4 reports results on the impact of financial deepening on inequality. Coefficients on the ratio of private credit to GDP are negative and highly significant at the 1 percent level in both inequality (Columns 1 and 2) and poverty (Columns 5 and 6) regressions, reflecting a beneficial effect of financial deepening in the global sample. A 1 percentage point increase in private credit to GDP ratio tends to reduce the Gini coefficient by more than 0.041%; and reduce the poverty gap by a percentage point of 0.019. Similarly, all coefficients on the ratio of stock market total value traded to GDP are negative and significant. These findings are consistent with Clark and others (2006), Beck and others (2004), and Beck and others (2007). They support the inequality-reducing effect of financial deepening from both financial institutions and stock markets.
Table 5 reports the results on the relationship between financial efficiency, income inequality, and poverty. The coefficients on net interest margin are all positive, but only significant in Gini coefficient regressions. As large net interest margins suggest less efficiency, the positive coefficients reflect inequality-reducing effects through enhanced efficiency in financial institutions. The results indicate that a reduction of 1 percentage point in the net interest margin can reduce inequality by a percentage point of 0.44. The results on the measure of stock market efficiency are negative and significant in all the regressions, which is consistent with the beneficial effect of increasing stock market efficiency for inequality reduction. In

10
quantitative terms, the estimation results imply that a 1 percent increase in the stock market turnover ratio can reduce the Gini coefficient by a percentage point of 0.055 (Column 4), and reduce the poverty gap by a percentage point of 0.016.
Table 6 summarizes the findings on the impact of financial institutions and market stability on income inequality and poverty. Similarly to Jeanneney and Kpodar (2011), our results confirm the worsening effects of financial instability on income distribution. The coefficients show that only the stability of financial institutions, measured by the ratio of regulatory capital to risk-weighted assets, helps to reduce income inequality. On average, a 1 percent increase in the ratio of regulatory capital to risk-weighted assets can lower the Gini coefficient and poverty gap by percentage points of 0.375 and 0.342, respectively.
In contrast to the favorable impact of financial depth, access, efficiency, and stability on income distribution, Table 7 shows that domestic and external financial liberalization tend to widen income inequality and poverty. Positive coefficients on domestic liberalization suggest that the aggregation of indices of credit control, interest rate control, entry barriers, and privatization can significantly worsen the Gini coefficient, but not on the poverty gap. Turning to external liberalization, both inequality and poverty could increase as the consolidated foreign claims of BIS-reporting banks to GDP (%) increase.
Tables 8 and 9 investigate the role of country income levels on the relationship between inequality, poverty, and finance. In Table 8, qualitatively looking at the coefficients of interaction and finance terms, the three income groups in most cases have the same finance-inequality relationships. However, in Columns (2), (3), (7), and (8), the low-income countries have different finance-inequality effects compared to rich countries. Most noticeably, a 1 percentage point increase in private credit tends to reduce the Gini coefficient by a percentage point of 0.059 in the high-income group; while this effect increases the Gini coefficient by a percentage point of 0.029 (0.088-0.059=0.029) in low-income countries. This result shows financial depth affects inequality differently according to a country’s income level. Similarly in Table 9, the poverty reduction effects of some financial development indicators are different in the three income groups. However, the differences are not consistent to conclude that the income level of a country can affect the finance-poverty relationship.
Tables 10 and 11 test whether institutional quality affects the linkage of inequality, poverty, and finance. When regressed with the Gini coefficient (Table 10), the interaction and finance terms are both positive and significant in Column (5), which studies the net interest margin effect. These two positive signs imply that lower interest margins (better financial efficiency) can reduce income inequality and that this effect is larger when a country has a stronger rule of law. Columns (9) and (10) show diverse signs in both interaction and finance terms. However, since financial liberalization is shown to aggravate inequality, the negative sign in
11
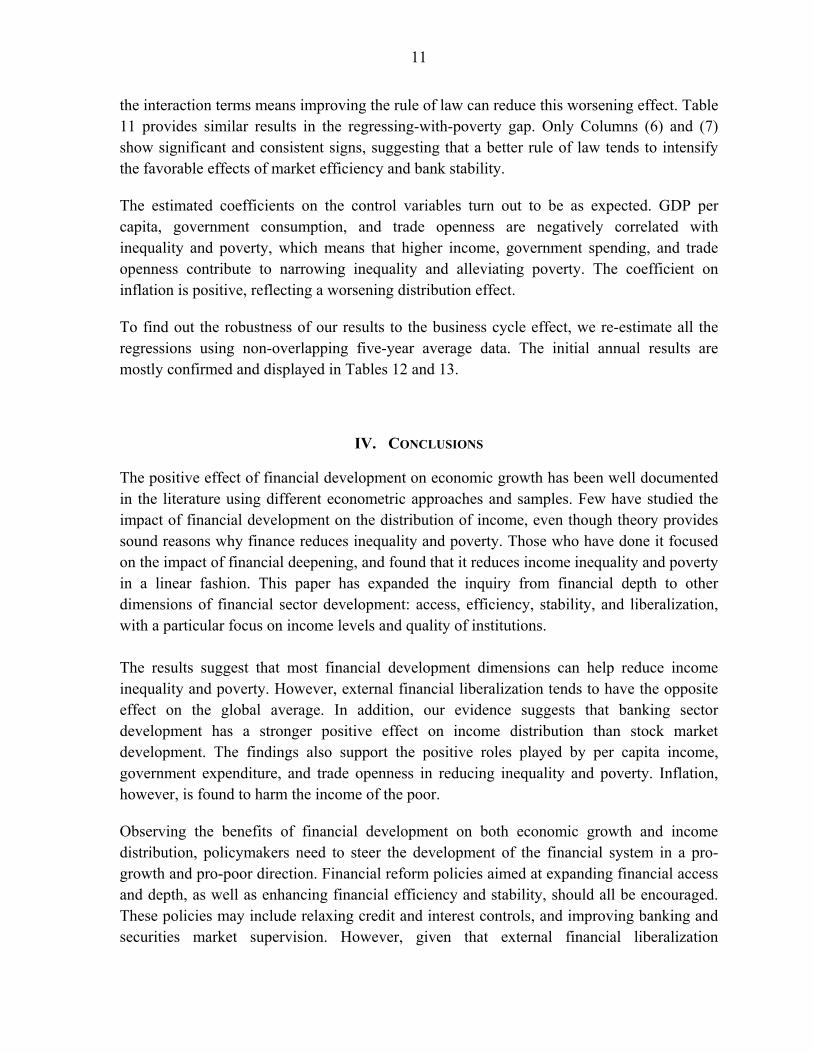
the interaction terms means improving the rule of law can reduce this worsening effect. Table 11 provides similar results in the regressing-with-poverty gap. Only Columns (6) and (7) show significant and consistent signs, suggesting that a better rule of law tends to intensify the favorable effects of market efficiency and bank stability.
The estimated coefficients on the control variables turn out to be as expected. GDP per capita, government consumption, and trade openness are negatively correlated with inequality and poverty, which means that higher income, government spending, and trade openness contribute to narrowing inequality and alleviating poverty. The coefficient on inflation is positive, reflecting a worsening distribution effect.
To find out the robustness of our results to the business cycle effect, we re-estimate all the regressions using non-overlapping five-year average data. The initial annual results are mostly confirmed and displayed in Tables 12 and 13.
IV. CONCLUSIONS
The positive effect of financial development on economic growth has been well documented in the literature using different econometric approaches and samples. Few have studied the impact of financial development on the distribution of income, even though theory provides sound reasons why finance reduces inequality and poverty. Those who have done it focused on the impact of financial deepening, and found that it reduces income inequality and poverty in a linear fashion. This paper has expanded the inquiry from financial depth to other dimensions of financial sector development: access, efficiency, stability, and liberalization, with a particular focus on income levels and quality of institutions.
The results suggest that most financial development dimensions can help reduce income inequality and poverty. However, external financial liberalization tends to have the opposite effect on the global average. In addition, our evidence suggests that banking sector development has a stronger positive effect on income distribution than stock market development. The findings also support the positive roles played by per capita income, government expenditure, and trade openness in reducing inequality and poverty. Inflation, however, is found to harm the income of the poor.
Observing the benefits of financial development on both economic growth and income distribution, policymakers need to steer the development of the financial system in a pro-growth and pro-poor direction. Financial reform policies aimed at expanding financial access and depth, as well as enhancing financial efficiency and stability, should all be encouraged. These policies may include relaxing credit and interest controls, and improving banking and securities market supervision. However, given that external financial liberalization

12
aggravates poverty, capital account liberalization should proceed in a carefully designed and well-sequenced fashion in a stable macroeconomic environment to avoid offsetting the poverty-reducing gains with the development of other dimensions of the financial sector. It is also important to develop an effective regulatory system for financial institutions and to enhance financial infrastructure (credit information, and collateral and insolvency regimes) in order to limit risk taking of banks. Given that the development of financial institutions has a greater impact than the development of the stock market, policymakers may give priority to banking sector improvement when considering poverty and income inequality alleviation. Further research will focus on the policy setting and conditions in which financial liberalization could reduce poverty and income inequality.

13
References
Abiad, A., Detragiache, E., Tressel,T., (2008). A New Database of Financial Reforms. IMF Working Papers 08/266. International Monetary Fund.
Alesina, A., Devleeschauwer,A., Easterly, W., Kurlat, S., and Wacziarg, R. (2003). “Fractionalization.” J. Econ. Growth 8 (June): 155–94.
Beck, T., Demirguc-Kunt, A., and Levine, R. (2004). Finance, Inequality, and Poverty: Cross-Country Evidence. NBER Working Paper No. 10979
Beck, T., Demirguc-Kunt, A., and Levine, R. (2007). Finance, Inequality, and Poor. Journal of Economic Growth, 12(1), 27-49
Claessens, S., and Perotti, E. (2007). Finance and Inequality: Channels and Evidence. Journal of Comparative Economics, 35(4), 748-773
Demirguc-Kunt, A., Beck, T., Honohan, P. (2008). Finance for All: Policies and Pitfalls in Expanding Access. The World Bank, Washington, DC.
Easterly, W., & Fischer, S. (2001). Inflation and the Poor. Journal of Money, Credit and Banking, 33(2), 160-178
Furceri, D., & Loungani, P.(2015). Capital Account Liberalization and Inequality. IMF working paper
Galor, O., and Moav, O. (2004). From Physical to Human Capital Accumulation: Inequality and the Process of Development. The Review of Economic Studies, 71(4), 1001-1026
Galor. O., and Zeira. J. (1993). Income Distribution and Macroeconomics. Review of Economic Studies, Bol. 60, pp. 35-52
Greenwood, J., and Jovanovic, B. (1990). Financial Development, Growth, and the Distribution of Income. Journal of Political Economy, 98(5), 1076-1107
Honohan, P. (2004). Financial Development, Growth and Poverty: How Closer are the Links? World Bank Policy Research Working Paper 3203
Jeanneney, S. G., and Kpodar, K. (2011). Financial Development and Poverty Reduction: Can There Be a Benefit Without a Cost? The Journal of Development Studies, 47(1), 143-163
Kunieda. T., Okada. K., and Shibata. A. (2011). Finance and Inequality: How Does Globalization Change Their Relationship? MPRA Paper No.35358
Rajan, Raghuram G. and Luigi Zingales. (2003). The Great Reversals: The Politics of Financial Development in the 20th Century. Journal of Financial Economics 69, 1: 5-50.
14
Table 1: Summary Statistics
Variables Obs Mean sd Min Max
Gini coefficient 1759 39.39 10.91 15.90 76.70
Poverty gap 804 7.30 10.34 0.00 63.34
Log GDP per capita 7885 7.63 1.60 4.00 11.59
Inflation 6438 33.82 487.15 -21.68 24411.00
Trade openness 7427 76.83 49.13 0.31 460.47
Government consumption 7100 15.89 6.85 1.38 76.22
Bank accounts per 1,000 adults 434 333.97 276.46 0.72 988.15
Value traded in top 10 trading companies (%) 559 55.38 23.10 2.35 99.66
Private credit to GDP (%) 5844 35.91 35.63 0.12 434.09
Stock market total value traded to GDP (%) 1942 28.30 58.09 0.00 754.03
Net interest margin (%) 3807 4.68 3.48 -12.01 40.63
Stock market turnover ratio (%) 1933 46.04 59.32 0.01 538.20
Regulatory capital to risk-weighted assets (%) 1276 15.77 5.23 2.50 48.60
Volatility of stock price index (%) 1281 26.60 15.60 3.86 195.34
Domestic financial liberalization 2330 6.30 3.87 0.00 12.00
External financial liberalization (%) 4482 36.07 75.59 0.01 957.14

15
Table 2: Correlations
Variables (1) (2) (3) (4) (5) (6) (7) (8) (9) (10) (11) (12)
Gini coefficient (1) 1.00
Poverty gap (2) 0.18 1.00
Bank accounts per 1,000 adults (3) -0.28 -0.49 1.00
Value traded in top 10 trading companies (%)
(4) 0.02 -0.10 0.07 1.00
Private credit to GDP (%) (5) -0.24 -0.27 0.71 0.08 1.00
Stock market total value traded to GDP (%)
(6) -0.14 -0.12 0.16 -0.34 0.47 1.00
Net interest margin (%) (7) 0.19 0.21 -0.27 -0.02 -0.5 -0.33 1.00
Stock market turnover ratio (%) (8) -0.23 -0.07 0.08 -0.37 0.26 0.54 -0.30 1.00
Regulatory capital to risk-weighted assets (%)
(9) -0.09 -0.10 -0.09 0.08 -0.35 -0.18 0.45 -0.23 1.00
Volatility of stock price index (10) 0.13 0.03 -0.12 0.03 -0.16 -0.04 0.15 0.12 0.16 1.00
Domestic financial liberalization (11) 0.00 -0.27 -0.20 0.31 0.39 0.30 -0.09 -0.05 -0.08 -0.30 1.00
External financial liberalization (%)
(12) 0.04 -0.12 0.35 0.33 0.42 0.24 -0.25 0.00 -0.17 -0.14 -0.04 1.00

16
Table 3: Effects of Financial Access on Income Inequality
Gini coefficient Poverty gap
(1) (2) (3) (4) (5) (6) (7) (8) OLS IV OLS IV OLS IV OLS IV Log GDP per capita 4.468*** 4.360*** -3.066*** -3.062*** -4.344*** -4.028*** -2.339*** -2.056*** (1.02) (1.04) (0.68) (0.75) (0.93) (0.92) (0.35) (0.44) Inflation -0.054 -0.062 -0.083 -0.004 0.219 0.232 -0.019 -0.019 (0.22) (0.29) (0.11) (0.08) (0.19) (0.21) (0.03) (0.03) Trade openness 0.001 -0.005 -0.032*** -0.029** -0.075*** -0.075** -0.036*** -0.032*** (0.03) (0.03) (0.01) (0.01) (0.03) (0.03) (0.01) (0.01) Government Consumption 0.366 0.349 -0.351* -0.299 0.107 0.103 0.079 0.072 (0.23) (0.24) (0.18) (0.21) (0.18) (0.19) (0.05) (0.05) Constant 15.000* 15.402* 73.253*** 74.200*** 42.891*** 40.542*** 21.908*** 19.069*** (8.10) (8.30) (5.52) (5.88) (7.00) (7.76) (2.51) (3.05) Bank accounts per 1000 adults -0.022*** -0.019*** -0.007* -0.007* (0.00) (0.00) (0.00) (0.00) Value traded in top 10 trading companies (%)↓ 0.048 0.010 0.015 0.019 (0.03) (0.04) (0.01) (0.01) R-squared 0.272 0.267 0.229 0.242 0.464 0.462 0.469 0.542 Observations 102 102 197 157 94 94 112 91 Hansen’s J statistic 0.6206 0.6996 0.9357 0.1252

17
Table 4: Effects of Financial Deepening on Income Inequality
Gini coefficient Poverty gap
(1) (2) (3) (4) (5) (6) (7) (8) OLS IV OLS IV OLS IV OLS IV Log GDP per capita -0.390* -0.459** -0.249 -0.079 -6.544*** -6.607*** -3.745*** -3.005*** (0.23) (0.23) (0.32) (0.32) (0.28) (0.37) (0.29) (0.48) Inflation 0.006*** 0.008*** 0.006*** 0.013*** 0.001 0.002** 0.001 0.002*** (0.00) (0.00) (0.00) (0.00) (0.00) (0.00) (0.00) (0.00) Trade openness 0.003 0.004 -0.029*** -0.031*** -0.029*** -0.024*** -0.030*** -0.027*** (0.01) (0.01) (0.01) (0.01) (0.01) (0.01) (0.01) (0.01) Government Consumption -0.500*** -0.476*** -0.699*** -0.714*** 0.153** 0.170** 0.006 -0.008 (0.05) (0.06) (0.08) (0.08) (0.06) (0.07) (0.06) (0.06) Constant 52.402*** 52.430*** 55.340*** 54.569*** 55.593*** 55.789*** 34.954*** 28.983*** (1.61) (1.52) (2.37) (2.50) (2.10) (2.91) (2.20) (3.53) Private credit to GDP (%) -0.045*** -0.041*** -0.020 -0.019* (0.01) (0.01) (0.01) (0.01) Stock market total value traded to GDP (%) -0.019* -0.022** -0.017 -0.015** (0.01) (0.01) (0.01) (0.01) R-squared 0.141 0.139 0.179 0.180 0.484 0.498 0.347 0.285 Observations 1393 1328 729 618 687 628 412 339 Hansen’s J statistics 0.3510 0.7253 0.3758 0.9433 * p<0.10, ** p<0.05, *** p<0.01 Note: parentheses report standard errors

18
Table 5: Effects of Financial Efficiency on Income Inequality
Gini coefficient Poverty gap
(1) (2) (3) (4) (5) (6) (7) (8) OLS IV OLS IV OLS IV OLS IV
Log GDP per capita 0.116 0.345 -0.465 -0.168 -5.459*** -5.371*** -4.071*** -2.735*** (0.35) (0.37) (0.30) (0.30) (0.33) (0.44) (0.31) (0.43)
Inflation 0.031 0.032 0.008*** 0.018*** 0.023 0.031 0.002 0.004*** (0.02) (0.03) (0.00) (0.00) (0.02) (0.02) (0.00) (0.00)
Trade openness -0.037*** -0.038*** -0.033*** -0.041*** -0.036*** -0.035*** -0.029*** -0.030*** (0.01) (0.01) (0.01) (0.01) (0.01) (0.01) (0.01) (0.01)
Government Consumption -0.572*** -0.580*** -0.655*** -0.695*** 0.022 0.015 0.031 -0.019 (0.08) (0.10) (0.08) (0.08) (0.07) (0.07) (0.06) (0.05)
Constant 49.603*** 47.550*** 58.301*** 58.164*** 48.046*** 47.061*** 37.545*** 27.576*** (3.14) (3.95) (2.23) (2.39) (2.73) (3.84) (2.40) (3.34)
Net Interest Margin (%) ↓ 0.359*** 0.440** 0.062 0.096 (0.13) (0.22) (0.09) (0.18)
Stock market turnover ratio (%) -0.037*** -0.055*** -0.017*** -0.016*** (0.01) (0.01) (0.01) (0.00)
R-squared 0.142 0.141 0.222 0.236 0.440 0.434 0.334 0.295 Observations 626 626 721 610 461 402 416 333
Hansen’s J statistic 0.4866 0.9676 0.1105 0.3669 * p<0.10, ** p<0.05, *** p<0.01 Note: parentheses report standard errors

19
Table 6: Effects of Financial Stability on Income Inequality
Gini coefficient Poverty gap
(1) (2) (3) (4) (5) (6) (7) (8) OLS IV OLS IV OLS IV OLS IV Log GDP per capita -1.235*** -1.360** -1.561*** -1.502*** -3.587*** -4.557*** -1.769*** -1.662*** (0.44) (0.54) (0.39) (0.46) (0.27) (1.01) (0.24) (0.32) Inflation 0.016 0.052 0.008*** 0.013*** -0.012 -0.025 0.002*** 0.001* (0.04) (0.05) (0.00) (0.00) (0.02) (0.04) (0.00) (0.00) Trade openness -0.038*** -0.035*** -0.024*** -0.023*** -0.030*** -0.025*** -0.032*** -0.025*** (0.01) (0.01) (0.01) (0.01) (0.01) (0.01) (0.00) (0.01) Government Consumption -0.838*** -0.769*** -0.571*** -0.532*** -0.056 0.018 -0.014 0.009 (0.10) (0.11) (0.10) (0.11) (0.05) (0.06) (0.04) (0.04) Constant 70.831*** 72.337*** 64.659*** 61.846*** 38.789*** 46.031*** 20.521*** 16.519*** (4.08) (6.19) (3.52) (5.92) (2.39) (9.17) (1.97) (3.85) Regulatory capital to risk-weighted assets (%) -0.238*** -0.375*** -0.258*** -0.342*** (0.08) (0.13) (0.04) (0.10) Volatility of stock price index ↓ -0.039 0.032 -0.043*** 0.031 (0.03) (0.07) (0.01) (0.06) R-squared 0.239 0.210 0.200 0.194 0.414 0.307 0.358 0.259 Observations 487 387 489 418 348 242 254 253 Hansen’s J statistic 0.1121 0.6011 0.6839 0.2804 * p<0.10, ** p<0.05, *** p<0.01 Note: parentheses report standard errors

20
Table 7: Effects of Financial Liberalization on Income Inequality
Gini coefficient Poverty gap
(1) (2) (3) (4) (5) (6) (7) (8) OLS IV OLS IV OLS IV OLS IV Log GDP per capita -0.579** -0.810*** -0.678** -0.569** -5.716*** -5.918*** -6.793*** -6.779*** (0.26) (0.27) (0.27) (0.28) (0.34) (0.42) (0.27) (0.37) Inflation 0.007*** 0.008*** 0.005*** 0.006*** -0.000 -0.000 -0.000 0.000 (0.00) (0.00) (0.00) (0.00) (0.00) (0.00) (0.00) (0.00) Trade openness -0.031*** -0.030*** -0.029*** -0.031*** -0.066*** -0.067*** -0.052*** -0.052*** (0.01) (0.01) (0.01) (0.01) (0.01) (0.01) (0.01) (0.01) Government Consumption -0.727*** -0.687*** -0.393*** -0.361*** -0.008 0.005 0.152*** 0.159** (0.07) (0.07) (0.07) (0.08) (0.08) (0.07) (0.06) (0.06) Constant 53.739*** 54.814*** 53.847*** 52.813*** 52.888*** 54.085*** 57.519*** 57.345*** (1.78) (1.85) (2.02) (1.94) (2.34) (3.07) (2.06) (2.87) Domestic financial liberalization 0.479*** 0.501*** 0.037 0.059 (0.10) (0.11) (0.10) (0.13) External financial liberalization 0.022*** 0.024*** 0.037*** 0.038*** (0.01) (0.01) (0.01) (0.00) R-squared 0.224 0.228 0.080 0.070 0.550 0.549 0.494 0.492 Observations 820 792 1049 998 356 354 698 679 Hansen’s J statistic 0.2607 0.1823 0.1234 0.6294 * p<0.10, ** p<0.05, *** p<0.01 Note: parentheses report standard errors

21
Table 8: Inequality-FD add Country income level interaction (1) (2) (3) (4) (5) (6) (7) (8) (9) (10) Bank
accounts per 1000
adults
Value traded in
top 10 trading
companies↓
Private credit to GDP (%)
Stock market
total value traded to GDP (%)
Net Interest Margin (%)↓
Stock market
turnover ratio (%)
Regulatory capital to risk-
weighted assets
(%)
Volatility of stock
price index ↓
Domestic financial
liberalization
External financial
liberalization
Log GDP per capita 6.984*** 2.129** 3.150*** 3.694*** 2.133*** 1.955*** 2.225** 6.292*** 2.902*** 1.692*** (1.61) (0.86) (0.40) (0.57) (0.80) (0.52) (0.88) (0.68) (0.47) (0.50) Inflation -0.357 -0.184*** 0.005*** 0.009*** 0.024 0.015*** -0.018 0.008*** 0.005*** 0.004** (0.25) (0.06) (0.00) (0.00) (0.04) (0.00) (0.07) (0.00) (0.00) (0.00) Trade openness 0.050 0.017 -0.002 -0.016** -0.020** -0.020** -0.028*** -0.019** -0.022*** -0.032*** (0.04) (0.01) (0.00) (0.01) (0.01) (0.01) (0.01) (0.01) (0.01) (0.01) Government Consumption 0.326 0.694*** -0.248*** -0.367*** -0.337*** -0.328*** -0.276** -0.200* -0.377*** -0.060 (0.22) (0.21) (0.07) (0.09) (0.10) (0.09) (0.12) (0.12) (0.07) (0.07) Constant 6.663 8.669 11.502*** 6.876 16.444* 22.052*** 2.678 -40.219*** 11.725** 17.771*** (10.82) (9.29) (3.73) (5.21) (9.00) (5.56) (13.73) (10.18) (4.73) (4.72) low -12.091** 2.224 12.552*** 15.866*** 16.444*** 15.449*** 43.664*** 43.528*** 14.033*** 16.025*** (5.26) (4.84) (2.07) (1.39) (3.10) (1.43) (8.09) (6.20) (2.00) (1.34) mid N/A N/A 17.224*** 16.037*** 7.617 12.557*** 32.081*** 38.496*** 16.179*** 14.609*** (2.63) (2.53) (4.82) (3.75) (12.11) (9.17) (3.83) (2.35) FD -0.057*** -0.169*** -0.059* -0.034 1.460** -0.007 1.265** 0.799*** 0.235* 0.047*** (0.02) (0.05) (0.03) (0.02) (0.59) (0.01) (0.57) (0.25) (0.13) (0.01) FD*low 0.035** 0.380*** 0.088*** 0.020 -1.267** -0.041*** -2.011*** -0.912*** 0.171 0.008 (0.02) (0.08) (0.03) (0.04) (0.62) (0.01) (0.57) (0.26) (0.13) (0.01) FD*mid N/A N/A -0.063 -0.860*** -0.200 -0.045 -1.295** -0.658** 0.145 0.370** (0.09) (0.28) (0.66) (0.04) (0.65) (0.26) (0.37) (0.15) R-squared 0.427 0.687 0.349 0.388 0.302 0.407 0.383 0.268 0.415 0.263 Observations 58 157 1364 618 530 610 387 450 775 1002 Hansen’s J statistic 0.1171 0.6215 0.1057 0.1577 0.1647 0.5265 0.2939 0.8752 0.3361 0.2426 Note: parentheses report standard errors * p<0.10, ** p<0.05, *** p<0.01

22
Table 9: Poverty-FD add Country income level interaction (1) (2) (3) (4) (5) (6) (7) (8) (9) (10) Bank
accounts per 1000
adults
Value traded in top 10 trading
companies↓
Private credit to GDP (%)
Stock market
total value traded to GDP (%)
Net Interest Margin (%)↓
Stock market turnover ratio
(%)
Regulatory capital to
risk-weighted
assets (%)
Volatility of stock
price index ↓
Domestic financial
liberalization
External financial
liberalization
Log GDP per capita -3.084* -2.211*** -5.034*** -5.096*** -4.591*** -4.348*** -2.612*** -2.345*** -3.975*** -5.948*** (1.65) (0.75) (0.46) (0.83) (0.72) (0.58) (0.41) (0.40) (0.40) (0.49) Inflation 0.028 -0.027 0.002** 0.003*** 0.041** 0.005*** 0.001 0.002*** -0.000 0.001 (0.24) (0.02) (0.00) (0.00) (0.02) (0.00) (0.02) (0.00) (0.00) (0.00) Trade openness -0.061 -0.023*** -0.027*** -0.027*** -0.037*** -0.031*** -0.022*** -0.026*** -0.059*** -0.052*** (0.05) (0.01) (0.01) (0.01) (0.01) (0.01) (0.01) (0.01) (0.01) (0.01) Government Consumption 0.126 0.163** 0.162** 0.026 -0.062 -0.008 0.012 0.018 0.020 0.150** (0.19) (0.08) (0.07) (0.07) (0.08) (0.06) (0.05) (0.05) (0.07) (0.07) Constant 46.536*** 18.710** 38.040*** 55.571*** 56.668*** 42.500*** 21.269*** 14.324 26.604*** 50.906*** (11.38) (7.92) (3.85) (9.89) (9.85) (5.33) (5.33) (12.10) (6.76) (4.24) low -14.854** -1.116 4.536** -11.136** -13.649** -2.513** 7.750* 9.352 12.498** -0.424 (6.51) (4.61) (1.86) (4.55) (5.45) (1.01) (4.18) (11.08) (5.36) (0.99) mid 18.503*** -14.431** -21.656*** -3.488 35.748*** 2.716 20.020*** 6.038** (3.26) (6.14) (7.44) (2.61) (9.62) (11.44) (7.75) (2.58) FD -0.065*** -0.004 0.146** -1.168** -2.989** -0.042** 0.279 0.302 1.289** 0.060*** (0.02) (0.05) (0.06) (0.57) (1.39) (0.02) (0.29) (0.39) (0.55) (0.02) FD*low 0.060*** 0.045 -0.140** 1.157** 2.826** 0.021 -0.540* -0.330 -1.029*** -0.021 (0.02) (0.07) (0.06) (0.57) (1.37) (0.02) (0.30) (0.38) (0.39) (0.02) FD*mid -0.532*** 0.862 4.566*** -0.011 -1.421*** -0.213 -0.605 -0.224 (0.14) (0.85) (1.45) (0.02) (0.42) (0.39) (0.67) (0.21) R-squared 0.609 0.583 0.571 -0.119 0.495 0.273 0.542 0.200 0.678 0.518 Observations 56 91 647 339 402 357 282 238 352 680 Hansen’s J statistic 0.9041 0.1084 0.5305 0.1094 0.1576 0.1532 0.3319 N/A 0.6097 0.4424
Note: parentheses report standard errors * p<0.10, ** p<0.05, *** p<0.01

23
Table 10: Inequality-FD add quality of institution interaction (1) (2) (3) (4) (5) (6) (7) (8) (9) (10) Bank
accounts per 1000
adults
Value traded in
top 10 trading
companies↓
Private credit to GDP (%)
Stock market
total value traded to GDP (%)
Net Interest Margin (%)↓
Stock market
turnover ratio (%)
Regulatory capital to risk-
weighted assets
(%)
Volatility of stock
price index ↓
Domestic financial
liberalization
External financial
liberalization
Log GDP per capita 0.898 3.497* 1.591** 0.970 2.710*** 0.832 1.015 3.914** 0.976 0.464 (3.77) (2.10) (0.66) (1.35) (0.63) (0.72) (0.92) (1.59) (1.23) (0.63) Inflation -0.676** -0.086* 0.037 -0.045 0.031 -0.015 -0.025 0.175 0.058 0.044** (0.32) (0.05) (0.03) (0.09) (0.04) (0.08) (0.07) (0.16) (0.04) (0.02) Trade openness 0.089* 0.020** -0.029** -0.032** -0.020* -0.036** -0.012 -0.022 -0.058*** -0.057*** (0.05) (0.01) (0.01) (0.01) (0.01) (0.01) (0.01) (0.01) (0.02) (0.02) Government Consumption -0.256 0.261 -0.420*** -0.523*** -0.422*** -0.500*** -0.329** -0.304* -0.413** -0.334*** (0.27) (0.21) (0.11) (0.13) (0.10) (0.12) (0.15) (0.16) (0.19) (0.11) Constant 37.815 8.833 35.863*** 44.688*** 20.962*** 46.316*** 52.173*** 26.995* 34.384*** 43.783*** (25.22) (12.23) (6.03) (13.17) (6.22) (6.76) (11.16) (15.77) (9.09) (5.00) Rule of Law -10.183 -7.123 -3.011*** -5.046*** -8.515*** -4.962*** -11.659* -19.589*** 14.918*** -3.694*** (10.77) (7.10) (1.13) (1.79) (1.43) (1.19) (6.18) (7.29) (5.05) (0.97) FD -0.002 0.023 0.036 -0.093 1.537*** -0.042*** -0.804** -0.383** 1.107** 0.103*** (0.02) (0.12) (0.05) (0.08) (0.37) (0.01) (0.33) (0.19) (0.46) (0.02) FD*rule of law 0.028 -0.098 -0.047* 0.052 1.370*** 0.016** 0.294 0.326 -1.350*** -0.054*** (0.02) (0.09) (0.02) (0.04) (0.35) (0.01) (0.43) (0.23) (0.33) (0.01) R-squared 0.530 0.565 0.236 0.227 0.256 0.332 0.248 0.279 0.454 0.213 Observations 24 139 495 365 442 355 338 244 124 494 Hansen’s J statistic 0.1740 0.0513 0.5659 0.5046 0.2637 0.8298 0.6534 0.4093 0.1513 0.3445
Note: parentheses report standard errors * p<0.10, ** p<0.05, *** p<0.01

24
Table 11: Poverty-FD add quality of institution interaction (1) (2) (2) (4) (5) (6) (7) (8) (9) (10) Bank
accounts per 1000
adults
Value traded in top 10 trading
companies↓
Private credit to GDP (%)
Stock market total value traded to GDP (%)
Net Interest Margin (%)↓
Stock market
turnover ratio (%)
Regulatory capital to
risk-weighted
assets (%)
Volatility of stock
price index ↓
Domestic financial liberalization
External financial
liberalization
Log GDP per capita -5.803*** -2.754*** -6.446*** -4.470*** -6.172*** -6.757*** -4.237*** -1.368** -5.767*** -6.524*** (1.53) (0.80) (0.54) (0.74) (0.65) (1.50) (0.92) (0.59) (1.03) (0.56) Inflation 0.083 -0.018 0.028 -0.017 0.055** 0.016 0.018 0.001 0.001 0.042** (0.22) (0.02) (0.02) (0.03) (0.02) (0.05) (0.03) (0.05) (0.02) (0.02) Trade openness -0.070 -0.019** -0.026** -0.035*** -0.049*** -0.063*** -0.051*** -0.027 -0.073*** -0.054*** (0.05) (0.01) (0.01) (0.01) (0.01) (0.02) (0.02) (0.02) (0.02) (0.01) Government Consumption -0.067 0.235*** 0.035 -0.041 -0.060 -0.142* -0.097 0.012 -0.026 0.034 (0.24) (0.07) (0.07) (0.07) (0.08) (0.08) (0.11) (0.06) (0.10) (0.08) Constant 57.497*** 20.701*** 56.647*** 42.169*** 59.726*** 67.953*** 59.932*** 16.854** 46.040*** 57.014*** (14.32) (5.80) (4.72) (6.26) (7.20) (14.64) (10.40) (7.91) (7.37) (4.75) Rule of Laws 3.084 2.489 2.075 2.501*** 9.125** 8.439*** 15.475* -2.352 -8.917 1.475 (6.37) (2.92) (1.47) (0.87) (3.95) (3.21) (8.44) (6.05) (6.83) (1.13) FD -0.005 0.029 -0.028** -0.027*** -0.665 -0.123** -1.133*** -0.064 0.905*** 0.043*** (0.01) (0.02) (0.01) (0.01) (0.54) (0.05) (0.35) (0.08) (0.32) (0.01) FD*rule of law 0.002 -0.063 0.012 0.007 -1.176 -0.083* -0.914* 0.065 0.846 0.016 (0.01) (0.04) (0.03) (0.02) (0.73) (0.05) (0.52) (0.17) (0.52) (0.03) R-squared 0.509 0.594 0.482 0.275 0.430 -0.374 -0.119 0.268 0.500 0.472 Observations 55 82 371 252 340 246 246 152 130 380 Hansen’s J statistic 0.4936 0.1838 0.2378 0.0122 0.1460 0.5011 0.7533 0.9587 0.1501 0.3820
Note: parentheses report standard errors * p<0.10, ** p<0.05, *** p<0.01

25
Table 12: Gini coefficient 5 year average sample
Dependent Variable: Gini coefficient (1) (2) (3) (4) (5) (6) (7) (8) (9) (10) Log GDP per capita 2.391 -3.179* -0.567 -0.202 -2.518*** 2.869 -0.947 -1.157** -1.578*** -1.423*** (1.67) (1.76) (0.39) (0.54) (0.43) (1.85) (0.60) (0.56) (0.49) (0.39) Inflation 0.049 0.079 0.006 0.021*** 0.004 0.235* 0.103 0.023*** 0.014*** 0.007** (0.29) (0.43) (0.00) (0.00) (0.00) (0.14) (0.13) (0.00) (0.00) (0.00) Trade openness -0.000 -0.001 0.013** -0.003 0.011 -0.039** -0.011 -0.006 0.023* -0.015 (0.03) (0.02) (0.01) (0.01) (0.01) (0.02) (0.01) (0.01) (0.01) (0.01) Government Consumption 0.301 -0.293 -0.308*** -0.635*** -0.219** -1.111*** -0.861*** -0.636*** -0.325** -0.202** (0.26) (0.51) (0.09) (0.13) (0.10) (0.30) (0.16) (0.14) (0.16) (0.10) Constant 25.44** 80.547*** 51.364*** 51.964*** 63.687*** 38.358*** 66.325*** 60.065*** 55.710*** 54.914*** (10.99) (14.77) (2.37) (3.59) (3.73) (10.05) (7.23) (6.95) (4.12) (2.81) Bank accounts per 1,000 adults -0.011* (0.01) Value traded in top 10 trading companies -0.144 (0.10) Private credit to GDP -0.067*** (0.02) Stock market total value traded to GDP -0.029** (0.01) Lending-deposit spread -0.176 (0.16) Stock market turnover ratio -0.069*** (0.03) Regulatory capital to risk-weighted assets -0.357 (0.23) Volatility of stock price index -0.051 (0.09) Domestic financial liberalization 0.035 (0.21) External financial liberalization 0.030*** (0.01) Centered R-squared 0.097 0.352 0.189 0.208 0.095 0.186 0.259 0.237 0.152 0.032 Observations 75 32 513 231 464 181 152 182 188 441 Hansen’s J statistic 0.9551 0.4916 0.3176 0.5596 0.9948 0.1785 0.5959 0.5047 0.2432 0.8414
Note: parentheses report standard errors * p<0.10, ** p<0.05, *** p<0.01

26
Table 13: Poverty Gap 5 year average sample
Dependent Variable: Poverty gap (1) (2) (3) (4) (5) (6) (7) (8) (9) (10) Log GDP per capita -4.605*** -3.069*** -7.147*** -4.060*** -6.817*** -4.997*** -3.988*** -2.609*** -7.888*** -7.255*** (0.99) (0.86) (0.45) (0.72) (0.61) (0.74) (0.76) (0.98) (0.50) (0.73) Inflation 0.235 -0.094 0.004*** 0.003*** 0.010 0.006*** 0.034 -0.037 0.006** 0.005* (0.27) (0.06) (0.00) (0.00) (0.01) (0.00) (0.06) (0.11) (0.00) (0.00) Trade openness -0.043 -0.022*** 0.000 -0.009 -0.040** -0.015 -0.018 -0.026*** -0.038*** -0.036** (0.03) (0.01) (0.02) (0.01) (0.02) (0.01) (0.01) (0.01) (0.01) (0.02) Government Consumption 0.278 0.131 0.244*** 0.072 0.143 0.174 0.015 0.050 0.193** 0.226* (0.20) (0.09) (0.08) (0.12) (0.10) (0.13) (0.09) (0.14) (0.08) (0.13) Constant 41.861*** 25.562*** 58.145*** 34.979*** 64.032*** 42.072*** 41.726*** 22.347*** 64.292*** 60.046*** (7.75) (5.45) (3.55) (4.57) (4.94) (4.97) (6.95) (4.46) (3.88) (5.27) Bank accounts per 1,000 adults -0.008** (0.00) Value traded in top 10 trading companies
0.029
(0.02) Private credit to GDP -0.054** (0.02) Stock market total value traded to GDP -0.026* (0.01) Lending-deposit spread -0.581** (0.22) Stock market turnover ratio -0.029** (0.01) Regulatory capital to risk-weighted assets -0.404*** (0.12) Volatility of stock price index 0.082 (0.15) Domestic financial liberalization 0.040*** (0.01) External financial liberalization -0.045 (0.15) Centered R-squared 0.445 0.403 0.535 0.360 0.318 0.386 0.424 0.430 0.533 0.514 Observations 67 32 289 151 300 138 95 51 283 134 Hansen’s J statistic 0.7375 0.2419 0.1159 0.4250 0.1219 0.8537 0.5844 0.2444 0.8537 0.5844
Note: parentheses report standard errors * p<0.10, ** p<0.05, *** p<0.01

27
Appendix1: Variable Definition and Data Source
Variables Definition Source
Gini coefficient Gini coefficient measures income inequality, with 0 resembles perfectly equal outcome, while, 100 percent reflects extremely unequal condition.
World Bank, All the Gini database (2013)
Poverty gap Poverty Gap Index, measures the average income shortfall of the poor individual from the poverty line ($1.25 a day).
World Bank, PovcalNet
Log GDP per capita Log of GDP per capita (constant 2000 US$) World Development Indicators(henceforth WDI)
Inflation Consumer prices (annual %) WDI
Trade openness Trade (% of GDP) measures trade openness WDI
Government consumption General government final consumption expenditure (% of GDP) WDI
Bank accounts per 1,000 adults Bank accounts per 1,000 adults World Bank, Global Financial Development Database (henceforth GFDD)
Value traded in top 10 trading companies (%)
Value traded in top 10 trading companies (lower values indicates better access to market) GFDD
Private credit to GDP (%) Private credit to GDP (%) GFDD
Stock market total value traded to GDP (%)
Stock market total value traded to GDP (%) GFDD
Net interest margin (%) Net interest margin (larger value suggests less efficiency) GFDD
Stock market turnover ratio (%) Stock market turnover ratio (%) GFDD
Regulatory capital to risk-weighted assets (%)
Regulatory capital to risk-weighted assets GFDD
Volatility of stock price index Volatility of stock price index (higher values implies less stability) GFDD
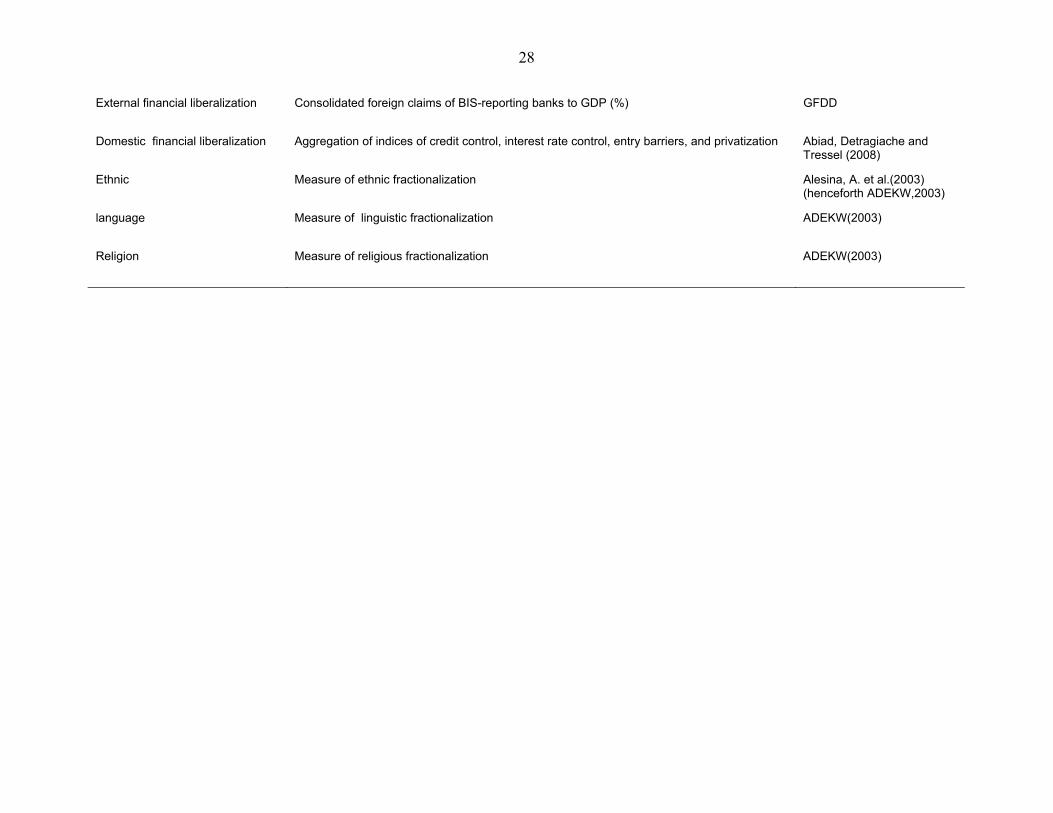
28
External financial liberalization Consolidated foreign claims of BIS-reporting banks to GDP (%) GFDD
Domestic financial liberalization Aggregation of indices of credit control, interest rate control, entry barriers, and privatization Abiad, Detragiache and Tressel (2008)
Ethnic Measure of ethnic fractionalization Alesina, A. et al.(2003) (henceforth ADEKW,2003)
language Measure of linguistic fractionalization ADEKW(2003)
Religion Measure of religious fractionalization ADEKW(2003)