financial information at 30 june 2013 2q13 - · pdf filefinancial information at 30 june 2013...
TRANSCRIPT
1
2Q13
Grupo Financiero HSBC
Financial information at 30 June 2013
Release date: 31 July 2013
► Press Release
► Quarterly Report
► Second Quarter 2013
Quarterly Report 2Q13
31 July 2013
GRUPO FINANCIERO HSBC, S.A. DE C.V. FIRST HALF 2013 FINANCIAL RESULTS – HIGHLIGHTS
Net income before tax for the first half of 2013 was MXN3,019m, an increase of MXN214m
or 7.6% compared with MXN2,805m for the first half of 2012. Net income for the first half of 2013 was MXN2,060m, a decrease of MXN266m or 11.4%
compared with MXN2,326m for the first half of 2012. Total operating income, net of loan impairment charges, for the first half of 2013 was
MXN13,632m, a decrease of MXN323m or 2.3% compared with MXN13,955m for the first half of 2012.
Loan impairment charges for the first half of 2013 were MXN3,777m, an increase of
MXN442m or 13.3% compared with MXN3,335m for the first half of 2012. Administrative and personnel expenses were MXN10,631m, a decrease of MXN547m or
4.9% compared with MXN11,178m for the first half of 2012.
The cost efficiency ratio was 61.1% for the first half of 2013, compared with 64.7% for the first half of 2012.
Net loans and advances to customers were MXN181.6bn at 30 June 2013, a decrease of MXN2.9bn or 1.6% compared with MXN184.4bn at 30 June 2012. Total impaired loans as a percentage of gross loans and advances increased to 4.3% compared with 2.2% at 30 June 2012.
At 30 June 2013, deposits were MXN253.1bn, a decrease of MXN42.5bn or 14.4%
compared with MXN295.5bn at 30 June 2012. Return on equity was 7.9% for the first half of 2013 compared with 10.0% for the first half
of 2012.
At 30 June 2013, the bank’s total capital adequacy ratio was 16.2% and the tier 1 capital ratio was 13.4% compared with 13.6% and 10.5% respectively at 30 June 2012.
In the first quarter of 2013, the bank paid a dividend of MXN1,400m, representing
MXN0.72 per share, and Grupo Financiero HSBC paid a dividend of MXN2,500m, representing MXN0.89 per share.
2012 results have been restated to reflect the general insurance manufacturing businesses as a discontinued operation.

Quarterly Report 2Q13
HSBC Mexico S.A. (the bank) is a subsidiary of Grupo Financiero HSBC, S.A. de C.V.’s (Grupo Financiero HSBC) and is subject to supervision by the Mexican Banking and Securities Commission. The bank is required to file financial information on a quarterly basis (in this case for the quarter ended 30 June 2013) and this information is publicly available. Given that this information is available in the public domain, Grupo Financiero HSBC, S.A. de C.V. has elected to file this release. HSBC Seguros, S.A. de C.V. Grupo Financiero HSBC (HSBC Seguros) is Grupo Financiero HSBC’s insurance group. Results are prepared in accordance with Mexican GAAP (Generally Accepted Accounting Principles).

Quarterly Report 2Q13
Overview In Mexico, growth remained weak, with lacklustre economic results in the first quarter of 2013, partly as government spending in the country moderated during the first months of the new administration. Core inflation remained under control and headline inflation continued to converge towards the mid-point of the inflation target (3.0%) expected later this year. For the first half of 2013, Grupo Financiero HSBC’s net income was MXN2,060m, a decrease of MXN266m or 11.4% compared with the first half of 2012. The reduction was driven mainly by higher loan impairment charges, an increased tax expense, and lower trading and other operating income, partially offset by an increase in net interest income and net fee income, as well as reduced administrative and personnel expenses. Net interest income was MXN11,373m, an increase of MXN577m or 5.3% compared with the first half of 2012. The improvement was due to higher average loan portfolio balances, mainly in payroll, personal, credit cards and higher business banking loans, partially offset by lower spreads in personal and payroll loans and lower interest income in non-interest bearing deposits due to a decrease in market rates. Loan impairment charges were MXN3,777m, an increase of MXN442m or 13.3% compared with the first half of 2012. In the first half of 2012 loan impairment charges were negatively impacted by a MXN659m one-off charge relating to a change in the write-off policy for mortgage loans. Excluding the 2012 one-off, there was an increase of MXN1,101m, mainly explained by higher loan impairment charges of MXN802m related to a finance project, a states and municipalities loan and the home builders’ portfolio, which was impacted by a change in policy regarding housing development; and the increase in the impaired consumer loan portfolio arising from loan growth. Loan impairment charges for the period exclude the loan impairment allowances for commercial lending due to the new CNBV methodology effective on 30 June 2013. The implementation of this new methodology increased loan loss allowances by MXN799m, which were recognized through retained earnings. Net fee income was MXN3,428m, an increase of MXN393m or 12.9% compared with the first half of 2012. The improvement was driven by lower fee expenses, mainly as a result of a change in the presentation of certain insurance expenses to administration expenses in the first half of 2013. In addition, higher fee income was explained by increased card fees as the number of customers increased by 10.4%, higher investment funds fees related to the ongoing promotion of this product which resulted in a 26.0% increase in volumes and higher account services fees. Trading income of MXN1,223m decreased by MXN238m or 16.3% compared with the first half of 2012, mainly due to a steepening of the yield curve in recent months which negatively affected long bond positions, partially offset by derivative gains.
Other operating income was MXN1,385m, a decrease of MXN613m or 30.7% compared with the first half of 2012. This reduction is mainly due to an impairment provision on a defaulted derivative related to a specific customer that was recognised as an account receivable.

Quarterly Report 2Q13
Administrative and personnel expenses were MXN10,631m, a decrease of MXN547m or 4.9% compared with the first half of 2012. This decrease is the result of cost reduction initiatives such as the restructure of operational processes, reengineering of global functions and technological infrastructure, lower restructuring expenses and the non-recurrence of MXN379m CNBV fine paid in 2012 as a result of non-compliance with anti-money laundering systems and controls identified by the CNBV in 2007 and 2008. This was partially offset by higher compliance and risk costs as a result of the implementation of HSBC global standards and the strategy of repositioning portfolios. The cost efficiency ratio was 61.1% for the first half of 2013, compared with 64.7% for the first half of 2012. The effective tax rate was 39.3% for the first half of 2013, compared with 23.7% for the first half of 2012. A large part of this variance is explained by higher inflationary effects which benefited the effective tax rate in the first half of 2012, and higher non-deductible provisions in the first half of 2013. The performance of non-banking subsidiaries continued to contribute positively to Grupo Financiero HSBC’s results, particularly HSBC Seguros, which reported net income before tax of MXN1,417m for the first half of 2013, up 26.3% compared with the first half of 2012. This increase was mainly due to a gain on the sale of the general insurance manufacturing portfolio in Mexico of MXN423m, which took place on 1 April 2013. In addition, a regulatory change to the methodology of calculating the incurred but not reported claims reserve resulted in a release of MXN126m. Excluding these one-off effects, HSBC Seguros would have reported a net income before tax of MXN868m for the first half of 2013, down 13.5% compared with the same period of 2012. This was mainly due to an increase in the underlying claims ratio to 39.3% from 35.7% reported in the first half of 2012. This was coupled with lower investment income as a result of the steepening of the yield curve, principally in the second quarter of 2013. Net loans and advances to customers decreased MXN2.9bn or 1.6% to MXN181.6bn at 30 June 2013 compared with 30 June 2012. The performing commercial loan portfolio decreased by 5.7% due to lower demand and the reclassification of certain home builder loans to the impaired portfolio. Government loans decreased due to a prepayment in one significant loan. The performing consumer loan portfolio increased by 15.2% primarily in payroll and personal loans and the performing mortgage loan portfolio increased by 11.3%. At 30 June 2013, total impaired loans increased by 96.6% to MXN8.3bn compared with MXN4.2bn at 30 June 2012. The higher impaired loan portfolio is largely associated with increased impaired commercial loans related with the performance of the home builder market during the second quarter of 2013, which was impacted by a change in policy regarding housing development. Total impaired loans as a percentage of total loans and advances to customers increased to 4.3% compared with 2.2% at 30 June 2012. Total loan loss allowances at 30 June 2013 were MXN11.2bn, an increase of MXN0.6bn or 5.6% compared with 30 June 2012. A total of MXN799m of loan loss allowances were recognized through retained earnings as a consequence of applying the new CNBV methodology for commercial loans. The total coverage ratio (allowance for loan losses divided by impaired
Quarterly Report 2Q13
loans) was 135.7% at 30 June 2013 compared with 252.6% at 30 June 2012. This decrease was primarily a result of the increase in impaired commercial loans related to the home builders’ portfolio. Total deposits were MXN253.1bn at 30 June 2013, a decrease of MXN42.5bn or 14.4% compared with 30 June 2012. Demand deposits decreased by 8.4% mainly related to a reduction of high interest bearing accounts in Commercial and Global Banking due to re-pricing strategies in order to offset the decrease in market interest rates, while time deposits decreased by 20.8% primarily as a result of customers switching to mutual fund products. Total assets under management in mutual funds were MXN89,268m an increase of 26.0% compared with 30 June 2012. Available for sale securities were MXN89.4bn, a decrease of MXN13.1bn or 12.8% compared with 30 June 2012. The decrease was largely as a result of the managed reduction in customer deposits. At 30 June 2013, the bank’s total capital adequacy ratio was 16.2% and the tier 1 capital ratio was 13.4% compared with 13.6% and 10.5% respectively at 30 June 2012. In the first quarter of 2013, the bank paid a dividend of MXN1,400m representing MXN0.72 per share and Grupo Financiero HSBC paid a dividend of MXN2,500m representing MXN0.89 per share. Business highlights Retail Banking and Wealth Management (RBWM) During the second quarter of 2013 we launched our “Mobile” strategy, to enable customers to pay their credit cards and utility bills, review their statements and transfer their funds to other accounts through their mobile phones. RBWM’s assets under management experienced strong growth in mutual funds, with an increase of 67.7% in balances compared to the same period of the previous year, mostly due to strategies focused on the Premier segment as part of our wealth management strategy. Our mutual funds are growing at a faster pace than the market average, increasing our market share. Personal loans achieved record sales volumes with an increase of 110.8% compared to the same period of the previous year, mainly due to pre-approved customer relationship management (CRM) offers, and an improvement in sales through our Contact Centre. Mortgage sales volumes increased 76.7% compared with the same period of 2012, as a result of a limited time mortgage campaign, launched during April 2013, offering the most competitive mortgage rate in the market at that time (8.70%) in order to improve sales and grow the portfolio.
Quarterly Report 2Q13
Commercial Banking (CMB) Aligned to our global strategy of becoming the Leading International Trade and Business Bank, CMB is improving connectivity with global customers throughout the world. Some of the highlights are:
• The first import documentary credit denominated in RMB was executed on 9 April 2013. • The launch during July of a very competitively priced International Growth Fund (export
and import financing) of USD1.0bn for our clients. • Strong collaboration with Global Banking and Markets and Global Private Banking
(GPB), including new debt capital market transactions and strong referrals in GPB taking advantage of enterprise relationships.
• Special focus on trade services in order to capture new relationships and support our existing customers’ international business opportunities and needs. As a consequence trade revenues for the first half of 2013 increased 18.4% compared with the first half of 2012.
The commercial loan portfolio has been affected during the second quarter of 2013 as a result of credit deterioration in the home builder market as well as specific provisions in the mid-market portfolio. Global Banking and Markets (GBM) During the second quarter of 2013, Debt Capital Markets business improved its position as a leading underwriter in Mexico, achieving first place in the local debt capital market league tables. Global Banking credit and lending business in local currency experienced a slowdown growth in average balances compared with 30 June of 2012 as a consequence of the lower economic activity, resulting in a lower demand. Global Banking average customer deposits decreased 5.1%, however the lower balances were offset by higher deposit spreads resulting in higher net interest income. Sale of HSBC general insurance manufacturing to AXA Group On 1 April 2013, the sale of the general insurance manufacturing portfolio to AXA Group was completed. Under the terms of this agreement, the purchaser will provide general insurance products to Grupo Financiero HSBC for our retail customers. From April 2013, a long-term distribution agreement has begun which will broaden and strengthen the suite of general insurance products available to our customers. This transaction represents another step in the execution of the HSBC Group’s global strategy. Grupo Financiero HSBC first half 2013 financial results as reported to HSBC Holdings plc, our ultimate parent company, are prepared in accordance with International Financial Reporting Standards (IFRS)
Quarterly Report 2Q13
For the half year ended 30 June 2013, on an IFRS basis, Grupo Financiero HSBC reported a net income before tax of MXN1,740m, a decrease of MXN2,964m or 63.0% compared with MXN4,704m for the half ended 30 June 2012. The higher net income before tax reported under Mexican GAAP is largely due to higher loan impairment charges under IFRS mainly as a result of recognising through the income statement the home builders loan impairment charges that were recognised through retained earnings in Mexican GAAP, and a reduction of the present value of in-force long term insurance business, a concept which is only recognized under IFRS. A reconciliation and explanation between the Mexican GAAP and IFRS results is included with the financial statements of this document. About HSBC HSBC won the following prizes in the Latin American region at this year’s Euromoney awards for Excellence. HSBC obtained first place in:
Best Risk Adviser in Latin America Best Project Finance House in Latin America Best Debt House in Latin America
Grupo Financiero HSBC is one of the leading financial groups in Mexico with 1,021 branches, 6,350 ATMs and approximately 17,300 employees. For more information, visit www.hsbc.com.mx. Grupo Financiero HSBC is a 99.99% directly owned subsidiary of HSBC Latin America Holdings (UK) Limited, which is a wholly owned subsidiary of HSBC Holdings plc, and a member of the HSBC Group. With around 6,600 offices in over 80 countries and territories in Europe, Hong Kong, Rest of Asia-Pacific, North and Latin America, the Middle East and North Africa and with assets of US$2,681bn at 31 March 2013, the HSBC Group is one of the world’s largest banking and financial services organisation.
For further information contact: Mexico City
Lyssette Bravo Andrea Colín Public Affairs Investor Relations Telephone: +52 (55) 5721 2888 Telephone: +52 (55) 5721 3001 London Patrick Humphris Guy Lewis Group Media Relations Investor Relations Telephone: +44 (0)20 7992 1631 Telephone: +44 (0)20 7992 1938
Quarterly Report 2Q13
Contents Key Indicators 1 Income Statement Variance Analysis 3 Balance sheet Variance Analysis 5 Financial Statements Grupo Financiero HSBC 7
Consolidated Balance Sheet 7 Consolidated Income Statement 10 Consolidated Statement of Changes in Shareholder’s Equity 11 Consolidated Statement of Cash Flow 12
Financial Statements HSBC Mexico, S.A. 13 Consolidated Balance Sheet 13 Consolidated Income Statement 15 Consolidated Statement of Changes in Shareholder’s Equity 17 Consolidated Statement of Cash Flow 18
Repos 19 Derivative Financial Instruments 20 Collateral Sold or delivered as guarantee 20 Loan Portfolio 20 Loan Portfolio Grading 21 Non – Performing Loans 22 Federal Government support programs 22 Deferred Taxes 24 Funding, Loans and Investments in Securities 25 Long Term Debt 25 Capital 26 Capital Ratio 26 Trading income 27 Other Operating Income (Expenses) 28 Information on Customer Segment and Results 28 Related Party Transactions 29 Differences between Mexican GAAP and International Financial
Reporting Standards (IFRS) 30 Participation by Subsidiary 32 Ratings HSBC México, S.A. 32 Accounting Policies 33 Treasury Policies 34 Dividends Policy 35 Internal Control 35 Risk Management 36
Assets and Liabilities Committee (ALCO) 37 Risk Management Committee (RMC) 37 Market Risk Management 38 Liquidity Risk 42 Credit Risk 42 Retail Portfolio 45
Operational Risk 45 Technological Risk 47 Legal Risk 48 Corporate Sustainability (CSR) 50 8. Conclusions 55 Contacts 55 Annex A 56

Quarterly Report 2Q13
1
Key Indicators Grupo Financiero HSBC, S.A. de C.V. For the quarter ended at
30 Jun
2012 30 Sep
2012 31 Dec
2012
31 Mar
2013 30 Jun
2013 a) Liquidity 99.93 % 95.36 % 94.96 % 104.52 % 98.48 % Profitability b) ROE (Return over equity) 9.79 % 17.37 % 12.87 % 11.25 % 4.22 % c) ROA (Return over assets) 0.89 % 1.67 % 1.28 % 1.15 % 0.45 % Asset quality d) Impaired loans/total loans 2.16 % 1.97 % 2.02 % 2.18 % 4.29 % e) Coverage ratio 252.65 % 270.18 % 233.77 % 220.45 % 135.71 % Capitalization f) Credit risk 21.55 % 23.00 % 22.36 % 25.34 % 24.16 % g) Credit and market risk operational 13.62 % 14.40 % 14.51 % 16.83 % 16.15 % Operating efficiency h) Expenses/Total Assets 4.49 % 4.17 % 4.49 % 3.93 % 4.34 % i) NIM 5.01 % 5.08 % 5.20 % 5.00 % 5.09 % Infrastructure Branches 1,067 1,055 1,040 1,040 1,021 ATM 6,240 6,364 6,490 6,453 6,350 Head Count 18,110 17,735 17,518 17,326 17,287 a) Liquidity = Liquid Assets / Liquid Liabilities.
Liquid Assets = Cash and deposits in banks + Trading securities + Available for sale securities Liquid Liabilities = Demand deposits + Bank deposits and other on demand + Bank deposits and other short
term liabilities b) ROE = Annualized quarter net income / Average shareholders’ equity. c) ROA = Annualized quarter net income / Average total assets. d) Impaired loans balance at quarter end / Total loans balance at quarter. e) Coverage ratio = Balance of provisions for loan losses at quarter end / Balance of impaired loans f) Capitalization ratio by credit risk = Net capital / Credit risk weighted assets. g) Capitalization ratio by credit and market risk operational = Net capital / Credit and market risk weighted assets. h) Operating efficiency = Expenses / Total assets i) NIM = Annualized net interest income / Average performing assets.
Performing assets = Cash and deposits in banks + Investments in securities +Repurchase agreements+ Derivatives operations + Performing loans.
The averages utilized correspond to the average balance of the quarter in study and the balance of the previous quarter.

Quarterly Report 2Q13
2
Relevant Events There are no relevant events to disclose during the second quarter of 2013.
Quarterly Report 2Q13
3
Net Income30 June 2013
1,583
2,3262,060
2Q11 2Q12 2Q13
Revenue Distribution30 June 2013
Fees & Commissions, 20%
Other Income, 8%
Trading, 7%
NII, 65%
Income Statement Variance Analysis Net Income Net income for Grupo Financiero HSBC for the first half of 2013 was MXN2,060m, a decrease of 11.4% compared with the same period of 2012. The decrease was mainly due to higher loan impairment charges, increased tax expense, and lower trading and other operating income, partially offset by an increase in net interest income and net fee income, as well as reduced administrative and personnel expenses.
Total Operating Income The Group’s total operating income, net of loan impairment charges, for the first half of 2013 was MXN13,632m, a decrease of MXN323m (2.3%) compared with the first half of 2012. The decrease in total operating income, net of loan impairment charges, is mainly due to increased loan impairment charges, lower other operating income and a reduction in trading income. Net Interest Income Net interest income for the first half of 2013 increased to MXN11,373m, up MXN577m compared to the same period of 2012. The increase in net interest income was mainly due to higher average loan portfolio balances, mainly in payroll, personal, credit cards and higher business banking loans, partially offset by lower spreads in personal and payroll loans and lower interest income in non-interest bearing deposits due to a decrease in market rates. Non-interest Income Non-interest income for the first half of 2013 was MXN6,036m; a decrease of MXN458m or 7.1% compared with results from the same period of 2012.
Quarterly Report 2Q13
4
Trading Income30 June 2013
1,896
1,461 1,223
2Q11 2Q12 2Q13
Group Fees & Commissions30 June 2013
2,948 3,035
3,428
2Q11 2Q12 2Q13
Loan Impairment Charges30 June 2013
3,202 3,335
3,777
2Q11 2Q12 2Q13
Administrative Expenses30 June 2013
12,939 11,178 10,631
2Q11 2Q12 2Q13
The Group’s non-interest income to total revenue ratio decreased from 37.6% for the first half of 2012 to 34.7% for the first half of 2013, driven by lower other operating and trading income, partially offset by higher net fee income.
► Fee income
The Group’s net fee income for the first half of 2013 was MXN3,428m, an increase of MXN393m or 12.9% compared with the same period of 2012. This increase was mainly due to lower fee expenses related to a change in presentation of certain insurance expenses in the first half of 2013, and higher fee income related to increased card, investment funds and account services fees.
► Trading income
Trading income was MXN1,223m, a decrease of MXN238m or 16.3% compared with the first half of 2012, mainly due to a steepening of the yield curve, partially offset by derivative gains.
► Other operating income Other operating income was MXN1,385m, a decrease of MXN613m or 30.7% compared with the first half of 2012. This reduction is mainly due to an impairment provision on a defaulted derivative related to a specific customer that was recognised as an account receivable. Loan Impairment Charges The Group’s loan impairment charges for the first half of 2013 were MXN3,777m, an increase of MXN442m or 13.3% compared with the same period of 2012. In the first half of 2012 loan impairment charges were negatively impacted by a MXN659m one-off charge relating to a change in the write-off policy for mortgage loans. Excluding the 2012 one-off, there was an increase of MXN1,101m, mainly explained by higher loan impairment charges of MXN802m related to a finance project, a states and municipalities loan and the home builders’ portfolio, which was impacted by a change in policy regarding housing development; and the increase in the impaired consumer loan portfolio arising from loan growth. Administrative and Personnel Expenses The Group’s administrative and personnel expenses for the first half of 2013 were MXN10,631m, a MXN547m or 4.9% decrease compared with the same period of 2012. This decrease is the result of cost reduction initiatives such as the restructure of operational processes, reengineering of global functions and technological infrastructure, lower restructuring expenses and the non-recurrence of MXN379m CNBV fine in 2012.
Quarterly Report 2Q13
5
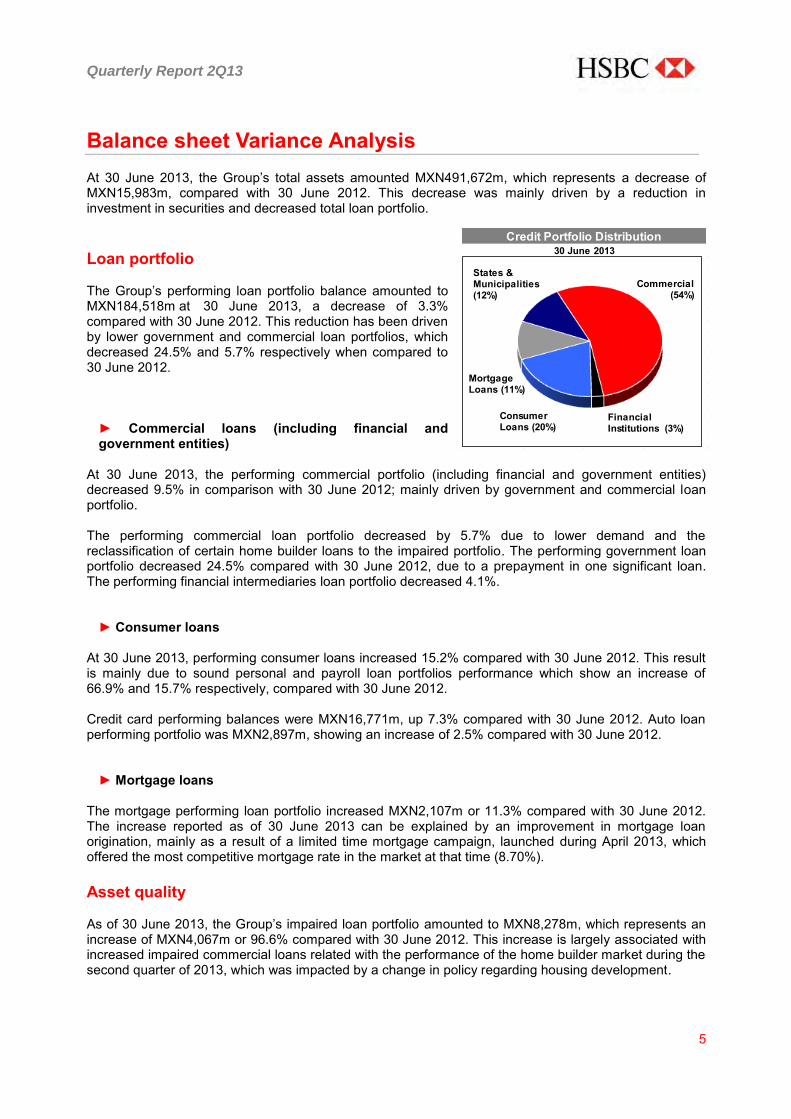
Credit Portfolio Distribution30 June 2013
Consumer Loans (20%)
Commercial (54%)
States & Municipalities (12%)
Mortgage Loans (11%)
Financial Institutions (3%)
Balance sheet Variance Analysis At 30 June 2013, the Group’s total assets amounted MXN491,672m, which represents a decrease of MXN15,983m, compared with 30 June 2012. This decrease was mainly driven by a reduction in investment in securities and decreased total loan portfolio. Loan portfolio The Group’s performing loan portfolio balance amounted to MXN184,518m at 30 June 2013, a decrease of 3.3% compared with 30 June 2012. This reduction has been driven by lower government and commercial loan portfolios, which decreased 24.5% and 5.7% respectively when compared to 30 June 2012.
► Commercial loans (including financial and government entities)
At 30 June 2013, the performing commercial portfolio (including financial and government entities) decreased 9.5% in comparison with 30 June 2012; mainly driven by government and commercial loan portfolio. The performing commercial loan portfolio decreased by 5.7% due to lower demand and the reclassification of certain home builder loans to the impaired portfolio. The performing government loan portfolio decreased 24.5% compared with 30 June 2012, due to a prepayment in one significant loan. The performing financial intermediaries loan portfolio decreased 4.1%.
► Consumer loans At 30 June 2013, performing consumer loans increased 15.2% compared with 30 June 2012. This result is mainly due to sound personal and payroll loan portfolios performance which show an increase of 66.9% and 15.7% respectively, compared with 30 June 2012. Credit card performing balances were MXN16,771m, up 7.3% compared with 30 June 2012. Auto loan performing portfolio was MXN2,897m, showing an increase of 2.5% compared with 30 June 2012.
► Mortgage loans The mortgage performing loan portfolio increased MXN2,107m or 11.3% compared with 30 June 2012. The increase reported as of 30 June 2013 can be explained by an improvement in mortgage loan origination, mainly as a result of a limited time mortgage campaign, launched during April 2013, which offered the most competitive mortgage rate in the market at that time (8.70%). Asset quality As of 30 June 2013, the Group’s impaired loan portfolio amounted to MXN8,278m, which represents an increase of MXN4,067m or 96.6% compared with 30 June 2012. This increase is largely associated with increased impaired commercial loans related with the performance of the home builder market during the second quarter of 2013, which was impacted by a change in policy regarding housing development.

Quarterly Report 2Q13
6
Group Deposit Mix30 June 2013
171,323 171,126 186,723 162,072 157,015
119,977 111,162 104,358 98,666 95,055
2Q12 3Q12 4Q12 1Q13 2Q13
Demand Time
Capital Ratio30 June 2013
10.8 10.5 13.4
3.2 3.1 2.8 14.0 13.6
16.2
2Q11 2Q12 2Q13
Tier 1 Tier 2 ICap
Total impaired loans as a percentage of gross loans and advances to customers increased to 4.3% compared with 2.2% reported at 30 June 2012. The coverage ratio (allowance for loan losses divided by impaired loans) at 30 June 2013 was 135.7%, compared to 252.6% reported at 30 June 2012. Deposits The Group’s total deposits at 30 June 2013 amounted to MXN253,085m, a decrease of 14.4% compared to the reported at 30 June 2012, as a result of reduced time and demand deposits.
► Demand deposits
At 30 June 2013, demand deposits were MXN157,015m, down 8.4% compared with 30 June 2012, mainly related to a reduction of high interest bearing accounts in Commercial and Global Banking due to re-pricing strategies in order to offset the decrease in market interest rates. ► Time deposits
Total time deposits decreased 20.8% compared to 30 June 2012, primarily as a result of customers switching to mutual fund products. Shareholder’s equity At 30 June 2013, the Group’s equity amounted to MXN54,074m, representing an increase of 15.2% compared to 30 June 2012. The banks equity was MXN46,490m, at 30 June 2013, up 15.4% compared to 30 June 2012. Capital Adequacy Ratio The Bank’s capital adequacy ratio at 30 June 2013 was 16.2%, placing it well above the authorities’ requirements. The Tier 1 capital ratio at the end of the reporting period is 13.4%. Financial Situation, Liquidity and Capital Resources HSBC’s balance structure has maintained its liquidity. Cash and investments in securities represent 39.6% of total assets, 1.70 percentage points below than the one reported in the first half of 2012. Total assets were MXN491,672m, down by MXN15,983m in comparison with 30 June 2012. The loan portfolio is adequately diversified across segments.
Quarterly Report 2Q13
7
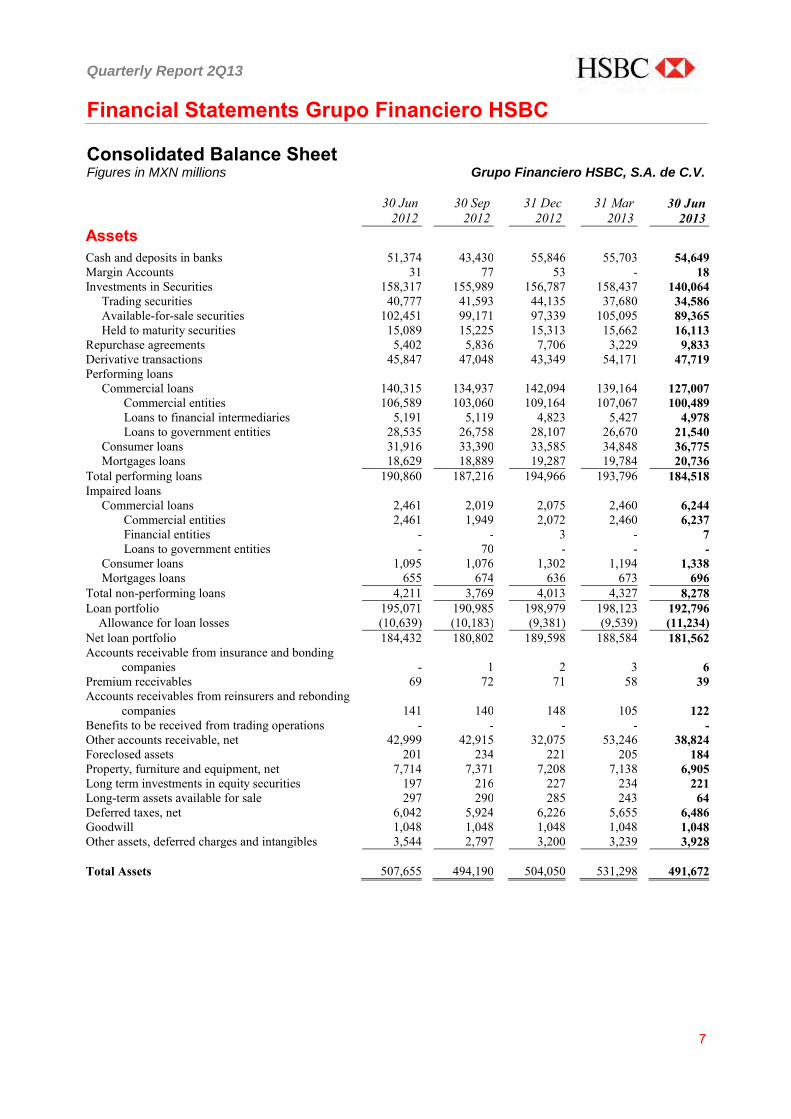
Financial Statements Grupo Financiero HSBC Consolidated Balance Sheet Figures in MXN millions Grupo Financiero HSBC, S.A. de C.V.
30 Jun
2012 30 Sep
2012 31 Dec
2012 31 Mar
2013 30 Jun
2013 Assets
Cash and deposits in banks 51,374 43,430 55,846 55,703 54,649 Margin Accounts 31 77 53 - 18 Investments in Securities 158,317 155,989 156,787 158,437 140,064 Trading securities 40,777 41,593 44,135 37,680 34,586 Available-for-sale securities 102,451 99,171 97,339 105,095 89,365 Held to maturity securities 15,089 15,225 15,313 15,662 16,113 Repurchase agreements 5,402 5,836 7,706 3,229 9,833 Derivative transactions 45,847 47,048 43,349 54,171 47,719 Performing loans Commercial loans 140,315 134,937 142,094 139,164 127,007 Commercial entities 106,589 103,060 109,164 107,067 100,489 Loans to financial intermediaries 5,191 5,119 4,823 5,427 4,978 Loans to government entities 28,535 26,758 28,107 26,670 21,540 Consumer loans 31,916 33,390 33,585 34,848 36,775 Mortgages loans 18,629 18,889 19,287 19,784 20,736 Total performing loans 190,860 187,216 194,966 193,796 184,518 Impaired loans Commercial loans 2,461 2,019 2,075 2,460 6,244 Commercial entities 2,461 1,949 2,072 2,460 6,237 Financial entities - - 3 - 7 Loans to government entities - 70 - - - Consumer loans 1,095 1,076 1,302 1,194 1,338 Mortgages loans 655 674 636 673 696 Total non-performing loans 4,211 3,769 4,013 4,327 8,278 Loan portfolio 195,071 190,985 198,979 198,123 192,796 Allowance for loan losses (10,639) (10,183) (9,381) (9,539) (11,234) Net loan portfolio 184,432 180,802 189,598 188,584 181,562 Accounts receivable from insurance and bonding
companies - 1 2 3 6 Premium receivables 69 72 71 58 39 Accounts receivables from reinsurers and rebonding
companies 141 140 148 105 122
Benefits to be received from trading operations - - - - - Other accounts receivable, net 42,999 42,915 32,075 53,246 38,824 Foreclosed assets 201 234 221 205 184 Property, furniture and equipment, net 7,714 7,371 7,208 7,138 6,905 Long term investments in equity securities 197 216 227 234 221 Long-term assets available for sale 297 290 285 243 64 Deferred taxes, net 6,042 5,924 6,226 5,655 6,486 Goodwill 1,048 1,048 1,048 1,048 1,048 Other assets, deferred charges and intangibles 3,544 2,797 3,200 3,239 3,928 Total Assets 507,655 494,190 504,050 531,298 491,672
Quarterly Report 2Q13
8
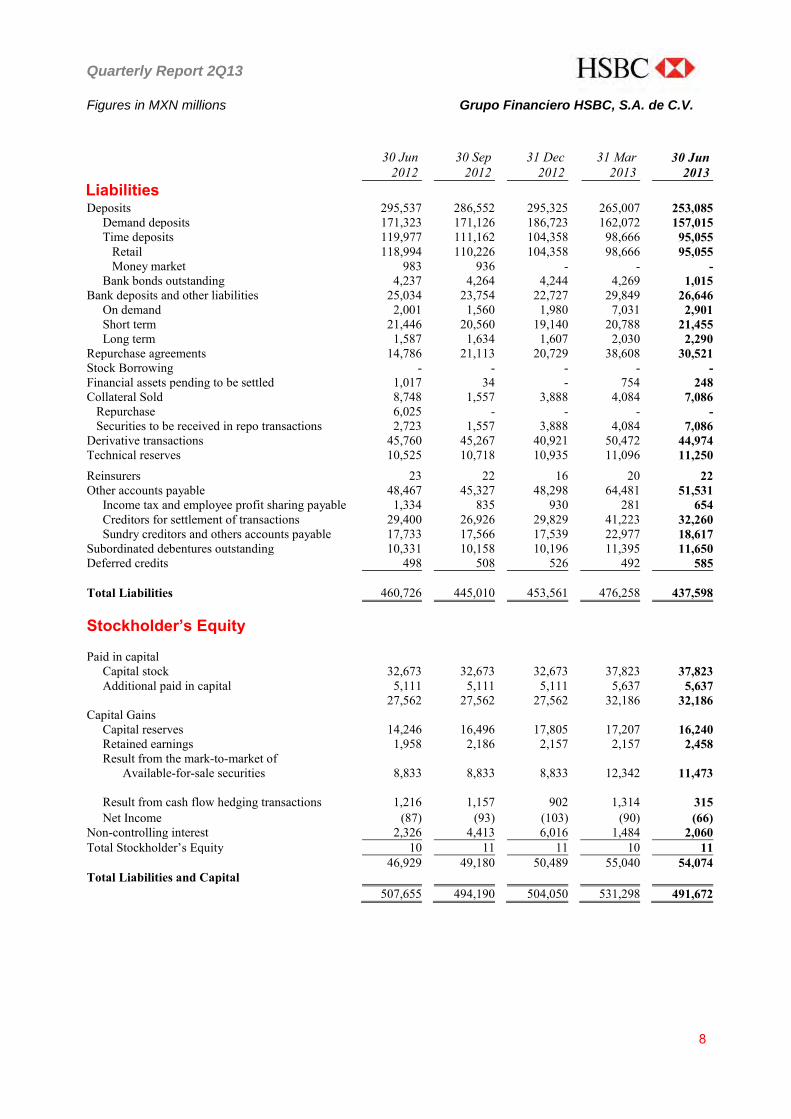
Figures in MXN millions Grupo Financiero HSBC, S.A. de C.V.
30 Jun 2012
30 Sep 2012
31 Dec 2012
31 Mar 2013
30 Jun 2013
Liabilities
Deposits 295,537 286,552 295,325 265,007 253,085 Demand deposits 171,323 171,126 186,723 162,072 157,015 Time deposits 119,977 111,162 104,358 98,666 95,055 Retail 118,994 110,226 104,358 98,666 95,055 Money market 983 936 - - - Bank bonds outstanding 4,237 4,264 4,244 4,269 1,015 Bank deposits and other liabilities 25,034 23,754 22,727 29,849 26,646 On demand 2,001 1,560 1,980 7,031 2,901 Short term 21,446 20,560 19,140 20,788 21,455 Long term 1,587 1,634 1,607 2,030 2,290 Repurchase agreements 14,786 21,113 20,729 38,608 30,521 Stock Borrowing - - - - - Financial assets pending to be settled 1,017 34 - 754 248 Collateral Sold 8,748 1,557 3,888 4,084 7,086 Repurchase 6,025 - - - - Securities to be received in repo transactions 2,723 1,557 3,888 4,084 7,086 Derivative transactions 45,760 45,267 40,921 50,472 44,974 Technical reserves 10,525 10,718 10,935 11,096 11,250 Reinsurers 23 22 16 20 22 Other accounts payable 48,467 45,327 48,298 64,481 51,531 Income tax and employee profit sharing payable 1,334 835 930 281 654 Creditors for settlement of transactions 29,400 26,926 29,829 41,223 32,260 Sundry creditors and others accounts payable 17,733 17,566 17,539 22,977 18,617 Subordinated debentures outstanding 10,331 10,158 10,196 11,395 11,650 Deferred credits 498 508 526 492 585 Total Liabilities 460,726 445,010 453,561 476,258 437,598 Stockholder’s Equity Paid in capital Capital stock 32,673 32,673 32,673 37,823 37,823 Additional paid in capital 5,111 5,111 5,111 5,637 5,637 27,562 27,562 27,562 32,186 32,186 Capital Gains Capital reserves 14,246 16,496 17,805 17,207 16,240 Retained earnings 1,958 2,186 2,157 2,157 2,458 Result from the mark-to-market of
Available-for-sale securities 8,833 8,833 8,833 12,342 11,473
Result from cash flow hedging transactions 1,216 1,157 902 1,314 315
Net Income (87) (93) (103) (90) (66) Non-controlling interest 2,326 4,413 6,016 1,484 2,060 Total Stockholder’s Equity 10 11 11 10 11 46,929 49,180 50,489 55,040 54,074 Total Liabilities and Capital 507,655 494,190 504,050 531,298 491,672
Quarterly Report 2Q13
9
Figures in MXN millions Grupo Financiero HSBC, S.A. de C.V.
30 Jun
2012 30 Sep
2012 31 Dec
2012 31 Mar
2013 30 Jun
2013
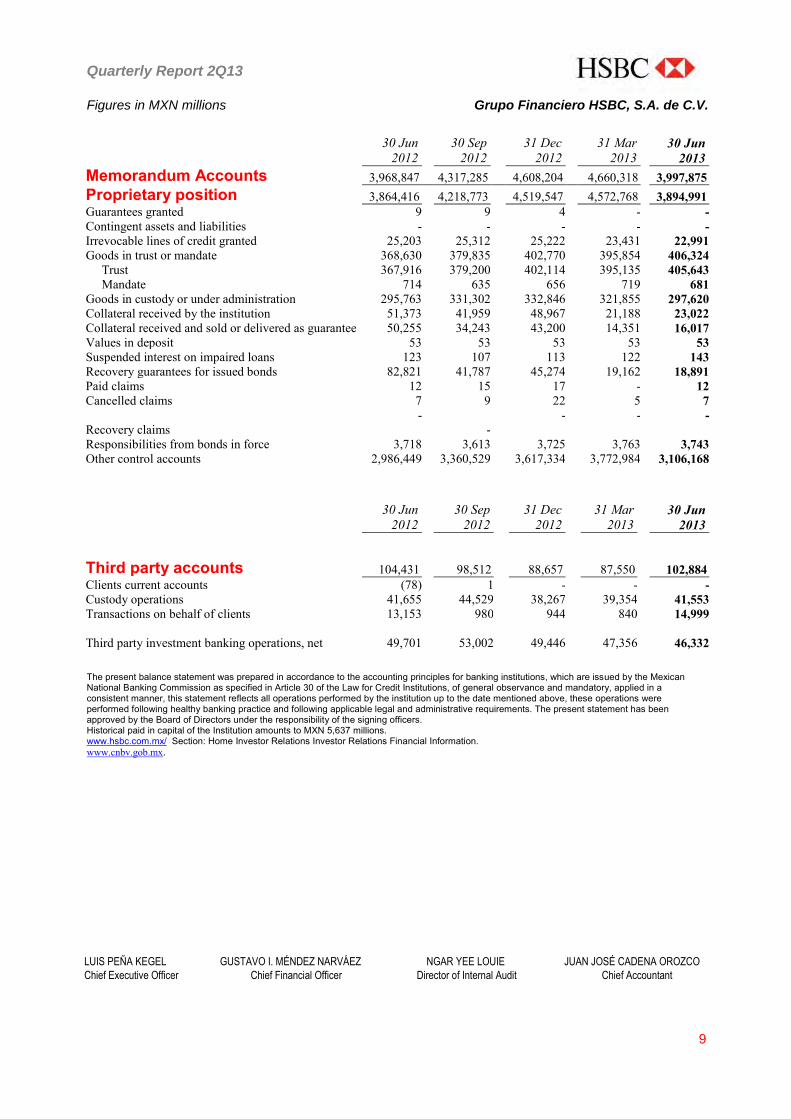
Memorandum Accounts 3,968,847 4,317,285 4,608,204 4,660,318 3,997,875 Proprietary position 3,864,416 4,218,773 4,519,547 4,572,768 3,894,991 Guarantees granted 9 9 4 - - Contingent assets and liabilities - - - - - Irrevocable lines of credit granted 25,203 25,312 25,222 23,431 22,991 Goods in trust or mandate 368,630 379,835 402,770 395,854 406,324 Trust 367,916 379,200 402,114 395,135 405,643 Mandate 714 635 656 719 681 Goods in custody or under administration 295,763 331,302 332,846 321,855 297,620 Collateral received by the institution 51,373 41,959 48,967 21,188 23,022 Collateral received and sold or delivered as guarantee 50,255 34,243 43,200 14,351 16,017 Values in deposit 53 53 53 53 53 Suspended interest on impaired loans 123 107 113 122 143 Recovery guarantees for issued bonds 82,821 41,787 45,274 19,162 18,891 Paid claims 12 15 17 - 12 Cancelled claims 7 9 22 5 7
Recovery claims -
- - - -
Responsibilities from bonds in force 3,718 3,613 3,725 3,763 3,743 Other control accounts 2,986,449 3,360,529 3,617,334 3,772,984 3,106,168
30 Jun
2012 30 Sep
2012 31 Dec
2012 31 Mar
2013 30 Jun
2013
Third party accounts
104,431
98,512
88,657
87,550
102,884 Clients current accounts (78) 1 - - - Custody operations 41,655 44,529 38,267 39,354 41,553 Transactions on behalf of clients 13,153 980 944 840 14,999
Third party investment banking operations, net
49,701
53,002
49,446
47,356
46,332
The present balance statement was prepared in accordance to the accounting principles for banking institutions, which are issued by the Mexican National Banking Commission as specified in Article 30 of the Law for Credit Institutions, of general observance and mandatory, applied in a consistent manner, this statement reflects all operations performed by the institution up to the date mentioned above, these operations were performed following healthy banking practice and following applicable legal and administrative requirements. The present statement has been approved by the Board of Directors under the responsibility of the signing officers. Historical paid in capital of the Institution amounts to MXN 5,637 millions. www.hsbc.com.mx/ Section: Home Investor Relations Investor Relations Financial Information. www.cnbv.gob.mx.
LUIS PEÑA KEGEL GUSTAVO I. MÉNDEZ NARVÁEZ NGAR YEE LOUIE JUAN JOSÉ CADENA OROZCO
Chief Executive Officer Chief Financial Officer Director of Internal Audit Chief Accountant
Quarterly Report 2Q13
10
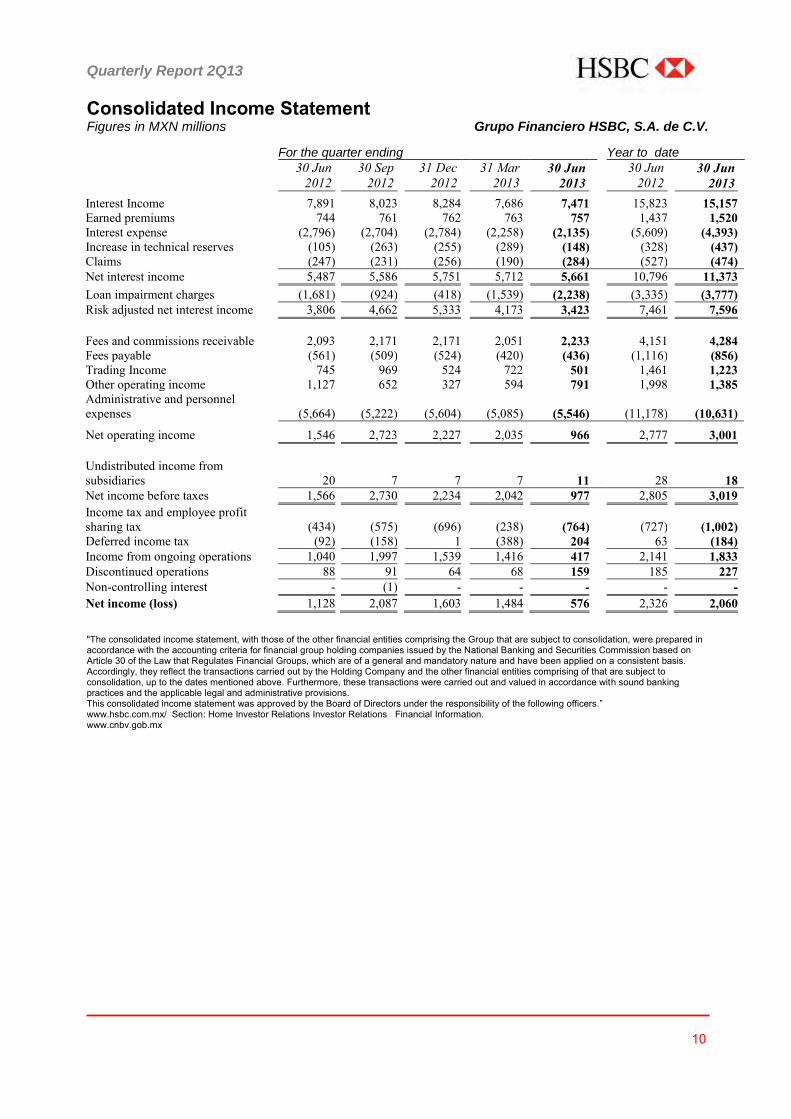
Consolidated Income Statement Figures in MXN millions Grupo Financiero HSBC, S.A. de C.V. For the quarter ending Year to date
30 Jun
2012 30 Sep
2012 31 Dec
2012 31 Mar
2013 30 Jun
2013 30 Jun 2012
30 Jun 2013
Interest Income 7,891 8,023 8,284 7,686 7,471 15,823 15,157 Earned premiums 744 761 762 763 757 1,437 1,520 Interest expense (2,796) (2,704) (2,784) (2,258) (2,135) (5,609) (4,393) Increase in technical reserves (105) (263) (255) (289) (148) (328) (437) Claims (247) (231) (256) (190) (284) (527) (474) Net interest income 5,487 5,586 5,751 5,712 5,661 10,796 11,373 Loan impairment charges (1,681) (924) (418) (1,539) (2,238) (3,335) (3,777) Risk adjusted net interest income 3,806 4,662 5,333 4,173 3,423 7,461 7,596 Fees and commissions receivable 2,093 2,171 2,171 2,051 2,233 4,151 4,284 Fees payable (561) (509) (524) (420) (436) (1,116) (856) Trading Income 745 969 524 722 501 1,461 1,223 Other operating income 1,127 652 327 594 791 1,998 1,385 Administrative and personnel expenses
(5,664)
(5,222)
(5,604)
(5,085)
(5,546)
(11,178)
(10,631)
Net operating income 1,546 2,723 2,227 2,035 966 2,777 3,001
Undistributed income from subsidiaries 20 7 7 7 11 28 18
Net income before taxes 1,566 2,730 2,234 2,042 977 2,805 3,019 Income tax and employee profit sharing tax (434) (575) (696) (238) (764) (727) (1,002)
Deferred income tax (92) (158) 1 (388) 204 63 (184) Income from ongoing operations 1,040 1,997 1,539 1,416 417 2,141 1,833 Discontinued operations 88 91 64 68 159 185 227 Non-controlling interest - (1) - - - - - Net income (loss) 1,128 2,087 1,603 1,484 576 2,326 2,060
"The consolidated income statement, with those of the other financial entities comprising the Group that are subject to consolidation, were prepared in accordance with the accounting criteria for financial group holding companies issued by the National Banking and Securities Commission based on Article 30 of the Law that Regulates Financial Groups, which are of a general and mandatory nature and have been applied on a consistent basis. Accordingly, they reflect the transactions carried out by the Holding Company and the other financial entities comprising of that are subject to consolidation, up to the dates mentioned above. Furthermore, these transactions were carried out and valued in accordance with sound banking practices and the applicable legal and administrative provisions. This consolidated income statement was approved by the Board of Directors under the responsibility of the following officers.” www.hsbc.com.mx/ Section: Home Investor Relations Investor Relations Financial Information. www.cnbv.gob.mx
Quarterly Report 2Q13
11
LUIS PEÑA KEGEL GUSTAVO I. MÉNDEZ NARVÁEZ NGAR YEE LOUIE JUAN JOSÉ CADENA OROZCO
Chief Executive Officer Chief Financial Officer Director of Internal Audit Chief Accountant
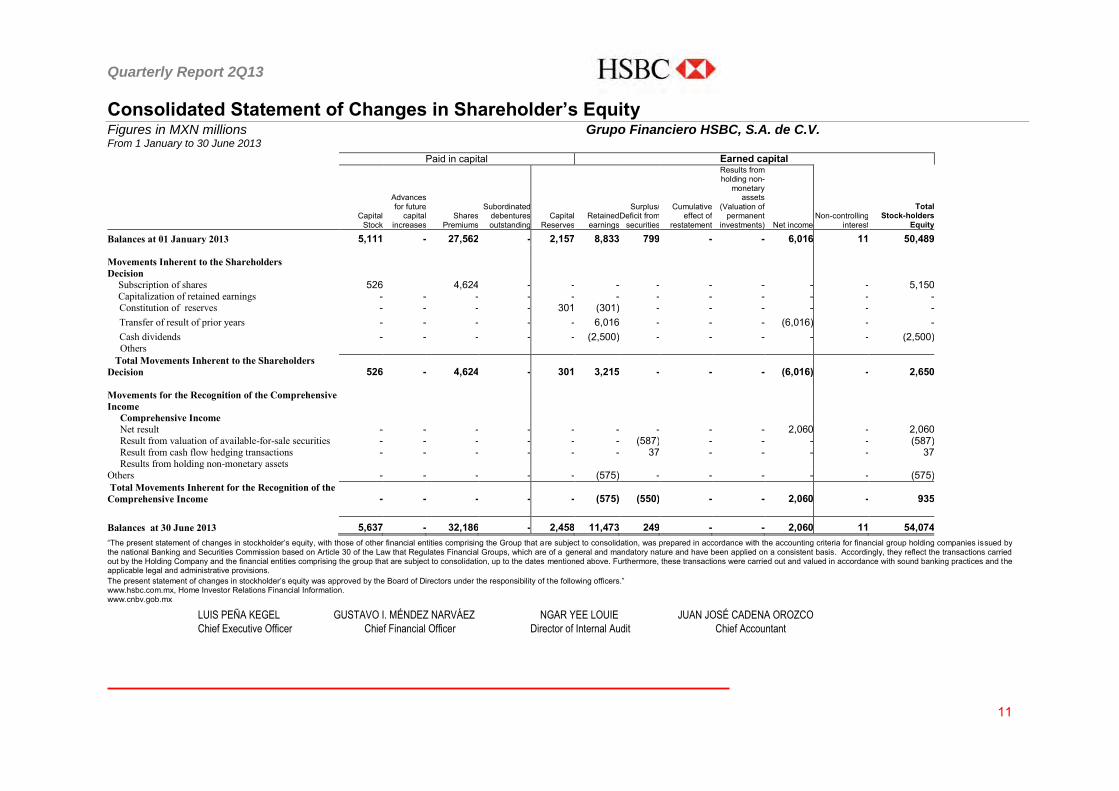
Consolidated Statement of Changes in Shareholder’s Equity Figures in MXN millions Grupo Financiero HSBC, S.A. de C.V. From 1 January to 30 June 2013
Paid in capital Earned capital
Capital
Stock
Advances for future
capital increases
Shares Premiums
Subordinated debentures outstanding
Capital Reserves
Retained earnings
Surplus/ Deficit from
securities
Cumulative effect of
restatement
Results from holding non-
monetary assets
(Valuation of permanent
investments) Net income Non-controlling
interest
Total Stock-holders
Equity
Balances at 01 January 2013 5,111 - 27,562 - 2,157 8,833 799 - - 6,016 11 50,489 Movements Inherent to the Shareholders Decision
Subscription of shares 526 4,624 - - - - - - - - 5,150 Capitalization of retained earnings - - - - - - - - - - - - Constitution of reserves - - - - 301 (301) - - - - - - Transfer of result of prior years - - - - - 6,016 - - - (6,016) - - Cash dividends - - - - - (2,500) - - - - - (2,500)
Others Total Movements Inherent to the Shareholders Decision 526 - 4,624 - 301 3,215 - - - (6,016) - 2,650 Movements for the Recognition of the Comprehensive Income Comprehensive Income Net result - - - - - - - - - 2,060 - 2,060 Result from valuation of available-for-sale securities - - - - - - (587) - - - - (587) Result from cash flow hedging transactions - - - - - - 37 - - - - 37 Results from holding non-monetary assets Others - - - - - (575) - - - - - (575) Total Movements Inherent for the Recognition of the Comprehensive Income - - - - - (575) (550) - - 2,060 - 935 Balances at 30 June 2013 5,637 - 32,186 - 2,458 11,473 249 - - 2,060 11 54,074
“The present statement of changes in stockholder’s equity, with those of other financial entities comprising the Group that are subject to consolidation, was prepared in accordance with the accounting criteria for financial group holding companies issued by the national Banking and Securities Commission based on Article 30 of the Law that Regulates Financial Groups, which are of a general and mandatory nature and have been applied on a consistent basis. Accordingly, they reflect the transactions carried out by the Holding Company and the financial entities comprising the group that are subject to consolidation, up to the dates mentioned above. Furthermore, these transactions were carried out and valued in accordance with sound banking practices and the applicable legal and administrative provisions. The present statement of changes in stockholder’s equity was approved by the Board of Directors under the responsibility of the following officers.” www.hsbc.com.mx, Home Investor Relations Financial Information. www.cnbv.gob.mx
Quarterly Report 2Q13
12
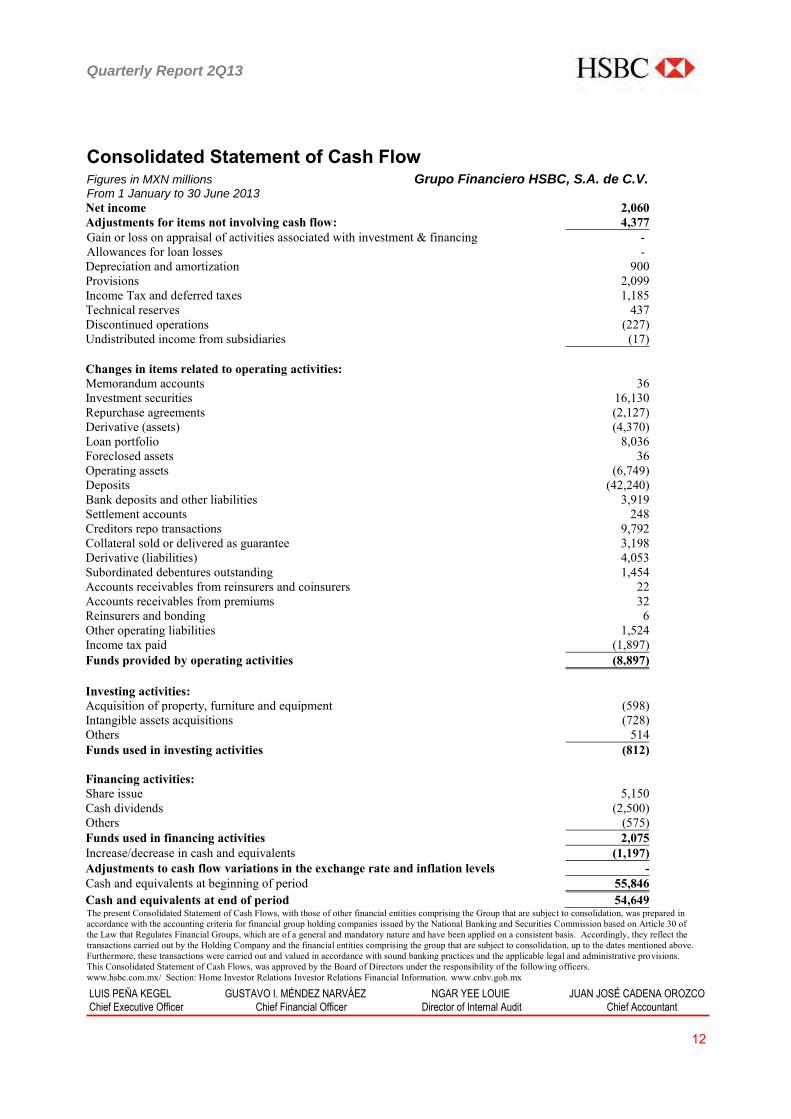
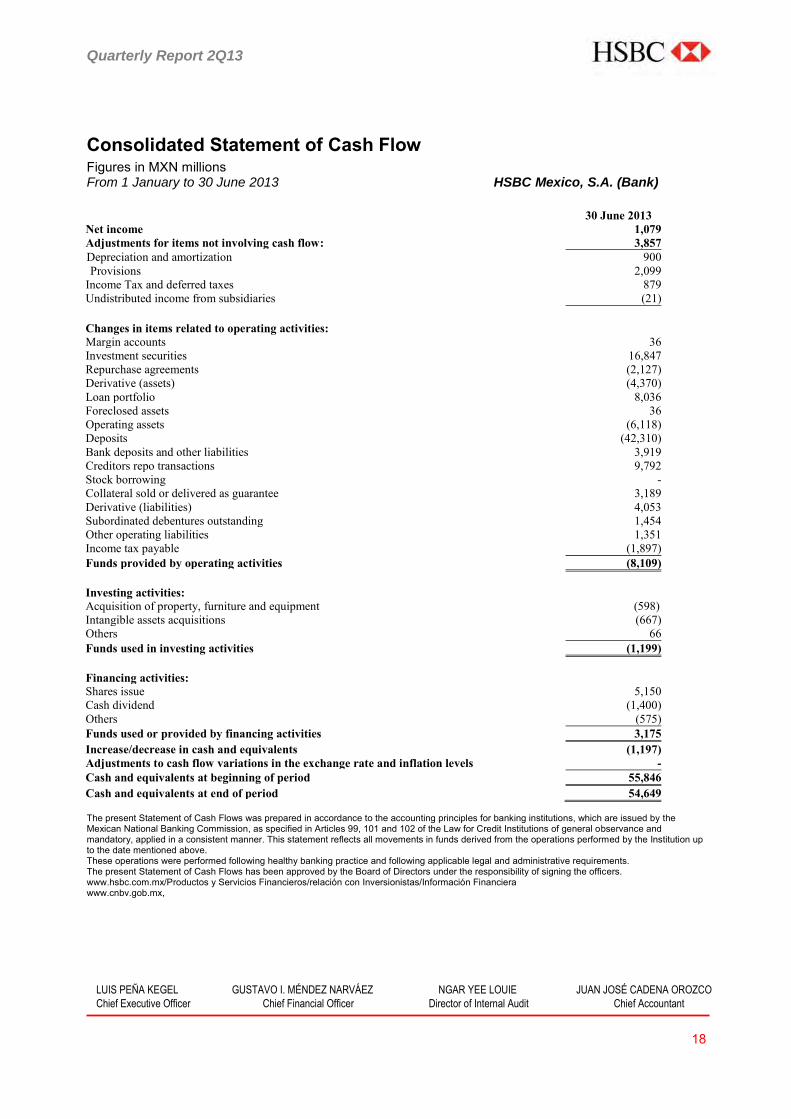
Consolidated Statement of Cash Flow Figures in MXN millions Grupo Financiero HSBC, S.A. de C.V. From 1 January to 30 June 2013
Net income 2,060 Adjustments for items not involving cash flow: 4,377 Gain or loss on appraisal of activities associated with investment & financing - Allowances for loan losses - Depreciation and amortization 900 Provisions 2,099 Income Tax and deferred taxes 1,185 Technical reserves 437 Discontinued operations (227) Undistributed income from subsidiaries (17) Changes in items related to operating activities: Memorandum accounts 36 Investment securities 16,130 Repurchase agreements (2,127) Derivative (assets) (4,370) Loan portfolio 8,036 Foreclosed assets 36 Operating assets (6,749) Deposits (42,240) Bank deposits and other liabilities 3,919 Settlement accounts 248 Creditors repo transactions 9,792 Collateral sold or delivered as guarantee 3,198 Derivative (liabilities) 4,053 Subordinated debentures outstanding 1,454 Accounts receivables from reinsurers and coinsurers 22 Accounts receivables from premiums 32 Reinsurers and bonding 6 Other operating liabilities 1,524 Income tax paid (1,897) Funds provided by operating activities (8,897) Investing activities: Acquisition of property, furniture and equipment (598) Intangible assets acquisitions (728) Others 514 Funds used in investing activities (812)
Financing activities: Share issue 5,150 Cash dividends (2,500) Others (575) Funds used in financing activities 2,075 Increase/decrease in cash and equivalents (1,197) Adjustments to cash flow variations in the exchange rate and inflation levels - Cash and equivalents at beginning of period 55,846 Cash and equivalents at end of period 54,649 The present Consolidated Statement of Cash Flows, with those of other financial entities comprising the Group that are subject to consolidation, was prepared in accordance with the accounting criteria for financial group holding companies issued by the National Banking and Securities Commission based on Article 30 of the Law that Regulates Financial Groups, which are of a general and mandatory nature and have been applied on a consistent basis. Accordingly, they reflect the transactions carried out by the Holding Company and the financial entities comprising the group that are subject to consolidation, up to the dates mentioned above. Furthermore, these transactions were carried out and valued in accordance with sound banking practices and the applicable legal and administrative provisions. This Consolidated Statement of Cash Flows, was approved by the Board of Directors under the responsibility of the following officers. www.hsbc.com.mx/ Section: Home Investor Relations Investor Relations Financial Information. www.cnbv.gob.mx LUIS PEÑA KEGEL GUSTAVO I. MÉNDEZ NARVÁEZ NGAR YEE LOUIE JUAN JOSÉ CADENA OROZCO
Chief Executive Officer Chief Financial Officer Director of Internal Audit Chief Accountant
Quarterly Report 2Q13
13
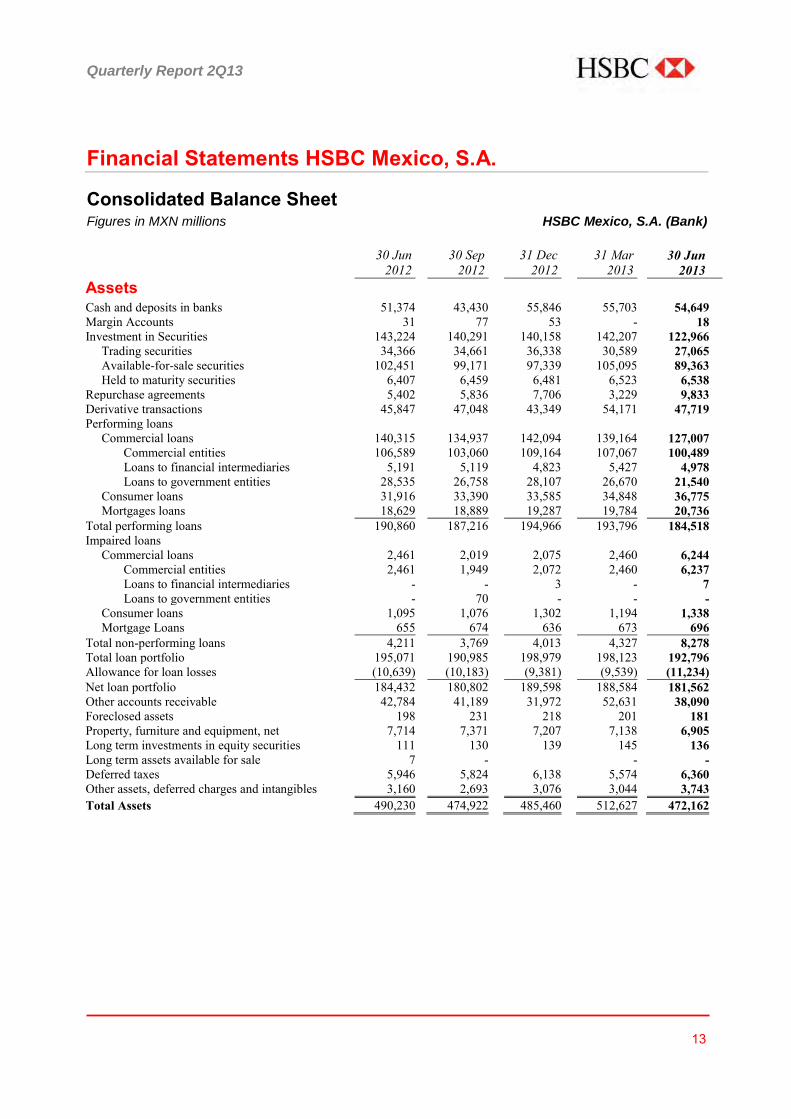
Financial Statements HSBC Mexico, S.A.
Consolidated Balance Sheet Figures in MXN millions HSBC Mexico, S.A. (Bank)
30 Jun
2012 30 Sep
2012 31 Dec
2012 31 Mar
2013 30 Jun
2013
Assets
Cash and deposits in banks 51,374 43,430 55,846 55,703 54,649 Margin Accounts 31 77 53 - 18 Investment in Securities 143,224 140,291 140,158 142,207 122,966 Trading securities 34,366 34,661 36,338 30,589 27,065 Available-for-sale securities 102,451 99,171 97,339 105,095 89,363 Held to maturity securities 6,407 6,459 6,481 6,523 6,538 Repurchase agreements 5,402 5,836 7,706 3,229 9,833 Derivative transactions 45,847 47,048 43,349 54,171 47,719 Performing loans Commercial loans 140,315 134,937 142,094 139,164 127,007 Commercial entities 106,589 103,060 109,164 107,067 100,489 Loans to financial intermediaries 5,191 5,119 4,823 5,427 4,978 Loans to government entities 28,535 26,758 28,107 26,670 21,540 Consumer loans 31,916 33,390 33,585 34,848 36,775 Mortgages loans 18,629 18,889 19,287 19,784 20,736 Total performing loans 190,860 187,216 194,966 193,796 184,518 Impaired loans Commercial loans 2,461 2,019 2,075 2,460 6,244 Commercial entities 2,461 1,949 2,072 2,460 6,237 Loans to financial intermediaries - - 3 - 7 Loans to government entities - 70 - - - Consumer loans 1,095 1,076 1,302 1,194 1,338 Mortgage Loans 655 674 636 673 696 Total non-performing loans 4,211 3,769 4,013 4,327 8,278 Total loan portfolio 195,071 190,985 198,979 198,123 192,796 Allowance for loan losses (10,639) (10,183) (9,381) (9,539) (11,234) Net loan portfolio 184,432 180,802 189,598 188,584 181,562 Other accounts receivable 42,784 41,189 31,972 52,631 38,090 Foreclosed assets 198 231 218 201 181 Property, furniture and equipment, net 7,714 7,371 7,207 7,138 6,905 Long term investments in equity securities 111 130 139 145 136 Long term assets available for sale 7 - - - Deferred taxes 5,946 5,824 6,138 5,574 6,360 Other assets, deferred charges and intangibles 3,160 2,693 3,076 3,044 3,743 Total Assets 490,230 474,922 485,460 512,627 472,162
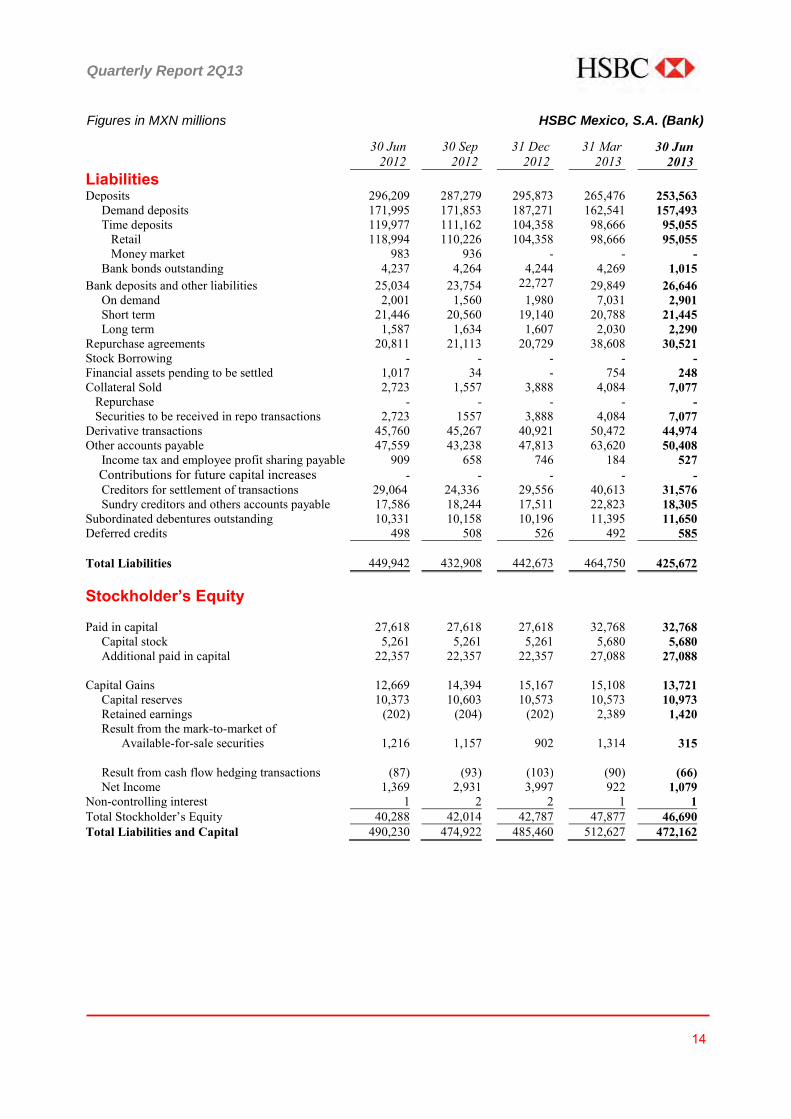
Quarterly Report 2Q13
14
Figures in MXN millions HSBC Mexico, S.A. (Bank)
30 Jun
2012 30 Sep
2012 31 Dec
2012 31 Mar
2013 30 Jun
2013 Liabilities Deposits 296,209 287,279 295,873 265,476 253,563 Demand deposits 171,995 171,853 187,271 162,541 157,493 Time deposits 119,977 111,162 104,358 98,666 95,055 Retail 118,994 110,226 104,358 98,666 95,055 Money market 983 936 - - - Bank bonds outstanding 4,237 4,264 4,244 4,269 1,015 Bank deposits and other liabilities 25,034 23,754 22,727 29,849 26,646 On demand 2,001 1,560 1,980 7,031 2,901 Short term 21,446 20,560 19,140 20,788 21,445 Long term 1,587 1,634 1,607 2,030 2,290 Repurchase agreements 20,811 21,113 20,729 38,608 30,521 Stock Borrowing - - - - - Financial assets pending to be settled 1,017 34 - 754 248 Collateral Sold 2,723 1,557 3,888 4,084 7,077 Repurchase - - - - - Securities to be received in repo transactions 2,723 1557 3,888 4,084 7,077 Derivative transactions 45,760 45,267 40,921 50,472 44,974 Other accounts payable 47,559 43,238 47,813 63,620 50,408 Income tax and employee profit sharing payable 909 658 746 184 527 Contributions for future capital increases - - - - - Creditors for settlement of transactions 29,064 24,336 29,556 40,613 31,576 Sundry creditors and others accounts payable 17,586 18,244 17,511 22,823 18,305 Subordinated debentures outstanding 10,331 10,158 10,196 11,395 11,650 Deferred credits 498 508 526 492 585 Total Liabilities 449,942 432,908 442,673 464,750 425,672 Stockholder’s Equity Paid in capital 27,618 27,618 27,618 32,768 32,768 Capital stock 5,261 5,261 5,261 5,680 5,680 Additional paid in capital 22,357 22,357 22,357 27,088 27,088 Capital Gains 12,669 14,394 15,167 15,108 13,721 Capital reserves 10,373 10,603 10,573 10,573 10,973 Retained earnings (202) (204) (202) 2,389 1,420 Result from the mark-to-market of
Available-for-sale securities 1,216 1,157
902
1,314
315
Result from cash flow hedging transactions (87)
(93)
(103) (90)
(66)
Net Income 1,369 2,931 3,997 922 1,079 Non-controlling interest 1 2 2 1 1 Total Stockholder’s Equity 40,288 42,014 42,787 47,877 46,690 Total Liabilities and Capital 490,230 474,922 485,460 512,627 472,162
Quarterly Report 2Q13
15
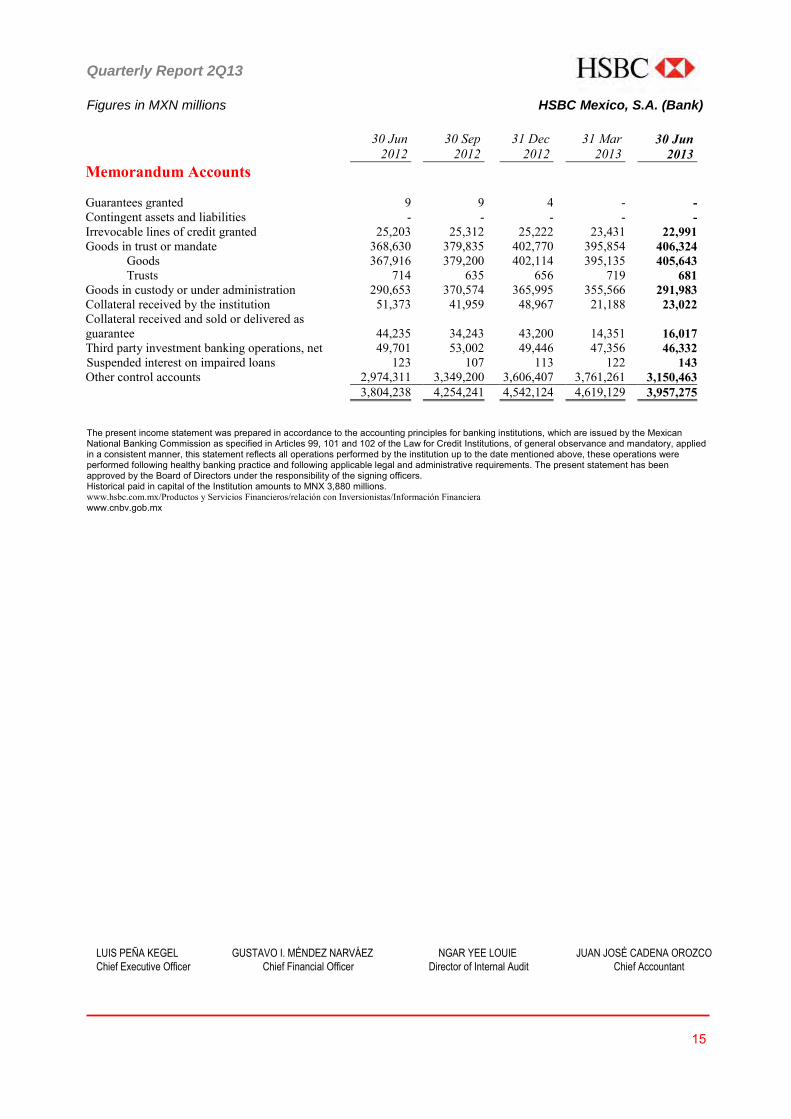
Figures in MXN millions HSBC Mexico, S.A. (Bank)
30 Jun
2012 30 Sep
2012 31 Dec
2012 31 Mar
2013 30 Jun
2013 Memorandum Accounts Guarantees granted 9 9 4 - - Contingent assets and liabilities - - - - - Irrevocable lines of credit granted 25,203 25,312 25,222 23,431 22,991 Goods in trust or mandate 368,630 379,835 402,770 395,854 406,324 Goods 367,916 379,200 402,114 395,135 405,643 Trusts 714 635 656 719 681 Goods in custody or under administration 290,653 370,574 365,995 355,566 291,983 Collateral received by the institution 51,373 41,959 48,967 21,188 23,022 Collateral received and sold or delivered as guarantee 44,235 34,243 43,200
14,351
16,017
Third party investment banking operations, net 49,701 53,002 49,446 47,356 46,332 Suspended interest on impaired loans 123 107 113 122 143 Other control accounts 2,974,311 3,349,200 3,606,407 3,761,261 3,150,463 3,804,238 4,254,241 4,542,124 4,619,129 3,957,275 The present income statement was prepared in accordance to the accounting principles for banking institutions, which are issued by the Mexican National Banking Commission as specified in Articles 99, 101 and 102 of the Law for Credit Institutions, of general observance and mandatory, applied in a consistent manner, this statement reflects all operations performed by the institution up to the date mentioned above, these operations were performed following healthy banking practice and following applicable legal and administrative requirements. The present statement has been approved by the Board of Directors under the responsibility of the signing officers. Historical paid in capital of the Institution amounts to MNX 3,880 millions. www.hsbc.com.mx/Productos y Servicios Financieros/relación con Inversionistas/Información Financiera www.cnbv.gob.mx
LUIS PEÑA KEGEL GUSTAVO I. MÉNDEZ NARVÁEZ NGAR YEE LOUIE JUAN JOSÉ CADENA OROZCO
Chief Executive Officer Chief Financial Officer Director of Internal Audit Chief Accountant
Quarterly Report 2Q13
16
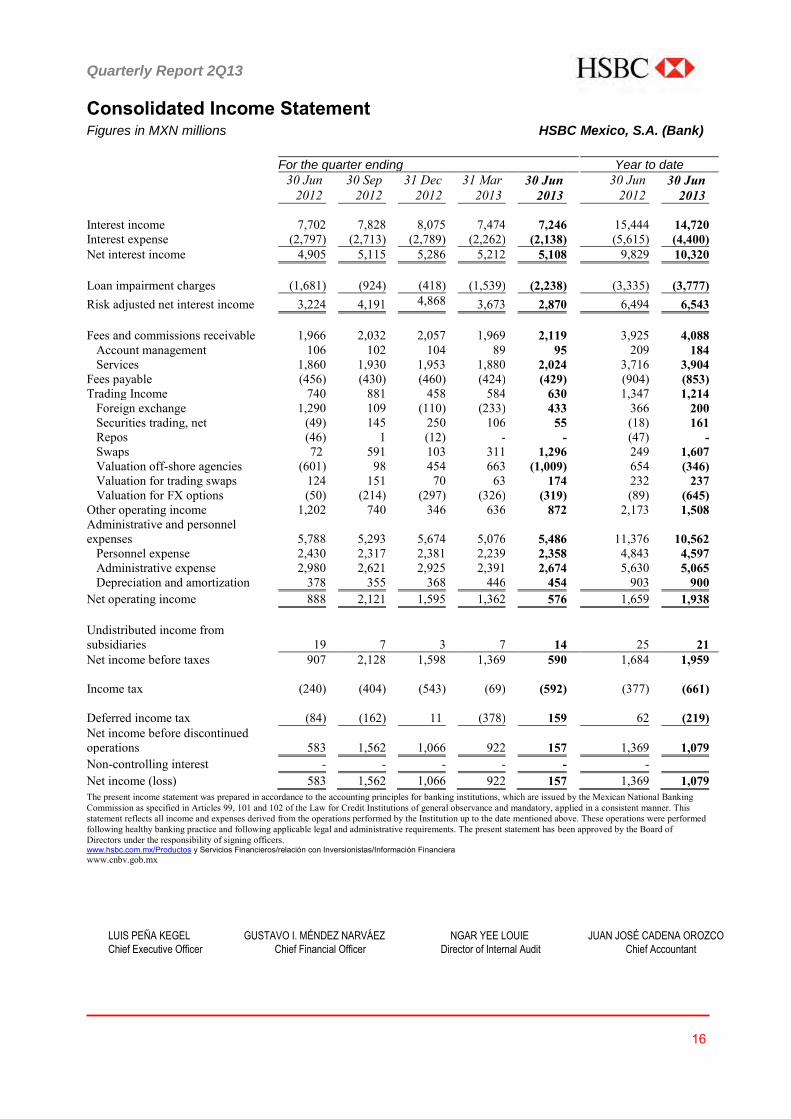
Consolidated Income Statement Figures in MXN millions HSBC Mexico, S.A. (Bank)
For the quarter ending Year to date
30 Jun
2012 30 Sep
2012 31 Dec
2012 31 Mar
2013 30 Jun
2013 30 Jun
2012 30 Jun
2013
Interest income 7,702 7,828 8,075 7,474 7,246 15,444 14,720 Interest expense (2,797) (2,713) (2,789) (2,262) (2,138) (5,615) (4,400) Net interest income 4,905 5,115 5,286 5,212 5,108 9,829 10,320
Loan impairment charges (1,681) (924) (418) (1,539) (2,238) (3,335) (3,777) Risk adjusted net interest income 3,224 4,191 4,868 3,673 2,870 6,494 6,543
Fees and commissions receivable 1,966 2,032 2,057 1,969 2,119 3,925 4,088 Account management 106 102 104 89 95 209 184 Services 1,860 1,930 1,953 1,880 2,024 3,716 3,904 Fees payable (456) (430) (460) (424) (429) (904) (853) Trading Income 740 881 458 584 630 1,347 1,214 Foreign exchange 1,290 109 (110) (233) 433 366 200 Securities trading, net (49) 145 250 106 55 (18) 161 Repos (46) 1 (12) - - (47) - Swaps 72 591 103 311 1,296 249 1,607 Valuation off-shore agencies (601) 98 454 663 (1,009) 654 (346) Valuation for trading swaps 124 151 70 63 174 232 237 Valuation for FX options (50) (214) (297) (326) (319) (89) (645) Other operating income 1,202 740 346 636 872 2,173 1,508 Administrative and personnel expenses 5,788 5,293
5,674 5,076 5,486 11,376 10,562
Personnel expense 2,430 2,317 2,381 2,239 2,358 4,843 4,597 Administrative expense 2,980 2,621 2,925 2,391 2,674 5,630 5,065 Depreciation and amortization 378 355 368 446 454 903 900 Net operating income 888 2,121 1,595 1,362 576 1,659 1,938
Undistributed income from subsidiaries 19 7
3 7 14 25 21
Net income before taxes 907 2,128 1,598 1,369 590 1,684 1,959 Income tax (240) (404) (543) (69) (592) (377) (661)
Deferred income tax (84) (162) 11 (378) 159 62 (219)
Net income before discontinued operations 583 1,562
1,066 922 157 1,369 1,079
Non-controlling interest - - - - - - Net income (loss) 583 1,562 1,066 922 157 1,369 1,079
The present income statement was prepared in accordance to the accounting principles for banking institutions, which are issued by the Mexican National Banking Commission as specified in Articles 99, 101 and 102 of the Law for Credit Institutions of general observance and mandatory, applied in a consistent manner. This statement reflects all income and expenses derived from the operations performed by the Institution up to the date mentioned above. These operations were performed following healthy banking practice and following applicable legal and administrative requirements. The present statement has been approved by the Board of Directors under the responsibility of signing officers. www.hsbc.com.mx/Productos y Servicios Financieros/relación con Inversionistas/Información Financiera www.cnbv.gob.mx
LUIS PEÑA KEGEL GUSTAVO I. MÉNDEZ NARVÁEZ NGAR YEE LOUIE JUAN JOSÉ CADENA OROZCO
Chief Executive Officer Chief Financial Officer Director of Internal Audit Chief Accountant
Quarterly Report 2Q13
17
LUIS PEÑA KEGEL GUSTAVO I. MÉNDEZ NARVÁEZ NGAR YEE LOUIE JUAN JOSÉ CADENA OROZCO
Chief Executive Officer Chief Financial Officer Director of Internal Audit Chief Accountant
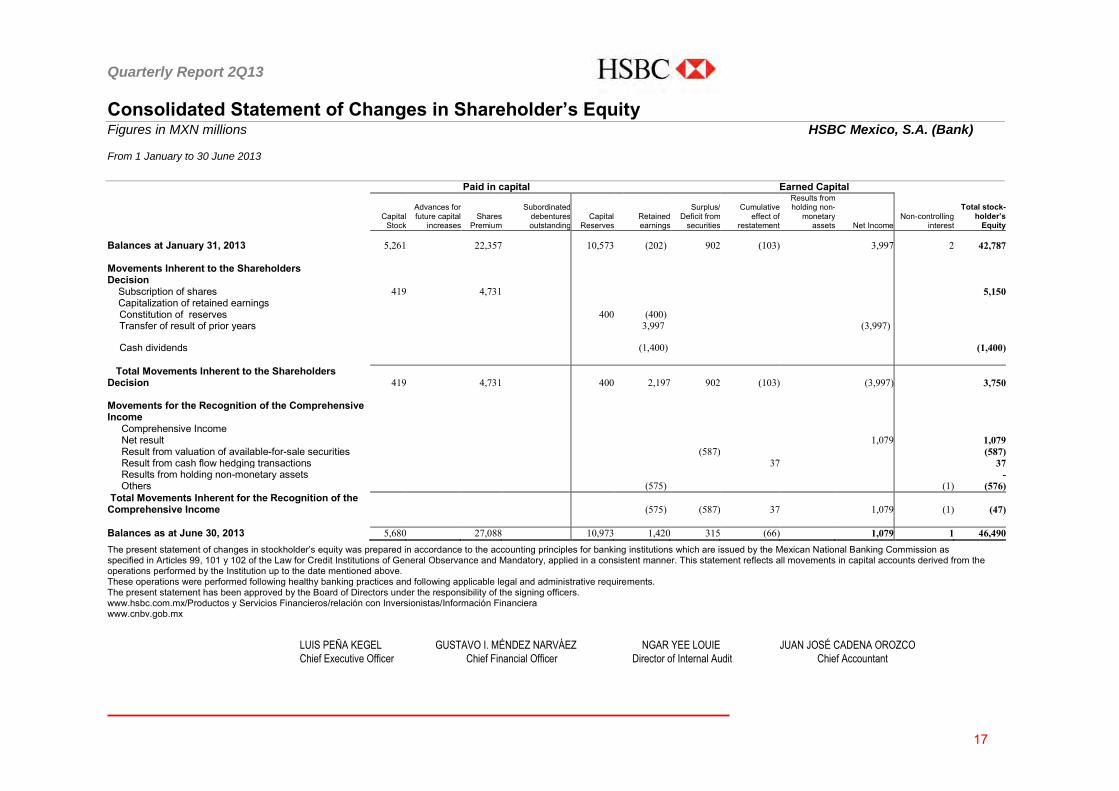
Consolidated Statement of Changes in Shareholder’s Equity Figures in MXN millions HSBC Mexico, S.A. (Bank) From 1 January to 30 June 2013
Paid in capital Earned Capital
Capital
Stock
Advances for future capital
increases Shares
Premium
Subordinated debentures outstanding
Capital Reserves
Retained earnings
Surplus/ Deficit from
securities
Cumulative effect of
restatement
Results from holding non-
monetary assets Net Income
Non-controlling interest
Total stock- holder’s
Equity
Balances at January 31, 2013 5,261 22,357 10,573 (202) 902 (103) - 3,997 2 42,787 Movements Inherent to the Shareholders Decision
Subscription of shares 419 4,731 5,150 Capitalization of retained earnings Constitution of reserves 400 (400) Transfer of result of prior years 3,997 (3,997)
Cash dividends (1,400) (1,400)
Total Movements Inherent to the Shareholders Decision 419 4,731 400 2,197 902 (103) (3,997) 3,750 Movements for the Recognition of the Comprehensive Income Comprehensive Income Net result 1,079 1,079 Result from valuation of available-for-sale securities (587) (587) Result from cash flow hedging transactions 37 37 Results from holding non-monetary assets - Others (575) (1) (576) Total Movements Inherent for the Recognition of the Comprehensive Income (575) (587) 37 1,079 (1) (47) Balances as at June 30, 2013 5,680 27,088 10,973 1,420 315 (66) 1,079 1 46,490
The present statement of changes in stockholder’s equity was prepared in accordance to the accounting principles for banking institutions which are issued by the Mexican National Banking Commission as specified in Articles 99, 101 y 102 of the Law for Credit Institutions of General Observance and Mandatory, applied in a consistent manner. This statement reflects all movements in capital accounts derived from the operations performed by the Institution up to the date mentioned above. These operations were performed following healthy banking practices and following applicable legal and administrative requirements. The present statement has been approved by the Board of Directors under the responsibility of the signing officers. www.hsbc.com.mx/Productos y Servicios Financieros/relación con Inversionistas/Información Financiera www.cnbv.gob.mx
Quarterly Report 2Q13
18
Consolidated Statement of Cash Flow Figures in MXN millions From 1 January to 30 June 2013 HSBC Mexico, S.A. (Bank)
30 June 2013 Net income 1,079 Adjustments for items not involving cash flow: 3,857 Depreciation and amortization 900 Provisions 2,099
Income Tax and deferred taxes 879 Undistributed income from subsidiaries (21) Changes in items related to operating activities: Margin accounts 36 Investment securities 16,847 Repurchase agreements (2,127) Derivative (assets) (4,370) Loan portfolio 8,036 Foreclosed assets 36 Operating assets (6,118) Deposits (42,310) Bank deposits and other liabilities 3,919 Creditors repo transactions 9,792 Stock borrowing - Collateral sold or delivered as guarantee 3,189 Derivative (liabilities) 4,053 Subordinated debentures outstanding 1,454 Other operating liabilities 1,351 Income tax payable (1,897) Funds provided by operating activities (8,109) Investing activities: Acquisition of property, furniture and equipment (598) Intangible assets acquisitions (667) Others 66 Funds used in investing activities (1,199)
Financing activities: Shares issue 5,150 Cash dividend (1,400) Others (575) Funds used or provided by financing activities 3,175 Increase/decrease in cash and equivalents (1,197) Adjustments to cash flow variations in the exchange rate and inflation levels - Cash and equivalents at beginning of period 55,846 Cash and equivalents at end of period 54,649 The present Statement of Cash Flows was prepared in accordance to the accounting principles for banking institutions, which are issued by the Mexican National Banking Commission, as specified in Articles 99, 101 and 102 of the Law for Credit Institutions of general observance and mandatory, applied in a consistent manner. This statement reflects all movements in funds derived from the operations performed by the Institution up to the date mentioned above. These operations were performed following healthy banking practice and following applicable legal and administrative requirements. The present Statement of Cash Flows has been approved by the Board of Directors under the responsibility of signing the officers. www.hsbc.com.mx/Productos y Servicios Financieros/relación con Inversionistas/Información Financiera www.cnbv.gob.mx,
LUIS PEÑA KEGEL GUSTAVO I. MÉNDEZ NARVÁEZ NGAR YEE LOUIE JUAN JOSÉ CADENA OROZCO
Chief Executive Officer Chief Financial Officer Director of Internal Audit Chief Accountant
Quarterly Report 2Q13
19
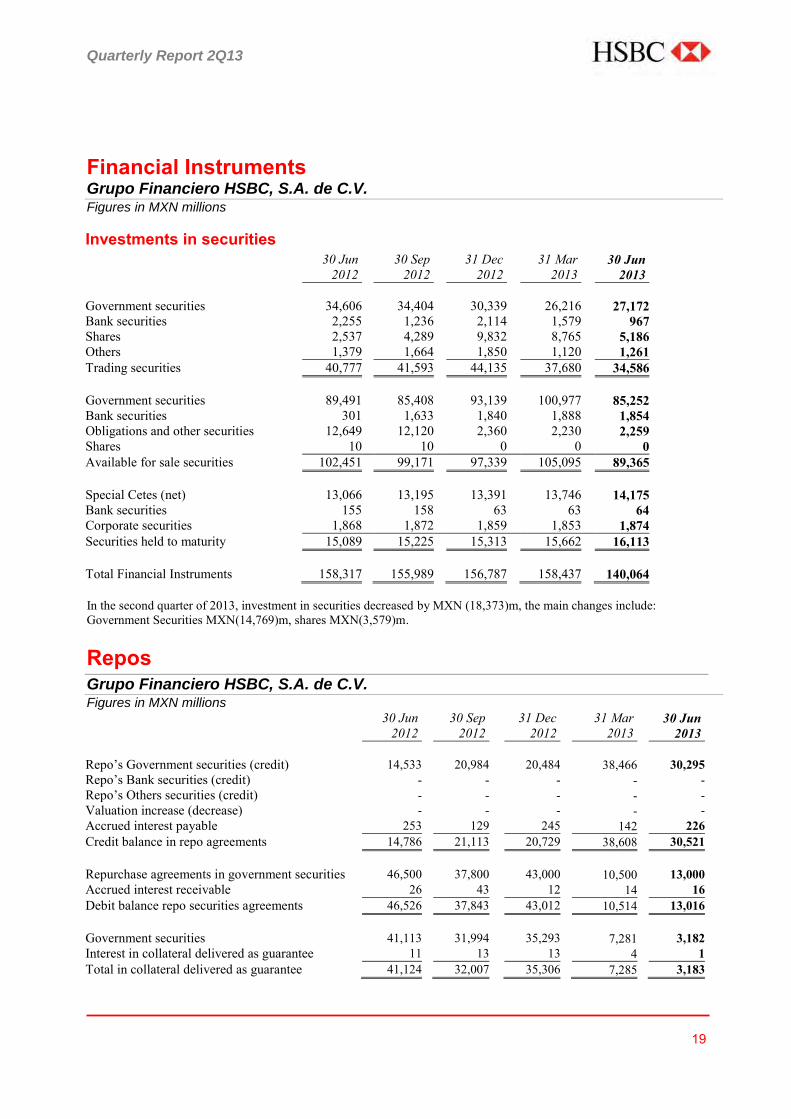
Financial Instruments Grupo Financiero HSBC, S.A. de C.V. Figures in MXN millions
Investments in securities
30 Jun
2012 30 Sep
2012 31 Dec
2012 31 Mar
2013 30 Jun
2013
Government securities 34,606 34,404 30,339 26,216 27,172 Bank securities 2,255 1,236 2,114 1,579 967 Shares 2,537 4,289 9,832 8,765 5,186 Others 1,379 1,664 1,850 1,120 1,261 Trading securities 40,777 41,593 44,135 37,680 34,586 Government securities 89,491 85,408 93,139 100,977 85,252 Bank securities 301 1,633 1,840 1,888 1,854 Obligations and other securities 12,649 12,120 2,360 2,230 2,259 Shares 10 10 0 0 0 Available for sale securities 102,451 99,171 97,339 105,095 89,365 Special Cetes (net) 13,066 13,195 13,391 13,746 14,175 Bank securities 155 158 63 63 64 Corporate securities 1,868 1,872 1,859 1,853 1,874 Securities held to maturity 15,089 15,225 15,313 15,662 16,113 Total Financial Instruments 158,317 155,989 156,787 158,437 140,064 In the second quarter of 2013, investment in securities decreased by MXN (18,373)m, the main changes include: Government Securities MXN(14,769)m, shares MXN(3,579)m. Repos Grupo Financiero HSBC, S.A. de C.V. Figures in MXN millions
30 Jun
2012 30 Sep
2012 31 Dec
2012 31 Mar
2013 30 Jun
2013
Repo’s Government securities (credit) 14,533 20,984 20,484 38,466 30,295 Repo’s Bank securities (credit) - - - - - Repo’s Others securities (credit) - - - - - Valuation increase (decrease) - - - - - Accrued interest payable 253 129 245 142 226 Credit balance in repo agreements 14,786 21,113 20,729 38,608 30,521 Repurchase agreements in government securities 46,500 37,800 43,000 10,500 13,000 Accrued interest receivable 26 43 12 14 16 Debit balance repo securities agreements 46,526 37,843 43,012 10,514 13,016 Government securities 41,113 31,994 35,293 7,281 3,182 Interest in collateral delivered as guarantee 11 13 13 4 1 Total in collateral delivered as guarantee 41,124 32,007 35,306 7,285 3,183
Quarterly Report 2Q13
20
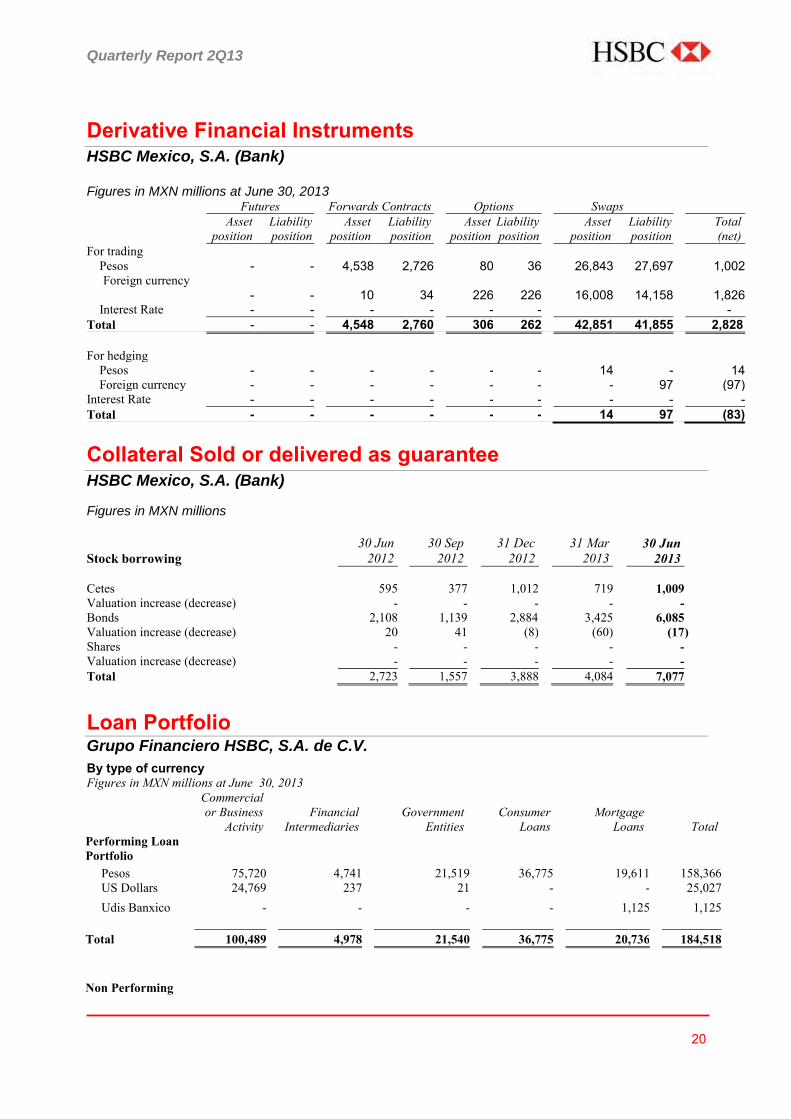
Derivative Financial Instruments HSBC Mexico, S.A. (Bank) Figures in MXN millions at June 30, 2013 Futures Forwards Contracts Options Swaps
Asset
position Liability position
Asset position
Liability position
Asset position
Liability position
Asset position
Liability position
Total (net)
For trading Pesos - - 4,538 2,726 80 36 26,843 27,697 1,002
Foreign currency - - 10 34
226
226
16,008 14,158 1,826
Interest Rate - - - - - - - Total - - 4,548 2,760 306 262 42,851 41,855 2,828 For hedging Pesos - - - - - - 14 - 14 Foreign currency - - - - - - - 97 (97) Interest Rate - - - - - - - - - Total - - - - - - 14 97 (83) Collateral Sold or delivered as guarantee HSBC Mexico, S.A. (Bank)
Figures in MXN millions
Stock borrowing
30 Jun 2012
30 Sep 2012
31 Dec 2012
31 Mar 2013
30 Jun 2013
Cetes 595 377 1,012 719 1,009 Valuation increase (decrease) - - - - - Bonds 2,108 1,139 2,884 3,425 6,085 Valuation increase (decrease) 20 41 (8) (60) (17 ) Shares - - - - - Valuation increase (decrease) - - - - - Total 2,723 1,557 3,888 4,084 7,077
Loan Portfolio Grupo Financiero HSBC, S.A. de C.V.
By type of currency Figures in MXN millions at June 30, 2013
Commercial or Business
Activity
Financial
Intermediaries
Government
Entities
Consumer
Loans
Mortgage
Loans
Total Performing Loan Portfolio
Pesos 75,720 4,741 21,519 36,775 19,611 158,366 US Dollars 24,769 237 21 - - 25,027 Udis Banxico - - - - 1,125 1,125 Total 100,489 4,978 21,540 36,775 20,736 184,518 Non Performing

Quarterly Report 2Q13
21
Loans Portfolio Pesos 5,509 7 - 1,338 626 7,480 US Dollars 727 - - - 1 728 Udis Banxico 1 - - - 69 70 Total 6,237 7 - 1,338 696 8,278
Loan Portfolio Grading HSBC Mexico, S.A. (Bank)
Figures in constant MXN millions at June 30, 2013
Allowance for Loan Losses by type of loan Total loan
portfolio Commercial
loans Consumer
loans
Mortgages loans
Total reserves Excepted from rating 4,387 Rated 211,399 Risk A 156,160 4,296 24 52 4,372 Risk A-1 148,746 4,166 24 52 4,242 Risk A-2 7,414 130 0 0 130 Risk B 47,925 801 2,283 139 3,223 Risk B-1 31,975 276 1,491 139 1,906 Risk B-2 12,027 60 792 0 852 Risk B-3 3,923 465 0 0 465 Risk C 4,006 133 868 158 1,159 Risk C-1 3,856 115 868 158 1,141 Risk C-2 150 18 0 0 18 Risk D 3,257 1,170 1,166 12 2,348 Risk E 51 60 49 23 132 Total 215,786 6,460 4,390 384 11,234 Less: Constituted loan loss provisions 11,234 Surplus 0 The figures related to the rating and constitution of loan loss allowances correspond to those as at June 30, 2013.
The loan portfolio is graded according to the rules for lending portfolios issued by the Secretaría de Hacienda y Crédito Público (SHCP – Mexican Government’s Secretary of Public Lending) and to the methodology established by the CNBV (Mexican Banking and Securities National Commission). On June 24, 2013, some changes were issued which relates to the loan loss provisions methodology applicable to credit institutions in Mexico (the Dispositions) and which are applicable to the methodology for grading commercial loans granted to the following clients: financial institutions, individuals with business activities and others different than: projects with own source of payment, trustees acting under trusts not included in the projects with own source of payment and credit schemes commonly known as " structured ". Although mandatory as of December 31, 2013, in accordance with Article Second of the Transitional Dispositions, HSBC chose to early adopt the methodology on June 2013. The rest of the commercial portfolio, except for States and Municipalities and Investment Projects, is rated according to the methodology issued by the CNBV which distinguishes client grading and based on this grading determines the one applicable for the operation. For States and Municipalities and Investment Projects, HSBC apply the methodology in force issued on October 5, 2011. For the consumer and mortgage portfolio, grading is based on the "General Regulations Applicable to Credit Institutions" issued by the CNBV, specifically using the standard methodology. As at June 2013, the increase in loan loss reserves charged to Income Statement was MXN 3,777 million. In the other hand, MXN 2,607 million was related to write offs and MXN 129 million was related to debt forgiveness.
Quarterly Report 2Q13
22
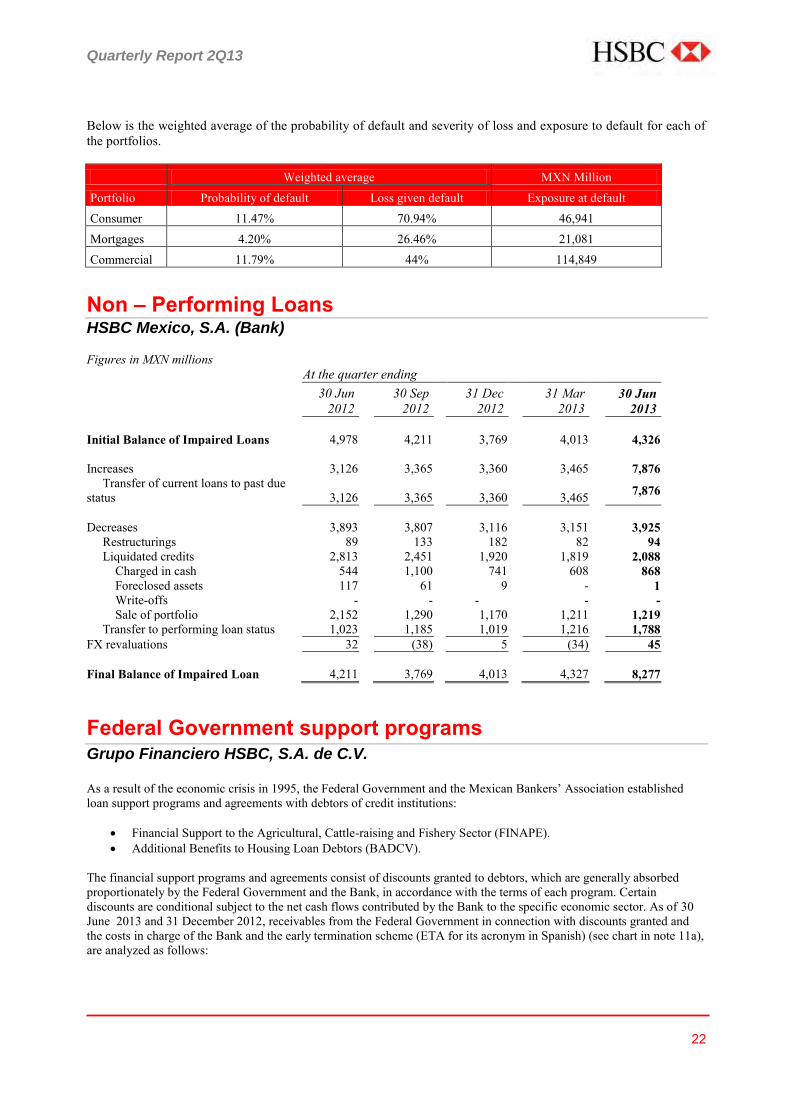
Below is the weighted average of the probability of default and severity of loss and exposure to default for each of the portfolios. Weighted average MXN Million
Portfolio Probability of default Loss given default Exposure at default Consumer 11.47% 70.94% 46,941 Mortgages 4.20% 26.46% 21,081 Commercial 11.79% 44% 114,849
Non – Performing Loans HSBC Mexico, S.A. (Bank) Figures in MXN millions At the quarter ending
30 Jun 2012
30 Sep 2012
31 Dec 2012
31 Mar 2013
30 Jun 2013
Initial Balance of Impaired Loans 4,978 4,211 3,769 4,013 4,326 Increases 3,126 3,365 3,360 3,465 7,876 Transfer of current loans to past due status 3,126 3,365 3,360 3,465 7,876
Decreases 3,893 3,807 3,116 3,151 3,925 Restructurings 89 133 182 82 94 Liquidated credits 2,813 2,451 1,920 1,819 2,088 Charged in cash 544 1,100 741 608 868 Foreclosed assets 117 61 9 - 1 Write-offs - - - - - Sale of portfolio 2,152 1,290 1,170 1,211 1,219 Transfer to performing loan status 1,023 1,185 1,019 1,216 1,788 FX revaluations 32 (38) 5 (34) 45 Final Balance of Impaired Loan 4,211 3,769 4,013 4,327 8,277
Federal Government support programs Grupo Financiero HSBC, S.A. de C.V. As a result of the economic crisis in 1995, the Federal Government and the Mexican Bankers’ Association established loan support programs and agreements with debtors of credit institutions:
Financial Support to the Agricultural, Cattle-raising and Fishery Sector (FINAPE). Additional Benefits to Housing Loan Debtors (BADCV).
The financial support programs and agreements consist of discounts granted to debtors, which are generally absorbed proportionately by the Federal Government and the Bank, in accordance with the terms of each program. Certain discounts are conditional subject to the net cash flows contributed by the Bank to the specific economic sector. As of 30 June 2013 and 31 December 2012, receivables from the Federal Government in connection with discounts granted and the costs in charge of the Bank and the early termination scheme (ETA for its acronym in Spanish) (see chart in note 11a), are analyzed as follows:
Quarterly Report 2Q13
23
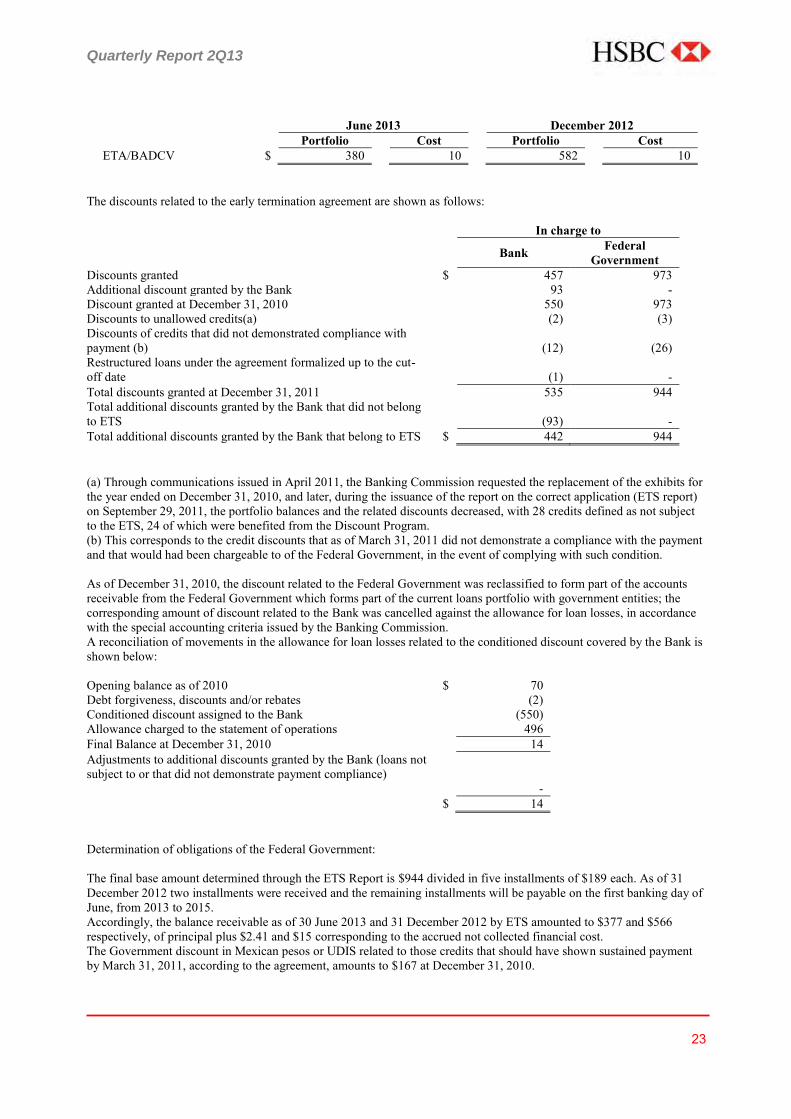
June 2013 December 2012 Portfolio Cost Portfolio Cost ETA/BADCV $ 380 10 582 10
The discounts related to the early termination agreement are shown as follows: In charge to Bank Federal
Government Discounts granted $ 457 973 Additional discount granted by the Bank 93 - Discount granted at December 31, 2010 550 973 Discounts to unallowed credits(a) (2) (3) Discounts of credits that did not demonstrated compliance with payment (b)
(12) (26)
Restructured loans under the agreement formalized up to the cut-off date
(1) -
Total discounts granted at December 31, 2011 535 944 Total additional discounts granted by the Bank that did not belong to ETS
(93) -
Total additional discounts granted by the Bank that belong to ETS $ 442 944 (a) Through communications issued in April 2011, the Banking Commission requested the replacement of the exhibits for the year ended on December 31, 2010, and later, during the issuance of the report on the correct application (ETS report) on September 29, 2011, the portfolio balances and the related discounts decreased, with 28 credits defined as not subject to the ETS, 24 of which were benefited from the Discount Program. (b) This corresponds to the credit discounts that as of March 31, 2011 did not demonstrate a compliance with the payment and that would had been chargeable to of the Federal Government, in the event of complying with such condition. As of December 31, 2010, the discount related to the Federal Government was reclassified to form part of the accounts receivable from the Federal Government which forms part of the current loans portfolio with government entities; the corresponding amount of discount related to the Bank was cancelled against the allowance for loan losses, in accordance with the special accounting criteria issued by the Banking Commission. A reconciliation of movements in the allowance for loan losses related to the conditioned discount covered by the Bank is shown below: Opening balance as of 2010 $ 70 Debt forgiveness, discounts and/or rebates (2) Conditioned discount assigned to the Bank (550) Allowance charged to the statement of operations 496 Final Balance at December 31, 2010 14 Adjustments to additional discounts granted by the Bank (loans not subject to or that did not demonstrate payment compliance)
- $ 14 Determination of obligations of the Federal Government: The final base amount determined through the ETS Report is $944 divided in five installments of $189 each. As of 31 December 2012 two installments were received and the remaining installments will be payable on the first banking day of June, from 2013 to 2015. Accordingly, the balance receivable as of 30 June 2013 and 31 December 2012 by ETS amounted to $377 and $566 respectively, of principal plus $2.41 and $15 corresponding to the accrued not collected financial cost. The Government discount in Mexican pesos or UDIS related to those credits that should have shown sustained payment by March 31, 2011, according to the agreement, amounts to $167 at December 31, 2010.
Quarterly Report 2Q13
24
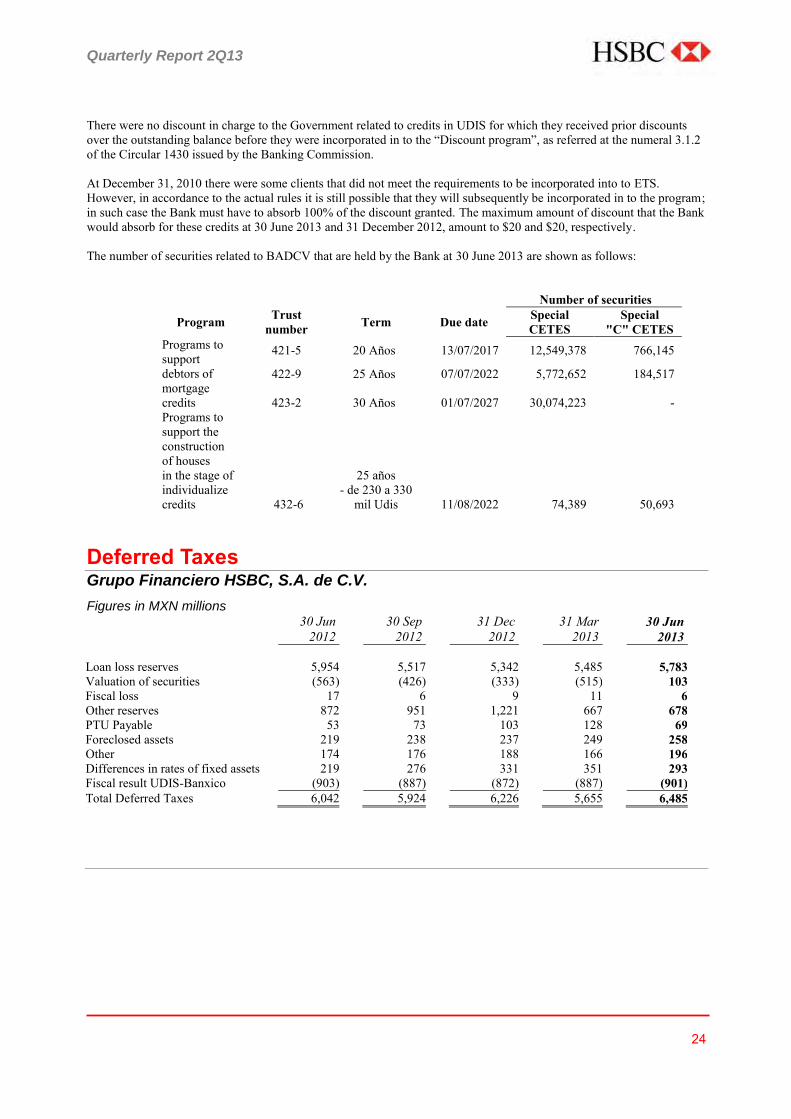
There were no discount in charge to the Government related to credits in UDIS for which they received prior discounts over the outstanding balance before they were incorporated in to the “Discount program”, as referred at the numeral 3.1.2 of the Circular 1430 issued by the Banking Commission. At December 31, 2010 there were some clients that did not meet the requirements to be incorporated into to ETS. However, in accordance to the actual rules it is still possible that they will subsequently be incorporated in to the program; in such case the Bank must have to absorb 100% of the discount granted. The maximum amount of discount that the Bank would absorb for these credits at 30 June 2013 and 31 December 2012, amount to $20 and $20, respectively. The number of securities related to BADCV that are held by the Bank at 30 June 2013 are shown as follows:
Number of securities
Program Trust number Term Due date Special
CETES Special
"C" CETES Programs to support debtors of mortgage credits
421-5 20 Años 13/07/2017 12,549,378 766,145
422-9 25 Años 07/07/2022 5,772,652 184,517
423-2 30 Años 01/07/2027 30,074,223 - Programs to support the construction of houses in the stage of individualize credits 432-6
25 años - de 230 a 330
mil Udis 11/08/2022 74,389 50,693
Deferred Taxes Grupo Financiero HSBC, S.A. de C.V.
Figures in MXN millions
30 Jun 2012
30 Sep 2012
31 Dec 2012
31 Mar 2013
30 Jun 2013
Loan loss reserves 5,954 5,517 5,342 5,485 5,783 Valuation of securities (563) (426) (333) (515) 103 Fiscal loss 17 6 9 11 6 Other reserves 872 951 1,221 667 678 PTU Payable 53 73 103 128 69 Foreclosed assets 219 238 237 249 258 Other 174 176 188 166 196 Differences in rates of fixed assets 219 276 331 351 293 Fiscal result UDIS-Banxico (903) (887) (872) (887) (901) Total Deferred Taxes 6,042 5,924 6,226 5,655 6,485
Quarterly Report 2Q13
25
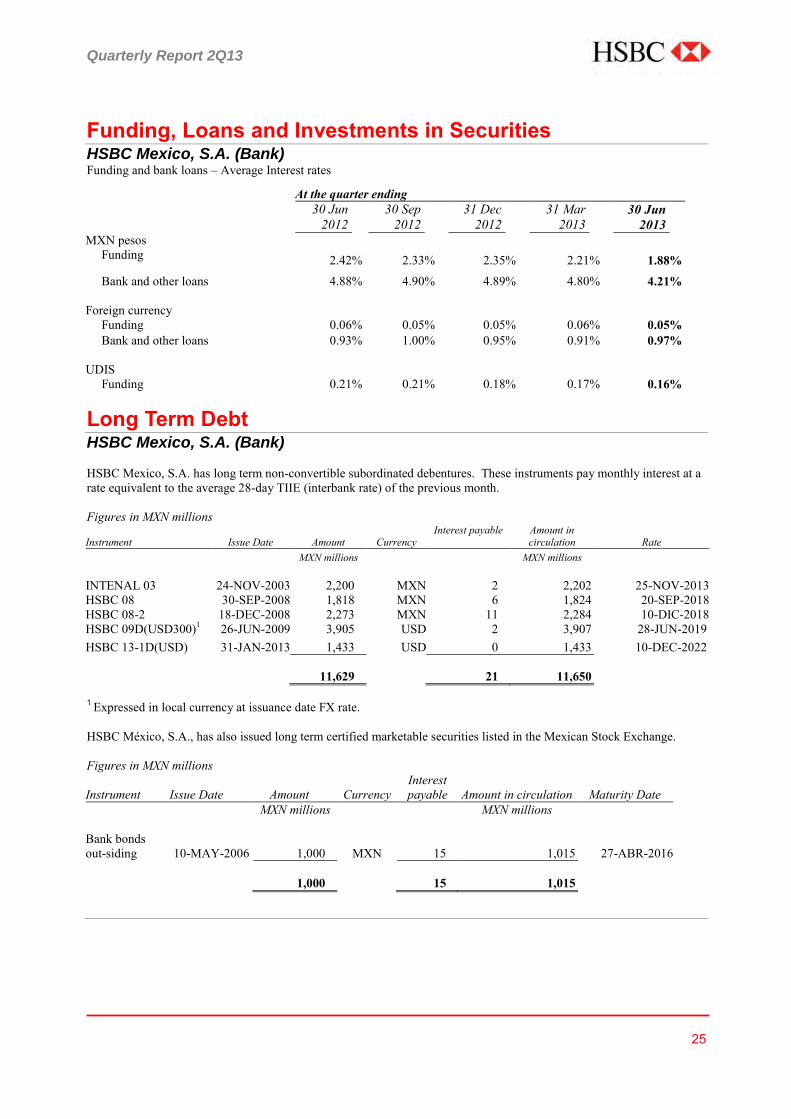
Funding, Loans and Investments in Securities HSBC Mexico, S.A. (Bank) Funding and bank loans – Average Interest rates
At the quarter ending
30 Jun
2012 30 Sep
2012 31 Dec
2012 31 Mar
2013 30 Jun
2013 MXN pesos Funding 2.42 % 2.33 % 2.35 % 2.21 % 1.88 % Bank and other loans 4.88 % 4.90 % 4.89 % 4.80 % 4.21 % Foreign currency Funding 0.06 % 0.05 % 0.05 % 0.06 % 0.05 % Bank and other loans 0.93 % 1.00 % 0.95 % 0.91 % 0.97 % UDIS Funding 0.21 % 0.21 % 0.18 % 0.17 % 0.16 %
Long Term Debt HSBC Mexico, S.A. (Bank) HSBC Mexico, S.A. has long term non-convertible subordinated debentures. These instruments pay monthly interest at a rate equivalent to the average 28-day TIIE (interbank rate) of the previous month. Figures in MXN millions
Instrument Issue Date Amount Currency Interest payable Amount in
circulation Rate MXN millions MXN millions INTENAL 03 24-NOV-2003 2,200 MXN 2 2,202 25-NOV-2013 HSBC 08 30-SEP-2008 1,818 MXN 6 1,824 20-SEP-2018 HSBC 08-2 18-DEC-2008 2,273 MXN 11 2,284 10-DIC-2018 HSBC 09D(USD300)1 26-JUN-2009 3,905 USD 2 3,907 28-JUN-2019 HSBC 13-1D(USD) 31-JAN-2013 1,433 USD 0 1,433 10-DEC-2022 11,629 21 11,650
1 Expressed in local currency at issuance date FX rate. HSBC México, S.A., has also issued long term certified marketable securities listed in the Mexican Stock Exchange. Figures in MXN millions
Instrument Issue Date Amount Currency Interest payable Amount in circulation Maturity Date
MXN millions MXN millions Bank bonds out-siding 10-MAY-2006 1,000 MXN 15 1,015 27-ABR-2016 1,000 15 1,015
Quarterly Report 2Q13
26
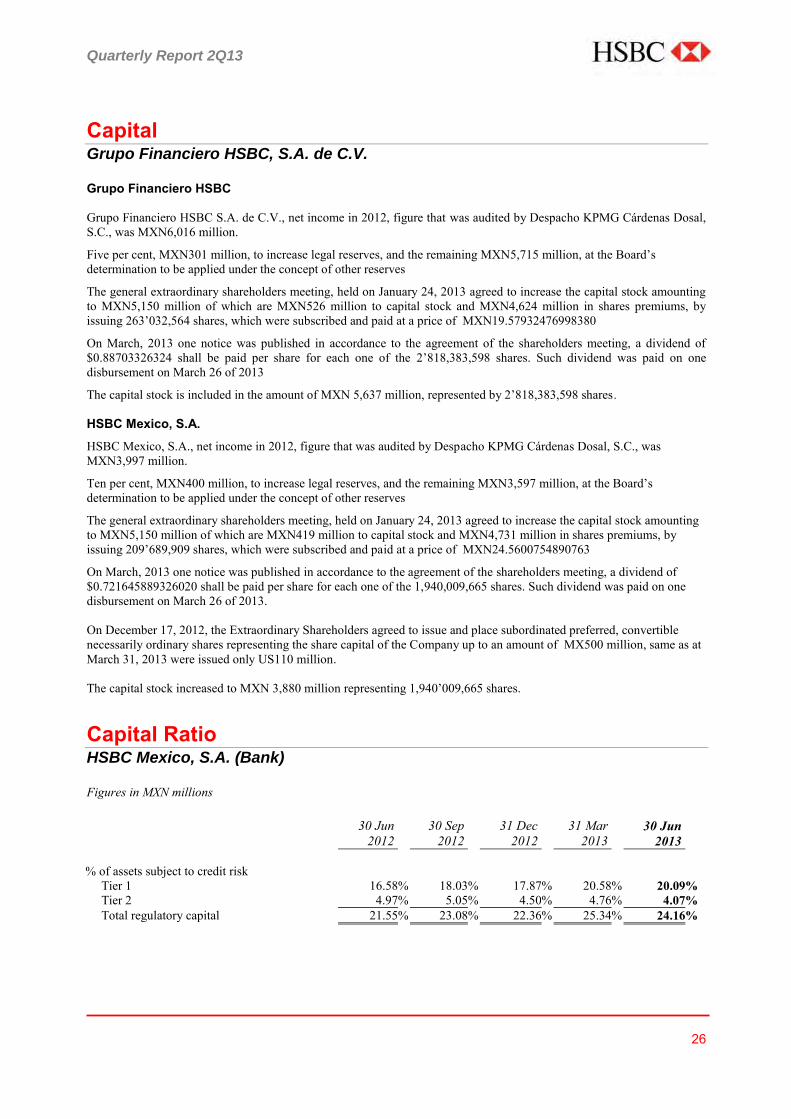
Capital Grupo Financiero HSBC, S.A. de C.V. Grupo Financiero HSBC Grupo Financiero HSBC S.A. de C.V., net income in 2012, figure that was audited by Despacho KPMG Cárdenas Dosal, S.C., was MXN6,016 million.
Five per cent, MXN301 million, to increase legal reserves, and the remaining MXN5,715 million, at the Board’s determination to be applied under the concept of other reserves
The general extraordinary shareholders meeting, held on January 24, 2013 agreed to increase the capital stock amounting to MXN5,150 million of which are MXN526 million to capital stock and MXN4,624 million in shares premiums, by issuing 263’032,564 shares, which were subscribed and paid at a price of MXN19.57932476998380
On March, 2013 one notice was published in accordance to the agreement of the shareholders meeting, a dividend of $0.88703326324 shall be paid per share for each one of the 2’818,383,598 shares. Such dividend was paid on one disbursement on March 26 of 2013
The capital stock is included in the amount of MXN 5,637 million, represented by 2’818,383,598 shares. HSBC Mexico, S.A.
HSBC Mexico, S.A., net income in 2012, figure that was audited by Despacho KPMG Cárdenas Dosal, S.C., was MXN3,997 million.
Ten per cent, MXN400 million, to increase legal reserves, and the remaining MXN3,597 million, at the Board’s determination to be applied under the concept of other reserves
The general extraordinary shareholders meeting, held on January 24, 2013 agreed to increase the capital stock amounting to MXN5,150 million of which are MXN419 million to capital stock and MXN4,731 million in shares premiums, by issuing 209’689,909 shares, which were subscribed and paid at a price of MXN24.5600754890763
On March, 2013 one notice was published in accordance to the agreement of the shareholders meeting, a dividend of $0.721645889326020 shall be paid per share for each one of the 1,940,009,665 shares. Such dividend was paid on one disbursement on March 26 of 2013. On December 17, 2012, the Extraordinary Shareholders agreed to issue and place subordinated preferred, convertible necessarily ordinary shares representing the share capital of the Company up to an amount of MX500 million, same as at March 31, 2013 were issued only US110 million. The capital stock increased to MXN 3,880 million representing 1,940’009,665 shares.
Capital Ratio HSBC Mexico, S.A. (Bank) Figures in MXN millions
30 Jun 2012
30 Sep 2012
31 Dec 2012
31 Mar
2013
30 Jun
2013 % of assets subject to credit risk Tier 1 16.58 % 18.03 % 17.87 % 20.58 % 20.09 % Tier 2 4.97 % 5.05 % 4.50 % 4.76 % 4.07 % Total regulatory capital 21.55 % 23.08 % 22.36 % 25.34 % 24.16 %
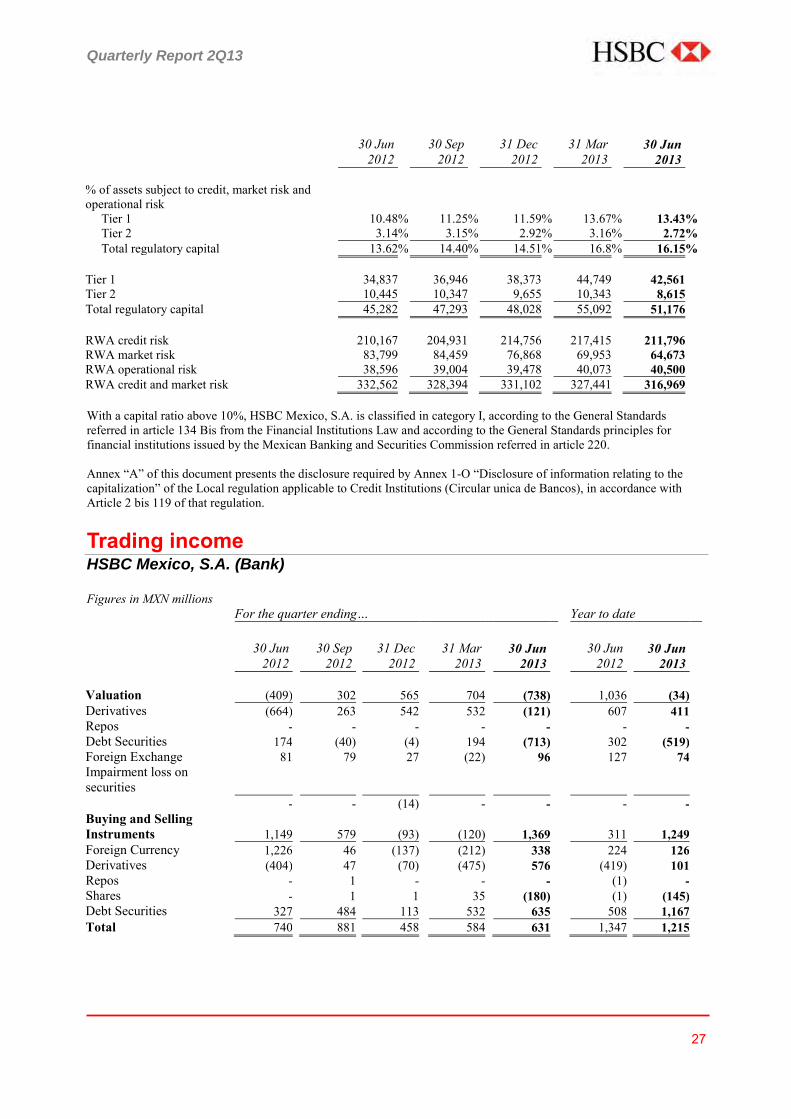
Quarterly Report 2Q13
27
30 Jun 2012
30 Sep 2012
31 Dec 2012
31 Mar
2013
30 Jun
2013 % of assets subject to credit, market risk and operational risk Tier 1 10.48 % 11.25 % 11.59 % 13.67 % 13.43 % Tier 2 3.14 % 3.15 % 2.92 % 3.16 % 2.72 % Total regulatory capital 13.62 % 14.40 % 14.51 % 16.8 % 16.15 % Tier 1 34,837 36,946 38,373 44,749 42,561 Tier 2 10,445 10,347 9,655 10,343 8,615 Total regulatory capital 45,282 47,293 48,028 55,092 51,176 RWA credit risk 210,167 204,931 214,756 217,415 211,796 RWA market risk 83,799 84,459 76,868 69,953 64,673 RWA operational risk 38,596 39,004 39,478 40,073 40,500 RWA credit and market risk 332,562 328,394 331,102 327,441 316,969 With a capital ratio above 10%, HSBC Mexico, S.A. is classified in category I, according to the General Standards referred in article 134 Bis from the Financial Institutions Law and according to the General Standards principles for financial institutions issued by the Mexican Banking and Securities Commission referred in article 220. Annex “A” of this document presents the disclosure required by Annex 1-O “Disclosure of information relating to the capitalization” of the Local regulation applicable to Credit Institutions (Circular unica de Bancos), in accordance with Article 2 bis 119 of that regulation. Trading income HSBC Mexico, S.A. (Bank) Figures in MXN millions For the quarter ending… Year to date
30 Jun
2012 30 Sep
2012 31 Dec
2012
31 Mar
2013
30 Jun
2013 30 Jun
2012 30 Jun
2013
Valuation (409) 302 565 704 (738) 1,036 (34) Derivatives (664) 263 542 532 (121) 607 411 Repos - - - - - - - Debt Securities 174 (40) (4) 194 (713) 302 (519) Foreign Exchange 81 79 27 (22) 96 127 74 Impairment loss on securities - - (14) - - - - Buying and Selling Instruments 1,149 579 (93) (120) 1,369 311 1,249
Foreign Currency 1,226 46 (137) (212) 338 224 126 Derivatives (404) 47 (70) (475) 576 (419) 101 Repos - 1 - - - (1) - Shares - 1 1 35 (180) (1) (145) Debt Securities 327 484 113 532 635 508 1,167 Total 740 881 458 584 631 1,347 1,215

Quarterly Report 2Q13
28
Other Operating Income (Expenses) Grupo Financiero HSBC, S.A. de C.V.
Figures in MXN millions
Por el trimestre terminado el Acumulado al
30 Jun
2012 30 Sep
2012 31 Dec
2012 31 Mar
2013 30 Jun
2013 30 Jun
2012 30 Jun
2013 Loans to employees 34 34 34 34 34 68 68 Recoveries 454 10 11 5 4 598 9 Credit portfolio recoveries 179 183 195 187 174 352 361 Result of Foreclosed assets 12 (6) 30 18 27 18 45 Property sales (7) - - - - - - Estimate for doubtful - - - (487) - (487) Other items of income (expenses) 471 373 410 330 1,033 1,007 1,363 Other income (expenses) arising from op. Insurance and Bonding 91 94 90 86 83 177 169 Monetary position result - 13 15 7 (7) 5 - Other losses (107) (49) (458) (73) (70) (227) (143) Total Other Operating Income (expenses)
1,127 652 327 594 791
1,998
1,385
Information on Customer Segment and Results Grupo Financiero HSBC, S.A. de C.V. Consolidated Income Statement by Customer Segment The consolidated income statement by customer segment includes Retail Banking and Wealth Management (RBWM), Commercial Banking (CMB) and Global Banking and Markets (GBM). The following is a brief description of the customer segments: Retail Banking and Wealth Management (RBWM) – retail banking operations focusing on the individual by offering a the complete spectrum of financial needs from checking/deposits accounts to credit cards, personal and auto loans, and mortgages, among others. Commercial Banking (CMB) – CMB covers all small and medium sized companies by offering lending in Mexican Pesos and other currencies, lines of credit for working capital, export financing, in addition to trade services, fiduciary and other financial services, among others. Global Banking and Markets (GBM) – This segment includes product lines directed towards large, multinational corporations and consists of treasury and custody services, corporate finance advising, risk administration, trade services, and money market and capital investments.
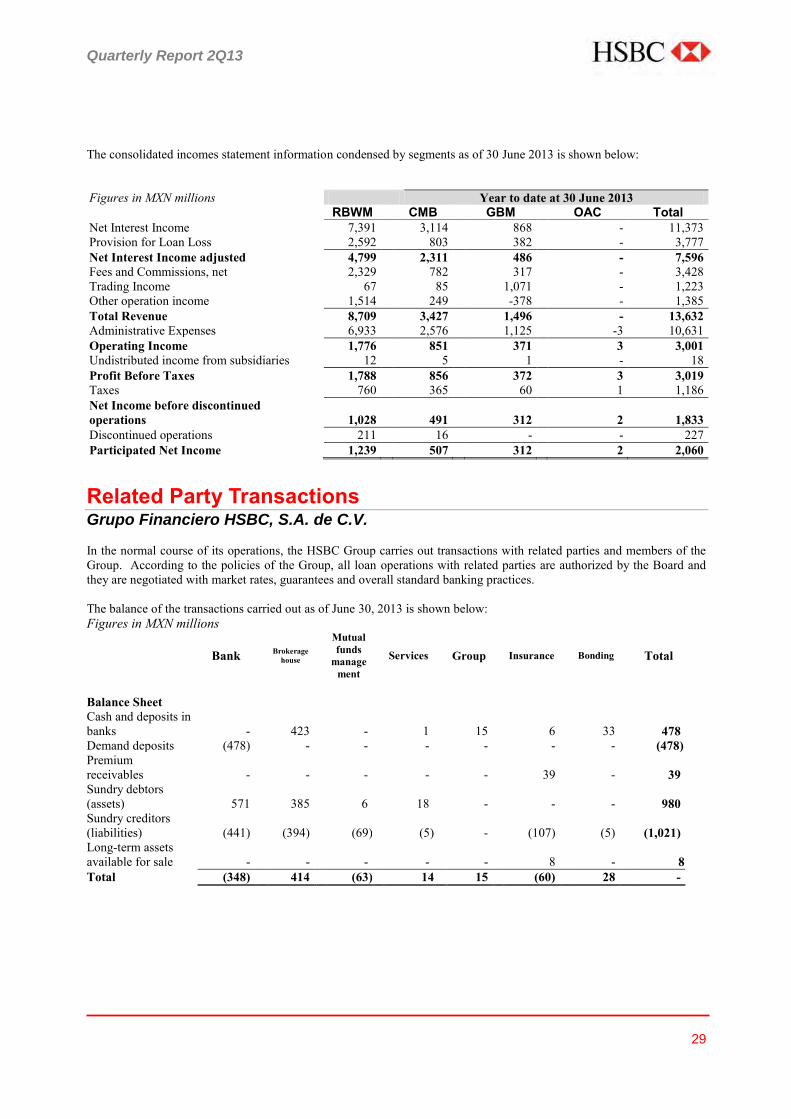
Quarterly Report 2Q13
29
The consolidated incomes statement information condensed by segments as of 30 June 2013 is shown below:
Figures in MXN millions Year to date at 30 June 2013 RBWM CMB GBM OAC Total Net Interest Income 7,391 3,114 868 - 11,373 Provision for Loan Loss 2,592 803 382 - 3,777 Net Interest Income adjusted 4,799 2,311 486 - 7,596 Fees and Commissions, net 2,329 782 317 - 3,428 Trading Income 67 85 1,071 - 1,223 Other operation income 1,514 249 -378 - 1,385 Total Revenue 8,709 3,427 1,496 - 13,632 Administrative Expenses 6,933 2,576 1,125 -3 10,631 Operating Income 1,776 851 371 3 3,001 Undistributed income from subsidiaries 12 5 1 - 18 Profit Before Taxes 1,788 856 372 3 3,019 Taxes 760 365 60 1 1,186 Net Income before discontinued operations
1,028 491 312 2 1,833
Discontinued operations 211 16 - - 227 Participated Net Income 1,239 507 312 2 2,060
Related Party Transactions Grupo Financiero HSBC, S.A. de C.V. In the normal course of its operations, the HSBC Group carries out transactions with related parties and members of the Group. According to the policies of the Group, all loan operations with related parties are authorized by the Board and they are negotiated with market rates, guarantees and overall standard banking practices. The balance of the transactions carried out as of June 30, 2013 is shown below: Figures in MXN millions
Bank Brokerage
house
Mutual funds
management
Services Group Insurance Bonding Total
Balance Sheet Cash and deposits in banks - 423 - 1 15 6 33 478 Demand deposits (478) - - - - - - (478) Premium receivables
-
-
-
-
-
39
-
39
Sundry debtors (assets)
571
385
6
18
-
-
-
980
Sundry creditors (liabilities)
(441)
(394)
(69)
(5)
-
(107)
(5)
(1,021)
Long-term assets available for sale
-
-
-
-
-
8
-
8
Total (348) 414 (63) 14 15 (60) 28 -

Quarterly Report 2Q13
30
Bank Brokerage
house
Mutual funds
management
Services Group Insurance Bonding Total
P&L Payable commissions
(16)
-
(255)
-
-
(92)
-
(363)
Receivable commissions 263 16 9 - - - - 288 Discontinued operations
-
-
-
-
-
(43)
-
(43)
Interest income - 8 - - - - - 8 Interest expense (8) - - - - - - (8) Earned premiums - - - - - 107 - 107 Administrative and personnel expenses
(107)
(1)
-
-
-
(9)
(1)
(118)
Administrative services (129) (17) (45) (7) (1) (107) (4) (310) Other income 308 - - 131 - - - 439 Total 311 6 (291) 124 (1) (144) (5) - Differences between Mexican GAAP and International Financial Reporting Standards (IFRS) Grupo Financiero HSBC HSBC Holdings plc, the ultimate parent of Grupo Financiero HSBC, reports its results under International Financial Reporting Standards (IFRS). Set out below is a reconciliation of the results of Grupo Financiero HSBC from Mexican GAAP to IFRS for the first half of 2013 and an explanation of the key reconciling items. 30 Jun Figures in MXN millions 2013 Grupo Financiero HSBC – Net Income Under Mexican GAAP 2,060 Differences arising from: Valuation of defined benefit pensions and post-retirement healthcare benefits 46 Deferral of fees received and paid on the origination of loans and other effective
interest rate adjustments 11 Loan impairment charges and other differences in presentation under IFRS (1,126) Recognition of the present value in-force of long-term insurance contracts (199) Differences in tax criteria (3,204) Other differences in accounting principles 269 Net income under IFRS (2,143) US dollar equivalent (millions) (171) Add back tax expense 3,883 Profit before tax under IFRS 1,740 US dollar equivalent (millions) 139 Exchange rate used for conversion 12.56 Net of tax at 30%.
Quarterly Report 2Q13
31
Summary of key differences between Grupo Financiero HSBC’s results as reported under Mexican GAAP and IFRS Valuation of defined benefit pensions and post-retirement healthcare benefits Mexican GAAP Defined benefit pension costs and the present value of defined benefit obligations are calculated at the reporting date by the schemes’ actuaries using the Projected Unit Credit Method and real interest rates. IFRS Defined benefit pension costs and the present value of defined benefit obligations are calculated at the reporting date by the schemes’ actuaries using the Projected Unit Credit Method. The net charge to the income statement mainly comprises the current service cost, plus the unwinding of the discount rate on plan liabilities, less the expected return on plan assets, and is presented in operating expenses. Past service costs are charged immediately to the income statement to the extent that the benefits have vested, and are otherwise recognised on a straight-line basis over the average period until the benefits vest. Actuarial gains and losses comprise experience adjustments (the effects of differences between the previous actuarial assumptions and what has actually occurred), as well as the effects of changes in actuarial assumptions. Actuarial gains and losses are recognised in other comprehensive income in the period in which they arise. Deferral of fees paid and received on the origination of loans and other effective interest rate adjustments Mexican GAAP From 1 January 2007, loan origination fees are required to be deferred and amortised over the life of the loan on a straight line basis. Prior to 2007, loan origination fees were recognised up-front. IFRS Effective interest rate method is used for the recognition of fees and expenses received or paid that are directly attributable to the origination of a loan and for other transaction costs, premiums or discounts. Loan impairment charges and other differences in presentation under IFRS Mexican GAAP Loan impairment charges are calculated following the rules issued by the Mexican Ministry of Finance and the National Banking and Securities Commission. Such rules establish methodologies for determining the amount of provision for each type of loan. IFRS Impairment losses on collectively assessed loans are calculated as follows: When appropriate empirical information is available, the Bank utilises roll rate methodology. This methodology
employs statistical analysis of historical data and experience of delinquency and default to estimate the amount of loans that will eventually be written off as a result of events occurring before the balance sheet date which the Bank is not able to identify on an individual loan basis, and that can be reliably estimated.
In other cases, loans are grouped together according to their credit risk characteristics for the purpose of calculating an estimated collective loss.
Impairment losses on individually assessed loans are calculated by discounting the expected future cash flows of a loan at its original effective interest rate, and comparing the resultant present value with the loans current carrying value. Present value of in-force long-term life insurance contracts Mexican GAAP The present value of future earnings is not recognised. Premiums are accounted for on a received basis and reserves are calculated in accordance with guidance as set out by the Insurance Regulator (Comisión Nacional de Seguros y Fianzas). IFRS The value placed on insurance contracts that are classified as long-term insurance business or long-term investment contracts with discretionary participating features (‘DPF’) and are in force at the balance sheet date is recognised as an asset. The asset represents the present value of the equity holders’ interest in the issuing insurance companies’ profits expected to emerge from these contracts written at the balance sheet date.
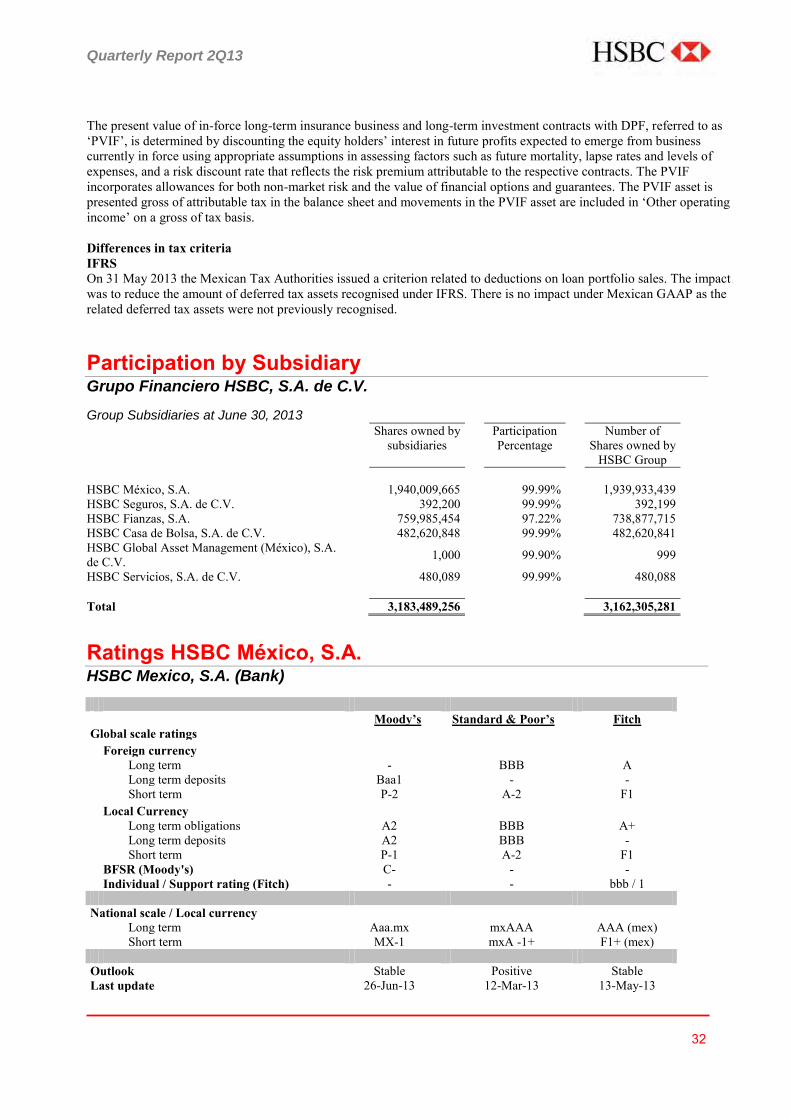
Quarterly Report 2Q13
32
The present value of in-force long-term insurance business and long-term investment contracts with DPF, referred to as ‘PVIF’, is determined by discounting the equity holders’ interest in future profits expected to emerge from business currently in force using appropriate assumptions in assessing factors such as future mortality, lapse rates and levels of expenses, and a risk discount rate that reflects the risk premium attributable to the respective contracts. The PVIF incorporates allowances for both non-market risk and the value of financial options and guarantees. The PVIF asset is presented gross of attributable tax in the balance sheet and movements in the PVIF asset are included in ‘Other operating income’ on a gross of tax basis. Differences in tax criteria IFRS On 31 May 2013 the Mexican Tax Authorities issued a criterion related to deductions on loan portfolio sales. The impact was to reduce the amount of deferred tax assets recognised under IFRS. There is no impact under Mexican GAAP as the related deferred tax assets were not previously recognised. Participation by Subsidiary Grupo Financiero HSBC, S.A. de C.V.
Group Subsidiaries at June 30, 2013 Shares owned by
subsidiaries Participation
Percentage Number of
Shares owned by HSBC Group
HSBC México, S.A. 1,940,009,665 99.99% 1,939,933,439 HSBC Seguros, S.A. de C.V. 392,200 99.99% 392,199 HSBC Fianzas, S.A. 759,985,454 97.22% 738,877,715 HSBC Casa de Bolsa, S.A. de C.V. 482,620,848 99.99% 482,620,841 HSBC Global Asset Management (México), S.A. de C.V.
1,000 99.90% 999
HSBC Servicios, S.A. de C.V. 480,089 99.99% 480,088 Total 3,183,489,256 3,162,305,281
Ratings HSBC México, S.A. HSBC Mexico, S.A. (Bank)
Moody’s Standard & Poor’s Fitch Global scale ratings Foreign currency Long term - BBB A Long term deposits Baa1 - - Short term P-2 A-2 F1 Local Currency Long term obligations A2 BBB A+ Long term deposits A2 BBB - Short term P-1 A-2 F1 BFSR (Moody's) C- - - Individual / Support rating (Fitch) - - bbb / 1 National scale / Local currency Long term Aaa.mx mxAAA AAA (mex) Short term MX-1 mxA -1+ F1+ (mex) Outlook Stable Positive Stable Last update 26-Jun-13 12-Mar-13 13-May-13
Quarterly Report 2Q13
33
Accounting Policies These financial statements are prepared under the banking law, in accordance with the accounting criteria for financial group holding companies in Mexico, at the balance sheet date, established by the Banking Committee (CNBV for its acronym in Spanish), who is responsible for the inspection and supervision of the financial group holding companies and for reviewing their financial information. The financial statements of subsidiaries have been prepared under the accounting criteria established by the CNBV, except for the financial statements of HSBC Seguros and HSBC Fianzas, which are prepared under the criteria for insurance and bonding institutions in Mexico, issued by the National Commission of Insurance and Bonds (CNSF for its acronym in Spanish) The accounting criteria established by the CNBV and the CNSF, follow the Financial Reporting Standards (NIF for its acronym in Spanish) issued by the Mexican Financial Reporting Standards (CINIF for its acronym in Spanish). The accounting criteria include specific rules for accounting, valuation, presentation and disclosure, which in some cases are different from the NIF. The accounting criteria indicate that the commission diffuses specific rules for specialized operations, and when the CNBV or the NIF (as applicable) do not indicate a specific accounting criterion for financial group holding companies, it must be analyzed a supplementary process established in the NIF A-8, and just in case that the International Financial Reporting Standards (IFRS) referred in the NIF A-8 do not provide solution to the accounting recognition, can opt to apply another supplementary rule that belongs to any other regulatory scheme (it has to comply with all the requirements mentioned in the NIF). For apply the mentioned supplementary rules, it must be in the following order: Generally Accepted Accounting Principles of the United States (USGAAP) and any accounting standard that is part of a set of formal and recognized standards. Modifications in to the policies, standards and accounting practices
I. Modifications to the NIF B-8 “Consolidated or combined financial statements”
a) Modification the definition of control; b) Includes the terms of “protective rights” and “structured entity” and incorporates the concepts of principal and
agent. c) The term “Special Purpose Entity” or SPE is eliminated.
II. Modifications to the NIF C-7 “Associates, joint ventures and other permanent investments”
a) It is provided that investments in joint ventures should be accounted for by the equity method. b) The term “Special Purpose Entity” or SPE is eliminated. c) It is stipulated that all the effects that have an impact on the net profit or loss of a holding company, arising from
its permanent investments in associates, joint ventures and others, should be recognized under the heading of “equity in the results of other entities”.
d) Additional disclosures are required.
III. Modifications to the NIF C-21 “Joint arrangements”
a) Defines the term of “joint arrangement”, and classifies into two types: “joint operations” and “joint ventures”. b) A joint venture accounts for its interest in the joint venture as a permanent investment using the equity method.
In December 2012 the CINIF published a document called “Improvements to 2013 NIF, which contains specific amendments to certain existing NIF:
IV. Improvements to NIF C-5 “Prepayments”, Bulletins C-9 “Liabilities, provisions, contingent assets and liabilities and commitments” and C-12 “Financial instruments with characteristics of liabilities, equity or both”
Changes provide that expenses on the issue of debentures should be presented as a reduction of the corresponding liability and charged to income based on the effective interest method.
Quarterly Report 2Q13
34
V. Improvements to NIF D-4 “Income taxes”
Establishes that current and deferred income tax shall be recognized and included in profit or loss for the period, except to the extent that the tax arises from a transaction or event that is recognized in a different period, outside profit or loss, either in other comprehensive income or directly in equity.
VI. Improvements to Bulletin D-5 “Leases”
Define that costs incurred and directly attributable to negotiating and arranging a lease, both for the lessor and lessee shall be deferred in the lease. VII. Changes in the loan loss provisions methodology for the commercial loan portfolio
On June 24, 2013, the CNBV issued changes to the loan loss provisions methodology applicable to credit institutions in Mexico (the Dispositions) which are applicable to the methodology for grading commercial loans granted to the following clients: financial institutions, individuals with business activities and others different than: projects with own source of payment, trustees acting under trusts not included in the projects with own source of payment and credit schemes commonly known as " structured ". In accordance with Article Second of the Transitional Dispositions, HSBC chose to early adopt on June 2013 the methodology for commercial portfolio included on section V of Article 110 of Dispositions. As result of the early adoption HSBC recognised in retained earnings on June 2013 MXN 799 million (MXN 575 million net of deferred tax). The Bank has not determined the retrospective financial effect from the application of this new methodology related to the year 2012. Although management has made all reasonable efforts, it has not been possible to obtain the historical information required by the new methodologies, as well as the development of specific systems. Therefore, these consolidated financial statements do not include the information required by paragraph 11 of the Financial Reporting Standars B-1 "Accounting changes and correction of errors" required in this ruling by the Banking Commission.
Below is a comparison between the amounts of loan loss provisions, calculated with the methodology published on June 24, 2013 compared with the amounts of loan loss provisions calculated according to the methodology in force prior to that date, both as at June 2013:
MXN millionsPrior methodology Actual methodology
3,944 4,547
Treasury Policies HSBC Mexico, S.A., Institución de Banca Múltiple, Grupo Financiero HSBC (HSBC Mexico) has three specific objectives in Treasury activities:
1. To fulfil the needs of our client base, mainly being Corporate, Institutional and Commercial clients. 2. Provide hedges for HSBC Mexico from interest rate, foreign exchange and liquidity risks. The latter as a part of
its normal commercial activity.
3. Positioning and Market Maker activities. All of the aforementioned is implemented in compliance with limits established by local regulating entities and with the high control standards from HSBC Group.
Quarterly Report 2Q13
35
Dividends Policy Grupo HSBC (including HSBC Mexico) does not have a fixed dividend policy. The decision to decreet or no to make payment of dividends is determined by the shareholder assembly and the Board of Directors, such decision is based on the reinvestment and capitalization needs. Paid Dividends The frequency of the dividends paid by the Bank in the last four periods and the dividend decreted per share has been the following:
Based on the authorization granted by the Board of Directors on 30 March 2009, on 31 March 2009 a dividend payment was made for MXN0.81133657 per share for the 1,235,526,706 outstanding.
Based on the authorization granted by the Board of Directors on 29 October 2010 a dividend payment was made
for MXN1.22497679421977 per share for the 1,643,363,189 outstanding shares.
Based on the authorization granted by the Board of Directors, on 18 March 2011 a dividend payment was made for MXN1.09531478619484 per share for the 1,643,363,189 outstanding shares.
Based on the authorization granted by the Board of Directors, on 29 March 2012 a dividend payment was made
for MXN0.809099009096675 per share for the 1,730,319,756 outstanding shares.
Based on the authorization granted by the shareholder assembly, on 26 March 2013 a dividend payment was made for MXN 0.721645889326 per share for the 1,940,009,665 outstanding shares.
Internal Control The Management is responsible of the internal control in HSBC and for reviewing its effectiveness. Procedures have been developed to prevent the disposal or non-authorized use of assets in order to maintain adequate accounting registers and to generate trustful financial information for internal use or for its publication. Such processes have been designed to manage risk and not to eliminate it; therefore they can only provide a reasonable safeguard against material deviations, errors, losses or frauds. The key procedures that the Management has established have been designed to facilitate the effectivity of HSBC’s internal controls and include the following:
A clear due diligence has been established, supported by a detailed definition of authority limits enhancing effective operational controls. Responsibility is delegated through writings with instructions clearly defined, including transactional ranges. Appropriate information is considered to determine the level of authority as well as the approach of such responsibility granted in individual basis; this is accomplished through the implementation of monitoring and reporting procedures, adequate segregation of functions and a management structure designed to control responsibility limits. In summary, the administrative board authorises the CEO (Chief Executive Officer) to delegate faculties to the rest of the Managers who receive the appropriate authority to develop their activities.
The administrative board in each of its meetings receives briefs about financial information, the development
of business, management of key personnel and drafts copies of each committee reunion held. The administrative board also receives presentations of key business areas and of any other relevant affairs that have been requested.
The systems and procedures that exist in HSBC to identify, manage and inform about relevant risks include:
credit, changes in market prices of financial instruments, liquidity, operation errors, law or normativity infringements, non-authorized activities and fraud. The exposure to such risks is supervised by the Assets and Liabilities Committee (ALCO) and by the Executive Committee. The Risk Management Committee (RMC), chaired by an external member of the Administrative Board, is celebrated in a monthly basis. In the RMC,

Quarterly Report 2Q13
36
assets and liabilities affairs are discussed. Each subsidiary holds individual RMCs that are discussed in HSBC’s RMC.
New procedures have been established in order to identify new risks arising from changes in market place
practices as well as from client behaviour, which can increase risk exposure to losses or to reputation damage in HSBC’s.
Strategic plans are prepared for each client segment, product group and main support areas. In such manner,
operational plans are prepared. These plans are approved annually and revised periodically, establishing key initiatives for our businesses and their possible financial effects.
Responsibility on the financial performance, capital expenditure, budget exercise, credit risk and market risk
are delegated with certain limits to the Management. Additionally, risk management policies are established by the Administrative Board for the following risk areas: credit risk, market risk, liquidity risk, operation risk, information technology risk, insurance risk, accounting risk, fiscal risk, legal risk, human resources risk, reputational risk, acquisition risk, and business risk.
Internal audit supervises the effectivity of the internal control structure. Internal audit tasks are focused in
supervising the areas that represent the higher risks for HSBC, to determine such areas, risk assessments take place. The head of this functions reports to the Audit Committee.
The Management is responsible to assure that recommendations given by the internal audit area are
implemented in the stipulated time; confirmation of implementations is handed to internal audit. The Management must also confirm in annual basis to internal audit that measures have been taken to implement recommendations given by an external author or the regulator.
The Audit Committee revises periodically the effectiveness of Internal Control and also informs the
Administrative Board about the latter. Among the main processes used by the committee in its revisions are: periodical reports of the heads of key risks, annual revision of the performance of internal control against key HSBC indicators, quarterly confirmations that no significant losses have taken place, contingency or uncertainty caused by deficiencies of the internal controls, internal audit reports, external audit reports and regulatory reports.
The Management, through the Audit Committee, realizes an annual review of the effectivity of the internal
control, which covers key financial, operational and compliance indicators as well as the affectivity of the risk management system. The Audit Committee receives periodically information about measures taken by the Administrative Board to correct or resolve any weakness or error detected through the operation of HSBC’s internal control.
Risk Management Risk management in Financial Group HSBC involves compliance with the norms and regulations on risk management included within the CNBV requirements, as well as with norms established by the Group on a worldwide level whose ultimate objective is to generate value for its shareholders while maintaining a conservative risk profile. Fundamental to carry out this work is the recognition of the essential precepts for an efficient and integral risks management, including quantifiable risks (credit, market and liquidity), as well as non-quantifiable, operational risk (technological and legal), under the sights that the basic processes of identifying, measuring, monitoring, limiting, controlling and disclosure will be satisfied. Bank’s Risk management framework in their main subsidiaries, begins with the Council Administration, whose main responsibility is the approval of objectives, alignment and policies relative to the topic, such as the determination of risk exposure limits which are supported by the ALCO and RMC committees.
Quarterly Report 2Q13
37
Assets and Liabilities Committee (ALCO) This committee meets monthly, chaired by the CEO and Group General Manager and having the Group Executive Directors as members. These Directors are the heads of the bank’s main business lines (RBWM, CMB, and GBM), and support areas like Treasury, Finance, Balance Management, Planning and Economic Capital. ALCO is the main vehicle to achieve the objectives of an adequate assets and liabilities management. It has the following objectives:
► To provide strategic direction and assure the tactical monitoring of a structure balance that fulfils the objectives within the pre-established risk parameters.
► To identify, monitor, and control all relevant risks, including information generated by RMC. ► To disseminate the information that required to make decisions. ► General review of funds sources and destinations. ► To determine the most likely environment for the bank’s assets and liabilities along with contingency scenarios
to be used in planning activities. ► To evaluate rates, price alternatives and portfolio mixes. ► To review and take on the responsibility for: assets and liabilities distribution and maturity dates; interest margin
size and position; liquidity levels and economic profit. Local Assets and Liabilities Committees, as Mexico, report directly to the Group Finance Department in London as a way to strengthen the decision making process. Risk Management Committee (RMC) The HBMX Board established the Risk Management Committee with the objective of controlling and managing the different types of risk. According to the guidelines for Risk Administration established by the Comisión Nacional Bancaria y de Valores (“CNBV”), the RMC carries out the following functions. The Committee comprises diverse external advisors and high-level HBMX officials, including the HBMX CEO, LAM CRO, HBMX CRO, Head Audit HBMX, Head RBWM HBMX, Head CMB HBMX, Head GBM HBMX, Head CTSO HBMX, CFO HBMX, Head Legal HBMX, Head GM HBMX, Head PB HBMX, Risk Manager (secretary). The committee is chaired by and external advisor on a monthly basis Objetives and responsibilities:
► Monitor current risks with the potential to have an impact on the Company’s operation, evaluate its likelihood and
effect on our financial results or reputation. Also, develop a focused and integrated methodology for the identification of such risks within HBMX.
► Propose solutions for improving risk profile and review risk strategies for mitigating specific or material risks. ► Develop a clear view of the overall risk profile and trends in credit, market, liquidity, insurance, operational and
reputational risks and internal controls within HBMX which might have an impact on our long term business strategy.
► A Risk-focused process to manage material risks, contingencies and mitigating actions, and consolidate risk reporting as an input to the ALCO process.
► Approve/ratify (as appropriate) proposed changes in policies and guidelines for integral risk administration, in accordance with CNBV rules and regulations.
► Approval of the maximum tolerance for market risk, credit risk and other risks considered acceptable for the Bank in relation to derivative trading operations.
► The RMC reviews and approves goals, operations and control procedures, as well as required risk tolerance levels, based on market conditions.
► Authorize the Terms of Reference (TOR) of the Committees that report into the RMC, including the authorization of its members, as well as providing guidance and overseeing their activities.
► Approve the methodologies for measuring and identifying all types of risk. ► Oversight of New Product approvals and subsequent review / amendments. ► Approval of changes to the provisioning methodologies including Economic Factors and Emergence Periods. ► Develop and modify the objectives, guidelines and policies on credit management and loan origination. ► Review open significant issues to be included in the CEO Attestation (as per the timing of the CEO Attestation)
and monitor the resolution of these issues.
Quarterly Report 2Q13
38
► Monitor current risks that could have an impact in the legal entities that comprise “GrupoFinanciero HSBC Mexico S.A. de C.V.”, according to the frequency defined for each entity:
Bank, Brokerage House (including Mutual Funds), Bonding, Global Asset Management, Insurance, Life Insurance and Pension entities on a monthly basis.
Real State and Foundation entities on a semiannually basis. Services Provider and Financial Services entities on a quarterly basis.
Also the HBMX legal entities list and status should be updated on a semiannual basis. Market Risk Management Qualitative Information Description of the qualitative aspects related to the Integral Management of Risks processes: Market risk management at HSBC consists of identifying, measuring, monitoring, limiting, controlling, reporting and revealing the different risks the institution is facing. The Board of Directors includes a Risk Committee that manages risk and ensures the operations to be executed in accordance with the objectives, policies and procedures for prudent risk management, as well as within the specific global limits set out by the Board. Market risk is defined as “the risk that the rates and market prices on which the Group has taken positions – interest rates, exchange rates, stock prices, etc.- will oscillate in an adverse way to the positions taken, there by causing losses for the Group”, that is to say, the potential loss derived from changes in the risk factors will impact the valuation or the expected results of assets and liabilities operations or will cause contingent liabilities, such as interest rates, exchange rates, and price indices, among others. The main market risks the Group is facing can be classified as follows: ► Foreign exchange or currency risk. - This risk arises in the open positions on different currencies to the local
currency, which generates an exposure to potential losses due to the variation of the corresponding exchange rates. ► Interest rate risk. - Arises from asset and liability operations (real nominal or notional), with different expiration
dates or re-capitalization dates. ► Risk related to shares. - This risk arises from maintaining open positions (purchase or sale) with shares or share-
based instruments, causing an exposure to changes in share prices and the instruments based on these prices. ► Volatility risk. - Arises in the financial instruments that contain options, in such a way that the price (among others
factors) depends on the perceived volatility in the underlying price of the option (interest rates, actions, exchange rate, etc.).
► Basis or margin risk. - This risk arises when an instrument is utilized for hedging and each one of them is valuated with different rate curves (for example, a government bond hedged with a by-product of inter-bank rates) so that its market value may differ from each other, generating an imperfect hedge.
► Credit Spread risk. - This is the risk that mark-to-market value of a corporate bond, inter-bank bond or sovereign debt in foreign currency, decreases due to changes in the credit quality perception of the issuer.
Main elements of the methodologies employed in the management of market risks: HSBC has decided to use Value at Risk (VaR) and the “Present Value of a Basis Point “(PVBP) in order to identify and quantify Market Risk. Both measures are monitored daily, based on market risk exposure limits set by the Board of Directors and marking-to-market all trading positions. Value at Risk (VaR) VaR is a statistical measure of the worst probable loss in a portfolio because of changes in the market risk factors of the instruments for a given period of time; therefore the calculation of VaR implies the use of a confidence level and a time horizon. VaR is obtained by Historical Simulation through full valuation, considering 500 historical daily changes on market risk factors. The Board of Directors has determined a confidence level of 99% with a holding period of one working day, therefore the VaR level becomes the maximum likely loss in a day with a 99% confidence level.
Quarterly Report 2Q13
39
Present value of a Basis Point (PVBP) and Forward PVBP (F-PVBP) PVBP is a measure of market risk exposure arising from movements in interest rates. This measure illustrates the potential loss by movements of a basis point in interest rates involved with the pricing of financial assets and liabilities, by re-valuating the whole position exposed to interest rates. Forward PVBP (F-PVBP) aims to measure the effect of movements in interest rates on the financial instruments exposed to them. This way, F-PVBP assumes the scenario of an increase of one basis point in the implied forward rates from the curve.
Spread over yield risk Spread over yield risk is understood as the possible adverse fluctuation in the market value of positions in financial instruments quoted with an over yield (Mexican floating government bonds), arising from market fluctuations in this risk factor.
Basis Risk Basis / Spread risk is a term used to describe the risk arising from the move of a market (by its internal factors) against other markets. Basis risk increases when an instrument is used to hedge another one and these two instruments are priced with different interest rate curves These differences arise because of the diverse features between the markets, among them: ► Regulation ► Each Market Restrictions ► Calendars ► Market Conventions (term basis in interest rates) ► Others
Credit Spread Risk (CSO1) Credit spread risk or CS01 is used to describe the risk of holding private sector issued securities in the trading books that can change in value as a function of changes in the perceived creditworthiness of the respective issuer. This market perceived credit quality of those corporate bonds is reflected in a spread over the risk free rate for those securities. HSBC uses limits to manage and control the corporate spread risk on its trading books. Vega or implied volatility risk
HSBC takes positions on instruments that are price sensitive to changes in market implied volatilities such as interest rate and foreign exchange options. Vega limits are used to control the risk against changes in market implied volatilities. Extreme Conditions Tests (Stress Test) These are models that take into account extreme values that sporadically occur, therefore they are highly improbable according to probability distributions assumed for the market risk factors, but if these extreme events occur could generate moderate to severe impacts. The generation of stress scenarios in HSBC, for the analysis of the sensitivity of positions and their risk exposure to interest rates, is carried out by considering hypothetical scenarios. Both negative and positive changes in interest rates are considered in order to fully measure the impact on the different portfolios. Besides this calculus, a linear extrapolation is done using the Forward PVBP based on hypothetical extreme scenarios (assuming that the portfolio is completely linear) to compare both results and obtain portfolio's implied convexity. Also stress test is done in foreign exchange and equity positions.
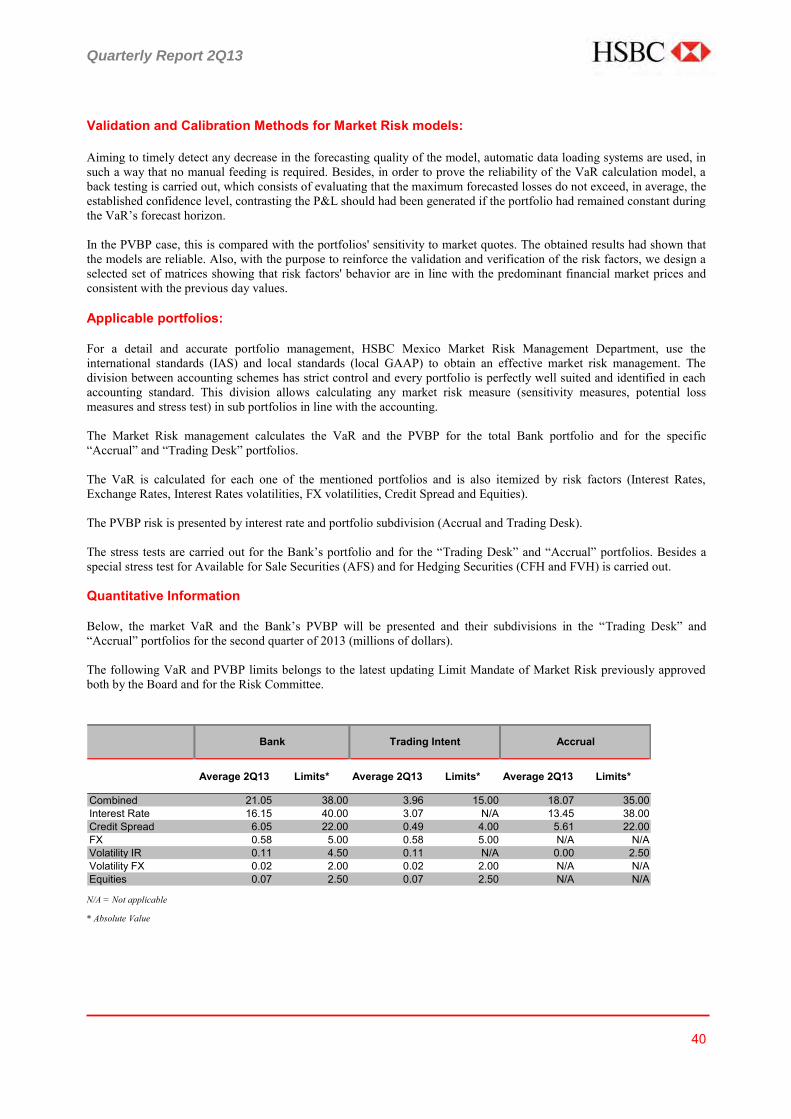
Quarterly Report 2Q13
40
Validation and Calibration Methods for Market Risk models: Aiming to timely detect any decrease in the forecasting quality of the model, automatic data loading systems are used, in such a way that no manual feeding is required. Besides, in order to prove the reliability of the VaR calculation model, a back testing is carried out, which consists of evaluating that the maximum forecasted losses do not exceed, in average, the established confidence level, contrasting the P&L should had been generated if the portfolio had remained constant during the VaR’s forecast horizon. In the PVBP case, this is compared with the portfolios' sensitivity to market quotes. The obtained results had shown that the models are reliable. Also, with the purpose to reinforce the validation and verification of the risk factors, we design a selected set of matrices showing that risk factors' behavior are in line with the predominant financial market prices and consistent with the previous day values. Applicable portfolios: For a detail and accurate portfolio management, HSBC Mexico Market Risk Management Department, use the international standards (IAS) and local standards (local GAAP) to obtain an effective market risk management. The division between accounting schemes has strict control and every portfolio is perfectly well suited and identified in each accounting standard. This division allows calculating any market risk measure (sensitivity measures, potential loss measures and stress test) in sub portfolios in line with the accounting. The Market Risk management calculates the VaR and the PVBP for the total Bank portfolio and for the specific “Accrual” and “Trading Desk” portfolios. The VaR is calculated for each one of the mentioned portfolios and is also itemized by risk factors (Interest Rates, Exchange Rates, Interest Rates volatilities, FX volatilities, Credit Spread and Equities). The PVBP risk is presented by interest rate and portfolio subdivision (Accrual and Trading Desk). The stress tests are carried out for the Bank’s portfolio and for the “Trading Desk” and “Accrual” portfolios. Besides a special stress test for Available for Sale Securities (AFS) and for Hedging Securities (CFH and FVH) is carried out. Quantitative Information Below, the market VaR and the Bank’s PVBP will be presented and their subdivisions in the “Trading Desk” and “Accrual” portfolios for the second quarter of 2013 (millions of dollars). The following VaR and PVBP limits belongs to the latest updating Limit Mandate of Market Risk previously approved both by the Board and for the Risk Committee.
Average 2Q13 Limits* Average 2Q13 Limits* Average 2Q13 Limits*
Combined 21.05 38.00 3.96 15.00 18.07 35.00 Interest Rate 16.15 40.00 3.07 N/A 13.45 38.00 Credit Spread 6.05 22.00 0.49 4.00 5.61 22.00 FX 0.58 5.00 0.58 5.00 N/A N/A Volatility IR 0.11 4.50 0.11 N/A 0.00 2.50 Volatility FX 0.02 2.00 0.02 2.00 N/A N/A Equities 0.07 2.50 0.07 2.50 N/A N/A
Bank Trading Intent Accrual
N/A = Not applicable
* Absolute Value
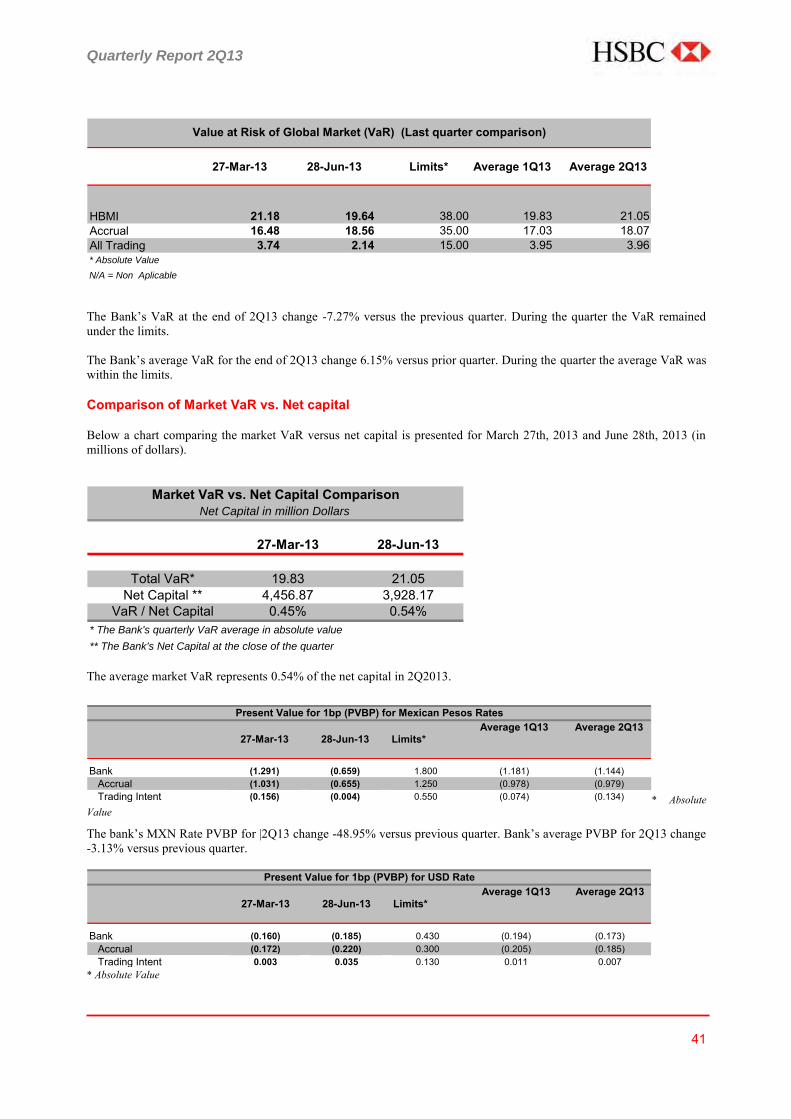
Quarterly Report 2Q13
41
27-Mar-13 28-Jun-13 Limits* Average 1Q13 Average 2Q13
21.18 19.64 38.00 19.83 21.05 16.48 18.56 35.00 17.03 18.07 3.74 2.14 15.00 3.95 3.96
* Absolute Value
N/A = Non Aplicable
HBMIAccrualAll Trading
Value at Risk of Global Market (VaR) (Last quarter comparison)
The Bank’s VaR at the end of 2Q13 change -7.27% versus the previous quarter. During the quarter the VaR remained under the limits. The Bank’s average VaR for the end of 2Q13 change 6.15% versus prior quarter. During the quarter the average VaR was within the limits. Comparison of Market VaR vs. Net capital Below a chart comparing the market VaR versus net capital is presented for March 27th, 2013 and June 28th, 2013 (in millions of dollars).
27-Mar-13 28-Jun-13
Total VaR* 19.83 21.05Net Capital ** 4,456.87 3,928.17
VaR / Net Capital 0.45% 0.54%* The Bank's quarterly VaR average in absolute value
** The Bank's Net Capital at the close of the quarter
Market VaR vs. Net Capital ComparisonNet Capital in million Dollars
The average market VaR represents 0.54% of the net capital in 2Q2013.
27-Mar-13 28-Jun-13 Limits*
Bank (1.291) (0.659) 1.800 (1.181) (1.144)Accrual (1.031) (0.655) 1.250 (0.978) (0.979)Trading Intent (0.156) (0.004) 0.550 (0.074) (0.134)
Present Value for 1bp (PVBP) for Mexican Pesos RatesAverage 1Q13 Average 2Q13
* Absolute Value
The bank’s MXN Rate PVBP for |2Q13 change -48.95% versus previous quarter. Bank’s average PVBP for 2Q13 change -3.13% versus previous quarter.
27-Mar-13 28-Jun-13 Limits*
Bank (0.160) (0.185) 0.430 (0.194) (0.173)Accrual (0.172) (0.220) 0.300 (0.205) (0.185)Trading Intent 0.003 0.035 0.130 0.011 0.007
Present Value for 1bp (PVBP) for USD RateAverage 1Q13 Average 2Q13
* Absolute Value
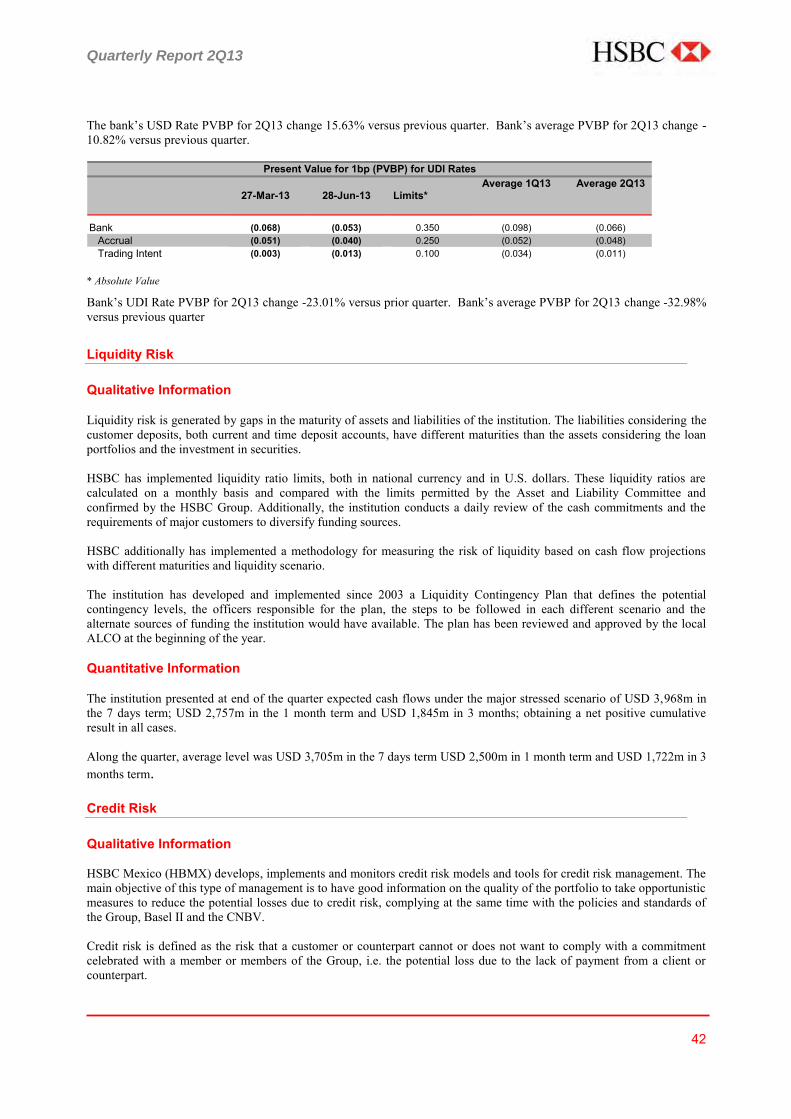
Quarterly Report 2Q13
42
The bank’s USD Rate PVBP for 2Q13 change 15.63% versus previous quarter. Bank’s average PVBP for 2Q13 change -10.82% versus previous quarter.
27-Mar-13 28-Jun-13 Limits*
Bank (0.068) (0.053) 0.350 (0.098) (0.066)Accrual (0.051) (0.040) 0.250 (0.052) (0.048)Trading Intent (0.003) (0.013) 0.100 (0.034) (0.011)
Present Value for 1bp (PVBP) for UDI RatesAverage 1Q13 Average 2Q13
* Absolute Value
Bank’s UDI Rate PVBP for 2Q13 change -23.01% versus prior quarter. Bank’s average PVBP for 2Q13 change -32.98% versus previous quarter
Liquidity Risk Qualitative Information Liquidity risk is generated by gaps in the maturity of assets and liabilities of the institution. The liabilities considering the customer deposits, both current and time deposit accounts, have different maturities than the assets considering the loan portfolios and the investment in securities. HSBC has implemented liquidity ratio limits, both in national currency and in U.S. dollars. These liquidity ratios are calculated on a monthly basis and compared with the limits permitted by the Asset and Liability Committee and confirmed by the HSBC Group. Additionally, the institution conducts a daily review of the cash commitments and the requirements of major customers to diversify funding sources. HSBC additionally has implemented a methodology for measuring the risk of liquidity based on cash flow projections with different maturities and liquidity scenario. The institution has developed and implemented since 2003 a Liquidity Contingency Plan that defines the potential contingency levels, the officers responsible for the plan, the steps to be followed in each different scenario and the alternate sources of funding the institution would have available. The plan has been reviewed and approved by the local ALCO at the beginning of the year. Quantitative Information The institution presented at end of the quarter expected cash flows under the major stressed scenario of USD 3,968m in the 7 days term; USD 2,757m in the 1 month term and USD 1,845m in 3 months; obtaining a net positive cumulative result in all cases. Along the quarter, average level was USD 3,705m in the 7 days term USD 2,500m in 1 month term and USD 1,722m in 3 months term. Credit Risk Qualitative Information HSBC Mexico (HBMX) develops, implements and monitors credit risk models and tools for credit risk management. The main objective of this type of management is to have good information on the quality of the portfolio to take opportunistic measures to reduce the potential losses due to credit risk, complying at the same time with the policies and standards of the Group, Basel II and the CNBV. Credit risk is defined as the risk that a customer or counterpart cannot or does not want to comply with a commitment celebrated with a member or members of the Group, i.e. the potential loss due to the lack of payment from a client or counterpart.
Quarterly Report 2Q13
43
For correct credit risk measurement, HSBC has credit risk measurement methodologies, as well as advanced information systems. In general, the methodologies separate the customer risk (probability that a customer will default to his/her payment commitments: Probability of Default) from the transaction risk (risk related with the structure of the credit, including principally the value and type of guarantees). In addition, HSBC Mexico has developed policies and procedures that include the different stages of the credit process: evaluation, authorization, origination, control, monitoring and recovery. Models and Systems used for the quantification and Credit Risk management Commercial Portfolio
1. Credit Risk Preventive Provisions HSBC Mexico adopted from June 2013 the new rules for estimating credit provisions that have been established by the CNBV in the "Disposiciones de carácter general aplicables a las instituciones de crédito" (Circular Única de Bancos, CUB), which set up an Expected Loss approach.
2. Internal Management Models Through an extensive methodological review process by HSBC Group experts, HSBC Mexico has different models for internal risk management, developed to encompass the three key parameters of Credit Risk:
1. Probability of default (PD) 2. Loss Given default (LGD) 3. Exposure at default (EAD)
These models are internally evaluated and monitored on a quarterly basis to assess their performing and their proper application, so as to carry out necessary adjustments in a timely manner. With respect to the Probability of default Model (PD), the monitoring intent to make sure that this model are still differentiating customers that comply with the acquired HSBC obligations of those who will not, ordering the customers by appropriate risk levels. In addition, the model quantification is validated by comparing with the observed default rates to know its accuracy. On the other hand, for the Exposure at default and Loss Given default Models, validates that the loss estimations in which the institution may be incurred in the event that the customer fails be more precise with a sufficient degree of conservatism. It is important to note that each models version is subject to the HSBC Group expert review and the approval process of this are attached to the standards established by the Group.
2.1. Probability of default Model (PD) HSBC Mexico has developed eight models for assessing the credit risk rating of the customers of Commercial Portfolio that are local Corporate or Corporate with annual sales up to MXN 7,000 M. These models were developed based on a statistical analysis of different economic activities that resulted in four major segments, which in turn were subdivided by annual turnover level, greater and less than MXN 100 M. In addition to the aforementioned models, HSBC Mexico has implemented the following global models that were developed by HSBC Group Head Office.
► A model for global customers to assess the corporate counterparties with annual sales equal or above to USD 700 M (GLCS).
► Another one to assess Bank Financial Institutions (RAfBanks).
► And eleven more, were implemented to assessing Non-Banking Financial Institutions (NBFI DST).
Quarterly Report 2Q13
44
The implementation of the abovementioned models was done along with the customers risk grading framework, known as Customer Risk Rating (CRR), which contemplates 23 levels, of which 2 are for customers in default. The framework includes a direct correspondence to Probabilities of Default and permits a more granular measurement of the customer’s credit quality. The Probability of Default models included in the internal rating system are monitored on a quarterly basis with the aim of examining their proper performance, and if the monitoring results are not as expected according to HSBC Group standards, some action plans are taken to meet the established guidelines. In the latest monitoring results for models of the Commercial Portfolio, excluding global models, there is generally a good statistical performance with an AR (Accuracy Ratio) of 0.55, which is above the threshold set by the HSBC Group. The rest of the global models, GLCS, RAfBanks y NBFI DST, are associated to low default portfolios, so it is not currently possible to measure their performance, but a monitoring is performed on their Overrides. It is relevant to mention that these models present an override rate slightly over the desired limits; however, it is not required to implement corrective actions due to the acceptable behaviour of the models in the follow-up analyses. Currently some improvements are being made to the models developed by HSBC México for the Commercial Portfolio, considering the most recent information to improve their accuracy.
2.2. Loss Given default Model (LGD) Regarding to the Loss Given Default (LGD) estimation, which represents the economic loss as a percentage of the Exposure at Default that HSBC Mexico will face at the time a customer defaults, HSBC Mexico developed a local model for assessing the Middle Market Enterprises and Corporate customers. In addition, for Bank Financial Institutions HSBC Mexico has implemented a model developed by Group HSBC Head Office. During 2013, we will include improvements to LGD model to provide greater granularity and accuracy, which have been revised against the standards that HSBC Group has determined for LGD models. The most recent monitoring shows a 55% of correlation between the observed and estimated LGD. It is expected that after the improvements implementation to the model, this correlation increases.
2.3. Exposure at default Model (EAD) For Exposure at Default (EaD) estimation, HSBC México also developed a model for Middle Market Enterprises and Corporate customers. Besides the Exposure at Default estimation for Banking Financial Institutions is based on the guidelines established by the Group HSBC. With the purpose to get a more accurate measurement of risk, the Exposure at default model was modified in 2012, and it is currently being evaluated under the Standards that HSBC Group has determined, to be subsequently updated in computing systems. The latest quarterly monitoring performance of this model shows a satisfactory correlation (over 50%) between the values of the observed and estimated EaD.
3. Credit Evaluation Systems In order to establish a better infrastructure management and risk measurement for the Commercial Portfolio, HSBC Mexico used a risk evaluation tool called Moody´s Risk Analyst (RA), which allows an assessment of the credit quality of customers based on its financial and qualitative information. Furthermore, HSBC Mexico has a system used at global level to manage, control and monitoring the commercial credit approval process known as Credit Application and Risk Management (CARM) through the major of the cases are approved. With this system the status of a credit application can be consulted in any stage of the credit process. Also, the minor of the cases continue to be approved by Workflow Authorization (SIPAC), this system will be replaced by CARM at the end of this year.
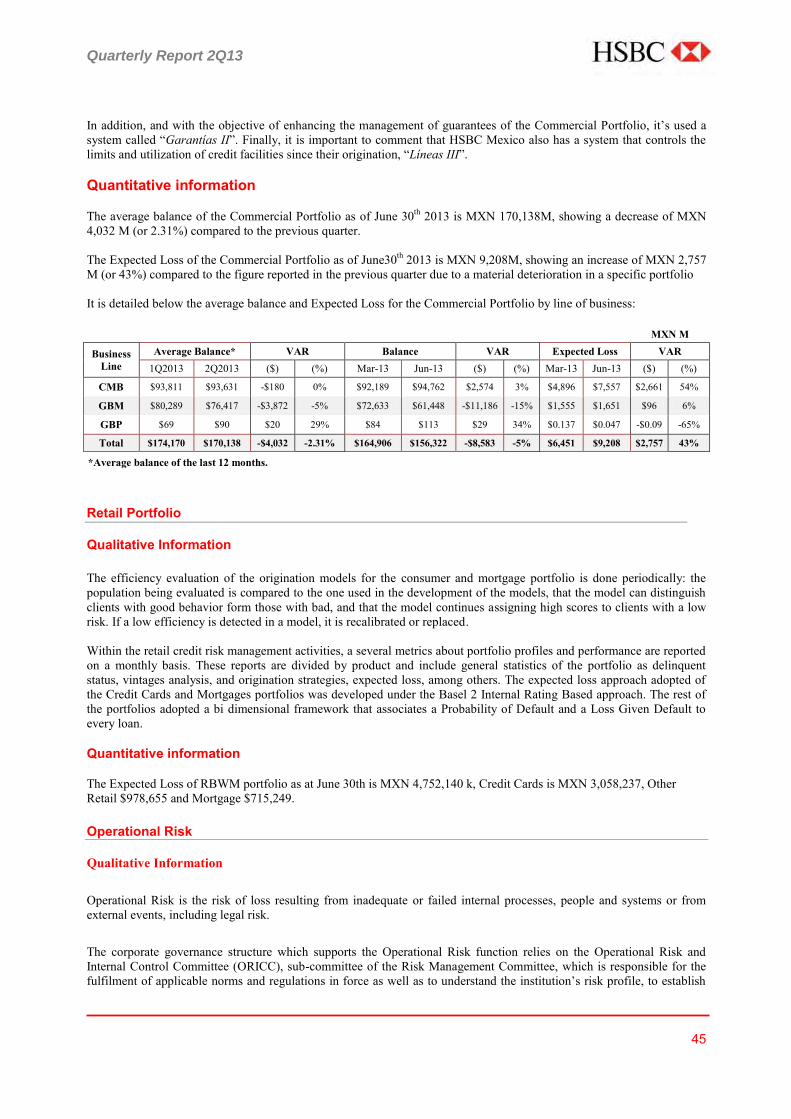
Quarterly Report 2Q13
45
In addition, and with the objective of enhancing the management of guarantees of the Commercial Portfolio, it’s used a system called “Garantías II”. Finally, it is important to comment that HSBC Mexico also has a system that controls the limits and utilization of credit facilities since their origination, “Líneas III”. Quantitative information The average balance of the Commercial Portfolio as of June 30th 2013 is MXN 170,138M, showing a decrease of MXN 4,032 M (or 2.31%) compared to the previous quarter. The Expected Loss of the Commercial Portfolio as of June30th 2013 is MXN 9,208M, showing an increase of MXN 2,757 M (or 43%) compared to the figure reported in the previous quarter due to a material deterioration in a specific portfolio It is detailed below the average balance and Expected Loss for the Commercial Portfolio by line of business:
MXN M
Business Line
Average Balance* VAR Balance VAR Expected Loss VAR 1Q2013 2Q2013 ($) (%) Mar-13 Jun-13 ($) (%) Mar-13 Jun-13 ($) (%)
CMB $93,811 $93,631 -$180 0% $92,189 $94,762 $2,574 3% $4,896 $7,557 $2,661 54%
GBM $80,289 $76,417 -$3,872 -5% $72,633 $61,448 -$11,186 -15% $1,555 $1,651 $96 6%
GBP $69 $90 $20 29% $84 $113 $29 34% $0.137 $0.047 -$0.09 -65%
Total $174,170 $170,138 -$4,032 -2.31% $164,906 $156,322 -$8,583 -5% $6,451 $9,208 $2,757 43%
*Average balance of the last 12 months. Retail Portfolio Qualitative Information The efficiency evaluation of the origination models for the consumer and mortgage portfolio is done periodically: the population being evaluated is compared to the one used in the development of the models, that the model can distinguish clients with good behavior form those with bad, and that the model continues assigning high scores to clients with a low risk. If a low efficiency is detected in a model, it is recalibrated or replaced. Within the retail credit risk management activities, a several metrics about portfolio profiles and performance are reported on a monthly basis. These reports are divided by product and include general statistics of the portfolio as delinquent status, vintages analysis, and origination strategies, expected loss, among others. The expected loss approach adopted of the Credit Cards and Mortgages portfolios was developed under the Basel 2 Internal Rating Based approach. The rest of the portfolios adopted a bi dimensional framework that associates a Probability of Default and a Loss Given Default to every loan. Quantitative information The Expected Loss of RBWM portfolio as at June 30th is MXN 4,752,140 k, Credit Cards is MXN 3,058,237, Other Retail $978,655 and Mortgage $715,249. Operational Risk Qualitative Information Operational Risk is the risk of loss resulting from inadequate or failed internal processes, people and systems or from external events, including legal risk. The corporate governance structure which supports the Operational Risk function relies on the Operational Risk and Internal Control Committee (ORICC), sub-committee of the Risk Management Committee, which is responsible for the fulfilment of applicable norms and regulations in force as well as to understand the institution’s risk profile, to establish
Quarterly Report 2Q13
46
risk management priorities, assess the strategies and mitigation plans and monitor the evolution of operational risks’ behaviour and their mitigants. A well-established and maintained internal control structure is vital to the success of all operations. Group methodology stipulates that all management within the Group is accountable for identifying, assessing and managing the broad spectrum of risks to which the Group is subject. The Group adopts a ‘Three Lines of Defence’ model to ensure that the risks and controls are properly managed by Global Businesses, Global Functions and HTS on an on-going basis. The model delineates management accountabilities and responsibilities over risk management and the control environment. The ‘Three Lines of Defence’ model should be applied with common sense and takes account of the Group’s business and functional structures. First Line of Defence: The First Line of Defence comprises predominantly management of Global Businesses and HTS who are accountable and responsible for their day to day activities, processes and controls. The First Line of Defence must ensure all key risks within their activities and operations are identified, mitigated and monitored by an appropriate control environment that is commensurate with risk appetite. It is the responsibility of management to establish their own control teams where required to discharge these accountabilities. Second Line of Defence: The Second Line comprises predominantly the Global Functions whose role is to ensure that the Group's Risk Appetite Statement is observed. They are responsible for:
► Providing assurance, oversight, and challenge over the effectiveness of the risk and control activities conducted by
the First Line ► Establishing frameworks to identify and measure the risks being taken by their respective parts of the business ► Monitoring the performance of the key risks, through the key indicators and oversight/assurance programmes
against defined risk appetite and tolerance levels Global Functions must also maintain and monitor controls for which they are directly responsible. Third Line of Defence: Internal Audit provides independent assurance as to the effectiveness of the design, implementation and embedding of the risk management frameworks, as well as the management of the risks and controls by the First Line and control oversight by the Second Line. Use Test Use test is ongoing verification to gather evidence of compliance with the ORIC management framework within the business decision making process. It is also a formal practice referred to gathering evidence that the following facts are carried out continuously: ► The Top Management is aware and is involved in the management of operational risk. ► Operational risk management information is used for decision-making. ► The Operational risk management information quality is adequate to support the business decisions making. Senior management must inform to Local ORIC the results of their risks and controls assessment as part of its decision-making process, and these should be reflected in the reports of the entity.
Quarterly Report 2Q13
47
The heads of the areas (senior management), should for their Operational Risk and Internal Control Process oversight: ► Establish an adequate organizational structure with BRCMs Team (Business Risk and Control Managers) in order
to ensure effective coverage of all business and operations under their responsibility, ensuring that BRCMs Staff members are individuals with experience and skills suitable for the performance of their functions:
Identify and assess operational risks and controls as part of the decision making process (Use Test). Identify and report operational loss incidents.
BRCM teams are responsible, within their respective areas of the following: ► Define key operational risks and set minimum standards of control and indicators / meters suitable; ► Undertake supervision to verify the adequacy of the monitoring of administrative control (functional). When these
teams carry out supervision, ORIC can strengthen this work fulfilling its oversight responsibilities to avoid duplication of effort;
► Review and report key indicators and take the appropriate action when an area is operating or is under the risk of operating outside the established risk appetite;
ORIC team is responsible for ensuring compliance with the minimum standards. An 9th annual assessment exercise took place from March 2012 to March 2013 in order to identify and re-assess relevant operational risks and Controls throughout HSBC Mexico. The methodology applied in accordance to the Group’s Operational Risk Management Framework, specifies that all areas of the Group should conduct a Risk Assessment and Control (RCA) or a Questionnaire at least once a year. The methodology and Control Risk Assessment (RCA) replaced the ABCD approach identification and self-assessment of operational risk (RSA) and is applicable to all entities of HSBC. ORIC department is responsible to lead and coordinate the annual RCA process. The latest completed assessment took place from March 2012 to 2013. As part of this exercise, relevant identifiable risks were denominated, described and classified into fifthteen categories: Compliance, Fiduciary, Legal, Information, Accounting, Tax, External Fraud, Internal Fraud, People, Political, Physical, Business Continuity, Systems, Operations and Project. Quantitative Information (including Legal and Technological Risk) From the 9th Operational Risk assessment exercise carried out between 2012-2013, and with all changes and updates performed during 2Q13; there are 2,932 risks identified and assessed as relevant distributed as follows: 9.17% (269) A type, 21.11 % (919) B type, 45.19% (1,325) C type, and 24.52% (719) D type. The institution holds an Operational Risk historical database since 2007, in which operational losses incidents are registered. Furthermore, the loss reporting threshold for individualized losses is of USD 10,000, where minor events are aggregated in a single record. The Operational Risk appetite statement for the bank is USD 34.42M for Operational Losses plus USD 9.12M for CROLs, and is monthly monitored through the BSC presented at the Risk Management Committee. Year to date (30JUN13) total amount of Operational Losses in 2013, are USD 25.05M. Both event types are recorded in the ad-hoc corporate system platform specifically designed for the management of operational risk and record of operational losses. Technological Risk HSBC México Technology Services (HTS) area keeps a continuous technological risk assessment in adherence to the local laws and regulations and their internal policies, attending the baselines of the local authorities and group’s
Quarterly Report 2Q13
48
guidelines, between them, those related to the development of methodologies and installation of standard infrastructure, the above as stated on their Technology Functional Instruction Manual (IT FIM). Interlaced to their operation schemes, HTS also is aligned to the statements within another manual and procedures, between them, the Operations Functional Instruction Manual (OPS FIM), the above due HTS acts as the entity that supplies technology and services for all bank channels and their business lines. Inside their corporate governance framework, HSBC follow up the matters and requirements made for the local authority throughout their compliance area, where one of their main accountabilities is to keep a continuous review of the assessed risk as well as, the monitoring to comply with the local regulations. Major methods/methodologies used on the assessment of technological risk are:
I. Throughout agile, secure and reliable Governance structure, focused on maintain an adequate technological risk control and response capabilities for all bank services that are offered throughout the different distribution channels. Risk is managed at the higher level committees: HTS Steering Committee, Risk Management Committee (RMC), Operational Risk & Internal Control Committee (ORICC) and Operational Risk Management Group (ORMG).
II. Keeping updated and testing the different case scenarios analysed on their Businesses Continuity Plan (BCP)
and related Disaster Recovery Plan (DRP), for those events that require reinstate their operation on alternate sites.
III. Performing Risk Based Control Assessments (RCA).
IV. The management of Information Technology Projects using a group standard methodology called Risk
Based Project Management (RBPM), specifically in the domain for software development is the SDLC (Software Development Life Cycle).
V. Performing Risk Management activities with the active involvement of a specialized Business Risk and
Control Managers (BRCM’s), including but not limited to operational risk, Sarbanes Oxley (SOX), internal, external and regulatory audit management.
VI. Throughout metrics and dashboards as tools that allow the measurement of the main goals defined within the
strategic plans, which in overall refer to systems availability, the compliance on time and quality of major projects and budget, those measurements are reviewed on different forums and committees for decisions making.
Legal Risk To manage and mitigate legal risk, in terms of financial loss, penalties and / or reputational damage that has been given detailed attention to the following risks identified as typical of the legal function:
► Contractual Risk, which is the risk that the rights and/or obligations within a contractual relationship are defective, and includes: misrepresentation, documentation, unintended consequences, unintended breach, enforceability and external factors.
► Dispute Risk, which is made up of the risks that the Institution is subject to when it is involved in or managing a
potential or actual dispute, and includes: exposure and management of disputes.
► Legislative Risk, which is the risk that HSBC fails to adhere to the laws of the jurisdictions in which it operates, and includes: compliance with laws, compliance risk (the risk owner of this risk is Compliance’s department) and change of law.
► Non-Contractual Rights Risk, which is the risk that Institution’s assets are not properly owned or are infringed
by others or the infringement by an Institutional member of another party's rights, and includes: infringement, ownership rights and legal responsibility.
Quarterly Report 2Q13
49
Policies were designed to have controls and procedures to identify, measure and manage legal risk in order to avoid financial losses and operational errors. The risk mitigation is sought with the following controls:
► Contractual Risk Control Proper procedures are in place in order to assure that all the documents that generate a contractual relation to the Institution, have been reviewed by an internal or external lawyer, through the required documentation or standard contracts. All the contracts that are signed by a member of the Institution that contain restrictions that may affect the business must have the authorization of the Legal Counsel, according to the level required. Additionally, there are procedures in order to have regular reviews of the standard contracts to assure that those maintain the required clauses.
► Dispute Risk Control Robust procedures have been established in order to assure a proper response to the disputes against the institution and to defend those in an efficient way, being able to take actions in order to protect and maintain the institution´s rights, as well as communicating the status of the litigation cases to the Legal Head. Practices or procedures are properly documented and placed to ensure that responsability is not admitted involuntarily in dispute situations, and that responsibility is not inadvertently allowed inside and that can not be inferred from any internal correspondence or third parties. There are procedures and instructions in order to have an immediate notification to the Legal department if any litigation is eather threatened or commenced against the the institution or employees and the following actions regarding the demand.
Legislative Risk Control There are implemented procedures and documented practices for monitoring of any new law or proposed regulation, as well as any court case that arises from the need of changing a procedure and the current documentation in their respective jurisdiction or in other. With this action and together with Compliance are implemented the required regulatory changes in order to continue with the operation of the business according to the law.
Non Contractual Rights Control: There are established procedures in order to assure that the Legal department validates the use of Headquarters’ trademark, local trademarks, commercial advertising and author rights. The use of a mark by a third party is approved in advance by Marketing’s department and Headquarters’s Advertising and Marketing Communication and is documented by a written license agreement which will be issued by Legal Department. A procedure is established in order to have a previous validation of any use of trademarks or commercial advertising of a third party. The legal department takes care of all the artistic and literary work that has been generated by an employee or external supplier or through a posterior acquisition of the rights with the proper documentation. Legal department is involved in any social media activities and campaigns initiated by their business within their jurisdiction. Legal Headquarters approval is required for all social media activities. Regarding Legal Operational Controls, is based on the scheme of Three lines of defense, referred to in Operational Risk section, in order to ensure that risks and controls are properly managed through the exercise of first and second line of defense function. All the institution´s policies have been established as well as the procedures needed to comply with the Operational Risk and Internal Control requirements; audits have been done, as well as estimations of potential losses from adverse judicial resolutions in order to have a historical database with a root-cause analysis.

Quarterly Report 2Q13
50
► US regulatory and law enforcement investigations
In December 2012, HSBC Holdings plc (‘HSBC Holdings’), the Grupo Financiero HSBC S.A. de C.V.’s ultimate parent company, HSBC Bank USA, N.A. (‘HBUS’), and HSBC North America Holdings (‘HNAH’) entered into agreements to achieve a resolution with US and UK government agencies regarding past inadequate compliance with anti-money laundering (‘AML’), Bank Secrecy Act (BSA) and sanctions laws. Among other agreements, HSBC Holdings and HBUS entered into a five-year Deferred Prosecution Agreement (the ‘US DPA’) with the US Department of Justice (‘DOJ’), HSBC Holdings entered into a two-year Deferred Prosecution Agreement with the New York County District Attorney (‘DANY’), and HSBC Holdings consented to a cease and desist order with the Federal Reserve Board (‘FRB’). HSBC Holdings also entered into an Undertaking with the UK Financial Services Authority (now a Financial Conduct Authority (‘FCA’) Direction) to comply with certain forward-looking obligations with respect to anti-money laundering and sanctions requirements over a five-year term. In addition, HBUS entered into a monetary penalty consent order with the US Department of the Treasury’s Financial Crimes Enforcement Network (‘FinCEN’) and a separate monetary penalty order with the Office of the Comptroller of the Currency (‘OCC’). HBUS also entered into a separate consent order with the OCC requiring it to correct the circumstances and conditions as noted in the OCC’s then most recent report of examination, imposing certain restrictions on HBUS directly or indirectly acquiring control of, or holding an interest in, any new financial subsidiary, or commencing a new activity in its existing financial subsidiary, unless it receives prior approval from the OCC. HBUS entered into a separate consent order with the OCC requiring it to adopt an enterprise wide compliance program. Under these agreements, HSBC Holdings and HBUS will continue to cooperate fully with US and UK regulatory and law enforcement authorities and take further action to strengthen its compliance policies and procedures. Under its agreements with DOJ, the FCA, and the FRB, an independent corporate compliance monitor will evaluate the HSBC Group’s progress in implementing its obligations under the relevant agreements. Michael Cherkasky has been selected as the independent monitor, and, on 1 July, 2013, the United States District Court for the Eastern District of New York approved the US DPA and retained authority to oversee implementation of the same. If HSBC Holdings and HSBC Bank USA fulfil all of the requirements imposed by the US DPA, the DOJ’s charges against those entities will be dismissed at the end of the five-year period of that agreement. Similarly, if HSBC Holdings fulfils all of the requirements imposed by the DANY DPA, DANY’s charges against it will be dismissed at the end of the two-year period of that agreement. The DoJ may prosecute HSBC Holdings or HSBC Bank USA in relation to the matters which are the subject of the US DPA if HSBC Holdings or HSBC Bank USA breaches the terms of the US DPA, and DANY may prosecute HSBC Holdings in relation to the matters which are subject of the DANY DPA if HSBC Holdings violates the terms of the DANY DPA. Under these agreements, HSBC Holdings has certain obligations to ensure that entities in the HSBC Group, including the Grupo Financiero HSBC, S.A. de C.V. and its subsidiaries, comply with certain requirements. Steps continue to be taken to implement ongoing obligations under the US DPA, FCA direction, and other settlement agreements, including obligations imposed by relevant authorities in Mexico. The settlement with U.S. and U.K. authorities does not preclude private litigation relating to, among other things, the HSBC Group’s compliance with applicable AML/ BSA and sanctions laws or other regulatory or law enforcement actions for AML/BSA or sanctions matters not covered by the various agreements.
Corporate Sustainability (CSR) We strongly believe that being a sustainable bank involves several commitments in our daily act, from a business perspective; sustainability primarily involves a long-term profitable growth, based on a relationship of trust between our institution and our customers. From the Sustainable perspective, implies to reduce as much as possible the environmental impact of our operations and contribute to our community by supporting programs and projects promoting better education, environment and community integration. Sustainability is achieved through 3 pillars:
1. Economic: alignment with the Ecuador principles and considering the environmental impact of the Group's investments.
2. Environmental: Controlling our carbon footprint and promoting a sustainable culture within our organization.

Quarterly Report 2Q13
51
3. Social: Supporting education, community and environmental projects promoting the positive development of the communities where we operate and to actively involve our employees in volunteer activities. Globally, HSBC's policy is to invest 0.5% of its pre-tax profits to social projects in the communities where it operates.
2013 will be a challenging year for the business and the consolidation of our Community Investment and our flagship projects, which are as follows: Education:
“Just raise your hand”, a partnership with Ara and Lazos foundations looking to improve the quality of education and prevent dropout in elementary schools with limited resources.
English Programme, The aim is to offer high quality English courses to students and teachers and improve their work and development opportunities through the alliance with The British Council and Global English.
Financial Education, to promote financial education among Mexican population, regardless the life stage on which they are.
Community: “Sumando Valor” inclusion programme to hire people with disabilities. Woman empowerment programme, aimimg to enhance personal development
Environment “HSBC Seguros Green Project” and “Cuida tu Ambiente”, a project aiming to create an employee
environmental task force. HSBC Water Programme, 5 year Global programme with an investment of USD 100M in alliance with
Earthwatch, Water Aid and WWF Our Community Investment fund comes from our profit before taxes and customer contributions. During 1H 2013, we invested $28.13 million pesos, 67% of such investment was made by HSBC. 1. Climate Business (Sustainable Finance) Corporate Sustainability continues working together with CMB and GBM, in the strategy for Climate Business, putting together the main stakeholders and coordinating progress. The CMB workplan has been defined with focus on specific segments (Large Corporate Finance, Real Estate, Municipality & States and MME), providing the required training to properly identify Climate Business opportunities and potential customers, following up and communicating success deals and consolidating income. To support the business model and providing guidance towards specific business opportunities, Corporate Sustainability translated and circulated 4 technology briefings, including alternative sources of finance, electric and hybrid vehicles, solar technology, biomass and waste to energy generation. The current pipeline of Climate Business projects includes: a wind farm development, the production of biodiesel with palm oil, a biomass project and energy efficiency equipment. 2. Sustainable Operations During the 2Q 2013, Corporate Sustainability coordinated the HTS Sustainability Committee, chaired by HBMX COO & Deputy CEO, the Committee has the participation of Corporate Real Estate, Procurement, ITO, Sustainable Leaders and Corporate Sustainability. As part of the Committee, an update of the sustainable operations metrics for 2013 was presented, with positive results in energy consumption, disposed waste, paper consumption and sustainable engagement. Specific projects aiming to reduce the environmental direct impact derived from the bank’s operation are been tracked. CS has been actively involved in the Integrated Waste Management, a program evolving form a Climate Champions initiative called “Reciclar es Ayudar” aiming to segregate the waste generated in HSBC corporate buildings, sell it to recycling companies and donate the income to charity. The program has generated approximately US $40k during this year, 48% of 2013 target. The renewable energy strategy was reviewed during the last committee. Mexico was selected for a first approach of the renewable energy consumption, having Ernest & Young conducting the Global assessment. CRE, together with JLL will
Quarterly Report 2Q13
52
be sending information to E&Y for the Business Case. CRE MX has been contacted by some player in the “Green Market”, including hydro, wind and solar projects. LEED Platinum Certification event: The unveiling of the plate took place on 9th April and it was chaired by Sean O’Sullivan. The tower was the first building in Latin America to obtain both LEED certifications: Construction and Operation & Maintenance. 3. Communication During this quarter, the Corporate Sustainability Department gained 28 free press releases with an estimated value of $151,213 USD. Volunteering Campaign The LAM volunteering campaign was launched with the support of HR. The campaign was coordinated by HBMX and it was launched simultaneously in LAM. Up to date, we could count the number of clicks we got on 2 weekly newsletters: Comunica 16 may: 806 Comunica 30 may: 778 Total: 1,584 clicks Since the launch, 69 employees registered themselves for the volunteering activities; some of them have already started participating. Sustainability Report 2012- We launched the Corporate Sustainability Report 2012. We distributed 500 hard copies and shared it on the intranet, internet and with specialized media. Additionally we developed a digital APP downloadable for free on the Itunes store. 4. Community Investment – Volunteering On January we started the volunteer activities through the Toy Drive campaign. We successfully collected toys for 9, 805 children in 41 cities. 841 volunteers participated in different activities, donating 5,180 hours. During this quarter, we had a participation of 1,114 volunteers, donating 7,015 hours distributed in Education, Environment and Community activities. 5. Community Investment – Education Programme HSBC – Lazos “Just raise your hand” For the school year 2012 – 2013, our goals are to benefit 2,114 more underserved students through scholarship sponsors, add 9 new schools and raise $2,296,000 pesos in a customer fundraising campaign in branches. We are aiming for a social investment of more than $50,000,000 pesos at the end of this school year. During 2Q 2013 “Sólo levanta la mano” sponsorship campaign is ongoing, with a target of 2 sponsors per branch for a total of 2082 sponsorships. To date the target has a 42% completion thanks to RBWM engagement and support. The target will be accomplished by July 2013. The infrastructure improvements of this phase of the program are ongoing, with consluded works in more than 50% of the schools. On June, the first inauguration event of the infrastructure improvements took place in the school located in Cancun, where we had the presence of the Divisional Head and HSBC volunteers. Our colleagues delivered school kits to all the students during the event.
Quarterly Report 2Q13
53
Ver Bien Para Aprender Mejor (See Better, Learn Better) The programme is administered jointly with the association “Ver Bien para Aprender Mejor”, together with the Ministry of Public Education and offers top-quality corrective glasses for children in public primary and secondary schools who have been diagnosed with vision problems like nearsightedness, astigmatism and farsightedness. “Ver Bien para Aprender Mejor” has started to work together with our flagship education programme “Sólo levanta la mano” (Just Raise Your Hand) during the school year 2012 – 2013, through this we will enhance the quality of education in our schools by benefiting our children in a much more integral way. Future First For the bid cycle of 2013, we proposed two SOS and five NON SOS projects that will benefit 1,299 disadvantaged children and young people by providing them with access to education and life skills training, thereby enabling them to become positive and productive assets of society. And we will look to engage local staff through volunteer activities. Nevertheless, the Future First Committee will have to send their approval. On April, we carried an activity with HSBC employees in order to give a day of joy and happiness to children benefited by the NGO EDNICA, which is an NGO supported by Future First. Mas allá del dinero (More than Money) 62 volunteers were trained in order to teach financial education and promote a culture of financial education in communities where we operate. Through this, we will reach 10 elementary schools of Mexico City and State of Mexico, benefiting an estimated of 4,200 students who will learn the basic concepts of business and economics and how education is relevant to the workplace. Sumando Valor- Social Inclusion In alliance between Corporate Sustainability and Human Resources, HBMX is hiring people with disabilities through Manpower Foundation A.C., FHADI I.A.P., Colabore A.C. and Teletón Foundation. At the moment, 58 candidates have been hired. The fourth Intensive Course for people with disabilities took place successfully and 13 people graduated with the presence of HR, RBWM, representatives of the NGO’s and DIF. Wheelchair donations: An integration activity for Credit Cards (TDC) area was organized where 25 people “built” 10 wheelchairs and donated them to people in need. The outcome was to donate another 10 chairs by the end of the year through “Programa + Puntos”. In June we organized an activity for HR for the closing of the Advanced Leadership Core Programme, where approximately 60 Sub-directors assisted to Grupo Altía and in groups they “built” 10 wheelchairs and donated them to people in need. Finally, through “Aprende con HSBC” another 10 wheelchairs were donated. English Programme The aim is to offer high quality English courses to students and teachers and improve their work and development opportunities through the alliance with two different organizations: The British Council: The pilot group of 363 master teachers was trained and has finished cascading the course, reaching 11,000 teachers who will reach 550,000 students. Global English: (On-line software): 13, 894users have begun using the software and in total, they have completed 90,298 hours training. Based on total year investment, this has a cost of means a cost $ 3.3 USD per hour. Financial Education Financial Education: Through our alliance with Universidad del Valle de México on the 19th February we launched the Degree on Financial and Banking Business. This adds up to our efforts to consolidate financial education in different sectors of society.

Quarterly Report 2Q13
54
Additionally, we will offer 15 conferences by Gianco Abundiz which will be delivered to employees, clients and students of Universidad del Valle de México. 6 conferences with UVM have already been given and we are coordinating with HR the first conference for employees. We have started planning the National Week for Financial Education (SNEF) together with the Mexican Banks Association, which will take place in October. Aprende con HSBC 19 wives of Business Heads taught financial education to 250 primary school kids in 6 schools. Also, 160 students were benefited by receiving glasses to improve their learning and performance. At the end all the schools were taken to the Interactive Economy Museum (MIDE) as closure of the programme. In addition, we carried out wheelchair donation (mentioned above) and story-telling sessions at the Federico Gomez Hospital, at IPPLIP (primary school for deaf children) and at Santa Martha’s female prison. MUJERes fuerza (Women Empowerment in rural communities) After the first 8 months of working with NEMI and Social Value for our flagship community programme for the empowerment of women, we are proud to share the first results. The objective of the programme is to develop actions to promote the empowerment of women living in poverty, seeking to encourage self-management capacities in order to improve their condition and quality of life. The beneficiaries of the programme are committed and inclusive women with leadership skills. The empowerment of these women is achieved by working closely with them through seminars, conferences and different dynamics and topics such as: diagnosing the community, self-esteem, self-management, gender construction, communication, sustainable family, financial education and leadership. We have worked in 3 states (Edo. De México, Hidalgo and Morelos) and 12 municipalities. Up to date 754 women have been directly benefited by the programme and 5,438 indirectly. 6. Community Investment - Environment Water Programme Engaging Activities On April 10th we held an event in Cancun to announce the HSBC Water Programme support to preserve the mayan aquifer through “Amigos de Sian Ka’an”. Media, government, and NGO’s were present during the event. This support was announced by Miguel Laporta, Head of Corporate Sustainability HSBC Mexico and Gonzalo Merediz, Executive Director Amigos de Sian Ka’an. The HSBC Water Programme will support the implementation of state of the art research technologies, the development of a water conservation culture in local communities, promotion of public policies related to waste water treatment, and protection of the tropical forest relevant for the aquifer recharge More than 10 volunteers, who helped in the restoration of water investigation facilities in the natural reserve of Sian Ka’an, participated in the event. One of the volunteers explained the activities on which they are supporting the project. H2O, a short film related to water scarcity awareness, also supported by HBMX, was presented as part of the event. There was important media coverage with 12 press releases During May, HBMX had the first two groups of CSL's trained in Xochimilco. Both groups were integrated by former Climate Champions, the Business and Corporate Sustainability, we are pleased to have the sponsorship of Victor Malvaez, Divisional Head of RBWM. The trainings included a trip in a motorized “trajinera” (a traditional Xochimilco boat) to the “chinampa”, a plot of land traditionally destined to agriculture since prehispanic times. The sessions included Earthwatch presentations about the programme and the water challenge, followed by the presentation of the Xoxhimilco project by REDES. Teams of 4 got into smaller “trajineras” for sampling and measuring water quality and birds and insect watching. Both teams left Cuemanco with a true understanding of the water challenge, the local project and really engaged with the future activities of the HSBC Water Programme. “HSBC Cuida tu Ambiente” Programme Thanks to the leadership of the environmental leaders of the program "HSBC Cuida Tu Ambiente" (HSBC Taking Care of the Environment), have been in charge of leading the rehabilitation in “Bosque de Chapultepec”, where about 30% of

Quarterly Report 2Q13
55
Mexico City water supply is distributed and at El Nido, place where endangered species are saved from extinction, both supported by HSBC. At the moment we have had 1,269 participants in 15 activities, including the environmental leaders volunteers + family members. Environmental Month On June, HSBC Mexico carried on several activities in benefit of the environment: Reforestation in the Nevado de Toluca, State of Mexico Sustainability Fair in 5 different HSBC buildings located at Mexico City and the States of Mexico, Jalisco and Nuevo León. Environmental Courses for HSBC volunteers and their family members. All of this activities were lead and carried by members of “HSBC Cuida tu Ambiente” Programme – Citizens Scientist Leaders in alliance with NGO partners supported by HSBC. Thanks to this we manage to achieve valuable results, such as: • 4,654 participants • 6,000 trees planted • 8 conferences for HSBC employees about environmental topics, such as ecotechnics, best practices at home and work, among others. • 15 Environmental Courses 7. Clients Contribution The first campaign of the year, in benefit of our education flagship programme “Just raise your hand” concluded on April, currently we are in the second campaign in benefit of “Becalos”, initiative aligned with the Mexican Banks Association. As of June we have raised $5.9 million pesos. As part of “Just raise your hand” a customer fundraising campaign in branches was executed from February 18 th to March 22th with a total fundraising of $3,335,004.93 pesos. 8. Conclusions During 1H 2013 we continue to focus our Community Investment by strengthening our flagship programs; this has helped us develop further our stakeholder engagement. Thanks to these campaigns that involve not only our staff, but also our clients, we are being able to provide an added value to our customers, giving them the option of participating in socially responsible and environmentally friendly projects. HSBC Mexico seeks to maintain a balance between environment, society and profits by establishing long term relationships with our customers. We are certain this will ensure our success in the long term.
Contacts
Media enquiries: Investor Relations:
London: Patrick Humphris London: Guy Lewis Tel: +44 (0)20 7992 1631 Tel: +44 (0)20 7992 1938 Mexico City: Lyssette Bravo Mexico City: Andrea Colín Tel: +52 (55) 5721 2888 Tel: +52 (55) 5721 3001

Quarterly Report 2Q13
56
Annex A Table I 30 Jun 2013 Referencia Common equity Tier 1 capital
1
Ordinary shares graded for Common equity TIER 1 capital and related surplus
32,768.5
2 Retained earnings 1,359.8 3 Accumulated other comprehensive income (and other reserves) 12,306.7 4
Total Common Equity Tier 1 capital attributable to parent company common shareholders
NA
5 Total minority interest given recognition in Common Equity Tier 1 capital NA 6 Total group Common Equity Tier 1 capital prior to regulatory adjustments 46,435.1
Total group Common Equity Tier 1 capital: regulatory
adjustments
7 Prudential valuation adjustments NA 8 Goodwill, net of related deferred tax liability - 9
Intangibles other than mortgage servicing rights, (net of related deferred tax liability)
874.9
10 Deferred tax assets (excluding temporary differences only), net of related deferred tax liabilities
11 gains and losses on derivatives held as cash flow hedges - 12 actuarial reserve - 13 Securitisation gain on sale (expected future margin income) - 14
Cumulative gains and losses due to changes in own credit risk on fair valued liabilities
NA
15 Defined benefit pension fund assets - 16 Investments in own shares - 17 Reciprocal cross holdings in common equity - 18
Investments in the capital of financial entities where the bank does not own more than 10% of the issued common share capital (amount above the 10% threshold)
6.3
19 Significant investments in the common stock of financial entities (amount above 10% threshold)
-
20 Mortgage servicing rights (amount above 10% threshold) 21
Deferred tax assets arising from temporary differences (amount above 10% threshold)
1,843.9
22 Amount exceeding the 15% threshold NA 23
which: Significant investments in the common stock of financial
entities amounting above 10% threshold
NA
24 which: Mortgage servicing rights NA 25 which: Deferred tax assets arising from temporary differences NA 26 Local regulatory adjustments 1,149.2
A which: Accumulated other comprehensive income (and other reserves) - B which: investments in subordinated debt 90.9 C
which: Profit or increase on the value of assets acquired on securitization positions (Institutions originators)
-
D which: Investments in multilateral organisms - E which: Investments in related companies - F which: Investments in risk capital - G which: Investments in Mutual funds 8.7 H which: own stock acquisition financing I which: Operations that infringe provisions J which: Deferred charges and prepaid expenses 1,049.6 K which: First Loss schemes positions -
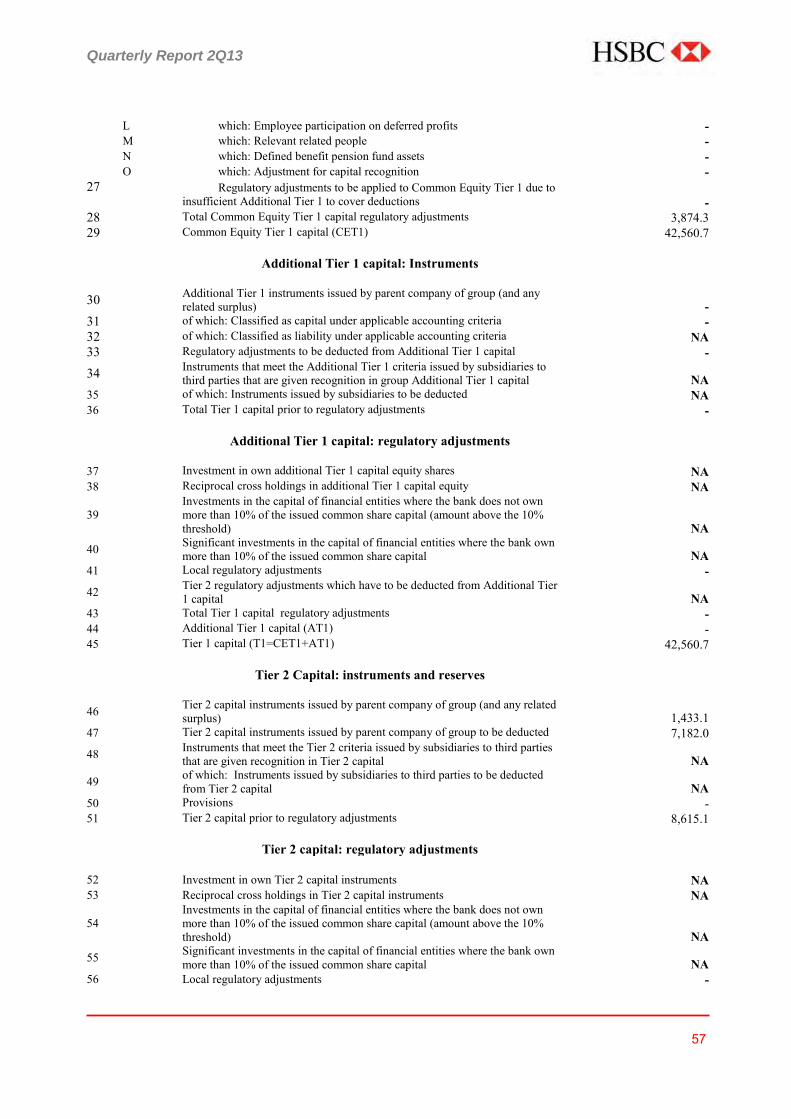
Quarterly Report 2Q13
57
L which: Employee participation on deferred profits - M which: Relevant related people - N which: Defined benefit pension fund assets - O which: Adjustment for capital recognition -
27
Regulatory adjustments to be applied to Common Equity Tier 1 due to insufficient Additional Tier 1 to cover deductions
-
28 Total Common Equity Tier 1 capital regulatory adjustments 3,874.3 29 Common Equity Tier 1 capital (CET1) 42,560.7 Additional Tier 1 capital: Instruments 30
Additional Tier 1 instruments issued by parent company of group (and any related surplus)
-
31 of which: Classified as capital under applicable accounting criteria - 32 of which: Classified as liability under applicable accounting criteria NA 33 Regulatory adjustments to be deducted from Additional Tier 1 capital - 34
Instruments that meet the Additional Tier 1 criteria issued by subsidiaries to third parties that are given recognition in group Additional Tier 1 capital
NA
35 of which: Instruments issued by subsidiaries to be deducted NA 36 Total Tier 1 capital prior to regulatory adjustments -
Additional Tier 1 capital: regulatory adjustments 37 Investment in own additional Tier 1 capital equity shares NA 38 Reciprocal cross holdings in additional Tier 1 capital equity NA
39
Investments in the capital of financial entities where the bank does not own more than 10% of the issued common share capital (amount above the 10% threshold)
NA
40 Significant investments in the capital of financial entities where the bank own more than 10% of the issued common share capital
NA
41 Local regulatory adjustments - 42
Tier 2 regulatory adjustments which have to be deducted from Additional Tier 1 capital
NA
43 Total Tier 1 capital regulatory adjustments - 44 Additional Tier 1 capital (AT1) - 45 Tier 1 capital (T1=CET1+AT1) 42,560.7
Tier 2 Capital: instruments and reserves 46
Tier 2 capital instruments issued by parent company of group (and any related surplus)
1,433.1
47 Tier 2 capital instruments issued by parent company of group to be deducted 7,182.0 48
Instruments that meet the Tier 2 criteria issued by subsidiaries to third parties that are given recognition in Tier 2 capital
NA
49 of which: Instruments issued by subsidiaries to third parties to be deducted from Tier 2 capital
NA
50 Provisions - 51 Tier 2 capital prior to regulatory adjustments 8,615.1
Tier 2 capital: regulatory adjustments 52 Investment in own Tier 2 capital instruments NA 53 Reciprocal cross holdings in Tier 2 capital instruments NA
54
Investments in the capital of financial entities where the bank does not own more than 10% of the issued common share capital (amount above the 10% threshold)
NA
55 Significant investments in the capital of financial entities where the bank own more than 10% of the issued common share capital
NA
56 Local regulatory adjustments -
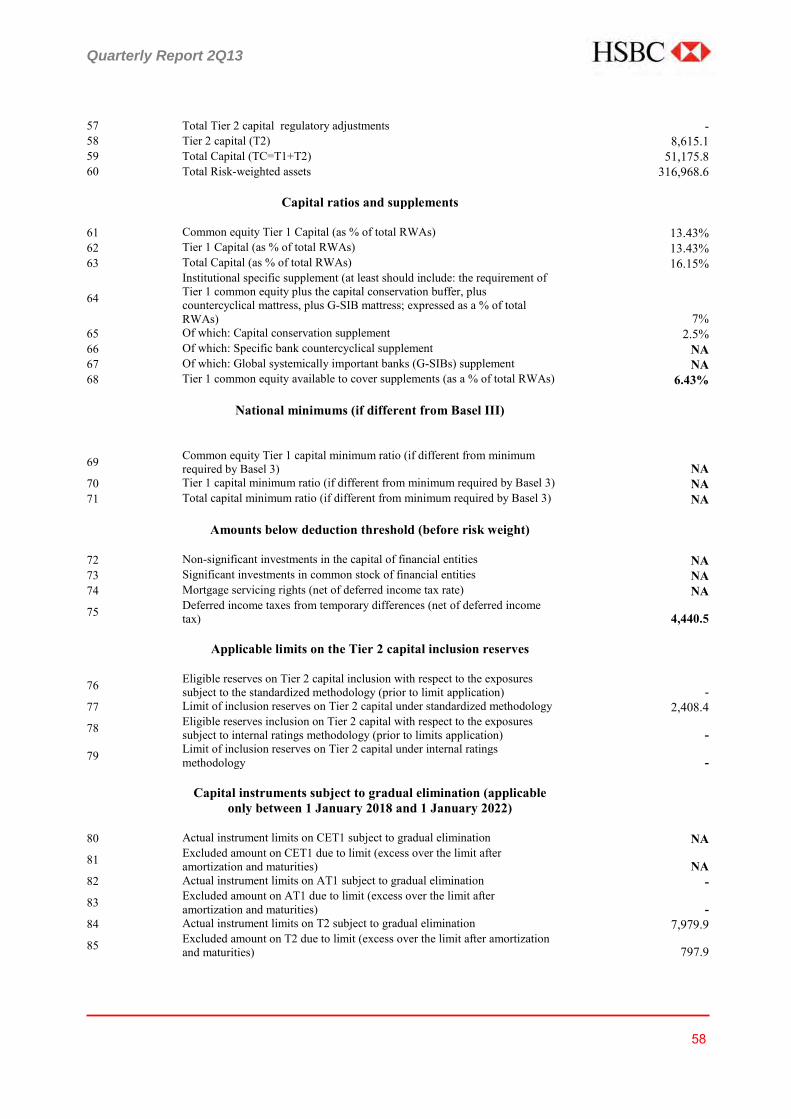
Quarterly Report 2Q13
58
57 Total Tier 2 capital regulatory adjustments - 58 Tier 2 capital (T2) 8,615.1 59 Total Capital (TC=T1+T2) 51,175.8 60 Total Risk-weighted assets 316,968.6
Capital ratios and supplements 61 Common equity Tier 1 Capital (as % of total RWAs) 13.43% 62 Tier 1 Capital (as % of total RWAs) 13.43% 63 Total Capital (as % of total RWAs) 16.15%
64
Institutional specific supplement (at least should include: the requirement of Tier 1 common equity plus the capital conservation buffer, plus countercyclical mattress, plus G-SIB mattress; expressed as a % of total RWAs)
7%
65 Of which: Capital conservation supplement 2.5% 66 Of which: Specific bank countercyclical supplement NA 67 Of which: Global systemically important banks (G-SIBs) supplement NA 68 Tier 1 common equity available to cover supplements (as a % of total RWAs) 6.43%
National minimums (if different from Basel III)
69
Common equity Tier 1 capital minimum ratio (if different from minimum required by Basel 3)
NA
70 Tier 1 capital minimum ratio (if different from minimum required by Basel 3) NA 71 Total capital minimum ratio (if different from minimum required by Basel 3) NA
Amounts below deduction threshold (before risk weight) 72 Non-significant investments in the capital of financial entities NA 73 Significant investments in common stock of financial entities NA 74 Mortgage servicing rights (net of deferred income tax rate) NA 75
Deferred income taxes from temporary differences (net of deferred income tax)
4,440.5
Applicable limits on the Tier 2 capital inclusion reserves
76
Eligible reserves on Tier 2 capital inclusion with respect to the exposures subject to the standardized methodology (prior to limit application)
-
77 Limit of inclusion reserves on Tier 2 capital under standardized methodology 2,408.4 78
Eligible reserves inclusion on Tier 2 capital with respect to the exposures subject to internal ratings methodology (prior to limits application)
-
79 Limit of inclusion reserves on Tier 2 capital under internal ratings methodology
-
Capital instruments subject to gradual elimination (applicable
only between 1 January 2018 and 1 January 2022)
80 Actual instrument limits on CET1 subject to gradual elimination NA 81
Excluded amount on CET1 due to limit (excess over the limit after amortization and maturities)
NA
82 Actual instrument limits on AT1 subject to gradual elimination - 83
Excluded amount on AT1 due to limit (excess over the limit after amortization and maturities)
-
84 Actual instrument limits on T2 subject to gradual elimination 7,979.9 85
Excluded amount on T2 due to limit (excess over the limit after amortization and maturities)
797.9
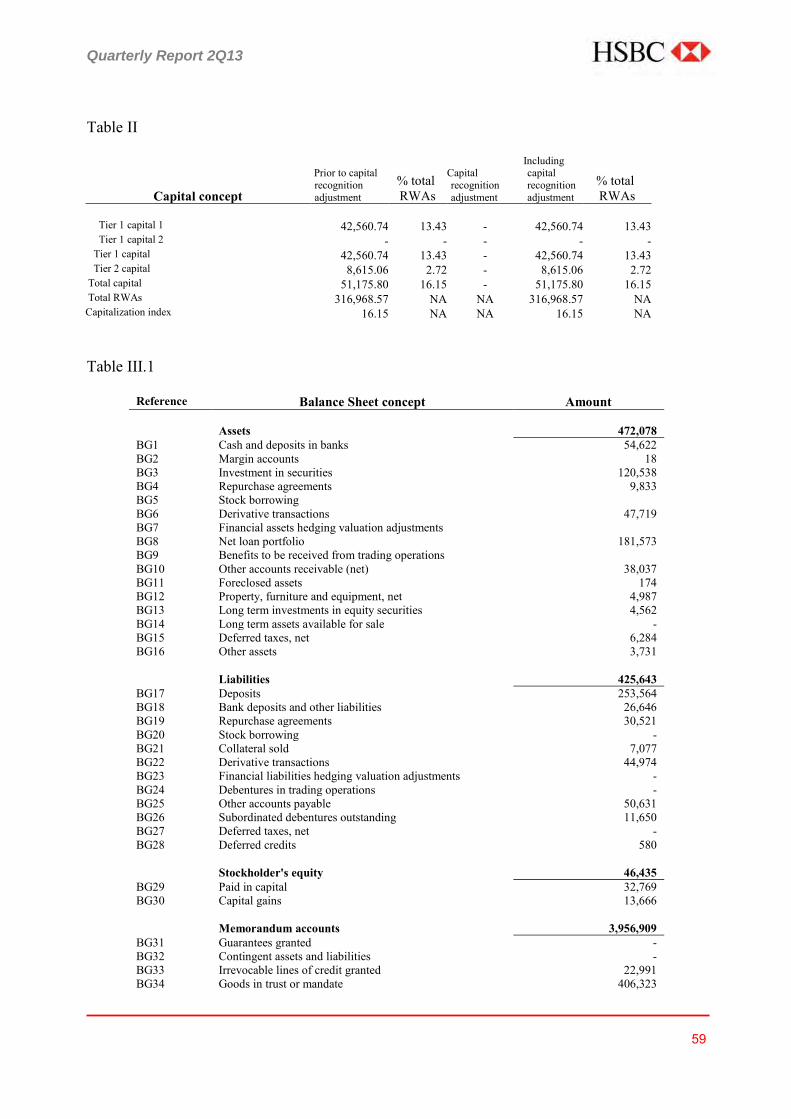
Quarterly Report 2Q13
59
Table II
Capital concept
Prior to capital recognition adjustment
% total RWAs
Capital recognition adjustment
Including capital recognition adjustment
% total RWAs
Tier 1 capital 1 42,560.74 13.43 - 42,560.74 13.43 Tier 1 capital 2 - - - - - Tier 1 capital 42,560.74 13.43 - 42,560.74 13.43 Tier 2 capital 8,615.06 2.72 - 8,615.06 2.72 Total capital 51,175.80 16.15 - 51,175.80 16.15 Total RWAs 316,968.57 NA NA 316,968.57 NA Capitalization index 16.15 NA NA 16.15 NA Table III.1
Reference Balance Sheet concept Amount Assets 472,078 BG1 Cash and deposits in banks 54,622 BG2 Margin accounts 18 BG3 Investment in securities 120,538 BG4 Repurchase agreements 9,833 BG5 Stock borrowing
BG6 Derivative transactions 47,719 BG7 Financial assets hedging valuation adjustments
BG8 Net loan portfolio 181,573 BG9 Benefits to be received from trading operations
BG10 Other accounts receivable (net) 38,037 BG11 Foreclosed assets 174 BG12 Property, furniture and equipment, net 4,987 BG13 Long term investments in equity securities 4,562 BG14 Long term assets available for sale - BG15 Deferred taxes, net 6,284 BG16 Other assets 3,731 Liabilities 425,643 BG17 Deposits 253,564 BG18 Bank deposits and other liabilities 26,646 BG19 Repurchase agreements 30,521 BG20 Stock borrowing - BG21 Collateral sold 7,077 BG22 Derivative transactions 44,974 BG23 Financial liabilities hedging valuation adjustments - BG24 Debentures in trading operations - BG25 Other accounts payable 50,631 BG26 Subordinated debentures outstanding 11,650 BG27 Deferred taxes, net - BG28 Deferred credits 580 Stockholder's equity 46,435 BG29 Paid in capital 32,769 BG30 Capital gains 13,666 Memorandum accounts 3,956,909 BG31 Guarantees granted - BG32 Contingent assets and liabilities - BG33 Irrevocable lines of credit granted 22,991 BG34 Goods in trust or mandate 406,323

Quarterly Report 2Q13
60
BG35 Federal government financial agent BG36 Goods in custody or under administration 291,983
BG37 Collateral received by the institution 23,022 BG38 Collateral received and sold or delivered as guarantee
16,017 BG39 Third party investment banking operations, net 46,332 BG40 Suspended interest on impaired loans
143 BG41 Other control accounts 3,150,098
Table III.2
Identifier
Regulatory concepts to be considered for the Net capital components calculation
Equity report
reference
Amount according to
the notes of the regulatory concepts
considered for Net capital calculation
Balance Sheet report
reference
Assets 1 Goodwill 8 - 2 Other intangible assets 9 874.9 BG16 3731 3 Deferred income tax from fiscal losses and credits 10 - 4 Benefits to be received from trading operations 13 - 5 Pension plan investments by defined benefits with
unrestricted and unlimited access 15 - 6 Own shares investments 16 - 7 Common equity reciprocal investments 17 - 8 Direct investment in the capital of financial entities
where the institution does not own more than 10% of issued share capital 18 -
9 Indirect investment in the capital of financial entities where the institution does not own more than 10% of issued share capital 18 6.3 BG13 4562
10 Direct investment in the capital of financial entities where the institution own more than 10% of issued share capital 19 -
11 Indirect investment in the capital of financial entities where the institution own more than 10% of issued share capital 19 -
12 Deferred income tax from temporary differences 21 1,843.9 BG15 6284 13 Recognized reserves as supplementary capital 50 - BG8 181573 14 Subordinated debt investment 26 - B 90.9 BG8 181573 15 Multilateral organisms investment 26 - D - 16 Related parties investments 26 - E - 17 Risk capital investment 26 - F - 18 Mutual funds investment 26 - G 8.7 BG13 4562 19 Own shares acquisition financing 26 - H - 20 Deferred charges and prepaid expenses 26 - J 1,049.6 BG16 3731 21 Employee participation in profit sharing (net) 26 - L - 22 Pension plan investments by defined benefits 26 - N - 23 Compensation chamber investment 26 - P - Liabilities 24 Deferred income tax associated to goodwill 8 - 25 Deferred income tax associated to other intangibles 9 - 26 Pension plan liabilities by defined benefits with
unrestricted and unlimited access 15 - 27 Deferred income tax associated to pension plan by 15 -
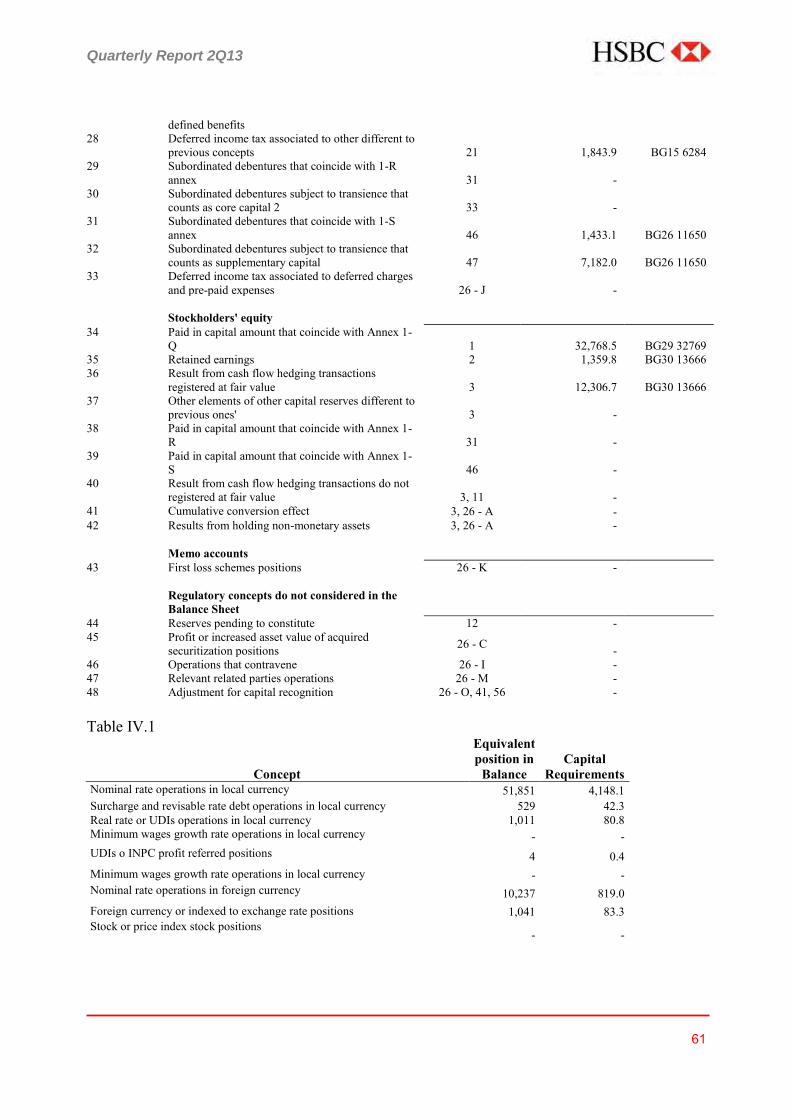
Quarterly Report 2Q13
61
defined benefits 28 Deferred income tax associated to other different to
previous concepts 21 1,843.9 BG15 6284 29 Subordinated debentures that coincide with 1-R
annex 31 - 30 Subordinated debentures subject to transience that
counts as core capital 2 33 - 31 Subordinated debentures that coincide with 1-S
annex 46 1,433.1 BG26 11650 32 Subordinated debentures subject to transience that
counts as supplementary capital 47 7,182.0 BG26 11650 33 Deferred income tax associated to deferred charges
and pre-paid expenses 26 - J - Stockholders' equity 34 Paid in capital amount that coincide with Annex 1-
Q 1 32,768.5 BG29 32769 35 Retained earnings 2 1,359.8 BG30 13666 36 Result from cash flow hedging transactions
registered at fair value 3 12,306.7 BG30 13666 37 Other elements of other capital reserves different to
previous ones' 3 - 38 Paid in capital amount that coincide with Annex 1-
R 31 - 39 Paid in capital amount that coincide with Annex 1-
S 46 - 40 Result from cash flow hedging transactions do not
registered at fair value 3, 11 - 41 Cumulative conversion effect 3, 26 - A - 42 Results from holding non-monetary assets 3, 26 - A - Memo accounts 43 First loss schemes positions 26 - K - Regulatory concepts do not considered in the
Balance Sheet 44 Reserves pending to constitute 12 - 45 Profit or increased asset value of acquired
securitization positions 26 - C - 46 Operations that contravene 26 - I - 47 Relevant related parties operations 26 - M - 48 Adjustment for capital recognition 26 - O, 41, 56 - Table IV.1
Concept
Equivalent position in
Balance Capital
Requirements Nominal rate operations in local currency 51,851 4,148.1 Surcharge and revisable rate debt operations in local currency 529 42.3 Real rate or UDIs operations in local currency 1,011 80.8 Minimum wages growth rate operations in local currency - - UDIs o INPC profit referred positions 4 0.4 Minimum wages growth rate operations in local currency - - Nominal rate operations in foreign currency 10,237 819.0 Foreign currency or indexed to exchange rate positions 1,041 83.3 Stock or price index stock positions
- -
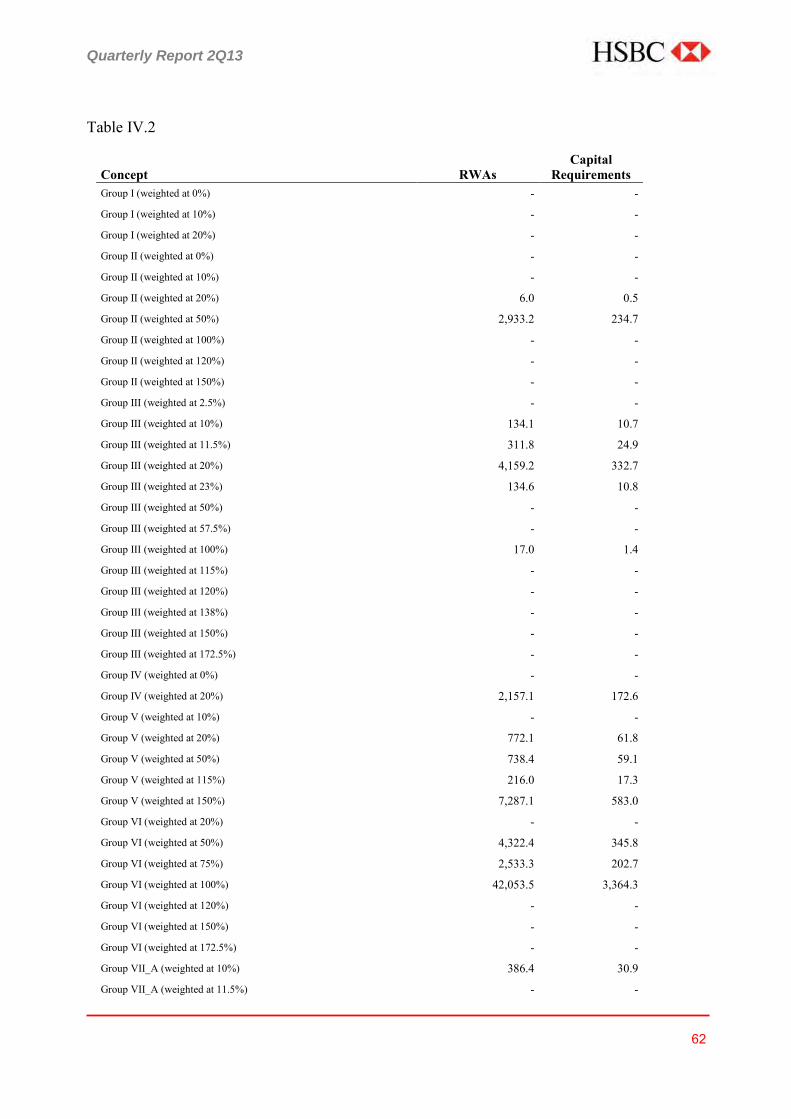
Quarterly Report 2Q13
62
Table IV.2
Concept RWAs Capital
Requirements Group I (weighted at 0%) - -
Group I (weighted at 10%) - -
Group I (weighted at 20%) - -
Group II (weighted at 0%) - -
Group II (weighted at 10%) - -
Group II (weighted at 20%) 6.0 0.5
Group II (weighted at 50%) 2,933.2 234.7
Group II (weighted at 100%) - -
Group II (weighted at 120%) - -
Group II (weighted at 150%) - -
Group III (weighted at 2.5%) - -
Group III (weighted at 10%) 134.1 10.7
Group III (weighted at 11.5%) 311.8 24.9
Group III (weighted at 20%) 4,159.2 332.7
Group III (weighted at 23%) 134.6 10.8
Group III (weighted at 50%) - -
Group III (weighted at 57.5%) - -
Group III (weighted at 100%) 17.0 1.4
Group III (weighted at 115%) - -
Group III (weighted at 120%) - -
Group III (weighted at 138%) - -
Group III (weighted at 150%) - -
Group III (weighted at 172.5%) - -
Group IV (weighted at 0%) - -
Group IV (weighted at 20%) 2,157.1 172.6
Group V (weighted at 10%) - -
Group V (weighted at 20%) 772.1 61.8
Group V (weighted at 50%) 738.4 59.1
Group V (weighted at 115%) 216.0 17.3
Group V (weighted at 150%) 7,287.1 583.0
Group VI (weighted at 20%) - -
Group VI (weighted at 50%) 4,322.4 345.8
Group VI (weighted at 75%) 2,533.3 202.7
Group VI (weighted at 100%) 42,053.5 3,364.3
Group VI (weighted at 120%) - -
Group VI (weighted at 150%) - -
Group VI (weighted at 172.5%) - -
Group VII_A (weighted at 10%) 386.4 30.9
Group VII_A (weighted at 11.5%) - -

Quarterly Report 2Q13
63
Group VII_A (weighted at 20%) 4,725.0 378.0
Group VII_A (weighted at 23%) 5,570.6 445.6
Group VII_A (weighted at 50%) 1,045.4 83.6
Group VII_A (weighted at 57.5%) - -
Group VII_A (weighted at 100%) 94,028.4 7,522.3
Group VII_A (weighted at 115%) 843.0 67.4
Group VII_A (weighted at 120%) - -
Group VII_A (weighted at 138%) - -
Group VII_A (weighted at 150%) 706.0 56.5
Group VII_A (weighted at 172.5%) - -
Group VII_B (weighted at 0%) - -
Group VII_B (weighted at 20%) - -
Group VII_B (weighted at 23%) - -
Group VII_B (weighted at 50%) - -
Group VII_B (weighted at 57.5%) - -
Group VII_B (weighted at 100%) 3,216.5 257.3
Group VII_B (weighted at 115%) - -
Group VII_B (weighted at 120%) - -
Group VII_B (weighted at 138%) - -
Group VII_B (weighted at 150%) - -
Group VII_B (weighted at 172.5%) - -
Group VIII (weighted at 125%) 5,232.3 418.6
Group IX (weighted at 100%) 24,335.4 1,946.8
Group IX (weighted at 115%) - -
Group X (weighted at 1250%) 1,161.3 92.9 Securitizations with Risk rating 1 (weighted at 20%) 108.8 8.7 Securitizations with Risk rating 2 (weighted at 50%) - - Securitizations with Risk rating 3 (weighted at 100%) - - Securitizations with Risk rating 4 (weighted at 350%) - - Securitizations with Risk rating 4, 5, 6 or not classified
374.0 29.92 (weighted at 1250%)
Resecuritizations with Risk rating 1 (weighted at 40%) - - Resecuritizations with Risk rating 2 (weighted at 100%) - - Resecuritizations with Risk rating 3 (weighted at 225%) - - Resecuritizations with Risk rating 4 (weighted at 650%) - - Resecuritizations with Risk rating 5, 6 or not classified
2,286.3 182.9 (weighted at 1250%)

Quarterly Report 2Q13
64
Table IV.3
Operational RWAs Capital Requirements
40,499.9 3,240.0
Average Market and credit RWAs of last 36 months Average of positive net annual
revenues for the last 36 months
21,600.0 24,525.4
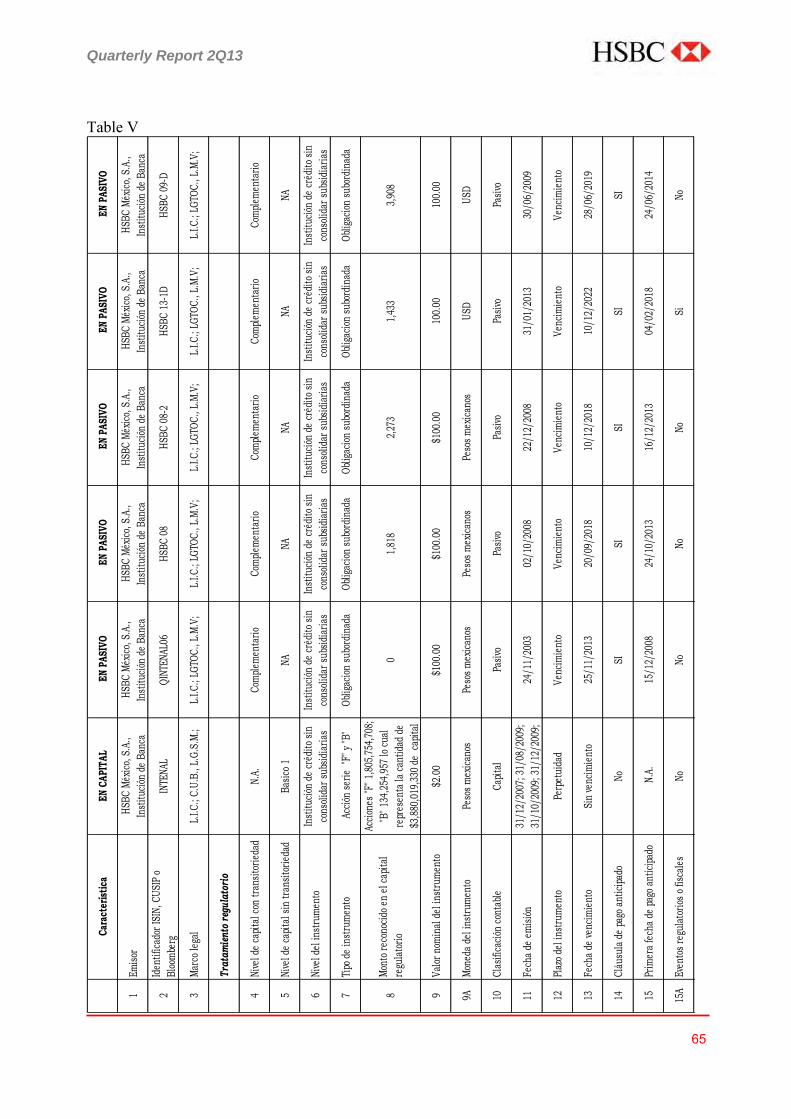
Quarterly Report 2Q13
65
Car
acte
ríst
ica
EN
CA
PIT
AL
EN
PA
SIV
O E
N P
ASI
VO
EN
PA
SIV
O E
N P
ASI
VO
EN
PA
SIV
O
1Em
isor
HSB
C M
éxic
o, S
.A.,
Inst
ituc
ión
de B
anca
HSB
C M
éxic
o, S
.A.,
Inst
ituc
ión
de B
anca
HSB
C M
éxic
o, S
.A.,
Inst
ituc
ión
de B
anca
HSB
C M
éxic
o, S
.A.,
Inst
ituc
ión
de B
anca
HSB
C M
éxic
o, S
.A.,
Inst
ituc
ión
de B
anca
HSB
C M
éxic
o, S
.A.,
Inst
ituc
ión
de B
anca
2Id
enti
ficad
or IS
IN, C
USI
P o
Blo
ombe
rgIN
TEN
ALQ
INTE
NAL
06H
SBC
08
HSB
C 0
8-2
HSB
C 1
3-1D
HSB
C 0
9-D
3M
arco
lega
lL.
I.C.;
C.U
.B.,
L.G
.S.M
.; L.
I.C.;
LGTO
C.,
L.M
.V;
L.I.C
.; LG
TOC
., L.
M.V
; L.
I.C.;
LGTO
C.,
L.M
.V;
L.I.C
.; LG
TOC
., L.
M.V
; L.
I.C.;
LGTO
C.,
L.M
.V;
Tra
tam
ient
o re
gula
tori
o
4N
ivel
de
capi
tal c
on t
rans
itor
ieda
d N
.A.
Com
plem
enta
rio
Com
plem
enta
rio
Com
plem
enta
rio
Com
plem
enta
rio
Com
plem
enta
rio
5N
ivel
de
capi
tal s
in t
rans
itor
ieda
dB
asic
o 1
NA
NA
NA
NA
NA
6N
ivel
del
inst
rum
ento
In
stit
ució
n de
cré
dito
sin
cons
olid
ar s
ubsi
diar
ias
Inst
ituc
ión
de c
rédi
to s
in
cons
olid
ar s
ubsi
diar
ias
Inst
ituc
ión
de c
rédi
to s
in
cons
olid
ar s
ubsi
diar
ias
Inst
ituc
ión
de c
rédi
to s
in
cons
olid
ar s
ubsi
diar
ias
Inst
ituc
ión
de c
rédi
to s
in
cons
olid
ar s
ubsi
diar
ias
Inst
ituc
ión
de c
rédi
to s
in
cons
olid
ar s
ubsi
diar
ias
7Ti
po d
e in
stru
men
to A
cció
n se
rie
"F"
y "
B"
Obl
igac
ion
subo
rdin
ada
Obl
igac
ion
subo
rdin
ada
Obl
igac
ion
subo
rdin
ada
Obl
igac
ion
subo
rdin
ada
Obl
igac
ion
subo
rdin
ada
8M
onto
rec
onoc
ido
en e
l cap
ital
regu
lato
rio
Acci
ones
"F"
1,8
05,7
54,7
08;
"B"
134,
254,
957
lo c
ual
repr
esen
ta la
can
tida
d de
$3,8
80,0
19,3
30 d
e c
apit
al
01,
818
2,27
31,
433
3,90
8
9V
alor
nom
inal
del
inst
rum
ento
$2.0
0$1
00.0
0$1
00.0
0$1
00.0
010
0.00
100.
00
9AM
oned
a de
l ins
trum
ento
Peso
s m
exic
anos
Peso
s m
exic
anos
Peso
s m
exic
anos
Peso
s m
exic
anos
USD
USD
10C
lasi
ficac
ión
cont
able
Cap
ital
Pasi
voPa
sivo
Pasi
voPa
sivo
Pasi
vo
11Fe
cha
de e
mis
ión
31/1
2/20
07; 3
1/08
/200
9;
31/1
0/20
09; 3
1/12
/200
9;
24/1
1/20
0302
/10/
2008
22/1
2/20
0831
/01/
2013
30/0
6/20
09
12Pl
azo
del i
nstr
umen
toPe
rpet
uida
dV
enci
mie
nto
Ven
cim
ient
oV
enci
mie
nto
Ven
cim
ient
oV
enci
mie
nto
13Fe
cha
de v
enci
mie
nto
Sin
venc
imie
nto
25/1
1/20
1320
/09/
2018
10/1
2/20
1810
/12/
2022
28/0
6/20
19
14C
láus
ula
de p
ago
anti
cipa
doN
oSI
SISI
SISI
15Pr
imer
a fe
cha
de p
ago
anti
cipa
do N
.A.
15/1
2/20
0824
/10/
2013
16/1
2/20
1304
/02/
2018
24/0
6/20
14
15A
Even
tos
regu
lato
rios
o fi
scal
esN
oN
oN
oN
oSi
No
Table V
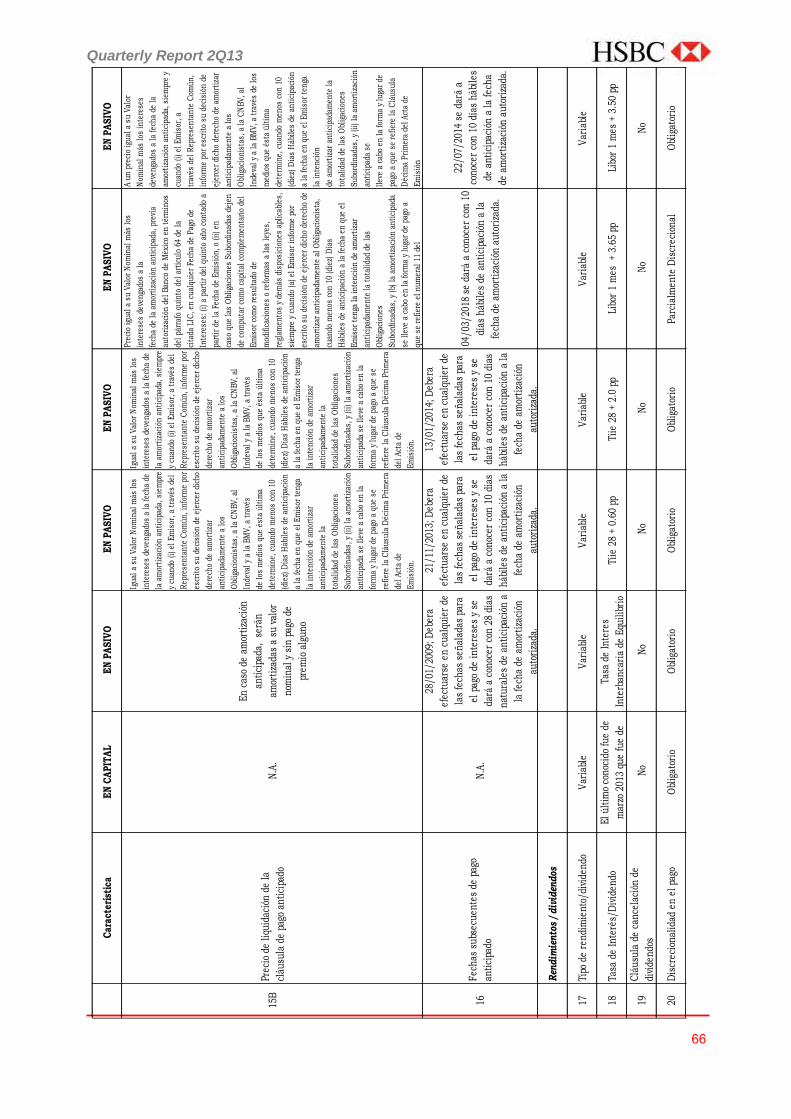
Quarterly Report 2Q13
66
Car
acte
ríst
ica
EN
CA
PIT
AL
EN
PA
SIV
O E
N P
ASIV
O E
N P
ASIV
O E
N P
ASIV
O E
N P
ASIV
O
15B
Prec
io d
e li
quid
ació
n d
e la
cláu
sula
de
pago
an
tici
pado
N.A
.
En
cas
o de
am
orti
zaci
ón
anti
cipa
da,
ser
án
amor
tiza
das
a su
val
or
nom
inal
y s
in p
ago
de
prem
io a
lgu
no
Igu
al a
su
Val
or N
omin
al m
ás l
os
inte
rese
s de
ven
gado
s a
la f
ech
a de
la a
mor
tiza
ción
an
tici
pada
, si
empr
e
y cu
ando
(i)
el
Em
isor
, a
trav
és d
el
Rep
rese
nta
nte
Com
ún
, in
form
e po
r
escr
ito
su d
ecis
ión
de
ejer
cer
dich
o
dere
cho
de a
mor
tiza
r
anti
cipa
dam
ente
a l
os
Obl
igac
ion
ista
s, a
la
CN
BV
, al
Inde
val
y a
la B
MV
, a
trav
és
de l
os m
edio
s qu
e és
ta ú
ltim
a
dete
rmin
e, c
uan
do m
enos
con
10
(die
z) D
ías
Háb
iles
de
anti
cipa
ción
a la
fec
ha
en q
ue
el E
mis
or t
enga
la i
nte
nci
ón d
e am
orti
zar
anti
cipa
dam
ente
la
tota
lida
d de
las
Obl
igac
ion
es
Su
bord
inad
as,
y (i
i) l
a am
orti
zaci
ón
anti
cipa
da s
e ll
eve
a ca
bo e
n l
a
form
a y
luga
r de
pag
o a
que
se
refi
ere
la C
láu
sula
Déc
ima
Pri
mer
a
del
Act
a de
Em
isió
n.
Pre
cio
igu
al a
su
Val
or N
omin
al m
ás l
os
inte
rese
s de
ven
gado
s a
la
fech
a de
la
amor
tiza
ción
an
tici
pada
, pr
evia
auto
riza
ción
del
Ban
co d
e M
éxic
o en
tér
min
os
del
párr
afo
quin
to d
el a
rtíc
ulo
64
de l
a
cita
da L
IC,
en c
ual
quie
r Fe
cha
de P
ago
de
Inte
rese
s: (
i) a
par
tir
del
quin
to a
ño
con
tado
a
part
ir d
e la
Fec
ha
de E
mis
ión
, o
(ii)
en
caso
qu
e la
s O
blig
acio
nes
Su
bord
inad
as d
ejen
de c
ompu
tar
com
o ca
pita
l co
mpl
emen
tari
o de
l
Em
isor
com
o re
sult
ado
de
mod
ific
acio
nes
o r
efor
mas
a l
as l
eyes
,
regl
amen
tos
y de
más
dis
posi
cion
es a
plic
able
s,
siem
pre
y cu
ando
(a)
el
Em
isor
in
form
e po
r
escr
ito
su d
ecis
ión
de
ejer
cer
dich
o de
rech
o de
amor
tiza
r an
tici
pada
men
te a
l O
blig
acio
nis
ta,
cuan
do m
enos
con
10
(die
z) D
ías
Háb
iles
de
anti
cipa
ción
a l
a fe
cha
en q
ue
el
Em
isor
ten
ga l
a in
ten
ción
de
amor
tiza
r
anti
cipa
dam
ente
la
tota
lida
d de
las
Obl
igac
ion
es
Su
bord
inad
as,
y (b
) la
am
orti
zaci
ón a
nti
cipa
da
se l
leve
a c
abo
en l
a fo
rma
y lu
gar
de p
ago
a
que
se r
efie
re e
l n
um
eral
11
del
A u
n p
reci
o ig
ual
a s
u V
alor
Nom
inal
más
los
in
tere
ses
deve
nga
dos
a la
fec
ha
de l
a
amor
tiza
ción
an
tici
pada
, si
empr
e y
cuan
do (
i) e
l E
mis
or,
a
trav
és d
el R
epre
sen
tan
te C
omú
n,
info
rme
por
escr
ito
su d
ecis
ión
de
ejer
cer
dich
o de
rech
o de
am
orti
zar
anti
cipa
dam
ente
a l
os
Obl
igac
ion
ista
s, a
la
CN
BV
, al
Inde
val
y a
la B
MV
, a
trav
és d
e lo
s
med
ios
que
ésta
últ
ima
dete
rmin
e, c
uan
do m
enos
con
10
(die
z) D
ías
Háb
iles
de
anti
cipa
ción
a la
fec
ha
en q
ue
el E
mis
or t
enga
la i
nte
nci
ón
de a
mor
tiza
r an
tici
pada
men
te l
a
tota
lida
d de
las
Obl
igac
ion
es
Su
bord
inad
as,
y (i
i) l
a am
orti
zaci
ón
anti
cipa
da s
e
llev
e a
cabo
en
la
form
a y
luga
r de
pago
a q
ue
se r
efie
re l
a C
láu
sula
Déc
ima
Pri
mer
a de
l A
cta
de
Em
isió
n
16F
ech
as s
ubs
ecu
ente
s de
pag
o
anti
cipa
do N
.A.
28/0
1/20
09;
Deb
era
efec
tuar
se e
n c
ual
quie
r de
las
fech
as s
eñal
adas
par
a
el p
ago
de i
nte
rese
s y
se
dará
a c
onoc
er c
on 2
8 dí
as
nat
ura
les
de a
nti
cipa
ción
a
la f
ech
a de
am
orti
zaci
ón
auto
riza
da.
21/1
1/20
13;
Deb
era
efec
tuar
se e
n c
ual
quie
r de
las
fech
as s
eñal
adas
par
a
el p
ago
de i
nte
rese
s y
se
dará
a c
onoc
er c
on 1
0 dí
as
háb
iles
de
anti
cipa
ción
a l
a
fech
a de
am
orti
zaci
ón
auto
riza
da.
13/0
1/20
14;
Deb
era
efec
tuar
se e
n c
ual
quie
r de
las
fech
as s
eñal
adas
par
a
el p
ago
de i
nte
rese
s y
se
dará
a c
onoc
er c
on 1
0 dí
as
háb
iles
de
anti
cipa
ción
a l
a
fech
a de
am
orti
zaci
ón
auto
riza
da.
04/0
3/20
18 s
e da
rá a
con
ocer
con
10
días
háb
iles
de
anti
cipa
ción
a l
a
fech
a de
am
orti
zaci
ón a
uto
riza
da.
22/0
7/20
14 s
e da
rá a
con
ocer
con
10
días
háb
iles
de a
nti
cipa
ción
a l
a fe
cha
de a
mor
tiza
ción
au
tori
zada
.
Ren
dim
iento
s / div
iden
dos
17Ti
po d
e re
ndi
mie
nto
/div
iden
doV
aria
ble
Var
iabl
eV
aria
ble
Var
iabl
eV
aria
ble
Var
iabl
e
18Ta
sa d
e In
teré
s/D
ivid
endo
El
últ
imo
con
ocid
o fu
e de
mar
zo 2
013
que
fue
de
Tasa
de
Inte
res
Inte
rban
cari
a de
Equ
ilib
rio
Tiie
28
+ 0.
60 p
pTi
ie 2
8 +
2.0
ppLi
bor
1 m
es
+ 3.
65 p
pLi
bor
1 m
es +
3.5
0 pp
19C
láu
sula
de
can
cela
ción
de
divi
den
dos
No
No
No
No
No
No
20D
iscr
ecio
nal
idad
en
el
pago
Obl
igat
orio
Obl
igat
orio
Obl
igat
orio
Obl
igat
orio
Parc
ialm
ente
Dis
crec
ion
alO
blig
ator
io

Quarterly Report 2Q13
67
Cara
cte
ríst
ica
EN
CA
PIT
AL
EN
PA
SIV
O E
N P
ASIV
O E
N P
ASIV
O E
N P
ASIV
O E
N P
ASIV
O
21
Clá
usu
la d
e a
um
en
to d
e i
nte
rese
s N
o N
o N
o N
o N
o N
o
22
Ren
dim
ien
to/div
iden
dos
No
Acu
mu
labl
es
No
Acu
mu
labl
es
No
Acu
mu
labl
es
No
Acu
mu
labl
es
No
Acu
mu
labl
es
No
Acu
mu
labl
es
23
Con
vert
ibil
idad d
el
inst
rum
en
to N
o C
onve
rtib
les
No
Con
vert
ible
s N
o C
onve
rtib
les
No
Con
vert
ible
sC
onve
rtib
les
No
Con
vert
ible
s
24
Con
dic
ion
es
de c
onve
rtib
ilid
ad
N.A
N.A
N.A
N.A
Las O
blig
acio
nes S
ubor
dina
das s
erán
de
conv
ersió
n ob
ligat
oria
en
acci
ones
ord
inar
ias r
epre
sent
ativa
s del
cap
ital
soci
al d
el E
miso
r, sin
que
est
e he
cho
se c
onsid
ere
com
o un
ev
ento
de
incu
mpl
imie
nto,
y la
cua
l se
lleva
rá a
cab
o cu
ando
se
pre
sent
e al
guna
de
las c
ondi
cion
es q
ue a
con
tinua
ción
se
lista
n:1.C
uand
o el
resu
ltado
de
divid
ir el c
apita
l bás
ico
1 ent
re lo
s ac
tivos
pon
dera
dos s
ujet
os a
riesg
o to
tale
s del
Em
isor s
e ub
ique
en
4.5%
o m
enos
. Par
a ef
ecto
s de
lo d
ispue
sto
en e
l pr
esen
te n
umer
al, e
l Em
isor d
eber
á pr
oced
er a
la c
onve
rsió
n,
el D
ía H
ábil s
igui
ente
a la
pub
licac
ión
del ín
dice
de
capi
taliz
ació
n a
que
se re
fiere
el A
rtícu
lo 2
21 d
e la
s Di
spos
icio
nes d
e Ca
pita
lizac
ión.
2.Cu
ando
la C
NBV
notif
ique
al E
miso
r, co
nfor
me
a lo
disp
uest
o en
el A
rtícu
lo 2
9 Bi
s de
la L
IC, q
ue h
a in
curri
do e
n al
guna
de
las c
ausa
les a
que
se re
fiere
n la
s fra
ccio
nes I
V o
V de
l Artí
culo
28
de
la L
IC y
en e
l pla
zo p
revis
to p
or e
l cita
do A
rtícu
lo 2
9 Bi
s,
el E
miso
r no
subs
ane
los h
echo
s o tr
atán
dose
de
la c
ausa
l de
revo
caci
ón re
ferid
a en
la fr
acci
ón V
no
solic
ite a
coge
rse
al
régi
men
de
oper
ació
n co
ndic
iona
da o
no
rein
tegr
e el
cap
ital.
Para
efe
ctos
de
lo d
ispue
sto
en e
l pre
sent
e nu
mer
al, e
l Em
isor
debe
rá p
roce
der a
la c
onve
rsió
n, e
l Día
Háb
il sig
uien
te a
que
hu
bier
e co
nclu
ido
el p
lazo
refe
rido
en e
l ant
es m
enci
onad
o Ar
tícul
o 29
Bis
de la
LIC
. En
todo
cas
o, la
con
vers
ión
en
acci
ones
refe
rida
en e
ste
inci
so se
rá d
efin
itiva,
por
lo q
ue n
o po
drán
incl
uirs
e cl
áusu
las q
ue p
reve
an la
rest
ituci
ón u
ot
orgu
en a
lgun
a co
mpe
nsac
ión
a lo
s ten
edor
es d
el o
los
Títu
los.
N.A
25
Gra
do
de c
onve
rtib
ilid
ad
N.A
N.A
N.A
N.A
La
con
vers
ión
se
real
izar
á al
men
os p
or e
l m
onto
que
resu
lte
men
or d
e: (i) l
a to
tali
dad
de
los
Título
s, y
(ii
) el
im
por
te n
eces
ario
par
a qu
e el
resu
ltad
o de
div
idir
el
capit
al b
ásic
o 1 d
el E
mis
or
entr
e lo
s ac
tivo
s pon
der
ados
suje
tos
a ri
esgo
tot
ales
del
Em
isor
sea
de
7.0
%
(sie
te p
or c
ien
to). C
ada
vez
que
se a
ctual
icen
los
supues
tos
ante
s des
crit
os,
oper
ará
nuev
amen
te l
a co
nve
rsió
n e
n a
ccio
nes
ord
inar
ias,
en l
os m
ism
os t
érm
inos
.
La
con
vers
ión
deb
erá
real
izar
se o
bser
van
do
en t
odo
mom
ento
los
lím
ites
de
ten
enci
a ac
cion
aria
por
per
son
a o
grupo
de
per
son
as,
pre
vist
os e
n l
as l
eyes
apli
cabl
es.
Par
a ef
ecto
s de
lo
ante
rior
, el
Em
isor
des
de
el m
omen
to d
e la
Em
isió
n s
e as
egura
rá y
ver
ific
ará
que
se d
é cu
mpli
mie
nto
a d
ich
os l
ímit
es o
bie
n,
que
se p
rese
nte
n l
os a
viso
s y/
o se
obt
enga
n l
as
auto
riza
cion
es c
orre
spon
die
nte
s.
N.A
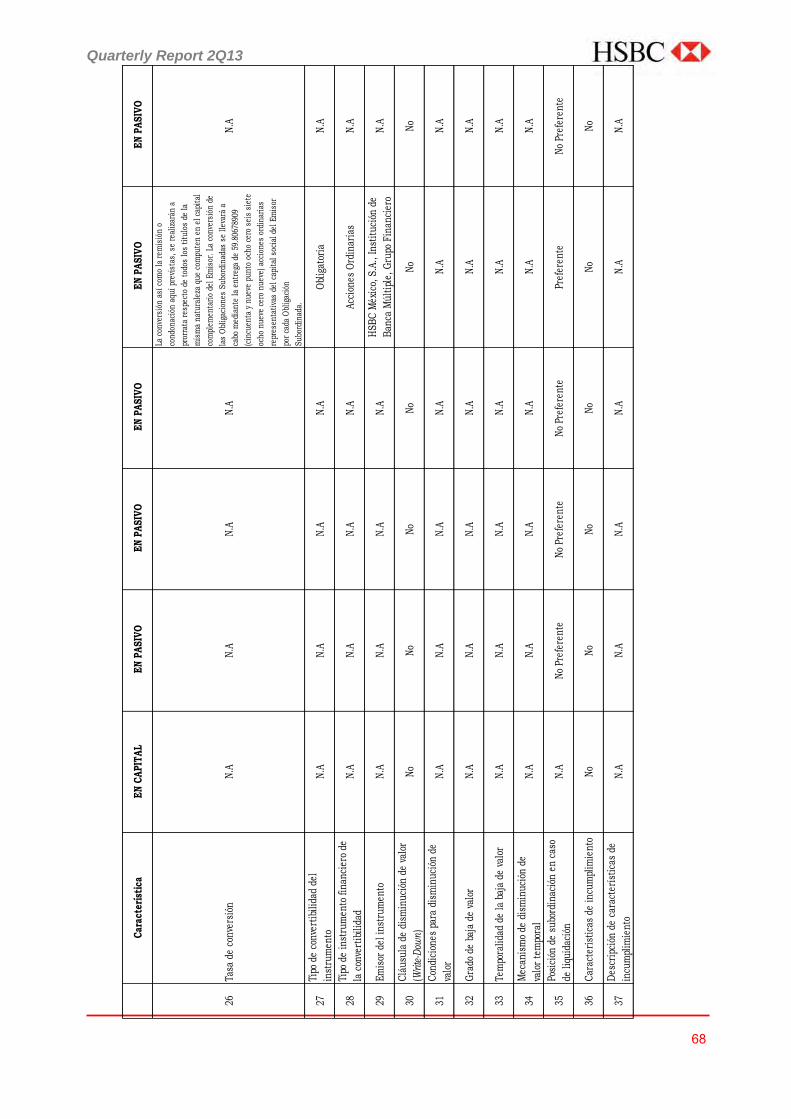
Quarterly Report 2Q13
68
Car
acte
ríst
ica
EN
CA
PIT
AL
EN
PA
SIV
O E
N P
ASIV
O E
N P
ASIV
O E
N P
ASIV
O E
N P
ASIV
O
26Ta
sa d
e co
nve
rsió
nN
.AN
.AN
.AN
.A
La c
onve
rsió
n a
sí c
omo
la r
emis
ión
o
con
don
ació
n a
quí
prev
ista
s, s
e re
aliz
arán
a
pror
rata
res
pect
o de
tod
os l
os t
ítu
los
de l
a
mis
ma
nat
ura
leza
qu
e co
mpu
ten
en
el
capi
tal
com
plem
enta
rio
del
Em
isor
. La
con
vers
ión
de
las
Obl
igac
ion
es S
ubo
rdin
adas
se
llev
ará
a
cabo
med
ian
te l
a en
treg
a de
59.
8067
8909
(cin
cuen
ta y
nu
eve
pun
to o
cho
cero
sei
s si
ete
och
o n
uev
e ce
ro n
uev
e) a
ccio
nes
ord
inar
ias
repr
esen
tati
vas
del
capi
tal
soci
al d
el E
mis
or
por
cada
Obl
igac
ión
Su
bord
inad
a.
N.A
27Ti
po d
e co
nve
rtib
ilid
ad d
el
inst
rum
ento
N.A
N.A
N.A
N.A
Obl
igat
oria
N.A
28Ti
po d
e in
stru
men
to f
inan
cier
o de
la c
onve
rtib
ilid
adN
.AN
.AN
.AN
.AA
ccio
nes
Ord
inar
ias
N.A
29E
mis
or d
el i
nst
rum
ento
N
.AN
.AN
.AN
.AH
SB
C M
éxic
o, S
.A.,
In
stit
uci
ón d
e
Ban
ca M
últ
iple
, G
rupo
Fin
anci
ero
N.A
30C
láu
sula
de
dism
inu
ción
de
valo
r
(Write-Down
)N
oN
oN
oN
oN
oN
o
31C
ondi
cion
es p
ara
dism
inu
ción
de
valo
rN
.AN
.AN
.AN
.AN
.AN
.A
32G
rado
de
baja
de
valo
rN
.AN
.AN
.AN
.AN
.AN
.A
33Te
mpo
rali
dad
de l
a ba
ja d
e va
lor
N.A
N.A
N.A
N.A
N.A
N.A
34M
ecan
ism
o de
dis
min
uci
ón d
e
valo
r te
mpo
ral
N.A
N.A
N.A
N.A
N.A
N.A
35Po
sici
ón d
e su
bord
inac
ión
en
cas
o
de l
iqu
idac
ión
N.A
No
Pref
eren
teN
o Pr
efer
ente
No
Pref
eren
tePr
efer
ente
No
Pref
eren
te
36C
arac
terí
stic
as d
e in
cum
plim
ien
toN
oN
oN
oN
oN
oN
o
37D
escr
ipci
ón d
e ca
ract
erís
tica
s de
incu
mpl
imie
nto
N.A
N.A
N.A
N.A
N.A
N.A