tnt express 2q13 press release
DESCRIPTION
Persbericht van TNT Express over de nieuwe kwartaalcijfers.TRANSCRIPT

More detailed quarterly financial and operational information: www.tnt.com/corporate/2Q13datasheets
PRESS RELEASE
29 July 2013 Amsterdam, The Netherlands
2Q13 results: Challenging trading conditions continue, focus on operational improvements
� Reported revenues €1,702m (-3.1%), reported operating income €(280)m (2Q12: €94m)
� Adjusted revenues €1,736m (-1.1%), adjusted operating income €71m (2Q12: €97m)
� Adjustments to operating income include €296m goodwill impairments and €53m fair value
adjustments
� Solid period end net cash position of €287m (1Q13: €280m)
� Strong focus on operational improvements with Deliver! gaining momentum; accelerated
reorganisation Italy announced
� Brazil sales process on course, turnaround measures successful
� Interim pro forma 2013 dividend of €0.022 per share declared representing 40% pay-out of
1H13 normalised net income; shareholders may choose to receive the dividend in stock or
cash
Summary: Consolidated results (€m)
No tes 2Q13 2Q12 %chg/ € 2Q13 2Q12 %chg/ €
Revenues (1) 1,702 1,756 -3.1 1,736 1,756 -1.1
Operating incom e from continuing operations (2) (280) 94 (374) 71 97 (26)
Operating incom e m argin (%) -16.5 5.4 4.1 5.5
Profit/(loss) from discontinued operations (3) (23) 20
Profit/(loss) equity holders of the parent (304) 39 (343) -
Cash generated from continuing operations 102 98 4
Net cash from continuing operating activities 54 63 (9)
Net cash used in continuing inves ting activities (26) (10) (16)
Change in cash from discontinued operations 0 0 - - -
Net debt/(cash) (287) (6) (281)
Notes: Non-GAAP adjustments
Reported Adjusted (non-GAAP)
(2) 2Q13: €1m FX, €296m goodw ill impairments, €53m fair value adjustments, €4m restructuring Europe Main, €1m restructuring
AMEA, €(4)m claim settlement in Europe Other & Americas
(2) 2Q12: €3m UPS-related of fer cost
(1) 2Q13: €34m FX
� Trading conditions continued to reflect generally challenging economic conditions
� Europe Main (Benelux, France, Germany, Italy and UK/Ireland) profit decline as a result of
pricing pressure, mitigated by volume growth and savings
� Good performance Europe Other & Americas as a whole, but mixed picture by country, mostly
depending on local economic conditions
� Pacific (mostly Australia and New Zealand) operating income below prior year. Strong
consignment growth but significantly lower weight per consignment and higher input costs
� Asia Middle East & Africa profitability higher, despite weaker economic growth and negative
effect introduction of VAT in China

2
Date 29 July 2013
Revenues (€m) Notes 2Q13 2Q12 %chg FX
One-
offs 2Q13 2Q12 %chg
Europe Main 818 847 -3.4 11 0 829 847 -2.1
Europe Other & Americas 298 295 1.0 3 0 301 295 2.0
Pacific 167 174 -4.0 10 0 177 174 1.7
AMEA 287 305 -5.9 8 0 295 305 -3.3
Unallocated 137 140 -2.1 - 0 137 140 -2.1
Elimination (5) (5) 0.0 2 0 (3) (5)
Total 1,702 1,756 -3.1 34 0 1,736 1,756 -1.1
Operating income (€m)
Europe Main (1) (195) 61 0.0 1 242 48 61 -21.3
Europe Other & Americas (2) 20 14 42.9 - (4) 16 14 14.3
Pacific 3 6 -50.0 - - 3 6 -50.0
AMEA (3) (37) 15 0.0 - 54 17 15 13.3
Unallocated (4) (71) (2) 0.0 - 58 (13) 1 0.0
Total (280) 94 0.0 1 350 71 97 -26.8
Operating income margin (%)
Europe Main -23.8 7.2 5.8 7.2
Europe Other & Americas 6.7 4.7 5.3 4.7
Pacific 1.8 3.4 1.7 3.4
AMEA -12.9 4.9 5.8 4.9
Total -16.5 5.4 4.1 5.5
Notes: Non-GAAP adjustments
Reported Adjusted (non-GAAP)
(1) 2Q13: €238m goodwill impairments, €4m restructuring
(2) 2Q13: €(4)m claim settlement
(4) 2Q13:€58m goodwill impairments Other Networks
(3) 2Q13: €53m fair value adjustments, €1m restructuring
Deliver! update
TNT Express’ Deliver! programme was launched on 25 March 2013 and runs through 2015. The
programme is built around four priorities: reshape the portfolio, focus on TNT Express’ distinctive
service, execute better and invest in infrastructure and IT. Highlights in the quarter include:
� Closing of sale China Domestic expected in 2H13; sale process Brazil Domestic started –
adjusted operating income losses reduced to €(5)m in 2Q13
� Streamlined company-wide functions being established; consultation with employee
representatives initiated
� Start of implementation various operational improvement projects
� Savings realised from central air linehaul optimisation
� Accelerated reorganisation in Italy announced in June 2013

3
Date 29 July 2013
Commenting on this quarter’s developments, Tex Gunning, CEO said:
‘During my first two months, I have had the pleasure to meet with many employees and customers
around the world. These meetings have strengthened my confidence about our future: we have
attractive market positions that we continue to develop thanks to our highly committed employees.
But there are also many challenges – and trading conditions remain difficult. The Deliver!
programme is therefore vital to improve our performance. We are making good progress in its
implementation. We announced the restructuring of our Italian operations in June and will realise
important milestones for our overhead and operational process improvement projects after the
summer. We should start seeing benefits from Deliver! as the programme gains momentum.
While visibility of the economy remains limited, we reiterate our 2015 ambitions.’
2013 guidance
� Challenging trading conditions foreseen for the rest of 2013, with continued negative
development of operating results for Europe Main and Europe Other & Americas combined
� Asia Middle East & Africa expected to perform better than the prior year
� Pacific decline in operating profits
� Unallocated around €(25)m (consists of unallocated costs and operating income from Fashion
and Innight)
� Brazil expected to reduce losses
2015 ambitions
� The economic climate remains uncertain with limited visibility on the future
� Assuming a return to normal economic conditions in Europe (moderate economic growth and
2% annual inflation), ambition for Europe Main and Europe Other & Americas combined to
achieve an adjusted operating income margin of around 8% and sales growth for the period of
around 2% (CAGR)
� All other segments to contribute to profitability
� Other indicators:
- €220m improvements from Deliver!
- Unallocated around €(25)m
- ETR around 30%
- Capex 2-3% of revenues (excluding additional investments Deliver! programme)
- Trade working capital around 8% of revenues

4
Date 29 July 2013
New reporting segmentation
Previously, TNT Express operated its businesses through five reportable segments: Europe Middle
East & Africa, Asia Pacific, Brazil, Other Americas and Other Networks.
This has now been replaced by a new structure based on business units and global functions, as
presented on 25 March 2013. In line with IFRS requirements, this results in the following new
reporting segments: Europe Main, Europe Other & Americas, Pacific and Asia, Middle East & Africa
(AMEA).
The constituents of these segments are as follows:
Europe Main Benelux, France, Germany, Italy and UK & Ireland
Europe Other & Americas Other European countries and Americas
Pacific Australia, New Zealand and Rest of Pacific
AMEA Asia, Middle East and Africa
Brazil is reported as Discontinued Operations.
The year-to-date 2012 and 2013 figures have been restated accordingly and can be found on page
12. The table below bridges total revenues and operating income between old and new
segmentation for 2Q13.
Bridge ' old' reportable segments versus 'new' reportable segments
€m @ avg 2012 and adjusted for business one-offs 2Q13 2Q12
Revenues Old segmentation
Europe Asia Other Other Non- Total Brazil Total Total
Middle East & Pacific Americas Networks allocated Continued incl incl
Africa Brazil Brazil
New segmentation
Europe Main 821 8 829 829 847
Europe Other & Americas 256 45 301 301 295
Pacific 177 177 177 174
Asia, Middle East & Africa 45 250 295 295 305
Unallocated 39 98 137 137 140
Eliminations -3 -3 -3 -5
87 87 74
Total 2Q13 1,161 427 45 106 -3 1,736 87 1,823 1,830
Total 2Q 2012 1,157 437 44 119 -1 1,756 74 1,830
Operating income Old segmentation
Europe Asia Other Other Non- Total Brazil Total Total
Middle East & Pacific Americas Networks allocated Continued incl incl
Africa Brazil Brazil
New segmentation
Europe Main 50 -2 48 48 61
Europe Other & Americas 20 -4 16 16 14
Pacific 3 3 3 6
Asia, Middle East & Africa 4 13 17 17 15
Unallocated 0 2 -15 -13 -13 1
-5 -5 -18
Total 74 16 -4 0 -15 71 -5 66 79
Total 2Q 2012 88 16 -5 4 -6 97 -18 79

5
Date 29 July 2013
Unallocated
Given their small relative size, the Other Networks activities TNT Innight and TNT Fashion outside
the UK, as well as the Air Cargo Sales and Central Network activities (previously reported within
Europe Middle East & Africa) are now reported in Unallocated.
Management will integrate TNT Fashion’s UK activities with the UK Express operations to capture
the synergies between the two businesses.
Cash generating units (CGUs)
Following IFRS requirements, the CGUs for the purpose of goodwill testing have changed.
Previously, the CGUs were: Northern Europe, Southern Europe & MEA, Asia Pacific, North America,
Brazil, Other South America and Other Networks. The new CGUs correspond to operations in the
business units and the nature of the services provided. They now are: Benelux, France, Germany,
Italy, UK & Ireland, Europe Other, North America, Brazil, Other South Americas, Asia Middle East &
Africa, Pacific and Other Networks.
The change in CGUs requires a reallocation of the goodwill previously allocated to the CGUs of the
former reporting segments Northern Europe and Southern Europe & MEA to the respective new
CGUs. This triggers an impairment test based on the present value of the estimated future cash
flows of each CGU. The estimated future cash flows do not include the impact of future
improvement programmes, such as Deliver!. If the present value of the estimated future cash flows
is lower than the carrying value (including allocated goodwill) of the CGU, a goodwill impairment
must be recognised.
The impairment test results in a total impairment of €296m, related to the former Southern Europe &
MEA CGU (€159m), the former Northern Europe CGU (€79m) and the former Other Networks CGU
(€58m).
Worsening trading conditions in Southern Europe, in particular in Italy and France, the loss of a
significant fashion contract and the decline in Innight results contribute to the impairments.
The increased granularity of the new CGUs also affects the impairment review. As each of the
Europe Main business units now constitutes a separate CGU, the offsetting higher results of other
units (which were previously part of the same CGU) no longer compensate for the lower values of
these individual business units.
TNT Express reconfirms its 2015 ambitions.

6
Date 29 July 2013
2Q13 segmental performance overview
Europe Main
2Q13 2Q12 %chg 1H13 1H12 %chg
Adjus ted revenues 829 847 -2.1 1,652 1,702 -2.9
Adjus ted operating incom e 48 61 -21.3 78 114 -31.6
Average cons ignm ents per day ('000) 707 670 5.5 705 661 6.7
Revenue per cons ignm ent (€)(1) 18.9 20.4 -7.4 18.7 20.3 -7.9
Average kilos per day ('000) 11,412 11,289 1.1 11,267 11,160 1.0
Revenue per kilo (€)(1) 1.17 1.21 -3.3 1.17 1.20 -2.5
(1) based o n repo rted revenues @avg12
� Overall, negative trends remain in difficult market environment
� Lower RPC as a result of price pressure, lower weight per consignment in International and
higher proportion of domestic light-weight parcels
� Volume growth and good cost control supported profitability
� Most units weaker, with particular pressure on results in Italy and France
Europe Other & Americas
2Q13 2Q12 %chg 1H13 1H12 %chg
Adjus ted revenues 301 295 2.0 590 590 0.0
Adjus ted operating incom e 16 14 14.3 28 22 27.3
Average cons ignm ents per day ('000) 114 114 0.0 112 111 0.9
Revenue per cons ignm ent (€)(1) 42.7 41.9 1.9 42.1 41.8 0.7
Average kilos per day ('000) 4,238 4,387 -3.4 4,219 4,344 -2.9
Revenue per kilo (€)(1) 1.15 1.08 6.5 1.12 1.07 4.7
(1) based o n repo rted revenues @avg12
� Overall moderate revenue growth with good yield, but mixed volume development by country
� Positive RPC and RPK due to successful yield enhancement programme, but WPC lower
� Revenue in all products in line with or higher than prior year
� Good cost containment

7
Date 29 July 2013
Asia, Middle East & Africa
2Q13 2Q12 %chg 1H13 1H12 %chg
Adjus ted revenues 295 305 -3.3 557 601 -7.3
Adjus ted operating incom e 17 15 13.3 14 5
Average cons ignm ents per day ('000) 102 111 -8.1 96 105 -8.6
Revenue per cons ignm ent (€)(1) 46.7 44.5 4.9 46.4 45.2 2.7
Average kilos per day ('000) 8,435 8,635 -2.3 7,702 8,012 -3.9
Revenue per kilo (€)(1)0.56 0.57 -1.8 0.58 0.59 -1.7
(1) based o n repo rted revenues @avg12
� Year-on-year volume and price comparisons impacted by last year’s closure of India Air
Domestic
� Business conditions in China weakening and lower export volumes from large accounts; VAT
introduction negatively impacting TNT Express pricing
� Operating result in Asia outside China well ahead of prior year
Pacific
2Q13 2Q12 %chg 1H13 1H12 %chg
Adjus ted revenues 177 174 1.7 350 348 0.6
Adjus ted operating incom e 3 6 -50.0 2 11 -81.8
Average cons ignm ents per day ('000) 79 72 9.7 77 70 10.0
Revenue per cons ignm ent (€)(1) 36.4 39.3 -7.4 36.5 38.9 -6.2
Average kilos per day ('000) 2,958 2,998 -1.3 2,916 2,922 -0.2
Revenue per kilo (€)(1) 0.97 0.94 3.2 0.96 0.94 2.1
(1) based o n repo rted revenues @avg12
� High consignment growth result of successful business development
� Significantly lower WPC, with related decline in RPC, due to downtrading large mining and
resource sector customers and changes in customer mix
� Cost increases driven by high consignment growth and wage inflation, mitigated by productivity
improvements
� Cost and commercial measures accelerated

8
Date 29 July 2013
Unallocated
� Adjusted for one-off items, Unallocated was €14m lower than the prior year mostly because of
lower results from Central Networks, higher reallocation to the reportable segments of lower
than expected corporate costs and increase in other costs
� Innight showing higher volumes in agriculture and automotive segments after slower start of
the year
Other financial indicators
� Net cash from operating activities €9m below prior year
� Net cash used in investing activities €16m lower than prior year mainly because of lower proceeds
from sale of PPE
� Trade working capital reduced to 8.5% of revenues (2Q12: 10.1% of revenue)
� Net cash €287m (1Q13: €280m net cash)

9
Date 29 July 2013
CONSOLIDATED INTERIM FINANCIAL STATEMENTS
GENERAL INFORMATION
TNT Express N.V. is a public limited liability company domiciled in Amsterdam, the Netherlands.
The consolidated interim financial statements include the interim financial statements of TNT
Express N.V. and its consolidated subsidiaries (hereafter referred to as ‘TNT Express’, ‘Group’ or
‘the company’). The company was incorporated under the laws of the Netherlands and is listed on
Euronext Amsterdam.
TNT Express provides door-to-door express delivery services for customers sending documents,
parcels, freight and special services worldwide, with a focus on time-certain and/or day–certain
pick-up and delivery. The main industries TNT Express serves are technology, automotive,
industrial, healthcare and lifestyle (fashion).
The express business is seasonal in that it is affected by public and local holiday patterns. The third
quarter is traditionally our weakest quarter due to the summer holiday in Europe.
BASIS OF PREPARATION
The information is reported on quarter-to-date and year-to-date basis ending 29 June 2013. Where
material to an understanding of the period starting 1 January 2013 and ending 29 June 2013,
further information is disclosed. The interim financial statements were discussed and approved by
the Executive Board. The interim financial statements should be read in conjunction with TNT
Express’ consolidated financial statements in the 2012 annual report as published on 18 February
2013.
The interim financial statements have been prepared in accordance with IAS 34 ‘Interim financial
reporting’.
The significant accounting policies applied in these consolidated interim financial statements are
consistent with those applied in TNT Express’ consolidated financial statements in the 2012 annual
report for the year ended 31 December 2012, except for the following changes in accounting
policies and disclosures:
− The revised IAS 19 is effective for TNT Express as from 1 January 2013. The impact on the Group
is as follows: the corridor approach has been eliminated and all actuarial gains and losses are
recognised in Other Comprehensive Income as they occur; all past service costs are immediately
recognised; and interest cost and expected return on plan assets are replaced with a net interest
amount that is calculated by applying the discount rate to the net defined benefit liability (asset). In
accordance with IAS 8 we have restated the financial statements of the comparable interim period
and the financial statements as at 31 December 2012. Refer to Adoption of IAS 19R hereafter.
− IFRS 13, ‘Fair Value Measurement’ is effective for TNT Express as from 1 January 2013. IFRS 13
aims to improve consistency and reduce complexity by providing a precise definition of fair value
and a single source of fair value measurement and disclosure requirements for use across IFRS.
The requirements do not extend the use of fair value accounting but provide guidance on how it
should be applied where its use is already required or permitted by other standards within IFRS.
The adoption of IFRS 13 did not materially impact the consolidated interim financial statements.

10
Date 29 July 2013
For the long-term debt stated at amortised cost, we have included an additional disclosure on the
debit value adjustment, following the disclosure requirements of IFRS 13. Refer to note 6.
The measure of profit and loss and assets and liabilities is based on the TNT Express Group
Accounting Policies, which are compliant with International Financial Reporting Standards (IFRS)
as adopted by the European Union (EU). The pricing of inter-company sales is done at arm’s length.
Adoption IAS 19R
The following table summarises the effects on the balance sheet of adopting IAS 19R
Adoption of IAS19R IAS19
31 Dec
Adoption of
IAS19R
31 Dec
in € m illions 2012 IAS19R 2012
Ass ets
Non-current assets
Intangible assets 1,457 0 1,457
Property, plant and equipm ent 836 0 836
Financial fixed assets 237 34 271
Pens ion assets 57 (56) 1
Total non-current as sets 2,587 (22) 2,565
Total current as sets 1,667 0 1,667
Ass ets class ified as held for dispos al 235 0 235
Total assets 4,489 (22) 4,467
Liabilities and equity
Total equity 2,717 (100) 2,617
Non-current liabilities
Deferred tax liabilities 31 0 31
Provis ions for pens ion liabilities 43 81 124
Other provis ions 109 (3) 106
Long-term debt 191 0 191
Accrued liabilities 3 0 3
Total non-current liabilities 377 78 455
Total current liabilities 1,350 0 1,350
Liabilities related to assets clas s ified as held for dis posal 45 0 45
Total liabilities and equity 4,489 (22) 4,467
The employer pension expense in each of the two quarters of 2012 is €2m higher (net of tax). The
earnings per share have decreased by 0.4€ cents to 9.9€ cents following the IAS19R restatement.
The closing equity position as at 29 June 2012 and 31 December 2012 is €42m and €100m lower
(net of tax), respectively. As the company is required to apply IAS 19R retrospectively, the adoption
also affects the opening balance sheet of the comparative year. The equivalent effect of the
adoption as per 1 January 2012 on equity amounts to €40m (net of tax).
AUDITOR’S INVOLVEMENT
The content of this interim financial report has not been audited or reviewed by an external auditor.
11
Date 29 July 2013
SEGMENT INFORMATION
Until 2Q13 TNT Express managed its businesses through five reportable segments: Europe Middle
East and Africa (Europe & MEA), Asia Pacific, Brazil, Other Americas and Other networks. As
disclosed in the 2012 annual report, Brazil was reported as a separate reportable segment in 2012.
As part of the updated strategy, Deliver!, a new management structure is implemented in 2Q13,
which led to new operating segments. Consequently, the reportable segments have changed into
Europe Main, Europe Other & Americas, Pacific, Asia Middle East and Africa (AMEA). Given the
relatively small size, Other Networks is reported as part of Unallocated.
In addition, the cash-generating units (CGUs) used for the goodwill impairment test have changed.
The new CGUs correspond to operations in a business unit and the nature of the services provided.
The new CGUs include: Benelux, France, Germany, Italy, UK & Ireland, Europe Other, North
America, Brazil, Other South Americas, Pacific, AMEA and Other Networks. Until 2Q13 the CGU
structure included Northern Europe, Southern Europe & MEA, Asia Pacific, North America, Brazil,
Other South Americas and Other Networks. In 2Q13, the CGU Other Networks was partly allocated
to the CGU UK & Ireland.
The comparative figures for 2012 have been restated.
12
Date 29 July 2013
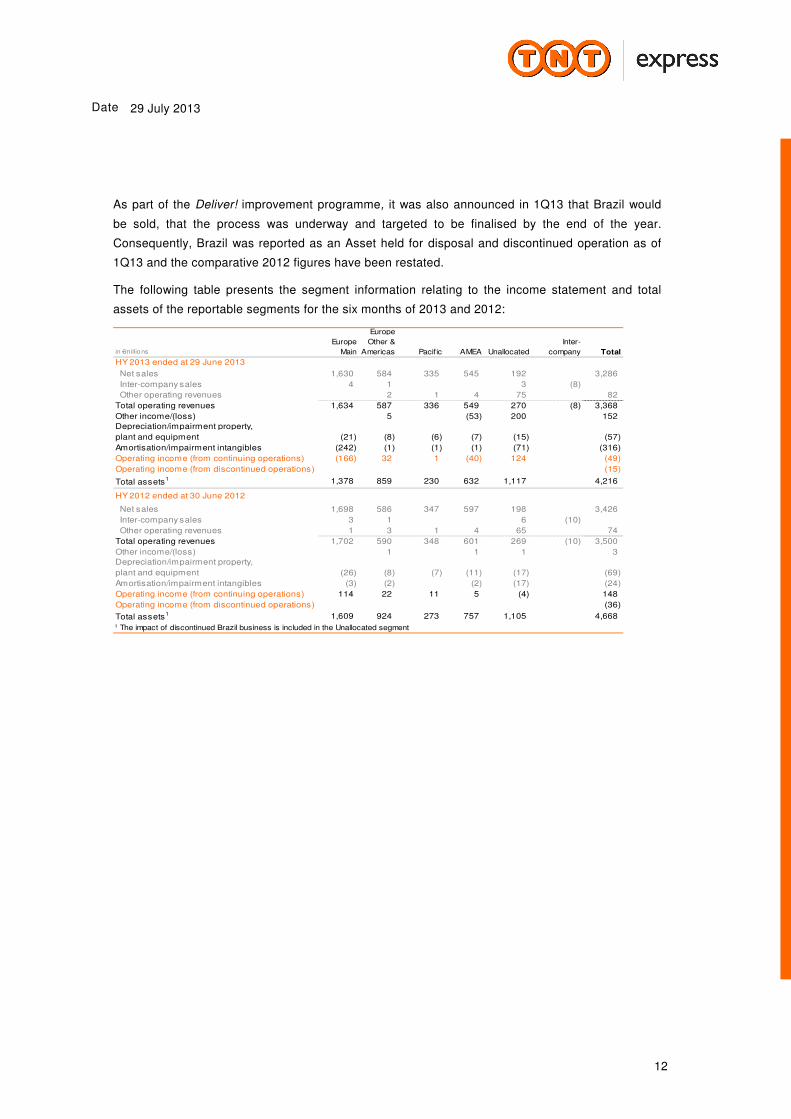
As part of the Deliver! improvement programme, it was also announced in 1Q13 that Brazil would
be sold, that the process was underway and targeted to be finalised by the end of the year.
Consequently, Brazil was reported as an Asset held for disposal and discontinued operation as of
1Q13 and the comparative 2012 figures have been restated.
The following table presents the segment information relating to the income statement and total
assets of the reportable segments for the six months of 2013 and 2012:
in € millions
Europe
Main
Europe
Other &
Americas Pacific AMEA Unallocated
Inter-
company Total
HY 2013 ended at 29 June 2013
Net sales 1,630 584 335 545 192 0 3,286
Inter-company sales 4 1 3 (8)
Other operating revenues 2 1 4 75 0 82
Total operating revenues 1,634 587 336 549 270 (8) 3,368
Other income/(loss) 5 (53) 200 152
Depreciation/impairment property,
plant and equipment (21) (8) (6) (7) (15) (57)
Amortisation/impairment intangibles (242) (1) (1) (1) (71) (316)
Operating income (from continuing operations) (166) 32 1 (40) 124 (49)
Operating income (from discontinued operations) (15)
Total assets1 1,378 859 230 632 1,117 4,216
HY 2012 ended at 30 June 2012
Net sales 1,698 586 347 597 198 0 3,426
Inter-company sales 3 1 6 (10)
Other operating revenues 1 3 1 4 65 74
Total operating revenues 1,702 590 348 601 269 (10) 3,500
Other income/(loss) 1 1 1 3
Depreciation/impairment property,
plant and equipment (26) (8) (7) (11) (17) (69)
Amortisation/impairment intangibles (3) (2) (2) (17) (24)
Operating income (from continuing operations) 114 22 11 5 (4) 148
Operating income (from discontinued operations) (36)
Total assets1 1,609 924 273 757 1,105 4,668 1 The impact of discontinued Brazil business is included in the Unallocated segment

13
Date 29 July 2013
Consolidated statement of financial position TNT Express N.V. 29 Jun 31 Dec
in € m illions 2013 20121
Assets
Non-current assets
Intangible assets
Goodwill 1,042 1,340
Other intangible assets 100 117
Total 1,142 1,457
Property, plant and equipment
Land and buildings 459 482
Plant and equipm ent 144 207
Aircraft 35 40
Other 72 87
Cons truction in progress 21 20
Total 731 836
Financial fixed assets
Inves tm ents in associates 10 10
Other loans receivable 2 3
Deferred tax assets 232 243
Other financial fixed assets 13 15
Total 257 271
Pens ion assets 1 1
Total non-current assets 2,131 2,565
Current assets
Inventory 11 13
Trade accounts receivable 978 1,026
Accounts receivable 86 88
Incom e tax receivable 22 14
Prepaym ents and accrued incom e 166 129
Cash and cash equivalents 502 397
Total current assets 1,765 1,667
Assets class ified as held for disposal 320 235
Total assets 4,216 4,467
Liabilities and equity
Equity
Equity attributable to the equity holders of the parent 2,390 2,610
Non-controlling interes ts 9 7
Total equity 2,399 2,617
Non-current liabilities
Deferred tax liabilities 20 31
Provis ions for pens ion liabilities 136 124
Other provis ions 77 106
Long-term debt 181 191
Accrued liabilities 3 3
Total non-current liabilities 417 455
Current liabilities
Trade accounts payable 395 439
Other provis ions 55 66
Other current liabilities 263 297
Incom e tax payable 79 44
Accrued current liabilities 500 504
Total current liabilities 1,292 1,350
Liabilities related to assets class ified as held for disposal 108 45
Total liabilities and equity 4,216 4,467 1 Restated for IAS19R

14
Date 29 July 2013
Consolidated income statement TNT Express N.V.in € millions 2Q13 2Q121 1H13 1H121
Net sales 1,660 1,711 3,286 3,426
Other operating revenues 42 45 82 74
Total revenues 1,702 1,756 3,368 3,500
Other income/(loss) (48) 2 152 3
Cost of materials (104) (108) (208) (217)
Work contracted out and other external expenses (901) (904) (1,804) (1,827)
Salaries and social security contributions (541) (545) (1,079) (1,097)
Depreciation, amortisation and impairments (334) (47) (373) (93)
Other operating expenses (54) (60) (105) (121)
Total operating expenses (1,934) (1,664) (3,569) (3,355)
Operating income (280) 94 (49) 148
Interest and similar income 3 4 6 8
Interest and similar expenses (8) (14) (18) (23)
Net financial (expense)/income (5) (10) (12) (15)
Results from investments in associates 0 1 0 1
Profit/(loss) before income taxes (285) 85 (61) 134
Income taxes (15) (24) (82) (34)
Profit/(loss) for the period from continuing operations (300) 61 (143) 100
Profit/(loss) from discontinued operations (3) (23) (16) (47)
Profit/(loss) for the period (303) 38 (159) 53
Attributable to:
Non-controlling interests 1 (1) 1 (1)
Equity holders of the parent (304) 39 (160) 54
Earnings per ordinary share (in € cents) 2 (55.9) 7.2 (29.4) 9.9
1 Restated for IAS19R
2 Based on an average of 543,569,231 o f outstanding o rdinary shares (2012: 543,223,590)
Consolidated statement of comprehensive income TNT Express N.V.
in € m illions 2Q13 2Q121 1H13 1H121
Profit/(loss) for the period (303) 38 (159) 53
Pens ions : Actuarial gains /losses (12) 0 (12) 0
Gains /(losses ) on cashflow hedges , net of tax 3 0 4 0
Currency trans lation adjus tm ent, net of tax (46) 46 (39) 28
(55) 46 (47) 28
Total com prehens ive incom e for the period (358) 84 (206) 81
Attributable to:
Non-controlling interes ts 1 (1) 1 (1)
Equity holders of the parent (359) 85 (207) 82
1 Restated fo r IA S19R
The 2Q13 tax impact on Other comprehensive income relates to pensions €4m (2Q12: 0), cash flow
hedges €(1)m (2Q12: 1) and currency translation adjustment €0m (2Q12: 0).
The YTD 2013 tax impact on Other comprehensive income relates to pensions €4m (2012: 0), cash
flow hedges €(2)m (2012: 0) and currency translation adjustment €0m (2012: 0).
Other comprehensive income can be further split into items that are or may be reclassified to the
income statement when certain conditions are met and items that will not be reclassified. Currency
translation adjustments and gains/losses on cash flow hedges are or may be reclassified to the income
statement. Pension adjustments will not be reclassified to the income statement.

15
Date 29 July 2013
Consolidated statement of cash flows TNT Express N.V.in € millions 2Q13 2Q12 1H13 1H12
Profit before income taxes (285) 85 (61) 134
Adjustments for:
Depreciation, amortisation and impairments 334 47 373 93
Amortisation of f inancial instruments/derivatives 1 - 1 1
Share-based compensation 1 - 1 -
Investment income: - - - -
(Profit)/loss of assets held for disposal 53 (2) 53 (2)
(Profit)/loss on sale of group companies/joint ventures - - - -
Interest and similar income (2) (4) (5) (8)
Foreign exchange (gains) and losses - 2 1 3
Interest and similar expenses 7 12 16 20
Results from investments in associates - (1) - (1)
Changes in provisions: - - - -
Pension liabilities 2 (5) - (11)
Other provisions (2) (3) (2) (11)
Cash from/(used in) f inancial instruments/derivatives - - - -
Changes in w orking capital: - - - -
Inventory (1) - (1) -
Trade accounts receivable 20 13 (15) (3)
Accounts receivable (6) (4) (14) (1)
Other current assets 2 24 (34) (19)
Trade accounts payable 3 (10) (33) (49)
Other current liabilities excluding short-term financing and taxes (25) (56) 14 (15)
Cash generated from operations 102 98 294 131
Interest paid (9) (13) (15) (19)
Income taxes received/(paid) (39) (22) (57) (30)
Net cash from/(used in) operating activities 54 63 222 82
Interest received 2 4 5 8
Investments in associates - 1 - -
Disposal of associates - 1 - 1
Capital expenditure on intangible assets (8) (6) (11) (9)
Disposal of intangible assets - 2 - 2
Capital expenditure on property, plant and equipment (20) (23) (35) (37)
Proceeds from sale of property, plant and equipment 1 10 3 13
Cash from f inancial instruments/derivatives (1) - (17) -
Other changes in (f inancial) f ixed assets (1) 1 - 1
Changes in non-controlling interests 1 - 1 -
Net cash from/(used in) investing activities (26) (10) (54) (21)
Capital contribution (Brazil) (8) (16) (27) (35)
Proceeds from long-term borrow ings (5) - (5) -
Repayments of long-term borrow ings 4 - 4 -
Proceeds from short-term borrow ings (40) (34) (5) (26)
Repayments of short-term borrow ings 24 36 (7) 29
Repayments of f inance leases (7) (8) (8) (10)
Dividends paid (11) (2) (11) (2)
Net cash from/(used in) f inancing activities (43) (24) (59) (44)
Change in cash from continuing operations (15) 29 109 17
Cash flows from discontinued operationsNet cash from/(used in) operating activities (6) (24) (20) (45)
Net cash from/(used in) investing activities 0 0 (1) (2)
Net cash from/(used in) f inancing activities 6 24 23 38
Change in cash from discontinued operations 0 0 2 (9)
Total changes in cash (15) 29 111 8

16
Date 29 July 2013
Consolidated statement of changes in equity TNT Express N.V.
in € millions
Issued
share
capital
Additional
paid in
capital
Legal
reserves
Other
reserves
Retained
earnings
Total
equity
Balance at 31 December 20111 43 3,021 24 (52) (270) 2,766 6 2,772
Total comprehensive income1 28 54 82 (1) 81
Final dividend previous year (2) (2) (2)
Changes in legal reserves (6) 6 - -
Other - - (1) - (1) (1)
Total direct changes in equity - (2) (6) 5 - (3) - (3)
Balance at 30 June 20121 43 3,019 46 (47) (216) 2,845 5 2,850
Balance at 31 December 20121 43 3,019 (4) (92) (356) 2,610 7 2,617
Total comprehensive income (35) (12) (160) (207) 1 (206)
Dividend previous year (11) (11) (11)
Legal reserves reclassifications (7) 7 - -
Share based payments 1 1 1
Other (1) (2) (3) 1 (2)
Total direct changes in equity - (11) (8) 6 - (13) 1 (12)
Balance at 29 June 2013 43 3,008 (47) (98) (516) 2,390 9 2,399 1 Restated other reserves and to tal comprehensive income for IAS19R
Non-
contro lling
interests
Attributable to
equity ho lders
o f the parent
17
Date 29 July 2013
NOTES TO THE CONSOLIDATED INTERIM FINANCIAL STATEMENTS
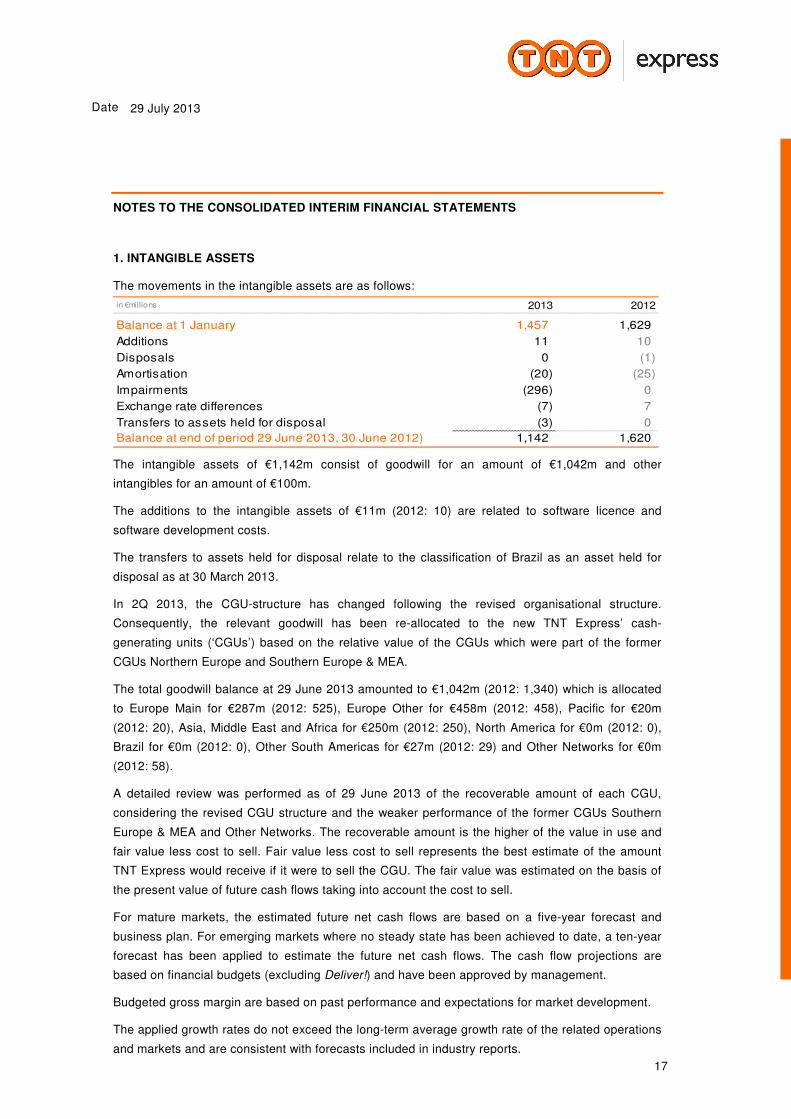
1. INTANGIBLE ASSETS
The movements in the intangible assets are as follows:
in € millions 2013 2012
Balance at 1 January 1,457 1,629
Additions 11 10
Disposals 0 (1)
Amortisation (20) (25)
Impairments (296) 0
Exchange rate differences (7) 7
Transfers to assets held for disposal (3) 0
Balance at end of period 29 June 2013, 30 June 2012) 1,142 1,620
The intangible assets of €1,142m consist of goodwill for an amount of €1,042m and other
intangibles for an amount of €100m.
The additions to the intangible assets of €11m (2012: 10) are related to software licence and
software development costs.
The transfers to assets held for disposal relate to the classification of Brazil as an asset held for
disposal as at 30 March 2013.
In 2Q 2013, the CGU-structure has changed following the revised organisational structure.
Consequently, the relevant goodwill has been re-allocated to the new TNT Express’ cash-
generating units (‘CGUs’) based on the relative value of the CGUs which were part of the former
CGUs Northern Europe and Southern Europe & MEA.
The total goodwill balance at 29 June 2013 amounted to €1,042m (2012: 1,340) which is allocated
to Europe Main for €287m (2012: 525), Europe Other for €458m (2012: 458), Pacific for €20m
(2012: 20), Asia, Middle East and Africa for €250m (2012: 250), North America for €0m (2012: 0),
Brazil for €0m (2012: 0), Other South Americas for €27m (2012: 29) and Other Networks for €0m
(2012: 58).
A detailed review was performed as of 29 June 2013 of the recoverable amount of each CGU,
considering the revised CGU structure and the weaker performance of the former CGUs Southern
Europe & MEA and Other Networks. The recoverable amount is the higher of the value in use and
fair value less cost to sell. Fair value less cost to sell represents the best estimate of the amount
TNT Express would receive if it were to sell the CGU. The fair value was estimated on the basis of
the present value of future cash flows taking into account the cost to sell.
For mature markets, the estimated future net cash flows are based on a five-year forecast and
business plan. For emerging markets where no steady state has been achieved to date, a ten-year
forecast has been applied to estimate the future net cash flows. The cash flow projections are
based on financial budgets (excluding Deliver!) and have been approved by management.
Budgeted gross margin are based on past performance and expectations for market development.
The applied growth rates do not exceed the long-term average growth rate of the related operations
and markets and are consistent with forecasts included in industry reports.

18
Date 29 July 2013
The discount rates used vary from 7.3% to 11.0% pre-tax (post-tax 7.2% to 10.8%) to reflect
specific risks relating to each CGU.
Key assumptions used to determine the recoverable values of all CGUs are:
− maturity of the underlying market, market share and volume development to determine the revenue
mix and growth rate;
− level of capital expenditure in network related assets that may affect the further roll-out of the
network;
− level of operating income largely impacted by revenue and cost development taking into account
the nature of the underlying costs, potential economies of scale; and
− discount rate to be applied following the nature of the underlying cash flows and foreign currency
and inflation related risks.
Based on the impairment test, management has concluded that the recoverable amount, based on
value in use of Other Networks and the former CGUs Northern Europe and Southern Europe &
MEA, is below the carrying amount for a total amount of €296m. This can be specified as follows:
− former CGU Northern Europe €79m;
− former CGU Southern Europe & MEA €159m;
− Other Networks €58m.
Of the total goodwill of €571m of the former CGU SEMEA, the total impairment is €159m. This is
due to the weaker performances of Italy and France and the higher granularity of the new CGUs as
a result of which compensating developments no longer are taken into account.
For the former CGU Northern Europe an amount of €79m is impaired, out of a total goodwill of
€659m, as a result of the generally worsened economic climate and the higher granularity of the
new CGUs.
For Other Networks the total of €58m goodwill is impaired as a result of the loss of a significant
fashion contract and the decline in the results of the Innight activities.
2. PROPERTY, PLANT AND EQUIPMENT
The movements in property, plant and equipment are as follows:
in € millions 2013 2012
Balance at 1 January 836 899
Capital expenditures in cash 29 40
Capital expenditures in financial leases/other 0 1
Disposals (1) (4)
Depreciation (59) (72)
Impairment 0 0
Exchange rate differences (17) 9
Transfers to assets held for disposal (57) (17)
Balance at end of period (29 June 2013, 30 June 2012) 731 856
Capital expenditures of €37m (including China Domestic and Brazil respectively presented as
Assets classified as held for disposal and discontinued operations as of 30 March 2013) consist of
investments within Europe Main of €13m, Europe Other and Americas of €3m, Pacific of €2m AMEA
19
Date 29 July 2013
of €10m, Brazil of €2m and Unallocated of €7m. The investments mainly relate to hubs, depots,
sorting machinery, depot equipment and vehicles.
The transfers to assets held for disposal relate to the classification of Brazil as an asset held for
disposal as at 30 March 2013.
3. PENSIONS
TNT Express operates a number of post-employment benefit plans around the world. Most of TNT
Express’ post-employment benefit plans are defined contribution plans. The most significant defined
benefit plans in place are in the Netherlands, the United Kingdom, Germany, Australia and Italy.
On the balance sheet, the net pension assets and net pension liabilities of the various defined
benefit pension schemes have been presented separately. TNT Express adopted the revised IAS
19 as of 1 January 2013. The impact of this change in accounting policy is explained in the Basis of
preparation and the 2012 comparatives have been restated accordingly. As at 29 June 2013, the
pension asset is €1m (2012: 1) and the pension liability is €136m (2012: 124).
4. ASSETS CLASSIFIED AS HELD FOR DISPOSAL AND LIABILITIES RELATED TO ASSETS
CLASSIFIED AS HELD FOR DISPOSAL
The assets classified as held for disposal amounted to €320m (2012: 235) and are related to China
Domestic of €109m (2012: 114), Brazil of €132m (2012: 0), vehicles of €0m (2012: 4) and aircrafts
classified as held for disposal of €79m (2012: 117). The liabilities related to assets classified as
held for disposal of €108m (2012: 45) are related to China Domestic for €34m (2012: 45) and Brazil
for €74m (2012: 0).
All assets classified as held for disposal and liabilities related to assets classified as held for
disposal are expected to be disposed of within one year.
In 2Q13, a loss of €53m was recorded in Other income for Asia, Middle East and Africa as a result of a
fair value adjustment for the two Boeing 747 aircraft (€38m) and China Domestic (€15m).
As at 31 December 2012, there were three aircraft classified as asset held for disposal. Two of
these aircraft were Boeing 747 freighters. The third aircraft was sold in 1Q13 with a result effect of
€0m.
(i) China Domestic
On 28 March 2013 TNT Express announced the sale of its domestic road operations in China (Hoau)
to private equity funds under the management of CITIC PE. This transaction follows on from TNT
Express’ previously announced intention to explore partnership opportunities for its domestic
activities in China.
The transaction and the subsequent settlements are subject to regulatory approvals. It is expected
to close in the second half of 2013 with settlement of part of the purchase price to be cleared in
2014.

20
Date 29 July 2013
The major classes of assets and liabilities classified as held for disposal relating to China Domestic
are presented below:
in € millio ns 29 Jun
Balance as a t 2013
Intangib le as s ets 40
Property, p lant and equipm ent 39
Financia l fixed as s ets 2
Current as s ets 28
Total as s ets 109
Non-current liab ilities 0
Current liabilities 34
Total liabilities 34
In 2013 the year-to-date revenue for China Domestic was €119m and operating income was €(4)m.
(ii) Brazil
As part of the updated strategy ‘Deliver!’, on 25 March it was announced Brazil will be sold, the
process was underway and targeted to be finalised by the end of the year. Consequently Brazil was
reported as an Asset held for disposal and discontinued operation.
The major classes of assets and liabilities classified as held for disposal relating to Brazil are
presented below:
in € millions 29 Jun
Balance as at 2013
Intangible assets 3
Property, plant and equipment 48
Financial fixed assets 1
Current assets 80
Total assets 132
Non-current liabilities 28
Current liabilities 46
Total liabilities 74
Condensed income statement Brazil
Income statement Brazilin € millions 2Q13 2Q12 1H13 1H12
Net sales 80 74 151 149
Total revenues 80 74 151 149
Total operating expenses (85) (92) (166) (185)
Operating income (5) (18) (15) (36)
Net financial (expense)/income 0 - 0 (1)
Profit/(loss) before income taxes (5) (18) (15) (37)
Income taxes 2 (5) (1) (10)
Profit/(loss) for the period (3) (23) (16) (47)
Attributable to:
Equity holders of the parent (3) (23) (16) (47)
Earnings per ordinary share (in € cents)1(0.6) (4.2) (2.9) (8.7)
1 Based on an average of 543,569,231 of outstanding ordinary shares (2012: 543,223,590)

21
Date 29 July 2013
Condensed statement of cash flows Brazil
Statement of cash flows Brazil 2Q13 2Q12 1H13 1H12
Net cash f rom/(used in) operating activ ities (6) (24) (20) (45)
Net cash f rom/(used in) investing activ ities - - (1) (2)
Net cash f rom/(used in) f inancing activ ities 6 24 23 38
Change in cash from discontinued operations 0 0 2 (9)
in € m illio ns
5. EQUITY
Total equity attributable to equity holders of the parent decreased to €2,390m on 29 June 2013 from
€2,610m as at 31 December 2012. This decrease of €220m is mainly due to the negative
comprehensive income attributable to equity holders €(207)m and the dividend paid for 2012 of
€11m. The comprehensive income mainly consists of €160m relating to the loss for the period, a
negative of €(39)m due to foreign currency translation results, a positive €4m due to gains on cash
flow hedges, net of tax and a negative of €12m due to adjustment actuarial gains and losses.
The Company’s authorised share capital amounts to €120m, divided into 750,000,000 ordinary
shares with a nominal value of €0.08 each and 750,000,000 Preference shares with a nominal
value of €0.08 each.
The Company’s issued share capital amounts to €43m divided into 544,261,665 ordinary shares
with a nominal value of €0.08 each.
Additional paid-in capital amounted to €3,008m on 29 June 2013 as a total dividend of €11m was
distributed in May 2013. The amount of paid-in capital recognised for Dutch dividend withholding
tax purposes was €791m.
For administration and compliance purposes, a foundation (Stichting Bewaarneming Aandelen TNT)
legally holds shares under (former) incentive schemes which are beneficially owned by the
employees. As at 29 June 2013, the number of TNT Express shares held by the foundation
amounted to 529,522 with a nominal value of €0.08 per share.
6. NET DEBT
The net debt is specified in the table below:
29 Jun 31 Dec
in € millions 2013 2012
Short term debt 41 71
Long term debt 181 191
Total interest bearing debt 222 262
Cash and cash equivalents (509) (401) Net debt/(cash) (287) (139)
The net debt position as at 29 June 2013 improved by €148m compared to 31 December 2012. The
improvement is due to a positive change in cash from continuing operations of €109m and change
in cash from discontinued operations of €2m and various non-cash items €37m.

22
Date 29 July 2013
The positive change in cash from continuing operations of €109m is due to net cash from operating
activities of €222m, net cash used in investing activities of €54m and a net cash used in financing
activities of €59m.
The long-term debt position of €181m includes €0m liabilities related to assets classified as held for
disposal, the short-term debt position of €41m includes €3m liabilities related to assets classified as
held for disposal, and the cash and cash equivalents position of €509m includes €7m assets
classified as held for disposal.
TNT Express has applied IFRS13 as of 1 January 2013. Consequently a debit value adjustment (DVA)
was calculated for the outstanding, long-term debt stated at amortised cost. This DVA results in a
decrease of the market value of the long term debt of €1m. Other accounts are not materially impacted.
7. OTHER PROVISIONS
The other provisions consist of long-term provisions and short-term provisions for employee
benefits, restructuring, claims and indemnities and other obligations. The long-term and short-term
provisions as at 29 June 2013 decreased by €40m compared to 1 January 2013, mainly due to the
classification of Brazil as an Asset held for disposal as at 30 March 2013. Refer to note 4.
in € millions 2013 2012
Balance at 1 January 172 189
Additions 14 22
Withdrawals/releases (15) (46)
Other/releases 0 0
Exchange rate differences (4) 0
Transfers to liabilities related to assets held for disposal (35) 0
Balance at end of period (29 June 2013, 30 June 2012) 132 165
The additions of €14m relate to claims indemnities (€3m), long-term employment benefits (€4m),
restructuring (€4m) and other movements (€3m). The withdrawals/releases of €15m relate to claims
indemnities (€4m), restructuring (€3m), long-term employment benefits (€2m) and other movements
(€6m).
The transfers to liabilities related to assets held for disposal relate to the classification of Brazil as
assets held for disposal.
8. OTHER INCOME
Other income in the first six months of 2013 included the receipt of the UPS termination fee of
€200m, an amount of €4m relating to the settlement of a claim and miscellaneous items of €1m,
partly offset by fair value adjustments of €(53)m (2012: 0) relating to Assets held for disposal.
23
Date 29 July 2013
9. TAXES
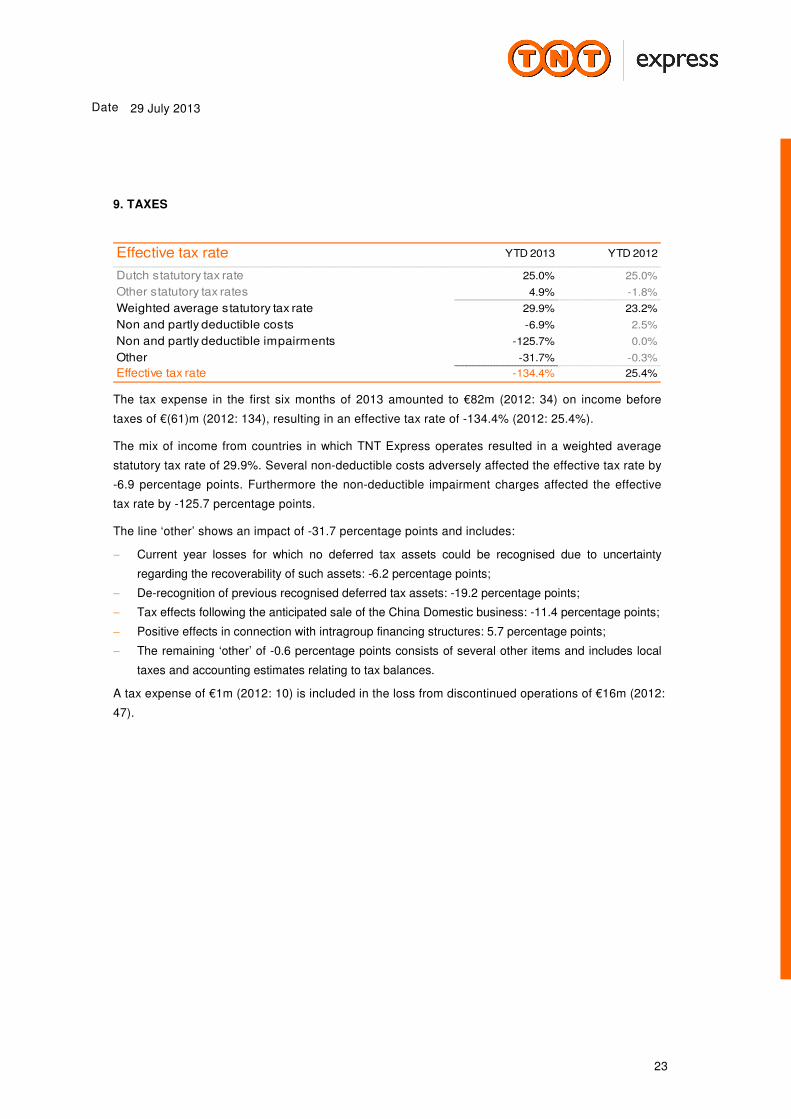
Effective tax rate YTD 2013 YTD 2012
Dutch statutory tax rate 25.0% 25.0%
Other statutory tax rates 4.9% -1.8%
Weighted average statutory tax rate 29.9% 23.2%
Non and partly deductible costs -6.9% 2.5%
Non and partly deductible impairments -125.7% 0.0%
Other -31.7% -0.3%
Effective tax rate -134.4% 25.4%
The tax expense in the first six months of 2013 amounted to €82m (2012: 34) on income before
taxes of €(61)m (2012: 134), resulting in an effective tax rate of -134.4% (2012: 25.4%).
The mix of income from countries in which TNT Express operates resulted in a weighted average
statutory tax rate of 29.9%. Several non-deductible costs adversely affected the effective tax rate by
-6.9 percentage points. Furthermore the non-deductible impairment charges affected the effective
tax rate by -125.7 percentage points.
The line ‘other’ shows an impact of -31.7 percentage points and includes:
− Current year losses for which no deferred tax assets could be recognised due to uncertainty
regarding the recoverability of such assets: -6.2 percentage points;
− De-recognition of previous recognised deferred tax assets: -19.2 percentage points;
− Tax effects following the anticipated sale of the China Domestic business: -11.4 percentage points;
− Positive effects in connection with intragroup financing structures: 5.7 percentage points;
− The remaining ‘other’ of -0.6 percentage points consists of several other items and includes local
taxes and accounting estimates relating to tax balances.
A tax expense of €1m (2012: 10) is included in the loss from discontinued operations of €16m (2012:
47).

24
Date 29 July 2013
10. LABOUR FORCE
29 Jun 31 Dec
Employees 2013 2012
Europe Main 23,930 24,386
Europe Other & Americas 10,438 10,500
Pacific 4,521 4,568
AMEA 14,626 15,880
Unallocated 5,739 5,833
Total 59,254 61,167
Average FTEs YTD 2013 YTD 2012
Europe Main 22,916 23,623
Europe Other & Americas 9,841 10,063
Pacific 5,022 5,107
AMEA 15,378 18,509
Unallocated 5,149 5,355
Total 58,306 62,657
The average number of full time equivalents (excluding discontinued operations) working in TNT
Express during the first six months of 2013 was 58,306, which decreased by 4,351 compared to
YTD 2012. This was mainly due to outsourcing in 2012 of certain activities in China and the closure
of the domestic air network in India in 2012.
The average number of full time equivalents relating to discontinued operations amount to 7,531
(2012: 8,473).
11. RELATED PARTIES
Performance share plan
In 2Q13, the Supervisory Board approved a Performance share plan (PSP) for employees including
key management personnel. This was implemented 30 April 2013, effective as of 1 January 2013.
The PSP contains the following main conditions:
− Annually shares are granted for an IFRS fair value of 30% of base salary.
− Participants have continued employment.
− Vesting period is 36 months after grant date.
− Realisation of performance targets:
− 50% of the granted shares will vest under a ‘Total Shareholder Return’ target (peer group Dutch
AEX listed companies);
− 50% will vest on the basis of 3 non-financial internal performance targets:
− Employees (33%)
− Customer (33%)
− Environment (33%)
− TSR is measured on a three year basis and non financial targets are measured on an annual basis
− Each year the performance condition is tested upon realisation. If met the vesting condition of
continued employment will come in place.

25
Date 29 July 2013
The expenses recognised in the first half year 2013 amounted to €1m (2012: €0m).
Joint ventures
Purchases of TNT Express from joint ventures amounted to €14m (2012: 14). During the first half
year from 2013, no sales (2012: 0) were made by TNT Express companies to its joint ventures.
As at 29 June 2013, net amounts due to the joint venture entities amounted to €13m (30 June 2012:
21). Net amounts due to associated companies amounted to €1m (30 June 2012: 0).
12. SUBSEQUENT EVENTS
Sale of equity interest in Apriso
After balance sheet date TNT Express’ investment fund Logispring sold its 14.3% equity interest in
Apriso. The cash proceeds to TNT Express are €25m. The book value at 29 June 2013 amounted
to €9m. The profit will be recorded as a Result from investments in associates in 3Q13.
Dividend
The Executive Board of TNT Express has decided, with the approval of the Supervisory Board, to
declare an optional pro forma dividend of €0.022 per share. This level represents a pay-out of about
40% of normalised net income over the first half of 2013, in line with TNT Express’ stated dividend
guidelines. The optional pro forma dividend is payable, at the shareholder’s election, either wholly
in ordinary shares or wholly in cash. The election period is from 30 July 2013 to 19 August 2013,
inclusive.
To the extent that the dividend is paid in shares, it will be paid free of withholding tax and it will be
sourced from the additional paid-in capital that is recognised for Dutch dividend withholding tax
purposes. The cash dividend will be paid out of the remaining additional paid-in capital. The ratio of
the value of the stock dividend to that of the cash dividend will be determined on 19 August 2013,
after the close of trading on NYSE Euronext by Euronext Amsterdam (‘Euronext’), based on the
volume weighted average price (‘VWAP’) of all TNT Express shares traded on Euronext over a
three trading day period from 15 to 19 August 2013, inclusive. The value of the stock dividend,
based on this VWAP, will, subject to rounding, be targeted at but not lower than 3% above the cash
dividend. There will be no trading in the stock dividend rights.
The ex-dividend date will be 30 July 2013, the record date 1 August 2013 and the dividend will be
payable as from 22 August 2013.

26
Date 29 July 2013
EXECUTIVE BOARD COMPLIANCE STATEMENT
In line with the requirements of the EU Transparency Directive as incorporated in the Dutch
Financial Markets Supervision Act (Wet op het financieel toezicht) the Executive Board confirms to
the best of its knowledge that:
− The consolidated interim financial statements for the period ended 29 June 2013 give a true and
fair view of the assets, liabilities, financial position and profit or loss of TNT Express N. V. and its
consolidated companies, and
− The Interim Report of the Executive Board gives a fair review of the information required pursuant
to section 5:25d/(8)/(9) of the Dutch Financial Markets Supervision Act (Wet op het financieel
toezicht).
Tex Gunning – Chief Executive Officer Bernard Bot – Chief Financial Officer
Hoofddorp, 29 July 2013
RISKS
TNT Express’ management regularly reviewed the risk profile of the company in the first half of
2013 and will continue to do so throughout the rest of the year. For those risks deemed material,
comprehensive mitigation action plans are developed and reviewed by the Executive Board. All
business units worldwide and material projects participate in the risk identification process, the
outcome of which is reported to the relevant functional management. Regular status reports
detailing the mitigation actions are provided to the Executive Board to further strengthen the
company’s risk management processes. The outcome of the risk management process is also
shared and discussed with the audit committee of the Supervisory Board and with the Supervisory
Board.
The Executive Board has reviewed TNT Express’ risk profile as at 29 June 2013 and confirms that
the risks disclosed in Chapter 4 (Section VI) of the TNT Express 2012 Annual Report have been
updated but remain and continue to require focused and decisive management attention in the
second half of 2013. On 25 March 2013, TNT Express announced its profit improvement plan under
the name Deliver!. The Deliver! programme includes various cost reduction and restructuring
measures. The Executive Board has more explicitly included the risks around this program as part
of the updated risk profile that can be found at www.tnt.com/corporate/risks.
It should be noted that no matter how good a risk management and control system is, it cannot be
assumed to be exhaustive nor can it provide certainty that it will prevent negative developments in
TNT Express’ business and business environment from occurring or that mitigating actions are fully
effective. It is important to note that new risks could be identified that are not known currently.

27
Date 29 July 2013
FINANCIAL CALENDAR
28 October 2013 Publication 3Q13 results
Additional information available at www.tnt.com/corporate/en/site/home.html#
CONTACT INFORMATION
WARNING ABOUT FORWARD-LOOKING STATEMENTS
Some statements in this press release are "forward-looking statements". By their nature, forward-looking
statements involve risk and uncertainty because they relate to events and depend on circumstances that will
occur in the future. These forward-looking statements involve known and unknown risks, uncertainties and other
factors that are outside of our control and impossible to predict and may cause actual results to differ materially
from any future results expressed or implied. These forward-looking statements are based on current
expectations, estimates, forecasts, analyses and projections about the industries in which we operate and
management's beliefs and assumptions about future events. You are cautioned not to put undue reliance on
these forward-looking statements, which only speak as of the date of this press release and are neither
predictions nor guarantees of future events or circumstances. We do not undertake any obligation to release
publicly any revisions to these forward-looking statements to reflect events or circumstances after the date of
this press release or to reflect the occurrence of unanticipated events, except as may be required under
applicable securities laws.
INVESTOR RELATIONS MEDIA RELATIONS PUBLISHED BY TNT Express N.V.
Andrew Beh
Phone +31 (0)88 393 9500
Email [email protected]
Michiel van der Harst
Phone +31 (0)88 393 9500
Cyrille Gibot
Phone +31 (0)88 393 9390
Mobile 31 (0)6 5113 3104
Email [email protected]
Taurusavenue 111
2132 LS Hoofddorp
P.O. Box 13000
1100 KG Amsterdam
Phone +31 (0)88 393 9000
Fax +31 (0)88 393 3000
Email [email protected]