financial instability in historical perspective...
TRANSCRIPT

Financial Instability in Historical Perspective
Abstract
In the United States for the last century and a half, Depository institutions have been overseen via four regulatory regimes. All of those systems suffered periodic perturbations. This essay examines those systems’ susceptibility to financial panics. Panics were events which occurred when creditors lost confidence in the system and ceased extending loans and when depositors lost confidence in the system and withdrew funds en masse. Analysis of time until the implosion of the central money market indicates the twenty-first century regime is no more stable than its nineteenth century predecessor and significantly less stable than the regimes that operated throughout the twentieth century. Comparing characteristics across regimes reveals sources of instability in the current system and reforms which might reduce the frequency of future central-money-market meltdowns.
Gary Richardson University of California at Irvine and National Bureau of Economic Research

1
Outline 1. Introduction 2. Four Regulatory Regimes 3. Financial Panics from 1873 until 2008 4. Methods and Results 5. Conclusions Dear audience, I pushed envelope on presenting this paper to get comments from the audience at Indiana. I think it is the best place to discuss an early version of this research. As you’ll see, recent events inspired this idea. I thought that I could complete the paper within a few weeks. The difficulty of conducting legal research, however, vastly exceeded my initial (and naïve) estimates. Note that with the exception of the title, every section of this essay is preliminary and incomplete. I do, however, have detailed power points. I hope that you will be able to follow my arguments, tell me where I am wrong (or crazy), and point me in productive directions. Thanks Gary
2
1. Introduction
Four depository-institution regulatory regimes operated in the United States during the
last 150 years. These regimes differed in the along many dimensions including the strictness of
the regulatory regime, the structure of corporate governance, the substantiveness of deposit
insurance, the existence of a central bank, and the philosophy of economic policy makers.
All of these regulatory regimes suffered periodic perturbations. The financial
disturbances with the most severe impacts impeded the processing of payments in the central
money markets. These panics occurred during 1873, 1893, 1907, 1933, and 2008. During these
events, creditors lost confidence in the system and ceased extending loans and when depositors
lost confidence in the system and withdrew funds en masse. These credit crunches had
macroeconomic effects. All contributed to business cycle slowdowns. The panics of 1893 and
1933 occurred at the beginning of severe contractions that contemporaries named a “Great
Depression.” Events of 2008 appear to coincide with the onset of a worldwide recession,
although the extent of the downturn remains to be seen.
This essay analyzes the current crisis in historical perspective. The goal is to derive
insight into a key question: when will the modern financial regime experience disturbances like
the one we are currently experiencing. Analysis of time until the meltdown of the central money
market across the four financial regimes yields a troubling insight. Depository-institution
regulatory regimes appear to be of two types. Regimes that seek stability first – like the regime in
operation in the United States from the mid 1930s through the early 1990s – seldom suffer
financial panics. In fact, the United States post-depression stability-first regime experienced no
crises that afflicted the processing of payments in the central money market and no disturbance
that approached that magnitude. All of the other depository-institution regulatory regimes –
3
including the National Banking regime established in 1864, the Federal Reserve regime
established in 1913, and the modern regime established in the 1990s – experienced financial
panics so severe that the central money markets shut down (or in the recent case, tottered on the
precipice of implosion, and remained in operation only after central bank intervention of
unprecedented scope and scale). History, in other words, tells us that a crisis like the current one
will occur sometime in the future.
The rest of this paper describes why this will occur, how the current crisis relates to its
predecessors, and what past regulatory regimes teach us about the possibilities for mitigating or
preventing panics in the future. Section 2 describes the current and past regulatory regimes.
Section 3 describes the banking crises of 1873, 1893, 1907, 1933, and 2008. Section 4 describes
my method for estimating the time until the failure of a regulatory regime. Section 5 concludes.

4
2. Four Regulatory Regimes Four financial-institution regulatory regimes operated in the United States during the last
150 years. Congress inaugurated the first with the National Banking Act of 1864; the second with the Federal Reserve Act of 1913; the third with the Banking Acts of 1933 and 1935; and the fourth with the a series of laws passed during the 1980s and 1990s. The most significant acts came in 1987, 1994, and 1999.
These regulatory regimes differed on many dimensions … Note to the reader: this section
is taking much longer to research than I anticipated. Banking regulations differed on many dimensions over time and across states. No source contains all of the relevant information for past state legal codes. This section contains my notes on the topic. Table 1 contains additional details.
Corporate governance … compensation structure and liability born by shareholders, directors, and executives
laws imposing fiduciary responsibility laws mandating release of accurate financial information laws imposing liability for losses corporate structure exposing owners, directors, and executives to investment risk
Central bank’s existence and operation
Philosophies of discretionary economic policy makers
Deposit insurance … and other forms of forbearance by monetary and fiscal authorities Regulatory stringency including rules regarding investment activities of deposit taking institutions, levels of required reserves and capital, and entry of firms into the banking business … Liability used to control moral hazard … Limitations on actions used to control moral hazard and limit risk taking … Stringency of regulatory regime …
Corporate governance … compensation structure and liability of shareholders and executives for losses to depositors
Central bank’s existence and operation
Philosophies of discretionary economic policy makers Shift to ability to extract personal profits earlier

5
3. Financial Panics from 1873 to 2008. Measures of Panics
1) withdrawals from system en masse a. forcing institutions to suspend conversion of currency to deposits OR b. forcing institutions to employ alternatives to convention currency OR c. requiring intervention by monetary authorities to restore the stability of the
system d. ONLY include panics affecting the central money markets that forced the
interruption of activity in those markets, via voluntary closures of institutions or government decree, or that threatened to interrupt activity in the central money markets if monetary authorities did not intervene
2) Creditors lose confidence a. Creditors cease rolling over short term credit b. Creditors call loans c. Creditors cease to extend loans in circumstances where in the past they would
have offered loans at reasonable interest rates What are the panics 1873, 1893, 1907, 1933, 2008 Panic of 1873 The underlying cause of the financial panic in 1873 was the expansion of railroads into undeveloped western territory. This activity promised substantial returns, but required large-scale, long-term financing. Railroads took years from the start of construction until turning a profit. During the 1860s, railroads added an average of 2,000 miles of track each year, financing much of this construction with by selling land granted by the federal government. In 1871, the federal government discontinued policy of land grants, as private financing flowed to railroad corporations in ever-increasing quantities, and the pace of construction increased to 4,000 miles per year. During the summer of 1873, as railroad financing peaked, problems arose for financial institutions. In July, the Brooklyn Trust Company, which lost funds advanced to the New Haven and Willimantic Railroad, closed its doors to depositors. On September 8, the Mercantile Warehouse and Security Company failed, after an institution whose bonds it held, the Missouri, Kansas, & Texas Railroad, missed payments on interest. On September 15, Kenyon, Cox, and Company failed, after an institution whose bonds it endorsed, the Canada Southern Railroad headed toward default. On September 18, a large and prominent investment firm, Jay Cooke and Company, failed. Its Philadelphia branch had loaned $15 million to the Northern Pacific Railroad. The note could not be repaid when it came due. The First National Bank in Philadelphia and the First National Bank of Washington D.C, both subsidiaries of Cooke and Company, suspended operations.

6
“Jay Cooke and Co. was one of the most prestigious merchant banking houses in the United States. Its closing was a surprise and changed the character of the crisis. … news that its affiliates in Philadephia and Washington, D. C. … had also closed brought pandemonium to Wall Street. Stock prices tumbled, followed by a veritable wave of insolvencies, including more than thirty brokerage houses (Wicker 2000 p. 20).”
Runs struck banks and brokerages in Philadelphia, Washington, and New York. Numerous institutions closed their doors to depositors, hoping to ride out the storm by refusing to redeem deposits. Action by individual firms, however, failed to tame the tempest. On September 20, financial institutions began to act in unison. The New York Stock Market ceased operations, for the first time in its history, and remained closed for ten days. The New York City Clearing House authorized the equalization of reserves among clearing house members, began issuing clearing house loan certificates, and gave its executives the power to redistribute currency among member banks. The overall reserve position continued to deteriorate, however, and four days later, on September 24, the New York City Clearing House suspended cash payments. The suspension spread nationwide by September 27. As the financial situation deteriorated in New York, financial unrest spread along the Eastern seaboard. Runs occurred on financial institutions in Petersburg and Richmond, Virginia; Augusta and Savannah, Georgia; and Charleston, South Carolina. Financial unrest also spread in to commercial centers inland, including Chicago, Illinois; Indianapolis, Indiana; Memphis, Tennessee; and Louisville, Kentucky. These panics followed patterns similar to events in New York. In Richmond, for example, heavy withdrawals began on September 24, a week after panic struck New York and a day after runs began on banks in the nearby city of Petersburg. On the next day, banks began to enforce the clause requiring advanced notice for savings withdrawals and taking other actions to limit deposit losses. Institutions suffering the heaviest drains closed their doors to depositors. On September 26, the national banks in Richmond agreed to stand behind each other if the need arose, and the Richmond Clearing House began to issue loan certificates to settle interbank claims. The panic soon subsided. Chicago probably suffered more severely than any inland city. Immediately after the failure of Jay Cooke and Company, commodity prices plummeted. A bank and a brokerage house failed. Fifteen out of twenty savings banks activated the clause requiring thirty days notice before withdrawals. Commercial banks withdrew large balances from reserve institutions in New York City. On the day that the New York Clearing House announced the suspension of cash payments, the Chicago clearing house considered a similar measure, but decided against such action, although recommending that members refuse payment on large demands made upon them by country banks or over their counter. Within a few days, the six largest banks in Chicago had suspended operations, followed by most of the smaller banks in the Windy City. Almost all of these institutions remained solvent. All but one reopened on September 29. The later reopened three weeks later. By the middle of October, resources at Chicago banks had fallen by 40 percent. Deposits had decline by 22 percent. Cash reserves, however, had increased, because banks hoarded currency to defend themselves against renewed demands by depositors.

7
Throughout the nation, financial institutions resumed normal operations during the month of October. By then, about 60 brokerage houses and 40 banks (most in New York and Philadelphia) had gone out of business. Many more – perhaps the majority of those in the nation – had temporarily suspended operations. The cost of credit had risen rapidly. The rate for prime commercial paper peaked at 17 percent, roughly two to three times its normal level. The stock market had fallen by 35 percent. The annual GNP growth rate fell from 5% in 1872 to 2% in 1873. Panic of 1893 A series of shocks preceded the financial crisis. In January 1892, an economic contraction began.1 All contemporary business journals noted slowdown (Wicker 2000 p. 80). Prices of commodities, particularly wheat and iron, declined. Large business felt the pinch. On February 26, the Philadelphia and Reading Railroad went into receivership. The stock market, particularly values of industrials, declined rapidly for the next two months (Sprague 1910, p. 163). On April 21, the United States Treasury’s gold reserve slipped below $100 million. Falling below this threshold generated uncertainty about the Treasury’s ability to convert treasury notes into gold (Lauck 1907, p. 97). The Secretary of Treasury’s comments on the matter sent the stock market plummeting and call money rates soaring. Markets stabilized after President Cleveland released a statement ensuring the continued redemption of treasury notes with gold. On May 3, the stock market collapsed. Prices of industrials declined precipitously. The most active stock, National Cordage, declined from 23 to 4 (from a high of 75 in February). Banks called loans to the corporation, which filed bankruptcy, forcing three brokerages which had speculated in its stock to cease operations (Wicker 2000 p. 59). During the weeks that followed the stock market collapse, commercial banks in several cities experienced difficulties (which appear to have had no direct link to the stock market decline) (Wicker 2000, p. 60). On May 8, Chemical National Bank of Chicago with $1.6 million in deposits closed it doors to depositors. Rumors of links between Chemical National Bank and the Columbia National Bank (with deposits of $1.5 million) precipitated the failure of that institution. Columbia Nationals served as a correspondent for at least 30 country banks in surrounding states. Its collapse forced most of those banks to suspend operations. Its collapse also forced the closure of the 12 banks in the Dwiggings-Starbuck chain, with which it was affiliated, and the collapse of the National Bank of Deposit in New York, with which it had a longstanding relationship. These bank suspensions appear to have been isolated events with mild effects on the general level of depositor confidence. In many Midwestern cities, large depositors drew down deposit balances, but the process appeared orderly and gradually, rather than panicked and precipitous. In June, the character of the disturbance changed. City-wide runs engulfed savings banks in Chicago, Omaha, Detroit, Cleveland, and Kansas City and commercial banks in Milwaukee, Spokane, Los Angeles, San Diego, San Francisco, and San Bernadino. In these cities, long lines of frightened depositors appeared outside financial institutions. Many banks met depositors’ demands, but some invoked the thirty-day clause to slow the pace of withdrawals. In Detroit, fourteen savings banks restricted withdrawals, as did many institutions in Kansas City. In Cleveland, bankers organized a coordinated response in which all institutions restricted payments 1 The National Bureau of Economic Research identified a cyclical peak in January 1893.
8
to depositors. In California, twenty five banks closed their doors to depositors. Eighteen resumed operations within three days; three more resumed operations within one month. Across the nation, a total of 126 institutions suspended operations at some time during the month, as Table 3 indicates. In the second week of July, bank suspensions accelerated. Attention focused on six cities in Western states that served as centers of trade and finance for agricultural hinterlands. In these entrepots, the banks that suspended operations did so after rapid withdrawals by local depositors and out-of-town correspondent banks depleted cash on hand. Table 4 reveals an important aspect of these events. Half of the banks that closed their doors to depositors resumed operations soon thereafter. These banks were certainly solvent, and survived the sudden contraction in credit by ceasing payments. Once depositors regained confidence and normal financial flows resumed, these institutions returned to business as usual. After peaking in July at 216, the pace of suspensions slowed. During August, 101 institutions suspended operations. As in earlier months, most of these banks were located in states in the Midwest, Pacific Coast, Great Plains, or Old South. A substantial share of those tat suspended during the peak panic months of June through August (95 out of 446) rapidly reopened their doors to depositors. These institutions, which held nearly one-third of the deposits in suspended banks, must have been solvent, since they survived the disturbance and continued to post profits. While the preponderance of banks that failed operated in the interior of the country, the disturbance did reach the central money market. On June 15, in hopes of insulating itself from events at lower levels of the banking pyramid, the New York Clearing House authorized the issue of Clearing House Certificates. The Philadelphia and Boston Clearing Houses soon followed suit. In all of these cities, depositors remained calm, and bank reserves remained substantial. On August 3, banks in New York
“severely restricted, though they did not completely halt, the shipment of currency to the interior … New York banks were simply unwilling to suffer further declines in their reserves. They gave as their reason the fact that further depletion might lead to a loss of depositor confidence – presumably in New York Banks (Wicker 2000 p. 77).”
The reluctance of banks in the central money market to ship currency to correspondent institutions created a currency famine in the interior. A premium on currency arose as country banks scrambled to acquire cash. Banks seeking currency paid premiums of roughly one percent during the first week of August and two percent during the second week. Premiums of that magnitude lasted for most of the month. Banks throughout the United States rationed cash. Banks belonging to the clearing house in Richmond, Virginia refused withdrawals of more than $50 per customer. Banks in New Orleans refused to ship currency to pay demand deposits (Wicker 2000, p. 78). This unsettled situation spread throughout the nation. Banks throughout the mid and far west refused to honor drafts drawn on New York banks. The refusal to honor New York drafts slowed the shipment of crops and manufactures to the East Coast. The sudden illiquidity of deposits reduced their utility relative to currency, inducing depositors to hold fewer deposits and more cash. This shift in the deposit/currency ratio reduced the money supply and deflated the price level, further weakening financial institutions (Friedman and Schwartz 1963, p. 110). Depositors’ distrust of banks exacerbated this effect.

9
“The suspension of cash payments generated economic trauma, leaving a residue of distressing experiences which etched itself in the public’s mind (Wicker 2000, p. 80).”
The contraction of the real economy accelerated. Aggregate output fell in 1893 and 1894.2 Unemployment rose. The credit contraction appears to have affected the economy through several channels. Expectations became pessimistic. Uncertainty increased. Deflation raised real interest rates. The destruction of financial institutions raised the costs of credit intermediation. The cash and credit crunch prevented firms from paying suppliers or meeting payrolls. The cessation of exchange interrupted flows of commodities and crops among different sections of the nation. Both aggregate supply and demand, in other words, probably shifted inwards. Panic of 1907 The 1907 panic began with an unsuccessful attempt to corner the copper market (Wicker 2000 pp. 83-113). On October 16, two brokerage houses at the center of the copper corner failed. Runs immediately ensued on eight banks connected with the leaders of the copper scheme. Five of the banks belonged to the New York City Clearing House (NYCH), which quickly acted to aid its ailing members. Clearing-house examiners demonstrated the solvency of these banks, and the clearing house placed $10 million at their disposal. Runs on these banks subsided, and all repaid the emergency loans within one week. I have to flesh out this section … you see more about this in future drafts of the paper. Panic of 1933
Began in 1929
Panic of 2008
Began in 2007
What do we exclude … shakeouts of industry caused by changes in financial technology … merger movement of late 19th century and spread of interstate branch banking a century later in the 1980s and 1990s … failures of institutions due to shocks that affected segments, perhaps large, of the industry, but that did not threaten the flow of credit through the system as a whole, for example failure of banks in agricultural states during the 1920s due to overextension during WW1, contraction of international demand for American crops when European grain-growing areas resumed full-scale production, and the onset of severe droughts in the center of the United States
2 Romer (1989) estimates that real GNP declined by 0.8 percent in 1893 and 0.9 percent in 1894. Balke and Gordon (1989) estimate that real GNP remain unchanged in 1893 and fell by 2.9 percent in 1894.

10
… failures of large numbers of institutions due to changes in macroeconomic conditions and/or the regulatory regime that did not limit the flow of credit through the system as a whole, for example the savings-and-loan crisis of the 1980s, caused by the high-inflation of the 1970s, which bankrupt financial institutions designed to operate in a low-inflation (or deflationary) environment. The losses incurred by the industry were then, of course, exacerbated by regulatory changes that encouraged FSLIC-insured institutions to embark on new and risky ventures in hopes of earning enough to avoid bankruptcy. Exclude 1884, 1890, 1925 cotton, Cuba, Florida, S&L, 1987, LTCM, Dotcom, 1997 Asian and other international Why US focus … regulations largely national … crises have domestic origins, impact on world due to international linkages

11
Table 1 Characteristics of Four Regulatory Regimes 1 2 3 4 National
Banking Federal Reserve
Stability via Regulation
Innovation via Deregulation
Dates Begin 1863 1913 ~1935 ~1990 End 1912 1933 ~1990 Corporate Governance Commercial Banks Shareholder Liability Double Double Limited Limited Director Liability Yes Yes No No Insolvency Liability Yes Yes No No Managers & Owners Same Same Transition Separate Compensation of
Corporate Officers Ownership
and Wage Ownership and Wage
Wage Incentive
Investment Banks Shareholder Liability Unlimited Unlimited Unlimited Limited Managers & Owners Same Same Same Separate Compensation of
Corporate Officers Ownership
and Wage Ownership and Wage
Ownership and Wage
Incentive
Government Insurance None None* Deposits Deposits** Intermediate Credit None Farm, Trade Home, Trade,
Farm, Foreign Home, Trade, Farm, Foreign
Regulations Accounting Book Book Book Market Securities Permissive Permissive Restrictive Permissive Interest Limitations Yes Yes Yes No Separate Commercial and
Investment Banking No No Yes No
Separate Mortgage and Commercial Banking
Yes Yes Transition No
Shift to extracting personal profits earlier. Intermediate Credit Banks (e.g. Fannie and Freddy) Discounts of Commercial Paper

12
Table 2 Bank Suspensions and Reopenings during 1893. Month #
Suspensions Liabilities in Suspensions ($ millions)
# Resumptions
% Liabilities in Resumptions
January 7 2 February 5 2 March 8 3 April 13 4 May 57 18 June 126 34 July 219 73 August 101 25 Total 536 161 100 30.7 Source: Wicker 2000, pp. 55. Bradstreet’s, September 23, 1893, pp. 599-601.

13
Table 3 Banking Panics during July, 1893
City Date of Panic
# Suspensions
$ Liabilities in Suspensions
# Resumptions
% Liabilities in Resumptions
Kansas City, KS & MO July 11-17 8 7,340,000 4 68 Denver, CO July 17-19 12 6,634,000 5 65 Louisville, KY July 22-25 5 4,447,000 4 88 Milwaukee, WI July 22-29 4 9,684,000 2 25 Portland, OR July 27-29 7 6,047,000 4 49 Total 36 34,152,000 19 53 Source: Wicker 2000, pp. 62-77 and Tables 4.7 to 4.15. Note that I have included Milwaukee
Fire and Insurance in the number of reopened institutions. Wicker excluded this observation.

14
Table 4 Bank Changes Due to Financial Difficulties by Category and Year January 1929 through March 1933
Categories 1929 1930 1931 1932 1933 Total
Suspensions, Terminal 433 1078 1958 1300 420 5189Suspensions, Temporary 70 278 316 161 48 874Consolidations Due to Financial Difficulties 54 136 309 151 38 688Voluntary Liquidations 39 86 110 99 37 371
Total 596 1578 2693 1712 543 7122
Note: Statistics for 1933 include only the months January through March. Figures do not include banks closed due to government proclamations, moratoria, or banking holidays. Source: National Archives and Records Administration.

15
Table 5 Regulatory Regime Begin End Panics 1. National Banking 1863 1912 1873, 1893, 19072. Federal Reserve 1913 1933 19333. Stability via Regulation 1934 ~19904. Efficiency via Innovation ~1990 2008 49 years, 3 panics, average time until panic 16 years 20 years, 1 panic, average time until panic 20 years 56 years, 0 panics, average time until panic infinity 18 years, 1 panic, average time until panic 18 years

16
Figure 1 Terminal and Temporary Bank Suspensions, January 1929 through March 1933
0
20
40
60
80
100
120
Jan-29 Jan-30 Jan-31 Jan-32 Jan-33
Num
ber o
f Ban
ks P
er W
eek
Terminal SuspensionsTemporary Suspensions
Definitions: A bank suspension occurred when a bank closed its doors to depositors and ceased conducting normal banking business for at least one business day. Banks that suspended terminally never reopened. Banks that suspended temporarily did reopen. Note: Figures for 1933 include only changes occurring in January through March except those which occurred to institutions closed by government proclamation of banking moratoria or holidays. Source: National Archives and Record Administration. See footnote # 1 for details.
17
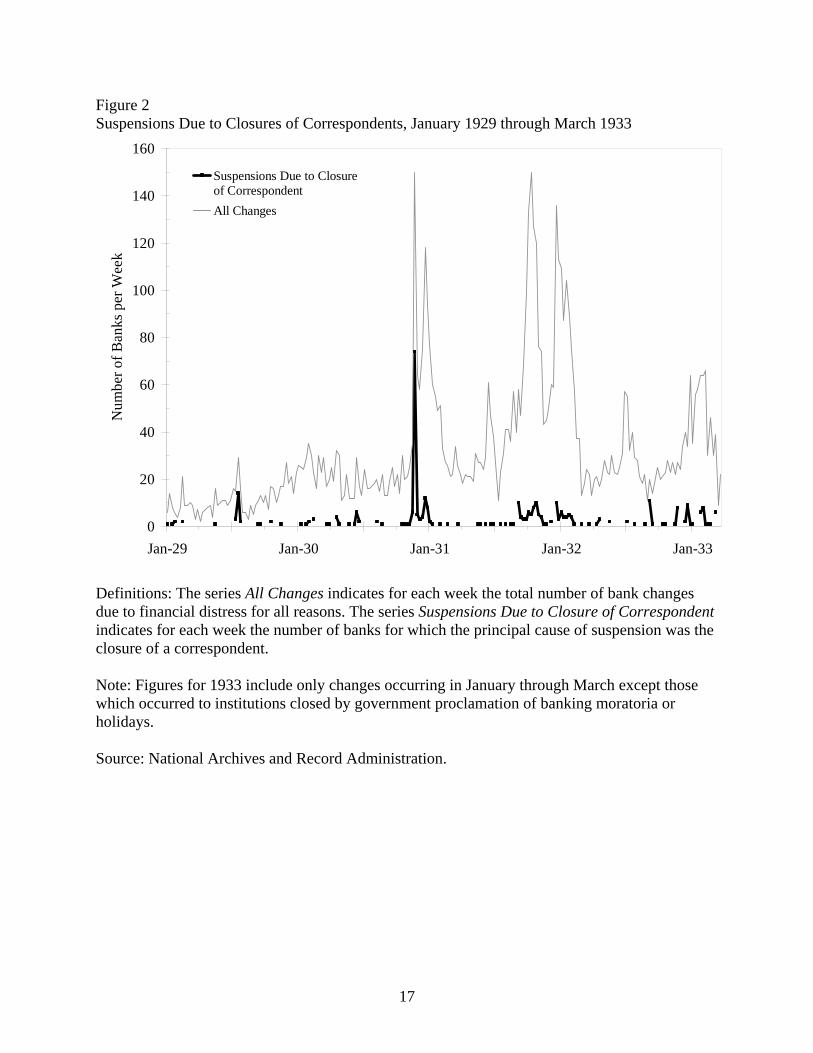
Figure 2 Suspensions Due to Closures of Correspondents, January 1929 through March 1933
0
20
40
60
80
100
120
140
160
Jan-29 Jan-30 Jan-31 Jan-32 Jan-33
Num
ber o
f Ban
ks p
er W
eek
Suspensions Due to Closureof CorrespondentAll Changes
Definitions: The series All Changes indicates for each week the total number of bank changes due to financial distress for all reasons. The series Suspensions Due to Closure of Correspondent indicates for each week the number of banks for which the principal cause of suspension was the closure of a correspondent. Note: Figures for 1933 include only changes occurring in January through March except those which occurred to institutions closed by government proclamation of banking moratoria or holidays. Source: National Archives and Record Administration.

18
Figure 3a Figure 3b Checks in Transit and Bankers’ Balances, 1913 to 1939 Actual Reserves as a Fraction of Apparent Reserves
0
1,000
2,000
3,000
4,000
5,000
6,000
7,000
1915 1920 1925 1930 1935
Year
$ M
illio
n
0.1
0.2
0.3
0.4
0.5
0.6
Rat
io
Checks in Transit (Float)
Bankers' Balances (including reserves)
Ratio
0.2
0.4
0.6
0.8
1
1915 1920 1925 1930 1935Year
Actual Reserves as a Fraction of Apparent Reserves
Figure 3c Figure 3d Actual and Apparent Reserves Over Time Actual and Apparent Reserves Relative to Total Assets
0.00
0.50
1.00
1.50
2.00
2.50
3.00
3.50
4.00
4.50
1915 1920 1925 1930 1935Year
Apparent Reserves as a Percentage of Apparent Reserves in 1913
Actual Reserves as a Percentage of Apparent Reserves in 1913
0.00
0.05
0.10
0.15
0.20
0.25
0.30
1915 1920 1925 1930 1935Year
Apparent Reserves as a Fraction of Total Assets
Actual Reserves as a Fraction of Total Assets
Source for Figures 1 to 4: Board of Governors, All Bank Statistics, Table A-3, p. 43, 1959. Notes: These series were constructed using data from June 30 of each year or the nearest available date. Apparent reserves equal ‘currency and coin’ plus ‘bankers’ balances (including reserves).’ Actual reserves equal apparent reserves minus 1.5 times ‘cash items in the process of collection.’

19
Figure 4 Suspensions Due to Illiquidity, January 1929 through March 1933
0
20
40
60
80
100
120
140
160
Jan-29 Jan-30 Jan-31 Jan-32 Jan-33
Num
ber o
f Ban
ks p
er W
eek
Distress Due to Illiquidity,Broad Definition
Distress Due to Illiquidity,Lower Bound
All Changes Due to BankDistress
Definitions: The series All Changes Due to Bank Distress indicates for each week the total number of bank changes due to financial distress for all reasons. For remaining definitions, see Section 4. Note: Figures for 1933 include only changes occurring in January through March except those which occurred to institutions closed by government proclamation of banking moratoria or holidays. Source: National Archives and Records Administration.

20
Figure 5 Illiquidity Relative to Insolvency as the Cause of Bank Suspensions July 1930 through March 1933 (a) Share of suspension due to illiquidity minus share of suspensions due to insolvency, Thirteen-week moving averages.
-0.40
-0.30
-0.20
-0.10
0.00
0.10
0.20
Jul-30 Jul-31 Jul-32
Ratio - Broad Definitions
Ratio - Lower Bounds
(b) Number of bank changes due to distress each week.
0
50
100
150
Jul-30 Jul-31 Jul-32
All Changes Due toBank Distress
Definitions and Notes: The plotted series in Figure 9(a) are ∑+
−
6
6
t
ttR . See Section 4 for details.
Source: National Archives and Records Administration.

21
Figure 6 Percentage of Banks in Business and in Operations in the 6th and 8th Federal Reserve Districts Mississippi, July 1929 to June 1933
0.600
0.700
0.800
0.900
1.000
Jul-29 Jan-30 Jul-30 Jan-31 Jul-31 Jan-32 Jul-32 Jan-33 Jul-33
6th District - in business
6th District - in operation
8th District - in business
8th District - in operation
Caldwell collapses
UK abandons gold standard
FDR elected
8th District eases Glass-Steagall Feb. '32
Notes: The difference between ‘banks in operation’ and ‘banks in business’ is the percentage of temporarily suspended banks. The numerator of the series ‘banks in operation’ is the number of banks in operations on 1 July 1929 minus the number of banks which since that date suspended operations (either temporarily or permanently), consolidated due to financial distress, liquidated voluntarily, or surrendered their charter after merging with another institution and plus the number of banks which since 1 July 1929 newly opened for business or reopened after temporarily suspending operations. The numerator of the series ‘banks in business’ equals ‘banks in operation’ plus the number of suspended banks yet to reopen. The denominator of both series is the number of banks in operation (which equals the number of banks in business) on 1 July 1929. For the 6th District, that number is 141. For the 8th District, that number is 169. Source: See Section 1.
Frac
tion
of B
anks
in O
pera
tion
on 1
July
192
9

22
Newspapers, Periodicals, and Primary Sources Comptroller of Currency Annual Reports Bradstreet’s Rand McNally Bankers Directory Federal Reserve ST-6386 Database. New York Times Wall Street Journal Washington Post Los Angeles Times References Andrew, A. Piatt. 1908a. “Substitutes for Cash in the Panic of 1907.” Quarterly Journal of
Economics (February): 290-99. Calomiris, Charles W. 1993. “Regulation, Industrial Structure and Instability in U.S. Banking: A
Historical Perspective,” in Structural Change in Banking, eds. Michael Klausner and Lawrence J. White. New York University Salomen Center. Business One Irwin, Homewood, Ill.
Cowles, Alfred and Associates. 1938. Common Stock Indexes 1871-1937. Bloomington, Ind:
Principia Press. Dewey, Davis R. 1968. Financial History of the United States. New York: Augustus Kelley. D. S. C. “Corporations: Limited Liability: Amendments of the California Constitution and
Code.” California Law Review, Vol. 17, No. 3 (March 1929) pp. 276-281. Editors. “Corporations. Banks and Banking. Stockholders’ Liability. “Liabilities Accruing”
during Period of Ownership.” Columbia Law Review. Vol. 33, No. 2 (February 1933), pp. 361-363.
Editors. “Liability of Directors as a Means of Securing the Solvency of Banks.” Yale Law
Journal, Vol. 40, No. 6 (April 1931), pp. 994-996. E. G. T. Jr. “Ambit of Double Liability of National Bank Stockholders.” University of
Pennsylvania Law Review and American Law Register, Vol. 80, No. 8 (June, 1932), pp. 1133-38.
Bernanke, B. S. “Nonmonetary Effects of the Financial Crisis in the Propagation of the Great
Depression.” American Economic Review, June 1983, (73), pp. 257-276.
23
Board of Governors of the Federal Reserve System. 1929. “Memorandum Regarding Preparation of Reports of Changes in Status of Member and Nonmember Banks,” Memo: November 18, 1929. National Archives, Record Group 82, Federal Reserve Central Subject File, 421.113.
----- 1930. Committee on Branch, Group and Chain Banking, “Bank Changes – Definitions of Terms,”
Memo: November 5, 1930. National Archives, Record Group 82, Federal Reserve Central Subject File, 421.113-1.
----- 1931. Committee on Branch, Group and Chain Banking. “Comments Regarding Preparation of
Form F.” 23 November 1931. National Archives, Record Group 82, Federal Reserve Central Subject File, 421.113-1, Forms and Instructions.
----- 1937. “Bank Suspensions in the United States.” Federal Reserve Bulletin. Washington, D.C.:
Board of Governors of the Federal Reserve System. September, 1937. ----- Banking and Monetary Statistics, 1914-1941. Washington, D.C.: Federal Reserve System, 1943. ----- All Bank Statistics, 1896-1955. Washington, D.C.: Federal Reserve System, 1959. Friedman, Milton and Anna J. Schwartz. 1963. A Monetary History of the United States, 1867-
1960. New York: National Bureau of Economic Research. Glassner, David. 1997. “Crisis of 1873.” In Business Cycle and Depression, ed. David Glassner.
New York: Garland Publishing, 132-34. Goldenweiser, E. A., et al. 1931. Bank Suspensions in the United States, 1892-1931. Volume 4. Material
prepared for the information of the Federal Reserve System by the Federal Reserve Committee on Branch, Group, and Chain Banking.
Gorton, Gary. 1985. “Clearinghouses and the Origins of Central Banking in the United States,”
Journal of Economic History 45 (June): 277-84. ----- and Donald J. Mullineaux. 1987. “The Joint Production of Confidence: Endogenous
Regulation and Nineteenth Century Commercial-Bank Clearing Houses,” Journal of Money, Credit, and Banking (November) 457-578.
Lauck, W. Jetl. 1907. The Causes of the Panic of 1893. New York: Houghton Mifflin. Marguis, Ralph W. and Frank P. Smith. “Double Liability for Bank Stock.” American Economic
Review, Vol. 27, No. 3 (September 1937), pp. 490-502. Myers, Margaret G. 1931. The New York Money Market, vol. 1. New York: Columbia University
Press. ----- 1970. A Financial History of the United States. New York: Columbia University Press. Preston, Howard H. “The Banking Act of 1933.” American Economic Review, Vol. 23, No 4
(December 1933), pp. 585-607.

24
Romer, Christina. 1989. “The Prewar Business Cycle Reconsidered: New Estimates of Gross
National Product.” Journal of Political Economy 97 (February): 1-37. Schwartz, Anna. 1981. “Understanding 1929-1933.” In The Great Depression Revisited, ed. K.
Brunner. Boston: Martinus Nyhoff, 5-48. Sprauge, O.M.W. 1910. History of Crises under the National Banking System. Washington:
Government Printing Office. Tallman, Ellis W. and Jan R. Moen. 1990. “Lesson from the Panic of 1907.” In Federal Reserve
Bank of Atlanta, Economic Review. (May/June):2-13. Wicker, Elmus. 1996. The Banking Panics of the Great Depression. Cambridge: Cambridge
University Press. ----- 2000. The Banking Panics of the Gilded Age. Cambridge: Cambridge University Press.

25
Quotes: Galbraith, Greenspan (100 year)