financial institutions and financial marketsjnujprdistance.com/assets/lms/lms jnu/mba/mba -...
TRANSCRIPT

Financial Institutions and Financial Markets

Board of Studies
Prof. H. N. Verma Prof. M. K. GhadoliyaVice- Chancellor Director, Jaipur National University, Jaipur School of Distance Education and Learning Jaipur National University, JaipurDr. Rajendra Takale Prof. and Head AcademicsSBPIM, Pune
___________________________________________________________________________________________
Subject Expert Panel
Dr. S. U. Gawade Somrita MitraHead Research, SIOM Subject Matter ExpertPune
___________________________________________________________________________________________
Content Review Panel
Shreya Saraf Shweta MutttalmaniSubject Matter Expert Subject Matter Expert
___________________________________________________________________________________________Copyright ©
This book contains the course content for Financial Institutions and Financial Markets.
First Edition 2014
Printed byUniversal Training Solutions Private Limited
Address05th Floor, I-Space, Bavdhan, Pune 411021.
All rights reserved. This book or any portion thereof may not, in any form or by any means including electronic or mechanical or photocopying or recording, be reproduced or distributed or transmitted or stored in a retrieval system or be broadcasted or transmitted.
___________________________________________________________________________________________

I
Index
Content ........................................................................... II
List of Figures ...............................................................VI
List of Tables ............................................................... VII
Abbreviations ............................................................VIII
Case Study .................................................................. 140
Bibliography ............................................................... 144
Self Assessment Answers ........................................... 147

II
Contents
Chapter I ....................................................................................................................................................... 1Financial Markets: Role and Structure in the Industry ........................................................................... 1Aim ................................................................................................................................................................ 1Objectives ...................................................................................................................................................... 1Learning outcome .......................................................................................................................................... 11.1 Financial System Structure and Functions ............................................................................................... 21.2 Financial Markets and their Economic Functions ................................................................................... 31.3 Stock Exchanges in India ......................................................................................................................... 51.4 Security Measures and Operational Features of BSE and NSE ............................................................... 6 1.4.1 Market Timings ........................................................................................................................ 6 1.4.2 Automated Trading System ...................................................................................................... 6 1.4.3 Rolling Settlement and Settlement Cycle ................................................................................ 61.5 Financial Intermediaries and Their Functions ......................................................................................... 81.6 Financial Markets Structure ..................................................................................................................... 9 1.6.1. Financial Instruments .............................................................................................................. 9 1.6.2 Classification of Financial Markets ....................................................................................... 121.7 Financial Market Regulation .................................................................................................................. 131.8 Role of Financial Institutions ................................................................................................................. 13 1.8.1 Role of Depository Institutions .............................................................................................. 13 1.8.2 Role of Non-depository Financial Institutions ....................................................................... 141.9 Role of Financial Markets ...................................................................................................................... 15 1.9.1 Accommodating Corporate Finance Needs ........................................................................... 16 1.9.2 Accommodating Investment Needs ....................................................................................... 16 1.9.3 Primary versus Secondary Markets ....................................................................................... 16Summary ..................................................................................................................................................... 18References ................................................................................................................................................... 18Recommended Reading ............................................................................................................................. 19Self Assessment .......................................................................................................................................... 20
Chapter II ................................................................................................................................................... 22Determination of Interest Rates................................................................................................................ 22Aim .............................................................................................................................................................. 22Objectives .................................................................................................................................................... 22Learning outcome ........................................................................................................................................ 222.1 Introduction ............................................................................................................................................ 232.2 Interest Rate Determination ................................................................................................................... 23 2.2.1 The Rate of Interest ................................................................................................................ 23 2.2.2 Interest Rate Theories: Loanable Funds Theory .................................................................... 24 2.2.3 Interest Rate Theories: Liquidity Preference Theory ............................................................. 252.3 Determinants of Interest Rates for Individual Securities ....................................................................... 25 2.3.1 Inflation is the Rate of Change in the Overall Price Level .................................................... 25 2.3.2 Default or Credit Risk ............................................................................................................ 26 2.3.3 Liquidity Risk ........................................................................................................................ 26 2.3.4 Special Provisions of Covenants ............................................................................................ 26 2.3.5 Term to Maturity .................................................................................................................... 272.4 Forecasting Interest Rates ...................................................................................................................... 27Summary ..................................................................................................................................................... 28References ................................................................................................................................................... 28Recommended Reading ............................................................................................................................. 29Self Assessment ........................................................................................................................................... 30

III
Chapter III .................................................................................................................................................. 32Term Structure of Interest Rates .............................................................................................................. 32Aim .............................................................................................................................................................. 32Objectives .................................................................................................................................................... 32Learning outcome ........................................................................................................................................ 323.1 Introduction ............................................................................................................................................ 333.2 Theories of Term Structure of Interest Rates ......................................................................................... 33 3.2.1 Expectations Theory .............................................................................................................. 33 3.2.2 Liquidity Premium Theory .................................................................................................... 35 3.2.3 Market Segmentation Theory ................................................................................................ 36 3.2.4 The Preferred Habitat Theory ................................................................................................ 363.3 Forward Interest Rates and Yield Curve ................................................................................................ 37Summary ..................................................................................................................................................... 39References ................................................................................................................................................... 39Recommended Reading ............................................................................................................................. 39Self Assessment ........................................................................................................................................... 40
Chapter IV .................................................................................................................................................. 42Money Market ............................................................................................................................................ 42Aim .............................................................................................................................................................. 42Objectives .................................................................................................................................................... 42Learning outcome ........................................................................................................................................ 424.1 Introduction ............................................................................................................................................ 43 4.1.1 The Role of Money Markets .................................................................................................. 43 4.1.2 Money Market Segments ....................................................................................................... 44 4.1.3 Money Market Participants .................................................................................................... 454.2 Money Market Instruments .................................................................................................................... 46 4.2.1 Treasury Bills and other Government Securities ................................................................... 46 4.2.2 The Interbank Market Loans .................................................................................................. 50 4.2.3 Commercial Papers ................................................................................................................ 51 4.2.4 Certificates of Deposit ........................................................................................................... 52 4.2.5 Repurchase Agreements ......................................................................................................... 53 4.2.6 International Money Market Securities ................................................................................. 554.3 Money Market Interest Rates and Yields ............................................................................................... 56Summary ..................................................................................................................................................... 59References ................................................................................................................................................... 59Recommended Reading ............................................................................................................................. 59Self Assessment ........................................................................................................................................... 60
Chapter V .................................................................................................................................................... 62Debt Markets .............................................................................................................................................. 62Aim .............................................................................................................................................................. 62Objectives .................................................................................................................................................... 62Learning outcome ........................................................................................................................................ 625.1 Debt Market Instrument Characteristics ................................................................................................ 63 5.1.1 Important Characteristics of Bonds ...................................................................................... 63 5.1.2 The Types of Bonds .............................................................................................................. 635.2 Bond Market .......................................................................................................................................... 64 5.2.1 Bond Market Characteristics ................................................................................................. 64 5.2.2 Bond Market Yields ............................................................................................................... 655.3 Bond Valuation ....................................................................................................................................... 66 5.3.1 Discounted Models ................................................................................................................ 66 5.3.2 Bond Duration and Risk ........................................................................................................ 67 5.3.3 Bond Price Volatility .............................................................................................................. 67 5.3.4 Behaviour of Macaulay’s Duration ........................................................................................ 68

IV
5.3.5 Immunisation ......................................................................................................................... 69 5.3.6 Bond Convexity ..................................................................................................................... 695.4 Bond Analysis ........................................................................................................................................ 70 5.4.1 Inverse Floaters and Floating Rate Notes .............................................................................. 70 5.4.2 Callable Bonds ....................................................................................................................... 71 5.4.3 Convertible Bonds ................................................................................................................. 72Summary ..................................................................................................................................................... 74References ................................................................................................................................................... 74Recommended Reading ............................................................................................................................. 75Self Assessment ........................................................................................................................................... 76
Chapter VI .................................................................................................................................................. 78Equity Markets........................................................................................................................................... 78Aim .............................................................................................................................................................. 78Objectives .................................................................................................................................................... 78Learning outcome ........................................................................................................................................ 786.1 Introduction ............................................................................................................................................ 796.2 Equity Instruments ................................................................................................................................. 79 6.2.1 Common Shares ..................................................................................................................... 79 6.2.2 Preferred Shares ..................................................................................................................... 80 6.2.3 Private Equity ........................................................................................................................ 81 6.2.4 Global Shares and American Depository Receipts (ADR) .................................................... 826.3 Primary Equity Market .......................................................................................................................... 83 6.3.1 Primary Public Market ........................................................................................................... 846.4 Secondary Equity Market ...................................................................................................................... 86 6.4.1 Organised exchanges ............................................................................................................. 86 6.4.2 Over-the-Counter (OTC) Market ........................................................................................... 88 6.4.3 Electronic Stock Markets ....................................................................................................... 886.5 Secondary Equity Market Structure ....................................................................................................... 90 6.5.1 Cash vs. Forward Markets ..................................................................................................... 90 6.5.2 Continuous Markets and Auction Markets ............................................................................ 90 6.5.3 Order-driven Markets and Quote-driven Markets ................................................................. 90 6.5.4 Hybrid Markets ...................................................................................................................... 916.6 Equity Market Transactions ................................................................................................................... 91 6.6.1 Bid-ask Spread ....................................................................................................................... 91 6.6.3 Margin Trading ...................................................................................................................... 93 6.6.4 Short Selling .......................................................................................................................... 94 6.6.5 Stock Trading Regulations ..................................................................................................... 946.7 Equity Market Characteristics ................................................................................................................ 95 6.7.1 Stock Indicators ..................................................................................................................... 95 6.7.2 Stock Market Indexes ............................................................................................................ 96 6.7.3 Stock Market Indicators ......................................................................................................... 97 6.7.4 Transaction Execution Costs .................................................................................................. 986.8 Stock Valuation ...................................................................................................................................... 99 6.8.1 Fundamental Analysis ............................................................................................................ 99 6.8.2 Technical Analysis ............................................................................................................... 100Summary ................................................................................................................................................... 104References ................................................................................................................................................. 104Recommended Reading ........................................................................................................................... 104Self Assessment ......................................................................................................................................... 105

V
Chapter VII .............................................................................................................................................. 107Derivative Market .................................................................................................................................... 107Aim ............................................................................................................................................................ 107Objectives .................................................................................................................................................. 107Learning outcome ...................................................................................................................................... 1077.1 Hedging Against Risk .......................................................................................................................... 1087.2 Description of Derivatives Markets ..................................................................................................... 1087.3 Forward and Futures Contracts ............................................................................................................ 109 7.3.1 Principles of Forward and Futures Contracts ...................................................................... 109 7.3.2 Forward and Futures Valuation .............................................................................................111 7.3.3 Use of Forwards and Futures ................................................................................................112 7.3.4 Futures Contracts: Stock Index Futures ................................................................................114 7.3.5 Contracts for Difference (CFD) ............................................................................................1147.4 Swaps ....................................................................................................................................................1157.5 Options ..................................................................................................................................................116 7.5.1 Options Definition ................................................................................................................116 7.5.2 Components of the Option Price ...........................................................................................119 7.5.3 Determinants of the Option Price ........................................................................................ 120 7.5.4 Option Pricing Models ......................................................................................................... 122 7.5.5 Mixed Strategies in Options Trading ................................................................................... 1227.6 Depository System ............................................................................................................................... 123 7.6.1 Depository Participant (DP) ................................................................................................. 123 7.6.2 Need and Importance of Depository System ....................................................................... 124Summary ................................................................................................................................................... 125References ................................................................................................................................................. 125Recommended Reading ........................................................................................................................... 125Self Assessment ......................................................................................................................................... 126
Chapter VIII ............................................................................................................................................. 128Financial Institutions in India................................................................................................................. 128Aim ............................................................................................................................................................ 128Objectives .................................................................................................................................................. 128Learning outcome ...................................................................................................................................... 1288.1 Introduction .......................................................................................................................................... 1298.2 Institutional Support............................................................................................................................. 129 8.2.1 National Small Industries Corporation (NSIC) ................................................................... 129 8.2.2 Small Industries Development Organisation (SIDO) .......................................................... 129 8.2.3 Small Industries Service Institutes (SISI) ............................................................................ 130 8.2.4 Small-Scale Industries Board (SSIB) .................................................................................. 130 8.2.5 State Small Industries Development Corporations (SSIDC) ............................................... 131 8.2.6 District Industries Centres (DIC) ......................................................................................... 1318.3 Financial System and Banking System ................................................................................................ 1328.4 Constituents of the Financial System ................................................................................................... 132 8.4.1 Financial Institutions ............................................................................................................ 1328.5 Indian Financial System ....................................................................................................................... 1338.6 Indian Banking System Evolution of Commercial Banking in India .................................................. 134 8.6.1 Phase of Banking Consolidation: 1951-1964 ...................................................................... 134 8.6.2 Phase of Innovative Banking: 1964-1990 ............................................................................ 135 8.6.3 Phase of Prudential Banking - Since Early Nineties ............................................................ 136Summary ................................................................................................................................................... 137References ................................................................................................................................................. 137Recommended Reading ........................................................................................................................... 137Self Assessment ......................................................................................................................................... 138

VI
List of Figures
Fig. 1.1 The structure of financial system ...................................................................................................... 2Fig. 1.2 Comparison of roles among financial institutions ............................................................................ 9Fig. 1.3 How financial markets facilitate corporate finance and investment management ......................... 17Fig. 3.1 How interest rate expectations affect the yield curve ..................................................................... 35Fig. 3.2 Impact of liquidity premium on the yield curve under three scenarios .......................................... 36Fig. 4.1 Key money market instruments ...................................................................................................... 44Fig. 4.2 Prices in a sealed-bid auction ......................................................................................................... 47Fig. 4.3 Impact of single-price auction upon demand curve ........................................................................ 48Fig. 4.4 Money market rates and yields ....................................................................................................... 57Fig. 5.1 Duration and convexity .................................................................................................................. 69Fig. 5.2 Callable bond .................................................................................................................................. 71Fig. 5.3 Values of callable bonds, non-callable bonds and the call option .................................................. 72Fig. 5.4 Convertible bonds ........................................................................................................................... 73Fig. 7.1 Profit profile for perfect hedge ......................................................................................................113Fig. 7.2 Profit profile for a cross hedge ......................................................................................................113Fig. 7.3 Program trading arbitrage ..............................................................................................................114Fig. 7.4 Profit profiles for a call option ......................................................................................................117Fig. 7.5 Profit profile for writing a covered call option ..............................................................................118Fig. 7.6 Profit profile for a put option .........................................................................................................118Fig. 7.7 Merton‘s bound............................................................................................................................. 120Fig. 7.8 Impact of longer remaining life on the value of a call option ...................................................... 121Fig. 7.9 Impact of the volatility of the underlying asset on the value of a call option .............................. 121Fig. 7.10 Impact of higher interest rate on value of call option ................................................................. 122

VII
List of Tables
Table 1.1 Rolling settlement & settlement cycle ........................................................................................... 7Table 1.2 Financial instrument categories.................................................................................................... 10Table 1.3 Fixed-income markets ...................................................................................................................11Table 1.4 Debt versus equity .........................................................................................................................11Table 1.5 Financial market classification ..................................................................................................... 12

VIII
Abbreviations
ADR - American Depository ReceiptsARPS - Auction Rate Preferred SharesATS - Alternative Trading SystemsBOLT - BSE’s Online TradingBSE - Bombay Stock ExchangeCD - CertificateofDepositCDSL - Central Depository Services LimitedCFD - Contract for DifferenceCFS - Committee on Financial SectorCP - Commercial PaperCPI - Consumer Price IndexCRA - Credit Rating AgenciesDIC - District Industries CentersDOT - Designated Order TurnaroundDP - Depository ParticipantDRP - Default Risk PremiumsECB - European Central BankECN - Electronic Communication NetworksEONIA - Euro Overnight Index AverageETF - Exchange Traded FundsEURIBOR - Euro Interbank Offered RateFTSE - Financial Times Stock ExchangeGDR - Global Depository ReceiptsICICI - Industrial Credit and Investment Corporation of India IDBI - Industrial Development Bank of IndiaIFCI - Industrial Finance Corporation of IndiaIMF - International Mutual FundsIOI - Indications of InterestIPO - Initial Public OfferingsLIBOR - London Inter Bank Offer RateLIC - Life Insurance Corporation of IndiaMRO - MainRefinancingOperationsNABARD - National Bank for Agriculture and Rural DevelopmentNEAT - National Exchange for Automated TradingNSDL - National Securities Depository LimitedNSE - National Stock ExchangeNSIC - National Small Industries CorporationOTC - Over-the CounterPERCS - Preferred Equity Redemption Cumulative StocksPMRY - Prime Minister Rojgar YojanaREPO - Re Earnable Point OpportunitySEO - Seasoned Equity OfferingSIDBI - Small Industrial Development Bank of IndiaSISI - Small Industries Service InstitutesSPO - Secondary Public OfferingSSIB - Small Scale Industries BoardSSIDC - State Small Industries Development CorporationsUTI - Unit Trust of India

1
Chapter I
Financial Markets: Role and Structure in the Industry
Aim
The aim of this chapter is to:
introducethestructureofafinancialsystem•
explainthefunctionsofafinancialsystem•
elucidatemajorfinancialmarketparticipants•
Objectives
The objectives of this chapter are to:
determineclassificationoffinancialmarkets•
elaborate key attributes determining transaction costs•
analysefinancialmarketregulations•
Learning outcome
At the end of this chapter, you will be able to:
distinguishthekeyfeaturesoffinancialintermediaries•
understandthestructureandkeyfeaturesoffinancialmarkets•
describe costs of contracting and monitoring•

Financial Institutions and Financial Markets
2
1.1 Financial System Structure and FunctionsThefinancialsystemplaysthekeyroleintheeconomybystimulatingeconomicgrowth,influencingeconomicperformanceoftheactorsaffectingeconomicwelfare.Thisisachievedbyfinancialinfrastructure,inwhichentitieswithfundsallocatethosefundstothosewhohavepotentiallymoreproductivewaystoinvestthosefunds.Afinancialsystemmakesitpossibleamoreefficienttransferoffunds.Asonepartyofthetransactionmaypossesssuperiorinformationthantheotherparty,itcanleadtotheinformationasymmetryproblemandinefficientallocationoffinancialresources.Byovercomingtheinformationasymmetryproblemthefinancialsystemfacilitatesbalancebetween those with funds to invest and those needing funds.
Accordingtothestructuralapproach,thefinancialsystemofaneconomyconsistsofthreemaincomponents:Financial markets•Financial intermediaries (institutions)•Financial regulators•
Eachofthecomponentsplaysaspecificroleintheeconomy.Accordingtothefunctionalapproach,financialmarketsfacilitatetheflowoffundsinordertofinanceinvestmentsbycorporations,governmentsandindividuals.Financialinstitutionsarethekeyplayersinthefinancialmarketsastheyperformthefunctionofintermediationandthusdeterminetheflowoffunds.Thefinancialregulatorsperformtheroleofmonitoringandregulatingtheparticipantsinthefinancialsystem.
Firms
Stock market
Bond market
Short term fixed securities market
Banking sector
Governments
Fig. 1.1 The structure of financial system(Source: http://www.bcci.bg/projects/latvia/pdf/7_Financial_markets.pdf)
Financialmarketsstudies,basedoncapitalmarkettheory,focusonthefinancialsystem,thestructureofinterestratesandthepricingoffinancialassets.Anassetisanyresourcethatisexpectedtoprovidefuturebenefits,andthus possesses economic value. Assets are divided into two categories: tangible assets with physical properties and intangibleassets.Anintangibleassetrepresentsalegalclaimtosomefutureeconomicbenefits.Thevalueofanintangible asset bears no relation to the form, physical or otherwise, in which the claims are recorded.
Financialassets,oftencalledfinancialinstruments,areintangibleassets,whichareexpectedtoprovidefuturebenefitsintheformofaclaimtofuturecash.Somefinancialinstrumentsarecalledsecuritiesandgenerallyincludestocksandbonds.Anytransactionrelatedtofinancialinstrumentincludesatleasttwoparties
The party that has agreed to make future cash payments and is called the issuer•Thepartythatownsthefinancialinstrument,andthereforetherighttoreceivethepaymentsmadebytheissuer,•is called the investor
Financial assets provide the following key economic functions:They allow the transfer of funds from those entities, who have surplus funds to invest to those who need funds •to invest in tangible assets.Theyredistributetheunavoidableriskrelatedtocashgenerationamongdeficitandsurpluseconomicunits.•

3
Theclaimsheldbythefinalwealthholdersgenerallydifferfromtheliabilitiesissuedbythoseentitieswhodemandthosefunds.Theroleisperformedbythespecificentitiesoperatinginfinancialsystems,calledfinancialintermediaries.Thelatteronestransformthefinalliabilitiesintodifferentfinancialassetspreferredbythepublic.
1.2 Financial Markets and their Economic FunctionsAfinancialmarketisamarketwherefinancialinstrumentsareexchangedortraded.Financialmarketsprovidethefollowing three major economic functions:
Price discovery•Liquidity•Reduction of transaction costs•
Pricediscoveryfunctionmeansthattransactionsbetweenbuyersandsellersoffinancialinstrumentsinafinancialmarket determine the price of the traded asset. At the same time, the required return from the investment of funds is determinedbytheparticipantsinafinancialmarket.Themotivationforthoseseekingfunds(deficitunits)dependsontherequiredreturnthatinvestorsdemand.Itisthesefunctionsoffinancialmarketsthatsignalhowthefundsavailable from those who want to lend or invest funds will be allocated among those needing funds and raise those fundsbyissuingfinancialinstruments.
Liquidityfunctionprovidesanopportunityforinvestorstosellafinancialinstrument,sinceitisreferredtoasameasure of the ability to sell an asset at its fair market value at any time. Without liquidity, an investor would be forcedtoholdafinancialinstrumentuntilconditionsarisetosellitortheissueriscontractuallyobligatedtopayitoff. Debt instrument is liquidated when it matures, and equity instrument is until the company is either voluntarily or involuntarilyliquidated.Allfinancialmarketsprovidesomeformofliquidity.However,differentfinancialmarketsare characterised by the degree of liquidity.
Thefunctionofreductionoftransactioncostsisperformed,whenfinancialmarketparticipantsarechargedand/orbearthecostsoftradingafinancialinstrument.Inmarketeconomies,theeconomicrationalefortheexistenceofinstitutions and instruments is related to transaction costs, thus the surviving institutions and instruments are those that have the lowest transaction costs. The key attributes determining transaction costs are as follows:
Assetspecificity•Uncertainty•Frequency of occurrence•
Assetspecificityisrelatedtothewaytransactionisorganisedandexecuted.Itislowerwhenanassetcanbeeasilyputtoalternativeuse,canbedeployedfordifferenttaskswithoutsignificantcosts.Transactionsarealsorelatedtouncertainty, which has the following:
External sources (when events change beyond control of the contracting parties)•Depends on opportunistic behaviour of the contracting parties•
Ifchangesinexternaleventsarereadilyverifiable,thenitispossibletomakeadaptationstooriginalcontracts,takinginto account problems caused by external uncertainty. In this case, there is a possibility to control transaction costs. However, when circumstances are not easily observable, opportunism creates incentives for contracting parties to review the initial contract and creates moral hazard problems. The higher the uncertainty, the more opportunistic behaviour may be observed, and the higher transaction costs may be borne.
Frequency of occurrence plays an important role in determining if a transaction should take place within the market orwithinthefirm.Aone-timetransactionmayreducecostswhenitisexecutedinthemarket.Conversely,frequenttransactionsrequiredetailedcontractingandshouldtakeplacewithinafirminordertoreducethecosts.Whenassetsarespecific,transactionsarefrequent,andtherearesignificantuncertaintiesIntra-firmtransactionsmaybetheleastcostlyand,viceversa.Ifassetsarenon-specific,transactionsareinfrequent,andtherearenosignificantuncertainties. The least costly may be market transactions.

Financial Institutions and Financial Markets
4
The mentioned attributes of transactions and the underlying incentive problems are related to behavioural assumptions about the transacting parties. The economists, Williamson, Akerl and (others) have contributed to transactions costs economics by analysing behaviour of the human beings, assumed generally self-serving and rational in their conduct, and also behaving opportunistically. Opportunistic behaviour was understood as involving actions with incomplete and distorted information that may intentionally mislead the other party. This type of behaviour requires efforts of ex-ante screening of transaction parties, and ex-post safeguards as well as mutual restraint among the parties, which leadstospecifictransactioncosts.Transactioncostsareclassifiedinto:
Costs of search and information•Costs of contracting and monitoring•Costsofincentiveproblemsbetweenbuyersandsellersoffinancialassets•
Costsofsearchandinformationaredefinedinthefollowingway:Search costs fall into categories of explicit costs and implicit costs:•
Explicitcostsincludeexpensesthatmaybeneededtoadvertiseone’sintentiontosellorpurchaseafinancial �instrument. Implicit costs include the value of time spent in locating counterparty to the transaction. The presence of �anorganisedfinancialmarketreducessearchcosts.
Informationcostsareassociatedwithassessingafinancialinstrument’sinvestmentattributes.Inapriceefficient•market,pricesreflecttheaggregateinformationcollectedbyallmarketparticipants
Costs of contracting and monitoring are related to the costs necessary to resolve information asymmetry problems, when the two parties entering into the transaction possess limited information on each other and seek to ensure that thetransactionobligationsarefulfilled.
Costsofincentiveproblemsbetweenbuyersandsellersarise,whenthereareconflictsofinterestbetweenthetwoparties,havingdifferentincentivesforthetransactionsinvolvingfinancialassets.
Thefunctionsofamarketareperformedbyitsdiverseparticipants.Theparticipantsinfinancialmarketscanbealsoclassifiedintovariousgroups,accordingtotheirmotivefortrading:
Public investors, who ultimately own the securities and who are motivated by the returns from holding the •securities. Public investors include private individuals and institutional investors, such as pension funds and mutual funds.Brokers, who act as agents for public investors and who are motivated by the remuneration received (typically •in the form of commission fees) for the services they provide. Brokers thus trade for others and not on their own account.Dealers,whotradeontheirownaccountbutwhoseprimarymotiveistoprofitfromtradingratherthanfrom•holding securities. Typically, dealers obtain their return from the differences between the prices at which they buy and sell the security over short intervals of time.Credit rating agencies (CRAs) that assess the credit risk of borrowers.•
In reality three groups are not mutually exclusive. Some public investors may occasionally act on behalf of others; brokers may act as dealers and hold securities on their own, while dealers often hold securities in excess of the inventories needed to facilitate their trading activities. The role of these three groups differs according to the trading mechanismadoptedbyafinancialmarket.

5
1.3 Stock Exchanges in IndiaIndian stock market marks to be one of the oldest stock markets in Asia. It dates back to the close of 18th century when the East India Company used to transact loan securities. In the 1830s, trading on corporate stocks and shares in Bank and Cotton presses took place in Bombay.
Though the trading was broad but the brokers were hardly half dozen during 1840 and 1850.An informal group of 22 stockbrokers began trading under a banyan tree opposite the Town Hall of Bombay from the mid-1850s, each investing a (then) princely amount of Rupee 1. This banyan tree still stands in the Horniman Circle Park, Mumbai. In1860,theexchangeflourishedwith60brokers.Infactthe‘ShareMania’inIndiabeganwiththeAmericanCivilWar broke and the cotton supply from the US to Europe stopped. Further the brokers increased to 250. The informal group of stockbrokers organised themselves as the The Native Share and Stockbrokers Association which, in 1875, was formally organised as the Bombay Stock Exchange (BSE).BSE was shifted to an old building near the Town Hall. In 1928, the plot of land on which the BSE building now stands (at the intersection of Dalal Street, Bombay Samachar Marg and Hammam Street in downtown Mumbai) was acquired, and a building was constructed and occupied in 1930.
Premchand Roychand was a leading stockbroker of that time, and he assisted in setting out traditions, conventions, and procedures for the trading of stocks at Bombay Stock Exchange and they are still being followed. Several stock brokingfirmsinMumbaiwerefamily-runenterprises,andwerenamedaftertheheadsofthefamily.Thefollowingis the list of some of the initial members of the exchange, and who are still running their respective business:
D.S. Prabhudas & Company (now known as DSP, and a joint venture partner with Merrill Lynch)•Jamnadas Morarjee (now known as JM)•Champaklal Devidas (now called Cifco Finance)•Brijmohan Laxminarayan•
In1956,theGovernmentofIndiarecognisedtheBombayStockExchangeasthefirststockexchangeinthecountryunder the Securities Contracts (Regulation) Act. The most decisive period in the history of the BSE took place after 1992. In the aftermath of a major scandal with market manipulation involving a BSE member named Harshad Mehta, BSE responded to calls for reform with intransigence. The foot-dragging by the BSE helped radicalise the position of the government, which encouraged the creation of the National Stock Exchange (NSE), which created an electronic marketplace. NSE started trading on 4 November 1994. Within less than a year, NSE turnover exceeded the BSE. BSE rapidly automated, but it never caught up with NSE spot market turnover.
The second strategic failure at BSE came in the following two years. NSE embarked on the launch of equity derivatives trading. BSE responded by political effort, with a friendly SEBI chairman (D. R. Mehta) aimed at blocking equity derivatives trading. The BSE and D. R. Mehta succeeded in delaying the onset of equity derivatives trading by roughlyfiveyears.However,thistradingandtheaccompanyingshiftofthespotmarkettorollingsettlementdidcome along in 2000 and 2001. Helped by another major scandal at BSE involving the then President Mr. Anand Rathi. NSE scored nearly 100% market share in the runaway success of equity derivatives trading, thus consigning BSE into clearly second place. Today, NSE has roughly 66% of equity spot turnover and roughly 100% of equity derivatives turnover. Stock Exchange provides a trading platform, where buyers and sellers can meet to transact in securities.
Stock marketsStock Market is a market where the trading of company stock, both listed securities and unlisted takes place. It is different from stock exchange because it includes all the national stock exchanges of the country. For example, we use the term, ‘the stock market was up today’ or ‘the stock market bubble.’
Stock exchangesStock Exchanges are an organised marketplace, either corporation or mutual organisation, where members of the organisation gather to trade company stocks or other securities. The members may act either as agents for their customers, or as principals for their own accounts. Stock exchanges also facilitates for the issue and redemption

Financial Institutions and Financial Markets
6
ofsecuritiesandotherfinancialinstrumentsincludingthepaymentofincomeanddividends.Therecordkeepingis central but trade is linked to such physical place because modern markets are computerised. The trade on an exchange is only by members and stock broker do have a seat on the exchange.
1.4 Security Measures and Operational Features of BSE and NSEThe leading stock exchanges in India have developed itself to a large extent since its emergence. These stock exchanges aim at offering the investors and traders better transparency, genuine settlement cycle, honest transaction and to reduce and solve investor grievances if any.
1.4.1 Market TimingsTrading on the equities segment takes place on all days of the week (except Saturdays and Sundays and holidays declared by the Exchange in advance). The market timings of the equities segment are:Normal Market Open: 09:55 hoursNormal Market Close: 15:30 hoursThe post closing session is held between 15.50 to 16.00 hours
1.4.2 Automated Trading SystemToday our country has an advanced trading system which is a fully automated screen based trading system. This system adopts the following principles of an order-driven market as opposed to a quote driven system.
NSE operates on the ‘National Exchange for Automated Trading’ (NEAT) system.•BSE operates on the ‘BSE’s Online Trading’ (BOLT) system.•
Order management in automated trading systemThetradingsystemprovidescompleteflexibilitytomembersinthekindsofordersthatcanbeplacedbythem.Ordersarefirstnumberedandtime-stampedonreceiptandthenimmediatelyprocessedforpotentialmatch.Everyorder has a distinctive order number and a unique time stamp on it. If a match is not found, then the orders are stored in different ‘books’. Orders are stored in price-time priority in various books in the following sequence Best Price, Within Price, by time priority. Price priority means that if two orders are entered into the system, the order having the best price gets the higher priority. Time priority means if two orders having the same price are entered, theorderthatisenteredfirstgetsthehigherpriority.
Order matching rules in automated trading systemThe best buy order is matched with the best sell order. An order may match partially with another order resulting in multiple trades. For order matching, the best buy order is the one with the highest price and the best sell order is the one with the lowest price. This is because the system views all buy orders available from the point of view of a seller and all sell orders from the point of view of the buyers in the market. So, of all buy orders available in the market at any point of time, a seller would obviously like to sell at the highest possible buy price that is offered. Hence, the best buy order is the order with the highest price and the best sell order is the order with the lowest price.
Members can proactively enter orders in the system, which will be displayed in the system till the full quantity is matched by one or more of counter-orders and result into trade(s) or is cancelled by the member. Alternatively, members may be reactive and put in orders that match with existing orders in the system. Orders lying unmatched in the system are ‘passive’ orders and orders that come into match the existing orders are called ‘active’ orders. Orders are always matched at the passive order price. This ensures that the earlier orders get priority over the orders that come in later.
1.4.3 Rolling Settlement and Settlement CycleIn a rolling settlement, each trading day is considered as a trading period and trades executed during the day are settled based on the net obligations for the day. At NSE, trades in rolling settlement are settled on a T+2 basis, i.e., on the 2nd working day. For arriving at the settlement day all intervening holidays, which include bank holidays, NSE holidays, Saturdays and Sundays are excluded. Typically trades taking place on Monday are settled on Wednesday, Tuesday’s trades settled on Thursday and so on.

7
Settlement for trades is done on a trade-for-trade basis and delivery obligations arise out of each trade. The settlement cycle for this segment is same as for the rolling settlement viz:
Activity Day
Trading Rolling settlement trading T
Clearing Custodialconfirmation T+1 working days
Delivery generation T+1 working days
Settlement Securities and funds pay in T+2 working days
Securities and funds pay out T+2 working days
Post Settlement Assigning of shortages for close out T+3 working days
Reporting and pick-up of bad delivery T+4 working days
Close out of shortages T+5 working days
Replacement of bad delivery T+6 working days
Reporting of re-bad and pick-up T+8 working days
Close out of re-bad delivery T+9 working days
Table 1.1 Rolling settlement & settlement cycle
Salient features of settlementDelivery of shares in street name and market delivery (clients holding physical shares purchased from the •secondary market) is treated as bad delivery. The shares standing in the name of individuals/HUF only would constitute good delivery. The selling/delivering member must necessarily be the introducing member.Any delivery of shares, which bears the last transfer date on or after the introduction of the security for trading •in the LP market, is construed as bad delivery.Any delivery in excess of 500 shares is marked as short and such deliveries are compulsorily closed-out.•Shortages,ifany,arecompulsorilyclosed-outat20%overtheactualtradedprice.Uncertifiedbaddeliveryand•re-bad delivery are compulsorily closed-out at 20% over the actual traded price.All deliveries are compulsorily required to be attested by the introducing/ delivering member.•The buyer must compulsorily send the securities for transfer and dematerialisation, latest within three months •from the date of pay-out.Company objections arising out of such trading and settlement in this market are reported in the same manner •as is currently being done for normal market segment. However, securities would be accepted as valid company objection, only if the securities are lodged for transfer within three months from the date of pay-out.Institutionalsegment:TheReserveBankofIndiahadvideapressreleaseonOctober21,1999,clarifiedthat•inter-foreign-institutional-investor(inter-FII)transactionsdonotrequirepriorapprovalorpost-factoconfirmationof the Reserve Bank of India, since such transactions do not affect the percentage of overall FII holdings in Indian companies. (Inter FII transactions are however not permitted in securities where the FII holdings have already crossed the overall limit due to any reason).
To facilitate execution of such inter-institutional deals in companies where the cut-off limit of FII investment has been reached, the Exchange introduced a new market segment on December 27, 1999. The securities where FII investorsandFIIholdinghasreachedthecut-offlimitasspecifiedbyRBI(2%lowerthantheceilingspecifiedbyRBI) from time –to- time would be available for trading in this market type for exclusive selling by FII clients. The cut-off limits for companies with 24% ceiling is 22%, for companies with 30% ceiling is 28% and for companies with 40% ceiling is 38%. Similarly, the cut- off limit for public sector banks (including State Bank of India) is 18% whose ceiling is 20%. The list of securities eligible/become ineligible for trading in this market type would be notifiedtomembersfromtime-to-time.

Financial Institutions and Financial Markets
8
Brokerage and other transaction costsBrokerage is negotiable. The Exchange has not prescribed any minimum brokerage. The maximum brokerage is subject to a ceiling of 2.5 percent of the contract value. However, the average brokerage charged by the members to the clients is much lower. Typically there are different scales of brokerages for delivery transaction, trading transaction, etc. The Stamp Duty on transfer of securities in physical form is to be paid by the seller but in practice it is paid by the buyer while registering the shares in his name. In case of transfer of shares, the rate is 50 paisa for every Rs.100/- or part thereof on the basis of the amount of consideration and that for transfer of debentures the rateofstampdutyvariesfromState-to-State,wheretheregisteredofficeofaCompanyissuingthedebenturesislocated.
Transfer of ownershipTransfer of ownership of securities, if the same is not delivered in demat form by the seller, is effected through a date stamped transfer-deed which is signed by the buyer and seller. The duly executed transfer-deed along with the share certificatehastobelodgedwiththecompanyforchangeintheownership.Anominaldutybecomespayableintheformofstampstobeaffixedonthetransfer-deeds.Transfer-deedremainsvalidfortwelvemonthsorthenextbookclosure following the stamped date whichever occurs later for transfer of shares in the name of buyer. However, for delivery of shares in the market, transfer deed is valid till book closure date of the company.
1.5 Financial Intermediaries and Their FunctionsFinancialintermediaryisaspecialfinancialentity,whichperformstheroleofefficientallocationoffunds,whenthereareconditionsthatmakeitdifficultforlendersorinvestorsoffundstodealdirectlywithborrowersoffundsinfinancialmarkets.Financialintermediariesincludedepositoryinstitutions,insurancecompanies,regulatedinvestmentcompanies, investment banks, and pension funds.
Theroleoffinancialintermediariesistocreatemorefavourabletransactiontermsthancouldberealisedbylenders/investorsandborrowersdealingdirectlywitheachotherinthefinancialmarket.Thefinancialintermediariesareengaged in the following manner:
Obtaining funds from lenders or investors•Lending or investing the funds that they borrow to those who need funds•
Thefundsthatafinancialintermediaryacquiresbecome,dependingonthefinancialclaim,eithertheliabilityofthefinancialintermediaryorequityparticipantsofthefinancialintermediary.Thefundsthatafinancialintermediarylendsorinvestsbecometheassetofthefinancialintermediary.
Financialintermediariesareengagedintransformationoffinancialassets,whicharelessdesirableforalargepartoftheinvestingpublicintootherfinancialassetstheirownliabilitieswhicharemorewidelypreferredbythepublic.Asset transformation provides at least one of the following three economic functions:
Maturity intermediation•Riskreductionviadiversification•Cost reduction for contracting and information processing•

9
Surplus Units
Policyholders
Employers and
Employees
Depository Institutions
(Commercial Banks, Savings Institutions,
Credit Unions)
Finance Companies
Mutual Funds
Insurance Companies
Pension funds
Deficit Units (Firms,
Government, Agencies, Some
Individuals)
Deposits
Purchase Securities
Purchase Shares
Premiums
Employee Contributions
Fig. 1.2 Comparison of roles among financial institutions(Source: http://www.bcci.bg/projects/latvia/pdf/7_Financial_markets.pdf)
Theseeconomic functionsareperformedbyfinancialmarketparticipantswhileproviding the specialfinancialservices,e.g.,thefirstandsecondfunctionscanbeperformedbybrokers,dealersandmarketmakers.Thethirdfunctionisrelatedtotheserviceofunderwritingofsecurities.Otherservicesthatcanbeprovidedbyfinancialintermediaries include the following:
Facilitating the trading of financial assets for the financial intermediary’s customers through brokering•arrangements.Facilitatingthetradingoffinancialassetsbyusingitsowncapitaltotakeapositioninafinancialassetthe•financialintermediary’scustomerwanttotransactin.Assistinginthecreationoffinancialassetsforitscustomersandtheneitherdistributingthosefinancialassets•to other market participants.Providing investment advice to customers•Managethefinancialassetsofcustomers•Providing a payment mechanism•
1.6 Financial Markets StructureFinancial market structure is further divided into two sections. They are explained in the paragraphs given below:
1.6.1. Financial InstrumentsThereisagreatvarietyoffinancialinstrumentinthefinancialmarketplace.Theuseoftheseinstrumentsbymajormarket participants depends upon their offered risk and return characteristics, as well as availability in retail or wholesalemarkets.Thegeneralviewonthefinancialinstrumentcategoriesisprovidedintablebelow.

Financial Institutions and Financial Markets
10
Category Risk Determinants Expected Returns Main Participants
Non-tradables and non-transferables
In wholesale money markets: transaction volumes
In wholesale money markets: low
In wholesale money markets: banks
In retail markets: low transparency, lack of standardisation, low creditworthiness
In credit markets: lowIn retail markets banks andnon-bankfirmsandhouseholds
In foreign exchange\ markets: high volatility, change of currency
In foreign exchange markets: high
In foreign exchange markets:financialinstitutions, companies
SecuritiesMarket volatility, individual risks and failures
Comparably high Banks and non-bank firms,individuals
Derivatives Market volatility, leverage Very high Banks and non-bank firms,individuals
Table 1.2 Financial instrument categories
Afinancialinstrumentcanbeclassifiedbythetypeofclaimsthattheinvestorhasontheissuer.Afinancialinstrumentin which the issuer agrees to pay the investor interest plus repay the amount borrowed is a debt instrument. A debt instrument also referred to as an instrument of indebtedness, can be in the form of a note, bond, or loan. The interest paymentsthatmustbemadebytheissuerarefixedcontractually.Forexample,inthecaseofadebtinstrumentthatisrequiredtomakepaymentsinEuros,theamountcanbeafixedEuroamountoritcanvarydependinguponsomebenchmark. The investor in a debt instrument can realise no more than the contractual amount. For this reason, debt instrumentsareoftencalledfixedincomeinstruments.
Fixedincomeinstrumentsformawideanddiversifiedfixedincomemarket.Thekeycharacteristicsofitareprovidedin Table 1.3.
Market Features Issuers
Long- term
Bonds Long-term obligations to make a seriesoffixedpayments Governments,firms
Convertibles Bonds that can be swapped for equity atpre-specifiedconditions Firms
Asset-backed securities Securitised “receivables” presenting future streams of payments
Financial institutions, firms
Preferred stock, subordinated debt Debt and equity hybrids Firms
Medium-term
Notes Medium-term obligations Governments
Floating-rate notesMedium-term instruments with interest rates based on LIBOR or another index
Firms

11
Short-term
Bills Short-term obligations Governments
Commercial paper Short-term debt instruments Firms
Certificatesofdeposit Short-term debt instruments Banks
Table 1.3 Fixed-income markets
Incontrasttoadebtobligation,anequityinstrumentspecifiesthattheissuerpaystheinvestoranamountbasedonearnings,ifany,aftertheobligationsthattheissuerisrequiredtomaketoinvestorsofthefirm’sdebtinstrumentshavebeenpaid.Common stock is an example of equity instruments. Somefinancial instruments due to theircharacteristics can be viewed as a mix of debt and equity.
Preferredstockisafinancialinstrument,whichhastheattributeofadebtbecausetypicallytheinvestorisonlyentitledtoreceiveafixedcontractualamount.However,itissimilartoanequityinstrumentbecausethepaymentisonlymadeafterpaymentstotheinvestorsinthefirm’sdebtinstrumentsaresatisfied.
Another ‘combination’ instrument is a convertible bond, which allows the investor to convert debt into equity under certain circumstances.Aspreferred stockholders typically are entitled to afixedcontractual amount, preferredstockisreferredtoasafixedincomeinstrument.Hence,fixedincomeinstrumentsincludedebtinstrumentsandpreferredstock.ThefeaturesofdebtandequityinstrumentsarecontrastedinTable1.4.Theclassificationofdebtand equity is especially important for two legal reasons. First, in the case of a bankruptcy of the issuer, investor in debt instruments has a priority on the claim of the issuer’s assets over equity investors. Second, the tax- treatment ofthepaymentsbytheissuercandifferdependingonthetypeoffinancialinstrumentclass.
Debt Equity
Characteristic Borrower-lenderrelation,fixedmaturities Ownership, no time limit
Advantage for the firm Predictability, independence from shareholders’influence
Flexibility,lowcostoffinance,reputation
Advantage for the investor Low risk High expected return
Disadvantages for the firm Debt servicing obligationShareholder dependence, shortsightedness, market volatility influencingmanagementdecisions
Disadvantage for the investor Low returns High risk
Table 1.4 Debt versus equity

Financial Institutions and Financial Markets
12
1.6.2 Classification of Financial MarketsTheredifferentwaystoclassifyfinancialmarkets.Theyareclassifiedaccordingtothefinancialinstrumentstheyare trading, features of services they provide, trading procedures, key market participants, as well as the origin of themarkets.ThegeneralisedfinancialmarketclassificationisgiveninTable1.5.
Criterion Features Examples
ProductsTradability, transferability, ownership, maturity, denomination, substance
Equity, debt instruments, derivatives
ServicesTechnical, advisory, information and knowledge based, administrative
IT support, research and analysis, custody
Ways of trading Physical, electronic, virtual Over the counter, exchange, internet
Participants Professionals, non-professionals, institutions,officials
Banks, central banks, non-bank financialcompanies,institutionalinvestors,businessfirms,households
Origin Domestic, cross-border, regional, international
National markets, regionally integrated markets, Euromarkets, domestic/foreign currency markets, onshore/offshore markets
Table 1.5 Financial market classification
Fromtheperspectiveofcountry-origin,itsfinancialmarketcanbebrokendownintoaninternalmarketandanexternal market. The internal market, also called the national market, consists of two parts: the domestic market and the foreign market. The domestic market is where issuers domiciled in the country issue securities and where those securities are subsequently traded. The foreign market is where securities are sold and traded outside the country of issuers. External market is the market where securities with the following two distinguishing features are trading:
At issuance they are offered simultaneously to investors in a number of countries•They are issued outside the jurisdiction of any single country•
The external market is also referred to as the international market, offshore market, and the Euromarket (despite thefactthatthismarketisnotlimitedtoEurope).Moneymarketisthesectorofthefinancialmarketthatincludesfinancialinstrumentsthathaveamaturityorredemptiondatethatisoneyearorlessatthetimeofissuance.Theseare mainly wholesale markets.
Thecapitalmarketisthesectorofthefinancialmarketwherelong-termfinancialinstrumentsissuedbycorporationsandgovernmentstrade.Here‘long-term’referstoafinancialinstrumentwithanoriginalmaturitygreaterthanoneyear and perpetual securities (those with no maturity). There are two types of capital market securities those that represent shares of ownership interest, also called equity, issued by corporations, and those that represent indebtedness, ordebtissuedbycorporationsandbythestateandlocalgovernments.Financialmarketscanbeclassifiedintermsof cash market and derivative markets. The cash market, also referred to as the spot market is the market for the immediatepurchaseandsaleofafinancialinstrument.
Incontrast,somefinancialinstrumentsarecontractsthatspecifythatthecontractholderhaseithertheobligationor the choice to buy or sell another something at or by some future date. The ‘something’ that is the subject of the contractiscalledtheunderlying(asset).Theunderlyingassetisastock,abond,afinancialindex,aninterestrate,acurrency or a commodity. As the price of such contracts derives their value from the value of the underlying assets, these contracts are called derivative instruments and the market where they are traded is called the derivatives market.

13
Whenafinancialinstrumentisfirstissued,itissoldintheprimarymarket.Asecondarymarketissuchinwhichfinancialinstrumentsareresoldamonginvestors.Nonewcapitalisraisedbytheissuerofthesecurity.Tradingtakesplaceamonginvestors.SecondarymarketsarealsoclassifiedintermsoforganisedstockexchangesandOver-TheCounter(OTC)markets.Stockexchangesarecentraltradinglocations,wherefinancialinstrumentsaretraded.Incontrast,anOTCmarketisgenerallywhereunlistedfinancialinstrumentsaretraded.
1.7 Financial Market RegulationIngeneral,financialmarketregulationisaimedtoensurethefairtreatmentofparticipants.Manyregulationshavebeen enacted in response to fraudulent practices. One of the key aims of regulation is to ensure business disclosure of accurate information for investment decision- making. When information is disclosed only to limited set of investors, those have major advantages over other groups of investors. Thus, regulatory framework has to provide the equal access to disclosures by companies. The recent regulations were passed in response to large bankruptcies, overhauled corporate governance, in order to strengthen the role of auditors in overseeing accounting procedures.
The Sorbanes-Oxley Act of 2002 in US was designed particularly to tighten companies’ governance after dotcom bustandEnron’sBankruptcy.Ithaddirectconsequencesinternationally,firstofallthroughglobalcompanies.TheUSWallStreetReformandConsumerProtectionAct(Dodd-Frank)of2010aimsat imposingtighterfinancialregulationforthefinancialmarketsandfinancialintermediariesintheUS,inordertoensureconsumerprotection.ThisisintunewithmajorfinancialregulationsystemdevelopmentinEUandotherpartsoftheworld.
1.8 Role of Financial InstitutionsAsfinancialmarketsareimperfect,securitiesbuyersandsellersdonothavefullaccesstoinformation.Individualswith available funds are not normally capable of identifying creditworthy borrowers to whom they could lend those funds. In addition, they do not have the expertise to assess the creditworthiness of potential borrowers. Financial institutions are needed to resolve the limitations caused by market imperfections. They accept funds from surplus unitsandchannelthefundstodeficitunits.Withoutfinancialinstitutions,theinformationandtransactioncostsoffinancialmarkettransactionswouldbeexcessive.Financialinstitutionscanbeclassifiedasdepositoryandnon-depository institutions.
1.8.1 Role of Depository InstitutionsDepository institutionsacceptdeposits fromsurplusunitsandprovidecredit todeficitunits through loansandpurchasesofsecurities.Theyarepopularfinancialinstitutionsforthefollowingreasons:
They offer deposit accounts that can accommodate the amount and liquidity characteristics desired by most •surplus units.They repackage funds received fromdeposits to provide loans of the size andmaturity desiredbydeficit•units.They accept the risk on loans provided.•Theyhavemoreexpertisethanindividualsurplusunitsinevaluatingthecreditworthinessofdeficitunits.•Theydiversifytheirloansamongnumerousdeficitunitsandthereforecanabsorbdefaultedloansbetterthan•individual surplus units could.
Toappreciatetheseadvantages,considertheflowoffundsfromsurplusunitstodeficitunitsifdepositoryinstitutionsdidnotexist.Eachsurplusunitwouldhavetoidentifyadeficitunitdesiringtoborrowthepreciseamountoffundsavailable for the precise time period in which funds would be available. Furthermore, each surplus unit would have to perform the credit evaluation and incur the risk of default. Under these conditions, many surplus units would likelyholdtheirfundsratherthanchannelthemtodeficitunits.Hence,theflowoffundsfromsurplusunitstodeficitunits would be disrupted.
When a depository institution offers a loan, it is acting as a creditor, just as if it had purchased a debt security. The more personalised loan agreement is less marketable in the secondary market than a debt security, however, because theloanagreementcontainsdetailedprovisionsthatcandiffersignificantlyamongloans.Anypotentialinvestorswouldneedtoreviewallprovisionsbeforepurchasingloansinthesecondarymarket.Amorespecificdescriptionofeachdepositoryinstitution’sroleinthefinancialmarketsfollows.

Financial Institutions and Financial Markets
14
Commercial banksIn aggregate, commercial banks are the most dominant depository institution. They serve surplus units by offering awidevarietyofdepositaccounts,andtheytransferdepositedfundstodeficitunitsbyprovidingdirectloansorpurchasing debt securities. Commercial bank operations are exposed to risk because their loans and many of their investments in debt securities are subject to the risk of default by the borrowers.
Commercial banks serve both the private and public sectors; their deposit and lending services are utilised by households, businesses, and government agencies. Some commercial banks (including Bank of America, J.P. Morgan Chase, Citigroup, and SunTrust Banks) have more than $100 billion in assets.Some commercial banks receive more funds from deposits than they need to make loans or invest in securities. Other commercial banks need more funds to accommodate customer requests than the amount of funds that they receive from deposits. The federal funds market facilitatestheflowoffundsbetweendepositoryinstitutions(includingbanks).Abankthathasexcessfundscanlendtoabankwithdeficientfundsforashort-termperiod,suchasonetofivedays.Inthisway,thefederalfundsmarketfacilitatestheflowoffundsfrombanksthathaveexcessfundstobanksthatareinneedoffunds.
Commercial banks are subject to regulations that are intended to limit their exposure to the risk of failure. In particular, banks are required to maintain a minimum level of capital, relative to their size, so that they have a cushion to absorb possible losses from defaults on some loans provided to households or businesses. The Federal Reserve (The Fed) serves as a regulator of banks.
Savings institutions Savings institutions, which are sometimes referred to as thrift institutions, are another type of depository institution. Savings institutions include savings and loan associations (S&Ls) and savings banks. Like commercial banks, savingsinstitutionsofferdepositaccountstosurplusunitsandthenchannelthesedepositstodeficitunits.SavingsbanksaresimilartoS&Lsexceptthattheyhavemorediversifiedusesoffunds.Overtime,however,thisdifferencehas narrowed. Savings institutions can be owned by shareholders, but most are mutual (depositor owned). Like commercial banks, savings institutions rely on the federal funds market to lend their excess funds or to borrow funds on a short-term basis.
Whereas commercial banks concentrate on commercial (business) loans, savings institutions concentrate on residential mortgage loans. Normally, mortgage loans are perceived to exhibit a relatively low level of risk, but manymortgagesdefaultedin2008and2009.Thisledtothecreditcrisisandcausedfinancialproblemsformanysavings institutions.
Credit unions Credit unions differ from commercial banks and savings institutions as follows:
Arenonprofit•Restrict their business to the credit union members, who share a common bond (such as a common employer •or union)
Like savings institutions, they are sometimes classified as thrift institutions in order to distinguish them fromcommercial banks. Because of the “common bond” characteristic, credit unions tend to be much smaller than other depository institutions. They use most of their funds to provide loans to their members. Some of the largest credit unions (e.g., the Navy Federal Credit Union, the State Employees Credit Union of North Carolina and the Pentagon Federal Credit Union) have assets of more than $5 billion.
1.8.2 Role of Non-depository Financial InstitutionsNon-depositoryinstitutionsgeneratefundsfromsourcesotherthandepositsbutalsoplayamajorroleinfinancialintermediation.
Finance companiesMostfinancecompaniesobtainfundsbyissuingsecuritiesandthenlendthefundstoindividualsandsmallbusinesses.Thefunctionsoffinancecompaniesanddepositoryinstitutionsoverlap,althougheachtypeofinstitutionconcentratesonaparticularsegmentofthefinancialmarkets(explainedinthechaptersdevotedtotheseinstitutions).

15
Mutual funds Mutual funds sell shares to surplus units and use the funds received to purchase a portfolio of securities. They are thedominantnon-depositoryfinancialinstitutionswhenmeasuredintotalassets.Somemutualfundsconcentratetheir investment in capital market securities, such as stocks or bonds. Others, known as money market mutual funds, concentrate in money market securities. Typically, mutual funds purchase securities in minimum denominations that are larger than the savings of an individual surplus unit. By purchasing shares of mutual funds and money market mutualfunds,smallsaversareabletoinvestinadiversifiedportfolioofsecuritieswitharelativelysmallamountof funds.
Securities firms Securitiesfirmsprovideawidevarietyoffunctionsinfinancialmarkets.Somesecuritiesfirmsactasabroker,executingsecurities transactionsbetweentwoparties.Thebrokerfeeforexecutinga transaction is reflected inthe difference (or spread) between the bid quote and the ask quote. The markup as a percentage of the transaction amount will likely be higher for less common transactions, since more time is needed to match up buyers and sellers. The markup will also likely be higher for transactions involving relatively small amounts so that the broker will be adequately compensated for the time required to execute the transaction.
Inadditiontobrokerageservices,securitiesfirmsplacenewlyissuedsecuritiesforcorporationsandgovernmentagencies; this task differs from traditional brokerage activities because it involves the primary market. When securitiesfirmsunderwritenewlyissuedsecurities,theymaysellthesecuritiesforaclientataguaranteedpriceormay simply sell the securities at the best price they can get for their client.
Furthermore,securitiesfirmsoftenactasdealers,makingamarketinspecificsecuritiesbymaintaininganinventoryofsecurities.Althoughabroker’sincomeismostlybasedonthemarkup,thedealer’sincomeisinfluencedbytheperformance of the security portfolio maintained. Some dealers also provide brokerage services and therefore earn incomefrombothtypesofactivities.Somesecuritiesfirmsofferadvisoryservicesonmergersandotherformsofcorporaterestructuring.Inadditiontohelpingacompanyplansit’srestructuring,thesecuritiesfirmalsoexecutesthechangeintheclient’scapitalstructurebyplacingthesecuritiesissuedbythecompany.Thesecuritiesfirmsthatoffer these services are commonly referred to as investment banks.
Insurance companies Insurancecompaniesprovideindividualsandfirmswithinsurancepoliciesthatreducethefinancialburdenassociatedwith death, illness and damage to property. These companies charge premiums in exchange for the insurance that they provide. They invest the funds received in the form of premiums until the funds are needed to cover insurance claims. Insurance companies commonly invest these funds in stocks or bonds issued by corporations or in bonds issuedbythegovernment.Inthisway,theyfinancetheneedsofdeficitunitsandthusserveasimportantfinancialintermediaries. Their overall performance is linked to the performance of the stocks and bonds in which they invest. Large insurance companies include State Farm Group, Allstate Insurance, Travelers Group, CNA Insurance, and Liberty Mutual.
Pension funds Many corporations and government agencies offer pension plans to their employees. The employees and their employers(orboth)periodicallycontributefundstotheplan.Pensionfundsprovideanefficientwayforindividualsto save for their retirement. The pension funds manage the money until the individuals withdrew the funds from their retirement accounts. The money that is contributed to individual retirement accounts is commonly invested by the pension funds in stocks or bonds issued by corporations or in bonds issued by the government. Thus pension fundsareimportantfinancialintermediariesthatfinancetheneedsofdeficitunits.
1.9 Role of Financial MarketsFinancial markets transfer funds from those who have excess funds to those who need funds. They enable college studentstoobtainstudentloans,familiestoobtainmortgages,businessestofinancetheirgrowth,andgovernmentstofinancemanyoftheirexpenditures.Manyhouseholdsandbusinesseswithexcessfundsarewillingtosupplyfundstofinancialmarketsbecausetheyearnareturnontheirinvestment.Iffundswerenotsupplied,thefinancialmarkets would not be able to transfer funds to those who need them.

Financial Institutions and Financial Markets
16
Those participants who receive more money than they spend are referred to as surplus units (or investors). They providetheirnetsavingstothefinancialmarkets.Thoseparticipantswhospendmoremoneythantheyreceivearereferredtoasdeficitunits.Theyaccessfundsfromfinancialmarketssothattheycanspendmoremoneythantheyreceive.Manyindividualsprovidefundstofinancialmarketsinsomeperiodsandaccessfundsinotherperiods.E.g.,Collegestudentsaretypicallydeficitunits,astheyoftenborrowfromfinancialmarketstosupporttheireducation.After they obtain their degree, they earn more income than they spend and thus become surplus units by investing theirexcessfunds.Afewyearslater,theymaybecomedeficitunitsagainbypurchasingahome.Atthisstage,theymayprovidefundstoandaccessfundsfromfinancialmarketssimultaneously.
Thatis,theymayperiodicallydepositsavingsinafinancialinstitutionwhilealsoborrowingalargeamountsofmoneyfromafinancialinstitutiontobuyahome.Manydeficitunitssuchasfirmsandgovernmentagenciesaccessfundsfromfinancialmarketsbyissuingsecurities,whichrepresentaclaimontheissuer.Debtsecuritiesrepresentdebt(alsocalledcredit,orborrowedfunds)incurredbytheissuer.Deficitunitsthatissuethedebtsecuritiesareborrowers. The surplus units that purchase debt securities are creditors, and they receive interest on a periodic basis (such as every six months). Debt securities have a maturity date, at which time the surplus units can redeem the securitiesinordertoreceivetheprincipal(facevalue)fromthedeficitunitsthatissuedthem.Equitysecurities(alsocalledstocks)representequityorownershipinthefirm.Somebusinessesprefertoissueequitysecuritiesratherthandebtsecuritieswhentheyneedfundsbutmightnotbefinanciallycapableofmakingtheperiodicinterestpaymentsrequired for debt securities.
1.9.1 Accommodating Corporate Finance NeedsAkeyroleoffinancialmarketsistoaccommodatecorporatefinanceactivity.Corporatefinance(alsocalledfinancialmanagement) involves corporate decisions such as how much funding to obtain and what types of securities to issue whenfinancingoperations.Thefinancialmarketsserveasthemechanismwherebycorporations(actingasdeficitunits) can obtain funds from investors (acting as surplus units).
1.9.2 Accommodating Investment NeedsAnotherkeyroleoffinancialmarketsisaccommodatingsurplusunitswhowanttoinvestineitherdebtorequitysecurities.Investmentmanagementinvolvesdecisionsbyinvestorsregardinghowtoinvesttheirfunds.Thefinancialmarkets offer investors access to a wide variety of investment opportunities, including securities issued by the U.S. Treasury and government agencies as well as securities issued by corporations. Financial institutions serve as intermediarieswithinthefinancialmarketstochannelfundsfrominvestorstocorporations.Thus,theyconnecttheinvestmentmanagementactivitywiththecorporatefinanceactivity.Theyalsocommonlyserveasinvestorsandchannel their own funds to corporations.
1.9.3 Primary versus Secondary MarketsPrimary markets facilitate the issuance of new securities. Secondary markets facilitate the trading of existing securities, which allows for a change in the ownership of the securities. Primary market transactions provide funds to the initial issuer of securities; secondary market transactions do not. E.g., Last year, Riverto Co. had excess funds and invested in newly issued Treasury debt securities with a 10-year maturity. This year, it will need $15 million to expand its operations. The company decided to sell its holdings of Treasury bonds in the secondary market and received $5 million from the sale.It also issued its own debt securities, which have a 10-year maturity, in the primary market. The investors who purchased Riverton’s debt securities can redeem them at maturity or sell them before that time to other investors in the secondary market.
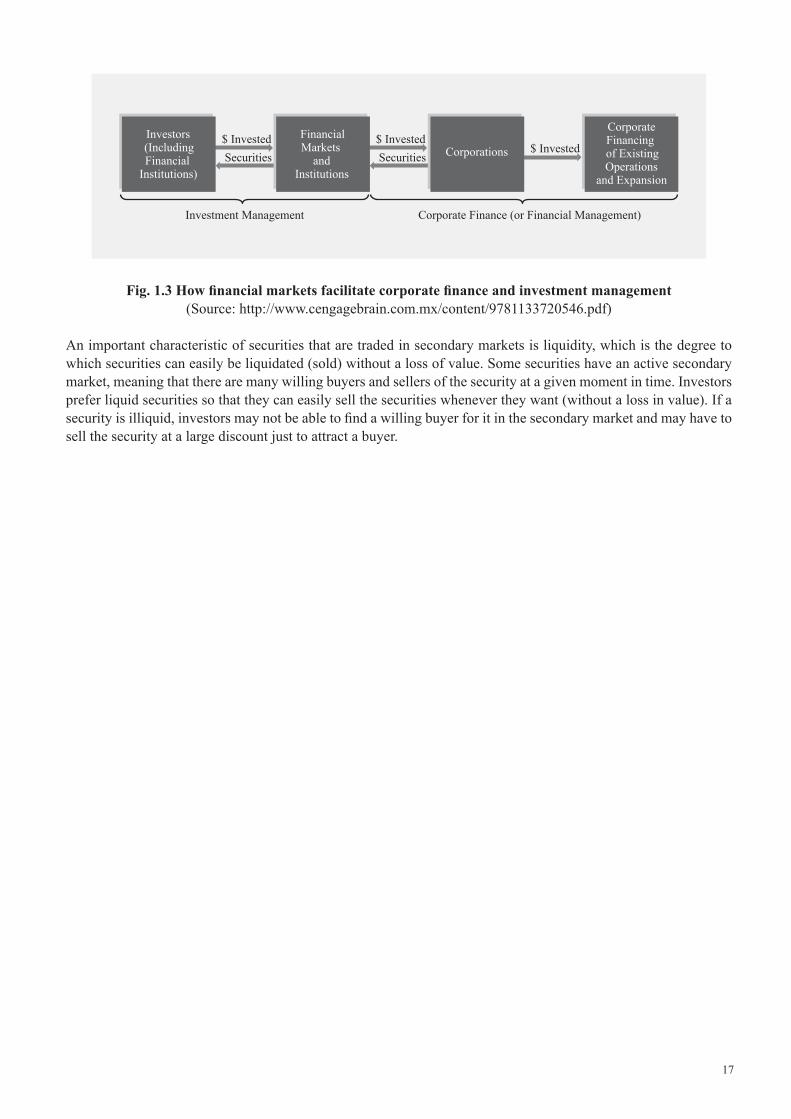
17
$ InvestedSecurities
$ InvestedSecurities
$ InvestedInvestors(IncludingFinancial
Institutions)
FinancialMarkets
andInstitutions
Corporations
CorporateFinancing of ExistingOperations
and Expansion
Investment Management Corporate Finance (or Financial Management)
Fig. 1.3 How financial markets facilitate corporate finance and investment management(Source: http://www.cengagebrain.com.mx/content/9781133720546.pdf)
An important characteristic of securities that are traded in secondary markets is liquidity, which is the degree to which securities can easily be liquidated (sold) without a loss of value. Some securities have an active secondary market, meaning that there are many willing buyers and sellers of the security at a given moment in time. Investors prefer liquid securities so that they can easily sell the securities whenever they want (without a loss in value). If a securityisilliquid,investorsmaynotbeabletofindawillingbuyerforitinthesecondarymarketandmayhavetosell the security at a large discount just to attract a buyer.

Financial Institutions and Financial Markets
18
SummaryThe main function of the system is to channel funds between the two groups of end users of the system: from •lenders(‘surplusunits’)toborrowers(‘deficitunits’).Afinancialsystemprovidespaymentsfacilities,avarietyofservicessuchasinsurance,pensionsandforeign•exchange, together with facilities which allow people to adjust their existing wealth portfolios.Apart from direct borrowing and lending between end-users, borrowing and lending through intermediaries and •organised markets have important advantages. These include transforming the maturity of short-term savings into longer-term loans and reduction of risk and controlling transaction costs.Thefieldoffinancialmarketsanditstheoreticalfoundationsisbasedonthestudyofthefinancialsystem,the•structure of interest rates, and the pricing of risky assets.Themajormarket players are households, governments, nonfinancial corporations, depository institutions,•insurance companies, assetmanagement firms, investment banks, nonprofit organisations, and foreigninvestors.Financialmarketsareclassifiedintointernalversusexternalmarkets,capitalmarketsversusmoneymarkets,•cash versus derivative markets, primary versus secondary markets, and private placement versus public markets, exchange-traded versus over-the-counter markets.Thefinancialmarketsandintermediariesaresubjecttofinancialregulators.Therecentchangesintheregulatory•systemarehappeninginresponsetotheproblemsinthecreditmarketsandfinancialcrisisthatstruck2008.An important characteristic of securities that are traded in secondary markets is liquidity, which is the degree •to which securities can easily be liquidated (sold) without a loss of value.Secondary markets facilitate the trading of existing securities, which allows for a change in the ownership of •the securities.Akeyroleoffinancialmarketsistoaccommodatecorporatefinanceactivity.•The capitalmarket is the sector of thefinancialmarketwhere long-termfinancial instruments issued by•corporations and governments trade.Mostfinancecompaniesobtainfundsbyissuingsecuritiesandthenlendthefundstoindividualsandsmall•businesses.
ReferencesFabozzi F. J. & Modigliani F., 2007. • Capital Markets: Institutions and Instruments. Prentice-Hall International.Howells, P. & Bain, K., 2008. • Financial Markets and Institutions. Financial Times, Prentice Hall.Financial Markets• . [Pdf] Available at: <http://www.bcci.bg/projects/latvia/pdf/7_Financial_markets.pdf> [Accessed 14 May 2014].McClintock, E. E. & Calabria, A. M., • Regulation, Market Structure, and Role of the Credit Rating Agencies. [Pdf]Availableat:<http://www.cato.org/sites/cato.org/files/pubs/pdf/PA704.pdf>[Accessed14May2014].Financial Markets• . [Video online] Available at: <https://www.youtube.com/watch?v=P_bqDgkZmuY> [Accessed 14 May 2014].Anintroductiontofinancialmarkets-MoneyWeekInvestmentTutorials• . [Video online] Available at: <https://www.youtube.com/watch?v=6OoMQiClXCs> [Accessed 14 May 2014].

19
Recommended ReadingMadura, J., 2008. • Financial Markets and Institutions. Prentice-Hall International.Mishkin, F., S. & Eakins S. G. 2006. • Financial Markets and Institutions. Addison-Wesley.Seifert, W. G., Schleitner, A., K., Mattern, F., Streit, C. C. & Voth, H. J., 2000. • European Capital Markets. Macmillan.

Financial Institutions and Financial Markets
20
Self Assessment _____________arethekeyplayersinthefinancialmarketsastheyperformthefunctionofintermediationand1. thusdeterminetheflowoffunds.
Financial intermediariesa. Financial marketsb. Financial regulatorsc. Financial institutionsd.
Whoperformtheroleofmonitoringandregulatingtheparticipantsinthefinancialsystem?2. Thefinancialregulatorsa. Financial intermediariesb. Financial marketsc. Financial institutionsd.
The value of an ____________ bears no relation to the form, physical or otherwise, in which the claims are 3. recorded.
intangible asseta. tangible assetsb. physical propertiesc. financialinstrumentsd.
Which party is called the investor party?4. The party that has agreed to make future cash payments.a. Thepartythatownsthefinancialinstrument,andthereforetherighttoreceivethepaymentsmadebytheb. issuer.The party which allows the transfer of funds from those entities, who have surplus funds to invest to those c. who need funds to invest in tangible assets.Thepartywhichredistributes theunavoidableriskrelatedtocashgenerationamongdeficitandsurplusd. economic units.
_______________meansthattransactionsbetweenbuyersandsellersoffinancialinstrumentsinafinancial5. market determine the price of the traded asset.
Transaction costsa. Debt instrumentb. Price discovery functionc. Market economiesd.
___________providesanopportunityforinvestorstosellafinancialinstrument,sinceitisreferredtoasa6. measure of the ability to sell an asset at its fair market value at any time.
Liquidity functiona. Transaction costsb. Indian stock marketc. Stock exchanged.

21
Which of the following is not a key attributes determining transaction costs?7. Assetspecificitya. Uncertaintyb. Frequency of occurrencec. External eventsd.
Match the following8. Public investors1. Assess the credit risk of borrowersA. Brokers2. Ultimately own the securitiesB. Dealers3. Act as agents for public investorsC. Credit rating agencies4. Do trade on their own accountD.
1-C, 2-D, 3-B, 4-Aa. 1-D, 2-A, 3-C, 4-Bb. 1-B, 2-C, 3-D, 4-Ac. 1-A, 2-B, 3-C, 4-Dd.
_____________ is a market where the trading of company stock, both listed securities and unlisted takes 9. place.
Price a. Market timingsb. Stock exchangesc. Stock marketd.
Akeyroleof__________istoaccommodatecorporatefinanceactivity.10. Financial intermediariesa. Financial marketsb. Financial regulatorsc. Financial institutionsd.

Financial Institutions and Financial Markets
22
Chapter II
Determination of Interest Rates
Aim
The aim of this chapter is to:
introduce liquidity preference theory•
explain interest rate determination•
discuss loanable funds theory•
Objectives
The objectives of this chapter are to:
explore yield curves•
elaborate level of interest rates in the economy•
compare spot rates and forwards rates•
Learning outcome
At the end of this chapter, you will be able to:
elucidate the forecasting of interest rates•
understand the term structure of interest rates•
explain theories of term structure of interest rates•

23
2.1 IntroductionForfinancingandinvestingdecision-makinginadynamicfinancialenvironmentofmarketparticipants,itiscrucialtounderstandinterestratesasoneofthekeyaspectsofthefinancialenvironment.Severaleconomictheoriesexplaindeterminants of the level of interest rates. Another group of theories explains the variety of interest rates and their term structure, i.e., relationship between interest rates and the maturity of debt instruments.
2.2 Interest Rate DeterminationInterest rates are calculated differently according to different criteria. These are explained below.
2.2.1 The Rate of InterestInterest rate is a rate of return paid by a borrower of funds to a lender of them, or a price paid by a borrower for a service,therighttomakeuseoffundsforaspecifiedperiod.Thusitisoneformofyieldonfinancialinstruments.The following two questions are being raised by market participants:
What determines the average rate of interest in an economy?•Why do interest rates differ on different types and lengths of loans and debt instruments?•
Interest rates vary depending on borrowing or lending decision. There is interest rate at which banks are lending (the offer rate) and interest rate they are paying for deposits (the bid rate). The difference between them is called a spread. Such a spread also exists between selling and buying rates in local and international money and capital markets. Thespreadbetweenofferandbidratesprovidesacoverforadministrativecostsofthefinancialintermediariesandincludestheirprofit.Thespreadisinfluencedbythedegreeofcompetitionamongfinancialinstitutions.Intheshort-term international money markets the spread is lower if there is considerable competition.
Conversely, the spread between banks borrowing and lending rates to their retail customers is larger in general due to considerably larger degree of loan default risk. Thus the lending rate (offer or ask rate) always includes a risk premium. Risk premium is an addition to the interest rate demanded by a lender to take into account the risk that the borrower might default on the loan entirely or may not repay on time (default risk).
There are several factors that determine the risk premium for a Non- Government security, as compared with the Government security of the same maturity. These are as follows:
The perceived creditworthiness of the issuer•Provisions of securities such as conversion provision, call provision, put provision•Interest taxes•Expected liquidity of a security’s issue•
In order to explain the determinants of interest rates in general, the economic theory assumes there is some particular interest rate, as a representative of all interest rates in an economy. Such an interest rate usually depends upon the topic considered, and can represented by e.g. interest rates on government short-term or long-term debts, or the base interest rate of the commercial banks, or a short-term money market rate (EURIBOR). In such a case it is assumed that the interest rate structure is stable and that all interest rates in the economy are likely to move in the same direction. Interest rate structure is the relationships between the various rates of interest in an economy on financialinstrumentsofdifferentlengths(terms)orofdifferentdegreesofrisk.
Theratesofinterestquotedbyfinancialinstitutionsarenominalrates,andareusedtocalculateinterestpaymentstoborrowers and lenders. However, the loan repayments remain the same in money terms and make up a smaller and smaller proportion of the borrower’s income. The real cost of the interest payments declines over time. Therefore thereisarealinterestrate,i.e.therateofinterestadjustedtotakeintoaccounttherateofinflation.Astherealrateof return to the lender can be also falling over time, the lender determines interest rates to take into account the expectedrateofinflationovertheperiodofaloan.Whenthereisuncertaintyabouttherealrateofreturntobereceivedbythelender,hewillbeinclinedtolendatfixedinterestratesforshort-term.Theloancanbe‘rolledover’atanewlysetrateofinteresttoreflectchangesintheexpectedrateofinflation.Ontheotherhand,lenderscanset

Financial Institutions and Financial Markets
24
afloatinginterestrate,whichisadjustedtotheinflationratechanges.Realinterestrateisthedifferencebetweenthenominalrateofinterestandtheexpectedrateofinflation.Itisameasureoftheanticipatedopportunitycostofborrowing in terms of goods and services forgone.
The dependence between the real and nominal interest rates is expressed using the following equation:
i = (1+r) (1+ie) – 1
Where i is the nominal rate of interest, r is the real rate of interest and ieeistheexpectedrateofinflation
Example: Assume that a bank is providing a company with a loan of 1000 thousand Euro for one year at a real rate of interest of 3 per cent. At the end of the year it expects to receive back 1030 thousand Euro of purchasing power atcurrentprices.However,ifthebankexpectsa10percentrateofinflationoverthenextyear,itwillwant1133thousand Euro (10 percent above 1030 thousand Euro). The interest rate required by the bank would be 13.3 per cent.
i = (1+ 0,03) (1 + 0,1) - 1 = (1,03)(1,1) - 1 = 1,133 – 1 = 0,133 or 13,3 per cent
Whensimplified,theequationbecomes:i = r+ ie
In the example, this would give 3 per cent plus 10 per cent = 13 per cent.The real rate of return is thus: r = i ie
When assumption is made that r is stable over time, the equation provides the Fisher effect. It suggests that changes inshort-terminterestratesoccurbecauseofchangesintheexpectedrateofinflation.Ifafurtherassumptionismadethatexpectationsabouttherateofinflationofmarketparticipantsarecorrect,thenthekeyreasonforchangesininterestratesisthechangesinthecurrentrateofinflation.Borrowersandlendersthinkmostlyintermsofrealinterest rates. There are two economic theories explaining the level of real interest rates in an economy:
The loanable funds theory•Liquidity preference theory•
2.2.2 Interest Rate Theories: Loanable Funds TheoryIn an economy, there is a supply loanable funds (i.e., credit) in the capital market by households, business and governments. The higher the level of interest rates, the more such entities are willing to supply loan funds; the lower the level of interest, the less they are willing to supply. These same entities demand loanable funds, demanding more when the level of interest rates is low and less when interest rates are higher.
The extent to which people are willing to postpone consumption depends upon their time preference.Time preference describes the extent to which a person is willing to give up the satisfaction obtained from present consumption in return for increased consumption in the future.
The term ‘loanable funds’, simply refers to the sums of money offered for lending and demanded by consumers and investors during a given period. The interest rate in the model is determined by the interaction between potential borrowersandpotentialsavers.Loanablefundsarefundsborrowedandlentinaneconomyduringaspecifiedperiodoftime–theflowofmoneyfromsurplustodeficitunitsintheeconomy.
The loanable funds theory was formulated by the Swedish economist Knut Wicksell in the 1900s. According to him, the level of interest rates is determined by the supply and demand of loanable funds available in an economy’s credit market (i.e., the sector of the capital markets for long-term debt instruments). This theory suggests that investment and savings in the economy determine the level of long-term interest rates. Short-term interest rates, however, are determinedbyaneconomy’sfinancialandmonetaryconditions.
25
According to the loanable funds theory for the economy as a whole the formulae are as follows:Demand for loanable funds = net investment + net additions to liquid reserves•Supply of loanable funds = net savings + increase in the money supply•
Given the importance of loanable funds and that the major suppliers of loanable funds are commercial banks; the key roleofthisfinancialintermediaryinthedeterminationofinterestratesisvivid.Thecentralbankisimplementingspecificmonetarypolicy;thereforeitinfluencesthesupplyofloanablefundsfromcommercialbanksandtherebychanges the level of interest rates. As central bank increases (decreases) the supply of credit available from commercial banks, it decreases (increases) the level of interest rates.
2.2.3 Interest Rate Theories: Liquidity Preference TheorySaving and investment ofmarket participants under economic uncertaintymaybemuchmore influenced byexpectations and by exogenous shocks than by underlying real forces. A possible response of risk-averse savers istovarytheforminwhichtheyholdtheirfinancialwealthdependingontheirexpectationsaboutassetprices.As they are concerned about the risk of loss in the value of assets, they are likely to vary the average liquidity of their portfolios.A liquid asset is the one that can be turned into money quickly, cheaply and for a known monetary value.
Money balances can be held in the form of currency or checking accounts, however it does earn a very low interest rate or no interest at all. A key element in the theory is the motivation for individuals to hold money balance despite thelossofinterestincome.Moneyisthemostliquidofallfinancialassetsand,ofcourse,caneasilybeutilisedtoconsume or to invest. The quantity of money held by individuals depends on their level of income and, consequently, for an economy the demand for money is directly related to an economy’s income. There is a trade-off between holding money balance for purposes of maintaining liquidity and investing or lending funds in less liquid debt instruments in order to earn a competitive market interest rate. The difference in the interest rate that can be earned by investing in interest-bearing debt instruments and money balances represents an opportunity cost for maintaining liquidity. The lower the opportunity cost, the greater the demand for money balances; the higher the opportunity cost, the lower the demand for money balance.
Liquiditypreferenceispreferenceforholdingfinancialwealthintheformofshort-term,highlyliquidassetsratherthan long-term illiquid assets, based principally on the fear that long-term assets will lose capital value over time. According to the liquidity preference theory, the level of interest rates is determined by the supply and demand for money balances. The money supply is controlled by the policy tools available to the country’s Central Bank. Conversely, in the loan funds theory the level of interest rates is determined by supply and demand, however it is in the credit market.
2.3 Determinants of Interest Rates for Individual SecuritiesInterest rates are determined with the following factors.
2.3.1 Inflation is the Rate of Change in the Overall Price LevelTheConsumerPriceIndex(CPI)isthemostcommonlyquotedmeasureofinflation.TheCPIpurportstomeasuretheprice level of a market basket of goods and services purchased by the typical urban consumer. The Fisher effect states thatnominalratesequalrealratesplusapremiumforexpectedinflation.Thisrelationshipisthebasisforthetermstructure.Differencesinannualexpectedinflationratescausedifferencesinbondrateswithdifferentmaturities.
The nominal interest rate is the additional dollars earned from an investment. The real interest rate is the additional purchasing power earned from an investment. The real interest rate refers to the marginal gain in units purchased rather than in dollars. Sometimes we think that ex-ante real rates cannot be negative, but they can because of the convenience yield of liquidity. They have been negative in recent years in both the U.S. and Japan. The Fisher Effect relates nominal and real interest rates. The approximate Fisher effect is given as,

Financial Institutions and Financial Markets
26
i = RIR + Expected (IP)
Wherei=nominalinterestrate,RIR=realinterestrateandExpected(IP)=expectedinflation.
The actual Fisher Effect is given as(1+i) = (1+RIR)*(1+Expected(IP))
The following example illustrates why the actual Fisher Effect is multiplicative:
Suppose“It”originallycostyou$1.Youhave$10socouldbuy10of“it.”Ifinflationis5%,inoneyear“it”willcost $1 + .05 =$1.05. If you invest your $10 and earn 10% + 5% = 15% (the approximate Fisher Effect) you will get back $10 * 1.15 = $11.50. Can you buy $10% more of “it?” I.E. can you now buy 10 * 1.1 or 11 of “it?”
11 * $1.05 = $11.55; so you are short 5 cents.In order to buy 10% more of it you must earn an interest rate equal to (1.10 * 1.05) - 1 = 1.155 - 1 = 15.5% nominal interest. Then your $10 will grow to $10 * 1.155 = $11.55 and you can buy 10% more of it! Since both P & Q are rising,theratechargedmustreflecttheincrementstobothPandQ.
Thedifferencematters little if inflation is lowand/or the timeperiodunder consideration is not very long. IninternationalinvestingenvironmentswhereinflationismuchhigherthantheU.S.iscurrentlyexperiencing,thedifference can be material.
2.3.2 Default or Credit RiskDefault risk premiums (DRPs) are increases in required yield needed to offset the possibility the borrower will not repay the promised interest and principle in full or as scheduled. According to the Wall Street Journal Online, May 5 edition, credit risk premiums on Aa rated corporate debt relative to Treasuries were 1.95% and were 2.77% on Baa rated debt. DRPs on high grade debt were about 6.60%. DRPs are cyclical and rise in periods of weak economic conditions such as the U.S. was experiencing in 2008.
2.3.3 Liquidity RiskLiquidity risk premiums are increases in required or promised yields designed to offset the risk of not being able to sell the asset in timely fashion at fair value. These are similar to, but not the same as, the liquidity premiums in thetermstructurediscussion.Liquidityriskcanbemoresignificantforsomedebtinstrumentsthanforstocksasmany bonds trade in thin markets.
2.3.4 Special Provisions of CovenantsMunicipal bond (Muni) rates are lower than similar corporate bonds because interest (but not capital gains) is exempt from federal taxation. In most states the holder of a muni bond issued in that state is also exempted from state taxes. Why munis are granted special tax status? What do they think about industrial development bonds which allow private corporations to issue tax advantaged munis for certain projects? Note that usage of IDBs has been restricted inrecentyearsduetooverusagebyprivatefirmsseekingtoexploitthetaxadvantageofmunis.
Callable bonds have higher required yields than straight bonds because the issuer will normally call them when rates have dropped, forcing the bondholders to reinvest at lower interest rates. Although, it varies with interest rate expectations the premium on a callable bond might be 30 to 50 basis points.
Convertible bonds have lower yields than straight bonds because the bondholder has the right to convert them to preferred or common stock at their choice. Offering a conversion feature may save 100 to 200 basis points, ceteris paribus. In most cases however, the stock has to appreciate 15%-25% over the at issue price in order to make conversion attractive.

27
2.3.5 Term to MaturityThe term structure depicts the relationship between maturity and yields for bonds identical in all respects except maturity. In practice, ‘identical’ means same rating, liquidity and hopefully the same coupon (or differential tax effects will be present). The graph of the term structure can take on any shape, but upward sloping is most common (meaning longer term bonds promise higher nominal yields). The yield curve was inverted in Nov 2000 and in parts of 2006 and 2007. Note that for Treasuries, ‘on the run’ (newly issued) securities often carry price premiums over ‘off the run’ (previously issued) securities.
ij*= f(Riskless real rate,Expected inflation,Default risk premium,Liquidity risk premium,Special covenantpremium, Maturity risk premium)
2.4 Forecasting Interest RatesA forward rate is a rate that can be imputed from the existing term structure. It is a mathematical tautology that givenasetoflong-termspotratesonecanfindthesetofindividualoneyearforwardrates.Forinstanceusingthebooks terminology:
(1+1R6)6 = (1+1R5)5 * (1+5F1)(1+1R5)6 = (1+1R4)4 * (1+4F1)
Where, 1R6 and 1R5 are the long-term spot rates from today to year 6 and 5 respectively and F stands for a forward rate.Thefirstsubscriptreferstotheloanoriginationdate,butthetextbookconfusinglyuses1insteadof0asisnormal to represent today. The second subscript refers to the term to maturity. As all the spot rates are known one can construct the full set of forward rates, iF1, from them.
Interpreting the forward ratesIf the UET strictly holds then forward rates are an unbiased estimate of expected future annual rates. If there are liquidity premiums, one should subtract the liquidity premium from the forward rate before using it as an estimate of the expected future spot rate. If segmentation strictly holds, the forward rate has no economic meaning.

Financial Institutions and Financial Markets
28
SummaryLevel of interest rates in an economy is explained by two key economic theories: the loanable funds theory and •the liquidity preference theory.The loanable funds theory states that the level of interest rates is determined by the supply of and demand for •loanable funds.According to the liquidity preference theory, the level of interest rates is determined by the supply of and demand •for money balances.Interest rates in the economy are determined by the base rate (rate on a Government security) plus a risk premium •(or a spread).There are several factors that determine the risk premium for a Non- Government security, as compared with •the Government security of the same maturity. The term structure of interest rates shows the relationship between the yield on a bond and its maturity.•The yield curve describes the relationship between the yield on bonds of the same credit quality but different •maturities in a graphical way.Apart from spot rates, forward rates provide additional information for issuers and investors.•The major theories explain the observed shapes of the yield curve are the expectations theory, liquidity premium, •market segmentation theory and preferred habit theory.A forward rate is a rate that can be imputed from the existing term structure.•Inflationistherateofchangeintheoverallpricelevel.•TheFishereffectstatesthatnominalratesequalrealratesplusapremiumforexpectedinflation.•The nominal interest rate is the additional dollars earned from an investment.•Default risk premiums (DRPs) are increases in required yield needed to offset the possibility the borrower will •not repay the promised interest and principle in full or as scheduled.Liquidity risk premiums are increases in required or promised yields designed to offset the risk of not being •able to sell the asset in timely fashion at fair value.Municipal bond (Muni) rates are lower than similar corporate bonds because interest (but not capital gains) is •exempt from federal taxation. In most states the holder of a muni bond issued in that state is also exempt from state taxes.The term structure depicts the relationship between maturity and yields for bonds identical in all respects except •maturity.
ReferencesCulbertson, J. M., 1957. • TheTermStructureofInterestRates. Quarterly Journal of Economics.Estrella, A. & Mishkin, F. S., 1996. • TheyieldcurveasapredictorofU.S.recessions. Federal Reserve Bank of New York Current Issues in Economics and Finance.Financial Markets• . [Pdf] Available at: <http://www.bcci.bg/projects/latvia/pdf/7_Financial_markets.pdf> [Accessed 14 May 2014].Introduction toFinancialMarket (Part-1)• . [Pdf] Available at: <http://cbse.gov.in/Financial%20Market%20Final.pdf> [Accessed 14 May 2014].Moneymarket: Interest rate determination• . [Video online] Available at: <https://www.youtube.com/watch?v=bQ0Ellr1L3o> [Accessed 14 May 2014].Mod-01Lec-33InterestRate:Determination&Structure• . [Video online] Available at: <https://www.youtube.com/watch?v=rbmVJS00HeI> [Accessed 14 May 2014].

29
Recommended ReadingFavero, C. A., Kaminska, I. & Soderstrom, U., 2005. • Thepredictivepoweroftheyieldspread:Furtherevidenceand a structural interpretation. CEPR Discussion.Kane, E. J., 1970. • Thetermstructureofinterestrates:Anattempttoreconcileteachingwithpractice. Journal of Finance.Ron, U., 2002. • InterestRate,TermStructure,andValuationModeling. New York, John Wiley & Sons.

Financial Institutions and Financial Markets
30
Self Assessment____________ is a rate of return paid by a borrower of funds to a lender of them, or a price paid by a borrower 1. foraservice,therighttomakeuseoffundsforaspecifiedperiod.
Interest ratea. Determinantsb. Economic theoryc. Financial instrumentd.
What is the difference between interest rate at which banks are lending (the offer rate) and interest rate they 2. are paying for deposits is called as?
Marketa. Degreeb. Spreadc. Risk premium d.
Thespreadisinfluencedbythe_______________amongfinancialinstitutions.3. securitya. depositsb. money and capital marketsc. degree of competitiond.
___________ is an addition to the interest rate demanded by a lender to take into account the risk that the 4. borrower might default on the loan entirely or may not repay on time.
Default riska. Risk premiumb. Interest taxesc. Liquidityd.
_____________istherelationships,betweenthevariousratesofinterestinaneconomyonfinancialinstruments5. of different lengths (terms) or of different degrees of risk.
Interest rate structurea. Real interest rateb. Expected liquidity of a security’s issuec. Risk premiumd.
Which of the following factors does not determine the risk premium for a Non- government security?6. The perceived creditworthiness of the issuera. Provisions of securities such as conversion provision, call provision and put provisionb. Liquidity preference c. Expected liquidity of a security’s issued.
_____________ describes the extent to which a person is willing to give up the satisfaction obtained from 7. present consumption in return for increased consumption in the future.
Interest ratea. Time preferenceb. Liquidity preferencec. The loanable fundsd.

31
___________arefundsborrowedandlentinaneconomyduringaspecifiedperiodoftime–theflowofmoney8. fromsurplustodeficitunitsintheeconomy.
Interest ratea. Time preferenceb. Liquidity preferencec. The loanable fundsd.
Match the following9.
Demand for loanable funds1. Market segmentationA.
Supply of loanable funds2. net investment + net additions to liquid reservesB.
Theory of Term Structure of Interest Rates3. Rate of change in the overall price levelC.
Inflation4. net savings + increase in the money supplyD. 1-D, 2-C, 3-B, 4-Aa. 1-B, 2-D, 3-A, 4-Cb. 1-A, 2-B, 3-C, 4-Dc. 1-C, 2-A, 3-D, 4-Bd.
What is the nominal interest rate?10. Additional dollars earned from an investmenta. Differences in bond rates with different maturitiesb. Rated corporate debtc. Municipal bondd.

Financial Institutions and Financial Markets
32
Chapter III
Term Structure of Interest Rates
Aim
The aim of this chapter is to:
introduce term structure of interest rates•
explain theories of term structure of interest rates•
discuss liquidity premium theory•
Objectives
The objectives of this chapter are to:
determine impact of liquidity premium on the yield curve•
elaborate forward interest rates and yield curve•
analyse forward yield curve•
Learning outcome
At the end of this chapter, you will be able to:
analyse expectations theory•
understand how interest rate expectations affect the yield curve•
describe market segmentation theory•

33
3.1 IntroductionThe relationship between the yields on comparable securities but different maturities is called the term structure of interest rates. The primary focus here is the treasury market. The graphic representation of the relationship between the yields on Treasury securities with different maturities is known as the yield curve and, therefore, the maturity spread is also referred to as the yield curve spread.
Yield curve shows the relationships between the interest rates payable on bonds with different lengths of time to maturity. That is, it shows the term structure of interest rates. The focus on the treasury yield curve functions is due to mainly because of its role as a benchmark for setting yields in many other sectors of the debt market. However, a treasury yield curve based on observed yields on the treasury market is an unsatisfactory measure of the relation between required yield and maturity. The key reason is that securities with the same maturity may actually provide different yields.
Hence, it is necessary to develop more accurate and reliable estimates of the treasury yield curve. It is important to estimate the theoretical interest rate that the treasury would have to pay assuming that the security it issued is a zero-coupon security. If the term structure is plotted at a given point in time, based on the yield to maturity, or the spot rate, at successive maturities against maturity, one of the three shapes of the yield curve would be observed. The type of yield curve, when the yield increases with maturity, is referred to as an upward-sloping yield curve or a positively sloped yield curve. A distinction is made for upward sloping yield curves based on the steepness of the yield curve. The steepness of the yield curve is typically measured in terms of the maturity spread between the long-term and short-term yields.
A downward-sloping or inverted yield curve is the one, where yields in general decline as maturity increases. A variantoftheflatyieldistheoneinwhichtheyieldonshort-termandlong-termtreasuriesaresimilarbuttheyieldon intermediate-term treasuries are much lower than, for example, the six-month and 30-year yields. Such a yield curve is referred to as a humped yield curve.
3.2 Theories of Term Structure of Interest RatesThere are several major economic theories that explain the observed shapes of the yield curve. They are as follows:
3.2.1 Expectations TheoryThe pure expectations theory assumes that investors are indifferent between investing for a long period on the one hand and investing for a shorter period with a view to reinvesting the principal plus interest on the other hand. For example an investor would have no preference between making a 12-month deposit and making a 6-month deposit with a view to reinvesting the proceeds for a further six months so long as the expected interest receipts are the same. This is equivalent to saying that the pure expectations theory assumes that investors treat alternative maturities as perfect substitutes for one another.
The pure expectations theory assumes that investors are risk-neutral. A risk-neutral investor is not concerned about the possibility that interest rate expectations will prove to be incorrect, so long as potential favourable deviations from expectations are as likely as unfavourable ones. Risk is not regarded negatively. However, most investors are risk-averse, i.e., they are prepared to forgo some investment return in order to achieve greater certainty about return and value of their investments. As a result of risk-aversion, investors may not be indifferent between alternative maturities. Attitudes to risk may generate preferences for either short or long maturities. If such is the case, the termstructureofinterestrates(theyieldcurve)wouldreflectriskpremiums.Ifaninvestmentisclosetomaturity,there is little risk of capital loss arising from interest rate changes. A bond with a distant maturity (long duration) would suffer considerable capital loss in the event of a large rise in interest rates. The risk of such losses is known as capital risk.

Financial Institutions and Financial Markets
34
To compensate for the risk that capital loss might be realised on long-term investments, investors may require a risk premium on such investments. A risk premium is an addition to the interest or yield to compensate investors for accepting risk. This results in an upward slope to a yield curve. This tendency towards an upward slope is likely to be reinforced by the preference of many borrowers to borrow for long periods (rather than borrowing for a succession of short periods).
Someinvestorsmaypreferlongmaturityinvestmentsbecausetheyprovidegreatercertaintyofincomeflows.Thisuncertainty is income risk. If investors have a preference for predictability of interest receipts, they may require a higher rate of interest on short-term investments to compensate for income risk. This would tend to cause the yield curve to be inverted (downward sloping).
The effects on the slope of the yield curve from factors such as capital risk and income risk are in addition to the effect of expectations of future short-term interest rates. If money market participants expect short-term interest rates to rise, the yield curve would tend to be upward sloping. If the effect of capital risk were greater than the effect of income risk, the upward slope would be steeper. If market expectations were that short-term interest rates would fall in the future, the yield curve would tend to be downward sloping. A dominance of capital-risk aversion over income-risk aversion would render the downward slope less steep (or possibly turn a downward slope into an upward slope).

35
Yield
YC1
3Months 10Years
E( i) -term (such as 3-month) markets, and -term (such as 10-year) markets. Demand for funds by borrowers -term markets and -term markets. Therefore, the yield curve becomes upward sloping as shown here.
Panel A: Impact of a Sudden Expectation of Higher Interest Rates
Market for 3-Month (Short term)
Risk-free Debt
Market for 3-Month (Short term)
Risk-free Debt
Market for 3-Month (Short term)
Risk-free Debt
i
i1
i2
S1
S2
D1 D2
Quantity of Funds
i2
i1
i S2
S1
D2
D1
Quantity of Funds
YC2
Term to Maturity
Panel B: Impact of a Sudden Expectation of Lower Interest Rates
i2
i1
i S2
S1
D2
D1
Quantity of Funds
i
i1
i2
S1
S2
D1 D2
Quantity of Funds
Yield
YC1
3Months 10Years
E( i) -term (such as 10-year) markets, and -term (such as 3-month) markets. Demand for funds by borrowers -term markets and -term markets. Therefore, the yield curve becomes downward sloping as shown here.
YC2
Term to Maturity
Fig. 3.1 How interest rate expectations affect the yield curve
The Fig. 3.1 provides a graphical explanation, how interest rate expectations affect the yield curve.
3.2.2 Liquidity Premium TheorySome investors may prefer to own shorter rather than longer term securities because a shorter maturity represents greater liquidity. In such case they will be willing to hold long-term securities only if compensated with a premium for the lower degree of liquidity. Though long-term securities may be liquidated prior to maturity, their prices are more sensitive to interest rate movements. Short-term securities are usually considered to be more liquid because

Financial Institutions and Financial Markets
36
they are more likely to be converted to cash without a loss in value. Thus there is a liquidity premium for less liquid securities which changes over time. The impact of liquidity premium on interest rates is explained by liquidity premium theory.
Scenario 1: Market expects stable
interest rates
Scenario 3: Market expects a
reduction in interest
Ann
ualiz
ed Y
ield
Ann
ualiz
ed Y
ield
Inclusion of Liquidity Premium
Liquidity Premium Removed
Term to Maturity
Scenario 2: Market expects an
increase in interest rates
Ann
ualiz
ed Y
ield
Inclusion of Liquidity Premium
Liquidity Premium Removed
Term to Maturity
Term to Maturity
Inclusion of Liquidity Premium
Liquidity Premium Removed
Fig. 3.2 Impact of liquidity premium on the yield curve under three scenarios
3.2.3 Market Segmentation TheoryAccording to the market segmentation theory, interest rates for different maturities are determined independently of one another. The interest rate for short maturities is determined by the supply of and demand for short-term funds. Long-term interest rates are those that equate the sums that investors wish to lend long-term with the amounts that borrowers are seeking on a long-term basis.
According to market segmentation theory, investors and borrowers do not consider their short-term investments or borrowings as substitutes for long-term ones. This lack of substitutability keeps interest rates of differing maturities independent of one another. If investors or borrowers considered alternative maturities as substitutes, they may switch between maturities. However, if investors and borrowers switch between maturities in response to interest rate changes, interest rates for different maturities would no longer be independent of each other. An interest rate change for one maturity would affect demand and supply and hence interest rates, for other maturities.
3.2.4 The Preferred Habitat TheoryPreferred habitat theory is a variation on the market segmentation theory. The preferred habitat theory allows for some substitutability between maturities. However, the preferred habitat theory views that interest premiums are needed to entice investors from their preferred maturities to other maturities.
According to the market segmentation and preferred habitat explanations, government can have a direct impact on the yield curve. Governments borrow by selling bills and bonds of various maturities. If government borrows by selling long-term bonds, it will push up long-term interest rates (by pushing down long-term bond prices) and cause the yield curve to be more upward sloping (or less downward sloping). If the borrowing were at the short maturity end, short-term interest rates would be pushed up.

37
3.3 Forward Interest Rates and Yield CurveThe expectations that are relevant to investment decisions are expectations relative to market expectations. An active portfolio manager bases investment decisions on attempts to forecast interest rates more accurately than the average participant in the money market. For this reason, the manager of an actively managed bond portfolio needs to be able to ascertain the market consensus forecast. Such market expectations can be deduced from forward interest rates. Forward interest rates are rates for periods commencing at points of time in the future. They are implied by current rates for differing maturities. For example, the current three month interest rate and the current six month interest rate between them imply a rate for a three month period, which runs from a point in time three months from the present until a point in time six months hence.
The forward three month rate for a period commencing three months from the present is the rate which, when compounded on the current three month rate, would yield the same return as the current six month rate. For example, if the three month rate is 9% p.a. and the six month rate is 10% p.a., the forward rate is shown as x in equation:
(1,0225)(1 + x) =1,05
The forward rate is calculated as:x=(1,05/1.0225) - 1 = 0,0269
which is 2.69% over three months and hence 10.76% p.a.
The forward rate can be interpreted as the market expectation of the future interest rate under the assumptions that the expectations theory of the yield curve is correct and there is no risk premium. If the expectations theory is seen as a good model, but there is a risk premium, an adjustment is required to remove the effects of the risk premium before the result can be interpreted as the market forecast of the future interest rate.
The yield curve based on zero coupon bonds is known as the spot yield curve. It is regarded as more informative than a yield curve that relates redemption yields to maturities of coupon bearing bonds. The redemption date is not the only maturity date.
ExampleThe one-year interest rate is 6,5% p.a. and the six-month interest rate is 6% p.a. What is the forward six-month interest rate for the period between six months and one year from now? Can this forward interest rate be taken to be the interest rate expected by money market participants? Let x be the forward interest rate p.a. (so that the rate for six months is x/2).
(1,03) (1 +x/2) =1,0651 +x/2 = (1,065) / (1,03)x/2 = [(1,065)/(1,03)] -1
x=2 { [(1,065)/(1,03)] -1}Therefore x=0,068, i.e., 6,8% p.a.The forward interest rate of 6,8% p.a. can be taken to be the market expectation if the expectations theory of the yield curve is correct and there is no risk premium. If the expectations theory is correct but there is a risk premium, the risk premium must be removed before carrying out the calculation. Suppose that the six-month rate contains no risk premium, but the one-year rate contains a risk premium of 0,1% p.a. The one-year interest rate, net of the risk premium, is 6,4% p.a. The new calculation would be as follows:
(1,03)(1 + x/2) = (1,064)x=2{[(1,064)/(1,03)] -1}
Therefore, x=0,066, i.e. 6,6% p.a.
Coupon-bearing bonds may have differing redemption yields, despite having common redemption dates, because of differences in the coupon payments. Yield curves based on coupon-bearing bonds may not provide a single redemptionyieldcorrespondingtoaredemption(finalmaturity)date.

Financial Institutions and Financial Markets
38
ExampleSuppose, zero coupon bonds with maturities one, two and three years from the present have prices of 95, 88, and 80 Euro. What are the spot one, two and three-year interest rates? Draw the yield curve.
In the case of the one-year bond, an investment of 95 Euro entails a receipt of 100 Euro in one year. 100/95 =1,0526 which implies a spot one-year interest rate of 5,26%. In the case of the two-year bond, an investment of 88 Euro yields a receipt of 100 Euro after two years.100/88 =1,13636√1,13636=1,0660oraspot2-yearinterestrateof6,60%p.a.
In the case of the three-year bond, an investment of 80 Euro provides a receipt of 100 Euro after three years.100/80 = 1,251,250.33=1,0772 or a spot three-year interest rate of 7,72% p.a.
The forward yield curve relates forward interest rates to the points of time to which they relate. For example, rates ofreturnonfive-yearbondsandratesonfour-yearbondsimplyratesononeyearinstrumentstobeenteredintofour years from the present. The implied forward rate can be calculated by means of the formula:
(1 + 4r1) = (1 + 0r5)5 / (1 +0r4)
4
Wherer5isthefive-yearinterestrate,r4isthefour-yearinterestrate,and4r1istheone-yearrateexpectedinfouryears’ time.
This formula arises from the relation:(1 +0r5)
5= (1 + 0r4)4 (1 + 4r1)
Whichstatesthatafive-yearinvestmentatthefive-yearinterestrateshouldyieldthesamefinalsumasafour-yearinvestment at the four-year rate with the proceeds reinvested for one year at the one-year rate expected to be available four years hence. The value of 4r1 would be related to the point in time, of four years, on the yield curve. Carrying out such a calculation for a succession of future periods produces a series of forward interest rates.
When plotted against their respective dates, the series of forward rates produces a forward yield curve. The forward yield curve requires the use of zero coupon bonds for the calculations. This forms also the basis for calculation of short-term interest rate futures. Short-term interest rate futures, which frequently take the form of three-month interest rate futures, are instruments suitable for the reduction of the risks of interest rate changes. Three-month interest rate futures are notional commitments to borrow or deposit for a three-month period that commences on the futures maturity date. They provide means whereby borrowers or investors can (at least approximately) predetermine interest rates for future periods.
ExampleAssume that the three-month interest rate is 4.5% p.a. and the six-month interest rate is 5% p.a. What is the forward interest rate for the three-month period commencing three months from now?5% p.a. is 2,5% over six months, and 4,5% p.a. is 1,125% over three months.(1,025)/(1,01125) = 1,013597 1.013597 - 1 = 0.013597, i.e. 1.3597% for three months or 5.44% p.a. (to two decimal places).The forward interest rate is 5,44% p.a.

39
SummaryThe relationship between the yields on comparable securities but different maturities is called the term structure •of interest rates.The graphic that depicts the relationship between the yields on Treasury securities with different maturities is •known as the yield curve and, therefore, the maturity spread is also referred to as the yield curve spread.The pure expectations theory assumes that investors are indifferent between investing for a long period on the •one hand and investing for a shorter period with a view to reinvesting the principal plus interest on the other hand.Attitudes to risk may generate preferences for either short or long maturities.•A risk premium is an addition to the interest or yield to compensate investors for accepting risk.•The effects on the slope of the yield curve from factors such as capital risk and income risk are in addition to •the effect of expectations of future short-term interest rates.A dominance of capital-risk aversion over income-risk aversion would render the downward slope less steep.•Some investors may prefer to own shorter rather than longer term securities because a shorter maturity represents •greater liquidity.Preferred habitat theory is a variation on the market segmentation theory.•Governments borrow by selling bills and bonds of various maturities.•The expectations that are relevant to investment decisions are expectations relative to market expectations.•The forward rate can be interpreted as the market expectation of the future interest rate under the assumptions •that: the expectations theory of the yield curve is correct and there is no risk premium.When plotted against their respective dates, the series of forward rates produces a forward yield curve.•Three-month interest rate futures are notional commitments to borrow or deposit for a three-month period that •commences on the futures maturity date.
ReferencesCulbertson, J. M., 1957. • TheTermStructureofInterestRates. Quarterly Journal of Economics.Estrella, A. & Mishkin, F. S., 1996. • TheyieldcurveasapredictorofU.S.recessions. Federal Reserve Bank of New York Current Issues in Economics and Finance.TermStructureofInterestRates:TheTheories• . [Pdf] Available at: <http://spears.okstate.edu/home/munasib/MoneyBanking_3313/Handout/Handout03.pdf> [Accessed 30 May 2014].Kessel, A. R., • EXPLANATIONSOFTHETERMSTRUCTUREOF INTERESTRATES. [Pdf] Available at: <http://www.nber.org/chapters/c1662.pdf> [Accessed 30 May 2014].TermStructureofInterestRates• . [Video online] Available at: <https://www.youtube.com/watch?v=Hl5zOAxBoDw> [Accessed 30 May 2014].Chapter 6:TheTermStructure of InterestRates• . [Video online] Available at: <https://www.youtube.com/watch?v=YyqyzLU9ZYY> [Accessed 30 May 2014].
Recommended ReadingFavero, C. A., Kaminska, I. & Soderstrom, U. 2005. • Thepredictiepoweroftheyieldspread:Furtherevidenceand a structural interpretation. CEPR Discussion Paper.Kane, E. J., 1970. • Thetermstructureofinterestrates:Anattempttoreconcileteachingwithpractice. Journal of Finance.Ron, U., 2002. • Apracticalguide to swapcurveconstruction. Interest Rate, Term Structure, and Valuation Modeling. New York, John Wiley & Sons.

Financial Institutions and Financial Markets
40
Self AssessmentThe relationship between the yields on comparable securities but different maturities is called ___________.1.
the maturity spreada. the yield and maturityb. treasury marketc. the term structure of interest ratesd.
A ________________ or inverted yield curve is the one, where yields in general decline as maturity 2. increases.
downward-slopinga. variantb. yieldsc. coupond.
The _____________ theory assumes that investors are risk-neutral.3. liquidity premium theorya. pure expectationsb. market segmentation theoryc. habitat theoryd.
_____________ to risk may generate preferences for either short or long maturities.4. Bonda. Maturityb. Attitudesc. Capital riskd.
A ___________ is an addition to the interest or yield to compensate investors for accepting risk.5. risk capitala. income riskb. borrowerc. risk premiumd.
Which theory is a variation on the market segmentation theory?6. Expectations Theorya. Liquidity Premium Theoryb. Market segmentation theoryc. Preferred habitat theoryd.
An active ____________ manager bases investment decisions on attempts to forecast interest rates more 7. accurately than the average participant in the money market.
equitya. yieldb. portfolioc. cashd.

41
______________ are those that equate the sums that investors wish to lend long term with the amounts that 8. borrowers are seeking on a long-term basis.
Market segmentation theorya. Long-term interest ratesb. Long-term basisc. Switch between maturitiesd.
Match the following9. If money market participants expect 1. short-term interest rates to rise The yield curve would tend to be upward slopingA.
If the effect of capital risk were greater 2. than the effect of income risk The yield curve would tend to be downward slopingB.
If market expectations were that short-3. term interest rates would fall in the future Would render the downward slope less steepC.
A dominance of capital-risk aversion over 4. income-risk aversion The upward slope would be steeperD.
1-A, 2-D, 3-B, 4-Ca. 1-B, 2-C, 3-A, 4-Db. 1-C, 2-B, 3-D, 4-Ac. 1-D, 2-A, 3-C, 4-Bd.
A variant of the __________ is the one in which the yield on short-term and long-term.10. flatyielda. pure expectation theoryb. neutral investorc. bondd.

Financial Institutions and Financial Markets
42
Chapter IV
Money Market
Aim
The aim of this chapter is to:
introduce money market instruments•
explain the purpose of money markets•
elucidate bond duration and convexity•
Objectives
The objectives of this chapter are to:
explain money markets segments and participants•
elaborate money market interest rates and yields•
definevaluationofbonds•
Learning outcome
At the end of this chapter, you will be able to:
distinguish the characteristics of debt instruments•
understand money market rates and yields•
analyse callable bonds and other bond instruments•

43
4.1 IntroductionThe purpose of money markets is to facilitate the transfer of short-term funds from agents with excess funds (corporations, financial institutions, individuals, government) to thosemarket participantswho lack funds forshort-termneeds.Theyplaycentralroleinthecountry’sfinancialsystem,byinfluencingitthroughthecountry’smonetary authority.
Forfinancialinstitutionsandtosomeextenttoothernon-financialcompanies’moneymarketsallowforexecutingsuch functions as:
Fund raising•Cash management•Risk management•Speculationorpositionfinancing•Signalling•Providing access to information on prices•
4.1.1 The Role of Money MarketsTheroleofmoneymarketsinvariousfieldsisexplainedintheparagraphsgivenbelow.
Corporate strategyMoney markets are wholesale markets with very large amounts of transactions, e.g., with transactions from 500 millionEuroto1billionEuroorevenlargerones.Thisisthemostactivefinancialmarketintermsofvolumesoftrading.
From the start of emergence the traditional money markets performed the role of monetary policy. In order to influencethesupplyside,governmentshaveemployedmethodsofdirectregulationandcontrolofthesavingsandinvestment behaviour of individuals and companies. However, due to fast technological advances, internationalisation and liberalisationoffinancialmarkets, possibilities to carryoutpolicyobjectives through suchmeasureshavediminished.
Current policy through market oriented measures is aimed primarily at demand side. Thus, money markets serve the interface between execution of monetary policy and the national economies. Another role of domestic money marketsistoservepublicpolicyobjectives,i.e.,financingpublicsectordeficitsandmanagingtheaccumulatedgovernmentdeficits.Governmentpublicdebtpolicyisanimportantdeterminantofthemoneymarketsoperations,since government debt typically forms a key part of the country’s money markets (as well as debt markets). The scopeandmeasuresofmonetarypolicyarealsolinkedtothegovernment’sbudgetandfiscalpolicies.
Thus the country’s money market shifts are dependent upon the goals of national public policy and tools used to reachthesegoals.Changesintheroleandstructureofmoneymarketswerealsoinfluencedbyfinancialderegulation,whichevolvedasaresultofrecognitionthatexcessivecontrolsarenotcompatiblewithefficientresourceallocationwith solid and balanced growth of economies. Money markets went through passive adaptation as well as through activeinfluencefromthesideofgovernmentsandmonetaryauthorities.
Finally,moneymarketswereinfluencedbysuchinternationaldimensionsasincreasingcapitalmobility,changingexchange rate arrangements and diminishing monetary policy autonomy. The shifts in European domestic money markets were made by the European integration process, emergence and development of European monetary union.

Financial Institutions and Financial Markets
44
4.1.2 Money Market SegmentsIn a broad sense, money market consists of the market for short-term funds, usually with maturity up to one year. It can be divided into several major segments:
Interbankmarket,wherebanksandnon-depositfinancialinstitutionssettlecontractswitheachotherandwith•centralbank,involvingtemporaryliquiditysurplusesanddeficits.Primary market, which is absorbing the issues and enabling borrowers to raise new funds.•Secondary market for different short-term securities, which redistributes the ownership, ensures liquidity, and •as a result, increases the supply of lending and reduces its price.Derivativesmarketisthemarketforfinancialcontractswhosevaluesarederivedfromtheunderlyingmoney•market instruments.
Interbankmarketisdefinedmainlyintermsofparticipants,whileothermarketsaredefinedintermsofinstrumentsissued and traded. Therefore, there is a considerable overlap between these segments. Interbank market is referred mainly as the market for very short deposits and loans, e.g., overnight or up to two weeks. Nearly all types of money market instruments can be traded in interbank market. Key money market segments by instruments are provided in Fig.4.1.
Government treasury
securities
Money market segments
CDs CPs Swaps Repo
Fig. 4.1 Key money market instruments(Source: Available at: <http://www.bcci.bg/projects/latvia/pdf/7_Financial_markets.pdf)
The money-market instruments are often grouped in the following way:Treasury bills and other short-term government securities (up to one year)•Interbank loans, deposits and other bank liabilities•Repurchase agreements and similar collateralised short-term loans•Commercialpapers,issuedbynon-depositentities(non-financecompanies,financecompanies,localgovernment,•etc.)Certificatesofdeposit•Eurocurrency instruments•Interest rate and currency derivative instruments•
Alltheseinstrumentshaveslightlydifferentcharacteristics,fulfillingthedemandofinvestorsandborrowersfordiversificationintermsofrisk,rateofreturn,maturityandliquidity,andalsodiversificationintermsofsourcesoffinancingandmeansofpayment.Manyinvestorsregardindividualmoneymarketinstrumentsasclosesubstitutes,thus changes in all money market interest rates are highly correlated. Major characteristics of money market instruments are:
Short-term nature•Low risk•High liquidity (in general)•Close to money•

45
Money markets consist of tradable instruments as well as non-tradable instruments. Traditional money markets instruments, which included mostly dealing of market participants with central bank, have decreased their importance duringtherecentperiod,followedbyanincreasingtrendtofinance,short-termneedsbyissuingnewtypesofsecuritiessuchasREPOs,commercialpapersorcertificatesofdeposit.Theargumentsbehindthetrendarethefollowing:
An observed steady shift to off-balance sheet instruments, as a reaction to introduction of capital risk management •rules for internationally operating banks in the recommendations of Basel II Accord and EU Directives on banking.Advantages provided to high-rated market participants, allowing diversifying borrowing sources, to cut the •costs, to reduce the borrowers’ dependence on banking sector lending and its limitations.
Intermsofrisk,twospecificmoney-marketsegmentsare:unsecured debt instruments markets (e.g., deposits with various maturities, ranging from overnight to one •year)secured debt instruments markets (e.g., REPOs) with maturities also ranging from overnight to one year•
Differences in amount of risk are characteristic to the secured and the unsecured segments of the money markets. Credit risk is minimised by limiting access to high-quality counter-parties. When providing unsecured interbank deposits,abanktransfersfundstoanotherbankforaspecifiedperiodoftimeduringwhichitassumesfullcounterpartycredit risk. In the secured REPO markets, this counterparty credit risk is mitigated as the bank that provides liquidity receives collateral (e.g., bonds) in return.
Money markets structures differ across the countries, depending upon regulatory and legislative frameworks, factors thathavesupportedorlimitedthedevelopmentofsuchnationalmarkets.Theinfluenceofbusinesscultureandtraditions, industrial structures have played an important role also.
Economicsignificanceofmoneymarketsispredeterminedbyitssize,levelofdevelopmentofinfrastructureandefficiency.Growthofgovernmentsecuritiesissues,theircostsconsiderations,favourabletaxationpolicieshavebecome additional factors boosting some of the country’s money markets.
4.1.3 Money Market ParticipantsMoneymarketparticipantsincludemainlycreditinstitutionsandotherfinancialintermediaries,governments,aswellasindividuals(households).Ultimatelendersinthemoneymarketsarehouseholdsandcompanieswithafinancialsurpluswhichtheywanttolend,whileultimateborrowersarecompaniesandgovernmentwithafinancialdeficitwhich need to borrow. Ultimate lenders and borrowers usually do not participate directly in the markets. As a rule they deal through an intermediary, who performs functions of broker, dealer or investment banker.
Importantroleisplayedbygovernment,whichissuemoneymarketsecuritiesandusetheproceedstofinancestatebudgetdeficits.Thegovernmentdebtisoftenrefinancedbyissuingnewsecuritiestopayoffolddebt,whichmatures.Thus,itmanagestofinancelong-termneedsthroughmoneymarketsecuritieswithshort-termmaturities.
Central bank employs money markets to execute monetary policy. Through monetary intervention means and by fixingthetermsatwhichbanksareprovidedwithmoney,centralbanksensureeconomy’ssupplywithliquidity.Creditinstitutions (i.e., banks) account for the largest share of the money market. They issue money market securities to financeloanstohouseholdsandcorporations,thussupportinghouseholdpurchasesandinvestmentsofcorporations.Besides, these institutions rely on the money market for the management of their short-term liquidity positions and forthefulfilmentoftheirminimumreserverequirements.
Otherimportantmarketparticipantsareotherfinancialintermediaries,suchasmoneymarketfunds,investmentfundsotherthanmoney-marketfunds,insurancecompaniesandpensionfunds.Largenon-financialcorporation’sissue money market securities and use the proceeds to support their current operations or to expand their activities through investments.

Financial Institutions and Financial Markets
46
Ingeneralissuanceofmoneymarketsecuritiesallowmarketparticipantstoincreasetheirexpendituresandfinanceeconomicgrowth.Moneymarket securitiesarepurchasedmainlybycorporations,financial intermediariesandgovernment that have funds available for a short-term period. Individuals (or households) play a limited role in the market by investing indirectly through money market funds. Apart from transactions with the central bank, money market participants trade with each other to take positions dependent upon their short-term interest rate expectations, tofinancetheirsecuritiestradingportfolios(bonds,shares,etc.),tohedgetheirlonger-termpositionswithshort-termcontracts, and to reduce individual liquidity imbalances.
4.2 Money Market InstrumentsMoney market instruments are studied through various aspects of it. These are explained in the paragraphs given below.
4.2.1 Treasury Bills and other Government SecuritiesTreasury bills are short-term money market instruments issued by government and backed by it. Therefore, market participant view these government securities as having little or even no risk. The interest rates on treasury securities serve as benchmark default-free interest rates. A typical life to maturity of the securities is from four weeks to twelvemonths.Astheydonothaveaspecifiedcoupon,theyareineffectzero-couponinstrumentsandareissuedat a discount to their par or nominal value, at which price they are redeemed. Any new issue with the same maturity date as an existing issue is regarded as a new tranche of the existing security.
Treasurybillsaretypicallyissuedatonlycertainmaturitiesdependentuponthegovernmentbudgetdeficitfinancingrequirements.Budgetdeficitscreateachallengeforthegovernment.LargevolumesofTreasurysecuritieshavetobesoldeachyeartocoverannualdeficit,aswellasthematuringTreasurysecurities,thatwereissuedinthepast.Themix of Treasury offerings determines the maturity structure of the government’s debt primary market. A tender is a sealed bid. The securities are issued via a regularly scheduled auction process. Upon the Treasury’s announcement of the size of upcoming auction, tenders or sealed bids are being solicited.
Biddersaresubmittingtwotypesofbids:competitiveandnon-competitive.Acompetitivebidderspecifiesboththe amount of the security that the bidder wants to buy, as well as the price that the bidder wants to pay. The price is set in terms of yield. The price of the securities in the auction is set based on the prices offered in competitive bids, taking the average of all accepted competitive prices. Not all competitive bids that are tendered are accepted. Typically, the longer the maturity, the greater would be the percentage of accepted bids. The percentage of accepted bids is determined by the size of the issue as compared to the amount of bids tendered. Competitive bidders are thelargestfinancialinstitutionsthatgenerallypurchaselargestamountsofTreasurysecurities.Ingeneral80-90%Treasury securities are sold to them.
Anon-competitivebidderspecifiesonlytheamountofthesecuritythatthebidderwantstobuy,withoutprovidingtheprice,andautomaticallypaythedefinedprice.Non-competitivebiddersareretailcustomers,whopurchaselowvolumes of the issues, and are not enough sophisticated to submit a bid price. Limits on each non-competitive bid can be set. Direct purchases of Treasury securities by individuals are limited in many countries. In such cases, they use the services of dealers.
The Fig.4.2 illustrates the results of sealed bid (tender) auction. The Treasury will accept the competitive bids with the highest price and lowest interest rates, and will reject other bids. Depending upon the existing regulation in a specificcountrytreasurysecurityauctionscanbeorganisedandheldatthecentralbankorstockexchanges.
There are two auction forms:Uniform price auction, when all bidders pay the same price•Discriminatory price auction, in which each bidder pays the bid price•

47
Supply curve Price
Accepted bids
Rejected bids
Demand curve
Amount of bonds
Price of lowest accepted bid
Fig. 4.2 Prices in a sealed-bid auction(Source: http://www.bcci.bg/projects/latvia/pdf/7_Financial_markets.pdf)
Theprocedureofthediscriminatorypriceauctiononeismoresophisticated.Atfirst,allthenon-competitivebidsaretotalled,andtheirsumissubtractedfromthetotalissueamount.Thiswayallnon-competitivebidsarefulfilled.Theprice, which non-competitive bidders are going to pay, is determined taking into account the results of the competitive part of the auction. Uniform price auction is an auction, when all bidders pay the same price. Discriminatory price auction is an auction, in which each bidder pays the bid price.
Further on, all competitive tenders are ranked in order of the bid yield. In order to minimise the government’s borrowingcosts,thelowestcompetitivebidisacceptedfirst.Asaresult,thehighestbidpricesareaccepteduntilthe issue is sold out fully. The lowest rejected bid yield (or the highest accepted bid yield) is called stop yield. The corresponding price is called the stop-out price. During such a Treasury auction, each competitive bidder pays the price for the securities, which is determined by the yield that was bid. The average yield is the average of all accepted competitive bids, weighted by the amounts allocated at each yield. All non-competitive bidders pay the average yield. The discriminatory auction is characterised by:
A tail: The difference between the stop yield and the average yield.•A cover: The ratio between the total amount competitive and non-competitive bids tendered and the total issue •(i.e., the total amount of accepted bids).A large cover indicates active market participation in an auction. Average cover can be evaluated in terms of a •difference between maximum and minimum accepted bid yields (in basis points) A small tail shows that most competitive bidders provide similar evaluation of Treasury security issue, and thus pay nearly the same price forit.Thelargerthecoverandthesmallerthetail,themoreefficientistheTreasuryauction.Basispointisaveryfinemeasureofinterestrates,equaltoonehundredthofonepercentagepoint.

Financial Institutions and Financial Markets
48
In a discriminatory price auction the bidder’s price is determined by his own tender. A low bid, i.e., low yield and high offered price, increases the bidder’s chance of his bid to be accepted. However, this can lead to the possibility of the winner’s curse. In such a case, the low bidder’s tender is accepted, but he pays a price that is higher than of others lower priced (or higher yield) bids. Therefore, competitive bidders may be reluctant to submit low bids, because this will oblige them to pay high prices for newly issued securities. This is a problem of discriminatory price auction. Winner’s curse is the case, when the low bidder wins acceptance of the tender, but pays a price, which is higher than that of other lower bidders.
A uniform price auction (or a Dutch auction) does not have a problem of this kind. All the procedures of the auction except for the last one are the same as in the discriminatory price auction. Each accepted bid pays the price of the lowest accepted bid. As a result, uniform price auction becomes more expensive to the Treasury and it receives lower revenue. Besides, the average bidder may bid a higher price, shifting demand curve to right with the possibility offsetting the negative effect to the Treasury.
Price in single-price auction
Lowest accepted discriminatory bid
Supply curve Price
Accepted bids Rejected bids
Amount of bonds
Single-price demand
Discriminatory demand
Fig. 4.3 Impact of single-price auction upon demand curve(Source: http://www.bcci.bg/projects/latvia/pdf/7_Financial_markets.pdf)
Uniform price auction is considered fairer because all competitive bidders pay the same price. This may encourage greaterparticipationintheauction,andfinallyincreasetheauction’scoverindicator.Competitivebiddersarenotafraid to submit too low bids, because they will not be paying the price they bid. Conversely, the lower they will bid, the higher likelihood is that their bid will be accepted. As a result, bidders tend to reduce their bids, thereby lowering the average yield on the entire issue. Such changes in bidder behaviour may offset the direct effect of higher issuer’s interest costs in the uniform price auction.
While evaluating the effectiveness of the Treasury auction method, there is a concern, that competitive as well as non-competitivebidderscanbeneglected,whilefewlargefinancialinstitutionsmaybefavoured.Thiscancausedecline in auction participation, undermining the Treasury’s abilities to place large amounts of securities. On the other hand, since bidders do not pay their tendered prices, the uniform price auction may be more subject to manipulation or collusion by informed bidders.
Secondary MarketTypically the Treasury securities have an active and liquid secondary market. The most actively traded issues, which are usually the ones sold through an auction, most recently, are called on-the-run issues. They have narrower bid-ask

49
spreadsthanolder,off-the-runissues.Theroleofbrokersanddealersisperformedbyfinancialinstitutions.Asarule, competitive bidders can submit more than one bid to each auction, with different prices and quantities on each tender. However, in well developed markets limitations are being placed to the amount of securities in each auction allocatedtoaparticularsinglebidder.Theaimofsucharuleistopreventmarketfrominfluenceofasinglebidder,andthussqueezingotherfinancialinstitutionswiththeirowncustomers.
Thetextthencanfollow(startingwiththestyleofthefirstparagraph).Then,wecanhavesomereadingsoranexample. It can be but in the same format as the Concept/Check Question. Price of a Treasury bill is the price that an investor will pay for a particular maturity Treasury security, depending upon the investor’s required return on it. Thepriceisdeterminedasthepresentvalueofthefuturecashflowstobereceived.AstheTreasurybilldoesnotgenerate interest payments, the value of it is the present value of par value. Therefore, since the Treasury bill does not pay interest, investors will pay a price for a one-year security that will ensure that the amount they receive one year later will generate the desired return.
Example: Assume investor requires a 5 percent annualised return on a one-year Treasury bill with a 100000Euro par value. He will be willing to pay the price
P = 100000 Euro / 1,05 = 95238 Euro
If investor requires a return higher than 5 percent, he will discount the par value at a higher return rate. This will result in a lower price to be paid today.
In case the maturity of Treasury bill is shorter than one year, then the annualised return will be reduced by the fraction oftheyear,duringwhichtheinvestmentismade.Thesimplifiedcalculationsareprovidedintheexamplebelow.
Example: Assume investor requires a 5 percent annualised return on a 6 month Treasury bill with a 100000 Euro par value. The price of the security will be
P = 100000 Euro / ( 1 + 0,05 / 2) == 100000 Euro / ( 1 + 0,025) = 97560,9 Euro
If investor requires a return higher than 5 percent, he will discount the par value at a higher return rate. This will result in a lower price to be paid today.
The price of the Treasury bill calculated on discount rate basis is:P = PAR x (1- (d x n / 360))
Where d is the yield or rate of discount, PAR is par or maturity value and n is the number of days of the investment (holding period).
Example: Assume investor requires an 8 percent annualized return on a 91-day Treasury bill with a 100000 Euro par value. The price of the security will be
P = 100000 Euro x ( 1 – (0,08 x 91/ 360) == 100000 Euro x ( 1 – 0,02 ) = 98000 Euro
If investor requires a return higher than 5 percent, he will discount the par value at a higher return rate. This will result in a lower price to be paid today.
Yield of a Treasury bill is determined taking into account the difference between the selling price and the purchase price. As Treasury bills do not offer coupon payments, the yield the investor will receive if he purchases the security and holds it until maturity will be equal to the return based on difference between par value and the purchase price. The annualised yield on Treasury bill is calculated in the following way:
y = (PAR - P) / P x (365/n)
Example: Assume investor requires pays 98000 Euro for a 91-day Treasury bill with a 100000 Euro par value. The annualised yield of the security will be

Financial Institutions and Financial Markets
50
y = (100000 – 98000) / 98000 ) x ( 365 / 91 ) == 0,02 x 4,01 = 0,0802 or 8,02 %.
If the Treasury bill is sold prior to maturity, the return is calculated on the basis of difference between the price for which the bill was sold in the secondary market and the purchase price. The annualised yield on Treasury bill is calculated in the following way:
y = (SP - P) / P x (365/n)
In some countries (e.g., US) Treasury bills are quoted on a discount rate (or referred to as Treasury bill rate) basis. The Treasury bill discount rate represents the percent discount of the purchase price from par value of a new issue of a Treasury bill. It is determined in the following way:
d = (PAR - P) / PAR x (360/n)
In such a case the year is assumed having 360 days, and the number of days of the investment can be actual or an assumed convention. If a newly issued Treasury bill is held until maturity, then its yield is always greater than rate of discount. The difference is due to price or value used in denominator, since purchase price is always lower than par value. Besides, the yield is always calculated on 365 day during a year basis.
4.2.2 The Interbank Market LoansInterbank market is a market through which banks lend to each other. Commercial banks are required to keep reserves on deposits within central bank. Banks with reserves in excess of required reserves can lend these funds to other banks. Traditionally this formed the basis of the interbank market operations. However, currently these operations involve lending any funds in reserve accounts at a central bank. Interbank market is a market which involves bank borrowing and lending of any funds in reserve accounts at the central bank.
In US, the interbank market is the federal funds market, which involves the borrowing and lending any funds in reserve accounts at the Federal Reserve Bank (FED). The major characteristics of the interbank markets are:
The transfer of immediately available funds•Short time horizons•Unsecured transfers•
Individual banks have a possibility to invest (lend) surplus funds and have a source of borrowing when their reserves are low, thus they manage their reserve position and fund their assets portfolio by trading at the interbank market. This is a wholesale market with deals usually in large denominations. It is used by all types of banks, involved in loans for very short periods, from overnight to fourteen days mostly. Then bank borrows in the interbank market, it is said to be a funds buyer. When bank lends immediately available reserve accounts, it is said to be a seller. Most banks simultaneously buy and sell funds all the time. By acting as dealers they make markets for funds by announcing willingness to buy or to sell at the current competitive interbank rate.
The interbank interest rates and interest rates in the traditional market are interconnected. If banks are short of liquidity they will lend less to both markets and will cause interest rates to rise. When Central bank provides funds to the discount market, less attractive terms are offered by banks. Thus, they may choose other markets to invest and will cause the drop in interest rates.
Interbank rates are generally slightly higher and more volatile than interest rates in the traditional market. In periodsofgreatshortageofliquidity,theneedsofbankswhichdonothavesufficientfundstomeetthecentralbankrequirementsdriveuptheovernightratessignificantly.Tokeepupthespeedofthetransferandthecostsoftransferdown, the interbank market transfers are unsecured, i.e., not backed by any collateral and have no protection against default by the borrowing bank.
Credit risk in the interbank market is controlled through the interbank rate, which is truly competitive, quoted market rate. It is determined entirely by the supply and demand of banks for funds. Since the market is a closed interbank system, the aggregate value of all buy orders (demand for funds) should be equal to the aggregate value of all sell

51
orders (supply of funds). If the demand for fund purchase increases, it drives up the interbank interest rate.Participants in the interbank market typically undertake two types of transactions:
Reserve management transactions•Portfolio management transactions•
Bank reserve management transactions allow complying with contemporaneous bank reserve requirements. Through portfoliomanagementtransactionsbanksuseinterbankmarkettofinancetheirassets’portfolio.Theseareencouragedbytheinterbankmarketliquidityandflexibility.Withtimehorizonsasshortasovernight,thetransactionscanbemade rapidly at low transaction costs. Unlike other instruments ‘traded’ in the money markets, interbank deposits are not negotiable, i.e., do not have a secondary market. A lending bank which wishes to retrieve its funds simply withdraws the deposit from the bank to which it was lent. Thus, in this case, the distinction between primary and secondary markets is irrelevant.
4.2.3 Commercial PapersCommercial paper (CP) is a short-term debt instrument issued only by large, well known, creditworthy companies andistypicallyunsecured.Theaimofitsissuanceistoprovideliquidityorfinancecompany’sinvestments,e.g.,ininventoryandaccountsreceivable.Themajorissuersofcommercialpapersarefinancialinstitutions,suchasfinancecompanies,bankholdingcompanies,andinsurancecompanies.FinancialcompaniestendtouseCPsasaregularsourceoffinancewhilenon-financialcompaniestendtoissueCPsonanirregularbasistomeetspecialfinancingneeds.
Thus,commercialpaperisaformofshort-termborrowing.Itsinitialmaturityisusuallybetweensevenandforty-fivedays. In US, the advantage of issuing CPs with maturities less than nine months is that they do not have to register with the Securities Exchange Commission (SEC) as a public offering. This reduces the costs of registration with SEC and avoids delays related to the registration process.
CPs can be sold directly by the issuer, or may be sold to dealers who charge a placement fee (e.g., 1/8 percent). As issues of CPs are heterogeneous in terms of issuers, amounts, maturity dates, there is no active secondary market for commercial papers. However, dealers may repurchase CPs for a fee. The price of CP is calculated in the following way:
P = PAR x (1- (d x n / 360))
Where d is the yield or rate of discount, PAR is par or maturity value and n is the number of days of the investment (holding period). CP is sold at a discount to its maturity value, thus it is the other money market instrument whose return is expressed on a discount basis.
A 30 day CP with 10 million Euro par value yields 4,75%. The price of this CP currently offering is equal toP = 10,0 million Euro x (1- (0,0475 x 30 / 360)) =
= 10,0 million Euro x (1- 0,003) = 9,97 million Euro
Investor has purchased a 30 day CP with a par value of 1 million Euro for a price of 990 000 Euro. What is the yield of this CP investment?
d = (1 mil Euro - 990 000 Euro) / 1 mil Euro x (360/30) == 0,01 x 12 = 0,12 or 12 %.
Commercialpaperisnormallyunsecuredagainstanyspecificassetsandfirmswishingtousethecommercialpapermarket will usually seek a credit rating from one or other of the credit rating agencies. A high rating will mean that such paper can be issued at a smaller discount, often amounting to the equivalent of 1 percent. Although commercial paper is unsecured, typically it is backed by a line of credit at a commercial bank.
Asasourceoffinance,commercialpaperservesasimilarpurposetocommercialbills(andispricedinthesameway).Thus, in countries with a highly developed discount, or bills, market, the market for commercial paper is relatively

Financial Institutions and Financial Markets
52
small (e.g., UK). However, when the commercial bill market is less developed, the commercial paper market is very large (e.g., France and US). The main difference between commercial papers and commercial bills lies in the manneroftheircreation.Afirmborrowsviaacommercialbillwhenitagreesto‘accept’abillwhichis‘drawn’byacreditor.Thebilloriginateswiththelender.Afirmborrowsviacommercialpaperwhenitissuesthepaperitself.
4.2.4 Certificates of DepositCertificateofdeposit(CD)statesthatadeposithasbeenmadewithabankforafixedperiodoftime,attheendofwhich it will be repaid with interest. Thus it is, in effect, a receipt for a time deposit and explains why CDs appear indefinitionsofthemoneysupplysuchasM4.Itisnotthecertificateassuchthatisincluded,buttheunderlyingdeposit, which is a time deposit like other time deposits.
An institution is said to ‘issue’ a CD when it accepts a deposit and to ‘hold’ a CD when it itself makes a deposit or buysacertificateinthesecondarymarket.Fromaninstitution’spointofview,therefore,issuedCDsareliabilitieswhileheldCDsareassets.Theadvantagetothedepositoristhatthecertificatecanbetradable.Thusthoughthedepositismadeforafixedperiod,thedepositorcanusefundsearlierbysellingthecertificatetoathirdpartyatapricewhichwillreflecttheperiodtomaturityandthecurrentlevelofinterestrates.Theadvantagetothebankisthatithastheuseofadepositforafixedperiodbut,becauseoftheflexibilitygiventothelender,ataslightlylowerprice than it would have had to pay for a normal time deposit.
The minimum denomination can be 100 000USD, although the issue can be as large as 1 million USD. The maturities ofCDsusuallyrangefromtwoweekstooneyear.Non-financialcorporation’susuallypurchasenegotiableCDs.Though negotiable CD denominations are typically too large for individual investors, they are sometimes purchased by money market funds that have pooled individual investors’ funds. Thus money market funds allow individuals to be indirect investors in negotiable CDs. This way the negotiable CD market can be more active. There is also a secondary market for these securities; however its liquidity is very low.
Negotiablecertificatesofdepositarecertificatesthatareissuedbylargecommercialbanksandotherdepository•institutions as a short-term source of funds.
The negotiable CDs must be priced offering a premium above government securities (e.g., Treasury bills) to compensate for less liquidity and safety. The premiums are generally higher during the recessionary periods. The premiumsreflectalsothemoneymarketparticipants’understandingaboutthesafetyofthefinancialsystem.
Negotiable CDs are priced on a yield basis. Institution issue negotiable CDs at a par value. Thus,the yield of the security is calculated:
y = ( PAR – P )/ P x (360 / n)
A three-month CD for 100 000 Euro at 6 percent matures in 73 days. It is currently trading at 99 000 Euro. Rate of return of this CD current offering is
y = (100 000 – 99 000)/ 99 000 x (360 / 73) == 0,01 x 4,93 = 0,0493 or 4,93%
The market price of the CD is found by discounting the par or maturity value by the rate of interest currently available on similar assets, adjusted for the residual maturity. The price of CDs is determined using the following equation:
P = PAR / (1 – (i x n / 360))
The annualised yield they pay is the annualised interest rate on negotiable CDs. If investors purchase and holds negotiable CDs until maturity, their annualised yield is the interest rate. However, if investors purchase negotiable CDs in the secondary market instead of holding them from issuance to maturity, then annualised yield can differ from the annualised interest rate.
y = (Selling Price – Purchase Price + Interest) / Purchase Price

53
The interest rate paid on CDs is often linked to interbank rate. If LIBOR is 4,75 percent, for example, the CD describedabovemightbepaying5percentbecauseitisquotedaspayingLIBORplus25basispoints.Certificatesof deposit are an alternative of short-term, wholesale lending and borrowing. Three and six-month maturities are common. Some CDs are issued for one year and even for two years but the market for these is comparatively thin. This has led to the practice of banks issuing ‘roll-over’ CDs, i.e., six-month CDs with a guarantee of further renewal onspecifiedterms.CDsareissuedbyawidevarietyofbanks.Itisquitecommonforabankbothtohaveissuedand to hold CDs, through normally of differing maturities. It will issue CDs with a maturity expected to coincide with a liquidity surplus and hold CDs expected to mature at a time of shortage.
4.2.5 Repurchase AgreementsA repurchase agreement (REPO) is an agreement to buy any securities from a seller with the agreement that they will berepurchasedatsomespecifieddateandpriceinthefuture.Repurchaseagreement(REPO)isafullycollateraliseloan in which the collateral consists of marketable securities.
In essence the REPO transaction represents a loan backed by securities. If the borrower defaults on the loan, the lender has a claim on the securities. Most REPO transactions use government securities, though some can involve suchshort-termsecuritiesascommercialpapersandnegotiableCertificatesofDeposit.Sincethelengthofanyrepurchaseagreementisshort-term,amatterofmonthsatmost,itisusuallyassumedasaformofshort-termfinanceand therefore, logically, an alternative to other money market transactions.
Open REPO is a REPO agreement with no set maturity date, but renewed each day upon agreement of both •counterparties.Term REPO is a REPO with a maturity of more than one day.•
A reverse REPO transaction is a purchase of securities by one party from another with the agreement to sell them. Thus a REPO and a reverse REPO can refer to the same transaction but from different perspectives and is used to borrow securities and to lend cash. The participants of REPO transactions are banks, money market funds, non-financialinstitutions,etc.Thetransactionscanamount10millioninUSDtermswiththematurityfromonetofifteendays and for one, three, six months. There is no secondary market for REPOs. As the effect of the REPO transactions influencemoneymarketpricesandyields,itisnormaltoregardsuchREPOsasmoneymarketdeals.
In a REPO, the seller is the equivalent of the borrower and the buyer is the lender. The repurchase price is higher than the initial sale price and the difference in price constitutes the return to the lender. The amount of REPO loan is determined in the following way:
REPO principal = Securities market value x ( 1 – Haircut )Securities market value = PAR x ( 1 – (d x n / 360 ))
Where the securities market value is determined as the current market value of these securities, d is the rate of discount of the securities, n is term of the securities, PAR is the par value of the securities.
In the REPO transaction securities market value is equal to the value of collateral, against which the borrowing takes place.Sincethevalueofthesecuritiesmaybefluctuatingduringthetermof,theamountoftheloan(theprincipal)is less than the current market value of the securities. The deduction from current market value of the securities collateral required to do the REPO transaction is made, which is call a haircut or a margin. The haircut is a margin stated in terms of basis points. A standard haircut can be, e.g., 25 basis points (or 0,0025%). Thus, a REPO loan is over collateralised loan meaning that the amount of the collateral exceeds the loan principal and the haircut.
Repurchase of the securities is made by repaying REPO loan and interest:REPO principal + Interest = REPO principal ( 1 + (y x t / 360 ))
Where y is the yield or rate of the REPO transaction, t is the term of the REPO transaction. REPO principal = Securities market value x (1 – Haircut).

Financial Institutions and Financial Markets
54
Securitiesmarketvalueisdefinedaspresentvalueoftheparvalueofthesecuritiesinvolvedinthetransaction.Haircut is the function of a broker/ dealers securities portfolio, that cannot be traded, but instead must be held as capital to act as a cushion against loss.
The haircut or margin offers some protection to the lender in case the borrower goes bankrupt or defaults for some other reason. The size of the risk and thus this haircut/margin, depends in large part upon the status of the borrower, but it also depends upon the precise nature of the contract. Some REPO deals are genuine sales. In these circumstances, the lender owns the securities and can sell them in the case of default. In some REPO contracts, however, what is created is more strictly a collateralised loan with securities acting as collateral while remaining in the legal ownership of the borrower. In the case of default, the lender has only a general claim on the lender and so the haircut/margin are likely to be greater.
Example: Consider a 90 day REPO transaction, with a REPO rate of 4,75%. 180 days government securities with a rate of discount of 5% and a par value of 10 million Euro are used as collateral. Assume that the haircut is equal to 25 basis points. What is the amount of REPO loan? What is the amount of REPO loan repayment in the transaction?
REPO deals are quoted on a yield basis. The rate is quoted as a simple interest yield on a 360 days basis set upon initiationofthetransactionandfixedforthetermofREPO.TheREPOrateoryieldiscalculated:
y = ( PAR – P ) / P x (360 / t )
Where P is the purchase price, PAR is the agreed repurchase price and t is the period of the transaction.
Example: Investor has purchased securities at a price of 9 980 000 Euro, with an agreement to sell them back at 10 million Euro. At the end of 15 days period, what is the yield of the transaction?
REPO transactions have two legs:when cash is borrowed against collateral•when REPO transaction takes place, i.e., securities are repurchased by repaying REPO loan plus interest•
The repurchase of the securities (REPO payment) is completely independent from the market value of the securities on the maturity date of the REPO. This reinforces the economic reality that REPO transaction is a collateralised loan. In a reverse REPO transaction the reverse payment is calculated:Reverse principal + Interest = Reverse principal x ( 1 + (y x t / 360)) where y is the yield or REPO rate, t is maturity of the reverse REPO.
AssumeafinancialinstitutionutilisesareverseREPOtoborrowsecuritiesandtolendcash.Thesecuritiescollateralis 1 million of par value government securities paying 6% p.a. semi annually with 5 years to maturity. A REPO rate is 4,5%, 181 day of maturity, with a 50 basis points of haircut. What is the amount of reverse REPO repayment of the transaction?
REPO and reverse REPO markets as well as number of their participants have grown up tremendously, especially due to increased sensitivity to interest rate risk and the opportunity cost of holding idle cash.
REPO transactions are negotiated through a telecommunications network. Dealers and REPO brokers perform theroleoffinancialintermediariestocreateREPOtransactionsfromthecompanieswithfundsdeficitorexcessfunds and receive a commission for such services. However, direct REPO transaction is executed, when there is a possibilitytofindcounterpartyforit.Marketparticipantsincludecentralbanks,financialinstitutions,non-financialcorporations, etc.
Centralbanksconductshort-termREPOtransactionsonbondsofanyresidualmaturityasameansofinfluencingmoneymarketinterestrates.‘Non-financialcompanies,privatefinancialinstitutionsaremorelikelytoutilisereverseREPOs to earn interest on their cash balances during the periods of high interest rates.

55
SpeculativeREPOandreverseREPOtransactionsareattractivetofinancialinstitutionswiththeincreasedvolatilityof interest rates. Money market funds often take the other side of REPO transactions and hold reverses in their assetsportfoliosasflexibleshort-terminvestmentvehicles.Individuals,owningsharesinthesefunds,earninterestonthereverses.ThefundmanagersmayspeculateoninterestratefluctuationsusingREPOsandreverseREPOswithout being subject to the limitations on speculative derivative transactions. Important participants of the REPO market are security dealers. They make markets by carrying inventories of marketable securities and can use these securitiesascollateralonREPOloans.Thus,theycanreducethecostoffinancing,utiliseREPOstotakepositionsoninterestrates,financetheirsecuritiesportfolios.
InterestyieldsforREPOsofdifferenttermsreflectatermstructureofinterestrateswhichisamarketconsensusonforecastedinterestrates.TheREPOrateissignificantlylowerthanothermoneymarketrates,howeverhigherthanthe rate of government securities. It is maintained by possibility to substitute different money market instruments. There is no REPO secondary market.
4.2.6 International Money Market SecuritiesApart from variety of money market instruments which enable short-term lending and borrowing to take place in the domestic currency, in recent years some of the fastest growing markets have been the so-called euro currency markets. These are markets in which the borrowing and lending denominated in a currency of some other country takes place. In general, Euro currency market instruments are the same as other money market instruments. When suchinstrumentsaredenominatedinsomeothercurrency,theyareidentifiedas‘Euro’,thoughitcanbeanycurrency(e.g., US dollars or Japanese yen). The trading can also take place anywhere (in European countries or in New York or Tokyo or Hong Kong).
The factor contributing to the long-term development of euro currency business was the ability of euro banks to offer their services at more competitive rates than domestic institutions. ‘Euro banks’ are banks which specialise in eurocurrencybusiness.Theychannelfundsbetweensurplusanddeficitunitsandthuscreateassetsandliabilitieswhich are more attractive to end-users than if they dealt directly with each other, also they help to use funds which might otherwise lay idle.
In the Eurodollar market banks channel the deposited funds to other companies which need to receive Eurodollar loans. The deposit and loan transactions are of large denominations, e.g., exceeding 1 million USD. Therefore only governmentsandlargestcorporationscanparticipateinthemarket.ThemarketgrowthwasinfluencedgreatlybyEurocurrencyliabilitiesoffinancialinstitutionswhichareasfollowing:
EuroCertificatesofdeposits•Interbank placements•Time deposits•Call money•
Eurocertificatesofdeposits(EuroCDs)arenegotiabledepositswithafixedtimetomaturity.Timedepositsarenon-negotiabledepositswithafixedtimetomaturity.DuetoilliquiditytheiryieldstendtobehigherthantheyieldsonequivalentmaturityofnegotiableEurocertificatesofdeposits.Interbankplacementsareshort-term,oftenovernight,interbankloansofEurocurrencytimedeposits.Callmoneyarenon-negotiabledepositswithafixedmaturitythatcanbewithdrawnatanytime.Eurocurrencyassetsoffinancialinstitutionsarethefollowing:
Euro Commercial Papers (Euro CPs)•Syndicated Euroloans•Euronotes•
Euro Commercial Papers (Euro CPs) are securitised short-term bearer notes issued by a large well-known corporation. They are issued only by private corporations in short maturities with the aim to provide short-term investments with a broad currency choice for international investors. Most issues are pure discount zero coupon debt securities with maturities from 7 to 365 days. Issuance may be conducted through an appointed panel of dealers. It can be resold in a highly liquid secondary market. The issuers should be highly rated as Euro CPs is unsecured.

Financial Institutions and Financial Markets
56
SyndicatedEuroloansarerelatedtobanklendingofEurocurrencydepositstononfinancialcompanieswiththeneed for funds. As they are non-negotiable banks used to hold the syndicated loans in their portfolios until they mature. Due to their illiquidity, the loans are often made jointly by a group of lending banks which is called a syndicate. The role of syndication is to share loan risks among the banks that members of the syndicate Euronotes are unsecuritised debt instruments, substitutes for non-negotiable Euroloans. They are short-term, most often up to one year. Floating rate notes (FRNs) offer a variable interest rate that is reset periodically, usually semi-annually or quarterly, according to some predetermined market interest rate (e.g., LIBOR). For a high rated issuer the interest rate can be set lower than LIBOR.
4.3 Money Market Interest Rates and YieldsShort-term money market instruments have different interest rate and yield quoting conventions. The yield on short-term money market instruments is often calculated using simple interest as opposed to compound interest and as a result is not directly comparable with the yields to maturity.
Short-term government securities (Treasury bills), commercial papers are often quoted and traded on a ‘discount’ basis, while interbank loan rates, REPO rates are quoted on an “addon” basis. Besides, it is a convention in the US Treasury bills market to assume that a year has 360 days, while if it is denominated in sterling it has 365 days, eveninaleapyear.Short-termmoneymarketinstrumentsfrequentlydonothaveaspecifiedcouponandasaresultinvestors in them obtain a return by buying them at a discount to their par or maturity value. Below is provide the comparison of different money market rates and yields.
Rate on a discount basisd = ( PAR – P ) / PAR x (360 / t )
Where d is the yield on the basis of rate of discount, PAR – par value, P – the purchase price of the security and t is the number of days until maturity. Discount is calculated in this case as a percent from par value. It also assumes a 360 days year.
The discount is often converted into a yield so as to make it comparable with other money market instruments. This yield is often called a ‘money market yield’. Using the above example, the money market yield is just 4 × 100/99 = 4.0404 %.
Add-on ratey = ( PAR – P ) / P x (360 / t )
Where y is the yield on the basis of add-on rate, PAR - par value, P - the purchase price of the security and t is the number of days until maturity.
Bond-equivalent yieldy = ( PAR – P ) / P x (365 / t )
Where y is the yield, PAR - par value, P - the purchase price of the security and t is the number of days until maturity.
The bond equivalent yield is used to compare Treasury bill yields with the yields to maturity of coupon bearing Treasury notes and bonds. The bond equivalent yield is an approximation of the yield to maturity of a bond. The bond equivalent yield is higher than the discount rate. The difference is larger for longer maturities and for higher levels of discount rate d. Therefore an error of yield using discount rate d increases for longer maturities and for higher rates.
Annual yield to maturityy = ( PAR / P ) (365 / t ) – 1

57
Where y is the yield, PAR - par or maturity value, P - the purchase price of the security and t is the number of days until maturity.
Semiannual yield to maturityy = 2 x ( PAR / P ) (365 /2 t ) – 2
Where y is the yield on the basis of add-on rate, PAR - par or maturity value, P - the purchase price of the security and t is the number of days until maturity.
Comparison of all the money markets rates and yields are provided in Fig. 4.4. It shows that the largest is always the annual yield, which is then followed by semi-annual yield, bond equivalent yield, the yield on the basis of add-on rate and the yield on discount basis. The difference between bond equivalent yield and the semi-annual yield are smaller for longer maturities and approach as the maturity approaches half a year. The longer the maturity, the smaller is the difference between bond equivalent yield and the annual yield.
Finally, the longer the maturity, the larger are the differences between the money market discount rate and other rates.
90 180
Days
Discount rate
Add-on rate
Annual
Semiannual
Bond equivalent yield
Rate
Fig. 4.4 Money market rates and yields(Source: http://www.bcci.bg/projects/latvia/pdf/7_Financial_markets.pdf)
SeveralspecificmoneymarketinterestratesareusedinEurope.ThekeyEuropeanCentralBank(ECB)interestrateistheminimumbidrate,whichrepresentsthepricefloor,whichensurescentralbankliquidityintheopen-marketoperations.Thetwootherkeyinterestrates,onthemarginallendingfacilityandthedepositfacility,definethecorridorwithinwhichtheovernightinterestratecanfluctuate.
TheGoverningCounciloftheECBsetstheleveloftheminimumbidrateintheEurosystem’sweeklymainrefinancingoperations (MROs). Through the MROs, the ECB aims to supply the liquidity necessary for the banking system to operate smoothly. This way very short-term money market interest rates are aligned with the monetary policy oftheECB.Throughthemoney-marketyieldcurve,monetarypolicyistransmittedtofinancialinstrumentsandcreditconditionsmoregenerally,whichinturnwillinfluencesavingandinvestmentdecisionsandthuswillaffectprice developments in the euro area.

Financial Institutions and Financial Markets
58
Whenmoneymarketisaffectedbycrisisinthefinancialmarkets,theECBneedstoprovideadditionalliquidityinordertosupportmarketconfidence.ApartfromtheECBinterestrates,thereareothermainmarketinterestratesfor the money market as follows:
EONIA (Euro Overnight Index Average). The EONIA is the effective overnight reference rate for the euro. It is •computed daily as a volume-weighted average of unsecured euro overnight lending transactions in the interbank market, as reported by a representative panel of large banks.EURIBOR (Euro Interbank Offered Rate). The EURIBOR is the benchmark rate of the large unsecured euro •money market for maturities longer than overnight (one week to one year) that has emerged since 1999. It is based on information provided by the same panel of banks.EUREPO (the REPO market reference rate for the euro) for different maturities. The EUREPO is the benchmark •rate of the euro REPO market and has been released since March 2002. It is the rate at which one prime bank offers funds in Euros to another prime bank when the funds are secured by a REPO transaction using general collateral.The rate of interest paid on interbank loans in London (UK) is known as London InterBank Offer Rate or LIBOR. •It is an important reference to banks of the cost of raising immediate marginal funds. Numerous bank interest rates are therefore tied to LIBOR, particularly to the rate for three-month deposits.
The spreads among the key ECB interest rates and short-term market interest rates are low. E.g., EONIA is mostly slightlyabove,butverycloseto,theminimumbidrate.Thesmallspread(about6to7basispoints)reflectsthatthe EONIA is an unsecured interbank rate. It includes a small premium for credit risk and transaction costs. Larger spreadsnormallyoccurattheendofthereservemaintenanceperiodwhenthereisaneedforthebankstofulfilthereserve requirement.
The yields of money market securities are closely monitored by money market participants. As money market securities are seen as close substitutes, investors may exchange them to achieve more attractive yields. This causes yields among the securities to come closer. If there is a difference between yields, investors will avoid lower yielding instruments and will favour the ones with high-yield. During the periods of larger uncertainty about the economy, investors tend to shift from more risky money market securities to Treasury bills and other government securities.

59
SummaryBonds are debts of the governments, companies, and organisations that issue them.•Oneofthewaysinwhichbondsdifferfromsharesisintherelativecertaintyoffuturecashflows.•Intheabsenceofdefaultbytheissuer,thefuturecashflowsfromabondaretypicallyknownwithcertainty.•Therelativecertaintyofbondcashflowsinfluencesthepricingandanalysisofbonds.Thefairpriceofabond•is estimated using a discount model.The relativecertaintyofbondcashflowsmeans thatothercharacteristics, suchasdurationandconvexity,•can also be reliably estimated. Other important bond characteristics are future bond yields and of bond price volatility (risk).Thedebtmarketsareusedbybothfirmsandgovernmentstoraisefundsforlong-termpurposes,thoughmost•investmentbyfirmsisfinancedbyretainedprofits.Firms and governments can issue corporate bonds of various types of shares.•Bondsusuallypayafixedrateofinterestatpre-determinedintervals.•Bondsaretradedonastockexchangeandtheirpricefluctuatesinresponsetosupplyanddemand.•In the short-run the supply of both is fixed and price fluctuations are therefore the result of changes in•demand.The purpose of money markets is to facilitate the transfer of short-term funds from agents with excess funds •(corporations,financialinstitutions,individuals,government)tothosemarketparticipantswholackfundsforshort-term needs.Current policy through market oriented measures is aimed primarily at demand side.•Interbankmarketisdefinedmainlyintermsofparticipants,whileothermarketsaredefinedintermsofinstruments•issued and traded.Money markets consist of tradable instruments as well as non-tradable instruments. Credit risk is minimised by •limiting access to high-quality counter-parties.
ReferencesBernanke, B. & Blinder, A., 1992. • TheFFrateandthechannelsofmonetarytransmission. Journal of Banking and Finance.The • AnalysisoftheEuroMoneyMarketfromaMonetaryPolicyPerspective. ECB Monthly Bulletin.MoneyMarkets• .[Pdf]Availableat:<http://lamar.colostate.edu/~jelder/courses/finmarkets/lect_ppt/ch07_money_mkt.pdf> [Accessed 2 June 2014].AcommondefinitionofEuropeanmoneymarketfunds• . [Pdf] Available at: <http://www.esma.europa.eu/system/files/09_850.pdf>[Accessed2June2014].IntroductiontotheMoneyMarket• . [Video online] Available at: <https://www.youtube.com/watch?v=BoDjLCKov9I> [Accessed 2 June 2014].Module8MoneyMarketinIndia• . [Video online] Available at: <https://www.youtube.com/watch?v=I2kncghw8do> [Accessed 2 June 2014].
Recommended ReadingHartmann, P., Manna, M. & Manzanares, A., 2001. • TheMicrostructureoftheEuroMoneyMarket, ECB Working Paper.International Capital Market Association, 2007. • EuropeanREPOMarket Survey,Number 12, conductedDecember2006, Zürich, ICMA.Wolswijk, G. & de Haan, J. 2005. • GovernmentDebtManagement in theEuroArea:Recent TheoreticalDevelopmentsandChangesinPractices, ECB Occasional Paper 25.

Financial Institutions and Financial Markets
60
Self Assessment__________ are wholesale markets with very large amounts of transactions.1.
Money marketsa. Future marketsb. Small marketsc. Debt marketsd.
_______________ is definedmainly in termsof participants,while othermarkets are defined in termsof2. instruments issued and traded.
Primary marketa. Secondary marketb. Derivatives marketc. Interbank marketd.
Match the following3.
Interbank market1. Redistributes the ownership, ensures liquidity.A.
Primary market2. MarketforfinancialcontractswhosevaluesarederivedB. from the underlying money market instruments.
Secondary market3. Banksandnon-depositfinancialinstitutionssettleC. contracts with each other and with central bank.
Derivatives market4. Absorbs the issues and enables borrowers to raise new D. funds.
1-A, 2-C, 3-B, 4-Da. 1-D, 2-C, 3-B, 4-Ab. 1-C, 2-D, 3-A, 4-Bc. 1-B, 2-D, 3-A, 4-Cd.
____________ is minimised by limiting access to high-quality counter-parties.4. Credit riska. Money marketsb. Frameworksc. REPO marketsd.
Which of the following factors signify the economy of money market?5. Taxation policiesa. Costs considerationsb. Growth of government securities issuesc. Level of development of infrastructured.
A typical life to maturity of the securities is from four weeks to ______________.6. 9 monthsa. 6 monthsb. 18 monthsc. 12 monthsd.

61
____________aretypicallyissuedatonlycertainmaturitiesdependentuponthegovernmentbudgetdeficit7. financingrequirements.
Budgetdeficitsa. Treasury billsb. Tendersc. Competitive bidderd.
_____________ is a short-term debt instrument issued only by large, well-known, creditworthy companies and 8. is typically unsecured.
Commercial papera. Financial companiesb. Certificateofdepositc. Negotiablecertificatesd.
_____________statesthatadeposithasbeenmadewithabankforafixedperiodoftime,attheendofwhich9. it will be repaid with interest.
Certificateofdeposita. Commercial paperb. Financial companiesc. Negotiablecertificatesd.
______________arecertificatesthatareissuedbylargecommercialbanksandotherdepositoryinstitutionsas10. a short-term source of funds.
A reverse REPOa. Negotiablecertificatesofdepositb. The annualised yieldc. Repurchase agreementd.

Financial Institutions and Financial Markets
62
Chapter V
Debt Markets
Aim
The aim of this chapter is to:
introduce the debt markets•
explain valuation of bonds•
explicate the characteristics of debt instruments•
Objectives
The objectives of this chapter are to:
explore bond duration and convexity•
elaborate bond price volatility•
enlist types of bonds•
Learning outcome
At the end of this chapter, you will be able to:
distinguish callable bonds and other bond instruments•
understand characteristics of debt markets•
determine the behaviour of Macaulay’s duration•

63
5.1 Debt Market Instrument CharacteristicsDebtmarketsareusedbybothfirmsandgovernmentstoraisefundsforlong-termpurposes,thoughmostinvestmentbyfirmsisfinancedbyretainedprofits.Bondsarelong-termborrowinginstrumentsfortheissuer.
Majorissuersofbondsaregovernments(TreasurybondsinUS,GiltsintheUK,BundsinGermany)andfirms,which issue corporate bonds. Corporate as well as government bonds vary very considerably in terms of their risk. Some corporate bonds are secured against assets of the company that issued them, whereas other bonds are unsecured. Bonds secured on the assets of the issuing company are known as debentures. Bonds that are not secured are referred to as loan stock. Banks are major issuers of loan stock. The fact that unsecured bonds do not provide theirholderswithaclaimontheassetsoftheissuingfirmintheeventofdefaultisnormallycompensatedforbymeans of a higher rate of coupon payment.
5.1.1 Important Characteristics of Bonds The conventional or straight bond has the following characteristics:
Residual maturity (or redemption date)Astimepasses,theresidualmaturityofanybondshortens.Bondsareclassifiedinto‘short-term’(withlivesuptofiveyears);‘medium-term’(fromfivetofifteenyears);‘long-term’(overfifteenyears).Bondspayafixedrateofinterest, called coupon. It is normally made in two instalments, at six-monthly intervals, each equal to half the rate specifiedinthebond’scoupon.Thecoupondividedbytheparvalueofthebond(100Euro)givesthecouponrateon the bond. The par or redemption value of bonds is commonly 100 Euro (or other currency). This is also the price atwhichbondsarefirstissued.
As the preparations for issue takes time, market conditions may change in such a way as to make the bonds unattractive at their existing coupon at the time they are offered for sale. They will then have to be sold at a discount to 100 Euro, in order to make the coupon rate approximate the market rate of interest. If, vice-versa, the market interest rates fall, the coupon may make the bond attractive at a price above 100 Euro. In these cases, the issuers are making a last-minute adjustment to the price which they hope will make the bonds acceptable to the market.
Bondpricesfluctuateinverselywithmarketinterestrates.Ifmarketratesrise,peopleprefertoholdthenew,higher-yielding issues than existing bonds. Existing bonds will be sold and their price will fall. Eventually, existing bonds with various coupons will be willingly held, but only when their price has fallen to the point where the coupon expressed as a percentage of the current price approximates the new market rate. The yields on bonds are expressed commonly in two forms:
Interest yield (or running yield) : The return on a bond taking account only of the coupon payments.•Yieldtomaturityorredemptionyield:Thereturnonabondtakingaccountofthecouponcashflowsandthe•capital gain or loss at redemption.
5.1.2 The Types of Bonds The various types of bonds are explained as follows:
Callable and Putable BondsCallablebondscanberedeemedattheissuer’sdiscretionpriortothespecifiedmaturity(redemption)date.Putablebondscanbesoldbacktotheissueronspecifieddates,priortotheredemptiondate.
Convertible bondsTheseareusuallycorporatebonds,issuedwiththeoptionforholderstoconvertintosomeotherassetonspecifiedtermsatafuturedate.Conversionisusuallyintoequitiesinthefirm,thoughitmaysometimesbeintofloatingratenotes.

Financial Institutions and Financial Markets
64
EurobondsEurobonds are bonds issued in a country other than that of the currency of denomination. Thus bonds issued in US dollars in London are Eurobonds, as are yen bonds issued in New York. The bonds themselves may be straights, thatarefixed-interest,fixedredemptionbondslikethesterlingonesdescribedabove,ortheymaycomeinanyofthe variations listed here. Eurobonds are issued by governments but more usually by corporations.
Euro bondsThese are bonds denominated in Euros and issued in the euro currency area. If bonds denominated in Euros would be issued outside the euro currency area, they would be euro Eurobonds.
Floating Rate Notes (FRNs)These are corporate bonds where the coupon can be adjusted at pre-determined intervals. The adjustment will be made byreferencetosomebenchmarkrate,specifiedwhenthebondisfirstissued.AnFRNmightspecify,forexample,thatitscouponshouldbefiftybasispointsabovesix-monthTreasurybillrate,orsix-monthLIBOR,adjustedeverysixmonths.FRNsare,inpart,aresponsetohighandvariableinflationrates.
Foreign bondsThesearecorporatebonds,issuedinthecountryofdenomination,byafirmbasedoutsidethatcountry.Thus,aUSfirmmightissueasterlingbondinLondon.
Index-linked bondsThesearecorporatebondswherethecouponcanbeadjustedtohighandvariableratesofinflation.Whileotherbondshaveamaturity(redemption)valuefixedinnominaltermsandthereforesufferadeclineinrealvalueasaresultofinflation,boththevalueandthecouponofanindex-linkedbondareupdatedeachyearinlinewithlaggedchangesinaspecifiedpriceindex.
Junk bondsJunk bonds are corporate bonds whose issuers are regarded by bond credit rating agencies as being of high risk. They will carry a rate of interest at least 200 basis points above that for the corresponding bonds issued by high-quality borrowers.
StripsStripping refers to the breaking up of a bond into its component coupon payments and its maturity (redemption) value. Thus a ten-year bond, paying semi-annual coupons, would make twenty-one strips. Each strip is then sold as a zero-coupon bond. That is, it pays no interest but is sold at a discount to the payment that will eventually be received. In this sense, it is like a long-dated bill. The strips are created from conventional bonds.
5.2 Bond MarketDebt markets include primary markets for bonds, i.e., the markets in which newly issued instruments are bought and secondary markets, in which existing or second hand instruments are traded.
5.2.1 Bond Market CharacteristicsMajority of world bond markets have different institutional arrangements for the issue and trading of government bonds and corporate bonds. The reason is that governments should be able to sell the debt, which they use for budgetary and other purposes. Thus an active market with high rated participants should be ensured. Therefore government bond markets are subject to high level of supervision and regulation by the central bank. For governments bonds are the main instrument (mainly central governments, but also regional and local government authorities, and social security’sfunds)tofinancetheirbudgetdeficits.Thisistrueespeciallyforwithintheeuroareacountries.Besides,government bonds often serve as a benchmark for pricing other assets and they are also frequently used as collateral invariousfinancialtransactions.

65
In governments debt securities issues form the most important market segment, followed by debt securities issued byfinancialinstitutions(consistingofmonetaryfinancialinstitutions(MFIs)andnon-MFIfinancialinstitutions)and those issuedbynon-financialcorporations.Monetaryfinancial institutions includeallfinancial institutionswhose business is:
to receive deposits and/or close substitutes for deposits from entities other than MFIs•to grant for their own account credit and/or invest in securities•
The non-government bond market is dominated by bank debt securities. This segment includes different types of bonds, including unsecured bank debt securities and covered bonds. Covered bonds are claims of the bond holders against the issuing MFI that are secured by a pool of cover assets on the MFI’s balance sheet, such as mortgage loans or loans to the public sector.
The introduction of the euro in 1999 had a major impact on the operations of government debt managers as the disappearance of exchange rate risks within the euro area created the conditions for a pan-European capital market. As a result, debt managers became players in a larger European market. Investors turned their focus more on credit riskandliquidity,whilebondportfolioshavebecomeincreasinglyinternationallydiversified,especiallyinthesmallereuro-areacountries.Consequently,competitionamongdebtmanagershasincreased,stimulatingamoreefficientprimary market and a deeper, more liquid secondary market. Governments have put great effort into making their outstanding debt and new issues more attractive to international bond investors. In addition to local systems, the European electronic platform for government securities, EuroMTS, was introduced in 1999, enabling quotation and trading of some European benchmark bonds.
5.2.2 Bond Market YieldsBondyieldsareinfluencedbyinterest-rateexpectations,thetermpremium,creditriskandliquidity.Risk-averseinvestors demand a risk premium (term premium) for investments in long- term bonds to compensate them for the risk of losses due to interest rate hikes; those losses increase with bond duration. The term premium leads to a positive term spread, i.e., the spread of yields for bonds with longer maturity over yields for bonds with shorter maturity, even when markets expect increasing and decreasing interest rates to be equally likely.
Liquidity is one of the key characteristics of the bond market. Liquidity is the ease with which an investor can sell or buy a bond immediately at a price close to the mid-quote (i.e., the average of the bid-ask spread). A liquid market allowsmarketparticipantstotradeatlowtradingcosts.Kyle(1985)identifiesthreedimensionsofliquidity:
Tightness: The cost of turning around a position during a short period. Tightness in essence refers to a low •bid-ask spread.Depth: A market is deep if only large buy or sell orders can have an impact on prices.•Resiliency:Amarketisresilientifmarketpricesreflect‘fundamental’valuesand,inparticular,quicklyreturn•to ‘fundamental’ values aftershocks.
The spread between the yield of a bond with liquidity and a similar bond with less liquidity is referred to as the liquidity premium. Credit risk is the risk of loss because of the failure of a counter party to perform according to a contractual arrangement, for instance due to a default by a borrower. The spread between the yield of a particular bond and the yield of a bond with similar characteristics but without credit risk is the credit-risk premium. Rating agencies like Moody’s, Standard & Poor’s, and Fitch indicate issuers’ credit risk by assigning them a rating.
Credit risk and liquidity premium of euro-denominated bonds are typically calculated as the spread of the bond yields over those of German government bonds. There are two reasons for this. Firstly, German government bonds have consistently received the highest ranking from the three main rating agencies, indicating that German government bonds are associated with zero or very low credit risk. Secondly, German government bonds are very actively traded, ensuring that they are very liquid.

Financial Institutions and Financial Markets
66
Yield differentials vary considerably across countries, while for each country the yield differential varies considerably over time. Pagano and Von Thadden (2008) discuss studies that try to explain these yield differentials, arguing that they may arise from:
intrinsicdifferencesincountry-specificdefaultriskordifferentsensitivitiesofbonds’futurepayoffstocommon•shocks, or market frictions, like trading costs, clearing and settlement fees, and taxes. •
They state that credit risk explains a considerable portion of cross-country yield differences but explains very little of their variation over time.
5.3 Bond ValuationBond valuation has various methods which are explained below.
5.3.1 Discounted ModelsThefairvalueorfairpriceofabondisbasedonthepresentvalueofexpectedfuturecashflows.Thegeneralformulafor estimating the fair price of a bond is:
P = C/(1+r) +C/(1+r)2 + C/(1+r)3 +. . .+ C/(1 + r)n + B/(1+r)n
Where P is the fair price of the bond (its dirty price, which includes accrued interest), C is the regular coupon payment each period, B is the money value to be paid to the bondholder at maturity (redemption), r is the rate of discount per period, and n is the number of periods to maturity (redemption).
ExampleA bond pays a coupon of 4 Euro every six months, and 100 Euro will be repaid at maturity. There are two years to maturity and the next coupon is due in six months. The redemption yield on similar bonds is 6% p.a. Estimate the fair price of the bond. An interest rate of 6% p.a. indicates a rate of 3% per six month period.
P = 4/(1,03) + 4/(1,03)2 + 4/(1,03)3 +4/(1,03)4 + 100/(1,03)4P = 3,88 + 3,77 + 3,.66 + 3,55 + 88.85 = 103,71 Euro
Typicallyasinglerateorredemptionyieldisappliedtodiscountingallfuturecashflows.Theredemptionyieldofabondcouldbeviewedasanaverageofdiscountratesapplicabletothevariousfuturecashflows.Theredemptionyield indicates the average annual return to be received by an investor holding a bond to maturity.
The rate of discount is the required rate of return from a bond. The required rate of return can be regarded as the sumoftheyieldonbondsthatarefreeofdefaultrisk(governmentbonds)andariskpremiumtoreflectthedefaultrisk of the bond being valued. High default risk entails a high required rate of return and hence a high discount rate. Therefore,foranyparticularstreamoffuturecashflows,highriskbondswouldhavehigherratesofdiscountandhence lower fair prices than low risk bonds. Thus, bond prices have an inverse relationship to interest rates and that they have an inverse relationship to the risk of default. High interest rates and high risk are associated with low prices.
An important distinction when considering bond prices is between the clean and dirty prices. When a bond is purchased, the buyer must include in the purchase price a sum corresponding to the seller’s share of the next coupon. If the coupon is paid six-monthly and the bond is sold three months after the last coupon payment date, the seller would require the price to include half the next coupon so that holding the bond for the previous three months provides an interest yield. The rights to the coupon accumulated by the seller are referred to as accrued interest. The clean price of a bond excludes accrued interest whereas the dirty price includes it.
Clean price: The price of a bond ignoring any interest which may have accrued since the last coupon •payment.Dirty price : The price of a bond, including any accrued interest.•Quoted prices are usually clean prices whereas the price to be paid is the dirty price.•

67
Bond prices are inversely related to interest rates, but the relationship is not symmetrical. The proportionate fall in the bond price resulting from a rise in interest rates is less than the proportionate rise in the bond price caused by a fall when the percentage point change in interest rates is the same in the two cases. This can be illustrated by reference to the case of a bond with no maturity date. The price of such a bond is:
P = C/rWhere P represents the fair price of the bond, C the coupon, and r is the interest rate (required rate of return). Consider the case of a 5 Euro annual coupon and an initial interest rate of 10% p.a. The fair price of the bond would be estimated as:
5 / 0,1 = 50 EuroIf the interest rate falls by 2 percentage points to 8% p.a., the price of the bond is expected to rise to:
5 / 0,08 = 62.50 Euro
If the interest rate rises by 2 percentage points to 12% p.a., the fair price of the bond falls to:5 / 0,12 = 41,67 Euro
Whereas the interest rate fall results in a 25% price rise, the equivalent interest rate increase causes a 16,67% price decline.Thisasymmetryofpriceresponseisreferredtoasconvexity.Futurecashflowsfromabond,togetherwiththe required rate of return, can be used to estimate the fair price of the bond. The process could be reversed in order tofindtheredemptionyieldofthebondknowingitscurrentpriceandthefuturecashflows.Theredemptionyield(y) can be obtained by solving equation for y.
P =C/(1+y)1+C/(1+y)2+C/(1+y)3+C/(1+y)4+B/(1+y)4
Where P is the current market price of the bond, C is the annual coupon, B is the redemption value of the bond, and y is the redemption yield (yield to maturity). The effective annual yield takes account of the compounding. The effective annual yield is given by:
(1+y)2-1 .
Realised compound yield is the average compound rate of return actually obtained from an investment. Realised compound yield is affected by yield on reinvested coupons. The calculations of redemption yield assume that coupons are reinvested at the redemption yield. The realised compound yield equals the redemption yield if coupons are reinvested at the redemption yield and the bond is held to redemption. If the reinvestment rate for the coupons exceeds the redemption yield, the realised compound yield will exceed the redemption yield.If the reinvestment rate for the coupons is less than the redemption yield, the realised compound yield will be less than the redemption yield.
5.3.2 Bond Duration and RiskThere are two types of risk encountered by investors in bonds. There is price (or capital) risk, and reinvestment (or income) risk. Price risk is the risk that bond prices can change. For example a general rise in interest rates or a fall in the credit rating of a particular bond, would reduce the price of a bond. A capital loss would result. Reinvestment risk refers to the uncertainty of the interest rate at which coupons and redemption sums can be invested. This causes uncertaintyastothefinalsumthatwillbeavailableattheendofaninvestmenthorizon.
5.3.3 Bond Price VolatilityBondpricevolatilityismeasuredbyduration.ThedurationmeasuresincludeMacaulay’sduration,modifiedduration,andmoneyduration.Macaulay’sdurationistheaverageperiodoftimetothereceiptofcashflows.Eachtimeperiod(tothereceiptofacashflow)isweightedbytheproportionatecontributionofthatcashflowtothefairpriceofthebond.Macaulay’sdurationistransformedintomodifieddurationbymeansofdividingitby(1+r/n),whereristheredemption yield (which approximates an interest rate) and n is the number of coupon payments per year.
Macaulay’s duration has another meaning, it is the proportionate change in the bond price (fair price of the bond) arising from a unit proportional change in (1 + redemption yield).
Macaulay’sduration=(ΔP/P)/(Δ(1+r)/(1+r))

Financial Institutions and Financial Markets
68
WhereΔisthechangeinandPisthebondprice.Thecorrespondinginterpretationofmodifieddurationis:Modifiedduration=(ΔP/P)/Δr
Δ(1+r)=Δr.
Equations assume annual coupon payments. When coupons are paid more frequently, r is replaced by r/n (the annual redemption yield divided by the number of coupon payments per year). The calculation of duration can be demonstrated by an example. Suppose that a bond has just paid a coupon, matures in two years, and pays a coupon of 6 Euro six-monthly. The interest rate is 10% p.a. for all maturities. The fair price of the bond is:
P = 6/(1,05)+6/(1,05)2+6/(1,05)3+106/(1,05)4 = 5,71 + 5,44 + 5,18 + 87,21 = 103,54
An interest rate of 10% p.a. is 5% per six-month period. Macaulay’s duration is calculated as the weighted average oftheperiodstothereceiptofcashflows.Theweightingisbasedonthecontributionoftheperiod’scashflowtothe fair price of the bond. The periods are 0, 5, 1, 1, 5, and 2 years.
Macaulay’s duration = (5,71/103,54)0,5+(5,44/103,54)1,0+(5,18/103,54)1,5 +(87,21/103,54)2,0=0,028+0,053+0,075+1,685=1,841years.ConversionofMacaulay’sdurationtomodifieddurationismadethrough division by (1+r/n).
Modifiedduration=1,841/(1+0,1/2)=1,841/(1,.05)=1,753
ExamplesA corporate bond pays an annual coupon of £10 and has four years to maturity. It has just paid a coupon. As a •result of a downgrading of its credit rating, its required rate of return rises from 8% p.a. to 12% p.a. What are the effects of this change on (a) the price (b) the Macaulay’s duration, of the bond? (c) Discuss your results.Treasury 10% 2012, which pays coupons six-monthly, will reach maturity on 10 June 2012. It is now 11 June •2010. Interest rates for 0,5, 1, 1,5, and 2 years are all 7% p.a. Estimate the fair price, Macaulay’s duration, and modifieddurationofthebond.Aninvestorhastwobonds.BondApaysa5Euroannualcouponandmaturesinfiveyears.BondBpaysa4•Euro coupon semi-annually and matures in three years. The investor needs to sell one bond immediately and holdtheotherfortwoyears.Thecurrentrateofinterest,forallmaturitiesuptofiveyearsis6%p.a.
5.3.4 Behaviour of Macaulay’s DurationMacaulay’s duration of a bond behaviour can be summarised by a set of rules.
Rule 1: The duration of a zero coupon bond equals it’s time to maturity. As a zero coupon bond generates only •onecashflow,thepaymentofprincipalatmaturity,theaveragetimetothereceiptofcashflowsequalsthetime to that payment.Rule 2: Holding time to maturity and redemption yield constant, duration is inversely related to the coupon.•Rule 3: Holding the coupon rate constant, duration generally increases with time to maturity.•Rule 4: Holding coupon and maturity constant, duration is inversely related to redemption yield.•Rule 5: The duration of an irredeemable bond is given by (1 + r)/r, where r is the redemption yield. If a bond pays •the same coupon each period forever without the principal ever being repaid, the duration equals (1 + r)/r.
Example,A fund manager holds a 100-million Euro bond portfolio comprising three bonds: A, B, and C. Bond A has duration of four years and accounts for 25 Euro million of the portfolio. Bond B has a duration of seven years and accounts for 25 Euro million. Bond C, of which 50 Euro million is held, has duration of ten years. What is duration of the portfolio?

69
5.3.5 ImmunisationBonds are used in institutional investment portfolios not only as means of accumulating wealth but also as means of funding annuity payments. As it is possible to obtain reasonably reliable estimates of the duration of prospective annuity payment streams as well as the duration of bond portfolios, it is possible to match the duration of the bond portfolio with the duration of the annuity payments. Such duration matching or immunisation, is very useful for annuity and pension providers since it provides a high degree of protection against interest rate risk.
Duration is also important for the structuring of bond index tracker funds. If such a fund were to be constructed using stratifiedsamplingbasedonacellstructure,oneofthecharacteristicsofacellwouldbeduration.Othercharacteristicsmight be redemption yield and credit rating. There would be a cell for each combination of characteristics (e.g., high duration, low redemption yield, high credit rating), and the portfolio would contain an appropriately weighted combination of cells. If an annuity fund, index tracker fund or other bond fund exhibits a duration that differs from the optimum it is possible to use bond futures to adjust the portfolio duration to the desired value.
5.3.6 Bond ConvexityDuration provides just an approximation to the relationship between yield changes and bond price movements. The analysis of the price/yield relationship for a bond together with a straight line representing duration (i.e., price value ofabasispoint,PVBP),showsthatforsmallchangesinyielditissufficient.
Convexity is a measure of the change in duration with respect to changes in interest rates. However, the actual price change is expressed by the curved price/yield relationship. Thus for large yield changes, the duration line provides a poor estimate of the actual price change. Duration underestimates price rises and overestimates falls. In both cases, the new bond price is underestimated. The inaccuracies arise because money duration fails to take account of the convexity (curvature) of the actual price/yield relationship of a bond.
While constructing bond portfolios, a bond portfolio manager should be concerned with not only duration, but also convexity. Convexity has value in that it leads to higher bond prices following interest rate movements, when comparedwithaninvestmentwithzeroconvexity.Highconvexitybondsprovidethisbenefittoagreaterextentthanlowconvexitybonds.Thebenefitsofconvexityaregreaterwheninterestratechangesarerelativelylarge.This implies that the portfolio manager needs to consider the prospective size of interest rate movement as well as the direction.
y3 y2 y1
Initial interest rate
First & second derivatives
First derivative
Interest rate
Price
Price
Fig. 5.1 Duration and convexity

Financial Institutions and Financial Markets
70
If instead of duration a Taylor expansion is used, expressing the percentage changes in bond price in terms of the first,secondandhigherderivatives,theapproximationismoreaccurate.Thesecondderivativeincorporateswhathas been called convexity:
Convexity = ( d2P / dy2) x ( 1/P ) x (1 / 2 ) to y2,
Fig. 5.1 shows, that for increases of interest rates to y2 the duration plus convexity approximation gives a high estimate of bond price. For decreases in interest rates to y3, the duration and convexity approximation give a low estimate of bond price.
ExampleA bond has just paid a six-monthly coupon of 4 Euro. There are four more coupons to be paid by maturity. How accurateismodifieddurationforthepurposeofestimatingtheeffectofa(a)0.2%p.a.and(b)1%p.a.,decreasein the redemption yield on the bond price, when redemption yields are initially 2% p.a. Comment on the results of the calculations.
A bond with high convexity will tend to have a relatively low redemption yield. The advantage from high convexity would be offset by a lower yield. If interest rate movements are small, the gains from convexity would not compensate for the low yield. So if a portfolio manager expects a small interest rate change, bonds with low convexity should be chosen. If the expectation is that there will be a substantial interest rate movement, high convexity bonds should be chosen.
Convexity is greatest for low coupon, long maturity, and low-redemption-yield bonds (i.e., high duration bonds).Convexity can be calculated and combined with measures of duration when evaluating the potential effects of interest rate changes on bond prices. Since measures of duration are accurate only for very small changes in interest rates, a convexity correction is required in the case of large interest rate movements. To estimate the effects of relatively large interest rate changes on bond prices, it is necessary to combine an estimate of convexity with an estimate of duration.
5.4 Bond AnalysisIn this section we will study bond analysis through the topics discussed below.
5.4.1 Inverse Floaters and Floating Rate NotesFinancial engineering can create derivatives from a non-derivative investment, e.g., the division of a conventional bondintoaninversefloaterandafloatingratenote.Inversefloaterisabondwhoseinterestrateisinverselyrelatedtoamarketrate.Forexample,aninversefloatermightpayacouponrateof10%p.a.minusLIBOR(LIBORisacommonlyusedbenchmarkinterestratethatreflectsmarketrates).
Thepriceofaninversefloaterisextremelysensitivetointerestratemovements.Notonlydoesthecouponratefallwhen interest rates rise, but the rate at which the coupons and principal value are discounted also rises. There are two effects of interest rate rises that act to reduce the bond price. Conversely interest rate falls have two positive effectsonthebondprice;thehighercouponsareaccompaniedbyalowerdiscountrate.Soinversefloatersareverysensitivetointerestratechanges,inotherwordstheyhaveverylongdurations.Inversefloatersarestructuredbydividingaconventionalbondintoaninversefloaterandafloatingratenote.
Floating rate note is a bond whose coupon rate moves in line with market rates. For example, the coupon rate on a floatingratenotemightbe2%p.a.plusEURIBOR.Sincethecouponratemovesinthesamedirectionastherateofdiscount, effects of interest rate changes tend to offset each other with the effect that there is little net effect on the bond price. Floating rate notes exhibit low price volatility and hence short durations. The high duration of inverse floatersrendersthemusefulforhedginglong-termliabilities.
Falling interest rates increase the value of the liabilities, but that would be offset by the increase in the value of the inversefloaters.Inversefloatersmightbeattractivetoinstitutionswithlong-termliabilitiessuchaspensionfunds,annuityprovidersandlifeassurancecompanies.Converselyfloatingratenotescouldbeattractivetoinstitutionswith short-term liabilities, such as banks and building societies.

71
5.4.2 Callable BondsSome corporate bonds are callable. This means that the issuer has the right to repurchase the bonds at a predetermined price (the issuer has a call option on the bonds). To compensate for the risk of future calls, the bondholders require a higher coupon (on a callable as opposed to non callable bond), a call premium and typically a period of call protection during which the original coupon is locked in.
A rise in the bond price that makes the repurchase desirable would be brought about by a fall in market interest rates or an improvement in the credit rating of the bonds. Under these circumstances the issuer could repurchase the bonds and issue new bonds at a lower coupon rate. The issuer would choose to repurchase since that would allow forareductioninfinancingcosts.Bondswitharelativelyhighcouponcouldberepurchasedwithmoneyraisedfrom the sale of bonds with a lower coupon. The issuer thereby reduces coupon payments.
The predetermined price at which the issuer has the right to repurchase puts an upper limit on the value of the bonds. No one would pay a higher price knowing that they could be forced to sell at the predetermined price. The price/yield relationship for a callable bond has an upper limit to the price.
Par
Issue date
Maturity
Noncallable but redeemable
Freely callable
Time
Call price
Fig. 5.2 Callable bond
An implication of the upper limit to the price is that the convexity turns into concavity. Another implication is that the coupon rate on a callable bond will be higher than the coupon rate on a bond without the call feature. If investors face a ceiling on their prospective capital gains, they would require an enhanced coupon yield in compensation. Effectively investors are providing the issuer with a call option. The investors would require payment for the call option. The payment to the investors takes the form of increased coupons.
Fig.5.3clarifiestherelationshipbetweenthevaluesofthecalloption,thenon-callablebondandthecallablebond.Onthehorizontalaxis,thefigureshowsthevalueofanon-callablebond.Asinterestratesgetlower,thevalueofthe non-callable bond increases. The left vertical axis shows the value of a call option for a callable bond with the same coupon, par value and maturity as the non-callable bond. The origin for the left axis is the point where the thick black lines cross. As interest rates go down, the market value of a non-callable bond increases and the value of the call option also increases.

Financial Institutions and Financial Markets
72
Call option
Origin for left axis
0 EV
EV
EV
EV
Intrinsic value
Noncallable bond
Bond price
Option value
EV = Excess value
Call price Par
Origin for right axis
Value of noncallable
Par Call bbbbbprice
Callable bond
Lower interest rates
0
Fig. 5.3 Values of callable bonds, non-callable bonds and the call option
The right vertical axis shows the price of non-callable and callable bonds with the same coupons, maturity and callprice.Theoriginoftherightaxisistherightcornerofthefigure.Thevalueofthecallablebondisequaltothevalue of the non-callable bond minus the call option value. As the interest rates fall, the value of the callable bond approaches the call price.
5.4.3 Convertible BondsSome corporate bonds may be convertible into common stock of the company at the option of the bond holder. The bonds are usually callable at par plus a call premium. A convertible bond is in the money if the stock value of the bond exceeds the call price. The call feature is included to allow the company to force conversion into common stock. Conversion can be forced only if the bond is in the money. Call of an out-of-the money convertible induces the bondholders to turn in their bonds at the call price. Sometimes voluntary conversion occurs if the convertible is in the money and the dividend yield on the stock exceeds the current yield on the convertible.
Fig.5.4 shows the relationship between the stock value, the straight bond value and the price of the convertible. The stock value is initially below the par value and the stock value is assumed to grow over time. The straight bond value gradually approaches the par value as the bond gets closer to maturity. The call price declines over time to the par value. As the stock value rises above the call price, the premium of the convertible over the bond value declines and the market price of the convertible approach the stock value. The market price of the convertible must be higher than the higher of the straight bond value or the stock value. Otherwise arbitrage occurs.

73
When convertible bonds are issued, the stock price tends to decline. This evidence is consistent with the view, that issuing convertibles is a negative signal to the market. The evidence supports the view that convertibles are issued when the management has negative information.
Stock value Convertible bbbprice
Call price
Straight bond value
Maturity time Issue date
Par
$
Fig. 5.4 Convertible bonds

Financial Institutions and Financial Markets
74
SummaryBonds are debts of the governments, companies, and organisations that issue them. One of the ways in which •bondsdifferfromsharesisintherelativecertaintyoffuturecashflows.Intheabsenceofdefaultbytheissuer,thefuturecashflowsfromabondaretypicallyknownwithcertainty.•This is in contrast to shares since shares typically have dividend payments, which are variable and uncertain.Therelativecertaintyofbondcashflowsinfluencesthepricingandanalysisofbonds.Thefairpriceofabond•is estimated using a discount model.The relativecertaintyofbondcashflowsmeans thatothercharacteristics, suchasdurationandconvexity,•can also be reliably estimated. Other important bond characteristics are future bond yields and of bond price volatility (risk).Thedebtmarketsareusedbybothfirmsandgovernmentstoraisefundsforlong-termpurposes,thoughmost•investmentbyfirmsisfinancedbyretainedprofits.Firms and governments can issue corporate bonds of various types of shares. •Bondsusuallypayafixedrateofinterestatpre-determinedintervals.Bondsaretradedonastockexchangeand•theirpricefluctuatesinresponsetosupplyanddemand.Debtmarketsareusedbybothfirmsandgovernments to raise funds for long-termpurposes, thoughmost•investmentbyfirmsisfinancedbyretainedprofits.Bondpricesfluctuateinverselywithmarketinterestrates.•Bonds issued in US dollars in London are Eurobonds, as are yen bonds issued in New York.•Stripping refers to the breaking up of a bond into its component coupon payments and its maturity (redemption) •value.In governments debt securities issues form the most important market segment, followed by debt securities •issuedbyfinancial institutions (consistingofmonetaryfinancial institutions (MFIs)andnon-MFIfinancialinstitutions),andthoseissuedbynon-financialcorporations.The value of the callable bond is equal to the value of the non-callable bond minus the call option value.•Thepriceofaninversefloaterisextremelysensitivetointerestratemovements.•Convexity is a measure of the change in duration with respect to changes in interest rates.•
ReferencesDunne, P. & Moore, M. & Portes, R., 2006. • EuropeanGovernmentBondMarkets:Transparency,Liquidity,Efficiency, CEPR, London.Edwards, A. K., Harris, L. E. & Piwowar, M. S., 2007. • CorporateBondMarket TransactionCosts andTransparency, Journal of Finance.BondBasicsTutorial• . [Pdf] Available at: <http://i.investopedia.com/inv/pdf/tutorials/bondbasics.pdf> [Accessed 30 May 2014].EconomicImportanceoftheCorporateBondMarkets• .[Pdf]Availableat:<file:///C:/Users/ashwinip/Downloads/Corporate%20Bond%20Markets%20March%202013.pdf> [Accessed 30 May 2014].Episode123:IntroductiontoDebtandEquityFinancing• . [Video online] Available at: <https://www.youtube.com/watch?v=fH_gQmiVZgU> [Accessed 30 May 2014].FCR 001 - Introduction toDebt Financing• . [Video online] Available at: <https://www.youtube.com/watch?v=yrEkKlAwKKU> [Accessed 30 May 2014].

75
Recommended ReadingGoldstein, M. A., Hotchkiss, E. & Sirri, E., 2007. • TransparencyandLiquidity:AControlledExperimentonCorporateBonds. Review of Financial Studies.Pagano, M. & Von, Thadden, E., 2008. • TheEuropeanBondMarketsunderEMU,inX.Freixas,P.Hartmann,andC.Mayer(eds.), Handbook of European Financial Markets and Institutions. Oxford University Press, Oxford.Wolswijk, G. & de Haan, J. 2005. • GovernmentDebtManagement in theEuroArea:Recent TheoreticalDevelopmentsandChangesinPractices. ECB Occasional.

Financial Institutions and Financial Markets
76
Self AssessmentWhich bonds are referred to as a loan stock?1.
Secured bondsa. Unsecured bondsb. Issued bondsc. Major bondsd.
Who are major issuers of loan stock?2. Banksa. Customersb. Assetsc. Governmentd.
Who are the major issuers of bonds?3. Banksa. Customersb. Assetsc. Governmentandfirmsd.
Match the following4.
Coupon1. TheA. return on a bond taking account only of the coupon payments
Interest yield2. CouponsB.
Bonds3. Fixed rate of interest paid by bondsC.
Interest yield4. Return on a bond taking account only of the coupon paymentsD. 1-C, 2-D, 3-B, 4-Aa. 1-D, 2-A, 3-B, 4-Cb. 1-C, 2-D, 3-B, 4-Ac. 1-A, 2-B, 3-D, 4-C d.
_______________ are claims of the bond holders against the issuing MFI that are secured by a pool of cover 5. assets on the MFI’s balance sheet, such as mortgage loans or loans to the public sector.
European marketa. Junk bondsb. Index-linked bondsc. Covered bondsd.
__________ is the risk of loss because of the failure of a counter party to perform according to a contractual 6. arrangement, for instance due to a default by a borrower.
Credit riska. Fixed creditb. Price indexc. Quality borrowerd.

77
Whicharecorporatebonds,issuedinthecountryofdenomination,byafirmbasedoutsidethatcountry?7. Covered bondsa. Index-linked bondsb. Foreign bondsc. Euro bondsd.
______________canberedeemedattheissuer’sdiscretionpriortothespecifiedmaturity(redemption)date.8. Convertible bondsa. Callable bondsb. Eurobondsc. Floating rate notesd.
_____________ refers to the breaking up of a bond into its component coupon payments and its maturity 9. (redemption) value.
Strippinga. Debt marketsb. Covered bondsc. Capital marketd.
The price of a bond ignoring any interest which may have accrued since the last coupon payment is called as 10. ___________.
quoted pricea. dirty priceb. clean pricec. actual priced.

Financial Institutions and Financial Markets
78
Chapter VI
Equity Markets
Aim
The aim of this chapter is to:
introduce the equity instruments•
explain stock market trading systems•
explicate the purpose and functions of stock exchanges•
Objectives
The objectives of this chapter are to:
explore processes by which shares are issued•
elaborate types of purchase and sale order•
enlist types of stock exchange•
Learning outcome
At the end of this chapter, you will be able to:
distinguish primary and secondary markets•
understand bid-offer spreads•
determine private equity•

79
6.1 IntroductionEquitymarketisoneofthekeysectorsoffinancialmarketswherelong-termfinancialinstrumentsaretraded.Thepurposeofequityinstrumentsissuedbycorporationsistoraisefundsforthefirms.Theproviderofthefundsisgrantedaresidualclaimonthecompany’sincomeandbecomesoneoftheownersofthefirm.
Formarketparticipantsequitysecuritiesmeanholdingwealthaswellasasourceofnewfinance,andareofgreatsignificanceforsavingsandinvestmentprocessinamarketeconomy.Thepurposeofequityisasfollows:
Anewissueofequitysharesisanimportantsourceofexternalcorporatefinancing.•Equitysharesperformafinancingrolefrominternallygeneratedfunds(retainedearnings).•Equity shares perform an institutional role as a means of ownership.•
Within the savings-investment process magnitude of retained earnings exceeds that of the new stock issues and constitutesthemainsourceoffundsforthefirms.Equityinstrumentscanbetradedpubliclyandprivately.Externalfinancingthroughequityinstrumentsisdeterminedbythefollowingfinancialfactors:
Thedegreeofavailabilityofinternalfinancingwithintotalfinancingneedsofthefirm.•Thecostofavailablealternativefinancingsources.•Currentmarketpriceofthefirm’sequityshares,whichdeterminesthereturnofequityinvestments.•
Internalequityfinancingofcompaniesisprovidedthroughretainedearnings.Wheninternallygeneratedfinancingisscarceduetolow-levelsofprofitabilityandretainedearningsandalsoduetolowdepreciation,buttheneedforlong-terminvestmentsishigh,companiesturntolookforexternalfinancingsources.Firmsmayraisefundsbyissuingequity that grants the investor a residual claim on the company’s income. Low interest rates provide incentives for use of debt instruments, thus lowering demand for new equity issues. High equity issuance costs force companies to lookforothersourcesoffinancingaswell.However,duringtheperiodofstockmarketgrowthhighmarketpricesof equity shares encourage companies to issue new equity, providing with the possibility to attract larger magnitude of funds from the market players.
Equity markets are markets which organise trading nationally and internationally in such instruments, as common equity, preferred shares, as well as derivatives on equity instruments.
6.2 Equity InstrumentsEquity instruments are explained with various factors as below.
6.2.1 Common SharesCommon (ordinary) shares represent partial ownership of the company and provide their holders claims to future streamsofincome,paidoutofcompanyprofitsandcommonlyreferredtoasdividends.Commonshareholdersareresidualclaimants,i.e.,theyareentitledtoashareonlyinthoseprofitswhichremainafterbondholdersandpreferenceshareholders have been paid. If the company is liquidated, shareholders have a claim on any remaining assets only after prior claimants have been paid. Therefore, common shareholders face larger risks than other stakeholders of the company, e.g., bondholders and owners of preferred shares. On the other hand, if the value of the company increases,theshareholdersareentitledtolargerpotentialbenefits,whichmaywellexceedtheguaranteedinterestof bondholders.
Thevariabilityofreturnstoshareholdersisaffectedbytheproportionofdebttoequityfinancing(calledthedebttoequityratio)ofthecompany.Thehighertheproportionofdebtfinancing,thelargerthefixedinterestpaymentsandtheloweristhenumberofsharesoverwhichthenetprofitistobedistributed.Whenearnedprofitsexceedthelevelnecessarytopaytheinterest,alltheexcessprofitaccruestothesmallernumberofshareholders.Ontheotherhand,ifprofitsdecreasebelowinterestpayments,thewholereductioninpaymentsisbornebythecompanyshareholders. The higher is the debt to equity ratio, the greater is the variability in dividend payments to shareholders. Thus common shares in ‘highly leveraged’ companies are usually regarded as riskier than those in ‘low leveraged’ companies.

Financial Institutions and Financial Markets
80
Leverage:Theamountofdebt,relativetoequity,inafirm’scapitalstructure.Usuallyexpressedastheratioofdebtto equity, D/E, or debt to total capital D/(D.E).
Thelawrequiresthatthecompanyprovidestheownerswithspecifiedinformationintheannualreportandaccountsandthatthefirmmustholdanannualgeneralmeetingatwhichmanagementconductissubjecttoapprovalbycommon (ordinary) shareholders, each of whom has a number of votes matching the size of his shareholding. The decision to issue equity against debt is based on several factors:
Tax incentives. In many countries interest payments are tax deductible, however dividends are taxed. Thus the •taxshieldofdebtformsincentivestofinancecompanybydebt.Costofdistress:Increaseofcompanyleverage,increasestheriskoffinancialinsolvencyandmaycausedistress•as well as lead to bankruptcy. Thus companies tend to minimise their credit risk and increase the portion of equity in the capital structure.Agencyconflicts:Whenacompanyisfinancedbydebt,aninherentconflictarisesbetweendebtholdersand•equity holders. Shareholders have incentives to undertake a riskier operating and investment decisions, hoping forhigherprofitsincaseofoptimisticoutcomes.Theirincentivesaremainlybasedbylimitedliabilityoftheirinvestments. In case of worst outcome debt holders may suffer more, in spite of their priority claims towards company assets.Signallingeffect:Thecompanies,whichissueequitytofinanceoperations,providesignalstothemarket,that•current share selling price is high and company is overvalued.
6.2.2 Preferred SharesPreferredsharesisafinancialinstrument,whichrepresentsanequityinterestinafirmandwhichusuallydoesnotallowforvotingrightsofitsowners.Typicallytheinvestorintoitisonlyentitledtoreceiveafixedcontractualamountof dividends and this make this instrument similar to debt. However, it is similar to an equity instrument because thepaymentisonlymadeafterpaymentstotheinvestorsinthefirm’sdebtinstrumentsaresatisfied.Thereforeitis call a hybrid instrument.
Technicallypreferredshareholdersshareownershipofthefirmwithcommonshareholdersandarecompensatedwhencompanygeneratesearnings.Therefore,ifthecompanydoesnotearnsufficientnetprofit,fromwhichtopaythe preferred share dividends it may not pay dividends without the risk of bankruptcy. Because preferred stockholders typicallyareentitledtoafixedcontractualamount,preferredstockisreferredtoasafixedincomeinstrument.Preferred share an equity security, which carries a predetermined constant dividend payment.
Preferred stock investments may have tax advantage to institutional investors. Majority of preferred shares have cumulative dividend provision, which entitles to preferred share dividend payments (current and from previous periods) dividend payments on common shares. Usually owners of preferred shares do not participate in the net profitofthecompanyinexcesstothestatedfixedannualdividend.
Due to the fact that preferred dividends can be omitted, the company risk is less compared to risk in case of company debt.Howeverinthiscase,companymayfinditdifficulttoraisenewcapitalbeforeallpreferreddividendsarepaid. Investors may be unwilling to make new investments before the company is able to compensate its existing equity investors.
Preferredstockisanattractivesourceoffinancingforhighlyleveragedcompanies.Equitymarketsofferavarietyof innovations in preferred shares issues. These varieties include:
Cumulative preference shares•Non-cumulative preference shares•Irredeemable•Redeemable preference shares•Convertible preference shares•

81
Participating preference shares•Stepped preference shares•
Withtheexceptionofthefirsttwo,thesecharacteristicsarenotexcludingeachother.Forexample,itispossibletoissue non-cumulative, redeemable, convertible preferred shares. Non-cumulative preferred shares do not have an obligation to pay any missed past dividends, with the effect that missed dividends may be lost forever.
A redeemable preferred share has a maturity date on which the original sum invested is repaid, whereas most preference shares have no maturity date (the issuer may pay the dividends forever and never repay the principal sum). Some redeemable preference shares provide the issuer with the right to redeem at a predetermined price without the obligation to do so; in effect such preference shares provide the issuer with a call option, which would be paid for by means of a higher dividend for the investors.
Convertible preferred shares give the holder the right to convert preference shares into ordinary shares at a predetermined rate; the investor pays nothing to convert apart from surrendering the convertible preference shares. In some cases, the right to convert arises only in the event of a failure to pay dividends. Participating preferred shares allowtheissuingcompanytoincreasethedividendsifprofitsareparticularlyhigh;thepreferencesharedividendcanexceedthefixedlevelifthedividendonordinarysharesisgreaterthanaspecifiedamount.Steppedpreferredsharespayadividendthatincreasesinapredeterminedway.Specificadjustableratepreferredsharesareattractivein increasing interest environment. If the dividend is reset each quarter according to a pre-established formula based on Treasury bill rate, these issues can be considered as company capital.
Auction Rate Preferred Shares (ARPS) or Single Point Adjustable Rate Shares (ARPS) reset dividend periodically using Dutch auction method. The reset date can be as frequent as 49 days. Because of characteristics close to money marketsecurities,theyhavesignificantlyloweryields.
Dutch auction is a method, which allows all investors participating in the auction submitting a bid for the stock by specifieddeadline.Thebidpricesarerankedandminimumpriceforsellingofsharesisdetermined.Allbidsequalor above minimum price are accepted, and all bids below the minimum price are rejected.
Preferred Equity Redemption Cumulative Stocks (PERCS) are shares that pay dividends and are automatically converted into common stock at a conversion price and date. These can be callable at any date after the issuance for price above the issue price (e.g., by 40%) and gradually declines as the conversion date approaches.
Thecostofpreferredequityfinancingmaybehigher,comparedtodebtfinancing.Preferreddividendisnotataxdeductible expense to the company. Besides, investors are compensated more, as they assume its risk is higher due to the fact, that the company legally is not required to pay preferred dividends. As a rule, preferred equity has no maturity, thus it may force company to permanent preferred dividend payments.
6.2.3 Private EquityWhen companies are organised as partnerships and private limited companies, their shares are not traded publicly. The form of equity investments, which is made through private placements, is called private equity.
In such case investors’ liability may not be limited to the amount of contributed capital, and may be extended to total wealth of private owners. It is used mainly by small and medium-sized companies, young or start-up business inneedtoraisesignificantfundsforinvestment.However,theiraccesstobankorpublicstockmarketfinancingislimited.Typicallybanksdonotfinancestart-upsduetosignificantrisksoftheiroperationsandalimitedcompanyequity base. On the other hand, a public offering of shares for such companies may be feasible only if it has a significantshareholderbasetosupportanactivesecondarymarket.Withoutanactivesecondarymarketsuchsharesareilliquid,foundersofthecompaniesfinditdifficultto“cashout”bysellingtheiroriginalequityinvestment,canbeforcedtosellsharesatadiscounttothefundamentalcompanyvalue,fixedcostsofbeingpubliccompanyarehigh and this prohibits company from being public.

Financial Institutions and Financial Markets
82
Therefore, such companies attempt to raise additional capital from wealthy individual or institutional investors. Thistypeofinvestmentshasgrownsignificantlysincelate1990s,mainlyinUSandisslowlygaininggroundinEuropean countries. The most important sources of private equity investments come from venture capital funds, private equity funds and in the form of leveraged buyouts.
Venture capital funds receive capital from wealthy individual or institutional investors, willing to maintain the investment for a long-term period (5-10 years). Venture capital market brings together private businesses that need equityfinancingandventurecapitalists(businessangels)thatcanprovidefunding.Venturecapitalfundidentifiespotential of the business, negotiates the terms of investment, return from the investments and exit strategy. The invested funds are not withdrawn before a set deadline. Common exit strategies are either through the public sale oftheequitystakeinpublicstockofferingorthroughcashoutifthecompanyisacquiredbyanotherfirm.
Private equity funds pool resources of their partners to fund most often new business start-ups. They can rely heavilyondebtfinancing,too.Thus,theyperformtheroleoffinancialintermediaries.Privateequityfundsusuallytake over the businesses, manage them and control the restructuring, charge annual fee for managing the fund. Exit strategies are similar to the ones used by venture capital funds. Leveraged buyouts are company equity purchases byindividualorinstitutionalinvestors,whicharefinancedbyaminorportionofsharecapitalandamajorportionofdebt,providedbybanksorotherfinancialintermediaries.
6.2.4 Global Shares and American Depository Receipts (ADR)Investors may invest into foreign shares by purchasing shares directly, purchasing American Depository Receipts (ADRs) and Global Depository Receipts (GDRs). Alternatively, investments can be made by investing into international funds or purchasing exchange traded funds (ETFs). Direct purchases of foreign shares can be limited due to limited access to the stock exchanged, a limited available set of shares, high transaction costs through specialised brokerage companies.
Shares in international funds (International mutual funds (IMFs)) offer possibility of investing into a portfolio of internationalsecurities,createdandmanagedbyvariousfinancialinstitutions.Thusindividualinvestorsmaygetaccessanddiversifyacross internationalstocks. IMFscanbespecialisingonspecificcountryoracrossseveralcountries or regions.
ExchangeTradedFunds(ETFs)arepassivefundsthattrackspecificindex.Thusinvestorcaninvestintoaspecificindex, representing a country’s (e.g., foreign) stock market. Although ETFs are denominated in US dollars as a rule, the net asset value of an international ETF is determined by translating foreign currency value of the foreign securities into dollars.
While the price of each international ETF is denominated in US dollars, the underlying securities that make up the indexaredenominatedinnon-UScurrencies.ThusthereturnonETFwillbeinfluencedbythemovementofthecountry’s currency against dollar. If the country’s currency appreciates, this will increase the value of the index as measured in dollars. On the other hand, if the foreign currency depreciates, this will reduce the value of the index as measured in dollars. This is also true for IMFs.
American Depository Receipts (ADR) is an arrangement under which foreign shares are deposited within a US bank, which in turn issues ADRs in the name of foreign company. In this way the shares of a foreign company is admitted to the well-developed stock market, like US or UK. When issued in US, they are denominated in US dollars.DividendsarealsopaidinUSdollars,eveniftheunderlyingsecurity’scashflowsaredenominatedintermsof foreign issuer’s home currency. ADR may represent a combination of several foreign shares (e.g., lots of 100 shares).Tradingtakesplaceinnegotiablecertificatesrepresentingownershipofsharesofthecompany.
AmericanDepositoryReceipts(ADR)isacertificateofownershipissuedbyaUSbanktopromotelocaltradingon a foreign stock. US bank holds foreign shares and issues ADRs against them.

83
An ADR program, which is created without company’s involvement is called an unsponsored ADR. If ADR program is created with an assistance of the company, it is called a sponsored ADR. Such shares can be registered within the securities exchange commission and comply with reporting requirements and thus be traded on an organised stock exchange. Without such registration and reporting compliance, they can be traded on the over-the counter market.
Instrument Types Characteristics Investors MarketCommon shares Common (ordinary) shares,
Puttable common shares, ADRs GDRs
Corporate ownership Companies, state, financialinstitutions,non-financialintermediaries, individual investors
Stock exchange
Preferred shares Cumulative preference shares, non-cumulative preference shares, redeemable preference shares, convertible preference shares, participating preference shares, stepped preference shares.
Hybrid security, Features of equity and debt, Callability
Financial institutions, non-financialintermediaries, individual investors
Preferred stock market / stock exchange
Private equity Venture capital fund shares Private equity fund shares
Private placements, Investments of pool of funds, Partnerships or private limited form of companies
Venture capital companies, Institutional investors, individual investors (business angels)
Private equity market
Advantages of ADRs are follows:Easy and direct access to funding in the foreign market•Building company name recognition in the foreign country•Reliable quoting of share prices•Close following by investment analysts•
Disadvantages of ADRs are as follows:A costly investment alternative•For large institutional investors vs. small retail investors differences in prices and return•Market for ADRs can be illiquid•Multiple listing can result in share price differences in various markets globally•
GlobalDepositoryReceipts(GDRs)arenegotiablereceiptsissuedbyfinancialinstitutionsindevelopedcountriesagainst shares of foreign companies. GDRs can be simultaneously issued in US and Europe. Financial institution collectsanddistributesdividendspaidbytheforeignfirmtotheGDR(alsoADR)investor.Thus,financialinstitutionsfacilitate access to world equity markets by intermediating between world investors and companies in developing and transition countries.
6.3 Primary Equity MarketWhen equity shares are initially issued, they are said to be sold in the primary market. Equity can be issued either privately (unquoted shares) or publicly via shares that are listed on a stock exchange (quoted shares). Public market offering of new issues typically involves the use of an investment bank in a process, which is referred to as the underwriting of securities. Private placement market includes securities which are sold directly to investors and are not registered with the securities exchange commission. There are different regulatory requirements for such securities.

Financial Institutions and Financial Markets
84
In theprivateequitymarket,venturecapital isoftenprovidedby investorsas‘start-up’moneytofinancenew,high-risk companies in return for obtaining equity in the company. In general, private placement market is viewed as illiquid. Such a lack of liquidity means that buyers of shares may demand a premium to compensate for this unappealing feature of a security.
6.3.1 Primary Public MarketInitial Public Offering (IPO) means issuing public equity, i.e., when a company is engaged in offering of shares and isincludedinalistingonastockexchangeforthefirsttime.Itallowsthecompanytoraisefundsfromthepublic.Ifa company is already listed and issues additional shares, it is called Seasoned Equity Offering (SEO) or Secondary PublicOffering(SPO).Whenafirmissuesequityatastockexchange,itmaydecidetochangeexistingunquotedshares for quoted ones. In this case, the proceeds from sale of shares are received by initial investors. However, when a company issues newly created shares, the raised funds are received by the company.
Process of going publicThe issuing company has to develop a prospectus with detailed information about the company’s operations, investments,financing,financialstatementsandnotes,discussionontherisksinvolved.Thisinformationisprovidedto potential investors for making decision in buying large blocks of shares. The prospectus is registered within and approved by the securities exchange commission. Afterwards the prospectus is sent to institutional investors, meetings and road shows are organised in order to present the company. Road show is the travelling of company managers through various cities and making presentations for large institutional investors.
Share issues are often underwritten by banks. A bank, which is underwriting a share issue, agrees for a fee to buy any shares not acquired by investors. This guarantees that the issuing company receives the funding that it expects. Inthecaseofrightsissuesfirmssometimesavoidpayingafeetounderwritersbyusingthedeepdiscountroute.Ina rights issue, failure to sell the new shares would result from the share price (prior to the issue) falling below the sale price of the new shares.
Tounderwriteisanactofguaranteeingaspecificpricetotheissuerofthesecurity.Leadunderwriteriskeyinvestmentbankwithinagroupofinvestmentbankingfirmsthatarerequiredtounderwriteaportionofacorporation’snewlyissued shares.
The deep discount method prices the new shares at such a low-level that the market price is extremely unlikely to fall so far. The share offer price is determined by the lead underwriter, which takes into account the prevailing market and industry conditions. During the road show the lead underwriter is engaged in book building, i.e., a process of collecting indications of demanded number of shares by investors at various possible offer prices.
IPO FactorsPublic equity markets play a limited role as a source of new funds for listed corporations. Because of information asymmetry,companiespreferinternalfinancing(i.e.,retainedearnings)toexternalfinancing.MyersandMajluf(1984)haveintroducedthepecking-ordertheory,whichstatesthatcompaniesadoptahierarchyoffinancialpreferences.Ifexternalfinancingisneeded,firstly,companiespreferdebtfunding.Equityisissuedonlyasalastresort.Statisticsoncompanysourcesoffinancingsupportthisview.
On the other hand, during equity markets growth and share price increase periods IPO market tend to increase dramatically, while the drop in share prices is followed by decrease in net issuance of public equity. A large number of the issues in the late 1990s were ‘new economy’ offerings, like the technology, media and telecommunications sector.
Example,A one for four rights issue assumes offering one new share for every four held. A one for four rights issue may be at 160 Euro when the current share price is 200 Euro. The cost of:4 shares each 200 Euro equal to 800 Euro1 right each 160 Euro equals to 160 Euro

85
Thus, 5 shares cost 960 Euro (192 Euro each).It is to be expected that the rights issue would cause the share price to fall by 200 Euro – 192 Euro = 8 Euro.
Amongotherfactorstheeconomiccycleisconsideredtoplayasignificantroleinacompany’sdecisiontoissuepublicequity.Equityisoftenusedtofinancelong-terminvestments,whichfluctuateoverthebusinesscycle.Shiller(2003) has related the timing of equity issuance with investor sentiment. Developments in investor optimism over timemayhaveanimpactonthecostofequity,thusinfluencingtheamountofequityissued.E.g.,excessiveincreasesin risk aversion resulting in falling stock market prices could raise the cost of equity, preventing companies from newequityissues.Companiesalsoissueequityinordertofinancetheacquisitionofothercompanies,eitherbyusing the cash proceeds of public offerings or by issuing shares, which are subsequently exchanged for the shares of a target company. Therefore, merger and acquisition (M&A) cycles can also be expected to correlate with equity issuance activity.
There are important advantages and disadvantages of initial public offerings (IPOs). Advantages of IPOs:Possibilitytoobtainfundstofinanceinvestment.•The price of a company’s shares acts as a measure of the company’s value.•Increasesofcompanyfinancialindependence(e.g.,frombanks)duetolistingofacompany’ssharesonastock•exchange.Possibility to diversify investments of current company owners by selling stakes in the company in a liquid •market.Increased recognition of the company name•Improved company transparency•A disciplining mechanism for managers•
Disadvantages of IPOs:High issuance costs due to underwriters’ commission, legal fees, and other charges.•High costs due to disclosure requirements.•Risk of wider dispersed ownership.•Separation of ownership and control which causes ‘agency problems’.•Divergence of managers’ and outside investors’ interests.•Information asymmetry problems between old and new shareholders.•Risk of new shareholders focusing on short-term results.•
Instead of exercising the right to buy at 160 Euro, the investor can sell the right. The price could be around 192 Euro – 160 Euro = 32 Euro, because the buyer has the right to buy shares for 160 Euro when they are prospectively worth 192 Euro.
A one for one rights issue may be used.1 share each 200 Euro equal to 200 Euro1 right each 40 Euro equals to 40 Euro
Thus, 2 shares cost 240 Euro (120 Euro each). Therefore, instead of exercising the right to buy at the discounted price an investor could sell the rights. In the one for one case, the rights might be sold for
120 Euro – 40 Euro = 80 Euro
Note that the one for four rights issue at 160 Euro would raise the same amount of money as the one for one rights issue at 40 Euro (the latter involves selling four times the number of shares at a quarter of the price).

Financial Institutions and Financial Markets
86
IPO market has received negative publicity due to several problems:Spinning: Spinning occurs, when investment bank allocates shares from an IPO to corporate executives. Bankers’ •expectations are to get future contracts from the same company.Laddering:WhenthereisasubstantialdemandforanIPO,brokersencouragesinvestorstoplacethefirstday•bids for the shares that are above the offer price. This helps to build the price upwards. Some investors are willing to participate to ensure that the brokers will reserve some shares of the next hot IPO for them.Excessive commissions: These are charged by some brokers when the demand for an IPO is high. Investors •arewillingtopaythecommissionsiftheycanrecoverthecostsfromthereturnontheveryfirstday,especiallywhentheofferpriceoftheshareissetsignificantlybelowthemarketvalue.
The literature contains strong evidence that IPOs on average perform poorly over a period of a year or more. Thus, from a long-term perspective many IPOs are overpriced. Since introduction of Sarbanes-Oxley Act in US, which aimed at improving company reporting processes and transparency, initially returns from IPOs in general have been lower.
6.4 Secondary Equity MarketEquity instruments are traded among investors in a secondary market, in which no new capital is raised and the issuerofthesecuritydoesnotbenefitdirectlyfromthesale.Secondarymarketsarealsoclassifiedintoorganisedstock exchanges and over-the-counter (OTC) markets. Apart from legal structure, numerous historical differences are found in the operations of national stock markets. The most important differences are in the trading procedures. The trading on secondary markets takes place among investors, however most often through specialised intermediaries stock brokers (dealers), who buy or sell securities for their clients.
Securities’ trading in the secondary market form the means by which stocks or bonds bought in the primary market can be converted into cash. The knowledge that assets purchased in the primary market can easily and cheaply be resold in the secondary market makes investors more prepared to provide borrowers with funds by buying in the primary market. Effective secondary market is an important basis of successful primary market.
If transaction costs are high in the secondary market the proceeds from the sale of securities will be reduced, and the incentive to buy in the primary market would be lower. Also high transaction costs in the secondary market might tend to reduce the volume of trading and thereby reduce the ease with which secondary market sales can be executed. Therefore, high transaction costs in the secondary market could reduce primary market asset liquidity. In consequence there can be adverse effects on the level of activity in the primary market and hence on the total level of investment in the economy.
6.4.1 Organised exchangesStock exchanges are central trading locations, in which securities of corporations are traded. These securities may include not only equity, but also debt instruments as well as derivatives. Equity instruments can be traded if they are listed by the organised exchange, i.e., included in a stock exchange trading list. The list is formed of instruments that satisfy the requirements set by the exchange, including minimum earnings requirements, net tangible assets, marketcapitalisation,andnumberanddistributionofsharespubliclyheld.Eachstockexchangespecifiesthesetofrequirements. Advantages of listing on the stock exchange to the corporation and its shareholders are:
The ability to sell shares on the stock exchange makes people more willing to invest in the company.•Investors may accept a lower return on the shares and the company can raise capital more cheaply.•Stock exchange provides a market price for the shares, and forms basis for valuation of a company.•The information aids corporate governance, allows monitoring the management of the company.•Listing makes takeover bids easier, since the predator company is able to buy shares on the stock market.•The increased transparency may reduce the cost of capital.•

87
However, there are several disadvantages of listing, which include:Listing on the stock exchange is costly for the company.•It requires a substantial amount of documentation to be prepared, e.g., audited and prepared according to IFRS •financialstatements.It increases transparency, which may cause problems in terms of market competition and in takeover cases.•
Stockmarketdealersandbrokersfulfilspecificfunctionsattheequitymarket.Dealersmakemarketinsecurities,maintain securities inventories and risk their own funds. In contrast to dealers, who risk their own funds, brokers donotownsecurities,butexecutematchingofbuyersandsellersforaspecificfee..Dealer is an agent who buys and sells securities as a principal on its own account, rather than as a broker for his clients. Dealer may function as a broker, or as market maker. Dealers stand ready to buy at the bid price and to sellattheaskpriceandmakingprofitfromtheaveragespread.However,whenthestockpricesaregoingdown,dealers experience loss of value of stock inventory. This forms the primary risk for the dealer. Broker is an agent who executes orders to buy and sell securities on behalf of his clients in exchange for a commission fee.
Inordertoprofitfromdifferentpricemovementsdirectionsdealersmakepositioning.Ifthedealerexpectsthestockpricestoincrease,itbuysthestockandtakesalongposition.Profitisearned,ifthestockissoldatahigherprice.Ifadealerexpectsthestockpricetodecline,hetriestobenefitfromashortposition.Inashortsalethesecurityisborrowed and sold in the expectation of buying this security back later at a lower price. The investor tries to sell highandbuylow,profitingfromthedifference.Proceedsfromashortsalecannotbeusedbytheshortseller,andmust be deposited at the broker. The short seller must pay any cash dividends to the lender of the security. This rule is related to the amount of drop in stock prices by approximately the after-tax amount of a cash dividend after the dividend payment date. Stock exchanges apply down stick restrictions on short sales in order to prevent from panic selling and driving stock prices sharply down.
If the dealer’s forecast is wrong, the dealer must close the position at unfavourable price and absorb the loss. This creates the risk of dealer bankruptcy, and forces stock exchanges as well as securities exchange commission’s to imposethespecificregulationsinordertopreventthistypeofpricemanipulations.Shortsaleisthesaleofthesecurity, which is not owned by the seller at the time of trade.
Security dealers are heavily levered. Typically the dealer’s equity forms a small percentage of the market value ofhisinventory.Mostdealersfinancingisintheformofdebt(e.g.,bankloan).Majorityofdealerdebtfinancingis in the form of repurchase agreements (REPO, see chapter on Money markets). There are several types of stock exchange members which are explained as follows:
Commission brokers: Who execute buy and sell orders for the public for the fee. This is the largest group of •marketparticipants,actingasagentsoflendersorbuyersoffinancialsecurities.Theymayfindthebestpricefor someone who wishes to buy or sell securities.Odd-lot brokers: A group of brokers, who execute transactions of fewer than 100 shares. These brokers break •round lots (a multiple of 100 shares) into odd-lots and vice versa for a fee.Registered trader: Who owns a seat on a stock exchange and trades on his own account? Large volume of trades, •along with the possibility of speedy execution of orders, allows the traders to cover their large investments into the seat of a stock exchange.Specialists: These are market makers for individual securities listed on an organised stock exchange. Their •purpose is to reduce variability of the securities prices. When there are too many sell orders, the specialists have to perfume a role of buyers to keep the prices from falling for a period. When there are too many buy orders, the specialists have to perfume a role of sellers to prevent the temporary rise in prices.Issuing intermediary: Who undertakes to issue new securities on behalf of a borrower? An issuing house acts •asanagentfortheborrowerinfinancialmarkets.Thistaskisusuallycarriedoutbyinvestmentbanks.Market-maker: It is an intermediary who holds stock of securities and quotes a price at which each of the securities •may be bought and sold. Market-making is usually performed by the securities divisions of the major banks.

Financial Institutions and Financial Markets
88
Arbitrageur:Whobuysandsellsfinancialassetsinordertomakeaprofitfrompricinganomalies.Anomalies•occurwhenthesameassetispriceddifferentlyintwomarketsatthesametime.Sincefinancialmarketsarewell informed and highly competitive, usually these anomalies are very small and do not last long. Anomalies are usually known, thus there is no risk of arbitrage, which makes it different from speculation.Hedger:Whobuysorsellsafinancialassettoavoidriskofdevaluationofcurrency,changeofinterestratesor•prices of the securities in the market.Arbitrage: It is the simultaneous purchase of an undervalued asset or portfolio and sale of an overvalued but •equivalentassetorportfolio,inordertoobtainarisklessprofitonthepricedifferential.Ittakesadvantageofmarketinefficienciesinarisk-freemanner.
Stockexchangessetquitehighcommissionsforallmemberfirms.Thecompetitionfromothertypesofmarkets,e.g., OTC or third market (direct trading transactions), force stock exchanges to move to negotiated commission schedule, where lower fees can be applied to larger transactions. Majority of transactions at the stock exchanges are fully automated. Small buy and sell orders are matched by computers.
6.4.2 Over-the-Counter (OTC) MarketOver-the-counter(OTC)marketisthemarketplacefortradingfinancialinstruments,whicharegenerallyunlistedfinancialinstruments.Thesemarketsarenetworksofdealers,whomakemarketsinindividualsecurities.Commonequity shares that are traded on it can be listed and unlisted shares. Over-the-counter (OTC) market is a market for securities made up of dealers. It is not an organised exchange, and trading usually takes place by electronic means.
Two large segments of OTC markets can be distinguished as follows:Unorganised OTC markets with unregulated trading taking place between individuals. Typically, these markets •do not restrict possibilities to buy and sell outside of organised exchanges.HighlyorganisedandsophisticatedOTCmarkets,oftenspecialisingintradingspecificcompanyshares.Examples•of organised over-the-counter markets are the NASDAQ and upstairs markets in the United States.
Trading takes place via a computer network. Market makers display the prices at which they are prepared to buy and sell, while investors trade with the market makers, usually through brokers. The upstairs market is mainly used by institutional investors and handles large buy and sell orders (block trades). Institutions place orders through brokers,whoattempttofindatransactioncounterparty.Intheabsenceofsuchacounterparty,thebrokerattemptsto execute the order with market makers.
6.4.3 Electronic Stock MarketsSince the middle of 1990s a number of electronic stock markets were created for disclosing and executing stock transactions electronically. While publicly displaying buy and sell orders of stock, they are adapted mainly to serve execution of orders institutional investors mainly. Registered and regulated electronic stock exchanges developed from electronic communication networks (ECN). Some electronic communication networks (ECNs) exist along withofficialexchanges.
Electronic communication networks order-driven trading systems, in which the book of limit orders plays a central role.
ThepopularityofECNsstemsfromthepossibilitytoexecutesecuritytradeordersefficiently.Theymayallowcomplete access to orders placed on other organised or electronic exchanges, and thus eliminate the practice of providing more favourable quotes exclusively to most important clients. As a result quote spreads between the bids and ask prices are reduced. Since ECNs can execute orders of stocks listed and traded on organised or other electronic exchanges, they form the increasing competition among the stock exchanges. Examples of well-known electronic trading systems include Instinet (acquired by NASDAQ), Archipelago (merged into NYSE), SETS (London Stock Exchange’s premier electronic trading system).

89
As an alternative to organised stock exchanges the so called alternative trading systems (ATS) have developed, based on the idea there is no necessity to use an intermediary in order to conduct a transaction between two parties. In fact the services of a broker or a dealer are not required to execute a trade. The direct trading of stocks between two customers without the use of a broker or an exchange is called an ATS. There are two types of alternative trading systems (ATS):
Crossing networks•Dark pools•
Electronic crossing networks do not display quotes but match large buy and sell orders of a pool of clients (dealers, brokers, institutional investors) anonymously. These networks are batch processors that aggregate orders for execution. Market orders are crossed once or a few times per day at prices, which are determined in the primary market for a security.
The trade price is formed as a midpoint between bids and asks prices, observed in the primary market at a certain time. There is a variety of ECNs, depending upon the type of order information that can be entered by the subscriber and the amount of pre trade transparency that is available to participants. An example of an electronic crossing network is POSIT.
Electronic crossing networks order-driven trading systems, in which market orders are anonymously matched at specifiedtime,determinedintheprimarymarketforthesystem.Electroniccrossingnetworksprovidelowtransactioncostsandanonymity,whichareimportantadvantagesforlargeordersofinstitutionalinvestors.Theyarespecificallydesigned to minimise market impact trading costs.
However, there is no trading immediacy, since the traders have to wait until the crossing session time to execute the orders and an offsetting order entered by other market participant. Thus their execution rates tend to be low. Besides,iftheydrawtoomuchorderflowawayfromthemainmarket,theycanreducethequalityofthepricesonwhich they are basing their trades.
Dark pools are private crossing networks, which perform the traditional role of a stock exchange and provide for a neutral gathering place at the same time. Their participants submit orders to cross trades at prices, which are determined externally. Thus they provide anonymous (“dark”) source of liquidity.
Dark pools are electronic execution systems that do not display quotes but execute transactions at externally provided prices. Buyers and sellers must submit a willingness to transact at this externally provided price in order to complete a trade. The key advantage of dark pools systems is that they are designed to prevent information leakage and offer accesstoundisclosedliquidity.Aseparateformofcomputerisedtradingisprogramtrading,whichisdefinedassimultaneousbuyingandsellingofalargeportfolioofhighratedstockswithasignificantaggregatevalue.Anotherunderstanding of programme trading refers to the use of computer system (Designated order turnaround (DOT)), which allows traders to send orders to many trading posts at the exchange. Program trading is used to reduce the susceptibility of stock portfolio to stock market movements, e.g. by selling a number of stocks which become overpriced or by purchasing of stocks which become underpriced.
The critics of program trading state that it is one of the major reasons for decline or rise in the stock market and increases market volatility. Due to these concerns, stock exchanges implement collars, which restrict program trading when a wide stock index changes (e.g., by 2 percent) from the closing index on the previous trading day. When the collars are imposed, program trading for the sell orders becomes allowed when the last movement in the stock price was up (or “uptick”). Conversely, when program trading is for the buy orders, it becomes allowed when the last movement in the stock price was down (or “downtick”). Such restrictions are supposed to half stabilising effect on the market.

Financial Institutions and Financial Markets
90
6.5 Secondary Equity Market StructureSecondary markets are characterised based on the trading procedures.
6.5.1 Cash vs. Forward MarketsCashmarketsaremarketswherestocksaretradedonacashbasisandtransactionshavetobesettledwithinaspecifiedfew days period. Typical period is three days after the transaction. In order to increase the number of trades most cash markets allow margin trading. Margin trading allows the investor to borrow money or shares from a broker to financethetransaction.
Forward markets are markets in which in order to simplify the clearing operations, all transactions are settled at a predetermined day, e.g., at the end of a period (month). This is a periodic settlement system, in which a price is fixedatthetimeofthetransactionandremainsatthisvalueinspiteofmarketpricechangesbythesettlementtime.In order to guarantee a position, a deposit is required. Such a system does not prevent short-term speculation. Some cash markets provide institutionalised procedures to allow investors to trade forward, if they desire.
6.5.2 Continuous Markets and Auction MarketsContinuous markets are markets where transactions take place all day and market makers are ensuring market liquidity at moment. Dealer market is the market in which dealers publicly post bid and ask prices simultaneously, andthesebecomefirmcommitmentstomaketransactionatthepricesforaspecifictransactionvolume.Investorsare addressing the dealers offering the best price (quote).
Auction market is a market in which the supply and demand of securities are matched directly and the price is formed as an equilibrium price. An open outcry system allows brokers to negotiate loudly until price, which is equilibrium of buy and sell orders, is determined. In a call auction market all orders are put into an order book until an auction and are executed at a single price. Liquidity requires that such trades take place one or several times during a day. Suchtradingproceduresareaimedatdefiningtheauctionpricethatmaximisesthetradingvolume.
Callauctionisamethodofdeterminingthemarketpriceofasecuritybyfindingtheprice,whichbalancesbuyersandsellers.Suchpricefixingtakesplaceperiodicallyeachdayatdefinedtime.
6.5.3 Order-driven Markets and Quote-driven MarketsThe mechanism by which buyers and sellers interact to determine price and quantity of securities in the trade is calledmarketstructure.Therearetwooverallmarketstructuresfortradingfinancialinstruments:
Order driven •Quote driven•
Order-driven market structure allows buyers and seller orders submit their orders through their broker. The latter sends these orders to a centralised location, where orders are matched and the transaction is executed. Order is a driven market without active market makers, in which buy and sell orders directly confront each other.
An auction marketTherearedifferentformsoforder-drivenmarkets.Incallmarkets,thepriceisdeterminedseveraltimesatspecifiedmoments.Inthatway,orderscanbecollectedandtheauctiontakesplaceatthespecifiedtime.Thistypeofauctionis widely used for initial public offerings of equity (and new issues of government debt). The call market mechanism has disappeared in secondary markets for bonds and equity, and has been replaced by continuous trading systems. In continuous auction markets, public investors send their instructions (‘orders’) to buy or sell to brokers.
Typically order-driven trading systems are computerised. If not all orders at a price can be executed, a priority is given to the oldest order. Order driven markets are highly formalised as the auction rules for matching trades have tobespecifiedingreatdetailtoensureanorderlyandfairtradingprocess.Advancesininformationtechnologieshave supported the development of order-driven markets, in particular for equity trading. The combination of smart trading rules (software) with fast computers (hardware) allows an almost instantaneous matching of orders.

91
A group of stock exchanges worldwide (e.g., Paris, Frankfurt stock exchanges) use electronic order-driven systems, which allow all limit orders to be stored in the central order book. A new arriving order is immediately matched with the previously submitted orders from the order book. The trader can view all submitted orders and foresee what trades will be executed if a new order is entered. The highest limit order and the lowest limit order are in fact the bid and ask prices of the market. One of the examples of trading platform of the order-driven system is XETRA, used by Frankfurt stock exchange. Quote-driven market structure is the one, in which market makers or dealers quote the prices at which the public market participants are trading. Market makers provide a bid quote (to buy)andanaskquote(tosell).Marketmakersordealersearnprofitfromthespreadbetweenthetwoquotesandthe turnover of the shares.
Anyone who wants to trade in a quote-driven market must trade with a dealer. Either the investors negotiate with the dealers themselves or their brokers negotiate with the dealers. Quote-driven markets require little formal organisation, however require mechanisms for publishing the dealers’ price quotations and for regulating the conduct of dealers. Stock exchanges usually provide the dealers or market makers with privileged access to certain administrative procedures or market information. In return for these privileges, dealers have particular obligations, i.e., to quote ‘firm’bidandaskpricesatwhichtheyguaranteetomaketradesofuptospecifiedvolumes.
Atypicalquote-drivensystemisappliedbyNASDAQ,inwhichanautomatedsystempostsfirmstockquotesofthedealers, who place equivalent buy limit orders and sell limit orders. However, when posting the quotes, the dealers do not know which trades will be generated.
6.5.4 Hybrid MarketsHybrid market structures are the ones, which have elements of, for example, quote driven and order-driven market structures.AmarketthatintegratestraditionalfloortradingwithelectronicauctiontradinghasbeendevelopedbyNYSE (US). Another example is Euronext, which uses an order-driven trading system with a centralised electronic order book. Euronext also enables small and medium-sized listed companies to hire a designated market maker to act as ‘liquidity provider’ in their stock. London Stock Exchange combines electronic order-driven trading with liquidity provision by market makers.
Market structures are often compared from the point of view of their transparency and liquidity. In spite of expectations of the same market prices both in quote-driven and order-driven markets, in reality quote-driven markets tend to be more fragmented. Dealers quote different bid and ask prices, information on executed orders can be made available with some delay (to allow dealers some time to off-load large trades in the market). As a result, order-driven markets tend to be more transparent than quote-driven markets. Liquidity can be also different. Investors can tradeimmediatelyincontinuousorder-drivenmarkets,buthavetowaitforthenextpricefixinginacallmarket.Theprice,however,dependsontheavailabilityofsufficientnumberoforders,i.e.liquidity.Thus,investorsmayprefer to negotiate price individually with dealers in quote-driven markets. In quote driven markets information about transactions may be delayed also.
6.6 Equity Market TransactionsEquity market transactions are as below.
6.6.1 Bid-ask SpreadWhen a security is traded, a dealer, operating as a market-maker, quotes a price at which he/she is prepared to sell, the offer price and a price at which he/she is willing to buy the bid price. In the transaction the buyer pays the ask price and the seller receives the bid price. The ask price is always above the bid price.
Ask price is the price at which market maker is willing to sell a security. It is also called an offer price. Bid price is the price at which market maker is willing to buy a security.
Thedifferenceiscalledthebid–askspreadandistheprofitofthedealer:Spread = ask price – bid price.

Financial Institutions and Financial Markets
92
The market bid-ask spread is the excess of the lowest ask price over the highest bid price and is normally smaller than the spreads of individual market-makers.
The bid-ask spread of dealer can be seen as the price to be paid by investors for his services. On the other hand, from the perspective of the dealer the spread can be seen as a compensation for his costs and risks. The dealer typically holds an inventory of securities during the day to be able to sell (and buy) immediately. From his return (i.e.,thebid–askspread),thedealerhastocoverthecostsofholdinghisinventory(e.g.,interestcostsoffinancingthe securities inventory) and the risks (e.g., prices may move while the securities are in the inventory). From the perspective of investors, dealers (in their role as market-makers) provide two important services:
Possibility to execute a trade immediately from inventory, without having to wait for a counterparty to •emergeMaintenance of price stability in the absence of corresponding sell or buy orders•
Bytradingfromtheirownstockholdings,dealersreducepricefluctuations.Thedealercostsincludetheadministrativecostsoftransferringshares.Thedealerrisksarisefrompricefluctuationsandinformation-basedinvestors.Forsharesthat are infrequently traded, such as shares in smaller companies, the risks are greater, because positions are held for longer periods between trades. If shares are held for a long time, the risk of losses from price falls is greater. As a result the bid-offer spreads for such shares tend to be relatively high.
Dealer risk is also related to the possibility of investors possessing information that the dealer does not. Such investors areabletomakeprofitattheexpenseofthedealer.Investorcansellsharestothedealeratahighprice,whileheisinformed about a possible fall of share price. As a result the dealer may suffer the loss from a fall in the share price. The bid-offer spread is to provide the dealer with compensation for bearing this kind of information risk.
Dealers have a possibility to negotiate special prices for large transactions. The spread can be broader for particularly large transactions (i.e., block trades) to cover the price risk of such block trades before the dealer can sell on (or buy) thebought(sold)securitiesto(from)otherdealersinthemarket.Thus,thespreadisinfluencedbythefollowingfactors:
Order costs are costs of processing orders, including clearing costs and costs of recording transactions•Inventory costs include the costs of maintaining an inventory of particular shares;•Competition the larger the number of market makers, the greater their competition, and the narrower is the •spreadVolume is the larger the trading volume, the more liquid are the shares, the less risk of share price change•Risk is the more risky are company operations, the more volatile are its shares, the higher spread is set•
Severalresearchstudiesshowedthatbid-askspreadsonspecificlargestockexchangesarewiderastheyshouldbe.Due to specific tradingpractice,marketmakers kept their profitsmarginswide.Some analysts called thisphenomenon“under-the-table-payment”fororderflowortherighttoexecutecustomers’trades.Thereforeitabusessmall investors, who do not receive the best price for their quotes.
6.6.2 Placing OrderAn investor who wants to buy shares on a stock exchange has a possibility to submit different types of orders through a broker. Market order is the simplest and most common. It requires that the shares should be traded at the most favourable price available. The most favourable price is the lowest obtainable price for a purchase, and the highest available price for a sale shares. The trade then takes place at a price that is currently available in the market.
Limitorderplacesalimitonthepriceatwhichsharescanbeboughtorsold.Thusitspecifiespurchaseorsaleofshares at maximum buying price or minimum selling price, respectively. The outstanding limit-orders are generally listed in a limit-order book, which allows automatic trade matching. However in practice some possibility in setting the priority of orders remains. Limit orders remain on the limit order book until they are withdrawn by the investors, or until they can be executed as a result of new orders arriving.

93
Specifictypesofordersinclude:Buylimitorder(stopbuyorder),whichspecifiesthatthepurchaseshouldtakeplaceonlyifthepriceisat,or•below,aspecifiedlevel.Selllimitorder(stoplossorder),whichspecifiesaminimumsellingpricesuchthatthetradeshouldnottake•place unless that price, or more, can be obtained.Market-if-touched order becomes a market order if the share price reaches a particular level. It is different from •a limit order as there is no upper limit to the purchase price, or lower limit to the selling price. As soon as trade inthemarkethappensatthespecifiedprice,theorderbecomesamarketorder.However,thespecifiedpriceisnot necessarily obtained.Stop order is also an order that becomes a market order if there is a trade in the market at a particular price. •Howeveritinvolvessellingofsharesafterthepricehasfallentoaspecifiedlevel,orbuyingafterthepricehasrisentoalevel.Stopordersareaimedatprotectingmarketparticipants’profits,orlimitingtheirlosses.
They seek to ensure that a selling price is not too low, or that a buying price is not too high. Another dimension to an order is the length of time for which it remains in force. Fill-or-kill order is to be cancelled if it cannot be executedimmediately.Openorder,orgood-till-cancelledorder,remainsinforceuntilitisspecificallycancelledby the investor.
Investors can also specify the period of time for which the order should remain open, e.g., a day, a week, or a month.
6.6.3 Margin TradingInvestors can borrow cash to buy securities and use the securities themselves as collateral. A transaction in which an investor borrows to buy shares using the shares themselves as collateral is called margin trading or buying on margin.
The funds borrowed to buy the additional stock are provided by the broker, who in his turn borrows from a bank. The interest rate that bank charges broker for funds for this purpose is called the broker call rate or call money rate. The broker charges the borrowing investor the call money rate plus a service charge.
Stockexchangeregulationssetmarginrequirement,whichdoesnotallowbrokerstolendmorethanaspecifiedpercentage of the market value of the securities. The aim of margin requirement is to discourage excessive speculation and ensure greater stability in the markets. Margin requirement has to ensure that investors can cover their position in case the value of their investments into shares reduces. In such a way the possibility of default on broker loans should be reduced.
In order to purchase shares on margin investors have to create an account with a broker, which is called a margin account. The initial deposit of cash is called initial margin. Stock exchange regulations set initial margin requirement, which is the proportion of the total market value of the securities that the investor must pay as an equity share, and the remainder is borrowed from the broker.
As time passes, the market value of the shares is changing. The investor’s equity position then represents the value of shares, which is left to the investor after the loan from the broker is paid back. In order to reduce the possibility of default, the stock exchange regulation rules establish a maintenance margin requirement. This is the minimum proportion of the equity in the investor’s margin account to the total market value. The use of borrowed funds for investments into shares can magnify the returns on the investment. However, when borrowed funds are used, any lossesarealsomagnified.
Thereturnfromtheinvestmentintosecuritiesisinfluencedbytheproportionoftheinvestmentthatcomesfromborrowedfunds.Thereturnonstockpurchasedonmarginisdefined:
r = (SP – INV – L + D ) / INV

Financial Institutions and Financial Markets
94
Where SP is the selling price of securities, INV is initial investment by investor not including borrowed funds, L is loan payments on borrowed funds including principal and interest payments, D is dividend payments on the security.
If the investor’s margin account falls below the minimum maintenance margin (which would happen if the share’s price fell), the investor is required to transfer additional cash. The investor receives a margin call from the broker specifying the additional cash to be put into the investor’s margin account. If the investor fails to put up the additional cash, the broker has the authority to sell the securities for the investor’s account. Because of potential margin calls, a large volume of margin lending exposes the stock market to potential crisis. When a sudden huge downturn in the market happens, many margin calls are submitted. This may force investors to sell their share holdings, if they donothavesufficientcashtotransferinordertoreachrequiredmaintenancemargin.Suchsalesplaceadditionaldownward pressure on share prices and magnify the negative effect in the market.
6.6.4 Short SellingIn a short selling, investor place an order to sell a security that is not owned by the investor at the time of sale. Investors sell the stock short (or short the stock) when they expect decline of the stock price.
They arrange to have their broker borrow the stock from other investor, and the borrowed stock is delivered to implement the sale. To cover their short position, investors must subsequently purchase the stock and return it to the party that lent the stock. Thus investor, who owns the stock is unaffected when his shares are borrowed, are not aware about the fact that their shares were borrowed.
If the stock price declines by the time the short-seller purchases it in the market in order to return to the investor, from whomhehasborrowed,theshortsellerearnsaprofitfromthedifferencebetweentheinitialsellingpriceandthesubsequentpurchasepriceofthestock.However,hisprofitwillbeless,ifhehastopaytotheinvestor,fromwhomhe has borrowed the stock, dividends which the investor would have received if he had not borrowed the stock. The risk of a short sale is that the stock price may increase over time, which forces the short-seller to pay a higher price forthestockthanthepriceatwhichitwasinitiallysold.Stockmarketsandfinancialanalystsprovideinformationon level of short sale. Several indicators are used to measure the short position on stock which is explained in the paragraphs given below:
A degree of short positions: It is a ratio of the number of shares that are currently sold short, divided by the total •number of shares outstanding. Statistics shows, that most often this measure is in the range of 0,5-2%. A high measure of 3% shows a large number of short positions in the market, which may indicate that a large number of investors expect the stock price to decline.Shortinterestratioforspecificshares:Itisthenumberofshareswhicharecurrentlysoldshort,dividedbythe•average daily trading volume over the recent period. The higher the ratio, the higher the level of short sales. The ratioof20ormorereflectsanunusuallyhighlevelofshortsales,indicatingthatmanyinvestorsbelievethatthestock price is currently overvalued. For some stock this ratio may exceed 100 at particular points in time.Short interest ratio for the market: The higher the ratio, the higher the level of short selling activity in the •market overall. Investors, who have established a short position, quite often request a stop-buy order to limit their losses.
6.6.5 Stock Trading RegulationsStock market regulations aim at ensuring fair treatment of all investors in the market. Stock trading is regulated by national securities exchange commissions and by individual stock exchanges. It is widely understood, that the developmentoffinancialmarketsandsuccessofnewissuesofsecuritiescannotbehandledwithoutefficientandfair secondary stock markets.
Analysis of average real returns on stock in the well developed markets indicate that historically it has been about 6% percent higher than return on Treasury bills, which reached on average only 1% p.a. The difference between the return on stocks and the risk free- rate is a measure of risk premium on equities. However, the size of this risk premiumisnot justifiedby thestockmarket’s riskexposure, ifonly investorsareassumedtobeunreasonablyaversetorisk.Theresearchhasshownthatonly0,35%ofanequitypremiumcanbejustifiedasriskpremium.Suchpersistent overpricing of risk premium is called an equity premium puzzle.

95
If the equity premium puzzle is the result of security mispricing, then there is an arbitrage opportunity. It means that investor can gain by borrowing at the Treasury bill rate and investing in stocks. Borrowing limitations and transactioncostsmayreducethisarbitrageprofit,butnoteliminateit.
The concern about the fair and ethical stock market trading require imposing discipline on individuals and institutional investors. The organised stock exchanges introduce surveillance of all transactions at the exchanges. Computerised systems are installed to detect unusual trading of any particular stock. Any abnormal price or trading volume of particular stock or unusual trading practices of market participants is investigated. Additional regulations on imposing good corporate governance practice for listed companies are imposed through introduced corporate governance codes. Regulationsrequiredisclosureoffinancialstatements,havingamajorityofindependentdirectors(notemployeesofthecompanies)ontheirboardsofdirectors.Suchrequirementsareaimedatreducingexistingorpotentialconflictsofinterest between management and minority as well as majority shareholders, focusing management on maximising stockvalueforcompanyshareholders.Specificregulationconcernsarerelatedtorestrictionsontradingincaseofmarket downturns.
Stock exchanges can impose circuit breakers, which are restrictions on trading when stock prices or stock indexes reachesaspecifiedthresholdlevel.Thenecessityofsuchrestrictionbecamevividduringstockmarketcrashes,e.g., of NYSE in October 1987 and the later ones. When market maker swamp market with sell orders, stock prices cannotreflectthefairvalueanylongerandmoveintoafreefall.Themarketexperienceshugeliquiditycrisis,whichfeeds panic and exacerbates the price decline. As a result of such experience, in order to provide time for market participants to regroup and obtain backup sources of liquidity, a series of circuit breakers are put to use.
The NYSE prevailing circuit breakers have three threshold levels for a daily change of Dow Jones Industrial average index from its previous closing level:
Level 1 – 10%, •Level 2 – 20%, •Level 3 – 30%. •
If the Level 1 threshold is reached, there is a brief 30 or 60 minute halt in trading. If the Level 2 threshold is reached, there is a slightly longer 1 to 2 hour halt in trading. If the Level 3 threshold is reached, the market is closed for a day. NASDAQ and other large international exchanges impose similar circuit breakers.
Trading halts may be imposed on particular stocks if stock exchanges believe that market participants need more time to receive and absorb material information, which can affect stock price. Such trading halts are imposed of stocks that are associated with mergers and acquisitions, earning reports, lawsuits and other important news. The purpose of them is to ensure that market has complete information before trading on the news. A halt may last a few minutes, hours or several days. Trading is resumed after it is believed that the market has complete information. This does not prevent investors from a trading loss in response to the news. However, it can prevent from excessive optimism or pessimism about a stock, and can reduce stock market volatility. Drawbacks of trading halts are related to slowing down the inevitable adjustment of stock prices to the news.
6.7 Equity Market CharacteristicsFollowing are the equity market characteristics.
6.7.1 Stock IndicatorsTrading of stocks in the secondary market is related to stock price changes. Investors monitor stock price quotations, providedinfinancialwebsitesandpress.Thoughformatisdifferent,mostoftermprovidessimilarinformation.Stockexchangesprovideinformationonmarketcapitalisation,whichisthemarket’svaluationofthefirmandisfoundbymultiplyingthenumberofsharesbytheirmarketprice.Earningspersharearenetprofitsattributabletocommonshareholdersdividedbythenumberofcommonsharesoutstanding.Annualdividendisanetprofitportiondistributed to the shareholders over the last year on a per share basis. Dividend yield is the annual dividend per share as a percentage of the stock’s actual price. The price/earnings ratio (P/E ratio) is the reciprocal of the earnings yield. It conveys the same information but avoids the use of percentages.
Financial Institutions and Financial Markets
96
IfafirmhasahighP/Eratio,theindicationisthatthemarketvaluesithighlyforsomereasonotherthancurrentearnings. The usual presumption is that future earnings are likely to grow rapidly and the price increased in its anticipation. Shares of another company in the same sector might be judged ‘cheap’ if their P/E ratio were low by comparison (for no obvious reason). Stock quotations also include volume of shares traded the previous day. Stock price quotations show the “last” or closing price on the previous session.
6.7.2 Stock Market IndexesStock market indexes are measures of the price performance of stock portfolios, which are formed to represent a stockmarketasawholeoraspecificsegmentofthemarket,orsubindexes.Thewell-knownindicesincludetheDow Jones Industrial Average, the Standard & Poor’s 500 in the United States; the FTSE 100 in the United Kingdom; the Nikkei 225 in Japan; the DAX in Germany; the CAC 40 in France; and the Hang Seng in Hong Kong. National stock markets have at least one index, and some countries with well developed stock markets (in particular the United States) have numerous indexes. Indices can be categorised as follows:
The number of stocks included•The method of weighting the stock prices•The method of averaging•
The number of stocks can vary from a small number of largest most liquid company stocks to a wide portfolio of all stocks traded on a particular market. The indexes based on a small number of stocks have the advantage of easy calculation; however they can hardly represent stock market as a whole.
Weighting of the stock prices is diverse. Contribution of individual stock prices to an index may be unweighted (as in the case of the Financial Times Ordinary Share Index), value weighted (for example the Financial Times Stock Exchange (FTSE) 100), price weighted (such as the Dow Jones Industrial Average). In the case of unweighted indexes allstocksequalinfluenceirrespectiveofthesizesofthecompanies.Averageofdailyratesofsharepricechangeiscalculated each day and gives stock price change average on one day. The product of such changes starting from a base date provides the index. The calculation involves two stages:
Averaging stock price changes on a single day•Compounding the daily averages over time•
Indexes have a number of uses:To measure and monitor market movements.•To provide a means of ascertaining changes in aggregate wealth over time.•To perform a role as barometers of the economy; in particular stock market movements tend to be leading •indicators which means that they provide indications of likely future changes in the level of activity in the economy as a whole. They provide a means of evaluating the performance of fund managers by providing benchmarks against which •portfolio managers can be compared.To provide the basis for derivative instruments such as futures and options.•Toprovide the framework for thecreationof tracker funds,which is to reflect theperformanceofa stock•market.To be used by capital market models, in particular the capital asset pricing model (for discount rates for capital •projects, estimating required rates of return on shares, deriving fair rates of return for utilities).
Value weighted and arithmetically averaged indexes a key ones. In order to measure stock market values, an index hastoreflectaccuratelythetotalmarketcapitalisation.Anarithmeticallyaveragedvalue-weightedindexaccuratelymeasures the aggregate value of the stocks covered by its index. A reliable measure of the total value of the market is also required for measuring changes in aggregate wealth over time and as a basis for derivative instruments.

97
Arithmetically averaged value-weighted stock indices are the only indices that are macro consistent, i.e., it is possible for all investors to hold the index portfolio simultaneously. An index portfolio is a portfolio of shares that matches a stock index in terms of its constituent shares and their relative proportions.
The larger number of stocks is covered by an index, the more effective it is. Indices that provide a very broad coverage,andhencereliablyreflectthewholemarket,arereferredtoasbroadcapitalisationindices.Agoodbroadcapitalisation index is characterised by completeness and investability. This should make it possible for fund managers to buy all the shares in the index. Investability is particularly important for the managers of index tracker funds, but mayrequiresomesacrificeofcompletenessinordertoeliminateilliquidstocks.
Thecalculationofvalue-weightedindiceshasmovedtowardsafree-floatbasisandawayfromatotalcapitalisationbasis.Freefloatincludesonlythosesharesthatareavailableforpurchase,ratherthanallshares.Thefreefloatbasisexcludessharesheldbygovernments,foundingfamiliesandnon-financialcompanies.Thestock-indexweightingisthus based on the total value of a company’s shares available for purchase, and not on the full market capitalisation of the company. Weighting for multi-country stock indices is subject to discussion. One view is to weight each country by its contribution to global market capitalisation. However, the ratio of stock market capitalisation to national income (GDP) varies considerably between countries.
Another view is to use national income (GDP) rather than market capitalisation for weighting. This approach would provide a more stable weighting since relative GDP is less volatile than relative market capitalisation.
Two types of emerging-market stock index are available. There are indices based on total market capitalisation and indices based on the shares available for foreign investors. The performances of the two different types of index canbesignificantlydifferent.Stock indexesareusedby institutional investorsasbenchmarks forperformancemeasurement. Index tracker funds aim to replicate the performance of an index. Although, most stock indexes are based on arithmetic averages, there are some that use geometric averaging. However, geometric averaging has particular problems. The geometric mean overestimates the effects of rises in the prices of smaller company stocks and underestimates the effects of changes in the stock prices of larger companies. Since large corporations are large because of rapid growth in the past, it follows that the use of geometric means gives too little weight to the stock prices of rapidly growing companies and too much weight to the stock prices of slow growth companies. So the use of geometric means underweights stocks, whose prices rise rapidly, and over weights stocks, whose prices increase slowly. In consequence, over time, indices based on geometric means tend to understate the true rate of increase in stock prices. The cumulative effect of such understatement over time can substantially distort the calculated market rise.
6.7.3 Stock Market IndicatorsIn order to characterise and compare national as well as international stock markets, a number of indicators are being used.
Market sizeMarket size is characterised by market capitalisation. Relative national market capitalisations give indications of the importance of each country to international investors. Market capitalisation weights are used in the global benchmarks. Thus, market size forms the basis for global investment strategies.
Market liquidityIn liquid markets investors can be more active and design various arbitrage strategies. Market illiquidity tends to imply higher transaction costs. Thus those investors, who measure performance relative to a global benchmark, will tend to be more passive on such illiquid markets. Market illiquidity can be measure by transaction volume and turnover ratio. Turnover ratio is sometimes called share turnover velocity.Price volatility is an important measure in the secondary market, but might also be important to the operations of the primary market. High volatility means that buyers in the primary market are subject to a considerable risk of losing money by having to sell at a lower price in the secondary market. This can reduce the motivation to buy in the primary market.

Financial Institutions and Financial Markets
98
Two factors that affect the price volatility of securities in the secondary market are the depth and breadth of that market. The depth of the market is based on the likely appearance of new orders stimulated by any movement in price. If a rise in price brings forth numerous sell orders, the price rise will be small. A decline in price that stimulates many buy orders would be a small decline.
A deep market would be characterised by the appearance of orders that tend to dampen the extent of any movement inprice.Greaterdepth is thusassociatedwith lowervolatility.Breadthof thatmarket reflects thenumberanddiversity of the traders in the market. If there is large number of market participants with differing motivations and expectations, then there is less likely to be substantial price changes, compared to when there is small number of traders, or when the traders have common views such that they buy or sell together. A broad market is a large heterogeneous market characterised by relative price stability.
ConcentrationAlsocalleddegreeofconcentrationcanbemeasuredbasedonmarketcapitalisationforspecificstockexchanges,as well groups of stock exchanges in a region. This an important measure for investors interested to know if a national market is formed of a large number of diverse companies, or concentrated on a few companies. Institutional investors are reluctant to invest in small companies, fearing that they offer poor liquidity. Besides, it is easier for investors to track performance of a market index (based on market capitalisation weights), if it is dominated by a fewlargeissues.Amarketdominatedbyafewlargecompaniesprovideslessopportunitiesforriskdiversificationand active portfolio strategies.
6.7.4 Transaction Execution CostsTransaction costs are an important aspect of implementing an investment strategy. However, measurement of trading costsmeetsdifficulties.Tradingcostsconsistoftwomajorcomponents:
Explicit costs •Implicit costs•
Explicit trading costs are the direct costs of trading, such as broker commissions, fees, and taxes. The main explicit cost is the commission fee, which is paid to the broker for execution of an order. Commission costs are fully negotiable and vary systematically by broker type and stock market mechanism. The commission fee may be set, dependent upon both the price per share and the number of shares in the transaction.
In addition to commissions, other explicit costs include custodial fees, which are the fees charged by an institution that holds securities in safekeeping for an investor, and transfer fees, consisting of the fees associated with transferring an asset from one owner to another. Implicit trading costs represent such indirect costs as the price impact of the trade and the opportunity costs of failing to execute in a timely manner or at all. Whereas explicit costs are associated withidentifiableaccountingcharges,nosuchreportingofimplicitcostsoccurs.Implicittradingcostsinclude:
Impact costs•Timing costs•Opportunity costs•
The impact cost of a transaction is related to the change in market price due to supply and demand imbalances, caused by the trading transactions. Bid-ask spread estimates fail to capture the fact that large trades those that exceed the number of shares the market maker is willing to trade at the quoted bid and ask prices may move prices in particular direction. That is, large trades may increase the price for buy orders and decrease the price for sell orders. The resulting market impact or price change due to the transaction can be described as the deviation of the transaction price from the “unperturbed price” that would prevail if the trade did not occur.
The timing cost of a trade is measured as the price change between the time the market participants assume responsibility for the trade and the time they complete this responsibility for the transaction. Timing costs occur when orders are on the trading desk of a buy side company (e.g., an investment management company), but are not yet released to the broker, because the trader fears that the trade may swamp the market.

99
The opportunity cost of a trade is the “cost” of securities not traded. This cost results from missed or only partially completed trades. These costs are the natural consequence of the trade order delays. For example, if the price moves too much before the trade can be completed, the asset manager will not make the trade. In practice, this cost is measured on shares not traded based on the difference between the market price at the time of decision and the closing price 30 days later.
Commission fees and impact costs are actual and visible; however, the opportunity costs and timing costs are the costs of forgone opportunities and are invisible. Opportunity costs can arise for two reasons. Firstly, some orders are executed with a delay, during which the price moves against the investor. Secondly, some orders incur an opportunity cost because they are only partially executed or are not executed at all. Several methods of reduction of transaction costs are applied by institutional investors are as follows:
Internal crossing, i.e., manager attempts to cross the order with an opposite order for another client of the •firm.External crossing, i.e., manager sends the order to an electronic crossing network;•Principaltrade,i.e.,themanagertradesthroughthedealer,whoguaranteesfullexecutionataspecifieddiscount•or premium to the prevailing price. The dealer then acts as principal, because he commits to taking the opposite sideoftheorderatthefirmprice.Agency trade, i.e. when fund manager negotiates a competitive commission fee and selects a broker on the •basis of his ability to reduce total execution costs. This way the search for the best execution is delegated to the broker.Use of dealer indications of interest (IOI) Some party may wish to engage in an opposite trade for a stock or a •basket of stocks. Pooling IOIs from various dealers helps to identify possible pools of liquidity.
Use of futuresThere is an opportunity cost associated with the delay of execution of large trade. The fund manager could use futures to monitor the position while the trade is executed. Seeking to control (minimise) the costs, institutional investors have developed computer automated programs to enter trading orders. The use of computer programs for this purpose is known as algorithmic trading. Once an asset manager makes a decision to buy or sell a large stock position, the program separates the trade into several smaller orders so as to minimise transaction costs. Sometimes algorithmic trading is confused with automated trading. The latter uses computer programs to make investment decisions about which shares to buy or sell. Algorithmic trading is used to determine how to place the order. However, algorithmic trading does not require that the decision of which shares to buy or sell be made by automated trading.
6.8 Stock ValuationIn order to make investment decisions investors conduct valuation of stocks. They search for undervalued stocks for investing and sell holdings of stocks if they are considered overvalued. There are two approaches to what information is useful in the selection of stocks and the timing of the purchase of stocks:
Fundamental analysis •Technical analysis•
6.8.1 Fundamental AnalysisFundamental analysis is one of the methods of valuing stocks, which involves the analysis of a company’s operations to assess its economicprospects. It is basedon fundamentalfinancial characteristics (e.g., earnings) about thecompanyanditscorrespondingindustrythatareexpectedtoinfluencestockvalues.Theanalysisisbasedonfinancialstatementsofthecompanyinordertoinvestigatetheearnings,cashflow,profitability,andfinancialleverage.Thefundamental analysis includes analysis of the major product lines, the economic outlook for the products (including existing and potential competitors), and the industries in which the company operates.
This analysis results in projections of earnings growth. Based on the growth prospects of earnings, the fair value of the stock using one or more of the equity valuation models is determined. The fair value is based on present value calculations. There are various models to estimate the fundamental value of company shares. One approach is to estimate expected earnings and then multiply by expected price/earnings ratio. Another approach is to estimate the value of the assets of the company.

Financial Institutions and Financial Markets
100
The estimated fair value is compared to the market price to determine if the stock is fairly priced in the market, cheap (a market price below the estimated fair value), or rich (a market price above the estimated fair value). Traditional fundamental analysis has several limitations. It does not quantify the risk factors associated with a stock and how thoseriskfactorsaffectitsvaluation.Inaperfectlyefficientmarketallsecuritiesarealwayscorrectlypriced.Themarketpriceequalstothefundamentalvalueofthesecurity.Inamarketthatispartiallyinefficient,themarketprices deviate from fundamental value. Financial analysts aim to discover the fundamental value ahead of the rest ofthemarketparticipantsbeforethemarketpricesapproachthefundamentalvalueinordertomakeprofits.Theactionsofsuchprofitseekinginvestorspushthemarkettowardsefficiency.
6.8.2 Technical AnalysisThe aim of the technical analysis is to identify stocks that are candidates for purchase or sale, and the investor can employtechnicalanalysistodefinethetimeofthepurchaseorsale.Suchanalysisisusednotonlyforinvestigationof common shares, but also in the trading of commodities, bonds, and futures contracts. This analysis can be traced back to the seventeenth century, where it was applied in Japan to analyse the trend in the price of rice. The father ofmoderntechnicalanalysisisCharlesDow,afounderoftheWallStreetJournalanditsfirsteditorintheperiodof 1889 -December 1902.
Technical analysis ignores company fundamental information, focusing instead on the study of internal stock market information on price and trading volume of individual stocks, groups of stocks, and the overall market, resulting from shifting supply and demand. Technical analysts believe that stock markets have a dynamic of their own, independent of outside economic forces.
Technical analysis is aimed to determine past market trends and patterns from which predictions of future market behaviour are derived. It attempts to forecast short-term price movements. The methodology of analysis is based on the belief that stock market history tends to repeat itself. If a certain pattern of prices and volumes has previously been followed by particular price movements, it is suggested that a repetition of that pattern will be followed by similar price movements.
The study of past patterns of variables such as prices and trading volumes allows investors to identify times when particular stocks (or sectors, or the overall market) are likely to fall or rise in price. The focus tends to be on the timing of purchases and sales. H. Levy has suggested that technical analysis is based on the following assumptions:
The market price of securities (such as shares and bonds) is determined by supply and demand.•Supply and demand are determined by numerous rational and irrational factors. These include both objective •and subjective factors.Apartfromminorfluctuationsthepricesofindividualsecurities,andthelevelofthemarketasawhole,tend•tomoveintrendswhichpersistforsignificantperiodsoftime.Trends change in reaction to shifts in supply and demand. These shifts in supply and demand can be detected •in the action of the market itself.
Assumptions3and4arecontroversial.Supportersoftheefficientmarkethypothesis(EMH)taketheviewthatnewinformationisveryquicklyreflectedinsecurityprices.Ifinformationisveryquicklyreflectedinprices,trendsdonot have an opportunity to emerge. Technical analysts believe that new information does not arrive in the market at a single point in time; they take the view that new information comes to the market over a period of time. For example,newinformationmaybeavailablefirsttoinsiders,secondtoprofessionals,andlastlytothepublic.
As the information gradually becomes more widely available, the share price gradually moves to its new equilibrium price. Technical analysts look for the beginning of a movement from one equilibrium price to another without attemptingtopredictthenewequilibriumprice.Theyattempttoprofitfromforecastingthedirectionofmovement;thatistheytrytoidentifytrendsandprofitfromthem.Whateverthereasonforachangeinprice,ifthesharepricerespondssufficientlyslowly,atrendemerges.Aslowresponseofpricestoshiftsinsupplyanddemandprovidesthepotentialtoprofitfromtechnicalanalysis.

101
There are many technical analysis and trading techniques, including chart and non-chart ones. Price charts are a more frequent technique. Price charts are made for each day, or other chosen time interval, with the help of a vertical line. The top of the vertical line indicates the highest price reached during the day and the bottom shows the lowest price. A short horizontal line on each vertical line indicates the closing price on the day. A variety of price charts includelinecharts,Japanesecandlestickcharts,apoint-andfigure.
Oneaimofthechartsistofindareaswherepricereversalsarefrequentsincethisisseenaspresagingasubstantialprice movement (break out from a trading range).This would appear as a horizontal stretching out of the chart. Technical analysts use a vast number of chart patterns. Price channels (Trend channels). Trend channels can be horizontal, upward or downward sloping. The share price remains within the channel, and some points in time breaks out of the channel. If it breaks out of the channel in a downward direction, the chartist may interpret this as a signal to sell the stock since it is seen as forecasting a fall in the stock price, and vice versa. Price channels are often interpreted in terms of the bounds providing limits to the extent of variation of share prices, such that share prices tend to remain within the bounds.
Reversal patternsChartists frequently believe that when the direction of a share price (or market index) changes, characteristic chart patternsmaydevelopastheturnoccurs.Oneofthosereversalpatternsishead-and-shouldersconfiguration.Thehighest peak is the head, and the lower peaks are the shoulders. When the share price falls below the lower peak, further price fall is forecasted and eventually constitutes a sell signal. Converse reasoning would explain the use of reverse head-and-shoulders, which indicates that stock prices will rise and that therefore shares should be bought.
Moving averagesTechnical analysts use not only prices relating to individual dates, but also moving averages. A moving average is an average of a series of previous prices, for example the average of the last 200 daily prices. (Each day the oldest price is removed from the calculation of the average and the most recent price introduced). Chart patterns can be based on moving averages as well as daily prices.
One popular technique is to use moving averages and daily prices on the same chart. If the current price is a predetermined percentage above or below the moving average, a buy or sell signal may be indicated. For the market as a whole, the proportion of stocks currently above their moving average is seen as an indicator of general market sentiment.Pointsatwhichachartofdailypricescrossesachartofmovingaveragesareseenassignificant.Adailyprice chart that crosses a moving average chart from below might be seen as providing a buy signal. The signal may be dependent upon whether the moving average is rising or falling at the time. Studies have suggested that moving average strategies could be successful, e.g., stock returns following buy signals from a moving average rule were higher than those following sell signals.
Dow TheoryThis is one of the oldest technical tools, aimed to forecast the future direction of the overall stock market. Dow Theory is based on the belief that market movements are analogous to movements of the sea. It sees three simultaneous movementsinthemarket.Dailyandweeklyfluctuationscorrespondtoripples.Secondarymovements(whichlasta few months) are the waves. Primary trends of a year or more are analogous to tides. It is the primary trend that is referred to as either a bull or a bear market. The daily or weekly movements are seen as having little or no predictive value. However, secondary movements in stock indices are used to forecast changes in the direction of the primary trend. A bull market is characterised by both high and low points of successive secondary movements moving in an upward trend, especially if this were accompanied by rising volumes of stocks traded. Each new peak is above the previous peak, and each new trough is above the previous trough.
Trading volume should increase with moves made in the direction of the primary trend; for a rising primary trend, volume should be heavier for advances than for falls. The market is sustained by rising support levels and would break through successively higher resistance levels. When the market eventually falls through a support level and then is unable to bounce back beyond a previous resistance level, the beginning of a bear market is signalled. A bullish primary trend is seen as being initiated by informed investors, who anticipate a recovery. Subsequently uninformed investors start buying, thereby reinforcing the upward trend. While the uninformed investors continue to buy, the informed investors start to sell. Sales by informed investors cause the temporary downturns (the waves).

Financial Institutions and Financial Markets
102
Elliot Wave TheoryThe theory sees markets as moving in cycles. There are very long-run cycles that last many decades. Superimposed on these are cycles of shorter duration. In turn there are cycles of even shorter duration superimposed upon the latter cycles. This pattern of cycles within cycles continues down to cycles of very short duration. Analysis of the Elliot cycles is based on waves. Each cycle has eight waves. Five waves carry the market up and three waves carry it down. At the end of the cycle the market is higher than at the beginning.
The pattern of waves entails a succession of support and resistance levels, similarly to Dow Theory. Elliot wave theory assumes that markets are driven by investor psychology. After a fall in prices, investor optimism is seen as growingslowlyatfirstbutlatertheoptimismbecomesexcessiveandleadstoabubbleatwhichpricespeak.Thebubble bursts and the market is then carried lower in the wave pattern.
ElliotwavetheoryissometimessupplementedbytheuseofFibonaccinumbers.Fibonaccinumbersseemtofitthepatternofdevelopmentofarangeofnaturalphenomenafromthereproductionofpetalsonaflowertotheformation of galaxies. They are also believed to explain stock market developments. Fibonacci numbers are taken from a sequence in which each number is found by adding together the previous two in the series. The sequence runs 1, 1, 2, 3, 5, 8, 13, 21, 34, and so forth. Users of the theory employ various combinations and ratios of Fibonacci numbers to predict market tops and bottoms, along with support and resistance levels. Elliot wave theory sees cycles ascomprisingeightwaves,fiveontheupswingandthreeonthedownswing,whichareFibonaccinumbers.
Technicalanalystsalsouseotherindicators,suchasfilterrules,relativestrength,andshortinterestratios.Filterrulestates that an investor should buy when a stock price (or market index) has risen by a predetermined percentage above a previous low point. Conversely, the investor should sell when the price or index falls by a particular percentage below a previous high. The percentages are decided by the investor, but they should be established prior to the market movements.
Relative strength is measured by the ratio of a stock price to a market index. Changes in the ratio are taken to indicate buy or sell opportunities. For a momentum trader a rise in the ratio is a signal to buy the stock (and a fall is a signal to sell).A contrarian trader would interpret a rise in the ratio as a sell signal (and a fall as a buy signal). The short interest ratio is the ratio of short sales to total trading. A rise in the ratio has two opposite interpretations. First, a rise in the ratio as indicative of bearish sentiment, and hence is a sell signal. Second, a rise is a buy signal, since it is believed that the short positions will have to be covered by stock purchases. These stock purchases would tend to push up stock prices.
Trin statistic is the ratio of the average trading volume in stocks with declining prices to average volume in stocks rising prices. Ratio above 1 show a bearish market, since a relatively high volume of trades in declining stocks is indicating net selling pressure. Conversely, ratios below 1 are seen as indications of a bullish market. Trading volume is considered an indication of the strength of a trend. If a price movement is accompanied by a relatively high quantity oftrades,itisconsideredmoresignificantthanthepricemovementinalowtradingvolumemarket.
Breadthof themarket shows theextent towhichmovement inamarket index is reflectedwidely in thepricemovements of individual stocks. The most common measure of breadth is the difference between the numbers of stocks that rise and the number that fall. If the difference is large, the market movement is considered to be strong, since it is widespread. A market rise is viewed stronger, if prices of large majority of stocks are rising. Conversely, market rise is viewed as weaker, when only prices of stocks of a few large capitalisation companies are increasing.Mutual fund cash holdings, if they increase, might an indication of a market rise based on belief that the cash will be used to buy shares. This demand for shares would tend to push prices up. Conversely, low mutual fund cash holdings are seen as a bearish signal.
Put-call ratioPutoptionsgivetherighttosellsharesataspecifiedprice,andareboughtbyinvestorswhoexpectsharepricestofall.Calloptionsgivetherighttobuysharesataspecifiedprice,andareboughtbyinvestorswhoexpectshareprices to rise. The ratio of puts bought to calls bought is used as an indicator of the expectations of investors.

103
However technical analysts have different interpretations of the ratio. Some see a high put call ratio as a sign of a bearish market based on the belief that it indicates that investors in general expect stock price falls. Others have a contrarian view, and see a high put-call ratio as a buy signal. Contrarian analysts base their analysis on the belief that investors are usually wrong. Technical analysis is often, though regarded as an essential tool of investment analysis by market practitioners, however is criticised by academics. The criticism from academics tends to focus ontheabsenceofacoherentbodyoftheorytoexplaintechnicalanalysis,andonthedifficultyofusingstatisticaltests to ascertain its effectiveness.
The past theories proposed by technical analysts tended to be ad hoc and inconsistent. There has been no coherent rationaleastowhytechnicalanalysisshouldwork.However, therecentdevelopmentofbehaviouralfinanceiscontributingtotheemergenceoftheoreticaljustificationsoftechnicalanalysis.
Ifsocialandpsychologicalforcesinfluencestockmarketbehaviourinconsistentways,technicalanalysiscouldbeseenasatechniqueforidentifyingthoseforcesandforecastingtheireffects.Besides,behaviouralfinancecanalsobeappliedtoexplainthebehaviouroftechnicalanalysts.Technicalanalystsmaybeinfluencedbythesamesocialandpsychologicalbiasesasothermarketparticipants.Thosebiaseswould tend to influence technicalanalysts’interpretations of their charts and other data. The forecasts of technical analysts could be affected by the same biases, which the analysts may be seeking to identify among other market participants.
Institutional investors tend to use technical analysis alongside other methods of investment analysis. The research evidence on the ability of institutional investors to outperform stock market indices indicates that, at best, such outperformance is marginal. This evidence throws doubt on the effectiveness of investment analysis, including technical analysis. However since the stock market in aggregate is equal to the sum of investment portfolios, such findingsmightbeexpected.Investmentanalysismaybeazero-sumgameinthatthosemakingprofitsmakethemat the expense of other analysts.

Financial Institutions and Financial Markets
104
SummaryEquity markets exist to facilitate the transfer of funds from savers of funds to investors, which need to raise •money.Organised stock exchanges as well as over the counter markets ensure that a secondary market provides a means •for existing investors to sell their equity securities.Newly issued shares are sold in the primary market by public offer, tender, placement, or through a rights issue. •In addition to common (ordinary) shares there are various types of preferred shares.Stock exchanges may be order-driven, quote-driven, or a hybrid of these two systems. In all stock market trading •systems share prices are determined by the demand and supply. The key types of orders are market orders, which accept the existing share price, and limit orders which specify •upper limits to buying prices or lower limits to selling prices.Most individual investors buy equity instruments indirectly through institutional investors such as pension •funds, insurance companies, and investment funds. Therefore most of the trading on stock exchanges is done through institutional investors.Some types of institutional investment, like investment funds or exchange-traded funds (ETFs), trade their own •shares on a stock exchange directly.Stockmarketsoperatemostefficientlyiftheyhavesufficientdepthandbreadth.Adeepmarkethasalarge•number of traders, who ensure that small price movements raise many new buy or sell orders. This helps to avoid excessive share price volatility, since price falls are met by new purchase orders, and price rises are met by new sell orders.A broad market contains traders with differing opinions such that some will be forecasting price rises whilst •others expect falls.The diversity of views helps to prevent large price swings. When stock markets are characterised by uniformity •of opinion, extreme share price movements can result.If the overwhelming majority of investors expect a rise, there would be many buyers and few sellers. Sharp •price rises (a bubble) would result.If the majority expects a price fall, sales would dominate purchases and share prices could fall dramatically •(and a stock market crash can occur).
ReferencesEuropean Central Bank. 2006. • EquityIssuanceintheEuroArea. Monthly Bulletin.Fama, E. F., 1965. • RandomWalksinStockMarketPrices. Financial Analysts Journal.EquityMarkets• . [Pdf] Available at: <http://www.kesdee.com/pdf/equitymarkets.pdf> [Accessed 3 June 2014].EquityMarketStructureLiteratureReview• . [Pdf] Available at: <http://www.sec.gov/marketstructure/research/hft_lit_review_march_2014.pdf> [Accessed 3 June 2014].EquityMarket• . [Video online] Available at: <https://www.youtube.com/watch?v=dDFYGg6vKFQ> [Accessed 3 June 2014].HowtheStockMarketWorks• . [Video online] Available at: <https://www.youtube.com/watch?v=GnJCOof2HJk> [Accessed 3 June 2014].
Recommended ReadingFoucault, T. & Menkveld, A. J., 2008. • CompetitionforOrderFlowandSmartOrderRoutingSystems. Journal of Finance.Kazarian, E. G., 2006. • IntegrationoftheSecuritiesMarketInfrastructureintheEuropeanUnion:PolicyandRegulatoryIssues.Levy, H., 1978. • Equilibriuminimperfectmarket. A constraint on the number of securities. American Economic Review.

105
Self AssessmentWhichofthefollowingisoneofthekeysectorsoffinancialmarketswherelong-termfinancialinstruments1. are traded?
Equity marketa. Debt marketb. Finance marketc. Equity instrumentd.
___________ represent partial ownership of the company and provide their holders claims to future streams of 2. income,paidoutofcompanyprofitsandcommonlyreferredtoasdividends.
Common sharesa. Residual claimantsb. Shareholdersc. Remaining assetsd.
_______________isafinancialinstrument,whichrepresentsanequityinterestinafirmandwhichusually3. does not allow for voting rights of its owners.
Equity securitya. Preferred sharesb. Common shareholdersc. Predetermined constantd.
____________isanattractivesourceoffinancingforhighlyleveragedcompanies.4. Equity securitya. Preferred sharesb. Common shareholdersc. Preferred stockd.
Which of the following offers a variety of innovations in preferred shares issues?5. Equity marketa. Debt marketb. Finance marketc. Equity instrumentd.
_____________ give the holder the right to convert preference shares into ordinary shares at a predetermined 6. rate.
Equity securitya. Preferred sharesb. Convertible preferred shares c. Preferred stockd.
____________ is a method, which allows all investors participating in the auction submitting a bid for the stock 7. byspecifieddeadline.
Preferred dividenda. Private Equityb. Preferred equity redemption cumulative stockc. Dutch auctiond.

Financial Institutions and Financial Markets
106
Which of the following statement is true?8. Venture capital market receives capital from wealthy individual or institutional investors, willing to maintain a. the investment for a long-term period.Venture capital funds receive capital from wealthy individual or institutional investors, willing to maintain b. the investment for a long-term period.Common exit strategies receive capital from wealthy individual or institutional investors, willing to maintain c. the investment for a long-term period.Private equity funds receive capital from wealthy individual or institutional investors, willing to maintain d. the investment for a long-term period.
______________ usually takes over the businesses, manage them and control the restructuring, charge annual 9. fee for managing the fund.
Venture capital marketa. Venture capital fundsb. Common exit strategiesc. Private equity fundsd.
______________arepassivefundsthattrackspecificindex.10. ADR programa. American Depository Receiptsb. Exchange traded fundsc. Global Depository Receiptsd.

107
Chapter VII
Derivative Market
Aim
The aim of this chapter is to:
introduce depository system•
definederivativesmarkets•
explicate the meaning of hedging against risk•
Objectives
The objectives of this chapter are to:
explore options and their use•
elaboratefinancialfuturesandhedgingagainstrisk•
determine use of forwards and futures•
Learning outcome
At the end of this chapter, you will be able to:
describe stock index futures•
understand principles of forward and futures contracts•
determine forward and futures valuation•

Financial Institutions and Financial Markets
108
7.1 Hedging Against RiskInvestments based on some underlying assets are known as derivatives. The capital invested is less than the price oftheunderlyingasset.Thiscreatesfinancialleverageandallowsinvestorstomultiplytherateofreturnontheunderlying asset. Because of this leverage, derivatives have several uses such as speculative or taking an advantage overspecificprofitopportunityandhedgingaportfolioagainstaspecificrisk.
Participantsinderivativemarketsownportfoliosoffinancialsecurities,whichmustbetakenintoconsiderationwhen understanding impact of any particular derivatives transaction. Any derivatives transaction involves cash flows,whicharemoreorlessoppositetothecashflowsgeneratedbytheothersecuritiesintheportfolio.Whenthetwosetsofcashflowsmovesintheoppositedirection,itisahedge.Whenthetwosetsofcashflowsmovesinthe same direction, it is a speculative position. This is why speculative trades increase risk exposure, while hedging reduces risk exposure.
Hedgingensurescounterbalancingcashflows,whichreducedispersionofpossibleoutcomesandthereforereducestherisk.Conversely,byaddingmorecashflows,whichmoveinthesamedirection,speculatingincreasesprofitwhen outcomes are favourable, but increases losses when outcomes are unfavourable. Thus the risk is increased. The underlying cash position is the twin transaction that is undertaken simultaneously with the derivatives trade. The underlying cash position motivates the hedge transaction. If the underlying cash position consists of only one financialsecurity,thenitiscalledmicrohedge.Iftheunderlyingcashpositionconsistsofaportfoliooffinancialsecurities, then it is called macrohedge.
Macrohedgingisprevalentinfinancialinstitutionsthaninnon-financialcompanies,whichmaybehedgingonlyasinglefinancialsecurityontheirbalancesheets.Thehedgeisalwaystailoredtothehedger’sunderlyingcashposition.Thehedger’scashflowsaswellashisgoalswilldeterminetheconfigurationofthederivativestransaction.
7.2 Description of Derivatives MarketsThe establishment andgrowthoffinancial derivativesmarkets has beenmajor development trend infinancialmarketsoverthepastthirty-fiveyears.Financialinnovationandincreasedmarketdemandledtoarapidgrowthofderivativestrading.Developmentoffinancialderivativeswasspeededupbytheglobalisationofbusiness,theincreasedvolatilityofforeignexchangerates,andincreasingandfluctuatingratesofinflation.
In general derivatives contracts promise to deliver underlying products at some time in the future or give the right to buy or sell them in the future. They can be based on different types of assets (such as equities or commodities), prices (such as interest rates or exchange rates), or indexes (such as a stock-market index).
The derivative contract can then be traded in a different market from that in which the underlying product (equity, bonds and currency) is itself traded. Markets in which underlying products are traded (such as the forex market) are often referred to as cash markets to distinguish them from derivatives markets. Although cash and derivatives markets are separate, the derivatives markets are linked to cash markets through the possibility that a delivery of the underlying product might be required.
There is a close relationship between the prices of derivatives contracts and the prices of the underlying assets they represent,andthatthevalueofaderivative,andhenceitsprice,variesasthepriceinthecashmarketfluctuates.However, in practice, derivatives seldom lead to the exchange of the underlying product. Instead, contracts are closed out or allowed to lapse before the delivery date arrives.
Forportfoliomanagerschangeoftheriskprofilethroughderivativetransactionstakesaverylowcost.Withoutderivatives, portfolio managers have to conduct transactions in the underlying cash markets (i.e., money, bond, or equity markets) at a higher cost, including the costly transfer of securities. Thus, the dynamic growth of hedge funds can be explained by the rise of low-cost derivatives markets. Hedge funds typically exploit small price differences ofsimilarfinancialproducts.Onlywhenthetransactioncostissmallerthanthepricedifferential,thenhedgefundtakes a position. The types of derivatives include:

109
Options•Forwards•Futures•Swap contracts•Various forms of bonds•
A forward contract gives the holder the obligation to buy or sell a certain underlying instrument (like a bond) at acertaindateinthefuture(i.e.,thedeliveryorfinalsettlementdate)andataspecifiedprice(i.e.,thesettlementprice). Forward contracts consist of futures and swaps. Futures contracts are forward contracts traded on organised exchanges.Swapsareforwardcontractsinwhichcounterpartiesagreetoexchangestreamsofcashflowsaccordingto predetermined rules. For example, an interest-rate swap is a derivative in which one party exchanges a stream ofinterestpaymentsforanotherparty’sstreamofcashflows.Themostimportantdifferencewithoptionsisthatoptions give the holder the right (but not the obligation) to buy or sell a certain underlying instrument at a certain dateinthefutureataspecifiedprice.
Derivatives are traded on organised exchanges or over-the-counter (OTC) market. Derivatives contracts traded and privately negotiated directly between two parties belong to the OTC market, generally interest-rate linked derivatives, like swaps and forward-rate agreements. All contract terms, such as delivery quality, quantity, location, date, and price, are negotiable in it. The total value of derivative contracts outstanding in global OTC markets is substantially higher than the exchanges-traded amount. A trend is a provision of standard contracts, which makes it easier for more participants to access the OTC markets.
Besides, OTC trades are increasingly being cleared through clearinghouses in much the same way as exchange-based contracts. Derivative contracts like futures and options, which are traded in organised exchanges are generally standardised, based on electronic trading. The traditional distinction between exchange-based and OTC derivatives is becoming less clear.
7.3 Forward and Futures ContractsForward and future contracts depend upon various factors which are explained in the paragraphs given below.
7.3.1 Principles of Forward and Futures ContractsA futures contract is a legally binding commitment to buy or sell a standard quantity of a something at a price determinedinthepresent(thefuturesprice)onaspecifiedfuturedate.Thebuyeriscalledthelongandtheselleriscalled the short. Futures contracts are “zero sum games”. The forward contract is a private agreement between the two parties and nothing happens between the contracting date and the date of delivery.
Forwards and futures contracts markets include diverse instruments on:Currencies•Commodities•Interest rate futures•Short-term deposits•Bonds•Stock futures•Stock index futures•Single stock futures (contract for difference)•
Thereisnomoneyexchangedwhenthecontractissigned.Toensurethateachpartyfulfilsitscommitments,amargin deposit is required. The exchanges set a minimum margin for each contract and revise it periodically. Margin isdetermineddependingupontheriskoftheindividualcontractFuturespricesfluctuateeveryday.Thereforeallcontract positions are marked to market at the end of every day. If net price movements result in gain on a position of the previous day, the customer immediately receives cash in the amount of the gain and vice versa. If there is a loss; the customer must cover the loss as soon as a customer’s account falls.

Financial Institutions and Financial Markets
110
The main economic function of futures is to provide a means of hedging. A hedger seeks to reduce an already existing risk.Thisriskreductioncouldbeachievedbytakingafuturespositionthatwouldprovideprofitintheeventofalossontheunderlyingposition(andalossinthecaseofaprofitontheunderlyingposition).
Long hedge: A long anticipatory hedge generally involving buying futures contracts in anticipation of spot •purchase.Short hedge: A short hedge involves selling futures contracts to cover the risk on a position in the spot market. •This is the most common use of hedging in investment management.
The most common products underlying futures contracts are foreign currencies (exchange rates), interest rates on notional amounts of capital, and stock exchange indices. The futures contracts are themselves tradable that is, they can be bought and sold in futures markets. To increase their tradability, futures contracts are standardised in terms of both time period and amount. They specify the quantity and quality of the underlying product, the agreed price and the date of delivery.
Theprocedureofmarking tomarketof futurescontract,which implies that allpotentialprofitsand lossesareimmediately realised, is the basis for the key difference between the forward and future contracts. A forward contract may or may not be marked to market. Where the counterparties are two high-credit-quality entities, the two parties may agree not to mark positions to market.
However, if one or both of the parties are concerned with the counterparty risk of the other, then positions may be markedtomarket.Whenaforwardcontractisnotmarkedtomarket,thentherearenointerimcashflows.Becausethere is no clearinghouse that guarantees the performance of a counter party in a forward contract, the parties to a forward contract are exposed to counterparty risk, the risk that the other party to the transaction will fail to perform. Whenhedgingthespecifiedsourceofrisktwoquestionshavetobeanswered:
Which contract should be used?•What amount should be hedged?•
Theanswertothefirstquestiondependsuponthesourceofrisk,whichwilldictatetheuseofsomespecificstockmarket index, interest rate or currency contract. The answer to the second question depends upon optimal hedge ratio to be used. The hedge ratio is the ratio of the size of the (short) position to be taken in futures contract to the size of the exposure (the value of the portfolio to be hedged).
Hedge ratio = (Number of contracts x Size x Spot price ) / V
Where, V is the market value of the underlying asset position. The number of contracts to be sold if hedge ratio, that is to be implemented, is known can be derived from this equation:
N = Hedge ratio x V / ( Size x Spot price)
Example,Assume the manager of a futures fund has 1000000 Euro. The fund manager buys FTSE 100 futures relating to 1000000 of shares when the FTSE 100 stands at 5000.The futures mature in one year.
Let’s determine the key characteristic of the contract. The number of futures contracts bought will be equal:1,000,000/(5000 x 10) = 20 contracts
Does any of the 1000000Euro need to be used in the purchase of the futures? Yes, the initial margin must be provided. The approximate capital gain on the fund over a year, if the FTSE 100 rises by 7%, will be equal to 7% (minus thenetcostofcarry).Inordertofindthetotalreturnonthefund,interestonthemoneyondepositplusinterestonmaintenance margin (i.e., interest on approximately 1,000,000) should be added to the capital gain.

111
7.3.2 Forward and Futures ValuationValuations of all derivative models are based on arbitrage arguments. This involves developing a strategy or a trade wherein a package consisting of a position in the underlying (that is, the underlying asset or instrument for thederivativecontract)andborrowingorlendingsoastogeneratethesamecashflowasthederivative.Thevalueof the package is then equal to the theoretical price of the derivative. If the market price of the derivative deviates from the theoretical price, then the actions of arbitrageurs will drive the market price of the derivative toward its theoretical price until the arbitrage opportunity is eliminated.
The pricing of futures and forward contracts is similar. If the underlying asset for both contracts is the same, the difference in pricing is due to differences in features of the contract that must be dealt with by the pricing model. A futures price equals the spot (cash market) price at delivery, though not during the life of the contract. The difference between the two prices is called the basis:
Basis = Futures price – Spot price = F – S
The basis is often expressed as a percentage of the Spot price (discount or premium) = Percentage basis = (F–S) / S
Futures valuation models determine the theoretical value of the basis. This value is constraint by the existence ofprofitablerisklessarbitragebetweenthefuturesandspotmarketsfortheasset.Inawell-functioningmarket,when arbitrageurs implement their strategy by selling the futures and buying underlying asset, this would force the futurespricedownsothatatsomepriceforthefuturescontract,thearbitrageprofitiseliminated.Thisstrategythatresultsinthecapturingofthearbitrageprofitisreferredtoasacash-and-carrytrade.Thereasonforthisnameisthat implementation of the strategy involves borrowing cash to purchase the underlying asset and “carrying” that underlying asset to the settlement date of the futures contract.
In general, the formula for determining the theoretical price of the contract, assuming that lending and borrowing ratesareboththesameandequaltofinancingcost,andthatthereisnomargin,becomes:
Theoretical futures price = Spot price + (Spot price) x (Financing cost - Cash yield)
Wherefinancingcostistheinterestratetoborrowfunds,cashyieldisthepaymentreceivedfrominvestingintheasset (e.g., dividend) as a percentage of the cash price.
Example,Assumethattheunderlyingassetpriceis100Euro,financingcostis1%andcashyieldis2%.Thenthetheoreticalfuturespriceis:100Euro+[100Euro×(1%−2%)]=99Euro
Thefuturepricecanbeaboveorbelowthespot(cash)pricedependingonthedifferencebetweenthefinancingcostandcashyield.Thedifferencebetweentheseratesiscalledthecostofcarryanddeterminesthenetfinancingcost.Positivecarrymeansthatthecashyieldexceedsthefinancingcost,whilethedifferencebetweenthefinancingcostand the cash yield is a negative value.
Negativecarrymeansthatthefinancingcostexceedsthecashyield.Zerofutureshappenwhenthefuturespriceisequal to the spot (cash) price. At the settlement date of the futures contract, the futures price must equal the spot (cash market) price. The reason is that a futures contract with no time left until delivery is equivalent to a spot (cash market) transaction. Therefore, as the delivery date approaches, the futures price is converging to the spot (cash market)price.Thishappensasfinancingcostandtheyieldthatcanbeearnedbyholdingtheunderlyingasset,andfinallythecostofcarry,approacheszero,whenthedeliverydateapproaches.
However, the borrowing rate is usually higher than the lending rate. The impact of this difference is important when definingtheoreticalfuturesprice.Inthecash-and-carrytrade,thetheoreticalfuturespricebasedonborrowingratebecomes.
Theoretical futures price = Spot price + (Spot price) ×(Borrowing rate -Cash yield)

Financial Institutions and Financial Markets
112
In the reverse cash-and-carry trade, the theoretical futures price based on lending rate becomes:Theoretical futures price = Spot price + (Spot price)×(Lending rate - Cash yield)
Both equations together provide a band between which the actual futures price can exist without allowing for an arbitrageprofit.Thefirstequationestablishes theuppervaluefor thebandwhile thesecondequationprovidesthe lower value for the band. The reverse cash-and-strategy trade requires the short selling of the underlying. It is assumed in this strategy that the proceeds from the short sale are received and reinvested. In practice, for individual investors, the proceeds are not received, and, in fact, the individual investor is required to deposit margin (securities margin and not futures margin) to short sell. For institutional investors, the underlying may be borrowed, but there is a cost to borrowing. This cost of borrowing can be incorporated into the model by reducing the cash yield on the underlying.
For strategies applied to stock index futures, a short sale of the components stocks in the index means that all stocks intheindexmustbesoldsimultaneously.Thismaybedifficulttodoandthereforewouldwidenthebandforthetheoretical future price. For valuation of stock index futures the fair value premium is used. The excess of the fair futures price over the spot (i.e., actual) stock index is called the fair value premium. The formula for the fair value premium is:
FP = I x [{(r - y)/100}x{d/365}]
Where FP is the fair value premium, I is the spot FTSE 100 Index, r is the interest rate, y is the expected percentage dividend yield on the index portfolio, and d is the number of days to maturity of the futures contract.
Short cash and carry involves selling the borrowed stock and buying futures. In this case, the excess of interest overdividendsisanetinflowandthisgainshouldbematchedbyhavingaguaranteedfuturepurchasepricethatexceedsthespotsalepricebytheamountofthisnetinflow.Themoneyfromthestocksaleisputondeposit.Inthe case of short selling, the borrower of the stock must pay sums equivalent to the dividends to the lender of the stock.Theexcessofinterestoverdividendsisanetinflowthatshouldbematchedbyacapitallossguaranteedbythe futures price.
7.3.3 Use of Forwards and FuturesGoing long or short in futures market without any offsetting position is described as taking a speculative position. In a futures hedge an investor offsets a position in the cash (spot) market with a nearly opposite position in the futures market. The objective is to reduce the overall risk position. The hedged position has lower expected return than an unhedged position. In a long hedge the investor takes a long position in futures. In a short hedge the investor takes a short position in futures. A very important type of hedge occurs when an investor with the long position in the spot market simultaneously take a short position in the futures contracts.
Inshorthedgingthehedgermaybeabletofindafuturescontractforavirtuallyidenticalitemashedgerscash(spot)position. Then the gains (losses) in the spot market are offset by the gains (losses) in the futures market. This offset is shown in the Fig. 7.1 below.

113
Short Futures
Long Spot
Hedge P 0
Prof
it
Los
s
Fig. 7.1 Profit profile for perfect hedge
TheFig.7.1providesprofitprofiles.Assume,theinvestorgoeslonginthespotmarketat50Euro.Asthespotpriceincreases(decreases)theinvestorgains(loses)exactlythesameamount.Theprofitprofileforaspotpositionisoffsetexactlybytheshortfuturesposition.Profitprofileforthenetpositionisahorizontalline,indicatingnochangeinthevalueofthenetpositionasthespotpricechanges.Flatprofilerepresentsaperfecthedge.
However most often identical or similar future contracts do not exist. In this situation, the hedger must utilise a short position in a similar, but different asset. This is called a cross hedge. The relationship between a spot position and afuturescontractinacrosshedgeisnotaperfectstraightline.Itisshownasadottedlineinthefigurebelow.Hereit is assumed that the investor takes a long position in the spot market in grade A investment assets, and offsets by taking short position in the futures market in grade B investment assets. Grade B asset prices are assumed to move halfasfastasgradeAassetprices.TheFig.7.2showsprofitprofileforlongspotgradeaninvestmentasset,shortfutures grade B investment assets and the net position. The gains and losses on the spot position are cut in half for grade A investment assets by the short hedge.
Short Futures: Grade B
Long Grade A
Hedge P
Prof
it
Los
s
Hedge
0
Fig. 7.2 Profit profile for a cross hedge
Thehedger can estimate the slopeof the line (β) byusing regression analysis in order tofind the best-fittingrelationship.Foreveryunitofthespotasset(cashmarket),thehedgershortsβunitsofthefutures.βiscalledtheoptimal hedge ratio.

Financial Institutions and Financial Markets
114
The optimal hedge ratio is not a perfect hedge, because the link between the spot and futures is not perfect. The optimal hedge ratio is the best in the sense that the expected change in the hedged position is zero.
7.3.4 Futures Contracts: Stock Index FuturesFor stock index futures the deliverable commodity (underlying asset) is a common stock index. Some stock index futures are actively traded contracts. The stock index future price depends upon the value of the stocks in the index, the dividends on these stocks and the interest rate until the delivery date on the futures contract.
Arbitrage ensures that the futures contract should be equivalent of a buying the stock in the index, borrowing the funds for this purchase, paying interest on the borrowed funds at the delivery date, and receiving any dividends.
F stock = P stock (1 + rd) d – Div
When, Pstock - is the current market value of stocks in the index, r – the spot interest rate from now until delivery date, Div – amount of dividends on these stocks. Unless the futures price is equal to Pstock (1 + rd )
d – Div, arbitrage occurs.Thisarbitrageiscalledprogramtrading.Thefigurebelowillustratesthecase,whenthefuturespriceisabove Pstock (1 + rd)
d – Div.
Actual futures Arbitrage profit
Theoretical futures
Spot price
Time
Price
Fig. 7.3 Program trading arbitrage
This arbitrage is to take short position in futures and buy the stocks in the index. The arbitrage position is held until thefuturesandspotpricesareoncemoreinline.Bothpositionsareclosedforprofit.Suchtypeofarbitrageinvolvesthe purchase and sale of large number of stocks in the index. In order to uncover the arbitrage opportunity initially, a computer program is needed. Afterwards, the buy or sell orders for a large number of stocks must be executed rapidlybycomputerprogrambeforethearbitrageprofitopportunitydisappears.
7.3.5 Contracts for Difference (CFD)A contract for difference (CFD) is an instrument that has similarities with a futures contract. Frequently it is related to a particular stock, but could relate to any marketable asset (or even non-marketable instruments such as stock indices).CFDcontractsdonothavefixedexpirydatesandcanbeclosedatanytime.ACFDisadealbetweenaninvestor and a broker. The investor is expected to pay a deposit (typically 10% of the value of the shareholding to which the CFD is related). If losses are made from the transaction, the broker takes cash from the deposit (margin) and the investor is required to provide more cash in order to maintain the value of the deposit at 10%. If the position makesaprofit,theinvestorreceivescash.

115
AninvestorwhotakesalongpositioninaCFDrelatingtoasharewouldprofitfromasharepricerise,andloseintheeventofasharepricefall.Theprofitsorlosseswouldbecalculatedbyreferencetoaspecifiedshareprice(typically slightly above the share price when the contract was entered into; the offer price of the share might be used).Ifthesharepricewereabovethespecifiedprice,therewouldbeaprofitequaltothedifferencebetweenthecurrentpriceandthespecifiedprice.
Conversely,therewouldbealossequaltotheextenttowhichthecurrentstockpriceisbelowthespecifiedprice.An investor with a long CFD is treated as if the shares are bought with borrowed money and the broker can do in the absence of offsetting short positions. The investor pays interest and receives dividends.
AninvestorwhotakesashortpositioninaCFDprofitsfrompricefallsandlosesfrompricerises.Theextentofprofitorlossisbasedonthedifferencebetweenthecurrentsharepriceandasharepriceslightlybelowtheshareprice at the time that the contract was entered into. The bid price of the share might be used also. An investor with a short CFD is treated as if the shares are sold short and the receipts are put on deposit. The investor receives interest and pays sums equal to the share dividends. Bid/offer prices might be quoted.
Potential losses are very large in the event of prices moving heavily against the anticipations of an investor. The use of stop-loss order ensures automatic closure of a position in the event of a price movement beyond a particular level. However, there is a risk that the price movement is so rapid, that closure occurs only after the price has moved significantlybeyondthechosenstop-lossprice.Abroker,whoisprovidingCFDs,cantakecorrespondingpositionsin the share.
However, if a broker has investors on both the long and short sides, the need to take positions in the share is reduced sincethecashflowsoflongandshortinvestorswouldmatcheachother.Someconcernhasbeenexpressedthatifinvestors use CFDs as a substitute for share purchases, liquidity is taken from the stock market. Although brokers take offsetting positions in the stock market, liquidity is reduced to the extent that there is matching between long and short positions. By using CFDs investors can obtain leveraged investments or short positions on a share (or other instrument).An almost identical alternative to CFDs is spread betting.
7.4 SwapsA swap is an agreement whereby two parties (called counterparties) agree to exchange periodic payments. The cash amount of the payments exchanged is based on some predetermined principal amount, which is called the notional principal amount or simply notional amount. The cash amount each counterparty pays to the other is the agreed-upon periodic rate times the notional amount. The only cash that is exchanged between the parties are the agreed-upon payments, not the notional amount.
A swap is an over-the-counter (OTC) contract. Hence, the counterparties to a swap are exposed to counter party risk. Swap can be decomposed into a package of derivative instruments, e.g., a package of forward contracts. However, its maturity can be longer than that of typical forward and futures contracts, it is negotiated separately, can have quite high liquidity (larger than many forward contracts, particularly long-dated (i.e., long-term) forward contracts). Thetypesofswapstypicallyusedbynon-financecorporationsare:
Interest rate swaps•Currency swaps•Commodity swaps•Credit default swaps•

Financial Institutions and Financial Markets
116
Interest rate swap is a contract in which the counterparties swap payments in the same currency based on an interest rate.Forexample,oneofthecounterpartiescanpayafixedinterestrateandtheotherpartyafloatinginterestrate.Thefloatinginterestrateiscommonlyreferredtoasthereferencerate.Currencyswapisacontract,inwhichtwoparties agree to swap payments based on different currencies.
Commodity swap is a contract, according to which the exchange of payments by the counterparties is based on the value of a particular physical commodity. Physical commodities include precious metals, base metals, natural gas, crude oil, food. A credit default swap (CDS) is an OTC derivative that permits the buying and selling of credit protection against particular types of events that can adversely affect the credit quality of a bond such as the default of the borrower.
Although it is referred to as a ‘swap’, it does not have the general characteristics of a typical swap. There are two parties in the CDS contract: the credit protection buyer and credit protection seller. Over the life of the CDS, the protectionbuyeragreestopaytheprotectionsellerapaymentatspecifieddatestoinsureagainsttheimpairmentofthedebtofareferenceentityduetoacredit-relatedevent.Thereferenceentityisaspecificissuer.Thespecificcredit-relatedeventsareidentifiedinthecontractthatwilltriggerapaymentbythecreditprotectionsellertothecredit protection buyer are referred to as credit events. If a credit event does occur, the credit protection buyer only makes a payment up to the credit event date and makes no further payment. At this time, the protection buyer is obligatedtofulfilitsobligation.Thecontractwillcallfortheprotectionsellertocompensateforthelossinthevalue of the debt obligation.
7.5 OptionsThis section explains the different aspects of options.
7.5.1 Options DefinitionAn option is a contract in which the option seller grants the option buyer the right to enter into a transaction with thesellertoeitherbuyorsellanunderlyingassetataspecifiedpriceonorbeforeaspecifieddate.
Options,likeotherfinancialinstruments,maybetradedeitheronanorganisedexchangeorintheover-the-counter(OTC)market.Thespecifiedpriceiscalledthestrikepriceorexercisepriceandthespecifieddateiscalledtheexpiration date. The option seller grants this right in exchange for a certain amount of money called the option premium or option price. The option seller is also known as the option writer, while the option buyer is the option holder.
The asset that is the subject of the option is called the underlying. The underlying can be an individual stock, a stock index, a bond, or even another derivative instrument such as a futures contract. The option writer can grant the option holder one of two rights. If the right is to purchase the underlying, the option is a call option. If the right is to sell the underlying, the option is a put option.
Calloptions:Optionsthatgivetherighttobuyagivenamountofafinancialinstrumentorcommodityatan•agreedpricewithinaspecifiedtimebut,likealloptions,donotobligeinvestorstodoso.Putoptions:Optionsthatgivetherighttosellagivenamountofafinancialinstrumentorcommodityatan•agreedpricewithinaspecifiedtime,butthatdonotobligeinvestorstodoso.
An option can also be categorised according to when it may be exercised by the buyer or the exercise style:European option can only be exercised at the expiration date of the contract.•American option can be exercised any time on or before the expiration date.•Bermuda option or Atlantic option is an option which can be exercised before the expiration date but only on •specifieddatesiscalled.

117
The terms of exchange are represented by the contract unit and are standardised for most contracts. The option holder enters into the contract with an opening transaction. Subsequently, the option holder then has the choice to exercise or to sell the option. The sale of an existing option by the holder is a closing sale.
Aprofitprofileforacalloptionisprovidedinthefigurebelow.Supposeaninvestorisbuyingabond,whichiscurrently selling at its exercise price of 100 Euro, and holds this bond for three months until the option expires. Possibleprofitsorlosseswillbeonthesolidline.Ifacalloptioncosts4Euro,thiswillbethemaximumlossforacalloptionbuyer.Ifthebondpriceatexpirationisabovetheexercise,theprofitequalsP–E–4Euro.
100 E
104
Write call Buy call
Buy underlying security
Underlying asset at expiration
Profit
+ 4
0
Loss
Fig. 7.4 Profit profiles for a call option
Themaximumprofitthattheoptionwritercanrealiseistheoptionprice.Theoptionbuyerhassubstantialupsidereturn potential, while the option writer has substantial downside risk. The described call option is called a naked call option. This is a risky position because the potential of loss is unbound.
Another less risky contract is writing a covered call. Such a contract involves the purchase of the underlying security andthewritingofacalloptiononthatsecurity.ProfitprofileforthecoveredcallisshownintheFig.7.5.Ifacalloptionisprofitable,thenitisexercisedandthecoveredcallwritermustselltheunderlyingsecurityattheexerciseprice (100 Euro). The maximum gain is 4 Euro, i.e., the original sale price of the call option. If the call option isunprofitable,thecoveredcalloptionwriterreceives4Euroforwritingthecall,andthisreducesthelossfromowning the underlying security.
The purchase of a call option creates a position referred to as a long call position. The writer of a call option is said tobeinashortcallposition.Thebuyingofaputoptioncreatesafinancialpositionreferredtoasalongputposition.Theprofitorlossforthispositionattheexpirationdatedependsonthemarketpriceoftheunderlyingasset.Aswithalllongoptionpositions;thelossislimitedtotheoptionprice.Theprofitpotential,however,issubstantial:Thetheoreticalmaximumprofitisgeneratedifasset’spricefallstozero.
Writingaputoptioncreatesapositionreferredtoasashortputposition.Theprofitandlossprofileforashortputoptionistheoppositeofthelongputoption.Themaximumprofitfromthispositionistheoptionprice.

Financial Institutions and Financial Markets
118
E
Write covered call
Buy underlying security
Underlying asset at expiration
Profit
Loss
0
C
Fig. 7.5 Profit profile for writing a covered call option
The theoretical maximum loss can be substantial, if the price of the underlying falls. If the price falls to zero, the loss wouldbeaslargeastheexercisepricelesstheoptionprice.Fig.7.6graphicallyshowsthisprofitandlossprofile.
Profit
Buy put
Loss
– pp
97
100
E
Underlying asset at expira tion
Fig. 7.6 Profit profile for a put option
To summarise, buying calls or selling puts allows the investor to gain if the price of the underlying asset rises. Selling calls and buying puts allows the investor to gain if the price of the underlying asset falls.

119
7.5.2 Components of the Option PriceThe theoretical price of an option is made up of two components:
Intrinsic value•Premium over intrinsic value•
The intrinsic value is the option’s economic value if it is exercised immediately. If no positive economic value would result from exercising immediately, the intrinsic value is zero. For a call option, the intrinsic value is the difference between the current market price of the underlying and the strike price. If that difference is positive, then the intrinsic value equals that difference; if the difference is zero or negative, then the intrinsic value is equal to zero.
Intrinsicvalueofanoption:Theprofitavailablefromimmediatelyexercisinganoption.Wherethevalueoftheright granted by the option is equal to the market value of the underlying instrument (the intrinsic value is zero), the option is said to be at-the-money. If the intrinsic value is positive, the option is in-the-money. If exercising an option would produce a loss, it is out-of-the-money.
For a put option, the intrinsic value is equal to the amount by which the underlying’s market price is below the strike price. Time premium of an option, or time value of the option, is the amount by which the option’s market price exceeds its intrinsic value. It is the expectation of the option buyer that at some time before the expiration date the changes in the market price of the underlying asset will increase the value of the rights of the option. Because of this expectation, the option buyer is willing to pay a premium above the intrinsic value.
Anoptionbuyerhastwowaystorealisethevalueofanoptionposition.Thefirstwayisbyexercisingtheoption.The second way is to sell the option in the market.
Put-call parity relationshipFor a European put and a European call option with the same underlying, strike price, and expiration date, there is a relationship between the price of a call option, the price of a put option, the price of the underlying, and the strike price. This relationship is known as the put-call parity relationship. The relationship is equal to:
Putoptionprice−Calloptionprice=Presentvalueofstrikeprice+Presentvalueofcashdistribution−Priceofunderlying asset
Put-call parity implies that:Call option price >= Put option price - Lending present value of exercise price
The value put option price: Lending present value of exercise price has been called Merton’s lower bound. It followsthatthecashflowsfrombuyingacalloptioncanneverbelessthanbuyingtheunderlyingsecurityandborrowing the underlying value of the exercise price. Merton’s bound is illustrated in the Fig. 7.8. As the price of the underlying asset rises, the value of the call approaches Merton’s bound, and consequently, the value of a put gets very small. When the price of the underlying asset is small, the value of the call option is small, and the value of a put becomes large.

Financial Institutions and Financial Markets
120
Shortsell Call price
Price of underlying asset
E
$ Merton’s bound: P – ED
Fig. 7.7 Merton‘s bound
7.5.3 Determinants of the Option PriceThe factors that affect the price of an option include:
Market price of the underlying asset.•Strike (exercise) price of the option.•Time to expiration of the option.•Expected volatility of the underlying asset over the life of the option.•Short-term, risk-free interest rate over the life of the option.•Anticipated cash payments on the underlying over the life of the option.•
The impact of each of these factors may depend on whether:the option is a call or a put•the option is an American option or a European option•
Market price of the underlying assetThe option price will change as the price of the underlying asset changes. For a call option, as the underlying asset’s price increases (all other factors being constant), the option price increases. The opposite holds for a put option, i.e., as the price of the underlying increases, the price of a put option decreases.
Exercise (strike) priceTheexercisepriceisfixedforthelifeoftheoption.Allotherfactorsbeingequal,thelowertheexerciseprice,thehigher the price for a call option. For put options, the higher the exercise price, the higher the option price.

121
Time to expiration of the optionAfter the expiration date, an option has no value. All other factors being equal, the longer the time to expiration of the option, the higher the option price. This is because, as the time to expiration decreases, less time remains for the underlying asset’s price to rise (for a call buyer) or fall (for a put buyer), and therefore the probability of a favourable price movement decreases. Consequently, as the time remaining until expiration decreases, the option price approaches its intrinsic value. The impact of longer remaining life is shown in Fig. 7.8.
C2 has a longer life than C 1 Merton’s bound is higher for C 2 because D 2 < D 1
C
P
C2
P – ED 2
P – E
C1
P – ED 1
E
Fig. 7.8 Impact of longer remaining life on the value of a call option
C2
P E
C P – ED
C1
C2 has greater volatility of underlying asset
P – E
Fig. 7.9 Impact of the volatility of the underlying asset on the value of a call option
Expected volatility of the underlying asset over the life of the optionAll other factors being equal, the greater the expected volatility (as measured by the standard deviation or variance) of the underlying, the more the option buyer would be willing to pay for the option and the more an option writer would demand for it. This occurs because the greater the expected volatility, the greater the probability that the movementoftheunderlyingwillchangesoastobenefittheoptionbuyeratsometimebeforeexpiration.

Financial Institutions and Financial Markets
122
C’ C
C
P
C’ has a higher interest rate
P – ED’
P – ED
P – E
Fig. 7.10 Impact of higher interest rate on value of call option
Short-term, Risk-free interest rate over the life of the optionBuying the underlying asset requires an investment of funds. Buying an option on the same quantity of the underlying makes the difference between the underlying’s price and the option price available for investment at an interest rate at least as high as the risk-free rate. Consequently, all other factors being constant, the higher the short-term, risk-free interest rate, the greater the cost of buying the underlying asset and carrying it to the expiration date of the call option. Hence, the higher the short-term, risk-free interest rate, the more attractive the call option will be relative to the direct purchase of the underlying. As a result, the higher the short-term, risk-free interest rate, the greater the price of a call option. Anticipated cash payments on the underlying over the life of the option cash payments on the underlying tend to decrease the price of a call option. The cash payments make it more attractive to hold the underlying than to hold the option. For put options, cash payments on the underlying tend to increase the price.
7.5.4 Option Pricing ModelsAn option pricing model uses a set of assumptions and arbitrage arguments to derive a theoretical price for an option. Deriving a theoretical option price is much more complicated than deriving a theoretical futures or forward price because the option price depends on the expected volatility of the underlying over the life of the option. Several models have been developed to determine the theoretical price of an option. The most popular one was developed by Fischer Black and Myron Scholes (1973) for valuing European call options on common stock.
7.5.5 Mixed Strategies in Options TradingCallandputoptionsandthebuyingandwritingofoptionscanbecombinedtotrytoprofitfromexpectedconditionsin the market. Some of such strategies are as follows:
Cases where a trader either buys or writes options but does not do both•Straddle a call and a put at the same strike price and expiry date•Strangle a call and a put for the same expiry date but at different strike prices•Strap two calls and one put with the same expiry dates; the strike prices might be the same or different•Strip two puts and one call with the same expiry date; again strike prices might be the same or different•

123
In general, the buyer of these options is hoping for market prices to move sharply but is uncertain whether they will rise or fall. The buyer of a strap gains more from a price rise than from a price fall; the buyer of a strip gains more from a price fall. The writer in all four cases is hoping that the market will remain stable, with little change in price during the life of the option.
Spreads: Combinations of buying and writing options.•Butterfly:Buyingtwocalloptions,onewithalowexerciseprice,theotherwithahighexercisepriceandwriting•two call options with the same intermediate strike price or the reverse.Condor: Similar to a butterfly, except that the call optionswhich arewritten have different intermediate•prices.
Bothabutterflyandacondorareverticalspreadsalloptionsboughtorsoldhavethesameexpirydatebutdifferentstrike prices. Horizontal spreads have the same strike prices but different expiry dates. With diagonal spreads both the strike prices and the expiry dates are different. Other mixed strategies have equally improbable names. They include vertical bull call; vertical bull spread; vertical bear spread; rotated vertical bull spread and rotated vertical bear spread.
7.6 Depository SystemDepository is an organisation or a system where securities/shares are held in electronic form. A depository is similar to a bank. The bank transfers money without handling money. A depository transfers securities/shares without handling securities/share. A bank facilitates safe keeping of money. The depository facilitates safe keeping of securities/shares. A bank holds funds in an account: The depository holds securities/shares in an account. The bank transfers funds between accounts on the instructions of account holders. The depository transfers securities/shares between accounts on the instruction of account holders. The bank contacts the customer directly. The depository contacts the customer through depository participant: Transfers of shares are made through mere computerised book entry in the depository. This becomes possible because shares are dematerialised. Only those securities which are heldintheformofsharecertificateinonesnamecanbedematerialised.Thedepositoryactsthroughthedepositoryparticipant. It provides its services to investors through its depository participant.
7.6.1 Depository Participant (DP)Depository Participant (DP) is the representative of the depository. Depository participant acts as an intermediary between investors and depositories. An investor has no direct access to the depositories. He has to trade his securities throughthedepositoryparticipant.Thedepositoryparticipantshaveanidentitynumberforidentification.Ithastomaintain accounts of securities of each investor. The depository participant gives intimation about holdings from time to time by sending a statement of holding or giving a pass-book. If an investor desires the services of depository, he has to open an account with depository through depository participant.At present there are two depositories:
National Securities Depository Limited (NSDL)•Central Depository Services Limited (CDSL)•
AccordingtoSEBIguidelinesfinancialinstitutions,banks,stockbrokerscanactasdepositoryparticipant.
Beneficial owner Aninvestorisknownas`beneficialowner’.He,isthepersoninwhosenamedemataccountisopened.Hisnameisrecordedwiththedepository.Heenjoystherightsandbenefitsofamembersuchastogetdividend,togetbonusshares, to vote at meeting.
Issuer CompanyIt is a company which makes an issue of securities. It must register itself with a depository.
DematerialisationItistheprocessinwhichsharecertificatesareconvertedintoelectronicform.

Financial Institutions and Financial Markets
124
FungibilityThesharesindepositoriesarefungible.Theydon’thavedistinctivenumberforidentification.
RematerialisationRematerialisation is the process by which shares in electronic form are reconverted into physical form.
International Securities Identification Number (ISIN)Itisanidentificationnumbergiventoasecurityofanissuercompanyatthetimeofadmittingsuchsecurityinthedepository system.
7.6.2 Need and Importance of Depository SystemDepository system exists in all developed countries. The size of Indian capital market has expanded because of the policy of liberalisation and globalisation adopted by the Government of India in 1991. Foreign investors are expected to play an important role. They place their large funds in Indian industries.
Need for depository arises due to the drawbacks of the conventional system of share transfer while holding shares inphysicalform.Asharecertificateisaproofofownershipofshares.Transferdeedistobeexecutedfortransferof ownership in shares. Registration by the company is required to transfer the share. Stamp duty on the basis of marketvalueistobepaid.Thepresentsystemoftransferofsharesthus,hasthedifficultiessuchasbaddeliveries,morepaperwork,delayedtransfers,loss,ofsharecertificate,forgeriesandfrauds.Toremovethesedifficultiesordrawbacks a new system has been adopted. It is the depository system in which share transfers are electronic.
In electronic transfer, transactions take place much faster than in physical form. It eliminates loss, theft, mutilation and forgery, etc. No stamp duty is to be paid on electronic transfer. Right and bonus shares are distributed fast because of direct credit: There is a facility of creating -charge on dematerialised share for getting loans and advances. There isnolossofsharecertificatebecauseitisstoredelectronically.Paymentcanbemademuchfasteronsaleofshares.Dematerialisation reduces the paper work.
Dematerialisation is optional according to the Companies Act. An investor can hold shares in physical form. But if he wishes to sell his shares, he has to demat the shares. If he wishes to purchase shares he will get delivery of shares in demat form. SEBI has made demat compulsory for traded scrips. Shares are allotted by crediting demat account of investor.

125
SummaryThe need for sophisticated risk management in the face of highly volatile exchange rates provides one of the •principal reasons for the growth of derivatives markets.The principal types of derivatives are futures, forwards, swaps and options.•Futurespromisethedeliveryofanunderlyingassetofaspecifiedkindonagivendate,althoughdeliveryis•seldom made.Options give the right to buy and/or sell an underlying asset, although that right need not be taken up.•In order to increase tradability, futures and options are highly standardised. •Bothofferthepossibilityofveryhighratesofprofit.Futuresdothisthroughthesystemofmarginpayments.•In the case of options, this occurs because buyers of options pay only the premium for the right to trade at the •specifiedprice.Derivative contracts are offered in relation to exchange rates, short-term and long-term interest rates and stock •exchange indices. They are widely used for speculation as well as for risk management. In recent years, options have become extremely complicated, with new forms of options contracts appearing regularly.Forward and futures contracts are likely to provide cheaper protection against loss than options, but remove •theprofitopportunityifpricesmoveinfavourofthefirm.Thus,optionsaregenerallypreferableifthehedgeris uncertain about the direction the price of the underlying asset is likely to move.Ahedgerwhoisconfidentaboutthedirectioninwhichthepricewillmoveismorelikelytochooseforwardor•futures contracts or remain in an open position and accept the risk of a price change.Derivatives markets have been controversial in recent years. Many companies have experienced losses badly •inthesemarkets,andfearsaboutcausingseriousproblemsfortheinternationalfinancialsystemcontinuetobe widespread.Depository system exists in all developed countries.•Depository Participant (DP) is the representative of the depository. Depository participant acts as an intermediary •between investors and depositories.
ReferencesMorck, Randall, Shleifer, A & Robert W. Vishny. 1988. • ManagementOwnershipandMarketValuation:AnEmpiricalAnalysis. Journal of Financial Economics.Myers, & Majluf, 1984. • CorporateFinancingandInvestmentDecisionswhenFirmshaveInformationthatInvestorsdonotHave. Journal of Financial Economics.TheGlobalDerivativesMarketAnIntroduction• . [Pdf] Available at: <http://www.math.nyu.edu/faculty/avellane/global_derivatives_market.pdf> [Accessed 3 June 2014].Finan, B. M., 2014. • ABasicCourseintheTheoryofInterestandDerivativesMarkets:APreparationfortheActuarialExamFM/2.[Pdf]Availableat:<http://faculty.atu.edu/mfinan/actuarieshall/mainf.pdf>[Accessed3June 2014].CFALevel I-DerivativeMarketsandInstruments• . [Video online] Available at: <https://www.youtube.com/watch?v=gxIe2vFK4dE> [Accessed 3 June 2014].Bennett, T., • Whatarederivatives?-MoneyWeekInvestmentTutorials. [Video online] Available at: <https://www.youtube.com/watch?v=Wjlw7ZpZVK4> [Accessed 3 June 2014].
Recommended ReadingSchich, S. & Wehinger, G. 2003. • ProspectsforStockexchanges. Financial market Tends.Shiller, 2003. • FromEfficientMarketstoBehavioralFinance. Journal of Economic Perspectives.Serifsoy, B. & M. Weib, 2007. • SettlingforEfficiency–AFrameworkfortheEuropeanSecuritiesTransactionIndustry. Journal of Banking and Finance.

Financial Institutions and Financial Markets
126
Self AssessmentInvestments based on some underlying assets are known as ______________.1.
derivativesa. hedgingb. riskc. marketd.
Whenthetwosetsofcashflowsmovesintheoppositedirection,itisa__________.2. cashflowa. hedgeb. transactionc. portfoliod.
Whenthetwosetsofcashflowsmovesinthesamedirection,itisa___________.3. derivatives transactiona. a hedgeb. speculative positionc. microhedged.
_______________isprevalentinfinancialinstitutionsthaninnon-financialcompanies,whichmaybehedging4. onlyasinglefinancialsecurityontheirbalancesheets.
Tradinga. Contractb. Transactionc. Macrohedgingd.
A ___________ involves selling futures contracts to cover the risk on a position in the spot market.5. short hedgea. long hedgeb. currenciesc. commoditiesd.
Valuations of all derivative models are based on _______________.6. arbitrage argumentsa. a strategyb. underlying asset or instrumentc. market priced.
Theoretical futures price = ?7. Futures price – Spot price = F – Sa. Spot price + (Spot price) x (Financing cost - Cash yield)b. I x [{(r - y)/100} x{d/365}]c. P d. stock (1 + rd)
d – Div

127
A ______________ is an instrument that has similarities with a futures contract.8. intrinsic valuea. credit default swapb. contract for differencec. over-the-counterd.
Match the following9.
Call options1. A call and a put at the same strike price and expiry date.A.
Put options2. Optionsthatgivetherighttobuyagivenamountofafinancialinstru-B. mentorcommodityatanagreedpricewithinaspecifiedtime.
Straddle3. Optionsthatgivetherighttosellagivenamountofafinancialinstru-C. mentorcommodityatanagreedpricewithinaspecifiedtime.
Strap4. Two calls and one put with the same expiry dates; the strike prices D. might be the same or different.
1-A, 2-D, 3-C, 4-Ba. 1-D, 2-B, 3-A, 4-Cb. 1-C, 2-A, 3-D, 4-Bc. 1-B, 2-C, 3-A, 4-Dd.
______________ is an organisation or a system where securities/shares are held in electronic form.10. Depositorya. Registerb. Fungibilityc. Stamp dutyd.

Financial Institutions and Financial Markets
128
Chapter VIII
Financial Institutions in India
Aim
The aim of this chapter is to:
introducefinancialinstitutionsinIndia•
explain institutional support•
explicate small-industries service institutes•
Objectives
The objectives of this chapter are to:
determine coordination activities of SIDO•
elaborate phase of innovative banking•
analyse small-scale industries board•
Learning outcome
At the end of this chapter, you will be able to:
identify phase of prudential banking since early nineties•
understand small industries development organisation•
determineIndianfinancialsystem•

129
8.1 IntroductionFinancialInstitutionsinIndiaaredividedintwocategories.Thefirsttypereferstotheregulatoryinstitutionsandthe second type refers to the intermediaries. The regulators are assigned with the job of governing all the divisions oftheIndianfinancialsystem.Theseregulatoryinstitutionsareresponsibleformaintainingthetransparencyandthe national interest in the operations of the institutions under their supervision.
Finance is one of the essential requirements of an enterprise. Without adequate funds, no business can be developed. InIndia,Centralandstategovernmentsarepromotingnumberoffinancialinstitutionstobringintheindustrialdevelopmentinthecountry.Someoftheimportantfinancialinstitutionsare:
Industrial Development Bank of India (IDBI)•National Bank for Agriculture and Rural Development (NABARD)•Export Import Bank of India•Small Industrial Development Bank of India (SIDBI)•Industrial Investment Bank of India•Industrial Finance Corporation of India (IFCI)•Industrial Credit and Investment Corporation of India (ICICI)•Industrial Reconstruction Bank of India•Indian Banking System and Commercial Banks•State Financial Corporations•Life Insurance Corporation of India (LIC)•Unit Trust of India (UTI)•
8.2 Institutional SupportThe list of various State and Central Government agencies supporting small-scale industries activities and functions are discussed in the following sections.
8.2.1 National Small Industries Corporation (NSIC)The National Small Industries Corporation (NSIC), an enterprise under the union ministry of industries was set up in 1955 in New Delhi to promote aid and facilitate the growth of small- scale industries in the country. NSIC offers apackageofassistanceforthebenefitofsmall-scaleenterprises.
Single point registration: Registration under this scheme for participating in government and public sector •undertaking tenders.Informationservice:NSICcontinuouslygetsupdatedwiththelatestspecificinformationonbusinessleads,•technology and policy issues.Rawmaterialassistance:NSICfulfilsrawmaterialrequirementsofsmall-scaleindustriesandprovidesraw•materialonconvenientandflexibleterms.Meeting credit needs of SSI: NSIC facilitate sanctions of term loan and working capital credit limit of small •enterprise from banks.Performance and credit rating: NSIC gives credit rating by international agencies subsidised for small enterprises •up to 75% to get better credit terms from banks and export orders from foreign buyers.Marketing assistance programme: NSIC participates in government tenders on behalf of small enterprises to •procure orders for them.
8.2.2 Small Industries Development Organisation (SIDO)SIDOiscreatedfordevelopmentofvarioussmall-scaleunitsindifferentareas.SIDOisasubordinateofficeofdepartment of SSI and ARI. It is a nodal agency for identifying the needs of SSI units coordinating and monitoring the policies and programmes for promotion of the small industries. It undertakes various programmes of training,

Financial Institutions and Financial Markets
130
consultancy, evaluation for needs of SSI and development of industrial estates. All these functions are taken care with27offices,31SISI(SmallIndustriesServiceInstitute)31extensioncentresofSISIand7centresrelatedtoproduction and process development. The activities of SIDO are divided into three categories as follows:
Coordination activities of SIDO:To coordinate various programmes and policies of various state governments pertaining to small industries.•To maintain relation with central industry ministry, planning commission, state level industries ministry and •financialinstitutions.Implement and coordinate in the development of industrial estates.•
Industrial development activities of SIDO:Develop import substitutions for components and products based on the data available for various volumes-wise •and value-wise imports.To give essential support and guidance for the development of ancillary units.•To provide guidance to SSI units in terms of costing market competition and to encourage them to participate •in the government stores and purchase tenders.To recommend the central government for reserving certain items to produce at SSI level only.•
Management activities of SIDO:To provide training, development and consultancy services to SSI to develop their competitive strength.•To provide marketing assistance to various SSI units.•To assist SSI units in selection of plant and machinery, location, layout design and appropriate process.•To help them get updated in various information’s related to the small-scale industries activities.•
8.2.3 Small Industries Service Institutes (SISI)The small industries service institutes have been set up in state capitals and other places all over the country to provide consultancy and training to small entrepreneurs both existing and prospective. The main functions of SISI include:
To serve as interface between central and state government.•To render technical support services.•To conduct entrepreneurship development programmes.•To initiate promotional programmes.•
The SISIs also render assistance in the following areas:Economic consultancy/information/EDP consultancy•Trade and market information•Projectprofiles•State industrial potential surveys•District industrial potential surveys•Modernisation and in plant studies•Workshop facilities•Training in various trade/activities•
8.2.4 Small-Scale Industries Board (SSIB)The government of India constituted a board, namely, Small Scale Industries Board (SSIB) in 1954 to advice on development of small-scale industries in the country. The SSIB is also known as central small industries board. The range of development work in small-scale industries involves several departments/ministries and several organs

131
of the central/state governments. Hence, to facilitate co-ordination and inter-institutional linkages, the small-scale industries board has been constituted. It is an apex advisory body constituted to render advice to the government on all issues pertaining to the development of small-scale industries.
The industries minister of the government of India is the chairman of the SSIB. The SSIB comprises of 50 members including state industry minister, some members of parliament, and secretaries of various departments of government ofIndia,financialinstitutions,publicsectorundertakings,industryassociationsandeminentexpertsinthefield.
8.2.5 State Small Industries Development Corporations (SSIDC)(Karnataka State Small Industries Development Authority KSSIDC in Karnataka State) The State Small Industries Development Corporations (SSIDC) were sets up in various states under the companies’ Act 1956, as state government undertakings to cater to the primary developmental needs of the small tiny and village industries in the state/ union territories under their jurisdiction. Incorporation under the companies act has provided SSIDCs with greater operationalflexibilityandwiderscopeforundertakingavarietyofactivitiesforthebenefitofthesmallsector.Theimportant functions performed by the SSIDCs include:
To procure and distribute scarce raw materials.•To supply machinery on hire purchase system.•To provide assistance for marketing of the products of small-scale industries.•To construct industrial estates/sheds, providing allied infrastructure facilities and their maintenance.•To extend seed capital assistance on behalf of the state government concerned provide management assistance •to production units.
8.2.6 District Industries Centres (DIC)The District Industries Centres (DIC’s) program was started in 1978 with a view to provide integrated administrative framework at the district level for promotion of small-scale industries in rural areas. The DIC’s are envisaged as a single window interacting agency at the district level providing service and support to small entrepreneurs under a single roof. DIC’s are the implementing arm of the central and state governments of the various schemes and programmes. Registration of small industries is done at the district industries centre and PMRY (Pradhan Mantri Rojgar Yojana) is also implemented by DIC. The organisational structure of DICS consists of General Manager, Functional Managers and Project Managers to provide technical services in the areas relevant to the needs of the district concerned. Management of DIC is done by the state government. The main functions of DIC are:
Toprepareandkeepmodelprojectprofilesforreferenceoftheentrepreneurs.•Toprepareactionplantoimplementtheschemeseffectivelyalreadyidentified.•To undertake industrial potential survey and to identify the types of feasible ventures which can be taken up in •ISB sector, i.e., industrial sector, service sector and business sector.To guide entrepreneurs in matters relating to selecting the most appropriate machinery and equipment, sources •of it supply and procedure for importing machineries.To provide guidance for appropriate loan amount and documentation.•Toassistentrepreneursforavailinglandandshedequipmentandtools,furnitureandfixtures.•To appraise the worthiness of the project-proposals received from entrepreneurs.•To help the entrepreneurs in obtaining required licenses/permits/clearance.•To assist the entrepreneurs in marketing their products and assess the possibilities of ancillarisation.•To conduct product development work appropriate to small industry.•To help the entrepreneurs in clarifying their doubts about the matters of operation of bank accounts, submission •of monthly, quarterly and annual returns to government departments.To conduct artisan training programme.•To act as the nodal agency for the district for implementing PMRY (Prime Minister Rojgar Yojana).•To function as the technical consultant of DRDA in administering IRDP and TRYSEM programme.•To help the specialised training organisations to conduct Entrepreneur development programmes.•

Financial Institutions and Financial Markets
132
InfineDIC’sfunctionasthetorch-bearertothebeneficiaries/entrepreneursinsettingupandrunningthebusinessenterprise right from the concept to commissioning. So the role of DIC’s in enterprise building and developing small scalesectorisofmuchsignificance.
8.3 Financial System and Banking System“Financeisameansofassuringtheflowofcapital.Historically,ithasalsobeenameansforguidingthatflow.Inthefirstcase,itisamechanisminaidoftheindustrialsystemasweknowit.Inthesecond,itisapowercontrollingit.”
A Financial System is the whole congeries of institutions and of institutional arrangements which have been establishedtoservetheneedsofmoderneconomy:tomeettheborrowingrequirementsofbusinessfirms;individualsand government; to gather and to invest savings; and to provide a payment mechanism. The institutions may be publicly owned or privately owned, may be partnerships or corporations, may be specialised or on-specialised in character. Whatever their legal or economic character, either they have evolved overtime in response to developing needs or they were established.
Worldwideexperienceconfirms that thecountrieswithwelldevelopedfinancialsystemgrowfasterandmoreconsistentlythanthosewithweakersystems.Thefinancialsectorplaysacentralroleinorganisingandcoordinatinganeconomy;itmakesmoderneconomicsocietypossible.Foreveryrealtransactionthereisafinancialtransactionthatmirrorsit.Ifthefinancialsectordoesn’twork,therealsectordoesn’twork.Alltradeinvolvesboththerealandthefinancialsector.Thefinancialsectorhasavitalroleinpromotingefficiencyandgrowthasitintermediatesintheflowoffundsfromthosebothsectorhasvitalroleinpromotingefficiencyandgrowthwhowanttosaveapartoftheirincometothosewhowanttoinvestinproductiveassets.Theefficiencyofintermediatingdependsonthewidth,depthanddiversityofthefinancialsystem.
8.4 Constituents of the Financial SystemThethreemainconstituentsofthefinancialsystemare:
The Financial Institutions•The Financial Markets•The Financial Assets•
8.4.1 Financial InstitutionsAfinancialinstitutionisabusinesswhoseprimaryactivityisbuying,sellingorholdingfinancialassets.Financialinstitutionsprovidevarioustypesoffinancialservices.Financial intermediariesareaspecialgroupoffinancialinstitutionsthatobtainfundsbyissuingclaimstomarketparticipantsandusethesefundstopurchasefinancialassets. Intermediaries transform funds they acquire into assets that are more attractive to the public. By doing so, financialintermediariesdooneormoreofthefollowing:
Provide maturity intermediation•Provideriskreductionviadiversificationatlowercost•Reduce the cost of contracting and information processing•Provide payments mechanism•
Theprincipalfinancialinstitutionsfallintothefollowingfourcategories:-Depositoryinstitutions:Financialinstitutionswhoseprimaryfinancialliabilitiesaredepositsincheckingor•savings accounts. It includes commercial banks, savings and loan associations, mutual savings banks and credit unions.Contractualintermediaries:Financialinstitutionsthatholdandstoresindividuals’financialassetsfallinthis•category. These intermediaries acquire funds at periodic intervals on a contractual basis. Because they can predictwithreasonableaccuracyhowmuchtheywillhavetopayoutinbenefitsinthecomingyears,theydonot have to worry as much depository institutions about losing funds. As a result, the liquidity of assets is not as important a consideration for them, and thus they tend to invest in long-term securities. This category includes pensionfunds,lifeinsurancecompaniesandfireandcasualtyinsurancecompanies.

133
Investment Intermediaries: Intermediaries falling under this type provide a mechanism through which small •saverspoolfundstoinvestinavarietyoffinancialassetsandthereforeresultindiversification.Diversification,here, means spreading and therefore lowering risk by holding shares or bonds of many different companies. Thiscategoryincludes-financecompanies,mutualfunds,andmoneymarketmutualfunds.Financial Brokers: A broker is an entity that acts on behalf of an investor who wishes to execute orders.•
8.5 Indian Financial SystemAnefficient articulate anddevelopedfinancial system is indispensable for the rapid economic growthof anyeconomy. The process of economic development is invariably accompanied by a corresponding and parallel growth offinancialorganisations.However,theirinstitutionalstructure,operatingpolicies,regulatory/legalframeworkdifferwidelyandlargelyinfluencedbytheprevailingpolitico-economicenvironment.PlannedeconomicdevelopmentinIndiahadgreatlyinfluencedthecourseoffinancialdevelopment.Theliberalisation/deregulation/globalisationof the Indian economy since the early nineties has had important implications for the future course of development ofthefinancialsystem.TheevolutionoftheIndianfinancialsystemfalls,fromtheviewpointofexposition,intothree distinct phases:
Up to 1951, corresponding to the post- independence scenario, on the eve of the initiation of planned economic •development.Between1951andthemid-eightiesreflectingtheimperativesofplannedeconomicgrowth.•After the early nineties responding to the requirements of liberalised/deregulated /globalised economic •environment.
AbriefdescriptionofthethreephasesofIndianfinancialsystemisgivenbelow:
Phase I: Pre-1951 OrganisationDuring thefirst phase, the organisation of thefinancial systemwas immature and rudimentary, reflecting theunderdeveloped nature of the industrial economy of the country. It was incapable of sustaining a high level of capital formation and accelerated pace for industrial development.
Phase II: 1951 to Mid-EightiesDuring the second phase, the mixed economy model with growing accent on ambitious industrialisation programmed hadasignificantbearingontheevolutionofthefinancialsystemandgreatlyconditionedtheinstitutionalstructureandregulatoryframework.Themainelementsofthefinancialorganisationinplannedeconomicdevelopmentcouldbe categorised into four broad groups:
Public/Governmentownershipoffinancialinstitutions•Fortificationoftheinstitutionalstructure•Protection to investors•Participationoffinancialinstitutionsincorporatemanagement•
Inbrief,auniquefinancialsystememergedinIndiabythemid-eightiesinconformitywiththerequirementsofplanning and the dominant role of the government in the Indian economy.
Phase III: Post NinetiesWith the liberalisation /globalisation of the economy, especially since the beginning of the nineties, the organisation oftheIndianfinancialsystemhasbeencharacterisedbyprofoundtransformation.Thenotabledevelopmentsduringthis phase are with reference to:
Privatisationoffinancialinstitutions•Re-organisation of institutional structure •Investor’s protection•

Financial Institutions and Financial Markets
134
Inbrief,theroleoftheGovernmentinthedistributionoffinanceandcreditismarkedbyaconsiderabledeclineandtheIndianfinancialsystemiswitnessingcapitalmarketorienteddevelopments.Thecapitalmarkethasemergedas the main agency for the allocation of resources. The essence of these developments is the fact that the Indian financialsystemispoisedforintegrationwiththesavingspoolinthedomesticeconomyandabroad.
8.6 Indian Banking System Evolution of Commercial Banking in IndiaAlthough evidence regarding the existence of money lending operations in India is found in the literature of the Vedic times, i.e., 2000 to 1400 B.C., no information is available regarding their pursuit as a profession by a section ofcommunity,till500B.C.Fromthistimeonwards,Indiapossessedasystembanking,whichadmirablyfulfilledherneedsandprovedverybeneficial,althoughitsmethodsweredifferentfromthoseofmodernwesternbanking.
Banking on modern lines was started by the English Agency Houses in Calcutta and Bombay. They began to conduct banking business besides their commercial business. From this time, the business and power of the indigenous bankers began to wave. The English agency houses in Calcutta and Bombay that began to serve as bankers to the East India Company, the members of the services and the European merchants in India, had no capital of their own anddependedupondepositsfortheirfunds.Theyfinancedthemovementofcrops,issuedpapermoneyandpavedthe way for the establishment of joint stock banks. Several of these banks failed on account of speculation and mismanagement.
TheBankofBengal,thefirstofthePresidencyBanks,wasestablishedin1806;theBanksofBombayandMadraswas established on 1840 and 1843. The Presidency banks established branches at many important trade centres, but they lacked points of contact, the want of which often deplored. On many occasions it was felt strongly that there should be only one bank of this kind for the whole country. In 1920, with an Act, the three presidency banks were amalgamated into the Imperial Bank of India. As a result of the recommendations of the Royal Commission on Indian Currency and Finance (1926), it was proposed to establish a central Reserve Bank. The Reserve Bank of India Act was passed in 1934 and the Reserve Bank of India (RBI) came into existence in 1935.
Thebankingsysteminthepre-independencewasdevoidofanydefiniteshapeandpolicyasaresultofwhichthebanking growth and development was haphazard and unsystematic. India inherited an extremely weak banking structure at the time of independence. The number of banks in existence then was 648, an unwieldy number not amenable for closer monitoring and control.
They had 4288 branches mostly in urban areas. Only some banks, especially in the south, were having branches in smallertownsandrivalareas.Therewere15exchangebanksoperatinginBombay,MadrasandCalcuttafinancingthe foreign trade. Thus, most of the banks lacked the all India character and had limited geographical coverage in their business. The Imperial Bank was operating with its imperialistic posture, distancing itself away from the common man. Commercial banks were generally characterised by conservatism, rigidity and lack of farsightedness, during the period of traditional banking which broadly continued up to year 1951.
The Evolution of Indian Banking in the Post 1951 period can be, for purposes of exposition, divided into three broad phases:
Phase of Banking Consolidation: 1951-1964•Phase of Innovative Banking: 1964-1990•Phase of Prudential Banking: Since early nineties•
8.6.1 Phase of Banking Consolidation: 1951-1964During the phase of consolidation, the weaknesses in the banking structure inherited at the time of independence wereremovedandasaresultoftherigorousofficialmeasurestakenbytheRBIundertheBankingRegulationAct,1949,aunifiedandcompactbankingsystemcameintobeinginIndia.TheobjectiveofenactingtheBankingRegulation Act, 1949, was to weed out the small, nonviable banking units; tone up the administration by eradicating unsound practices, and managerial abuses; and to afford greater protection to depositors. As a result, the number of banks progressively declined from 566 in 1951 to 292 in 1961 and further, to 108 in March 1966.

135
The aim was to integrate the banking operations with planning priorities. A major banking development in 1950s was the nationalisation of Imperial Bank of India and its transformation into State Bank of India effective from July1, 1955. In 1960, seven banks became subsidiaries of the State Bank of India. This step was intended to accelerate the paceofextensionofbankingfacilitiesalloverthecountry.Anothersignificantdevelopment,sincethemid-fifties,wasrelated to the widening of range of banking operations, which includes, term lending and underwriting of securities, asformsoffinance.Thedirectingofbankfundstotherequirementsofthefiveyearplanswasreflectedintheflowofbankcredittotheprioritysector.Butthequantitativemagnitudetothesenewareasremainedinsignificanttomaterially alter the basic structure of India banking.
Tillmidsixties,thebankswereessentiallyorientedtothesupplyofshort-termfinanceformeetingtheworkingcapital requirements of the large industries. The most notable change in the policies of the commercial banks during theconsolidationphasewasthemarkedshiftinfavourofindustrialfinancingandthecorrespondingsharpfallinthefinancingofcommerceandtradewhichaccountedforthebulkofbankcreditatthebeginningofthephase.Thesechanges were the result of policy initiatives and encouragement by the Government.
8.6.2 Phase of Innovative Banking: 1964-1990The period after 1964 may be aptly described as the phase of ‘innovative banking’ or ‘revolutionary phase’ or the beginningofthe‘bigchange’.After1964,therewasasignificantshiftinthetenorofpoliticsinIndia’s.Infact,theperiod 1964-67 witnessed the ‘ascendancy of radicalism ideology’ at the political front and there was an increasing concern about the problem of concentration of economic power in few hands and the widening economic disparities. In operational terms, an equitable distribution of bank credit among the various classes of borrower became the central issue of an acrimonious debate. The main features of this phase were: Social control, Nationalisation and Bank credit to priority sectors.
Inresponsetothepersistentdeficienciesofthebankingsystemi.e.,thelackofgeographicalandfunctionalcoverage,that the scheme of social control was introduced at the end of 1967. The basic postulate of this scheme was that the bank credit was an instrument for the attainment of the socio-economic objectives of the state policy. Its main objectives were “achieving a wider spread of bank credit, preventing its misuse, directing large volume of credit flowtoprioritysectorsandmakingitamosteffectiveinstrumentofdevelopment”.Itsoughttoremovethecontrolof the business houses over banks without removing the private ownership of banks. This was sought to be achieved by reforming their management and making them receptive to the changing concepts and goals of banking.
Although the banking system had taken several measures for achieving the objectives of social control, there were still serious reservations amongst a sizeable section of the political leadership about the effectiveness of the social controlmeasureswithoutabolishingtheframeworkoftheprofit-orientedprivateownershipofbanks.Tosatisfythisradical ideology, 14 major banks with individual deposits exceeding Rs.50 crores were nationalised on 19th July, 1969. The broad aims of nationalisation were: “To control the heights of the economy and meet progressively and serve better the needs of development of the economy in conformity with national policy and objectives”.
Atthetimeofnationalisationofthesebanks,theshareofpublicsectorinIndianbankingintermsofbranchoffices,deposits and assets was 79.7 percent, 82.7 per cent and 83.7 percent respectively. Nationalisation was visualised to provide a great impetus to changes and also give a new orientation to the banking system. Six more banks were later nationalised in 1980. Thus, the path breaking measures were taken to achieve the desired social and economic objectives. Thus, ‘Class Banking’ was replaced by ‘Mass Banking’.
Another significant featureof thisphase is that theflowofbankcredit to thepriority sectorwasconsiderablyaccelerated following the Bank Nationalisation. As with this structural reorientation the commercial banks were assignedtheroleofinstrumentsofdevelopment.Simultaneously,officialpolicyinitiativesweretakentoregulateand ration the bank credit available to large industry, as suggested by Tandon and Chore Committees.

Financial Institutions and Financial Markets
136
8.6.3 Phase of Prudential Banking - Since Early NinetiesIn the context of deregulated/liberalised/globalised economic environment since the early nineties, the post 1991 era ofIndianbankingisessentiallyaphaseofprudential/viable/profitablebanking.ThecommitteeonFinancialSector(CFS), 1991 (Narsimham Committee I) had set a comprehensive agenda for transforming Indian banking against thebackgroundofseriousdeficienciesinthesysteminthepost-nationalisationera.
The post-nationalisation era (1969-91) saw the rise of a geographically wide and functionally diverse banking system in conformity with the expanding and emerging needs of the Indian economy. They impressive progress of Indian bankinginachievingsocialgoals(socialbanking)asreflectedingeographicalreachandfunctionalspreadhasindeedbeen a major development input. “The banking system evolved under an active promotion policy appropriate to theearlyphaseoffinancialdevelopmentandthepolicyofpromotioncombinedwithregulationtoinstalldepositorconfidenceachievednotablesuccessintermsofresourcemobilisationandcreditextensiontoindustryandagricultureand thus assisted in meeting the major development objectives against the background of reasonable stability.” Serious weaknessesdevelopedintheformofdeclineinproductivityandefficiencyofthebankingsystemandconsequentlyaseriouserosionofitsprofitabilitywithimplicationforitsviabilityitself.
Grossprofitsprogressivelydeclinedtothelevelof1.1percentofworkingfunds.Incaseofsomebanks,theincrementalcost of operation per rupee of working funds was more than the incremental income per rupee of working funds. “Theerosionofprofitabilityadverselyaffectedtheabilityofthesystemtoexpanditsrangeofservicesinthecontextofassistinginthecreationofcompetitivevitalityandefficiencyintheruraleconomy.”Thefactorsthatadverselyaffectedtheprofitabilityofthebankingsystemwerepartlyexternalintermsofmacropolicyenvironmentandpartlyintermsoforganisation,staffingandbranchspread.
It is in the context of the foregoing features of the Indian banking in the post-nationalisation period, since the early nineties there was crying need of Indian banking has been the restoration of a competitive and professionally managed structure, policies and practices, and with the implementation of the recommendations of NC-I and NCII, this is fast becoming a reality.
TheapproachofNC-Itoreformwastoensurethatthesystemoperatesonthebasisofoperationalflexibilityandfunctionalautonomywithaviewtoenhancingefficiency,productivityandprofitability.Theintegrityofoperationsof banks was by far the more relevant issue than the question of their ownership. The focus of reforms until 1997 was on arresting the qualitative deterioration in the functioning of the banking system and a measure of success attended those efforts. The NC-II has outlined a comprehensive framework to consolidate those gains to strengthen the system within the purposive regulation and strong and effective legal system.
Financial sector management and reform is a process rather than an event. Many of the recommendations are beingimplementedbytheRBIinaphasedmanner.Asignificantstepinthisdirectionhasbeentheapplicationofinternationallyacceptednormstocapitaladequacy,assetclassificationandprovisioningandincomerecognition.Also, the reduction in SLR and CRR, setting up of special recovery tribunals, deregulation of interest rates, etc. Thus, the post 1991 phase of Indian banking is characterised by the beginning of ‘sound banking’ in contrast to thesocial/massbanking’incontrasttothesocial/massbankingofthenationalisationphase.Thefuturefinancialviability of the banking sector depends upon the capital support from the Government and enhancing the ability of banks to access the capital market to meet their capital requirements.

137
SummaryFinance is one of the essential requirements of an enterprise.•InIndia,Centralandstategovernmentsarepromotingnumberoffinancialinstitutionstobringintheindustrial•development in the country.The National Small Industries Corporation (NSIC), an enterprise under the union ministry of industries was set •up in 1955 in New Delhi to promote aid and facilitate the growth of small scale industries in the country.SIDO is created for development of various small-scale units in different areas.•The small industries service institutes have been set up in state capitals and other places all over the country to •provide consultancy and training to small entrepreneurs both existing and prospective.The government of India constituted a board, namely, Small Scale Industries Board (SSIB) in 1954 to advice •on development of small scale industries in the country.The District Industries Centres (DIC’s) programme was started in 1978 with a view to provide integrated •administrative framework at the district level for promotion of small- scale industries in rural areas.Financeisameansofassuringtheflowofcapital.Historically,ithasalsobeenameansforguidingthatflow.•A Financial System is the whole congeries of institutions and of institutional arrangements which have been •established to serve the needs of modern economy.Worldwideexperienceconfirmsthatthecountrieswithwelldevelopedfinancialsystemgrowfasterandmore•consistently than those with weaker systems.Anefficientarticulateanddevelopedfinancialsystemisindispensablefortherapideconomicgrowthofany•economy.Thebankingsysteminthepre-independencewasdevoidofanydefiniteshapeandpolicyasaresultofwhich•the banking growth and development was haphazard and unsystematic.A major banking development in 1950s was the nationalisation of Imperial Bank of India and its transformation •into State Bank of India effective from July1, 1955.Inresponsetothepersistentdeficienciesofthebankingsystemi.e.,thelackofgeographicalandfunctional•coverage, that the scheme of social control was introduced at the end of 1967.The post-nationalisation era (1969-91) saw the rise of a geographically wide and functionally diverse banking •system in conformity with the expanding and emerging needs of the Indian economy.
ReferencesPathak, V. B., 2011. • The IndianFinancial System:Markets Institutions and Services. Pearson Education India.Babu, R. G., 2007. • ManagementOfFinancialInstitutionsInIndia. Concept Publishing Company.Role ofFinancial Institutions forFundingEnterprises.• [Pdf] Available at: <http://tnau.ac.in/eagri/eagri50/ARM402/pdf/lec2021.pdf> [Accessed 4 June 2014].Financial Institution.• .[Pdf] Available at: <http://download.nos.org/318courseE/L-31%20FINANCIAL%20INSTITUTIONS.pdf> [Accessed 4 June 2014].BanksandFinancialInstitutions• . [Video online] Available at: <https://www.youtube.com/watch?v=ZLDpTsOrmDA> [Accessed 4 June 2014].IndianFinancial System• . [Video online] Available at: <https://www.youtube.com/watch?v=-ShUE6n_4pc> [Accessed 4 June 2014].
Recommended ReadingGurusamy., 2009. • IndianFinancialSystem,2E. Tata McGraw-Hill Education.Gup, E. B., 2011• .BankingandFinancialInstitutions:AGuideforDirectors,Investors,andBorrowers. John Wiley & Sons.Bhole, M. L., 2004. • FinancialInstitutionsandMarkets:Structure,GrowthandInnovations,4ed., Tata McGraw-Hill Education.

Financial Institutions and Financial Markets
138
Self Assessment____________ is one of the essential requirements of an enterprise.1.
Financea. Bankb. Industryc. Stated.
__________isasubordinateofficeofdepartmentofSSIandARI.2. NABARDa. NSIC b. SIDOc. UTId.
The industries minister of the government of India is the chairman of the _________.3. SSIBa. SSIDCb. DICc. EDPd.
_____________isameansofassuringtheflowofcapital.4. Banka. Governmentb. Financec. Enterprised.
_______________areaspecialgroupoffinancialinstitutionsthatobtainfundsbyissuingclaimstomarket5. participantsandusethesefundstopurchasefinancialassets.
Risk reductionsa. Depository institutionsb. Contractual intermediariesc. Financial intermediariesd.
Match the following6.
Depository institutions1. A broker is an entity that acts on behalf of an investor A. who wishes to execute orders.
Contractual intermediaries2. Includes-financecompanies,mutualfunds,andmoneyB. market mutual funds
Investment Intermediaries3. Financial institutions that holds and stores individuals’ C. financialassets
Financial Brokers4. FinancialinstitutionswhoseprimaryfinancialliabilitiesD. are deposits in checking or savings accounts
1-C, 2-A, 3-D, 4-Ba. 1-D, 2-C, 3-B, 4-Ab. 1-A, 2-D, 3-B, 4-Cc. 1-B, 2-A, 3-C, 4-Dd.

139
The ___________ has emerged as the main agency for the allocation of resources.7. capital marketa. bankingb. industryc. financemarketd.
___________ gives credit rating by international agencies subsidised for small enterprises up to 75% to get 8. better credit terms from banks and export orders from foreign buyers.
IDBIa. IFCIb. NSICc. SIDBId.
Who facilitates sanctions of term loan and working capital credit limit of small enterprise from banks?9. IDBIa. IFCIb. NSICc. SIDBId.
The ______________ saw the rise of a geographically wide and functionally diverse banking system in conformity 10. with the expanding and emerging needs of the Indian economy.
compact banking systema. extension industryb. post-nationalisation erac. resource mobilisationd.

Financial Institutions and Financial Markets
140
Case Study I
Commercial Paper Market in India
IntroductionThe base rate system which came into force on July 1, 2010, in India brought about drastic changes in the Commercial Paper (CP) market in the country. Under this system, banks were not supposed to lend below the base rate. Market analysts noted, “The introduction of the so-called base rate, below which no bank could lend since July 2010, would give a leg up to the commercial paper market in India. Corporations and Non-Banking Finance Companies (NBFCs) would prefer to utilise the CP for short-term funding needs.” Under base rate system, the cost of commercial paper worked out to be cheaper than the bank borrowing rate as the borrowers were no longer in a position to negotiate on the lending rate with banks.
The banking system had earlier been using the Prime Lending Rate (PLR) for the best rated customers. Borrowers often took undue advantage of the system and took loans for short-term periods at a minimal rate of interest. This led to a situation where the banks were forced to quote competitive, lower rates of interest to retain customers. Thisposedaseriousthreattotheprofitabilityofthebanks.Subsequently,RBIintroducedthe“BenchmarkPrimeLending Rate System” (BPLR) in place of PLR. It made banks quote BPLR, based on its affordability of credit. The BPLR was arrived at after taking into account four important components like average cost of deposits, operating expenses,probableloanlosses,andaprofitmargin.Despitetheseguidelines,thebargainingpowerofthewell-ratedborrower forced banks to quote sub-PLR/BPLR rates, to withstand the competition. About 70% of loans to well-rated companies were estimated to have been sanctioned at below PLR/BPLR rates.
Thesepracticeswerecuttingintotheprofitofthebanks.Keepingthisinview,RBIadvisedthebankstoquoteabaserateandtonotfinanceanyborrowerbelowthisrate.FromthemonthofJuly2010,thebankswerenotallowedto lend below the base rate. Since July 2010, the base rates quoted by the banks were in the range 8.5% to 9.5%. Hence,companiesfounditdifficulttoraisecreditfacilitiesatalowerrateofinterestthroughthebankingsystem.CommercialPaperappearedtobeabetteralternatesourceoffinance.
Alpana Dave, Assistant Vice President at Edelweiss Securities Ltd , commented, “There is enough demand from investors for commercial papers and expected NBFCs to raise more money through commercial papers than other companies. Such companies are likely to issue more paper than other companies because they need money for their lendingbusiness.”TheCPsmarket,till2007,didnotshowsignificantgrowthfortwomainreasons.
(Source: CommercialPaperMarket inIndia. [Online] Available at: <http://icmrindia.org/casestudies/catalogue/Finance/FINC070.htm> [Accessed 4 June 2014]).
QuestionsWho brought about drastic changes in the Commercial Paper (CP) market in the country?1. AnswerThe base rate system which came into force on July 1, 2010, in India brought about drastic changes in the Commercial Paper (CP) market in the country.
What is the banking system had been using earlier for the best rated customers?2. AnswerThe banking system had earlier been using the Prime Lending Rate (PLR) for the best rated customers.
What were the base rates quoted by the banks in July 2010?3. AnswerJuly 2010, the base rates quoted by the banks were in the range 8.5% to 9.5%.

141
Case Study II
Derivative Markets in India
IntroductionOn June9, 2000, theBombayStockExchange (BSE) introduced India’sfirst derivative instrument, theBSE-30(Sensex) index futures. It was introduced with three month trading cycle; the near month (one), the next month (two) and the far month (three).
The National Stock Exchange (NSE) followed a few days later, by launching the S&P CNX Nifty index futures on June 12, 2000. The plan to introduce derivatives in India was initially mooted by the National Stock Exchange (NSE) in 1995. The main purpose of this plan was to encourage greater participation of Foreign Institutional Investors (FIIs) in the Indian stock exchanges. Their involvement had been very low due to the absence of derivatives for hedging risk. However, there was no consensus of opinion on the issue among industry analysts and the media. The pros and cons of introducing derivatives trading were debated intensely. The lack of transparency and inadequate infrastructure of the Indian stock markets were cited as reasons to avoid derivatives trading.
Derivatives were also considered risky for retail investors because of their poor knowledge about their operation. In spite of the opposition, the path for derivatives trading was cleared with the introduction of Securities Laws (Amendment) Bill in Parliament in 1998.
The introduction of derivatives was delayed for some more time as the infrastructure for it had to be set up. Derivatives trading required a computer-based trading system, a depository and a clearing house facility. In addition, problems such as low market capitalisation of the Indian stock markets, the small number of institutional players and the absence of a regulatory framework caused further delays. Derivatives trading eventually started in June 2000. The introduction of derivatives was well received by stock market players. Trading in derivatives gained substantial popularity, and soon the turnover of the NSE and BSE derivatives markets exceeded the turnover of the NSE and BSE cash markets.
For instance, in the month of January 2004, the value of the NSE and BSE derivatives markets was Rs.3278.5 billion (bn) whereas the value of the NSE and BSE cash markets was only Rs.1998.89 bn. In spite of these encouraging developments, industry analysts felt that the derivatives market had not yet realised its full potential. Analysts pointed out that the equity derivative markets on the BSE and NSE had been limited to only four products such as index futures, index options and individual stock futures and options which were limited to certain select stocks.
The initial steps to launch derivatives were taken in 1995 with the introduction of the Securities Laws (Amendment) Ordinance, 1995 that withdrew the prohibition on trading in options on securities in the Indian stock market. In November 1996, a 24-member committee was set up by the Securities Exchange Board of India (SEBI) under the chairmanship of LC Gupta to develop an appropriate regulatory framework for derivatives trading.
The committee recommended that the regulatory framework applicable to the trading of securities would also govern the trading of derivatives. Following the committee’s recommendations, the Securities Contract Regulation Act (SCRA) was amended in 1999 to include derivatives within the scope of securities and a regulatory framework for administering derivatives trading was laid out.
The act granted legality to exchange-traded derivatives, but not OTC (over-the-counter) derivatives. It allowed derivatives trading either on a separate and independent derivatives exchange or on a separate segment of an existing stock exchange. The derivatives exchange had to function as a self-regulatory organisation (SRO) and SEBI acted as its regulator.
The responsibility of clearing and settlement of all trades on the exchange was given to the clearing house which was to be governed independently. Derivatives were introduced in a phased manner. Initially, trading was restricted to index futures contracts based on the S&P CNX Nifty Index and BSE-30 (Sensex) Index.

Financial Institutions and Financial Markets
142
The debate and the resultThosewhoopposed the introductionof derivatives argued that these instrumentswould significantly increasespeculation in the market. They said that derivatives could be used for speculation by investors by taking large price positions in the stock market while committing only a small amount of capital as margin.
For instance, instead of an investor buying stocks worth Rs.1 million (mn), he could buy futures contracts on Rs.1 mn of stocks by investing a few thousand rupees as margin. Thus, trading in derivatives encouraged investors to speculate taking on more risk while putting forward less investment. They were quick to point out some of the disasters of the past that had occurred due to the mismanagement of trading in derivatives.
A few issues remainBy January 2004, more than three and a half years of derivatives trading had been completed. However, according to several analysts and media reports, SEBI, NSE and BSE had still to resolve many issues so that the derivatives market could realise its full potential.
For instance, the issue of imposing taxes on income arising from derivatives trading still remained to be sorted out. TheIncomeTaxActofIndiadidnothaveanyspecificprovisionregardingtaxabilityofderivativesincome.Thetax authorities were still undecided on the issue, and in the absence of any provision, derivatives transactions were held on par with transactions of a speculative nature (in particular, the index futures/options which were essentially cash settled, were treated this way). Therefore, the loss, if any, arising from derivatives transactions, was treated as a speculative loss and was eligible to be set off only against speculative income upto a maximum period of eight years.
The new initiativesAs of early 2004, derivatives trading in India had been restricted to a limited range of products including index futures, index options and individual stock futures and options limited to certain select stocks.Analysts felt that index futures/options could be extended to other popular indices such as the CNX Nifty Junior. Similarly, stock futures/options could be extended to all active securities. Efforts were also on to encourage participation from domestic institutional investors. SEBI had authorized mutual funds to trade in derivatives, subject to appropriate disclosures. A broader product rollout for institutional investors was also on the cards. Steps weretakentostrengthenthefinancialinfrastructure.Theseincludeddevelopingadequatetradingmechanismsandsystems, and establishing proper clearing and settlement procedures. Regulations hampering the growth of derivative markets were being reviewed.
(Source: Commercial Paper Market in India. [Online] Available at: <http://icmrindia.org/casestudies/catalogue/Finance/FINC070.htm> [Accessed 4 June 2014]).
QuestionsWhat are the main objectives and reasons for the introduction of derivatives trading in India?1. The factors that can accelerate/suppress the growth of the derivatives market in a country?2. What were the reasons to avoid derivatives trading in India?3.

143
Case Study III
Certificates of Deposit
IntroductionACertificateofDeposit(CD)isashort-termmoneymarketinstrumentusedbybankstosourcefundsfromthepublic. Unlike a Bank term deposit, it is a negotiable instrument transferable by endorsement and delivery. CDs are normally issued by banks to tide over short-term liquidity problems. Banks make these CDs more attractive by offering a comparatively higher rate of interest over the short-term deposit rates.
Yet these deposits do not have the momentum and market share they ought to have. This may be on account of lack of customer awareness of this type of product and the lack of an effective secondary market for CDs.
This case presents the salient features of CDs issued in India and abroad, the legal framework related to the issue, the market position, RBI guidelines on the issue of the CDs in India, etc. It clearly brings out the basic differences between CDs and Bank term deposits and gives the reader a comprehensive idea of the instrument.
ThemonthsofMayandJune2010sawahugesaleofCertificatesofDeposit(CDs).MutualFunds(MFs)companiesbegan to liquidate their holding in the face of the “Euro Crisis” to meet the obligations of the Foreign Institutional Investors (FIIs). As the fund houses had redeemed huge quantities of CDs, the interest rate of six-month CDs went up steeply to 6.3%. In May 2010, FII took a short position of Rs. 94.36 billion of equities and a long position in debt portfolio amounting to Rs. 24.50 billion from the point of view of short-term liquidity. The buyers of the CDs during this period were banks, who took a long position at a steep discount.
Certificates of DepositCertificatesofDeposit(CDs)aremoneymarketinstrumentsissuedbybanksinIndiaandabroadintheformofnuisancepromissorynotes(RefertoExhibitIIIforCertificateofDepositinOtherCountries).
Thesebankdepositsarenegotiable,areinmarketableformandhavespecificfacevalueandmaturityperiods.Theyare transferable from one party to another unlike bank term deposits. Due to their negotiable nature, these are also knownasNegotiableCertificatesofDeposit(NCDs).
(Source: Commercial Paper Market in India. [Online] Available at: <http://icmrindia.org/casestudies/catalogue/Finance/FINC070.htm> [Accessed 4 June 2014]).
QuestionsWhatarecertificatesofdeposits?1. Write the role of mutual funds companies in this case studies.2. Whatisthebank’scontributionincertificateofdeposit?3.

Financial Institutions and Financial Markets
144
Bibliography
ReferencesAcommondefinitionofEuropeanmoneymarketfunds• . [Pdf] Available at: <http://www.esma.europa.eu/system/files/09_850.pdf>[Accessed2June2014].Anintroductiontofinancialmarkets-MoneyWeekInvestmentTutorials• . [Video online] Available at: <https://www.youtube.com/watch?v=6OoMQiClXCs> [Accessed 14 May 2014].Babu, R. G., 2007. • Management of Financial Institutions In India. Concept Publishing Company.BanksandFinancialInstitutions• . [Video online] Available at: <https://www.youtube.com/watch?v=ZLDpTsOrmDA> [Accessed 4 June 2014].Bennett, T., • Whatarederivatives?MoneyWeekInvestmentTutorials. [Video online] Available at: <https://www.youtube.com/watch?v=Wjlw7ZpZVK4> [Accessed 3 June 2014].Bernanke, B. & Blinder, A., 1992. • TheFFrateandthechannelsofmonetarytransmission. Journal of Banking and Finance.BondBasicsTutorial• . [Pdf] Available at: <http://i.investopedia.com/inv/pdf/tutorials/bondbasics.pdf> [Accessed 30 May 2014].CFALevel I-DerivativeMarketsandInstruments• . [Video online] Available at: <https://www.youtube.com/watch?v=gxIe2vFK4dE> [Accessed 3 June 2014].Culbertson, J. M., 1957. • TheTermStructureofInterestRates. Quarterly Journal of Economics.Dunne, P, Moore, M. & Portes, R., 2006. • EuropeanGovernmentBondMarkets: Transparency, Liquidity,Efficiency, CEPR, London.EconomicImportanceoftheCorporateBondMarkets• . [Pdf] Available at: < https://www.google.co.in/url?sa=t&rct=j&q=&esrc=s&source=web&cd=1&cad=rja&uact=8&ved=0CCEQFjAA&url=http%3A%2F%2Fwww.icmagroup.org%2Fassets%2Fdocuments%2FMedia%2FBrochures%2F2013%2FCorporate-Bond-Markets-March-2013.pdf&ei=ICuQU9CCDIu0uATvoKQDQ&usg=AFQjCNHau3vTKRbj0VQQWQFMwagIYPVOkw&bvm=bv.68235269,d.c2E > [Accessed 30 May 2014].Edwards, A. K., Harris, L. E. & Piwowar, M. S., 2007. • CorporateBondMarket TransactionCosts andTransparency. Journal of Finance.Episode123:IntroductiontoDebtandEquityFinancing• . [Video online] Available at: <https://www.youtube.com/watch?v=fH_gQmiVZgU> [Accessed 30 May 2014].EquityMarketStructureLiteratureReview• . [Pdf] Available at: <http://www.sec.gov/marketstructure/research/hft_lit_review_march_2014.pdf> [Accessed 3 June 2014].EquityMarket• . [Video online] Available at: <https://www.youtube.com/watch?v=dDFYGg6vKFQ> [Accessed 3 June 2014].EquityMarkets• . [Pdf] Available at: <http://www.kesdee.com/pdf/equitymarkets.pdf> [Accessed 3 June 2014].Estrella, A. & Mishkin, F. S., 1996. • TheyieldcurveasapredictorofU.S.recessions. Federal Reserve Bank of New York Current Issues in Economics and Finance.European Central Bank. 2006. • EquityIssuanceintheEuroArea, Monthly Bulletin.Fabozzi F. J. & Modigliani F., 2007. • Capital Markets: Institutions and Instruments. Prentice-Hall International.Fama, E. F., 1965. • RandomWalksinStockMarketPrices. Financial Analysts Journal.FCR 001 - Introduction toDebt Financing• . [Video online] Available at: <https://www.youtube.com/watch?v=yrEkKlAwKKU> [Accessed 30 May 2014].Finan, B. M., 2014. • ABasicCourseintheTheoryofInterestandDerivativesMarkets:APreparationfortheActuarialExamFM/2.[Pdf]Availableat:<http://faculty.atu.edu/mfinan/actuarieshall/mainf.pdf>[Accessed3June 2014].

145
Financial Institution.• [Pdf] Available at: <http://download.nos.org/318courseE/L-31%20FINANCIAL%20INSTITUTIONS.pdf> [Accessed 4 June 2014].Financial Markets• . [Pdf] Available at: <http://www.bcci.bg/projects/latvia/pdf/7_Financial_markets.pdf> [Accessed 14 May 2014].Financial Markets• . [Video online] Available at: <https://www.youtube.com/watch?v=P_bqDgkZmuY> [Accessed 14 May 2014].HowtheStockMarketWorks• . [Video online] Available at: <https://www.youtube.com/watch?v=GnJCOof2HJk> [Accessed 3 June 2014].Howells, P. & Bain, K., 2008. • Financial Markets and Institutions. Financial Times, Prentice Hall.IndianFinancial System• . [Video online] Available at: <https://www.youtube.com/watch?v=-ShUE6n_4pc> [Accessed 4 June 2014].Introduction toFinancialMarket (Part-1)• . [Pdf] Available at: <http://cbse.gov.in/Financial%20Market%20Final.pdf> [Accessed 14 May 2014].IntroductiontotheMoneyMarket• . [Video online] Available at: <https://www.youtube.com/watch?v=BoDjLCKov9I> [Accessed 2 June 2014].McClintock, E. E. & Calabria, A. M., • Regulation, Market Structure, and Role of the Credit Rating Agencies. [Pdf]Availableat:<http://www.cato.org/sites/cato.org/files/pubs/pdf/PA704.pdf>[Accessed14May2014].Mod-01Lec-33InterestRate:Determination&Structure• . [Video online] Available at: <https://www.youtube.com/watch?v=rbmVJS00HeI> [Accessed 14 May 2014].Module8MoneyMarketinIndia• . [Video online] Available at: <https://www.youtube.com/watch?v=I2kncghw8do> [Accessed 2 June 2014].Moneymarket: Interest rate determination• . [Video online] Available at: <https://www.youtube.com/watch?v=bQ0Ellr1L3o> [Accessed 14 May 2014].MoneyMarkets• .[Pdf]Availableat:<http://lamar.colostate.edu/~jelder/courses/finmarkets/lect_ppt/ch07_money_mkt.pdf> [Accessed 2 June 2014].Morck, Randall, Shleifer, A & Robert W. Vishny. 1988. • ManagementOwnershipandMarketValuation:AnEmpiricalAnalysis. Journal of Financial Economics.Myers, & Majluf, 1984. • CorporateFinancingandInvestmentDecisionswhenFirmshaveInformationthatInvestorsdonotHave. Journal of Financial Economics.Pathak, V. B., 2011. • The IndianFinancial System:Markets Institutions and Services. Pearson Education India.Role ofFinancial Institutions forFundingEnterprises.• [Pdf] Available at: <http://tnau.ac.in/eagri/eagri50/ARM402/pdf/lec2021.pdf> [Accessed 4 June 2014].The • AnalysisoftheEuroMoneyMarketfromaMonetaryPolicyPerspective. ECB Monthly Bulletin.TheGlobalDerivativesMarketAnIntroduction• . [Pdf] Available at: <http://www.math.nyu.edu/faculty/avellane/global_derivatives_market.pdf> [Accessed 3 June 2014].
Recommended ReadingBhole, M. L., 2004. • FinancialInstitutionsandMarkets:Structure,GrowthandInnovations,4e. Tata McGraw-Hill Education.Chapter 6:TheTermStructure of InterestRates• . [Video online] Available at: <https://www.youtube.com/watch?v=YyqyzLU9ZYY> [Accessed 30 May 2014].Culbertson, J. M., 1957. • TheTermStructureofInterestRates. Quarterly Journal of Economics.Estrella, A. & Mishkin, F. S., 1996. • TheyieldcurveasapredictorofU.S.recessions. Federal Reserve Bank of New York Current Issues in Economics and Finance.Favero, C. A., Kaminska, I. & Soderstrom, U. 2005. • Thepredictiepoweroftheyieldspread:Furtherevidenceand a structural interpretation. CEPR Discussion Paper.

Financial Institutions and Financial Markets
146
Favero, C. A., Kaminska, I. & Soderstrom, U., 2005. • Thepredictivepoweroftheyieldspread:Furtherevidenceand a structural interpretation. CEPR Discussion.Foucault, T. & Menkveld, A. J., 2008. • CompetitionforOrderFlowandSmartOrderRoutingSystems, Journal of Finance.Goldstein, M. A., Hotchkiss, E. & Sirri, E., 2007. • TransparencyandLiquidity:AControlledExperimentonCorporateBonds, Review of Financial Studies.Gup, E. B., 2011• .BankingandFinancialInstitutions:AGuideforDirectors,Investors,andBorrowers. John Wiley & Sons.Gurusamy., 2009. • IndianFinancialSystem,2E. Tata McGraw-Hill Education.Hartmann, P., Manna, M. & Manzanares, A., 2001. • TheMicrostructureoftheEuroMoneyMarket, ECB Working Paper.International Capital Market Association, 2007. • EuropeanREPOMarket Survey,Number 12, conductedDecember2006, Zürich, ICMA.Kane, E. J., 1970. • Thetermstructureofinterestrates:Anattempttoreconcileteachingwithpractice. Journal of Finance.Kazarian, E. G., 2006. • IntegrationoftheSecuritiesMarketInfrastructureintheEuropeanUnion:PolicyandRegulatoryIssues.Levy, H., 1978. • Equilibriuminimperfectmarket. A constraint on the number of securities. American Economic Review.Madura, J., 2008. • Financial Markets and Institutions. Prentice-Hall International.Mishkin, F., S. & Eakins S. G. 2006. • Financial Markets and Institutions. Addison-Wesley.Pagano, M. & Von, Thadden, E., 2008. • TheEuropeanBondMarketsunderEMU,inX.Freixas,P.Hartmann,andC.Mayer(eds.), Handbook of European Financial Markets and Institutions, Oxford University Press, Oxford.Ron, U., 2002. • Apracticalguide to swapcurveconstruction. Interest Rate, Term Structure, and Valuation Modeling. New York, John Wiley & Sons.Ron, U., 2002. • InterestRate,TermStructure,andValuationModeling. New York, John Wiley & Sons.Schich, S. & Wehinger, G. 2003. • ProspectsforStockexchanges. Financial market Tends.Seifert, W. G., Schleitner, A., K., Mattern, F., Streit, C. C. & Voth, H. J., 2000. • European Capital Markets. Macmillan.Serifsoy, B. & M. Weib, 2007. • SettlingforEfficiency–AFrameworkfortheEuropeanSecuritiesTransactionIndustry, Journal of Banking and Finance.Shiller, 2003. • FromEfficientMarketstoBehavioralFinance, Journal of Economic Perspectives.TermStructureofInterestRates• . [Video online] Available at: <https://www.youtube.com/watch?v=Hl5zOAxBoDw> [Accessed 30 May 2014].Wolswijk, G. & de Haan, J. 2005. • GovernmentDebtManagement in theEuroArea:Recent TheoreticalDevelopmentsandChangesinPractices, ECB Occasional Paper 25.

147
Self Assessment Answers
Chapter Id1. a2. a3. b4. c5. a6. d7. c8. d9. b10.
Chapter IIa1. c2. d3. b4. a5. c6. b7. d8. b9. a10.
Chapter IIId1. a2. b3. c4. d5. d6. c7. b8. a9. a10.
Chapter IVa1. d2. c3. a4. d5. d6. b7. a8. a9. b10.

Financial Institutions and Financial Markets
148
Chapter Vb1. a2. d3. a4. d5. a6. c7. b8. a9. c10.
Chapter VIa1. a2. b3. d4. a5. c6. d7. b8. d9. c10.
Chapter VIIa1. b2. c3. d4. a5. a6. b7. c8. d9. a10.
Chapter VIIIa1. c2. a3. c4. d5. b6. a7. c8. c9. c10.