financial liberalisation, exchange rate regime and ... · constituem o chamado bric - brasil,...
TRANSCRIPT

Financial liberalisation, exchange rate regime and economic performance in BRICs countries*
Luiz Fernando de Paula**
Abstract: Why economic performance and macroeconomic stability has differed among the BRICs countries? More specifically, in which way macroeconomic policy regime and the management of the economic policy has defined an economic environment that has contributed for a higher (or lower) economic performance and macroeconomic stability in the BRICs countries? The main objective of this paper is to analyse the relationship between exchange rate regime, capital account convertibility and economic performance within the big emerging countries that constitute what has been called BRIC – Brazil, Russia, India and China. The hypothesis of the paper is that economic performance of these countries is the result, at least partially, of the quality of the macroeconomic policy management adopted in each country, in which exchange rate policy, capital account convertibility and the degree of external vulnerability plays a key role.
Key words: BRIC; financial liberalisation; capital account convertibility Resumo: Porque o desempenho econômico e a estabilidade macroeconômica têm diferido entre os países do BRIC? Mais especificamente, de que modo o regime de política macroeconômica e o gerenciamento da política econômica têm definido um ambiente econômico que tem contribuído para um maior (ou menor) desempenho econômico entre os países do BRIC? O principal objetivo deste artigo é analisar a relação entre regime cambial, conversibilidade da conta de capital e desempenho econômico entre os grandes países que constituem o chamado BRIC - Brasil, Russia, India e China. A hipótese básica é que o desempenho econômico desses países resulta, ao menos parcialmente, da qualidade da administração da política macroeconômica adotada em cada país, no qual a política cambial, a conversibilidade da conta de capital e o grau de vulnerabilidade externa desempenham um papel crucial.
Palavras-chave: BRIC; liberalização financeira; conversibilidade da conta de capital
JEL Classification: E58; F31: F32: F34
Área da ANPEC: 6 – Economia Internacional
* I am very grateful to Fabio Barcelos for his generous research support. ** Associate Professor at the University of the State of the Rio de Janeiro and CNPq Visiting Research Fellow, Centre for Brazilian Studies, Oxford. Email: [email protected]

Financial liberalisation, exchange rate regime and economic performance in BRICs countries
1. Introduction
In October 2003, a Goldman and Sachs’ report (Purushothaman and Wilson, 2003), using the demographic projections and a model of capital accumulation and productivity growth, mapped out GDP growth, income per capita and currency movements of the BRICs countries (Brazil, Russia, India and China) until 2050. Based in some assumptions, the report forecasted that in less than 40 years the BRICs countries together could be larger than the G6 in US dollar terms and by 2025 they could account for over half for the size of the G6 (currently they are worth less than 15%). However, as the report recognizes, there is no guarantee that the economic growth of these countries will reach what is forecasted by the study, as such behaviour depends on a set of factors, which includes macro stability (understood as price stability), development of good institutions (legal system, functioning markets, educational systems, financial institutions etc.), openness to trade and FDI, and improvement in education degree of the population – a very known development policies supported by multilateral institutions, such as World Bank.
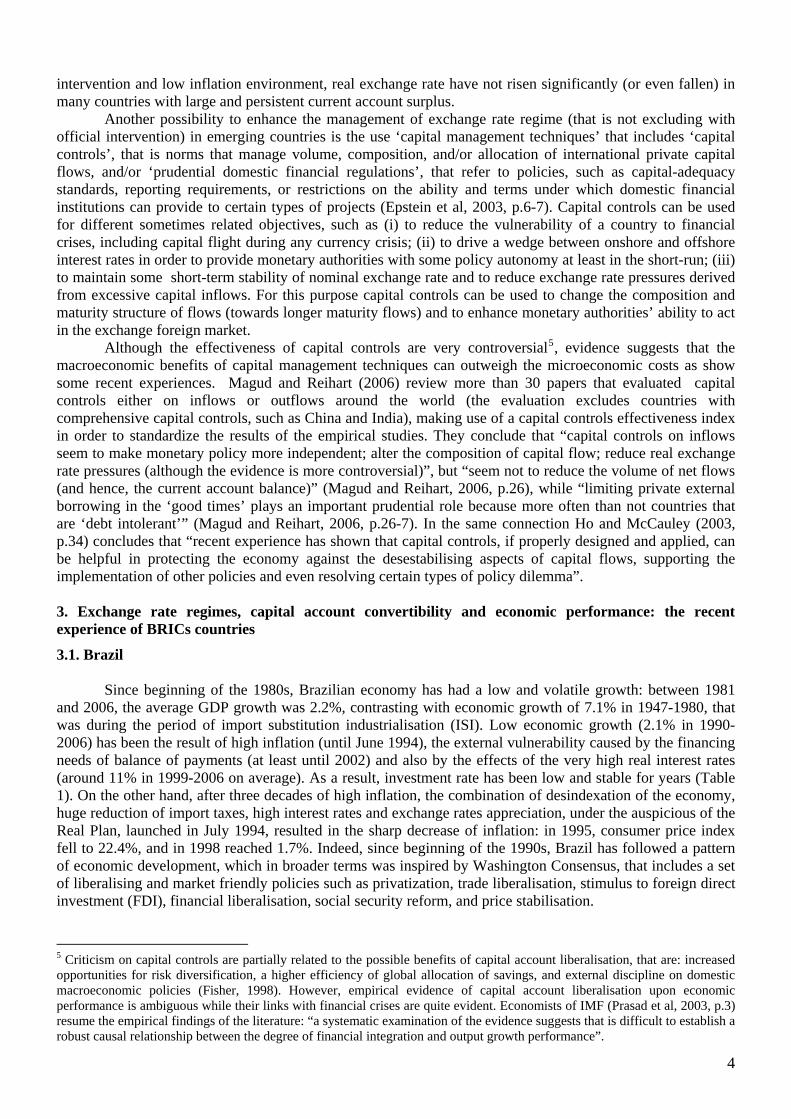
Although such sort of forecast is exposed to criticism, there is no doubt that due to their geographic and population size and GDP dimension (current and potential), in spite of the problems of social inequality and even poverty that the BRICs countries face nowadays, one cannot disregard the importance and potentiality of theses economies. Looking at the GDP growth performance of the BRICs countries, since 1990, one can see that GDP growth has differed among the countries: average GDP growth in China in 1990-2006 was 9.8%, in India 6.1%, Brazil 2.2% and Russia -0.1%. If we compare the BRICs countries only in the recent period (1999-2006), that is after the 1998’s Russian crisis, the economic performance changes somehow: 9.3% in China, 6.8% in India, 6.7% in Russia and 2.8% in Brazil.
F ig u r e 1 . G D P g r o w th (% ) o f B R IC s c o u n tr ie s
- 1 5
- 1 0
-5
0
5
1 0
1 5
1990
1991
1992
1993
1994
1995
1996
1997
1998
1999
2000
2001
2002
2003
2004
2005
2006
B ra z i l R u s s ia
In d ia C h in a
Source: IMF, IPEADATA(Brazil) and DB Research(Russia)
Why economic performance and macroeconomic stability1 has differed among the BRICs countries? More specifically, in which way macroeconomic policy regime and the management of the economic policy has defined an economic environment that has contributed for a higher (or lower) economic performance and macroeconomic stability of the BRICs countries?
1 For the purpose of this paper, we define macroeconomic stability as a broader concept than just price stabilization, as it aims at reducing the uncertainties that are intrinsic to the business world in order to provide a favourable environment for investment and production decisions. Macroeconomic stability can also be defined as a situation of sustained economic growth with financial stability, that is with inflation under control and with low likehood of financial/currency crises. See more, on this concern, Oreiro and Paula (2007, section 2).
1

The paper aims at analyzing the relationship between exchange rate regime, capital account convertibility and economic performance within the big emerging countries that constitute what has been called BRIC – Brazil, Russia, India and China, during the period of capital account liberalisation that has happened in broader terms since beginning of the 1990s. The main hypothesis developed in the paper is that economic performance of BRICs countries is the result, at least partially, of the quality of the macroeconomic policy management adopted in each country, in which exchange rate policy, capital account convertibility and the degree of external vulnerability play a key role.
The paper is divided in three sections, besides the Introduction. Section 2 discusses the relationship between capital account convertibility, exchange rate regime and macroeconomic stability in emerging countries, while section 3 focuses the analysis on the recent experience of each BRIC country. Section 4 compares briefly such experiences and seeks to extract some conclusions.
2. Exchange rate regimes, capital controls and macroeconomic stability
One important discussion in the literature about macroeconomic issues in emerging countries is which
exchange rate regime is more appropriate for these countries. On one hand, according to the ‘bipolar’ view intermediary regimes – that involve all sorts of intermediary exchange rate regimes, that is between freely floating regime and fixed exchange rate regime – are less appropriate for economies with substantial involvement in international capital markets. The main argument is that such exchange rate regimes make countries more vulnerable to speculative attacks (Fischer, 2001). On the other hand, the view called ‘fear of floating’ points out that many emerging countries that adopt flexible exchange rate regime in practice seek to limit exchange rate movements. Such resistance to floating arises from their low policy and institutional credibility and high degree of pass-through of exchange rate changes into domestic prices, among other factors (Calvo and Reihart, 2002). Other reasons to why monetary authorities avoid exchange rate movements are related to the effects of excessive exchange rate volatility (mainly devaluation) on the outstanding foreign currency debts of banks and the corporate sectors with unhedged foreign currency liabilities. In addition, exchange rate fluctuations may generate uncertainties that could impede trade. For instance, prolonged real appreciation associated with large capital inflows can adversely affect export competitiveness and investment in the external sector.
Fixed exchange regime has the advantage of eliminating the exchange rate risk that affects the decisions of exporters and importers and domestic borrowers in international financial markets, and also converging domestic inflation to external inflation. However, such regime has also high risks for bigger emerging countries, as its results in the lost of economic policy flexibility to face external shocks, mainly when economic authorities does not have enough exchange reserves to intervene in the exchange market and/or there is a confidence crisis associated to the lack of government capability in maintaining the pegged exchange rate; under these conditions, the adjustment costs can be very high. Fixed exchange rate may encourage borrowers to be too confident in taking out foreign-exchange-denominated loans, doing very painful any change in the exchange rate regime.2
One could argue that the adoption of a freely flexible exchange regime by emerging countries could isolate these countries from speculative attacks on domestic currency as government has no commitment with any level of exchange rate. Besides, floating exchange regime could increase the autonomy of monetary policy, overcoming the ‘impossible trinity’ that says that a country cannot have at the same time capital account convertibility, fixed exchange rate regime and monetary policy autonomy in order to achieve domestic objectives. However, floating exchange regime frequently works in the real world differently from what is supposed in the textbooks. According to Grenville (2000), fundamentals cannot explain the behaviour of exchange rate over a short/medium term horizon, that is exchange rate have at times exhibited long-lived swings with no apparent changes in fundamentals significant enough to justify them. The problems related to the exchange rate volatility are greater for emerging countries, as they have: (i) no long historical experience
2 Mohanty and Scatigna (2005, p.19), using the IMF’s de facto classification of exchange rate regimes report that the number of emerging countries opting for a flexible exchange rate has risen from a little above 15% in 1990 to about one half at the end of 2001, while the share of hard peg regimes increased moderately from under 10% at little above 15% during the same period, and intermediate regime has fallen from over three quarters to less than 35%. Reihart and Rogoff (2002), however, using another classification based on parallel exchange market activity and other special features, concluded that many emerging economies have in effect crawling peg regimes.
2

of market-determined exchange rate; (ii) few Friedmanite stabilizers speculators acting in the exchange market, that is there has been a lack of players willing take contrarian foreign exchange positions in emerging countries; and (iii) much larger and volatile capital flows, in relation to the size of their capital markets and economies more generally (Grenville, 2000). According to Ho and McCauley’s data (2003), despite of the rapid growth in activity during the 1990s, foreign exchange markets in most emerging countries continue to be relatively small and less liquidity than their counterparts in the industrial world. This suggests that emerging foreign exchange markets are more prone to one-sided bets and instability, because they are thin and subject to a high degree of uncertainty and information asymmetries (Moreno, 2005, p.10).
Flexibility in the operation of floating exchange regimes can be helpful in absorbing the capital inflow, in buffering external shocks, and responding to the changing productive capacity of emerging economies; it can also inhibit some short-term flows, by serving as a constant reminder that exchange rate volatility can outweigh the interest rate advantage of foreign currency borrowings (Grenville, 2000, p.59). Some sort of managed floating exchange rates regime can be useful if the objective of the central bank is to reduce the exchange rate volatility and also influence somehow the real exchange rate for international trade purposes. Central bank intervenes in foreign exchange markets to achieve a variety of macroeconomic objectives, such as controlling inflation, maintaining external competitiveness and/or maintaining financial stability. Differently from a pegged exchange rate, authorities’ interventions to limit exchange rate movements may not target a certain level of the exchange rate, allowing nominal exchange rate to float in order to disincentivise speculative capital flows but may influence its path. The preservation of a competitive and stable real exchange rate can be use as an intermediate target of macroeconomic policies oriented to employment and growth objectives.3
In order to enhance the possibility of a successful management of exchange rate regime in emerging markets can be necessary some measures to reduce the volatility of capital flows and the likehood of speculation attack on domestic currency. One possibility is the use of official intervention in the foreign exchange market, that may exert direct influence on nominal exchange rate as it alters the relative supply of domestic and foreign currency assets. On one hand, the countries’ ability to resist currency depreciation is limited by its stock of foreign exchange reserves and its access to potential credit lines. Reserve accumulation can be seen as an insurance against future negative shocks and speculation against domestic currency, as emerging economies have limited access to international capital market. On other hand, the ability to avoid currency appreciation may require the use of sterilised intervention. The accumulation of reserves requires some sort of financing due to the excess of foreign currency reserves over domestic currency in circulation. The central bank can finance this gap by issuing domestic monetary liabilities. If central banks have a target for the short-term rate, then they can attempt to offset increases in bank reserves selling domestic assets or issuing their own securities (Mohanty and Turner, 2006).
There are some concerns about the prolonged use of foreign exchange intervention to resist currency appreciation. One concern is related to the fact that a large portfolio currency asset exposes the central bank to potential valuation losses for currency appreciation. A second concern is related to the carrying costs of reserves, that are determined by the difference between the return on domestic assets and foreign assets.4 Finally, continuous reserve accumulation might at some point raise problems for the central bank in controlling monetary growth. The assessment of the recent experience of exchange reserve accumulation in emerging countries shows evidences that such countries have so far been successful in sterilising reserve operations (Mohanty and Scatigna, 2004; Mohanty and Turner, 2006). On one hand, carrying costs have been low or even negative in an important number of countries (including China, India and South Korea), although they have been high in some countries (Brazil and Indonesia). On the other hand, many central banks may have used reserve accumulation to expand the monetary base to deliberately ease monetary policy in an environment of low inflation and large excess capacity. Due to the effectiveness of official foreign exchange
3 According to Frenkel (2006, p.579), “a competitive RER [real exchange rate] involves the distortion of domestic relative prices in favor of tradable activities against nontradable activities: the combination of higher protection for local activities that compete with imports with a higher competitiveness for export activities. Consequently, the RER affects the employment growth rate in the long run due to its influence on the output growth rate, through its incentive on investment in tradable activities that accelerates productivity growth and generates positive externalities in other sectors”. 4 Cost of sterilisation is calculated as the spread between the domestic and the US one-year Treasury bill rate, applied to the total outstanding stock of foreign exchange reserves in domestic currency.
3
intervention and low inflation environment, real exchange rate have not risen significantly (or even fallen) in many countries with large and persistent current account surplus.
Another possibility to enhance the management of exchange rate regime (that is not excluding with official intervention) in emerging countries is the use ‘capital management techniques’ that includes ‘capital controls’, that is norms that manage volume, composition, and/or allocation of international private capital flows, and/or ‘prudential domestic financial regulations’, that refer to policies, such as capital-adequacy standards, reporting requirements, or restrictions on the ability and terms under which domestic financial institutions can provide to certain types of projects (Epstein et al, 2003, p.6-7). Capital controls can be used for different sometimes related objectives, such as (i) to reduce the vulnerability of a country to financial crises, including capital flight during any currency crisis; (ii) to drive a wedge between onshore and offshore interest rates in order to provide monetary authorities with some policy autonomy at least in the short-run; (iii) to maintain some short-term stability of nominal exchange rate and to reduce exchange rate pressures derived from excessive capital inflows. For this purpose capital controls can be used to change the composition and maturity structure of flows (towards longer maturity flows) and to enhance monetary authorities’ ability to act in the exchange foreign market.
Although the effectiveness of capital controls are very controversial5, evidence suggests that the macroeconomic benefits of capital management techniques can outweigh the microeconomic costs as show some recent experiences. Magud and Reihart (2006) review more than 30 papers that evaluated capital controls either on inflows or outflows around the world (the evaluation excludes countries with comprehensive capital controls, such as China and India), making use of a capital controls effectiveness index in order to standardize the results of the empirical studies. They conclude that “capital controls on inflows seem to make monetary policy more independent; alter the composition of capital flow; reduce real exchange rate pressures (although the evidence is more controversial)”, but “seem not to reduce the volume of net flows (and hence, the current account balance)” (Magud and Reihart, 2006, p.26), while “limiting private external borrowing in the ‘good times’ plays an important prudential role because more often than not countries that are ‘debt intolerant’” (Magud and Reihart, 2006, p.26-7). In the same connection Ho and McCauley (2003, p.34) concludes that “recent experience has shown that capital controls, if properly designed and applied, can be helpful in protecting the economy against the desestabilising aspects of capital flows, supporting the implementation of other policies and even resolving certain types of policy dilemma”.
3. Exchange rate regimes, capital account convertibility and economic performance: the recent experience of BRICs countries
3.1. Brazil
Since beginning of the 1980s, Brazilian economy has had a low and volatile growth: between 1981 and 2006, the average GDP growth was 2.2%, contrasting with economic growth of 7.1% in 1947-1980, that was during the period of import substitution industrialisation (ISI). Low economic growth (2.1% in 1990-2006) has been the result of high inflation (until June 1994), the external vulnerability caused by the financing needs of balance of payments (at least until 2002) and also by the effects of the very high real interest rates (around 11% in 1999-2006 on average). As a result, investment rate has been low and stable for years (Table 1). On the other hand, after three decades of high inflation, the combination of desindexation of the economy, huge reduction of import taxes, high interest rates and exchange rates appreciation, under the auspicious of the Real Plan, launched in July 1994, resulted in the sharp decrease of inflation: in 1995, consumer price index fell to 22.4%, and in 1998 reached 1.7%. Indeed, since beginning of the 1990s, Brazil has followed a pattern of economic development, which in broader terms was inspired by Washington Consensus, that includes a set of liberalising and market friendly policies such as privatization, trade liberalisation, stimulus to foreign direct investment (FDI), financial liberalisation, social security reform, and price stabilisation. 5 Criticism on capital controls are partially related to the possible benefits of capital account liberalisation, that are: increased opportunities for risk diversification, a higher efficiency of global allocation of savings, and external discipline on domestic macroeconomic policies (Fisher, 1998). However, empirical evidence of capital account liberalisation upon economic performance is ambiguous while their links with financial crises are quite evident. Economists of IMF (Prasad et al, 2003, p.3) resume the empirical findings of the literature: “a systematic examination of the evidence suggests that is difficult to establish a robust causal relationship between the degree of financial integration and output growth performance”.
4

Table 1. Brazil - basic economic indicators1990 1991 1992 1993 1994 1995 1996 1997 1998 1999 2000 2001 2002 2003 2004 2005
GDP real growth (% p.a.) -4.4 1.0 -0.5 4.7 5.3 4.4 2.2 3.4 0 0.3 4.3 1.3 2.7 1.2 5.7 2.9Gross fixed capital formation(%GDP) 17.3 18.3 18.4 19.3 20.7 20.5 19.3 19.9 19.7 18.9 19.3 19.5 18.3 17.8 19.6 19.9Consumer price index (% p.a.) 1621.0 472.7 1119.1 2477.1 916.5 22.4 9.6 5.2 1.7 8.9 6.0 7.7 12.5 9.3 7.6 5.7Fiscal balance (%of GDP) ... 26.5 44.3 59.6 24.7 6.6 5.3 5.5 7.0 5.3 3.4 3.3 4.2 4.7 2.4 3.0Public debt (% of GDP) 42.01 34.14 37.06 32.56 30.01 27.98 30.72 31.83 38.94 44.53 45.54 48.44 50.46 52.36 46.99 46.45Exchange rate average (real/USD) 0.0000 0.0001 0.0016 0.0322 0.6393 0.9177 1.0051 1.0780 1.1605 1.8147 1.8301 2.3577 2.9208 3.0771 2.9251 2.4344Intern.reserves(excl.gold,USD million 7441 8033 22521 30604 37070 49708 58323 50827 42580 34796 32488 35739 37684 49111 52740 53574Current account (% of GDP) -0.8 -0.4 1.6 -0.2 -0.3 -2.4 -2.8 -3.5 -4.0 -4.3 -3.8 -4.2 -1.5 0.75 1.6 1.2International reserves(% of imports) 36.0 38.2 109.6 121.2 112.1 99.5 109.3 85.1 73.7 70.6 58.2 64.3 79.8 101.7 84.0 72.8External debt (% of GDP) 26.3 30.5 35.1 33.9 27.3 20.1 21.4 23.0 28.6 41.1 36.6 37.9 41.8 38.8 30.3 19.2External debt/exports ratio 3.9 3.9 3.8 3.8 3.4 3.4 3.8 3.8 4.7 5.0 4.3 3.6 3.5 2.9 2.1 1.4Income debt (% of exports) 40.6 33.4 25.5 30.2 25.9 31.3 36.7 40.9 48.0 47.4 39.0 39.5 35.6 30.0 24.6 24.6Trade balance (USD million) 10747 10578 15239 14329 10861 -3157 -5453 -6652 -6603 -1261 -698 2650 13121 24794 33666 44757Current account (USD million) -3823 -1450 6089 20 -1153 -18136 -23248 -30491 -33829 -25400 -24225 -23215 -7636.6 4177.29 11737.6 14198.9Source: IMF - International Financial Statistics; IPEADATA (GDP growth, CPI, fiscal balance and public debt)
Since the beginning of the 1990s until nowadays, Brazil implemented different strategies of economic
policy: in 1990-1994 period economic policy was based in a crawling peg exchange rate regime with nominal diary devaluations, that resulted in a depreciated real exchange rate6, and a policy of high real interest rates; such policy generated both high trade balance surplus and the attraction of capital flows, at the costs of a very high inflation (Table 1). The period from July 1994 until January 1999, period of the Real Plan, is characterised by the use of a nominal anchor (a crawling exchange rate band) for stabilisation purposes and the implementation of a very tight monetary policy, that resulted in a huge exchange rate overvaluation, and the consequent increase of both trade deficits and capital inflows. This period is also marked by the contagious of external crises, such as Mexican crisis, Asian crisis and Russian crisis. Under the context of the semi-pegged exchange rate, Central Bank of Brazil (BCB) reacted to the capital flight increasing sharply interest rates in order to seek reverting capital outflows (Figure 4).
Figure 2. Brazil - nominal exchange rate
0
0.5
1
1.5
2
2.5
3
3.5
4
1994
08
1995
03
1995
10
1996
05
1996
12
1997
07
1998
02
1998
09
1999
04
1999
11
2000
06
2001
01
2001
08
2002
03
2002
10
2003
05
2003
12
2004
07
2005
02
2005
09
2006
04
2006
11
Source: Central Bank of Brazil
Figure 3. Brazil - real effective exchange rate(June 1994=100)
020406080
100120140160180
1990
01
1990
10
1991
07
1992
04
1993
01
1993
10
1994
07
1995
04
1996
01
1996
10
1997
07
1998
04
1999
01
1999
10
2000
07
2001
04
2002
01
2002
10
2003
07
2004
04
2005
01
2005
10
2006
07
Source: Central Bank of Brazil
After the Brazilian currency crisis in January 1999, Brazil adopted a new economic policy based on
the following guides: floating exchange rate regime, inflation targeting regime and the generation of primary fiscal surpluses7, that has resulted in interest rates lower than the former period (1995-1998) but still high, and volatile exchange rates. In general inflation rate has been higher than the former period while since 2002 there is a remarkable improvement in the external sector balance due to the increase of the trade balance surplus favoured initially by the exchange rate devaluation and later by the increase in both demand and prices of the commodities in the international trade. The modus operandi of inflation targeting regime plus the a floating exchange rate regime, under the conditions of operation of (almost) full opening of the capital account, has 6 Real effective exchange rate index (REER) is defined as a nominal effective rate index (index of the period average exchange rate of the currency in question to a weighted average of exchange rates for the currencies of selected countries) adjusted for relative movements in national price of home country and selected countries. It should be stressed that REER in Brazil and other Latin American countries is calculated differently from the most conventional way, that is REER is calculated by multiplying the nominal exchange rate by the inflation rate of home country and dividing by that of a partner country, while most frequently (as in case of China, India and Russia in this paper) REER calculated by multiplying the nominal exchange rate by the inflation rate of a partner country and dividing by that of home country. As a result in the case of Brazil when REER increases this means undervaluation and when it declines means overvaluation. 7 Fiscal primary surplus rose from 0.0% of GDP in 1998 to 3.2% in 2002, reaching 4.4 in 2003 and almost 5.0% in 2005.
5

resulted in a sharp instability of the nominal exchange rate (Figure 2). Capital flight induced an exchange rate devaluation that affected domestic prices, which frequently jeopardized the BCB’s inflation target – the targets were missed in 2001-20038. Under these conditions, BCB has been compelled to increase the interest rate in order to seek to reduce the ‘pass through effect’ – as it was the case in 2001 in view of the turbulence of international markets and again in 2002-03 due to the confidence crisis related to the election of the leftist Lula da Silva as President. The BCB’s reaction to exchange rate movements has caused frequently a decline in output and employment, increasing at the same time the volume of public debt (Table 1). More recently, favoured by the benign international environment, BCB has gradually reduced short-term interest rate.
Capital flows legislation in Brazil was introduced in the 1960s, according to which foreign capital flows should be registered in order to obtain permission for associated outflows (profits, interests, royalties, and repatriation). Since the end of the 1980s it can be noted an increasing trend towards capital account liberalisation in Brazil. Early 1990s foreign direct investment (FDI) was further liberalised as prohibition on FDI into certain sectors was lifted and bureaucratic obstacles were reduced. In 1991 Brazilian government permitted the acquisition by foreign institutional investors of equities of domestic firms. In 1992 BCB allowed a broad liberalisation of capital outflows as it permitted that a special non-resident account called CC5 could be operated more freely by foreign financial institutions as a result of acquisition or sale of foreign currencies. This exception created a privileged way to short-term capital flight that was used very often during periods of speculation attacks on domestic currency and represented the introduction of de facto convertibility, as in practice residents could deposit in a non-resident bank’s account held in a domestic bank, that could convert domestic into foreign currency: residents could transfer resources abroad making these deposits and asking the non-resident financial institution to buy foreign currency to make deposit in an account abroad9. In April 1994 Brady Plan converted the external loans into debt securities, helping to overcome the external debt crisis that had contributed somehow to the ‘stagflation’ environment of Brazil since 1981. In 1994 BCB implemented a financial transaction tax10 and increased the minimum maturity requirements for capital inflows in order to reduce upward pressure on the exchange rate, to minimise the cost of sterilisation and to give some freedom degree for monetary policy.11 At the same time, measures aimed to stimulate outflows – including the permission for prepayment of foreign borrowing and import finance – were also adopted.
Figure 4. Brazil - Selic interest rate
0102030405060708090
1994
08
1995
03
1995
10
1996
05
1996
12
1997
07
1998
02
1998
09
1999
04
1999
11
2000
06
2001
01
2001
08
2002
03
2002
10
2003
05
2003
12
2004
07
2005
02
2005
09
2006
04
2006
11
Source: Central Bank of Brazil
Figure 5. Brazil - consumer price index (% p.a.)
0
5
10
15
20
25
1995 1996 1997 1998 1999 2000 2001 2002 2003 2004 2005Source: IMF
After the 1999 Brazilian currency crisis and the adoption of a floating exchange regime, economic authorities implemented a lot of norms that resulted in further financial liberalisation (mainly related to capital outflows) and greater flexibility in foreign exchange market, including the unification of the exchange rate markets (floating and free ones), the reduction and later elimination of both the minimum average maturity for external loans and the financial transaction tax on capital inflows, the elimination of the restrictions on investments in the securities markets by foreign investors, and the simplification of the procedures related to the capital remittance to other countries12. In November 1999, Brazil accepted the obligations under Article 8 Inflation targets were 4.0% in 2001, 3.5% in 2002, and 3.5% in 2003 (later it was changed to maximum limit of 8.5%), with tolerance intervals of ± 2%; the consumer price index(IPCA) was 7.7%, 12;5% and 9.3%, respectively in 2001, 2002 and 2003. 9 Goldfajn and Minella (2005) report the norms on capital controls in Brazil. 10 The financial transaction tax was from 5% to 9% to Foreign Funds on Securities in October 1994. 11 According Ariyoshi et al (2000) these capital controls were not effective in Brazil as capitals inflows increased a great deal and sophistication of financial system enable participants to circumvent most controls. 12 In March 2005, Central Bank of Brazil authorized individuals and corporates to make transfer of resources abroad through their own bank accounts, a simplification in the norms that meant the end of CC-5 account.
6

VIII of the IMF, that precludes the country members from imposing restrictions on the meaning of payments and transfers for current international transactions. More recently, in August 2006, Brazilian government introduced more flexibility on the exports operations’ exchange rate coverage as now it is allowed that Brazilian exporters can maintain abroad the maximum of 30% of their exports incomes.
There are some controversies related to the macroeconomic effects of financial liberalisation in Brazil. Goldfajn and Minella (2005), for instance, support that, in order to reap the benefits of capital account liberalisation, such liberalisation should be accompanied by a broad range of reforms to improve and foster stronger institutions – such as approval of de jure central bank independence. However, the empirical findings suggest that financial liberalisation in Brazil resulted in greater exchange rate volatility and higher domestic interest rate – probably as consequence of the reduction of barriers to capital outflows. Ono et al (2005), using a VAR model with the objective to evaluate the relation between capital controls, exchange rate and interest rate in Brazil during 1990-2001, found the following results: (i) the relation between short-term interest rate (Selic) and capital controls is negative, so that an increase (decrease) the former should result in the reduction (increase) in the interest rate; (ii) nominal exchange rate does not respond to the variations in the capital controls, what suggests that there is no evidence that capital controls generate an increase the exchange rate volatility, a hypothesis suggested by some Brazilian economists (Arida, 2004).
Figure 6. Brazil - capital flows (liabilities, US$ million)
-40000
-30000
-20000
-10000
0
10000
20000
30000
40000
50000
60000
1990
1991
1992
1993
1994
1995
1996
1997
1998
1999
2000
2001
2002
2003
2004
2005
Direct investmentPortfolio investmentOther investmentsTotal capital flows
Source: IMF
As we have seen, during the period of semi-pegged exchange rate regime BCB defined the nominal
exchange rate inside a narrow band; after the 1999 devaluation of the real (Brazilian currency), however, BCB has had no commitment to determine exchange rate (both nominal and real), although it has operated occasionally in the exchange foreign markets in periods of greater capital flows volatility and more recently according to its policy to accumulate exchange reserves13. Therefore, Brazilian exchange rate regime is not a freely floating exchange regime, as BCB eventually intervenes in foreign exchange market, but it is closer to a floating exchange regime than other emerging countries. Since end of 2002 real exchange rate has had an overvaluated trend due to both increase of trade surplus and capital flows. The latter has been attracted by high yield differentials between domestic and foreign bonds. As can be seen in Figure 6, the resumption of capital flows was dominated by portfolio investment (equity and debt securities) until 1997, while the decline in the capital flows was commanded by portfolio investments and other investments14. Portfolio investments have played a crucial role in the large capital flow swings associated with the financial crisis. Since 1998 FDI has prevailed as the main source of capital flows. According to ECLAC (2000, p.35-6), Brazil was since 1996 the second-largest destination for FDI among developing countries, although the volume of FDI has declined more recently.
13 Souza and Hoff (2006), using Calvo-Reihart’s fear of floating indicators, show that from January 1999 to December 2005 the frequency that monthly variation of exchange rate exceeded the band of ± 2.5% was 52% in Brazil, compared to 27% in other emerging countries of Latin America, and to 19% in Asian emerging countries. 14 ‘Other investments include short-and long term trade credits, loans, currency and deposits (transferable and other), etc.
7
External vulnerability was a marked feature in Brazil since mid-1990s due mainly the dependence of foreign capital in order to reach some equilibrium in the balance of payments and also a result of the gradual but increasing opening up of capital account. Indeed, the ratio external indebtedness to exports, a traditional indicator of external solvency, was up to 3.0 until 2002. Due to the current account deficits, that reached more than 4% in 1998, Brazilian economy was very dependent of foreign capitals by the end of the 1990s, what left the economy very vulnerable to external contagious (Paula and Alves Jr, 2000). Even after the adoption of a floating exchange regime, in 1999, Brazilian economy suffered strong speculative pressures in 2001 and 2002, when there was eventually a situation of ‘sudden stop’ of capitals, derived by the lost of confidence of investors caused by the likely election of Lula’s candidate. The growth of exports since 2002 and the quick reduction of external indebtedness have resulted in an improvement of the indicators of external vulnerability: the ratio foreign debt over exports declined from 2.5% in 2002 to 1.4% in 2005. At the same time, foreign reserves have increased due to the foreign reserve accumulation policy that has been implemented by BCB. However, sterilisation operations have been costly to Brazilian government, due to the high interest rate differential between domestic and international bonds - public debt has been more or less in the same level despite of the fiscal primary surplus. 3.2 Russia
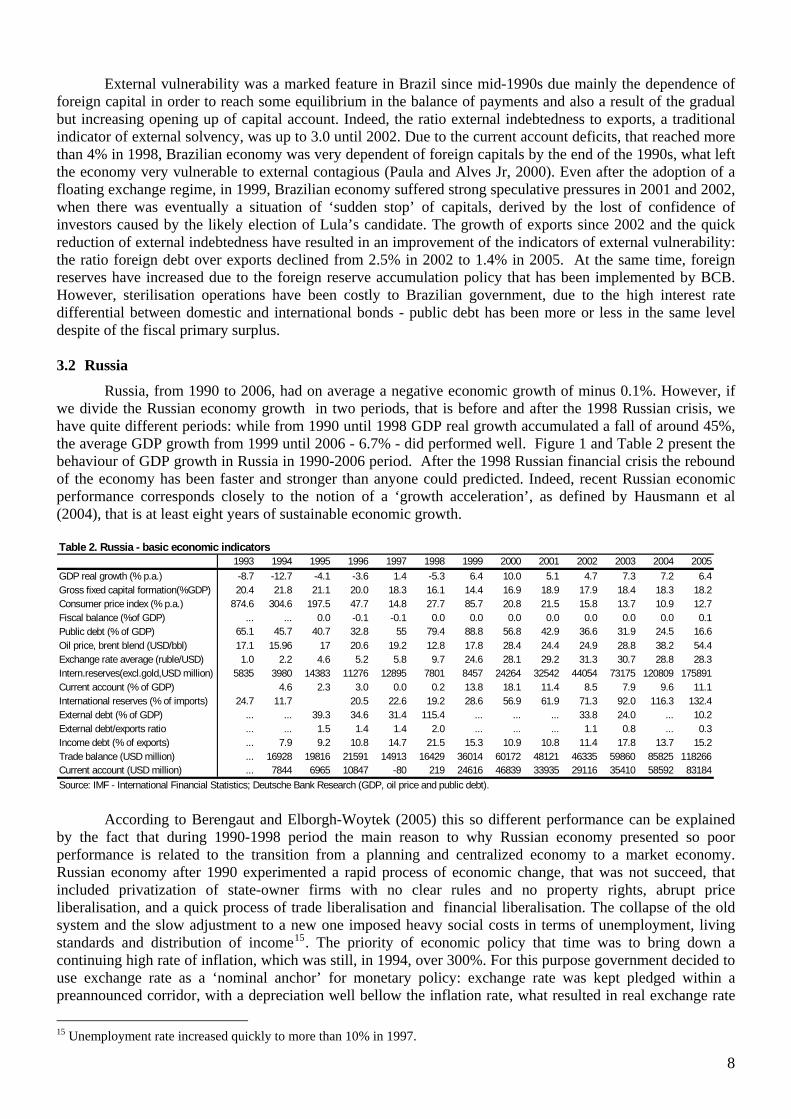
Russia, from 1990 to 2006, had on average a negative economic growth of minus 0.1%. However, if we divide the Russian economy growth in two periods, that is before and after the 1998 Russian crisis, we have quite different periods: while from 1990 until 1998 GDP real growth accumulated a fall of around 45%, the average GDP growth from 1999 until 2006 - 6.7% - did performed well. Figure 1 and Table 2 present the behaviour of GDP growth in Russia in 1990-2006 period. After the 1998 Russian financial crisis the rebound of the economy has been faster and stronger than anyone could predicted. Indeed, recent Russian economic performance corresponds closely to the notion of a ‘growth acceleration’, as defined by Hausmann et al (2004), that is at least eight years of sustainable economic growth.
Table 2. Russia - basic economic indicators
1993 1994 1995 1996 1997 1998 1999 2000 2001 2002 2003 2004 2005GDP real growth (% p.a.) -8.7 -12.7 -4.1 -3.6 1.4 -5.3 6.4 10.0 5.1 4.7 7.3 7.2 6.4Gross fixed capital formation(%GDP) 20.4 21.8 21.1 20.0 18.3 16.1 14.4 16.9 18.9 17.9 18.4 18.3 18.2Consumer price index (% p.a.) 874.6 304.6 197.5 47.7 14.8 27.7 85.7 20.8 21.5 15.8 13.7 10.9 12.7Fiscal balance (%of GDP) ... ... 0.0 -0.1 -0.1 0.0 0.0 0.0 0.0 0.0 0.0 0.0 0.1Public debt (% of GDP) 65.1 45.7 40.7 32.8 55 79.4 88.8 56.8 42.9 36.6 31.9 24.5 16.6Oil price, brent blend (USD/bbl) 17.1 15.96 17 20.6 19.2 12.8 17.8 28.4 24.4 24.9 28.8 38.2 54.4Exchange rate average (ruble/USD) 1.0 2.2 4.6 5.2 5.8 9.7 24.6 28.1 29.2 31.3 30.7 28.8 28.3Intern.reserves(excl.gold,USD million) 5835 3980 14383 11276 12895 7801 8457 24264 32542 44054 73175 120809 175891Current account (% of GDP) 4.6 2.3 3.0 0.0 0.2 13.8 18.1 11.4 8.5 7.9 9.6 11.1International reserves (% of imports) 24.7 11.7 20.5 22.6 19.2 28.6 56.9 61.9 71.3 92.0 116.3 132.4External debt (% of GDP) ... ... 39.3 34.6 31.4 115.4 ... ... ... 33.8 24.0 ... 10.2External debt/exports ratio ... ... 1.5 1.4 1.4 2.0 ... ... ... 1.1 0.8 ... 0.3Income debt (% of exports) ... 7.9 9.2 10.8 14.7 21.5 15.3 10.9 10.8 11.4 17.8 13.7 15.2Trade balance (USD million) ... 16928 19816 21591 14913 16429 36014 60172 48121 46335 59860 85825 118266Current account (USD million) ... 7844 6965 10847 -80 219 24616 46839 33935 29116 35410 58592 83184Source: IMF - International Financial Statistics; Deutsche Bank Research (GDP, oil price and public debt).
According to Berengaut and Elborgh-Woytek (2005) this so different performance can be explained by the fact that during 1990-1998 period the main reason to why Russian economy presented so poor performance is related to the transition from a planning and centralized economy to a market economy. Russian economy after 1990 experimented a rapid process of economic change, that was not succeed, that included privatization of state-owner firms with no clear rules and no property rights, abrupt price liberalisation, and a quick process of trade liberalisation and financial liberalisation. The collapse of the old system and the slow adjustment to a new one imposed heavy social costs in terms of unemployment, living standards and distribution of income15. The priority of economic policy that time was to bring down a continuing high rate of inflation, which was still, in 1994, over 300%. For this purpose government decided to use exchange rate as a ‘nominal anchor’ for monetary policy: exchange rate was kept pledged within a preannounced corridor, with a depreciation well bellow the inflation rate, what resulted in real exchange rate 15 Unemployment rate increased quickly to more than 10% in 1997.
8

appreciation (Figure 7 and 8). Russian government started a gradual liberalisation of restrictions on non-resident portfolio investment in 1994 that was completed in early 1998.16 The weak performance of trade combined with a tight monetary policy, under a context of disordered transition to capitalism, contributed to the very bad economic performance in 1990-1998 period.
According to Owen and Robinson (2003, p.25-26), the seeds of the 1998 Russian financial crisis were related to some economic unbalances: a large budget deficit (7.4% of GDP in 1996) arising from the government inability to collect taxes and contain expenditure; a large short-term domestic debt; the lack of structural reform in banking, natural monopoly, and agricultural sectors. Furthermore, the Asian crisis by contributing to weakening commodity prices (especially oil) sparked a sharp deterioration in Russia’s terms of trade – what resulted in a sudden decline in the trade balance from US$ 21.6 billion in 1996 to US$ 14.9 billion in 1997; the contagious of the Asian crisis substantially increased the cost of access and reduced the volume of foreign capitals (Owen and Robinson, 2003, p.5). Under such environment, Russian authorities got a financing package with IMF, the World Bank and Japan, and announced emergency measures in August 1998 – that included a default on rubble-denominated government debt maturing before end-1999, an adjustment to the exchange rate band from 5.3-7.1 rubbles before end-1999 and the reintensification of capital controls – in an attempt to quell the pressure on reserves. However, negative market reaction, reflecting the fragile remained fiscal situation, forced rubble to fall quickly to the edge of the new exchange band and the band was abandoned on September 2, leaving the exchange rate to float. Losses in international reserves were by US$ 5.1 billion in 1998 and consumer prices rose very sharply, with inflation reaching 86% p.a. in 1999.
Figure 7. Russia - official exchange rate
(rubbles per USD - period average)
0
5
10
15
20
25
30
35
1992
q03
1993
q02
1994
q01
1994
q04
1995
q03
1996
q02
1997
q01
1997
q04
1998
q03
1999
q02
2000
q01
2000
q04
2001
q03
2002
q02
2003
q01
2003
q04
2004
q03
2005
q02
2006
q01
2006
q04
Figure 8. Russia - NBER and REER (period average; index number 2000=100)
0
100
200
300
400
500
600
1994
q01
1994
q04
1995
q03
1996
q02
1997
q01
1997
q04
1998
q03
1999
q02
2000
q01
2000
q04
2001
q03
2002
q02
2003
q01
2003
q04
2004
q03
2005
q02
2006
q01
Nominal Effective Exchange Rate
Real Effective Exchange Rate
Source: IMF/International Financial Statistics
The initial output collapse that followed the August 1998 crisis in Russia was not as deep as in most other crisis countries and recovery was quicker and stronger than other crisis countries due to a set factors that include: (i) import substitution stimulated by large exchange rate depreciation; (ii) the fact that channels through shocks are generally transmitted to the real economy in crisis situations were less relevant in the case of Russia than in other emerging market economies, as private sector wealth was largely held outside the banking sector, and relatively few enterprises had significant foreign currency liabilities not matched by foreign currency income streams; and (iii) the positive terms of trade change from rising oil prices gave a further boost to the economy from mid-1999, and allowed a quick recovery of international reserves (Owen and Robinson, 2003, p.7-9). Furthermore, Central Bank of Russia (CBR) acted quickly to address the problems in the banking sector, improving rapidly liquidity situation of the banks, what avoided general run on deposits and at the same time enhanced the payments system.
As we have already stressed, growth performance after the Russian crisis has been strong contrasting with the pre-crisis period. By 2000 high oil prices - the average oil price increased from US$ 12,8 in 1998 to US$ 28,4 in 2000 - contributed to a quick rise in investment rate of the economy (Table 2). Furthermore, the rise of aggregate demand also contributed to boost economic growth, favoured by the increase in both pensions and wages, the increase of net exports, and the decline of interest rates due to the adoption of a more expansionary monetary policy (Figure 9), that has stimulated the increase of banking credit, from 12% of GDP in 1999 to 22% in 2003 (IMF, 2004, p.10). Energy sector has direct impact on output growth, as it contributes
16 Non-residents were allowed to open special rubble-denominated bank accounts with which to buy government securities in either the primary or secondary markets. See more in Ariyoshi et al (2000, Ch 2).
9

about 20% of GDP, and indirectly as it pushes other industrial sector (such as construction and machinery). However, the economic recovery was broad-based as large real exchange rate depreciation in late 1998 provided a strong boost to the competitiveness of the tradable sector which was translated into a surge in the output in many sectors of the economy (Owen and Robinson, 2003, p.51).
Pushed by the increase of the oil prices (US$ 54.4 in 2005), trade balance increased from US$ 16.4 billion in 1998 to US$ 36.0 billion in 1999, rising steadily until to reach US$ 118.3 billion in 2005, despite of the recent deterioration of non-fuel trade balance; as a result, the ratio current account over GDP increased from 0.2% in 1998 to 11.1% in 2005. Foreign reserves were until 1999 relatively low to satisfy the needs of imports of goods by the Russian economy, as they covered on average only 20% of the Russian imports. However, since 2002 the ratio international reserves over imports have been around 88% on average. The continuous and sharp increase of foreign reserves, from US$ 8.5 billion in 1999 to US$ 175.0 billion in 2005, is due to an aggressive foreign reserves accumulation policy under a context of high current account surplus and capital flows reversal after 2002. Indeed, all the external vulnerability indicators have had a very clear improvement since 1999, as can be seen in Table 2. In particular, the external debt-to-exports ratio declined from 2.0 in 1998 to only 0.3 in 2005. After many years of massive capital outflows, capital flows have changed course in 2002, with significant reduction in capital outflows and a surge in capital inflows, including higher borrowing (Figure 9). The combination of a prolonged period of high world energy prices with some capital account surplus has generated a real exchange rate trend, that has gradually returned to its pre-crisis level, despite of the efforts of CBR to attenuate this trend (Figure 8). As nominal exchange rate has been stable, due to the active performance of CBR in the foreign exchange market, the bulk of real appreciation took the form of a persistently high inflation differential. The continued rapid real appreciation has raised the risk of ‘Dutch disease’ that can reduce the efforts of diversification of the Russia’s production and export structure – a current concern of the Russian government.
Figure 9. Russia - capital flows (liabilities, US$ million)
-20000
-10000
0
10000
20000
30000
40000
50000
60000
1994 1995 1996 1997 1998 1999 2000 2001 2002 2003 2004 2005
Direct investmentPortfolio investmentOther investmentsTotal capital flows
Source: IMF Russia have adopted after the 1998 crisis an administered floating exchange regime, under a context of
capital account partially convertibility. CBR has pursued multiple objectives, avoiding an unnecessarily tight monetary policy for fear of slowing output growth. The main goal of the CBR has been to accumulate reserves and to prevent overly rapid real exchange rate appreciation, by maintaining nominal effective exchange rate stable, in an effort to preserve the competitiveness of manufacturing sector, and also to smooth the path of exchange-rate adjustment, while guiding down inflation has been an important, but secondary, objective.17 Inflation, though still high, has continued to edge downwards each year despite relatively lax monetary conditions (Figure 10 and 11). Russian government makes use of some sort of capital controls on inflows and outflows, although more recently it has liberalized again some foreign exchange transactions. Controls on capital outflows include the requirement permission from the CBR to portfolio investment abroad and the need that Russian credit institutions have to create reserve for operations with offshore residents (Mohanty and
17 Several econometric studies conclude that monetary policy has tended to focus on an implicit exchange rate target since the late 1990s. See, among others, Esanov et al (2005).
10

Scatigna, 2005, p.52). In 2004 CBR implemented requirement reserves on capital inflows, with a moderate use, justified by the needs to protect the still weak banking sector from the more volatile capital flows. Other restrictions on capital inflows include the requirement of permission to CBR to raise capital abroad.
Figure 11. Russia - consumer price index(% p.a.)
0
50
100
150
200
250
300
350
1994 1995 1996 1997 1998 1999 2000 2001 2002 2003 2004 2005
Figure 10. Russia - interest rates (%)
0
50
100
150
200
250
300
1995
q04
1996
q03
1997
q02
1998
q01
1998
q04
1999
q03
2000
q02
2001
q01
2001
q04
2002
q03
2003
q02
2004
q01
2004
q04
2005
q03
2006
q02
Money market rate
Lending rate
Refinancing rate
Source: IMF/International Financial Statistics
Large-scale foreign exchange purchases by CBR – via unsterilised interventions - have been combined with large fiscal surplus. According to Owen and Robinson (2002, p.12), fiscal restraint in the face of burgeoning oil revenues allowed the government to quickly rebuild international reserves while slowing the real appreciation of the rubble. Since 1999 fiscal position strengthened due to a remarkable fiscal adjustment of 9.5% of GDP from 1997 to 2001, that resulted from both higher oil revenues and a reduction of real government expenditures. While in 2002 and 2003 fiscal surplus has declined compared to the previous period, it increased sharply in 2004 and 2005 (4.9% and 7.5% of GDP, respectively), due to the extra fiscal revenue arising from higher oil prices since 2002.
The Oil Stabilisation Fund18, established in 2004, in which the bulk of the windfall fiscal revenue is accumulated, plays a crucial role in maintaining the fiscal surplus. In 2005, around two-thirds of the increase in revenues from oil, gas and oil product exports was actually sterilized through the Stabilisation Fund. Some flexibility in the fiscal policy was introduced in 2006 with the creation of an Investment Fund in the federal budget. The aim of the fund is to finance infrastructure investment and innovation related projects in joint public-private partnerships (PPPs). The sums involved have been relatively small – around 0.26% of projected GDP for 2006 and 0.34% in 2007. 3.3. India
India, after years of low economic growth and after facing a financial crisis in 1991, has had a dramatic change in economic growth: the real GDP growth was on average 6.5% in 1990-2006 (Figure 1 and Table 3), while it was 3.1% in 1971-1980 and 4.7% in 1981-1990 (Ariff and Khalid, 2005, p.97). Although India still has an enormous lack of infra-structure, investment rate has increased from around 22% in the first half of the 1990s to around 24% during the 2000s. This good economic performance has been the result, among other factors, of the enormous potential of its domestic consumer market, the existence of a segment of well-qualified workers, the strong productivity growth (more than 3.5% over the course of the 1990s), the management of a well-coordinated economic policy, and the implementation of economic reforms. Capital account liberalisation has been part of a broad-based programme of economic reform, that included the abolishment of industrial license, the sharp reduction in the import taxes, liberalisation of the transactions related to the current account and a more limited liberalisation of the capital flows related to the capital account.
18 The Oil Stabilisation Fund (OIF) was created in 2004 with the objective of reducing the impact of fluctuations of oil prices on the resources available to the budget. ‘Surplus’ revenues resulting from relatively high oil prices are accumulated in the Fund automatically: 95% of the income from the natural resource extraction tax and 100% of the crude oil export duty above that which would accrue at on oil price of $27/bbl (Urals) is automatically transferred to the Fund. Until the Fund accumulates a total of RUB 500 billion, Stabilisation Fund may be spend only to finance the federal deficit arising as a result of oil prices below the cut-off price of $27 for Urals crude(OECD, 2006,Ch 2).
11

Table 3. India - basic economic indicators1990 1991 1992 1993 1994 1995 1996 1997 1998 1999 2000 2001 2002 2003 2004 2005
GDP real growth (% p.a.) 5.8 0.9 5.3 4.9 7.6 7.5 7.4 4.5 6.0 7.1 3.9 5.2 4.6 8.3 7.3 9.0Gross fixed capital formation(%GDP) 22.9 22.0 22.4 21.4 21.9 24.4 22.8 21.7 21.5 23.3 22.7 23.1 24.1 24.7 25.9 ...Consumer price index (% p.a.) 9.0 13.9 11.8 6.4 10.2 10.2 9.0 7.2 13.2 4.7 4.0 3.7 4.4 3.8 3.8 4.2Fiscal balance (%of GDP) -7.6 -5.5 -5.3 -7.0 -5.6 -5.0 -4.9 -4.9 -5.3 -5.4 -5.2 -4.7 -5.9 -4.5 -4.0 -4.1Public debt (% of GDP) ... ... 84.5 83.9 77.9 71.4 67.8 68.3 69.5 69.9 71.1 82.7 85.5 82.1 86.0 83.1Exchange rate average (ruppe/USD) 17.5 22.7 25.9 30.5 31.4 32.4 35.4 36.3 41.3 43.1 44.9 47.2 48.6 46.6 45.3 44.1Intern.reserves(excl.gold,USD million) 5504 6841 8961 13916 23366 22046 24212 27933 30216 35744 40793 48819 71049 103582 131830 136932Current account (% of GDP) -2.2 -1.7 -1.6 -0.7 -0.5 -1.6 -1.6 -0.8 -1.7 -0.7 -1.0 0.3 1.4 1.1 ... ...International reserves (% imports) 23.5 32.4 39.1 57.7 78.7 58.1 55.3 61.1 67.4 78.5 75.7 95.3 129.9 151.9 ... ...External debt (% of GDP) 26.7 32.5 37.6 34.9 32.2 26.9 24.5 23.2 23.8 22.2 21.8 20.5 20.7 18.8 17.9 ...External debt/exports ratio 3.2 2.7 2.3 2.6 2.8 3.4 3.7 4.0 4.0 4.3 4.4 4.7 4.6 5.1 5.2 ...Income debt (% of exports) 20.6 23.9 21.8 19.1 17.5 17.0 14.1 14.3 16.3 15.8 17.5 17.7 14.1 14.0 ... ...Long-term debt (% external debt) 86.6 87.7 87.6 90.8 91.6 92.1 91.4 93.9 95.3 96.0 96.5 97.0 96.1 95.4 93.5 ...Trade balance (USD million) -5150.9 -2992 -2911.2 -2092.5 -4150.1 -6718.8 -10052 -10028 -10752 -8678.9 -10640 -6417.9 -3559.3 -8870.2 ... ...Current account (USD million) -7037 -4292 -4485 -1876 -1676 -5563 -5956 -2965 -6903 -3228 -4601 1410 7060 6853 ... ...Source: IMF - International Financial Statistics; ADB (fiscal balance in 2002-2005; external debt).
Economic liberalisation accelerated after the external debt crisis of 1991, when rupee, the domestic currency, was depreciated in two steps by almost 20% vis-à-vis the US dollar (see Figure 12); liberalisation began with a dramatic process of trade liberalisation; as a result, the imports tariffs reduced from 87.0% on average in 1991 to 25.0% on average in 1997 (IMF, 2001, p.32). Under the context of economic reform, capital account has been gradually liberalised and the exchange rate regime changed from a pegged exchange rate to a managed floating exchange regime. This change began with the transition of a managed floating related to basket of currencies to a dual exchange rate regime in March 1992. Finally, India adopted a floating and unified exchange rate regime in March 1993. The change in the exchange rate regime was followed step-by-step by flexibility on current account transactions, that resulted in the acceptance of full convertibility of current account in August 1994, that is the formal acceptance of the obligations of the IMF’s Article VII. Although India adopted formally a floating exchange regime, in practice it is a quasi-managed float where the Reserve Bank of India (RBI) plays a crucial role in the foreign exchange market. Indeed, RBI has been an important player in the foreign exchange market, acting to avoid that some big transactions in this market can increase the exchange rate volatility, and at the same time seeking to affect the real effective exchange rate trajectory in the long run. For this purpose, RBI makes use of a very large range of tools operating in the spot and derivative markets, and even making use of administered measures. Such management has been possible due to the existence of extensive capital controls that result in a limited integration into international financial markets.
Compared to other countries that adopted floating exchange regime, the volatility of nominal exchange rate has been lower in India (IMF, 2001, p.152). Exchange rate has been used in India, combined with other extra-exchange rate tools, to absorb external shocks. As a general trend, nominal exchange rate has been gradually devaluated since 1996 (Figure 12 and 13). Real effective exchange rate has been most time stable, while recently there is a gradual appreciation trend. Indeed, during the 1990s RBI followed a PPP rule whereby the nominal exchange rate was indexed to the price level to target the real exchange rate (Kohli, 2005, p.153). Since the end of the 1990s, exchange rate policy has begun to change a little the course, shifting from stabilizing the exchange rate towards a more flexible rate regime with no fixed target, but still concerned in curbing excessive volatility and calibrating temporary mismatches in the demand and supply of foreign exchange.
Figure 12. India - nominal exchange rate (rupee/dollar)
0
10
20
30
40
50
60
1990
q01
1990
q04
1991
q03
1992
q02
1993
q01
1993
q04
1994
q03
1995
q02
1996
q01
1996
q04
1997
q03
1998
q02
1999
q01
1999
q04
2000
q03
2001
q02
2002
q01
2002
q04
2003
q03
2004
q02
2005
q01
2005
q04
Figure 13 India - REER and NEER (export-based weights, annual average)
0
10
20
30
40
50
60
70
80
1990-91
1991-92
1992-93
1993-94
1994-95
1995-96
1996-97
1997-98
1998-99
1999-00
2000-01
2001-02
2002-03
2003-04
2004-05
Real effective exchange rate
Nominal effective exchange rate
Source: Reserve Bank of India
12

As we have already stressed, after 1991 external debt crisis, India began a gradual but rapid process of
liberalisation of current account, that included the end of the foreign exchange budget and the elimination of controls on current transactions. Although some norms related to long term capital flows have been loosened, including the limits of ownership share related to foreign direct investment, short term capital controls are still significant. The approach to capital account liberalisation in India has been cautious: what was liberalised has been specified while everything else remained restricted or prohibited. The contours of liberalisation were in large part shaped by the lessons of the 1991 external debt crisis – mainly problems related to roll over short-term debt and capital flight due to deposits withdrawals by non-resident Indian.
The Indian approach of gradual and limited liberalisation of capital account has emphasized opening up of the economy to foreign direct investment and portfolio equity investment, instead of external debt, with the objective to reduce the country’s vulnerability to external crises by reducing reliance on volatile short-term debt flows that characterized the 1980s (Habermeier, 2000, p.80). First, concerning capital inflows, financial liberalisation began with a more flexible policy related to foreign direct investment (FDI) in July 1991 when FDI with up to 51% equity was to receive automatic approval in 35 selected high priority industries subject only to a registration procedure with the RBI, while access through the automatic route has been progressively enlarged over time. Second, liberalisation was extended to portfolio investment in September 1992, when foreign institutional investors were allowed to invest in the domestic capital market, first in the secondary market for equity subject a ceiling of 5% and later in the primary market (maximum limit of 15% of the new issue). Third, liberalisation in the sphere of external commercial borrowings (ECBs) has been limited, selective and variable. Commercial borrowings require case by case approval from the government where the decision depends upon the amount borrowed, the maturity period and the proposed utilization. Deregulation of ECBs has been subject to annual ceilings decided on the basis of the country’s external debt and balance of payments position. Finally, concerning non-resident deposits, in order to avoid capital flight, Indian government reduced the interest rate differentials (typical of the 1980s), so that interest rates offered to these deposits were gradually aligned with international rates, and RBI has no longer underwritten the exchange rate risk (Nayyar, 2002).
Capital controls in India have been well-designed and clearly effective in limiting measured capital flows. There has been a predominance of quantitative capital controls rather than market based, administratively enforced, and clearly demarcating the distinction between resident (with more strict controls) and non-resident transactions. On the other hand, there are more extensive controls on capital outflows and considerable liberalisation on capital inflows. In particular, capital outflows related to residents are more limited: while they are very restricted to individuals, for domestic firms capital outflows are possible within some limits stipulated by the government. More recently, restrictions on individuals and domestic corporates have been loosened to allow investments abroad.19 Capital controls in India have also been dynamic, that is government tends to tight capital controls on outflows during speculative periods and to loose them after that (Epstein et al, 2003, p.30).
Due mainly to the increase of foreign exchange reserves and the limits to accumulation of foreign debt (mostly short-term ones), most external vulnerability indicators show a remarkable and continuous improvement since 1991: the ratio current account over GDP has been below to -2.0%, and since 2001 the ratio has been positive, due mainly to the increase of services and income and current transfers20. Although the traditional external solvency indicator (external debt over exports) has gradually increased during the 1990s, the external indebtedness declined markedly, from a peak of 38% of GDP in 1992 to less than 25% in 1996, while the ratio income debt over exports declined sharply in the first-middle of the 1990s. Furthermore, since 1993 the share of the long-term debt on the total external debt has been more than 90% - a clear evidence that the reorientation of capital account policy toward non-debt creating inflows and FDI since 1991 succeeded. Finally, the international reserves-to-imports ratio increased to more than 100% by 2002 compared to less than 40% in the beginning of the 1990s. Indeed international reserves rose from US$ 30.2 billion in 1998 to US$ 136.9 billion in 2005 – an increase of 453% in just seven years – due to a more aggressive RBI’s exchange reserve accumulation policy (Table 3). Summing up, the improvement of external vulnerability
19 For instance, mutual funds in India are now permitted to invest up to US$ 1 billion abroad. 20 Although India has managed to diversify its exports towards higher value added goods, the country’s export performance has lagged that of Asia of its share of global exports remains low (IMF, 2006, Ch II).
13

indexes in India resulted mainly from the low current account deficit, a declining external debt and the increasing level of foreign reserves.
Figure 14. India - capital flows (liabilities, USD million)
-5000
0
5000
10000
15000
20000
1990
1991
1992
1993
1994
1995
1996
1997
1998
1999
2000
2001
2002
2003
Direct investment
Portfolio investment
Other investmentsTotal capital flows
Source: IMF
The nature and the pace of capital account liberalisation exercised an influence on the dimensions and
the composition of the private foreign capital inflows to, and outflows from, India – a shift from debt creating to non-debt creating capital flows (Figure 14). Capital flows has raised a great deal along the 1990s, followed by a sharp change in their composition: until 1993 there was a predominance of other investments (that include, among others item, non-resident Indian deposits – NRI and foreign loans) while other types of capital flows were almost non-existent; since 1994 capital flows have raised and diversified due the increase of portfolio investments, other investments and foreign direct investment. However, financial integration of the India economy into international capital markets has been still slow and limited: FDI has been increasing during 1990s, but it is low compared to other ‘big’ emerging countries; according to IMF (2005, p.20), the ratio FDI over GDP in 2002 was 3.7% in China, 3.1% in Brazil, 2.1% in Mexico and only 0.6% in India.
Due to the adoption of a managed floating exchange regime, that has resulted in a stable nominal exchange rate, domestic interest rate has had a more unstable behaviour, probably because interest rate has been used as a tool to stabilize nominal exchange rate and also due to non-sterilized operations related to foreign exchange accumulation policy. Figure 15 shows that there is a remarkable declining trend of interest rate in India after the adoption of the managed floating exchange rate regime in 1993 and the steady reduction of the cash reserves requirement since 1991. Such interest rate reduction has stimulated credit expansion under a market based credit system. It seems that in India capital controls have been used not only to reduce external vulnerability and to avoid currency crises, but also to drive a wedge between domestic and external interest rates in order to provide RBI discretion to achieve some monetary policy autonomy.
Figure 15. India - interest rate (% p.a.)
0
5
10
15
20
25
1990
q01
1990
q04
1991
q03
1992
q02
1993
q01
1993
q04
1994
q03
1995
q02
1996
q01
1996
q04
1997
q03
1998
q02
1999
q01
1999
q04
2000
q03
2001
q02
2002
q01
2002
q04
2003
q03
2004
q02
2005
q01
2005
q04
Bank rate
Commercial lendingrate-prime
Figure 16. India - consumer price index (% p.a.)
0
2
4
6
8
10
12
14
16
1990
1991
1992
1993
1994
1995
1996
1997
1998
1999
2000
2001
2002
2003
2004
2005
Source: IMF/International Financial Statistics
14

Finally, concerning the inflation, there is a general declining trend of the consumer prices index, for which the combination between trade liberalisation with (the more recent) exchange rate appreciation has contributed somehow. Fiscal deficit has been high (Table 3), that is higher than 4.0% of GDP (but declining more recently), and public debt has also been very high (more than 80% of the GDP); however, it is mostly domestic, denominated in rupee and with predominance of long-term debt (IMF, 2005a). Inflation increased in two moments, during the balance-of-payments crisis of 1991 and during 1997 Asian crisis (Figure 16). It should be stressed that inflation rate has been reduced while domestic interest rate has also declined. 3.5. China
The performance of Chinese economy has been impressive: the average real GDP growth was 9.8% from 1990 to 2006 (Figure 1 and Table 4), the same growth of 1980-1989 period, that means that for more than 25 years China is growing on average by 10% p.a.! Investment is the driving force of economic expansion: the investment rate has increased rapidly from 25% of GDP in 1990 to more than 30% after 1992 and since 2004 more than 40%. Banking credit to business sector over GDP, under a bank-based system dominated by state-owned banks, has been almost double compared to OECD area (OECD, 2005, p.42). Finally, the high growth performance is partly due to rapid growth of the export sector. This growth has been followed step-by-step by a remarkable expansion of China in the international trade: the country’s share in world trade increased from 0.8% to 7.7% during 1988-2005 (Zhao, 2006, p.4). Economic aperture in Chinese experience has been gradual and incremental: reforms tend to be undertaken on an experimental basis in some localities or provinces before implementing programmes on a nationwide basis; reforms started in the late 1970s, and in 1980 the first Special Economic Zones were created. From 1979 to 1986, China’s policy toward foreign direct investment (FDI) was characterised by the attitude that FDIs were welcome, but to be highly regulated; after 1986 China granted permission for the operation of wholly owned foreign enterprises (Haihong, 2000, p.19-20). Major changes in the functioning of the economy were introduced in the 1990s, such as encouragement of foreign investment, reduction of effective tariffs on imported inputs21, the modernization of the public corporations, the abolition of multiple exchange rates, and the introduction of convertibility for current account transactions.
Table 4. China - basic economic indicators
1990 1991 1992 1993 1994 1995 1996 1997 1998 1999 2000 2001 2002 2003 2004 2005GDP real growth (% p.a.) 3.8 9.2 14.2 13.9 13.1 10.9 10.0 9.3 7.8 7.6 8.4 8.3 9.1 10.0 10.1 10.2 Gross fixed capital formation(%GDP) 25.0 26.8 30.9 36.0 34.5 33.0 32.4 31.8 33.0 33.6 34.3 34.6 36.3 39.2 40.6 41.9Consumer price index (% p.a.) 3.1 3.5 6.3 14.6 24.2 16.9 8.3 2.8 -0.8 -1.4 0.3 0.5 -0.8 1.2 4.0 1.8Fiscal balance (%of GDP) -3.7 -3.3 -2.6 -1.9 -1.9 -1.4 -1.2 -1.1 -1.5 -2.2 -2.8 -4.0 -2.6 -2.1 -1.3 -1.2Public debt (% of GDP) ... ... ... ... ... ... ... ... ... ... ... 17.7 18.9 19.2 18.5 17.9Exchange rate average (yuan/USD) 4.8 5.3 5.5 5.8 8.6 8.4 8.3 8.3 8.3 8.3 8.3 8.3 8.3 8.3 8.3 8.2Intern.reserves(excl.gold,USD million) 29586 43674 20620 22387 52914 75377 107039 142762 149188 157728 168278 215605 291128 408151 614500 821514Current account (% of GDP) 3.2 2.2 1.3 -1.8 1.2 0.2 0.8 3.7 3.0 1.9 1.7 1.3 2.4 2.8 3.5 7.0International reserves (% of imports) 57.3 70.1 27.1 22.7 46.9 58.4 78.6 102.3 109.4 97.0 76.0 89.9 100.2 100.1 110.3 124.9External debt (% of GDP) 14.9 14.5 15.1 13.5 16.9 15.5 14.4 14.9 13.8 13.8 12.2 9.0 12.8 12.7 12.0 ...External debt/exports ratio 1.07 1.02 1.04 1.14 0.98 0.92 0.85 0.80 0.78 0.78 0.58 0.69 0.57 0.48 0.42 ...Income debt (% of exports) 3.2 4.0 6.3 6.2 5.6 11.4 13.1 9.1 12.1 11.7 10.9 10.7 7.2 5.5 4.1 3.7Long-term debt (% external debt) 82.3 82.1 81.0 82.2 82.6 81.1 80.3 78.6 88.0 90.0 91.0 69.5 64.6 57.7 52.8 ...Trade balance (USD million) 9165 8743 5183 -10654 7290 18050 19535 46222 46614 35982 34474 34017 44167 44652 58982 134189Current account (USD million) 11997 13272 6401 -11609 6908 1618 7243 36963 31472 21115 20518 17401 35422 45875 68659 160818Source: IMF - International Financial Statistics; Deutsche Bank Research (public debt); ADB (external debt).
Since the end of the 1970s, exchange rate regime has changed sometimes: firstly it was centralized and still a fixed one; from 1986 to 1993 the exchange rate was dual, where the official rate, that was subject to periodic adjustments, coexisted with the market-determined rate in the swap centres22 - the second rate was set at a relatively depreciated level as compared to the official rate. In 1994, the official rate was devaluated and unified with the exchange rate at the swap centres, and a managed floating exchange regime was officially adopted. In practice, however, after short period of some appreciation of nominal exchange rate, the renminbi (RMB), the domestic currency, also known as yuan, was de facto fixed to the U.S. dollar since 1995 (Figure 17). Central bank’s intervention to maintain a stable exchange rate has been large scale, with reserves rising to 21 Average import customs duty was reduced from 45% in 1992 to 17.5% in 2000 (Ariff and Khalid, 2005, p.88). 22In swap centres, exporters, importers, and other parties with foreign exchange supply or needs could transact at a market-determined exchange rate. By 1991, all residents were allowed to sell foreign exchange at the swap rate at the designed bank branches. In 1998 swap centres were closed and all exchange payments were bought into the banking settlement system.
15

more than 30% of GDP by end 2004. In July 2005, the Chinese authorities announced a revaluation of the exchange rate against the dollar of 2.1%, with the currency able to move daily in a narrow range of ± 0.3%.23 In addition, the central rate for the RMB is determined by a basket of currencies the composition of which was not revealed. Again, in practice it has not resulted in greater changes in the modus operandi of Chinese exchange rate policy.
Figure 18. China - NEER and REER
(period average, index number 2000=100)
0
50
100
150
200
250
1986
q01
1987
q01
1988
q01
1989
q01
1990
q01
1991
q01
1992
q01
1993
q01
1994
q01
1995
q01
1996
q01
1997
q01
1998
q01
1999
q01
2000
q01
2001
q01
2002
q01
2003
q01
2004
q01
2005
q01
Nominal effective exchange rate
Real effective exchange rate
Figure 17. China - nominal exchange rate (% annual average)
0123456789
10
1985
q01
1986
q02
1987
q03
1988
q04
1990
q01
1991
q02
1992
q03
1993
q04
1995
q01
1996
q02
1997
q03
1998
q04
2000
q01
2001
q02
2002
q03
2003
q04
2005
q01
Source: IMF/International Financial Statistics
Popular Bank of China, the central bank, acts as a market marker in the foreign exchange market.24
The management of a (semi) fixed exchange rate in China has been possible due to the existence of a widespread capital controls system on both inflows and outflows, mainly through the use of prohibitions and quantitative limits. The objectives of the controls evolved over time, but generally have included: (i) to help channel external savings to desired uses; (ii) keeping monetary policy independent of the influence of international developments, under a context of a managed exchange rate regime: (iii) preventing firms and financial institutions from taking excessive external risks : (iv) maintaining balance of payments equilibrium and keeping exchange rate stability; and (iv) to insulate the economy from foreign financial crises (Zhao, 2006, p.8). Indeed, China has followed a pattern of financial liberalisation in which sequence starts with liberalising the trade account, then relaxing foreign exchange restrictions, then the long term capital account, and finally the short term capital account (Epstein et al, 2005, p.33-4).
In 1996 China accepted the IMF Article VII, that resulted in the liberalisation of foreign exchange controls related to current account transactions. Furthermore, since then controls over inflows and outflows by non-residents have been loosened, while maintaining strict but porous controls on inflows and outflows by residents. In fact, at the end of 1996 there were a lot of controls on foreign exchange transactions: (i) non-residents were forbidden to operate in the money market, stock market and derivative market; they could only buy some sort of shares; (ii) residents could only operate in these markets abroad with previous approval of the monetary authorities, while in some operations there were quantitative restrictions; (iii) prior approval was required for any foreign borrowing, foreign currency-denominated bond issues, and guarantees in foreign exchange (Haihong, 2000). Therefore, portfolio capitals were not welcome due to segregation between residents and non-residents in the stock markets, while restrictions on other types of external loans were pervasive and generally subject to strict ceilings – controls on foreign debt accumulation prevented the excessive accumulation of foreign debt by residents, controls on equity inflows prevented a speculative bubble in the stock market, while controls on outflows in general prevented devastating surges of capital flight.
It should be stressed the dynamic nature of the controls in China, with the authorities tightening enforcement during crisis periods and then loosening them when the crisis subsides (Epstein et al, 2005, p.35). As can be seen in Table 4 and Figure 19, during 1997 Asian crisis, although current account remained in surplus and FDI remained strong, capital account deteriorated sharply. Under this circumstance, the authorities intensified enforcement of exchange and capital controls, and moved to reduce circumvention – including verification requirements on current account transactions to demonstrate that the transactions are in fact legitimate current transactions (Ariyoshi et al, 2000, p.63). More recently some tight controls on foreign
23 In May 2007 the range was enlarged to ± 0.5%. 24 State Administration of Foreign Exchange (SAFE) is responsible for controlling and monitoring cross-border exchange flows and all businesses in foreign currency.
16

exchange transactions have been loosened, at the same time that tariffs and quotas on imports were reduced or eliminated. Such measures in general reduced the quantitative restrictions to the purchase of foreign currencies by residents, relaxing the restrictions on extending external guarantee, on issuing bonds in international market and on foreign firms’ borrowing in RMB. Chinese authorities have attempted to alleviate recent appreciation pressures by easing controls on capital outflows.
The current level of exchange rate is considered in general devaluated. The real effective exchange rate, based on the consumer prices index, had a lot of variations during the last 25 years: it depreciated sharply during the 1980s and beginning of the 1990s, due to frequent nominal exchange rate devaluations, and it appreciated for a short period until 1997, due to the increase in the inflation. Indeed, RMB was devaluated by 21% in 1989, 9% in 1990, and 14% in 1994. Since 1997 real effective exchange rate has had a stable trend, due to both very low inflation and the stable nominal exchange rate (Figure 17 and 18). The dramatic process of foreign reserves accumulation in China – reaching more than US$ 800 billion in 2005 (Table 4) - started in the beginning of the 1990s, having in particular a increasing pace since 2000, as a result of the a deliberate foreign reserves accumulation policy under a context of increasing trade surplus and the rising of capital inflows, mainly FDI.
Considering the capital flows, it can be noted that there was a dramatic growth of the volume of capital flows in China along the 1990s, due mainly the increase of FDI since 1993. Indeed, FDI increased dramatically during the 1990s, from US$ 4.3 billion in 1991 to US$ 44 billion in 1997, what made China second largest recipient of FDI among all countries. FDI has been attracted by the long-term growth perspective of Chinese economy (and increasing exports performance) and also by the fact the since the beginning of the reforms China sought to attract FDI. Foreign loans, however, had a low growth in the period, what is the result in great extension of the existence of restrictions on foreign debt. Therefore, at the same time that China has sought to attract FDI, it also has been very cautious about foreign loans and portfolio investments, although more recently such capital inflows have increased markedly, notably portfolio investments and other investments, such as loans, currency and deposits. The pick up in export growth since 1995 came as a result of a set of factors, such as liberalisation of the exports licensing system, the increasing productivity of the industry, the cheap wages and the fall in the effective exchange rate. Overall, the current account surplus rose to more than 3% of GDP since 2004 (Table 4).
Figure 19. China - capital flows (liabilites, USD million)
-30000
-10000
10000
30000
50000
70000
90000
110000
130000
150000
1983
1985
1987
1989
1991
1993
1995
1997
1999
2001
2003
2005
Direct investment
Portfolio investment
Other investments
Total capital flows
Source: IMF
As a consequence of the combination of the exceptional trade surplus, the dramatic increase of foreign
reserves and the low level of external debt, the indexes of external vulnerability of China show a very comfortable situation: the external debt-to-GDP ratio has been low and declining in 1990-2004 period, reaching only 12.0% in 2004. Further, the long-term debt over total external debt ratio had been higher than 70% until 2000, an evidence that the maturity structure of the debt is very healthy; more recently the ratio has declined due to the increase of external indebtedness, including short-term ones. Other indexes show additional evidences of a very good external situation: the external debt to exports ratio declined to less than
17

50% in 2003, while reserve-to-imports ratio increased of 47% on average in 1990-95 to 102% in 1997 (Table 4).
After a short period of high inflation and high interest rates in the mid-1990s, China has experienced low domestic rates and declining inflation and eventually even deflation (Figures 20 and 21). The combination of a stable exchange rate (and even a real appreciation in 1994-98), strong labour productivity growth (as a result of strong investment rates), trade liberalisation and declining commodity prices exerted significant downward pressures in inflation in 1996-2002, while demand factors played a smaller role (Prasad et al, 2004, p.14). The reduction in the inflation has been followed by expansionist monetary and fiscal policies in the period. China’s fiscal position has been healthy due to the strong economic growth and low domestic interest rates, despite the fact that primary fiscal position may appear weaker (Prasad et al, 2004, V). More recently fiscal deficit over GDP has declined to 1.2% in 2005. The Chinese authorities have attempted to isolate the domestic economy from the consequences of the combination of a fixed exchange rate and large capital inflows through sterilisation. The sterilisation of capital inflows has been facilitated by the fact that domestic interest rates have been lower than interest rates of industrial country treasury bonds (Prasad et al, 2005, p.12).
Figure 20. China - interest rate
0
2
4
6
8
10
12
14
990q
01
1990
q04
1991
q03
1992
q02
1993
q01
1993
q04
1994
q03
1995
q02
1996
q01
996q
04
997q
03
998q
02
1999
q01
1999
q04
2000
q03
2001
q02
2002
q01
2002
q04
2003
q03
2004
q02
2005
q01
005q
04
1 1 1 1 2
Bank Rate (% p.a.)
Deposit Rate (% p.a.)
Lending Rate (% p.a.)
Figure 21 China - consumer price index (% p.a.)
-5
0
5
10
15
20
25
1990
1991
1992
1993
1994
1995
1996
1997
1998
1999
2000
2001
2002
2003
2004
2005
Source: IMF/International Financial Statistics 4. Conclusion
China, India and Russia, managing their exchange rate regimes with a restrictive capital account convertibility, have been, in more or less degree, succeed cases of management of macroeconomic policy – in which the stability of exchange rate has a crucial role – that seek to create a stability environment for economic growth. In particular China and India’s cases show how is correct to implement a gradual and careful management of capital account and policies oriented towards the reduction of external vulnerability. These experiences also show that capital controls can be helpful in protecting the economy against the destabilising aspects of capital flows and helping to resolve certain types of policy dilemma, such as simultaneously managing exchange rate and the short term interest rate. Russia is an interesting case, as the economy until 1998 performed very bad, as a result of a chaotic transition process of liberalisation to a market economy; after the 1998 crisis the economy has performed very well, due to both the increase in the exports and the better management of macroeconomic policy, that has combined a more active exchange rate policy and decreasing interest rates, under a context of a partial capital account convertibility. Brazil, on the other hand, has adopted a more liberal and orthodox economic policy, that includes a less interventionist approach related to exchange rate policy and a very open capital account, that has resulted in higher exchange rate volatility, higher interest rates, and a more poor economic performance. Table 5 shows a comparative synthesis of the analysis of the macroeconomic policy of each BRIC country.
Among different factors that are important to the management of macroeconomic policy, this paper stressed in particular the importance of reducing external vulnerability, that should be understood not only in terms of the external solvency of the country, but also in terms of its vulnerability to external shocks and changes in the market sentiment, in which the lower or higher degree of capital convertibility can be a essential factor. In this particular concern, the recent experience of the BRICs countries shows the importance of having:
a) A gradual and careful process of capital account liberalisation;
18

b) Capital management techniques well-designed and dynamic in the sense that policymakers need to retain the ability to implement a variety of management techniques and alter as circumstances warrant, but most important that they are coherent and consistent with the overall aims of the economic policy regime;
c) A surplus balance in the current account or a deficit in low level, financed by external capitals with the predominance of long-term capitals;
d) The accumulation of exchange reserves by central bank, in order to avoid speculative attacks on domestic currency and also to allow that the monetary authorities enhance their capability to influence the effective real exchange rate and to reduce the volatility of nominal exchange rate;
e) A managed floating exchange regime, according to the specificities of each country, that aims the preservation of a competitive and stable real exchange rate as an intermediate target of macroeconomic policies oriented to employment and growth objectives.
T a b le 5 . E x c h a n g e r a t e r e g im e a n d c a p it a l a c c o u n t c o n v e r t ib i lit y o f B R I C s c o u n t r ie s C o u n t r y E x c h a n g e
r a t e r e g im eM o n e t a r y p o li c y f r a m e w o r k
In d ic a t o r o f e x c h a n g e r a t e
C a p i t a l a c c o u n t c o n v e r t ib i l i t y
E x c h a n g e r a t e v o la t i li t y *
B r a z il F lo a t in g , w it h d ir t y f lo a t in g
I n fla t io n t a r g e t in g
N o m in a l b i la t e r a l
H ig h H ig h
C h in a S e m i- f ix e d P e g g e d e x c h a n g e r a t e
R e a l e f f e c t iv e P a r t ia l, w it h m a n y r e s t r ic t io n s
V e r y lo w
I n d ia M a n a g e d f lo a t in g
M u lt ip le in d ic a to r s
N o m in a l b i la t e r a l a n d r e a l e f f e c t iv e
P a r t ia l, w it h m a n y r e s t r ic t io n s
V e r y lo w
R u s s ia M a n a g e d f lo a t in g
M u lt ip le in d ic a to r s
N o m in a l b i la t e r a l
P a r t ia l, w it h s o m e r e s t r ic t io n s
L o w
S o u r c e : A u th o r ’ s e l a b o r a t i o n b a s e d o n M o h a n t y a n d S c a t i g n a ( 2 0 0 5 ) . ( * ) E x c h a n g e r a t e v o l a t i l i t y r e la t e d t o 1 9 9 9 - 2 0 0 3 , a c c o r d in g to M o h a n t y a n d S c a t i g n a ( 2 0 0 5 , T a b le A 2 ) .
References:
ADB -ASIAN DEVELOPMENT BANK, ADB Indicators, various numbers. ARIDA, P.(2004). Aspectos macroeconomicos da conversibilidade: uma discussao do caso brasileiro,
unpublished manuscript. ARIFF, M.; KHALID,A.(2005). Liberalization and Growth in Asia. Cheltenham: Edward Elgar. ARIYOSHI, A. et al (2000). Capital controls: country experiences with their use and liberalization.
Occasional Paper N.190. Washington: IMF. BERENGAUT, J.; ELBORGH-WOYTEK, K.(2005). Who is still haunted by the specter of communism?
Explaining relative output contractions under transition. IMF Working Paper 05/68, April. CALVO, G.; REINHART, C.(2002). Fear of floating. Quarterly Journal of Economics, CXVII (2):379-408. DEUTSCHE BANK RESEARCH, http://www.dbresearch.com, access in May 2007. ECLAC (2000). Foreign Investment in Latin America and the Caribbean – 1999 Report. Santiago: Chile. EPSTEIN, G.; GRABEL, I.; JOMO, K.S.(2003).Capital management techniques in developing countries.
Working Paper Series No. 56, Political Economy Research Institute, University of Massachusetts. FISCHER, S.(2001). Exchange rate regimes: is the bipolar view correct? Journal of Economic Perspectives,
15(2):3-24. FRENKEL, R.(2006). An alternative to inflation targeting in Latin America: macroeconomic policies focused
on employment. Journal of Post Keynesian Economics 28(4):573-591. GOLDFAJN, I.; MINELLA, A.(2005). Capital flows and controls in Brazil: What have we learned? NBER
Working Paper Series No. 11640, September. GRENVILLE, S.(2000). Exchange rate regime for emerging countries. Reserve Bank of Australia Bulletin,
November.
19

HABERMEIER, K.(2000). India’s experience with the liberalization of capital flows since 1991. In ARIOYSHI et al. (2000), op.cit.
HAIHONG, G.(2000). Liberalising China’s capital account: lessons drawn from Thailand´s experience. Visiting Researchers Series N.6. Institute of Southeast Asian Studies, February.
HAUSMANN, R.; PRITCHETT, L.; RODRIK, D.(2004). Growth accelerations. NBER Working Paper Series No. 10566, June.
HO, C.; McCAULEY, R. (2003). Living with flexible exchange rates: issues and recent experience in inflation targeting emerging market economies. BIS Working Paper N.130, February.
IMF - INTERNATIONAL MONETARY FUND, International Financial Statistics, various numbers. INTERNATIONAL MONETARY FUND (2001). India: Recent Economic Developments and Selected Issues.
IMF Country Report N. 01/191, October. __________.(2003). Russia: Staff Report for the 2003 Article IV Consultation. IMF Country Report.N.
03/144, May. __________.(2004). Russia: Staff Report for the 2004 Article IV Consultation. IMF Country Report. .N.
04/314, September. __________.(2005). India: Staff Report for the 2004 Article IV Consultation. IMF Country Report. N. 05/86,
March. __________.(2006). India: Selected Issues. IMF Country Report. N. 06/56, February. KHOLI. R.(2005). Liberalizing Capital Flows. New Delhi: Oxford University Press. MAGUD, N.; REINHART, C.(2006). Capital controls: an evaluation. NBER Working Paper N.11973,
January. MOHANTY, M.; SCATIGNA, M.(2005). Has globalization reduced monetary policy independence? BIS
Papers N.23. MOHANTY, M.; TURNER, P.(2006). Foreign exchange reserves in emerging countries. BIS Quarterly
Review 24:39-42. NAYYAR, D.(2002). Capital controls and the World Financial Authority: what can we learn from the Indian
experience? In Eatwell,J. and Taylor,L.(ed.). International Capital Markets: Systems in Transition. Oxford: Oxford University Press.
MORENO, R.(2005). Motives for intervention. BIS Papers N.24, May. OECD (2005). China. OECD Economic Surveys vol. 2005/13, September. OECD (2006).Russian Federation. OECD Economic Surveys vol. 2006/17, November. OREIRO, J.L.; PAULA, L.F.(2007). “Strategy for economic growth in Brazil: a Post Keynesian approach”. In
Arestis, P., Baddeley, M. e McCombie, J.(org.). Economic Growth: New Directions in Theory and Policy. Cheltenham, Edward Elgar.
OWEN, D.; ROBINSON, D.,ed. (2003). Russia Rebounds. Washington: IMF. PAULA, L.F.; ALVES, Jr., A.J.(2000). External financial fragility and the 1998-1999 Brazilian currency
crisis. Journal of Post Keynesian Economics, 22(4):589-617. PRASAD, E.; ROGOFF, K.; WEI, S.; KOSE, M.(2003). Effects of financial globalization on developing
countries: some empirical evidence, http://www.imf.org.. PRASAD, E.(2004). China’s growth and integration into the world economy. Occasional Paper No 232.
Washington: IMF. PRASAD. E.; WEI, S.J.(2005). The Chinese approach to capital inflows: patterns and possible explanations.
NBER Working Paper Series, N.11306, April. PURUSHOTHAMAN, R.; WILSON, D.(2003). Dreaming with BRICs: the path to 2050. http://www.gs.com,
Global Economics Paper, N.99, October. REIHART, C.; ROGOFF, K.(2002). The modern history of exchange rate arrangements: a reinterpretation.
NBER Working Paper Series, N.8963, June. SOUZA, F.E.; HOFF, C.(2006). O regime cambial brasileiro: 7 anos de flutuação.
http://www.ie.ufrj.br/conjuntura/pdfs/TextoRedeMercosul.pdf. ZHAO, M.(2006). External liberalization and the evolution of China’s exchange system. The World Bank
Beijing Office, http://siteresources.worldbank.org
20