financial market imperfection, overinvestment, and ... · repeatedly in the literature (fazzari,...
TRANSCRIPT

Bank of Canada Banque du Canada
Working Paper 2004-27 / Document de travail 2004-27
Financial Market Imperfection, Overinvestment,and Speculative Precaution
by
Christian Calmès

ISSN 1192-5434
Printed in Canada on recycled paper

Bank of Canada Working Paper 2004-27
July 2004
Financial Market Imperfection, Overinvestment,and Speculative Precaution
by
Christian Calmès
Monetary and Financial Analysis DepartmentBank of Canada
Ottawa, Ontario, Canada K1A 0G9
The views expressed in this paper are those of the author.No responsibility for them should be attributed to the Bank of Canada.


iii
Contents
Acknowledgements. . . . . . . . . . . . . . . . . . . . . . . . . . . . . . . . . . . . . . . . . . . . . . . . . . . . . . . . . . . . ivAbstract/Résumé. . . . . . . . . . . . . . . . . . . . . . . . . . . . . . . . . . . . . . . . . . . . . . . . . . . . . . . . . . . . . . . v
1 Introduction . . . . . . . . . . . . . . . . . . . . . . . . . . . . . . . . . . . . . . . . . . . . . . . . . . . . . . . . . . . . . . 1
2 A Brief Overview of the Literature . . . . . . . . . . . . . . . . . . . . . . . . . . . . . . . . . . . . . . . . . . . . 3
2.1 Financial market imperfections. . . . . . . . . . . . . . . . . . . . . . . . . . . . . . . . . . . . . . . . . . . 3
2.2 The sensitivity of investment to cash flow . . . . . . . . . . . . . . . . . . . . . . . . . . . . . . . . . . 5
3 Excessive Conservatism, and Precaution. . . . . . . . . . . . . . . . . . . . . . . . . . . . . . . . . . . . . . . . 7
4 Categorizing Firms with their Z-Score . . . . . . . . . . . . . . . . . . . . . . . . . . . . . . . . . . . . . . . . 11
4.1 Average investment, inventories, cash flow, and sales. . . . . . . . . . . . . . . . . . . . . . . . 12
4.2 Hoarding of cash flow. . . . . . . . . . . . . . . . . . . . . . . . . . . . . . . . . . . . . . . . . . . . . . . . . 14
4.3 Investment and financial expectations . . . . . . . . . . . . . . . . . . . . . . . . . . . . . . . . . . . . 18
5 Conclusion: Some Macroeconomic Implications . . . . . . . . . . . . . . . . . . . . . . . . . . . . . . . . 21
References. . . . . . . . . . . . . . . . . . . . . . . . . . . . . . . . . . . . . . . . . . . . . . . . . . . . . . . . . . . . . . . . . . . 23
Appendix A. . . . . . . . . . . . . . . . . . . . . . . . . . . . . . . . . . . . . . . . . . . . . . . . . . . . . . . . . . . . . . . . . . 26
Appendix B . . . . . . . . . . . . . . . . . . . . . . . . . . . . . . . . . . . . . . . . . . . . . . . . . . . . . . . . . . . . . . . . . . 29

iv
Acknowledgements
I would like to thank Martin Berka, Mohammed Jabir, Kevin Moran, Brian O’Reilly, Stéphane
Pallage, Eric Santor, Christian Sigouin, David Tessier, Carolyn Wilkins, and Christian
Zimmermann for stimulating discussions. I particularly thank Joao Gomes, Scott Hendry, and
Peter Thurlow for their useful comments. I also thank seminar participants at Université du
Québec à Montréal, the Bank of Canada, and the Society of Economic Dynamics 2001
Conference.

v
cial
are
tress
rical
splay
ems to
s non
e dans
cière
penser
ent le
es,
f de
Abstract
The author uses panel data to assess the sensitivity of investment to cash flow in non-finan
firms, taking into account the role their financial health plays in investment decisions. Firms
categorized using a method called the Z-score, a contemporaneous indicator of financial s
that is inversely related to firms’ probability of financial failure. Based on this method, empi
evidence suggests that firms that have the greatest sensitivity of investment to cash flow di
the lowest average Z-score. The author also shows that, in this class of firms, investment se
be partly driven by excessive conservatism, or precaution.
JEL classification: D92, E22, E44, G33Bank classification: Business fluctuations and cycles
Résumé
À l’aide de données de panel, l’auteur évalue la sensibilité de l’investissement des entreprise
financières à leurs flux de trésorerie en tenant compte du rôle que leur santé financière jou
leurs décisions d’investissement. Les entreprises sont classées au moyen d’un indicateur
contemporain du stress financier qui est inversement lié à la probabilité de défaillance finan
des entreprises, appelé score Z. À l’aune de ce critère, les résultats empiriques donnent à
que les entreprises dont l’investissement est le plus sensible aux flux de trésorerie présent
plus faible score Z moyen. L’auteur montre également que, dans cette catégorie d’entrepris
l’investissement semble déterminé en partie par un conservatisme excessif ou par un moti
précaution.
Classification JEL : D92, E22, E44, G33Classification de la Banque : Cycles et fluctuations économiques


“There is no necessity to hold idle cash to bridge over intervals if it can be obtained
without difficulty at the moment when it is actually required.”
J.M. Keynes (1936)
1 Introduction
The investment decisions of firms that have differing financial profiles can differ qual-
itatively (and quantitatively). The fact that, for some firms, investment is sensitive to
variations in the level of internal funds or liquidity (e.g., cash flow) has been demonstrated
repeatedly in the literature (Fazzari, Hubbard, and Petersen 1988; Whited 1992). Recent
findings suggest that, for firms that are financially constrained, investment spending is
sensitive to internal funds. They also emphasize the fact that these results depend cru-
cially upon the method used to determine which firms are financially constrained and
which are not (Kaplan and Zingales 1995, 2000).
In this paper, I use panel data1 to assess the sensitivity of investment to cash flow for
non-financial firms, taking into account the role their financial health plays in investment
decisions. This paper’s contribution to the literature is the method it uses to deter-
mine the degree of firms’ financial health. The method is based on a contemporaneous
measure of the firms’ probability of experiencing financial stress (the Z-score2). Based
on the Z-score, the empirical evidence suggests that the firms with investment that is
most sensitive to cash flow have the lowest Z-score. The evidence also suggests that, in
this class of firms, investment seems to be partly driven by precaution. While this last
1The data are taken from Compustat. See Appendix B for a brief description of the data.2The Z-score relates a firm’s probability of bankruptcy to its working capital, total assets, earnings
before interest and taxes, sales, and other financial variables. The Z-score does not rely directly on
investment or cash flow, which permits its direct use in investment regressions. This score indicates the
nature of the future financial constraints that a firm is expected to face. Obviously, the Z-score is not
a perfect indicator. Numerous such indicators are available in the literature; the Z-score is the most
commonly accepted and used measure. See section 4.1.
1

finding can be explained by financial market imperfections that stem from informational
problems, another explanation is suggested by the risk-sharing nature of lender-borrower
relationships.
Theoretically, an investment should be sensitive only to the profitability of the project
with which it is associated. Usually, the classical approach relates investment to a measure
of this profitability, such as Tobin’s q. Empirical evidence, however, seems to suggest that
investment is also related to some financial variables, such as cash flow. To account for this
extrasensitivity, it is common to introduce some financial market imperfection, thereby
departing from the classical framework. In the literature, asymmetric information models
are often used to explain the sensitivity of investment to cash flow. These models support
the view that investment by financially constrained firms has a greater sensitivity to cash
flow. It is generally accepted that financial constraints that arise from informational
problems or agency costs preclude some firms from reaching their desired (first-best) level
of investment. Financially constrained firms are thus presumed to underinvest because
internal funds are partially depleted and external funds are available only at a prohibitive
price (or not at all).
The fact that investment is related not only to Tobin’s q but is also sensitive to cash
flow and other financial variables has recently been challenged. Using conventional meth-
ods of categorization (e.g., size, age, dividend-payout ratio), Whited and Erickson (2000)
show that, when estimating investment with a strictly measured variable of expected prof-
itability (as with Tobin’s q), cash flow and other financial factors become insignificant.
This is the case regardless of the financial situation of the firm. Similarly, Gomes (2001)
shows that, when using a more refined measure of profitability (i.e., a variable that incor-
porates financial constraints), cash flow is no longer a significant explanatory variable for
investment. Nevertheless, as Whited and Erickson (2000) state, this does not necessarily
rule out the idea that investment might also be partly driven by financial considerations.
Instead, it means that the measure of the firm’s profitability could incorporate the influ-
2

ence of financial factors, leading to a non-significant role for those factors in explaining
investment.
The approach of Whited and Erikson (2000) or Gomes (2001) is convenient for char-
acterizing the determinants of investment. It is less appropriate, however, for identifying
the role of firms’ financial health in investment decisions. Indeed, a purely empirical
measure of expected profitability should incorporate financial constraints as one of its
components, but such a measure would not necessarily be tractable for studying the ef-
fect of financial variables on investment. Hence, in this paper, I use a pseudo-measure of
a firm’s profitability; i.e., Tobin’s q, the conventional measure of profitability. The aim
of this work is to identify the role of intertemporal financing for investment, by showing
how overinvestment is linked to what Kaplan and Zingales (1995, 2000) call “excessive
conservatism,” or precaution. Section 2 discusses the conventional approach used to em-
phasize the sensitivity of investment to cash flow among different types of firms. It also
describes the different methods used to categorize firms as either financially constrained or
healthy. Section 3 describes evidence of firms’ excessive conservatism. Section 4 proposes
an alternative indicator of financial stress, called the Z-score, that helps to explain the
excessive conservatism identified in previous studies. Since the Z-score is based on expec-
tations about the financial conditions that firms will face, it uses a risk-sharing argument
to interpret the sensitivity of investment to cash flow. Section 5 concludes and describes
some macroeconomic implications of the results.
2 A Brief Overview of the Literature
2.1 Financial market imperfections
According to asymmetric information models, some firms that expect future financial
stress cannot necessarily borrow more in advance if they are already constrained. Yet,
3

one might think that these firms could still hold cash to cushion any severe future con-
straint: cash flow would be held as a precautionary buffer, as Schnure (1998) suggests.
The lender might agree with this precaution, because it could provide some financial
protection to the borrower (Sigouin 2003) and therefore to the long-term relationship be-
tween the two parties. This feature is not taken fully into account by the asymmetric
information framework. Furthermore, a firm that is not financially constrained but ex-
pects to be restricted in the near future would be willing to increase its borrowing in the
short run, before being restricted. Regarding precaution, firms could possibly want to
increase their investment/borrowing level before facing a severe borrowing limit, rather
than underinvest, as the asymmetric information framework assumes.
An alternative approach emphasizes the role of risk-sharing and limited commitment
between the financial intermediary and the firm. Marcet and Marimon (1992) show that
the limited-commitment framework has more pervasive effects on investment spending
than the framework for asymmetric information. The limited-commitment approach as-
sumes that the financial relationship between a borrower and a creditor can be unilat-
erally terminated at any time (Kehoe and Levine 1993). Consequently, when there is
risk-sharing, endogenous financing constraints that arise from limited commitment can
potentially lead to overinvestment as well as underinvestment.
This property arises in some limited-commitment models, but not all. For example,
this is not the case in Hart and Moore (1994) or in Albuquerque and Hopenhayn (1997).
In their models, investment takes place in only the first period. Kiyotaki and Moore
(1997) and Hart and Moore (1994) base their research on anonymous debt contracts
and do not allow for long-term relationships. Sigouin (2003), however, shows that, in a
limited-commitment model where investment decisions occur each period, and where the
relationship lasts ad infinitum, a self-enforcing financial contract can arise endogenously.
Because the model assumes a stochastic environment (in contrast to Kiyotaki and Moore
1997, and Hart and Moore 1994), it is possible to evaluate the impact of “unexpected but
4

rationally anticipated” fluctuations in the availability of internal funds. Sigouin’s major
finding is that an entrepreneur can, in fact, overborrow at the end of economic upturns,
to take advantage of the still-low cost of external funds.
2.2 The sensitivity of investment to cash flow
Regardless of the type of market imperfection considered (e.g., informational problems or
limited-commitment), the usual result in the literature is some sensitivity of investment
to cash flow, and the sensitivity seems more pronounced for financially constrained firms.
This is an indirect indication of some form of market imperfection.
Fazzari, Hubbard, and Petersen (1988) show that the financial structure of firms does
matter for investment decisions. For some firms, external funds do not provide a perfect
substitute for internal capital. The authors show that the conventional representative-firm
approach might apply to mature companies, but that financial factors play an important
role for other firms. Using Value Line data for 421 manufacturing firms, Fazzari, Hubbard,
and Petersen analyze differences in investment among firms with a sample categorized
according to the dividend-income ratio as a proxy for earnings-retention practices. This
criterion is relevant because retained earnings are the main source of internal finance and
net funds regardless of firm size. The retention ratio decreases monotonically with asset
size, from 80 per cent for small firms to 50 per cent for large firms. Fazzari, Hubbard,
and Petersen use the following reduced-form investment equations:
(I/K)i,t = f(X/K)i,t + g(CF/K)i,t + ui,t,
where i = firm class, I = investment in plant and equipment, K = beginning-of-period
capital stock, X = the vector of variables controlling for investment opportunities, and
CF = cash flow.
Fazzari, Hubbard, and Petersen find that investment by firms with a low dividend-
income ratio is sensitive to fluctuations in cash flow. Although firms with a low dividend-
5

income ratio are smaller on average, this does not mean that firm size is always a factor.
When the firms are categorized according to size (average capital stock), the authors
find that small firms have a relatively low cash flow coefficient. Furthermore, the cash
flow effect holds for every class of dividend-income ratio; however, the cash flow effect is
strongest for the lowest dividend-income ratio class.
Fazzari, Hubbard, and Petersen conclude that financial factors play a role in invest-
ment decisions, especially for financially constrained firms (identified as the low dividend-
income firms). This conclusion is quite robust: it supports both the limited-commitment
and the asymmetric information approaches, because it provides empirical evidence of the
sensitivity of investment to cash flow. This empirical evidence is repeatedly confirmed in
the literature. For example, Mills, Morling, and Tease (1995) find similar evidence regard-
ing financial factor effects on investment. Using different methods of categorization, they
find that investment by small firms, particularly by highly leveraged firms and firms with
high retention ratios, is highly sensitive to cash flow. Mills, Morling, and Tease estimate:
Ii,t/Ki,t−1 =
α + β1qi,t−1 + β2(CFi,t/Ki,t−1) + β3(Li,t−1/Ki,t−2) + β4(Di,t−1/Ki,t−2) + β5(Si,t/Ki,t−1),
where q = the conventional Tobin’s q, L = the stock of liquid financial assets, D = the
stock of outstanding debt, and S = sales (the last three being measured at the end of the
previous period).
One might attribute these results to the fact that the proxy variable constructed for
Tobin’s q does not completely capture investment opportunities, making cash flow spu-
riously significant. Yet Fazzari, Hubbard, and Petersen (1988) attempt to control for
that problem, as do Gilchrist and Himmelberg (1995, 1998). Following Abel and Blan-
chard (1986), Gilchrist and Himmelberg (1995) estimate a set of vector autoregressive
forecasting equations to build a proxy for the expected value of marginal q conditional
on observed fundamentals: a “fundamental q.” This allows the role of cash flow as a fore-
casting variable to be distinguished from its role as an explanatory variable of investment.
6

Even when controlling for this, the empirical evidence of Fazzari, Hubbard, and Petersen
still holds true. Using Compustat data, Gilchrist and Himmelberg (1995) confirm that
financial factors matter for all firms and that the sensitivity of investment to cash flow
is strong for firms identified as being financially constrained, although the fundamental q
is strongly significant for unconstrained firms. For financially constrained firms, the use
of the fundamental q seems superfluous, since the sensitivity of investment to cash flow
is almost the same as when using more conventional measures of q. Actually, the use of
conventional measures of q underestimates the different sensitivity of investment to cash
flow among classes of firms.
When they use the same method as Fazzari, Hubbard, and Petersen (1988) to identify
financially constrained firms (the dividend-payout ratio), Gilchrist and Himmelberg (1995)
find contradicting results. This suggests that both the method of categorization and
the firm’s method of measuring its profitability matter. When considering firm size, CP
ratings, and bond ratings, the majority of these criteria reveal the sensitivity of investment
to cash flow for financially constrained firms. Consequently, Gilchrist and Himmelberg
infer that the empirical evidence supports the asymmetric information approach.
3 Excessive Conservatism, and Precaution
The sensitivity of investment to cash flow that financially constrained firms experience can
be linked to the asymetric information framework as well as the limited-commitment one.
But some limited-commitment models cause financially constrained firms to overinvest,
in anticipation of further constraints, which leads to a different explanation of investment
sensitivity. Puzzling empirical evidence suggests that some firms whose investment is
sensitive to cash flow actually smooth their investment.
The first significant finding is that, in some studies, cash flow matters, but in a non-
linear manner. Fazzari, Hubbard, and Petersen (1988), and Devereux and Schiantarelli
7

(1989) show that the timing of the cash flow effect is more complex than suggested by the
asymmetric information framework. As Devereux and Schiantarelli state, the asymmetric
information models “do not yield an investment equation that explains how financial
factors and expectations about firm’s prospects jointly determine investment.” In addition
to reporting the fact that the cash flow dynamic effect is not captured, Devereux and
Schiantarelli assert that cash flow fluctuations might play a role for all firms, and not
just those with currently depleted internal funds or an incapacity to issue new shares.
Categorizing firms according to size, they show that the sensitivity of investment to cash
flow is actually greater for large firms.
Kaplan and Zingales (1995, 2000) also cast doubt on a monotonic relationship between
the sensitivity of investment to cash flow and the firm’s category. They find that the less
financially constrained firms can actually hold more internal funds and exhibit a signifi-
cantly higher sensitivity of investment to cash flow. One possible explanation Kaplan and
Zingales give for the low sensitivity of investment by financially constrained firms relies
on capital adjustment costs. When a financially constrained firm experiences a jump in
cash flow, it invests more. But because capital adjustment costs force the firm to invest
prior to the increase in liquidity, the investment reaction is dampened. If the firm had
not been constrained during a downturn, it would have invested more. In addition, if
firms with very scarce cash flow are included in the analysis, then it is obviously possible
to find that the sensitivity of their investment is unrelated to cash flow, because of their
extreme financial distress.
To categorize firms according to their relative degree of financing constraints, Kaplan
and Zingales (1995) use qualitative information from annual reports, as well as quantita-
tive information about the firms’ financial statements and notes retrieved from Compus-
tat. Because their results contradict previous studies, Kaplan and Zingales conclude that
the observed sensitivity of investment to cash flow depends crucially on the method of
categorization used. The relationship is not necessarily monotonic, since unconstrained
8

firms can also be sensitive to cash flow depending on the criterion used. Kaplan and
Zingales insist that their paradoxical results should command criticism when the influ-
ence of financial factors is examined. If the least-constrained firms are in fact somehow
intertemporally constrained, then the method of categorization must be designed accord-
ingly. This also suggests that designing a method that is truly able to categorize firms
according to their current and expected degree of financial constraint, as Kaplan and
Zingales show, is useful for determining the degree of non-linearity in the sensitivity of
investment to cash flow.
With respect to the two issues described above, Fazzari, Hubbard, and Petersen (1988)
explain that firms with large amounts of cash balances and unused lines of credit may
be expecting future financial constraints. This coincides with the view of Kaplan and
Zingales (2000) regarding the excessive conservatism of managers. Gertler and Gilchrist
(1993) state that bank lending to large firms rises following tight monetary policy. They
interpret this as evidence of smoothing behaviour: large firms borrow more to cushion
themselves from expected declines in sales revenue in the wake of tighter monetary con-
ditions. Empirical evidence shows that there is a slightly positive response from business
loans, lasting almost one year, after an interest rate increase (Bernanke, Gertler, and
Gilchrist 1996). Thurlow (1994), conducting a vector autoregression (VAR) analysis,
shows that the immediate response to monetary tightening is an increase in lending and
inventory stocks, a result consistent with the findings of Gertler and Gilchrist (1994).
This response could result from the fact that lenders are willing to provide more funds in
an effort to prevent premature bankruptcies, an intertemporal interpretation consistent
with limited-commitment models a la Thomas and Worrall.3
Gertler and Gilchrist (1994) state that overinvestment by large firms seems to be a
3In VAR studies, the trough in output generally precedes that in business credit, and the increased
demand for business credit coincides with a rise in inventories. I thank Scott Hendry for pointing out
these facts.
9

result of persistently piling up inventories at the onset of monetary policy tightenings
(for Romer dates, see Romer and Romer 1988, 1992). The view of a desired inventory
buildup for precautionary reasons vis-a-vis expected credit limitations is also advocated
by Thurlow (1994). He notes that an undesired inventory buildup due to real rigidities
is not supported by the facts, does not explain the increase in sales prior to a downturn,
and does not generate asymmetric responses.4
If, for some firms, investment is sensitive to expected cash flow, then, when such firms
anticipate lower future inflows, they should hold higher internal funds in advance whenever
it is possible to do so. When a firm is so severely constrained that it cannot borrow but
experiences scarce cash flow, it might use internal funds to smooth investment. The fact
that future inflows might explain current cash flow positions is supported by the evidence
of Opler et al. (1999). Net working capital is a proxy for money expected to be received
by the firm within the year. Opler et al. (1999) present evidence that net working capital
is negatively related to cash flow. Firms have target levels for cash flow, estimating
∆(CF/A)t = α + β∆(CF/A)t−1 + εt,
where A = assets. Using Compustat data, Opler et al. (1999) find cash flow to be mean
reverting. Firms try to stabilize their cash flow around a target value, with the average
holdings being greater in volatile industries. They also find that the short-run impact of
cash flow on investment is small. These findings suggest that cash flow helps a firm to con-
tinue its investment projects: a firm that has excess cash in one year will experience a fall
in operating cash flow the next year. When a firm expects to be financially constrained, it
accumulates cash to be able to finance investment despite the expected decrease in future
cash flow. Opler et al. argue that this evidence is consistent with a dominant precaution-
ary demand for liquid assets. While the results confirm that investment and cash flow are
4To account for this increasing investment, Thurlow (1994) assumes the existence of credit lines and
time-consuming reorganization of credit by commercial banks. The limited-commitment approach offers
a different explanation by making the creditor actually willing to increase lending.
10

dynamically related, the authors find no evidence that informational problems or agency
costs would have an impact on a firm’s propensity to spend excess cash.
In fact, the most important finding is that excess cash seems to be held in advance to
cushion decreases in operative cash flows. This might be paralleled with overborrowing
and increased investment in inventory stocks prior to downturns. In Opler et al., the
propensity to use excess cash for capital expenditures is far from significant. As such,
cash hoarding could be the result of risk aversion; i.e., a cash-in-advance motive driven
by a form of liquidity preference.
The idea of treating cash flow as an independent variable to disentangle its effect
on investment is also pursued by Schnure (1998), with the same conclusions. He devel-
ops a model of a firm’s decision regarding cash flow given a probability of being credit-
constrained in the future. Using Compustat data, Schnure suggests that informational
problems or agency costs do not concern the majority of firms. He advocates precau-
tionary cash balances regardless of a firm’s size5 (in the United States, holders of high
cash flow operate in the riskiest sectors, precisely where precaution matters). Whereas
investment is positively correlated to past cash flow (Fazzari, Hubbard, and Petersen
1988; Devereux and Schiantarelli 1989), Schnure finds that current cash flow is strongly
negatively related to future capital expenditures, especially for holders of high cash flow.
This is consistent with the findings of Opler et al. (1999).
4 Categorizing Firms with their Z-Score
This paper uses panel data to assess the sensitivity of investment to cash flow in non-
financial firms, taking into account the role their financial health plays in investment
decisions. The firms are categorized using a measure called the Z-score; it is a contem-
poraneous indicator of financial stress that is inversely related to firms’ probability of
5In the case of the most-liquid firms, cash comes from stock issuance.
11

financial failure. Like any method of categorization (e.g., dividend-payout ratio), the Z-
score is unable to establish a definite link between the sensitivity of investment and cash
flow, and it does not help distinguish between the demand and supply aspects of cash
flow—although we are more interested in the demand aspects. It is precisely for these
reasons that it is useful to investigate alternative methods of categorization. I choose
the Z-score for its forward-looking nature, which makes it possible to investigate how
precautionary motives relate to investment.
4.1 Average investment, inventories, cash flow, and sales
The first experiment computes average investment, inventories, cash flow, and sales, taking
into account the financial situation of firms. Using Research Insight data6 from 1980 to
1998, I retrieve yearly financial data for over 16,000 firms. After cleaning the data set
and transforming the variables, I compute the average ratios of investment, inventories,
cash flow, and sales to total assets for a subsample of 2,999 firms. I exclude firms started
after 1980, and firms for which these variables were not jointly available for at least fifteen
consecutive years.
To account for excessive conservatism, I use the Z-score as the method of categoriza-
tion. The Z-score relates the probability of a firm’s bankruptcy to its working capital, total
assets, earnings before interest and taxes, sales, and other financial variables.7 Hence, by
construction, the Z-score does not rely directly on investment or cash flow, which permits
its direct use in investment regressions.8 Numerous prediction models for financial stress
are available in the literature (e.g., Theodossiou 1993), but it is beyond the scope of this
paper to construct a variable for financial stress. Since Research Insight provides such
6Research Insight is a product of Standard and Poor’s, similar to Compustat. The main difference is
that Research Insight includes not only a data set but also software that enables data retrieval.7For more details on the rigorous computation of the Z-score, see Altman, Haldeman, and Narayanan
(1977), and Altman (1983).8Regarding identification problems, the Z-score is still not perfect.
12

a variable for each firm in the sample, it is used directly in the regressions. Altman’s
Z-score indicates the future financial constraints that a firm is expected to face. In that
respect, it provides an appropriate criterion by which to investigate whether precaution-
ary investment exists in firms that are expecting financial troubles, regardless of their
size, age, dividend-payout ratio, or rating.
In the first experiment, firms are assigned to one of three categories. When, for a
specific year, a firm has a Z-score below 1.81, the threshold identified in Altman, Halde-
man, and Narayanan (1977), it is categorized as a troubled firm with a high probability
of bankruptcy. Above this threshold, the firm is categorized as a healthy firm with a low
probability of bankruptcy. The third category is for firms that go bankrupt during the
period.9
The computation of the ratios for the three categories reveals that firms with a high
Z-score for a given year have relatively higher average ratios of cash flow, sales, and
inventories than their troubled or bankrupt counterparts. The inventory ratio differential
between bankrupt and healthy firms, however, seems smaller than that between troubled
and healthy firms. This seems to also be the case for the cash flow ratio differential. More
importantly, the average ratio of investment to total assets for each category indicates
that firms with a high probability of bankruptcy in a given year do not necessarily invest
less than firms in the healthy set (see Appendix A). In fact, between 1980 and 1989, and
after 1997, the reverse holds true. The case appears even stronger for bankrupt firms.
These descriptive, albeit simple, statistics support the idea that there may be a case
for excessive conservatism, or precaution, when troubled firms invest. These statistics are
also consistent with the more conventional idea that troubled firms are financially stressed
because of this overinvestment pattern. Nevertheless, assessing investment behaviour
9The threshold identified by Altman, Haldeman, and Narayanan (1977) is only a substitute for the
threshold that could have been associated with the data set. However, estimating a new measure of the
Z-score is beyond the scope of this study.
13

by considering the indicator of financial stress, such as the probability of bankruptcy
embedded in the Z-score, could yield encouraging results.
4.2 Hoarding of cash flow
Schnure (1998) and Opler et al. (1999) describe cash flow hoarding behaviour. They relate
this behaviour to the financial constraints that firms face. The common argument is that
cash flow helps firms continue their investment projects. To illustrate this argument, I
run several experiments involving cash flow, categorizing firms according to their average
Z-score throughout the 1980–1998 period. This categorization is ad hoc, in that its only
objective is to show how the behaviour of firms evolves, depending on their average Z-
score. In the experiments, I estimate cash flow equations using regressors that are similar
to those of Schnure (1998) and Opler et al. (1999). The primary objective is to check
for the hoarding of cash flow. In the first experiment, I use seven categories for firms,
ranging from an average Z-score of 1.5 to an average of 5. Each category corresponds
to an increment of 0.5 in the average Z-score. When I regress cash flow on past cash
flow, investment, and debt, and adjust for firms clustering, the overall fit is significant
(Wald chi2(3) = 1005.18, P rob > chi2 = 0.000). Apart from the constant (z = −31.37),
the most significant regressor is past cash flow (z = 17.26), as expected. As with Schnure
(1998) and Opler et al. (1999), I find that past cash flow is always a strongly significant
regressor, regardless of the firm class (see Table 1). Firms seem to display a hoarding
behaviour that is consistent with the excessive conservatism argument of Kaplan and
Zingales (1995, 2000) and Devereux and Schiantarelli (1989). Furthermore, in the model,
investment has a strong positive coefficient and debt has a negative coefficient. If firms
are hoarding cash flow to continue their investment projects, their ability to do so is
impacted negatively by their debt level: the higher the debt level, the harder it is for
firms to maintain their buffer. When the regression is run on subsamples of firms, the
result is the same. In low average Z-score firms, however, debt is relatively less significant,
14

Table 1: Hoarding of Cash Flow (dependent variable: cash flow/total asset)
Z-score Lagged cash flow Investment Debt Constant
All firms 0.319 1.5 -0.942 -1.498
9,047 firms (0.000) (0.000) (0.000) (0.000)
[1.5,2] 0.307 1.677 -0.288 -1.814
603 firms (0.000) (0.000) (0.277) (0.000)
[2,2.5] 0.276 1.915 -0.662 -1.783
703 firms (0.000) (0.001) (0.001) (0.000)
[2.5,3] 0.331 1.315 -0.702 -1.56
833 firms (0.000) (0.046) (0.000) (0.000)
[3,3.5] 0.306 1.545 -0.737 -1.628
1,223 firms (0.000) (0.001) (0.000) (0.000)
[3.5,4] 0.255 3.43 -0.550 -1.924
1,057 firms (0.000) (0.000) (0.047) (0.000)
[4,4.5] 0.404 1.661 -0.678 -1.320
857 firms (0.000) (0.000) (0.005) (0.000)
[4.5,5] 0.449 1.651 -0.504 -1.222
730 firms (0.000) (0.000) (0.004) (0.000)
Z-score = average Z-score, Cash flow = log(cash flow/(total asset-cash flow)), In-
vestment = (capital expenditures/total asset), Debt = total debt/total asset
(P -values in parentheses)
15

which reinforces the explanatory power of lagged cash flow (and investment). Investment
is usually the most volatile regressor, and lagged cash flow is always significant. All
categories display a significant fit, and the coefficient on cash flow and other variables
does not change much, as the Chow tests suggest.
Schnure (1998) states that net working capital should be a significant and negative
regressor of cash flow changes, since it is a proxy for the expected liquid inflows. Because
the description in many studies of a mean reverting property of cash flow is consistent
with the idea of excessive conservatism, cash flow levels would tend to be maintained
through time. To confirm this view, I run a second experiment, regressing differenced
cash flow on its lag and net working capital, and again adjusting for firms clustering. This
specification fits the data reasonably well (Wald Chi2 = 30.65, P rob > Chi2 = 0.000)
and all variables are significant. As expected, net working capital has a negative coefficient
(see Table 2). It is also the most significant regressor (z = −6.97, compared with −3.02
for past differenced cash flow, and 3.81 for the constant). The mean reversion of cash flow
is captured by the negative sign of past differenced cash flow, and this variable displays a
strong coefficient. When I run the regression on two subsamples of firms, those with a low
average Z-score [1.5, 2] and those with a higher average Z-score [2, 20], the model remains
significant and Chow tests suggest no significant difference in the coefficients. Low Z-score
firms, however, seem to display a relatively greater significance in net working capital.
Higher Z-score firms would have a stronger past differenced cash flow coefficient, which
could be explained by their better ability to preserve their cash reserves.
The result for net working capital can also be obtained by regressing cash flow on
lagged cash flow, debt, and net working capital. This specification is not rejected (Wald Chi2 =
71.19, P rob > Chi2 = 0.000) and all the coefficients are significant (Table 3). In this
model, net working capital is the most significant variable (z = −6.68, compared with
5.31 for lagged cash flow and −4.21 for debt) with the constant (z = 10.18). It also has
the expected negative sign, as debt. Lagged cash flow has a strong coefficient regardless
16

Table 2: Net Working Capital versus Past Cash Flow (dependent variable: change in cash
flow)
Z-score Lagged cash flow Net working capital Constant
All firms -0.231 -0.0001 0.0046
10,008 firms (0.003) (0.000) (0.000)
[1.5,2] -0.181 -0.0002 -0.003
720 firms (0.104) (0.000) (0.0236)
[2,20] -0.374 -0.0001 0.008
8,115 firms (0.000) (0.000) (0.000)
Cash flow = (cash flow/total asset) - (previous cash flow/previous total
asset), Net working capital = working capital - cash flow
Table 3: Cash Flow Hoarding and Debt (dependent variable: cash flow)
Z-score Lagged cash flow Debt Net working capital Constant
All firms 0.320 -0.166 -0.0002 0.089
10,164 firms (0.000) (0.000) (0.000) (0.000)
[1.5,2.5] 0.243 -0.240 -0.0003 0.117
1,624 firms (0.000) (0.048) (0.000) (0.004)
[2.5,3.5] 0.164 -0.121 -0.0005 0.102
2,321 firms (0.000) (0.000) (0.000) (0.000)
[3.5,5] 0.296 -0.084 -0.0002 0.082
2,773 firms (0.001) (0.002) (0.000) (0.000)
Cash flow = cash flow/total asset
17

of its categorization, and Chow tests suggest that this coefficient does not change much
across firms. As before, the explanatory power of lagged cash flow seems greater for low
Z-score firms, and debt less so.
Although Schnure’s results can be reproduced using my method of categorizing firms,
the robustness of his results might be improved upon by using a better-tailored method,
particularly one that does not rely on the working capital variable for that specific study.
Because my purpose in this paper is to study the precautionary part of investment, the
use of alternative indicators of financial stress is left for future research. Note also that, in
most experiments, the coefficients do not significantly change across categories of firms.
For example, hoarding of cash flow is a phenomenon common to all firms, because among
other reasons, the method of categorization captures the average Z-score. Hence, in my
experiments, a low Z-score firm is financially troubled on average, and not necessarily
often constrained; the Z-score is quite a volatile series.
4.3 Investment and financial expectations
To further assess the “excessive conservatism” argument, it is possible to use the mode
of the Z-score in conjunction with my method of categorizing firms. In the following
experiments, I assign firms to one of two categories (the low Z-score class and the high
Z-score class), depending on their average Z-score and the modes of their Z-score. The
minimum mode of the Z-score across the 10,435 firms has a mean of 1.554 and a standard
deviation of 5.054. The mean of the maximum mode is 7.2 (with a standard deviation of
9.7). The category for the financially constrained firms (the low Z-score class) excludes
firms with a Z-score greater than 1.81 on average and a minimum mode that exceeds −3.5.
The category for healthy firms (the high Z-score class) includes firms with a Z-score greater
than 4 on average and a maximum mode that exceeds 17.
In the first experiment, I regress investment (capital expenditures) on a proxy for a
firm’s profitability (q), cash flow, sales, and inventories, controlling for fixed effects for the
18
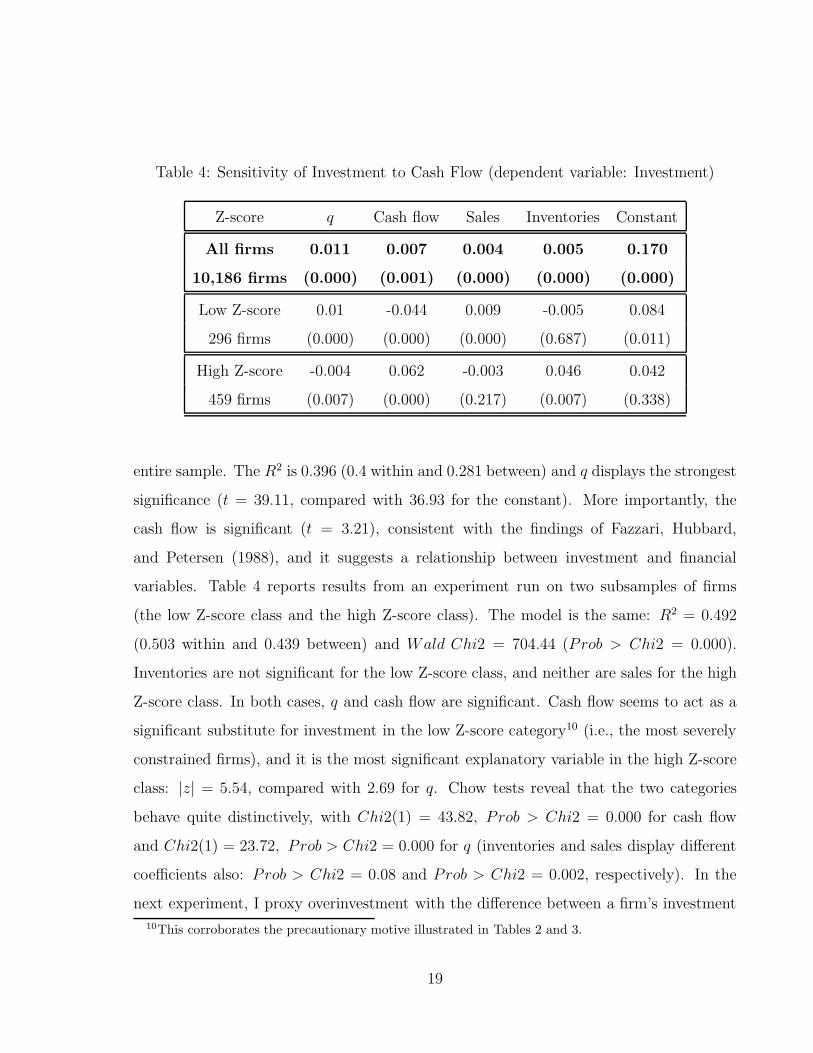
Table 4: Sensitivity of Investment to Cash Flow (dependent variable: Investment)
Z-score q Cash flow Sales Inventories Constant
All firms 0.011 0.007 0.004 0.005 0.170
10,186 firms (0.000) (0.001) (0.000) (0.000) (0.000)
Low Z-score 0.01 -0.044 0.009 -0.005 0.084
296 firms (0.000) (0.000) (0.000) (0.687) (0.011)
High Z-score -0.004 0.062 -0.003 0.046 0.042
459 firms (0.007) (0.000) (0.217) (0.007) (0.338)
entire sample. The R2 is 0.396 (0.4 within and 0.281 between) and q displays the strongest
significance (t = 39.11, compared with 36.93 for the constant). More importantly, the
cash flow is significant (t = 3.21), consistent with the findings of Fazzari, Hubbard,
and Petersen (1988), and it suggests a relationship between investment and financial
variables. Table 4 reports results from an experiment run on two subsamples of firms
(the low Z-score class and the high Z-score class). The model is the same: R2 = 0.492
(0.503 within and 0.439 between) and Wald Chi2 = 704.44 (Prob > Chi2 = 0.000).
Inventories are not significant for the low Z-score class, and neither are sales for the high
Z-score class. In both cases, q and cash flow are significant. Cash flow seems to act as a
significant substitute for investment in the low Z-score category10 (i.e., the most severely
constrained firms), and it is the most significant explanatory variable in the high Z-score
class: |z| = 5.54, compared with 2.69 for q. Chow tests reveal that the two categories
behave quite distinctively, with Chi2(1) = 43.82, P rob > Chi2 = 0.000 for cash flow
and Chi2(1) = 23.72, P rob > Chi2 = 0.000 for q (inventories and sales display different
coefficients also: Prob > Chi2 = 0.08 and Prob > Chi2 = 0.002, respectively). In the
next experiment, I proxy overinvestment with the difference between a firm’s investment
10This corroborates the precautionary motive illustrated in Tables 2 and 3.
19

Table 5: Overinvestment and Financial Health (dependent variable: overinvestment)
Z-score Sales q prob
Low Z-score 0.006 0.006 0.015
296 firms (0.043) (0.027) (0.022)
High Z-score -0.001 -0.001 0.399
459 firms (0.59) (0.607) (0.539)
and the average investment of its class (its Z-score category). I construct a dummy
variable, prob, equal to unity if the Z-score is below the threshold of 1.81 (i.e., the firm
faces a strong average probability of bankruptcy), and zero otherwise. There appears to
exist more underinvesting firms (i.e., negative overinvestment) than overinvesting ones,
so that prob has a negative coefficient unless underinvesting firms are discarded. The
regression of (positive) overinvestment on sales, q and prob, has a reasonable fit for the 302
observations (Wald Chi2(6) = 137.81, P rob > Chi2 = 0.000). As expected, removing
any firm that has negative overinvestment delivers a positive coefficient of prob for low
Z-score firms (Table 5). Prob is also found significant for this class. This is not true of
any regressor for the high Z-score firms, possibly because overinvestment is less frequent
in this category.
These results are only a preliminary indication of speculative overinvestment. The
Chow tests reveal no significant difference in the coefficients of the two categories, which
suggests that speculative overinvestment is still common among all firms, and (or) that it
is a short-lived phenomenon that is hard to capture even with average Z-scores refined with
Z modes. Furthermore, my method of categorizing firms might lead to a biased result,
because it is somewhat related to the prob regressor. In light of these caveats, it seems that
financial factors are significant variables for investment, at least when they are isolated
from the profitability variable. But the investment-cash flow relationship should not
20

necessarily be considered as only intratemporal. Indeed, the evidence suggests that any
categorization method used to assess the sensitivity of investment to cash flow should take
into account a firm’s expected financial constraints. This would be addressed by a method
based on the Z-score, as in this study, or by any similar financial stress indicator. This
kind of “forward-looking” method makes it possible to investigate excessive conservatism,
or precaution, for investment.
5 Conclusion: Some Macroeconomic Implications
According to asymmetric information models, the sensitivity of investment to cash flow
leads to an internal propagation mechanism. When there is an upturn in the economy,
external funds can be acquired at a cheaper cost. Indeed, an increase in internal funds,
ceteris paribus, reduces the cost of borrowing. Financially constrained firms can then
increase investment both because of the increase in internal funds and because external
funds become less expensive. Their investment decisions are sensitive to variations in
internal funds. This phenomenon is believed to generate a financial accelerator (Gertler
and Gilchrist 1994). Gertler (1992) and Carlstrom and Fuerst (1997) argue that business
fluctuations are amplified by the countercyclicality of external funds costs. During up-
turns, financially constrained firms have access to external funds at low cost. As their net
worth increases, they invest more. This, in turn, triggers a further increase in output.
Some form of limited commitment makes investment and borrowing sensitive to ex-
pected variations in cash flows. This leads, however, to a financial decelerator consistent
with the “excessive conservatism” argument. Therefore, in downturns, a firm can in-
vest more than an asymmetric framework would predict, because risk-sharing fully plays
its role; the precaution strongly prevails. The intuition behind this is straightforward.
In asymmetric information models, financially constrained firms can decrease their de-
gree of underinvestment only during upturns in the economy, whereas, in some limited-
21

commitment models, the financial constraint does not bind all the time. It arises (en-
dogenously) only during downturns. Thus, depending on the contract design, a firm
that expects a decrease in its future internal funds may have the opportunity to overin-
vest before facing the financial constraint vis-a-vis its creditor. This corresponds to the
investment smoothing reported in this paper.
I have categorized firms using a method that roughly captures the forward-looking
nature of investment decisions, beyond what can be achieved using a profitability vari-
able. As long as this method is independent of q, it is possible to demonstrate excessive
conservatism, or precaution, that leads directly to a financial decelerator. Sigouin (2003)
explains this financial decelerator by relying on limited-commitment, self-enforcing con-
tracts and risk-sharing between a borrower and a lender.
Because firms with high cash flow and high inventory levels do not need to invest
under unfavourable circumstances—or, if so, can rely on internal financing—they are
temporarily immune to an easing in credit conditions. Consistent with the interpretation
of the investment-cash flow relation given above, Kaplan and Zingales (1995) further
argue that “policies designed to make credit more available in recessions will not lead to
increased investment by firms with the highest investment-cash flow sensitivity.”
22

References
Abel, A. and O. Blanchard. 1986. “The Present Value of Profits and Cyclical Movements in
Investments.” Econometrica 54: 249–73.
Albuquerque, R. and H.A. Hopenhayn. 1997. “Optimal Dynamic Lending Contracts with
Imperfect Enforceability.” Rochester Center for Economic Research Working Paper.
Altman, E.I. 1983. “Corporate Financial Distress: A Complete Guide to Predicting, Avoiding,
and Dealing With Bankruptcy.” New York: John Wiley.
Altman, E.I., R. Haldeman, and P. Narayanan. 1977. “ZETA Analysis: A New Model to
Identify Bankruptcy Risk of Corporations.” Journal of Banking and Finance 1: 29–54.
Bernanke, B., M. Gertler, and S. Gilchrist. 1996. “The Financial Accelerator and the Flight
to Quality.” The Review of Economics and Statistics 78(1): 1–16.
Carlstrom, T.C. and T.S. Fuerst. 1997. “Agency Costs, Net Worth and Business Fluctuations:
A Computable General Equilibrium Analysis.” American Economic Review 87(5): 893–
910.
Devereux, M. and F. Schiantarelli. 1989. “Investment, Financial Factors and Cash Flow:
Evidence from UK Panel Data.” NBER Working Paper No. 3116.
Fazzari, S.M., G.R. Hubbard, and B.C. Petersen. 1988. “Financing Constraint and Corporate
Investment.” Brookings Papers on Economic Activity (1): 141–95.
Gertler, M. 1992. “Financial Capacity and Output Fluctuations in an Economy with Multi-
Period Financial Relationships.” Review of Economic Studies (59): 455–72.
Gertler, M. and S. Gilchrist. 1993. “The Role of Credit Market Imperfections in the Monetary
Transmission Mechanism: Arguments and Evidence.” Scandinavian Journal of Economics
95(1): 43–64.
23

Gertler, M. and S. Gilchrist. 1994. “Monetary Policy, Business Cycles and the Behavior of
Small Manufacturing Firms.” Quarterly Journal of Economics 109(2): 309–40.
Gilchrist, S. and C. Himmelberg. 1995. “Evidence on the Role of Cash Flow for Investment.”
Journal of Monetary Economics 36(3): 541–72.
——. 1998. “Investment: Fundamentals and Finance.” NBER Macroeconomics Annual
223–62.
Gomes, J. 2001. “Financing Investment.” American Economic Review 91(5): 1263–85.
Hart, O. and J. Moore. 1994. “A Theory of Debt Based on the Inalienability of Human
Capital.” Quarterly Journal of Economics 109(4): 841–79.
Kaplan N.S. and L. Zingales. 1995. “Do Financing Constraints Explain Why Investment Is
Correlated With Cash Flow?” NBER Working Paper No. 5267.
——. 2000. “Investment-Cash Flow Sensitivities Are Not Valid Measures of Financing Con-
straints.” Quarterly Journal of Economics 115(2): 707–12.
Kehoe, T.J. and D.K. Levine. 1993. “Debt-Constrained Asset Markets.” Review of Economic
Studies (60): 865–88.
Keynes, J.M. 1936. The General Theory of Employment, Interest, and Money. Macmillan
Publication, London.
Kiyotaki, N. and J. Moore. 1997. “Credit Cycles.” Journal of Political Economy 105(2):
211–48.
Marcet, A. and R. Marimon. 1992. “Communication, Commitment, and Growth.” Journal
of Economic Theory (58): 219–249.
Mills, K., S. Morling, and W. Tease. 1995. “The Influence of Financial Factors on Corporate
24

Investment.” Australian Economic Review 0(110): 50–64.
Opler, T., L. Pinkowitz, R. Stulz, and R. Willamson. 1999. “The Determinants and Implica-
tions of Corporate Cash Holdings.” Journal of Financial Economics 52(1): 3–46.
Romer, C.D. and D.H. Romer. 1988. “Does Monetary Policy Matter? A New Test in the
Spirit of Friedman and Schwartz.” NBER Macroeconomics Annual 4: 121–70.
——. 1992. “Money Matters.” Photocopy. University of California, Berkeley.
Schnure, C. 1998. “Who Holds Cash? And Why?” Photocopy. U.S. Federal Reserve Board.
Sigouin, C. 2003. “Investment Decisions, Financial Flows, and Self-Enforcing Contracts.”
International Economic Review 44(4): 1359–82.
Theodossiou, P. 1993. “Predicting Shifts in the Mean of a Multivariate Time Series Process:
An Application in Predicting Business Failures.” Journal of the American Statistical
Association 88(422): 441–49.
Thurlow, P. 1994. “Intermediated Finance, Inventory Investment and the Monetary Policy
Transmission Mechanism.” In Credit, Interest Rate Spreads and the Monetary Policy
Transmission Mechanism, 38–78. Proceedings of a conference held at the Bank of Canada,
November 1994.
Whited, T.M. 1992. “Debt, Liquidity Constraints, and Corporate Investment: Evidence from
Panel Data.” The Journal of Finance 4(157): 1425–60.
Whited, T.M. and T. Erickson. 2000. “Measurement Error and the Relationship between
Investment and q.” Journal of Political Economy 5(108): 1027–57.
25

Appendix A
Figure A1: Healthy Firms, All Sample by Z-Score
26

Figure A2: Troubled Firms, All Sample by Z-Score
27

Figure A3: Set of Bankrupt Firms
28

Appendix B: About the Data from Compustat
Standard and Poor’s Compustat provides a wide range of financial information about pub-
licly traded companies in the United States and Canada. It includes financial, statistical,
and market data covering more than 10,000 active firms and 9,400 inactive ones. It also
includes more than 340 annual and 120 quarterly income statements, balance sheets, flows
of funds, and other items. I use these data in this paper, including income-statement and
balance-sheet data on North American non-financial firms, for the 1980 to 1998 period,
collecting annual information on about 16,000 firms.
29

Bank of Canada Working PapersDocuments de travail de la Banque du Canada
Working papers are generally published in the language of the author, with an abstract in both officiallanguages.Les documents de travail sont publiés généralement dans la langue utilisée par les auteurs; ils sontcependant précédés d’un résumé bilingue.
Copies and a complete list of working papers are available from:Pour obtenir des exemplaires et une liste complète des documents de travail, prière de s’adresser à:
Publications Distribution, Bank of Canada Diffusion des publications, Banque du Canada234 Wellington Street, Ottawa, Ontario K1A 0G9 234, rue Wellington, Ottawa (Ontario) K1A 0G9E-mail: [email protected] Adresse électronique : [email protected] site: http://www.bankofcanada.ca Site Web : http://www.banqueducanada.ca
20042004-26 Regulatory Changes and Financial Structure: The
Case of Canada C. Calmès
2004-25 Money Demand and Economic Uncertainty J. Atta-Mensah
2004-24 Competition in Banking: A Review of the Literature C.A. Northcott
2004-23 Convergence of Government Bond Yields in the Euro Zone:The Role of Policy Harmonization D. Côté and C. Graham
2004-22 Financial Conditions Indexes for Canada C. Gauthier, C. Graham, and Y. Liu
2004-21 Exchange Rate Pass-Through and the Inflation Environmentin Industrialized Countries: An Empirical Investigation J. Bailliu and E. Fujii
2004-20 Commodity-Linked Bonds: A Potential Means forLess-Developed Countries to Raise Foreign Capital J. Atta-Mensah
2004-19 Translog ou Cobb-Douglas? Le rôle des duréesd’utilisation des facteurs E. Heyer, F. Pelgrin and A. Sylvain
2004-18 When Bad Things Happen to Good Banks:Contagious Bank Runs and Currency Crises R. Solomon
2004-17 International Cross-Listing and the Bonding Hypothesis M. King and D. Segal
2004-16 The Effect of Economic News on Bond Market Liquidity C. D’Souza and C. Gaa
2004-15 The Bank of Canada’s Business OutlookSurvey: An Assessment M. Martin and C. Papile
2004-14 National Saving–Investment Dynamics andInternational Capital Mobility F. Pelgrin and S. Schich
2004-13 Contraintes de liquidité et capital humaindans une petite économie ouverte F. Pelgrin
2004-12 Durées d’utilisation des facteurs et fonction deproduction : une estimation par la méthode desmoments généralisés en système E. Heyer, F. Pelgrin, and A. Sylvain
2004-11 Estimating New Keynesian Phillips CurvesUsing Exact Methods L. Khalaf and M. Kichian