financial model - ibm · financial model mark loughridge senior vice president and chief financial...
TRANSCRIPT

Financial Model
Mark Loughridge Senior Vice President and Chief Financial Officer,
Finance and Enterprise Transformation

© 2013 International Business Machines Corporation 2
11% CAGR
~$50B returned through share repurchase
Revenue Growth
~$2.80
2010 Operating EPS*
Revenue Mix
Enterprise Productivity
Margin Mix
Shares
2015 Operating EPS*
$11.67
At Least
$20
Operating Leverage
~$2.50
~$3.05
2015 Roadmap
Acquisitions
Enterprise Productivity yields margin
expansion
Shift to a higher value portfolio continues to
provide leverage
Shift to faster growing business mix provides ~1% revenue growth
Base revenue growth ~2%
excluding divestitures
~$20B of acquisition spend provides ~2%
revenue growth
Base Revenue Growth
* Non-GAAP: Excludes acquisition-related charges and non-operating retirement-related expense. Assumes current tax policy and Non-GAAP tax rate of 25%

© 2013 International Business Machines Corporation 3
2010 2012 2015
2015 Roadmap Progress
$11.67
$15.25
“At Least”
$20
2010-15 11% CAGR
Operating EPS*
Revenue Continued strong growth across key initiatives
– Growth Markets +10% CAGR
– Smarter Planet >25% CAGR
– Business Analytics +14% CAGR
– Cloud ~7x 2010 revenue
Strong acquisition performance
Operating Leverage
Margin expansion driven by continued business mix shift to higher value areas, Enterprise Productivity savings and operational improvements
Cash & Shareholder Return
Generated $35 billion in free cash flow and returned $34B to shareholders through gross share repurchase and dividends in 2011 and 2012
* Non-GAAP: Excludes acquisition-related charges and non-operating retirement-related expense
14% CAGR
2010 – 2012 Results

© 2013 International Business Machines Corporation 4
Business Analytics Growth Markets
Smarter Planet
Cloud
Contributes ~$7B of growth over Roadmap
Contributes ~$10B of growth over Roadmap
up from $6B previously
Contributes ~$7B of revenue, of which ~$3B is incremental growth
Approaches 30% of IBM’s geographic revenue by 2015
Revenue Growth ~$0.59
$11.67
Share Repurchase
$15.25 14% CAGR
’10-’12 Operating EPS
Growth Initiatives Roadmap Objectives
Operating Leverage
Growth Initiatives

© 2013 International Business Machines Corporation 5
~$17B ~$10B
~$3B ~$7B
2010* Revenue from Key Initiatives
2015 Revenue from Key Initiatives
Double-digit yr/yr growth
2010 ~$4B
~$3B
~$4B
~$0.4B
~$9B
Growth Initiatives contributed ~$9 billion of revenue growth
Incremental Cloud
Growth Markets
Smarter Planet
Business Analytics
2012
*Adjusted for scope added in 2012
Revenue Growth ~$0.59
$11.67
Share Repurchase
$15.25 14% CAGR
’10-’12 Operating EPS
Operating Leverage
Growth Initiatives

© 2013 International Business Machines Corporation 6
2pts
2pts
1pts
BAO Smarter Planet Cloud High Value '10-'12 CGR
~20% 2012 GP%* ~60% ~50%
Includes: Labor-based Proc Svcs Legacy Advisory Svcs
Legacy App Svcs RSS
Industry Std Servers
* External Segment GP % modeled based on brand mix within each category at 2012 average margins by brand ** External segment revenue
Includes: GBS
Growth Markets GTS IGF
IP-based Proc Svcs Mainframe
Power PureSystems
Software Storage
Currently Under-performing
(excl. Growth Initiatives content)
Revenue Growth ~$0.59
$11.67
Share Repurchase
$15.25 14% CAGR
’10-’12 Operating EPS
Operating Leverage
~85% of total segment revenue in 2012
Growth Initiatives and high value offerings drove 4% growth at higher margins
2010 – 2012 Revenue Dynamics
4% CAGR
3% CAGR
2%** CAGR

© 2013 International Business Machines Corporation 7
2010 2011 2012 2013 2014 2015
Annual Operating EPS from Closed Acquisitions
Roadmap ~$0.90
~5% Pending Acquisitions
~95% Closed Acquisitions
Actual
Projected
Revenue Growth ~$0.59
$11.67
Share Repurchase
$15.25 14% CAGR
’10-’12 Operating EPS
Operating Leverage
Closed acquisitions through 2012 position us on track to achieve the 2015 objectives
Acquisitions

© 2013 International Business Machines Corporation 8
~$1B
Operating view @ actual rates
Acquisitions closed 2010 - 2012
Revenue Growth ~$0.59
$11.67
Share Repurchase
$15.25 14% CAGR
’10-’12 Operating EPS
Operating Leverage
Acquisitions closed since beginning of 2010 generated ~$1B of profit since inception
Acquisition Operating PTI
• 27 of the 33 acquisitions closed by the end of 2012 are exceeding their profit business cases
Scalable intellectual property
Key to solutions offerings
Drive synergies through global distribution
Acquisitions

© 2013 International Business Machines Corporation 9
57% 54%
71%75%
61% 63%59%
33%
50%
10%
21%
36%40%
29%
Likelihood of a deal achieving objectives
Attribute 1 Attribute 2 Attribute 3 Attribute 4 Attribute 5
Deals that don’t exhibit selected attribute Deals that exhibit selected attribute
Analytics around the correlation between key attributes and deal performance validate our acquisition strategy and improve our selection process
Attribute 18 Attribute 17
End-to-end themes that build on IBM strategic platforms – organic or acquired – and extend adjacently into new market opportunities. Examples:
• Smarter Commerce built on Websphere Commerce • Business Analytics built on Cognos acquisition • Enterprise Social built on Collaboration Solutions enhanced by Kenexa acquisition • Security built on Tivoli connected by Q1 Labs acquisition
Success Factors
Revenue Growth ~$0.59
$11.67
Share Repurchase
$15.25 14% CAGR
’10-’12 Operating EPS
Operating Leverage
Acquisitions

© 2013 International Business Machines Corporation 10
Servers, Networking &
Storage Optimization
Cloud
Smarter Planet
Governance, Risk, Compliance &
Security
Complements Organic Assets
GTS Service Delivery
IBM Hardware Portfolio
GBS BAO Service Line
8 Analytics Solution Centers
Industry Solutions Frameworks
IBM Hardware Portfolio
GBS Offerings
Business Intelligence & Data Analytics
Spent $19B in R&D and ~$12B for 35 acquisitions closed / announced since beginning of 2010
Revenue Growth ~$0.59
$11.67
Share Repurchase
$15.25 14% CAGR
’10-’12 Operating EPS
Operating Leverage
Acquisitions

© 2013 International Business Machines Corporation 11
Acquisitions have contributed significantly to IBM’s growth in key strategic areas
Big Data Mobile Social Business
Acquired
Organic IBM Connections
Help customers recruit,
on board, enable, train
and manage staff with an
integrated social platform
to create a smarter
workforce
IBM InfoSphere
Enable secure discovery
and exploration of data
across a broad range of
enterprise content and big
data to maximize return
on information
IBM Mobile Connect
Deliver application
development,
connectivity,
management & security
capabilities across many
device types
Revenue Growth ~$0.59
$11.67
Share Repurchase
$15.25 14% CAGR
’10-’12 Operating EPS
Operating Leverage
Acquisitions

© 2013 International Business Machines Corporation 12
Manage Risk Enterprise Risk Management
and advisor to business units and senior management
Operational Efficiency Efficient service delivery through standardization, automation and
centralization
Business Insight Trusted Business Advisors
Tools Deployed Tools Deployed Tools Deployed
Country Financial Risk Scorecard
PRISM M&A risk management
Strategic planning optimization (SEE)
Critical Parts Management Tool
Employee expenses monitoring
Worldwide spending analytics
Workforce Analytics
Coverage Optimization
SO Cost and Risk Management
Labor claiming analytics
Business Intelligence Dashboards
Services Backlog Run Out and
Revenue Analytics
Business Partner Optimization and
Opportunity Growth
Transformation for Quota and
Opportunity Alignment
Implementation of Finance 2.0
Revenue Growth ~$0.59
$11.67
Share Repurchase
$15.25 14% CAGR
’10-’12 Operating EPS
Operating Leverage
Deployment of Analytics

© 2013 International Business Machines Corporation 13
5,081
3,1743,032
2,7692,613
2,447
2,013
1,652 1,624
6,478
IBM Samsung Canon Sony Panasonic Microsoft Toshiba Hon Hai GE LG
Source: IFI CLAIMS Patent Services
20 Consecutive Years of Patent Leadership
Research & Development
~$35B
2015 Roadmap 2006 - 2010
$30B
2012 US Patents
We will continue to focus our investments on higher value businesses
Revenue Growth ~$0.59
$11.67
Share Repurchase
$15.25 14% CAGR
’10-’12 Operating EPS
Operating Leverage
Investing for Growth

© 2013 International Business Machines Corporation 14
Revenue Growth @ CC
* Revenue mix percentages exclude PCD and Printers divestitures
Growth Markets % of IBM Geographic Revenue*
2011
16%
18%
21%
22%
24%
2006
2008
2010
11% 2000
30% Approaches
2015
2012
2%
-6%
1% 2%
-1%
10%
1%
11% 11%
7%
2008 2009 2010 2011 2012
Major Markets Growth Markets
+8 pts
+8 pts
+10 pts
+8 pts
IBM’s business mix continues to shift towards the Growth Markets
+10 pts
Revenue Growth ~$0.59
$11.67
Share Repurchase
$15.25 14% CAGR
’10-’12 Operating EPS
Operating Leverage
Growth Markets

© 2013 International Business Machines Corporation 15
~$51B
~$47B
$1.9B
$0.5B $1.1B
$0.6B
2010 2012
Growth Markets delivered over 60% of IBM’s geographic gross profit growth between 2010 and 2012
* Sum of geographic gross profit not equal to IBM gross profit
Growth Markets
Major Markets
61% 39% Growth Markets
Major Markets
80% 20% Growth Markets
Major Markets
Geographic Gross Profit Bridge*
Gross profit from margin expansion
Gross profit from revenue growth
Revenue Growth ~$0.59
$11.67
Operating Leverage
~$1.49
Share Repurchase
$15.25 14% CAGR
’10-’12 Operating EPS
Revenue Growth Mix
Gross Profit Growth Mix
Operating Leverage

© 2013 International Business Machines Corporation 16
Operating Pre-tax Income
Hardware/Financing Services Software
* Sum of operating segment pre-tax income not equal to IBM operating pre-tax income
** Stock-based compensation expense was not recorded at the segment level and excludes Enterprise Investments
2000**
Mix* Margin
35% @ 8%
38% @ 10% 27% @ 19%
2015 2006 2012
~10%
~40%
~50%
14% @ 15%
41% @ 16%
45% @ 38% Mix* Margin
Mix* Margin
Mix*
23% @ 12%
37% @ 10%
40% @ 28%
10%
22%
15%
Revenue Growth ~$0.59
$11.67
Operating Leverage
~$1.49
Share Repurchase
$15.25 14% CAGR
’10-’12 Operating EPS
IBM expands margins in 2015 Roadmap by continuing to shift to higher value
Operating Leverage

© 2013 International Business Machines Corporation 17
Shared Services
End-to-End Process
Transformation
Integrated Operations
Cost & Expense Reduction
Revenue Productivity
Software
Services
Hardware / Financing
$8B $8B $8B
Enterprise Productivity Savings ($B)
Revenue Growth ~$0.59
$11.67
Operating Leverage
~$1.49
Share Repurchase
$15.25 14% CAGR
’10-’12 Operating EPS
On track to achieve $8B of Enterprise Productivity
Operating Leverage

© 2013 International Business Machines Corporation 18
~40% flow to bottom-line
Ente
rpri
se
Pro
du
ctiv
ity
$8B
~60% reinvested for growth
Growth Investments
BAO Cloud Smarter Planet Growth
Markets
Acquisitions*
* Investment in acquisitions not already accounted for in the growth initiatives
Revenue Growth ~$0.59
$11.67
Operating Leverage
~$1.49
Share Repurchase
$15.25 14% CAGR
’10-’12 Operating EPS
Enterprise Productivity is a critical source of investment funding
Operating Leverage

© 2013 International Business Machines Corporation 19
* Excluding GF Receivables
Primary Cash Uses $B
15.116.3
10.59.69.18.7
5.9
14.3
12.4
16.618.2
2002 2003 2004 2005 2006 2007 2008 2009 2010 2011 2012
$7$6
$8
$272011 - 2012
Gross Share Repurchase
Acquisitions
Capital
Dividends
Free Cash Flow* $B 2011 - 2015:
• Generate $90B - $100B of Free Cash Flow
• Return $70B to shareholders through gross share repurchases and dividends
• Spend $20B in acquisitions
• $30B - $40B of Financial Flexibility
Revenue Growth ~$0.59
$11.67
Operating Leverage ~$1.49
Share Repurchase
~$1.50
$15.25 14% CAGR
’10-’12 Operating EPS
Strong Free Cash Flow supports investments and shareholder returns
Cash Generation and Usage

© 2013 International Business Machines Corporation 20
$11.67
Revenue Growth
Operating Leverage ~$2.50
~$3.05
Performance through ‘12: ~$0.59
~$1.49
~$1.50
~$2.80
Revenue Mix Enterprise Productivity
Margin Mix Shares Acquisitions Base Revenue Growth
2015 Operating EPS*
2010 Operating EPS*
14% CAGR $15.25
9.5%+ CAGR to go
“At Least” $20
~$50B returned through share repurchase
Enterprise Productivity yields margin
expansion
Shift to a higher value portfolio continues to
provide leverage
Shift to faster growing business mix provides ~1% revenue growth
Base revenue growth ~2%
excluding divestitures
~$20B of acquisition spend provides ~2%
revenue growth
2015 Roadmap
* Non-GAAP: Excludes acquisition-related charges and non-operating retirement-related expense. Assumes current tax policy and Non-GAAP tax rate of 25%
© 2013 International Business Machines Corporation 21
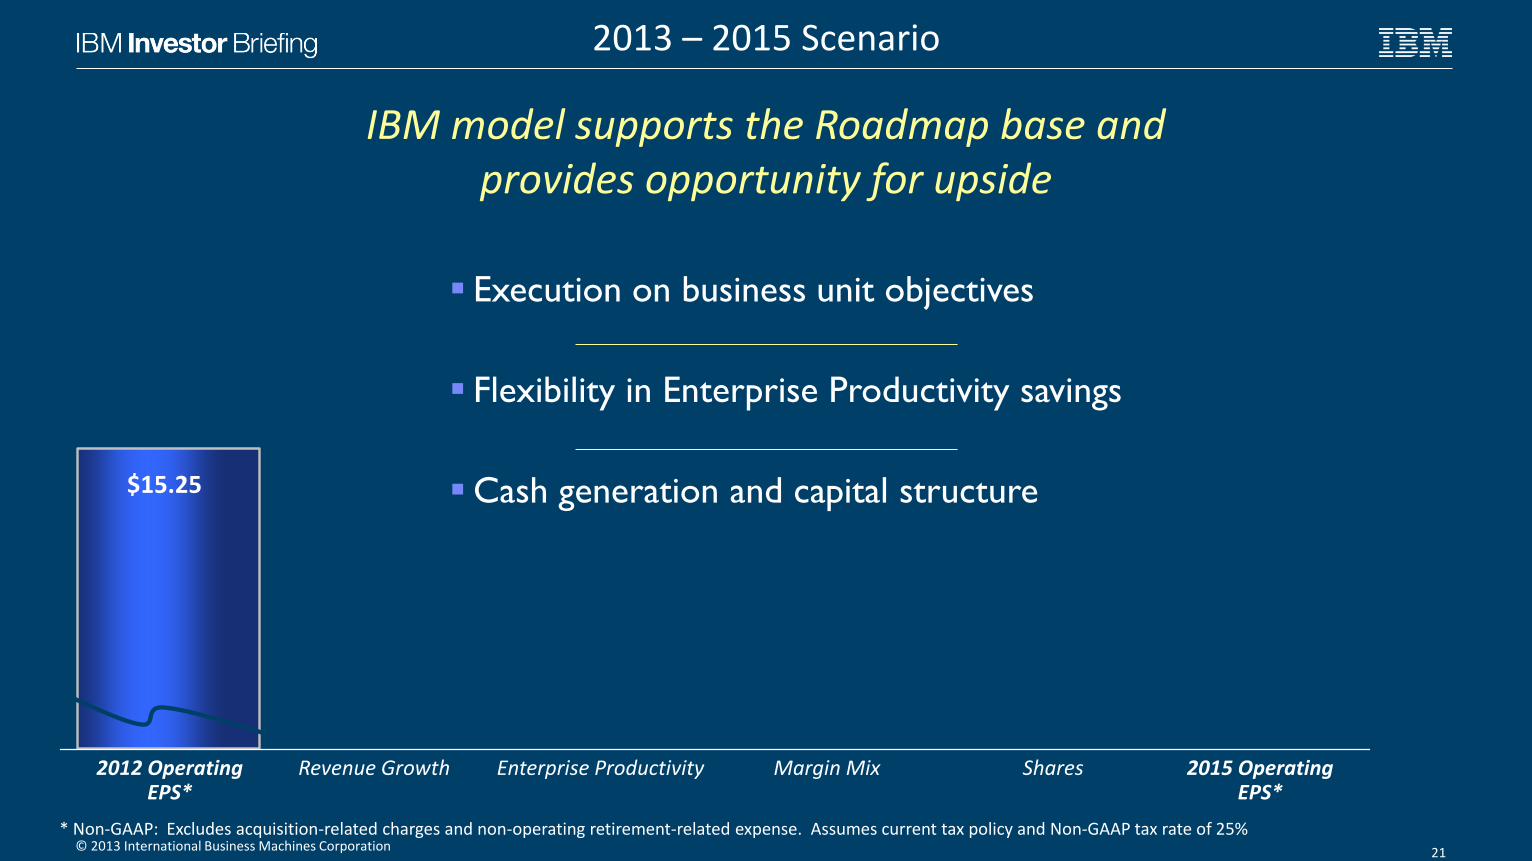
$15.25
Execution on business unit objectives
Flexibility in Enterprise Productivity savings
Cash generation and capital structure
IBM model supports the Roadmap base and provides opportunity for upside
2013 – 2015 Scenario
* Non-GAAP: Excludes acquisition-related charges and non-operating retirement-related expense. Assumes current tax policy and Non-GAAP tax rate of 25%
Revenue Growth 2015 Operating EPS*
2012 Operating EPS*
Shares Enterprise Productivity Margin Mix

© 2013 International Business Machines Corporation 22
Revenue Growth 2015 Operating EPS*
2012 Operating EPS*
$15.25
Share Buyback
14% CAGR $15.25
~$1.35
Shares Enterprise Productivity Margin Mix
Remaining $23B of gross share repurchase delivers ~$1.35 EPS
* Non-GAAP: Excludes acquisition-related charges and non-operating retirement-related expense. Assumes current tax policy and Non-GAAP tax rate of 25%
2013 – 2015 Scenario

© 2013 International Business Machines Corporation 23
Revenue Growth 2015 Operating EPS*
2012 Operating EPS*
$15.25
Share Buyback
Software Profit Growth
14% CAGR $15.25
Shares Enterprise Productivity Margin Mix
Software profit at historical growth delivers ~$2.70 EPS
~$1.35
~$2.70
2013 – 2015 Scenario
* Non-GAAP: Excludes acquisition-related charges and non-operating retirement-related expense. Assumes current tax policy and Non-GAAP tax rate of 25%

© 2013 International Business Machines Corporation 24
Revenue Growth 2015 Operating EPS*
2012 Operating EPS*
$15.25
Enterprise Prod. yield
Share Buyback
14% CAGR $15.25
~$0.70
$20
Shares Enterprise Productivity Margin Mix
Enterprise Productivity delivers ~$.70 EPS
~$1.35
~$2.70 Software
Profit Growth
2013 – 2015 Scenario
* Non-GAAP: Excludes acquisition-related charges and non-operating retirement-related expense. Assumes current tax policy and Non-GAAP tax rate of 25%

© 2013 International Business Machines Corporation 25
Revenue Growth 2015 Operating EPS*
2012 Operating EPS*
$15.25
Enterprise Prod. yield
Share Buyback
Capture additional growth opportunity from Software, Services & Hardware
14% CAGR $15.25
~$0.70
~$2.70
“At Least” $20
Shares Enterprise Productivity Margin Mix
~$1.35
Software Profit Growth
2013 – 2015 Scenario
* Non-GAAP: Excludes acquisition-related charges and non-operating retirement-related expense. Assumes current tax policy and Non-GAAP tax rate of 25%

© 2013 International Business Machines Corporation 26
'00 '01 '02 '03 '04 '05 '06 '07 '08 '09 '10 '11 '12 '13e '14e '15e
Hardware / Financing Services Software Sum of external segment pre-tax income not equal to IBM pre-tax income * Non-GAAP: Excludes Acquisition-related charges and non-operating retirement-related expense
Operating PTI / EPS * Segment Operating PTI$
2000 & 2001 segments not restated for stock based compensation
2015 Objectives
Operating EPS
2015 Roadmap
$3.32 $1.81
At Least $20
$15.25
At Least $16.70
Software contributes about half of our segment profit
Growth Initiatives deliver > $20B in revenue growth
Growth Markets approach 30% of IBM’s geographic revenue
Enterprise Productivity delivers $8B in gross savings
IBM returns $70B to shareholders over the Roadmap

© 2013 International Business Machines Corporation 27

© 2013 International Business Machines Corporation 28
These charts and the associated remarks and comments are integrally related, and they are intended to be presented and understood together.
In an effort to provide additional and useful information regarding the company’s financial results and other financial information as determined by generally accepted accounting principles (GAAP), certain materials presented during this event include non-GAAP information. The rationale for management’s use of this non-GAAP information, the reconciliation of that information to GAAP, and other related information is included in supplemental materials entitled “Non-GAAP Supplemental Materials” that are linked to the company’s investor relations web site at http://www.ibm.com/investor/events/investor0213.phtml. The Non-GAAP Supplemental Materials are also included as Attachment II to the company’s Forms 8-K dated January 22, 2013 and February 28, 2013.

© 2013 International Business Machines Corporation 29