financial our business statements - aa annual report...
TRANSCRIPT

Ou
r Bu
sine
ss
Go
ve
rna
nc
eF
ina
nc
ial S
tate
me
nts
Ou
r Pe
rform
an
ce
AA plc Annual Report and Accounts 2016 87
Financial statementsfor the year ended 31 January 2016

88 AA plc Annual Report and Accounts 2016
Note2016
£m2015
£m
Revenue 2 973 984
Cost of sales (347) (346)
Gross profit 626 638
Administrative & marketing expenses (322) (313)
Share of profits of joint venture and associates, net of tax 1 1
Operating profit 305 326
Trading EBITDA 2 415 430
Items not allocated to a segment 2 (18) (8)
Amortisation and depreciation 9,11 (54) (48)
Exceptional items 3 (38) (48)
Operating profit 3 305 326
Finance costs 4 (289) (266)
Finance income 5 1 1
Profit before tax 17 61
Tax (expense)/credit 7 (11) 8
Profit for the year 6 69
Earnings per share from profit for the year Note2016
pence2015
pence
Basic 8 1.0 13.3
Diluted 8 1.0 13.3
The accompanying notes are an integral part of this consolidated income statement.
Consolidated income statementfor the year ended 31 January

Ou
r Bu
sine
ss
Go
ve
rna
nc
eF
ina
nc
ial S
tate
me
nts
AA plc Annual Report and Accounts 2016 89
Ou
r Pe
rform
an
ce
Note2016
£m2015
£m
Profit for the year 6 69
Other comprehensive income on items that may be reclassified to profit and loss in subsequent years
Exchange differences on translation of foreign operations 1 (1)
Effective portion of changes in fair value of cash flow hedges 10 (14)
Tax effect (expense)/credit 7 (2) 3
9 (12)
Other comprehensive income on items that will not be reclassified to profit and loss in subsequent years
Remeasurement on gains/(losses) on defined benefit schemes 23 149 (167)
Tax effect (expense)/credit 7 (26) 32
123 (135)
Total other comprehensive income 22 132 (147)
Total comprehensive income for the year 138 (78)
The accompanying notes are an integral part of this consolidated statement of comprehensive income.
Consolidated statement of comprehensive incomefor the year ended 31 January

90 AA plc Annual Report and Accounts 2016
Note2016
£m2015
£m
Non-current assets
Goodwill and other intangible assets 9 1,298 1,257
Property, plant and equipment 11 122 100
Investments in joint ventures and associates 12 10 4
Deferred tax assets 7 52 81
Other receivables 14 – 21
1,482 1,463
Current assets
Inventories 13 5 5
Trade and other receivables 14 172 187
Current tax receivable – 1
Cash and cash equivalents 15 166 302
343 495
Total assets 1,825 1,958
Current liabilities
Trade and other payables 16 (518) (498)
Current tax payable (7) –
Provisions 19 (8) (8)
(533) (506)
Non-current liabilities
Borrowings and loans 17 (2,920) (3,241)
Finance lease obligations 27 (21) (16)
Defined benefit pension scheme net liabilities 23 (296) (434)
Provisions 19 (7) (12)
Insurance technical provisions 20 (4) (4)
(3,248) (3,707)
Total liabilities (3,781) (4,213)
Net liabilities (1,956) (2,255)
Equity
Share capital 21 1 1
Share premium 22 399 200
Own shares 22 (22) –
Currency translation reserve 22 (1) (2)
Cashflow hedge reserve 22 (10) (18)
Retained earnings 22 (2,323) (2,436)
Total equity attributable to equity holders of the parent (1,956) (2,255)
Signed for and on behalf of the Board on 4 April 2016 by
Bob Mackenzie Martin Clarke Executive Chairman Chief Financial Officer
The accompanying notes are an integral part of this consolidated statement of financial position.
Consolidated statement of financial positionfor the year ended 31 January

Ou
r Bu
sine
ss
Go
ve
rna
nc
eF
ina
nc
ial S
tate
me
nts
AA plc Annual Report and Accounts 2016 91
Ou
r Pe
rform
an
ce
Attributable to the equity holders of the parent
Share capital
£m
Share premium
£m
Own shares
£m
Currency translation
reserve £m
Cashflow hedge
reserve £m
Retained earnings
£mTotal
£m
At 1 February 2014 – 1 – (1) (7) (2,372) (2,379)
Profit for the year – – – – – 69 69
Other comprehensive income – – – (1) (11) (135) (147)
Total comprehensive income – – – (1) (11) (66) (78)
Issue of share capital 1 199 – – – – 200
Share-based payments – – – – – 2 2
At 31 January 2015 1 200 – (2) (18) (2,436) (2,255)
Profit for the year – – – – – 6 6
Other comprehensive income – – – 1 8 123 132
Total comprehensive income – – – 1 8 129 138
Dividends – – – – – (21) (21)
Issue of share capital – 199 – – – – 199
Purchase of own shares – – (22) – – – (22)
Share-based payments – – – – – 5 5
At 31 January 2016 1 399 (22) (1) (10) (2,323) (1,956)
The accompanying notes are an integral part of this consolidated statement of changes in equity.
Consolidated statement of changes in equityfor the year ended 31 January
92 AA plc Annual Report and Accounts 2016
Note2016
£m2015
£m
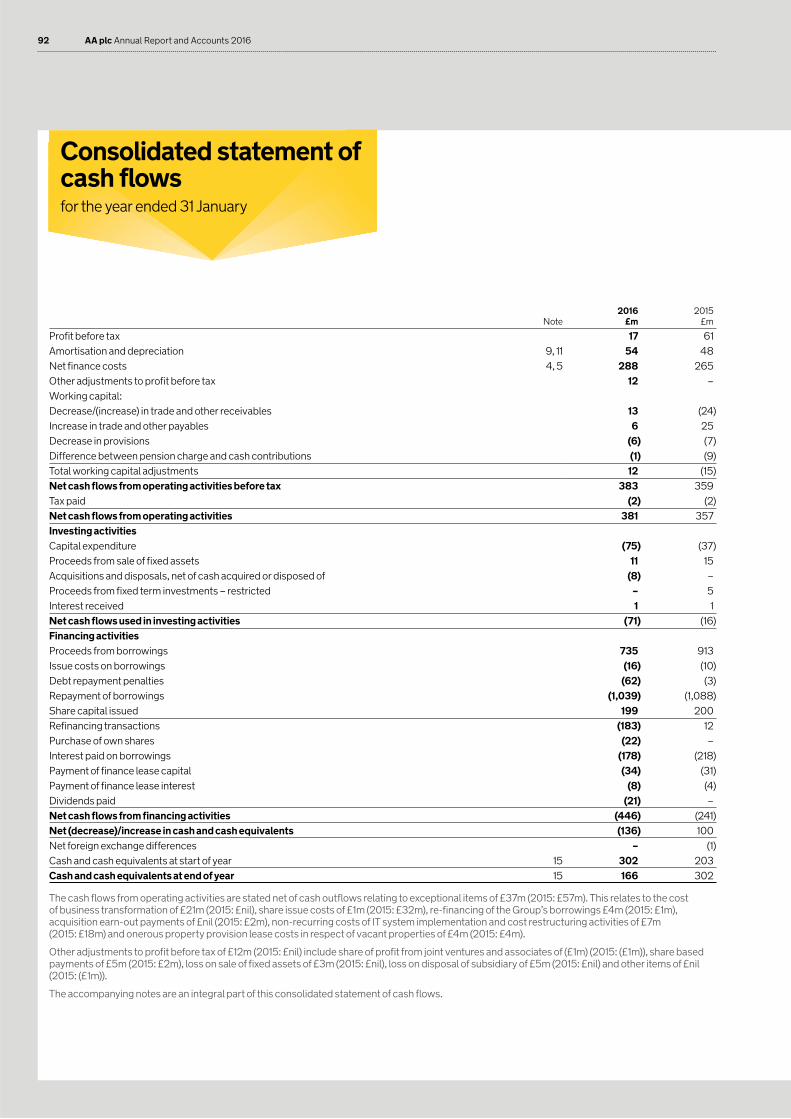
Profit before tax 17 61
Amortisation and depreciation 9, 11 54 48
Net finance costs 4, 5 288 265
Other adjustments to profit before tax 12 –
Working capital:
Decrease/(increase) in trade and other receivables 13 (24)
Increase in trade and other payables 6 25
Decrease in provisions (6) (7)
Difference between pension charge and cash contributions (1) (9)
Total working capital adjustments 12 (15)
Net cash flows from operating activities before tax 383 359
Tax paid (2) (2)
Net cash flows from operating activities 381 357
Investing activities
Capital expenditure (75) (37)
Proceeds from sale of fixed assets 11 15
Acquisitions and disposals, net of cash acquired or disposed of (8) –
Proceeds from fixed term investments – restricted – 5
Interest received 1 1
Net cash flows used in investing activities (71) (16)
Financing activities
Proceeds from borrowings 735 913
Issue costs on borrowings (16) (10)
Debt repayment penalties (62) (3)
Repayment of borrowings (1,039) (1,088)
Share capital issued 199 200
Refinancing transactions (183) 12
Purchase of own shares (22) –
Interest paid on borrowings (178) (218)
Payment of finance lease capital (34) (31)
Payment of finance lease interest (8) (4)
Dividends paid (21) –
Net cash flows from financing activities (446) (241)
Net (decrease)/increase in cash and cash equivalents (136) 100
Net foreign exchange differences – (1)
Cash and cash equivalents at start of year 15 302 203
Cash and cash equivalents at end of year 15 166 302
The cash flows from operating activities are stated net of cash outflows relating to exceptional items of £37m (2015: £57m). This relates to the cost of business transformation of £21m (2015: £nil), share issue costs of £1m (2015: £32m), re-financing of the Group’s borrowings £4m (2015: £1m), acquisition earn-out payments of £nil (2015: £2m), non-recurring costs of IT system implementation and cost restructuring activities of £7m (2015: £18m) and onerous property provision lease costs in respect of vacant properties of £4m (2015: £4m).
Other adjustments to profit before tax of £12m (2015: £nil) include share of profit from joint ventures and associates of (£1m) (2015: (£1m)), share based payments of £5m (2015: £2m), loss on sale of fixed assets of £3m (2015: £nil), loss on disposal of subsidiary of £5m (2015: £nil) and other items of £nil (2015: (£1m)).
The accompanying notes are an integral part of this consolidated statement of cash flows.
Consolidated statement of cash flowsfor the year ended 31 January

Ou
r Bu
sine
ss
Go
ve
rna
nc
eF
ina
nc
ial S
tate
me
nts
AA plc Annual Report and Accounts 2016 93
Ou
r Pe
rform
an
ce
1 Basis of preparatio n and accounting policies
1.1 General informationThe consolidated financial statements for the year ended 31 January 2016 comprise the financial statements of AA plc (‘the Company’) and its subsidiaries (together referred to as ‘the Group’). AA plc is a public limited company incorporated and domiciled in the United Kingdom.
These statements have been presented to the nearest £million and the prior year comparatives have been restated accordingly.
1.2 Basis of preparationThe Group has prepared these statements under International Financial Reporting Standards (IFRS) as adopted by the European Union, International Financial Reporting Interpretation Council (IFRIC) interpretations and those parts of the Companies Act 2006 applicable to companies reporting under IFRS.
These consolidated financial statements have been prepared under the historic cost convention as modified by the measurement of derivatives and liabilities for contingent consideration in business combinations at fair value.
a) Going concernThe Group is highly cash generative with a large proportion of its revenues coming from recurring transactions. The significant customer loyalty demonstrated by high renewal rates and lengthy customer tenure underpins this. The Group’s borrowings are long-term in nature and in addition to the cash balances at the reporting date the Group has agreed undrawn credit facilities. Additionally, the Group has ready access to both public debt and equity markets allowing these borrowings to be easily refinanced in due course. The Directors have reviewed projected cash flows for a period of one year from the date of signing these financial statements and have concluded that the Group has sufficient funds to continue trading for this period and the foreseeable future. Therefore, the financial statements have been prepared using the going concern basis.
b) Basis of consolidationThe consolidated financial statements incorporate the financial statements of the Company and entities controlled by the Company (its subsidiaries). Control is achieved where the Company has rights to variable returns from its involvement with the entity and has the ability to influence those returns through its power over the entity.
The results of subsidiaries acquired or disposed of during the year are included in the consolidated income statement from the effective date of acquisition or up to the effective date of disposal, as appropriate. Where necessary, adjustments are made to the financial statements of subsidiaries to bring the accounting policies into line with those used by the Group. All intra-group transactions, balances, income and expenses are eliminated on consolidation.
1.3 Accounting policiesThe principal accounting policies are set out below.
a) Interests in joint ventures and associatesAn associate is an entity over which the Group is in a position to exercise significant influence, but not control or joint control, through participating in the financial and operating policy decisions of the entity. Joint ventures are joint arrangements whereby the parties that have joint control of the arrangement have rights to the net assets of the arrangement.
The results, assets and liabilities of joint ventures and associates are incorporated in these financial statements using the equity method of accounting. Investments in joint ventures and associates are carried in the Group balance sheet at cost as adjusted by post-acquisition changes in the Group’s share of the net assets less any impairment losses.
b) Foreign currenciesThese financial statements are presented in pounds sterling which is the currency of the primary economic environment in which the Group operates.
Transactions in currencies other than the functional currency of each consolidated undertaking are recorded at rates of exchange prevailing on the dates of the transactions. Monetary assets and liabilities denominated in foreign currencies are translated into the respective functional currency at rates of exchange ruling at the balance sheet date. Gains and losses arising on the translation of assets and liabilities are taken to the income statement.
The results of overseas operations are translated into sterling at average rates of exchange for the period. Exchange differences arising on the retranslation of the opening net assets of overseas operations are transferred to the Group’s cumulative translation reserve in equity.
c) Business combinations and goodwillAll business combinations are accounted for by applying the acquisition method.
Costs related to the acquisition, other than those associated with the issue of debt or equity securities, are expensed as incurred.
Goodwill arising on consolidation represents the excess of the cost of acquisition over the Group’s interest in the fair value of the identified assets and liabilities of a subsidiary at the date of acquisition. Goodwill is recognised as an asset at cost less accumulated impairment losses.
Any contingent consideration payable is recognised at fair value at the acquisition date, and subsequent changes to the fair value of the contingent consideration are recognised in profit or loss. Any consideration paid to a former owner who continues to work for the business as part of the acquisition that is contingent on future service is excluded from goodwill and treated as acquisition earn-out costs within items not allocated to a segment within administrative and marketing expenses.
d) Intangible assetsIntangible assets other than goodwill which are acquired separately are stated at cost. The cost of intangible assets acquired in a business combination is their fair value as at the date of acquisition.
Following initial recognition, intangible assets are carried at cost less any accumulated amortisation and impairment losses. Intangible assets with finite lives are amortised over the useful economic life.
e) Software and development costsSoftware development expenditures on an individual project are recognised as an intangible asset when the Group can demonstrate:
The technical feasibility of completing the intangible asset so that it will be available for use or sale
Its intention to complete and its ability to use or sell the asset
How the asset will generate future economic benefits
The availability of resources to complete the asset
The ability to measure reliably the expenditure during development
Following initial recognition of the development expenditure as an asset, the cost model is applied. The asset is carried at cost less any accumulated amortisation and impairment losses. Amortisation of the asset begins when development is complete and the asset is available for use. It is amortised over its useful life of three to five years.
Notes to the consolidated financial statements

94 AA plc Annual Report and Accounts 2016
1 Basis of preparation and accounting policies (continued)
1.3 Accounting policies (continued)f) Property, plant and equipmentLand and buildings held for use in the production of goods and services or for administrative purposes are stated in the balance sheet at cost or fair value for assets acquired in a business combination less any subsequent accumulated depreciation and impairment losses. No capitalised interest is included in the cost of items of property, plant and equipment.
Property, plant and equipment is stated at cost less accumulated depreciation and impairment losses. Such costs include costs directly attributable to making the asset capable of operating as intended. The cost of property, plant and equipment less their expected residual value is depreciated by equal instalments over their useful economic lives. These lives are as follows:
Buildings 50 years Related fittings 3 – 20 years Leasehold properties over the period of the lease IT Systems (hardware) 3 – 5 years Plant, vehicles and other equipment 3 – 10 years
Assets held under finance leases are depreciated on a straight line basis over the lease term.
g) InventoriesInventories are stated at the lower of cost and net realisable value. Costs include all costs incurred in bringing each product to its present location and condition. Net realisable value is based on estimated selling price less any further costs expected to be incurred to completion and disposal.
h) Financial instrumentsFinancial assets and financial liabilities are recognised on the Group’s balance sheet when the Group becomes a party to the contractual provisions of the instrument. They are classified according to the substance of the contractual arrangements entered into. At each reporting date the Group assesses whether there is any objective evidence that a financial asset or a group of financial assets is impaired.
Trade receivables and trade payablesTrade receivables and trade payables are not interest bearing and are recognised initially at fair value. A provision for impairment of trade receivables is established when there is objective evidence that the Group will not be able to collect all amounts due according to the original terms of the receivables.
Cash and cash equivalentsCash and cash equivalents comprise cash balances and call deposits with an original maturity less than three months.
Debt instrumentsDebt is initially recognised in the balance sheet at fair value less transaction costs incurred directly in connection with the issue of the instrument. Debt issue fees in respect of the instrument, including discounts on issue, are capitalised at inception and charged to the income statement over the term of the instrument using the effective interest method.
Equity instruments (share capital issued by the Group)An equity instrument is any contract that evidences a residual interest in the assets of the Group after deducting all its liabilities. Equity instruments are recognised at the fair value of proceeds received less direct issue costs.
Derivative financial instrumentsThe Group’s capital structure exposes it to the financial risk of changes in interest rates and fuel prices. The Group uses interest rate and fuel swap contracts to hedge these exposures.
Derivative financial instruments are recorded in the balance sheet at fair value. The fair value of derivative financial instruments is determined by reference to market values for similar financial instruments. The gain or loss on remeasurement to fair value is recognised immediately in profit or loss unless they qualify for hedge accounting as described below.
Cashflow hedgesChanges in the fair value of derivative financial instruments that are designated as highly effective hedges of future cashflows are recognised in other comprehensive income. Any ineffective portion of the hedge is recognised immediately in the income statement. Amounts recognised in other comprehensive income are reclassified from equity to profit and loss (within finance costs) in the period when the hedged item affects profit or loss. When a hedging instrument expires or is sold, or when a hedge no longer meets the criteria for hedge accounting, any cumulative gain or loss recognised in the other comprehensive income at that time remains in equity and is reclassified when the hedged transaction is ultimately recognised in the income statement.
In order to qualify for hedge accounting, the Group is required to document from inception the relationship between the item being hedged and the hedging instrument and demonstrate that the hedge will be highly effective on an on-going basis. This effectiveness testing is performed at each period end to ensure that the hedge remains highly effective.
i) Impairment of assetsThe carrying amounts of the Group’s non-financial assets, other than inventories and deferred tax assets, are reviewed at each reporting date to determine whether there is any indication of impairment. If any such indication exists, then the asset’s recoverable amount is estimated. In addition goodwill and intangible assets not yet available for use are tested for impairment annually.
For the purpose of impairment testing, assets that cannot be tested individually are grouped together into the smallest group of assets that generates cash inflows from continuing use that are largely independent of the cash inflows of other assets or groups of assets (the cash generating units or “CGUs”). The goodwill acquired in a business combination is allocated to CGUs so that the level at which impairment is tested reflects the lowest level at which goodwill is monitored for internal reporting purposes.
The recoverable amount of an asset or cash-generating unit is the greater of its value in use and its fair value less costs to sell. In assessing value in use, the estimated future cash flows are discounted to their present value using a pre-tax discount rate that reflects current market assessments of the time value of money and the risks specific to the asset.
An impairment loss is recognised if the carrying amount of an asset or its CGU exceeds its estimated recoverable amount. Impairment losses are recognised in profit or loss. Impairment losses recognised in respect of CGUs are allocated first to reduce the carrying amount of any allocated goodwill and then to reduce the carrying amounts of the other assets on a pro rata basis.
An impairment loss in respect of goodwill is not reversed. In respect of other assets, an impairment loss is reversed if there has been a change in the estimates used to determine the recoverable amount. An impairment loss is reversed only to the extent that the asset’s carrying amount does not exceed the carrying amount that would have been determined, net of depreciation or amortisation, if no impairment loss had been recognised.
Notes to the consolidated financial statements continued

Ou
r Bu
sine
ss
Go
ve
rna
nc
eF
ina
nc
ial S
tate
me
nts
AA plc Annual Report and Accounts 2016 95
Ou
r Pe
rform
an
ce
1 Basis of preparation and accounting policies (continued)
1.3 Accounting policies (continued)j) LeasesFinance leases transfer substantially all of the risks and rewards of ownership to the lessee. All other leases are classified as operating leases.
Assets held under finance leases are recognised as assets of the Group at their fair value or, if lower, at the present value of the minimum lease payments, each determined at the inception of the lease. The corresponding liability to the lessor is shown as a financial liability. Lease payments are apportioned between finance charges and the lease obligation so as to achieve a constant rate of interest on the remaining balance of the liability. Finance charges are charged directly to the income statement.
Rentals payable and receivable under operating leases are charged, or credited, to the income statement on a straight-line basis over the term of the relevant lease. Any incentives to enter into an operating lease are recognised evenly over the lease term.
k) ProvisionsA provision is required when the Group has a present legal or constructive obligation as a result of a past event and it is probable that settlement will be required of an amount that can be reliably estimated. Provisions are discounted where the impact is material.
Provisions for restructuring costs are recognised when the Group has a detailed formal plan for the restructuring that has been communicated to affected parties.
For property leases, where a decision has been made prior to the year end to permanently vacate the property, provision is made for future rent and similar costs net of any rental income expected to be received up to the estimated date of final disposal.
l) Retirement benefit obligationThe Group’s position in respect of defined benefit pension plans is calculated by estimating the amount of future benefit that employees have earned in return for their service in the current and prior periods; that benefit is discounted to determine its present value, and the fair value of any plan assets (at bid price) is deducted. The Group determines the net interest on the net defined benefit liability for the period by applying the discount rate used to measure the defined benefit obligation at the beginning of the annual period to the net defined benefit liability.
The discount rate is the yield at the reporting date on bonds that have a credit rating of at least AA with maturity dates approximating the terms of the Group’s obligations and that are denominated in the currency in which the benefits are expected to be paid.
Remeasurements arising from defined benefit plans comprise actuarial gains and losses and the return on plan assets (excluding interest). The Group recognises them immediately in other comprehensive income and all other expenses related to defined benefit plans in administrative and marketing expenses in profit or loss.
When the benefits of a plan are changed, or when a plan is curtailed, the portion of the changed benefit related to past service by employees, or the gain or loss on curtailment, is recognised immediately in profit or loss when the plan amendment or curtailment occurs.
The calculation of the defined benefit obligations is performed by a qualified actuary using the projected unit credit method. When the calculation results in a benefit to the Group, the recognised asset is limited to the present value of benefits available in the form of any future refunds from the plan or reductions in future contributions and takes into account the adverse effect of any minimum funding requirements.
For defined contribution schemes, the amounts recognised in profit or loss are the contributions payable in the year.
m) Revenue recognitionRevenue is measured at the fair value of the consideration receivable less any discounts and excluding value added tax and other sales related taxes.
Roadside membership subscriptions and premiums receivable on underwritten insurance products are apportioned on a time basis over the period where the Group is liable for risk cover. The unrecognised element of subscriptions and premiums receivable, relating to future periods, is held within liabilities as deferred income.
Commission income from insurers external to the Group is recognised at the commencement of the period of risk.
Where customers choose to pay by instalments, the Group charges interest based on the principal outstanding and disclosed interest rate and recognises this income over the course of the loan.
For all other revenue, income is recognised at point of delivery of goods or on provision of service. This includes work which has not yet been fully invoiced, provided that it is considered to be fully recoverable.
n) Insurance contractsAn insurance contract is a contract under which insurance risk is transferred to the issuer of the contract by another party. The Group accepts insurance risk from its customers under roadside recovery service contracts by agreeing to provide services whose frequency and cost is uncertain. Claims and expenses arising from these contracts are recognised in profit or loss as incurred.
At the balance sheet date, a liability adequacy test is performed to ensure the adequacy of the insurance contract liabilities. In performing these tests, current estimates of future cash outflows arising under insurance contracts are considered and compared with the carrying amount of deferred income and other insurance contract liabilities. Any deficiency is immediately recognised in profit or loss and an onerous contract provision is established.
The estimation of the ultimate liability from claims made under insurance contracts is not considered to be one of the Group’s most critical accounting estimates. This is because there is a very short period of time between the receipt of a claim, i.e. a breakdown, and the settling of that claim. Consequently there are no significant provisions for unsettled claims costs in respect of the roadside assistance services.
o) Exceptional items and Adjusted EPSExceptional items are events or transactions that fall within the operating activities of the Group and which by virtue of their size or incidence have been disclosed in order to improve a reader’s understanding of the financial statements. See note 3 for further information on the nature of exceptional items.
In addition, occasionally there are events or transactions that fall below operating profit that are one-off in nature and items within operating profit that relate to transactions that do not form part of the on-going segment performance and which by virtue of their size or incidence have been separately disclosed in the financial statements.
Adjusted earnings per share adjusts profit after tax for items that are one-off in nature or related to transactions that do not form part of the on-going performance, as defined above. See note 8 for a reconciliation of Adjusted EPS.

96 AA plc Annual Report and Accounts 2016
1 Basis of preparation and accounting policies (continued)
1.3 Accounting policies (continued)p) Finance income and costsFinance costs comprise interest payable, finance charges on finance leases recognised in profit or loss using the effective interest method, unwinding of the discount on provisions (including the net defined benefit obligations) and net foreign exchange losses that are recognised in the income statement (see foreign currency accounting policy).
Finance income comprises interest receivable on funds invested and net foreign exchange gains.
Foreign currency gains and losses are reported on a net basis.
q) TaxationTax on the profit or loss for the year comprises current and deferred tax.
Current tax is the expected tax payable or receivable on the taxable income or loss for the year, using tax rates enacted or substantively enacted at the balance sheet date, and any adjustment to tax payable in respect of previous years.
Deferred tax is provided on temporary differences between the carrying amounts of assets and liabilities for financial reporting purposes and the amounts used for taxation purposes. The following temporary differences are not provided for: the initial recognition of goodwill; the initial recognition of assets or liabilities that affect neither accounting nor taxable profit other than in a business combination, and differences relating to investments in subsidiaries to the extent that they will probably not reverse in the foreseeable future. The amount of deferred tax provided is based on the expected manner of realisation or settlement of the carrying amount of assets and liabilities, using tax rates enacted or substantively enacted at the balance sheet date.
A deferred tax asset is recognised only to the extent that it is probable that future taxable profits will be available against which the temporary difference can be utilised. The carrying amount of deferred tax assets is reviewed at each balance sheet date and reduced to the extent that it is no longer probable that sufficient taxable profits will be available to allow all or part of the asset to be recovered.
r) Segmental analysisThe Group reports its operations using the segments that are reported for management purposes. Segments are based on business operations because this is where Group risk and return is focussed, with the exception of Ireland which represents the Group’s only material operations outside of the UK.
s) Share-based paymentsThe Group operates a number of equity settled, share-based payment compensation plans for employees. The fair value of the equity settled awards is measured at the grant date based on expectations of performance conditions being met. The fair value of the awards is recognised as an expense with a corresponding credit to reserves.
t) Critical accounting estimates and judgementsEstimates are evaluated continually and are based on historical experience and other factors, including expectations of future events that are believed to be reasonable under the circumstances. The Group makes estimates and assumptions about the future. The resulting accounting estimates will, by definition, seldom equal the related actual results.
Management have exercised judgement in applying the Group’s accounting policies and in making critical estimates. The underlying assumptions on which these judgements are based, are reviewed on an on-going basis and include the selection of assumptions in relation to the retirement benefit obligation and assumptions for future growth of cash flows to support the value-in-use calculations for the goodwill impairment review.
The principal estimates and assumptions that have a risk of causing an adjustment to the carrying amounts of assets and liabilities within the next financial period are discussed below.
Retirement benefit obligationThe Group’s retirement benefit obligation, which is actuarially assessed each period, is based on key assumptions including return on plan assets, discount rates, inflation, future salary and pension costs. These assumptions may be different to the actual outcome.
Derivative financial InstrumentsThe fair value of derivative financial instruments is determined by reference to market values for similar financial instruments. The Group is therefore required to identify changes in market conditions around expectations for interest rates. These assumptions may be different to the actual outcome.
Goodwill The Group tests goodwill for impairment annually. The recoverable amounts of cash generating units have been determined based on value-in-use calculations which require the use of estimates. Management have prepared discounted cash flows based on the latest strategic plan.
Share-based paymentsThe Group has issued a number of share-based payment awards to employees during the year which are measured at fair value. This involves estimates about the expected volatility of the share price and the number
of leavers over the vesting period.
Notes to the consolidated financial statements continued
Ou
r Bu
sine
ss
Go
ve
rna
nc
eF
ina
nc
ial S
tate
me
nts
AA plc Annual Report and Accounts 2016 97
Ou
r Pe
rform
an
ce
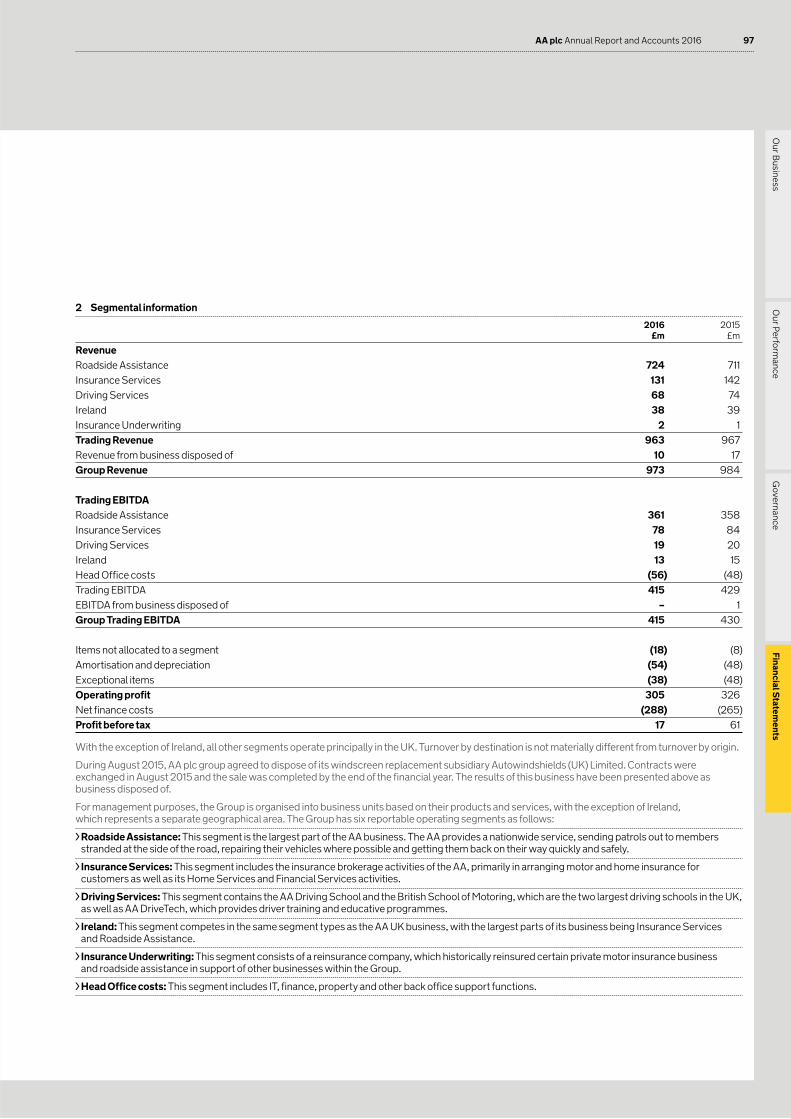
2 Segmental information
2016 £m
2015 £m
Revenue
Roadside Assistance 724 711
Insurance Services 131 142
Driving Services 68 74
Ireland 38 39
Insurance Underwriting 2 1
Trading Revenue 963 967
Revenue from business disposed of 10 17
Group Revenue 973 984
Trading EBITDA
Roadside Assistance 361 358
Insurance Services 78 84
Driving Services 19 20
Ireland 13 15
Head Office costs (56) (48)
Trading EBITDA 415 429
EBITDA from business disposed of – 1
Group Trading EBITDA 415 430
Items not allocated to a segment (18) (8)
Amortisation and depreciation (54) (48)
Exceptional items (38) (48)
Operating profit 305 326
Net finance costs (288) (265)
Profit before tax 17 61
With the exception of Ireland, all other segments operate principally in the UK. Turnover by destination is not materially different from turnover by origin.
During August 2015, AA plc group agreed to dispose of its windscreen replacement subsidiary Autowindshields (UK) Limited. Contracts were exchanged in August 2015 and the sale was completed by the end of the financial year. The results of this business have been presented above as business disposed of.
For management purposes, the Group is organised into business units based on their products and services, with the exception of Ireland, which represents a separate geographical area. The Group has six reportable operating segments as follows:
Roadside Assistance: This segment is the largest part of the AA business. The AA provides a nationwide service, sending patrols out to members stranded at the side of the road, repairing their vehicles where possible and getting them back on their way quickly and safely.
Insurance Services: This segment includes the insurance brokerage activities of the AA, primarily in arranging motor and home insurance for customers as well as its Home Services and Financial Services activities.
Driving Services: This segment contains the AA Driving School and the British School of Motoring, which are the two largest driving schools in the UK, as well as AA DriveTech, which provides driver training and educative programmes.
Ireland: This segment competes in the same segment types as the AA UK business, with the largest parts of its business being Insurance Services and Roadside Assistance.
Insurance Underwriting: This segment consists of a reinsurance company, which historically reinsured certain private motor insurance business and roadside assistance in support of other businesses within the Group.
Head Office costs: This segment includes IT, finance, property and other back office support functions.

98 AA plc Annual Report and Accounts 2016
2 Segmental information (continued)
Segment performance is primarily evaluated using the Group’s key performance measure of Trading EBITDA. Trading EBITDA is profit after tax as reported adjusted for depreciation, amortisation, net finance costs, taxation, exceptional items and items not allocated to a segment and better reflects the Group’s underlying performance.
Items not allocated to a segment relate to transactions that do not form part of the on-going segment performance and include transactions which are one–off in nature. In the year ended 31 January 2016 these principally relate to the difference between the cash contributions to the pension schemes for on-going service and the calculated annual service cost and share-based payments (see note 32).
Depreciation, amortisation, exceptional items, net finance costs and tax expense are not allocated to individual segments as they are managed on a group basis.
Segmental information is not presented for items in the Consolidated Statement of Financial Position as management does not view this information on a segmental basis.
3 Operating profit
Operating profit is stated after charging:
2016 £m
2015 £m
Amortisation of owned intangible assets 23 20
Depreciation of owned tangible fixed assets 11 10
Depreciation of leased tangible fixed assets 20 18
Operating lease rentals payable – land and buildings 5 4
Operating lease rentals payable – plant and machinery – 6
Exceptional items 38 48
Exceptional costs include £5m for the loss on disposal of Autowindshields (UK) Limited (2015: £nil), £4m relating to financing transactions (2015: £1m), £22m relating to business transformation costs (2015: £nil) and £7m mainly relating to non-recurring costs for IT system implementation, onerous property lease costs, loss on disposal of fixed assets and cost restructuring activities (2015: £14m). In addition, in the prior year, £33m related to IPO costs.
Notes to the consolidated financial statements continued

Ou
r Bu
sine
ss
Go
ve
rna
nc
eF
ina
nc
ial S
tate
me
nts
AA plc Annual Report and Accounts 2016 99
Ou
r Pe
rform
an
ce
4 Finance costs
2016 £m
2015 £m
Interest on external borrowings (178) (211)
Finance charges payable under finance leases (7) (4)
Penalties on early repayment of debt (62) (3)
Total cash finance costs (247) (218)
Amortisation of debt issue fees (22) (30)
Transfer from cashflow hedge reserve for extinguishment of cashflow hedge (8) (7)
Net finance expense on defined benefit pension schemes (12) (11)
Total non-cash finance costs (42) (48)
Total finance costs (289) (266)
During the year, the Group repaid the original Class B notes of £655m and PIK notes of £175m (see note 18). As a result, the Group incurred early repayment penalties of £58m (2015: £nil) for the Class B notes and £4m (2015: £3m) for the PIK notes.
The Group also repaid £209m of the Senior Term Facility, following which, the Group has transferred the fair value of the cashflow hedges related to the repayment of £8m (2015: £7m) from other comprehensive income to the income statement.
Within interest on external borrowings is £13m (2015: £21m) of interest charged on the Senior Term Facility and £8m (2015: £10m) charged in relation to the interest rate swaps used to hedge the variable element of the Senior Term Facility (see note 18).
Also included within interest on external borrowings is £19m (2015: £nil) of interest costs relating to the double-running of the Class B/B2 notes from the time of issue of the Class B2 notes in April 2015 until the repayment of the Class B notes in July 2015.
Amortisation of debt issue fees includes £18m (2015: £21m) that was immediately written off following the repayment of borrowings.
5 Finance income
2016 £m
2015 £m
Interest receivable 1 1
Total finance income 1 1
6 Staff costs
2016 £m
2015 £m
Wages and salaries 270 258
Social security costs 24 25
Retirement benefit costs 34 27
328 310
The average monthly number of persons employed under contracts of service during the year was:
2016 2015
Operational 6,620 6,876
Management and administration 1,242 1,277
7,862 8,153
100 AA plc Annual Report and Accounts 2016
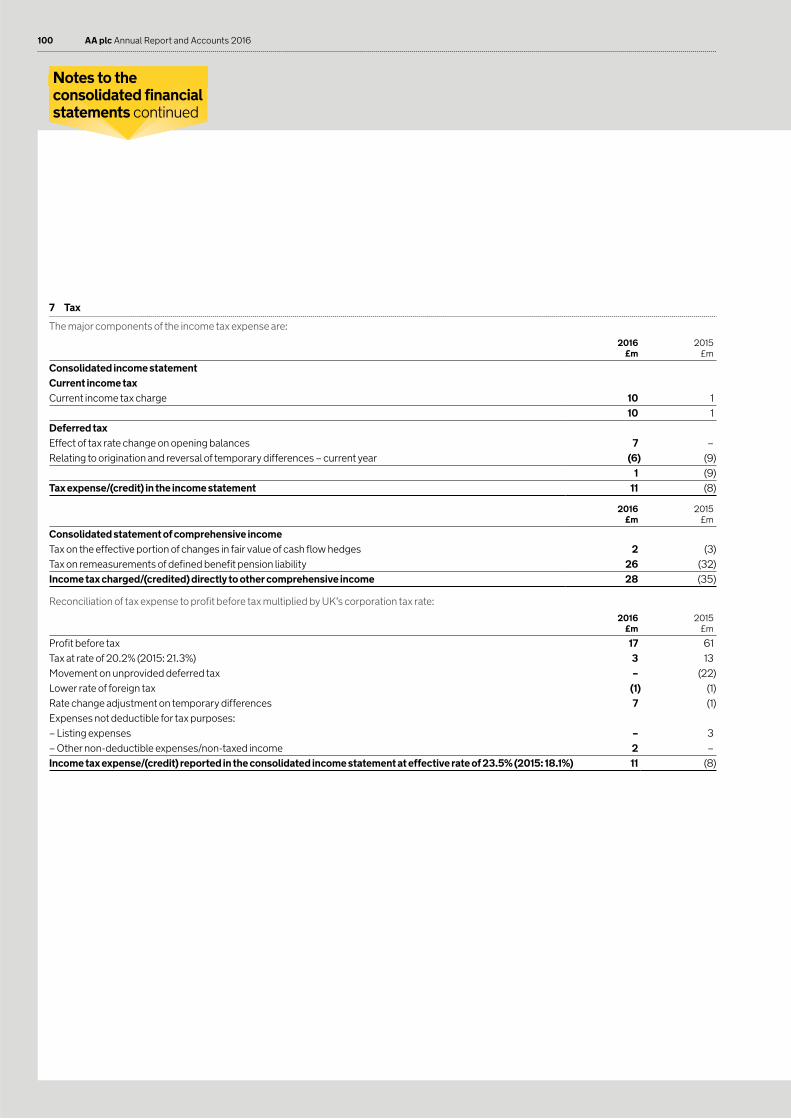
7 Tax
The major components of the income tax expense are:
2016 £m
2015 £m
Consolidated income statement
Current income tax
Current income tax charge 10 1
10 1
Deferred tax
Effect of tax rate change on opening balances 7 –
Relating to origination and reversal of temporary differences – current year (6) (9)
1 (9)
Tax expense/(credit) in the income statement 11 (8)
2016 £m
2015 £m
Consolidated statement of comprehensive income
Tax on the effective portion of changes in fair value of cash flow hedges 2 (3)
Tax on remeasurements of defined benefit pension liability 26 (32)
Income tax charged/(credited) directly to other comprehensive income 28 (35)
Reconciliation of tax expense to profit before tax multiplied by UK’s corporation tax rate:
2016 £m
2015 £m
Profit before tax 17 61
Tax at rate of 20.2% (2015: 21.3%) 3 13
Movement on unprovided deferred tax – (22)
Lower rate of foreign tax (1) (1)
Rate change adjustment on temporary differences 7 (1)
Expenses not deductible for tax purposes:
– Listing expenses – 3
– Other non-deductible expenses/non-taxed income 2 –
Income tax expense/(credit) reported in the consolidated income statement at effective rate of 23.5% (2015: 18.1%) 11 (8)
Notes to the consolidated financial statements continued

Ou
r Bu
sine
ss
Go
ve
rna
nc
eF
ina
nc
ial S
tate
me
nts
AA plc Annual Report and Accounts 2016 101
Ou
r Pe
rform
an
ce
7 Tax (continued)
Deferred tax by type of temporary difference
Consolidated statement of financial position
Consolidated income statement
2016 £m
2015 £m
2016 £m
2015 £m
Accelerated depreciation for tax purposes 9 13 4 (2)
Revaluations of land and buildings to fair value (1) (1) – –
Rollover relief (2) (2) – –
Pension 15 42 1 (1)
Revaluation of cashflow hedges 5 6 (1) (1)
Short-term temporary differences 9 1 (8) 1
Losses available for offsetting against future taxable income 17 22 5 (6)
Deferred tax expense/(income) 1 (9)
Net deferred tax assets 52 81
Reconciliation of net deferred tax assets
2016 £m
2015 £m
At start of year 81 36
Tax (expense)/income recognised in the income statement (1) 10
Tax (expense)/income recognised in OCI (28) 35
At end of year 52 81
The Group offsets tax assets and liabilities if and only if it has a legally enforceable right to set off current tax assets and current tax liabilities and the deferred tax assets and deferred tax liabilities relate to income taxes levied by the same tax authority.
The UK corporation tax rate will reduce from 20% to 19% on 1 April 2017 and then to 18% on 1 April 2020. These rates have been substantially enacted at the balance sheet date and have therefore been included in the deferred tax calculations.
Deferred tax has been recognised at an overall rate of 18.4% for the UK at 31 January 2016 (2015: 20%) and 12.5% for Ireland (2015: 12.5%). The UK rate has been adjusted to reflect the expected reversal profile of the Group’s temporary differences.
The 2016 effective tax rate has been calculated by excluding the rate change adjustment that has arisen as a result of the future reduction in corporation tax rates affecting the carrying value of the deferred tax balances. The 2015 effective tax rate is calculated by excluding the effects of expenses relating to the IPO, not deductible for tax purposes within the taxable profit and excluding the effect of the movements in unprovided deferred tax from the tax charge.
The Group has tax losses which arose in the UK of £92m (2015: £110m) that are available indefinitely for offsetting against future taxable profits of the companies in which the losses arose. In the prior year, following the IPO, a deferred tax asset of £22m was recognised on these tax losses as the Group
expected to have sufficient taxable profits to be able to recover these losses.

102 AA plc Annual Report and Accounts 2016
8 Earnings per share
Basic earnings per share amounts are calculated by dividing net profit for the year attributable to ordinary shareholders by the weighted average number of ordinary shares outstanding during the year.
2016 2015
Basic earnings per share:
Profit after tax (£m) 6 69
Weighted average number of shares outstanding (millions) 596 520
Basic earnings per share (pence) 1.0 13.3
For diluted earnings per share, the weighted average number of ordinary shares is adjusted to assume conversion of all potential dilutive ordinary shares.
In the prior year, the potential dilutive ordinary shares related to the employee share scheme for the UK (SIP), where the share price at which shares were to be purchased and matching shares issued was expected to be less than the average market value of ordinary shares for the period from issue of the options to 31 January 2015. These shares were purchased and issued respectively in the current year so are no longer dilutive. Under the current year SIP, shares are purchased monthly at market value and matching shares issued contemporaneously and are therefore not dilutive.
The Group also has another class of potential dilutive ordinary shares relating to the MVP shares, see note 32. However, as at 31 January 2016, based on average market value of ordinary shares for the year, these were not dilutive.
There are no further classes of share that are dilutive as at 31 January 2016.
2016 2015
Weighted average number of ordinary shares in issue (millions) 596 520
Potentially dilutive shares under SIP (see note 32) (millions) – 1
Weighted average number of diluted ordinary shares (millions) 596 521
Diluted earnings per share (pence) 1.0 13.3
Reconciliation of reported earnings per share to adjusted earnings per share:
2016 2015
Profit after tax as reported (£m) 6 69
Adjusted for:
Exceptional items (£m) 38 48
Items not allocated to a segment (£m) 18 8
Write off of debt issue fees following refinancing (see note 4) (£m) 18 21
Penalties on early repayment of debt (see note 4) (£m) 62 3
Double-running interest cost of Class B/B2 notes (see note 4) (£m) 19 –
Transfer from cashflow hedge reserve for extinguishment of cashflow hedge (see note 4) (£m) 8 7
Tax expense/(credit) (£m) 11 (8)
Adjusted profit before tax (£m) 180 148
Tax at the effective rate of 23.5% (2015: 18.1%) (£m) (42) (27)
Adjusted profit after tax (£m) 138 121
Weighted average number of shares outstanding (millions) 596 520
Adjusted basic earnings per share (pence) 23.2 23.3
Weighted average number of diluted ordinary shares (millions) 596 521
Adjusted diluted earnings per share (pence) 23.2 23.2
Adjusted earnings per share adjusts profit after tax for items that are one-off in nature or relate to transactions that do not form part of the on-going segment performance.
Notes to the consolidated financial statements continued

Ou
r Bu
sine
ss
Go
ve
rna
nc
eF
ina
nc
ial S
tate
me
nts
AA plc Annual Report and Accounts 2016 103
Ou
r Pe
rform
an
ce
9 Goodwill and other intangible assets
Goodwill £m
Software £m
Total £m
Cost
At 1 February 2014 1,199 100 1,299
Additions – 31 31
Disposals – (2) (2)
At 31 January 2015 1,199 129 1,328
Additions – 64 64
Disposals – (2) (2)
At 31 January 2016 1,199 191 1,390
Amortisation and impairment
At 1 February 2014 – 53 53
Amortisation – 20 20
Disposals – (2) (2)
At 31 January 2015 – 71 71
Amortisation – 23 23
Disposals (2) (2)
At 31 January 2016 – 92 92
Net book value
At 31 January 2016 1,199 99 1,298
At 31 January 2015 1,199 58 1,257
Within software, £53m (2015: £10m) relates to assets under construction which are not amortised.
Software additions comprise of £13m (2015: £14m) in relation to internally developed assets and £51m (2015: £17m) in relation to separately
acquired assets.

104 AA plc Annual Report and Accounts 2016
10 Business combinations
Acquisitions during the year ended 31 January 2016 On 18 August 2015 the Group acquired the entire share capital of XL Insurance (Gibraltar) Limited, an insurance underwriter, for a total consideration of £7m. It was then renamed AA Underwriting Insurance Company Limited.
Acquisitions during the year ended 31 January 2015 There were no acquisitions in the prior year.
11 Property, plant and equipment
Freehold Land & Buildings
£m
Long Leasehold Land & Buildings
£mVehicles
£m
Plant & equipment
£mTotal
£m
Cost
At 1 February 2014 24 10 66 104 204
Additions – – 62 5 67
Disposals – – (36) (1) (37)
Exchange adjustments – – – (1) (1)
At 31 January 2015 24 10 92 107 233
Additions – – 47 21 68
Disposals – – (50) (3) (53)
At 31 January 2016 24 10 89 125 248
Depreciation and impairment
At 1 February 2014 5 3 41 78 127
Charge for the year 1 1 16 10 28
Disposals – – (20) (1) (21)
Exchange adjustments – – – (1) (1)
At 31 January 2015 6 4 37 86 133
Charge for the year 1 – 21 9 31
Disposals – – (36) (2) (38)
At 31 January 2016 7 4 22 93 126
Net book value
At 31 January 2016 17 6 67 32 122
At 31 January 2015 18 6 55 21 100
The net book amount of vehicles includes £65m (2015: £54m) held under finance lease agreements. The accumulated depreciation on these assets is £19m (2015: £35m).
The net book amount of other assets includes £nil (2015: £nil) in respect of plant & machinery held under finance lease agreements. The accumulated depreciation on these assets is £8m (2015: £8m).
Notes to the consolidated financial statements continued

Ou
r Bu
sine
ss
Go
ve
rna
nc
eF
ina
nc
ial S
tate
me
nts
AA plc Annual Report and Accounts 2016 105
Ou
r Pe
rform
an
ce
12 Investments in joint ventures and associates
2016 2015
Joint ventures £m
Associates £m
Total £m
Joint ventures £m
Associates £m
Total £m
At start of year 1 3 4 – 3 3
Additions 5 – 5 – – –
Share of profits – 1 1 1 – 1
Exchange differences – – – – – –
At end of year 6 4 10 1 3 4
The joint ventures of the Group which are indirectly held are detailed below.
Company Country of registration Nature of business
AA Law Limited (49% interest held)1 England Insurance services
TVS Auto Assist (India) Limited (49% interest held)2 India Roadside services
Motoriety UK Limited (50% interest held) England Roadside services
1 The Group exercises joint control over AA Law Limited through its equal representation on the Board.
2 The Group exercises joint control over TVS Auto Assist (India) Limited through its joint influence over key decision making.
The associates of the Group which are indirectly held are listed below.
Company Country of registration Nature of business
ARC Europe S.A. (20% interest held) Belgium Roadside services
A.C.T.A. Assistance S.A. (22% interest held) France Roadside services
13 Inventories
2016 £m
2015 £m
Finished goods 5 5
5 5
14 Trade and other receivables
2016 £m
2015 £m
Current
Trade receivables 146 156
Prepayments and accrued income 22 26
Other receivables 4 5
172 187
Non-current
Interest rate swap derivatives (see note 25) – 21
– 21
Included in trade receivables are amounts of £89m (2015: £89m) relating to amounts due from insurance broking customers.

106 AA plc Annual Report and Accounts 2016
15 Cash and cash equivalents
2016 £m
2015 £m
Ring-fenced cash at bank and in hand – available 74 244
Ring-fenced cash at bank and in hand – restricted 20 18
Non ring-fenced cash at bank and in hand – available 58 15
Non ring-fenced cash at bank and in hand – restricted 14 25
166 302
Ring-fenced cash and cash equivalents relate to cash held by AA Intermediate Co Limited and its subsidiaries. Dividends can only be paid to AA plc when certain debt to EBITDA and cashflow criteria are met.
Cash at bank and in hand – restricted includes £nil (2015: £19m) held as pre-funded interest to cover interest payments on the PIK notes (see note 18) and could not be used for any other purpose.
Cash at bank and in hand includes £34m (2015: £24m) held by and on behalf of the Group’s insurance businesses which are subject to contractual or regulatory restrictions. These amounts are not readily available to be used for other purposes within the Group and include £7m held as part of the capital requirements of the new insurance underwriter.
16 Trade and other payables
2016 £m
2015 £m
Trade payables 110 114
Other taxes and social security costs 23 25
Accruals 67 66
Deferred income 248 238
Other payables 30 20
Obligations under finance lease agreements (note 27) 40 35
518 498
Included in trade payables are amounts of £86m (2015: £85m) relating to amounts due to underwriters in respect of insurance broking activities.
17 Borrowings and loans
2016 £m
2015 £m
Borrowings (see note 18) 2,893 3,191
Interest rate and fuel swap used for hedging (see note 25) 27 50
2,920 3,241
The interest rate swap liability is shown on a net basis as at 31 January 2016 as the liability is settled with each counterparty on a net basis. On a gross basis, the asset is £24m (2015: £21m) and the liability is £51m (2015: £50m).
Notes to the consolidated financial statements continued

Ou
r Bu
sine
ss
Go
ve
rna
nc
eF
ina
nc
ial S
tate
me
nts
AA plc Annual Report and Accounts 2016 107
Ou
r Pe
rform
an
ce
18 Borrowings
Expected maturity date Interest ratePrincipal
£mIssue costs
£m
Amortised issue costs
£m
Total at 31 January 2016
£m
Total at 31 January 2015
£m
Senior Term Facility 31 January 2019 4.36% 454 (3) 1 452 661
Class A1 notes 31 July 2018 4.72% 475 (3) 2 474 473
Class A2 notes 31 July 2025 6.27% 500 (1) – 499 499
Class A3 notes 31 July 2020 4.25% 500 (3) 1 498 498
Class A4 notes 31 July 2019 3.78% 250 (2) 1 249 248
Class B notes 31 July 2019 – – – – – 639
Class B2 notes 31 July 2022 5.50% 735 (16) 2 721 –
PIK notes 6 November 2019 – – – – – 173
4.97% 2,914 (28) 7 2,893 3,191
A summary of the Group’s financing transactions are shown below:
Senior Term Facility
£mClass A1
£mClass A2
£mClass A3
£mClass A4
£mClass B
£mClass B2
£mPIK notes
£mTotal
£m
As at 1 February 2015 663 475 500 500 250 655 – 175 3,218
Issue date:
25 March 2015 (97) – – – – – – – (97)
13 April 2015 – – – – – – 735 – 735
24 April 2015 – – – – – – – (175) (175)
30 April 2015 (112) – – – – – – – (112)
31 July 2015 – – – – – (655) – – (655)
Total 454 475 500 500 250 – 735 – 2,914
At 31 January 2016, the Senior Term Facility carried interest at a rate of LIBOR plus a margin of 2%. The variable element has been fully hedged using matching interest rate swap arrangements which fix LIBOR at 2.36% until 31 July 2018 and then at 3.00% until 31 January 2019. All other borrowings have fixed interest rates. The weighted average interest rate for all borrowings of 4.97% has been calculated using the effective interest rate and carrying values on 31 January 2016.
In order to show the Group’s net borrowings, the notes and the issue costs have been offset. Issue costs are shown net of any premium on the issue of borrowings. Interest rate swaps are recognised in the consolidated statement of financial position at fair value at the period end.
All of the Class A notes and Senior Term Facility are secured by first ranking security in respect of the undertakings and assets of AA Intermediate Co Limited and its subsidiaries. The Class A facility security over the AA Intermediate Co Limited group’s assets ranks ahead of the Class B2 notes. The Class B2 notes have first ranking security over the assets of the immediate parent undertaking of the AA Intermediate Co Limited group, AA Mid Co Limited. AA Mid Co Limited group can only pay a dividend when certain net debt to EBITDA and cashflow criteria are met.
The Class B2 notes have an initial period to 31 July 2018 when any voluntary repayment would incur a make-whole payment and incur all remaining interest due to 31 July 2018. After this period, there is a further two year period when any voluntary repayment would be made at a fixed premium based on the date of redemption. Any voluntary early repayments of the Class A notes, would incur a make-whole payment.
Due to the early repayment of the Class B notes and the PIK notes, early repayment fees of £58m and £4m respectively were incurred in the year.
Following the repayment of £209m of the Senior Term Facility and repayment of the PIK notes and Class B notes, amortisation of the associated issue fees has been accelerated and an additional £18m (2015: £21m) has been written off in the year.
In order to comply with the requirements of the Class A notes, we are required to maintain the Class A free cash flow to debt service ratio in excess of 1.35x. The Class B2 notes require us to maintain the Class B2 free cash flow to debt service ratio in excess of 1x.
The Class A and Class B2 notes therefore place restrictions on the Group’s ability to upstream cash from the key trading companies to pay external dividends and finance activities unconstrained by the restrictions embedded in the financing documents.
The Class A notes only permit the release of cash providing the senior leverage ratio after payment is less than 5.5x and providing there is sufficient excess cash flow to cover the payment. The Class B2 note restrictions came into effect during the 2016 financial year refinancing and only permit the release of cash providing the fixed charge cover ratio after payment is more than 2:1 and providing that the aggregate payments do not exceed 50% of the accumulated consolidated net income.

108 AA plc Annual Report and Accounts 2016
19 Provisions
Property Leases £m
Restructuring £m
Other £m
Total £m
At 1 February 2014 25 2 1 28
Utilised during the year (4) (1) (1) (6)
Released unutilised during the year (4) – (1) (5)
Charge for the year 1 – 2 3
At 31 January 2015 18 1 1 20
Utilised during the year (4) – (1) (5)
Released unutilised during the year (2) – – (2)
Charge for the year 1 – 1 2
At 31 January 2016 13 1 1 15
Current 6 1 1 8
Non-current 7 – – 7
At 31 January 2016 13 1 1 15
Current 6 1 1 8
Non-current 12 – – 12
At 31 January 2015 18 1 1 20
The property lease provision relates to future onerous lease costs of vacant properties for the remaining period of the lease, net of expected sub-letting income. These sums are mainly expected to be paid out over the next 7 years however it will take 38 years to fully pay out all amounts provided for. The provision has been calculated on a pre-tax discounted basis.
The restructuring provision relates to redundancy and other related costs following the restructuring of operations in the current and prior periods.
Other provisions primarily comprise a provision for an onerous contract of £1m (2015: £1m). These items are reviewed and updated annually.
Notes to the consolidated financial statements continued

Ou
r Bu
sine
ss
Go
ve
rna
nc
eF
ina
nc
ial S
tate
me
nts
AA plc Annual Report and Accounts 2016 109
Ou
r Pe
rform
an
ce
20 Insurance technical provisions
2016 £m
2015 £m
Outstanding claims provisions 2 2
Other technical provisions – provisions for incurred but not reported claims 2 2
4 4
Provision is made for the estimated cost of claims incurred but not settled at the balance sheet date, including the cost of claims incurred but not yet reported. The estimated cost of claims includes expenses to be incurred in settling claims.
21 Share capital
2016 £m
2015 £m
Allotted, called up and fully paid
608,181,845 (2015: 554,000,001) ordinary shares of £0.001 each 1 1
1 1
The voting rights of the holders of all ordinary shares are the same and all ordinary shares rank pari passu on a winding up. AA plc has no authorised ordinary share capital.
On 22 April 2015, the Company issued 51,937,501 ordinary shares at a premium of £193m including issue costs.
During the rest of the year, the Company issued 2,244,343 ordinary shares at a premium of £6m in relation to the staff share incentive plans, see note 32.
In the previous year, AA plc issued 24 million Management Value Participation Shares (MVP shares). A further 36 million MVP shares were issued on 22 December 2015. The MVP shares in issue were as follows:
2016 £000
2015 £000
Allotted, called up and fully paid
20,000,000 (2015: 8,000,000) MVP A shares of £0.001 each 20 8
20,000,000 (2015: 8,000,000) MVP B shares of £0.001 each 20 8
20,000,000 (2015: 8,000,000) MVP C shares of £0.001 each 20 8
60 24
The MVP shares have no voting rights. There are 8 million authorised shares in each of the following MVP share classes: A1, B1 and C1. There are 12 million authorised shares in each of the following MVP share classes: A2, B2 and C2. In total, there are 60 million authorised MVP shares. See also note 32.
110 AA plc Annual Report and Accounts 2016
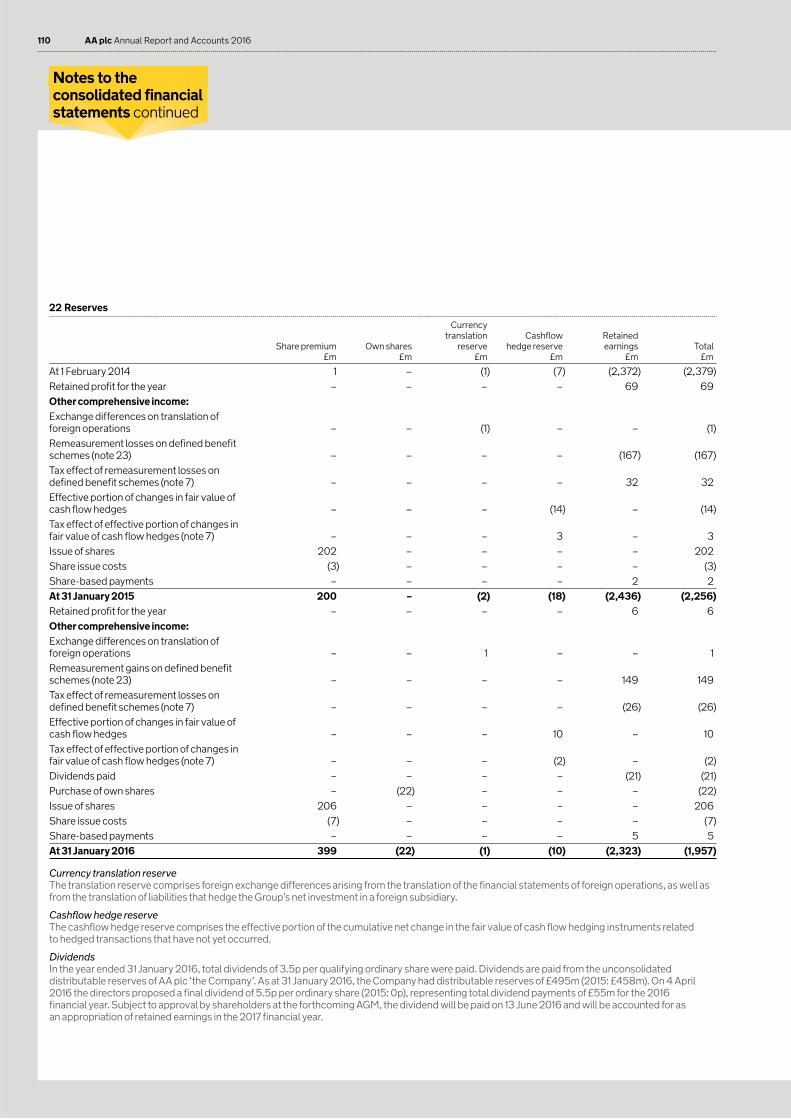
22 Reserves
Share premium £m
Own shares £m
Currency translation
reserve £m
Cashflow hedge reserve
£m
Retained earnings
£mTotal
£m
At 1 February 2014 1 – (1) (7) (2,372) (2,379)
Retained profit for the year – – – – 69 69
Other comprehensive income:
Exchange differences on translation of foreign operations – – (1) – – (1)
Remeasurement losses on defined benefit schemes (note 23) – – – – (167) (167)
Tax effect of remeasurement losses on defined benefit schemes (note 7) – – – – 32 32
Effective portion of changes in fair value of cash flow hedges – – – (14) – (14)
Tax effect of effective portion of changes in fair value of cash flow hedges (note 7) – – – 3 – 3
Issue of shares 202 – – – – 202
Share issue costs (3) – – – – (3)
Share-based payments – – – – 2 2
At 31 January 2015 200 – (2) (18) (2,436) (2,256)
Retained profit for the year – – – – 6 6
Other comprehensive income:
Exchange differences on translation of foreign operations – – 1 – – 1
Remeasurement gains on defined benefit schemes (note 23) – – – – 149 149
Tax effect of remeasurement losses on defined benefit schemes (note 7) – – – – (26) (26)
Effective portion of changes in fair value of cash flow hedges – – – 10 – 10
Tax effect of effective portion of changes in fair value of cash flow hedges (note 7) – – – (2) – (2)
Dividends paid – – – – (21) (21)
Purchase of own shares – (22) – – – (22)
Issue of shares 206 – – – – 206
Share issue costs (7) – – – – (7)
Share-based payments – – – – 5 5
At 31 January 2016 399 (22) (1) (10) (2,323) (1,957)
Currency translation reserveThe translation reserve comprises foreign exchange differences arising from the translation of the financial statements of foreign operations, as well as from the translation of liabilities that hedge the Group’s net investment in a foreign subsidiary.
Cashflow hedge reserveThe cashflow hedge reserve comprises the effective portion of the cumulative net change in the fair value of cash flow hedging instruments related to hedged transactions that have not yet occurred.
DividendsIn the year ended 31 January 2016, total dividends of 3.5p per qualifying ordinary share were paid. Dividends are paid from the unconsolidated distributable reserves of AA plc ‘the Company’. As at 31 January 2016, the Company had distributable reserves of £495m (2015: £458m). On 4 April 2016 the directors proposed a final dividend of 5.5p per ordinary share (2015: 0p), representing total dividend payments of £55m for the 2016 financial year. Subject to approval by shareholders at the forthcoming AGM, the dividend will be paid on 13 June 2016 and will be accounted for as an appropriation of retained earnings in the 2017 financial year.
Notes to the consolidated financial statements continued

Ou
r Bu
sine
ss
Go
ve
rna
nc
eF
ina
nc
ial S
tate
me
nts
AA plc Annual Report and Accounts 2016 111
Ou
r Pe
rform
an
ce
23 Pensions
The Group operates two funded defined benefit pension schemes: the AA UK Pension Scheme (AAUK) and the AA Ireland Pension Scheme (AAI). The assets of the schemes are held separately from those of the Group in independently administered funds. New entrants to the AAUK scheme accrue benefits on a career average salary basis. The AAUK scheme has final salary sections that are closed to new entrants but open to future accrual for existing members. The AAI scheme is closed to new entrants and future accrual of benefits. The Group also operates an unfunded post-retirement Private Medical Plan scheme (AAPMP), which is a defined benefit scheme that is not open to new entrants.
On 29 November 2013, the Group completed the AAUK pension scheme triennial valuations agreeing a deficit of £202m with the pension trustees and implementing an asset backed funding scheme. The asset backed funding scheme provides a long-term deficit reduction plan where the Group makes an annual deficit reduction contribution of £13m increasing with inflation, over a period of up to 25 years from 29 November 2013 secured on the Group’s brands. This compares with the traditional unsecured deficit reduction plan requiring the deficit to be removed over a substantially shorter period and would have resulted in significantly higher annual deficit contributions.
The valuations have been based on a full assessment of the liabilities of the schemes which have been updated where appropriate to 31 January 2016 by independent qualified actuaries.
The Group expects to pay £25m of on-going employer contributions and £13m of deficit reduction employer contributions to its defined benefit plans (AAUK and AAI) in the year ending 31 January 2017.
The amounts recognised in the balance sheet are as follows:As at 31 January 2016
AAUK £m
AAI £m
AAPMP £m
Total £m
Present value of the defined benefit obligation in respect of pension plans (2,053) (46) (47) (2,146)
Fair value of plan assets 1,815 35 – 1,850
Deficit (238) (11) (47) (296)
As at 31 January 2015
AAUK £m
AAI £m
AAPMP £m
Total £m
Present value of the defined benefit obligation in respect of pension plans (2,178) (51) (49) (2,278)
Fair value of plan assets 1,809 35 – 1,844
Deficit (369) (16) (49) (434)
The decrease in the deficit is mainly due to changes in financial assumptions, mostly from a rise in the discount rates in all of the schemes. This has been partially offset by a loss on assets.

112 AA plc Annual Report and Accounts 2016
23 Pensions (continued)
Assets £m
Liabilities £m
Income statement
£m
Statement of comprehensive
income £m
Balance at 1 February 2015 1,844 (2,278) – –
Current service cost – (34) (34) –
Past service cost – (2) (2) –
Interest on defined benefit scheme assets/(liabilities) 56 (68) (12) –
Amounts recognised in the income statement 56 (104) (48) –
Effect of changes in financial assumptions – 185 – 185
Effect of experience adjustment – 1 – 1
Return on plan assets excluding interest income (37) – – (37)
Amounts recognised in the statement of comprehensive income (37) 186 – 149
Foreign exchange loss – (1) – (1)
Contribution from scheme participants 1 (1) – –
Benefits paid from scheme assets (52) 52 – –
Ongoing employer contributions 24 – – –
Deficit reduction employer contributions 14 – – –
Movements through cash (13) 51 – –
Balance at 31 January 2016 1,850 (2,146) – –
A redundancy exercise was carried out during the 2016 financial year which affected 28 members of the AAUK Scheme. Under the terms of the AAUK Scheme the members were entitled to enhanced pension benefits upon redundancy and the impact of this was a past service cost of £2m (2015: nil) in relation to the AAUK scheme.
Assets £m
Liabilities £m
Income statement
£m
Statement of comprehensive
income £m
Balance at 1 February 2014 1,580 (1,846) – –
Current service cost – (27) (27) –
Interest on defined benefit scheme assets/(liabilities) 68 (79) (11) –
Amounts recognised in the income statement 68 (106) (38) –
Effect of changes in financial assumptions – (373) – (373)
Effect of experience adjustment – (3) – (3)
Return on plan assets excluding interest income 209 – – 209
Amounts recognised in the statement of comprehensive income 209 (376) – (167)
Foreign exchange (loss)/gain (3) 5 – 2
Contribution from scheme participants 1 (1) – –
Benefits paid from scheme assets (46) 46 – –
Ongoing employer contributions 21 – – –
Deficit reduction employer contributions 14 – – –
Movements through cash (10) 45 – –
Balance at 31 January 2015 1,844 (2,278) – –
Notes to the consolidated financial statements continued

Ou
r Bu
sine
ss
Go
ve
rna
nc
eF
ina
nc
ial S
tate
me
nts
AA plc Annual Report and Accounts 2016 113
Ou
r Pe
rform
an
ce
23 Pensions (continued)
Fair value of plan assetsThe overall expected rate of return is calculated by weighting the individual rates in accordance with the anticipated balance in the plan’s investment portfolio.
The table below shows the AAUK plan assets split between those that have a quoted market price and those that are unquoted. Of the AAI scheme, 26.6% (2015: 22.0%) of assets do not have a quoted market price.
The fair value of the AAUK plan assets and the return on those assets were as follows:
2016 2015
Assets with a quoted
market price £m
Assets without a quoted
market price £m
Assets with a quoted
market price £m
Assets without a quoted
market price £m
Equities 136 264 237 206
Bonds 667 122 731 113
Property 79 172 67 132
Hedge funds – 356 – 305
Cash/net current assets 17 1 15 3
Total plan assets 899 915 1,050 759
Actual return on AAUK plan assets 18 272
Pension plan assumptionsThe principal actuarial assumptions were as follows:
AAUK AAI AAPMP
2016 %
2015 %
2016 %
2015 %
2016 %
2015 %
Pensioner discount rate 3.6 2.9 1.7 1.2 3.6 2.9
Non pensioner discount rate 3.8 3.2 2.6 2.0 3.8 3.2
Pensioner RPI 2.9 2.6 – – 2.9 2.6
Non pensioner RPI 3.2 2.9 – – 3.2 2.9
Rate of increase of pensions in payment – pensioner 2.8 2.5 – – – –
Rate of increase of pensions in payment – non pensioner 3.0 2.7 – – – –
Pensioner increase for deferred benefits 2.2 1.9 1.5 1.5 – –
Medical premium inflation rate – – – – 6.9 6.6
Mortality assumptions are set using standard tables based on scheme specific experience where available. Each scheme’s mortality assumptions are based on standard mortality tables which allow for future mortality improvements. The AA schemes’ assumptions are that an active male retiring in normal health currently aged 60 will live on average for a further 28 years and an active female retiring in normal health currently aged 60 will live on average for a further 30 years.

114 AA plc Annual Report and Accounts 2016
23 Pensions (continued)
Sensitivity analysisThe Scheme exposes the Group to risks such as longevity, interest rate risk and market (investment) risk.
The AA Pension Scheme Trustees have hedged around 50% of interest rate risk and 74% of inflation risk as part of a policy to reduce financial risks to the Scheme.
Reasonably possible changes at the reporting date to one of the relevant actuarial assumptions, holding other assumptions constant, would have affected the defined benefit liability by the amounts shown below:
For the year ending 31 January 2016
AAUK £m
AAI £m
AAPMP £m
Increase of 0.25% in discount rate 108 2 2
Increase of 0.25% in Inflation rate (97) (1) –
Increase of 1% in medical claims inflation – – (7)
Increase of one year of life expectancy (59) (1) –
An equivalent decrease in the assumptions at 31 January 2016 would have had the equal but opposite effect on the amounts shown above, on the basis that all other variables remain constant.
The weighted average duration of plan liabilities at 31 January 2016 is 22 years.
24 Impairment of intangible assets
Goodwill acquired through business combinations has been allocated to cash-generating units (“CGUs”) on initial recognition and for subsequent impairment testing.
The carrying value of goodwill by CGU is as follows:
2016 £m
2015 £m
Roadside Assistance 874 874
Insurance Services 240 240
Driving Schools 26 26
DriveTech 33 33
Ireland 26 26
1,199 1,199
The Group has performed impairment testing at 31 January 2016 and 31 January 2015. The impairment test compares the recoverable amount of the CGU to its carrying value.
The recoverable amount of each CGU has been determined based on a value in use calculation using cash flow projections from the Group’s three year plan up to 31 January 2019 and a reasonable expectation of growth in the subsequent two years. For the purposes of the impairment test terminal values have been calculated using the Gordon growth model and a nil growth assumption which is lower than the expected long term average growth rate of the UK economy. Cash flows have been discounted at a pre-tax rate reflecting the time value of money and the risk specific to these cash flows. This has been determined as a pre-tax rate of 9.9% (2015: 12.2%).
The value in use calculation used is most sensitive to the assumptions used for growth and for the discount rate. Accordingly, stress testing has been performed on these key assumptions as part of the impairment test to further inform the consideration of whether any impairment is evident. Further to this, management believes that no reasonably foreseeable change in any of the key assumptions would cause the recoverable amount of the CGU to be lower than its carrying amount, and consequently no impairment has been recognised.
Notes to the consolidated financial statements continued

Ou
r Bu
sine
ss
Go
ve
rna
nc
eF
ina
nc
ial S
tate
me
nts
AA plc Annual Report and Accounts 2016 115
Ou
r Pe
rform
an
ce
25 Financial assets and financial liabilities
The carrying amount of all financial assets and financial liabilities by class are as follows:
Financial assets 2016
£m2015
£m
Measured at fair value through other comprehensive income
Interest rate swaps used for hedging – 21
Loans and receivables
Cash and cash equivalents 166 302
Trade receivables 146 156
Other receivables and accrued income 17 18
Total financial assets 329 497
Financial liabilities 2016
£m2015
£m
Measured at fair value through other comprehensive income
Interest rate and fuel swaps used for hedging 27 50
Loans and borrowings
Trade payables 110 114
Other payables 66 64
Obligations under finance lease agreements 61 51
Borrowings 2,893 3,191
Total financial liabilities 3,157 3,470
Fair valuesFinancial instruments held at fair value are valued using quoted market prices or other valuation techniques.
Valuation techniques include net present value and discounted cash flow models, and comparison to similar instruments for which market observable prices exist. Assumptions and market observable inputs used in valuation techniques include interest rates.
The objective of using valuation techniques is to arrive at a fair value that reflects the price of the financial instrument at each year end at which the asset or liability would have been exchanged by market participants acting at arm’s length.
Observable inputs are those that have been seen either from counterparties or from market pricing sources and are publicly available. The use of these depends upon the liquidity of the relevant market. When measuring the fair value of an asset or a liability, the Group uses observable inputs as much as possible. Fair values are categorised into different levels in a fair value hierarchy based on the inputs used in the valuation as follows:
Level 1 – Quoted market prices in an actively traded market for identical assets or liabilities. These are the most reliable.
Level 2 – Inputs other than quoted prices included in Level 1 that are observable for the assets or liabilities. These include valuation models used to calculate the present value of expected future cash flows and may be employed either when no active market exists or when there are quoted prices available for similar instruments in active markets. The models incorporate various inputs including interest rate curves and forward rate curves of the underlying instrument.
Level 3 – Inputs for assets or liabilities that are not based on observable market data.
If the inputs used to measure the fair values of an asset or a liability might be categorised in different levels of the fair value hierarchy, then the fair value measurement is categorised in its entirety in the same level as the lowest input that is significant to the entire measurements.
The fair values are periodically reviewed by the Group Treasury function. The following tables provide the quantitative fair value hierarchy of the Group’s interest rate and fuel swaps and loan notes.

116 AA plc Annual Report and Accounts 2016
25 Financial assets and financial liabilities (continued)
The carrying values of all other financial assets and liabilities (including the Senior Term Facility) are approximate to their fair values:
At 31 January 2016:Fair value measurement using
Carrying value £m
Quoted prices in active markets
(Level 1) £m
Significant observable
inputs (Level 2) £m
Significant unobservable
inputs (Level 3) £m
Financial liabilities measured at fair value
Interest rate and fuel swaps (note 17) 27 – 27 –
Liabilities for which fair values are disclosed
Loan notes (note 18) 2,441 2,528 – –
At 31 January 2015:
Fair value measurement using
Carrying value £m
Quoted prices in active markets
(Level 1) £m
Significant observable inputs
(Level 2) £m
Significant unobservable
inputs (Level 3) £m
Financial assets measured at fair value
Interest rate swaps (note 14) 21 – 21 –
Financial liabilities measured at fair value
Interest rate swaps (note 17) 50 – 50 –
Liabilities for which fair values are disclosed
Loan notes (note 18) 2,530 2,861 – –
There have been no transfers between the levels and no non-recurring fair value measurements of assets and liabilities during the two years to
31 January 2016.
Notes to the consolidated financial statements continued

Ou
r Bu
sine
ss
Go
ve
rna
nc
eF
ina
nc
ial S
tate
me
nts
AA plc Annual Report and Accounts 2016 117
Ou
r Pe
rform
an
ce
26 Financial risk management objectives and policies
The Group’s principal financial liabilities comprise borrowings as well as trade and other payables. The main purpose of these financial liabilities is to finance the Group’s operations. The Group’s principal financial assets include deposits with financial institutions, money market funds and trade receivables.
The Group is exposed to market risk, credit risk and liquidity risk. The Group’s senior management oversees the management of these risks, supported by the Group Treasury function. The Group Treasury function ensures that the Group’s financial risks are governed by appropriate policies and procedures and that financial risks are identified, measured and managed in accordance with the Group’s policies and risk objectives. All derivative activities are for risk management purposes and are carried out by the Group Treasury function. It is the Group’s policy not to trade in derivatives for speculative purposes.
The Board of Directors reviews and agrees policies for managing each of these risks, which are summarised below.
Market riskMarket risk is the risk that the fair value of future cash flows of a financial instrument will fluctuate because of changes in prices set by the market. The key market risk that the Group is exposed to is interest rate risk. The Group has policies and limits approved by the Board for managing the interest rate risk exposure. The Group’s policy is to fully hedge all of its exposure to variable interest rates. The Group has therefore taken out interest rate swaps to the value of its variable rate instruments.
The interest rate profile of the Group’s interest-bearing financial instruments is as follows:
2016 £m
2015 £m
Fixed rate instruments
Financial liabilities (2,502) (2,581)
Effect of interest rate swaps (454) (663)
Net exposure to fixed rate instruments (2,956) (3,244)
Variable rate instruments
Financial liabilities (452) (660)
Effect of interest rate swaps 454 663
Net exposure to variable rate instruments 2 3
Sensitivity of fixed-rate instruments The Group does not account for any fixed-rate financial assets and financial liabilities at fair value through profit or loss and does not use derivative instruments in fair value hedges. Consequently, having regard to fixed rate instruments, a change in market interest rates at the reporting date would not affect profit or loss.
Sensitivity of variable rate instrumentsAn increase of 50 basis points in interest rates at 31 January 2016 would have increased equity by £4m (2015: £9m) and had no impact on profit or cash. A decrease to interest rates of the same magnitude will have an equal and opposite effect on equity and profit. This calculation assumes that the change occurred at the year end and had been applied to risk exposures existing at that date.
This analysis assumes that all other variables remain constant and considers the effect of financial instruments with variable interest rates and the fixed rate element of interest rate swaps. The analysis is performed on the same basis for all comparative periods.

118 AA plc Annual Report and Accounts 2016
26 Financial risk management objectives and policies (continued)
Credit riskCredit risk is the risk that a counterparty will not meet its obligations under a financial instrument or customer contract, leading to a financial loss. The Group is exposed to credit risk in relation to its financial assets, outstanding derivatives and trade and other receivables. The Group assesses its counterparty exposure in relation to the investment of surplus cash and undrawn credit facilities. The Group primarily uses published credit ratings to assess counterparty strength and therefore to define the credit limit for each counterparty, in accordance with approved treasury policies.
The credit risk for the Group is limited as payment from customers is generally required before services are provided.
Credit risk in relation to deposits and derivative counterparties is managed by the Group’s treasury function in accordance with the Group’s policy. Investments of surplus funds are made only with approved counterparties and within credit limits assigned to each counterparty. The limits are set to mitigate financial loss through any potential counterparty failure.
The Group’s maximum exposure to credit risk for the components of the statement of financial position at each reporting date is the carrying amount except for derivative financial instruments. The Group’s maximum exposure for financial derivative instruments is noted under liquidity risk.
The ageing analysis of trade receivables is as follows:
Past due but not impaired
Total £m
Neither past due nor impaired
£m< 30 days
£m30 – 60 days
£m60+ days
£m
2016 146 136 2 2 6
2015 156 143 5 2 6
The movements in the provision for the collective impairment of receivables are as follows:
2016 £m
2015 £m
At start of year 2 4
Charge for the year 1 1
Utilised – (2)
Unused amounts reversed (1) (1)
At end of year 2 2
Notes to the consolidated financial statements continued

Ou
r Bu
sine
ss
Go
ve
rna
nc
eF
ina
nc
ial S
tate
me
nts
AA plc Annual Report and Accounts 2016 119
Ou
r Pe
rform
an
ce
26 Financial risk management objectives and policies (continued)
Liquidity riskLiquidity risk is the risk that the Group either does not have available sufficient financial resources to enable it to meet its obligations as they fall due, or can secure them only at excessive cost. The Group’s approach to managing liquidity risk is to evaluate current and expected liquidity requirements to ensure that it maintains sufficient reserves of cash and headroom on its working capital facilities.
The table below analyses the maturity of the Group’s financial liabilities on a contractual undiscounted cash flow basis and includes any associated debt service costs. The analysis of non-derivative financial liabilities is based on the remaining period at the reporting date to the contractual maturity date.
At 31 January 2016:On demand
£mLess than 1 year
£m1 to 2 years
£m2 to 5 years
£mover 5 years
£mTotal
£m
Loans and borrowings – 138 140 1,990 1,436 3,704
Obligation under finance leases – 43 14 8 – 65
Other payables and accruals – 66 – – – 66
Trade payables – 110 – – – 110
– 357 154 1,998 1,436 3,945
Interest rate swaps used for hedging
Assets (inflow) – (9) (3) – – (12)
Liabilities – 16 8 5 – 29
– 7 5 5 – 17
– 364 159 2,003 1,436 3,962
At 31 January 2015:
On demand £m
Less than 1 year £m
1 to 2 years £m
2 to 5 years £m
over 5 years £m
Total £m
Loans and borrowings – 182 185 2,692 1,183 4,242
Obligation under finance leases – 38 10 5 2 55
Other payables and accruals – 64 – – – 64
Trade payables – 114 – – – 114
– 398 195 2,697 1,185 4,475
Interest rate swaps used for hedging
Assets (inflow) – (6) – (14) – (20)
Liabilities – 13 3 14 – 30
– 7 3 – – 10
– 405 198 2,697 1,185 4,485
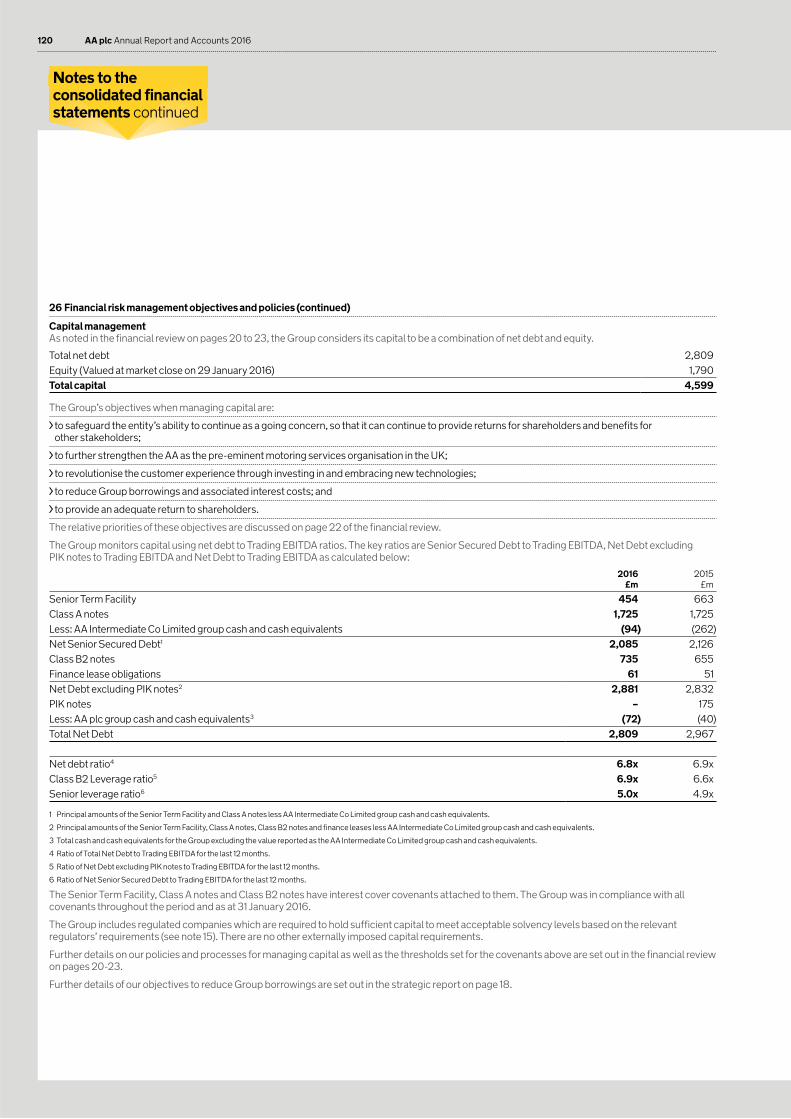
120 AA plc Annual Report and Accounts 2016
26 Financial risk management objectives and policies (continued)
Capital managementAs noted in the financial review on pages 20 to 23, the Group considers its capital to be a combination of net debt and equity.
Total net debt 2,809
Equity (Valued at market close on 29 January 2016) 1,790
Total capital 4,599
The Group’s objectives when managing capital are:
to safeguard the entity’s ability to continue as a going concern, so that it can continue to provide returns for shareholders and benefits for other stakeholders;
to further strengthen the AA as the pre-eminent motoring services organisation in the UK;
to revolutionise the customer experience through investing in and embracing new technologies;
to reduce Group borrowings and associated interest costs; and
to provide an adequate return to shareholders.
The relative priorities of these objectives are discussed on page 22 of the financial review.
The Group monitors capital using net debt to Trading EBITDA ratios. The key ratios are Senior Secured Debt to Trading EBITDA, Net Debt excluding PIK notes to Trading EBITDA and Net Debt to Trading EBITDA as calculated below:
2016 £m
2015 £m
Senior Term Facility 454 663
Class A notes 1,725 1,725
Less: AA Intermediate Co Limited group cash and cash equivalents (94) (262)
Net Senior Secured Debt1 2,085 2,126
Class B2 notes 735 655
Finance lease obligations 61 51
Net Debt excluding PIK notes2 2,881 2,832
PIK notes – 175
Less: AA plc group cash and cash equivalents3 (72) (40)
Total Net Debt 2,809 2,967
Net debt ratio4 6.8x 6.9x
Class B2 Leverage ratio5 6.9x 6.6x
Senior leverage ratio6 5.0x 4.9x
1 Principal amounts of the Senior Term Facility and Class A notes less AA Intermediate Co Limited group cash and cash equivalents.
2 Principal amounts of the Senior Term Facility, Class A notes, Class B2 notes and finance leases less AA Intermediate Co Limited group cash and cash equivalents.
3 Total cash and cash equivalents for the Group excluding the value reported as the AA Intermediate Co Limited group cash and cash equivalents.
4 Ratio of Total Net Debt to Trading EBITDA for the last 12 months.
5 Ratio of Net Debt excluding PIK notes to Trading EBITDA for the last 12 months.
6 Ratio of Net Senior Secured Debt to Trading EBITDA for the last 12 months.
The Senior Term Facility, Class A notes and Class B2 notes have interest cover covenants attached to them. The Group was in compliance with all covenants throughout the period and as at 31 January 2016.
The Group includes regulated companies which are required to hold sufficient capital to meet acceptable solvency levels based on the relevant regulators’ requirements (see note 15). There are no other externally imposed capital requirements.
Further details on our policies and processes for managing capital as well as the thresholds set for the covenants above are set out in the financial review on pages 20-23.
Further details of our objectives to reduce Group borrowings are set out in the strategic report on page 18.
Notes to the consolidated financial statements continued

Ou
r Bu
sine
ss
Go
ve
rna
nc
eF
ina
nc
ial S
tate
me
nts
AA plc Annual Report and Accounts 2016 121
Ou
r Pe
rform
an
ce
27 Commitments and contingencies
Operating lease commitments Future minimum rentals payable under non-cancellable operating leases as at 31 January are as follows:
Land and Buildings
2016 £m
2015 £m
Leases expiring:
Within one year – 2
Between one and five years 11 13
After five years 28 30
39 45
Income from operating sub-leases (4) (6)
Amounts included in onerous lease provisions (6) (8)
29 31
Where a property is no longer used by the Group for operational purposes, tenants are sought to reduce the Group’s exposure to lease payments. Where the future minimum lease payments are in excess of any expected rental income due, a provision is made.
Finance lease commitmentsThe Group has finance lease contracts for various items of plant and machinery. Future minimum lease payments under finance lease contracts together with the present value of the net minimum lease payments are as follows:
2016 2015
Present value of payments
£m
Minimum payments
£m
Present value of payments
£m
Minimum payments
£m
Within one year 40 43 35 38
Between one and five years 21 22 16 17
Total minimum lease payments 61 65 51 55
Less amounts representing finance charge – (4) – (4)
Present value of minimum lease payments 61 61 51 51
CommitmentsAmounts contracted for but not provided in the financial statements amounted to £15m (2015: £5m).
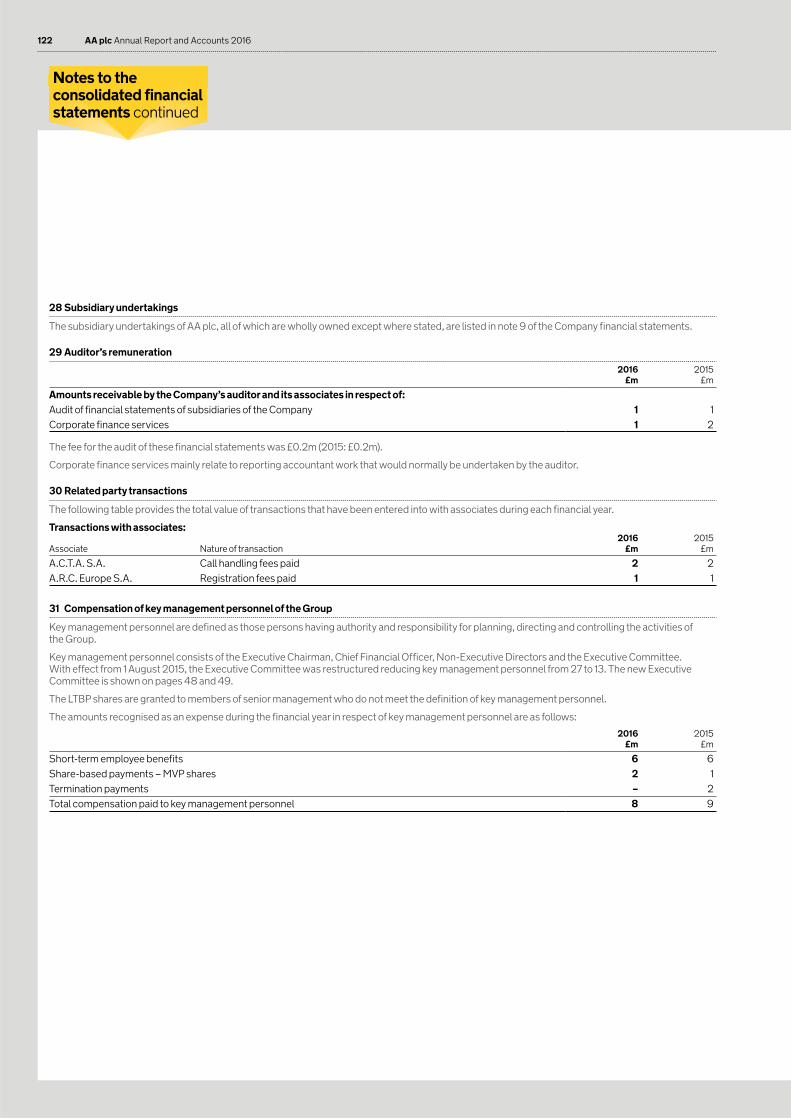
122 AA plc Annual Report and Accounts 2016
28 Subsidiary undertakings
The subsidiary undertakings of AA plc, all of which are wholly owned except where stated, are listed in note 9 of the Company financial statements.
29 Auditor’s remuneration
2016 £m
2015 £m
Amounts receivable by the Company’s auditor and its associates in respect of:
Audit of financial statements of subsidiaries of the Company 1 1
Corporate finance services 1 2
The fee for the audit of these financial statements was £0.2m (2015: £0.2m).
Corporate finance services mainly relate to reporting accountant work that would normally be undertaken by the auditor.
30 Related party transactions
The following table provides the total value of transactions that have been entered into with associates during each financial year.
Transactions with associates:
Associate Nature of transaction2016
£m2015
£m
A.C.T.A. S.A. Call handling fees paid 2 2
A.R.C. Europe S.A. Registration fees paid 1 1
31 Compensation of key management personnel of the Group
Key management personnel are defined as those persons having authority and responsibility for planning, directing and controlling the activities of the Group.
Key management personnel consists of the Executive Chairman, Chief Financial Officer, Non-Executive Directors and the Executive Committee. With effect from 1 August 2015, the Executive Committee was restructured reducing key management personnel from 27 to 13. The new Executive Committee is shown on pages 48 and 49.
The LTBP shares are granted to members of senior management who do not meet the definition of key management personnel.
The amounts recognised as an expense during the financial year in respect of key management personnel are as follows:
2016 £m
2015 £m
Short-term employee benefits 6 6
Share-based payments – MVP shares 2 1
Termination payments – 2
Total compensation paid to key management personnel 8 9
Notes to the consolidated financial statements continued

Ou
r Bu
sine
ss
Go
ve
rna
nc
eF
ina
nc
ial S
tate
me
nts
AA plc Annual Report and Accounts 2016 123
Ou
r Pe
rform
an
ce
32 Share-based payments
2016 £m
2015 £m
Share-based payments – MVP shares 2 1
Share-based payments – LTBP 2 –
Share-based payments – staff share incentive plan 1 1
5 2
Management value participation shares (MVP shares)On 23 June 2014, the Company issued 24 million convertible, redeemable MVP shares to Executive Directors at £0.001 per share. These shares were divided into three classes and are convertible into ordinary shares following satisfaction of a Total Shareholder Return (TSR) performance condition of 12% per annum compound growth against the admission price of £2.50 which is tested on the third, fourth and fifth anniversaries of admission to the London Stock Exchange.
A further 36 million MVP shares were issued at £0.001 per share on 22 December 2015.
The MVP share-based payments are equity settled. The following table illustrates the number and fair value of the MVP shares:
Vesting date2016
No. of shares2015
No. of shares
2016 Fair value per share
£
2015 Fair value per share
£
A1 shares 23 June 2017 8,000,000 8,000,000 0.25 0.25
B1 shares 23 June 2018 8,000,000 8,000,000 0.26 0.26
C1 shares 23 June 2019 8,000,000 8,000,000 0.26 0.26
A2 shares 23 June 2017 12,000,000 – 0.38 –
B2 shares 23 June 2018 12,000,000 – 0.40 –
C2 shares 23 June 2019 12,000,000 – 0.40 –
Total 60,000,000 24,000,000
The A1 and A2 shares can also be converted on the 4th or 5th anniversary of admission and the B1 and B2 shares can also be converted on the 5th anniversary of admission.
All MVP shares were valued using a Binomial model and 25% volatility assumption to calculate the fair value using the following risk-free interest rates:
Vesting period
3 year %
4 year %
5 year %
Risk-free interest rate for A1, B1 and C1 MVP shares 0.88 1.35 1.82
Risk-free interest rate for A2, B2 and C2 MVP shares 0.55 0.77 0.98
The expected volatility reflects the assumption that the historical volatility is indicative of future trends which may not necessarily be the actual outcome.

124 AA plc Annual Report and Accounts 2016
32 Share-based payments (continued)
Long Term Bonus Plan (LTBP)On 13 August 2015, the Company issued 3 million awards over market purchased conditional ordinary shares, held by an employee benefit trust, to certain key members of senior management at nil cost. A further 1 million conditional ordinary shares were issued on 16 November 2015. Executive Directors are not eligible to participate in the LTBP.
These awards were divided into three tranches, A, B and C and vest following satisfaction of a Total Shareholder Return (TSR) performance condition of 12% per annum compound growth against the admission price of £2.50 which is tested on the 3rd, 4th and 5th anniversaries of admission to the London Stock Exchange and satisfaction of certain individual performance targets.
The LTBP share-based payments are equity settled. The following table illustrates the number and fair value of the LTBP shares:
2016
Vesting date No. of shares
Fair value per share
£
August 2015 awards:
A shares 26 June 2017 1,010,219 2.93
B shares 26 June 2018 1,010,219 2.39
C shares 26 June 2019 1,010,219 1.88
November 2015 awards:
A shares 26 June 2017 247,104 1.43
B shares 26 June 2018 247,104 1.12
C shares 26 June 2019 247,104 0.83
Total 3,771,969
If the awards do not vest on the 3rd or 4th anniversary of admission, then they are retested on the 4th and/or 5th anniversary respectively.
The shares issued in August 2015 were valued using a Monte Carlo simulation model and 20% volatility assumption to calculate the fair value using the following risk-free interest rates:
Vesting period
3 year 4 year 5 year
Risk-free interest rate (%) 0.70 0.72 1.00
The shares issued in November 2015 were valued using a Monte Carlo simulation model and 24% volatility assumption to calculate the fair value using the following risk-free interest rates:
Vesting period
3 year 4 year 5 year
Risk-free interest rate (%) 0.58 0.79 0.99
The expected volatility reflects the assumption that the historical volatility is indicative of future trends which may not necessarily be the actual outcome.
Staff share incentive plans The Group has a number of Share Incentive Plans (SIP).
Under the SIP, employees are able to buy Partnership shares by making weekly or monthly payments into the SIP.
In addition, for every Partnership share an employee purchases, the Company will match this on a 1:1 basis (Matching Shares).
Notes to the consolidated financial statements continued

Ou
r Bu
sine
ss
Go
ve
rna
nc
eF
ina
nc
ial S
tate
me
nts
AA plc Annual Report and Accounts 2016 125
Ou
r Pe
rform
an
ce
32 Share-based payments (continued)
Staff share incentive plans (continued)The SIP share-based payments are equity settled. The following table illustrates the fair value and vesting period of the SIPs:
Share type Award date Vesting date No. of shares1
Volatility %
Risk-free interest rate
%
Fair value per share
£
Charge for year ended
31 January 2016 £m
Charge for year ended
31 January 2015 £m
2015 SIP
Partnership shares 29 August 2014 29 August 2015 2,132,766 21 0.55 0.23 – –
Matching shares 29 August 2014 29 August 2018 2,132,766 21 0.55 2.58 1 1
2016 SIP
Matching shares 11 January 2016 11 January 2019 111,577 26 0.76 2.93 – –
4,377,109 1 1
1 The number of shares shown above is the estimated number as at 31 January 2016.
The SIPs are valued using a Black Scholes model.
The expected volatility reflects the assumption that the historical volatility is indicative of future trends which may not necessarily be the actual outcome.
33 Ultimate parent undertaking and controlling party
AA plc is the ultimate controlling party and parent undertaking of the Group.
34 Accounting standards, amendments and interpretations
New accounting standards, amendments and interpretations adopted in the yearIn the year ended 31 January 2016 the Group did not adopt any new standards or amendments issued by the IASB or interpretations issued by the IFRS Interpretations Committee (IFRS IC) that have had a material impact on the consolidated financial statements. Other new standards, amendments and interpretations adopted, that have not had a material impact on the amounts reported in these financial statements but may impact the accounting for future transactions and arrangements, were:
Effective date
IAS 19 Defined Benefit Plans –employee contributions 1 July 2014
Annual Improvements to IFRS 2010-2012, 2011-2013 1 July 2014
New accounting standards, amendments and interpretations not yet adopted A number of new standards, amendments and interpretations, which have not been applied in preparing these financial statements, have been issued and are effective for annual reports beginning after 1 February 2015:
Effective date
IAS 1: Disclosure Initiative 1 January 2016
Annual Improvements to IFRS 2012-2014 1 January 2016
IFRS 11: Accounting for Acquisitions of Interests in Joint Operations 1 January 2016
IAS 12: Recognition of Deferred Tax assets for unrealised losses 1 January 2017
IAS 7: Disclosure Initiative 1 January 2017
IFRS 15: Revenue from Contracts with Customers 1 January 2018
IFRS 9: Financial Instruments 1 January 2018
IFRS 16: Leases 1 January 2019
The Group is currently assessing whether the above standards will have a material impact on the financial statements for the year ended 31 January 2017.
35 Events after the reporting period
On 16 March 2016 the Chancellor presented the 2016 budget in which he announced a reduction in the future corporation tax rate. Instead of the corporation tax rate reducing from 19% to 18%, on 1 April 2020, the rate will now fall to 17%. As the new rate of 17% was not substantively enacted at the balance sheet date the impact of this reduction has not been reflected in the deferred tax calculations. The effect of this rate reduction would be to reduce the carrying value of the deferred tax asset in the balance sheet by £2m.

126 AA plc Annual Report and Accounts 2016
Notes2016
£m2015
£m
Non-current assets
Investment in subsidiaries 2 806 799
Investment in joint ventures 3 4 –
810 799
Current assets
Trade and other receivables 4 14 4
Cash at bank and in hand 5 59 33
73 37
Total assets 883 836
Current liabilities
Trade and other payables 6 (9) (176)
Non-current liabilities
Other payables 7 (1) (1)
Total liabilities (10) (177)
Net assets 873 659
Equity
Called up share capital 8 1 1
Share premium 399 200
Own shares (22) –
Retained earnings 495 458
Total equity attributable to equity holders of the parent 873 659
The profit for the financial year of the Company is £51m (2015: loss of £44m).
As at 31 January 2016, the Company has distributable reserves of £495m (2015: £458m).
Signed for and on behalf of the Board on 4 April 2016 by
Bob Mackenzie Martin Clarke Executive Chairman Chief Financial Officer
The accompanying notes are an integral part of this company balance sheet.
Company statement of financial positionas at 31 January

Ou
r Bu
sine
ss
Go
ve
rna
nc
eF
ina
nc
ial S
tate
me
nts
AA plc Annual Report and Accounts 2016 127
Ou
r Pe
rform
an
ce
Share capital
£m
Share premium
£m
Own shares
£m
Retained earnings
£mTotal
£m
At 1 February 2014 1 1 – 502 504
Profit for the year – – – (44) (44)
Issue of share capital – 199 – – 199
At 31 January 2015 1 200 – 458 659
Profit for the year – – – 51 51
Dividends – – – (21) (21)
Issue of share capital – 199 – – 199
Purchase of own shares – – (22) – (22)
Share-based payments – – – 7 7
At 31 January 2016 1 399 (22) 495 873
The accompanying notes are an integral part of this consolidated statement of changes in equity.
Company statement of changes in equity

128 AA plc Annual Report and Accounts 2016
1 Authorisation of financial statements and Company accounting policies
1.1 Authorisation of financial statementsThe parent company financial statements of AA plc (the “Company”) for the year ended 31 January 2016 were authorised for issue by the board of directors on 4 April 2016 and the balance sheet was signed on the Board’s behalf by Bob Mackenzie and Martin Clarke. AA plc is a public limited company incorporated and domiciled in England and Wales and the Company registration number is 5149111. The Company’s ordinary shares are traded on the London Stock Exchange.
These financial statements were prepared in accordance with Financial Reporting Standard 101 Reduced Disclosure Framework (FRS101). The financial statements are prepared under the historical cost convention. There were no material measurement or recognition adjustments on the adoption of FRS101.
No profit and loss account is presented by the Company as permitted by Section 408 of the Companies Act 2006.
The accounting policies which follow set out those policies which apply in preparing the financial statements for the year ended 31 January 2016. The financial statements are prepared in Sterling and are rounded to the nearest million pounds (£m). These financial statements are prepared on the going concern basis.
1.2 Basis of preparationThe Company has transitioned to FRS 101 from previously extant UK Generally Accepted Accounting Practice for all periods presented. The Company has adopted FRS 101 early which is permitted under the Standard. The Company has early adopted SI 2015/980.
The Company has taken advantage of the following disclosure exemptions under FRS 101:
IAS 1: paragraph 10(d) (statement of cash flows),
IAS 1: paragraph 16 (statement of compliance with all IFRS),
IAS 1: paragraph 38A (requirement for minimum of two primary statements, including cash flow statements),
IAS 1: paragraph 111 (cash flow statement information),
IAS 1: paragraphs 134-136 (capital management disclosures),
IFRS 1: paragraphs 6 and 21,
Paragraphs 45(b) and 46 to 52 of IFRS 2: ‘Share-based payment’,
IAS 7: ‘Statement of cash flows’,
IFRS 7: ‘Financial Instruments: Disclosures’,
IAS 8: paragraphs 30 and 31,
The requirements in IAS 24: ‘Related party disclosures’ to disclose related party transactions entered into between two or more members of a group.
1.3 Accounting policiesa) Foreign currencies Transactions in foreign currencies are recorded at the rate ruling at the date of the transaction or at the contracted rate if the transaction is covered by a forward foreign currency contract. Monetary assets and liabilities denominated in foreign currencies are retranslated at the rate of exchange ruling at the balance sheet date or if appropriate at the forward contract rate. All differences are taken to the profit and loss account.
b) Investments in subsidiaries and joint venturesFixed asset investments are included in the balance sheet at cost, less any provisions for permanent impairment.
Investments in subsidiaries and joint ventures are stated at the lower of cost and net realisable value.
The carrying amounts of the Company’s assets are reviewed for impairment when events or changes in circumstances indicate that the carrying amount of the fixed asset may not be recoverable. If any such indication exists, the asset’s recoverable amount is estimated. An impairment loss is recognised whenever the carrying amount of an asset or its income-generating unit exceeds its recoverable amount. Impairment losses are recognised in the profit and loss account unless it arises on a previously revalued fixed asset.
The recoverable amount of fixed assets is the greater of their net realisable value and value in use. In assessing value in use, the expected future cash flows are discounted to their present value using a pre-tax discount rate that reflects current market assessments of the rate of return expected on an investment of equal risk. For an asset that does not generate largely independent income streams, the recoverable amount is determined for the income-generating unit to which the asset belongs.
Joint ventures are joint arrangements whereby the parties that have joint control of the arrangement have rights to the net assets of the arrangement.
c) Borrowings All borrowings are initially stated at the fair value of the consideration received after deduction of issue costs. Issue costs are charged to the profit and loss account over the term of the borrowings and represent a constant proportion of the balance of capital repayments outstanding.
Notes to the Company financial statements
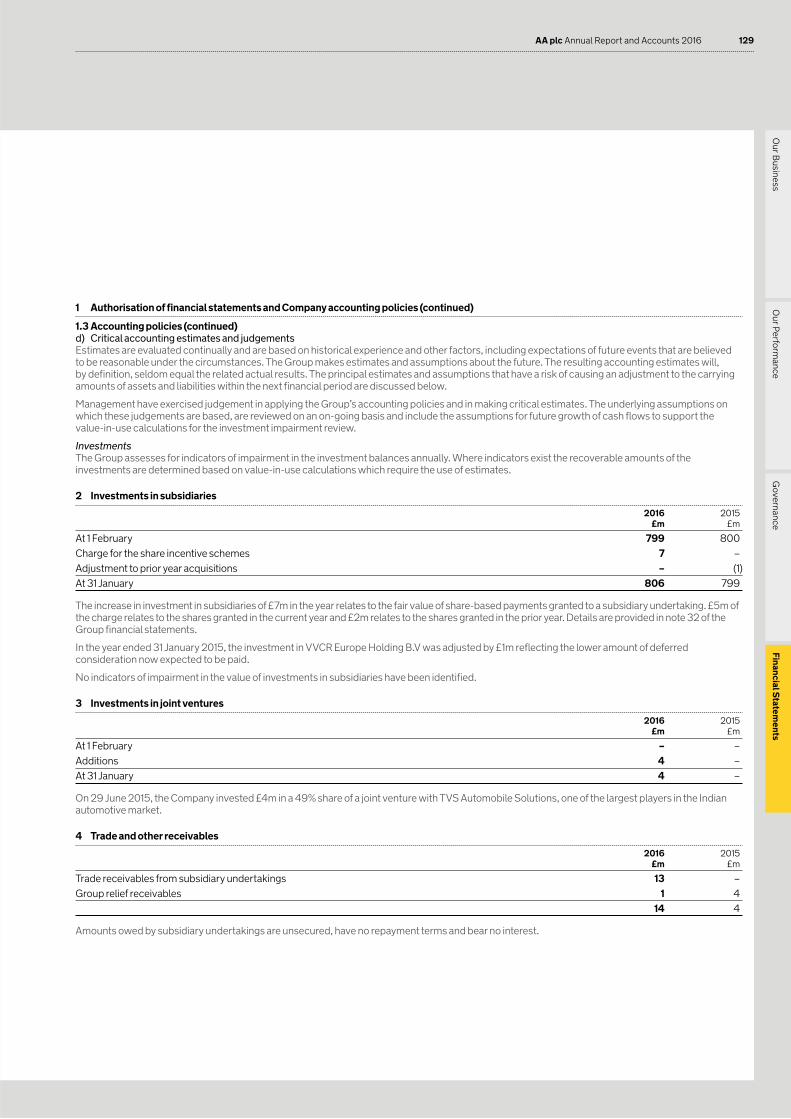
Ou
r Bu
sine
ss
Go
ve
rna
nc
eF
ina
nc
ial S
tate
me
nts
AA plc Annual Report and Accounts 2016 129
Ou
r Pe
rform
an
ce
1 Authorisation of financial statements and Company accounting policies (continued)
1.3 Accounting policies (continued)d) Critical accounting estimates and judgements Estimates are evaluated continually and are based on historical experience and other factors, including expectations of future events that are believed to be reasonable under the circumstances. The Group makes estimates and assumptions about the future. The resulting accounting estimates will, by definition, seldom equal the related actual results. The principal estimates and assumptions that have a risk of causing an adjustment to the carrying amounts of assets and liabilities within the next financial period are discussed below.
Management have exercised judgement in applying the Group’s accounting policies and in making critical estimates. The underlying assumptions on which these judgements are based, are reviewed on an on-going basis and include the assumptions for future growth of cash flows to support the value-in-use calculations for the investment impairment review.
InvestmentsThe Group assesses for indicators of impairment in the investment balances annually. Where indicators exist the recoverable amounts of the investments are determined based on value-in-use calculations which require the use of estimates.
2 Investments in subsidiaries
2016 £m
2015 £m
At 1 February 799 800
Charge for the share incentive schemes 7 –
Adjustment to prior year acquisitions – (1)
At 31 January 806 799
The increase in investment in subsidiaries of £7m in the year relates to the fair value of share-based payments granted to a subsidiary undertaking. £5m of the charge relates to the shares granted in the current year and £2m relates to the shares granted in the prior year. Details are provided in note 32 of the Group financial statements.
In the year ended 31 January 2015, the investment in VVCR Europe Holding B.V was adjusted by £1m reflecting the lower amount of deferred consideration now expected to be paid.
No indicators of impairment in the value of investments in subsidiaries have been identified.
3 Investments in joint ventures
2016 £m
2015 £m
At 1 February – –
Additions 4 –
At 31 January 4 –
On 29 June 2015, the Company invested £4m in a 49% share of a joint venture with TVS Automobile Solutions, one of the largest players in the Indian automotive market.
4 Trade and other receivables
2016 £m
2015 £m
Trade receivables from subsidiary undertakings 13 –
Group relief receivables 1 4
14 4
Amounts owed by subsidiary undertakings are unsecured, have no repayment terms and bear no interest.

130 AA plc Annual Report and Accounts 2016
5 Cash
2016 £m
2015 £m
Cash – unrestricted 59 14
Cash – restricted – 19
59 33
Cash – restricted includes £nil (2015: £19m) held as pre-funded interest to cover interest payments on the PIK notes held by subsidiary undertakings and could not be used for any other purpose. The PIK notes were repaid during the 2016 financial year.
6 Trade and other payables
2016 £m
2015 £m
Amounts owed to subsidiary undertakings 8 175
Accruals 1 1
9 176
Amounts owed to subsidiary undertakings are unsecured, have no repayment terms and bear no interest.
In the prior year, the terms of the amounts owed to subsidiary undertakings reflected the terms on the PIK notes held by a subsidiary undertaking. These amounts were unsecured, had an interest rate of 9.5% and were repayable on 6 November 2019. The PIK notes were repaid in full during the 2016 financial year.
7 Other payables
2016 £m
2015 £m
Other payables 1 1
All amounts are due within five years.
8 Share capital
2016 £m
2015 £m
Allotted, called up and fully paid
608,181,845 (2015: 554,000,001) ordinary shares of £0.001 each 1 1
1 1
The voting rights of the holders of all ordinary shares are the same and all ordinary shares rank pari passu on a winding up. AA plc has no authorised ordinary share capital.
On 22 April 2015, the Company issued 51,937,501 ordinary shares at a premium of £193m including issue costs.
During the rest of the year, the Company issued 2,244,343 ordinary shares at a premium of £6m in relation to the staff share incentive plans (see Group financial statements – note 32 for further information on these shares).
36 million MVP shares were issued on 22 December 2015. (see Group financial statements – note 32 for further information on these shares).
Notes to the Company financial statements continued

Ou
r Bu
sine
ss
Go
ve
rna
nc
eF
ina
nc
ial S
tate
me
nts
AA plc Annual Report and Accounts 2016 131
Ou
r Pe
rform
an
ce
9 Subsidiary undertakings
All subsidiaries are wholly owned and incorporated and registered where stated below.
The principal subsidiary undertakings of the Company at 31 January 2016 are:
Name Country Name Country
AA Acquisition Co Limited United Kingdom AA Reinsurance Company Limited1 Guernsey
AA Bond Co Limited Jersey AA Senior Co Limited United Kingdom
AA Corporation Limited United Kingdom AA The Driving School Agency Limited United Kingdom
AA Financial Services Limited United Kingdom AA Underwriting Insurance Company Limited Gibraltar
AA Intermediate Co Limited United Kingdom Automobile Association Developments Limited United Kingdom
AA Ireland Limited Ireland Automobile Association Insurance Services Limited United Kingdom
AA Media Limited United Kingdom Drivetech (UK) Limited United Kingdom
AA Mid Co Limited1 United Kingdom Intelligent Data Systems (UK) Limited United Kingdom
AA PIK Co Limited1 Jersey VVCR Europe B.V.1 Netherlands
The other subsidiary undertakings of the Company at 31 January 2016 are:
Name Country Name Country
1Stop Travel Insurance Services Limited United Kingdom Breakdown Assistance Services Limited Ireland
A.A. Insurance Services Limited United Kingdom Drakefield Group Limited United Kingdom
A.A. Pensions Trustees Limited United Kingdom Drakefield Holdings Limited United Kingdom
AA Assistance Limited United Kingdom Drakefield Insurance Services Limited United Kingdom
AA Brand Management Limited United Kingdom Drakefield Services Limited United Kingdom
AA Insurance Holdings Limited1 United Kingdom Drive Publications Limited United Kingdom
AA Ireland Pension Trustees Limited Ireland Drivetech Advantage Agency Limited United Kingdom
AA J Quartz Limited United Kingdom Driving Services UK Limited United Kingdom
AA Legal Services Limited United Kingdom E Travel Insurance Services Limited United Kingdom
AA Parking Solutions Limited United Kingdom Fanum Services Limited United Kingdom
AA Pension Funding GP Limited United Kingdom Go Insurance Services Limited United Kingdom
AA Pension Funding LP United Kingdom Go Travel Insurance Services Limited United Kingdom
AA Road Services Limited United Kingdom Intelematics Europe Limited United Kingdom
AA Signs Limited United Kingdom Longacre Claims Limited United Kingdom
AA Technical Solutions Limited United Kingdom Nationwide 4 X 4 Ltd United Kingdom
AA Underwriting Limited United Kingdom Peak Performance Management Limited United Kingdom
Automobile Association Commercial Services Limited United Kingdom
Personal Insurance Mortgages and Savings Limited United Kingdom
Automobile Association Holdings Limited United Kingdom Quotebanana Limited United Kingdom
Automobile Association Insurance Services Holdings Limited United Kingdom
The Automobile Association Limited Jersey
Automobile Association Protection and Investment Planning Limited United Kingdom
The British School of Motoring Limited United Kingdom
Automobile Association Services Limited United Kingdom Tourist Accommodation Management Services Limited Ireland
Automobile Association Travel Services Limited United Kingdom VVCR Europe Beroepsopleidingen B.V. Netherlands
Automobile Association Underwriting Services Limited United Kingdom
VVCR Europe Holding B.V. Netherlands
1 Directly owned by AA plc, all other subsidiaries are indirectly held.
10 Auditor’s remuneration
The fee for the audit of these financial statements was £0.2m (2015: £0.2m).
11 Staff costs
The Company had no employees or employee staff costs in the current or prior year. However, the Company has incurred costs in respect of the non-executive directors of £1m (2015: nil).