financial performance patrik johnson and operating model cfo
TRANSCRIPT

Financial performance and operating model
Patrik JohnsonCFO

Financial performance

Track record of profitable growth
0
4
8
12
0
2 000
4 000
6 000
8 000
10 000
12 000
14 000
16 000
18 000
2008 2009 2010 2011 2012 2013 2014 2015 2016 2017 2018
SEKNet Sales EPS * Dividend per shareSEK m
R12M 2018 Q3*) Excluding restructuring
+12% p.a
5 YEAR SALES DEVELOPMENT
+15% p.a
5 YEAR EPS* DEVELOPMENT
+10% p.a
5 YEAR DIVIDEND DEVELOPMENT
3

5 year bridge
+12% growth p.a.
NET SALES
+3% p.a.
ORGANIC
+8% p.a.
ACQUISITIONS
+1% p.a.
CURRENCY
+14% growth p.a.
EBITA
+2% p.a.
ORGANIC
+11% p.a.
ACQUISITIONS
+1% p.a.
CURRENCY
*) Excluding restructuring
*
4
Operating model

Operating model – principles
FULL ACCOUNTABILITY
Decentralisation
Lean head office and no allocations
Structured governance through BA’s and Boards
Common financial scorecard
Simple and consistent performance incentives
6

Decentralisation – how it works
Independent companies
Sharing and learning encouraged
Trust, mandate and obligation to act
Monthly financial reporting
Indutrade governance through Board
Bank and treasury integration
7
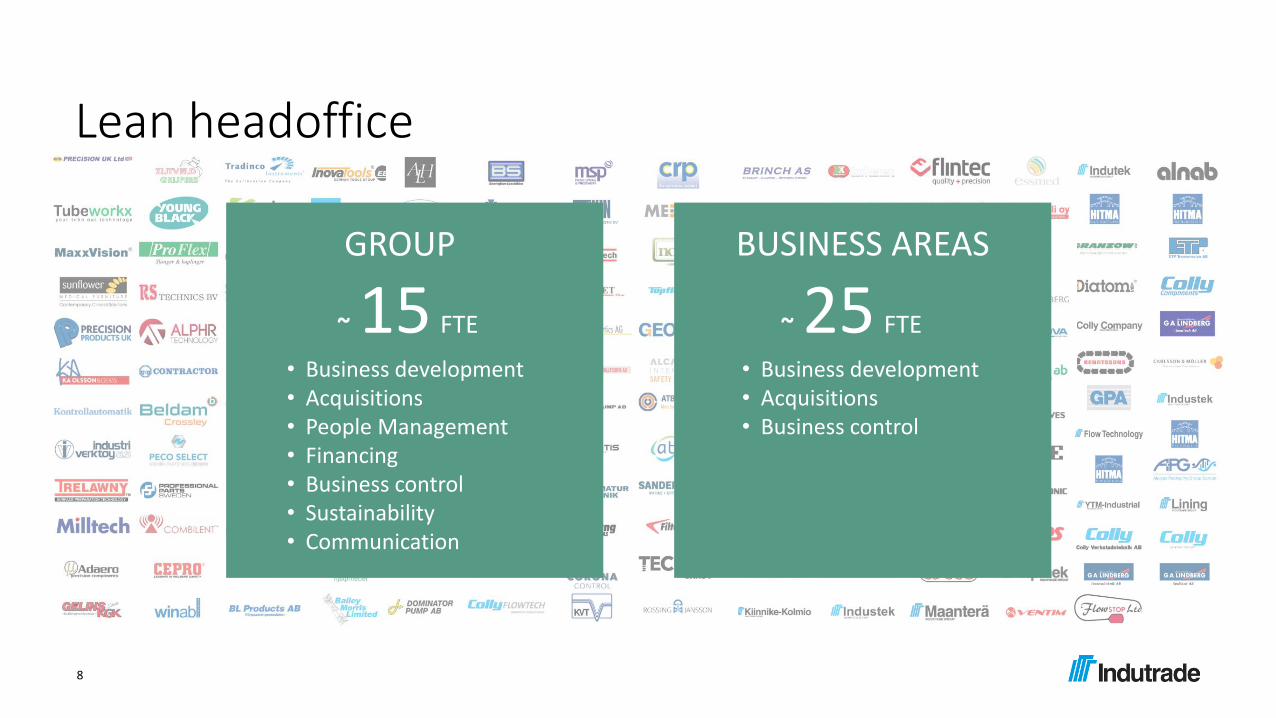
Lean headoffice
• Business development• Acquisitions• People Management• Financing • Business control• Sustainability• Communication
• Business development• Acquisitions• Business control
BUSINESS AREAS
~ 25 FTE~ 15 FTE
GROUP
8

Structured governance through company boards
▪ Company Boards the formal governance fora
▪ Monthly Business Reviews with all BA’s
▪ Board composition adopted to company needs
▪ Business Area manager supported by network of senior and experienced MDs
▪ Standard agenda
▪ Tools and best practice available in various areas
▪ Capital allocation based on Business case
Q1 meeting
(reviewing and closing previous year)
Q2 meeting
(Strategy)
Q3-Q4 meeting
(Target / budget for coming year)
Formal Board meeting
3 times per year
9

Common financial scorecard to support performance management
▪ Common Group reporting system
▪ Full P/L and B/S monthly
▪ Scorecard with standard KPI set
▪ Annual target / budget
▪ Forecasts reported three times per year
▪ Year over year improvements most important
10

Main performance incentives
▪ Full “ownership” and accountability
▪ Earn-outs (1-3 year)
▪ Annual bonus scheme based on year over year profit improvement
▪ Long term warrant program
▪ Quarterly financial benchmarking and ranking including annual and 5 year awards
11

Summary

Summary and key message
▪ Strong historical financial performance
▪ Potential to improve organic performance
▪ Simple and powerful governance and operating model
▪ Decentralisation and full accountability fundamental
▪ Harmonisation in Finance
13
