financial ratios and stock return: a panel data analysis ratios and stock return ; a... ·...
TRANSCRIPT

FINANCIAL RATIOS AND STOCK RETURN A PANEL DATA ANALYSIS
Liaw Huan Huan
Bachelor of Finance (Honours)
2012
Pusat Kbidmat Makumat Akademik UNNERSm MALAYSIA SARAWAK
PKHIDMAT MAKLUMAT AKADEMIK
1IIIIIIIIIfiim 111111111 1000245035
FINANCIAL RATIOS AND STOCK RETURN A PANEL DATA ANALYSIS
LIA W HUAN HUAN
This project is submitted in partial fulfillment of the reqt1uements for the degree of Bachelor of Finance with Honours
Faculty of Economics and Business UNIVERSITI MALAYSIA SARA W AK
2012
Statement of Originality
The work described in this Final Year Project entitled FINANCIAL RATIOS AND STOCK RETURN A PANEL DATA ANALYSIS
is to the best of the authors knowledge that of the author except where due reference is made
10 1UIE 2012
(Date submitted) (Students signature) Liaw Huan Huan 23847
ASBTRACT
FINANCIAL RATIOS AND STOCK RETURN A PANEL DATA ANALYSIS
By
Liaw Huan Ruan
The main objective of this study is to examine the role of the financial ratios such as
dividend yield (DIY) book-to-market (BM) ratio price earnings (PIE) ratio size payout ratio
and leverage to predict the stock return for the 5 different sectors in Malaysia from 2006 to 20 I O
Using panel data analysis the result shows that the financial ratios such as size were the most
powerful in predicting the stock return in all sectors Dividend yields also show the high
predictability in stock return in all sectors except banking sector Besides that the book-to-market
ratios showed the negative significant relati()nship between stock return in servicing banking
food producer and construction sectors However the financial ratios such as leverage payout
and price earnings ratio were indicated less predictive power to predict the stock return
Therefore the results imply that investors can rely on the financial ratios such as dividend yields
and size information to gain abnormal returns in the market The results further ind icate that the
Malaysian stock market is not informational efficient
Key Words Hausman Test financial ratios ~tock return panel data analysis
ABSTRAK
NISBAH KEWANGAN DAN PULANGAN SAHAM ANALISIS PANEL DATA
Oleh
Liaw Huan Huan
Objektif utama bagi kajian ini adalah untuk mengkaji peranan nisbah kewangan seperti
hasil dividen (DIY) nisbah buku (BM) nisbah harga (PIE) saiz nisbah pembayaran dan
leverage untuk meramalkan pulangan saham bagi 5 sektor yang berbeza di Malaysia dari tahun
2006 hingga 20 I O Dengan menggunakan analisis data panel hasH kajian menunjukkan bahawa
nisbah kewangan seperti saiz adalah paling berkesan untuk membuat ramalan terhadap pulangan
saham dalam semua sektor Hasil dividen juga menunjukkan kebolehramalan pada pulangan
saham dalam semua sektor kecuali sektor pmiddoterbankan Selain itu nisbah buku menunjukkan
hubungan signifikan yang negatif dengan pulangan saham dalam sektor perkhidmatan
perbankan pengeluaran makanan dan pembinaan Walaubagaimanapun nisbah kewangan yang
seperti leverage nisbah pembayaran dan nisbah harga didapati tidak signifikan mempengaruhi
pulangan saham Secara keseluruhan kajian ini menunjukkan para pelabur dapat menggunakan
maklumat saiz and hasil dividen untuk memperoleh pulangan abnormal di pasaran Justeru hasil
kajian ini juga menur~jukkan pasaran saham di Malaysi~ adalah kurang cekap
Kata Kunci Hausman test nisbah kewangan saham pulangan panel data analisis
ACKNOWLEDGEMENT
Apart from the efforts of me the success of my thesis highly depends on the
encouragement and support from many of others I would like to take this opportunity to express
my greatest appreciation to the people who have been instrumental in the successful completion
of my Final Year Project
I would like to take this opportunity to deliver acknowledgement and thankful toward the
people who had assisted guided advised and encouraged me in the preparation of my final year
project especially to my respected project supervisor Encik Bakri Abdul Karim who had always
instructed me patiently I m felt motivated and encouraged every time I attended his meeting
With his valuable opinion expert guidance and support this project able to completed in well
timed
Hereby I would like to express my gratitude to my beloved family which is always give
support and encouragement to me from the initial to the final level of my project Moreover my
family members also help me in term of moneys aspect The high budget in completed this
research thus the monetary support from family members are very important to me
Furthermore I also would like to acknowledge to my friends who not forget to support me and guide me in doing this project Lastly I offer my regards and blessings to all of those who
supported me in any respect during the completion of the project
I
Pusat Khidmat MakJumat Akademik VNlVERSm MALAYSIA SARAWAK
TABLE OF CONTENTS
LIST OF TABLES IX
LIST OF FIGURES X
CHAPTER ONE INTRODUCTION
10 Introduction
11 Background of the Research
12 The Malaysian Economic 4
13 The Stock Development in Malaysia 9
14 Problem Statement 16
15 Objective 19
bmiddotmiddot bull151 General 0 ~ectlve 19
152 Specific Objectives 19
16 Significant of Study 20
17 Scope of Study 21
CHAPTER TWO LITERATURE REVIEW AND LITERATURE REVIEW
20 Introduction of Theoretical Framework 22
21 Market Efficient Hypothesis 23
22 Literature Review 24
221 Capital Asset Pricing Model 24
222 Asset Pricing Theory 27
223 Financial Ratios 29
VI
2231 Dividend Yields 29
~
223 2 Book-to-Market Ratio 31
2233 Price Earnings Ratio 32
2234 Size 33
2235 Payout Ratio 34
2236 Leverage 34
CHAPTER THREE METHODOLOGY
30 Introduction 36
31 Conceptual Framework 37
32 Research Design 38
321 Salnple 38
32 2 Model Specification~ 39
323 Data Collection 40
324 Data Analysis 40
33 Methodology 41
331 Panel Data 41
332 Dependent and Independent Variables 42
332 1 Stock Return 43
3322 Dividend yields 43
3323 Book-to-Market Ratio 44
3324 Price Earnings Ratio 44
3325 Size 45
3326 Payout Ratio 45
vii
~-
3327 Leverage 45
J
34 Hausman Test 46
35 Fixed Effect Model 48
36 Random Effect Model 49
37 Diagnostic Checking 50
CHAPTER FOUR EMPIRICAL FINDINGS AND DISCUSSIONS
40 Introduction 52
41 Statistical Descriptive 52
42 Discussion on Hausman Test Analysis 54
43 Discussion on Fixed Effect Model Analysis 56
44 Discussion on Random Effect Model Analysis 58
45 Summary of Discussion 59
CHAPTER FIVE DISCUSSION OF FINDINGS
50 Introduction 65
51 Sulnmary 65
52 Implication of Study 68
53 Recomlnendation 69
54 Limitation 70
REFERENCES 71
Vill
I
-
LIST OF TABLES
Table 1 Dependent and Independent Variables 39
Table 2 Summary Statistics for Data Used 53
Table 3 Hausman Test 55
Table 4 Fixed Effect Model 56
Table 5 Random Effect Model 58
p
IX
Figure 1
Figure 2
Figure 3
Figure 4
Figure 5
Figure 6
Figure 7
Figure 8
Figure 9
Figure 10
Figure 11
LIST OF FIGURES
Malaysia Gross Domestic Product by Sector on 2010 5
Gross Domestic Product and Annual Growth Rate from Period
2008 to 2010 6
Malaysia - Annual GOP Growth Rates by Sectors 2008 to 2010 7
Comparison the GOP in Malaysia by Sectors between 2009 and
2010 8
Number of Listed Companies in Malaysia from Period 1990 to
2010 11
Market Capitalizations in Malaysia from Period 1990 to 2010 12
Price Earnings Ratio and Gross Dividend Yield in Bursa
Malaysia from Period r990 to 2010 13
Kuala Lumpur Composite Index from Period 1990 to 2010 14
Value of Share Trading from Period 1990 to 2010 15
Conceptual Framework 45
The Summarize Findings of Financial Ratios Based on Sectors 64
x
CHAPTER ONE
INTRODUCTION
10 Introduction
This research is study on the relationship between the financial ratios and stock
return This chapter discusses the background of the research Besides that this study
also covers problem statement purpose of research significant of research and scope of
research
11 Background of Study
Nearly five decades ago study on the pred iction of stock return has been one of
the most challenging topics in financial economics A number of theoretical models
have been developed to explain stock return such as Capital Asset Pricing Model
(CAPM) Arsitrage Pricing Theory (APT) Fama and French three factor model and
others financial ratios
In the early stages a number of studies on CAPM were considerably written in
the academic research CAPM consider as one of the most important modern capital
theory which originally proposed by Sharpe (1964) The parallel) work was also
~
performed by Lintner (1965) and Black (1972) CAPM had been continuously used in
practical portfolio management and the capital equilibrium model for the academic
research guiding purpose (Koo amp Olson 2007) Besides that CAPM were widely used
to measures the powerful explanation on the expected risk and return theoretical as well
as empirical studies (Michailidis Tsopoglou Papanastasiou amp Mariola 2006 Nguyen
amp Puri 2010) However Michailidis et at (2006) found that the basic theory hypothesis
of higher risk was associated with higher return which is not supportive The early test
CAPM worked efficiently as a pred ictor of the stock return but many of studies found
anomalies in CAPM (Padney 2001)
More to the point in the early 1976s Arbitrage Pricing Theory (APT) proposed
by Stephen Ross as an alternative to replace CAPM to explain stock return The main
idea of APT was the price of security driven by number of factors There were several
dependent macroeconomics factors influenced on the asset return such as inflation rate
GOP exchange rate change in price indexes and etc (Somoye Akintoye amp Oseni
2009) The asset return were relying on the influences of macroeconomic factors and
others incident that were distinctive to the firm but the expected risk premium only
affected by the macroeconomic factors (Hohling 2009) In the efficeint market
hypothesis the informat ion change in the macroeconomic variables fully reflect the
current stock prices therefore this caused the investors to get the anomalies return in
the future stock market movment (Balvers Cosimano amp Mcdonald 1990)
2
Additionally Fama and French (1992) co written came out a new model which
was known as Fama-French three model factor Fama-French three model factor
measured by the combination of the market beta such as size Leverage book-to market
equity and price earnings ratio with the cross sectional of expected stock return (Fama
amp French 1992) The Fama-French three model factor was a simple variation in stock
return compare with CAPM due to the additional of size and book-to-market-equity in
the model (Ajili 200 I) CAPM was only using one variable (beta) to describe the stock
return but reversely Fama-French three model factor was using three variables such as
small caps book-to-market ratio and the additional of size (Fama amp French 2008)
However CAPM and Fama-French three model factor had performed a good job in
explaining the cross section of stock return (Ajlis 200 I)
As Fama (1970) recommended that an efficient capital market is all the security
prices adjust rapidly new information and the prices of an asset reflect all available
information However the stock prices wandered randomly over the time period and the
stock prices change could use predictors (Padney 200) An efficient market as a
dominate sources of allocation in order to provide an accurate signal for the firm to
make investment decision and investor can choose among securities that represent
ownership of firms activities (Brown amp KReiIlY 2009) Besides that if the abnormal
rate of return on the stock market which were lower than the normal rate of return it
means that the capital market was efficient and vice versa
3
12 The Malaysian Economic
Since Malaysia became independent on 1957 Malaysias economic had grown
rapidly Malaysia is a developing country which consists of thirteen states and three
federal territories Malaysia considers as a small country where totals landmass of
329847 square kilometres (127315 sq mi) which separated by the South China
Sea into two regions Peninsular Malaysia and Malaysia Borneo In the year of201 0 the
population exceeded 283 million (United States State Department 20 I 0)
According to the United States State Department (2010) the Malaysia annual
real gross domestic product (GOP) growth rate grew by the average of 446 per year
from period 2006 to 20FO The total Nominal GOP on 2010 is $2553 billion and the
total nominal per capital Income (GNI) is $8126 Malaysia is a country which
prosperity In the mineral natural resources and agricultural product The natural
resources are such as petroleum liquefied natural gas (LNG) tin minerals and others
where the agricultural products are such as palm oil rubber timber cocoa rice tropical
fruit fish coconut and others
The Malaysia economy is expected to grow healthy and strong by switching
from the agricultural and commodities sectors to the manufacture and export sectors
Based on the United States State Department (20 I 0) stated that the Malaysia traded on
merchandise export is 2103 billion where the traded includes electronic products
machinery liquid natural gas petroleum products and telecom equipment The recent
4
Pu at Khldm rMIIJdum tAk UNlVERsm MALAYSIA
impressive perfonnance shows the export as a main contribution in services sector to
lead the economic growth in Malaysia (Economy Watch 2010)
F 1 MImiddot G oss Do f Product b S ctor on 2010 -
change2010 ChangeSector (Q4 2010(RM billion) (20102009)Q42009)
Source Ministry of International Trade and Industry 2011
Figure above shows the Malaysias gross domestic product on 2010 was mostly
contributed by services sector which shows RM3206 billion compare to the
construction sectors which only shows RM 182 billion Nowadays Malaysia is a
middle-income country which focuses most on the services and manufacturing sector
Moreover Malaysia become one of the largest exporters of world in semiconductor
devices electric goods and as well as infonnation and communication technology (lCT)
products
5
Figure 2 Gross Domestic Product and Annual Growth Rate from Period 2008 to 2010
40
Source Ministry ofIntemational Trade and Industry 2011
Figure above represents the annual gross domestic product growth in Malaysia
from period 2008 to 2010 taken as whole was moving average but the abnonnal
circumstance happened during 2009 quarter 1 The annual gross domestic product
growth in 2008 average was RM13255 million The average amount drops to
RM13030 million in 2009 However the amount annual gross domestic product growth
in 2010 recovers and increases to RM13390 million
6
3 Malaysia - Annual GDP Growth Rates by Sectors 2008 to 2010
Source Source Ministry of Intemational Trade and Industry 2011
Figure above indicates that the GDP annual growth rates by sectors the growth
rate in services and manufacturing sectors were higher than the others sectors During
the abnormal circumstance in 2009 it shows negative value substantially as well
However in the year 2010 the GDP growth in Malaysia recovered and the
manufacturing sector remain the highest growth rate among the others sector
7
Figure 4 Comparison the GDP in Malaysia by Sectors between 2009 and 2010
I(I~ IM111AI
Source Ministry of International Trade and Industry 2011
Figure above is the comparison between the GDP by sector in Malaysia for 2009
and 2010 and it show that the total (1)P increase from RM5211billion in 2009 and
became RM5584 billion in 2010 The sectors such as services and manufacturing
sectors indicated the growth in the GDP However the sectors like mining amp quarrying
agricultural and construction indicated the percentages of decrease in the GDP growth
rate
8
13 The Stock Development in Malaysia
In 1960 the Malaysia Stock Exchange was first setting up and known as
Malayan Stock Exchange and in 1965 it was changed to Stock Exchange of Malaysia
and Singapore due to the secession of Singapore from Malaysia In 1973 the currency
interchange ability between Malaysia and Singapore had been ceased and the Stock
Exchange of Malaysia and Singapore were divided into Kuala Lumpur Stock Exchange
Bcrhad (KLSEB) and Stock Exchange of Singapore (SES) (Bursa Malaysia 20 L1)
Aller demutualize exercise on 14th April 2004 Kuala Lumpur Stock Exchange (KLSE)
was renamed to Bursa Malaysia On 18 th March 2005 Bursa Malaysia was listed on the
Main Board of Bursa Malaysia Securities Berhad (Chong amp Puah 2009) However
Bursa Malaysia currently consists of 988 companies which 637 companies on Main
Board 227 companies on Second Board and 124 companies on MESDAQ (Lee amp Lee
2008)
Moreover Capital market is a place for investor and institute trade financial
securities in order to raise funds Thus the market where securities traded is known as
Sccurities Market it comprised of both the primary and secondary markets The primary
market is known as new issue market where it deals with new issue securities in
Malaysia whereas the secondary market focuses on the trading of existing securities and
it often termed as stock exchange market According to Lee and Lee (2008) generally
the investor desire to earn a positive return in their investment The return of the shares
9
I
trade for the short term investor is capital gain and the dividend is for the long term
in cstor
However the stock market in Malaysia should always be in the range o[
effic k ncy This is because the efficient capital market assumes that an initial premise of
an fftcient market request that a large number of profit maximizing participant analyze
and va lue securities Besides that the new information regarding the securities comes to
the market in a random fashion However the buyer and seller decision of all those
profit maximizing investor who adjust security prices rapidly reflect the effect of new
intormation (Brown amp Reilly 2009)
In Malaysia therc are no practices on the tax loss-selling hypothesis therefore
there arc no capital gain taxes for the residents or non-residents The stock return
seasonality in Malaysia indicates that stock market in Malaysia is not efficient in
reflecting the information I-Ience investor can spend time in getting higher returns
Generally the efficient market hypothesis (EMH) stated that the stock price and return
are not able to be predicted by using the past price information However the
seasonality effect presence and this implies the efficiency market and negates the weak
form oCthe efficiency market hypothesis (Padney 2004)
The Malaysian capital market is focus on the weak form efficiency market and
risk of return relationship The weak form efficiency markets where the prices reflect all
the historical market trading information Most of the tests show this information unable
10
to generate abnormal return (Nasir Mohamad amp Hamid 1998) Based on Tan (2006)
Ma laysia stock index futures market does not subscribe to random walk hypothesis but
stock return are predictable
Figure 5 Number of Listed Companies in Malaysia fiom Period 1990 to 20 I 0
Units
1200
1000
800
600
400
200
0 Years
Columnl
S lire World federation of Exchange 2010
Based on Figure above World Federal of Exchange (2010) shows the total
numb r of listed companies in Malaysia have been increasing since 1990 from 271
listed companies to 1025 companies at the year of 2006 but had slightly decrease due to
the economic crisis on 2007 The numbers of listed companies in 2008 were 976 units
and cuntinue drop to 956 in 2010
11
Figure G Market Capitalizations in Malay~ia from Period 1990 to 200--______
USD million
45000000
40000000
35000000
30000000
25000000
20000000
15000000
10000000
5000000
000
-
-
i shy
1-
-
- i-=_
- - - -~
rshy
-~ -
-~ - - I ~ - - - - I-
- - - - 1-
~ -
1990 1992 1994 1996 1998 2000 2002 2004 2006 2008 2010 Years
Source World Federation of Exchange 20 I O
figure above demonstrates the market capitalization in Malaysia from period
1990 to 20 I 0 was inconsistent World Federal of Exchange (20 10) found that the
domestic capitalization in 1990 was USD 47868 8 million and continue to increase to
USD 306 1650 million on 1996 After 1996 it started to drop significantly on the year
0[2008 to USD 1892392 million due to the post crisis on 2007
12
-------
~
Figur~ 7 Price Earnings Ratio and Gross Dividend Yield in Bursa Malay-sia from Period 1990 to 2010
11R Gross Dividend Yield (Yo)
5 =-=- _-II-_~ -50 990 1992 1994 i9---- ~===---~=J
2002 2004 2006 ------shy 2008 2010-100 - ----- Years
-150
~--=--~J
Source World Federation of Exchange 2010
Figure above shows the price earnings ratio and gross dividend yield in Bursa
Malays ia from period 1990 to 20 I 0 The movement of the price earnings ratio and gross
dividend yield were stable and average over thc year The abnormal circulllstance
happcned in 1998 because of the crisis period and this caused the price earnings ratio
droppcd drastically in negative value
bull
13

I
Pusat Khidmat MakJumat Akademik VNlVERSm MALAYSIA SARAWAK
TABLE OF CONTENTS
LIST OF TABLES IX
LIST OF FIGURES X
CHAPTER ONE INTRODUCTION
10 Introduction
11 Background of the Research
12 The Malaysian Economic 4
13 The Stock Development in Malaysia 9
14 Problem Statement 16
15 Objective 19
bmiddotmiddot bull151 General 0 ~ectlve 19
152 Specific Objectives 19
16 Significant of Study 20
17 Scope of Study 21
CHAPTER TWO LITERATURE REVIEW AND LITERATURE REVIEW
20 Introduction of Theoretical Framework 22
21 Market Efficient Hypothesis 23
22 Literature Review 24
221 Capital Asset Pricing Model 24
222 Asset Pricing Theory 27
223 Financial Ratios 29
VI
2231 Dividend Yields 29
~
223 2 Book-to-Market Ratio 31
2233 Price Earnings Ratio 32
2234 Size 33
2235 Payout Ratio 34
2236 Leverage 34
CHAPTER THREE METHODOLOGY
30 Introduction 36
31 Conceptual Framework 37
32 Research Design 38
321 Salnple 38
32 2 Model Specification~ 39
323 Data Collection 40
324 Data Analysis 40
33 Methodology 41
331 Panel Data 41
332 Dependent and Independent Variables 42
332 1 Stock Return 43
3322 Dividend yields 43
3323 Book-to-Market Ratio 44
3324 Price Earnings Ratio 44
3325 Size 45
3326 Payout Ratio 45
vii
~-
3327 Leverage 45
J
34 Hausman Test 46
35 Fixed Effect Model 48
36 Random Effect Model 49
37 Diagnostic Checking 50
CHAPTER FOUR EMPIRICAL FINDINGS AND DISCUSSIONS
40 Introduction 52
41 Statistical Descriptive 52
42 Discussion on Hausman Test Analysis 54
43 Discussion on Fixed Effect Model Analysis 56
44 Discussion on Random Effect Model Analysis 58
45 Summary of Discussion 59
CHAPTER FIVE DISCUSSION OF FINDINGS
50 Introduction 65
51 Sulnmary 65
52 Implication of Study 68
53 Recomlnendation 69
54 Limitation 70
REFERENCES 71
Vill
I
-
LIST OF TABLES
Table 1 Dependent and Independent Variables 39
Table 2 Summary Statistics for Data Used 53
Table 3 Hausman Test 55
Table 4 Fixed Effect Model 56
Table 5 Random Effect Model 58
p
IX
Figure 1
Figure 2
Figure 3
Figure 4
Figure 5
Figure 6
Figure 7
Figure 8
Figure 9
Figure 10
Figure 11
LIST OF FIGURES
Malaysia Gross Domestic Product by Sector on 2010 5
Gross Domestic Product and Annual Growth Rate from Period
2008 to 2010 6
Malaysia - Annual GOP Growth Rates by Sectors 2008 to 2010 7
Comparison the GOP in Malaysia by Sectors between 2009 and
2010 8
Number of Listed Companies in Malaysia from Period 1990 to
2010 11
Market Capitalizations in Malaysia from Period 1990 to 2010 12
Price Earnings Ratio and Gross Dividend Yield in Bursa
Malaysia from Period r990 to 2010 13
Kuala Lumpur Composite Index from Period 1990 to 2010 14
Value of Share Trading from Period 1990 to 2010 15
Conceptual Framework 45
The Summarize Findings of Financial Ratios Based on Sectors 64
x
CHAPTER ONE
INTRODUCTION
10 Introduction
This research is study on the relationship between the financial ratios and stock
return This chapter discusses the background of the research Besides that this study
also covers problem statement purpose of research significant of research and scope of
research
11 Background of Study
Nearly five decades ago study on the pred iction of stock return has been one of
the most challenging topics in financial economics A number of theoretical models
have been developed to explain stock return such as Capital Asset Pricing Model
(CAPM) Arsitrage Pricing Theory (APT) Fama and French three factor model and
others financial ratios
In the early stages a number of studies on CAPM were considerably written in
the academic research CAPM consider as one of the most important modern capital
theory which originally proposed by Sharpe (1964) The parallel) work was also
~
performed by Lintner (1965) and Black (1972) CAPM had been continuously used in
practical portfolio management and the capital equilibrium model for the academic
research guiding purpose (Koo amp Olson 2007) Besides that CAPM were widely used
to measures the powerful explanation on the expected risk and return theoretical as well
as empirical studies (Michailidis Tsopoglou Papanastasiou amp Mariola 2006 Nguyen
amp Puri 2010) However Michailidis et at (2006) found that the basic theory hypothesis
of higher risk was associated with higher return which is not supportive The early test
CAPM worked efficiently as a pred ictor of the stock return but many of studies found
anomalies in CAPM (Padney 2001)
More to the point in the early 1976s Arbitrage Pricing Theory (APT) proposed
by Stephen Ross as an alternative to replace CAPM to explain stock return The main
idea of APT was the price of security driven by number of factors There were several
dependent macroeconomics factors influenced on the asset return such as inflation rate
GOP exchange rate change in price indexes and etc (Somoye Akintoye amp Oseni
2009) The asset return were relying on the influences of macroeconomic factors and
others incident that were distinctive to the firm but the expected risk premium only
affected by the macroeconomic factors (Hohling 2009) In the efficeint market
hypothesis the informat ion change in the macroeconomic variables fully reflect the
current stock prices therefore this caused the investors to get the anomalies return in
the future stock market movment (Balvers Cosimano amp Mcdonald 1990)
2
Additionally Fama and French (1992) co written came out a new model which
was known as Fama-French three model factor Fama-French three model factor
measured by the combination of the market beta such as size Leverage book-to market
equity and price earnings ratio with the cross sectional of expected stock return (Fama
amp French 1992) The Fama-French three model factor was a simple variation in stock
return compare with CAPM due to the additional of size and book-to-market-equity in
the model (Ajili 200 I) CAPM was only using one variable (beta) to describe the stock
return but reversely Fama-French three model factor was using three variables such as
small caps book-to-market ratio and the additional of size (Fama amp French 2008)
However CAPM and Fama-French three model factor had performed a good job in
explaining the cross section of stock return (Ajlis 200 I)
As Fama (1970) recommended that an efficient capital market is all the security
prices adjust rapidly new information and the prices of an asset reflect all available
information However the stock prices wandered randomly over the time period and the
stock prices change could use predictors (Padney 200) An efficient market as a
dominate sources of allocation in order to provide an accurate signal for the firm to
make investment decision and investor can choose among securities that represent
ownership of firms activities (Brown amp KReiIlY 2009) Besides that if the abnormal
rate of return on the stock market which were lower than the normal rate of return it
means that the capital market was efficient and vice versa
3
12 The Malaysian Economic
Since Malaysia became independent on 1957 Malaysias economic had grown
rapidly Malaysia is a developing country which consists of thirteen states and three
federal territories Malaysia considers as a small country where totals landmass of
329847 square kilometres (127315 sq mi) which separated by the South China
Sea into two regions Peninsular Malaysia and Malaysia Borneo In the year of201 0 the
population exceeded 283 million (United States State Department 20 I 0)
According to the United States State Department (2010) the Malaysia annual
real gross domestic product (GOP) growth rate grew by the average of 446 per year
from period 2006 to 20FO The total Nominal GOP on 2010 is $2553 billion and the
total nominal per capital Income (GNI) is $8126 Malaysia is a country which
prosperity In the mineral natural resources and agricultural product The natural
resources are such as petroleum liquefied natural gas (LNG) tin minerals and others
where the agricultural products are such as palm oil rubber timber cocoa rice tropical
fruit fish coconut and others
The Malaysia economy is expected to grow healthy and strong by switching
from the agricultural and commodities sectors to the manufacture and export sectors
Based on the United States State Department (20 I 0) stated that the Malaysia traded on
merchandise export is 2103 billion where the traded includes electronic products
machinery liquid natural gas petroleum products and telecom equipment The recent
4
Pu at Khldm rMIIJdum tAk UNlVERsm MALAYSIA
impressive perfonnance shows the export as a main contribution in services sector to
lead the economic growth in Malaysia (Economy Watch 2010)
F 1 MImiddot G oss Do f Product b S ctor on 2010 -
change2010 ChangeSector (Q4 2010(RM billion) (20102009)Q42009)
Source Ministry of International Trade and Industry 2011
Figure above shows the Malaysias gross domestic product on 2010 was mostly
contributed by services sector which shows RM3206 billion compare to the
construction sectors which only shows RM 182 billion Nowadays Malaysia is a
middle-income country which focuses most on the services and manufacturing sector
Moreover Malaysia become one of the largest exporters of world in semiconductor
devices electric goods and as well as infonnation and communication technology (lCT)
products
5
Figure 2 Gross Domestic Product and Annual Growth Rate from Period 2008 to 2010
40
Source Ministry ofIntemational Trade and Industry 2011
Figure above represents the annual gross domestic product growth in Malaysia
from period 2008 to 2010 taken as whole was moving average but the abnonnal
circumstance happened during 2009 quarter 1 The annual gross domestic product
growth in 2008 average was RM13255 million The average amount drops to
RM13030 million in 2009 However the amount annual gross domestic product growth
in 2010 recovers and increases to RM13390 million
6
3 Malaysia - Annual GDP Growth Rates by Sectors 2008 to 2010
Source Source Ministry of Intemational Trade and Industry 2011
Figure above indicates that the GDP annual growth rates by sectors the growth
rate in services and manufacturing sectors were higher than the others sectors During
the abnormal circumstance in 2009 it shows negative value substantially as well
However in the year 2010 the GDP growth in Malaysia recovered and the
manufacturing sector remain the highest growth rate among the others sector
7
Figure 4 Comparison the GDP in Malaysia by Sectors between 2009 and 2010
I(I~ IM111AI
Source Ministry of International Trade and Industry 2011
Figure above is the comparison between the GDP by sector in Malaysia for 2009
and 2010 and it show that the total (1)P increase from RM5211billion in 2009 and
became RM5584 billion in 2010 The sectors such as services and manufacturing
sectors indicated the growth in the GDP However the sectors like mining amp quarrying
agricultural and construction indicated the percentages of decrease in the GDP growth
rate
8
13 The Stock Development in Malaysia
In 1960 the Malaysia Stock Exchange was first setting up and known as
Malayan Stock Exchange and in 1965 it was changed to Stock Exchange of Malaysia
and Singapore due to the secession of Singapore from Malaysia In 1973 the currency
interchange ability between Malaysia and Singapore had been ceased and the Stock
Exchange of Malaysia and Singapore were divided into Kuala Lumpur Stock Exchange
Bcrhad (KLSEB) and Stock Exchange of Singapore (SES) (Bursa Malaysia 20 L1)
Aller demutualize exercise on 14th April 2004 Kuala Lumpur Stock Exchange (KLSE)
was renamed to Bursa Malaysia On 18 th March 2005 Bursa Malaysia was listed on the
Main Board of Bursa Malaysia Securities Berhad (Chong amp Puah 2009) However
Bursa Malaysia currently consists of 988 companies which 637 companies on Main
Board 227 companies on Second Board and 124 companies on MESDAQ (Lee amp Lee
2008)
Moreover Capital market is a place for investor and institute trade financial
securities in order to raise funds Thus the market where securities traded is known as
Sccurities Market it comprised of both the primary and secondary markets The primary
market is known as new issue market where it deals with new issue securities in
Malaysia whereas the secondary market focuses on the trading of existing securities and
it often termed as stock exchange market According to Lee and Lee (2008) generally
the investor desire to earn a positive return in their investment The return of the shares
9
I
trade for the short term investor is capital gain and the dividend is for the long term
in cstor
However the stock market in Malaysia should always be in the range o[
effic k ncy This is because the efficient capital market assumes that an initial premise of
an fftcient market request that a large number of profit maximizing participant analyze
and va lue securities Besides that the new information regarding the securities comes to
the market in a random fashion However the buyer and seller decision of all those
profit maximizing investor who adjust security prices rapidly reflect the effect of new
intormation (Brown amp Reilly 2009)
In Malaysia therc are no practices on the tax loss-selling hypothesis therefore
there arc no capital gain taxes for the residents or non-residents The stock return
seasonality in Malaysia indicates that stock market in Malaysia is not efficient in
reflecting the information I-Ience investor can spend time in getting higher returns
Generally the efficient market hypothesis (EMH) stated that the stock price and return
are not able to be predicted by using the past price information However the
seasonality effect presence and this implies the efficiency market and negates the weak
form oCthe efficiency market hypothesis (Padney 2004)
The Malaysian capital market is focus on the weak form efficiency market and
risk of return relationship The weak form efficiency markets where the prices reflect all
the historical market trading information Most of the tests show this information unable
10
to generate abnormal return (Nasir Mohamad amp Hamid 1998) Based on Tan (2006)
Ma laysia stock index futures market does not subscribe to random walk hypothesis but
stock return are predictable
Figure 5 Number of Listed Companies in Malaysia fiom Period 1990 to 20 I 0
Units
1200
1000
800
600
400
200
0 Years
Columnl
S lire World federation of Exchange 2010
Based on Figure above World Federal of Exchange (2010) shows the total
numb r of listed companies in Malaysia have been increasing since 1990 from 271
listed companies to 1025 companies at the year of 2006 but had slightly decrease due to
the economic crisis on 2007 The numbers of listed companies in 2008 were 976 units
and cuntinue drop to 956 in 2010
11
Figure G Market Capitalizations in Malay~ia from Period 1990 to 200--______
USD million
45000000
40000000
35000000
30000000
25000000
20000000
15000000
10000000
5000000
000
-
-
i shy
1-
-
- i-=_
- - - -~
rshy
-~ -
-~ - - I ~ - - - - I-
- - - - 1-
~ -
1990 1992 1994 1996 1998 2000 2002 2004 2006 2008 2010 Years
Source World Federation of Exchange 20 I O
figure above demonstrates the market capitalization in Malaysia from period
1990 to 20 I 0 was inconsistent World Federal of Exchange (20 10) found that the
domestic capitalization in 1990 was USD 47868 8 million and continue to increase to
USD 306 1650 million on 1996 After 1996 it started to drop significantly on the year
0[2008 to USD 1892392 million due to the post crisis on 2007
12
-------
~
Figur~ 7 Price Earnings Ratio and Gross Dividend Yield in Bursa Malay-sia from Period 1990 to 2010
11R Gross Dividend Yield (Yo)
5 =-=- _-II-_~ -50 990 1992 1994 i9---- ~===---~=J
2002 2004 2006 ------shy 2008 2010-100 - ----- Years
-150
~--=--~J
Source World Federation of Exchange 2010
Figure above shows the price earnings ratio and gross dividend yield in Bursa
Malays ia from period 1990 to 20 I 0 The movement of the price earnings ratio and gross
dividend yield were stable and average over thc year The abnormal circulllstance
happcned in 1998 because of the crisis period and this caused the price earnings ratio
droppcd drastically in negative value
bull
13

I
-
LIST OF TABLES
Table 1 Dependent and Independent Variables 39
Table 2 Summary Statistics for Data Used 53
Table 3 Hausman Test 55
Table 4 Fixed Effect Model 56
Table 5 Random Effect Model 58
p
IX
Figure 1
Figure 2
Figure 3
Figure 4
Figure 5
Figure 6
Figure 7
Figure 8
Figure 9
Figure 10
Figure 11
LIST OF FIGURES
Malaysia Gross Domestic Product by Sector on 2010 5
Gross Domestic Product and Annual Growth Rate from Period
2008 to 2010 6
Malaysia - Annual GOP Growth Rates by Sectors 2008 to 2010 7
Comparison the GOP in Malaysia by Sectors between 2009 and
2010 8
Number of Listed Companies in Malaysia from Period 1990 to
2010 11
Market Capitalizations in Malaysia from Period 1990 to 2010 12
Price Earnings Ratio and Gross Dividend Yield in Bursa
Malaysia from Period r990 to 2010 13
Kuala Lumpur Composite Index from Period 1990 to 2010 14
Value of Share Trading from Period 1990 to 2010 15
Conceptual Framework 45
The Summarize Findings of Financial Ratios Based on Sectors 64
x
CHAPTER ONE
INTRODUCTION
10 Introduction
This research is study on the relationship between the financial ratios and stock
return This chapter discusses the background of the research Besides that this study
also covers problem statement purpose of research significant of research and scope of
research
11 Background of Study
Nearly five decades ago study on the pred iction of stock return has been one of
the most challenging topics in financial economics A number of theoretical models
have been developed to explain stock return such as Capital Asset Pricing Model
(CAPM) Arsitrage Pricing Theory (APT) Fama and French three factor model and
others financial ratios
In the early stages a number of studies on CAPM were considerably written in
the academic research CAPM consider as one of the most important modern capital
theory which originally proposed by Sharpe (1964) The parallel) work was also
~
performed by Lintner (1965) and Black (1972) CAPM had been continuously used in
practical portfolio management and the capital equilibrium model for the academic
research guiding purpose (Koo amp Olson 2007) Besides that CAPM were widely used
to measures the powerful explanation on the expected risk and return theoretical as well
as empirical studies (Michailidis Tsopoglou Papanastasiou amp Mariola 2006 Nguyen
amp Puri 2010) However Michailidis et at (2006) found that the basic theory hypothesis
of higher risk was associated with higher return which is not supportive The early test
CAPM worked efficiently as a pred ictor of the stock return but many of studies found
anomalies in CAPM (Padney 2001)
More to the point in the early 1976s Arbitrage Pricing Theory (APT) proposed
by Stephen Ross as an alternative to replace CAPM to explain stock return The main
idea of APT was the price of security driven by number of factors There were several
dependent macroeconomics factors influenced on the asset return such as inflation rate
GOP exchange rate change in price indexes and etc (Somoye Akintoye amp Oseni
2009) The asset return were relying on the influences of macroeconomic factors and
others incident that were distinctive to the firm but the expected risk premium only
affected by the macroeconomic factors (Hohling 2009) In the efficeint market
hypothesis the informat ion change in the macroeconomic variables fully reflect the
current stock prices therefore this caused the investors to get the anomalies return in
the future stock market movment (Balvers Cosimano amp Mcdonald 1990)
2
Additionally Fama and French (1992) co written came out a new model which
was known as Fama-French three model factor Fama-French three model factor
measured by the combination of the market beta such as size Leverage book-to market
equity and price earnings ratio with the cross sectional of expected stock return (Fama
amp French 1992) The Fama-French three model factor was a simple variation in stock
return compare with CAPM due to the additional of size and book-to-market-equity in
the model (Ajili 200 I) CAPM was only using one variable (beta) to describe the stock
return but reversely Fama-French three model factor was using three variables such as
small caps book-to-market ratio and the additional of size (Fama amp French 2008)
However CAPM and Fama-French three model factor had performed a good job in
explaining the cross section of stock return (Ajlis 200 I)
As Fama (1970) recommended that an efficient capital market is all the security
prices adjust rapidly new information and the prices of an asset reflect all available
information However the stock prices wandered randomly over the time period and the
stock prices change could use predictors (Padney 200) An efficient market as a
dominate sources of allocation in order to provide an accurate signal for the firm to
make investment decision and investor can choose among securities that represent
ownership of firms activities (Brown amp KReiIlY 2009) Besides that if the abnormal
rate of return on the stock market which were lower than the normal rate of return it
means that the capital market was efficient and vice versa
3
12 The Malaysian Economic
Since Malaysia became independent on 1957 Malaysias economic had grown
rapidly Malaysia is a developing country which consists of thirteen states and three
federal territories Malaysia considers as a small country where totals landmass of
329847 square kilometres (127315 sq mi) which separated by the South China
Sea into two regions Peninsular Malaysia and Malaysia Borneo In the year of201 0 the
population exceeded 283 million (United States State Department 20 I 0)
According to the United States State Department (2010) the Malaysia annual
real gross domestic product (GOP) growth rate grew by the average of 446 per year
from period 2006 to 20FO The total Nominal GOP on 2010 is $2553 billion and the
total nominal per capital Income (GNI) is $8126 Malaysia is a country which
prosperity In the mineral natural resources and agricultural product The natural
resources are such as petroleum liquefied natural gas (LNG) tin minerals and others
where the agricultural products are such as palm oil rubber timber cocoa rice tropical
fruit fish coconut and others
The Malaysia economy is expected to grow healthy and strong by switching
from the agricultural and commodities sectors to the manufacture and export sectors
Based on the United States State Department (20 I 0) stated that the Malaysia traded on
merchandise export is 2103 billion where the traded includes electronic products
machinery liquid natural gas petroleum products and telecom equipment The recent
4
Pu at Khldm rMIIJdum tAk UNlVERsm MALAYSIA
impressive perfonnance shows the export as a main contribution in services sector to
lead the economic growth in Malaysia (Economy Watch 2010)
F 1 MImiddot G oss Do f Product b S ctor on 2010 -
change2010 ChangeSector (Q4 2010(RM billion) (20102009)Q42009)
Source Ministry of International Trade and Industry 2011
Figure above shows the Malaysias gross domestic product on 2010 was mostly
contributed by services sector which shows RM3206 billion compare to the
construction sectors which only shows RM 182 billion Nowadays Malaysia is a
middle-income country which focuses most on the services and manufacturing sector
Moreover Malaysia become one of the largest exporters of world in semiconductor
devices electric goods and as well as infonnation and communication technology (lCT)
products
5
Figure 2 Gross Domestic Product and Annual Growth Rate from Period 2008 to 2010
40
Source Ministry ofIntemational Trade and Industry 2011
Figure above represents the annual gross domestic product growth in Malaysia
from period 2008 to 2010 taken as whole was moving average but the abnonnal
circumstance happened during 2009 quarter 1 The annual gross domestic product
growth in 2008 average was RM13255 million The average amount drops to
RM13030 million in 2009 However the amount annual gross domestic product growth
in 2010 recovers and increases to RM13390 million
6
3 Malaysia - Annual GDP Growth Rates by Sectors 2008 to 2010
Source Source Ministry of Intemational Trade and Industry 2011
Figure above indicates that the GDP annual growth rates by sectors the growth
rate in services and manufacturing sectors were higher than the others sectors During
the abnormal circumstance in 2009 it shows negative value substantially as well
However in the year 2010 the GDP growth in Malaysia recovered and the
manufacturing sector remain the highest growth rate among the others sector
7
Figure 4 Comparison the GDP in Malaysia by Sectors between 2009 and 2010
I(I~ IM111AI
Source Ministry of International Trade and Industry 2011
Figure above is the comparison between the GDP by sector in Malaysia for 2009
and 2010 and it show that the total (1)P increase from RM5211billion in 2009 and
became RM5584 billion in 2010 The sectors such as services and manufacturing
sectors indicated the growth in the GDP However the sectors like mining amp quarrying
agricultural and construction indicated the percentages of decrease in the GDP growth
rate
8
13 The Stock Development in Malaysia
In 1960 the Malaysia Stock Exchange was first setting up and known as
Malayan Stock Exchange and in 1965 it was changed to Stock Exchange of Malaysia
and Singapore due to the secession of Singapore from Malaysia In 1973 the currency
interchange ability between Malaysia and Singapore had been ceased and the Stock
Exchange of Malaysia and Singapore were divided into Kuala Lumpur Stock Exchange
Bcrhad (KLSEB) and Stock Exchange of Singapore (SES) (Bursa Malaysia 20 L1)
Aller demutualize exercise on 14th April 2004 Kuala Lumpur Stock Exchange (KLSE)
was renamed to Bursa Malaysia On 18 th March 2005 Bursa Malaysia was listed on the
Main Board of Bursa Malaysia Securities Berhad (Chong amp Puah 2009) However
Bursa Malaysia currently consists of 988 companies which 637 companies on Main
Board 227 companies on Second Board and 124 companies on MESDAQ (Lee amp Lee
2008)
Moreover Capital market is a place for investor and institute trade financial
securities in order to raise funds Thus the market where securities traded is known as
Sccurities Market it comprised of both the primary and secondary markets The primary
market is known as new issue market where it deals with new issue securities in
Malaysia whereas the secondary market focuses on the trading of existing securities and
it often termed as stock exchange market According to Lee and Lee (2008) generally
the investor desire to earn a positive return in their investment The return of the shares
9
I
trade for the short term investor is capital gain and the dividend is for the long term
in cstor
However the stock market in Malaysia should always be in the range o[
effic k ncy This is because the efficient capital market assumes that an initial premise of
an fftcient market request that a large number of profit maximizing participant analyze
and va lue securities Besides that the new information regarding the securities comes to
the market in a random fashion However the buyer and seller decision of all those
profit maximizing investor who adjust security prices rapidly reflect the effect of new
intormation (Brown amp Reilly 2009)
In Malaysia therc are no practices on the tax loss-selling hypothesis therefore
there arc no capital gain taxes for the residents or non-residents The stock return
seasonality in Malaysia indicates that stock market in Malaysia is not efficient in
reflecting the information I-Ience investor can spend time in getting higher returns
Generally the efficient market hypothesis (EMH) stated that the stock price and return
are not able to be predicted by using the past price information However the
seasonality effect presence and this implies the efficiency market and negates the weak
form oCthe efficiency market hypothesis (Padney 2004)
The Malaysian capital market is focus on the weak form efficiency market and
risk of return relationship The weak form efficiency markets where the prices reflect all
the historical market trading information Most of the tests show this information unable
10
to generate abnormal return (Nasir Mohamad amp Hamid 1998) Based on Tan (2006)
Ma laysia stock index futures market does not subscribe to random walk hypothesis but
stock return are predictable
Figure 5 Number of Listed Companies in Malaysia fiom Period 1990 to 20 I 0
Units
1200
1000
800
600
400
200
0 Years
Columnl
S lire World federation of Exchange 2010
Based on Figure above World Federal of Exchange (2010) shows the total
numb r of listed companies in Malaysia have been increasing since 1990 from 271
listed companies to 1025 companies at the year of 2006 but had slightly decrease due to
the economic crisis on 2007 The numbers of listed companies in 2008 were 976 units
and cuntinue drop to 956 in 2010
11
Figure G Market Capitalizations in Malay~ia from Period 1990 to 200--______
USD million
45000000
40000000
35000000
30000000
25000000
20000000
15000000
10000000
5000000
000
-
-
i shy
1-
-
- i-=_
- - - -~
rshy
-~ -
-~ - - I ~ - - - - I-
- - - - 1-
~ -
1990 1992 1994 1996 1998 2000 2002 2004 2006 2008 2010 Years
Source World Federation of Exchange 20 I O
figure above demonstrates the market capitalization in Malaysia from period
1990 to 20 I 0 was inconsistent World Federal of Exchange (20 10) found that the
domestic capitalization in 1990 was USD 47868 8 million and continue to increase to
USD 306 1650 million on 1996 After 1996 it started to drop significantly on the year
0[2008 to USD 1892392 million due to the post crisis on 2007
12
-------
~
Figur~ 7 Price Earnings Ratio and Gross Dividend Yield in Bursa Malay-sia from Period 1990 to 2010
11R Gross Dividend Yield (Yo)
5 =-=- _-II-_~ -50 990 1992 1994 i9---- ~===---~=J
2002 2004 2006 ------shy 2008 2010-100 - ----- Years
-150
~--=--~J
Source World Federation of Exchange 2010
Figure above shows the price earnings ratio and gross dividend yield in Bursa
Malays ia from period 1990 to 20 I 0 The movement of the price earnings ratio and gross
dividend yield were stable and average over thc year The abnormal circulllstance
happcned in 1998 because of the crisis period and this caused the price earnings ratio
droppcd drastically in negative value
bull
13

~
performed by Lintner (1965) and Black (1972) CAPM had been continuously used in
practical portfolio management and the capital equilibrium model for the academic
research guiding purpose (Koo amp Olson 2007) Besides that CAPM were widely used
to measures the powerful explanation on the expected risk and return theoretical as well
as empirical studies (Michailidis Tsopoglou Papanastasiou amp Mariola 2006 Nguyen
amp Puri 2010) However Michailidis et at (2006) found that the basic theory hypothesis
of higher risk was associated with higher return which is not supportive The early test
CAPM worked efficiently as a pred ictor of the stock return but many of studies found
anomalies in CAPM (Padney 2001)
More to the point in the early 1976s Arbitrage Pricing Theory (APT) proposed
by Stephen Ross as an alternative to replace CAPM to explain stock return The main
idea of APT was the price of security driven by number of factors There were several
dependent macroeconomics factors influenced on the asset return such as inflation rate
GOP exchange rate change in price indexes and etc (Somoye Akintoye amp Oseni
2009) The asset return were relying on the influences of macroeconomic factors and
others incident that were distinctive to the firm but the expected risk premium only
affected by the macroeconomic factors (Hohling 2009) In the efficeint market
hypothesis the informat ion change in the macroeconomic variables fully reflect the
current stock prices therefore this caused the investors to get the anomalies return in
the future stock market movment (Balvers Cosimano amp Mcdonald 1990)
2
Additionally Fama and French (1992) co written came out a new model which
was known as Fama-French three model factor Fama-French three model factor
measured by the combination of the market beta such as size Leverage book-to market
equity and price earnings ratio with the cross sectional of expected stock return (Fama
amp French 1992) The Fama-French three model factor was a simple variation in stock
return compare with CAPM due to the additional of size and book-to-market-equity in
the model (Ajili 200 I) CAPM was only using one variable (beta) to describe the stock
return but reversely Fama-French three model factor was using three variables such as
small caps book-to-market ratio and the additional of size (Fama amp French 2008)
However CAPM and Fama-French three model factor had performed a good job in
explaining the cross section of stock return (Ajlis 200 I)
As Fama (1970) recommended that an efficient capital market is all the security
prices adjust rapidly new information and the prices of an asset reflect all available
information However the stock prices wandered randomly over the time period and the
stock prices change could use predictors (Padney 200) An efficient market as a
dominate sources of allocation in order to provide an accurate signal for the firm to
make investment decision and investor can choose among securities that represent
ownership of firms activities (Brown amp KReiIlY 2009) Besides that if the abnormal
rate of return on the stock market which were lower than the normal rate of return it
means that the capital market was efficient and vice versa
3
12 The Malaysian Economic
Since Malaysia became independent on 1957 Malaysias economic had grown
rapidly Malaysia is a developing country which consists of thirteen states and three
federal territories Malaysia considers as a small country where totals landmass of
329847 square kilometres (127315 sq mi) which separated by the South China
Sea into two regions Peninsular Malaysia and Malaysia Borneo In the year of201 0 the
population exceeded 283 million (United States State Department 20 I 0)
According to the United States State Department (2010) the Malaysia annual
real gross domestic product (GOP) growth rate grew by the average of 446 per year
from period 2006 to 20FO The total Nominal GOP on 2010 is $2553 billion and the
total nominal per capital Income (GNI) is $8126 Malaysia is a country which
prosperity In the mineral natural resources and agricultural product The natural
resources are such as petroleum liquefied natural gas (LNG) tin minerals and others
where the agricultural products are such as palm oil rubber timber cocoa rice tropical
fruit fish coconut and others
The Malaysia economy is expected to grow healthy and strong by switching
from the agricultural and commodities sectors to the manufacture and export sectors
Based on the United States State Department (20 I 0) stated that the Malaysia traded on
merchandise export is 2103 billion where the traded includes electronic products
machinery liquid natural gas petroleum products and telecom equipment The recent
4
Pu at Khldm rMIIJdum tAk UNlVERsm MALAYSIA
impressive perfonnance shows the export as a main contribution in services sector to
lead the economic growth in Malaysia (Economy Watch 2010)
F 1 MImiddot G oss Do f Product b S ctor on 2010 -
change2010 ChangeSector (Q4 2010(RM billion) (20102009)Q42009)
Source Ministry of International Trade and Industry 2011
Figure above shows the Malaysias gross domestic product on 2010 was mostly
contributed by services sector which shows RM3206 billion compare to the
construction sectors which only shows RM 182 billion Nowadays Malaysia is a
middle-income country which focuses most on the services and manufacturing sector
Moreover Malaysia become one of the largest exporters of world in semiconductor
devices electric goods and as well as infonnation and communication technology (lCT)
products
5
Figure 2 Gross Domestic Product and Annual Growth Rate from Period 2008 to 2010
40
Source Ministry ofIntemational Trade and Industry 2011
Figure above represents the annual gross domestic product growth in Malaysia
from period 2008 to 2010 taken as whole was moving average but the abnonnal
circumstance happened during 2009 quarter 1 The annual gross domestic product
growth in 2008 average was RM13255 million The average amount drops to
RM13030 million in 2009 However the amount annual gross domestic product growth
in 2010 recovers and increases to RM13390 million
6
3 Malaysia - Annual GDP Growth Rates by Sectors 2008 to 2010
Source Source Ministry of Intemational Trade and Industry 2011
Figure above indicates that the GDP annual growth rates by sectors the growth
rate in services and manufacturing sectors were higher than the others sectors During
the abnormal circumstance in 2009 it shows negative value substantially as well
However in the year 2010 the GDP growth in Malaysia recovered and the
manufacturing sector remain the highest growth rate among the others sector
7
Figure 4 Comparison the GDP in Malaysia by Sectors between 2009 and 2010
I(I~ IM111AI
Source Ministry of International Trade and Industry 2011
Figure above is the comparison between the GDP by sector in Malaysia for 2009
and 2010 and it show that the total (1)P increase from RM5211billion in 2009 and
became RM5584 billion in 2010 The sectors such as services and manufacturing
sectors indicated the growth in the GDP However the sectors like mining amp quarrying
agricultural and construction indicated the percentages of decrease in the GDP growth
rate
8
13 The Stock Development in Malaysia
In 1960 the Malaysia Stock Exchange was first setting up and known as
Malayan Stock Exchange and in 1965 it was changed to Stock Exchange of Malaysia
and Singapore due to the secession of Singapore from Malaysia In 1973 the currency
interchange ability between Malaysia and Singapore had been ceased and the Stock
Exchange of Malaysia and Singapore were divided into Kuala Lumpur Stock Exchange
Bcrhad (KLSEB) and Stock Exchange of Singapore (SES) (Bursa Malaysia 20 L1)
Aller demutualize exercise on 14th April 2004 Kuala Lumpur Stock Exchange (KLSE)
was renamed to Bursa Malaysia On 18 th March 2005 Bursa Malaysia was listed on the
Main Board of Bursa Malaysia Securities Berhad (Chong amp Puah 2009) However
Bursa Malaysia currently consists of 988 companies which 637 companies on Main
Board 227 companies on Second Board and 124 companies on MESDAQ (Lee amp Lee
2008)
Moreover Capital market is a place for investor and institute trade financial
securities in order to raise funds Thus the market where securities traded is known as
Sccurities Market it comprised of both the primary and secondary markets The primary
market is known as new issue market where it deals with new issue securities in
Malaysia whereas the secondary market focuses on the trading of existing securities and
it often termed as stock exchange market According to Lee and Lee (2008) generally
the investor desire to earn a positive return in their investment The return of the shares
9
I
trade for the short term investor is capital gain and the dividend is for the long term
in cstor
However the stock market in Malaysia should always be in the range o[
effic k ncy This is because the efficient capital market assumes that an initial premise of
an fftcient market request that a large number of profit maximizing participant analyze
and va lue securities Besides that the new information regarding the securities comes to
the market in a random fashion However the buyer and seller decision of all those
profit maximizing investor who adjust security prices rapidly reflect the effect of new
intormation (Brown amp Reilly 2009)
In Malaysia therc are no practices on the tax loss-selling hypothesis therefore
there arc no capital gain taxes for the residents or non-residents The stock return
seasonality in Malaysia indicates that stock market in Malaysia is not efficient in
reflecting the information I-Ience investor can spend time in getting higher returns
Generally the efficient market hypothesis (EMH) stated that the stock price and return
are not able to be predicted by using the past price information However the
seasonality effect presence and this implies the efficiency market and negates the weak
form oCthe efficiency market hypothesis (Padney 2004)
The Malaysian capital market is focus on the weak form efficiency market and
risk of return relationship The weak form efficiency markets where the prices reflect all
the historical market trading information Most of the tests show this information unable
10
to generate abnormal return (Nasir Mohamad amp Hamid 1998) Based on Tan (2006)
Ma laysia stock index futures market does not subscribe to random walk hypothesis but
stock return are predictable
Figure 5 Number of Listed Companies in Malaysia fiom Period 1990 to 20 I 0
Units
1200
1000
800
600
400
200
0 Years
Columnl
S lire World federation of Exchange 2010
Based on Figure above World Federal of Exchange (2010) shows the total
numb r of listed companies in Malaysia have been increasing since 1990 from 271
listed companies to 1025 companies at the year of 2006 but had slightly decrease due to
the economic crisis on 2007 The numbers of listed companies in 2008 were 976 units
and cuntinue drop to 956 in 2010
11
Figure G Market Capitalizations in Malay~ia from Period 1990 to 200--______
USD million
45000000
40000000
35000000
30000000
25000000
20000000
15000000
10000000
5000000
000
-
-
i shy
1-
-
- i-=_
- - - -~
rshy
-~ -
-~ - - I ~ - - - - I-
- - - - 1-
~ -
1990 1992 1994 1996 1998 2000 2002 2004 2006 2008 2010 Years
Source World Federation of Exchange 20 I O
figure above demonstrates the market capitalization in Malaysia from period
1990 to 20 I 0 was inconsistent World Federal of Exchange (20 10) found that the
domestic capitalization in 1990 was USD 47868 8 million and continue to increase to
USD 306 1650 million on 1996 After 1996 it started to drop significantly on the year
0[2008 to USD 1892392 million due to the post crisis on 2007
12
-------
~
Figur~ 7 Price Earnings Ratio and Gross Dividend Yield in Bursa Malay-sia from Period 1990 to 2010
11R Gross Dividend Yield (Yo)
5 =-=- _-II-_~ -50 990 1992 1994 i9---- ~===---~=J
2002 2004 2006 ------shy 2008 2010-100 - ----- Years
-150
~--=--~J
Source World Federation of Exchange 2010
Figure above shows the price earnings ratio and gross dividend yield in Bursa
Malays ia from period 1990 to 20 I 0 The movement of the price earnings ratio and gross
dividend yield were stable and average over thc year The abnormal circulllstance
happcned in 1998 because of the crisis period and this caused the price earnings ratio
droppcd drastically in negative value
bull
13
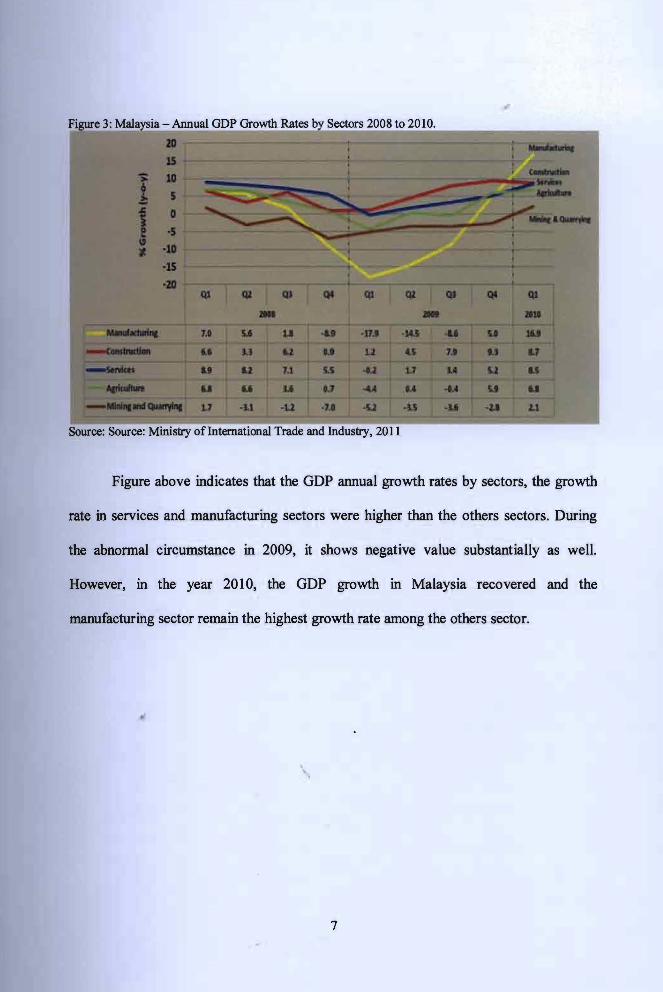