predictability of stock returns using financial ratios
TRANSCRIPT
Kelaniya Journal of Management, Vol. 4 No. 2, July-December 2015
44
Predictability of Stock Returns Using Financial Ratios: Empirical
Evidence from Colombo Stock Exchange
A. A. V. I. Wijesundera, D. A. S. Weerasinghe, T. P. C. R. Krishna,
M. M. D. Gunawardena* and H. R. I. Peiris
Faculty of Business, Sri Lanka Institute of Information Technology, Sri Lanka
Abstract
The purpose of this research is to examine the ability of the historical financial information in
constructing a resilient value portfolio for investors by predicting stock returns in the Sri Lankan
context. One of the most imperative and interesting phenomena for the investors and the analysts
would be the stock returns from the financial markets. The present study will aim at mainly to
assess correlation between financial ratios and the predictability of stock returns for companies
listed on the Colombo Stock Exchange. This study applies ordinary least squares (OLS)
techniques to estimate the predictive regressions in form of simple and multiple models of panel
data sets. For the current study, 60 listed companies were selected and 10 years of data has been
analyzed from 2004 to 2013. The results highlighted that ROE, EPS and MV/BV have a
significant positive relationship with the stock return which is followed by a simple equation to
predict the future stock returns. Hence the investors should consider these ratios of the
companies and movement in these ratios in selecting a resilient portfolio to invest.
Keywords: Financial ratios, Stock Return, Colombo Stock Exchange
1. Introduction
Stock market plays a substantial role in the economic growth of a country. Economic
growth of each country is influenced by the money and capital markets in the economy
of each country. Horrigan (1995) has stated that the most significant source that can
give discernibility to investors about the company is the financial statement and the
ratios that play a significant role in the market over five years or more. However as per
the Sri Lankan context valuation multiples and macro-economic factors such as impact
of economic factors, political stability, attractiveness of the industry, company’s
position in the industry are well related factors which affect the stock returns. Today the
prediction of stock returns has been very important from the investor’s point of view.
This empirical study specifically identifies financial ratios, which are known as the
predictors of stock returns in the share market, to test the stock return predictability on
the Sri Lankan market. The financial ratios include the Dividend yield, Price to earnings
ratio [P/E ratio], The ratio of book value to market value [B/M], Return on equity,
Earnings per share, Earnings Yield which are most useful and effective on stock return
predictability in order to cover a wide range of predictions which have been used by all
most all the previous researches. Investors seek those financial measures like financial
ratio analysis that have significant impact on deciding the winning portfolio.
Kelaniya Journal of Management, Vol. 4 No. 2, July-December 2015
45
In our research it has been observed that it is difficult to predict stock returns solely
based on the historical financial information because stock prices evolve. Therefore
foretelling 100% accuracy is impossible. With the road of time our intention is to find
out most accurate variables for predicting stock returns in Sri Lanka. We have
investigated above five investor and profitability ratios to determine whether they
predict stock returns and on the grounds of their applicable regression models.
Statistically there is a significant relationship between stock return and ROE, EPS and
MV/BV which gained ninety five percent of confidence level. However it’s probable
that majority of the investors in Sri Lankan stock market are followed by speculation
and other macro-economic factors such as political stability, attractiveness of the
industry, economic factors etc.
2. Literature Review
Basu (1977) in a time period from April 1957 to March 1971 showed that in addition to
the size of the company and the stock's beta, price to earnings ratio also plays a great
role in explaining average returns. He observed those stocks with a high ratio of profit
to sales have significantly higher returns than stocks with low ratio of profit to sales and
changes in Beta cannot explain stock return changes so that even after controlling Beta,
stocks with a lower ratio of profit to sales have higher returns than stocks with a high
ratio of profit to sales.
James Horrigan (1995) in his research has proved through an empirical study that ratios
and factors play a significant role in the market over 5 years or more. He also cites the
use of Price Earnings Ratio (PE Ratio) and Earnings per Share (EPS) as indicator ratios.
He states that there was a trend in the early 60’s, which was an increase in EPS providing
a proper reasoning for the bullish market which existed at that time.
It has also been proved that the dividend yield has the ability to confine expected return
and expectation about growth in dividend yield so dividend yield is a good predictor of
stock return (Campbell & Shiller, 1988).
It has been found that in Japanese market fundamental variables like dividend yield,
price to earnings ratio, book to market ratio and firm’s size have significant impact on
expected earning/returns of stocks (Chan, et al., 1991).
Kothari & Shanken (1997) in their research found out for the US market where Dividend
yield and ratio of book value to market value [B/M], have an association to the expected
real return over a period of 65years (1926-1991).
Examination of the association between financial ratios and stock returns for 50
industrial firms traded in the French stock market confirms that the financial statement
information helps in predicting stock returns. (Martinez, 1999). Nissim & Penman
Kelaniya Journal of Management, Vol. 4 No. 2, July-December 2015
46
(2001) provide rigorous evidence on the utility of the accounting ratios in projecting
future streams of abnormal earnings.
A study done by Hjalmarsson (2004) focused on predicting the Global stock returns.
The study was to analyze 20,000 monthly observations form forty international stock
markets. And showed that dividend yield and price to earnings ratio has little power of
predictability. Liolen (2004) examined the predictability of stock returns using financial
ratios including dividend yield, the book value to the market value, and profit to sales.
He found that dividend yield has more power to predict stock returns than other
variables.
Christos , et al., (2005) examined the use of financial ratios to predict stock returns
through linear regression and the Garch Test in the Greek Stock Exchange. The
comparative results of time series models and the Garch testing models indicated that
the ECM-GARCH Technique shows the correlations between variables more
effectively. Kheradyar (2011) conducted a study in the Malaysian stock exchange which
revealed the predictive power of Book Value to Market value is higher than other ratios.
According to A. Schrimpf (2010) there is significant economic repercussion of the
existence of stock return predictability. Kheradyar et al, (2011), "The Analytics of
Economic Time Series”, states that in stocks market share prices move randomly.
However, investors are not necessarily concerned with a company's financial situation
unless they can profit from it. Therefore, investors rely on ratios that show a company
can provide them with future returns. Historically, the most important of these are
earnings per share and the dividend payout ratio. Lewellan, (2004) himself,
hypothesizes that other factors aside from traditional financial ratios, such as integrity
and ethical values affect stock price. However, his study shows that even in an economy
plagued by scandal, financial ratios are still good indicators of what a company's stock
price will be in the future.
Taani and Banykhaled (2011) discovered that there is a positive and significant
relationship in between market value, debt ratio, operating cash flows and return on
equity with earnings per share following a study on the effect of ratios, firm size and
cash flow from operating activities on EPS. However a relationship between firm size
and EPS was not observed.
The previous researches that have been gathered were able to cater instincts to decide a
pipeline for this research to analyze the gap which is specifically involved with the stock
market in Sri Lanka and assisted the researches to decide crucial factors which is to be
incorporated into the analysis.
Kelaniya Journal of Management, Vol. 4 No. 2, July-December 2015
47
3. Methodology
The study was conducted over a ten year period from early 2004 to 2013. In this case,
‘Stratified sampling’ method has been utilized where the researchers’ have formed strata
based on shared attributes in selection of companies, which consider as the
representation of the population. For the current study, 60 listed companies will be
selected out of 298 listed companies in Colombo Stock Exchange in which 10 years
data were analyzed. Certain screening criteria’s were applied for companies to be
selected as the sample. First the company must be listed on the Colombo stock exchange
before 1st January 2003. Second the company stock must not be delisted during the
period of study. Third, the data must be available for all sample firms and variables.
Fourth, the top 60 companies will be selected based on their market capitalization.
The most relevant five ratios have been selected from the entire pool of investor ratios
by judgment as the independent variables. Simultaneous descriptive statistical analyses
have been utilized since it helps to analyze all kinds of accounting information.
4. Measurement of Variables
In this study, stock returns (SRit) in the companies listed on the Colombo Stock
Exchange are selected as the dependent variable. Where, SRit is the return on ordinary
stock during the period t.
4.1 Stock Returns
This research has used stock return as dependent variable. Stock return is measured by
adding capital gain along with dividend per share. Following is the formula for stock
returns.
SRit = DPs + capital gain
The independent variables include Dividend yield, Price to earnings ratio [P/E ratio],
the ratio of book value to market value [B/M], Return on equity, Earnings per share.
The relationship between Dividend yield ratio, Price to earnings ratio [P/E ratio], Return
on equity, Earnings per share and the ratio of book value to market value [B/M] to stock
returns in the Colombo Stock Exchange is observed in the present study.
4.2 Return on Equity
Return on equity is obtained by dividing net income by the equity shares. It measures
the rate of return on the shareholders’ equity of the common stock owners. ROE
demonstrates how well a company utilizes investment funds to generate earnings
growth. It basically involves in measuring the efficiency at making profits from net
assets (Shareholders’ equity).
Kelaniya Journal of Management, Vol. 4 No. 2, July-December 2015
48
4.3 Ratio of Book Value to Market Value
The ratio of book value to market value is derived by dividing market price per share
by the book value per share. A ratio applied to discover the value of a company by
comparing the book value of a company to its market price. Book value is figured out
by considering the company's historical cost, or accounting value. Market value is
discovered in the stock market from its market capitalization. This indicates the market
price per share in terms of the book value of equity. A price to Book Value ratio of
lower than the industry average will reflect that the company’s management and the
performance of the company might have some problems or a good company with less
investor attention.
4.4 Earnings per Share
Earnings per share is obtained by the dividing the profit after preference dividend by
the weighted average common shares. EPS is the monetary value of each earnings per
each share which is outstanding. It serves as an indicator of the profitability of the
company. It is regarded as the single most vital variable in determining a share price.
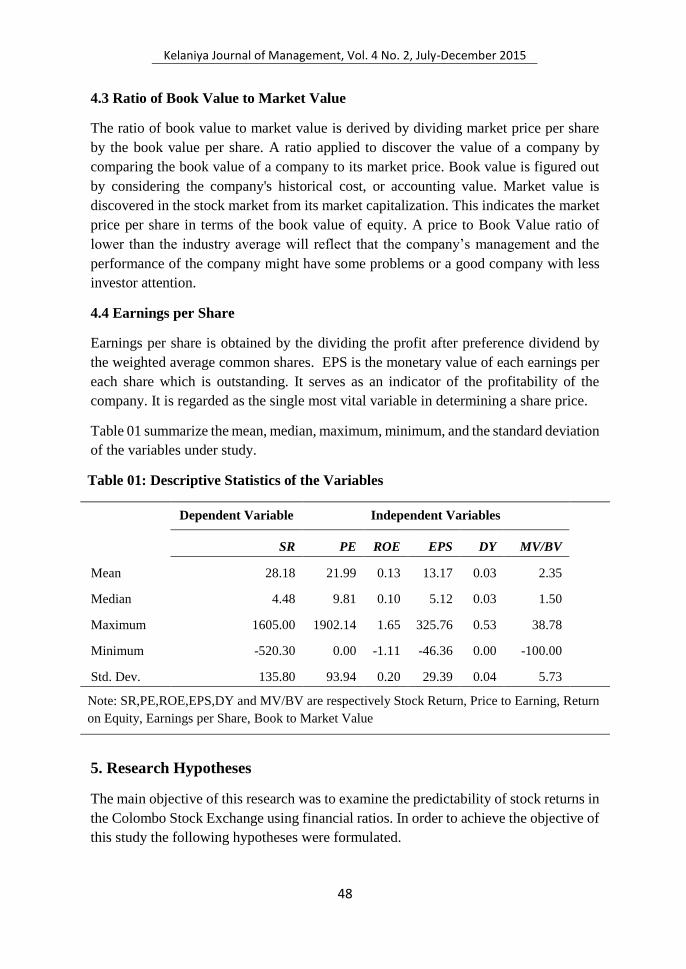
Table 01 summarize the mean, median, maximum, minimum, and the standard deviation
of the variables under study.
Table 01: Descriptive Statistics of the Variables
Dependent Variable Independent Variables
SR PE ROE EPS DY MV/BV
Mean 28.18 21.99 0.13 13.17 0.03 2.35
Median 4.48 9.81 0.10 5.12 0.03 1.50
Maximum 1605.00 1902.14 1.65 325.76 0.53 38.78
Minimum -520.30 0.00 -1.11 -46.36 0.00 -100.00
Std. Dev. 135.80 93.94 0.20 29.39 0.04 5.73
Note: SR,PE,ROE,EPS,DY and MV/BV are respectively Stock Return, Price to Earning, Return
on Equity, Earnings per Share, Book to Market Value
5. Research Hypotheses
The main objective of this research was to examine the predictability of stock returns in
the Colombo Stock Exchange using financial ratios. In order to achieve the objective of
this study the following hypotheses were formulated.

Kelaniya Journal of Management, Vol. 4 No. 2, July-December 2015
49
H1: There is a considerable association between stock returns and price-to-
earnings ratio in the listed companies in the Colombo Stock Exchange;
H2: There is a considerable association between stock returns and return on equity
in the listed companies in the Colombo Stock Exchange.
H3: There is a considerable association between stock returns and earnings per
share in the listed companies in the Colombo Stock Exchange.
H4: There is a considerable association between stock returns and dividend yield
in the listed companies in the Colombo Stock Exchange.
H5: There is a considerable association between stock returns and the ratio of the
book value to the market value in the listed companies in the Colombo Stock
Exchange;
H6: There is a considerable association between stock return and combination of
PE, BV/MV, ROE, EPS, and DY in the listed companies in the Colombo
Stock Exchange.
6. Techniques of Data Analysis
This research used panel data analysis technique which is often considered to be an
efficient analytical method in handling econometric data. Hence, this research utilized
the panel data regression techniques. Indeed by looking at the nature of the data
collected, which are cross sectional and time series, is compatible with this technique,
as the cross-sectional data reflected in stock returns and ratios of different companies
and the time series reflected the in the changes within stock return and ratios over time
in each company. Hausman specification test applied to recognize the appropriate
method for data analysis. The results of Hausman test indicate the random effect method
is more appropriate for the data analysis.
This study applied ordinary least square method (OLS) to correct set of covariance and
t-statistics. When data are ordered in chronological order, the error on one time period
may affect the error on next time periods, so this study employs the Durbin-Watson
(DW) test for recognizing the autocorrelation. The results of DW test shown in table III
indicate no serial correlation in all applied regressions because of the DW test statistic
amount to 2.05.
This research used panel data models to formulate predictive regressions. Hence it have
used simple regression model to test the first 5 hypothesis which are formulated on the
basis of association between each financial ratio and future stock returns. This research
examined 6 hypotheses by the predictive regression models in the panel data set. This
research have used simple predictive regression model to test first five hypotheses under
study.
Kelaniya Journal of Management, Vol. 4 No. 2, July-December 2015
50
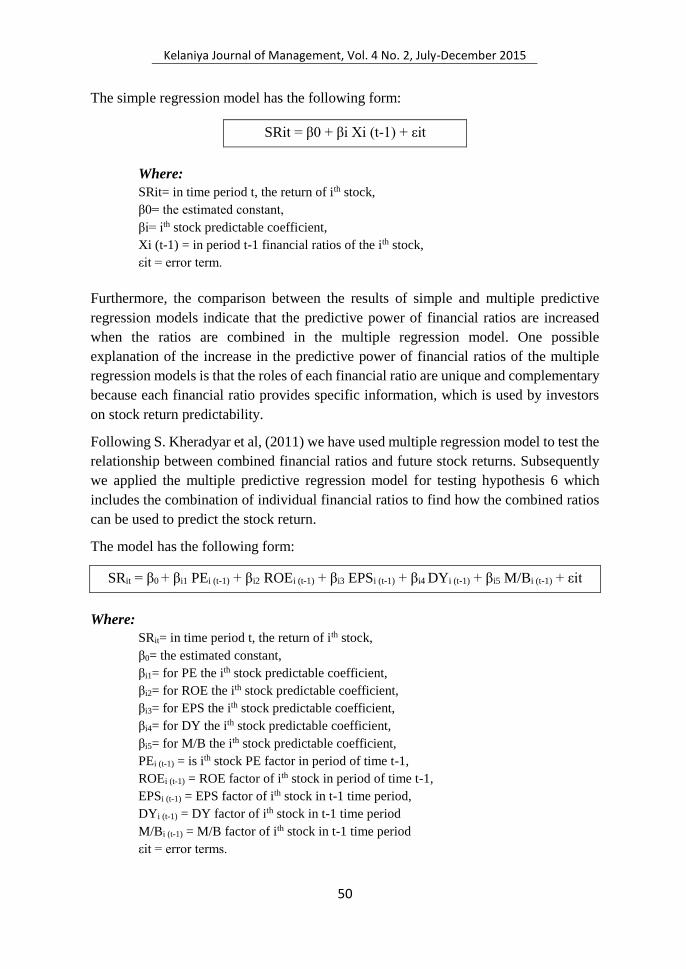
The simple regression model has the following form:
SRit = β0 + βi Xi (t-1) + εit
Where:
SRit= in time period t, the return of ith stock,
β0= the estimated constant,
βi= ith stock predictable coefficient,
Xi (t-1) = in period t-1 financial ratios of the ith stock,
εit = error term.
Furthermore, the comparison between the results of simple and multiple predictive
regression models indicate that the predictive power of financial ratios are increased
when the ratios are combined in the multiple regression model. One possible
explanation of the increase in the predictive power of financial ratios of the multiple
regression models is that the roles of each financial ratio are unique and complementary
because each financial ratio provides specific information, which is used by investors
on stock return predictability.
Following S. Kheradyar et al, (2011) we have used multiple regression model to test the
relationship between combined financial ratios and future stock returns. Subsequently
we applied the multiple predictive regression model for testing hypothesis 6 which
includes the combination of individual financial ratios to find how the combined ratios
can be used to predict the stock return.
The model has the following form:
SRit = β0 + βi1 PEi (t-1) + βi2 ROEi (t-1) + βi3 EPSi (t-1) + βi4 DYi (t-1) + βi5 M/Bi (t-1) + εit
Where:
SRit= in time period t, the return of ith stock,
β0= the estimated constant,
βi1= for PE the ith stock predictable coefficient,
βi2= for ROE the ith stock predictable coefficient,
βi3= for EPS the ith stock predictable coefficient,
βi4= for DY the ith stock predictable coefficient,
βi5= for M/B the ith stock predictable coefficient,
PEi (t-1) = is ith stock PE factor in period of time t-1,
ROEi (t-1) = ROE factor of ith stock in period of time t-1,
EPSi (t-1) = EPS factor of ith stock in t-1 time period,
DYi (t-1) = DY factor of ith stock in t-1 time period
M/Bi (t-1) = M/B factor of ith stock in t-1 time period
εit = error terms.
Kelaniya Journal of Management, Vol. 4 No. 2, July-December 2015
51
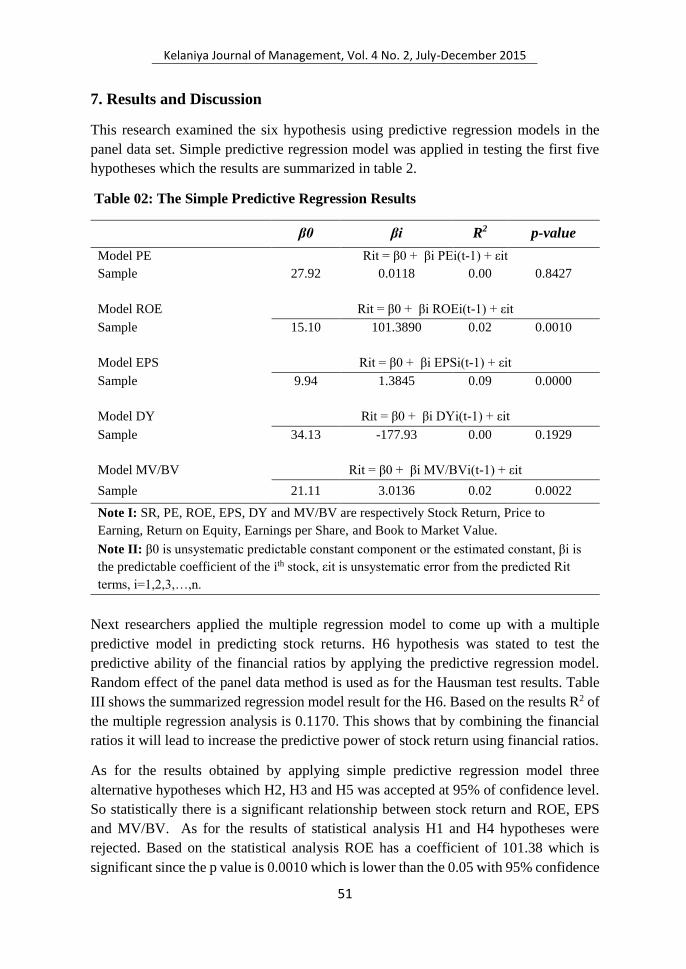
7. Results and Discussion
This research examined the six hypothesis using predictive regression models in the
panel data set. Simple predictive regression model was applied in testing the first five
hypotheses which the results are summarized in table 2.
Table 02: The Simple Predictive Regression Results
β0 βi R2 p-value
Model PE Rit = β0 + βi PEi(t-1) + εit
Sample 27.92 0.0118 0.00 0.8427
Model ROE Rit = β0 + βi ROEi(t-1) + εit
Sample 15.10 101.3890 0.02 0.0010
Model EPS Rit = β0 + βi EPSi(t-1) + εit
Sample 9.94 1.3845 0.09 0.0000
Model DY Rit = β0 + βi DYi(t-1) + εit
Sample 34.13 -177.93 0.00 0.1929
Model MV/BV Rit = β0 + βi MV/BVi(t-1) + εit
Sample 21.11 3.0136 0.02 0.0022
Note I: SR, PE, ROE, EPS, DY and MV/BV are respectively Stock Return, Price to
Earning, Return on Equity, Earnings per Share, and Book to Market Value.
Note II: β0 is unsystematic predictable constant component or the estimated constant, βi is
the predictable coefficient of the ith stock, εit is unsystematic error from the predicted Rit
terms, i=1,2,3,…,n.
Next researchers applied the multiple regression model to come up with a multiple
predictive model in predicting stock returns. H6 hypothesis was stated to test the
predictive ability of the financial ratios by applying the predictive regression model.
Random effect of the panel data method is used as for the Hausman test results. Table
III shows the summarized regression model result for the H6. Based on the results R2 of
the multiple regression analysis is 0.1170. This shows that by combining the financial
ratios it will lead to increase the predictive power of stock return using financial ratios.
As for the results obtained by applying simple predictive regression model three
alternative hypotheses which H2, H3 and H5 was accepted at 95% of confidence level.
So statistically there is a significant relationship between stock return and ROE, EPS
and MV/BV. As for the results of statistical analysis H1 and H4 hypotheses were
rejected. Based on the statistical analysis ROE has a coefficient of 101.38 which is
significant since the p value is 0.0010 which is lower than the 0.05 with 95% confidence
Kelaniya Journal of Management, Vol. 4 No. 2, July-December 2015
52
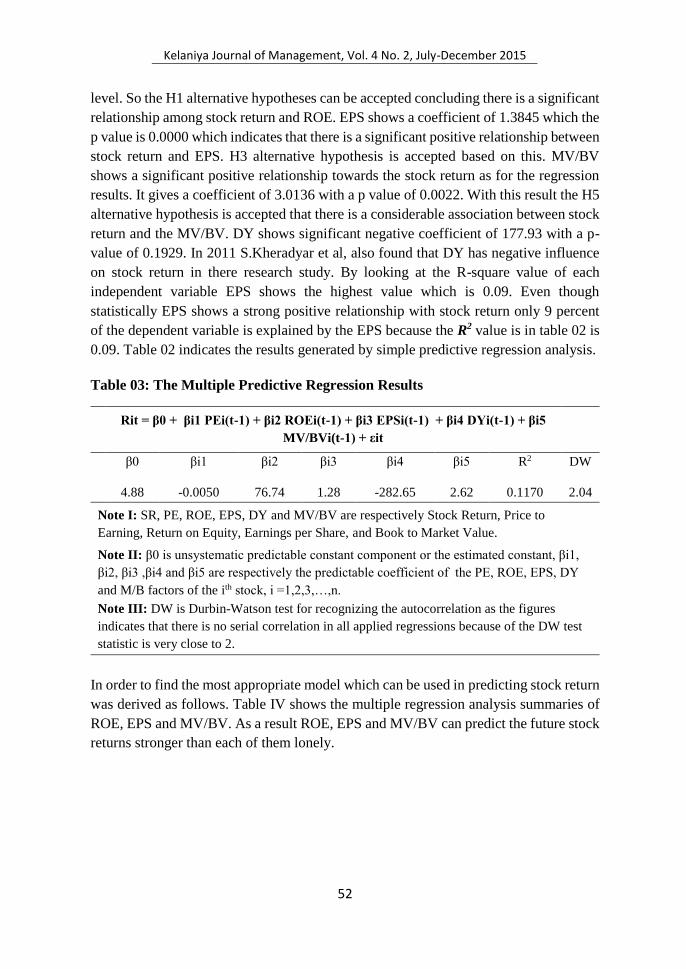
level. So the H1 alternative hypotheses can be accepted concluding there is a significant
relationship among stock return and ROE. EPS shows a coefficient of 1.3845 which the
p value is 0.0000 which indicates that there is a significant positive relationship between
stock return and EPS. H3 alternative hypothesis is accepted based on this. MV/BV
shows a significant positive relationship towards the stock return as for the regression
results. It gives a coefficient of 3.0136 with a p value of 0.0022. With this result the H5
alternative hypothesis is accepted that there is a considerable association between stock
return and the MV/BV. DY shows significant negative coefficient of 177.93 with a p-
value of 0.1929. In 2011 S.Kheradyar et al, also found that DY has negative influence
on stock return in there research study. By looking at the R-square value of each
independent variable EPS shows the highest value which is 0.09. Even though
statistically EPS shows a strong positive relationship with stock return only 9 percent
of the dependent variable is explained by the EPS because the R2 value is in table 02 is
0.09. Table 02 indicates the results generated by simple predictive regression analysis.
Table 03: The Multiple Predictive Regression Results
Rit = β0 + βi1 PEi(t-1) + βi2 ROEi(t-1) + βi3 EPSi(t-1) + βi4 DYi(t-1) + βi5
MV/BVi(t-1) + εit
β0 βi1 βi2 βi3 βi4 βi5 R2 DW
4.88 -0.0050 76.74 1.28 -282.65 2.62 0.1170 2.04
Note I: SR, PE, ROE, EPS, DY and MV/BV are respectively Stock Return, Price to
Earning, Return on Equity, Earnings per Share, and Book to Market Value.
Note II: β0 is unsystematic predictable constant component or the estimated constant, βi1,
βi2, βi3 ,βi4 and βi5 are respectively the predictable coefficient of the PE, ROE, EPS, DY
and M/B factors of the ith stock, i =1,2,3,…,n.
Note III: DW is Durbin-Watson test for recognizing the autocorrelation as the figures
indicates that there is no serial correlation in all applied regressions because of the DW test
statistic is very close to 2.
In order to find the most appropriate model which can be used in predicting stock return
was derived as follows. Table IV shows the multiple regression analysis summaries of
ROE, EPS and MV/BV. As a result ROE, EPS and MV/BV can predict the future stock
returns stronger than each of them lonely.

Kelaniya Journal of Management, Vol. 4 No. 2, July-December 2015
53
Table 04: The Multiple Predictive Regression Results with combination of EPS
and M/B
Rit = β0 + βi2 ROEi(t-1) + βi3 EPSi(t-1)+ βi5 MV/BVi(t-1) + εit
β0 βi2 βi3 βi5 R2 DW
-1.91 51.1456 1.30 2.7166 0.1105 2.0511
Note I: SR,ROE,EPS,MV/BV are respectively Stock Return, Return on Equity, Earnings
per Share, Book to Market Value.
Note II: β0 is unsystematic predictable constant component or the estimated constant, βi2,
βi3, βi5 are respectively the predictable coefficient of the ROE,EPS,M/B factors of the ith
stock, i =1,2,3,…,n.
Note III: DW is Durbin-Watson test for recognizing the autocorrelation as the figures
indicates that there is no serial correlation in all applied regressions because of the DW test
statistic is very close to 2.
8. Conclusion
This paper examines the predictive power of five financial ratios on stock returns in
Colombo Stock Exchange over ten years from 2004 to 2013. Many researches have
attempted to discover the predictive power of the financial ratios on predicting the stock
return. Most of the researches have concluded with different arguments over the period
of time. Most of the researches were done on western countries and there were lack of
researches on this area in south Asian counties, thus the predictive power of financial
ratios in developing Asian countries is still unknown.
In this study the stock return predictability was measured using financial ratios. As for
the results of regression analysis only ROE, EPS and MV/BV have a significant positive
relationship with the stock return. Hence the investors should consider these ratios of
the companies and movement in these ratios in selecting a resilient portfolio to invest.
The focus on these ratios are understandable even for amateur investors who can easily
calculated these ratios by relying on the information they obtain from Colombo Stock
Exchange or related companies in order to make effective decision on selecting a
resilient investment portfolio.
But the predictive power of each ratio shows a weak value when considering the R-
Squared value. In this case more researches need to be done by incorporating other
factors such as beta factor, industry returns, interest rates, size of the firm and other non-
numerical factors such as economic factors, political stability, attractiveness of the
industry, companies position in the industry in finding their impact on the stock return
and find whether the stock return can be predicted in Sri Lankan stock market.
Kelaniya Journal of Management, Vol. 4 No. 2, July-December 2015
54
9. References
Alexakis, C., Patra, T. & Poshakwale, S., 2010. Predictability of stock returns using financial
statement information: evidence on semi-strong efficiency of emerging Greek stock
market. Applied Financial Economics, Volume 20, p. 1321–1326.
http://dx.doi.org/10.1080/09603107.2010.482517
Ang, A. & Bekaert, G., 2007. Stock Return Predictability: Is it there? The Review of Financial
Studies, Volume 20, pp. 1-57. http://dx.doi.org/10.1093/rfs/hhl021
Anon., 2014. An Introduction to Colombo Stock Exchange. Colombo: Colombo Stock
Exchange, Sri Lanka.
Banderlipe, M. R. S., 2006. Predicting Stock Returns Using Financial Ratios: Evidence from
Selected Philippine Companies. pp. 1-45.
Bryman, A. & Bell, E., 2008. Business research methods. 2nd Ed. New York: Oxford
University Press Inc.
Cooper, M. J., Gulen, H. & Schill, M. J., 2009. The Asset Growth Effect in Stock Returns. pp.
1-22.
Dechow, P. M., Ak, B. K., Sun, E. Y. & Wang, A. Y., 2013. Do Financial Ratio Models Help
Investors Better Predict and Interpret Significant Corporate Events? pp. 1-74.
Hadassin, I., n.d. An Investigation into the Behavior of Earnings and Share Prices of South
African Listed Companies.
Karami, G. R. & Talaeei, L., 2013. Predictability of stock returns using financial ratios in the
companies listed in Tehran Stock Exchange. International Research Journal of Applied
and Basic Sciences, 4(12), pp. 4261-4273.
Khan, M. B. & Gul, S., 2012. Financial Ratios and Stock Return Predictability (Evidence from
Pakistan). pp. 1-6.
Kheradyar, S., Ibrahim, I. & Nor, F. M., 2011. Stock Return Predictability with Financial
Ratios. International Journal of Trade, Economics and Finance, 2(5), pp. 391-396.
Kim, J. H., Shamsuddin, A. & Lim, K.-P., 2011. Stock return predictability and the adaptive
markets hypothesis: Evidence from century-long U.S. data. Journal of Empirical
Finance, Volume 18, pp. 868-879. http://dx.doi.org/10.1016/j.jempfin.2011.08.002
Kohansal, M. R., Dadrasmoghaddam, A., Karmozdi, K. M. & Mohseni, A., 2013. Relationship
between Financial Ratios and Stock Prices for the Food Industry Firms in Stock
Exchange of Iran. World Applied Programming, 3(10), pp. 1-10.
Lettau, M. & Nieuwerburgh, S. V., 2007. Reconciling the Return Predictability Evidence. The
Review of Financial Studies, Volume 21, pp. 1-46.
Maio, P. & Clara, P. S., 2012. Dividend yields, dividend growth, and return predictability in
the cross-section of stocks. pp. 1-34.
Kelaniya Journal of Management, Vol. 4 No. 2, July-December 2015
55
Menaje, P. M., 2012. Impact of Selected Financial Variables on Share Price of Publicly Listed
Firms in the Philippines. American International Journal of Contemporary Research,
2(9), pp. 98-104.
Menaje, P. M., 2012. Impact of Selected Financial Variables on Share Price of Publicly Listed
Firms in the Philippines. American International Journal of Contemporary Research, pp.
01-07.
Nezhad, S. H. S., Ramezani, A. & Ebrahimpour, H., 2013. Investigation of the Market
Reaction to Accounting Information Adjustments: Evidence from Tehran Stock
Exchange. World of Sciences Journal, 1(12), pp. 165-175.
Pouraghajan, A. et al., 2013. Investigation the Effect of Financial Ratios, Operating Cash
Flows and Firm Size on Earnings per Share: Evidence from the Tehran stock Exchange.
pp. 01-08.
Rathnayaka, R., Nagahawatta, S. C. & Seneviratna, D., 2014. Empirical Investigation of Stock
Market Behavior in the Colombo Stock Exchange. Reshaping Management and
Economic Thinking through Integrating Eco-Friendly and Ethical Practices, pp. 209-
210.
Regan, P. O., 2006. Financial information Analysis. 2nd Ed.
Salisu, A., n.d. Dividend Payout Ratio and Share Price Movement of Listed Non-Service Firms
in Nigeria: Empirical Study. pp. 1-15.
