financial report 20161231 - capmetro - austin public transit€¦ · · 2017-04-03financial...
TRANSCRIPT
Financial Report
Period ended December 31, 2016 - Quarter 1 FY 2017
1
Table of Contents
SUMMARY REPORTS
Budgetary Performance
- Revenue 2 - Sales Tax Revenue 5 - Operating Expenses 6
Budget Transfers 8
APPENDIX REPORTS
- Cash, Investments and Reserves 10 - Statement of Revenue, Expenses and Changes in Net Position 11 - Budget Variances by Department 12 - Capital Expenditures and Commitments 13
Financial Report
Period ended December 31, 2016 - Quarter 1 FY 2017
2
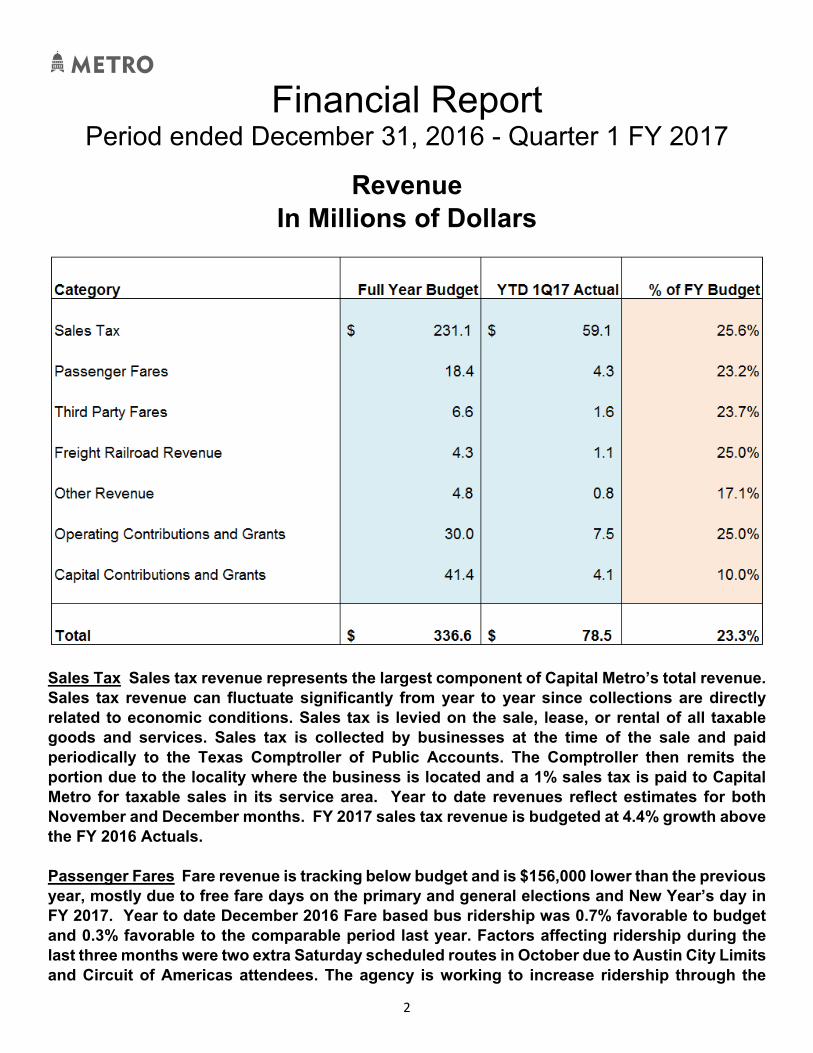
Revenue In Millions of Dollars
Sales Tax Sales tax revenue represents the largest component of Capital Metro’s total revenue. Sales tax revenue can fluctuate significantly from year to year since collections are directly related to economic conditions. Sales tax is levied on the sale, lease, or rental of all taxable goods and services. Sales tax is collected by businesses at the time of the sale and paid periodically to the Texas Comptroller of Public Accounts. The Comptroller then remits the portion due to the locality where the business is located and a 1% sales tax is paid to Capital Metro for taxable sales in its service area. Year to date revenues reflect estimates for both November and December months. FY 2017 sales tax revenue is budgeted at 4.4% growth above the FY 2016 Actuals. Passenger Fares Fare revenue is tracking below budget and is $156,000 lower than the previous year, mostly due to free fare days on the primary and general elections and New Year’s day in FY 2017. Year to date December 2016 Fare based bus ridership was 0.7% favorable to budget and 0.3% favorable to the comparable period last year. Factors affecting ridership during the last three months were two extra Saturday scheduled routes in October due to Austin City Limits and Circuit of Americas attendees. The agency is working to increase ridership through the
Financial Report
Period ended December 31, 2016 - Quarter 1 FY 2017
3
Connections 2025 transit plan that will establish a more frequent, more reliable and more connected transit system. At the end of December 2016, there were 231 vanpools in service compared to a budget of 245 vanpools, resulting in rideshare revenues that are $72,000 below budget. The budget reflects anticipated demand for alternative modes of transportation in the Austin metropolitan area. Third Party Fares This category is tracking close to expectations. Payments from The University of Texas for shuttle services can vary due to service hours, ridership, and contracted rates. Service hours are expected to remain relatively stable for the University of Texas service. Freight Railroad Revenue Freight operations and maintenance services are contracted out to Watco Companies, L.L.C. The contract provides for a base period of twenty years with six, five-year renewal options and Watco has assumed complete operation of the assigned services since October 1, 2015. Capital Metro receives 16.5% of gross revenue each year. Mainline revenue recorded this fiscal year totals $828,000 and is $92,000 above budget. In January 2005, the United States Congress enacted the Railroad Track Maintenance Tax Credit—section 45G of the U.S. Tax Code. The 45G tax credit is a federal income tax credit for track maintenance conducted by short lines and regional railroads in the United States. The credit granted an amount equal to 50% of qualified track maintenance expenditures and other qualifying railroad infrastructure projects. The full year FY 2017 budget is $575,000 Through December 2016 $144,000 has been received. The remainder is anticipated to be received by the end of the second quarter. The remainder of revenue reported in this category is $113,000 and is related to licenses and fees associated with use of Capital Metro’s railroad right of way. Other Revenue The year to date revenue variance is due to the timing of lease income that is budgeted for the second half of the fiscal year. There is an agreement between Capital Metro and Endeavor Real Estate Group to redevelop the 10-acre Plaza Saltillo tract and it has $1.6 million revenue budgeted in FY 2017. This is dependent on the approval of the Plaza Saltillo zoning change that is anticipated in the second quarter of FY 2017. Investment earnings received was $310,000 and is tracking close to budget expectations. Contributions and Grants Operating contributions and grants are tracking to Budget. $28 million of the FY 2017 budget is for the Federal Transit Administration (FTA) 5307 formula funds for the capital cost of contracting. The FTA provides assistance with the capital consumed in the course of contracting with outside sources to obtain public transportation service, maintenance service, or transit vehicles.

Financial Report
Period ended December 31, 2016 - Quarter 1 FY 2017
4
Capital contribution and grant revenue is recognized when eligible expenditures are paid. Revenue of $4.1 million has been recognized through December 31, 2016, and is primarily associated with progress payments on preliminary design and acquisition assistance for four rail cars. Capital grant revenue typically lags one to two months due to vendor invoice payment and submission for grant reimbursement. In June 2014, the Texas Department of Transportation (TxDOT) awarded Capital Metro $50 million for the purchase of new rail cars to support additional MetroRail service. The new rail cars will allow up to 2,400 additional passenger trips during morning and afternoon peak travel times, and Capital Metro will be able to increase frequency during peak periods from 34 to 15 minutes as well as adding an extra train after 7 p.m. to give commuters another alternative to driving in the evening. Funding will also help construct a permanent and larger rail station in downtown Austin to better serve crowds during special events. In January 2015, TxDOT remitted these funds in advance to Capital Metro, and they were deposited into a restricted account and recorded as deferred revenue, with revenue recognized as eligible expenses are paid.
Financial Report
Period ended December 31, 2016 - Quarter 1 FY 2017
5
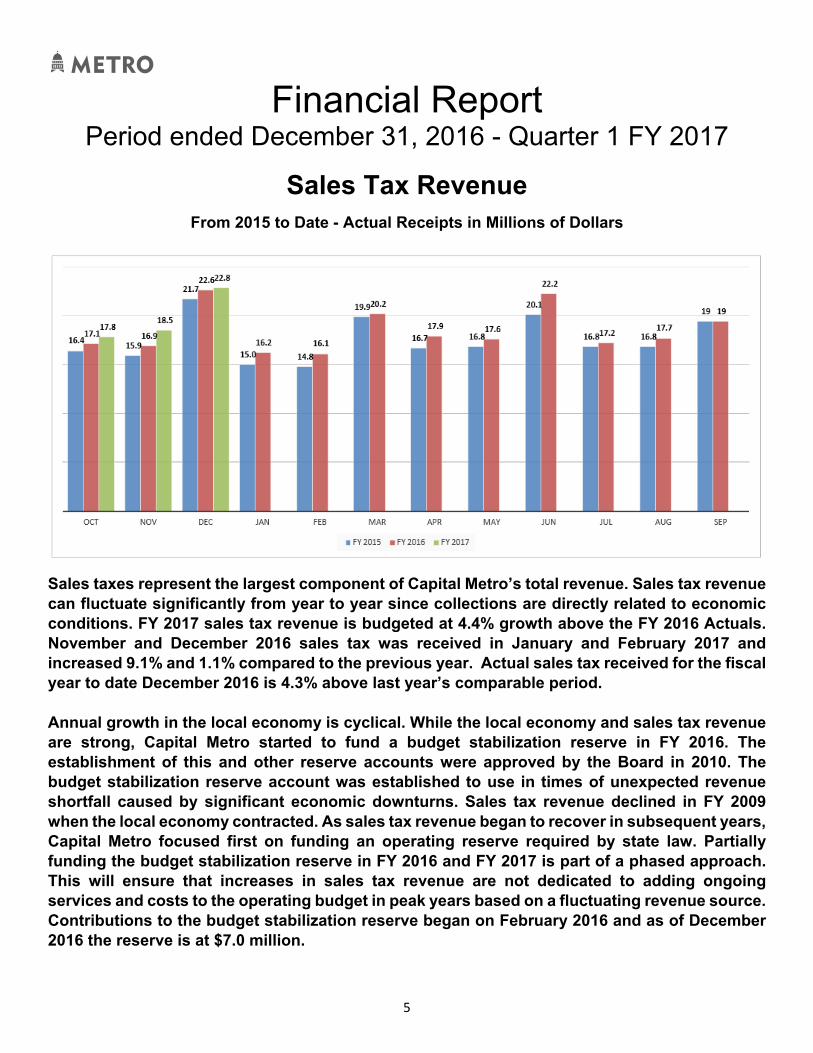
Sales Tax Revenue From 2015 to Date - Actual Receipts in Millions of Dollars
Sales taxes represent the largest component of Capital Metro’s total revenue. Sales tax revenue can fluctuate significantly from year to year since collections are directly related to economic conditions. FY 2017 sales tax revenue is budgeted at 4.4% growth above the FY 2016 Actuals. November and December 2016 sales tax was received in January and February 2017 and increased 9.1% and 1.1% compared to the previous year. Actual sales tax received for the fiscal year to date December 2016 is 4.3% above last year’s comparable period. Annual growth in the local economy is cyclical. While the local economy and sales tax revenue are strong, Capital Metro started to fund a budget stabilization reserve in FY 2016. The establishment of this and other reserve accounts were approved by the Board in 2010. The budget stabilization reserve account was established to use in times of unexpected revenue shortfall caused by significant economic downturns. Sales tax revenue declined in FY 2009 when the local economy contracted. As sales tax revenue began to recover in subsequent years, Capital Metro focused first on funding an operating reserve required by state law. Partially funding the budget stabilization reserve in FY 2016 and FY 2017 is part of a phased approach. This will ensure that increases in sales tax revenue are not dedicated to adding ongoing services and costs to the operating budget in peak years based on a fluctuating revenue source. Contributions to the budget stabilization reserve began on February 2016 and as of December 2016 the reserve is at $7.0 million.

Financial Report
Period ended December 31, 2016 - Quarter 1 FY 2017
6
Operating Expenses In Millions of Dollars
Salaries and Benefits The favorable budget variance is primarily due to employee vacancies that resulted in lower salary and benefit costs. As of December 31st, there were 27.5 unfilled positions. Professional Services Third party services are needed for various operational and planning purposes in FY 2017, including:
• Child care center operations • Hardware and Software maintenance agreements • Ongoing janitorial and landscaping services • Ongoing building and maintenance services at north operations facility
Financial Report
Period ended December 31, 2016 - Quarter 1 FY 2017
7
• Central corridor transit study (partially funded by a grant)
Spending for professional services typically lags the budget due to staggered start dates for hardware and phone system maintenance agreements and professional services. A contract to conduct a transit study of the central corridor was budgeted in FY 2017 at $1.6 million. Year-to-date $116,000 was expensed through December 2016. Other services payable to the Transit Empowerment Fund was budgeted at $350,000 and is anticipated in the second quarter of 2017. The Transit Empowerment Fund focuses on lowering barriers to self-sufficiency. Capital Metro funds the distribution of bus passes to organizations that serve low-income individuals and supports creative solutions to expand transit services in underserved neighborhoods in the Capital Metro service area. Fuel and Fluids The majority of this budget category is for the purchase of diesel fuel and gasoline. Fuel costs are below budget due to lower than budgeted diesel prices per gallon. Capital Metro budgeted $3.20 per gallon for diesel in FY 2017. The average price of diesel consumed during three months of FY 2017 was $1.64 per gallon. The average cost of diesel, net of hedging transactions, was $2.16 per gallon. Approximately 1.25 million gallons were consumed through the end of December. Capital Metro contracts with a third-party advisor to help manage diesel fuel pricing risk over time through the use of futures contracts. These programs are designed to reduce fuel cost volatility and are commonly referred to as fuel price risk management or fuel hedging. When fuel prices rise, the value of futures that were purchased when prices were lower will result in a gain when contracts are sold. Conversely, as fuel prices drop, the value of futures that were purchased when prices were higher will result in a loss when contracts are sold. Futures contracts outstanding at the end of each fiscal year will be reported in the financial statements at fair market value. Fuel prices at the time of sale will determine whether future transactions result in either a realized gain or loss in a future fiscal year. Insurance The variance is due to timing as the full year property insurance, liability, and other insurance premiums were paid upfront to utilize vendor payment discounts. Purchased Transportation Expenses are close to budget expectations and reflect transportation services received through December. Taxes The variance is due to a classification difference between the budget and actuals. The budget for fuel taxes was not split from fuel and is built into the Fuel and Fluids category. Other Expenses Other expenses are favorable to budget due to delayed timing of advertising expenses, as well as the million dollar expense contingency that was budgeted, but not yet needed.
Financial Report
Period ended December 31, 2016 - Quarter 1 FY 2017
8
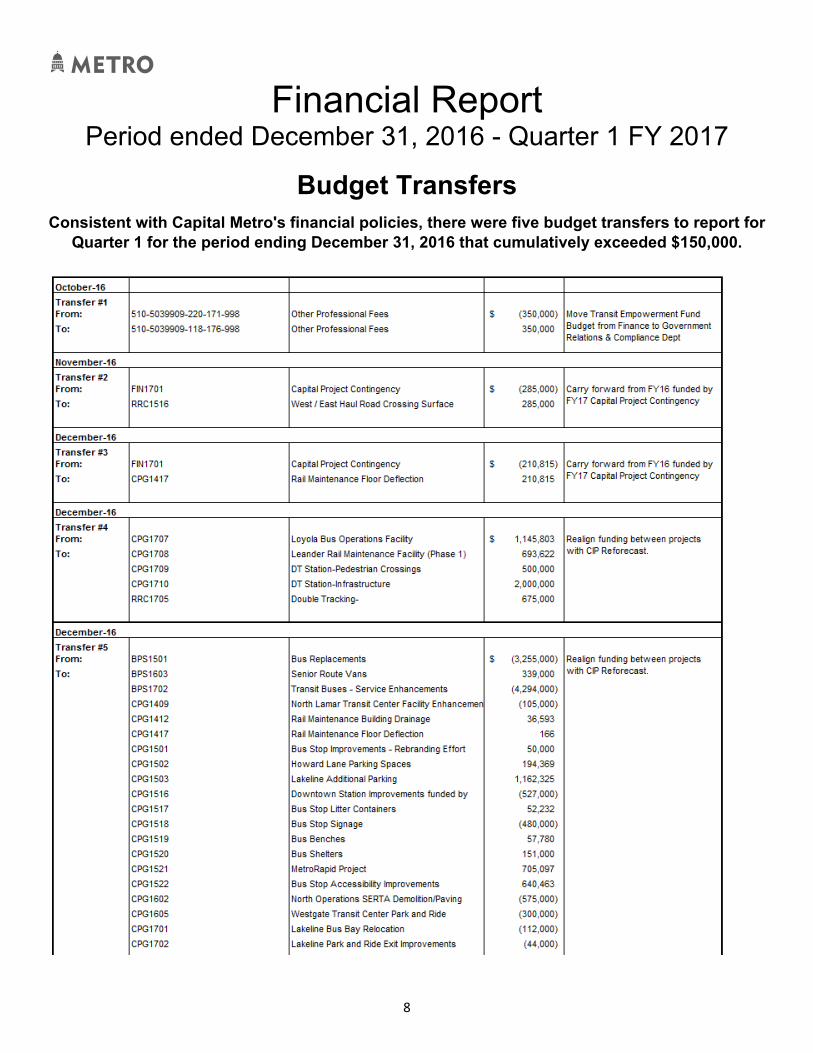
Budget Transfers Consistent with Capital Metro's financial policies, there were five budget transfers to report for
Quarter 1 for the period ending December 31, 2016 that cumulatively exceeded $150,000.

Financial Report
Period ended December 31, 2016 - Quarter 1 FY 2017
9
Continued from previous page

Financial Report
Period ended December 31, 2016 - Quarter 1 FY 2017
10
Cash, Investments and Reserves
Cash & Investments Cash and cash equivalents $66.0M Investments $133.2M Total $199.2M
Note:
Additional funding was allocated to the statutory operating and budget stabilization reserves based on the Board approved funding formula. The statutory operating reserve equals two months of FY 2016 operating expenses. Contributions to the budget stabilization reserve began in February 2016 and $7 million was reserved in FY 2016, with an additional contribution of $3 million budgeted for FY 2017 in quarterly installments of $750,000.
Funds for future capital investment will be required to help address extensive 2017 capital needs. The capital budget
for 2017 is $158 million, with $69 million funded by FY 2017 Income and $89 million from reserves. These capital improvements are needed to get caught up with the state of good repair of the community’s transit
infrastructure and to be in compliance with Federal regulations.
Statutory Operating Reserve, $37.6
Self Insurance Reserve, $1.2
City of Austin Mobility Programs, $26.3
Future Capital Investment (see Note), $88.7
Restricted for Rail Cars and Station
Improvements, $37.7
Budget Stabilization Reserve, $7.8
Rounded in millions of dollars

Financial Report
Period ended December 31, 2016 - Quarter 1 FY 2017
11
Statement of Revenue, Expenses and Changes in Net Position
Full Year Budget YTD Actual YTD % of Budget
Operating Revenue:
Passenger Fares 18,437,000$ 4,276,866$ 23.2%
Third Party Fares 6,630,000 1,570,755 23.7%
Freight Rail Revenue 4,342,000 1,086,325 25.0%
Other Revenue 3,741,000 500,231 13.4%
Total Operating Revenue 33,150,000 7,434,177 22.4%
Operating Expenses:
Salaries & Benefits 39,296,759 8,812,079 22.4%
Professional Services 21,633,345 2,888,560 13.4%
Materials and Supplies 1,726,049 107,220 6.2%
Fuel & Fluids 20,366,286 2,892,635 14.2%
Utilities 3,071,216 590,630 19.2%
Insurance 939,544 285,480 30.4%
Taxes 19,363 263,433 1360.5%
Purchased Transportation 154,048,396 36,936,416 24.0%
Other Expenses 4,488,495 556,759 12.4%
Interest Expense 389,264 6,575 1.7%
Lease/Rental 2,294,287 320,160 14.0%
Total Operating Expenses 248,273,004 53,659,946 21.6%
Operating Income/(Loss) (215,123,004) (46,225,770) 21.5%
Non-Operating Revenue/(Expenses):
Sales Tax 231,124,000 59,120,113 25.6%
Investment Income 1,000,000 309,890 31.0%
Operating Contributions and Grants 29,979,000 7,494,466 25.0%
Capital Contributions and Grants 41,364,000 4,151,433 10.0%
Mobility Interlocal Agreements (15,867,000) (94,507) 0.6%
Other - (1,638) 0.0%
Total Non-Operating Revenue/(Expenses) 287,600,000 70,979,757 24.7%
Change in Net Position 72,476,996$ 24,753,987$ 34.2%

Financial Report
Period ended December 31, 2016 - Quarter 1 FY 2017
12
Budget Variances by Department
Full Year Budget YTD ActualYTD % of
Total Budget
100 NON-ALLOCATED BENEFITS 10,268,445$ 2,340,266$ 22.8%
102 WELLNESS CENTER 276,375 40,932 14.8%
103 CHILD CARE CENTER 832,450 132,811 16.0%
105 BUSINESS CENTER 353,964 26,785 7.6%
110 EXECUTIVE STAFF 872,659 165,536 19.0%
115 COMMUNICATIONS 848,822 144,932 17.1%
118 GOVERNMENT RELATIONS & COMPLIANCE 1,237,379 163,279 13.2%
120 BOARD OF DIRECTORS 302,884 49,618 16.4%
125 INTERNAL AUDIT 414,469 74,357 17.9%
130 STRATEGIC OPERATIONS MANAGEMENT AND ADMIN 788,376 168,187 21.3%
141 SECURITY 4,001,731 977,622 24.4%
150 LEGAL 935,351 161,568 17.3%
220 FINANCE 4,188,658 644,029 15.4%
230 INFORMATION TECHNOLOGY 9,112,232 2,000,707 22.0%
250 PROCUREMENT 1,312,301 280,794 21.4%
275 RIDESHARE 2,740,241 572,038 20.9%
320 PLANNING 3,658,215 496,461 13.6%
330 MARKETING 3,756,595 453,797 12.1%
331 COMMUNITY INVOLVEMENT 1,066,634 118,838 11.1%
332 CUSTOMER SERVICE 1,674,678 285,324 17.0%
340 HUMAN RESOURCES 1,725,099 385,750 22.4%
420 RISK MANAGEMENT AND SAFETY 2,171,747 502,761 23.2%
457 PUBLIC FACILITIES 4,953,101 823,466 16.6%
530 CAPITAL PROJECTS 2,097,243 274,121 13.1%
540 REAL ESTATE, PROPERTY & ASSET MANAGEMENT 1,874,264 330,077 17.6%
542 FREIGHT RAIL MANAGEMENT 246,744 25,702 10.4%
544 COMMUTER RAIL OPERATIONS 21,190,280 4,576,739 21.6%
550 REAL ESTATE AND FACILITY PLANNING 3,653,769 655,395 17.9%
600 BUS AND PARATRANSIT SERVICES 3,913,803 693,801 17.7%
610 BUS CONTRACT OPERATIONS 122,571,086 28,166,541 23.0%
620 PARATRANSIT CONTRACT OPERATIONS 30,565,018 7,192,558 23.5%
630 PARATRANSIT ADMINISTRATION 366,312 57,117 15.6%
640 PARATRANSIT RESERVATIONS & CONTROL CENTER 1,797,543 370,586 20.6%
650 PARATRANSIT ELIGIBILITY 946,537 191,791 20.3%
920 CENTRAL CORRIDOR DEVELOPMENT 1,558,000 115,660 7.4%
TOTAL 248,273,005$ 53,659,946$ 21.6%
Financial Report
Period ended December 31, 2016 - Quarter 1 FY 2017
13
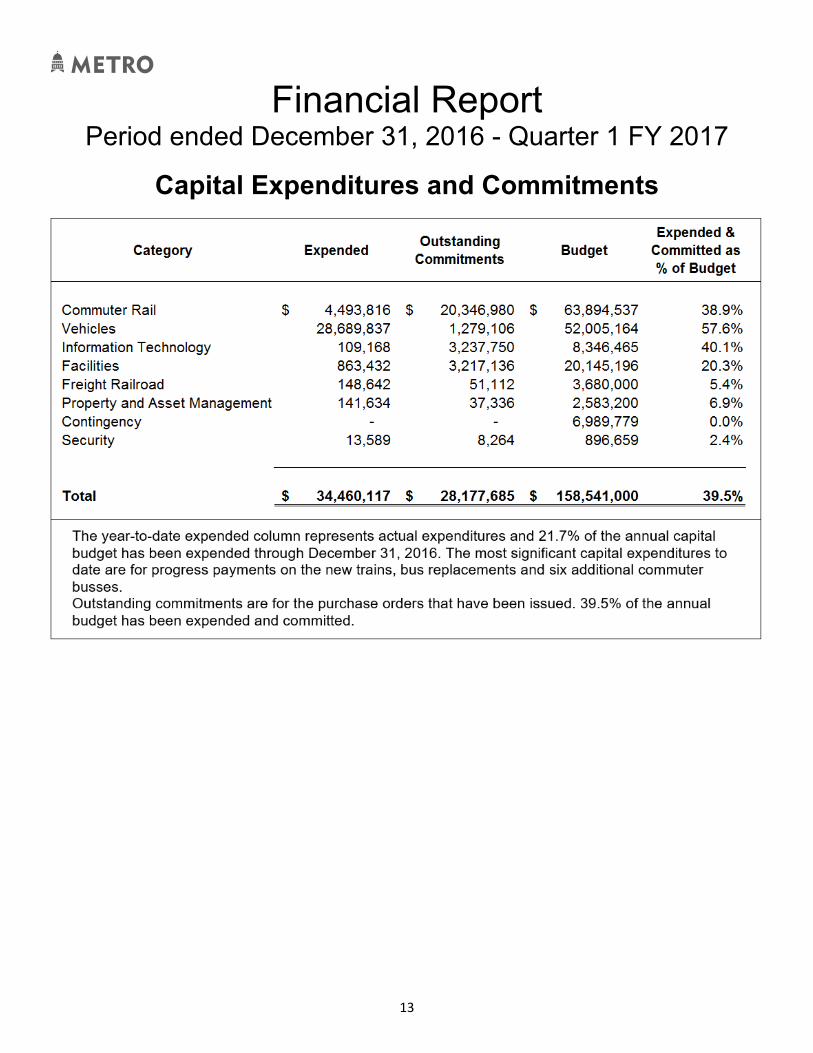
Capital Expenditures and Commitments