financial report 3q17 - credit suisse · pdf fileassets under management and net new assets...
TRANSCRIPT

5511194 English
Financial Report
3Q17

Key metrics in / end of % change in / end of % change
3Q17 2Q17 3Q16 QoQ YoY 9M17 9M16 YoY
Credit Suisse (CHF million, except where indicated)
Net income/(loss) attributable to shareholders 244 303 41 (19) 495 1,143 (91) –
Basic earnings/(loss) per share (CHF) 0.10 0.13 0.02 (23) 400 0.48 (0.04) –
Diluted earnings/(loss) per share (CHF) 0.09 0.13 0.02 (31) 350 0.47 (0.04) –
Return on equity attributable to shareholders (%) 2.2 3.0 0.4 – – 3.6 (0.3) –
Effective tax rate (%) 38.3 47.4 83.3 – – 30.7 (42.9) –
Core Results (CHF million, except where indicated)
Net revenues 5,227 5,479 5,561 (5) (6) 16,446 16,211 1
Provision for credit losses 40 69 50 (42) (20) 138 94 47
Total operating expenses 4,209 4,265 4,437 (1) (5) 12,976 13,316 (3)
Income before taxes 978 1,145 1,074 (15) (9) 3,332 2,801 19
Cost/income ratio (%) 80.5 77.8 79.8 – – 78.9 82.1 –
Assets under management and net new assets (CHF billion)
Assets under management 1,344.8 1,307.3 1,254.2 2.9 7.2 1,344.8 1,254.2 7.2
Net new assets (1.8) 12.1 11.6 – – 34.7 33.5 3.6
Balance sheet statistics (CHF million)
Total assets 788,690 783,411 806,711 1 (2) 788,690 806,711 (2)
Net loans 275,853 273,865 274,606 1 0 275,853 274,606 0
Total shareholders’ equity 43,858 43,493 44,276 1 (1) 43,858 44,276 (1)
Tangible shareholders’ equity 38,924 38,625 39,359 1 (1) 38,924 39,359 (1)
Basel III regulatory capital and leverage statistics
CET1 ratio (%) 14.0 14.2 14.1 – – 14.0 14.1 –
Look-through CET1 ratio (%) 13.2 13.3 12.0 – – 13.2 12.0 –
Look-through CET1 leverage ratio (%) 3.8 3.8 3.4 – – 3.8 3.4 –
Look-through Tier 1 leverage ratio (%) 5.2 5.2 4.6 – – 5.2 4.6 –
Share information
Shares outstanding (million) 2,555.1 2,553.3 2,088.3 0 22 2,555.1 2,088.3 22
of which common shares issued 2,556.0 2,556.0 2,089.9 0 22 2,556.0 2,089.9 22
of which treasury shares (0.9) (2.7) (1.6) (67) (44) (0.9) (1.6) (44)
Book value per share (CHF) 17.17 17.03 21.20 1 (19) 17.17 21.20 (19)
Tangible book value per share (CHF) 15.23 15.13 18.85 1 (19) 15.23 18.85 (19)
Market capitalization (CHF million) 39,184 35,426 26,563 11 48 39,184 26,563 48
Number of employees (full-time equivalents)
Number of employees 46,720 46,230 47,690 1 (2) 46,720 47,690 (2)
See relevant tables for additional information on these metrics.
Credit Suisse results 3I
II
III
Treasury, risk, balance sheet and off-balance sheet 49
Condensed consolidated financial statements – unaudited 83
List of abbreviations 172 Investor information 173Financial calendar and contacts 174Cautionary statement regarding forward-looking information 175
Financial Report 3Q17
For purposes of this report, unless the context otherwise requires, the terms “Credit Suisse,” “the Group,” “we,” “us” and “our” mean Credit Suisse Group AG and its consolidated subsidiar-ies. The business of Credit Suisse AG, the direct bank subsidiary of the Group, is substantially similar to the Group, and we use these terms to refer to both when the subject is the same or substantially similar. We use the term “the Bank” when we are only referring to Credit Suisse AG and its consolidated subsidiaries.
Abbreviations are explained in the List of abbreviations in the back of this report.
Publications referenced in this report, whether via website links or otherwise, are not incorporated into this report.
In various tables, use of “–” indicates not meaningful or not applicable.

2
Credit Suisse at a glance
Swiss Universal BankThe Swiss Universal Bank division offers comprehensive advice and a wide range of financial solutions to private, corporate and institutional clients primarily domiciled in our home market Switzer-land, which offers attractive growth opportunities and where we can build on a strong market position across our key businesses. Our Private Clients business has a leading franchise in our Swiss home market and serves ultra-high-net-worth individuals, high-net-worth individuals, affluent and retail clients. Our Corporate & Institutional Clients business serves large corporate clients, small and medium-sized enterprises, institutional clients, external asset managers and financial institutions.
International Wealth ManagementThe International Wealth Management division through its Private Banking business offers comprehensive advisory services and tailored investment and financing solutions to wealthy private clients and external asset managers in Europe, the Middle East, Africa and Latin America, utilizing comprehensive access to the broad spectrum of Credit Suisse’s global resources and capabilities as well as a wide range of proprietary and third-party products and services. Our Asset Management business offers investment solutions and services globally to a broad range of clients, including pension funds, governments, foundations and endowments, corpo-rations and individuals.
Asia PacificIn the Asia Pacific division, our wealth management, financing and underwriting and advisory teams work closely together to deliver integrated advisory services and solutions to our target ultra-high-net-worth, entrepreneur and corporate clients. Our Wealth Man-agement & Connected business combines our activities in wealth management with our financing, underwriting and advisory activi-ties. Our Markets business represents our equities and fixed income trading business in Asia Pacific, which supports our wealth manage-ment activities, but also deals extensively with a broader range of institutional clients.
Global MarketsThe Global Markets division offers a broad range of financial products and services to client-driven businesses and also supports Credit Suisse’s global wealth management businesses and their clients. Our suite of products and services includes global securities sales, trading and execution, prime brokerage and comprehensive invest-ment research. Our clients include financial institutions, corporations, governments, institutional investors, such as pension funds and hedge funds, and private individuals around the world.
Investment Banking & Capital MarketsThe Investment Banking & Capital Markets division offers a broad range of investment banking services to corporations, financial institutions, financial sponsors and ultra-high-net-worth individuals and sovereign clients. Our range of products and services includes advisory services related to mergers and acquisitions, divestitures, takeover defense mandates, business restructurings and spin-offs. The division also engages in debt and equity underwriting of public securities offerings and private placements.
Strategic Resolution UnitThe Strategic Resolution Unit was created to facilitate the immediate right-sizing of our business divisions from a capital perspective and includes remaining portfolios from former non-strategic units plus transfers of additional exposures from the business divisions. The unit’s primary focus is on facilitating the rapid wind-down of capital usage and costs to reduce the negative impact on the Group’s per-formance. Repositioned as a separate division, this provides clearer accountability, governance and reporting.
Credit SuisseOur strategy builds on Credit Suisse’s core strengths: its position as a leading global wealth manager, its specialist investment banking capabilities and its strong presence in our home market of Switzerland. We seek to follow a balanced approach to wealth management, aiming to capitalize on both the large pool of wealth within mature markets as well as the significant growth in wealth in Asia Pacific and other emerging markets. Founded in 1856, we today have a global reach with operations in about 50 countries and 46,720 employees from over 150 different nations. Our broad footprint helps us to generate a geographically balanced stream of revenues and net new assets and allows us to capture growth opportunities around the world. We serve our clients through three regionally focused divisions: Swiss Universal Bank, International Wealth Management and Asia Pacific. These regional businesses are supported by two other divisions specializing in investment banking capabilities: Global Markets and Investment Banking & Capital Markets. The Strategic Resolution Unit consolidates the remaining portfolios from the former non- strategic units plus additional businesses and positions that do not fit with our strategic direction. Our business divisions cooperate closely to provide holistic financial solutions, including innovative products and specially tailored advice.

Credit Suisse results
3
ICredit Suisse results
Operating environment 4
Credit Suisse 7
Swiss Universal Bank 17
International Wealth Management 23
Asia Pacific 30
Global Markets 36
Investment Banking & Capital Markets 39
Strategic Resolution Unit 42
Corporate Center 45
Assets under management 47

4 Credit Suisse results
Operating environment
Yield curves
Major government bond yields remained broadly unchanged.
%
USD
0 5 10 15 20 25
-1
0
1
2
3
Years
%
EUR
0 5 10 15 20 25Years
%
CHF
0 5 10 15 20 25
-1
0
1
2
3
Years
-1
0
1
2
3
p June 30, 2017 p September 30, 2017
Source: Datastream, Credit Suisse
Operating environmentGlobal economic growth appeared to remain robust in 3Q17, while inflation was low. Global equity markets ended the quarter higher, with European bank stocks in particular performing well, and volatility was low. Major government bond yields were stable and the US dollar depreciated against most major currencies. Commodities performed strongly.
ECONOMIC ENVIRONMENTThe US economy overall was robust during 3Q17, with consumer and business confidence measures continuing at the relatively high levels seen during the previous quarter. The devastating hur-ricane season caused some economic disruptions that may result in somewhat slower gross domestic product growth for 3Q17 com-pared to 2Q17. Core inflation showed some signs of stabilization during the quarter after the declines earlier in the year. In the Euro-zone, business sentiment improved, suggesting that the robust growth rates of past quarters are sustainable. Among emerging markets, Chinese data may point to a slowdown in growth activity, while both Brazil and Russia continued their recoveries.
The US Federal Reserve (Fed) announced at its Septem-ber meeting that it will start allowing its balance sheet to slowly shrink beginning in October 2017. The European Central Bank (ECB) left policy rates unchanged and in October announced that with respect to its asset purchase program it intends to decrease monthly purchases to EUR 30 billion from the beginning of 2018 until the end of September 2018 and may continue such pur-chases beyond this period if necessary. The Swiss National Bank (SNB) softened its language on the valuation of the Swiss franc, while the Bank of England (BoE) hinted at a rate hike in the com-ing months. Among major emerging markets, policy rates were lowered in Russia, Brazil and India during the quarter.
During 3Q17, global equities showed further positive momen-tum (refer to the charts under “Equity markets”), due to positive revisions to earnings estimates. Among developed markets, US and European equities slightly outperformed global equity markets
while Australian and UK equity markets underperformed. Emerg-ing market equities continued to outperform developed markets as they benefited from the US dollar weakening. Oil and commodity exporting emerging markets such as Russia and Brazil outper-formed due to the recovery in commodity prices in general, and oil prices in particular. Among sectors, materials, energy and IT were the top performers while consumer staples was the worst under-performer and the only sector posting a negative performance in 3Q17. Equity market volatility, as measured by the Chicago Board Options Exchange Market Volatility Index (VIX), reached its high-est year-to-date level in August, but ended the quarter at a low level. The Credit Suisse Hedge Fund Index increased 1.8% in 3Q17.
In fixed income, US dollar and euro long-dated government bond yields ended 3Q17 broadly unchanged compared to 2Q17. With credit spreads drifting lower, bond index returns were mostly positive with high yield bonds outperforming the general mar-ket. In US dollar rates, the yield curve marginally flattened (i.e., the 10-year vs. 2-year yield on US treasuries) on the expecta-tion of a continued subdued inflation environment. In euro rates, the German Bund curve steepened slightly, reflecting higher infla-tion expectations and a potential ECB tapering of its quantita-tive easing program. In credit markets, corporate bond spreads tightened, supported by loose financing conditions and a general positive economic backdrop. Emerging market sovereign bond spreads also narrowed reflecting the continued improved economic environment.

5Credit Suisse results
Operating environment
Equity markets
Global equities ended the quarter higher. Once again European bank stocks outperformed global stocks in general. Volatility remained low.
p Emerging markets Asia p Europe p MSCI World banks p MSCI European banks p VDAX p Emerging markets Latin America p North America p MSCI World p VIX Index
Source: Datastream, MSCI Barra, Credit Suisse Source: Datastream, MSCI Barra, Credit Suisse Source: Datastream, Credit Suisse
Index (June 30, 2017 = 100)
Performance region
90
95
100
105
110
115
2017 July August September July August September
Index (June 30, 2017 = 100)
Performance world banks
90
95
100
105
110
115
2017 2017July August September
%
Volatility
0
5
10
15
20
25
Credit spreads
Cash credit spreads slightly tightened. Derivative credit spreads remained relatively stable in 3Q17.
p European CDS (iTraxx) p North American CDS (CDX) bp: basis points
Source: Bloomberg, Credit Suisse
bp
48
51
54
57
60
63
66
2017 July August September
Emerging market hard currency bonds outperformed global high-yield bonds. In US dollar terms, emerging market local currency bonds performed even better due to strong currency gains, despite lower returns towards the end of 3Q17 as the US dollar regained some strength in September.
The US dollar depreciated against most major currencies in 3Q17 as weaker-than-anticipated US inflation weighed on inter-est rate expectations. The euro as well as Norwegian and Swed-ish krona were among the strongest currencies, benefitting from strong European economic growth. The British pound also appre-ciated. The Swiss franc was among the weakest currencies, depreciating both against the euro and US dollar, partly due to the reversal of safe-haven flows of capital, reflecting reduced eco-nomic and political risks in the Eurozone. In emerging markets, the South African rand was among the weakest currencies while the Brazilian real was one of the strongest currencies.
The Credit Suisse Commodities Benchmark more than reversed the losses suffered in 2Q17, gaining 7.9% in 3Q17. Energy was the strongest sector followed by base metals, which benefited from improved Chinese industrial activity. Precious met-als lost some of their initial gains later in the quarter, but ended the quarter 3.9% higher compared to 2Q17. Agricultural prices continued to underperform amid favorable crop conditions through the summer.
6 Credit Suisse results
Operating environment
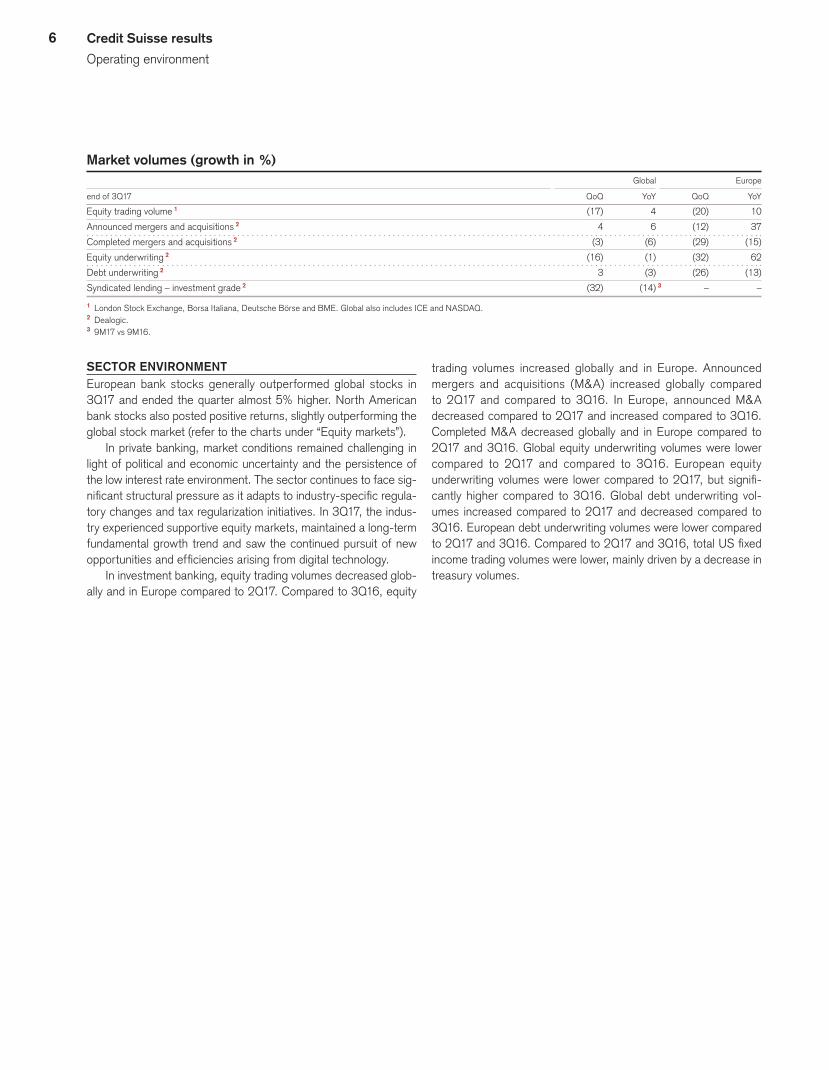
Market volumes (growth in %) Global Europe
end of 3Q17 QoQ YoY QoQ YoY
Equity trading volume 1 (17) 4 (20) 10
Announced mergers and acquisitions 2 4 6 (12) 37
Completed mergers and acquisitions 2 (3) (6) (29) (15)
Equity underwriting 2 (16) (1) (32) 62
Debt underwriting 2 3 (3) (26) (13)
Syndicated lending – investment grade 2 (32) (14) 3 – –
1 London Stock Exchange, Borsa Italiana, Deutsche Börse and BME. Global also includes ICE and NASDAQ.2 Dealogic.3 9M17 vs 9M16.
SECTOR ENVIRONMENTEuropean bank stocks generally outperformed global stocks in 3Q17 and ended the quarter almost 5% higher. North American bank stocks also posted positive returns, slightly outperforming the global stock market (refer to the charts under “Equity markets”).
In private banking, market conditions remained challenging in light of political and economic uncertainty and the persistence of the low interest rate environment. The sector continues to face sig-nificant structural pressure as it adapts to industry-specific regula-tory changes and tax regularization initiatives. In 3Q17, the indus-try experienced supportive equity markets, maintained a long-term fundamental growth trend and saw the continued pursuit of new opportunities and efficiencies arising from digital technology.
In investment banking, equity trading volumes decreased glob-ally and in Europe compared to 2Q17. Compared to 3Q16, equity
trading volumes increased globally and in Europe. Announced mergers and acquisitions (M&A) increased globally compared to 2Q17 and compared to 3Q16. In Europe, announced M&A decreased compared to 2Q17 and increased compared to 3Q16. Completed M&A decreased globally and in Europe compared to 2Q17 and 3Q16. Global equity underwriting volumes were lower compared to 2Q17 and compared to 3Q16. European equity underwriting volumes were lower compared to 2Q17, but signifi-cantly higher compared to 3Q16. Global debt underwriting vol-umes increased compared to 2Q17 and decreased compared to 3Q16. European debt underwriting volumes were lower compared to 2Q17 and 3Q16. Compared to 2Q17 and 3Q16, total US fixed income trading volumes were lower, mainly driven by a decrease in treasury volumes.

7Credit Suisse results
Credit Suisse
Credit SuisseIn 3Q17, we recorded net income attributable to shareholders of CHF 244 million. Diluted earnings per share were CHF 0.09 and return on equity attributable to shareholders was 2.2%. As of the end of 3Q17, our BIS CET1 ratio was 13.2% on a look-through basis.
Results in / end of % change in / end of % change
3Q17 2Q17 3Q16 QoQ YoY 9M17 9M16 YoY
Statements of operations (CHF million)
Net interest income 1,622 1,737 1,930 (7) (16) 4,992 5,940 (16)
Commissions and fees 2,762 2,905 2,680 (5) 3 8,713 8,151 7
Trading revenues 320 237 232 35 38 1,131 55 –
Other revenues 268 326 554 (18) (52) 875 996 (12)
Net revenues 4,972 5,205 5,396 (4) (8) 15,711 15,142 4
Provision for credit losses 32 82 55 (61) (42) 167 177 (6)
Compensation and benefits 2,451 2,542 2,674 (4) (8) 7,651 7,890 (3)
General and administrative expenses 1,630 1,580 1,978 3 (18) 4,858 5,586 (13)
Commission expenses 347 350 322 (1) 8 1,065 1,061 0
Restructuring expenses 112 69 145 62 (23) 318 491 (35)
Total other operating expenses 2,089 1,999 2,445 5 (15) 6,241 7,138 (13)
Total operating expenses 4,540 4,541 5,119 0 (11) 13,892 15,028 (8)
Income/(loss) before taxes 400 582 222 (31) 80 1,652 (63) –
Income tax expense 153 276 185 (45) (17) 507 27 –
Net income/(loss) 247 306 37 (19) – 1,145 (90) –
Net income/(loss) attributable to noncontrolling interests 3 3 (4) 0 – 2 1 100
Net income/(loss) attributable to shareholders 244 303 41 (19) 495 1,143 (91) –
Statement of operations metrics (%)
Return on regulatory capital 3.5 5.1 1.8 – – 4.8 (0.2) –
Cost/income ratio 91.3 87.2 94.9 – – 88.4 99.2 –
Effective tax rate 38.3 47.4 83.3 – – 30.7 (42.9) –
Earnings per share (CHF)
Basic earnings/(loss) per share 0.10 0.13 0.02 (23) 400 0.48 (0.04) –
Diluted earnings/(loss) per share 0.09 0.13 0.02 (31) 350 0.47 (0.04) –
Return on equity (%, annualized)
Return on equity attributable to shareholders 2.2 3.0 0.4 – – 3.6 (0.3) –
Return on tangible equity attributable to shareholders 1 2.5 3.4 0.4 – – 4.1 (0.3) –
Balance sheet statistics (CHF million)
Total assets 788,690 783,411 806,711 1 (2) 788,690 806,711 (2)
Risk-weighted assets 2 265,012 259,337 270,462 2 (2) 265,012 270,462 (2)
Leverage exposure 2 908,967 906,194 948,744 0 (4) 908,967 948,744 (4)
Number of employees (full-time equivalents)
Number of employees 46,720 46,230 47,690 1 (2) 46,720 47,690 (2)
1 Based on tangible shareholders’ equity attributable to shareholders, a non-GAAP financial measure, which is calculated by deducting goodwill and other intangible assets from total shareholders’ equity attributable to shareholders as presented in our balance sheet. Management believes that the return on tangible shareholders’ equity attributable to shareholders is meaningful as it allows consistent measurement of the performance of businesses without regard to whether the businesses were acquired.
2 Disclosed on a look-through basis.

8 Credit Suisse results
Credit Suisse
Credit Suisse
Core Results
Credit Suisse reporting structure
Credit Suisse includes the results of our six reporting segments, including the Strategic Resolution Unit, and the Corporate Center. Core Results do not include revenues and expenses from our Strategic Resolution Unit.
Swiss Universal Bank
International Wealth Management
Asia Pacific
Global Markets
Investment Banking & Capital Markets
Corporate Center
Strategic Resolution Unit
Private Clients
Private Banking
Wealth Management & Connected
Corporate & Institutional Clients
Asset Management
Markets
RESULTS SUMMARYIn 3Q17, Credit Suisse reported net income attributable to share-holders of CHF 244 million compared to CHF 303 million in 2Q17 and CHF 41 million in 3Q16.
Net revenues of CHF 4,972 million decreased 4% compared to 2Q17, primarily reflecting lower net revenues in Global Mar-kets and Swiss Universal Bank, partially offset by higher net rev-enues in the Corporate Center. The decrease in net revenues in Global Markets was primarily due to less favorable market condi-tions across its trading and underwriting businesses. The decrease in net revenues in Swiss Universal Bank was primarily driven by seasonally lower transaction-based revenues. The higher reve-nues in the Corporate Center reflected movements in treasury results, which also reflected the impact of a valuation methodology change.
Net revenues decreased 8% compared to 3Q16, primarily reflecting lower net revenues in Swiss Universal Bank and Global Markets and increased negative net revenues in the Strategic Res-olution Unit, partially offset by increased net revenues in Interna-tional Wealth Management. The decrease in net revenues in Swiss Universal Bank was mainly due to gains on the sale of real estate of CHF 346 million in 3Q16, partially offset by higher transac-tion-based revenues. Net revenues in Global Markets decreased compared to 3Q16 results, which had benefited from more favor-able market conditions. The increase in the Strategic Resolution Unit’s negative net revenues was primarily driven by a reduction in fee-based revenues as a result of accelerated business exits and higher exit losses related to the sale of legacy asset man-agement positions, partially offset by lower overall funding costs. The increase in net revenues in International Wealth Management reflected higher revenues across all revenue categories.
Provision for credit losses of CHF 32 million primarily related to a net provision for credit losses of CHF 14 million in Swiss Universal Bank, CHF 12 million in Investment Banking & Capital Markets, CHF 6 million in Global Markets and CHF 5 mil-lion in Asia Pacific, partially offset by a release of provision for credit losses of CHF 8 million in the Strategic Resolution Unit.
Total operating expenses of CHF 4,540 million were stable compared to 2Q17, reflecting a 3% increase in general and admin-istrative expenses and a 62% increase in restructuring expenses, offset by a 4% decrease in compensation and benefits. In 3Q17, we incurred CHF 112 million of restructuring expenses in connec-tion with the implementation of our strategy, of which CHF 99 mil-lion were compensation and benefits-related expenses.
Total operating expenses decreased 11% compared to 3Q16, primarily reflecting an 18% decrease in general and administrative expenses, mainly relating to lower litigation provisions and profes-sional fees, an 8% decrease in compensation and benefits and a 23% decrease in restructuring expenses.
Income tax expense of CHF 153 million recorded in 3Q17 mainly reflected the impact of the geographical mix of results and the impact from recognizing tax contingency accruals, partially offset by the impact of a re-assessment of a previously taken tax position relating to the deductibility of funding costs. Overall, net deferred tax assets decreased CHF 79 million to CHF 7,232 million, mainly driven by earnings, partially offset by a foreign exchange impact. Deferred tax assets on net operating losses decreased CHF 121 million to CHF 2,666 million during 3Q17. The Credit Suisse effec-tive tax rate was 38.3% in 3Q17, compared to 47.4% in 2Q17.u Refer to “Note 22 – Tax” in III – Condensed consolidated financial statements – unaudited for further information.

9Credit Suisse results
Credit Suisse
Overview of Results
Investment Swiss International Banking & Strategic Universal Wealth Global Capital Corporate Core Resolution Credit in / end of Bank Management Asia Pacific Markets Markets Center Results Unit Suisse
3Q17 (CHF million)
Net revenues 1,319 1,262 890 1,262 457 37 5,227 (255) 4,972
Provision for credit losses 14 3 5 6 12 0 40 (8) 32
Compensation and benefits 462 543 397 568 293 103 2,366 85 2,451
Total other operating expenses 417 361 270 617 117 61 1,843 246 2,089
of which general and administrative expenses 340 285 195 451 99 44 1,414 216 1,630
of which restructuring expenses 13 16 10 27 16 9 91 21 112
Total operating expenses 879 904 667 1,185 410 164 4,209 331 4,540
Income/(loss) before taxes 426 355 218 71 35 (127) 978 (578) 400
Return on regulatory capital (%) 13.2 26.9 16.8 2.0 5.2 – 9.3 – 3.5
Cost/income ratio (%) 66.6 71.6 74.9 93.9 89.7 – 80.5 – 91.3
Total assets 228,647 88,692 95,919 239,910 20,477 65,636 739,281 49,409 788,690
Goodwill 606 1,540 1,485 456 628 0 4,715 0 4,715
Risk-weighted assets 1 64,519 37,217 31,237 55,993 19,486 20,718 229,170 35,842 265,012
Leverage exposure 1 256,207 93,455 106,128 281,531 42,794 63,467 843,582 65,385 908,967
2Q17 (CHF million)
Net revenues 1,405 1,264 848 1,517 511 (66) 5,479 (274) 5,205
Provision for credit losses 36 8 (1) 12 13 1 69 13 82
Compensation and benefits 466 556 387 629 303 107 2,448 94 2,542
Total other operating expenses 401 335 274 619 117 71 1,817 182 1,999
of which general and administrative expenses 327 265 199 460 104 61 1,416 164 1,580
of which restructuring expenses (4) 7 11 32 10 2 58 11 69
Total operating expenses 867 891 661 1,248 420 178 4,265 276 4,541
Income/(loss) before taxes 502 365 188 257 78 (245) 1,145 (563) 582
Return on regulatory capital (%) 15.5 28.3 14.4 7.4 12.0 – 10.9 – 5.1
Cost/income ratio (%) 61.7 70.5 77.9 82.3 82.2 – 77.8 – 87.2
Total assets 235,562 89,163 90,948 228,858 20,973 63,480 728,984 54,427 783,411
Goodwill 602 1,523 1,473 452 623 0 4,673 0 4,673
Risk-weighted assets 1 64,426 36,515 32,293 51,333 18,648 18,021 221,236 38,101 259,337
Leverage exposure 1 260,479 93,107 101,583 276,483 43,073 59,858 834,583 71,611 906,194
3Q16 (CHF million)
Net revenues 1,667 1,081 917 1,357 467 72 5,561 (165) 5,396
Provision for credit losses 30 0 34 (5) (9) 0 50 5 55
Compensation and benefits 474 513 413 642 313 185 2,540 134 2,674
Total other operating expenses 405 323 318 633 124 94 1,897 548 2,445
of which general and administrative expenses 320 256 224 466 109 89 1,464 514 1,978
of which restructuring expenses 19 15 23 52 15 0 124 21 145
Total operating expenses 879 836 731 1,275 437 279 4,437 682 5,119
Income/(loss) before taxes 758 245 152 87 39 (207) 1,074 (852) 222
Return on regulatory capital (%) 24.7 20.5 11.3 2.5 6.1 – 10.4 – 1.8
Cost/income ratio (%) 52.7 77.3 79.7 94.0 93.6 – 79.8 – 94.9
Total assets 222,164 86,457 93,079 245,492 19,931 62,007 729,130 77,581 806,711
Goodwill 607 1,532 1,500 457 629 0 4,725 0 4,725
Risk-weighted assets 1 65,571 33,457 32,264 51,127 18,019 16,756 217,194 53,268 270,462
Leverage exposure 1 246,254 88,899 108,495 286,694 44,240 59,154 833,736 115,008 948,744
1 Disclosed on a look-through basis.

10 Credit Suisse results
Credit Suisse
Overview of Results (continued)
Investment Swiss International Banking & Strategic Universal Wealth Global Capital Corporate Core Resolution Credit in / end of Bank Management Asia Pacific Markets Markets Center Results Unit Suisse
9M17 (CHF million)
Net revenues 4,078 3,747 2,619 4,388 1,574 40 16,446 (735) 15,711
Provision for credit losses 60 13 8 23 31 3 138 29 167
Compensation and benefits 1,380 1,655 1,208 1,887 944 310 7,384 267 7,651
Total other operating expenses 1,306 1,068 850 1,833 337 198 5,592 649 6,241
of which general and administrative expenses 1,023 832 614 1,349 304 149 4,271 587 4,858
of which restructuring expenses 61 59 40 79 28 12 279 39 318
Total operating expenses 2,686 2,723 2,058 3,720 1,281 508 12,976 916 13,892
Income/(loss) before taxes 1,332 1,011 553 645 262 (471) 3,332 (1,680) 1,652
Return on regulatory capital (%) 13.8 26.1 13.9 6.1 13.2 – 10.5 – 4.8
Cost/income ratio (%) 65.9 72.7 78.6 84.8 81.4 – 78.9 – 88.4
9M16 (CHF million)
Net revenues 4,360 3,399 2,735 4,232 1,398 87 16,211 (1,069) 15,142
Provision for credit losses 45 14 15 1 20 (1) 94 83 177
Compensation and benefits 1,440 1,554 1,236 2,091 908 155 7,384 506 7,890
Total other operating expenses 1,232 1,041 862 2,097 358 342 5,932 1,206 7,138
of which general and administrative expenses 959 827 617 1,526 323 298 4,550 1,036 5,586
of which restructuring expenses 63 38 34 202 34 0 371 120 491
Total operating expenses 2,672 2,595 2,098 4,188 1,266 497 13,316 1,712 15,028
Income/(loss) before taxes 1,643 790 622 43 112 (409) 2,801 (2,864) (63)
Return on regulatory capital (%) 18.0 22.2 15.9 0.4 6.4 – 9.1 – (0.2)
Cost/income ratio (%) 61.3 76.3 76.7 99.0 90.6 – 82.1 – 99.2
CORE RESULTSIn 3Q17, Core Results net revenues of CHF 5,227 million decreased 5% compared to 2Q17, primarily reflecting lower net rev-enues in Global Markets and Swiss Universal Bank, partially offset by higher net revenues in the Corporate Center. Provision for credit losses was CHF 40 million, primarily related to a net provision for credit losses of CHF 14 million in Swiss Universal Bank, CHF 12 million in Investment Banking & Capital Markets, CHF 6 million in Global Markets and CHF 5 million in Asia Pacific. Total operat-ing expenses of CHF 4,209 million decreased slightly compared to 2Q17, mainly reflecting a 3% decrease in compensation and
benefits, partially offset by an increase in restructuring expenses. Compared to 2Q17, restructuring expenses of CHF 91 million increased 57%, primarily in Swiss Universal Bank and International Wealth Management.
Core Results net revenues decreased 6% compared to 3Q16, primarily reflecting lower net revenues in Swiss Universal Bank and Global Markets, partially offset by an increase in International Wealth Management. Total operating expenses decreased 5% compared to 3Q16, primarily reflecting a 7% decrease in compen-sation and benefits, a 3% decrease in general and administrative expenses and a 27% decrease in restructuring expenses.

11Credit Suisse results
Credit Suisse
Reconciliation of adjusted results
Adjusted results referred to in this report are non-GAAP financial measures that exclude goodwill impairment and certain other revenues and expenses included in our reported results. Management believes that adjusted results provide a useful presentation of our operat-ing results for purposes of assessing our Group and divisional performance consistently over time, on a basis that excludes items that management does not consider representative of our underlying performance. Provided below is a reconciliation of our adjusted results to the most directly comparable US GAAP measures. Investment Swiss International Banking & Strategic Universal Wealth Asia Global Capital Corporate Core Resolution Credit in Bank Management Pacific Markets Markets Center Results Unit Suisse
3Q17
Net revenues 1,319 1,262 890 1,262 457 37 5,227 (255) 4,972
Provision for credit losses 14 3 5 6 12 0 40 (8) 32
Total operating expenses 879 904 667 1,185 410 164 4,209 331 4,540
Restructuring expenses (13) (16) (10) (27) (16) (9) (91) (21) (112)
Major litigation provisions (9) (11) 0 0 0 0 (20) (88) (108)
Total operating expenses adjusted 857 877 657 1,158 394 155 4,098 222 4,320
Income/(loss) before taxes 426 355 218 71 35 (127) 978 (578) 400
Total adjustments 22 27 10 27 16 9 111 109 220
Adjusted income/(loss) before taxes 448 382 228 98 51 (118) 1,089 (469) 620
Adjusted return on regulatory capital (%) 13.9 28.9 17.6 2.8 7.6 – 10.4 – 5.5
2Q17
Net revenues 1,405 1,264 848 1,517 511 (66) 5,479 (274) 5,205
Provision for credit losses 36 8 (1) 12 13 1 69 13 82
Total operating expenses 867 891 661 1,248 420 178 4,265 276 4,541
Restructuring expenses 4 (7) (11) (32) (10) (2) (58) (11) (69)
Major litigation provisions (6) (6) 0 0 0 0 (12) (21) (33)
Total operating expenses adjusted 865 878 650 1,216 410 176 4,195 244 4,439
Income/(loss) before taxes 502 365 188 257 78 (245) 1,145 (563) 582
Total adjustments 2 13 11 32 10 2 70 32 102
Adjusted income/(loss) before taxes 504 378 199 289 88 (243) 1,215 (531) 684
Adjusted return on regulatory capital (%) 15.6 29.3 15.3 8.3 13.5 – 11.5 – 5.9
3Q16
Net revenues 1,667 1,081 917 1,357 467 72 5,561 (165) 5,396
Real estate gains (346) 0 0 0 0 0 (346) 0 (346)
Net revenues adjusted 1,321 1,081 917 1,357 467 72 5,215 (165) 5,050
Provision for credit losses 30 0 34 (5) (9) 0 50 5 55
Total operating expenses 879 836 731 1,275 437 279 4,437 682 5,119
Restructuring expenses (19) (15) (23) (52) (15) 0 (124) (21) (145)
Major litigation provisions 0 19 0 (7) 0 0 12 (318) (306)
Total operating expenses adjusted 860 840 708 1,216 422 279 4,325 343 4,668
Income/(loss) before taxes 758 245 152 87 39 (207) 1,074 (852) 222
Total adjustments (327) (4) 23 59 15 0 (234) 339 105
Adjusted income/(loss) before taxes 431 241 175 146 54 (207) 840 (513) 327
Adjusted return on regulatory capital (%) 14.0 20.1 12.9 4.1 8.6 – 8.1 – 2.7
Adjusted return on regulatory capital is calculated using adjusted results, applying the same methodology used to calculate return on regulatory capital.
12 Credit Suisse results
Credit Suisse
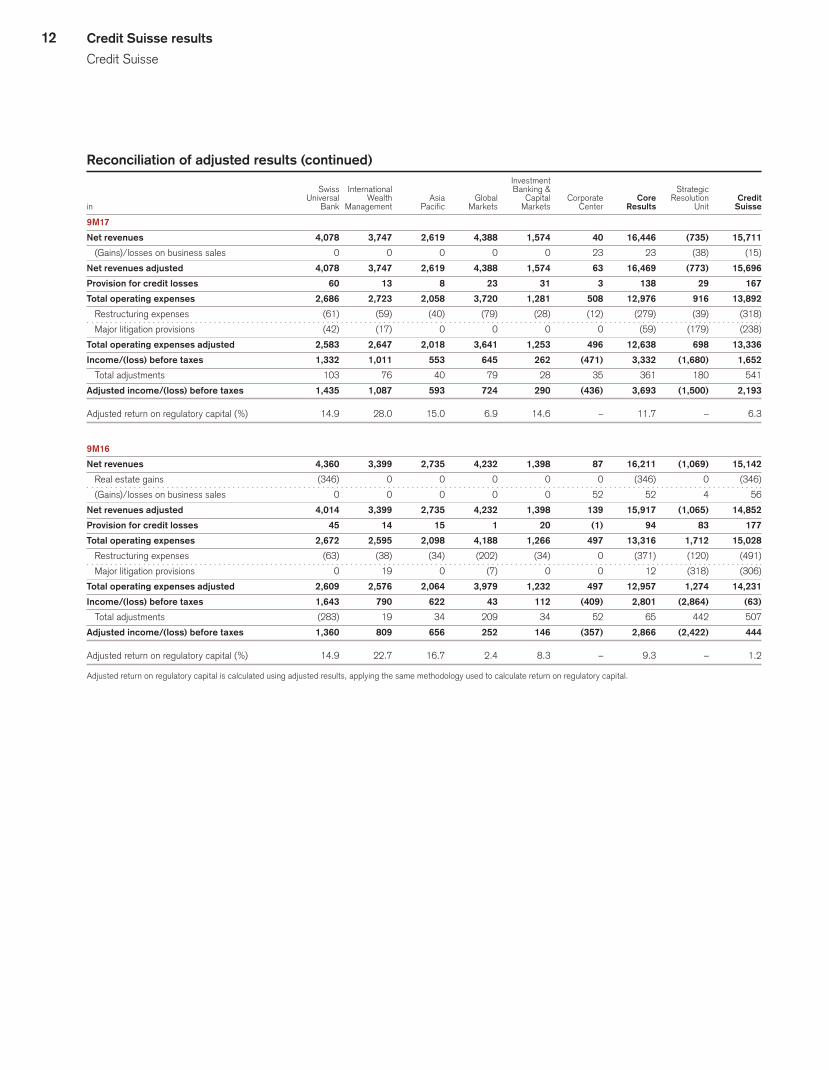
Reconciliation of adjusted results (continued) Investment Swiss International Banking & Strategic Universal Wealth Asia Global Capital Corporate Core Resolution Credit in Bank Management Pacific Markets Markets Center Results Unit Suisse
9M17
Net revenues 4,078 3,747 2,619 4,388 1,574 40 16,446 (735) 15,711
(Gains)/losses on business sales 0 0 0 0 0 23 23 (38) (15)
Net revenues adjusted 4,078 3,747 2,619 4,388 1,574 63 16,469 (773) 15,696
Provision for credit losses 60 13 8 23 31 3 138 29 167
Total operating expenses 2,686 2,723 2,058 3,720 1,281 508 12,976 916 13,892
Restructuring expenses (61) (59) (40) (79) (28) (12) (279) (39) (318)
Major litigation provisions (42) (17) 0 0 0 0 (59) (179) (238)
Total operating expenses adjusted 2,583 2,647 2,018 3,641 1,253 496 12,638 698 13,336
Income/(loss) before taxes 1,332 1,011 553 645 262 (471) 3,332 (1,680) 1,652
Total adjustments 103 76 40 79 28 35 361 180 541
Adjusted income/(loss) before taxes 1,435 1,087 593 724 290 (436) 3,693 (1,500) 2,193
Adjusted return on regulatory capital (%) 14.9 28.0 15.0 6.9 14.6 – 11.7 – 6.3
9M16
Net revenues 4,360 3,399 2,735 4,232 1,398 87 16,211 (1,069) 15,142
Real estate gains (346) 0 0 0 0 0 (346) 0 (346)
(Gains)/losses on business sales 0 0 0 0 0 52 52 4 56
Net revenues adjusted 4,014 3,399 2,735 4,232 1,398 139 15,917 (1,065) 14,852
Provision for credit losses 45 14 15 1 20 (1) 94 83 177
Total operating expenses 2,672 2,595 2,098 4,188 1,266 497 13,316 1,712 15,028
Restructuring expenses (63) (38) (34) (202) (34) 0 (371) (120) (491)
Major litigation provisions 0 19 0 (7) 0 0 12 (318) (306)
Total operating expenses adjusted 2,609 2,576 2,064 3,979 1,232 497 12,957 1,274 14,231
Income/(loss) before taxes 1,643 790 622 43 112 (409) 2,801 (2,864) (63)
Total adjustments (283) 19 34 209 34 52 65 442 507
Adjusted income/(loss) before taxes 1,360 809 656 252 146 (357) 2,866 (2,422) 444
Adjusted return on regulatory capital (%) 14.9 22.7 16.7 2.4 8.3 – 9.3 – 1.2
Adjusted return on regulatory capital is calculated using adjusted results, applying the same methodology used to calculate return on regulatory capital.

13Credit Suisse results
Credit Suisse
Core Results by business activity
in 3Q17 2Q17 3Q16
Investment Swiss International Banking & Universal Wealth Global Capital Corporate Core Core Core Bank Management Asia Pacific Markets Markets Center Results Results Results
Related to private banking (CHF million)
Net revenues 727 870 400 – – – 1,997 2,065 2,188
of which net interest income 421 367 144 – – – 932 929 898
of which recurring 205 300 97 – – – 602 598 556
of which transaction-based 101 203 159 – – – 463 537 389
Provision for credit losses 9 3 (1) – – – 11 13 50
Total operating expenses 512 615 261 – – – 1,388 1,384 1,357
Income before taxes 206 252 140 – – – 598 668 781
Related to corporate & institutional banking
Net revenues 592 – – – – – 592 672 614
of which net interest income 303 – – – – – 303 309 311
of which recurring 149 – – – – – 149 161 156
of which transaction-based 161 – – – – – 161 207 160
Provision for credit losses 5 – – – – – 5 25 18
Total operating expenses 367 – – – – – 367 367 364
Income before taxes 220 – – – – – 220 280 232
Related to investment banking
Net revenues – – 490 1,262 457 – 2,209 2,471 2,395
of which fixed income sales and trading – – 80 698 – – 778 912 904
of which equity sales and trading – – 262 383 – – 645 689 650
of which underwriting and advisory – – 148 1 240 478 – 866 931 891
Provision for credit losses – – 6 6 12 – 24 30 (18)
Total operating expenses – – 406 1,185 410 – 2,001 2,067 2,194
Income before taxes – – 78 71 35 – 184 374 219
Related to asset management
Net revenues – 392 – – – – 392 337 292
Total operating expenses – 289 – – – – 289 269 243
Income before taxes – 103 – – – – 103 68 49
Related to corporate center
Net revenues – – – – – 37 37 (66) 72
Provision for credit losses – – – – – 0 0 1 0
Total operating expenses – – – – – 164 164 178 279
Loss before taxes – – – – – (127) (127) (245) (207)
Total
Net revenues 1,319 1,262 890 1,262 457 37 5,227 5,479 5,561
Provision for credit losses 14 3 5 6 12 0 40 69 50
Total operating expenses 879 904 667 1,185 410 164 4,209 4,265 4,437
Income/(loss) before taxes 426 355 218 71 35 (127) 978 1,145 1,074
Certain transaction-based revenues in Swiss Universal Bank and certain fixed income and equity sales and trading revenues in Asia Pacific and Global Markets relate to the Group’s global advisory and underwriting business. Refer to “Global advisory and underwriting revenues” in Investment Banking & Capital Markets for further information.1 Reflects certain financing revenues in Asia Pacific that are not included in the Group’s global advisory and underwriting revenues.
14 Credit Suisse results
Credit Suisse
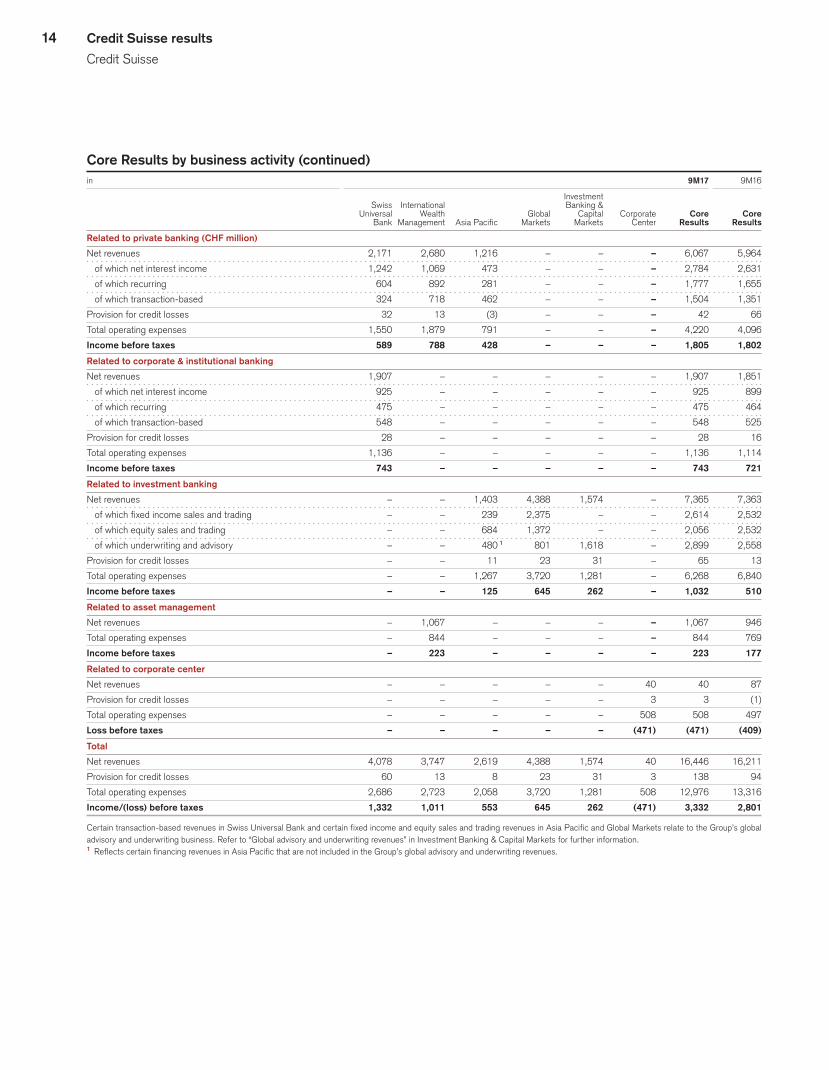
Core Results by business activity (continued)
in 9M17 9M16
Investment Swiss International Banking & Universal Wealth Global Capital Corporate Core Core Bank Management Asia Pacific Markets Markets Center Results Results
Related to private banking (CHF million)
Net revenues 2,171 2,680 1,216 – – – 6,067 5,964
of which net interest income 1,242 1,069 473 – – – 2,784 2,631
of which recurring 604 892 281 – – – 1,777 1,655
of which transaction-based 324 718 462 – – – 1,504 1,351
Provision for credit losses 32 13 (3) – – – 42 66
Total operating expenses 1,550 1,879 791 – – – 4,220 4,096
Income before taxes 589 788 428 – – – 1,805 1,802
Related to corporate & institutional banking
Net revenues 1,907 – – – – – 1,907 1,851
of which net interest income 925 – – – – – 925 899
of which recurring 475 – – – – – 475 464
of which transaction-based 548 – – – – – 548 525
Provision for credit losses 28 – – – – – 28 16
Total operating expenses 1,136 – – – – – 1,136 1,114
Income before taxes 743 – – – – – 743 721
Related to investment banking
Net revenues – – 1,403 4,388 1,574 – 7,365 7,363
of which fixed income sales and trading – – 239 2,375 – – 2,614 2,532
of which equity sales and trading – – 684 1,372 – – 2,056 2,532
of which underwriting and advisory – – 480 1 801 1,618 – 2,899 2,558
Provision for credit losses – – 11 23 31 – 65 13
Total operating expenses – – 1,267 3,720 1,281 – 6,268 6,840
Income before taxes – – 125 645 262 – 1,032 510
Related to asset management
Net revenues – 1,067 – – – – 1,067 946
Total operating expenses – 844 – – – – 844 769
Income before taxes – 223 – – – – 223 177
Related to corporate center
Net revenues – – – – – 40 40 87
Provision for credit losses – – – – – 3 3 (1)
Total operating expenses – – – – – 508 508 497
Loss before taxes – – – – – (471) (471) (409)
Total
Net revenues 4,078 3,747 2,619 4,388 1,574 40 16,446 16,211
Provision for credit losses 60 13 8 23 31 3 138 94
Total operating expenses 2,686 2,723 2,058 3,720 1,281 508 12,976 13,316
Income/(loss) before taxes 1,332 1,011 553 645 262 (471) 3,332 2,801
Certain transaction-based revenues in Swiss Universal Bank and certain fixed income and equity sales and trading revenues in Asia Pacific and Global Markets relate to the Group’s global advisory and underwriting business. Refer to “Global advisory and underwriting revenues” in Investment Banking & Capital Markets for further information.1 Reflects certain financing revenues in Asia Pacific that are not included in the Group’s global advisory and underwriting revenues.

15Credit Suisse results
Credit Suisse
End of / in 3Q17 (CHF billion, except where indicated)
Shareholders’ equity 43.9
Return on equity 2.2%
Tangible shareholders’ equity 38.9
Return on tangible shareholders’ equity 2.5%
Regulatory capital 31.8
Return on regulatory capital 3.5%7.1
5.0
EMPLOYEES AND OTHER HEADCOUNTThere were 46,720 Group employees as of the end of 3Q17, an increase of 490 compared to 2Q17, primarily reflecting seasonal graduate hiring as well a transfer of contractors to employees, pri-marily in International Wealth Management, Global Markets and Investment Banking & Capital Markets. The number of outsourced roles, contractors and consultants decreased by 80 compared to 2Q17.
Employees and other headcountend of 3Q17 2Q17 3Q16
Employees (full-time equivalents)
Swiss Universal Bank 12,600 12,610 13,440
International Wealth Management 10,110 9,930 10,350
Asia Pacific 7,050 7,000 7,140
Global Markets 11,760 11,620 11,680
Investment Banking & Capital Markets 3,260 3,130 2,910
Strategic Resolution Unit 1,640 1,640 1,840
Corporate Center 300 300 330
Total employees 46,720 46,230 47,690
Other headcount
Outsourced roles, contractors and consultants 22,010 22,090 25,060
Total employees and other headcount 68,730 68,320 72,750
REGULATORY CAPITALAs of the end of 3Q17, our Bank for International Settlements (BIS) common equity tier 1 (CET1) ratio was 13.2% and our risk-weighted assets (RWA) were CHF 265.0 billion, both on a look-through basis.
Effective July 1, 2017, the Swiss Financial Market Supervisory Authority FINMA (FINMA) has imposed an add-on to our risk-weighted assets relating to operational risk, primarily in respect of our residential mortgage-backed securities (RMBS) settlements. The add-on was CHF 5.2 billion in 3Q17, primarily in respect of the settlement with the US Department of Justice in January 2017 regarding our legacy RMBS business. Separately, Credit Suisse has approached FINMA with a request to review the appropriate-ness of the level of the operational risk RWA in the Strategic Reso-lution Unit given the progress in reducing the size of the division over the last seven quarters, with the aim of aligning reductions to the accelerated closure of the Strategic Resolution Unit by the end of 2018. This is still under discussion with FINMA.
As a consequence of the RMBS settlements with the National Credit Union Administration Board in May 2017 and with Mas-sachusetts Mutual Life Insurance Company in September 2017, additional FINMA-imposed add-ons to our risk-weighted assets of CHF 3.2 billion and CHF 0.6 billion, respectively, are expected to be recognized in 4Q17.u Refer to “Capital management” in II – Treasury, risk, balance sheet and off-balance sheet for further information.
INFORMATION AND DEVELOPMENTSFormat of presentationIn managing our business, revenues are evaluated in the aggre-gate, including an assessment of trading gains and losses and the related interest income and expense from financing and hedging positions. For this reason, specific individual revenue categories in isolation may not be indicative of performance.
Certain reclassifications have been made to prior periods to conform to the current presentation.
International Trading SolutionsEffective July 1, 2017, the Global Markets division entered into an agreement with Swiss Universal Bank and International Wealth Management whereby it provides centralized trading and sales ser-vices to private and institutional clients across the three divisions. These services are now managed as a single business within the Global Markets division, referred to as International Trading Solu-tions (ITS). ITS is expected to provide aligned market strategies, significant cost synergies and enhanced client focus.
Return on regulatory capitalCredit Suisse measures firm-wide returns against total sharehold-ers’ equity and tangible shareholders’ equity. In addition, it also measures the efficiency of the firm and its divisions with regard to the usage of capital as determined by the minimum require-ments set by regulators. This regulatory capital is calculated as the worst of 10% of risk-weighted assets and 3.5% of the leverage exposure. Return on regulatory capital is calculated using income/(loss) after tax and assumes a tax rate of 30% and capital allo-cated based on the worst of 10% of average risk-weighted assets and 3.5% of average leverage exposure. These percentages are used in the calculation in order to reflect the 2019 fully phased in Swiss regulatory minimum requirements for Basel III CET1 capital and leverage ratio. For Global Markets and Investment Banking & Capital Markets, return on regulatory capital is based on US dollar denominated numbers.
16 Credit Suisse results
Credit Suisse
Fair valuationsFair value can be a relevant measurement for financial instruments when it aligns the accounting for these instruments with how we manage our business. The levels of the fair value hierarchy as defined by the relevant accounting guidance are not a measure-ment of economic risk, but rather an indication of the observability of prices or valuation inputs.u Refer to “Note 1 – Summary of significant accounting policies” and “Note 28 – Financial instruments” in III – Condensed consolidated financial statements – unaudited for further information.
Models were used to value financial instruments for which no prices are available and which have little or no observable inputs (level 3). Models are developed internally and are reviewed by functions independent of the front office to ensure they are appropriate for current market conditions. The models require subjective assess-ment and varying degrees of judgment depending on liquidity, con-centration, pricing assumptions and risks affecting the specific instrument. The models consider observable and unobservable parameters in calculating the value of these products, including certain indices relating to these products. Consideration of these indices is more significant in periods of lower market activity.
As of the end of 3Q17, 39% and 25% of our total assets and total liabilities, respectively, were measured at fair value.
The majority of our level 3 assets are recorded in our invest-ment banking businesses. As of the end of 3Q17, total assets at fair value recorded as level 3 of CHF 17.6 billion were stable compared to the end of 2Q17, primarily reflecting net settlements, mainly in loans and loans held-for-sale, offset by net purchases, mainly in trading assets, and a foreign exchange translation impact, mainly in trading assets, loans held-for-sale and loans.
As of the end of 3Q17, our level 3 assets comprised 2% of total assets and 6% of total assets measured at fair value, unchanged from 2Q17.
We believe that the range of any valuation uncertainty, in the aggregate, would not be material to our financial condition; however, it may be material to our operating results for any particular period, depending, in part, upon the operating results for such period.
EVOLUTION OF LEGAL ENTITY STRUCTUREThe global service company initiative has continued to make progress in 3Q17 in evolving the legal entity structure of the bank and ensur-ing continued provision of critical services for the Group in case of a resolution event. A branch of Credit Suisse Services AG has been registered in Singapore as Credit Suisse Services AG, Singapore Branch, which is expected to become operational in 2018.
REGULATORY DEVELOPMENTS AND PROPOSALSGovernment leaders and regulators continued to focus on reform of the financial services industry, including capital, leverage and liquidity requirements, changes in compensation practices and systemic risk.
In September 2017, the Fed and the Federal Deposit Insurance Corporation each issued final rules that substantially implement their respective proposed rules designed to improve the resolvability of US headquartered global systematically important banks (G-SIBs) and the US operations of non-US G-SIBs, such as our US opera-tions. Covered “qualified financial contracts” must be conformed to the rules’ requirements starting January 1, 2019, with full compliance by January 1, 2020. The Office of the Comptroller of the Currency is expected to issue parallel final rules as well.u Refer to “Regulation and supervision” in I – Information on the company in the Credit Suisse Annual Report 2016 for further information and “Regulatory framework” and “Regulatory developments and proposals” in II – Treasury, risk, balance sheet and off-balance sheet – Liquidity and funding management and Capital management, respectively, for further information.
17Credit Suisse results
Swiss Universal Bank
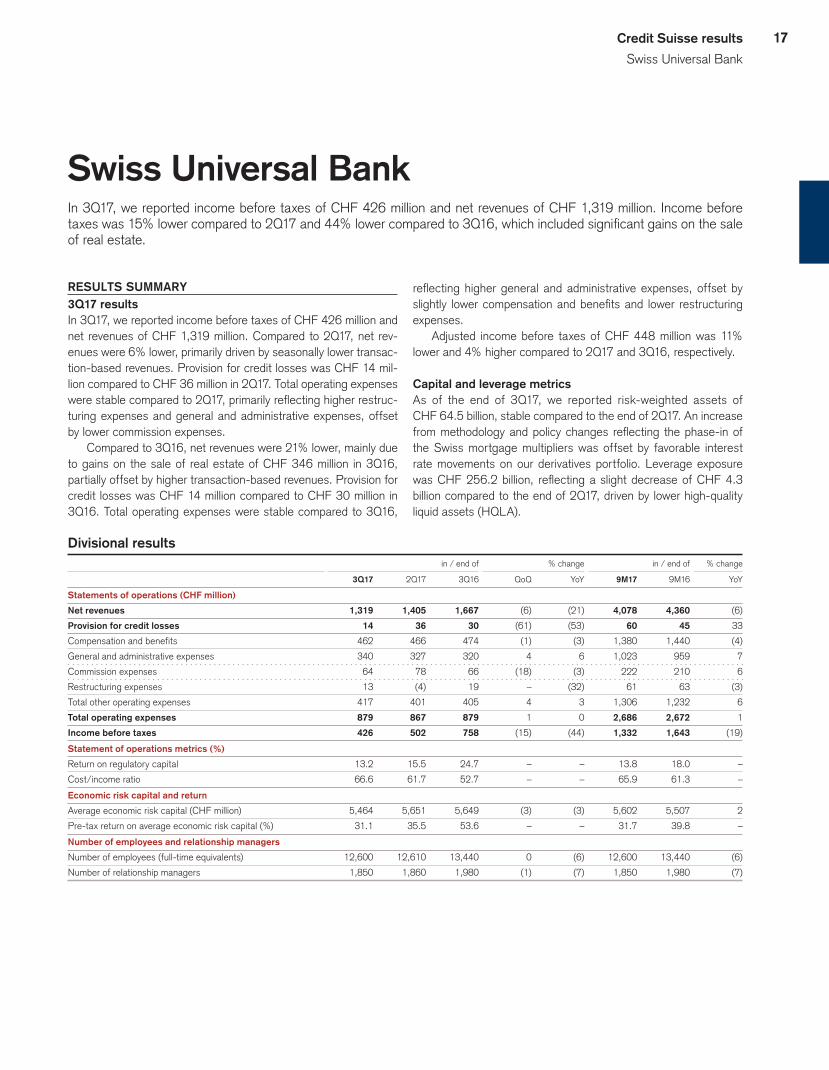
Swiss Universal BankIn 3Q17, we reported income before taxes of CHF 426 million and net revenues of CHF 1,319 million. Income before taxes was 15% lower compared to 2Q17 and 44% lower compared to 3Q16, which included significant gains on the sale of real estate.
RESULTS SUMMARY3Q17 resultsIn 3Q17, we reported income before taxes of CHF 426 million and net revenues of CHF 1,319 million. Compared to 2Q17, net rev-enues were 6% lower, primarily driven by seasonally lower transac-tion-based revenues. Provision for credit losses was CHF 14 mil-lion compared to CHF 36 million in 2Q17. Total operating expenses were stable compared to 2Q17, primarily reflecting higher restruc-turing expenses and general and administrative expenses, offset by lower commission expenses.
Compared to 3Q16, net revenues were 21% lower, mainly due to gains on the sale of real estate of CHF 346 million in 3Q16, partially offset by higher transaction-based revenues. Provision for credit losses was CHF 14 million compared to CHF 30 million in 3Q16. Total operating expenses were stable compared to 3Q16,
reflecting higher general and administrative expenses, offset by slightly lower compensation and benefits and lower restructuring expenses.
Adjusted income before taxes of CHF 448 million was 11% lower and 4% higher compared to 2Q17 and 3Q16, respectively.
Capital and leverage metricsAs of the end of 3Q17, we reported risk-weighted assets of CHF 64.5 billion, stable compared to the end of 2Q17. An increase from methodology and policy changes reflecting the phase-in of the Swiss mortgage multipliers was offset by favorable interest rate movements on our derivatives portfolio. Leverage exposure was CHF 256.2 billion, reflecting a slight decrease of CHF 4.3 billion compared to the end of 2Q17, driven by lower high-quality liquid assets (HQLA).
Divisional results in / end of % change in / end of % change
3Q17 2Q17 3Q16 QoQ YoY 9M17 9M16 YoY
Statements of operations (CHF million)
Net revenues 1,319 1,405 1,667 (6) (21) 4,078 4,360 (6)
Provision for credit losses 14 36 30 (61) (53) 60 45 33
Compensation and benefits 462 466 474 (1) (3) 1,380 1,440 (4)
General and administrative expenses 340 327 320 4 6 1,023 959 7
Commission expenses 64 78 66 (18) (3) 222 210 6
Restructuring expenses 13 (4) 19 – (32) 61 63 (3)
Total other operating expenses 417 401 405 4 3 1,306 1,232 6
Total operating expenses 879 867 879 1 0 2,686 2,672 1
Income before taxes 426 502 758 (15) (44) 1,332 1,643 (19)
Statement of operations metrics (%)
Return on regulatory capital 13.2 15.5 24.7 – – 13.8 18.0 –
Cost/income ratio 66.6 61.7 52.7 – – 65.9 61.3 –
Economic risk capital and return
Average economic risk capital (CHF million) 5,464 5,651 5,649 (3) (3) 5,602 5,507 2
Pre-tax return on average economic risk capital (%) 31.1 35.5 53.6 – – 31.7 39.8 –
Number of employees and relationship managers
Number of employees (full-time equivalents) 12,600 12,610 13,440 0 (6) 12,600 13,440 (6)
Number of relationship managers 1,850 1,860 1,980 (1) (7) 1,850 1,980 (7)
18 Credit Suisse results
Swiss Universal Bank
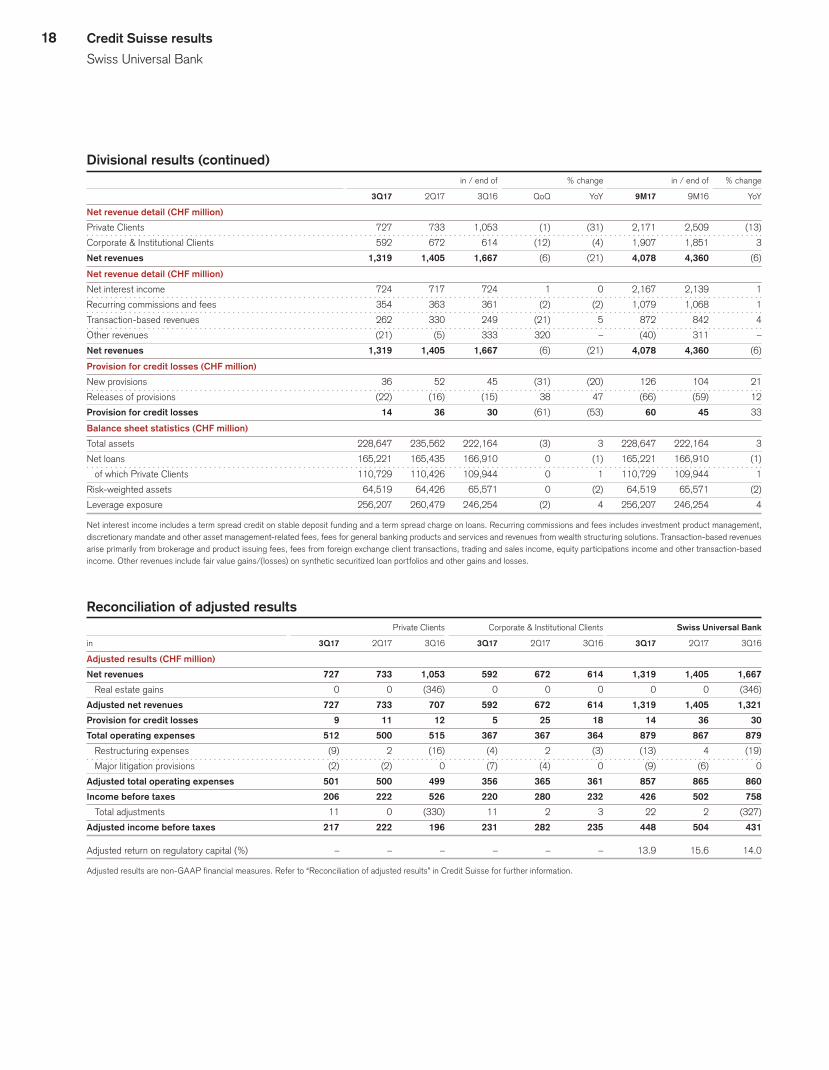
Divisional results (continued) in / end of % change in / end of % change
3Q17 2Q17 3Q16 QoQ YoY 9M17 9M16 YoY
Net revenue detail (CHF million)
Private Clients 727 733 1,053 (1) (31) 2,171 2,509 (13)
Corporate & Institutional Clients 592 672 614 (12) (4) 1,907 1,851 3
Net revenues 1,319 1,405 1,667 (6) (21) 4,078 4,360 (6)
Net revenue detail (CHF million)
Net interest income 724 717 724 1 0 2,167 2,139 1
Recurring commissions and fees 354 363 361 (2) (2) 1,079 1,068 1
Transaction-based revenues 262 330 249 (21) 5 872 842 4
Other revenues (21) (5) 333 320 – (40) 311 –
Net revenues 1,319 1,405 1,667 (6) (21) 4,078 4,360 (6)
Provision for credit losses (CHF million)
New provisions 36 52 45 (31) (20) 126 104 21
Releases of provisions (22) (16) (15) 38 47 (66) (59) 12
Provision for credit losses 14 36 30 (61) (53) 60 45 33
Balance sheet statistics (CHF million)
Total assets 228,647 235,562 222,164 (3) 3 228,647 222,164 3
Net loans 165,221 165,435 166,910 0 (1) 165,221 166,910 (1)
of which Private Clients 110,729 110,426 109,944 0 1 110,729 109,944 1
Risk-weighted assets 64,519 64,426 65,571 0 (2) 64,519 65,571 (2)
Leverage exposure 256,207 260,479 246,254 (2) 4 256,207 246,254 4
Net interest income includes a term spread credit on stable deposit funding and a term spread charge on loans. Recurring commissions and fees includes investment product management, discretionary mandate and other asset management-related fees, fees for general banking products and services and revenues from wealth structuring solutions. Transaction-based revenues arise primarily from brokerage and product issuing fees, fees from foreign exchange client transactions, trading and sales income, equity participations income and other transaction-based income. Other revenues include fair value gains/(losses) on synthetic securitized loan portfolios and other gains and losses.
Reconciliation of adjusted results Private Clients Corporate & Institutional Clients Swiss Universal Bank
in 3Q17 2Q17 3Q16 3Q17 2Q17 3Q16 3Q17 2Q17 3Q16
Adjusted results (CHF million)
Net revenues 727 733 1,053 592 672 614 1,319 1,405 1,667
Real estate gains 0 0 (346) 0 0 0 0 0 (346)
Adjusted net revenues 727 733 707 592 672 614 1,319 1,405 1,321
Provision for credit losses 9 11 12 5 25 18 14 36 30
Total operating expenses 512 500 515 367 367 364 879 867 879
Restructuring expenses (9) 2 (16) (4) 2 (3) (13) 4 (19)
Major litigation provisions (2) (2) 0 (7) (4) 0 (9) (6) 0
Adjusted total operating expenses 501 500 499 356 365 361 857 865 860
Income before taxes 206 222 526 220 280 232 426 502 758
Total adjustments 11 0 (330) 11 2 3 22 2 (327)
Adjusted income before taxes 217 222 196 231 282 235 448 504 431
Adjusted return on regulatory capital (%) – – – – – – 13.9 15.6 14.0
Adjusted results are non-GAAP financial measures. Refer to “Reconciliation of adjusted results” in Credit Suisse for further information.
19Credit Suisse results
Swiss Universal Bank
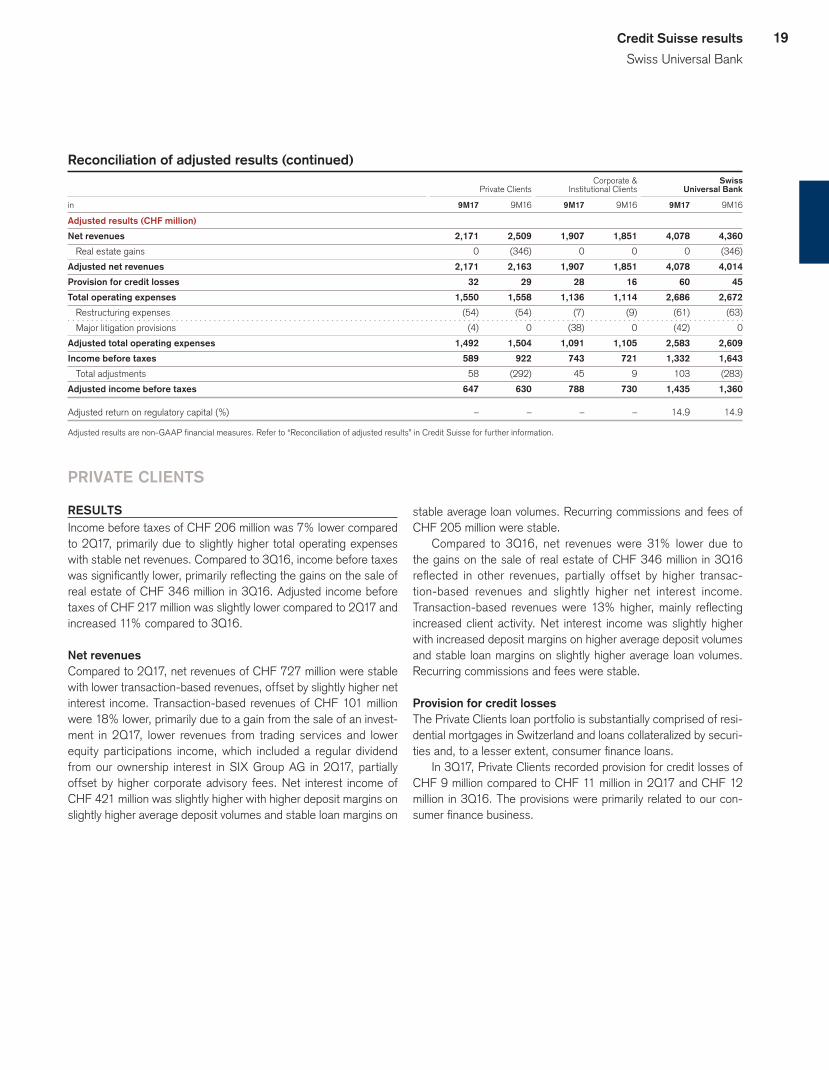
Reconciliation of adjusted results (continued) Corporate & Swiss Private Clients Institutional Clients Universal Bank
in 9M17 9M16 9M17 9M16 9M17 9M16
Adjusted results (CHF million)
Net revenues 2,171 2,509 1,907 1,851 4,078 4,360
Real estate gains 0 (346) 0 0 0 (346)
Adjusted net revenues 2,171 2,163 1,907 1,851 4,078 4,014
Provision for credit losses 32 29 28 16 60 45
Total operating expenses 1,550 1,558 1,136 1,114 2,686 2,672
Restructuring expenses (54) (54) (7) (9) (61) (63)
Major litigation provisions (4) 0 (38) 0 (42) 0
Adjusted total operating expenses 1,492 1,504 1,091 1,105 2,583 2,609
Income before taxes 589 922 743 721 1,332 1,643
Total adjustments 58 (292) 45 9 103 (283)
Adjusted income before taxes 647 630 788 730 1,435 1,360
Adjusted return on regulatory capital (%) – – – – 14.9 14.9
Adjusted results are non-GAAP financial measures. Refer to “Reconciliation of adjusted results” in Credit Suisse for further information.
PRIVATE CLIENTS
RESULTSIncome before taxes of CHF 206 million was 7% lower compared to 2Q17, primarily due to slightly higher total operating expenses with stable net revenues. Compared to 3Q16, income before taxes was significantly lower, primarily reflecting the gains on the sale of real estate of CHF 346 million in 3Q16. Adjusted income before taxes of CHF 217 million was slightly lower compared to 2Q17 and increased 11% compared to 3Q16.
Net revenuesCompared to 2Q17, net revenues of CHF 727 million were stable with lower transaction-based revenues, offset by slightly higher net interest income. Transaction-based revenues of CHF 101 million were 18% lower, primarily due to a gain from the sale of an invest-ment in 2Q17, lower revenues from trading services and lower equity participations income, which included a regular dividend from our ownership interest in SIX Group AG in 2Q17, partially offset by higher corporate advisory fees. Net interest income of CHF 421 million was slightly higher with higher deposit margins on slightly higher average deposit volumes and stable loan margins on
stable average loan volumes. Recurring commissions and fees of CHF 205 million were stable.
Compared to 3Q16, net revenues were 31% lower due to the gains on the sale of real estate of CHF 346 million in 3Q16 reflected in other revenues, partially offset by higher transac-tion-based revenues and slightly higher net interest income. Transaction-based revenues were 13% higher, mainly reflecting increased client activity. Net interest income was slightly higher with increased deposit margins on higher average deposit volumes and stable loan margins on slightly higher average loan volumes. Recurring commissions and fees were stable.
Provision for credit lossesThe Private Clients loan portfolio is substantially comprised of resi-dential mortgages in Switzerland and loans collateralized by securi-ties and, to a lesser extent, consumer finance loans.
In 3Q17, Private Clients recorded provision for credit losses of CHF 9 million compared to CHF 11 million in 2Q17 and CHF 12 million in 3Q16. The provisions were primarily related to our con-sumer finance business.

20 Credit Suisse results
Swiss Universal Bank
Results – Private Clients in / end of % change in / end of % change
3Q17 2Q17 3Q16 QoQ YoY 9M17 9M16 YoY
Statements of operations (CHF million)
Net revenues 727 733 1,053 (1) (31) 2,171 2,509 (13)
Provision for credit losses 9 11 12 (18) (25) 32 29 10
Compensation and benefits 252 253 277 0 (9) 747 830 (10)
General and administrative expenses 222 213 198 4 12 638 595 7
Commission expenses 29 36 24 (19) 21 111 79 41
Restructuring expenses 9 (2) 16 – (44) 54 54 0
Total other operating expenses 260 247 238 5 9 803 728 10
Total operating expenses 512 500 515 2 (1) 1,550 1,558 (1)
Income before taxes 206 222 526 (7) (61) 589 922 (36)
Statement of operations metrics (%)
Cost/income ratio 70.4 68.2 48.9 – – 71.4 62.1 –
Net revenue detail (CHF million)
Net interest income 421 408 413 3 2 1,242 1,240 0
Recurring commissions and fees 205 202 205 1 0 604 604 0
Transaction-based revenues 101 123 89 (18) 13 324 317 2
Other revenues 0 0 346 – (100) 1 348 (100)
Net revenues 727 733 1,053 (1) (31) 2,171 2,509 (13)
Margins on assets under management (annualized) (bp)
Gross margin 1 142 146 220 – – 145 177 –
Net margin 2 40 44 110 – – 39 65 –
Number of relationship managers
Number of relationship managers 1,300 1,310 1,440 (1) (10) 1,300 1,440 (10)
1 Net revenues divided by average assets under management.2 Income before taxes divided by average assets under management.
Total operating expensesCompared to 2Q17, total operating expenses of CHF 512 mil-lion were slightly higher, primarily reflecting higher restructuring and general and administrative expenses, partially offset by lower commission expenses. General and administrative expenses of CHF 222 million increased 4%, primarily reflecting higher allo-cated corporate function costs and higher advertising and mar-keting expenses, partially offset by lower professional services fees. Compensation and benefits of CHF 252 million were stable. Adjusted total operating expenses of CHF 501 million were stable compared to 2Q17.
Compared to 3Q16, total operating expenses were sta-ble, reflecting higher general and administrative expenses and increased commission expenses, offset by lower compensa-tion and benefits and lower restructuring expenses. General and administrative expenses were 12% higher, primarily reflecting higher allocated corporate function costs. Compensation and ben-efits were 9% lower, primarily reflecting lower allocated corporate function costs and lower salary expenses. Adjusted total operating expenses were stable compared to 3Q16.
MARGINSGross marginOur gross margin was 142 basis points in 3Q17, four basis points lower compared to 2Q17, mainly driven by 1.4% higher average assets under management. Compared to 3Q16, our gross margin was 78 basis points lower, mainly reflecting the gains on the sale of real estate in 3Q16 on 6.7% higher average assets under man-agement. On the basis of adjusted net revenues, our gross margin was 142 basis points in 3Q17, four basis points lower compared to 2Q17 and six basis points lower compared to 3Q16.u Refer to “Assets under management” for further information.
Net marginOur net margin was 40 basis points in 3Q17, four basis points lower compared to 2Q17, mainly reflecting higher restructuring and general and administrative expenses on 1.4% higher average assets under management. Compared to 3Q16, our net margin was 70 basis points lower, primarily due to the gains on the sale of real estate in 3Q16 on 6.7% higher average assets under man-agement. On the basis of adjusted income before taxes, our net margin was 43 basis points in 3Q17, one basis point lower com-pared to 2Q17 and two basis points higher compared to 3Q16.

21Credit Suisse results
Swiss Universal Bank
ASSETS UNDER MANAGEMENT As of the end of 3Q17, assets under management of CHF 206.1 billion were CHF 4.6 billion higher compared to the end of 2Q17,
mainly driven by favorable market and foreign exchange-related movements and net new assets of CHF 1.0 billion.
Assets under management – Private Clients in / end of % change in / end of % change
3Q17 2Q17 3Q16 QoQ YoY 9M17 9M16 YoY
Assets under management (CHF billion)
Assets under management 206.1 201.5 192.6 2.3 7.0 206.1 192.6 7.0
Average assets under management 204.2 201.4 191.3 1.4 6.7 200.2 189.4 5.7
Assets under management by currency (CHF billion)
USD 30.1 29.8 28.0 1.0 7.5 30.1 28.0 7.5
EUR 21.9 20.8 19.0 5.3 15.3 21.9 19.0 15.3
CHF 144.2 141.9 137.8 1.6 4.6 144.2 137.8 4.6
Other 9.9 9.0 7.8 10.0 26.9 9.9 7.8 26.9
Assets under management 206.1 201.5 192.6 2.3 7.0 206.1 192.6 7.0
Growth in assets under management (CHF billion)
Net new assets 1.0 1.7 0.9 – – 4.7 1.9 –
Other effects 3.6 1.6 2.1 – – 9.2 0.9 –
of which market movements 2.2 2.9 2.6 – – 9.9 1.7 –
of which foreign exchange 1.7 (1.1) (0.1) – – 0.0 (0.9) –
of which other (0.3) (0.2) (0.4) – – (0.7) 0.1 –
Growth in assets under management 4.6 3.3 3.0 – – 13.9 2.8 –
Growth in assets under management (annualized) (%)
Net new assets 2.0 3.4 1.9 – – 3.3 1.3 –
Other effects 7.1 3.3 4.5 – – 6.3 0.7 –
Growth in assets under management (annualized) 9.1 6.7 6.4 – – 9.6 2.0 –
Growth in assets under management (rolling four-quarter average) (%)
Net new assets 1.5 1.5 0.5 – – – – –
Other effects 5.5 4.8 3.0 – – – – –
Growth in assets under management (rolling
four-quarter average) 7.0 6.3 3.5 – – – – –
CORPORATE & INSTITUTIONAL CLIENTS
RESULTSIncome before taxes of CHF 220 million decreased 21% com-pared to 2Q17 and 5% compared to 3Q16, primarily due to lower net revenues and stable total operating expenses, partially off-set by lower provision for credit losses in 3Q17. Adjusted income before taxes of CHF 231 million decreased 18% compared to 2Q17 and was slightly lower compared to 3Q16.
Net revenuesCompared to 2Q17, net revenues of CHF 592 million were 12% lower with decreased revenues across all revenue categories. Transaction-based revenues of CHF 161 million were 22% lower,
mainly due to lower revenues from trading services, lower rev-enues from our Swiss investment banking business, our profit share on the sale of an investment and a regular dividend from SIX Group in 2Q17. Other revenues decreased CHF 16 million primarily due to gains from credit hedges in 2Q17. Recurring com-missions and fees of CHF 149 million were 7% lower, reflecting lower discretionary mandate management fees, lower investment product management fees and lower security account and custody services fees, partially offset by higher wealth structuring solu-tion fees. Net interest income of CHF 303 million was slightly lower with stable loan margins on stable average loan volumes and higher deposit margins on stable average deposit volumes.

22 Credit Suisse results
Swiss Universal Bank
Compared to 3Q16, net revenues were 4% lower, with slightly lower net interest income, decreased other revenues and lower recurring commissions and fees. Net interest income decreased slightly, driven by lower deposit margins on higher average deposit volumes and stable loan margins on stable average loan volumes. Other revenues decreased CHF 8 million primarily due to higher
fair value losses on synthetic securitized loan portfolios. Recurring commissions and fees decreased 4%, driven by lower discretion-ary mandate management fees, partially offset by higher invest-ment product management fees. Transaction-based revenues were stable.
Results – Corporate & Institutional Clients in / end of % change in / end of % change
3Q17 2Q17 3Q16 QoQ YoY 9M17 9M16 YoY
Statements of operations (CHF million)
Net revenues 592 672 614 (12) (4) 1,907 1,851 3
Provision for credit losses 5 25 18 (80) (72) 28 16 75
Compensation and benefits 210 213 197 (1) 7 633 610 4
General and administrative expenses 118 114 122 4 (3) 385 364 6
Commission expenses 35 42 42 (17) (17) 111 131 (15)
Restructuring expenses 4 (2) 3 – 33 7 9 (22)
Total other operating expenses 157 154 167 2 (6) 503 504 0
Total operating expenses 367 367 364 0 1 1,136 1,114 2
Income before taxes 220 280 232 (21) (5) 743 721 3
Statement of operations metrics (%)
Cost/income ratio 62.0 54.6 59.3 – – 59.6 60.2 –
Net revenue detail (CHF million)
Net interest income 303 309 311 (2) (3) 925 899 3
Recurring commissions and fees 149 161 156 (7) (4) 475 464 2
Transaction-based revenues 161 207 160 (22) 1 548 525 4
Other revenues (21) (5) (13) 320 62 (41) (37) 11
Net revenues 592 672 614 (12) (4) 1,907 1,851 3
Number of relationship managers
Number of relationship managers 550 550 540 0 2 550 540 2
Provision for credit lossesThe Corporate & Institutional Clients loan portfolio has relatively low concentrations and is mainly secured by real estate, securities and other financial collateral.
In 3Q17, Corporate & Institutional Clients recorded provision for credit losses of CHF 5 million compared to CHF 25 million in 2Q17 and CHF 18 million in 3Q16. The decrease compared to 2Q17 and 3Q16 reflected both lower new provisions and higher releases of provision for credit losses relating to several individual cases.
Total operating expensesCompared to 2Q17, total operating expenses of CHF 367 mil-lion were stable, with higher restructuring expenses and higher general and administrative expenses, offset by lower commission expenses. General and administrative expenses of CHF 118 million increased 4%, mainly reflecting higher litigation provisions. Com-pensation and benefits of CHF 210 million were stable. Adjusted total operating expenses of CHF 356 million decreased slightly compared to 2Q17.
Compared to 3Q16, total operating expenses were stable, with higher compensation and benefits, offset by decreased com-mission expenses and slightly lower general and administrative expenses. Compensation and benefits increased 7% mainly due to higher allocated corporate function costs. General and administra-tive expenses decreased slightly, primarily due to lower allocated corporate function costs and lower professional services fees. Adjusted total operating expenses were stable compared to 3Q16.
ASSETS UNDER MANAGEMENTAs of the end of 3Q17, assets under management of CHF 346.7 billion were CHF 5.8 billion lower compared to the end of 2Q17, mainly driven by net asset outflows of CHF 13.7 billion primarily due to redemptions of CHF 13.3 billion from a single public sector mandate.

23Credit Suisse results
International Wealth Management
International Wealth ManagementIn 3Q17, we reported income before taxes of CHF 355 million and net revenues of CHF 1,262 million. Income before taxes decreased slightly compared to 2Q17 and increased 45% compared to 3Q16.
RESULTS SUMMARY3Q17 resultsIn 3Q17, we reported income before taxes of CHF 355 million and net revenues of CHF 1,262 million. Compared to 2Q17, net revenues were stable, with lower transaction- and performance-based revenues that included the impact of seasonally lower client activity in Private Banking offset by higher revenues in Asset Man-agement. Provision for credit losses was CHF 3 million compared to CHF 8 million in 2Q17. Total operating expenses were stable compared to 2Q17, mainly driven by higher general and administra-tive expenses, offset by slightly lower compensation and benefits.
Compared to 3Q16, net revenues increased 17% reflecting higher revenues across all revenue categories. Provision for credit
losses was CHF 3 million compared to zero in 3Q16. Total operat-ing expenses were 8% higher, mainly driven by higher compensa-tion and benefits and higher general and administrative expenses.
Adjusted income before taxes of CHF 382 million was stable compared to 2Q17 and increased 59% compared to 3Q16.
Capital and leverage metricsAs of the end of 3Q17, we reported risk-weighted assets of CHF 37.2 billion, slightly higher compared to the end of 2Q17, primarily driven by foreign exchange movements and movements in risk levels. Leverage exposure of CHF 93.5 billion was stable compared to the end of 2Q17.
Divisional results in / end of % change in / end of % change
3Q17 2Q17 3Q16 QoQ YoY 9M17 9M16 YoY
Statements of operations (CHF million)
Net revenues 1,262 1,264 1,081 0 17 3,747 3,399 10
Provision for credit losses 3 8 0 (63) – 13 14 (7)
Compensation and benefits 543 556 513 (2) 6 1,655 1,554 6
General and administrative expenses 285 265 256 8 11 832 827 1
Commission expenses 60 63 52 (5) 15 177 176 1
Restructuring expenses 16 7 15 129 7 59 38 55
Total other operating expenses 361 335 323 8 12 1,068 1,041 3
Total operating expenses 904 891 836 1 8 2,723 2,595 5
Income before taxes 355 365 245 (3) 45 1,011 790 28
Statement of operations metrics (%)
Return on regulatory capital 26.9 28.3 20.5 – – 26.1 22.2 –
Cost/income ratio 71.6 70.5 77.3 – – 72.7 76.3 –
Economic risk capital and return
Average economic risk capital (CHF million) 4,438 4,428 3,958 0 12 4,284 3,777 13
Pre-tax return on average economic risk capital (%) 31.9 33.0 24.8 – – 31.4 27.9 –
Number of employees (full-time equivalents)
Number of employees 10,110 9,930 10,350 2 (2) 10,110 10,350 (2)
24 Credit Suisse results
International Wealth Management
Divisional results (continued) in / end of % change in / end of % change
3Q17 2Q17 3Q16 QoQ YoY 9M17 9M16 YoY
Net revenue detail (CHF million)
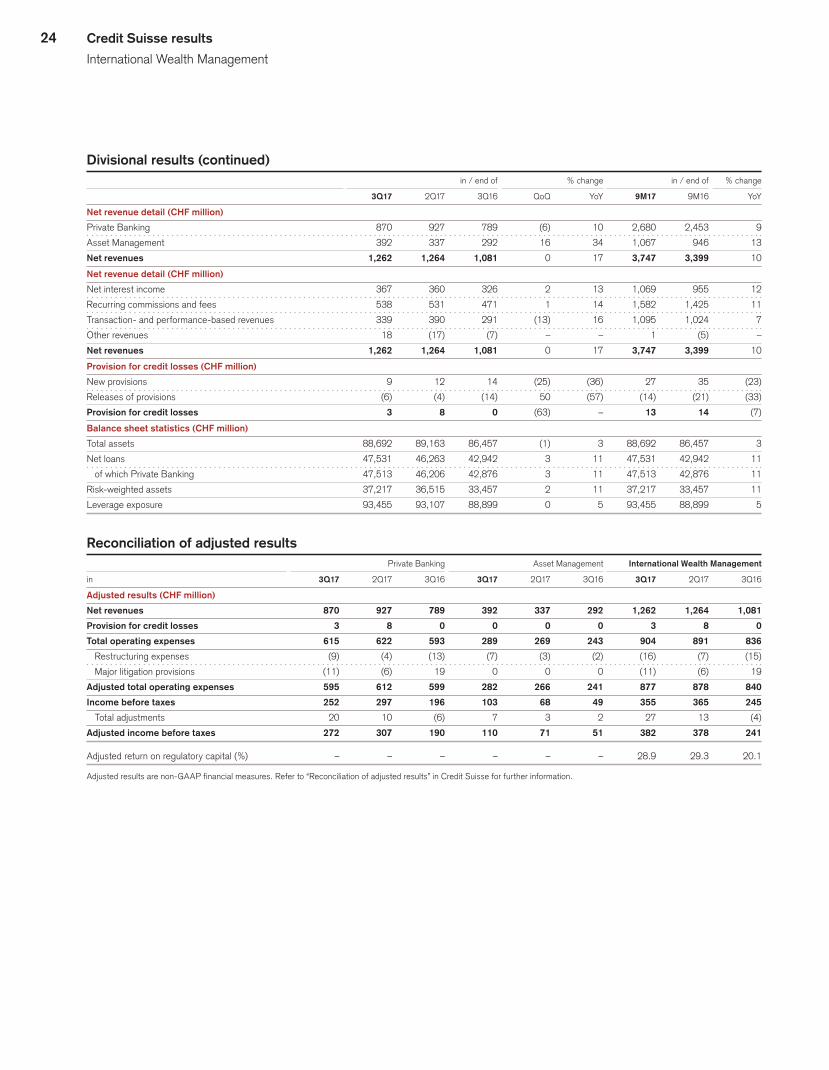
Private Banking 870 927 789 (6) 10 2,680 2,453 9
Asset Management 392 337 292 16 34 1,067 946 13
Net revenues 1,262 1,264 1,081 0 17 3,747 3,399 10
Net revenue detail (CHF million)
Net interest income 367 360 326 2 13 1,069 955 12
Recurring commissions and fees 538 531 471 1 14 1,582 1,425 11
Transaction- and performance-based revenues 339 390 291 (13) 16 1,095 1,024 7
Other revenues 18 (17) (7) – – 1 (5) –
Net revenues 1,262 1,264 1,081 0 17 3,747 3,399 10
Provision for credit losses (CHF million)
New provisions 9 12 14 (25) (36) 27 35 (23)
Releases of provisions (6) (4) (14) 50 (57) (14) (21) (33)
Provision for credit losses 3 8 0 (63) – 13 14 (7)
Balance sheet statistics (CHF million)
Total assets 88,692 89,163 86,457 (1) 3 88,692 86,457 3
Net loans 47,531 46,263 42,942 3 11 47,531 42,942 11
of which Private Banking 47,513 46,206 42,876 3 11 47,513 42,876 11
Risk-weighted assets 37,217 36,515 33,457 2 11 37,217 33,457 11
Leverage exposure 93,455 93,107 88,899 0 5 93,455 88,899 5
Reconciliation of adjusted results Private Banking Asset Management International Wealth Management
in 3Q17 2Q17 3Q16 3Q17 2Q17 3Q16 3Q17 2Q17 3Q16
Adjusted results (CHF million)
Net revenues 870 927 789 392 337 292 1,262 1,264 1,081
Provision for credit losses 3 8 0 0 0 0 3 8 0
Total operating expenses 615 622 593 289 269 243 904 891 836
Restructuring expenses (9) (4) (13) (7) (3) (2) (16) (7) (15)
Major litigation provisions (11) (6) 19 0 0 0 (11) (6) 19
Adjusted total operating expenses 595 612 599 282 266 241 877 878 840
Income before taxes 252 297 196 103 68 49 355 365 245
Total adjustments 20 10 (6) 7 3 2 27 13 (4)
Adjusted income before taxes 272 307 190 110 71 51 382 378 241
Adjusted return on regulatory capital (%) – – – – – – 28.9 29.3 20.1
Adjusted results are non-GAAP financial measures. Refer to “Reconciliation of adjusted results” in Credit Suisse for further information.

25Credit Suisse results
International Wealth Management
Reconciliation of adjusted results (continued) Private Asset International Banking Management Wealth Management
in 9M17 9M16 9M17 9M16 9M17 9M16
Adjusted results (CHF million)
Net revenues 2,680 2,453 1,067 946 3,747 3,399
Provision for credit losses 13 14 0 0 13 14
Total operating expenses 1,879 1,826 844 769 2,723 2,595
Restructuring expenses (36) (36) (23) (2) (59) (38)
Major litigation provisions (17) 19 0 0 (17) 19
Adjusted total operating expenses 1,826 1,809 821 767 2,647 2,576
Income before taxes 788 613 223 177 1,011 790
Total adjustments 53 17 23 2 76 19
Adjusted income before taxes 841 630 246 179 1,087 809
Adjusted return on regulatory capital (%) – – – – 28.0 22.7
Adjusted results are non-GAAP financial measures. Refer to “Reconciliation of adjusted results” in Credit Suisse for further information.
PRIVATE BANKING
RESULTSIncome before taxes of CHF 252 million decreased 15% com-pared to 2Q17 mainly reflecting lower net revenues. Compared to 3Q16, income before taxes increased 29%, reflecting higher net revenues, partially offset by higher total operating expenses. Adjusted income before taxes of CHF 272 million decreased 11% compared to 2Q17 and increased 43% compared to 3Q16.
Net revenuesCompared to 2Q17, net revenues of CHF 870 million were 6% lower, mainly driven by lower transaction- and performance-based revenues, partially offset by slightly higher net interest income. Transaction- and performance-based revenues of CHF 203 mil-lion decreased 23%, mainly driven by lower revenues from trad-ing services, lower brokerage and product issuing fees and lower equity participations income as 2Q17 included a regular dividend from SIX Group. Net interest income of CHF 367 million increased
slightly with slightly higher loan margins on stable average loan vol-umes and slightly lower deposit margins on slightly higher average deposit volumes. Recurring commissions and fees of CHF 300 million were stable.
Compared to 3Q16, net revenues increased 10%, with higher net interest income, higher recurring commissions and fees and slightly higher transaction- and performance-based revenues. Net interest income increased 13%, with higher loan and deposit mar-gins on higher average loan and deposit volumes. Recurring com-missions and fees increased 12%, mainly driven by higher invest-ment product management fees, including the impact of higher average assets under management. Transaction- and perfor-mance-based revenues increased slightly, mainly driven by higher brokerage and product issuing fees and higher corporate advisory fees related to integrated solutions, partially offset by lower rev-enues from trading services.

26 Credit Suisse results
International Wealth Management
Results – Private Banking in / end of % change in / end of % change
3Q17 2Q17 3Q16 QoQ YoY 9M17 9M16 YoY
Statements of operations (CHF million)
Net revenues 870 927 789 (6) 10 2,680 2,453 9
Provision for credit losses 3 8 0 (63) – 13 14 (7)
Compensation and benefits 375 388 369 (3) 2 1,144 1,081 6
General and administrative expenses 187 182 173 3 8 566 585 (3)
Commission expenses 44 48 38 (8) 16 133 124 7
Restructuring expenses 9 4 13 125 (31) 36 36 0
Total other operating expenses 240 234 224 3 7 735 745 (1)
Total operating expenses 615 622 593 (1) 4 1,879 1,826 3
Income before taxes 252 297 196 (15) 29 788 613 29
Statement of operations metrics (%)
Cost/income ratio 70.7 67.1 75.2 – – 70.1 74.4 –
Net revenue detail (CHF million)
Net interest income 367 360 326 2 13 1,069 955 12
Recurring commissions and fees 300 302 267 (1) 12 892 816 9
Transaction- and performance-based revenues 203 265 197 (23) 3 718 687 5
Other revenues 0 0 (1) – 100 1 (5) –
Net revenues 870 927 789 (6) 10 2,680 2,453 9
Margins on assets under management (annualized) (bp)
Gross margin 1 101 110 104 – – 106 111 –
Net margin 2 29 35 26 – – 31 28 –
Number of relationship managers
Number of relationship managers 1,130 1,120 1,160 1 (3) 1,130 1,160 (3)
Net interest income includes a term spread credit on stable deposit funding and a term spread charge on loans. Recurring commissions and fees includes investment product manage-ment, discretionary mandate and other asset management-related fees, fees for general banking products and services and revenues from wealth structuring solutions. Transaction- and performance-based revenues arise primarily from brokerage and product issuing fees, fees from foreign exchange client transactions, trading and sales income, equity participations income and other transaction- and performance-based income.1 Net revenues divided by average assets under management.2 Income before taxes divided by average assets under management.
Provision for credit lossesIn 3Q17, provision for credit losses was CHF 3 million, compared to CHF 8 million in 2Q17 and to zero in 3Q16.
Total operating expensesCompared to 2Q17, total operating expenses of CHF 615 million were stable, reflecting slightly lower compensation and benefits and lower commission expenses, offset by higher restructuring expenses and slightly higher general and administrative expenses. Compensation and benefits of CHF 375 million decreased slightly, mainly driven by lower deferred compensation expenses from prior-year awards and lower allocated corporate function costs. General and administrative expenses of CHF 187 million increased slightly, driven by higher allocated corporate function costs and
higher litigation provisions, partially offset by lower contractor ser-vices fees and lower professional services fees. Adjusted total operating expenses of CHF 595 million were slightly lower com-pared to 2Q17.
Compared to 3Q16, total operating expenses increased 4%, driven by higher general and administrative expenses, slightly higher compensation and benefits and higher commission expenses, partially offset by lower restructuring expenses. Gen-eral and administrative expenses were 8% higher, mainly driven by litigation provisions in 3Q17, compared to releases in 3Q16, partially offset by lower professional services fees. Compensation and benefits increased slightly, mainly due to higher allocated cor-porate function costs, partially offset by lower pension expenses. Adjusted total operating expenses were stable compared to 3Q16.

27Credit Suisse results
International Wealth Management
MARGINSGross marginOur gross margin was 101 basis points in 3Q17, nine basis points lower compared to 2Q17, mainly reflecting lower transaction- and performance-based revenues and 2.5% higher average assets under management. Our gross margin was three basis points lower compared to 3Q16, reflecting a 13.8% increase in average assets under management, partially offset by higher net interest income and higher recurring commissions and fees.u Refer to “Assets under management” for further information.
Net marginOur net margin was 29 basis points in 3Q17, six basis points lower compared to 2Q17, mainly reflecting lower net revenues and the
2.5% higher average assets under management. Our net margin was three basis points higher compared to 3Q16, reflecting higher net revenues, partially offset by the 13.8% increase in average assets under management and higher total operating expenses. On the basis of adjusted income before taxes, our net margin was 31 basis points in 3Q17, five basis points lower compared to 2Q17 and six basis points higher compared to 3Q16.
ASSETS UNDER MANAGEMENTAs of the end of 3Q17, assets under management of CHF 355.3 billion were CHF 18.9 billion higher compared to the end of 2Q17, reflecting favorable foreign exchange-related and market move-ments and net new assets. Net new assets of CHF 3.6 billion reflected solid inflows from emerging markets and Europe.
Assets under management – Private Banking in / end of % change in / end of % change
3Q17 2Q17 3Q16 QoQ YoY 9M17 9M16 YoY
Assets under management (CHF billion)
Assets under management 355.3 336.4 311.4 5.6 14.1 355.3 311.4 14.1
Average assets under management 346.0 337.4 304.0 2.5 13.8 336.8 295.1 14.1
Assets under management by currency (CHF billion)
USD 159.6 151.1 140.1 5.6 13.9 159.6 140.1 13.9
EUR 105.4 100.6 92.7 4.8 13.7 105.4 92.7 13.7
CHF 22.4 21.8 20.7 2.8 8.2 22.4 20.7 8.2
Other 67.9 62.9 57.9 7.9 17.3 67.9 57.9 17.3
Assets under management 355.3 336.4 311.4 5.6 14.1 355.3 311.4 14.1
Growth in assets under management (CHF billion)
Net new assets 3.6 4.6 4.4 – – 12.9 15.2 –
Other effects 15.3 (4.4) 8.4 – – 19.2 6.6 –
of which market movements 6.4 3.2 8.5 – – 18.8 6.4 –
of which foreign exchange 9.0 (7.6) (1.2) – – (1.7) 0.1 –
of which other (0.1) 0.0 1.1 – – 2.1 0.1 –
Growth in assets under management 18.9 0.2 12.8 – – 32.1 21.8 –
Growth in assets under management (annualized) (%)
Net new assets 4.3 5.5 5.8 – – 5.3 7.0 –
Other effects 18.2 (5.3) 11.3 – – 7.9 3.0 –
Growth in assets under management (annualized) 22.5 0.2 17.1 – – 13.2 10.0 –
Growth in assets under management (rolling four-quarter average) (%)
Net new assets 4.3 4.7 3.8 – – – – –
Other effects 9.8 8.0 4.9 – – – – –
Growth in assets under management (rolling
four-quarter average) 14.1 12.7 8.7 – – – – –
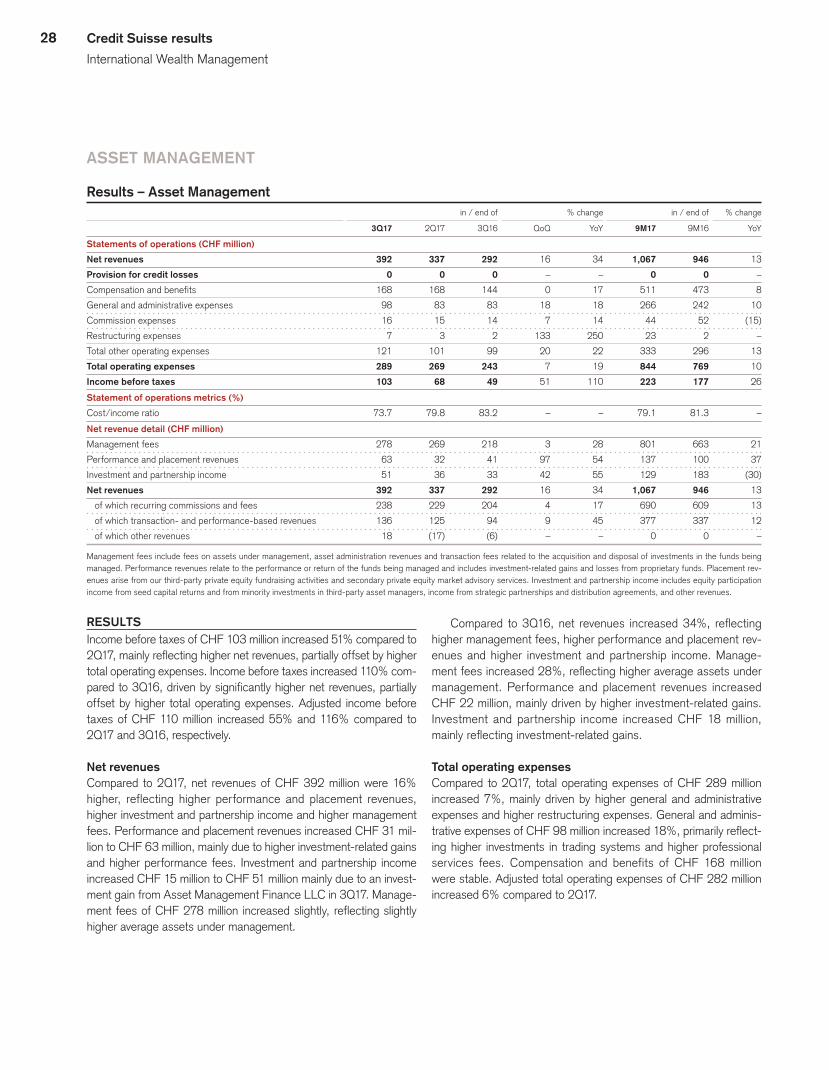
28 Credit Suisse results
International Wealth Management
ASSET MANAGEMENT
Results – Asset Management in / end of % change in / end of % change
3Q17 2Q17 3Q16 QoQ YoY 9M17 9M16 YoY
Statements of operations (CHF million)
Net revenues 392 337 292 16 34 1,067 946 13
Provision for credit losses 0 0 0 – – 0 0 –
Compensation and benefits 168 168 144 0 17 511 473 8
General and administrative expenses 98 83 83 18 18 266 242 10
Commission expenses 16 15 14 7 14 44 52 (15)
Restructuring expenses 7 3 2 133 250 23 2 –
Total other operating expenses 121 101 99 20 22 333 296 13
Total operating expenses 289 269 243 7 19 844 769 10
Income before taxes 103 68 49 51 110 223 177 26
Statement of operations metrics (%)
Cost/income ratio 73.7 79.8 83.2 – – 79.1 81.3 –
Net revenue detail (CHF million)
Management fees 278 269 218 3 28 801 663 21
Performance and placement revenues 63 32 41 97 54 137 100 37
Investment and partnership income 51 36 33 42 55 129 183 (30)
Net revenues 392 337 292 16 34 1,067 946 13
of which recurring commissions and fees 238 229 204 4 17 690 609 13
of which transaction- and performance-based revenues 136 125 94 9 45 377 337 12
of which other revenues 18 (17) (6) – – 0 0 –
Management fees include fees on assets under management, asset administration revenues and transaction fees related to the acquisition and disposal of investments in the funds being managed. Performance revenues relate to the performance or return of the funds being managed and includes investment-related gains and losses from proprietary funds. Placement rev-enues arise from our third-party private equity fundraising activities and secondary private equity market advisory services. Investment and partnership income includes equity participation income from seed capital returns and from minority investments in third-party asset managers, income from strategic partnerships and distribution agreements, and other revenues.
RESULTSIncome before taxes of CHF 103 million increased 51% compared to 2Q17, mainly reflecting higher net revenues, partially offset by higher total operating expenses. Income before taxes increased 110% com-pared to 3Q16, driven by significantly higher net revenues, partially offset by higher total operating expenses. Adjusted income before taxes of CHF 110 million increased 55% and 116% compared to 2Q17 and 3Q16, respectively.
Net revenuesCompared to 2Q17, net revenues of CHF 392 million were 16% higher, reflecting higher performance and placement revenues, higher investment and partnership income and higher management fees. Performance and placement revenues increased CHF 31 mil-lion to CHF 63 million, mainly due to higher investment-related gains and higher performance fees. Investment and partnership income increased CHF 15 million to CHF 51 million mainly due to an invest-ment gain from Asset Management Finance LLC in 3Q17. Manage-ment fees of CHF 278 million increased slightly, reflecting slightly higher average assets under management.
Compared to 3Q16, net revenues increased 34%, reflecting higher management fees, higher performance and placement rev-enues and higher investment and partnership income. Manage-ment fees increased 28%, reflecting higher average assets under management. Performance and placement revenues increased CHF 22 million, mainly driven by higher investment-related gains. Investment and partnership income increased CHF 18 million, mainly reflecting investment-related gains.
Total operating expensesCompared to 2Q17, total operating expenses of CHF 289 million increased 7%, mainly driven by higher general and administrative expenses and higher restructuring expenses. General and adminis-trative expenses of CHF 98 million increased 18%, primarily reflect-ing higher investments in trading systems and higher professional services fees. Compensation and benefits of CHF 168 million were stable. Adjusted total operating expenses of CHF 282 million increased 6% compared to 2Q17.
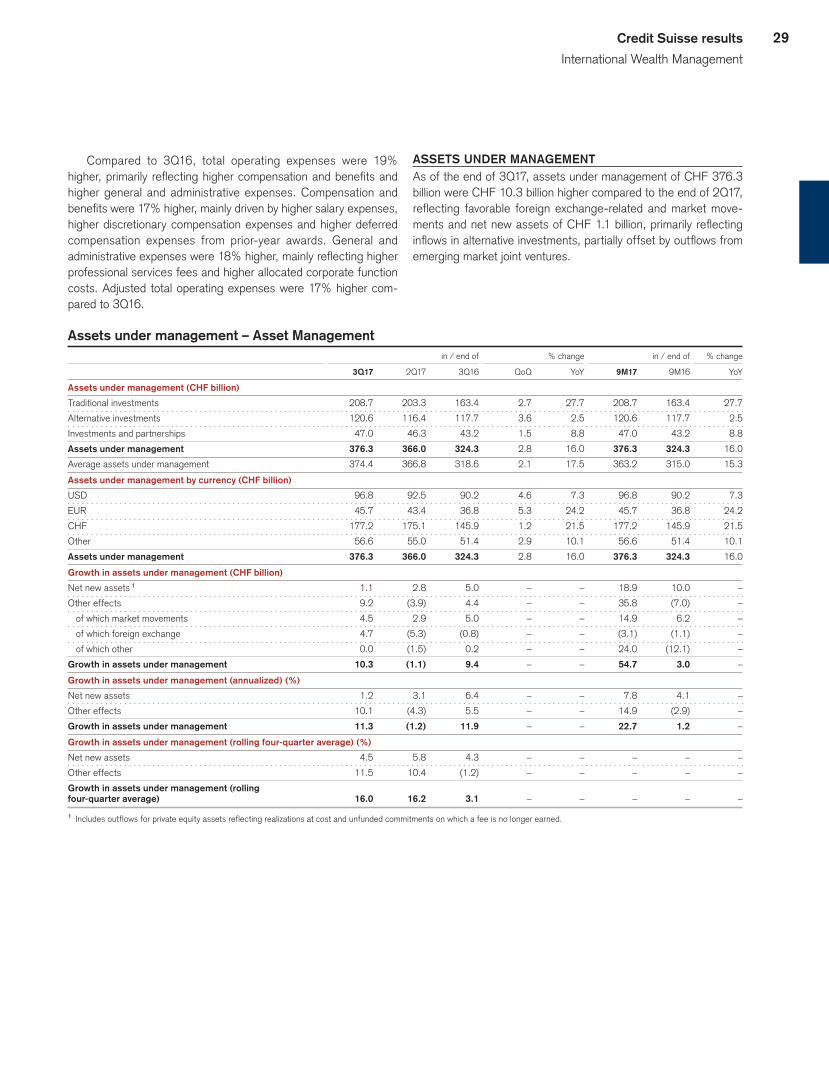
29Credit Suisse results
International Wealth Management
Compared to 3Q16, total operating expenses were 19% higher, primarily reflecting higher compensation and benefits and higher general and administrative expenses. Compensation and benefits were 17% higher, mainly driven by higher salary expenses, higher discretionary compensation expenses and higher deferred compensation expenses from prior-year awards. General and administrative expenses were 18% higher, mainly reflecting higher professional services fees and higher allocated corporate function costs. Adjusted total operating expenses were 17% higher com-pared to 3Q16.
ASSETS UNDER MANAGEMENTAs of the end of 3Q17, assets under management of CHF 376.3 billion were CHF 10.3 billion higher compared to the end of 2Q17, reflecting favorable foreign exchange-related and market move-ments and net new assets of CHF 1.1 billion, primarily reflecting inflows in alternative investments, partially offset by outflows from emerging market joint ventures.
Assets under management – Asset Management in / end of % change in / end of % change
3Q17 2Q17 3Q16 QoQ YoY 9M17 9M16 YoY
Assets under management (CHF billion)
Traditional investments 208.7 203.3 163.4 2.7 27.7 208.7 163.4 27.7
Alternative investments 120.6 116.4 117.7 3.6 2.5 120.6 117.7 2.5
Investments and partnerships 47.0 46.3 43.2 1.5 8.8 47.0 43.2 8.8
Assets under management 376.3 366.0 324.3 2.8 16.0 376.3 324.3 16.0
Average assets under management 374.4 366.8 318.6 2.1 17.5 363.2 315.0 15.3
Assets under management by currency (CHF billion)
USD 96.8 92.5 90.2 4.6 7.3 96.8 90.2 7.3
EUR 45.7 43.4 36.8 5.3 24.2 45.7 36.8 24.2
CHF 177.2 175.1 145.9 1.2 21.5 177.2 145.9 21.5
Other 56.6 55.0 51.4 2.9 10.1 56.6 51.4 10.1
Assets under management 376.3 366.0 324.3 2.8 16.0 376.3 324.3 16.0
Growth in assets under management (CHF billion)
Net new assets 1 1.1 2.8 5.0 – – 18.9 10.0 –
Other effects 9.2 (3.9) 4.4 – – 35.8 (7.0) –
of which market movements 4.5 2.9 5.0 – – 14.9 6.2 –
of which foreign exchange 4.7 (5.3) (0.8) – – (3.1) (1.1) –
of which other 0.0 (1.5) 0.2 – – 24.0 (12.1) –
Growth in assets under management 10.3 (1.1) 9.4 – – 54.7 3.0 –
Growth in assets under management (annualized) (%)
Net new assets 1.2 3.1 6.4 – – 7.8 4.1 –
Other effects 10.1 (4.3) 5.5 – – 14.9 (2.9) –
Growth in assets under management 11.3 (1.2) 11.9 – – 22.7 1.2 –
Growth in assets under management (rolling four-quarter average) (%)
Net new assets 4.5 5.8 4.3 – – – – –
Other effects 11.5 10.4 (1.2) – – – – –
Growth in assets under management (rolling
four-quarter average) 16.0 16.2 3.1 – – – – –
1 Includes outflows for private equity assets reflecting realizations at cost and unfunded commitments on which a fee is no longer earned.

30 Credit Suisse results
Asia Pacific
Asia PacificIn 3Q17, we reported income before taxes of CHF 218 million and net revenues of CHF 890 million. Income before taxes increased 16% compared to 2Q17 and 43% compared to 3Q16.
RESULTS SUMMARY
3Q17 resultsIn 3Q17, we reported income before taxes of CHF 218 million and net revenues of CHF 890 million. Compared to 2Q17, net revenues increased 5%, driven by our Markets business reflecting higher equity sales and trading revenues, partially offset by lower fixed income sales and trading revenues. We recorded a provision for credit losses of CHF 5 million in 3Q17, compared to a release of provision for credit losses of CHF 1 million in 2Q17. Total oper-ating expenses of CHF 667 million were stable, primarily due to higher compensation and benefits, offset by lower general and administrative expenses.
Compared to 3Q16, net revenues decreased slightly, driven by lower revenues in our Markets business across fixed income and equity sales and trading revenues, partially offset by higher reve-nues in our Wealth Management & Connected business, reflecting higher Private Banking revenues and higher advisory, underwriting
and financing revenues. Total operating expenses decreased 9%, primarily from lower general and administrative expenses, lower compensation and benefits and a decrease in restructuring expenses in our Markets business.
Adjusted income before taxes of CHF 228 million increased 15% compared to 2Q17 and 30% compared to 3Q16.
Capital and leverage metrics As of the end of 3Q17, we reported risk-weighted assets of CHF 31.2 billion, a decrease of CHF 1.1 billion compared to the end of 2Q17, mainly reflecting the securitization of certain lend-ing exposures in our Wealth Management & Connected business, partially offset by a foreign exchange impact. Leverage exposure was CHF 106.1 billion, reflecting an increase of CHF 4.5 billion compared to the end of 2Q17, mainly due to an increase in HQLA, higher lending in the Wealth Management & Connected business and the foreign exchange impact, partially offset by a decrease in inventory from the Markets business.
Divisional results in / end of % change in / end of % change
3Q17 2Q17 3Q16 QoQ YoY 9M17 9M16 YoY
Statements of operations (CHF million)
Net revenues 890 848 917 5 (3) 2,619 2,735 (4)
Provision for credit losses 5 (1) 34 – (85) 8 15 (47)
Compensation and benefits 397 387 413 3 (4) 1,208 1,236 (2)
General and administrative expenses 195 199 224 (2) (13) 614 617 0
Commission expenses 65 64 71 2 (8) 196 211 (7)
Restructuring expenses 10 11 23 (9) (57) 40 34 18
Total other operating expenses 270 274 318 (1) (15) 850 862 (1)
Total operating expenses 667 661 731 1 (9) 2,058 2,098 (2)
Income before taxes 218 188 152 16 43 553 622 (11)
Statement of operations metrics (%)
Return on regulatory capital 16.8 14.4 11.3 – – 13.9 15.9 –
Cost/income ratio 74.9 77.9 79.7 – – 78.6 76.7 –
Economic risk capital and return
Average economic risk capital (CHF million) 3,658 4,067 4,320 (10) (15) 4,000 4,058 (1)
Pre-tax return on average economic risk capital (%) 23.8 18.5 14.1 – – 18.4 20.4 –
Number of employees (full-time equivalents)
Number of employees 7,050 7,000 7,140 1 (1) 7,050 7,140 (1)

31Credit Suisse results
Asia Pacific
Divisional results (continued) in / end of % change in / end of % change
3Q17 2Q17 3Q16 QoQ YoY 9M17 9M16 YoY
Net revenues (CHF million)
Wealth Management & Connected 548 559 481 (2) 14 1,696 1,344 26
Markets 342 289 436 18 (22) 923 1,391 (34)
Net revenues 890 848 917 5 (3) 2,619 2,735 (4)
Provision for credit losses (CHF million)
New provisions 8 5 54 60 (85) 19 58 (67)
Releases of provisions (3) (6) (20) (50) (85) (11) (43) (74)
Provision for credit losses 5 (1) 34 – (85) 8 15 (47)
Balance sheet statistics (CHF million)
Total assets 95,919 90,948 93,079 5 3 95,919 93,079 3
Net loans 43,066 41,607 38,669 4 11 43,066 38,669 11
of which Private Banking 35,795 34,411 32,859 4 9 35,795 32,859 9
Risk-weighted assets 31,237 32,293 32,264 (3) (3) 31,237 32,264 (3)
Leverage exposure 106,128 101,583 108,495 4 (2) 106,128 108,495 (2)
Reconciliation of adjusted results Wealth Management & Connected Markets Asia Pacific
in 3Q17 2Q17 3Q16 3Q17 2Q17 3Q16 3Q17 2Q17 3Q16
Adjusted results (CHF million)
Net revenues 548 559 481 342 289 436 890 848 917
Provision for credit losses 5 (1) 34 0 0 0 5 (1) 34
Total operating expenses 370 364 352 297 297 379 667 661 731
Restructuring expenses (5) (2) (7) (5) (9) (16) (10) (11) (23)
Adjusted total operating expenses 365 362 345 292 288 363 657 650 708
Income/(loss) before taxes 173 196 95 45 (8) 57 218 188 152
Total adjustments 5 2 7 5 9 16 10 11 23
Adjusted income before taxes 178 198 102 50 1 73 228 199 175
Adjusted return on regulatory capital (%) – – – – – – 17.6 15.3 12.9
Wealth Management & Connected Markets Asia Pacific
in 9M17 9M16 9M17 9M16 9M17 9M16
Adjusted results (CHF million)
Net revenues 1,696 1,344 923 1,391 2,619 2,735
Provision for credit losses 8 18 0 (3) 8 15
Total operating expenses 1,118 999 940 1,099 2,058 2,098
Restructuring expenses (11) (9) (29) (25) (40) (34)
Adjusted total operating expenses 1,107 990 911 1,074 2,018 2,064
Income/(loss) before taxes 570 327 (17) 295 553 622
Total adjustments 11 9 29 25 40 34
Adjusted income before taxes 581 336 12 320 593 656
Adjusted return on regulatory capital (%) – – – – 15.0 16.7
Adjusted results are non-GAAP financial measures. Refer to “Reconciliation of adjusted results” in Credit Suisse for further information.

32 Credit Suisse results
Asia Pacific
WEALTH MANAGEMENT & CONNECTED
RESULTSIncome before taxes of CHF 173 million decreased 12% com-pared to 2Q17, reflecting lower net revenues, higher total operat-ing expenses and higher provision for credit losses. Compared to 3Q16, income before taxes increased 82%, primarily from higher net revenues and lower provision for credit losses, partially off-set by higher total operating expenses. Adjusted income before taxes of CHF 178 million decreased 10% compared to 2Q17 and increased 75% compared to 3Q16.
Net revenuesNet revenues of CHF 548 million decreased slightly compared to 2Q17, mainly reflecting lower net interest income and lower advisory, underwriting and financing revenues, mostly offset by
increased transaction-based revenues and higher recurring commissions and fees. Net interest income decreased 11% to CHF 144 million, driven by lower treasury revenues and a negative impact from an accounting reclassification related to treasury rev-enues. Advisory, underwriting and financing revenues decreased 4% to CHF 148 million, primarily due to lower financing revenues, partially offset by higher fees from M&A transactions. Transac-tion-based revenues increased 7% to CHF 159 million, due to a positive impact from the accounting reclassification related to treasury revenues, partially offset mainly by lower fees from for-eign exchange client business. Recurring commissions and fees increased slightly to CHF 97 million, primarily due to higher invest-ment product management fees, partially offset by lower wealth structuring solutions fees.
Results – Wealth Management & Connected in / end of % change in / end of % change
3Q17 2Q17 3Q16 QoQ YoY 9M17 9M16 YoY
Statements of operations (CHF million)
Net revenues 548 559 481 (2) 14 1,696 1,344 26
Provision for credit losses 5 (1) 34 – (85) 8 18 (56)
Compensation and benefits 250 244 240 2 4 761 679 12
General and administrative expenses 98 103 92 (5) 7 300 277 8
Commission expenses 17 15 13 13 31 46 34 35
Restructuring expenses 5 2 7 150 (29) 11 9 22
Total other operating expenses 120 120 112 0 7 357 320 12
Total operating expenses 370 364 352 2 5 1,118 999 12
Income before taxes 173 196 95 (12) 82 570 327 74
of which Private Banking 140 149 59 (6) 137 428 267 60
Statement of operations metrics (%)
Cost/income ratio 67.5 65.1 73.2 – – 65.9 74.3 –
Net revenue detail (CHF million)
Private Banking 400 405 346 (1) 16 1,216 1,002 21
of which net interest income 1 144 161 159 (11) (9) 473 436 8
of which recurring commissions and fees 97 94 84 3 15 281 235 20
of which transaction-based revenues 159 149 103 7 54 462 347 33
of which other revenues 0 1 0 (100) – 0 (16) 100
Advisory, underwriting and financing 148 154 135 (4) 10 480 342 40
Net revenues 548 559 481 (2) 14 1,696 1,344 26
Private Banking margins on assets under management (annualized) (bp)
Gross margin 2 87 91 84 – – 91 86 –
Net margin 3 30 33 14 – – 32 23 –
Number of relationship managers
Number of relationship managers 590 610 650 (3) (9) 590 650 (9)
1 Net interest income includes a term spread credit on stable deposit funding and a term spread charge on loans.2 Net revenues divided by average assets under management.3 Income before taxes divided by average assets under management.

33Credit Suisse results
Asia Pacific
Compared to 3Q16, net revenues increased 14%, mainly driven by increased transaction-based revenues, higher advisory, underwrit-ing and financing revenues and higher recurring commission and fees, partially offset by lower net interest income. Transaction-based revenues increased 54%, primarily reflecting higher bro-kerage and product issuing fees and a positive impact from the accounting reclassification. Advisory, underwriting and financing revenues increased 10%, mainly due to higher financing and debt underwriting revenues and higher fees from M&A transactions, partially offset by lower equity underwriting revenues. Recurring commissions and fees increased 15%, mainly due to higher invest-ment product management fees. Net interest income decreased 9%, mainly due to lower treasury revenues and a negative impact from the accounting reclassification.
Provision for credit lossesThe Wealth Management & Connected loan portfolio primarily comprises Private Banking lombard loans, mainly backed by listed securities, and secured and unsecured loans to corporates.
In 3Q17, Wealth Management & Connected recorded a provi-sion for credit losses of CHF 5 million, compared to a release of provision for credit losses of CHF 1 million in 2Q17. In 3Q16, we recorded a provision for credit losses of CHF 34 million in relation to a small number of share-based loans in Hong Kong which were impaired due to their collateral values abruptly falling below their loan amounts.
Total operating expensesTotal operating expenses of CHF 370 million increased slightly compared to 2Q17, mainly reflecting higher compensation and ben-efits, partially offset by lower general and administrative expenses. Compensation and benefits increased slightly to CHF 250 million, primarily driven by higher discretionary compensation expenses. General and administrative expenses decreased 5% to CHF 98 million, mainly due to lower IT infrastructure expenses. Adjusted total operating expenses of CHF 365 million were stable com-pared to 2Q17.
Compared to 3Q16, total operating expenses increased 5%, mainly reflecting higher compensation and benefits, higher general and administrative expenses and higher commission expenses. Compensation and benefits increased 4%, primarily driven by higher discretionary compensation expenses, partially offset by lower salary expenses. General and administrative expenses increased 7%, mainly due to higher compliance support and risk management expenses. Adjusted total operating expenses increased 6% compared to 3Q16.
MARGINSMargin calculations are aligned with the performance metrics of our Private Banking business and its related assets under man-agement within the Wealth Management & Connected business.
Gross marginOur Private Banking gross margin was 87 basis points in 3Q17, four basis points lower compared to 2Q17, mainly reflecting lower net interest income and a 3.4% increase in average assets under management. Compared to 3Q16, our gross margin was three basis points higher, mainly reflecting higher transaction-based rev-enues and higher recurring commissions and fees, partially offset by an 11.9% increase in average assets under management and lower net interest income.u Refer to “Assets under management” for further information.
Net marginOur Private Banking net margin was 30 basis points in 3Q17, three basis points lower compared to 2Q17, reflecting lower net rev-enues, higher provision for credit losses and a 3.4% increase in average assets under management. Compared to 3Q16, our net margin was sixteen basis points higher, mainly reflecting higher net revenues and lower provision for credit losses, partially offset by an 11.9% increase in average assets under management and higher total operating expenses.
ASSETS UNDER MANAGEMENTAssets under management and net new assets relate to our Pri-vate Banking business within the Wealth Management & Con-nected business. As of the end of 3Q17, assets under manage-ment of CHF 190.0 billion were CHF 12.2 billion higher compared to the end of 2Q17, mainly reflecting net new assets of CHF 5.8 billion and favorable market and foreign exchange-related move-ments. Net new assets reflected inflows primarily from Greater China.

34 Credit Suisse results
Asia Pacific
Assets under management – Private Banking in / end of % change in / end of % change
3Q17 2Q17 3Q16 QoQ YoY 9M17 9M16 YoY
Assets under management (CHF billion)
Assets under management 190.0 177.8 168.0 6.9 13.1 190.0 168.0 13.1
Average assets under management 184.1 178.1 164.5 3.4 11.9 177.7 155.8 14.1
Assets under management by currency (CHF billion)
USD 96.9 90.6 79.0 7.0 22.7 96.9 79.0 22.7
EUR 6.5 5.6 4.5 16.1 44.4 6.5 4.5 44.4
CHF 1.8 1.9 1.8 (5.3) 0.0 1.8 1.8 0.0
Other 84.8 79.7 82.7 6.4 2.5 84.8 82.7 2.5
Assets under management 190.0 177.8 168.0 6.9 13.1 190.0 168.0 13.1
Growth in assets under management (CHF billion)
Net new assets 5.8 4.5 4.3 – – 15.6 12.9 –
Other effects 6.4 (4.1) 6.1 – – 7.5 4.7 –
of which market movements 3.8 2.8 6.9 – – 13.4 5.2 –
of which foreign exchange 2.6 (6.8) (0.5) – – (5.8) (0.4) –
of which other 0.0 (0.1) (0.3) – – (0.1) (0.1) –
Growth in assets under management 12.2 0.4 10.4 – – 23.1 17.6 –
Growth in assets under management (annualized) (%)
Net new assets 13.0 10.1 10.9 – – 12.5 11.4 –
Other effects 14.4 (9.2) 15.4 – – 6.0 4.2 –
Growth in assets under management (annualized) 27.4 0.9 26.3 – – 18.5 15.6 –
Growth in assets under management (rolling four-quarter average) (%)
Net new assets 9.7 9.4 11.4 – – – – –
Other effects 3.4 3.4 9.4 – – – – –
Growth in assets under management (rolling
four-quarter average) 13.1 12.8 20.8 – – – – –
MARKETS
RESULTSIncome before taxes of CHF 45 million in 3Q17 compared to a loss before taxes of CHF 8 million in 2Q17. The related increase of CHF 53 million primarily reflected higher net revenues. Com-pared to 3Q16, income before taxes decreased 21%, primarily from lower net revenues, partially offset by lower total operating expenses. Adjusted income before taxes of CHF 50 million in 3Q17 compared to adjusted income before taxes of CHF 1 million and CHF 73 million in 2Q17 and 3Q16, respectively.
Net revenuesNet revenues of CHF 342 million increased 18% compared to 2Q17, reflecting higher equity sales and trading revenues, offset by lower fixed income sales and trading revenues. Equity sales and trading revenues increased 39% to CHF 262 million, mainly due to
higher revenues from equity derivatives reflecting higher volatility in Asian markets and increased client activity. Fixed income sales and trading revenues decreased 21% to CHF 80 million, mainly due to lower revenues from emerging markets rates products.
Compared to 3Q16, net revenues decreased 22%, reflecting lower fixed income and equity sales and trading revenues. Fixed income sales and trading revenues decreased 40%, mainly driven by lower revenues from emerging markets rates products com-pared to a strong 3Q16. Developed markets rates products reve-nue in 3Q16 included a positive impact of CHF 33 million resulting from an increase in the funding value of certain structured depos-its originated in Asia Pacific. Equity sales and trading revenues decreased 13%, mainly due to the transition of the systematic market making business to International Wealth Management that was completed in 1Q17 and lower revenues from prime services.

35Credit Suisse results
Asia Pacific
Results – Markets in / end of % change in / end of % change
3Q17 2Q17 3Q16 QoQ YoY 9M17 9M16 YoY
Statements of operations (CHF million)
Net revenues 342 289 436 18 (22) 923 1,391 (34)
Provision for credit losses 0 0 0 – – 0 (3) 100
Compensation and benefits 147 143 173 3 (15) 447 557 (20)
General and administrative expenses 97 96 132 1 (27) 314 340 (8)
Commission expenses 48 49 58 (2) (17) 150 177 (15)
Restructuring expenses 5 9 16 (44) (69) 29 25 16
Total other operating expenses 150 154 206 (3) (27) 493 542 (9)
Total operating expenses 297 297 379 0 (22) 940 1,099 (14)
Income/(loss) before taxes 45 (8) 57 – (21) (17) 295 –
Statement of operations metrics (%)
Cost/income ratio 86.8 102.8 86.9 – – 101.8 79.0 –
Net revenue detail (CHF million)
Equity sales and trading 262 188 302 39 (13) 684 892 (23)
Fixed income sales and trading 80 101 134 (21) (40) 239 499 (52)
Net revenues 342 289 436 18 (22) 923 1,391 (34)
Total operating expensesTotal operating expenses of CHF 297 million were stable com-pared to 2Q17, mainly reflecting slightly higher compensation and benefits, offset by lower restructuring expenses. Compensation and benefits increased slightly to CHF 147 million, primarily driven by higher discretionary compensation expenses, partially offset by lower salary expenses. General and administrative expenses were stable at CHF 97 million. Adjusted total operating expenses of CHF 292 million were stable compared to 2Q17.
Compared to 3Q16, total operating expenses decreased 22%, reflecting lower expenses across all categories. General and administrative expenses decreased 27%, mainly due to lower allo-cated corporate function costs and lower professional services fees. Compensation and benefits decreased 15%, primarily driven by lower deferred compensation expenses from prior-year awards and lower salary expenses. Adjusted total operating expenses decreased 20% compared to 3Q16.

36 Credit Suisse results
Global Markets
Global MarketsIn 3Q17, Global Markets reported income before taxes of CHF 71 million and net revenues of CHF 1,262 million. Net revenues decreased 17% compared to 2Q17, as a seasonal decline was exacerbated by persistently low volatility and decreased trading volumes which led to reduced client activity.
RESULTS SUMMARY3Q17 resultsIn 3Q17, we implemented a change in financial reporting to reflect an amended business structure consisting of equity sales and trad-ing, fixed income sales and trading and underwriting. Prior periods have been reclassified to conform to the current presentation.
In 3Q17, we reported income before taxes of CHF 71 million and net revenues of CHF 1,262 million. Compared to 2Q17, net revenues decreased 17%, primarily due to less favorable market conditions across our trading and underwriting businesses. Net revenues decreased 7% compared to 3Q16 results, which had benefited from more favorable market conditions.
Total operating expenses of CHF 1,185 million decreased 5% compared to 2Q17, reflecting lower compensation and ben-efits and reduced restructuring costs, partially offset by higher
commission expense. Compared to 3Q16, total operating expenses decreased 7%, reflecting lower compensation and ben-efits and reduced restructuring costs, partially offset by higher commission expenses. Adjusted income before taxes was CHF 98 million in 3Q17, compared to adjusted income before taxes of CHF 289 million in 2Q17 and adjusted income before taxes of CHF 146 million in 3Q16.
Capital and leverage metrics As of the end of 3Q17, we reported risk-weighted assets of USD 57.9 billion, reflecting an increase of USD 4.3 billion compared to the end of 2Q17 mainly due to the expiration of a credit risk hedge. Leverage exposure was USD 291.0 billion, reflecting an increase of USD 2.2 billion compared to the end of 2Q17.
Divisional results in / end of % change in / end of % change
3Q17 2Q17 3Q16 QoQ YoY 9M17 9M16 YoY
Statements of operations (CHF million)
Net revenues 1,262 1,517 1,357 (17) (7) 4,388 4,232 4
Provision for credit losses 6 12 (5) (50) – 23 1 –
Compensation and benefits 568 629 642 (10) (12) 1,887 2,091 (10)
General and administrative expenses 451 460 466 (2) (3) 1,349 1,526 (12)
Commission expenses 139 127 115 9 21 405 369 10
Restructuring expenses 27 32 52 (16) (48) 79 202 (61)
Total other operating expenses 617 619 633 0 (3) 1,833 2,097 (13)
Total operating expenses 1,185 1,248 1,275 (5) (7) 3,720 4,188 (11)
Income before taxes 71 257 87 (72) (18) 645 43 –
Statement of operations metrics (%)
Return on regulatory capital 2.0 7.4 2.5 – – 6.1 0.4 –
Cost/income ratio 93.9 82.3 94.0 – – 84.8 99.0 –
Economic risk capital and return
Average economic risk capital (CHF million) 9,030 8,960 9,311 1 (3) 9,164 10,087 (9)
Pre-tax return on average economic risk capital (%) 3.1 11.5 3.7 – – 9.4 0.6 –
Number of employees (full-time equivalents)
Number of employees 11,760 11,620 11,680 1 1 11,760 11,680 1

37Credit Suisse results
Global Markets
Divisional results (continued) in / end of % change in / end of % change
3Q17 2Q17 3Q16 QoQ YoY 9M17 9M16 YoY
Net revenue detail (CHF million)
Fixed income sales and trading 698 811 770 (14) (9) 2,375 2,033 17
Equity sales and trading 383 501 348 (24) 10 1,372 1,640 (16)
Underwriting 240 249 282 (4) (15) 801 716 12
Other (59) (44) (43) 34 37 (160) (157) 2
Net revenues 1,262 1,517 1,357 (17) (7) 4,388 4,232 4
Balance sheet statistics (CHF million, except where indicated)
Total assets 239,910 228,858 245,492 5 (2) 239,910 245,492 (2)
Risk-weighted assets 55,993 51,333 51,127 9 10 55,993 51,127 10
Risk-weighted assets (USD) 57,868 53,603 52,741 8 10 57,868 52,741 10
Leverage exposure 281,531 276,483 286,694 2 (2) 281,531 286,694 (2)
Leverage exposure (USD) 290,958 288,710 295,744 1 (2) 290,958 295,744 (2)
Reconciliation of adjusted results Global Markets
in 3Q17 2Q17 3Q16 9M17 9M16
Adjusted results (CHF million)
Net revenues 1,262 1,517 1,357 4,388 4,232
Provision for credit losses 6 12 (5) 23 1
Total operating expenses 1,185 1,248 1,275 3,720 4,188
Restructuring expenses (27) (32) (52) (79) (202)
Major litigation provisions 0 0 (7) 0 (7)
Adjusted total operating expenses 1,158 1,216 1,216 3,641 3,979
Income before taxes 71 257 87 645 43
Total adjustments 27 32 59 79 209
Adjusted income before taxes 98 289 146 724 252
Adjusted return on regulatory capital (%) 2.8 8.3 4.1 6.9 2.4
Adjusted results are non-GAAP financial measures. Refer to “Reconciliation of adjusted results” in Credit Suisse for further information.
RESULTSFixed income sales and tradingIn 3Q17, fixed income sales and trading revenues of CHF 698 mil-lion decreased 14% compared to 2Q17, primarily driven by lower securitized products revenues, particularly in non-agency trading compared to a strong 2Q17 performance. Global credit products revenues decreased significantly, driven by lower leveraged finance and investment grade trading revenues. Macro products revenues declined reflecting lower foreign exchange results partially offset by higher revenues in our rates business. In addition, emerging markets revenues increased reflecting improved Brazil trading and financing activity.
Fixed income sales and trading revenues decreased 9% com-pared to a strong 3Q16, due to persistently low levels of vola-tility, which led to reduced client activity. Macro products reve-nues declined significantly across our rates and foreign exchange businesses, which benefited from higher levels of volatility and increased client activity in 3Q16 following the UK referendum and US elections. Emerging markets revenues declined driven by lower
Brazil trading and financing activity compared to 3Q16, which included the positive impact of significant deal activity. In addition, global credit products revenues decreased due to lower leveraged finance and investment grade trading activity given tighter credit spreads. This was partially offset by continued strength in secu-ritized products revenues due to significantly higher asset finance results.
Equity sales and tradingIn 3Q17, equity sales and trading revenues of CHF 383 million decreased 24% compared to 2Q17, reflecting a seasonal slow-down in client activity coupled with a difficult trading environment characterized by persistently low levels of volatility and reduced trading volumes. Prime services revenues declined compared to a seasonally higher 2Q17. Equity derivatives revenues decreased significantly due to continued low levels of volatility, which nega-tively impacted structured and flow derivatives. We also had slightly lower revenues in cash equities consistent with lower trading vol-umes across regions.

38 Credit Suisse results
Global Markets
Compared to 3Q16, equity sales and trading revenues increased 10% amid the difficult trading environment. Prime ser-vices revenues increased, reflecting higher commissions in listed derivatives and higher client financing revenues. Equity deriva-tives revenues increased, albeit from subdued levels, reflecting improved flow derivatives results, partially offset by lower struc-tured derivatives revenues. In addition, cash equities trading rev-enues increased reflecting improved secondary revenues in Latin America. This increase was partially offset by significantly lower systematic market making revenues, largely due to challenging operating conditions in that business and its transition to Interna-tional Wealth Management in 1Q17.
UnderwritingIn 3Q17, underwriting revenues of CHF 240 million decreased 4% compared to 2Q17, reflecting a slowdown in issuance activ-ity. Equity underwriting revenues declined significantly, consistent with a slowdown in primary issuance volumes. This was partially offset by higher debt underwriting revenues, reflecting increased revenues across leveraged finance and investment grade.
Underwriting revenues decreased 15% compared to strong 3Q16 results, which benefited from significant client deals, par-ticularly in debt underwriting. Debt underwriting revenues declined, due to lower investment grade revenues partially offset by higher leveraged finance revenues. In addition, we also had lower equity underwriting revenues.
Provision for credit lossesGlobal markets recorded a provision for credit losses of CHF 6 million, including increased provisions reflecting a methodology change for probable losses inherent in the portfolio relating to the period of time expected to identify defaults once they have occurred. This compares to a provision for credit losses of CHF 12 million in 2Q17 and a release of provision for credit losses of CHF 5 million in 3Q16.
Total operating expenses In 3Q17, total operating expenses of CHF 1,185 million decreased 5% compared to 2Q17, reflecting lower compensation and bene-fits and reduced restructuring costs partially offset by higher com-mission expenses. The decrease in compensation and benefits reflected the lower results. During 3Q17, we incurred restructur-ing costs of CHF 27 million. General and administrative expenses were slightly lower, as the lower UK bank levy was partially offset by slightly higher allocated corporate function costs. Adjusted total operating expenses decreased 5%.
Compared to 3Q16, total operating expenses decreased 7%, reflecting lower compensation and benefits and restructur-ing costs, partially offset by higher commission expenses. The decrease in compensation and benefits reflected the lower results. General and administrative expenses decreased slightly, reflecting lower allocated corporate functions costs partially offset by higher professional services fees. Adjusted total operating expenses decreased 5%.
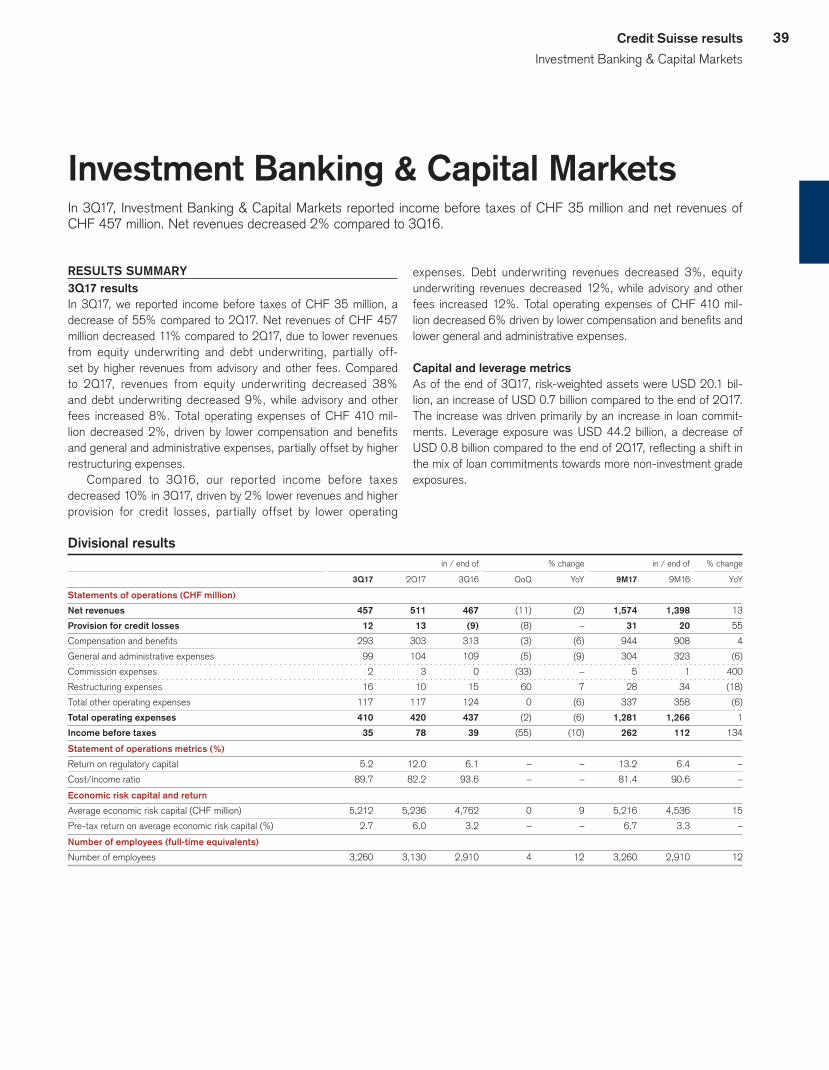
39Credit Suisse results
Investment Banking & Capital Markets
Investment Banking & Capital MarketsIn 3Q17, Investment Banking & Capital Markets reported income before taxes of CHF 35 million and net revenues of CHF 457 million. Net revenues decreased 2% compared to 3Q16.
RESULTS SUMMARY3Q17 results In 3Q17, we reported income before taxes of CHF 35 million, a decrease of 55% compared to 2Q17. Net revenues of CHF 457 million decreased 11% compared to 2Q17, due to lower revenues from equity underwriting and debt underwriting, partially off-set by higher revenues from advisory and other fees. Compared to 2Q17, revenues from equity underwriting decreased 38% and debt underwriting decreased 9%, while advisory and other fees increased 8%. Total operating expenses of CHF 410 mil-lion decreased 2%, driven by lower compensation and benefits and general and administrative expenses, partially offset by higher restructuring expenses.
Compared to 3Q16, our reported income before taxes decreased 10% in 3Q17, driven by 2% lower revenues and higher provision for credit losses, partially offset by lower operating
expenses. Debt underwriting revenues decreased 3%, equity underwriting revenues decreased 12%, while advisory and other fees increased 12%. Total operating expenses of CHF 410 mil-lion decreased 6% driven by lower compensation and benefits and lower general and administrative expenses.
Capital and leverage metricsAs of the end of 3Q17, risk-weighted assets were USD 20.1 bil-lion, an increase of USD 0.7 billion compared to the end of 2Q17. The increase was driven primarily by an increase in loan commit-ments. Leverage exposure was USD 44.2 billion, a decrease of USD 0.8 billion compared to the end of 2Q17, reflecting a shift in the mix of loan commitments towards more non-investment grade exposures.
Divisional results in / end of % change in / end of % change
3Q17 2Q17 3Q16 QoQ YoY 9M17 9M16 YoY
Statements of operations (CHF million)
Net revenues 457 511 467 (11) (2) 1,574 1,398 13
Provision for credit losses 12 13 (9) (8) – 31 20 55
Compensation and benefits 293 303 313 (3) (6) 944 908 4
General and administrative expenses 99 104 109 (5) (9) 304 323 (6)
Commission expenses 2 3 0 (33) – 5 1 400
Restructuring expenses 16 10 15 60 7 28 34 (18)
Total other operating expenses 117 117 124 0 (6) 337 358 (6)
Total operating expenses 410 420 437 (2) (6) 1,281 1,266 1
Income before taxes 35 78 39 (55) (10) 262 112 134
Statement of operations metrics (%)
Return on regulatory capital 5.2 12.0 6.1 – – 13.2 6.4 –
Cost/income ratio 89.7 82.2 93.6 – – 81.4 90.6 –
Economic risk capital and return
Average economic risk capital (CHF million) 5,212 5,236 4,762 0 9 5,216 4,536 15
Pre-tax return on average economic risk capital (%) 2.7 6.0 3.2 – – 6.7 3.3 –
Number of employees (full-time equivalents)
Number of employees 3,260 3,130 2,910 4 12 3,260 2,910 12
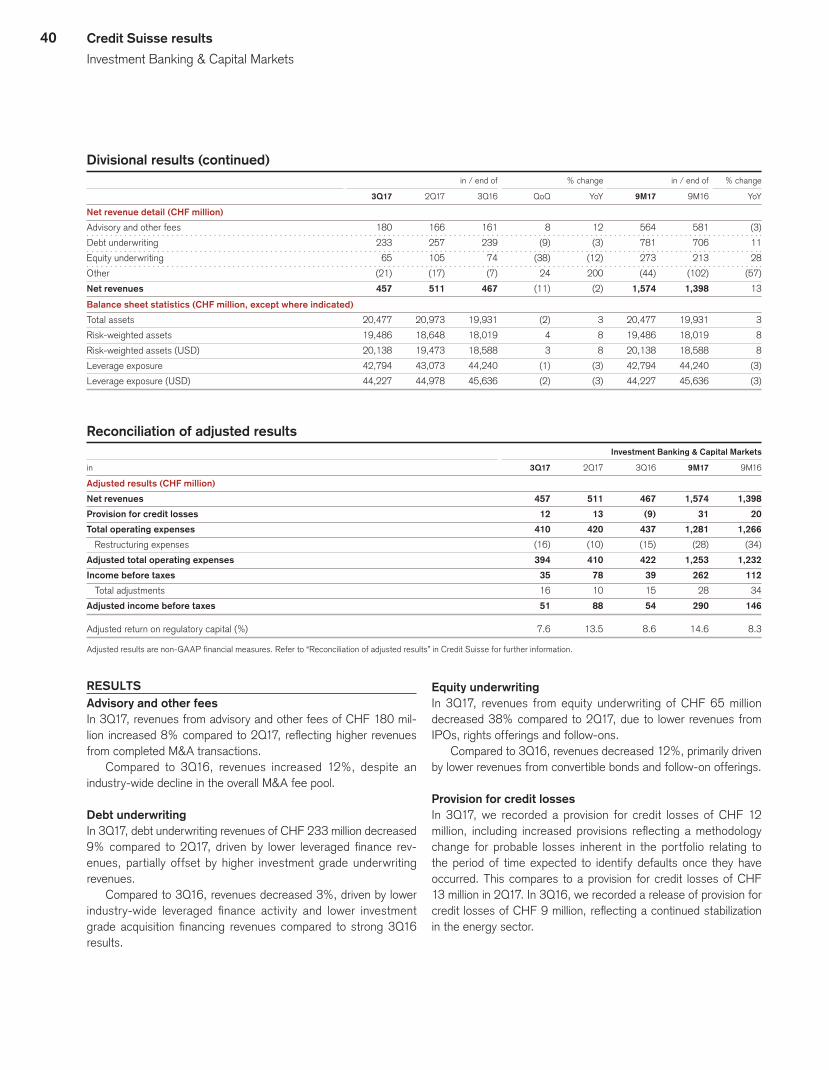
40 Credit Suisse results
Investment Banking & Capital Markets
Divisional results (continued) in / end of % change in / end of % change
3Q17 2Q17 3Q16 QoQ YoY 9M17 9M16 YoY
Net revenue detail (CHF million)
Advisory and other fees 180 166 161 8 12 564 581 (3)
Debt underwriting 233 257 239 (9) (3) 781 706 11
Equity underwriting 65 105 74 (38) (12) 273 213 28
Other (21) (17) (7) 24 200 (44) (102) (57)
Net revenues 457 511 467 (11) (2) 1,574 1,398 13
Balance sheet statistics (CHF million, except where indicated)
Total assets 20,477 20,973 19,931 (2) 3 20,477 19,931 3
Risk-weighted assets 19,486 18,648 18,019 4 8 19,486 18,019 8
Risk-weighted assets (USD) 20,138 19,473 18,588 3 8 20,138 18,588 8
Leverage exposure 42,794 43,073 44,240 (1) (3) 42,794 44,240 (3)
Leverage exposure (USD) 44,227 44,978 45,636 (2) (3) 44,227 45,636 (3)
Reconciliation of adjusted results Investment Banking & Capital Markets
in 3Q17 2Q17 3Q16 9M17 9M16
Adjusted results (CHF million)
Net revenues 457 511 467 1,574 1,398
Provision for credit losses 12 13 (9) 31 20
Total operating expenses 410 420 437 1,281 1,266
Restructuring expenses (16) (10) (15) (28) (34)
Adjusted total operating expenses 394 410 422 1,253 1,232
Income before taxes 35 78 39 262 112
Total adjustments 16 10 15 28 34
Adjusted income before taxes 51 88 54 290 146
Adjusted return on regulatory capital (%) 7.6 13.5 8.6 14.6 8.3
Adjusted results are non-GAAP financial measures. Refer to “Reconciliation of adjusted results” in Credit Suisse for further information.
RESULTSAdvisory and other feesIn 3Q17, revenues from advisory and other fees of CHF 180 mil-lion increased 8% compared to 2Q17, reflecting higher revenues from completed M&A transactions.
Compared to 3Q16, revenues increased 12%, despite an industry-wide decline in the overall M&A fee pool.
Debt underwritingIn 3Q17, debt underwriting revenues of CHF 233 million decreased 9% compared to 2Q17, driven by lower leveraged finance rev-enues, partially offset by higher investment grade underwriting revenues.
Compared to 3Q16, revenues decreased 3%, driven by lower industry-wide leveraged finance activity and lower investment grade acquisition financing revenues compared to strong 3Q16 results.
Equity underwritingIn 3Q17, revenues from equity underwriting of CHF 65 million decreased 38% compared to 2Q17, due to lower revenues from IPOs, rights offerings and follow-ons.
Compared to 3Q16, revenues decreased 12%, primarily driven by lower revenues from convertible bonds and follow-on offerings.
Provision for credit lossesIn 3Q17, we recorded a provision for credit losses of CHF 12 million, including increased provisions reflecting a methodology change for probable losses inherent in the portfolio relating to the period of time expected to identify defaults once they have occurred. This compares to a provision for credit losses of CHF 13 million in 2Q17. In 3Q16, we recorded a release of provision for credit losses of CHF 9 million, reflecting a continued stabilization in the energy sector.
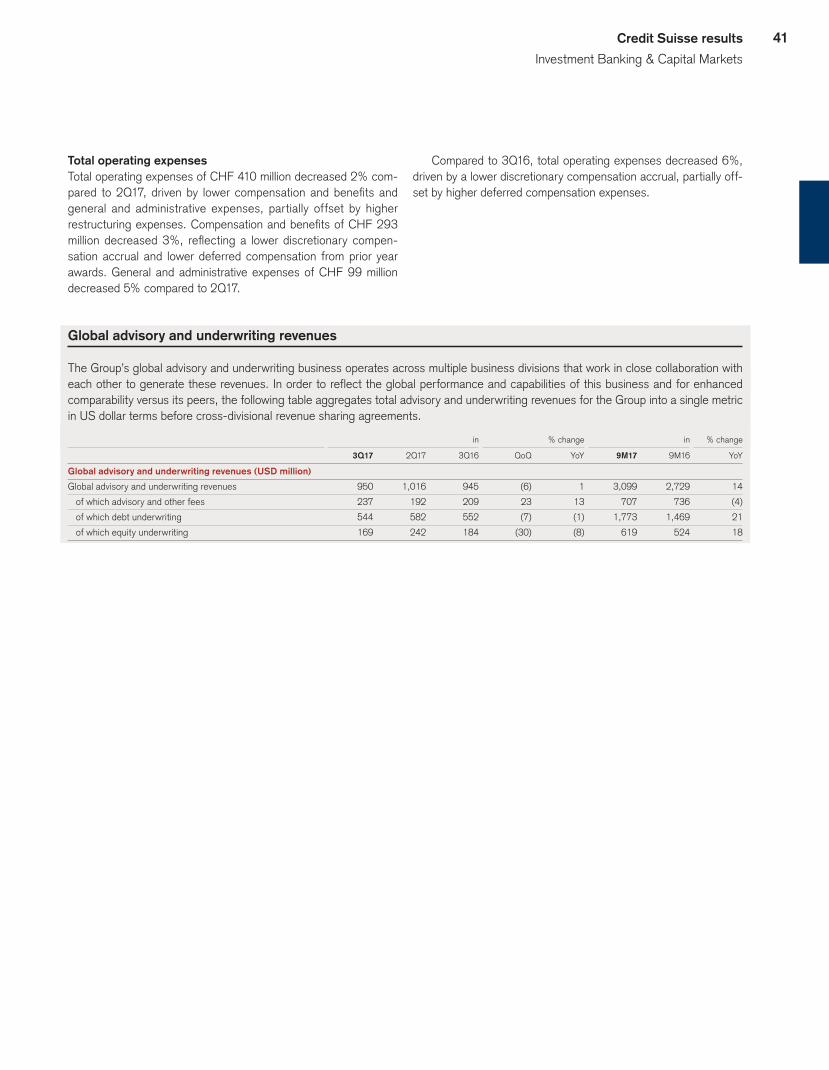
41Credit Suisse results
Investment Banking & Capital Markets
Total operating expenses Total operating expenses of CHF 410 million decreased 2% com-pared to 2Q17, driven by lower compensation and benefits and general and administrative expenses, partially offset by higher restructuring expenses. Compensation and benefits of CHF 293 million decreased 3%, reflecting a lower discretionary compen-sation accrual and lower deferred compensation from prior year awards. General and administrative expenses of CHF 99 million decreased 5% compared to 2Q17.
Compared to 3Q16, total operating expenses decreased 6%, driven by a lower discretionary compensation accrual, partially off-set by higher deferred compensation expenses.
Global advisory and underwriting revenues
The Group’s global advisory and underwriting business operates across multiple business divisions that work in close collaboration with each other to generate these revenues. In order to reflect the global performance and capabilities of this business and for enhanced comparability versus its peers, the following table aggregates total advisory and underwriting revenues for the Group into a single metric in US dollar terms before cross-divisional revenue sharing agreements.
in % change in % change
3Q17 2Q17 3Q16 QoQ YoY 9M17 9M16 YoY
Global advisory and underwriting revenues (USD million)
Global advisory and underwriting revenues 950 1,016 945 (6) 1 3,099 2,729 14
of which advisory and other fees 237 192 209 23 13 707 736 (4)
of which debt underwriting 544 582 552 (7) (1) 1,773 1,469 21
of which equity underwriting 169 242 184 (30) (8) 619 524 18
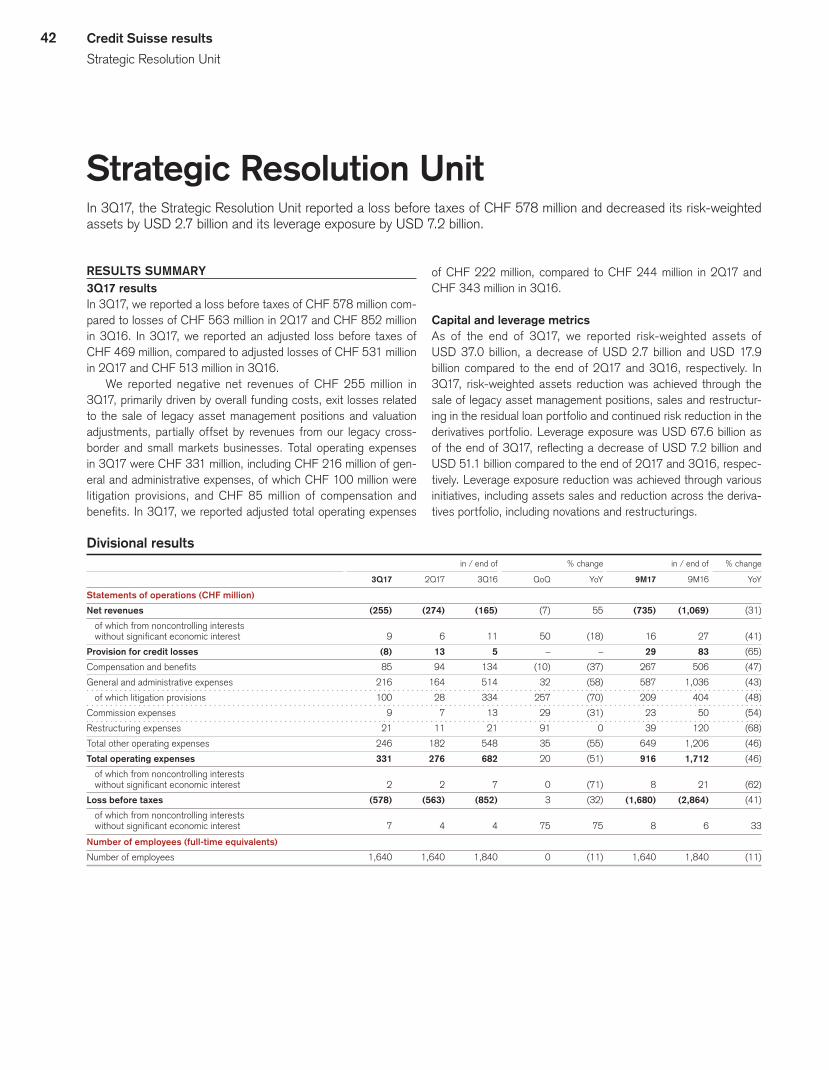
42 Credit Suisse results
Strategic Resolution Unit
Strategic Resolution UnitIn 3Q17, the Strategic Resolution Unit reported a loss before taxes of CHF 578 million and decreased its risk-weighted assets by USD 2.7 billion and its leverage exposure by USD 7.2 billion.
RESULTS SUMMARY3Q17 resultsIn 3Q17, we reported a loss before taxes of CHF 578 million com-pared to losses of CHF 563 million in 2Q17 and CHF 852 million in 3Q16. In 3Q17, we reported an adjusted loss before taxes of CHF 469 million, compared to adjusted losses of CHF 531 million in 2Q17 and CHF 513 million in 3Q16.
We reported negative net revenues of CHF 255 million in 3Q17, primarily driven by overall funding costs, exit losses related to the sale of legacy asset management positions and valuation adjustments, partially offset by revenues from our legacy cross-border and small markets businesses. Total operating expenses in 3Q17 were CHF 331 million, including CHF 216 million of gen-eral and administrative expenses, of which CHF 100 million were litigation provisions, and CHF 85 million of compensation and benefits. In 3Q17, we reported adjusted total operating expenses
of CHF 222 million, compared to CHF 244 million in 2Q17 and CHF 343 million in 3Q16.
Capital and leverage metricsAs of the end of 3Q17, we reported risk-weighted assets of USD 37.0 billion, a decrease of USD 2.7 billion and USD 17.9 billion compared to the end of 2Q17 and 3Q16, respectively. In 3Q17, risk-weighted assets reduction was achieved through the sale of legacy asset management positions, sales and restructur-ing in the residual loan portfolio and continued risk reduction in the derivatives portfolio. Leverage exposure was USD 67.6 billion as of the end of 3Q17, reflecting a decrease of USD 7.2 billion and USD 51.1 billion compared to the end of 2Q17 and 3Q16, respec-tively. Leverage exposure reduction was achieved through various initiatives, including assets sales and reduction across the deriva-tives portfolio, including novations and restructurings.
Divisional results in / end of % change in / end of % change
3Q17 2Q17 3Q16 QoQ YoY 9M17 9M16 YoY
Statements of operations (CHF million)
Net revenues (255) (274) (165) (7) 55 (735) (1,069) (31)
of which from noncontrolling interests
without significant economic interest 9 6 11 50 (18) 16 27 (41)
Provision for credit losses (8) 13 5 – – 29 83 (65)
Compensation and benefits 85 94 134 (10) (37) 267 506 (47)
General and administrative expenses 216 164 514 32 (58) 587 1,036 (43)
of which litigation provisions 100 28 334 257 (70) 209 404 (48)
Commission expenses 9 7 13 29 (31) 23 50 (54)
Restructuring expenses 21 11 21 91 0 39 120 (68)
Total other operating expenses 246 182 548 35 (55) 649 1,206 (46)
Total operating expenses 331 276 682 20 (51) 916 1,712 (46)
of which from noncontrolling interests
without significant economic interest 2 2 7 0 (71) 8 21 (62)
Loss before taxes (578) (563) (852) 3 (32) (1,680) (2,864) (41)
of which from noncontrolling interests
without significant economic interest 7 4 4 75 75 8 6 33
Number of employees (full-time equivalents)
Number of employees 1,640 1,640 1,840 0 (11) 1,640 1,840 (11)

43Credit Suisse results
Strategic Resolution Unit
Divisional results (continued) in / end of % change in / end of % change
3Q17 2Q17 3Q16 QoQ YoY 9M17 9M16 YoY
Net revenue detail (CHF million)
Restructuring of select onshore businesses (1) (3) 16 (67) – 31 145 (79)
Legacy cross-border and small markets businesses 26 34 46 (24) (43) 97 153 (37)
Legacy asset management positions (85) 22 2 – – (67) (56) 20
Legacy investment banking portfolio (115) (247) (171) (53) (33) (576) (1,099) (48)
Legacy funding costs (90) (92) (75) (2) 20 (247) (246) 0
Other 1 6 6 (83) (83) 11 7 57
Noncontrolling interests without significant economic interest 9 6 11 50 (18) 16 27 (41)
Net revenues (255) (274) (165) (7) 55 (735) (1,069) (31)
Balance sheet statistics (CHF million)
Total assets 49,409 54,427 77,581 (9) (36) 49,409 77,581 (36)
Risk-weighted assets 35,842 38,101 53,268 (6) (33) 35,842 53,268 (33)
Risk-weighted assets (USD) 37,042 39,786 54,949 (7) (33) 37,042 54,949 (33)
Leverage exposure 65,385 71,611 115,008 (9) (43) 65,385 115,008 (43)
Leverage exposure (USD) 67,574 74,778 118,638 (10) (43) 67,574 118,638 (43)
Reconciliation of adjusted results Strategic Resolution Unit
in 3Q17 2Q17 3Q16 9M17 9M16
Adjusted results (CHF million)
Net revenues (255) (274) (165) (735) (1,069)
(Gains)/losses on business sales 0 0 0 (38) 4
Adjusted net revenues (255) (274) (165) (773) (1,065)
Provision for credit losses (8) 13 5 29 83
Total operating expenses 331 276 682 916 1,712
Restructuring expenses (21) (11) (21) (39) (120)
Major litigation provisions (88) (21) (318) (179) (318)
Adjusted total operating expenses 222 244 343 698 1,274
Loss before taxes (578) (563) (852) (1,680) (2,864)
Total adjustments 109 32 339 180 442
Adjusted loss before taxes (469) (531) (513) (1,500) (2,422)
Adjusted results are non-GAAP financial measures. Refer to “Reconciliation of adjusted results” in Credit Suisse for further information.
RESULTSNet revenuesWe reported negative net revenues of CHF 255 million in 3Q17 compared to negative net revenues of CHF 274 million in 2Q17 and CHF 165 million in 3Q16. Compared to 2Q17, the improve-ment was primarily driven by a reduction in overall funding costs and lower negative valuation adjustments, partially offset by
higher exit losses related to the sale of legacy asset management positions.
Compared to 3Q16, the movement was primarily driven by a reduction in fee-based revenues as a result of accelerated busi-ness exits and higher exit losses related to the sale of legacy asset management positions. This movement was partially offset by lower overall funding costs.
44 Credit Suisse results
Strategic Resolution Unit
Provision for credit lossesIn 3Q17, there was a release of provision for credit losses of CHF 8 million compared to a provision for credit losses of CHF 13 million in 2Q17 and CHF 5 million in 3Q16. The improvement in 3Q17 was primarily related to improved economics of a single financing deal.
Total operating expensesTotal operating expenses of CHF 331 million increased CHF 55 million compared to 2Q17, primarily reflecting higher gen-eral and administrative expenses, including an increase in liti-gation provisions by CHF 72 million mainly in connection with
mortgage-related matters. Total operating expenses in 3Q17 included costs of CHF 40 million to meet requirements related to the settlements with US authorities regarding US cross-border matters. Adjusted total operating expenses decreased 9%.
Compared to 3Q16, total operating expenses decreased CHF 351 million, due to lower general and administrative expenses, including significantly lower litigation provisions mainly in connection with mortgage-related matters, and lower compen-sation and benefits as a result of various cost reduction initiatives, including the impact of the transfer of our US private banking busi-ness. Adjusted total operating expenses decreased 35%.
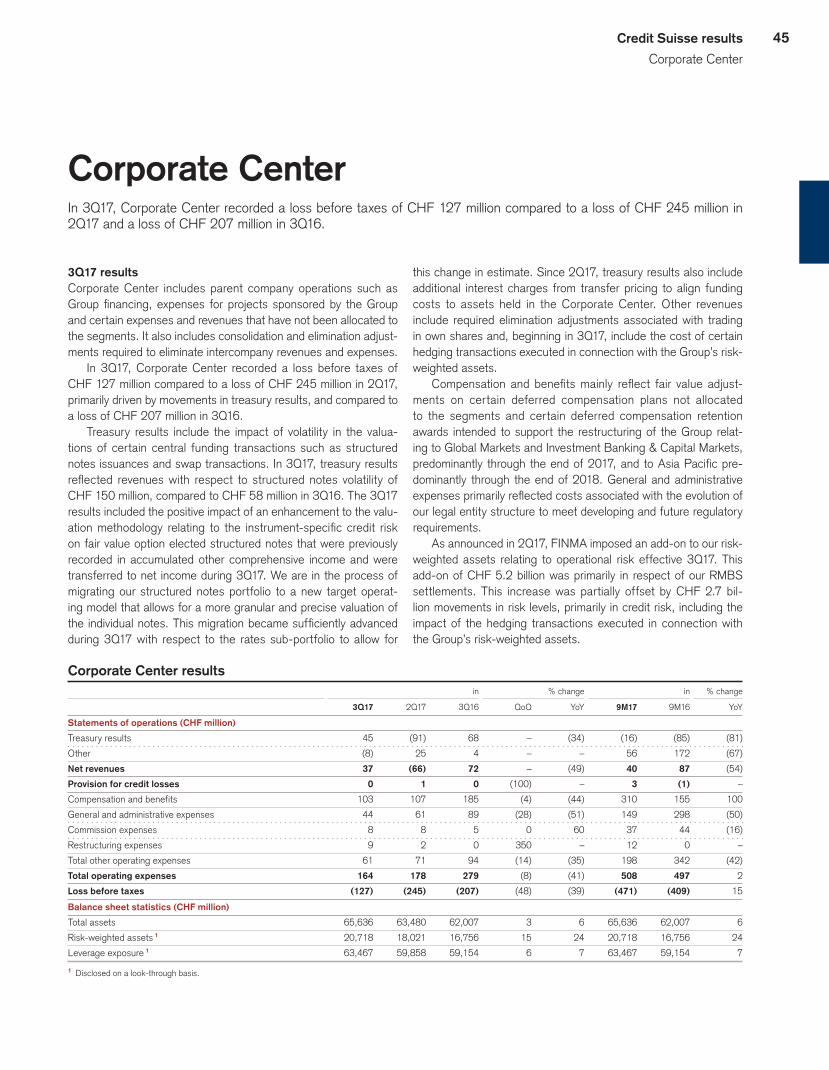
45Credit Suisse results
Corporate Center
Corporate CenterIn 3Q17, Corporate Center recorded a loss before taxes of CHF 127 million compared to a loss of CHF 245 million in 2Q17 and a loss of CHF 207 million in 3Q16.
3Q17 resultsCorporate Center includes parent company operations such as Group financing, expenses for projects sponsored by the Group and certain expenses and revenues that have not been allocated to the segments. It also includes consolidation and elimination adjust-ments required to eliminate intercompany revenues and expenses.
In 3Q17, Corporate Center recorded a loss before taxes of CHF 127 million compared to a loss of CHF 245 million in 2Q17, primarily driven by movements in treasury results, and compared to a loss of CHF 207 million in 3Q16.
Treasury results include the impact of volatility in the valua-tions of certain central funding transactions such as structured notes issuances and swap transactions. In 3Q17, treasury results reflected revenues with respect to structured notes volatility of CHF 150 million, compared to CHF 58 million in 3Q16. The 3Q17 results included the positive impact of an enhancement to the valu-ation methodology relating to the instrument-specific credit risk on fair value option elected structured notes that were previously recorded in accumulated other comprehensive income and were transferred to net income during 3Q17. We are in the process of migrating our structured notes portfolio to a new target operat-ing model that allows for a more granular and precise valuation of the individual notes. This migration became sufficiently advanced during 3Q17 with respect to the rates sub-portfolio to allow for
this change in estimate. Since 2Q17, treasury results also include additional interest charges from transfer pricing to align funding costs to assets held in the Corporate Center. Other revenues include required elimination adjustments associated with trading in own shares and, beginning in 3Q17, include the cost of certain hedging transactions executed in connection with the Group’s risk-weighted assets.
Compensation and benefits mainly reflect fair value adjust-ments on certain deferred compensation plans not allocated to the segments and certain deferred compensation retention awards intended to support the restructuring of the Group relat-ing to Global Markets and Investment Banking & Capital Markets, predominantly through the end of 2017, and to Asia Pacific pre-dominantly through the end of 2018. General and administrative expenses primarily reflected costs associated with the evolution of our legal entity structure to meet developing and future regulatory requirements.
As announced in 2Q17, FINMA imposed an add-on to our risk-weighted assets relating to operational risk effective 3Q17. This add-on of CHF 5.2 billion was primarily in respect of our RMBS settlements. This increase was partially offset by CHF 2.7 bil-lion movements in risk levels, primarily in credit risk, including the impact of the hedging transactions executed in connection with the Group’s risk-weighted assets.
Corporate Center results in % change in % change
3Q17 2Q17 3Q16 QoQ YoY 9M17 9M16 YoY
Statements of operations (CHF million)
Treasury results 45 (91) 68 – (34) (16) (85) (81)
Other (8) 25 4 – – 56 172 (67)
Net revenues 37 (66) 72 – (49) 40 87 (54)
Provision for credit losses 0 1 0 (100) – 3 (1) –
Compensation and benefits 103 107 185 (4) (44) 310 155 100
General and administrative expenses 44 61 89 (28) (51) 149 298 (50)
Commission expenses 8 8 5 0 60 37 44 (16)
Restructuring expenses 9 2 0 350 – 12 0 –
Total other operating expenses 61 71 94 (14) (35) 198 342 (42)
Total operating expenses 164 178 279 (8) (41) 508 497 2
Loss before taxes (127) (245) (207) (48) (39) (471) (409) 15
Balance sheet statistics (CHF million)
Total assets 65,636 63,480 62,007 3 6 65,636 62,007 6
Risk-weighted assets 1 20,718 18,021 16,756 15 24 20,718 16,756 24
Leverage exposure 1 63,467 59,858 59,154 6 7 63,467 59,154 7
1 Disclosed on a look-through basis.
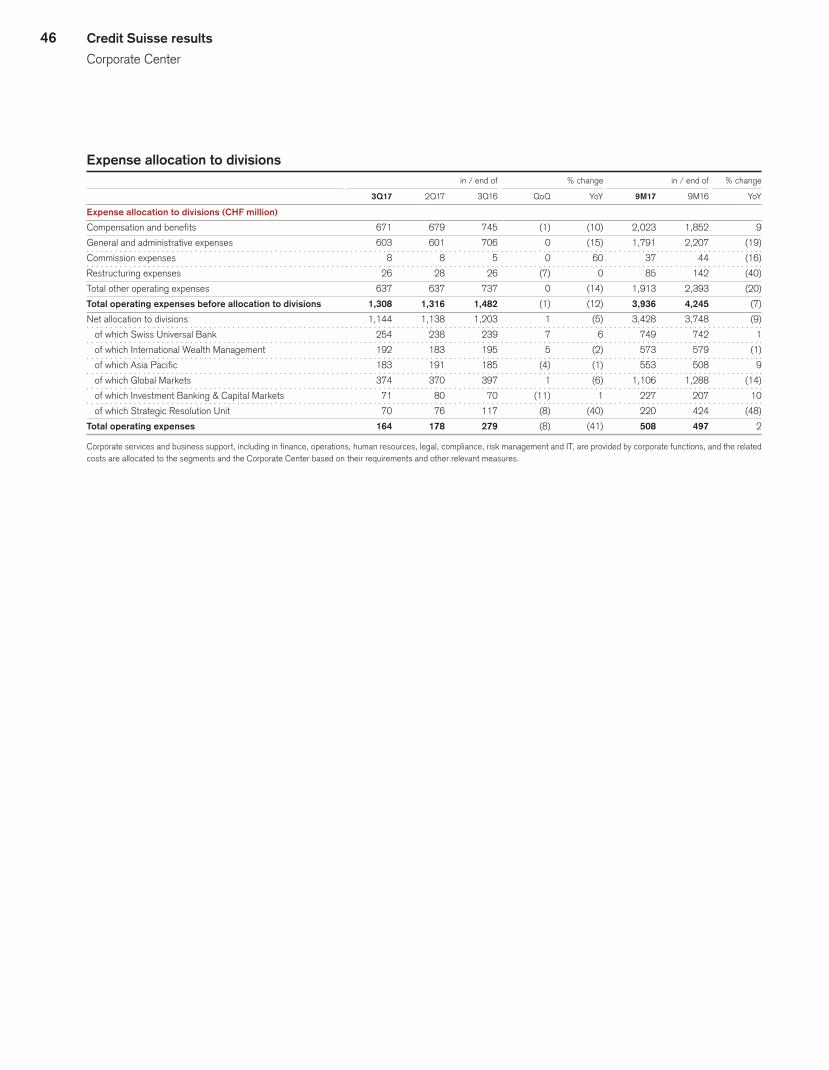
46 Credit Suisse results
Corporate Center
Expense allocation to divisions in / end of % change in / end of % change
3Q17 2Q17 3Q16 QoQ YoY 9M17 9M16 YoY
Expense allocation to divisions (CHF million)
Compensation and benefits 671 679 745 (1) (10) 2,023 1,852 9
General and administrative expenses 603 601 706 0 (15) 1,791 2,207 (19)
Commission expenses 8 8 5 0 60 37 44 (16)
Restructuring expenses 26 28 26 (7) 0 85 142 (40)
Total other operating expenses 637 637 737 0 (14) 1,913 2,393 (20)
Total operating expenses before allocation to divisions 1,308 1,316 1,482 (1) (12) 3,936 4,245 (7)
Net allocation to divisions 1,144 1,138 1,203 1 (5) 3,428 3,748 (9)
of which Swiss Universal Bank 254 238 239 7 6 749 742 1
of which International Wealth Management 192 183 195 5 (2) 573 579 (1)
of which Asia Pacific 183 191 185 (4) (1) 553 508 9
of which Global Markets 374 370 397 1 (6) 1,106 1,288 (14)
of which Investment Banking & Capital Markets 71 80 70 (11) 1 227 207 10
of which Strategic Resolution Unit 70 76 117 (8) (40) 220 424 (48)
Total operating expenses 164 178 279 (8) (41) 508 497 2
Corporate services and business support, including in finance, operations, human resources, legal, compliance, risk management and IT, are provided by corporate functions, and the related costs are allocated to the segments and the Corporate Center based on their requirements and other relevant measures.

47Credit Suisse results
Assets under management
Assets under managementAs of the end of 3Q17, assets under management were CHF 1,344.8 billion, with net asset outflows of CHF 1.8 billion in 3Q17.
Assets under managementAssets under management comprise assets that are placed with us for investment purposes and include discretionary and advisory counterparty assets.
Discretionary assets are assets for which the client fully trans-fers the discretionary power to a Credit Suisse entity with a man-agement mandate. Discretionary assets are reported in the busi-ness in which the advice is provided as well as in the business in which the investment decisions take place. Assets managed by the Asset Management business of International Wealth Management for other businesses are reported in each applicable business and eliminated at the Group level.
Advisory assets include assets placed with us where the client is provided access to investment advice but retains discretion over investment decisions.
Assets under management and net new assets include assets managed by consolidated entities, joint ventures and strategic
participations. Assets from joint ventures and participations are counted in proportion to our share in the respective entity.
Net new assetsNet new assets include individual cash payments, delivery of secu-rities and cash flows resulting from loan increases or repayments.
Interest and dividend income credited to clients and commis-sions, interest and fees charged for banking services as well as changes in assets under management due to currency and mar-ket volatility are not taken into account when calculating net new assets, as such charges or market movements are not directly related to the Group’s success in acquiring assets under manage-ment. Similarly structural effects mainly relate to asset inflows and outflows due to acquisition or divestiture, exit from businesses or markets or exits due to new regulatory requirements and are not taken into account when calculating net new assets. The Group reviews relevant policies regarding client assets on a regular basis.
Assets under management and client assets end of % change
3Q17 2Q17 4Q16 QoQ
Assets under management (CHF billion)
Swiss Universal Bank – Private Clients 206.1 201.5 192.2 2.3
Swiss Universal Bank – Corporate & Institutional Clients 346.7 352.5 339.3 (1.6)
International Wealth Management – Private Banking 355.3 336.4 323.2 5.6
International Wealth Management – Asset Management 376.3 366.0 321.6 2.8
Asia Pacific – Private Banking 190.0 177.8 166.9 6.9
Strategic Resolution Unit 5.9 6.7 13.7 (11.9)
Assets managed across businesses 1 (135.5) (133.6) (105.8) 1.4
Assets under management 1,344.8 1,307.3 1,251.1 2.9
of which discretionary assets 446.0 429.7 404.3 3.8
of which advisory assets 898.8 877.6 846.8 2.4
Client assets (CHF billion) 2
Swiss Universal Bank – Private Clients 234.6 229.5 218.5 2.2
Swiss Universal Bank – Corporate & Institutional Clients 471.7 463.5 447.8 1.8
International Wealth Management – Private Banking 450.0 430.5 423.4 4.5
International Wealth Management – Asset Management 376.3 366.0 321.6 2.8
Asia Pacific – Private Banking 242.7 223.4 202.8 8.6
Strategic Resolution Unit 10.0 11.1 19.8 (9.9)
Assets managed across businesses 1 (135.5) (133.6) (105.8) 1.4
Client Assets 1,649.8 1,590.4 1,528.1 3.7
1 Represents assets managed by Asset Management within International Wealth Management for the other businesses.2 Client assets is a broader measure than assets under management as it includes transactional accounts and assets under custody (assets held solely for transaction-related or safekeeping/
custody purposes) and assets of corporate clients and public institutions used primarily for cash management or transaction-related purposes.
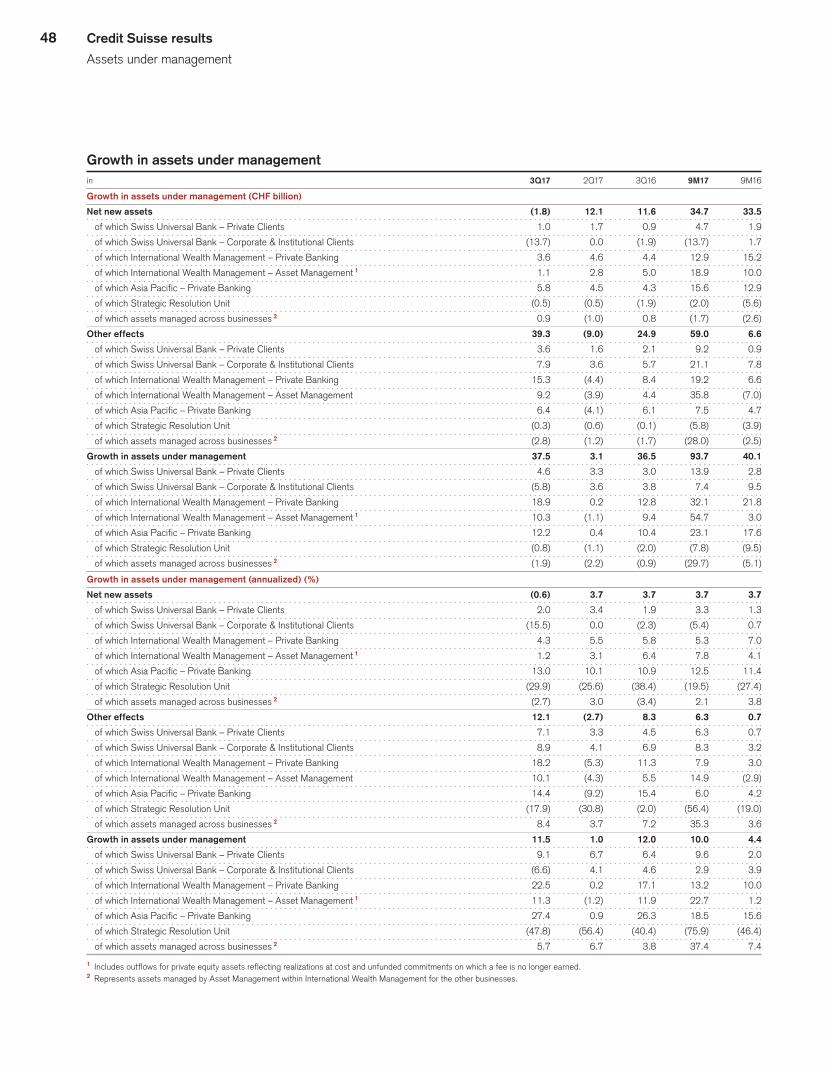
48 Credit Suisse results
Assets under management
Growth in assets under managementin 3Q17 2Q17 3Q16 9M17 9M16
Growth in assets under management (CHF billion)
Net new assets (1.8) 12.1 11.6 34.7 33.5
of which Swiss Universal Bank – Private Clients 1.0 1.7 0.9 4.7 1.9
of which Swiss Universal Bank – Corporate & Institutional Clients (13.7) 0.0 (1.9) (13.7) 1.7
of which International Wealth Management – Private Banking 3.6 4.6 4.4 12.9 15.2
of which International Wealth Management – Asset Management 1 1.1 2.8 5.0 18.9 10.0
of which Asia Pacific – Private Banking 5.8 4.5 4.3 15.6 12.9
of which Strategic Resolution Unit (0.5) (0.5) (1.9) (2.0) (5.6)
of which assets managed across businesses 2 0.9 (1.0) 0.8 (1.7) (2.6)
Other effects 39.3 (9.0) 24.9 59.0 6.6
of which Swiss Universal Bank – Private Clients 3.6 1.6 2.1 9.2 0.9
of which Swiss Universal Bank – Corporate & Institutional Clients 7.9 3.6 5.7 21.1 7.8
of which International Wealth Management – Private Banking 15.3 (4.4) 8.4 19.2 6.6
of which International Wealth Management – Asset Management 9.2 (3.9) 4.4 35.8 (7.0)
of which Asia Pacific – Private Banking 6.4 (4.1) 6.1 7.5 4.7
of which Strategic Resolution Unit (0.3) (0.6) (0.1) (5.8) (3.9)
of which assets managed across businesses 2 (2.8) (1.2) (1.7) (28.0) (2.5)
Growth in assets under management 37.5 3.1 36.5 93.7 40.1
of which Swiss Universal Bank – Private Clients 4.6 3.3 3.0 13.9 2.8
of which Swiss Universal Bank – Corporate & Institutional Clients (5.8) 3.6 3.8 7.4 9.5
of which International Wealth Management – Private Banking 18.9 0.2 12.8 32.1 21.8
of which International Wealth Management – Asset Management 1 10.3 (1.1) 9.4 54.7 3.0
of which Asia Pacific – Private Banking 12.2 0.4 10.4 23.1 17.6
of which Strategic Resolution Unit (0.8) (1.1) (2.0) (7.8) (9.5)
of which assets managed across businesses 2 (1.9) (2.2) (0.9) (29.7) (5.1)
Growth in assets under management (annualized) (%)
Net new assets (0.6) 3.7 3.7 3.7 3.7
of which Swiss Universal Bank – Private Clients 2.0 3.4 1.9 3.3 1.3
of which Swiss Universal Bank – Corporate & Institutional Clients (15.5) 0.0 (2.3) (5.4) 0.7
of which International Wealth Management – Private Banking 4.3 5.5 5.8 5.3 7.0
of which International Wealth Management – Asset Management 1 1.2 3.1 6.4 7.8 4.1
of which Asia Pacific – Private Banking 13.0 10.1 10.9 12.5 11.4
of which Strategic Resolution Unit (29.9) (25.6) (38.4) (19.5) (27.4)
of which assets managed across businesses 2 (2.7) 3.0 (3.4) 2.1 3.8
Other effects 12.1 (2.7) 8.3 6.3 0.7
of which Swiss Universal Bank – Private Clients 7.1 3.3 4.5 6.3 0.7
of which Swiss Universal Bank – Corporate & Institutional Clients 8.9 4.1 6.9 8.3 3.2
of which International Wealth Management – Private Banking 18.2 (5.3) 11.3 7.9 3.0
of which International Wealth Management – Asset Management 10.1 (4.3) 5.5 14.9 (2.9)
of which Asia Pacific – Private Banking 14.4 (9.2) 15.4 6.0 4.2
of which Strategic Resolution Unit (17.9) (30.8) (2.0) (56.4) (19.0)
of which assets managed across businesses 2 8.4 3.7 7.2 35.3 3.6
Growth in assets under management 11.5 1.0 12.0 10.0 4.4
of which Swiss Universal Bank – Private Clients 9.1 6.7 6.4 9.6 2.0
of which Swiss Universal Bank – Corporate & Institutional Clients (6.6) 4.1 4.6 2.9 3.9
of which International Wealth Management – Private Banking 22.5 0.2 17.1 13.2 10.0
of which International Wealth Management – Asset Management 1 11.3 (1.2) 11.9 22.7 1.2
of which Asia Pacific – Private Banking 27.4 0.9 26.3 18.5 15.6
of which Strategic Resolution Unit (47.8) (56.4) (40.4) (75.9) (46.4)
of which assets managed across businesses 2 5.7 6.7 3.8 37.4 7.4
1 Includes outflows for private equity assets reflecting realizations at cost and unfunded commitments on which a fee is no longer earned.2 Represents assets managed by Asset Management within International Wealth Management for the other businesses.
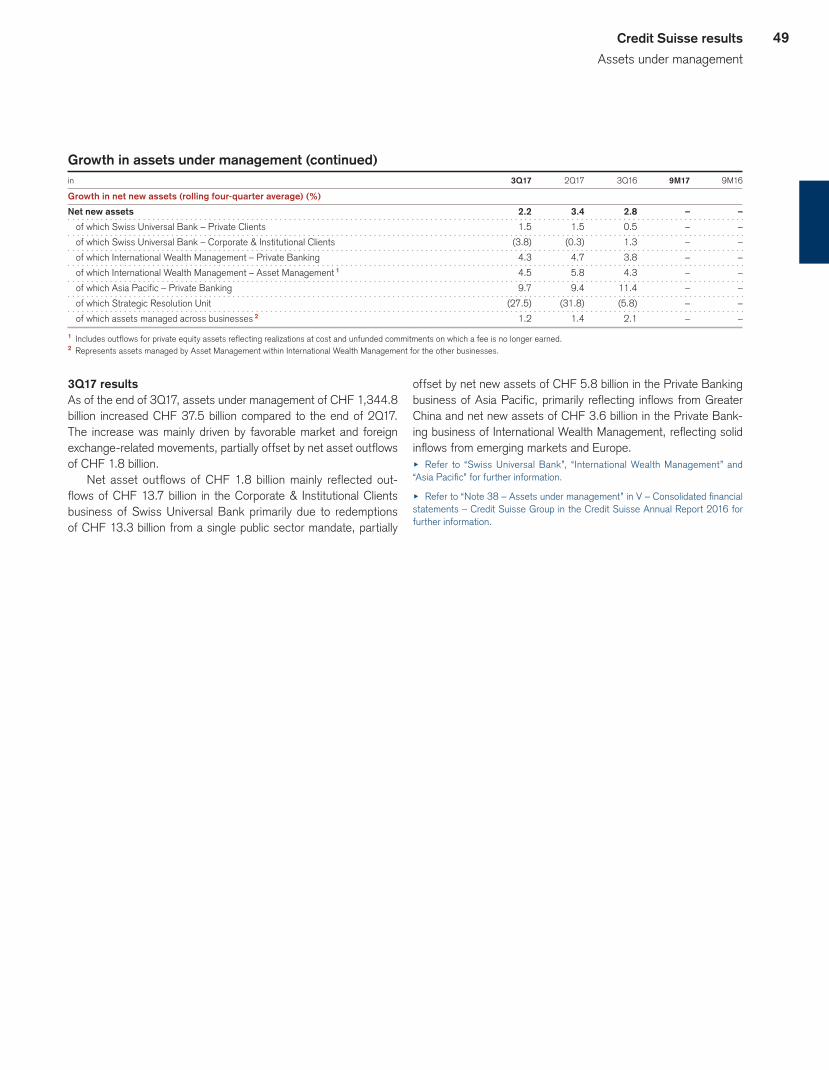
49Credit Suisse results
Assets under management
Growth in assets under management (continued)in 3Q17 2Q17 3Q16 9M17 9M16
Growth in net new assets (rolling four-quarter average) (%)
Net new assets 2.2 3.4 2.8 – –
of which Swiss Universal Bank – Private Clients 1.5 1.5 0.5 – –
of which Swiss Universal Bank – Corporate & Institutional Clients (3.8) (0.3) 1.3 – –
of which International Wealth Management – Private Banking 4.3 4.7 3.8 – –
of which International Wealth Management – Asset Management 1 4.5 5.8 4.3 – –
of which Asia Pacific – Private Banking 9.7 9.4 11.4 – –
of which Strategic Resolution Unit (27.5) (31.8) (5.8) – –
of which assets managed across businesses 2 1.2 1.4 2.1 – –
1 Includes outflows for private equity assets reflecting realizations at cost and unfunded commitments on which a fee is no longer earned.2 Represents assets managed by Asset Management within International Wealth Management for the other businesses.
3Q17 resultsAs of the end of 3Q17, assets under management of CHF 1,344.8 billion increased CHF 37.5 billion compared to the end of 2Q17. The increase was mainly driven by favorable market and foreign exchange-related movements, partially offset by net asset outflows of CHF 1.8 billion.
Net asset outflows of CHF 1.8 billion mainly reflected out-flows of CHF 13.7 billion in the Corporate & Institutional Clients business of Swiss Universal Bank primarily due to redemptions of CHF 13.3 billion from a single public sector mandate, partially
offset by net new assets of CHF 5.8 billion in the Private Banking business of Asia Pacific, primarily reflecting inflows from Greater China and net new assets of CHF 3.6 billion in the Private Bank-ing business of International Wealth Management, reflecting solid inflows from emerging markets and Europe.u Refer to “Swiss Universal Bank”, “International Wealth Management” and “Asia Pacific” for further information.
u Refer to “Note 38 – Assets under management” in V – Consolidated financial statements – Credit Suisse Group in the Credit Suisse Annual Report 2016 for further information.

50 Credit Suisse results
Assets under management
[this page intentionally left blank]

Treasury, risk, balance sheet and off-balance sheet
51
IITreasury, risk, balance sheet and off-balance sheet
Liquidity and funding management 52
Capital management 56
Risk management 72
Balance sheet and off-balance sheet 83
52 Treasury, risk, balance sheet and off-balance sheet
Liquidity and funding management
Liquidity and funding management In 3Q17, we maintained a strong liquidity and funding position. The majority of our unsecured funding was generated from core customer deposits and long-term debt.
OVERVIEW Securities for funding and capital purposes have historically been issued primarily by the Bank, our principal operating subsidiary and a US registrant. In response to regulatory reform, we have focused our issuance strategy on offering long-term debt securities at the Group level. Proceeds from issuances are lent to operating sub-sidiaries and affiliates on both a senior and subordinated basis, as needed; the latter typically to meet capital requirements and the former as desired by management to support business initiatives and liquidity needs.
Our internal liquidity risk management framework is subject to review and monitoring by the FINMA, other regulators and rating agencies.u Refer to “Treasury management” in III – Treasury, Risk, Balance sheet and Off-balance sheet in the Credit Suisse Annual Report 2016 for further information on liquidity and funding management.
REGULATORY FRAMEWORK Basel III liquidity frameworkIn 2010, the Basel Committee on Banking Supervision (BCBS) issued the Basel III international framework for liquidity risk mea-surement, standards and monitoring. The Basel III framework includes a liquidity coverage ratio (LCR) and a net stable funding ratio (NSFR). As of January 1, 2013, Basel III was implemented in Switzerland along with the Swiss “Too Big to Fail” legislation and regulations thereunder. Our related disclosures are in accor-dance with our interpretation of such requirements, including rel-evant assumptions and estimates. Changes in the interpretation of these requirements in Switzerland or in any of our interpretations, assumptions or estimates could result in different numbers from those shown in this report.
The LCR, which is being phased in from January 1, 2015 through January 1, 2019, addresses liquidity risk over a 30-day period. The LCR aims to ensure that banks have unencumbered high-quality liquid assets (HQLA) available to meet short-term liquidity needs under a severe stress scenario. The LCR is com-prised of two components, the value of HQLA in stressed con-ditions and the total net cash outflows calculated according to specified scenario parameters. Under the BCBS requirements, the ratio of liquid assets over net cash outflows is subject to an initial minimum requirement of 60%, which will increase by 10% per year until January 1, 2019.
The NSFR establishes criteria for a minimum amount of stable funding based on the liquidity of a bank’s on- and off-balance sheet activities over a one-year horizon. The NSFR is a complementary measure to the LCR and is structured to ensure that illiquid assets are funded with an appropriate amount of stable long-term funds.
The NSFR is defined as the ratio of available stable funding over the amount of required stable funding and once implemented by national regulators, should always be at least 100%.
Swiss liquidity requirementsIn 2012, the Swiss Federal Council adopted a liquidity ordinance (Liquidity Ordinance) that implements Basel III liquidity require-ments into Swiss law subject, in part, to further rule-making, including with respect to the final Basel III LCR rules adopted in 2014. Under the Liquidity Ordinance, as amended, certain Swiss banks became subject to an initial 60% LCR requirement, with incremental increases by 10% per year until January 1, 2019. Sys-temically relevant banks like Credit Suisse became subject to an initial minimum LCR requirement of 100% beginning on January 1, 2015 and the associated disclosure requirements. Further, begin-ning in May 2015, FINMA required us to maintain a minimum LCR of 110% at all times.
In connection with the implementation of Basel III, regula-tory LCR disclosures for the Group and certain subsidiaries are required. Further details on our LCR can be found on our website.u Refer to www.credit-suisse.com/regulatorydisclosures for additional information.
FINMA requires us to report the NSFR to FINMA on a monthly basis. The reporting instructions are generally aligned with the final BCBS NSFR requirements. Following an observation period that began in 2012, the NSFR will become a minimum standard in Switzerland on January 1, 2019, at which time banks will be required to comply with disclosure requirements prescribed by the BCBS and implemented by FINMA.Our liquidity principles and our liquidity risk management frame-work as agreed with FINMA are in line with the Basel III liquidity framework.u Refer to “Treasury management” in III – Treasury, Risk, Balance sheet and Off-balance sheet in the Credit Suisse Annual Report 2016 for further information on the Basel III liquidity framework and Swiss liquidity requirements.
LIQUIDITY RISK MANAGEMENT FRAMEWORKOur liquidity and funding policy is designed to ensure that fund-ing is available to meet all obligations in times of stress, whether caused by market events or issues specific to Credit Suisse. We achieve this through a conservative asset/liability management strategy aimed at maintaining long-term funding, including stable deposits, in excess of illiquid assets. To address short-term liquid-ity stress, we maintain a liquidity pool, described below, that covers unexpected outflows in the event of severe market and idiosyn-cratic stress. Our liquidity risk parameters reflect various liquidity stress assumptions that we believe are conservative. We manage

53Treasury, risk, balance sheet and off-balance sheet
Liquidity and funding management
our liquidity profile at a sufficient level such that, in the event we are unable to access unsecured funding, we expect to have suf-ficient liquidity to sustain operations for a period of time in excess of our minimum limit. This includes potential currency mismatches, which are not deemed to be a major risk but are monitored and subject to limits, particularly in the significant currencies of euro, Japanese yen, pound sterling, Swiss franc and US dollar.u Refer to “Treasury management” in III – Treasury, Risk, Balance sheet and Off-balance sheet in the Credit Suisse Annual Report 2016 for further information on our approach to liquidity risk management, governance and contingency planning.
LIQUIDITY METRICSLiquidity pool Treasury manages a sizeable portfolio of liquid assets comprised of cash held at central banks and securities. A portion of the liquid-ity pool is generated through reverse repurchase agreements with top-rated counterparties. We are mindful of potential credit risk and therefore focus our liquidity holdings strategy on cash held at cen-tral banks and highly rated government bonds and on short-term reverse repurchase agreements. These government bonds are eli-gible as collateral for liquidity facilities with various central banks including the SNB, the Fed, the ECB and the BoE. Our direct exposure on these bonds is limited to highly liquid, top-rated sov-ereign entities or fully guaranteed agencies of sovereign entities.
The liquidity pool may be used to meet the liquidity requirements of our operating companies.
As of the end of 3Q17, our liquidity pool managed by Trea-sury had an HQLA value of CHF 166.0 billion. The liquidity pool consisted of CHF 97.8 billion of cash held at major central banks, primarily the SNB, the Fed and the ECB, and CHF 68.2 billion market value of securities issued by governments and government agencies, primarily from the US, UK and France.
In addition to the liquidity portfolio managed by Treasury, there is also a portfolio of unencumbered liquid assets managed by various businesses, primarily in the Global Markets and Invest-ment Banking & Capital Markets divisions. These assets generally include high-grade bonds and highly liquid equity securities that form part of major indices. In coordination with the businesses, Treasury can access these assets to generate liquidity if required.
As of the end of 3Q17, the portfolio that is not managed by Treasury had a market value of CHF 31.3 billion, consisting of CHF 8.1 billion of high-grade bonds and CHF 23.2 billion of highly liquid equity securities. Under our internal model, an average stress-level haircut of 17% is applied to these assets. The haircuts applied to these portfolios reflect our assessment of overall market risk at the time of measurement, potential monetization capacity taking into account increased haircuts, market volatility and the quality of the relevant securities.
Liquidity pool – GroupEnd of 3Q17 2Q17 4Q16
Swiss US Other franc dollar Euro currencies Total Total Total
Liquid assets (CHF million)
Cash held at central banks 73,022 16,629 6,421 1,727 97,799 94,213 98,294
Securities 5,776 32,478 10,070 19,844 68,168 61,496 91,680
Liquid assets 1 78,798 49,107 16,491 21,571 165,967 155,709 189,974
1 Reflects a pre-cancellation view.
Liquidity Coverage Ratio Our calculation methodology for the LCR is prescribed by FINMA. For disclosure purposes, since January 1, 2017, our LCR is cal-culated using a three-month average that is measured using daily calculations during the quarter. The FINMA calculation of HQLA takes into account a cancellation mechanism (post-cancellation view) and is therefore not directly comparable to the assets pre-sented in the financial statements that could potentially be mon-etized under a severe stress scenario. The cancellation mecha-nism effectively excludes the impact of certain secured financing transactions from available HQLA and simultaneously adjusts the level of net cash outflows calculated. Application of the cancella-tion mechanism adjusts both the numerator and denominator of the LCR calculation, meaning that the impact is mostly neutral on the LCR itself.
Beginning on March 31, 2017, our HQLA measurement meth-odology excludes potentially eligible HQLA available for use by
entities of the Group in certain jurisdictions that may not be read-ily accessible for use by the Group as a whole. These HQLA eli-gible amounts may be restricted for reasons such as local reg-ulatory requirements, including large exposure requirements, or other binding constraints that could limit the transferability to other Group entities in other jurisdictions.
On this basis, the level of our LCR was 181% as of the end of 3Q17, an increase from 165% as of the end of 2Q17, represent-ing an average HQLA of CHF 167.8 billion and average net cash outflows of CHF 92.5 billion.
A significant part of the increase in the LCR in 3Q17 resulted from an increase in HQLA, which was mainly driven by the increase in the amount of securities held. The remainder of the increase resulted from a reduction in net cash outflows compared to the prior quarter, primarily arising from decreased cash outflows associated with other collateral requirements, credit and liquidity facilities and balances related to open and failed trades.

54 Treasury, risk, balance sheet and off-balance sheet
Liquidity and funding management
Liquidity coverage ratio – GroupEnd of 3Q17 2Q17 4Q16
Unweighted Weighted Weighted Weighted value 1 value 2 value 2 value 2
High-quality liquid assets (CHF million)
High-quality liquid assets 3 168,779 167,810 158,797 190,642
Cash outflows (CHF million)
Retail deposits and deposits from small business customers 155,520 19,564 19,053 18,811
Unsecured wholesale funding 211,091 83,410 83,985 74,763
Secured wholesale funding 149,046 66,424 70,155 63,312
Additional requirements 177,708 37,536 40,321 46,434
Other contractual funding obligations 69,459 69,459 77,177 66,300
Other contingent funding obligations 228,500 6,305 6,863 6,279
Total cash outflows 991,324 282,698 297,554 275,899
Cash inflows (CHF million)
Secured lending 131,449 86,276 90,958 80,759
Inflows from fully performing exposures 61,728 30,708 31,216 30,234
Other cash inflows 73,197 73,197 79,132 70,618
Total cash inflows 266,374 190,181 201,306 181,611
Liquidity coverage ratio
High-quality liquid assets (CHF million) 167,810 158,797 190,642
Net cash outflows (CHF million) 92,517 96,248 94,288
Liquidity coverage ratio (%) 181 165 202
Calculated using a three-month average which since 1Q17 is calculated on a daily basis.1 Calculated as outstanding balances maturing or callable within 30 days.2 Calculated after the application of haircuts for high-quality liquid assets or inflow and outflow rates.3 Consists of cash and eligible securities as prescribed by FINMA and reflects a post-cancellation view.
FUNDING SOURCES AND USESWe fund our balance sheet primarily through core customer deposits, long-term debt, including structured notes, and share-holders’ equity. We monitor the funding sources, including their concentrations against certain limits, according to their counter-party, currency, tenor, geography and maturity, and whether they are secured or unsecured.
A substantial portion of our balance sheet is match funded and requires no unsecured funding. Match funded balance sheet items consist of assets and liabilities with close to equal liquidity durations and values so that the liquidity and funding generated or required by the positions are substantially equivalent.
Cash and due from banks and reverse repurchase agreements are highly liquid. A significant part of our assets, principally unen-cumbered trading assets that support the securities business, is comprised of securities inventories and collateralized receivables that fluctuate and are generally liquid. These liquid assets are available to settle short-term liabilities.
Loans, which comprise the largest component of our illiquid assets, are funded by our core customer deposits, with an excess coverage of 18% as of the end of 3Q17, compared to 19% as of the end of 2Q17, primarily reflecting a small increase in deposits and loans. We fund other illiquid assets, including real estate, pri-vate equity and other long-term investments as well as the haircut for the illiquid portion of securities, with long-term debt and equity, in which we try to maintain a substantial funding buffer.
Our core customer deposits totaled CHF 327 billion as of the end of 3Q17, compared to CHF 323 billion as of the end of 2Q17,
reflecting a small increase in the customer deposit base in our private banking and corporate & institutional banking businesses. Core customer deposits are from clients with whom we have a broad and longstanding relationship. Core customer deposits exclude deposits from banks and certificates of deposit. We place a priority on maintaining and growing customer deposits, as they have proven to be a stable and resilient source of funding even in difficult market conditions. Our core customer deposit funding is supplemented by the issuance of long-term debt.u Refer to the chart “Balance sheet funding structure” and “Balance sheet” in Balance sheet, and off-balance sheet for further information.
DEBT ISSUANCES AND REDEMPTIONS Our long-term debt includes senior, senior bail-in and subordinated debt issued in US-registered offerings and medium-term note pro-grams, euro market medium-term note programs, stand-alone offer-ings, structured note programs, covered bond programs, Australian dollar domestic medium-term note programs and a Samurai shelf registration statement in Japan. As a global bank, we have access to multiple markets worldwide and our major funding centers are New York, London, Zurich and Tokyo.
Our covered bond funding is in the form of mortgage-backed loans funded by domestic covered bonds issued through Pfandbrief-bank Schweizerischer Hypothekarinstitute, one of two institutions established by a 1930 act of the Swiss Parliament to centralize the issuance of covered bonds, or historically from our own international covered bond program.
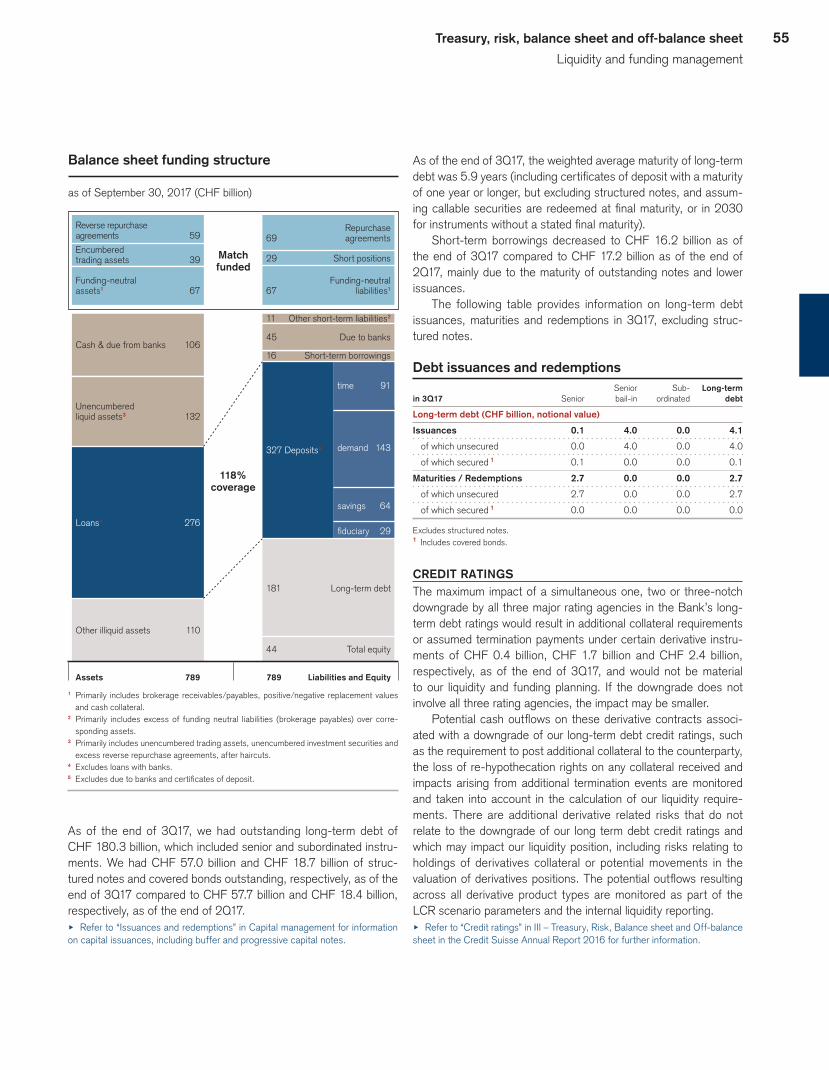
55Treasury, risk, balance sheet and off-balance sheet
Liquidity and funding management
Match funded
Balance sheet funding structure
as of September 30, 2017 (CHF billion)
Reverse repurchase agreements 59
Repurchase 69 agreements
Encumbered trading assets 39 29 Short positions
Funding-neutral assets1 67
Cash & due from banks 106
11 Other short-term liabilities2
45 Due to banks
16 Short-term borrowings
181 Long-term debt
44 Total equity
327 Deposits5
time 91
demand 143
savings 64
fiduciary 29
Unencumbered liquid assets3 132
Loans4 276
Other illiquid assets 110
Assets 789 789 Liabilities and Equity
Funding-neutral 67 liabilities1
118% coverage
1 Primarily includes brokerage receivables/payables, positive/negative replacement values and cash collateral.
2 Primarily includes excess of funding neutral liabilities (brokerage payables) over corre-sponding assets.
3 Primarily includes unencumbered trading assets, unencumbered investment securities and excess reverse repurchase agreements, after haircuts.
4 Excludes loans with banks.5 Excludes due to banks and certificates of deposit.
As of the end of 3Q17, we had outstanding long-term debt of CHF 180.3 billion, which included senior and subordinated instru-ments. We had CHF 57.0 billion and CHF 18.7 billion of struc-tured notes and covered bonds outstanding, respectively, as of the end of 3Q17 compared to CHF 57.7 billion and CHF 18.4 billion, respectively, as of the end of 2Q17. u Refer to “Issuances and redemptions” in Capital management for information on capital issuances, including buffer and progressive capital notes.
As of the end of 3Q17, the weighted average maturity of long-term debt was 5.9 years (including certificates of deposit with a maturity of one year or longer, but excluding structured notes, and assum-ing callable securities are redeemed at final maturity, or in 2030 for instruments without a stated final maturity).
Short-term borrowings decreased to CHF 16.2 billion as of the end of 3Q17 compared to CHF 17.2 billion as of the end of 2Q17, mainly due to the maturity of outstanding notes and lower issuances.
The following table provides information on long-term debt issuances, maturities and redemptions in 3Q17, excluding struc-tured notes.
Debt issuances and redemptions Senior Sub- Long-term
in 3Q17 Senior bail-in ordinated debt
Long-term debt (CHF billion, notional value)
Issuances 0.1 4.0 0.0 4.1
of which unsecured 0.0 4.0 0.0 4.0
of which secured 1 0.1 0.0 0.0 0.1
Maturities / Redemptions 2.7 0.0 0.0 2.7
of which unsecured 2.7 0.0 0.0 2.7
of which secured 1 0.0 0.0 0.0 0.0
Excludes structured notes.1 Includes covered bonds.
CREDIT RATINGS The maximum impact of a simultaneous one, two or three-notch downgrade by all three major rating agencies in the Bank’s long-term debt ratings would result in additional collateral requirements or assumed termination payments under certain derivative instru-ments of CHF 0.4 billion, CHF 1.7 billion and CHF 2.4 billion, respectively, as of the end of 3Q17, and would not be material to our liquidity and funding planning. If the downgrade does not involve all three rating agencies, the impact may be smaller.
Potential cash outflows on these derivative contracts associ-ated with a downgrade of our long-term debt credit ratings, such as the requirement to post additional collateral to the counterparty, the loss of re-hypothecation rights on any collateral received and impacts arising from additional termination events are monitored and taken into account in the calculation of our liquidity require-ments. There are additional derivative related risks that do not relate to the downgrade of our long term debt credit ratings and which may impact our liquidity position, including risks relating to holdings of derivatives collateral or potential movements in the valuation of derivatives positions. The potential outflows resulting across all derivative product types are monitored as part of the LCR scenario parameters and the internal liquidity reporting.u Refer to “Credit ratings” in III – Treasury, Risk, Balance sheet and Off-balance sheet in the Credit Suisse Annual Report 2016 for further information.
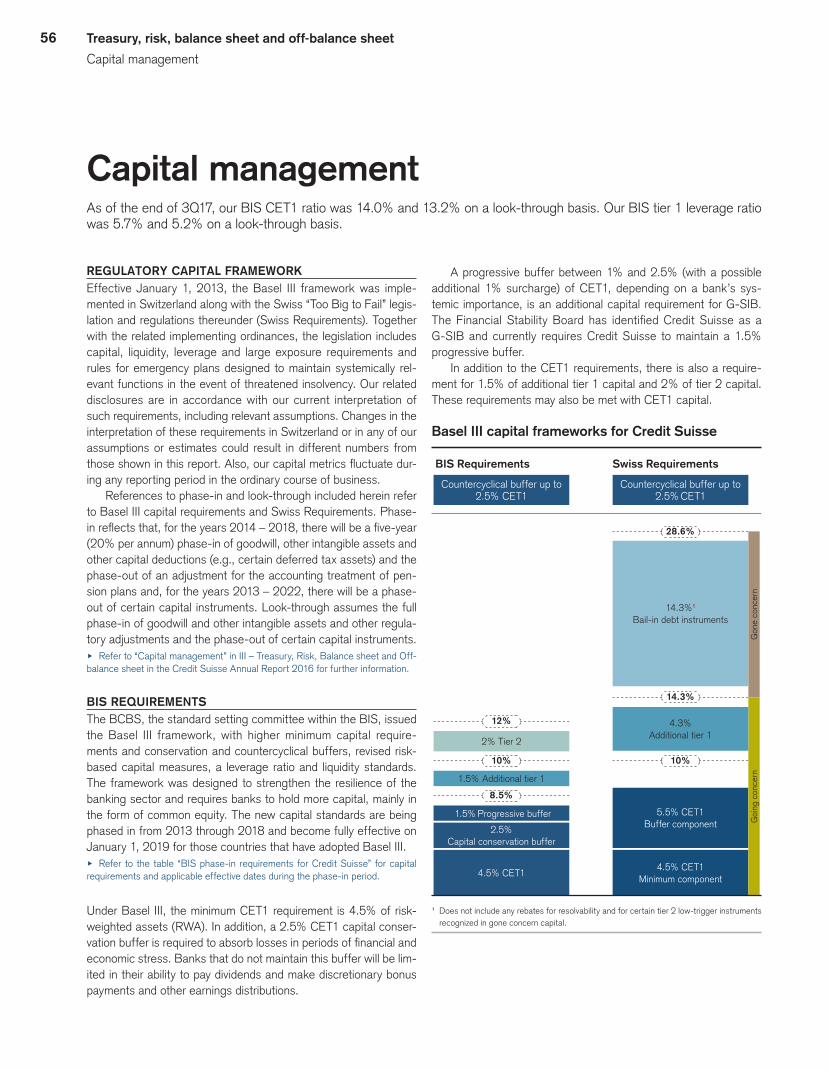
56 Treasury, risk, balance sheet and off-balance sheet
Capital management
Basel III capital frameworks for Credit Suisse
BIS Requirements Swiss Requirements
Countercyclical buffer up to 2.5% CET1
Countercyclical buffer up to 2.5% CET1
1 Does not include any rebates for resolvability and for certain tier 2 low-trigger instruments recognized in gone concern capital.
4.5% CET14.5% CET1
Minimum component
2.5% Capital conservation buffer
5.5% CET1 Buffer component
1.5% Progressive buffer
1.5% Additional tier 1
2% Tier 2
12%
10% 10%
14.3%
28.6%
8.5%
Goi
ng c
once
rn
4.3% Additional tier 1
14.3%1 Bail-in debt instruments
Gon
e co
ncer
n
Capital managementAs of the end of 3Q17, our BIS CET1 ratio was 14.0% and 13.2% on a look-through basis. Our BIS tier 1 leverage ratio was 5.7% and 5.2% on a look-through basis.
REGULATORY CAPITAL FRAMEWORKEffective January 1, 2013, the Basel III framework was imple-mented in Switzerland along with the Swiss “Too Big to Fail” legis-lation and regulations thereunder (Swiss Requirements). Together with the related implementing ordinances, the legislation includes capital, liquidity, leverage and large exposure requirements and rules for emergency plans designed to maintain systemically rel-evant functions in the event of threatened insolvency. Our related disclosures are in accordance with our current interpretation of such requirements, including relevant assumptions. Changes in the interpretation of these requirements in Switzerland or in any of our assumptions or estimates could result in different numbers from those shown in this report. Also, our capital metrics fluctuate dur-ing any reporting period in the ordinary course of business.
References to phase-in and look-through included herein refer to Basel III capital requirements and Swiss Requirements. Phase-in reflects that, for the years 2014 – 2018, there will be a five-year (20% per annum) phase-in of goodwill, other intangible assets and other capital deductions (e.g., certain deferred tax assets) and the phase-out of an adjustment for the accounting treatment of pen-sion plans and, for the years 2013 – 2022, there will be a phase-out of certain capital instruments. Look-through assumes the full phase-in of goodwill and other intangible assets and other regula-tory adjustments and the phase-out of certain capital instruments.u Refer to “Capital management” in III – Treasury, Risk, Balance sheet and Off-balance sheet in the Credit Suisse Annual Report 2016 for further information.
BIS REQUIREMENTSThe BCBS, the standard setting committee within the BIS, issued the Basel III framework, with higher minimum capital require-ments and conservation and countercyclical buffers, revised risk-based capital measures, a leverage ratio and liquidity standards. The framework was designed to strengthen the resilience of the banking sector and requires banks to hold more capital, mainly in the form of common equity. The new capital standards are being phased in from 2013 through 2018 and become fully effective on January 1, 2019 for those countries that have adopted Basel III.u Refer to the table “BIS phase-in requirements for Credit Suisse” for capital requirements and applicable effective dates during the phase-in period.
Under Basel III, the minimum CET1 requirement is 4.5% of risk-weighted assets (RWA). In addition, a 2.5% CET1 capital conser-vation buffer is required to absorb losses in periods of financial and economic stress. Banks that do not maintain this buffer will be lim-ited in their ability to pay dividends and make discretionary bonus payments and other earnings distributions.
A progressive buffer between 1% and 2.5% (with a possible additional 1% surcharge) of CET1, depending on a bank’s sys-temic importance, is an additional capital requirement for G-SIB. The Financial Stability Board has identified Credit Suisse as a G-SIB and currently requires Credit Suisse to maintain a 1.5% progressive buffer.
In addition to the CET1 requirements, there is also a require-ment for 1.5% of additional tier 1 capital and 2% of tier 2 capital. These requirements may also be met with CET1 capital.
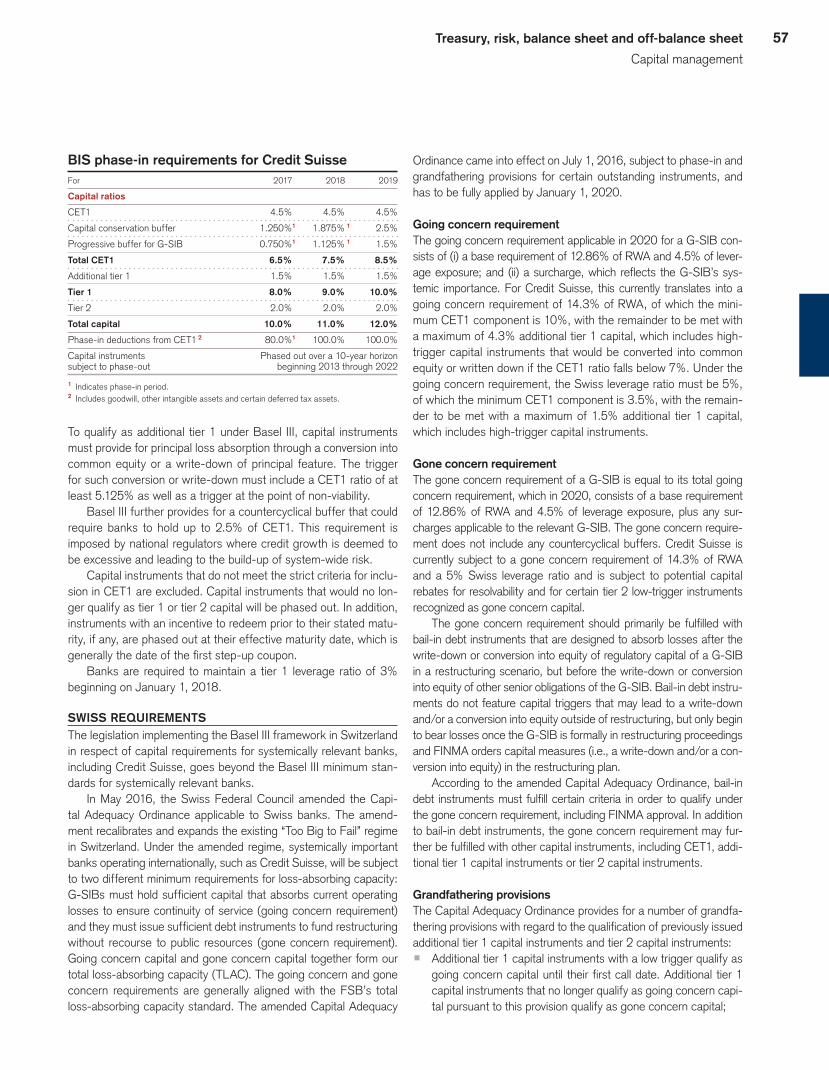
57Treasury, risk, balance sheet and off-balance sheet
Capital management
BIS phase-in requirements for Credit SuisseFor 2017 2018 2019
Capital ratios
CET1 4.5% 4.5% 4.5%
Capital conservation buffer 1.250% 1 1.875% 1 2.5%
Progressive buffer for G-SIB 0.750% 1 1.125% 1 1.5%
Total CET1 6.5% 7.5% 8.5%
Additional tier 1 1.5% 1.5% 1.5%
Tier 1 8.0% 9.0% 10.0%
Tier 2 2.0% 2.0% 2.0%
Total capital 10.0% 11.0% 12.0%
Phase-in deductions from CET1 2 80.0% 1 100.0% 100.0%
Capital instruments Phased out over a 10-year horizon subject to phase-out beginning 2013 through 2022
1 Indicates phase-in period.2 Includes goodwill, other intangible assets and certain deferred tax assets.
To qualify as additional tier 1 under Basel III, capital instruments must provide for principal loss absorption through a conversion into common equity or a write-down of principal feature. The trigger for such conversion or write-down must include a CET1 ratio of at least 5.125% as well as a trigger at the point of non-viability.
Basel III further provides for a countercyclical buffer that could require banks to hold up to 2.5% of CET1. This requirement is imposed by national regulators where credit growth is deemed to be excessive and leading to the build-up of system-wide risk.
Capital instruments that do not meet the strict criteria for inclu-sion in CET1 are excluded. Capital instruments that would no lon-ger qualify as tier 1 or tier 2 capital will be phased out. In addition, instruments with an incentive to redeem prior to their stated matu-rity, if any, are phased out at their effective maturity date, which is generally the date of the first step-up coupon.
Banks are required to maintain a tier 1 leverage ratio of 3% beginning on January 1, 2018.
SWISS REQUIREMENTSThe legislation implementing the Basel III framework in Switzerland in respect of capital requirements for systemically relevant banks, including Credit Suisse, goes beyond the Basel III minimum stan-dards for systemically relevant banks.
In May 2016, the Swiss Federal Council amended the Capi-tal Adequacy Ordinance applicable to Swiss banks. The amend-ment recalibrates and expands the existing “Too Big to Fail” regime in Switzerland. Under the amended regime, systemically important banks operating internationally, such as Credit Suisse, will be subject to two different minimum requirements for loss-absorbing capacity: G-SIBs must hold sufficient capital that absorbs current operating losses to ensure continuity of service (going concern requirement) and they must issue sufficient debt instruments to fund restructuring without recourse to public resources (gone concern requirement). Going concern capital and gone concern capital together form our total loss-absorbing capacity (TLAC). The going concern and gone concern requirements are generally aligned with the FSB’s total loss-absorbing capacity standard. The amended Capital Adequacy
Ordinance came into effect on July 1, 2016, subject to phase-in and grandfathering provisions for certain outstanding instruments, and has to be fully applied by January 1, 2020.
Going concern requirementThe going concern requirement applicable in 2020 for a G-SIB con-sists of (i) a base requirement of 12.86% of RWA and 4.5% of lever-age exposure; and (ii) a surcharge, which reflects the G-SIB’s sys-temic importance. For Credit Suisse, this currently translates into a going concern requirement of 14.3% of RWA, of which the mini-mum CET1 component is 10%, with the remainder to be met with a maximum of 4.3% additional tier 1 capital, which includes high-trigger capital instruments that would be converted into common equity or written down if the CET1 ratio falls below 7%. Under the going concern requirement, the Swiss leverage ratio must be 5%, of which the minimum CET1 component is 3.5%, with the remain-der to be met with a maximum of 1.5% additional tier 1 capital, which includes high-trigger capital instruments.
Gone concern requirementThe gone concern requirement of a G-SIB is equal to its total going concern requirement, which in 2020, consists of a base requirement of 12.86% of RWA and 4.5% of leverage exposure, plus any sur-charges applicable to the relevant G-SIB. The gone concern require-ment does not include any countercyclical buffers. Credit Suisse is currently subject to a gone concern requirement of 14.3% of RWA and a 5% Swiss leverage ratio and is subject to potential capital rebates for resolvability and for certain tier 2 low-trigger instruments recognized as gone concern capital.
The gone concern requirement should primarily be fulfilled with bail-in debt instruments that are designed to absorb losses after the write-down or conversion into equity of regulatory capital of a G-SIB in a restructuring scenario, but before the write-down or conversion into equity of other senior obligations of the G-SIB. Bail-in debt instru-ments do not feature capital triggers that may lead to a write-down and/or a conversion into equity outside of restructuring, but only begin to bear losses once the G-SIB is formally in restructuring proceedings and FINMA orders capital measures (i.e., a write-down and/or a con-version into equity) in the restructuring plan.
According to the amended Capital Adequacy Ordinance, bail-in debt instruments must fulfill certain criteria in order to qualify under the gone concern requirement, including FINMA approval. In addition to bail-in debt instruments, the gone concern requirement may fur-ther be fulfilled with other capital instruments, including CET1, addi-tional tier 1 capital instruments or tier 2 capital instruments.
Grandfathering provisionsThe Capital Adequacy Ordinance provides for a number of grandfa-thering provisions with regard to the qualification of previously issued additional tier 1 capital instruments and tier 2 capital instruments:p Additional tier 1 capital instruments with a low trigger qualify as
going concern capital until their first call date. Additional tier 1 capital instruments that no longer qualify as going concern capi-tal pursuant to this provision qualify as gone concern capital;
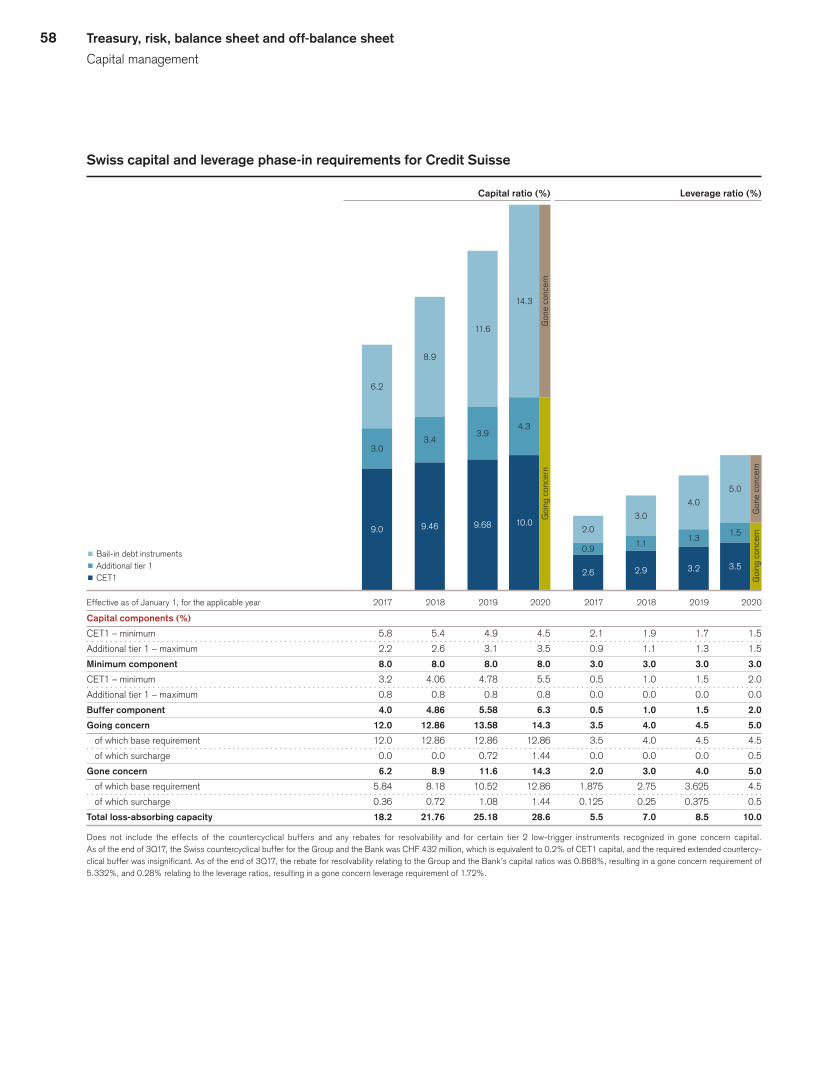
58 Treasury, risk, balance sheet and off-balance sheet
Capital management
Effective as of January 1, for the applicable year 2017 2018 2019 2020 2017 2018 2019 2020
Capital components (%)
CET1 – minimum 5.8 5.4 4.9 4.5 2.1 1.9 1.7 1.5
Additional tier 1 – maximum 2.2 2.6 3.1 3.5 0.9 1.1 1.3 1.5
Minimum component 8.0 8.0 8.0 8.0 3.0 3.0 3.0 3.0
CET1 – minimum 3.2 4.06 4.78 5.5 0.5 1.0 1.5 2.0
Additional tier 1 – maximum 0.8 0.8 0.8 0.8 0.0 0.0 0.0 0.0
Buffer component 4.0 4.86 5.58 6.3 0.5 1.0 1.5 2.0
Going concern 12.0 12.86 13.58 14.3 3.5 4.0 4.5 5.0
of which base requirement 12.0 12.86 12.86 12.86 3.5 4.0 4.5 4.5
of which surcharge 0.0 0.0 0.72 1.44 0.0 0.0 0.0 0.5
Gone concern 6.2 8.9 11.6 14.3 2.0 3.0 4.0 5.0
of which base requirement 5.84 8.18 10.52 12.86 1.875 2.75 3.625 4.5
of which surcharge 0.36 0.72 1.08 1.44 0.125 0.25 0.375 0.5
Total loss-absorbing capacity 18.2 21.76 25.18 28.6 5.5 7.0 8.5 10.0
Does not include the effects of the countercyclical buffers and any rebates for resolvability and for certain tier 2 low-trigger instruments recognized in gone concern capital. As of the end of 3Q17, the Swiss countercyclical buffer for the Group and the Bank was CHF 432 million, which is equivalent to 0.2% of CET1 capital, and the required extended countercy-clical buffer was insignificant. As of the end of 3Q17, the rebate for resolvability relating to the Group and the Bank’s capital ratios was 0.868%, resulting in a gone concern requirement of 5.332%, and 0.28% relating to the leverage ratios, resulting in a gone concern leverage requirement of 1.72%.
Swiss capital and leverage phase-in requirements for Credit Suisse
Capital ratio (%) Leverage ratio (%)
5.0
4.0
3.0
2.0 1.51.3
1.10.9
3.53.22.92.6
p Bail-in debt instruments p Additional tier 1 p CET1 G
oing
con
cern
14.3
11.6
8.9
6.2
4.33.9
3.43.0
10.09.689.469.0
Goi
ng c
once
rnG
one
conc
ern
Gon
e co
ncer
n

59Treasury, risk, balance sheet and off-balance sheet
Capital management
p Tier 2 capital instruments with a high trigger qualify as going concern capital until the earlier of (i) their maturity date or first call date; and (ii) December 31, 2019. Tier 2 capital instru-ments that no longer qualify as going concern capital pursuant to this provision qualify as gone concern capital until one year before their final maturity; and
p Tier 2 capital instruments with a low trigger also qualify as going concern capital until the earlier of (i) their maturity date or first call date; and (ii) December 31, 2019. Tier 2 capital instruments that no longer qualify as going concern capital pursuant to this provision qualify as gone concern capital until one year before their final maturity.
Furthermore, to be eligible as gone concern capital, outstanding bail-in debt instruments issued before July 1, 2016 and bail-in debt instruments issued by a (Swiss or foreign) special purpose vehicle before January 1, 2017 must have been approved by FINMA.
Both the going concern and the gone concern requirements are subject to a phase-in with gradually increasing requirements and have to be fully applied by January 1, 2020.
Other requirementsEffective July 1, 2016, Switzerland implemented an extended coun-tercyclical buffer, which is based on the BIS countercyclical buffer that could require banks to hold up to 2.5% of RWA in the form of CET1 capital. The extended countercyclical buffer relates to a requirement that can be imposed by national regulators when credit growth is deemed to be excessive and leading to the build-up of system-wide risk.
The Swiss Federal Council has not activated the BIS countercy-clical buffer for Switzerland but instead requires banks to hold CET1 capital in the amount of 2% of their RWA pertaining to mortgage loans that finance residential property in Switzerland (Swiss coun-tercyclical buffer).
In 2013, FINMA introduced increased capital charges for mortgages that finance owner occupied residential property in Switzerland (mortgage multiplier) to be phased in through Janu-ary 1, 2019. The mortgage multiplier applies for purposes of both BIS and FINMA requirements.
In December 2013, FINMA issued a decree (2013 FINMA Decree) specifying capital adequacy requirements for the Bank, on a stand-alone basis (Bank parent company), and the Bank and the Group, each on a consolidated basis, as systemically relevant institutions.u Refer to “Regulatory developments and proposals” below and in III – Treasury, Risk, Balance sheet and Off-balance sheet – Capital management in the Credit Suisse Annual Report 2016 for further information on the FINMA Decree.
Within the Basel framework for FINMA regulatory capital pur-poses, we implemented risk measurement models, including an incremental risk charge, stressed Value-at-Risk (VaR), risks not in VaR and advanced credit valuation adjustment (CVA).
For capital purposes, FINMA, in line with BIS requirements, uses a multiplier to impose an increase in market risk capital for
every regulatory VaR backtesting exception over four in the prior rolling 12-month period. In 3Q17, our market risk capital multiplier remained at FINMA and BIS minimum levels and we did not expe-rience an increase in market risk capital.u Refer to “Market risk review” in Risk management for further information.
REGULATORY DEVELOPMENTS AND PROPOSALSPartial replacement of the 2013 FINMA DecreeIn October 2017, FINMA issued an additional decree with respect to the regulatory capital requirements of the Bank parent company (2017 FINMA Decree), specifying the treatment of investments in subsidiaries for capital adequacy purposes. This decree partially replaces certain aspects of the 2013 FINMA Decree, but all other aspects of that decree remain in force. The 2017 FINMA Decree is effective retroactively as of July 1, 2017. The changes aim to create a capital adequacy framework for the Bank parent com-pany that is more comparable to relevant international frameworks and does not rely on exemptions from, or corrections of, the basic framework applicable to all Swiss banks. The changes only apply to the going concern capital requirements for the Bank parent company, which, as of July 1, 2017, amount to 14.3% of RWA, of which the minimum CET1 component is 10%, with the remainder to be met with a maximum of 4.3% additional tier 1 capital, which includes high-trigger capital instruments. Additional effects from countercyclical buffers impact the CET1 minimum requirement. Under the going concern requirement, the Swiss leverage ratio must be 5%, of which the minimum CET1 component is 3.5%, with the remainder to be met with a maximum of 1.5% additional tier 1 capital, which includes high-trigger capital instruments.
The new rules will require the Bank parent company to risk-weight both direct and indirect investments in subsidiaries, with the initial risk-weight set at 200%. Beginning in 2019, these risk-weights will gradually increase over 10 years to 250% for partici-pations in subsidiaries in Switzerland and to 400% for participa-tions in subsidiaries abroad. This replaces the existing framework that, for systemically relevant banks, provided exemptions to the general rule of capital deduction with respect to investments in subsidiaries to avoid unintended effects from the existing “Too Big to Fail” legislation and capital requirements thereunder. Fur-thermore, the Swiss administration plans to amend the Capital Adequacy Ordinance accordingly so that these new rules will apply to all banks in Switzerland.
The 2017 FINMA Decree also applies an adjustment (referred to as a regulatory filter) to any impact on CET1 capital arising from the upcoming accounting change under applicable Swiss banking rules for the Bank parent company’s investments in subsidiaries from the current portfolio valuation method to the individual valua-tion method by 2020. The regulatory filter allows for the measure-ment of the regulatory capital position as if the Bank parent com-pany had maintained the portfolio valuation method, which results in higher total participation values subject to risk weighting.u Refer to www.credit-suisse.com/regulatorydisclosures for the Bank parent company’s regulatory disclosures.

60 Treasury, risk, balance sheet and off-balance sheet
Capital management
Other developmentsIn October 2017, the BCBS published final guidelines on the iden-tification and management of step-in risk. Step-in risk refers to the risk that a bank decides to provide financial support to an uncon-solidated entity that is facing financial stress in the absence of, or in excess of, any contractual obligations or equity ties to actu-ally provide such support, in particular to avoid reputational risks. The guidelines do not prescribe any automatic liquidity or capital charge, but rather rely on existing prudential measures to mitigate significant step-in risk through identification and management of step-in risks and a supervisory process built on reporting. The BCBS expects the guidelines to be implemented in member juris-dictions by 2020.
In October 2017, FINMA announced its re-assessment of rebates for resolvability relating to the gone concern requirement. The eligibility for the rebates for resolvability is assessed on an annual basis. Effective July 1, 2017, our capital ratio rebate is 0.868% and our leverage ratio rebate is 0.28%.
ISSUANCES AND REDEMPTIONSIssuancesIn July 2017, the Group issued EUR 1.5 billion 1.25% senior notes due 2025.
In September 2017, the Group issued GBP 750 million 2.125% senior notes due 2025, USD 1,000 million 2.997% senior notes due 2023 and USD 500 million floating rate senior notes due 2023.
In October 2017, the Group issued JPY 38.7 billion 0.553% call-able senior notes due 2023, JPY 8.3 billion 0.904% callable senior
notes due 2027 and JPY 10 billion 1.269% callable senior notes due 2033.
All of the above-mentioned issuances count as bail-in instruments.
Higher Trigger Capital AmountThe capital ratio write-down triggers for certain of our outstanding capital instruments take into account the fact that other outstanding capital instruments that contain relatively higher capital ratios as part of their trigger feature are expected to convert into equity or be written down prior to the write-down of such capital instruments. The amount of additional capital that is expected to be contributed by such con-version into equity or write-down is referred to as the Higher Trigger Capital Amount.
With respect to the capital instruments that specify a trigger event if the CET1 ratio were to fall below 5.125%, the Higher Trigger Capital Amount was CHF 7.5 billion and the Higher Trigger Capital Ratio (i.e., the ratio of the Higher Trigger Capital Amount to the aggregate of all RWA of the Group) was 2.8%, both as of the end of 3Q17.
With respect to the capital instruments that specify a trigger event if the CET1 ratio were to fall below 5%, the Higher Trigger Capital Amount was CHF 12.4 billion and the Higher Trigger Capi-tal Ratio was 4.6%, both as of the end of 3Q17.u Refer to the table “BIS capital metrics – Group” for further information on the BIS metrics used to calculate such measures.
u Refer to “Higher Trigger Capital Amount” in III – Treasury, Risk, Balance sheet and Off-balance sheet – Capital management – Issuances and redemptions in the Credit Suisse Annual Report 2016 for further information on the Higher Trig-ger Capital Amount.
BIS capital metrics – Group Phase-in Look-through
% change % change
end of 3Q17 2Q17 4Q16 QoQ 3Q17 2Q17 4Q16 QoQ
Capital and risk-weighted assets (CHF million)
CET1 capital 37,331 37,011 36,576 1 34,860 34,467 30,783 1
Tier 1 capital 51,848 51,260 48,865 1 47,210 46,687 41,879 1
Total eligible capital 57,208 56,526 55,728 1 51,322 50,721 46,758 1
Risk-weighted assets 266,588 260,918 271,372 2 265,012 259,337 268,045 2
Capital ratios (%)
CET1 ratio 14.0 14.2 13.5 – 13.2 13.3 11.5 –
Tier 1 ratio 19.4 19.6 18.0 – 17.8 18.0 15.6 –
Total capital ratio 21.5 21.7 20.5 – 19.4 19.6 17.4 –
BIS CAPITAL METRICSOur CET1 ratio was 14.0% as of the end of 3Q17 compared to 14.2% as of the end of 2Q17, reflecting a slight increase in CET1 capital and higher RWA. Our tier 1 ratio was 19.4% as of the end of 3Q17 compared to 19.6% as of the end of 2Q17. Our total capi-tal ratio was 21.5% as of the end of 3Q17 compared to 21.7% as of the end of 2Q17.
CET1 capital was CHF 37.3 billion as of the end of 3Q17, a slight increase compared to CHF 37.0 billion as of the end of 2Q17, mainly reflecting a positive foreign exchange impact and net income attributable to shareholders, partially offset by the impact
of a dividend accrual and the net regulatory impact of losses on fair-valued financial liabilities due to changes in own credit risk.
Additional tier 1 capital increased to CHF 14.5 billion as of the end of 3Q17 compared to CHF 14.2 billion as of the end of 2Q17, mainly reflecting a positive foreign exchange impact and the impact of the prescribed amortization of issuance fees as instruments move closer to their maturity date.
Tier 2 capital increased slightly to CHF 5.4 billion as of the end of 3Q17 compared to CHF 5.3 billion as of the end of 2Q17, mainly reflecting a positive foreign exchange impact.
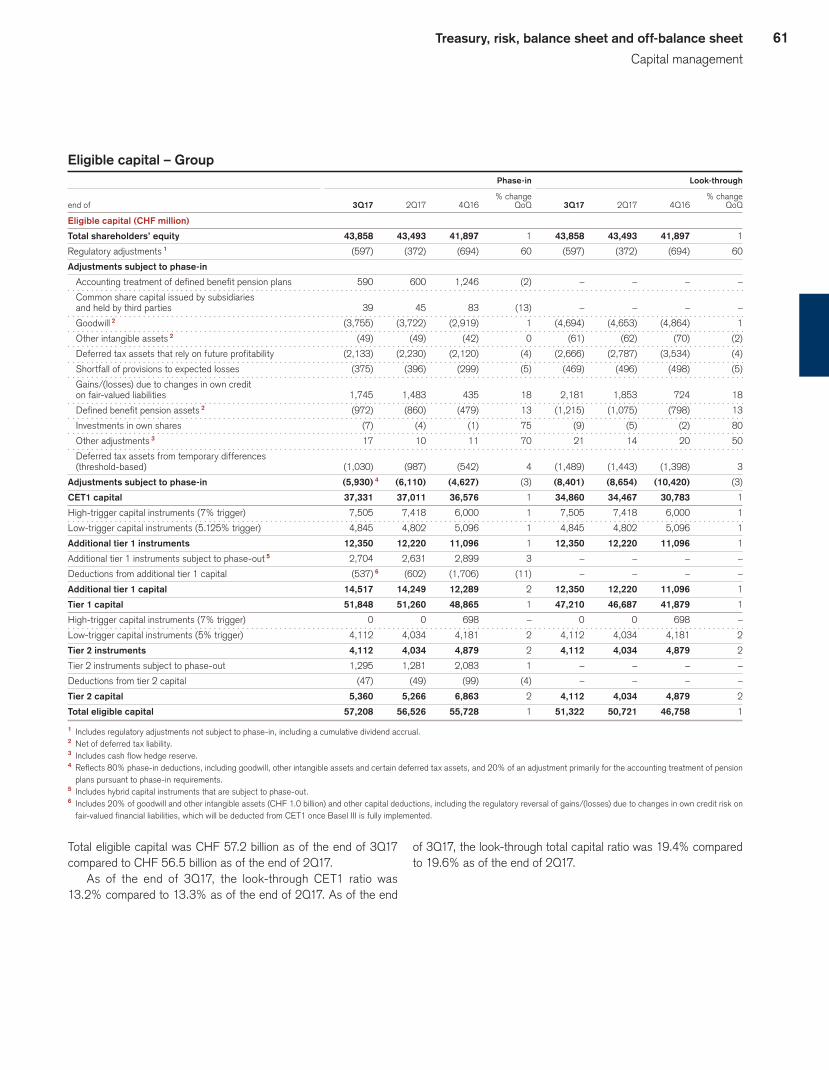
61Treasury, risk, balance sheet and off-balance sheet
Capital management
Eligible capital – Group Phase-in Look-through
% change % change
end of 3Q17 2Q17 4Q16 QoQ 3Q17 2Q17 4Q16 QoQ
Eligible capital (CHF million)
Total shareholders’ equity 43,858 43,493 41,897 1 43,858 43,493 41,897 1
Regulatory adjustments 1 (597) (372) (694) 60 (597) (372) (694) 60
Adjustments subject to phase-in
Accounting treatment of defined benefit pension plans 590 600 1,246 (2) – – – –
Common share capital issued by subsidiaries
and held by third parties 39 45 83 (13) – – – –
Goodwill 2 (3,755) (3,722) (2,919) 1 (4,694) (4,653) (4,864) 1
Other intangible assets 2 (49) (49) (42) 0 (61) (62) (70) (2)
Deferred tax assets that rely on future profitability (2,133) (2,230) (2,120) (4) (2,666) (2,787) (3,534) (4)
Shortfall of provisions to expected losses (375) (396) (299) (5) (469) (496) (498) (5)
Gains/(losses) due to changes in own credit
on fair-valued liabilities 1,745 1,483 435 18 2,181 1,853 724 18
Defined benefit pension assets 2 (972) (860) (479) 13 (1,215) (1,075) (798) 13
Investments in own shares (7) (4) (1) 75 (9) (5) (2) 80
Other adjustments 3 17 10 11 70 21 14 20 50
Deferred tax assets from temporary differences
(threshold-based) (1,030) (987) (542) 4 (1,489) (1,443) (1,398) 3
Adjustments subject to phase-in (5,930) 4 (6,110) (4,627) (3) (8,401) (8,654) (10,420) (3)
CET1 capital 37,331 37,011 36,576 1 34,860 34,467 30,783 1
High-trigger capital instruments (7% trigger) 7,505 7,418 6,000 1 7,505 7,418 6,000 1
Low-trigger capital instruments (5.125% trigger) 4,845 4,802 5,096 1 4,845 4,802 5,096 1
Additional tier 1 instruments 12,350 12,220 11,096 1 12,350 12,220 11,096 1
Additional tier 1 instruments subject to phase-out 5 2,704 2,631 2,899 3 – – – –
Deductions from additional tier 1 capital (537) 6 (602) (1,706) (11) – – – –
Additional tier 1 capital 14,517 14,249 12,289 2 12,350 12,220 11,096 1
Tier 1 capital 51,848 51,260 48,865 1 47,210 46,687 41,879 1
High-trigger capital instruments (7% trigger) 0 0 698 – 0 0 698 –
Low-trigger capital instruments (5% trigger) 4,112 4,034 4,181 2 4,112 4,034 4,181 2
Tier 2 instruments 4,112 4,034 4,879 2 4,112 4,034 4,879 2
Tier 2 instruments subject to phase-out 1,295 1,281 2,083 1 – – – –
Deductions from tier 2 capital (47) (49) (99) (4) – – – –
Tier 2 capital 5,360 5,266 6,863 2 4,112 4,034 4,879 2
Total eligible capital 57,208 56,526 55,728 1 51,322 50,721 46,758 1
1 Includes regulatory adjustments not subject to phase-in, including a cumulative dividend accrual.2 Net of deferred tax liability.3 Includes cash flow hedge reserve.4 Reflects 80% phase-in deductions, including goodwill, other intangible assets and certain deferred tax assets, and 20% of an adjustment primarily for the accounting treatment of pension
plans pursuant to phase-in requirements.5 Includes hybrid capital instruments that are subject to phase-out.6 Includes 20% of goodwill and other intangible assets (CHF 1.0 billion) and other capital deductions, including the regulatory reversal of gains/(losses) due to changes in own credit risk on
fair-valued financial liabilities, which will be deducted from CET1 once Basel III is fully implemented.
Total eligible capital was CHF 57.2 billion as of the end of 3Q17 compared to CHF 56.5 billion as of the end of 2Q17.
As of the end of 3Q17, the look-through CET1 ratio was 13.2% compared to 13.3% as of the end of 2Q17. As of the end
of 3Q17, the look-through total capital ratio was 19.4% compared to 19.6% as of the end of 2Q17.
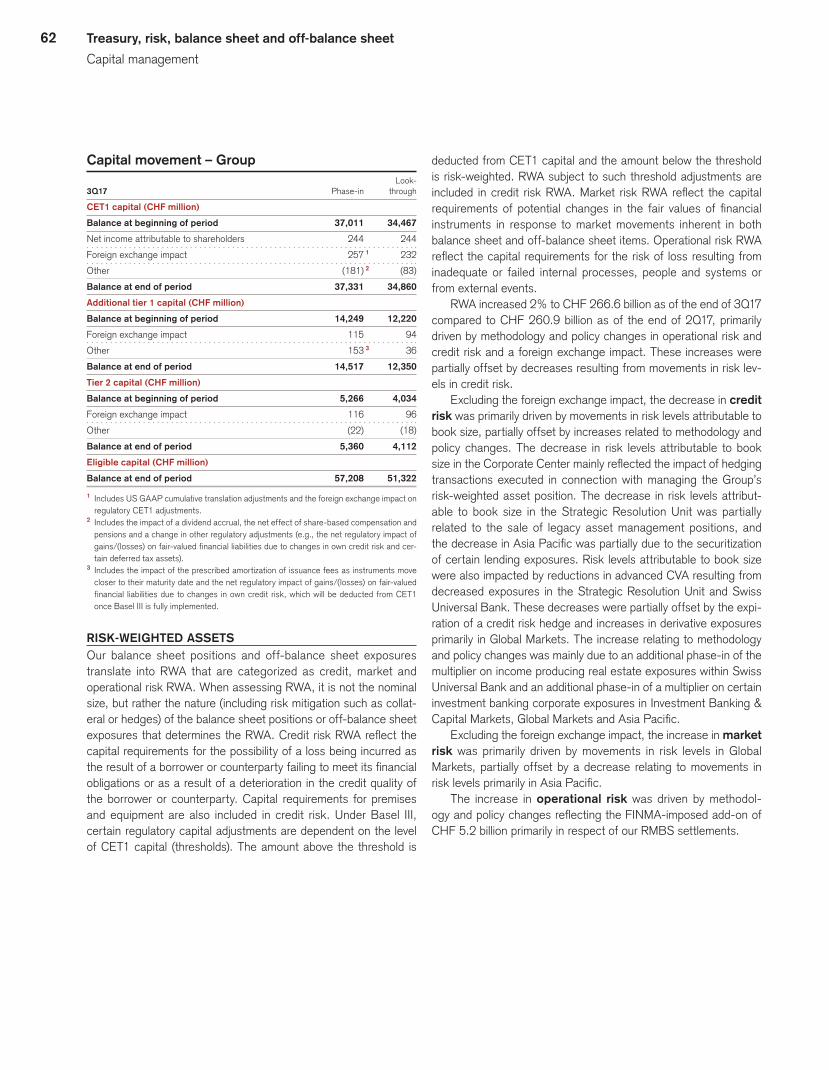
62 Treasury, risk, balance sheet and off-balance sheet
Capital management
Capital movement – Group Look-
3Q17 Phase-in through
CET1 capital (CHF million)
Balance at beginning of period 37,011 34,467
Net income attributable to shareholders 244 244
Foreign exchange impact 257 1 232
Other (181) 2 (83)
Balance at end of period 37,331 34,860
Additional tier 1 capital (CHF million)
Balance at beginning of period 14,249 12,220
Foreign exchange impact 115 94
Other 153 3 36
Balance at end of period 14,517 12,350
Tier 2 capital (CHF million)
Balance at beginning of period 5,266 4,034
Foreign exchange impact 116 96
Other (22) (18)
Balance at end of period 5,360 4,112
Eligible capital (CHF million)
Balance at end of period 57,208 51,322
1 Includes US GAAP cumulative translation adjustments and the foreign exchange impact on regulatory CET1 adjustments.
2 Includes the impact of a dividend accrual, the net effect of share-based compensation and pensions and a change in other regulatory adjustments (e.g., the net regulatory impact of gains/(losses) on fair-valued financial liabilities due to changes in own credit risk and cer-tain deferred tax assets).
3 Includes the impact of the prescribed amortization of issuance fees as instruments move closer to their maturity date and the net regulatory impact of gains/(losses) on fair-valued financial liabilities due to changes in own credit risk, which will be deducted from CET1 once Basel III is fully implemented.
RISK-WEIGHTED ASSETSOur balance sheet positions and off-balance sheet exposures translate into RWA that are categorized as credit, market and operational risk RWA. When assessing RWA, it is not the nominal size, but rather the nature (including risk mitigation such as collat-eral or hedges) of the balance sheet positions or off-balance sheet exposures that determines the RWA. Credit risk RWA reflect the capital requirements for the possibility of a loss being incurred as the result of a borrower or counterparty failing to meet its financial obligations or as a result of a deterioration in the credit quality of the borrower or counterparty. Capital requirements for premises and equipment are also included in credit risk. Under Basel III, certain regulatory capital adjustments are dependent on the level of CET1 capital (thresholds). The amount above the threshold is
deducted from CET1 capital and the amount below the threshold is risk-weighted. RWA subject to such threshold adjustments are included in credit risk RWA. Market risk RWA reflect the capital requirements of potential changes in the fair values of financial instruments in response to market movements inherent in both balance sheet and off-balance sheet items. Operational risk RWA reflect the capital requirements for the risk of loss resulting from inadequate or failed internal processes, people and systems or from external events.
RWA increased 2% to CHF 266.6 billion as of the end of 3Q17 compared to CHF 260.9 billion as of the end of 2Q17, primarily driven by methodology and policy changes in operational risk and credit risk and a foreign exchange impact. These increases were partially offset by decreases resulting from movements in risk lev-els in credit risk.
Excluding the foreign exchange impact, the decrease in credit risk was primarily driven by movements in risk levels attributable to book size, partially offset by increases related to methodology and policy changes. The decrease in risk levels attributable to book size in the Corporate Center mainly reflected the impact of hedging transactions executed in connection with managing the Group’s risk-weighted asset position. The decrease in risk levels attribut-able to book size in the Strategic Resolution Unit was partially related to the sale of legacy asset management positions, and the decrease in Asia Pacific was partially due to the securitization of certain lending exposures. Risk levels attributable to book size were also impacted by reductions in advanced CVA resulting from decreased exposures in the Strategic Resolution Unit and Swiss Universal Bank. These decreases were partially offset by the expi-ration of a credit risk hedge and increases in derivative exposures primarily in Global Markets. The increase relating to methodology and policy changes was mainly due to an additional phase-in of the multiplier on income producing real estate exposures within Swiss Universal Bank and an additional phase-in of a multiplier on certain investment banking corporate exposures in Investment Banking & Capital Markets, Global Markets and Asia Pacific.
Excluding the foreign exchange impact, the increase in market risk was primarily driven by movements in risk levels in Global Markets, partially offset by a decrease relating to movements in risk levels primarily in Asia Pacific.
The increase in operational risk was driven by methodol-ogy and policy changes reflecting the FINMA-imposed add-on of CHF 5.2 billion primarily in respect of our RMBS settlements.

63Treasury, risk, balance sheet and off-balance sheet
Capital management
Risk-weighted asset movement by risk type – Group Investment Swiss International Banking & Strategic Universal Wealth Asia Global Capital Resolution Corporate
3Q17 (CHF million) Bank Management Pacific Markets Markets Unit Center Total
Credit risk
Balance at beginning of period 51,497 22,907 20,464 30,131 15,985 16,523 19,379 176,886
Foreign exchange impact 241 400 263 445 339 223 168 2,079
Movements in risk levels (457) 313 (786) 2,425 239 (2,639) (2,935) (3,840)
of which credit risk – book size 1 (610) 457 (902) 2,612 575 (2,882) (2,908) (3,658)
of which credit risk – book quality 2 153 (144) 116 (187) (336) 243 (27) (182)
Model and parameter updates 3 40 (217) (7) 88 55 48 26 33
Methodology and policy changes 4 464 (37) 97 383 222 46 2 1,177
Balance at end of period – phase-in 51,785 23,366 20,031 33,472 16,840 14,201 16,640 176,335
Market risk
Balance at beginning of period 861 1,085 5,993 7,881 88 1,918 223 18,049
Foreign exchange impact 19 26 139 161 2 44 5 396
Movements in risk levels (205) 109 (843) 1,408 (20) 0 258 707
Model and parameter updates 3 0 117 81 (268) 1 19 (22) (72)
Balance at end of period – phase-in 675 1,337 5,370 9,182 71 1,981 464 19,080
Operational risk
Balance at beginning of period 12,068 12,523 5,836 13,321 2,575 19,660 0 65,983
Movements in risk levels (9) (9) 0 18 0 0 0 0
Methodology and policy changes 4 0 0 0 0 0 0 5,190 5,190
Balance at end of period – phase-in 12,059 12,514 5,836 13,339 2,575 19,660 5,190 71,173
Total
Balance at beginning of period 64,426 36,515 32,293 51,333 18,648 38,101 19,602 260,918
Foreign exchange impact 260 426 402 606 341 267 173 2,475
Movements in risk levels (671) 413 (1,629) 3,851 219 (2,639) (2,677) (3,133)
Model and parameter updates 3 40 (100) 74 (180) 56 67 4 (39)
Methodology and policy changes 4 464 (37) 97 383 222 46 5,192 6,367
Balance at end of period – phase-in 64,519 37,217 31,237 55,993 19,486 35,842 22,294 266,588
Look-through adjustment 5 – – – – – – (1,576) (1,576)
Balance at end of period – look-through 64,519 37,217 31,237 55,993 19,486 35,842 20,718 265,012
1 Represents changes in portfolio size.2 Represents changes in average risk weighting across credit risk classes.3 Represents movements arising from updates to models and recalibrations of parameters and internal changes impacting how exposures are treated.4 Represents externally prescribed regulatory changes impacting how exposures are treated.5 The look-through adjustment impacts only credit risk within the Corporate Center. The difference between phase-in and look-through risk-weighted assets relates to transitional arrange-
ments such as the impact from pension assets and deferred tax assets not deducted from CET1 during the phase-in period and the transitional impact from threshold-related risk-weighted assets.
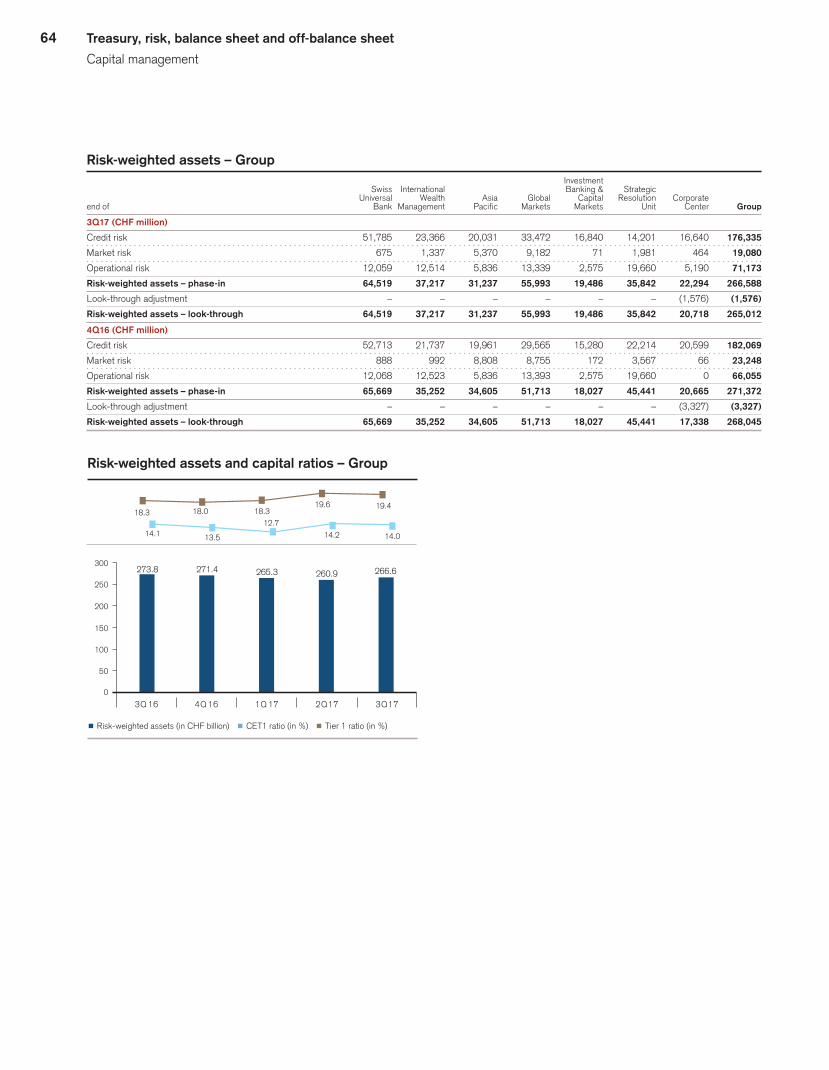
64 Treasury, risk, balance sheet and off-balance sheet
Capital management
3Q 16 4Q 16 1Q 17 2Q17 3Q17
300
250
100
150
200
50
0
273.8 271.4 265.3 260.9 266.6
18.3 18.0
14.1 13.5
12.718.3
14.2 14.0
19.6 19.4
Risk-weighted assets and capital ratios – Group
p Risk-weighted assets (in CHF billion) p CET1 ratio (in %) p Tier 1 ratio (in %)
Risk-weighted assets – Group Investment Swiss International Banking & Strategic Universal Wealth Asia Global Capital Resolution Corporate
end of Bank Management Pacific Markets Markets Unit Center Group
3Q17 (CHF million)
Credit risk 51,785 23,366 20,031 33,472 16,840 14,201 16,640 176,335
Market risk 675 1,337 5,370 9,182 71 1,981 464 19,080
Operational risk 12,059 12,514 5,836 13,339 2,575 19,660 5,190 71,173
Risk-weighted assets – phase-in 64,519 37,217 31,237 55,993 19,486 35,842 22,294 266,588
Look-through adjustment – – – – – – (1,576) (1,576)
Risk-weighted assets – look-through 64,519 37,217 31,237 55,993 19,486 35,842 20,718 265,012
4Q16 (CHF million)
Credit risk 52,713 21,737 19,961 29,565 15,280 22,214 20,599 182,069
Market risk 888 992 8,808 8,755 172 3,567 66 23,248
Operational risk 12,068 12,523 5,836 13,393 2,575 19,660 0 66,055
Risk-weighted assets – phase-in 65,669 35,252 34,605 51,713 18,027 45,441 20,665 271,372
Look-through adjustment – – – – – – (3,327) (3,327)
Risk-weighted assets – look-through 65,669 35,252 34,605 51,713 18,027 45,441 17,338 268,045
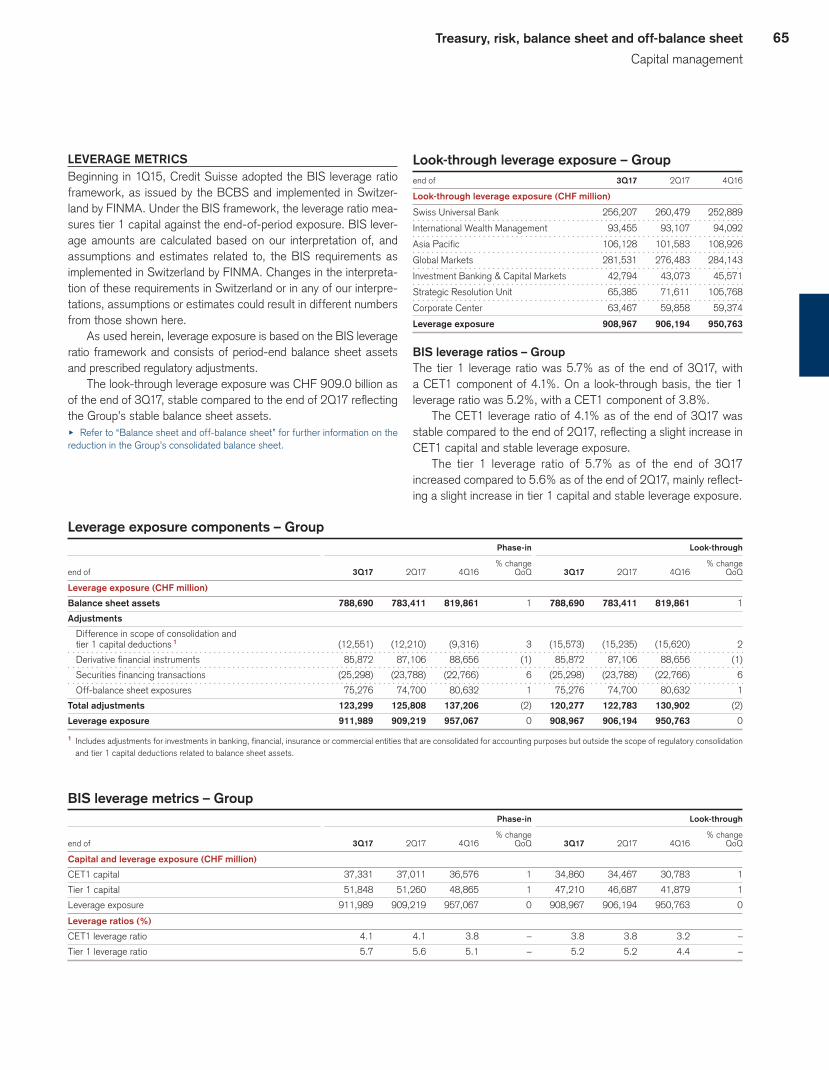
65Treasury, risk, balance sheet and off-balance sheet
Capital management
LEVERAGE METRICSBeginning in 1Q15, Credit Suisse adopted the BIS leverage ratio framework, as issued by the BCBS and implemented in Switzer-land by FINMA. Under the BIS framework, the leverage ratio mea-sures tier 1 capital against the end-of-period exposure. BIS lever-age amounts are calculated based on our interpretation of, and assumptions and estimates related to, the BIS requirements as implemented in Switzerland by FINMA. Changes in the interpreta-tion of these requirements in Switzerland or in any of our interpre-tations, assumptions or estimates could result in different numbers from those shown here.
As used herein, leverage exposure is based on the BIS leverage ratio framework and consists of period-end balance sheet assets and prescribed regulatory adjustments.
The look-through leverage exposure was CHF 909.0 billion as of the end of 3Q17, stable compared to the end of 2Q17 reflecting the Group’s stable balance sheet assets.u Refer to “Balance sheet and off-balance sheet” for further information on the reduction in the Group’s consolidated balance sheet.
Look-through leverage exposure – Groupend of 3Q17 2Q17 4Q16
Look-through leverage exposure (CHF million)
Swiss Universal Bank 256,207 260,479 252,889
International Wealth Management 93,455 93,107 94,092
Asia Pacific 106,128 101,583 108,926
Global Markets 281,531 276,483 284,143
Investment Banking & Capital Markets 42,794 43,073 45,571
Strategic Resolution Unit 65,385 71,611 105,768
Corporate Center 63,467 59,858 59,374
Leverage exposure 908,967 906,194 950,763
BIS leverage ratios – GroupThe tier 1 leverage ratio was 5.7% as of the end of 3Q17, with a CET1 component of 4.1%. On a look-through basis, the tier 1 leverage ratio was 5.2%, with a CET1 component of 3.8%.
The CET1 leverage ratio of 4.1% as of the end of 3Q17 was stable compared to the end of 2Q17, reflecting a slight increase in CET1 capital and stable leverage exposure.
The tier 1 leverage ratio of 5.7% as of the end of 3Q17 increased compared to 5.6% as of the end of 2Q17, mainly reflect-ing a slight increase in tier 1 capital and stable leverage exposure.
Leverage exposure components – Group Phase-in Look-through
% change % change
end of 3Q17 2Q17 4Q16 QoQ 3Q17 2Q17 4Q16 QoQ
Leverage exposure (CHF million)
Balance sheet assets 788,690 783,411 819,861 1 788,690 783,411 819,861 1
Adjustments
Difference in scope of consolidation and
tier 1 capital deductions 1 (12,551) (12,210) (9,316) 3 (15,573) (15,235) (15,620) 2
Derivative financial instruments 85,872 87,106 88,656 (1) 85,872 87,106 88,656 (1)
Securities financing transactions (25,298) (23,788) (22,766) 6 (25,298) (23,788) (22,766) 6
Off-balance sheet exposures 75,276 74,700 80,632 1 75,276 74,700 80,632 1
Total adjustments 123,299 125,808 137,206 (2) 120,277 122,783 130,902 (2)
Leverage exposure 911,989 909,219 957,067 0 908,967 906,194 950,763 0
1 Includes adjustments for investments in banking, financial, insurance or commercial entities that are consolidated for accounting purposes but outside the scope of regulatory consolidation and tier 1 capital deductions related to balance sheet assets.
BIS leverage metrics – Group Phase-in Look-through
% change % change
end of 3Q17 2Q17 4Q16 QoQ 3Q17 2Q17 4Q16 QoQ
Capital and leverage exposure (CHF million)
CET1 capital 37,331 37,011 36,576 1 34,860 34,467 30,783 1
Tier 1 capital 51,848 51,260 48,865 1 47,210 46,687 41,879 1
Leverage exposure 911,989 909,219 957,067 0 908,967 906,194 950,763 0
Leverage ratios (%)
CET1 leverage ratio 4.1 4.1 3.8 – 3.8 3.8 3.2 –
Tier 1 leverage ratio 5.7 5.6 5.1 – 5.2 5.2 4.4 –

66 Treasury, risk, balance sheet and off-balance sheet
Capital management
Swiss capital and leverage ratios for Credit Suisse
Look-through end of 3Q17
Look-through end of 3Q17
Requirement 2020
Requirement 2020
p CET1 p Additional tier 1 p Bail-in debt instruments
Rounding differences may occur. Does not include the effects of the countercyclical buffers and any rebates for resolvability and for certain tier 2 low-trigger instruments recognized in gone concern capital.
Goi
ng c
once
rnG
one
conc
ern
3.5%3.8%
5%3.7%
1.5%1.4%
10%8.9%
Goi
ng c
once
rnG
one
conc
ern
10%
13.1%
12.6%
4.3%
4.6%
28.6%30.3%
Capital ratio Leverage ratio
14.3%
SWISS CAPITAL AND LEVERAGE METRICSSwiss capital metricsu Refer to “Swiss Requirements” for further information on Swiss regulatory requirements.
As of the end of 3Q17, our Swiss CET1 ratio was 13.9%, our going concern capital ratio was 20.1%, our gone concern capital ratio was 12.7% and our TLAC ratio was 32.8%.
On a look-through basis, as of the end of 3Q17, our Swiss CET1 capital was CHF 34.7 billion and our Swiss CET1 ratio was 13.1%. Our going concern capital was CHF 47.1 billion and our going concern capital ratio was 17.7%. Our gone concern capi-tal was CHF 33.5 billion and our gone concern capital ratio was 12.6%. Our total loss-absorbing capacity was CHF 80.6 billion and our TLAC ratio was 30.3%.
Swiss capital metrics – Group Phase-in Look-through
% change % change
end of 3Q17 2Q17 4Q16 QoQ 3Q17 2Q17 4Q16 QoQ
Swiss capital and risk-weighted assets (CHF million)
Swiss CET1 capital 37,178 36,865 36,417 1 34,705 34,319 30,616 1
Going concern capital 53,640 53,118 52,392 1 47,055 46,538 42,410 1
Gone concern capital 34,040 29,487 26,783 15 33,535 29,065 26,340 15
Total loss-absorbing capacity (TLAC) 87,680 82,605 79,175 6 80,590 75,603 68,750 7
Swiss risk-weighted assets 267,184 261,580 272,090 2 265,607 259,999 268,762 2
Swiss capital ratios (%)
Swiss CET1 ratio 13.9 14.1 13.4 – 13.1 13.2 11.4 –
Going concern capital ratio 20.1 20.3 19.3 – 17.7 17.9 15.8 –
Gone concern capital ratio 12.7 11.3 9.8 – 12.6 11.2 9.8 –
TLAC ratio 32.8 31.6 29.1 – 30.3 29.1 25.6 –

67Treasury, risk, balance sheet and off-balance sheet
Capital management
Swiss capital and risk-weighted assets – Group Phase-in Look-through
% change % change
end of 3Q17 2Q17 4Q16 QoQ 3Q17 2Q17 4Q16 QoQ
Swiss capital (CHF million)
CET1 capital – BIS 37,331 37,011 36,576 1 34,860 34,467 30,783 1
Swiss regulatory adjustments 1 (153) (146) (159) 5 (155) (148) (167) 5
Swiss CET1 capital 37,178 36,865 36,417 1 34,705 34,319 30,616 1
Additional tier 1 high-trigger capital instruments 7,505 7,417 6,000 1 7,505 7,417 6,000 1
Grandfathered capital instruments 8,957 8,836 9,975 1 4,845 4,802 5,794 1
of which additional tier 1 low-trigger capital instruments 4,845 4,802 5,096 1 4,845 4,802 5,096 1
of which tier 2 high-trigger capital instruments 0 0 698 – 0 0 698 –
of which tier 2 low-trigger capital instruments 4,112 4,034 4,181 2 – – – –
Swiss additional tier 1 capital 16,462 16,253 15,975 1 12,350 12,219 11,794 1
Going concern capital 53,640 53,118 52,392 1 47,055 46,538 42,410 1
Bail-in debt instruments 29,423 25,030 22,159 18 29,423 25,030 22,159 18
Additional tier 1 instruments subject to phase-out 2,704 2,631 2,899 3 – – – –
Tier 2 instruments subject to phase-out 1,295 1,281 2,083 1 – – – –
Tier 2 amortization component 1,202 1,194 1,448 1 – – – –
Tier 2 low-trigger capital instruments – – – – 4,112 4,035 4,181 2
Deductions (584) (649) (1,806) (10) – – – –
Gone concern capital 34,040 29,487 26,783 15 33,535 29,065 26,340 15
Total loss-absorbing capacity 87,680 82,605 79,175 6 80,590 75,603 68,750 7
Risk-weighted assets (CHF million)
Risk-weighted assets – BIS 266,588 260,918 271,372 2 265,012 259,337 268,045 2
Swiss regulatory adjustments 2 596 662 718 (10) 595 662 717 (10)
Swiss risk-weighted assets 267,184 261,580 272,090 2 265,607 259,999 268,762 2
1 Includes adjustments for certain unrealized gains outside the trading book.2 Primarily includes differences in the credit risk multiplier.
Swiss leverage metrics – Group Phase-in Look-through
% change % change
end of 3Q17 2Q17 4Q16 QoQ 3Q17 2Q17 4Q16 QoQ
Swiss capital and leverage exposure (CHF million)
Swiss CET1 capital 37,178 36,865 36,417 1 34,705 34,319 30,616 1
Going concern capital 53,640 53,118 52,392 1 47,055 46,538 42,410 1
Gone concern capital 34,040 29,487 26,783 15 33,535 29,065 26,340 15
Total loss-absorbing capacity 87,680 82,605 79,175 6 80,590 75,603 68,750 7
Leverage exposure 911,989 909,219 957,067 0 908,967 906,194 950,763 0
Swiss leverage ratios (%)
Swiss CET1 leverage ratio 4.1 4.1 3.8 – 3.8 3.8 3.2 –
Going concern leverage ratio 5.9 5.8 5.5 – 5.2 5.1 4.5 –
Gone concern leverage ratio 3.7 3.2 2.8 – 3.7 3.2 2.8 –
TLAC leverage ratio 9.6 9.1 8.3 – 8.9 8.3 7.2 –
Rounding differences may occur.
Swiss leverage metricsThe leverage exposure used in the Swiss leverage ratio is mea-sured on the same period-end basis as the leverage exposure for the BIS leverage ratio.
As of the end of 3Q17, our Swiss CET1 leverage ratio was 4.1%, our going concern leverage ratio was 5.9%, our gone
concern leverage ratio was 3.7% and our TLAC leverage ratio was 9.6%.
On a look-through basis, as of the end of 3Q17, our Swiss CET1 leverage ratio was 3.8%, our going concern leverage ratio was 5.2%, our gone concern leverage ratio was 3.7% and our TLAC leverage ratio was 8.9%.
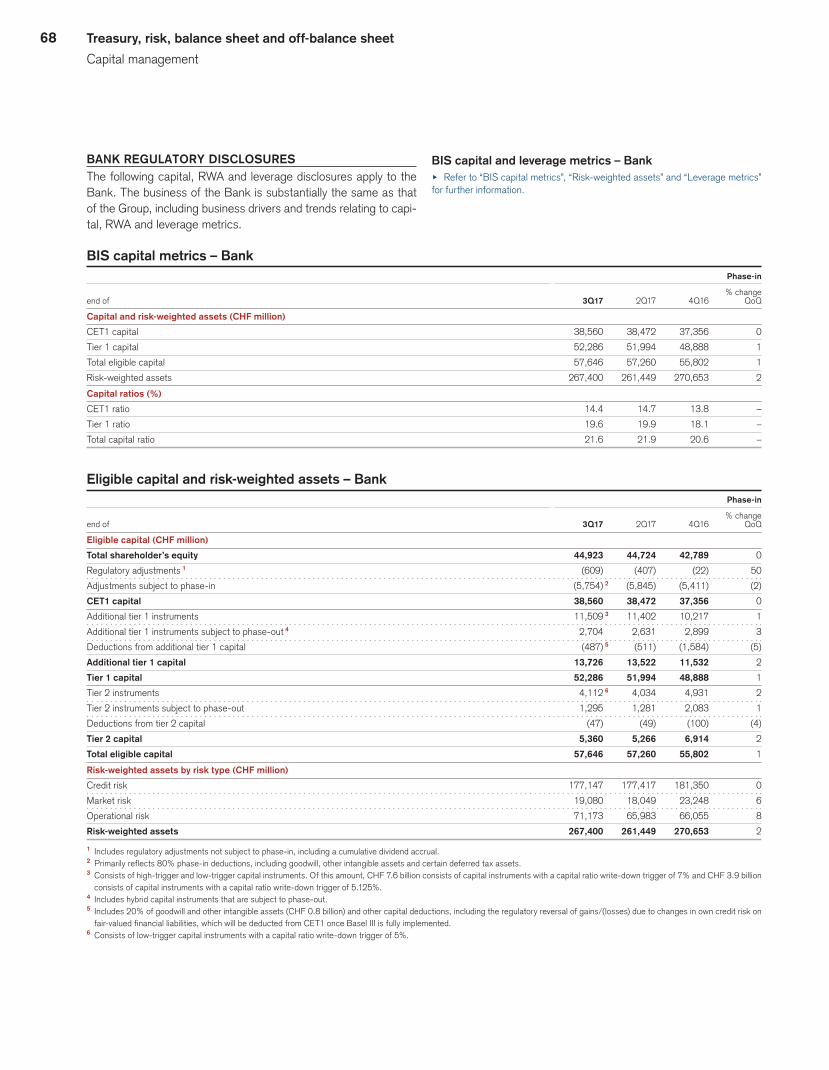
68 Treasury, risk, balance sheet and off-balance sheet
Capital management
BANK REGULATORY DISCLOSURESThe following capital, RWA and leverage disclosures apply to the Bank. The business of the Bank is substantially the same as that of the Group, including business drivers and trends relating to capi-tal, RWA and leverage metrics.
BIS capital and leverage metrics – Banku Refer to “BIS capital metrics”, “Risk-weighted assets” and “Leverage metrics” for further information.
BIS capital metrics – Bank Phase-in
% change
end of 3Q17 2Q17 4Q16 QoQ
Capital and risk-weighted assets (CHF million)
CET1 capital 38,560 38,472 37,356 0
Tier 1 capital 52,286 51,994 48,888 1
Total eligible capital 57,646 57,260 55,802 1
Risk-weighted assets 267,400 261,449 270,653 2
Capital ratios (%)
CET1 ratio 14.4 14.7 13.8 –
Tier 1 ratio 19.6 19.9 18.1 –
Total capital ratio 21.6 21.9 20.6 –
Eligible capital and risk-weighted assets – Bank Phase-in
% change
end of 3Q17 2Q17 4Q16 QoQ
Eligible capital (CHF million)
Total shareholder’s equity 44,923 44,724 42,789 0
Regulatory adjustments 1 (609) (407) (22) 50
Adjustments subject to phase-in (5,754) 2 (5,845) (5,411) (2)
CET1 capital 38,560 38,472 37,356 0
Additional tier 1 instruments 11,509 3 11,402 10,217 1
Additional tier 1 instruments subject to phase-out 4 2,704 2,631 2,899 3
Deductions from additional tier 1 capital (487) 5 (511) (1,584) (5)
Additional tier 1 capital 13,726 13,522 11,532 2
Tier 1 capital 52,286 51,994 48,888 1
Tier 2 instruments 4,112 6 4,034 4,931 2
Tier 2 instruments subject to phase-out 1,295 1,281 2,083 1
Deductions from tier 2 capital (47) (49) (100) (4)
Tier 2 capital 5,360 5,266 6,914 2
Total eligible capital 57,646 57,260 55,802 1
Risk-weighted assets by risk type (CHF million)
Credit risk 177,147 177,417 181,350 0
Market risk 19,080 18,049 23,248 6
Operational risk 71,173 65,983 66,055 8
Risk-weighted assets 267,400 261,449 270,653 2
1 Includes regulatory adjustments not subject to phase-in, including a cumulative dividend accrual.2 Primarily reflects 80% phase-in deductions, including goodwill, other intangible assets and certain deferred tax assets.3 Consists of high-trigger and low-trigger capital instruments. Of this amount, CHF 7.6 billion consists of capital instruments with a capital ratio write-down trigger of 7% and CHF 3.9 billion
consists of capital instruments with a capital ratio write-down trigger of 5.125%.4 Includes hybrid capital instruments that are subject to phase-out.5 Includes 20% of goodwill and other intangible assets (CHF 0.8 billion) and other capital deductions, including the regulatory reversal of gains/(losses) due to changes in own credit risk on
fair-valued financial liabilities, which will be deducted from CET1 once Basel III is fully implemented.6 Consists of low-trigger capital instruments with a capital ratio write-down trigger of 5%.

69Treasury, risk, balance sheet and off-balance sheet
Capital management
Leverage exposure components – Bank Phase-in
% change
end of 3Q17 2Q17 4Q16 QoQ
Leverage exposure (CHF million)
Balance sheet assets 791,146 785,494 822,065 1
Adjustments
Difference in scope of consolidation and tier 1 capital deductions 1 (12,535) (12,103) (10,639) 4
Derivative financial instruments 86,050 87,176 88,975 (1)
Securities financing transactions (25,298) (23,787) (22,766) 6
Off-balance sheet exposures 75,276 74,700 80,661 1
Total adjustments 123,493 125,986 136,231 (2)
Leverage exposure 914,639 911,480 958,296 0
1 Includes adjustments for investments in banking, financial, insurance or commercial entities that are consolidated for accounting purposes but outside the scope of regulatory consolidation and tier 1 capital deductions related to balance sheet assets.
BIS leverage metrics – Bank Phase-in
% change
end of 3Q17 2Q17 4Q16 QoQ
Capital and leverage exposure (CHF million)
CET1 capital 38,560 38,472 37,356 0
Tier 1 capital 52,286 51,994 48,888 1
Leverage exposure 914,639 911,480 958,296 0
Leverage ratios (%)
CET1 leverage ratio 4.2 4.2 3.9 –
Tier 1 leverage ratio 5.7 5.7 5.1 –
Swiss capital and leverage metrics – Banku Refer to “Swiss capital and leverage metrics” for further information.
Swiss capital metrics – Bank Phase-in
% change
end of 3Q17 2Q17 4Q16 QoQ
Swiss capital and risk-weighted assets (CHF million)
Swiss CET1 capital 38,407 38,326 37,196 0
Going concern capital 54,028 53,762 52,344 0
Gone concern capital 34,152 29,580 26,904 15
Total loss-absorbing capacity 88,180 83,342 79,248 6
Swiss risk-weighted assets 267,986 262,101 271,359 2
Swiss capital ratios (%)
Swiss CET1 ratio 14.3 14.6 13.7 –
Going concern capital ratio 20.2 20.5 19.3 –
Gone concern capital ratio 12.7 11.3 9.9 –
TLAC ratio 32.9 31.8 29.2 –
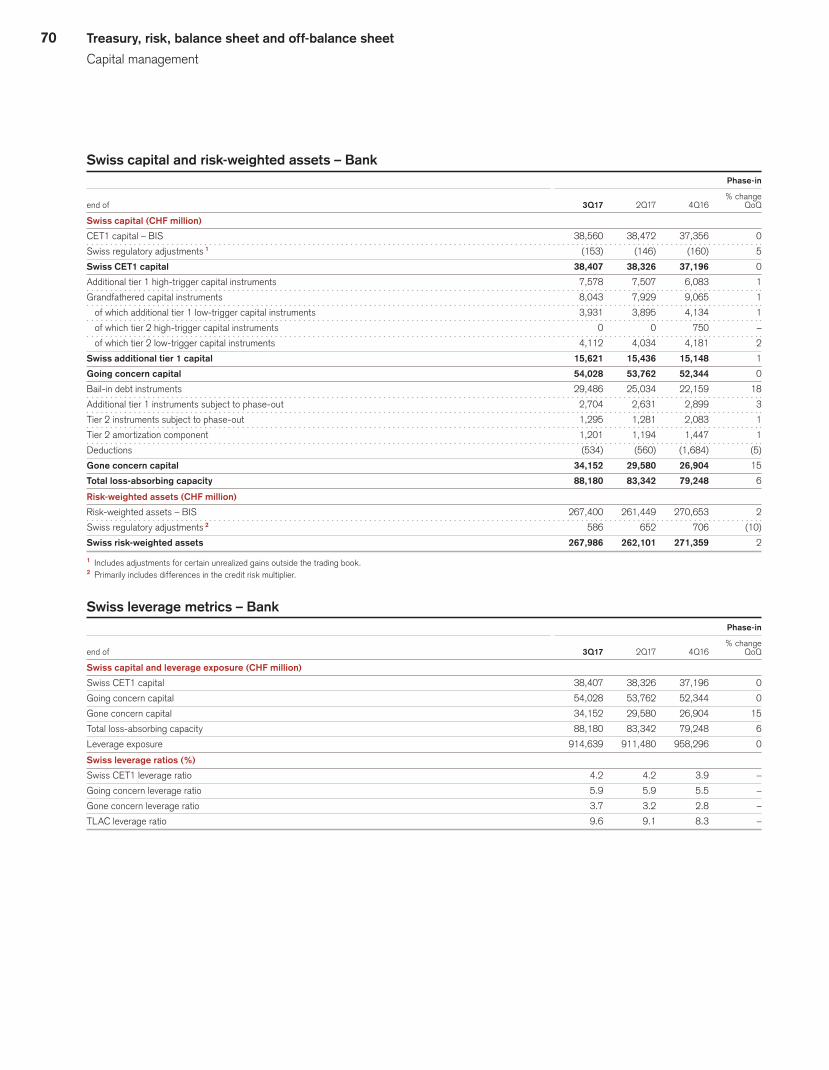
70 Treasury, risk, balance sheet and off-balance sheet
Capital management
Swiss capital and risk-weighted assets – Bank Phase-in
% change
end of 3Q17 2Q17 4Q16 QoQ
Swiss capital (CHF million)
CET1 capital – BIS 38,560 38,472 37,356 0
Swiss regulatory adjustments 1 (153) (146) (160) 5
Swiss CET1 capital 38,407 38,326 37,196 0
Additional tier 1 high-trigger capital instruments 7,578 7,507 6,083 1
Grandfathered capital instruments 8,043 7,929 9,065 1
of which additional tier 1 low-trigger capital instruments 3,931 3,895 4,134 1
of which tier 2 high-trigger capital instruments 0 0 750 –
of which tier 2 low-trigger capital instruments 4,112 4,034 4,181 2
Swiss additional tier 1 capital 15,621 15,436 15,148 1
Going concern capital 54,028 53,762 52,344 0
Bail-in debt instruments 29,486 25,034 22,159 18
Additional tier 1 instruments subject to phase-out 2,704 2,631 2,899 3
Tier 2 instruments subject to phase-out 1,295 1,281 2,083 1
Tier 2 amortization component 1,201 1,194 1,447 1
Deductions (534) (560) (1,684) (5)
Gone concern capital 34,152 29,580 26,904 15
Total loss-absorbing capacity 88,180 83,342 79,248 6
Risk-weighted assets (CHF million)
Risk-weighted assets – BIS 267,400 261,449 270,653 2
Swiss regulatory adjustments 2 586 652 706 (10)
Swiss risk-weighted assets 267,986 262,101 271,359 2
1 Includes adjustments for certain unrealized gains outside the trading book.2 Primarily includes differences in the credit risk multiplier.
Swiss leverage metrics – Bank Phase-in
% change
end of 3Q17 2Q17 4Q16 QoQ
Swiss capital and leverage exposure (CHF million)
Swiss CET1 capital 38,407 38,326 37,196 0
Going concern capital 54,028 53,762 52,344 0
Gone concern capital 34,152 29,580 26,904 15
Total loss-absorbing capacity 88,180 83,342 79,248 6
Leverage exposure 914,639 911,480 958,296 0
Swiss leverage ratios (%)
Swiss CET1 leverage ratio 4.2 4.2 3.9 –
Going concern leverage ratio 5.9 5.9 5.5 –
Gone concern leverage ratio 3.7 3.2 2.8 –
TLAC leverage ratio 9.6 9.1 8.3 –

71Treasury, risk, balance sheet and off-balance sheet
Capital management
OTHER REGULATORY DISCLOSURESIn connection with the implementation of Basel III, certain regula-tory disclosures for the Group and certain of its subsidiaries are required. The Group’s Pillar 3 disclosure, regulatory disclosures, additional information on capital instruments, including the main features and terms and conditions of regulatory capital instruments that form part of the eligible capital base, G-SIB financial indica-tors, reconciliation requirements, leverage ratios and certain liquid-ity disclosures as well as regulatory disclosures for subsidiaries can be found on our website.u Refer to www.credit-suisse.com/regulatorydisclosures for additional information.
SHAREHOLDERS’ EQUITY AND SHARE METRICSTotal shareholders’ equityOur total shareholders’ equity increased from CHF 43.5 billion as of the end of 2Q17 to CHF 43.9 billion as of the end of 3Q17. Total shareholders’ equity was positively impacted by foreign exchange-related movements on cumulative translation adjust-ments, net income attributable to shareholders and an increase in the share-based compensation obligation. These movements were partially offset by losses on fair value elected liabilities relating to credit risk and transactions relating to the settlement of share-based compensation awards.u Refer to the “Consolidated statements of changes in equity (unaudited)” in III – Condensed consolidated financial statements – unaudited for further information on shareholders’ equity.
Shareholders’ equity and share metrics % change
end of 3Q17 2Q17 4Q16 QoQ
Shareholders’ equity (CHF million)
Common shares 102 102 84 0
Additional paid-in capital 35,527 35,465 32,131 0
Retained earnings 27,099 26,855 25,954 1
Treasury shares, at cost (17) (40) 0 (58)
Accumulated other comprehensive loss (18,853) (18,889) (16,272) 0
Total shareholders’ equity 43,858 43,493 41,897 1
Goodwill (4,715) (4,673) (4,913) 1
Other intangible assets (219) (195) (213) 12
Tangible shareholders’ equity 1 38,924 38,625 36,771 1
Shares outstanding (million)
Common shares issued 2,556.0 2,556.0 2,089.9 0
Treasury shares (0.9) (2.7) 0.0 (67)
Shares outstanding 2,555.1 2,553.3 2,089.9 0
Par value (CHF)
Par value 0.04 0.04 0.04 0
Book value per share (CHF)
Total book value per share 17.17 17.03 20.05 1
Goodwill per share (1.85) (1.83) (2.35) 1
Other intangible assets per share (0.09) (0.07) (0.11) 29
Tangible book value per share 1 15.23 15.13 17.59 1
1 Management believes that tangible shareholders’ equity and tangible book value per share, both non-GAAP financial measures, are meaningful as they are measures used and relied upon by industry analysts and investors to assess valuations and capital adequacy.
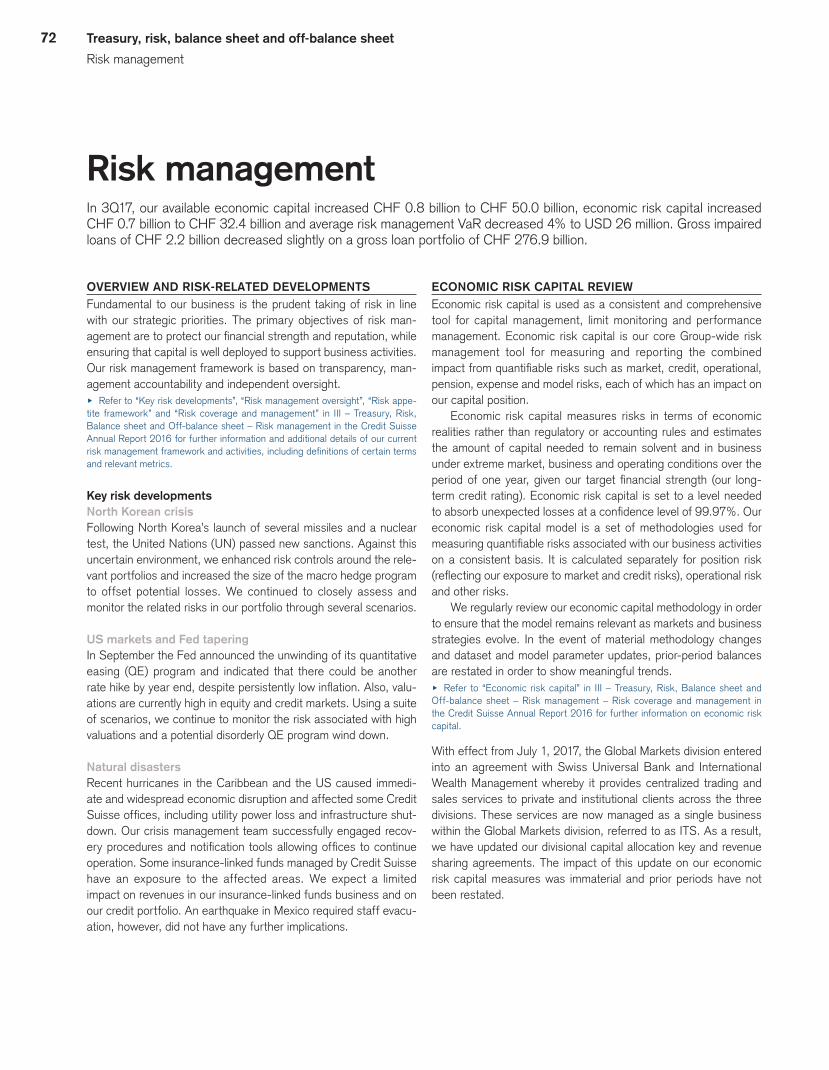
72 Treasury, risk, balance sheet and off-balance sheet
Risk management
Risk managementIn 3Q17, our available economic capital increased CHF 0.8 billion to CHF 50.0 billion, economic risk capital increased CHF 0.7 billion to CHF 32.4 billion and average risk management VaR decreased 4% to USD 26 million. Gross impaired loans of CHF 2.2 billion decreased slightly on a gross loan portfolio of CHF 276.9 billion.
OVERVIEW AND RISK-RELATED DEVELOPMENTSFundamental to our business is the prudent taking of risk in line with our strategic priorities. The primary objectives of risk man-agement are to protect our financial strength and reputation, while ensuring that capital is well deployed to support business activities. Our risk management framework is based on transparency, man-agement accountability and independent oversight.u Refer to “Key risk developments”, “Risk management oversight”, “Risk appe-tite framework” and “Risk coverage and management” in III – Treasury, Risk, Balance sheet and Off-balance sheet – Risk management in the Credit Suisse Annual Report 2016 for further information and additional details of our current risk management framework and activities, including definitions of certain terms and relevant metrics.
Key risk developmentsNorth Korean crisisFollowing North Korea’s launch of several missiles and a nuclear test, the United Nations (UN) passed new sanctions. Against this uncertain environment, we enhanced risk controls around the rele-vant portfolios and increased the size of the macro hedge program to offset potential losses. We continued to closely assess and monitor the related risks in our portfolio through several scenarios.
US markets and Fed taperingIn September the Fed announced the unwinding of its quantitative easing (QE) program and indicated that there could be another rate hike by year end, despite persistently low inflation. Also, valu-ations are currently high in equity and credit markets. Using a suite of scenarios, we continue to monitor the risk associated with high valuations and a potential disorderly QE program wind down.
Natural disastersRecent hurricanes in the Caribbean and the US caused immedi-ate and widespread economic disruption and affected some Credit Suisse offices, including utility power loss and infrastructure shut-down. Our crisis management team successfully engaged recov-ery procedures and notification tools allowing offices to continue operation. Some insurance-linked funds managed by Credit Suisse have an exposure to the affected areas. We expect a limited impact on revenues in our insurance-linked funds business and on our credit portfolio. An earthquake in Mexico required staff evacu-ation, however, did not have any further implications.
ECONOMIC RISK CAPITAL REVIEWEconomic risk capital is used as a consistent and comprehensive tool for capital management, limit monitoring and performance management. Economic risk capital is our core Group-wide risk management tool for measuring and reporting the combined impact from quantifiable risks such as market, credit, operational, pension, expense and model risks, each of which has an impact on our capital position.
Economic risk capital measures risks in terms of economic realities rather than regulatory or accounting rules and estimates the amount of capital needed to remain solvent and in business under extreme market, business and operating conditions over the period of one year, given our target financial strength (our long-term credit rating). Economic risk capital is set to a level needed to absorb unexpected losses at a confidence level of 99.97%. Our economic risk capital model is a set of methodologies used for measuring quantifiable risks associated with our business activities on a consistent basis. It is calculated separately for position risk (reflecting our exposure to market and credit risks), operational risk and other risks.
We regularly review our economic capital methodology in order to ensure that the model remains relevant as markets and business strategies evolve. In the event of material methodology changes and dataset and model parameter updates, prior-period balances are restated in order to show meaningful trends. u Refer to “Economic risk capital” in III – Treasury, Risk, Balance sheet and Off-balance sheet – Risk management – Risk coverage and management in the Credit Suisse Annual Report 2016 for further information on economic risk capital.
With effect from July 1, 2017, the Global Markets division entered into an agreement with Swiss Universal Bank and International Wealth Management whereby it provides centralized trading and sales services to private and institutional clients across the three divisions. These services are now managed as a single business within the Global Markets division, referred to as ITS. As a result, we have updated our divisional capital allocation key and revenue sharing agreements. The impact of this update on our economic risk capital measures was immaterial and prior periods have not been restated.
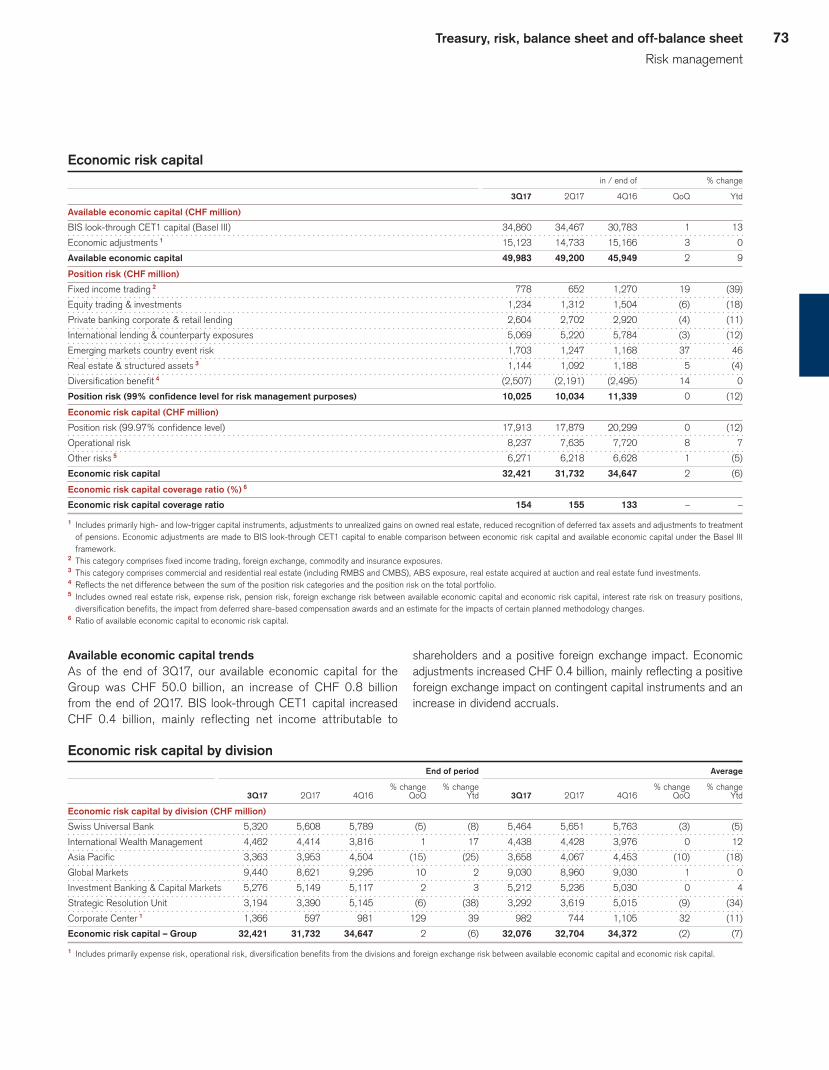
73Treasury, risk, balance sheet and off-balance sheet
Risk management
Economic risk capital in / end of % change
3Q17 2Q17 4Q16 QoQ Ytd
Available economic capital (CHF million)
BIS look-through CET1 capital (Basel III) 34,860 34,467 30,783 1 13
Economic adjustments 1 15,123 14,733 15,166 3 0
Available economic capital 49,983 49,200 45,949 2 9
Position risk (CHF million)
Fixed income trading 2 778 652 1,270 19 (39)
Equity trading & investments 1,234 1,312 1,504 (6) (18)
Private banking corporate & retail lending 2,604 2,702 2,920 (4) (11)
International lending & counterparty exposures 5,069 5,220 5,784 (3) (12)
Emerging markets country event risk 1,703 1,247 1,168 37 46
Real estate & structured assets 3 1,144 1,092 1,188 5 (4)
Diversification benefit 4 (2,507) (2,191) (2,495) 14 0
Position risk (99% confidence level for risk management purposes) 10,025 10,034 11,339 0 (12)
Economic risk capital (CHF million)
Position risk (99.97% confidence level) 17,913 17,879 20,299 0 (12)
Operational risk 8,237 7,635 7,720 8 7
Other risks 5 6,271 6,218 6,628 1 (5)
Economic risk capital 32,421 31,732 34,647 2 (6)
Economic risk capital coverage ratio (%) 6
Economic risk capital coverage ratio 154 155 133 – –
1 Includes primarily high- and low-trigger capital instruments, adjustments to unrealized gains on owned real estate, reduced recognition of deferred tax assets and adjustments to treatment of pensions. Economic adjustments are made to BIS look-through CET1 capital to enable comparison between economic risk capital and available economic capital under the Basel III framework.
2 This category comprises fixed income trading, foreign exchange, commodity and insurance exposures.3 This category comprises commercial and residential real estate (including RMBS and CMBS), ABS exposure, real estate acquired at auction and real estate fund investments.4 Reflects the net difference between the sum of the position risk categories and the position risk on the total portfolio.5 Includes owned real estate risk, expense risk, pension risk, foreign exchange risk between available economic capital and economic risk capital, interest rate risk on treasury positions,
diversification benefits, the impact from deferred share-based compensation awards and an estimate for the impacts of certain planned methodology changes.6 Ratio of available economic capital to economic risk capital.
Available economic capital trendsAs of the end of 3Q17, our available economic capital for the Group was CHF 50.0 billion, an increase of CHF 0.8 billion from the end of 2Q17. BIS look-through CET1 capital increased CHF 0.4 billion, mainly reflecting net income attributable to
shareholders and a positive foreign exchange impact. Economic adjustments increased CHF 0.4 billion, mainly reflecting a positive foreign exchange impact on contingent capital instruments and an increase in dividend accruals.
Economic risk capital by division End of period Average
% change % change % change % change 3Q17 2Q17 4Q16 QoQ Ytd 3Q17 2Q17 4Q16 QoQ Ytd
Economic risk capital by division (CHF million)
Swiss Universal Bank 5,320 5,608 5,789 (5) (8) 5,464 5,651 5,763 (3) (5)
International Wealth Management 4,462 4,414 3,816 1 17 4,438 4,428 3,976 0 12
Asia Pacific 3,363 3,953 4,504 (15) (25) 3,658 4,067 4,453 (10) (18)
Global Markets 9,440 8,621 9,295 10 2 9,030 8,960 9,030 1 0
Investment Banking & Capital Markets 5,276 5,149 5,117 2 3 5,212 5,236 5,030 0 4
Strategic Resolution Unit 3,194 3,390 5,145 (6) (38) 3,292 3,619 5,015 (9) (34)
Corporate Center 1 1,366 597 981 129 39 982 744 1,105 32 (11)
Economic risk capital – Group 32,421 31,732 34,647 2 (6) 32,076 32,704 34,372 (2) (7)
1 Includes primarily expense risk, operational risk, diversification benefits from the divisions and foreign exchange risk between available economic capital and economic risk capital.

74 Treasury, risk, balance sheet and off-balance sheet
Risk management
Economic risk capital trendsCompared to the end of 2Q17, our economic risk capital increased slightly to CHF 32.4 billion, mainly due to an 8% increase in opera-tional risk, primarily reflected in our Corporate Center. The increase in operational risk was mainly driven by the add-on to our risk-weighted assets relating to operational risk imposed by FINMA, primarily in respect of our RMBS settlements. Overall position risk was stable. Emerging markets country event risk increased, mainly reflecting higher exposures in Brazil. International lending & coun-terparty exposures and private banking corporate & retail lend-ing exposures decreased, primarily in Asia, driven by the securi-tization of certain lending exposures and decreased counterparty risk, respectively. Equity trading & investments risk decreased due to reduced private equity exposure across several regions. Other risks was stable, primarily reflecting increased foreign exchange risk between available economic capital and economic risk capital offset by lower pension risk driven by reduced equity risk in our Swiss and UK pension plans.
For Swiss Universal Bank, economic risk capital decreased 5% to CHF 5.3 billion from the end of 2Q17, mainly due to an impact from the agreement related to ITS and the lower pension risk driven by reduced equity risk in our Swiss pension plan.
For International Wealth Management, economic risk capital was stable at CHF 4.5 billion compared to the end of 2Q17.
For Asia Pacific, economic risk capital decreased 15% to CHF 3.4 billion from the end of 2Q17, mainly due to the securitiza-tion of certain lending exposures in international lending & coun-terparty exposures and a reduction in private banking corporate & retail lending exposures reflecting decreased counterparty risk. These reductions were partially offset by increased traded equity exposures in equity trading & investments and higher interest rate derivatives risk in fixed income trading.
For Global Markets, economic risk capital increased 10% to CHF 9.4 billion compared to the end of 2Q17, mainly due to increased exposures in Brazil in emerging markets country event risk and new loan commitments in international lending & coun-terparty exposures. These increases were partially offset by the impact of divisional revenue sharing agreements and the reduced pension risk in our UK pension plan.
For Investment Banking & Capital Markets, economic risk cap-ital increased slightly to CHF 5.3 billion from the end of 2Q17, mainly due to increased credit risk model reserve in other risks.
For the Strategic Resolution Unit, economic risk capital decreased 6% to CHF 3.2 billion from the end of 2Q17, mainly reflecting decreased risk in equity trading & investments due to reduced private equity exposure across several regions.
As part of our overall risk management, we hold a portfolio of hedges. Hedges are impacted by market movements, similar to other trading securities, and may result in gains or losses which off-set losses or gains on the portfolios they were designated to hedge. Due to the varying nature and structure of hedges, these gains or losses may not wholly offset the losses or gains on the portfolios.
MARKET RISK REVIEWMarket risk is the risk of financial loss arising from movements in market prices. Market risks arise from both our trading and non-trading business activities. The classification of assets into trad-ing book and banking book portfolios determines the approach for analyzing our market risk exposure. Market risk in the trading book is measured using VaR and market risk in our banking book is measured using sensitivity analysis on related market factors.u Refer to “Market risk” in III – Treasury, Risk, Balance sheet and Off-balance sheet – Risk management – Risk coverage and management in the Credit Suisse Annual Report 2016 for further information on market risk including our VaR methodology.
Trading bookMarket risks from our trading book relate to our trading activities primarily in Global Markets and Asia Pacific. We are active in most of the principal trading markets of the world, using the majority of common trading and hedging products, including derivatives such as swaps, futures, options and structured products. Some of the structured products are customized transactions using combinations of derivatives and are executed to meet specific client or internal needs. As a result of our broad participation in products and mar-kets, our trading strategies are correspondingly diverse and expo-sures are generally spread across a range of risks and locations.
VaR is a risk measure which quantifies the potential loss on a given portfolio of financial instruments over a certain holding period and that is expected to occur at a certain confidence level. VaR is an important tool in risk management and is used for mea-suring quantifiable risks from our activities exposed to market risk on a daily basis. In addition, VaR is one of the main risk measures for limit monitoring, financial reporting, calculation of regulatory capital and regulatory backtesting.
We regularly review our VaR model to ensure that it remains appropriate given evolving market conditions and the composition of our trading portfolio. In 3Q17, we updated our VaR methodology to capture volatility risk in exotic interest rate products. The volatil-ity modelling now accounts for a close to zero and a negative inter-est rate environment for major developed markets and for select emerging markets. The impact of this methodology change was immaterial and prior periods have not been restated.
We continue to receive regulatory approval for ongoing enhance-ments to our VaR methodology used for the calculation of regulatory capital, and the model is subject to regular reviews by regulators.
Information required under Pillar 3 of the Basel framework related to risk is available on our website at www.credit-suisse.com/pillar3.
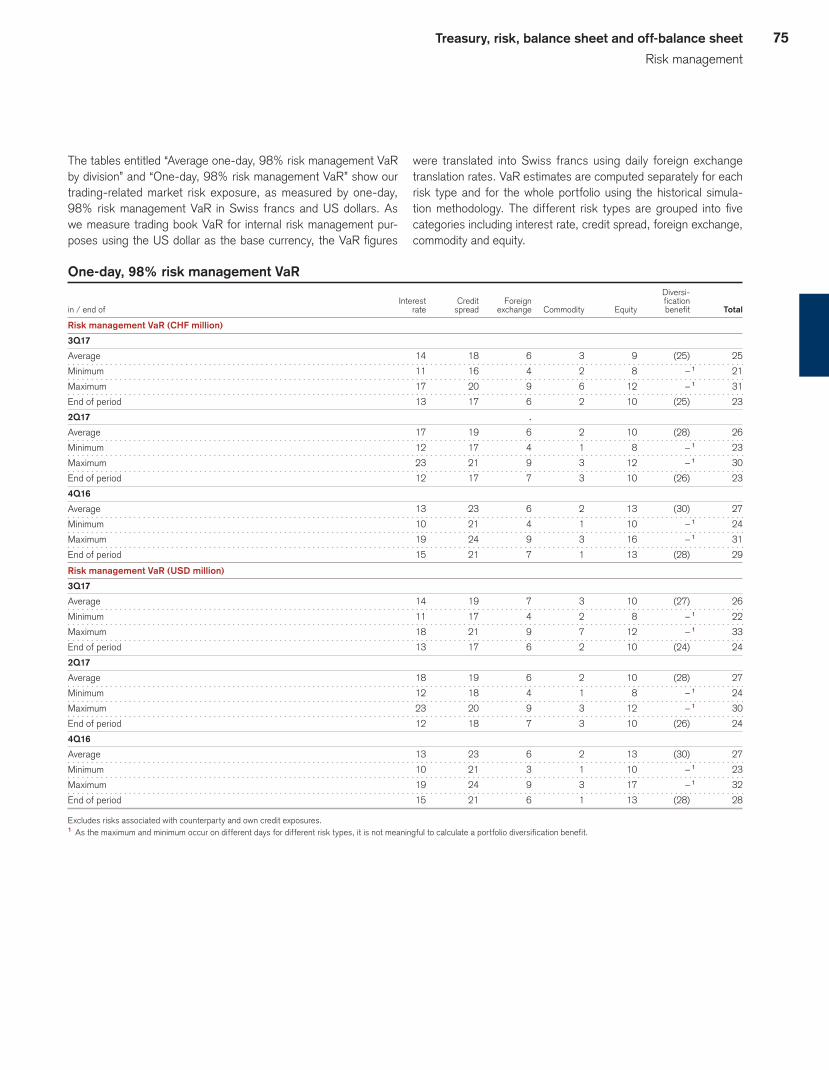
75Treasury, risk, balance sheet and off-balance sheet
Risk management
The tables entitled “Average one-day, 98% risk management VaR by division” and “One-day, 98% risk management VaR” show our trading-related market risk exposure, as measured by one-day, 98% risk management VaR in Swiss francs and US dollars. As we measure trading book VaR for internal risk management pur-poses using the US dollar as the base currency, the VaR figures
were translated into Swiss francs using daily foreign exchange translation rates. VaR estimates are computed separately for each risk type and for the whole portfolio using the historical simula-tion methodology. The different risk types are grouped into five categories including interest rate, credit spread, foreign exchange, commodity and equity.
One-day, 98% risk management VaR Diversi- Interest Credit Foreign fication
in / end of rate spread exchange Commodity Equity benefit Total
Risk management VaR (CHF million)
3Q17
Average 14 18 6 3 9 (25) 25
Minimum 11 16 4 2 8 – 1 21
Maximum 17 20 9 6 12 – 1 31
End of period 13 17 6 2 10 (25) 23
2Q17 .
Average 17 19 6 2 10 (28) 26
Minimum 12 17 4 1 8 – 1 23
Maximum 23 21 9 3 12 – 1 30
End of period 12 17 7 3 10 (26) 23
4Q16
Average 13 23 6 2 13 (30) 27
Minimum 10 21 4 1 10 – 1 24
Maximum 19 24 9 3 16 – 1 31
End of period 15 21 7 1 13 (28) 29
Risk management VaR (USD million)
3Q17
Average 14 19 7 3 10 (27) 26
Minimum 11 17 4 2 8 – 1 22
Maximum 18 21 9 7 12 – 1 33
End of period 13 17 6 2 10 (24) 24
2Q17
Average 18 19 6 2 10 (28) 27
Minimum 12 18 4 1 8 – 1 24
Maximum 23 20 9 3 12 – 1 30
End of period 12 18 7 3 10 (26) 24
4Q16
Average 13 23 6 2 13 (30) 27
Minimum 10 21 3 1 10 – 1 23
Maximum 19 24 9 3 17 – 1 32
End of period 15 21 6 1 13 (28) 28
Excludes risks associated with counterparty and own credit exposures.1 As the maximum and minimum occur on different days for different risk types, it is not meaningful to calculate a portfolio diversification benefit.

76 Treasury, risk, balance sheet and off-balance sheet
Risk management
Daily risk management VaR (rolling four quarters)
j One-day risk management VaR (98%) Excludes risks associated with counterparty and own credit exposures.
CHF million
0
10
20
30
40
50
60
70
4Q16 1Q17 2Q17 3Q17
Actual daily trading revenues
p 3Q17 p 2Q17 p 4Q16 Trading revenues exclude Neue Aargauer Bank AG and valuation adjustments associated with counterparty and own credit exposures.
0
10
20
30
40
< (1
00
)
Days
(10
0)–
(75
)
(75
)–(5
0)
(50
)–(2
5)
(25
)–0
0–
25
25
–5
0
50
–7
5
75
–1
00
10
0–
12
5
12
5–
15
0
> 1
50
CHFmillion
2 2
28
32
5
28 29
5
1
27
36
Average one-day, 98% risk management VaR by division Swiss International Strategic Diversi- Universal Wealth Asia Global Resolution fication Credit in Bank Management Pacific Markets Unit benefit 1 Suisse
Average risk management VaR (CHF million)
3Q17 0 4 12 20 5 (16) 25
2Q17 0 4 13 22 7 (20) 26
4Q16 0 5 15 21 7 (21) 27
Average risk management VaR (USD million)
3Q17 0 4 12 21 5 (16) 26
2Q17 0 4 13 22 7 (19) 27
4Q16 0 5 15 21 7 (21) 27
Excludes risks associated with counterparty and own credit exposures. Investment Banking & Capital Markets has only banking book positions.1 Difference between the sum of the standalone VaR for each division and the VaR for the Group.
We measure VaR in US dollars, as the majority of our trading activ-ities are conducted in US dollars.
Average risk management VaR decreased 4% to USD 26 mil-lion from 2Q17, mainly driven by decreased interest rate derivatives exposures in Europe, primarily reflected in the Strategic Resolution Unit. For Global Markets, the decrease in average risk manage-ment VaR was mainly driven by lower credit spread risk from com-mercial mortgage-backed securities (CMBS) in the US.
Period-end risk management VaR was stable at USD 24 mil-lion compared to 2Q17, mainly due to an increase in interest rate exposures offset by a decrease in credit spread risk reflecting reduced exposures in CMBS in the US.
The chart entitled “Daily risk management VaR” shows the aggregated market risk in our trading book on a consolidated basis.
The histogram entitled “Actual daily trading revenues” compares the actual daily trading revenues for 3Q17 with those for 2Q17 and 4Q16. The dispersion of trading revenues indicates the day-to-day volatility in our trading activities. We had no trading loss days in 3Q17 and 2Q17 and two trading loss days in 4Q16.
VaR backtestingVarious techniques are used to assess the accuracy of the VaR methodology used for risk management and regulatory purposes and to assess if our regulatory capital is sufficient to absorb actual losses. Our VaR backtesting process is used to assess the accu-racy and performance of our regulatory VaR model and to encour-age developments to our VaR model. Backtesting involves compar-ing the results produced from the VaR model with the daily trading revenues. A backtesting exception occurs when a trading loss exceeds the daily VaR estimate. For capital purposes, FINMA, in line with BIS requirements, uses a multiplier to impose an increase in market risk capital for every regulatory VaR backtesting excep-tion over four in the prior rolling 12-month period calculated using a subset of the actual daily trading revenues also referred to as “hypothetical” trading revenues under the Basel framework. In the rolling 12-month period through the end of 3Q17, we had no back-testing exceptions in our regulatory VaR model calculated using the subset of actual daily trading revenues. Since there were fewer than five backtesting exceptions in the rolling 12-month period

77Treasury, risk, balance sheet and off-balance sheet
Risk management
through the end of 3Q17, in line with BIS industry guidelines, the VaR model is deemed to be statistically valid.u Refer to “Market risk” in III – Treasury, Risk, Balance sheet and Off-balance sheet – Risk management – Risk coverage and management in the Credit Suisse Annual Report 2016 for further information on VaR backtesting.
u Refer to “Other requirements” in Capital management – Swiss requirements for further information on the use of our regulatory VaR model in the calculation of trading book market risk capital requirements.
Banking bookMarket risks from our banking book primarily relate to asset and liability mismatch exposures, equity participations and investments in bonds and money market instruments. Our businesses and the Corporate Center have non-trading portfolios that carry mar-ket risks, mainly related to changes in interest rates but also to changes in foreign exchange rates, equity prices and, to a lesser extent, commodity prices.
Interest rate risk on banking book positions is measured by estimating the impact resulting from a one basis point parallel increase in yield curves on the fair value of interest rate-sensitive banking book positions. As of the end of 3Q17, the interest rate sensitivity of a one basis point parallel increase in yield curves would have been positive CHF 5.5 million, compared to positive CHF 4.1 million as of the end of 2Q17.
CREDIT RISK REVIEWAll transactions that are exposed to potential losses due to a coun-terparty failing to meet an obligation are subject to credit risk expo-sure measurement and management. The majority of our credit risk is concentrated in the private banking, corporate and institu-tional businesses and in the investment banking businesses.u Refer to “Credit risk” in III – Treasury, Risk, Balance sheet and Off-balance sheet – Risk management – Risk coverage and management in the Credit Suisse Annual Report 2016 for further information on credit risk.
u Refer to “Note 16 – Loans, allowance for loan losses and credit quality” and “Note 28 – Financial instruments” in III – Condensed consolidated financial state-ments – unaudited for further information on loans and impaired loans and coun-terparty credit risk, respectively.
LoansCompared to the end of 2Q17, gross loans increased CHF 2.0 billion to CHF 276.9 billion as of the end of 3Q17, mainly driven by higher loans collateralized by securities, higher mortgages, increased loans to the real estate sector and higher loans to finan-cial institutions and the translation impact from the US dollar and the euro. These increases were partially offset by lower commer-cial and industrial loans and a decrease in consumer finance loans. The net increase of CHF 1.6 billion in loans collateralized by secu-rities was mainly driven by Asia Pacific and International Wealth Management. The net increase of CHF 0.5 billion in mortgages was mainly driven by increases in International Wealth Manage-ment and Swiss Universal Bank. Loans to the real estate sec-tor increased CHF 0.3 billion, primarily in Asia Pacific and Inter-national Wealth Management. Loans to financial institutions increased CHF 0.3 billion, primarily in International Wealth Man-agement and Global Markets, partially offset by a decrease in the Strategic Resolution Unit. The net decrease of CHF 0.4 billion in commercial and industrial loans primarily reflected decreases in the Strategic Resolution Unit, Swiss Universal Bank and Invest-ment Banking & Capital Markets, partially offset by an increase in Global Markets. The net decrease of CHF 0.2 billion in consumer finance loans was mainly driven by Swiss Universal Bank.
On a divisional level, increases in gross loans of CHF 1.5 billion in Asia Pacific, CHF 1.3 billion in International Wealth Manage-ment and CHF 0.5 billion in Global Markets were partially offset by decreases in gross loans of CHF 0.8 billion in the Strategic Reso-lution Unit, CHF 0.2 billion in Swiss Universal Bank and CHF 0.2 billion in Investment Banking & Capital Markets.

78 Treasury, risk, balance sheet and off-balance sheet
Risk management
Loans Investment Swiss International Banking & Strategic Universal Wealth Asia Global Capital Resolution Credit end of Bank Management Pacific Markets Markets Unit Suisse 1
3Q17 (CHF million)
Mortgages 100,440 4,027 1,282 0 0 140 105,889
Loans collateralized by securities 7,200 18,532 14,769 0 1,282 93 41,876
Consumer finance 3,215 519 10 17 0 86 3,847
Consumer 110,855 23,078 16,061 17 1,282 319 151,612
Real estate 23,178 1,859 813 227 292 53 26,422
Commercial and industrial loans 27,099 20,650 23,077 3,791 2,889 2,479 80,007
Financial institutions 3,756 1,935 2,189 5,072 468 1,181 14,829
Governments and public institutions 745 221 1,008 1,379 0 659 4,012
Corporate & institutional 54,778 2 24,665 3 27,087 4 10,469 3,649 4,372 125,270
Gross loans 165,633 47,743 43,148 10,486 4,931 4,691 276,882
of which held at fair value 43 161 4,642 6,119 1,805 2,592 15,362
Net (unearned income) / deferred expenses 52 (113) (21) (14) (10) (1) (107)
Allowance for loan losses 5 (464) (99) (61) (37) (51) (210) (922)
Net loans 165,221 47,531 43,066 10,435 4,870 4,480 275,853
2Q17 (CHF million)
Mortgages 100,180 3,757 1,305 0 0 191 105,433
Loans collateralized by securities 7,150 17,987 13,664 0 1,349 127 40,277
Consumer finance 3,421 476 27 17 0 84 4,025
Consumer 110,751 22,220 14,996 17 1,349 402 149,735
Real estate 23,263 1,645 504 317 353 62 26,144
Commercial and industrial loans 27,316 20,692 23,095 3,435 3,022 2,825 80,405
Financial institutions 3,776 1,635 2,096 4,923 392 1,500 14,575
Governments and public institutions 746 267 1,006 1,284 0 733 4,036
Corporate & institutional 55,101 2 24,239 3 26,701 4 9,959 3,767 5,120 125,160
Gross loans 165,852 46,459 41,697 9,976 5,116 5,522 274,895
of which held at fair value 50 185 4,684 6,337 2,171 3,200 16,627
Net (unearned income) / deferred expenses 44 (107) (30) (9) (10) (1) (113)
Allowance for loan losses 5 (461) (89) (60) (36) (46) (225) (917)
Net loans 165,435 46,263 41,607 9,931 5,060 5,296 273,865
4Q16 (CHF million)
Mortgages 99,383 3,551 1,166 0 0 235 104,335
Loans collateralized by securities 7,224 17,863 11,704 0 273 204 37,268
Consumer finance 2,923 438 3 18 0 108 3,490
Consumer 109,530 21,852 12,873 18 273 547 145,093
Real estate 23,661 1,383 499 160 214 99 26,016
Commercial and industrial loans 28,460 19,618 23,405 3,788 4,441 4,008 83,740
Financial institutions 3,657 2,077 2,320 4,351 465 4,878 17,921
Governments and public institutions 801 223 1,135 1,070 0 1,044 4,273
Corporate & institutional 56,579 2 23,301 3 27,359 4 9,369 5,120 10,029 131,950
Gross loans 166,109 45,153 40,232 9,387 5,393 10,576 277,043
of which held at fair value 38 397 5,377 6,711 2,545 4,460 19,528
Net (unearned income) / deferred expenses 38 (99) (27) (8) (8) (25) (129)
Allowance for loan losses 5 (462) (89) (71) (19) (24) (273) (938)
Net loans 165,685 44,965 40,134 9,360 5,361 10,278 275,976
1 Includes the Corporate Center, in addition to the divisions disclosed.2 The values of financial collateral and mortgages related to secured loans, considered up to the amount of the related loans, were CHF 11,155 million and CHF 32,638 million, respectively,
as of the end of 3Q17, CHF 10,818 million and CHF 32,855 million, respectively, as of the end of 2Q17, and CHF 11,266 million and CHF 33,515 million, respectively, as of the end of 4Q16.
3 The values of financial collateral and mortgages related to secured loans, considered up to the amount of the related loans, were CHF 19,538 million and CHF 1,648 million, respectively, as of the end of 3Q17, CHF 18,567 million and CHF 1,519 million, respectively, as of the end of 2Q17, and CHF 18,084 million and CHF 1,165 million, respectively, as of the end of 4Q16.
4 The values of financial collateral and mortgages related to secured loans, considered up to the amount of the related loans, were CHF 19,561 million and CHF 136 million, respectively, as of the end of 3Q17, CHF 19,275 million and CHF 164 million, respectively, as of the end of 2Q17, and CHF 21,135 million and CHF 175 million, respectively, as of the end of 4Q16.
5 Allowance for loan losses are only based on loans that are not carried at fair value.

79Treasury, risk, balance sheet and off-balance sheet
Risk management
Impaired loans Investment Swiss International Banking & Strategic Universal Wealth Asia Global Capital Resolution Credit end of Bank Management Pacific Markets Markets Unit Suisse 1
3Q17 (CHF million)
Non-performing loans 427 307 93 28 35 174 1,064
Non-interest-earning loans 168 17 0 0 0 45 230
Non-performing and non-interest-earning loans 595 324 93 28 35 219 1,294
Restructured loans 61 84 8 0 0 164 317
Potential problem loans 154 72 9 9 0 339 583
Other impaired loans 215 156 17 9 0 503 900
Gross impaired loans 2 810 480 110 37 35 722 2,194
of which loans with a specific allowance 684 297 94 37 35 681 1,828
of which loans without a specific allowance 126 183 16 0 0 41 366
2Q17 (CHF million)
Non-performing loans 388 256 124 29 33 199 1,029
Non-interest-earning loans 173 17 0 0 0 38 228
Non-performing and non-interest-earning loans 561 273 124 29 33 237 1,257
Restructured loans 62 82 9 0 0 191 344
Potential problem loans 170 90 8 9 0 362 639
Other impaired loans 232 172 17 9 0 553 983
Gross impaired loans 2 793 445 141 38 33 790 2,240
of which loans with a specific allowance 682 210 121 38 33 711 1,795
of which loans without a specific allowance 111 235 20 0 0 79 445
4Q16 (CHF million)
Non-performing loans 341 179 242 8 0 466 1,236
Non-interest-earning loans 168 17 1 0 0 79 265
Non-performing and non-interest-earning loans 509 196 243 8 0 545 1,501
Restructured loans 53 89 17 0 0 199 358
Potential problem loans 191 39 6 9 0 368 613
Other impaired loans 244 128 23 9 0 567 971
Gross impaired loans 2 753 324 266 17 0 1,112 2,472
of which loans with a specific allowance 674 170 239 17 0 985 2,085
of which loans without a specific allowance 79 154 27 0 0 127 387
1 Includes the Corporate Center, in addition to the divisions disclosed.2 Impaired loans are only based on loans that are not carried at fair value.
Impaired loansCompared to the end of 2Q17, gross impaired loans decreased slightly to CHF 2.2 billion as of the end of 3Q17, mainly reflecting lower potential problem loans and lower restructured loans, pri-marily in the Strategic Resolution Unit.
In the Strategic Resolution Unit, gross impaired loans decreased CHF 68 million, primarily driven by a reduction in ship finance. In Asia Pacific, gross impaired loans decreased CHF 31 million, mainly reflecting the repayment of a share-backed loan
exposure. In International Wealth Management, gross impaired loans increased CHF 35 million, primarily driven by a small number of newly defaulted mortgages and secured loans in ship finance, partially offset by reductions mainly in aviation finance. In Swiss Universal Bank, gross impaired loans increased CHF 17 million, mainly driven by the default of an exposure in commodity trade finance. Gross impaired loans for Global Markets and Investment Banking & Capital Markets were stable at CHF 37 million and CHF 35 million, respectively.

80 Treasury, risk, balance sheet and off-balance sheet
Risk management
Allowance for loan losses Investment Swiss International Banking & Strategic Universal Wealth Asia Global Capital Resolution Credit end of Bank Management Pacific Markets Markets Unit Suisse 1
3Q17 (CHF million)
Allowance for loan losses at beginning of period 2 461 89 60 36 46 225 917
of which individually evaluated for impairment 334 55 49 27 28 219 712
of which collectively evaluated for impairment 127 34 11 9 18 6 205
Net movements recognized in statements of operations 17 6 3 (4) (4) (10) 8
Gross write-offs (23) 0 (1) 0 0 (11) (35)
Recoveries 6 0 0 3 5 1 15
Net write-offs (17) 0 (1) 3 5 (10) (20)
Provisions for interest 1 1 (1) 1 1 4 7
Foreign currency translation impact and other adjustments, net 2 3 0 1 3 1 10
Allowance for loan losses at end of period 2 464 99 61 37 51 210 922
of which individually evaluated for impairment 339 67 45 23 27 205 706
of which collectively evaluated for impairment 125 32 16 14 24 5 216
9M17 (CHF million)
Allowance for loan losses at beginning of period 2 462 89 71 19 24 273 938
of which individually evaluated for impairment 314 56 62 9 0 259 700
of which collectively evaluated for impairment 148 33 9 10 24 14 238
Net movements recognized in statements of operations 67 16 4 11 16 30 144
Gross write-offs (80) (13) (2) 0 0 (92) (187)
Recoveries 13 0 0 6 8 9 36
Net write-offs (67) (13) (2) 6 8 (83) (151)
Provisions for interest 5 3 (7) 1 1 3 6
Foreign currency translation impact and other adjustments, net (3) 4 (5) 0 2 (13) (15)
Allowance for loan losses at end of period 2 464 99 61 37 51 210 922
of which individually evaluated for impairment 339 67 45 23 27 205 706
of which collectively evaluated for impairment 125 32 16 14 24 5 216
1 Includes the Corporate Center, in addition to the divisions disclosed.2 Allowance for loan losses are only based on loans that are not carried at fair value.
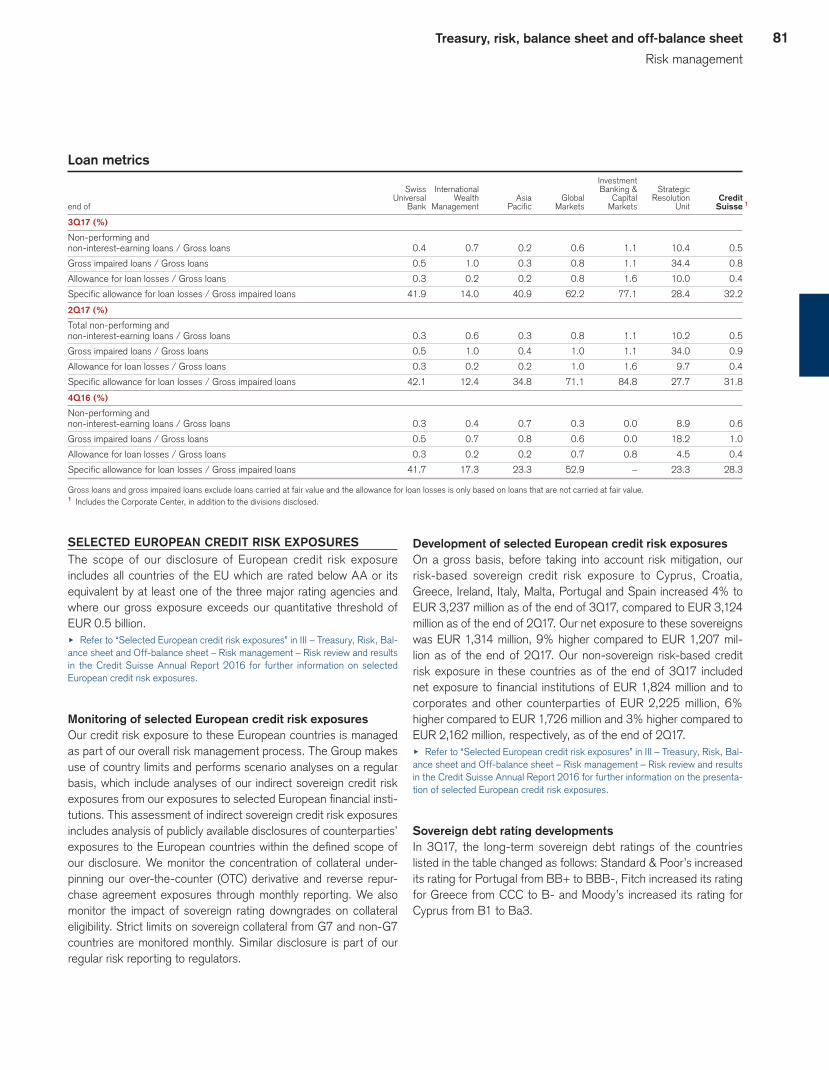
81Treasury, risk, balance sheet and off-balance sheet
Risk management
Loan metrics Investment Swiss International Banking & Strategic Universal Wealth Asia Global Capital Resolution Credit end of Bank Management Pacific Markets Markets Unit Suisse 1
3Q17 (%)
Non-performing and
non-interest-earning loans / Gross loans 0.4 0.7 0.2 0.6 1.1 10.4 0.5
Gross impaired loans / Gross loans 0.5 1.0 0.3 0.8 1.1 34.4 0.8
Allowance for loan losses / Gross loans 0.3 0.2 0.2 0.8 1.6 10.0 0.4
Specific allowance for loan losses / Gross impaired loans 41.9 14.0 40.9 62.2 77.1 28.4 32.2
2Q17 (%)
Total non-performing and
non-interest-earning loans / Gross loans 0.3 0.6 0.3 0.8 1.1 10.2 0.5
Gross impaired loans / Gross loans 0.5 1.0 0.4 1.0 1.1 34.0 0.9
Allowance for loan losses / Gross loans 0.3 0.2 0.2 1.0 1.6 9.7 0.4
Specific allowance for loan losses / Gross impaired loans 42.1 12.4 34.8 71.1 84.8 27.7 31.8
4Q16 (%)
Non-performing and
non-interest-earning loans / Gross loans 0.3 0.4 0.7 0.3 0.0 8.9 0.6
Gross impaired loans / Gross loans 0.5 0.7 0.8 0.6 0.0 18.2 1.0
Allowance for loan losses / Gross loans 0.3 0.2 0.2 0.7 0.8 4.5 0.4
Specific allowance for loan losses / Gross impaired loans 41.7 17.3 23.3 52.9 – 23.3 28.3
Gross loans and gross impaired loans exclude loans carried at fair value and the allowance for loan losses is only based on loans that are not carried at fair value.1 Includes the Corporate Center, in addition to the divisions disclosed.
SELECTED EUROPEAN CREDIT RISK EXPOSURESThe scope of our disclosure of European credit risk exposure includes all countries of the EU which are rated below AA or its equivalent by at least one of the three major rating agencies and where our gross exposure exceeds our quantitative threshold of EUR 0.5 billion. u Refer to “Selected European credit risk exposures” in III – Treasury, Risk, Bal-ance sheet and Off-balance sheet – Risk management – Risk review and results in the Credit Suisse Annual Report 2016 for further information on selected European credit risk exposures.
Monitoring of selected European credit risk exposuresOur credit risk exposure to these European countries is managed as part of our overall risk management process. The Group makes use of country limits and performs scenario analyses on a regular basis, which include analyses of our indirect sovereign credit risk exposures from our exposures to selected European financial insti-tutions. This assessment of indirect sovereign credit risk exposures includes analysis of publicly available disclosures of counterparties’ exposures to the European countries within the defined scope of our disclosure. We monitor the concentration of collateral under-pinning our over-the-counter (OTC) derivative and reverse repur-chase agreement exposures through monthly reporting. We also monitor the impact of sovereign rating downgrades on collateral eligibility. Strict limits on sovereign collateral from G7 and non-G7 countries are monitored monthly. Similar disclosure is part of our regular risk reporting to regulators.
Development of selected European credit risk exposuresOn a gross basis, before taking into account risk mitigation, our risk-based sovereign credit risk exposure to Cyprus, Croatia, Greece, Ireland, Italy, Malta, Portugal and Spain increased 4% to EUR 3,237 million as of the end of 3Q17, compared to EUR 3,124 million as of the end of 2Q17. Our net exposure to these sovereigns was EUR 1,314 million, 9% higher compared to EUR 1,207 mil-lion as of the end of 2Q17. Our non-sovereign risk-based credit risk exposure in these countries as of the end of 3Q17 included net exposure to financial institutions of EUR 1,824 million and to corporates and other counterparties of EUR 2,225 million, 6% higher compared to EUR 1,726 million and 3% higher compared to EUR 2,162 million, respectively, as of the end of 2Q17.u Refer to “Selected European credit risk exposures” in III – Treasury, Risk, Bal-ance sheet and Off-balance sheet – Risk management – Risk review and results in the Credit Suisse Annual Report 2016 for further information on the presenta-tion of selected European credit risk exposures.
Sovereign debt rating developmentsIn 3Q17, the long-term sovereign debt ratings of the countries listed in the table changed as follows: Standard & Poor’s increased its rating for Portugal from BB+ to BBB-, Fitch increased its rating for Greece from CCC to B- and Moody’s increased its rating for Cyprus from B1 to Ba3.

82 Treasury, risk, balance sheet and off-balance sheet
Risk management
Selected European credit risk exposures Gross Net Total credit risk credit risk credit risk exposure Risk mitigation exposure Inventory 2 exposure
Net synthetic
end of 3Q17 CDS Other 1 inventory 3 Gross Net
Croatia (EUR million)
Sovereign 58 0 49 9 11 8 69 20
Corporates & other 50 0 0 50 0 0 50 50
Total 108 0 49 59 11 8 119 70
Cyprus (EUR million)
Financial institutions 45 0 42 3 24 0 69 27
Corporates & other 1,121 0 1,049 72 0 0 1,121 72
Total 1,166 0 1,091 75 24 0 1,190 99
Greece (EUR million)
Sovereign 0 0 0 0 28 0 28 28
Financial institutions 160 0 160 0 0 0 160 0
Corporates & other 678 0 646 32 6 0 684 38
Total 838 0 806 32 34 0 872 66
Ireland (EUR million)
Sovereign 384 0 0 384 0 0 384 384
Financial institutions 883 0 326 557 194 (44) 1,077 751
Corporates & other 702 0 228 474 27 9 729 501
Total 1,969 0 554 1,415 221 (35) 2,190 1,636
Italy (EUR million)
Sovereign 2,194 1,746 128 320 178 143 2,372 498
Financial institutions 868 1 609 258 21 (18) 889 279
Corporates & other 3,499 50 2,624 825 45 17 3,544 870
Total 6,561 1,797 3,361 1,403 244 142 6,805 1,647
Malta (EUR million)
Financial institutions 49 0 0 49 0 0 49 49
Corporates & other 627 0 568 59 0 0 627 59
Total 676 0 568 108 0 0 676 108
Portugal (EUR million)
Sovereign 0 0 0 0 51 45 51 51
Financial institutions 302 0 296 6 11 (8) 313 17
Corporates & other 281 8 173 100 43 46 324 143
Total 583 8 469 106 105 83 688 211
Spain (EUR million)
Sovereign 333 0 0 333 0 (13) 333 333
Financial institutions 1,349 6 643 700 1 (47) 1,350 701
Corporates & other 1,775 35 1,290 450 42 (33) 1,817 492
Total 3,457 41 1,933 1,483 43 (93) 3,500 1,526
Total (EUR million)
Sovereign 2,969 1,746 177 1,046 268 183 3,237 1,314
Financial institutions 3,656 7 2,076 1,573 251 (117) 3,907 1,824
Corporates & other 8,733 93 6,578 2,062 163 39 8,896 2,225
Total 15,358 1,846 8,831 4,681 682 105 16,040 5,363
1 Includes other hedges (derivative instruments), guarantees, insurance and collateral.2 Represents long inventory positions netted at issuer level.3 Substantially all of which results from CDS; represents long positions net of short positions.

83Treasury, risk, balance sheet and off-balance sheet
Balance sheet and off-balance sheet
Balance sheet and off-balance sheet Total assets were CHF 788.7 billion, total liabilities were CHF 744.6 billion and total equity was CHF 44.1 billion. Total assets increased 1% and total liabilities increased 1% for the quarter, reflecting the foreign exchange translation impact and lower operating activities. The majority of our transactions are recorded on our balance sheet, however, we also enter into transactions that give rise to both on and off-balance sheet exposure.
BALANCE SHEET Total assets were CHF 788.7 billion as of the end of 3Q17, an increase of CHF 5.3 billion, or 1%, from the end of 2Q17, reflect-ing the foreign exchange translation impact and lower operating activities. Excluding the foreign exchange translation impact, total assets decreased CHF 2.2 billion.
Compared to the end of 2Q17, central bank funds sold, securi-ties purchased under resale agreements and securities borrowing
transactions increased CHF 10.7 billion, or 8%, mainly driven by an increase in reverse repurchase transactions from banks and customers and cash collateral from banks. Trading assets and net loans were stable. Brokerage receivables decreased CHF 4.8 bil-lion, or 12%, primarily reflecting decreases in failed settlements and margin lending. Cash and due from banks decreased CHF 4.6 billion, or 4%, mainly driven by lower cash positions at the Fed. All other assets were stable.
Balance sheet summary end of % change
3Q17 2Q17 4Q16 QoQ Ytd
Assets (CHF million)
Cash and due from banks 105,779 110,332 121,161 (4) (13)
Central bank funds sold, securities purchased under
resale agreements and securities borrowing transactions 140,041 129,347 134,839 8 4
Trading assets 142,379 140,981 165,150 1 (14)
Net loans 275,853 273,865 275,976 1 0
Brokerage receivables 35,525 40,279 33,431 (12) 6
All other assets 89,113 88,607 89,304 1 0
Total assets 788,690 783,411 819,861 1 (4)
Liabilities and equity (CHF million)
Due to banks 17,497 17,654 22,800 (1) (23)
Customer deposits 354,386 356,674 355,833 (1) 0
Central bank funds purchased, securities sold under
repurchase agreements and securities lending transactions 33,146 30,711 33,016 8 0
Trading liabilities 43,920 43,535 44,930 1 (2)
Long-term debt 180,294 176,700 193,315 2 (7)
Brokerage payables 32,416 33,545 39,852 (3) (19)
All other liabilities 82,950 80,756 87,804 3 (6)
Total liabilities 744,609 739,575 777,550 1 (4)
Total shareholders’ equity 43,858 43,493 41,897 1 5
Noncontrolling interests 223 343 414 (35) (46)
Total equity 44,081 43,836 42,311 1 4
Total liabilities and equity 788,690 783,411 819,861 1 (4)

84 Treasury, risk, balance sheet and off-balance sheet
Balance sheet and off-balance sheet
Total liabilities were CHF 744.6 billion as of the end of 3Q17, an increase of CHF 5.0 billion, or 1%, from the end of 2Q17, reflect-ing the foreign exchange translation impact and lower operating activities. Excluding the foreign exchange translation impact, total liabilities decreased CHF 0.8 billion.
Compared to the end of 2Q17, long-term debt increased CHF 3.6 billion, or 2%, primarily reflecting issuances of senior debt, the foreign exchange translation impact and valuation adjust-ments, partially offset by maturities of senior debt. Central bank funds purchased, securities sold under repurchase agreements and securities lending transactions increased CHF 2.4 billion, or 8%, primarily due to an increase in repurchase transactions with customers. Due to banks, customer deposits and trading liabili-ties were stable. Brokerage payables decreased CHF 1.1 billion, or 3%, mainly due to decreases in failed settlements. All other liabilities increased CHF 2.2 billion, or 3%, reflecting increases of CHF 2.5 billion, or 8%, in obligation to return securities received as collateral and CHF 0.7 billion, or 2%, in other liabilities, par-tially offset by a decrease of CHF 1.0 billion, or 6%, in short-term borrowings.u Refer to “Funding sources and uses” in Liquidity and funding management and “Capital management” for further information, including our funding of the bal-ance sheet and the leverage ratio.
OFF-BALANCE SHEETWe enter into off-balance sheet arrangements in the normal course of business. Off-balance sheet arrangements are transac-tions or other contractual arrangements with, or for the benefit of, an entity that is not consolidated. These transactions include deriv-ative instruments, guarantees and similar arrangements, retained or contingent interests in assets transferred to an unconsolidated entity in connection with our involvement with special purpose enti-ties (SPEs), and obligations and liabilities (including contingent obligations and liabilities) under variable interests in unconsolidated entities that provide financing, liquidity, credit and other support.u Refer to “Balance sheet, off-balance sheet and other contractual obligations” in III – Treasury, Risk, Balance sheet and Off-balance sheet in the Credit Suisse Annual Report 2016 and “Note 26 – Guarantees and commitments” and “Note 30 – Litigation” in III – Condensed consolidated financial statements – unaudited for further information.

Condensed consolidated financial statements – unaudited
85
IIICondensed consolidated financial statements – unaudited
Report of Independent Registered Public Accounting Firm 87
Condensed consolidated financial statements – unaudited 89
Notes to the condensed consolidated financial statements – unaudited 97
Notes to the condensed consolidated financial statements – unaudited
1 Summary of significant accounting policies 972 Recently issued accounting standards 973 Business developments 994 Segment information 1005 Net interest income 1016 Commissions and fees 1017 Trading revenues 1018 Other revenues 1029 Provision for credit losses 102
10 Compensation and benefits 10211 General and administrative expenses 10212 Restructuring expenses 10313 Earnings per share 10414 Trading assets and liabilities 10515 Investment securities 10616 Loans, allowance for loan losses and credit quality 10717 Goodwill 11418 Other assets and other liabilities 11519 Long-term debt 11620 Accumulated other comprehensive income and additional share information 11721 Offsetting of financial assets and financial liabilities 11922 Tax 12323 Employee deferred compensation 12424 Pension and other post-retirement benefits 12525 Derivatives and hedging activities 12626 Guarantees and commitments 13027 Transfers of financial assets and variable interest entities 13228 Financial instruments 13929 Assets pledged and collateral 16330 Litigation 16331 Subsidiary guarantee information 165
87Condensed consolidated financial statements – unaudited
1 1
KPMG AG, Badenerstrasse 172, PO Box, CH-8036 Zurich KPMG AG is a subsidiary of KPMG Holding AG, which is a member of the KPMG network of independent firms affiliated with KPMG International Cooperative (“KPMG International”), a Swiss legal entity. All rights reserved.
Report of Independent Registered Public Accounting Firm To the Board of Directors of Credit Suisse Group AG, Zurich _____________________________________________________________________________
We have reviewed the accompanying condensed consolidated balance sheet of Credit Suisse Group AG and subsidiaries (“the Group”) as of September 30, 2017, the related condensed consolidated statements of operations, comprehensive income, and changes in equity for the three and nine-month periods ended September 30, 2017 and 2016, and the related condensed consolidated statements of cash flows for the nine-month periods ended September 30, 2017 and 2016. These condensed consolidated financial statements are the responsibility of the Group’s management.
We conducted our reviews in accordance with the standards of the Public Company Accounting Oversight Board (United States). A review of interim financial information consists principally of applying analytical procedures and making inquiries of persons responsible for financial and accounting matters. It is substantially less in scope than an audit conducted in accordance with the standards of the Public Company Accounting Oversight Board (United States), the objective of which is the expression of an opinion regarding the financial statements taken as a whole. Accordingly, we do not express such an opinion.
Based on our reviews, we are not aware of any material modifications that should be made to the condensed consolidated financial statements referred to above for them to be in conformity with U.S. generally accepted accounting principles.
We have previously audited, in accordance with standards of the Public Company Accounting Oversight Board (United States), the consolidated balance sheet of the Group as of December 31, 2016, and the related consolidated statements of operations, comprehensive income, changes in equity, and cash flows for the year then ended (not presented herein); and in our report dated March 24, 2017, we expressed an unqualified opinion on those consolidated financial statements. In our opinion, the information set forth in the accompanying condensed consolidated balance sheet as of December 31, 2016, is fairly stated, in all material respects, in relation to the consolidated balance sheet from which it has been derived.
KPMG AG
Nicholas Edmonds Anthony Anzevino Licensed Audit Expert Global Lead Partner
Zurich, Switzerland November 2, 2017

88 Condensed consolidated financial statements – unaudited
[this page intentionally left blank]

89Condensed consolidated financial statements – unaudited
Condensed consolidated financial statements – unaudited Consolidated statements of operations (unaudited)in 3Q17 2Q17 3Q16 9M17 9M16
Consolidated statements of operations (CHF million)
Interest and dividend income 4,273 4,602 4,222 12,917 13,564
Interest expense (2,651) (2,865) (2,292) (7,925) (7,624)
Net interest income 1,622 1,737 1,930 4,992 5,940
Commissions and fees 2,762 2,905 2,680 8,713 8,151
Trading revenues 320 237 232 1,131 55
Other revenues 268 326 554 875 996
Net revenues 4,972 5,205 5,396 15,711 15,142
Provision for credit losses 32 82 55 167 177
Compensation and benefits 2,451 2,542 2,674 7,651 7,890
General and administrative expenses 1,630 1,580 1,978 4,858 5,586
Commission expenses 347 350 322 1,065 1,061
Restructuring expenses 112 69 145 318 491
Total other operating expenses 2,089 1,999 2,445 6,241 7,138
Total operating expenses 4,540 4,541 5,119 13,892 15,028
Income/(loss) before taxes 400 582 222 1,652 (63)
Income tax expense 153 276 185 507 27
Net income/(loss) 247 306 37 1,145 (90)
Net income/(loss) attributable to noncontrolling interests 3 3 (4) 2 1
Net income/(loss) attributable to shareholders 244 303 41 1,143 (91)
Earnings/(loss) per share (CHF)
Basic earnings/(loss) per share 0.10 0.13 0.02 0.48 (0.04)
Diluted earnings/(loss) per share 0.09 0.13 0.02 0.47 (0.04)
Consolidated statements of comprehensive income (unaudited)in 3Q17 2Q17 3Q16 9M17 9M16
Comprehensive income/(loss) (CHF million)
Net income/(loss) 247 306 37 1,145 (90)
Gains/(losses) on cash flow hedges (5) 10 (32) 1 34
Foreign currency translation 353 (1,101) (221) (1,248) (731)
Unrealized gains/(losses) on securities 0 (5) (1) (7) 6
Actuarial gains/(losses) 68 82 95 253 282
Net prior service credit/(cost) (27) (28) (24) (94) (77)
Gains/(losses) on liabilities related to credit risk (352) (630) (852) (1,495) 345
Other comprehensive income/(loss), net of tax 37 (1,672) (1,035) (2,590) (141)
Comprehensive income/(loss) 284 (1,366) (998) (1,445) (231)
Comprehensive income/(loss) attributable to noncontrolling interests 4 (3) (13) (7) (12)
Comprehensive income/(loss) attributable to shareholders 280 (1,363) (985) (1,438) (219)
The accompanying notes to the condensed consolidated financial statements – unaudited are an integral part of these statements.
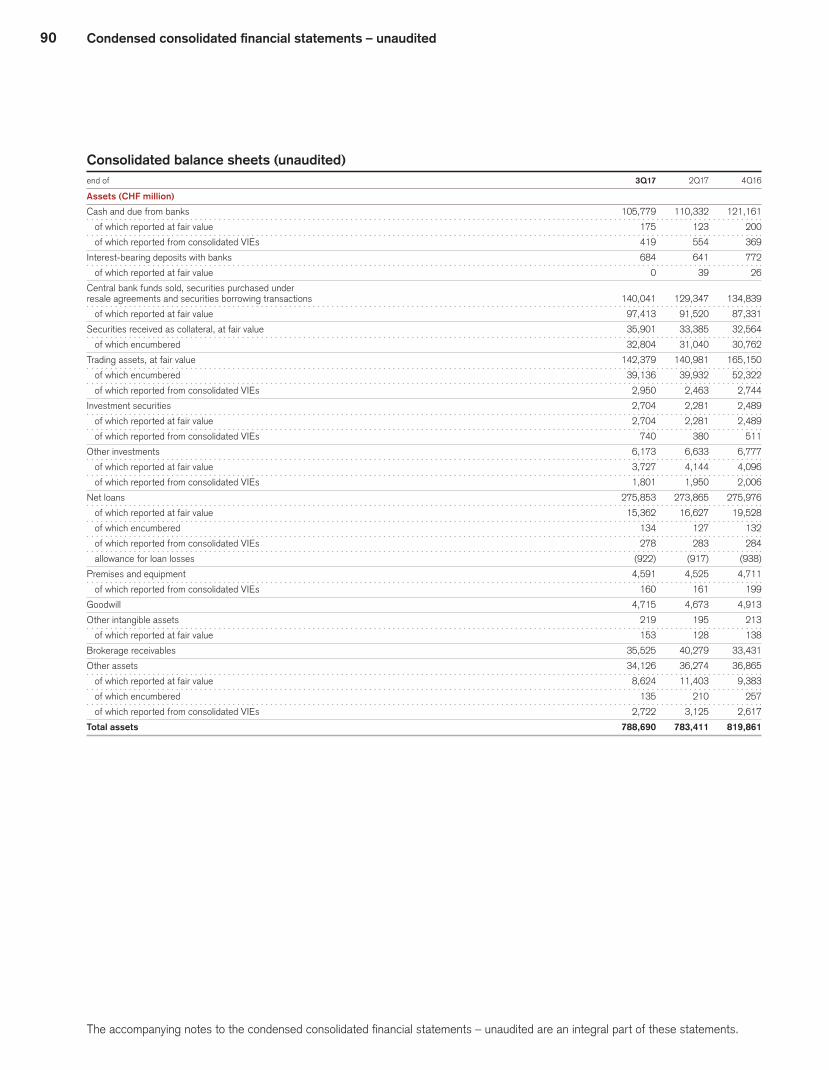
90 Condensed consolidated financial statements – unaudited
Consolidated balance sheets (unaudited)end of 3Q17 2Q17 4Q16
Assets (CHF million)
Cash and due from banks 105,779 110,332 121,161
of which reported at fair value 175 123 200
of which reported from consolidated VIEs 419 554 369
Interest-bearing deposits with banks 684 641 772
of which reported at fair value 0 39 26
Central bank funds sold, securities purchased under
resale agreements and securities borrowing transactions 140,041 129,347 134,839
of which reported at fair value 97,413 91,520 87,331
Securities received as collateral, at fair value 35,901 33,385 32,564
of which encumbered 32,804 31,040 30,762
Trading assets, at fair value 142,379 140,981 165,150
of which encumbered 39,136 39,932 52,322
of which reported from consolidated VIEs 2,950 2,463 2,744
Investment securities 2,704 2,281 2,489
of which reported at fair value 2,704 2,281 2,489
of which reported from consolidated VIEs 740 380 511
Other investments 6,173 6,633 6,777
of which reported at fair value 3,727 4,144 4,096
of which reported from consolidated VIEs 1,801 1,950 2,006
Net loans 275,853 273,865 275,976
of which reported at fair value 15,362 16,627 19,528
of which encumbered 134 127 132
of which reported from consolidated VIEs 278 283 284
allowance for loan losses (922) (917) (938)
Premises and equipment 4,591 4,525 4,711
of which reported from consolidated VIEs 160 161 199
Goodwill 4,715 4,673 4,913
Other intangible assets 219 195 213
of which reported at fair value 153 128 138
Brokerage receivables 35,525 40,279 33,431
Other assets 34,126 36,274 36,865
of which reported at fair value 8,624 11,403 9,383
of which encumbered 135 210 257
of which reported from consolidated VIEs 2,722 3,125 2,617
Total assets 788,690 783,411 819,861
The accompanying notes to the condensed consolidated financial statements – unaudited are an integral part of these statements.
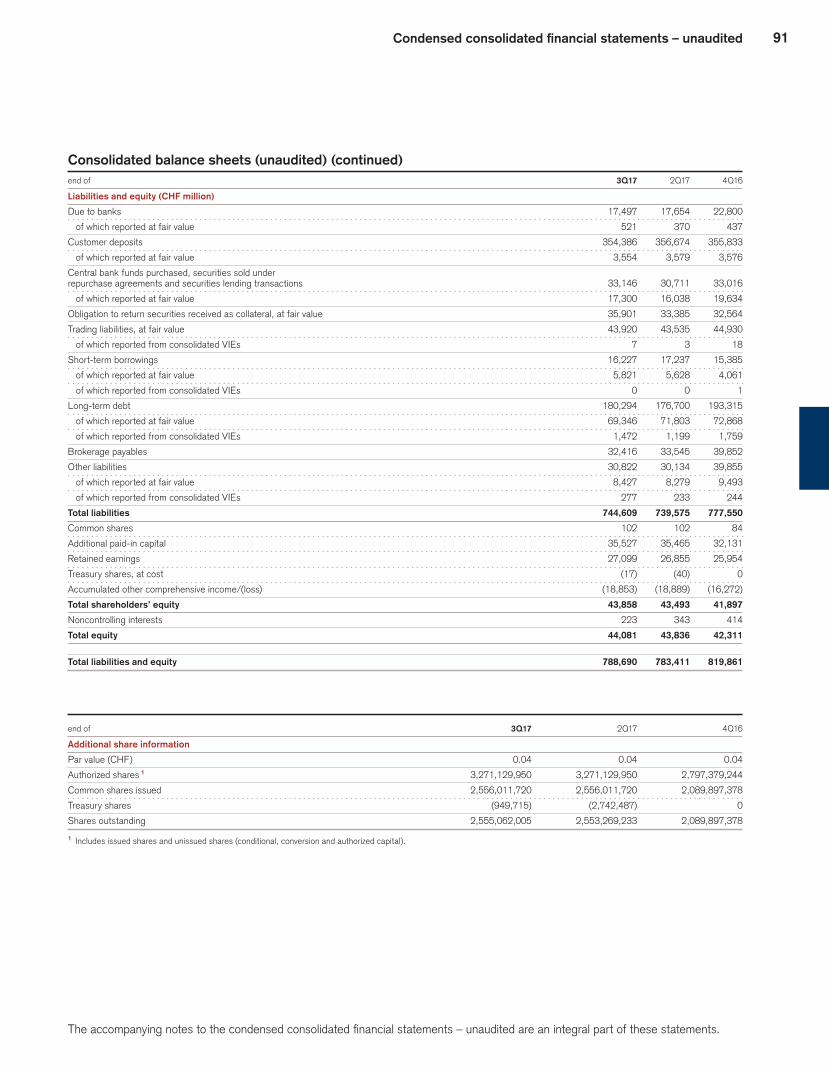
91Condensed consolidated financial statements – unaudited
Consolidated balance sheets (unaudited) (continued)end of 3Q17 2Q17 4Q16
Liabilities and equity (CHF million)
Due to banks 17,497 17,654 22,800
of which reported at fair value 521 370 437
Customer deposits 354,386 356,674 355,833
of which reported at fair value 3,554 3,579 3,576
Central bank funds purchased, securities sold under
repurchase agreements and securities lending transactions 33,146 30,711 33,016
of which reported at fair value 17,300 16,038 19,634
Obligation to return securities received as collateral, at fair value 35,901 33,385 32,564
Trading liabilities, at fair value 43,920 43,535 44,930
of which reported from consolidated VIEs 7 3 18
Short-term borrowings 16,227 17,237 15,385
of which reported at fair value 5,821 5,628 4,061
of which reported from consolidated VIEs 0 0 1
Long-term debt 180,294 176,700 193,315
of which reported at fair value 69,346 71,803 72,868
of which reported from consolidated VIEs 1,472 1,199 1,759
Brokerage payables 32,416 33,545 39,852
Other liabilities 30,822 30,134 39,855
of which reported at fair value 8,427 8,279 9,493
of which reported from consolidated VIEs 277 233 244
Total liabilities 744,609 739,575 777,550
Common shares 102 102 84
Additional paid-in capital 35,527 35,465 32,131
Retained earnings 27,099 26,855 25,954
Treasury shares, at cost (17) (40) 0
Accumulated other comprehensive income/(loss) (18,853) (18,889) (16,272)
Total shareholders’ equity 43,858 43,493 41,897
Noncontrolling interests 223 343 414
Total equity 44,081 43,836 42,311
Total liabilities and equity 788,690 783,411 819,861
end of 3Q17 2Q17 4Q16
Additional share information
Par value (CHF) 0.04 0.04 0.04
Authorized shares 1 3,271,129,950 3,271,129,950 2,797,379,244
Common shares issued 2,556,011,720 2,556,011,720 2,089,897,378
Treasury shares (949,715) (2,742,487) 0
Shares outstanding 2,555,062,005 2,553,269,233 2,089,897,378
1 Includes issued shares and unissued shares (conditional, conversion and authorized capital).
The accompanying notes to the condensed consolidated financial statements – unaudited are an integral part of these statements.

92 Condensed consolidated financial statements – unaudited
Consolidated statements of changes in equity (unaudited) Attributable to shareholders
Accumu- lated other compre- Total Additional Treasury hensive share- Non- Common paid-in Retained shares, income/ holders’ controlling Total shares capital earnings at cost (loss) equity interests equity
3Q17 (CHF million)
Balance at beginning of period 102 35,465 26,855 (40) (18,889) 43,493 343 43,836
Purchase of subsidiary shares from non-
controlling interests, not changing ownership 1, 2 – – – – – – (26) (26)
Sale of subsidiary shares to noncontrolling
interests, not changing ownership 2 – – – – – – 25 25
Net income/(loss) – – 244 – – 244 3 247
Total other comprehensive income/(loss), net of tax – – – – 36 36 1 37
Sale of treasury shares – 5 – 3,298 – 3,303 – 3,303
Repurchase of treasury shares – – – (3,319) – (3,319) – (3,319)
Share-based compensation, net of tax – 154 – 44 – 198 – 198
Financial instruments indexed to own shares 3 – (97) – – – (97) – (97)
Dividends paid – – – – – – (1) (1)
Change in scope of consolidation, net – – – – – – (122) (122)
Balance at end of period 102 35,527 27,099 (17) (18,853) 43,858 223 44,081
1 Distributions to owners in funds include the return of original capital invested and any related dividends.2 Transactions with and without ownership changes related to fund activity are all displayed under “not changing ownership”.3 Includes certain call options the Group purchased on its own shares to economically hedge share-based compensation awards. In accordance with US GAAP, these call options were des-
ignated as equity instruments and, as such, were initially recognized in shareholders’ equity at their fair values and not subsequently remeasured.
The accompanying notes to the condensed consolidated financial statements – unaudited are an integral part of these statements.

93Condensed consolidated financial statements – unaudited
Consolidated statements of changes in equity (unaudited) (continued) Attributable to shareholders
Accumu- lated other compre- Total Additional Treasury hensive share- Non- Common paid-in Retained shares, income/ holders’ controlling Total shares capital earnings at cost (loss) equity interests equity
2Q17 (CHF million)
Balance at beginning of period 84 32,388 26,552 (99) (17,223) 41,702 377 42,079
Purchase of subsidiary shares from non-
controlling interests, not changing ownership – – – – – – (30) (30)
Sale of subsidiary shares to noncontrolling
interests, not changing ownership – – – – – – 12 12
Net income/(loss) – – 303 – – 303 3 306
Total other comprehensive income/(loss), net of tax – – – – (1,666) (1,666) (6) (1,672)
Issuance of common shares 18 5,195 – – – 5,213 – 5,213
Sale of treasury shares – 10 – 3,302 – 3,312 – 3,312
Repurchase of treasury shares – – – (3,789) – (3,789) – (3,789)
Share-based compensation, net of tax – (617) – 546 – (71) – (71)
Financial instruments indexed to own shares – 203 – – – 203 – 203
Dividends paid – (1,546) – – – (1,546) – (1,546)
Change in scope of consolidation, net – – – – – – (8) (8)
Other – (168) – – – (168) (5) (173)
Balance at end of period 102 35,465 26,855 (40) (18,889) 43,493 343 43,836
3Q16 (CHF million)
Balance at beginning of period 84 31,702 28,532 (94) (15,262) 44,962 367 45,329
Purchase of subsidiary shares from non-
controlling interests, not changing ownership – – – – – – (2) (2)
Sale of subsidiary shares to noncontrolling
interests, not changing ownership – – – – – – 15 15
Net income/(loss) – – 41 – – 41 (4) 37
Total other comprehensive income/(loss), net of tax – – – – (1,026) (1,026) (9) (1,035)
Sale of treasury shares – 19 – 4,091 – 4,110 – 4,110
Repurchase of treasury shares – – – (4,031) – (4,031) – (4,031)
Share-based compensation, net of tax – 241 – 16 – 257 – 257
Financial instruments indexed to own shares – (37) – – – (37) – (37)
Change in scope of consolidation, net – – – – – – 114 114
Balance at end of period 84 31,925 28,573 (18) (16,288) 44,276 481 44,757
The accompanying notes to the condensed consolidated financial statements – unaudited are an integral part of these statements.
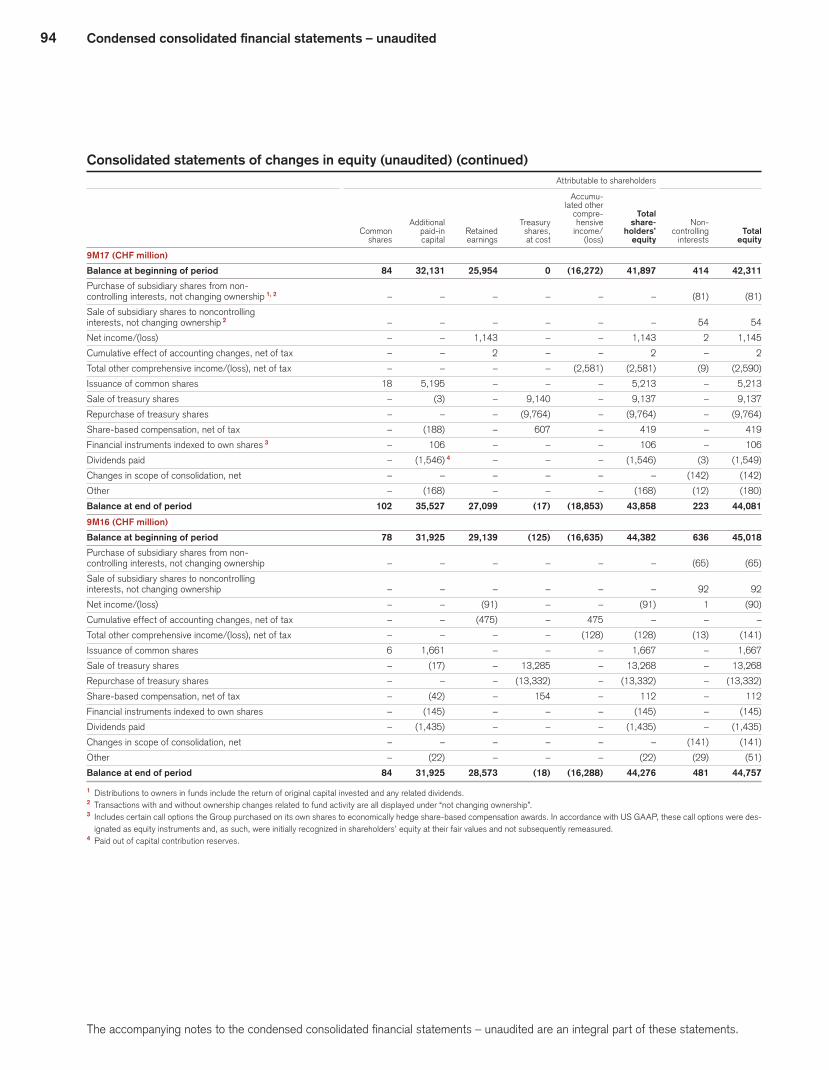
94 Condensed consolidated financial statements – unaudited
Consolidated statements of changes in equity (unaudited) (continued) Attributable to shareholders
Accumu- lated other compre- Total Additional Treasury hensive share- Non- Common paid-in Retained shares, income/ holders’ controlling Total shares capital earnings at cost (loss) equity interests equity
9M17 (CHF million)
Balance at beginning of period 84 32,131 25,954 0 (16,272) 41,897 414 42,311
Purchase of subsidiary shares from non-
controlling interests, not changing ownership 1, 2 – – – – – – (81) (81)
Sale of subsidiary shares to noncontrolling
interests, not changing ownership 2 – – – – – – 54 54
Net income/(loss) – – 1,143 – – 1,143 2 1,145
Cumulative effect of accounting changes, net of tax – – 2 – – 2 – 2
Total other comprehensive income/(loss), net of tax – – – – (2,581) (2,581) (9) (2,590)
Issuance of common shares 18 5,195 – – – 5,213 – 5,213
Sale of treasury shares – (3) – 9,140 – 9,137 – 9,137
Repurchase of treasury shares – – – (9,764) – (9,764) – (9,764)
Share-based compensation, net of tax – (188) – 607 – 419 – 419
Financial instruments indexed to own shares 3 – 106 – – – 106 – 106
Dividends paid – (1,546) 4 – – – (1,546) (3) (1,549)
Changes in scope of consolidation, net – – – – – – (142) (142)
Other – (168) – – – (168) (12) (180)
Balance at end of period 102 35,527 27,099 (17) (18,853) 43,858 223 44,081
9M16 (CHF million)
Balance at beginning of period 78 31,925 29,139 (125) (16,635) 44,382 636 45,018
Purchase of subsidiary shares from non-
controlling interests, not changing ownership – – – – – – (65) (65)
Sale of subsidiary shares to noncontrolling
interests, not changing ownership – – – – – – 92 92
Net income/(loss) – – (91) – – (91) 1 (90)
Cumulative effect of accounting changes, net of tax – – (475) – 475 – – –
Total other comprehensive income/(loss), net of tax – – – – (128) (128) (13) (141)
Issuance of common shares 6 1,661 – – – 1,667 – 1,667
Sale of treasury shares – (17) – 13,285 – 13,268 – 13,268
Repurchase of treasury shares – – – (13,332) – (13,332) – (13,332)
Share-based compensation, net of tax – (42) – 154 – 112 – 112
Financial instruments indexed to own shares – (145) – – – (145) – (145)
Dividends paid – (1,435) – – – (1,435) – (1,435)
Changes in scope of consolidation, net – – – – – – (141) (141)
Other – (22) – – – (22) (29) (51)
Balance at end of period 84 31,925 28,573 (18) (16,288) 44,276 481 44,757
1 Distributions to owners in funds include the return of original capital invested and any related dividends.2 Transactions with and without ownership changes related to fund activity are all displayed under “not changing ownership”.3 Includes certain call options the Group purchased on its own shares to economically hedge share-based compensation awards. In accordance with US GAAP, these call options were des-
ignated as equity instruments and, as such, were initially recognized in shareholders’ equity at their fair values and not subsequently remeasured.4 Paid out of capital contribution reserves.
The accompanying notes to the condensed consolidated financial statements – unaudited are an integral part of these statements.
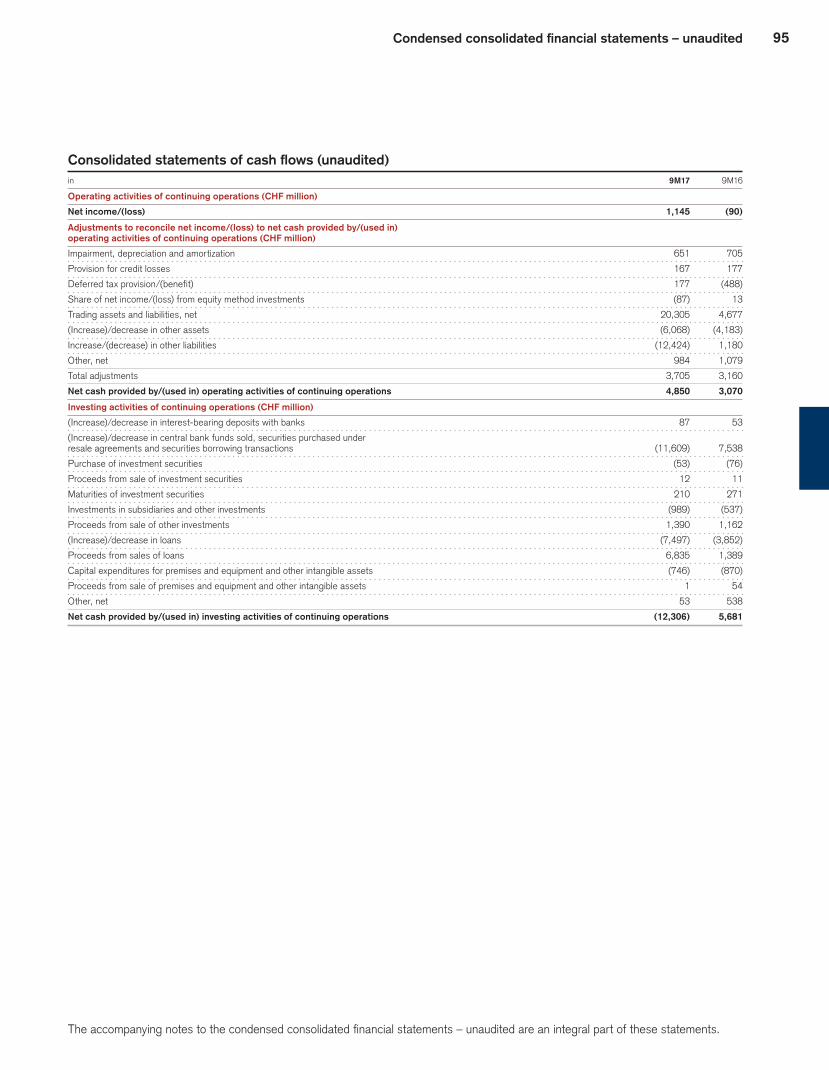
95Condensed consolidated financial statements – unaudited
Consolidated statements of cash flows (unaudited)in 9M17 9M16
Operating activities of continuing operations (CHF million)
Net income/(loss) 1,145 (90)
Adjustments to reconcile net income/(loss) to net cash provided by/(used in)
operating activities of continuing operations (CHF million)
Impairment, depreciation and amortization 651 705
Provision for credit losses 167 177
Deferred tax provision/(benefit) 177 (488)
Share of net income/(loss) from equity method investments (87) 13
Trading assets and liabilities, net 20,305 4,677
(Increase)/decrease in other assets (6,068) (4,183)
Increase/(decrease) in other liabilities (12,424) 1,180
Other, net 984 1,079
Total adjustments 3,705 3,160
Net cash provided by/(used in) operating activities of continuing operations 4,850 3,070
Investing activities of continuing operations (CHF million)
(Increase)/decrease in interest-bearing deposits with banks 87 53
(Increase)/decrease in central bank funds sold, securities purchased under
resale agreements and securities borrowing transactions (11,609) 7,538
Purchase of investment securities (53) (76)
Proceeds from sale of investment securities 12 11
Maturities of investment securities 210 271
Investments in subsidiaries and other investments (989) (537)
Proceeds from sale of other investments 1,390 1,162
(Increase)/decrease in loans (7,497) (3,852)
Proceeds from sales of loans 6,835 1,389
Capital expenditures for premises and equipment and other intangible assets (746) (870)
Proceeds from sale of premises and equipment and other intangible assets 1 54
Other, net 53 538
Net cash provided by/(used in) investing activities of continuing operations (12,306) 5,681
The accompanying notes to the condensed consolidated financial statements – unaudited are an integral part of these statements.
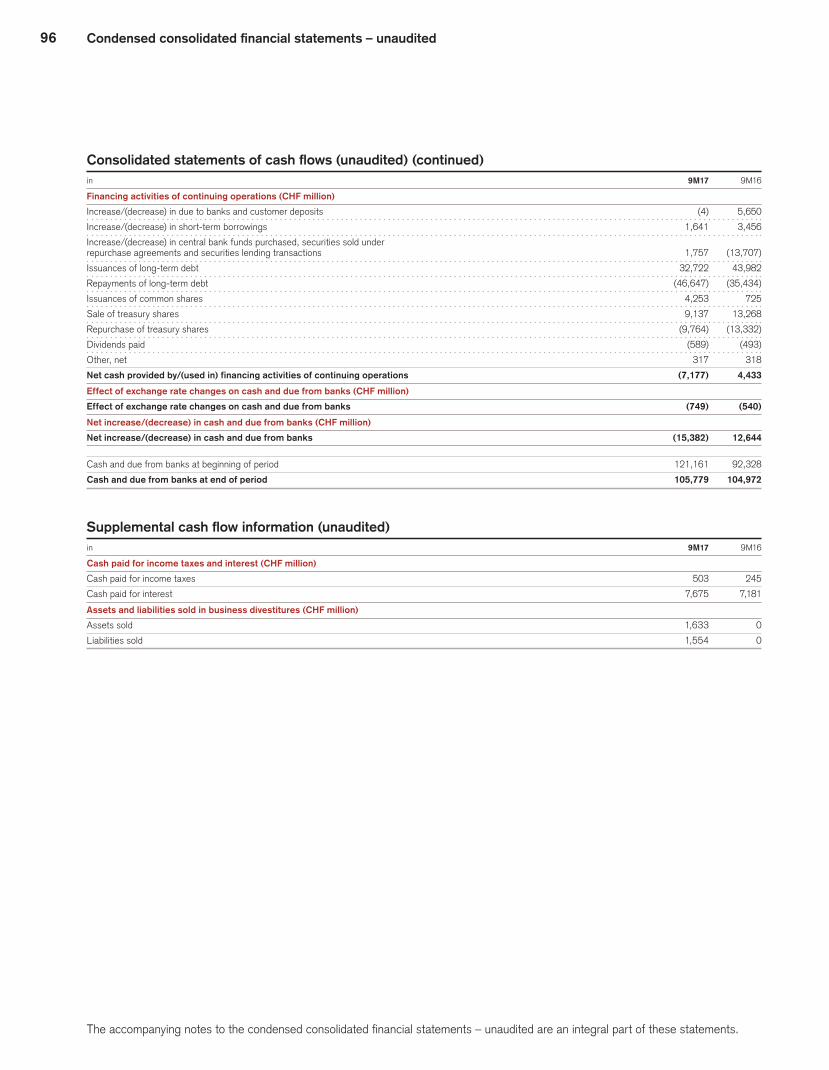
96 Condensed consolidated financial statements – unaudited
Consolidated statements of cash flows (unaudited) (continued)in 9M17 9M16
Financing activities of continuing operations (CHF million)
Increase/(decrease) in due to banks and customer deposits (4) 5,650
Increase/(decrease) in short-term borrowings 1,641 3,456
Increase/(decrease) in central bank funds purchased, securities sold under
repurchase agreements and securities lending transactions 1,757 (13,707)
Issuances of long-term debt 32,722 43,982
Repayments of long-term debt (46,647) (35,434)
Issuances of common shares 4,253 725
Sale of treasury shares 9,137 13,268
Repurchase of treasury shares (9,764) (13,332)
Dividends paid (589) (493)
Other, net 317 318
Net cash provided by/(used in) financing activities of continuing operations (7,177) 4,433
Effect of exchange rate changes on cash and due from banks (CHF million)
Effect of exchange rate changes on cash and due from banks (749) (540)
Net increase/(decrease) in cash and due from banks (CHF million)
Net increase/(decrease) in cash and due from banks (15,382) 12,644
Cash and due from banks at beginning of period 121,161 92,328
Cash and due from banks at end of period 105,779 104,972
Supplemental cash flow information (unaudited)in 9M17 9M16
Cash paid for income taxes and interest (CHF million)
Cash paid for income taxes 503 245
Cash paid for interest 7,675 7,181
Assets and liabilities sold in business divestitures (CHF million)
Assets sold 1,633 0
Liabilities sold 1,554 0
The accompanying notes to the condensed consolidated financial statements – unaudited are an integral part of these statements.
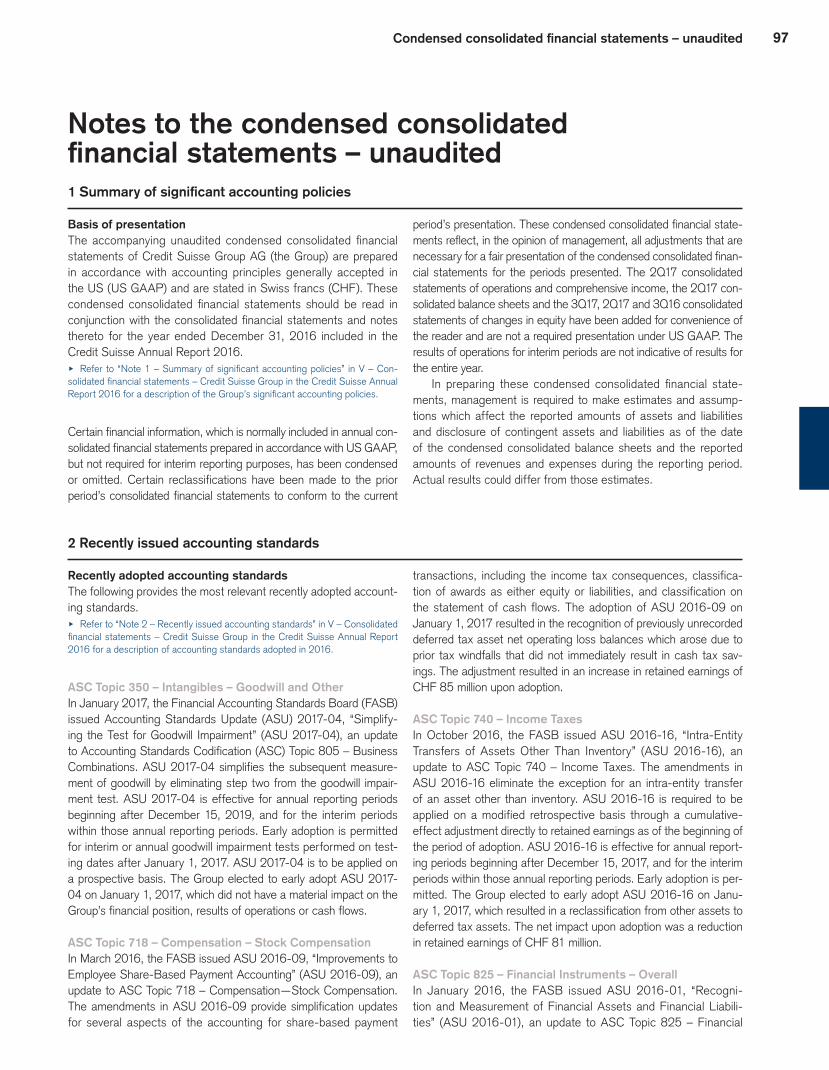
97Condensed consolidated financial statements – unaudited
Notes to the condensed consolidated financial statements – unaudited1 Summary of significant accounting policies
Basis of presentationThe accompanying unaudited condensed consolidated financial statements of Credit Suisse Group AG (the Group) are prepared in accordance with accounting principles generally accepted in the US (US GAAP) and are stated in Swiss francs (CHF). These condensed consolidated financial statements should be read in conjunction with the consolidated financial statements and notes thereto for the year ended December 31, 2016 included in the Credit Suisse Annual Report 2016.u Refer to “Note 1 – Summary of significant accounting policies” in V – Con-solidated financial statements – Credit Suisse Group in the Credit Suisse Annual Report 2016 for a description of the Group’s significant accounting policies.
Certain financial information, which is normally included in annual con-solidated financial statements prepared in accordance with US GAAP, but not required for interim reporting purposes, has been condensed or omitted. Certain reclassifications have been made to the prior period’s consolidated financial statements to conform to the current
period’s presentation. These condensed consolidated financial state-ments reflect, in the opinion of management, all adjustments that are necessary for a fair presentation of the condensed consolidated finan-cial statements for the periods presented. The 2Q17 consolidated statements of operations and comprehensive income, the 2Q17 con-solidated balance sheets and the 3Q17, 2Q17 and 3Q16 consolidated statements of changes in equity have been added for convenience of the reader and are not a required presentation under US GAAP. The results of operations for interim periods are not indicative of results for the entire year.
In preparing these condensed consolidated financial state-ments, management is required to make estimates and assump-tions which affect the reported amounts of assets and liabilities and disclosure of contingent assets and liabilities as of the date of the condensed consolidated balance sheets and the reported amounts of revenues and expenses during the reporting period. Actual results could differ from those estimates.
2 Recently issued accounting standards
Recently adopted accounting standardsThe following provides the most relevant recently adopted account-ing standards.u Refer to “Note 2 – Recently issued accounting standards” in V – Consolidated financial statements – Credit Suisse Group in the Credit Suisse Annual Report 2016 for a description of accounting standards adopted in 2016.
ASC Topic 350 – Intangibles – Goodwill and OtherIn January 2017, the Financial Accounting Standards Board (FASB) issued Accounting Standards Update (ASU) 2017-04, “Simplify-ing the Test for Goodwill Impairment” (ASU 2017-04), an update to Accounting Standards Codification (ASC) Topic 805 – Business Combinations. ASU 2017-04 simplifies the subsequent measure-ment of goodwill by eliminating step two from the goodwill impair-ment test. ASU 2017-04 is effective for annual reporting periods beginning after December 15, 2019, and for the interim periods within those annual reporting periods. Early adoption is permitted for interim or annual goodwill impairment tests performed on test-ing dates after January 1, 2017. ASU 2017-04 is to be applied on a prospective basis. The Group elected to early adopt ASU 2017-04 on January 1, 2017, which did not have a material impact on the Group’s financial position, results of operations or cash flows.
ASC Topic 718 – Compensation – Stock CompensationIn March 2016, the FASB issued ASU 2016-09, “Improvements to Employee Share-Based Payment Accounting” (ASU 2016-09), an update to ASC Topic 718 – Compensation—Stock Compensation. The amendments in ASU 2016-09 provide simplification updates for several aspects of the accounting for share-based payment
transactions, including the income tax consequences, classifica-tion of awards as either equity or liabilities, and classification on the statement of cash flows. The adoption of ASU 2016-09 on January 1, 2017 resulted in the recognition of previously unrecorded deferred tax asset net operating loss balances which arose due to prior tax windfalls that did not immediately result in cash tax sav-ings. The adjustment resulted in an increase in retained earnings of CHF 85 million upon adoption.
ASC Topic 740 – Income TaxesIn October 2016, the FASB issued ASU 2016-16, “Intra-Entity Transfers of Assets Other Than Inventory” (ASU 2016-16), an update to ASC Topic 740 – Income Taxes. The amendments in ASU 2016-16 eliminate the exception for an intra-entity transfer of an asset other than inventory. ASU 2016-16 is required to be applied on a modified retrospective basis through a cumulative-effect adjustment directly to retained earnings as of the beginning of the period of adoption. ASU 2016-16 is effective for annual report-ing periods beginning after December 15, 2017, and for the interim periods within those annual reporting periods. Early adoption is per-mitted. The Group elected to early adopt ASU 2016-16 on Janu-ary 1, 2017, which resulted in a reclassification from other assets to deferred tax assets. The net impact upon adoption was a reduction in retained earnings of CHF 81 million.
ASC Topic 825 – Financial Instruments – OverallIn January 2016, the FASB issued ASU 2016-01, “Recogni-tion and Measurement of Financial Assets and Financial Liabili-ties” (ASU 2016-01), an update to ASC Topic 825 – Financial

98 Condensed consolidated financial statements – unaudited
Instruments – Overall. The amendments in ASU 2016-01 address certain aspects of recognition, measurement, presentation and disclosure of financial instruments. The amendments primarily affect the accounting for equity investments, financial liabilities under the fair value option and the presentation and disclosure requirements for financial instruments. ASU 2016-01 is effective for annual reporting periods beginning after December 15, 2017, and for the interim periods within those annual reporting periods. Early adoption of the full standard is not permitted; however, cer-tain sections of ASU 2016-01 relating to fair value option-elected financial liabilities can be early adopted in isolation. These amend-ments to ASU 2016-01 require the changes in fair value relating to instrument-specific credit risk of fair value option elected financial liabilities to be presented separately in accumulated other com-prehensive income (AOCI). The Group has early adopted these sections of the update on January 1, 2016. As a result of adop-tion, a reclassification of a gain from retained earnings to AOCI of CHF 475 million, net of tax, was recorded. The Group is currently evaluating the impact of the adoption of the remaining sections of ASU 2016-01 on the Group’s financial position, results of opera-tions and cash flows.
Standards to be adopted in future periodsASC Topic 230 – Statement of Cash FlowsIn August 2016, the FASB issued ASU 2016-15, “Classification of Certain Cash Receipts and Cash Payments (a consensus of the Emerging Issues Task Force)” (ASU 2016-15), an update to ASC Topic 230 – Statement of Cash Flows. The amendments in ASU 2016-15 provide guidance regarding classification of certain cash receipts and payments where diversity in practice was observed. ASU 2016-15 is required to be applied retrospec-tively to all periods presented beginning in the year of adoption. ASU 2016-15 is effective for annual reporting periods beginning after December 15, 2017, and for the interim periods within those annual reporting periods. Early adoption is permitted, including adoption in an interim period. The Group is currently evaluating the impact of the adoption of ASU 2016-15 on the Group’s financial position, results of operations and cash flows.
ASC Topic 326 – Financial Instruments – Credit LossesIn June 2016, the FASB issued ASU 2016-13, “Measurement of Credit Losses on Financial Instruments” (ASU 2016-13), cre-ating ASC Topic 326 – Financial Instruments – Credit Losses. ASU 2016-13 is intended to improve financial reporting by requir-ing timelier recording of credit losses on financial assets measured at amortized cost basis (including, but not limited to loans), net investments in leases recognized as lessor and off-balance sheet credit exposures. ASU 2016-13 eliminates the probable initial rec-ognition threshold under the current incurred loss methodology for
recognizing credit losses. Instead, ASU 2016-13 requires the mea-surement of all expected credit losses for financial assets held at the reporting date based on historical experience, current conditions, and reasonable and supportable forecasts. The Group will incorpo-rate forward-looking information and macroeconomic factors into its credit loss estimates. ASU 2016-13 requires enhanced disclosures to help investors and other financial statement users to better under-stand significant estimates and judgments used in estimating credit losses, as well as the credit quality and underwriting standards of an organization’s portfolio. As the Group is a US Securities and Exchange Commission (SEC) filer, ASU 2016-13 is effective for annual reporting periods beginning after December 15, 2019, and for the interim periods within those annual reporting periods. Early application will be permitted for annual reporting periods and for the interim periods within those annual reporting periods, beginning after December 15, 2018.
The Group has established a cross-functional implementation team and governance structure for the project. The Group has decided on a current expected credit loss (CECL) methodology while it is adjusting for key interpretive issues. Furthermore, the Group will continue to monitor the initial scope assessment, as a basis to determine the requirements and data sourcing of the CECL models, and to design, build and test the models until the effective date.
The Group expects that the new CECL methodology would generally result in increased and more volatile allowance for loan losses. The main impact drivers include:p the remaining life of the loans measured at amortized cost and
the off-balance sheet credit exposures at the adoption date and subsequent reporting dates because of the new require-ment to measure lifetime expected credit losses;
p the point of time in the economic cycle at the adoption date and subsequent reporting dates because of the new require-ment to incorporate reasonable and supportable forward-look-ing information and macroeconomic factors; and
p the credit quality of the loans measured at amortized cost and the off-balance sheet credit exposures at the adoption date and subsequent reporting dates.
Upon adoption of the standard, the Group expects an adjustment to be posted to retained earnings for any changes in loan losses. As the implementation progresses, the Group will continue to evaluate the extent of the impact of the adoption of ASU 2016-13 on the Group’s financial position, results of operations and cash flows.
ASC Topic 606 – Revenue from Contracts with CustomersIn May 2014, the FASB issued ASU 2014-09, “Revenue from Contracts with Customers” (ASU 2014-09), an update to ASC Topic 606 – Revenue from Contracts with Customers. The
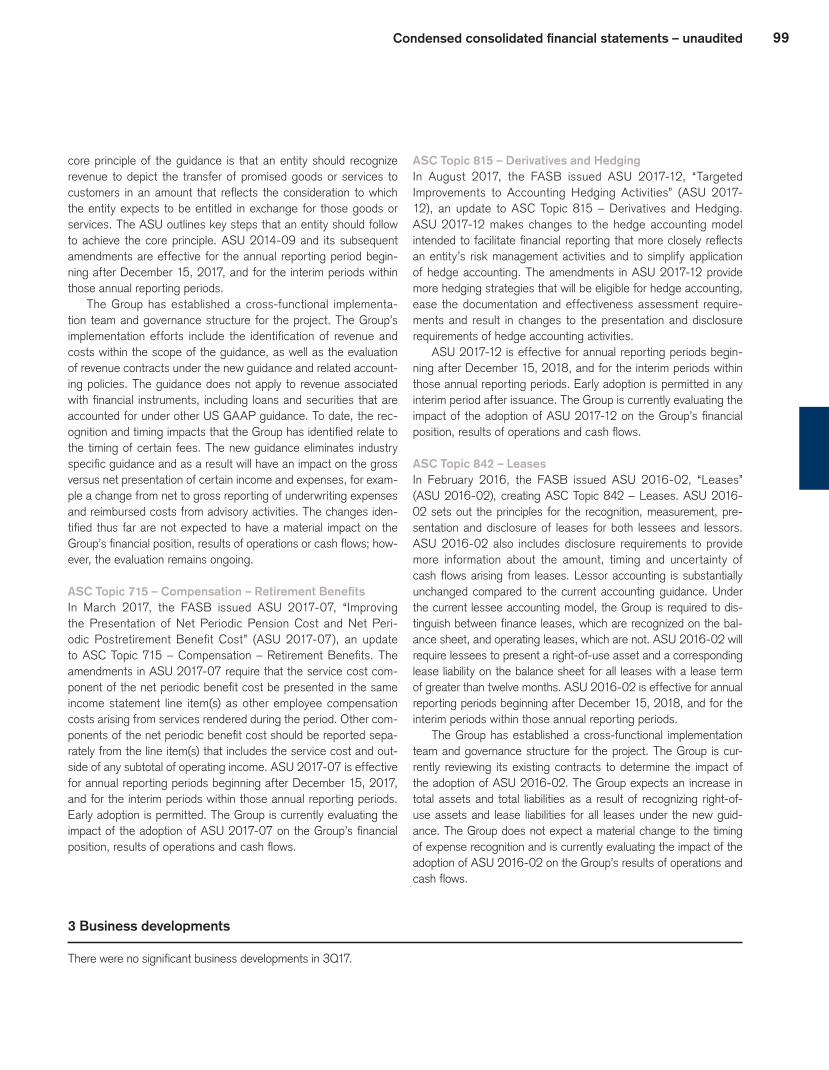
99Condensed consolidated financial statements – unaudited
core principle of the guidance is that an entity should recognize revenue to depict the transfer of promised goods or services to customers in an amount that reflects the consideration to which the entity expects to be entitled in exchange for those goods or services. The ASU outlines key steps that an entity should follow to achieve the core principle. ASU 2014-09 and its subsequent amendments are effective for the annual reporting period begin-ning after December 15, 2017, and for the interim periods within those annual reporting periods.
The Group has established a cross-functional implementa-tion team and governance structure for the project. The Group’s implementation efforts include the identification of revenue and costs within the scope of the guidance, as well as the evaluation of revenue contracts under the new guidance and related account-ing policies. The guidance does not apply to revenue associated with financial instruments, including loans and securities that are accounted for under other US GAAP guidance. To date, the rec-ognition and timing impacts that the Group has identified relate to the timing of certain fees. The new guidance eliminates industry specific guidance and as a result will have an impact on the gross versus net presentation of certain income and expenses, for exam-ple a change from net to gross reporting of underwriting expenses and reimbursed costs from advisory activities. The changes iden-tified thus far are not expected to have a material impact on the Group’s financial position, results of operations or cash flows; how-ever, the evaluation remains ongoing.
ASC Topic 715 – Compensation – Retirement BenefitsIn March 2017, the FASB issued ASU 2017-07, “Improving the Presentation of Net Periodic Pension Cost and Net Peri-odic Postretirement Benefit Cost” (ASU 2017-07), an update to ASC Topic 715 – Compensation – Retirement Benefits. The amendments in ASU 2017-07 require that the service cost com-ponent of the net periodic benefit cost be presented in the same income statement line item(s) as other employee compensation costs arising from services rendered during the period. Other com-ponents of the net periodic benefit cost should be reported sepa-rately from the line item(s) that includes the service cost and out-side of any subtotal of operating income. ASU 2017-07 is effective for annual reporting periods beginning after December 15, 2017, and for the interim periods within those annual reporting periods. Early adoption is permitted. The Group is currently evaluating the impact of the adoption of ASU 2017-07 on the Group’s financial position, results of operations and cash flows.
ASC Topic 815 – Derivatives and HedgingIn August 2017, the FASB issued ASU 2017-12, “Targeted Improvements to Accounting Hedging Activities” (ASU 2017-12), an update to ASC Topic 815 – Derivatives and Hedging. ASU 2017-12 makes changes to the hedge accounting model intended to facilitate financial reporting that more closely reflects an entity’s risk management activities and to simplify application of hedge accounting. The amendments in ASU 2017-12 provide more hedging strategies that will be eligible for hedge accounting, ease the documentation and effectiveness assessment require-ments and result in changes to the presentation and disclosure requirements of hedge accounting activities.
ASU 2017-12 is effective for annual reporting periods begin-ning after December 15, 2018, and for the interim periods within those annual reporting periods. Early adoption is permitted in any interim period after issuance. The Group is currently evaluating the impact of the adoption of ASU 2017-12 on the Group’s financial position, results of operations and cash flows.
ASC Topic 842 – LeasesIn February 2016, the FASB issued ASU 2016-02, “Leases” (ASU 2016-02), creating ASC Topic 842 – Leases. ASU 2016-02 sets out the principles for the recognition, measurement, pre-sentation and disclosure of leases for both lessees and lessors. ASU 2016-02 also includes disclosure requirements to provide more information about the amount, timing and uncertainty of cash flows arising from leases. Lessor accounting is substantially unchanged compared to the current accounting guidance. Under the current lessee accounting model, the Group is required to dis-tinguish between finance leases, which are recognized on the bal-ance sheet, and operating leases, which are not. ASU 2016-02 will require lessees to present a right-of-use asset and a corresponding lease liability on the balance sheet for all leases with a lease term of greater than twelve months. ASU 2016-02 is effective for annual reporting periods beginning after December 15, 2018, and for the interim periods within those annual reporting periods.
The Group has established a cross-functional implementation team and governance structure for the project. The Group is cur-rently reviewing its existing contracts to determine the impact of the adoption of ASU 2016-02. The Group expects an increase in total assets and total liabilities as a result of recognizing right-of-use assets and lease liabilities for all leases under the new guid-ance. The Group does not expect a material change to the timing of expense recognition and is currently evaluating the impact of the adoption of ASU 2016-02 on the Group’s results of operations and cash flows.
3 Business developments
There were no significant business developments in 3Q17.

100 Condensed consolidated financial statements – unaudited
4 Segment information
The Group is a global financial services company domiciled in Switzerland and serves its clients through three regionally focused divisions: Swiss Universal Bank, International Wealth Manage-ment and Asia Pacific. These regional businesses are supported by two other divisions specialized in investment banking capabili-ties: Global Markets and Investment Banking & Capital Markets. The Strategic Resolution Unit consolidates the remaining portfolios from the former non-strategic units plus additional businesses and
positions that do not fit with the strategic direction. The segment information reflects the Group’s six reportable segments and the Corporate Center, which are managed and reported on a pre-tax basis.u Refer to “Note 5 – Segment information” in V – Consolidated financial state-ments – Credit Suisse Group in the Credit Suisse Annual Report 2016 for further information on segment information, revenue sharing and cost allocation and funding.
Net revenues and income before taxes
in 3Q17 2Q17 3Q16 9M17 9M16
Net revenues (CHF million)
Swiss Universal Bank 1,319 1,405 1,667 4,078 4,360
International Wealth Management 1,262 1,264 1,081 3,747 3,399
Asia Pacific 890 848 917 2,619 2,735
Global Markets 1,262 1,517 1,357 4,388 4,232
Investment Banking & Capital Markets 457 511 467 1,574 1,398
Strategic Resolution Unit (255) (274) (165) (735) (1,069)
Corporate Center 37 (66) 72 40 87
Net revenues 4,972 5,205 5,396 15,711 15,142
Income/(loss) before taxes (CHF million)
Swiss Universal Bank 426 502 758 1,332 1,643
International Wealth Management 355 365 245 1,011 790
Asia Pacific 218 188 152 553 622
Global Markets 71 257 87 645 43
Investment Banking & Capital Markets 35 78 39 262 112
Strategic Resolution Unit (578) (563) (852) (1,680) (2,864)
Corporate Center (127) (245) (207) (471) (409)
Income/(loss) before taxes 400 582 222 1,652 (63)
Total assets
end of 3Q17 2Q17 4Q16
Total assets (CHF million)
Swiss Universal Bank 228,647 235,562 228,363
International Wealth Management 88,692 89,163 91,083
Asia Pacific 95,919 90,948 97,221
Global Markets 239,910 228,858 239,700
Investment Banking & Capital Markets 20,477 20,973 20,784
Strategic Resolution Unit 49,409 54,427 80,297
Corporate Center 65,636 63,480 62,413
Total assets 788,690 783,411 819,861

101Condensed consolidated financial statements – unaudited
5 Net interest income
in 3Q17 2Q17 3Q16 9M17 9M16
Net interest income (CHF million)
Loans 1,520 1,447 1,415 4,427 4,178
Investment securities 11 12 16 34 49
Trading assets 1,626 2,040 1,764 5,284 6,142
Central bank funds sold, securities purchased under
resale agreements and securities borrowing transactions 643 632 693 1,882 2,107
Other 473 471 334 1,290 1,088
Interest and dividend income 4,273 4,602 4,222 12,917 13,564
Deposits (348) (328) (255) (981) (757)
Short-term borrowings (43) (40) (18) (116) (56)
Trading liabilities (891) (1,178) (738) (2,857) (2,964)
Central bank funds purchased, securities sold under
repurchase agreements and securities lending transactions (319) (324) (363) (896) (1,116)
Long-term debt (933) (893) (871) (2,779) (2,583)
Other (117) (102) (47) (296) (148)
Interest expense (2,651) (2,865) (2,292) (7,925) (7,624)
Net interest income 1,622 1,737 1,930 4,992 5,940
6 Commissions and fees
in 3Q17 2Q17 3Q16 9M17 9M16
Commissions and fees (CHF million)
Lending business 421 484 495 1,369 1,345
Investment and portfolio management 866 841 777 2,529 2,366
Other securities business 11 12 11 33 36
Fiduciary business 877 853 788 2,562 2,402
Underwriting 356 441 371 1,294 988
Brokerage 712 757 682 2,274 2,272
Underwriting and brokerage 1,068 1,198 1,053 3,568 3,260
Other services 396 370 344 1,214 1,144
Commissions and fees 2,762 2,905 2,680 8,713 8,151
7 Trading revenues
in 3Q17 2Q17 3Q16 9M17 9M16
Trading revenues (CHF million)
Interest rate products 1,040 587 1,673 3,003 5,377
Foreign exchange products 350 703 300 1,587 (915)
Equity/index-related products (753) (953) (1,066) (2,624) (3,073)
Credit products (284) (143) (743) (865) (2,011)
Commodity and energy products 9 28 89 74 102
Other products (42) 15 (21) (44) 575
Trading revenues 320 237 232 1,131 55
Represents revenues on a product basis which are not representative of business results within segments, as segment results utilize financial instruments across various product types.
u Refer to “Note 8 – Trading revenues” in V – Consolidated financial statements – Credit Suisse Group in the Credit Suisse Annual Report 2016 for further infor-mation on trading revenues and managing trading risks.

102 Condensed consolidated financial statements – unaudited
8 Other revenues
in 3Q17 2Q17 3Q16 9M17 9M16
Other revenues (CHF million)
Noncontrolling interests without SEI (1) 0 0 (2) 1
Loans held-for-sale 5 1 (4) 5 (61)
Long-lived assets held-for-sale (5) (4) 340 (16) 364
Equity method investments 59 65 34 165 129
Other investments (46) 30 (4) 31 11
Other 256 234 188 692 552
Other revenues 268 326 554 875 996
9 Provision for credit losses
in 3Q17 2Q17 3Q16 9M17 9M16
Provision for credit losses (CHF million)
Provision for loan losses 8 70 62 144 175
Provision for lending-related and other exposures 24 12 (7) 23 2
Provision for credit losses 32 82 55 167 177
10 Compensation and benefits
in 3Q17 2Q17 3Q16 9M17 9M16
Compensation and benefits (CHF million)
Salaries and variable compensation 2,142 2,196 2,349 6,684 6,882
Social security 163 204 163 523 521
Other 1 146 142 162 444 487
Compensation and benefits 2,451 2,542 2,674 7,651 7,890
1 Includes pension and other post-retirement expense of CHF 60 million, CHF 53 million, CHF 84 million, CHF 177 million and CHF 243 million in 3Q17, 2Q17, 3Q16, 9M17 and 9M16, respectively.
11 General and administrative expenses
in 3Q17 2Q17 3Q16 9M17 9M16
General and administrative expenses (CHF million)
Occupancy expenses 256 246 252 745 742
IT, machinery, etc. 301 259 290 841 865
Provisions and losses 164 80 365 389 534
Travel and entertainment 75 80 74 238 245
Professional services 554 592 672 1,745 2,215
Amortization and impairment of other intangible assets 2 2 3 7 7
Other 278 321 322 893 978
General and administrative expenses 1,630 1,580 1,978 4,858 5,586

103Condensed consolidated financial statements – unaudited
12 Restructuring expenses
In connection with the strategic review of the Group, restructur-ing expenses of CHF 112 million, CHF 69 million, CHF 145 mil-lion, CHF 318 million and CHF 491 million were recognized in 3Q17, 2Q17, 3Q16, 9M17 and 9M16, respectively. Restructuring
expenses primarily include termination costs, expenses in connec-tion with the acceleration of certain deferred compensation awards and real estate contract termination costs.
Restructuring expenses by segment
in 3Q17 2Q17 3Q16 9M17 9M16
Restructuring expenses by segment (CHF million)
Swiss Universal Bank 13 (4) 19 61 63
International Wealth Management 16 7 15 59 38
Asia Pacific 10 11 23 40 34
Global Markets 27 32 52 79 202
Investment Banking & Capital Markets 16 10 15 28 34
Strategic Resolution Unit 21 11 21 39 120
Corporate Center 9 2 0 12 0
Total restructuring expenses 112 69 145 318 491
Restructuring expenses by type
in 3Q17 2Q17 3Q16 9M17 9M16
Restructuring expenses by type (CHF million)
Compensation and benefits-related expenses 99 50 123 278 355
of which severance expenses 59 24 65 145 181
of which accelerated deferred compensation 28 17 52 70 141
of which pension expenses 12 9 6 63 33
General and administrative-related expenses 13 19 22 40 136
Total restructuring expenses 112 69 145 318 491
Restructuring provision 3Q17 2Q17 3Q16
Compen- General and Compen- General and Compen- General and sation and administrative sation and administrative sation and administrative benefits expenses Total benefits expenses Total benefits expenses Total
Restructuring provision (CHF million)
Balance at beginning of period 181 83 264 220 89 309 189 110 299
Net additional charges 1 59 10 69 24 9 33 65 22 87
Utilization (50) (10) (60) (63) (15) (78) (38) (40) (78)
Balance at end of period 190 83 273 181 83 264 216 92 308
1 The following items for which expense accretion was accelerated in 3Q17, 2Q17 and 3Q16 due to the restructuring of the Group are not included in the restructuring provision: unsettled share-based compensation of CHF 22 million, CHF 12 million and CHF 42 million, respectively; unsettled pension obligations of CHF 12 million, CHF 9 million and CHF 6 million, respec-tively, which remain classified as a component of total shareholders’ equity; unsettled cash-based deferred compensation of CHF 6 million, CHF 5 million and CHF 10 million, respectively, which remain classified as compensation liabilities; and accelerated accumulated depreciation and impairment of CHF 3 million, CHF 10 million and CHF 0 million, respectively, which remain classified as premises and equipment. The settlement date for the unsettled share-based compensation remains unchanged at three years.

104 Condensed consolidated financial statements – unaudited
Restructuring provision (continued) 9M17 9M16
Compen- General and Compen- General and sation and administrative sation and administrative benefits expenses Total benefits expenses Total
Restructuring provision (CHF million)
Balance at beginning of period 217 94 311 187 12 199
Net additional charges 1 145 27 172 181 136 317
Utilization (172) (38) (210) (152) (56) (208)
Balance at end of period 190 83 273 216 92 308
1 The following items for which expense accretion was accelerated in 9M17 and 9M16 due to the restructuring of the Group are not included in the restructuring provision: unsettled share-based compensation of CHF 49 million and CHF 48 million, respectively; unsettled pension obligations of CHF 63 million and CHF 33 million, respectively, which remain classified as a component of total shareholders’ equity; unsettled cash-based deferred compensation of CHF 21 million and CHF 92 million, respectively, which remain classified as compensation liabili-ties; and accelerated accumulated depreciation and impairment of CHF 13 million and CHF 0 million, respectively, which remain classified as premises and equipment. The settlement date for the unsettled share-based compensation remains unchanged at three years.
13 Earnings per share
in 3Q17 2Q17 3Q16 9M17 9M16
Basic net income/(loss) attributable to shareholders (CHF million)
Net income/(loss) attributable to shareholders for basic earnings per share 244 303 41 1,143 (91)
Available for common shares 244 303 41 1,143 (94)
Available for unvested share-based payment awards 0 0 0 0 3
Diluted net income/(loss) attributable to shareholders (CHF million)
Net income/(loss) attributable to shareholders for basic earnings per share 244 303 41 1,143 (91)
Available for common shares 244 303 41 1,143 (94)
Available for unvested share-based payment awards 0 0 0 0 3
Weighted-average shares outstanding (million)
Weighted-average shares outstanding for basic
earnings per share available for common shares 2,565.5 2,309.6 2,181.0 2,363.1 2,119.0
Dilutive share options and warrants 1.8 4.2 2.8 3.2 0.0
Dilutive share awards 58.8 40.3 52.9 51.4 0.0
Weighted-average shares outstanding for diluted
earnings per share available for common shares 1 2,626.1 2,354.1 2,236.7 2,417.7 2,119.0 2
Weighted-average shares outstanding for basic/diluted earnings
per share available for unvested share-based payment awards 0.1 0.1 0.2 0.1 3.9
Earnings/(loss) per share available for common shares (CHF)
Basic earnings/(loss) per share available for common shares 0.10 0.13 0.02 0.48 (0.04)
Diluted earnings/(loss) per share available for common shares 0.09 0.13 0.02 0.47 (0.04)
Prior periods have been adjusted to reflect the increase in the number of shares outstanding as a result of the discount element in the 2017 rights issue and scrip dividend, as required under US GAAP.1 Weighted-average potential common shares relating to instruments that were not dilutive for the respective periods (and therefore not included in the diluted earnings per share calcula-
tion above) but could potentially dilute earnings per share in the future were 10.7 million, 10.4 million, 13.4 million, 9.6 million and 11.0 million for 3Q17, 2Q17, 3Q16, 9M17 and 9M16, respectively.
2 Due to the net loss in 9M16, 2.9 million of weighted-average share options and warrants outstanding and 49.9 million of weighted-average share awards outstanding were excluded from the diluted earnings per share calculation, as the effect would be antidilutive.
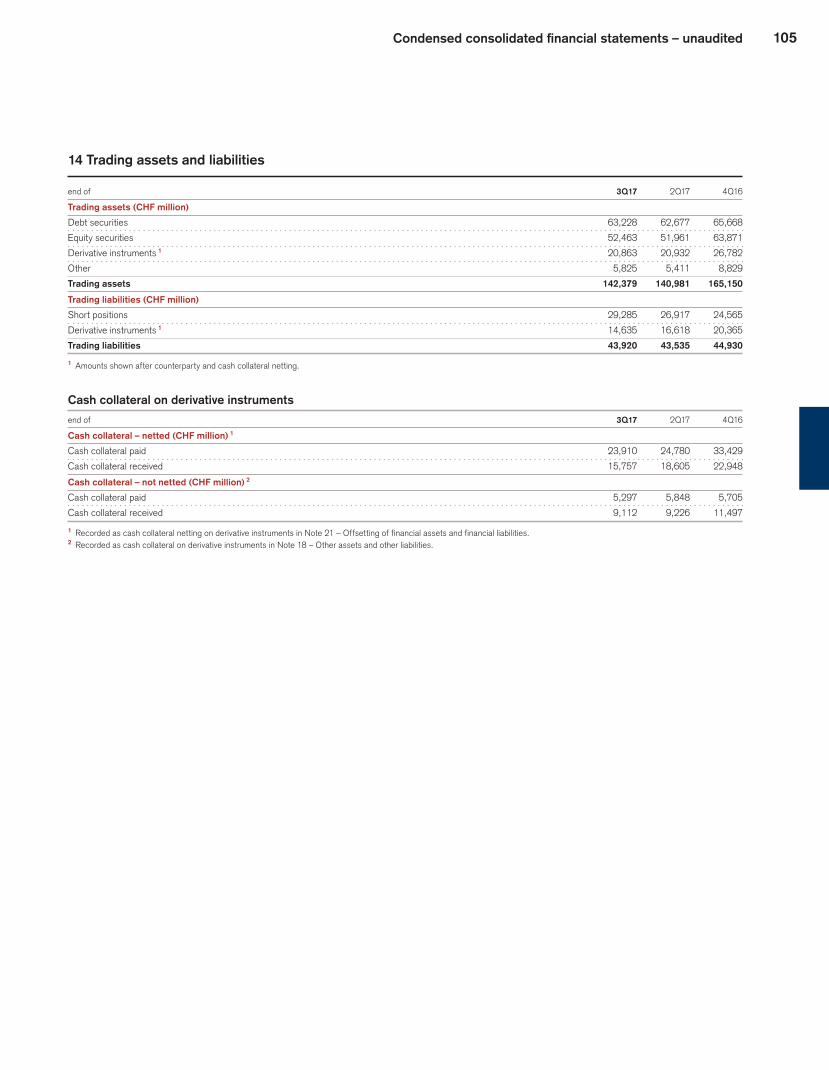
105Condensed consolidated financial statements – unaudited
14 Trading assets and liabilities
end of 3Q17 2Q17 4Q16
Trading assets (CHF million)
Debt securities 63,228 62,677 65,668
Equity securities 52,463 51,961 63,871
Derivative instruments 1 20,863 20,932 26,782
Other 5,825 5,411 8,829
Trading assets 142,379 140,981 165,150
Trading liabilities (CHF million)
Short positions 29,285 26,917 24,565
Derivative instruments 1 14,635 16,618 20,365
Trading liabilities 43,920 43,535 44,930
1 Amounts shown after counterparty and cash collateral netting.
Cash collateral on derivative instruments
end of 3Q17 2Q17 4Q16
Cash collateral – netted (CHF million) 1
Cash collateral paid 23,910 24,780 33,429
Cash collateral received 15,757 18,605 22,948
Cash collateral – not netted (CHF million) 2
Cash collateral paid 5,297 5,848 5,705
Cash collateral received 9,112 9,226 11,497
1 Recorded as cash collateral netting on derivative instruments in Note 21 – Offsetting of financial assets and financial liabilities.2 Recorded as cash collateral on derivative instruments in Note 18 – Other assets and other liabilities.

106 Condensed consolidated financial statements – unaudited
15 Investment securities
end of 3Q17 2Q17 4Q16
Investment securities (CHF million)
Securities available-for-sale 2,704 2,281 2,489
Total investment securities 2,704 2,281 2,489
Investment securities by type
end of 3Q17 4Q16
Gross Gross Gross Gross Amortized unrealized unrealized Fair Amortized unrealized unrealized Fair cost gains losses value cost gains losses value
Investment securities by type (CHF million)
Debt securities issued by Swiss federal,
cantonal or local governmental entities 199 14 0 213 241 18 0 259
Debt securities issued by foreign governments 1,371 24 0 1,395 1,309 34 0 1,343
Corporate debt securities 255 0 0 255 287 0 0 287
Residential mortgage-backed securities 1 738 0 0 738 497 0 0 497
Commercial mortgage-backed securities 2 0 0 2 14 0 0 14
Debt securities available-for-sale 2,565 38 0 2,603 2,348 52 0 2,400
Banks, trust and insurance companies 72 29 0 101 66 23 0 89
Equity securities available-for-sale 72 29 0 101 66 23 0 89
Securities available-for-sale 2,637 67 0 2,704 2,414 75 0 2,489
1 Relate to the consolidation of RMBS securitization VIEs where the assets are carried at fair value under the fair value option as are the VIEs’ liabilities recorded in long-term debt.
Proceeds from sales, realized gains and realized losses from available-for-sale securities
in 9M17 9M16
Debt Equity Debt Equity
securities securities securities securities
Additional information (CHF million)
Proceeds from sales 6 6 9 2
Amortized cost, fair value and average yield of debt securities Debt securities
available-for-sale
Average
Amortized Fair yield
end of cost value (in %)
3Q17 (CHF million, except where indicated)
Due within 1 year 817 822 0.61
Due from 1 to 5 years 923 948 0.99
Due from 5 to 10 years 77 83 0.96
Due after 10 years 748 750 1.66
Total debt securities 2,565 2,603 1.06

107Condensed consolidated financial statements – unaudited
16 Loans, allowance for loan losses and credit quality
u Refer to “Note 19 – Loans, allowance for loan losses and credit quality” in V – Consolidated financial statements – Credit Suisse Group in the Credit Suisse Annual Report 2016 for further information on loans, allowance for loan losses, credit quality, value of collateral and impaired loans.
Loans
end of 3Q17 2Q17 4Q16
Loans (CHF million)
Mortgages 105,889 105,433 104,335
Loans collateralized by securities 41,876 40,277 37,268
Consumer finance 3,847 4,025 3,490
Consumer 151,612 149,735 145,093
Real estate 26,422 26,144 26,016
Commercial and industrial loans 80,007 80,405 83,740
Financial institutions 14,829 14,575 17,921
Governments and public institutions 4,012 4,036 4,273
Corporate & institutional 125,270 125,160 131,950
Gross loans 276,882 274,895 277,043
of which held at amortized cost 261,520 258,268 257,515
of which held at fair value 15,362 16,627 19,528
Net (unearned income)/deferred expenses (107) (113) (129)
Allowance for loan losses (922) (917) (938)
Net loans 275,853 273,865 275,976
Gross loans by location (CHF million)
Switzerland 158,097 158,441 158,766
Foreign 118,785 116,454 118,277
Gross loans 276,882 274,895 277,043
Impaired loan portfolio (CHF million)
Non-performing loans 1,064 1,029 1,236
Non-interest-earning loans 230 228 265
Non-performing and non-interest-earning loans 1,294 1,257 1,501
Restructured loans 317 344 358
Potential problem loans 583 639 613
Other impaired loans 900 983 971
Gross impaired loans 2,194 2,240 2,472

108 Condensed consolidated financial statements – unaudited
Allowance for loan losses by loan portfolio 3Q17 2Q17 3Q16
Corporate & Corporate & Corporate & Consumer institutional Total Consumer institutional Total Consumer institutional Total
Allowance for loan losses (CHF million)
Balance at beginning of period 215 702 917 217 682 899 187 676 863
Net movements recognized in
statements of operations 11 (3) 8 14 56 70 46 16 62
Gross write-offs (14) (21) (35) (17) (36) (53) (25) (53) (78)
Recoveries 2 13 15 2 7 9 4 6 10
Net write-offs (12) (8) (20) (15) (29) (44) (21) (47) (68)
Provisions for interest 1 6 7 3 2 5 4 4 8
Foreign currency translation impact
and other adjustments, net 2 8 10 (4) (9) (13) 0 1 1
Balance at end of period 217 705 922 215 702 917 216 650 866
of which individually evaluated for impairment 175 531 706 172 540 712 170 459 629
of which collectively evaluated for impairment 42 174 216 43 162 205 46 191 237
Gross loans held at amortized cost (CHF million)
Balance at end of period 151,596 109,924 261,520 149,718 108,550 258,268 145,716 109,976 255,692
of which individually evaluated for impairment 1 611 1,583 2,194 607 1,633 2,240 713 1,589 2,302
of which collectively evaluated for impairment 150,985 108,341 259,326 149,111 106,917 256,028 145,003 108,387 253,390
9M17 9M16
Corporate & Corporate & Consumer institutional Total Consumer institutional Total
Allowance for loan losses (CHF million)
Balance at beginning of period 216 722 938 216 650 866
Net movements recognized in statements of operations 42 102 144 53 122 175
Gross write-offs (45) (142) (187) (67) (158) (225)
Recoveries 10 26 36 9 35 44
Net write-offs (35) (116) (151) (58) (123) (181)
Provisions for interest (4) 10 6 9 5 14
Foreign currency translation impact and other adjustments, net (2) (13) (15) (4) (4) (8)
Balance at end of period 217 705 922 216 650 866
1 Represents gross impaired loans both with and without a specific allowance.
Purchases, reclassifications and sales
in 3Q17 2Q17 3Q16
Corporate & Corporate & Corporate & Consumer institutional Total Consumer institutional Total Consumer institutional Total
Loans held at amortized cost (CHF million)
Purchases 1 0 727 727 0 734 734 30 500 530
Reclassifications from loans held-for-sale 2 0 11 11 0 0 0 0 0 0
Reclassifications to loans held-for-sale 3 0 1,040 1,040 0 705 705 0 256 256
Sales 3 0 1,013 1,013 0 907 907 0 275 275
1 Includes drawdowns under purchased loan commitments.2 Includes loans previously reclassified to held-for-sale that were not sold and were reclassified back to loans held-to-maturity.3 All loans held at amortized cost which are sold are reclassified to loans held-for-sale on or prior to the date of the sale.

109Condensed consolidated financial statements – unaudited
Purchases, reclassifications and sales (continued)
in 9M17 9M16
Corporate & Corporate & Consumer institutional Total Consumer institutional Total
Loans held at amortized cost (CHF million)
Purchases 1 0 2,385 2,385 30 1,915 1,945
Reclassifications from loans held-for-sale 2 0 11 11 0 125 125
Reclassifications to loans held-for-sale 3 0 4,849 4,849 1,632 920 2,552
Sales 3 0 4,709 4,709 0 305 305
1 Includes drawdowns under purchased loan commitments.2 Includes loans previously reclassified to held-for-sale that were not sold and were reclassified back to loans held-to-maturity.3 All loans held at amortized cost which are sold are reclassified to loans held-for-sale on or prior to the date of the sale.
Gross loans held at amortized cost by internal counterparty rating Investment Non-investment grade grade
end of AAA to BBB BB to C D Total
3Q17 (CHF million)
Mortgages 94,268 11,336 285 105,889
Loans collateralized by securities 38,575 3,191 110 41,876
Consumer finance 1,440 2,238 153 3,831
Consumer 134,283 16,765 548 151,596
Real estate 19,959 5,822 108 25,889
Commercial and industrial loans 39,001 33,041 1,361 73,403
Financial institutions 7,638 1,717 47 9,402
Governments and public institutions 1,161 67 2 1,230
Corporate & institutional 67,759 40,647 1,518 109,924
Gross loans held at amortized cost 202,042 57,412 2,066 261,520
Value of collateral 1 188,552 47,066 1,437 237,055
4Q16 (CHF million)
Mortgages 92,533 11,613 189 104,335
Loans collateralized by securities 34,136 2,916 216 37,268
Consumer finance 1,164 2,119 184 3,467
Consumer 127,833 16,648 589 145,070
Real estate 19,594 5,878 84 25,556
Commercial and industrial loans 36,469 35,945 1,459 73,873
Financial institutions 9,695 1,887 107 11,689
Governments and public institutions 1,253 60 14 1,327
Corporate & institutional 67,011 43,770 1,664 112,445
Gross loans held at amortized cost 194,844 60,418 2,253 257,515
Value of collateral 1 180,276 51,344 1,480 233,100
1 Includes the value of collateral up to the amount of the outstanding related loans. For mortgages, the value of collateral is determined at the time of granting the loan and thereafter regularly reviewed according to the Group’s risk management policies and directives, with maximum review periods determined by property type, market liquidity and market transparency.
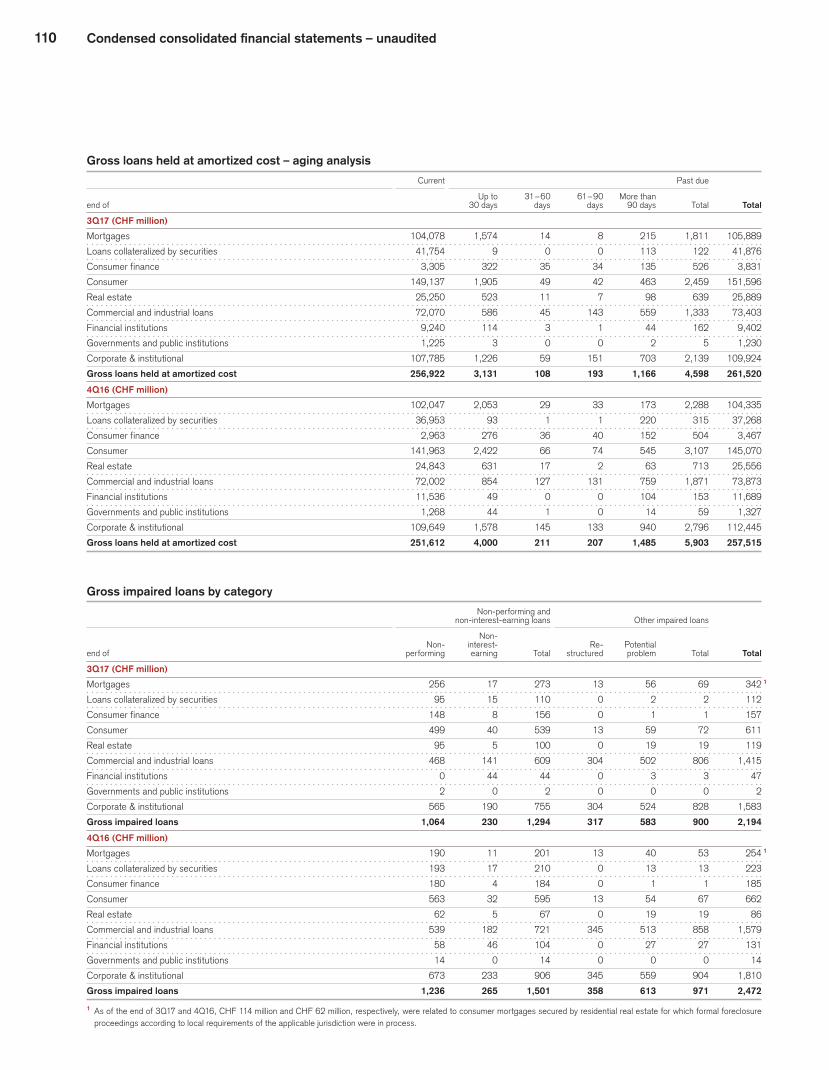
110 Condensed consolidated financial statements – unaudited
Gross loans held at amortized cost – aging analysis Current Past due
Up to 31 – 60 61 – 90 More than
end of 30 days days days 90 days Total Total
3Q17 (CHF million)
Mortgages 104,078 1,574 14 8 215 1,811 105,889
Loans collateralized by securities 41,754 9 0 0 113 122 41,876
Consumer finance 3,305 322 35 34 135 526 3,831
Consumer 149,137 1,905 49 42 463 2,459 151,596
Real estate 25,250 523 11 7 98 639 25,889
Commercial and industrial loans 72,070 586 45 143 559 1,333 73,403
Financial institutions 9,240 114 3 1 44 162 9,402
Governments and public institutions 1,225 3 0 0 2 5 1,230
Corporate & institutional 107,785 1,226 59 151 703 2,139 109,924
Gross loans held at amortized cost 256,922 3,131 108 193 1,166 4,598 261,520
4Q16 (CHF million)
Mortgages 102,047 2,053 29 33 173 2,288 104,335
Loans collateralized by securities 36,953 93 1 1 220 315 37,268
Consumer finance 2,963 276 36 40 152 504 3,467
Consumer 141,963 2,422 66 74 545 3,107 145,070
Real estate 24,843 631 17 2 63 713 25,556
Commercial and industrial loans 72,002 854 127 131 759 1,871 73,873
Financial institutions 11,536 49 0 0 104 153 11,689
Governments and public institutions 1,268 44 1 0 14 59 1,327
Corporate & institutional 109,649 1,578 145 133 940 2,796 112,445
Gross loans held at amortized cost 251,612 4,000 211 207 1,485 5,903 257,515
Gross impaired loans by category Non-performing and non-interest-earning loans Other impaired loans
Non- Non- interest- Re- Potential
end of performing earning Total structured problem Total Total
3Q17 (CHF million)
Mortgages 256 17 273 13 56 69 342 1
Loans collateralized by securities 95 15 110 0 2 2 112
Consumer finance 148 8 156 0 1 1 157
Consumer 499 40 539 13 59 72 611
Real estate 95 5 100 0 19 19 119
Commercial and industrial loans 468 141 609 304 502 806 1,415
Financial institutions 0 44 44 0 3 3 47
Governments and public institutions 2 0 2 0 0 0 2
Corporate & institutional 565 190 755 304 524 828 1,583
Gross impaired loans 1,064 230 1,294 317 583 900 2,194
4Q16 (CHF million)
Mortgages 190 11 201 13 40 53 254 1
Loans collateralized by securities 193 17 210 0 13 13 223
Consumer finance 180 4 184 0 1 1 185
Consumer 563 32 595 13 54 67 662
Real estate 62 5 67 0 19 19 86
Commercial and industrial loans 539 182 721 345 513 858 1,579
Financial institutions 58 46 104 0 27 27 131
Governments and public institutions 14 0 14 0 0 0 14
Corporate & institutional 673 233 906 345 559 904 1,810
Gross impaired loans 1,236 265 1,501 358 613 971 2,472
1 As of the end of 3Q17 and 4Q16, CHF 114 million and CHF 62 million, respectively, were related to consumer mortgages secured by residential real estate for which formal foreclosure proceedings according to local requirements of the applicable jurisdiction were in process.

111Condensed consolidated financial statements – unaudited
Gross impaired loan detail
end of 3Q17 4Q16
Unpaid Associated Unpaid Associated Recorded principal specific Recorded principal specific investment balance allowance investment balance allowance
Gross impaired loan detail (CHF million)
Mortgages 264 248 35 211 198 21
Loans collateralized by securities 109 97 45 209 193 54
Consumer finance 155 135 95 177 160 97
Consumer 528 480 175 597 551 172
Real estate 86 80 11 65 59 10
Commercial and industrial loans 1,165 1,127 481 1,283 1,250 472
Financial institutions 47 47 39 126 122 46
Governments and public institutions 2 2 0 14 14 0
Corporate & institutional 1,300 1,256 531 1,488 1,445 528
Gross impaired loans with a specific allowance 1,828 1,736 706 2,085 1,996 700
Mortgages 78 78 – 43 43 –
Loans collateralized by securities 3 3 – 14 14 –
Consumer finance 2 2 – 8 8 –
Consumer 83 83 – 65 65 –
Real estate 33 33 – 21 21 –
Commercial and industrial loans 250 250 – 296 296 –
Financial institutions 0 0 – 5 5 –
Corporate & institutional 283 283 – 322 322 –
Gross impaired loans without specific allowance 366 366 – 387 387 –
Gross impaired loans 2,194 2,102 706 2,472 2,383 700
of which consumer 611 563 175 662 616 172
of which corporate & institutional 1,583 1,539 531 1,810 1,767 528
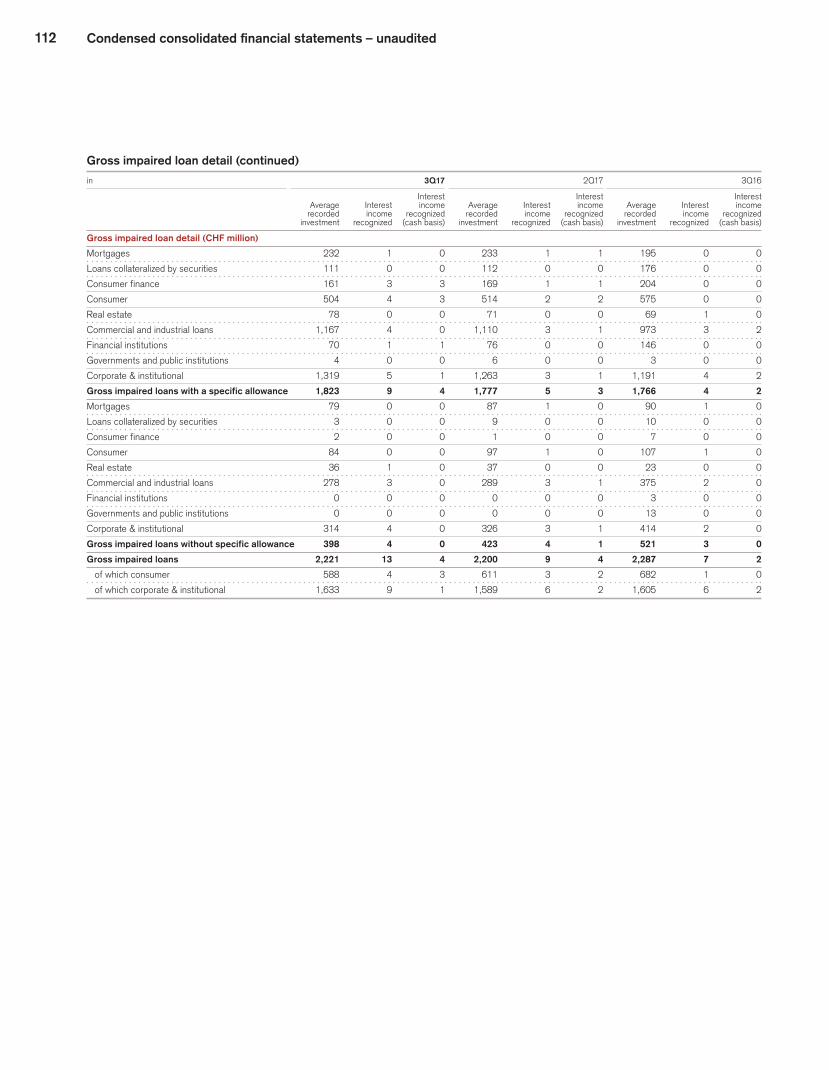
112 Condensed consolidated financial statements – unaudited
Gross impaired loan detail (continued)
in 3Q17 2Q17 3Q16
Interest Interest Interest Average Interest income Average Interest income Average Interest income recorded income recognized recorded income recognized recorded income recognized investment recognized (cash basis) investment recognized (cash basis) investment recognized (cash basis)
Gross impaired loan detail (CHF million)
Mortgages 232 1 0 233 1 1 195 0 0
Loans collateralized by securities 111 0 0 112 0 0 176 0 0
Consumer finance 161 3 3 169 1 1 204 0 0
Consumer 504 4 3 514 2 2 575 0 0
Real estate 78 0 0 71 0 0 69 1 0
Commercial and industrial loans 1,167 4 0 1,110 3 1 973 3 2
Financial institutions 70 1 1 76 0 0 146 0 0
Governments and public institutions 4 0 0 6 0 0 3 0 0
Corporate & institutional 1,319 5 1 1,263 3 1 1,191 4 2
Gross impaired loans with a specific allowance 1,823 9 4 1,777 5 3 1,766 4 2
Mortgages 79 0 0 87 1 0 90 1 0
Loans collateralized by securities 3 0 0 9 0 0 10 0 0
Consumer finance 2 0 0 1 0 0 7 0 0
Consumer 84 0 0 97 1 0 107 1 0
Real estate 36 1 0 37 0 0 23 0 0
Commercial and industrial loans 278 3 0 289 3 1 375 2 0
Financial institutions 0 0 0 0 0 0 3 0 0
Governments and public institutions 0 0 0 0 0 0 13 0 0
Corporate & institutional 314 4 0 326 3 1 414 2 0
Gross impaired loans without specific allowance 398 4 0 423 4 1 521 3 0
Gross impaired loans 2,221 13 4 2,200 9 4 2,287 7 2
of which consumer 588 4 3 611 3 2 682 1 0
of which corporate & institutional 1,633 9 1 1,589 6 2 1,605 6 2
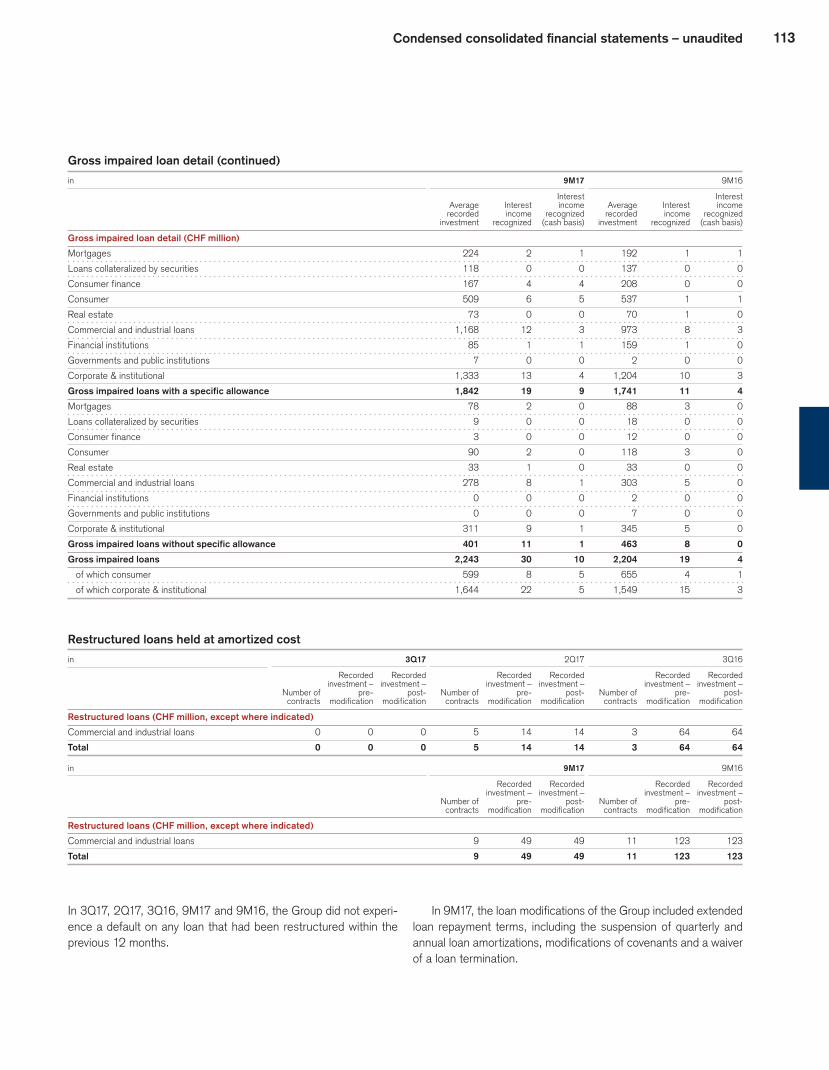
113Condensed consolidated financial statements – unaudited
Gross impaired loan detail (continued)
in 9M17 9M16
Interest Interest Average Interest income Average Interest income recorded income recognized recorded income recognized investment recognized (cash basis) investment recognized (cash basis)
Gross impaired loan detail (CHF million)
Mortgages 224 2 1 192 1 1
Loans collateralized by securities 118 0 0 137 0 0
Consumer finance 167 4 4 208 0 0
Consumer 509 6 5 537 1 1
Real estate 73 0 0 70 1 0
Commercial and industrial loans 1,168 12 3 973 8 3
Financial institutions 85 1 1 159 1 0
Governments and public institutions 7 0 0 2 0 0
Corporate & institutional 1,333 13 4 1,204 10 3
Gross impaired loans with a specific allowance 1,842 19 9 1,741 11 4
Mortgages 78 2 0 88 3 0
Loans collateralized by securities 9 0 0 18 0 0
Consumer finance 3 0 0 12 0 0
Consumer 90 2 0 118 3 0
Real estate 33 1 0 33 0 0
Commercial and industrial loans 278 8 1 303 5 0
Financial institutions 0 0 0 2 0 0
Governments and public institutions 0 0 0 7 0 0
Corporate & institutional 311 9 1 345 5 0
Gross impaired loans without specific allowance 401 11 1 463 8 0
Gross impaired loans 2,243 30 10 2,204 19 4
of which consumer 599 8 5 655 4 1
of which corporate & institutional 1,644 22 5 1,549 15 3
Restructured loans held at amortized cost
in 3Q17 2Q17 3Q16
Recorded Recorded Recorded Recorded Recorded Recorded investment – investment – investment – investment – investment – investment – Number of pre- post- Number of pre- post- Number of pre- post- contracts modification modification contracts modification modification contracts modification modification
Restructured loans (CHF million, except where indicated)
Commercial and industrial loans 0 0 0 5 14 14 3 64 64
Total 0 0 0 5 14 14 3 64 64
in 9M17 9M16
Recorded Recorded Recorded Recorded investment – investment – investment – investment – Number of pre- post- Number of pre- post- contracts modification modification contracts modification modification
Restructured loans (CHF million, except where indicated)
Commercial and industrial loans 9 49 49 11 123 123
Total 9 49 49 11 123 123
In 3Q17, 2Q17, 3Q16, 9M17 and 9M16, the Group did not experi-ence a default on any loan that had been restructured within the previous 12 months.
In 9M17, the loan modifications of the Group included extended loan repayment terms, including the suspension of quarterly and annual loan amortizations, modifications of covenants and a waiver of a loan termination.

114 Condensed consolidated financial statements – unaudited
17 Goodwill
Goodwill Investment Swiss International Banking & Strategic Credit Universal Wealth Asia Global Capital Resolution Suisse
3Q17 Bank Management Pacific Markets Markets Unit Group
Gross amount of goodwill (CHF million)
Balance at beginning of period 602 1,523 2,245 3,171 1,011 12 8,564
Foreign currency translation impact 4 17 12 4 5 0 42
Balance at end of period 606 1,540 2,257 3,175 1,016 12 8,606
Accumulated impairment (CHF million)
Balance at beginning of period 0 0 772 2,719 388 12 3,891
Balance at end of period 0 0 772 2,719 388 12 3,891
Net book value (CHF million)
Net book value 606 1,540 1,485 456 628 0 4,715
9M17
Gross amount of goodwill (CHF million)
Balance at beginning of period 623 1,612 2,318 3,195 1,044 12 8,804
Foreign currency translation impact (17) (68) (61) (20) (28) 0 (194)
Other 0 (4) 0 0 0 0 (4)
Balance at end of period 606 1,540 2,257 3,175 1,016 12 8,606
Accumulated impairment (CHF million)
Balance at beginning of period 0 0 772 2,719 388 12 3,891
Balance at end of period 0 0 772 2,719 388 12 3,891
Net book value (CHF million)
Net book value 606 1,540 1,485 456 628 0 4,715
In accordance with US GAAP, the Group continually assesses whether or not there has been a triggering event requiring a review of goodwill. There was no triggering event in 3Q17. As of Septem-ber 30, 2017, the Group’s market capitalization was below book value.
On December 7, 2016, and on February 14, 2017, the Group announced a reorganization and change to financial reporting affecting its Swiss Universal Bank and Asia Pacific segments. During 1Q17, these measures were implemented. The Group determined that these changes constituted triggering events. The Group’s reporting units as a result of these measures are defined as follows: Swiss Universal Bank – Private Clients (formerly Private Banking), Swiss Universal Bank – Corporate & Institutional Clients (formerly Corporate & Institutional Banking), International Wealth Management – Private Banking, International Wealth Management – Asset Management, Asia Pacific – Wealth Management & Con-nected (formerly Private Banking), Asia Pacific – Markets (formerly Investment Banking), Global Markets, Investment Banking & Capi-tal Markets and the Strategic Resolution Unit.
The carrying value of each reporting unit for the purpose of the goodwill impairment test is determined by considering the report-ing units’ risk-weighted assets usage, leverage ratio exposure, deferred tax assets, goodwill and intangible assets. Any residual
equity, after considering the total of these elements, is allocated to the reporting units on a pro-rata basis.
In estimating the fair value of its reporting units, the Group applied a combination of the market approach and the income approach. Under the market approach, consideration was given to price to projected earnings multiples or price to book value multiples for similarly traded companies and prices paid in recent transactions that have occurred in its industry or in related indus-tries. Under the income approach, a discount rate was applied that reflects the risk and uncertainty related to the reporting unit’s pro-jected cash flows, which are determined from the Group’s financial plan.
In determining the estimated fair value, the Group relied upon its updated five-year strategic business plan which included signifi-cant management assumptions and estimates based on its view of current and future economic conditions and regulatory changes.
Goodwill is tested for impairment before and immediately after a reorganization or restructuring of reporting units. As a result, the goodwill impairment test was performed during 1Q17 under the old business structure and then again under the modified structure according to the measures implemented in connection with the announcements on December 7, 2016 and on February 14, 2017.

115Condensed consolidated financial statements – unaudited
The Group concluded that the estimated fair value for all of its reporting units impacted by the measures implemented in connec-tion with the December 7, 2016 and February 14, 2017 announce-ments substantially exceeded their related carrying values and that no impairment was necessary.
The results of the impairment evaluation of each reporting unit’s goodwill would be significantly impacted by adverse changes
in the underlying parameters used in the valuation process. If actual outcomes adversely differ by a significant margin from its best estimates of the key economic assumptions and associated cash flows applied in the valuation of the reporting unit, the Group could potentially incur material impairment charges in the future.
18 Other assets and other liabilities
end of 3Q17 2Q17 4Q16
Other assets (CHF million)
Cash collateral on derivative instruments 5,297 5,848 5,705
Cash collateral on non-derivative transactions 1,848 873 1,237
Derivative instruments used for hedging 44 112 148
Assets held-for-sale 7,210 9,920 8,214
of which loans 1 7,029 9,742 8,062
of which real estate 2 143 150 122
of which long-lived assets 38 28 30
Assets held for separate accounts 398 410 431
Interest and fees receivable 4,532 4,577 4,787
Deferred tax assets 7,503 7,542 5,828
Prepaid expenses 450 464 394
Failed purchases 1,430 1,642 2,423
Defined benefit pension and post-retirement plan assets 1,591 1,412 1,061
Other 3,823 3,474 6,637
Other assets 34,126 36,274 36,865
Other liabilities (CHF million)
Cash collateral on derivative instruments 9,112 9,226 11,497
Cash collateral on non-derivative transactions 545 418 369
Derivative instruments used for hedging 3 2 2
Deposits held-for-sale 0 0 1,577
Provisions 980 954 4,077
of which off-balance sheet risk 108 82 88
Restructuring liabilities 273 264 311
Liabilities held for separate accounts 398 410 431
Interest and fees payable 5,221 5,548 6,039
Current tax liabilities 602 526 636
Deferred tax liabilities 271 231 129
Failed sales 657 787 737
Defined benefit pension and post-retirement plan liabilities 529 501 516
Other 12,231 11,267 13,534
Other liabilities 30,822 30,134 39,855
1 Included as of the end of 3Q17, 2Q17 and 4Q16 were CHF 477 million, CHF 608 million and CHF 681 million, respectively, in restricted loans, which represented collateral on secured borrowings.
2 As of the end of 3Q17, 2Q17 and 4Q16, real estate held-for-sale included foreclosed or repossessed real estate of CHF 5 million, CHF 5 million and CHF 16 million, respectively, of which CHF 2 million, CHF 2 million and CHF 13 million, respectively were related to residental real estate.

116 Condensed consolidated financial statements – unaudited
19 Long-term debt
Long-term debt
end of 3Q17 2Q17 4Q16
Long-term debt (CHF million)
Senior 155,529 152,549 168,601
Subordinated 23,293 22,952 22,955
Non-recourse liabilities from consolidated VIEs 1,472 1,199 1,759
Long-term debt 180,294 176,700 193,315
of which reported at fair value 69,346 71,803 72,868
of which structured notes 56,962 57,664 59,544
Structured notes by product
end of 3Q17 2Q17 4Q16
Structured notes (CHF million)
Equity 35,838 35,393 35,980
Fixed income 14,662 15,632 16,395
Credit 5,101 5,429 5,713
Other 1,361 1,210 1,456
Total structured notes 56,962 57,664 59,544

117Condensed consolidated financial statements – unaudited
20 Accumulated other comprehensive income and additional share information
Accumulated other comprehensive income/(loss) Gains/ Accumu- Unrealized (losses) lated other Gains/ gains/ Net prior on compre- (losses) Cumulative (losses) Actuarial service liabilities hensive on cash translation on gains/ credit/ relating to income/ flow hedges adjustments securities (losses) (cost) credit risk (loss)
3Q17 (CHF million)
Balance at beginning of period (29) (13,686) 54 (4,093) 576 (1,711) (18,889)
Increase/(decrease) 3 353 0 (14) 0 (522) (180)
Increase/(decrease) due to equity method investments 1 (1) 0 0 0 0 0
Reclassification adjustments, included in net income/(loss) (9) 0 0 82 (27) 170 216
Total increase/(decrease) (5) 352 0 68 (27) (352) 36
Balance at end of period (34) (13,334) 54 (4,025) 549 (2,063) (18,853)
2Q17 (CHF million)
Balance at beginning of period (39) (12,591) 59 (4,175) 604 (1,081) (17,223)
Increase/(decrease) (8) (1,096) (5) 2 0 (628) (1,735)
Increase/(decrease) due to equity method investments 0 1 0 0 0 0 1
Reclassification adjustments, included in net income/(loss) 18 0 0 80 (28) (2) 68
Total increase/(decrease) 10 (1,095) (5) 82 (28) (630) (1,666)
Balance at end of period (29) (13,686) 54 (4,093) 576 (1,711) (18,889)
3Q16 (CHF million)
Balance at beginning of period 51 (13,121) 67 (4,485) 554 1,672 (15,262)
Increase/(decrease) (28) (214) (1) 13 0 (852) (1,082)
Increase/(decrease) due to equity method investments 2 0 0 0 0 0 2
Reclassification adjustments, included in net income/(loss) (6) 2 0 82 (24) 0 54
Total increase/(decrease) (32) (212) (1) 95 (24) (852) (1,026)
Balance at end of period 19 (13,333) 66 (4,390) 530 820 (16,288)
9M17 (CHF million)
Balance at beginning of period (35) (12,095) 61 (4,278) 643 (568) (16,272)
Increase/(decrease) (13) (1,262) (7) 11 0 (1,663) (2,934)
Increase/(decrease) due to equity method investments 1 0 0 0 0 0 1
Reclassification adjustments, included in net income/(loss) 13 23 0 242 (94) 168 352
Total increase/(decrease) 1 (1,239) (7) 253 (94) (1,495) (2,581)
Balance at end of period (34) (13,334) 54 (4,025) 549 (2,063) (18,853)
9M16 (CHF million)
Balance at beginning of period (15) (12,615) 60 (4,672) 607 – (16,635)
Increase/(decrease) 45 (778) 6 35 0 345 (347)
Increase/(decrease) due to equity method investments (4) 0 0 0 0 0 (4)
Reclassification adjustments, included in net income/(loss) (7) 60 0 247 (77) 0 223
Cumulative effect of accounting changes, net of tax 0 0 0 0 0 475 475
Total increase/(decrease) 34 (718) 6 282 (77) 820 347
Balance at end of period 19 (13,333) 66 (4,390) 530 820 (16,288)
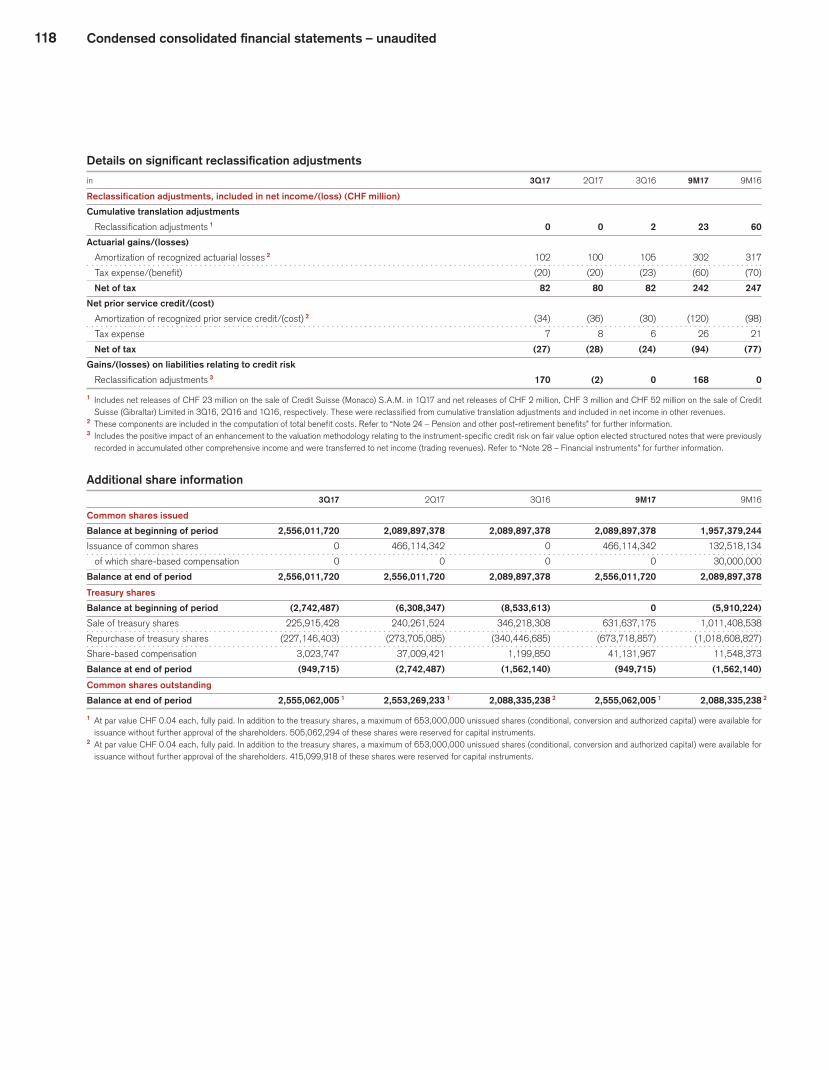
118 Condensed consolidated financial statements – unaudited
Details on significant reclassification adjustments
in 3Q17 2Q17 3Q16 9M17 9M16
Reclassification adjustments, included in net income/(loss) (CHF million)
Cumulative translation adjustments
Reclassification adjustments 1 0 0 2 23 60
Actuarial gains/(losses)
Amortization of recognized actuarial losses 2 102 100 105 302 317
Tax expense/(benefit) (20) (20) (23) (60) (70)
Net of tax 82 80 82 242 247
Net prior service credit/(cost)
Amortization of recognized prior service credit/(cost) 2 (34) (36) (30) (120) (98)
Tax expense 7 8 6 26 21
Net of tax (27) (28) (24) (94) (77)
Gains/(losses) on liabilities relating to credit risk
Reclassification adjustments 3 170 (2) 0 168 0
1 Includes net releases of CHF 23 million on the sale of Credit Suisse (Monaco) S.A.M. in 1Q17 and net releases of CHF 2 million, CHF 3 million and CHF 52 million on the sale of Credit Suisse (Gibraltar) Limited in 3Q16, 2Q16 and 1Q16, respectively. These were reclassified from cumulative translation adjustments and included in net income in other revenues.
2 These components are included in the computation of total benefit costs. Refer to “Note 24 – Pension and other post-retirement benefits” for further information.3 Includes the positive impact of an enhancement to the valuation methodology relating to the instrument-specific credit risk on fair value option elected structured notes that were previously
recorded in accumulated other comprehensive income and were transferred to net income (trading revenues). Refer to “Note 28 – Financial instruments” for further information.
Additional share information 3Q17 2Q17 3Q16 9M17 9M16
Common shares issued
Balance at beginning of period 2,556,011,720 2,089,897,378 2,089,897,378 2,089,897,378 1,957,379,244
Issuance of common shares 0 466,114,342 0 466,114,342 132,518,134
of which share-based compensation 0 0 0 0 30,000,000
Balance at end of period 2,556,011,720 2,556,011,720 2,089,897,378 2,556,011,720 2,089,897,378
Treasury shares
Balance at beginning of period (2,742,487) (6,308,347) (8,533,613) 0 (5,910,224)
Sale of treasury shares 225,915,428 240,261,524 346,218,308 631,637,175 1,011,408,538
Repurchase of treasury shares (227,146,403) (273,705,085) (340,446,685) (673,718,857) (1,018,608,827)
Share-based compensation 3,023,747 37,009,421 1,199,850 41,131,967 11,548,373
Balance at end of period (949,715) (2,742,487) (1,562,140) (949,715) (1,562,140)
Common shares outstanding
Balance at end of period 2,555,062,005 1 2,553,269,233 1 2,088,335,238 2 2,555,062,005 1 2,088,335,238 2
1 At par value CHF 0.04 each, fully paid. In addition to the treasury shares, a maximum of 653,000,000 unissued shares (conditional, conversion and authorized capital) were available for issuance without further approval of the shareholders. 505,062,294 of these shares were reserved for capital instruments.
2 At par value CHF 0.04 each, fully paid. In addition to the treasury shares, a maximum of 653,000,000 unissued shares (conditional, conversion and authorized capital) were available for issuance without further approval of the shareholders. 415,099,918 of these shares were reserved for capital instruments.
119Condensed consolidated financial statements – unaudited
21 Offsetting of financial assets and financial liabilities
The disclosures set out in the tables below include derivatives, reverse repurchase and repurchase agreements, and securities lending and borrowing transactions that:p are offset in the Group’s consolidated balance sheets; orp are subject to an enforceable master netting agreement or
similar agreement (enforceable master netting agreements), irrespective of whether they are offset in the Group’s consoli-dated balance sheets.
Similar agreements include derivative clearing agreements, global master repurchase agreements and global master securities lend-ing agreements.
DerivativesThe Group transacts bilateral OTC derivatives mainly under the International Swaps and Derivatives Association (ISDA) Master Agreements and Swiss Master Agreements for OTC derivative instruments. These agreements provide for the net settlement of all transactions under the agreement through a single payment in the event of default or termination under the agreement. They allow the Group to offset balances from derivative assets and lia-bilities as well as the receivables and payables to related cash col-lateral transacted with the same counterparty. Collateral for OTC derivatives is received and provided in the form of cash and mar-ketable securities. Such collateral may be subject to the standard industry terms of an ISDA Credit Support Annex. The terms of an ISDA Credit Support Annex provide that securities received or pro-vided as collateral may be pledged or sold during the term of the transactions and must be returned upon maturity of the transac-tion. These terms also give each counterparty the right to termi-nate the related transactions upon the other counterparty’s failure to post collateral. Financial collateral received or pledged for OTC
derivatives may also be subject to collateral agreements which restrict the use of financial collateral.
For derivatives transacted with exchanges (exchange-traded derivatives) and central clearing counterparties (OTC-cleared derivatives), positive and negative replacement values (PRV/NRV) and related cash collateral may be offset if the terms of the rules and regulations governing these exchanges and central clearing counterparties permit such netting and offset.
Where no such agreements exist, fair values are recorded on a gross basis.
Exchange-traded derivatives or OTC-cleared derivatives, that are fully margined and for which the daily margin payments con-stitute settlement of the outstanding exposure, are not included in the offsetting disclosures because they are not subject to offset-ting due to the daily settlement. The daily margin payments, which are not settled until the next settlement cycle is conducted, are presented in brokerage receivables or brokerage payables. The notional amount for these daily settled derivatives is included in the fair value of derivative instruments table in “Note 25 – Derivatives and hedging activities”.
Under US GAAP, the Group elected to account for substan-tially all financial instruments with an embedded derivative that is not considered clearly and closely related to the host contract at fair value. There is an exception for a bifurcatable hybrid debt instrument which the Group did not elect to account for at fair value. However, this bifurcated embedded derivative is not subject to an enforceable master netting agreement and is not recorded as a derivative instrument under trading assets and liabilities or other assets and other liabilities. Information on this bifurcated embed-ded derivative has therefore not been included in the offsetting disclosures.
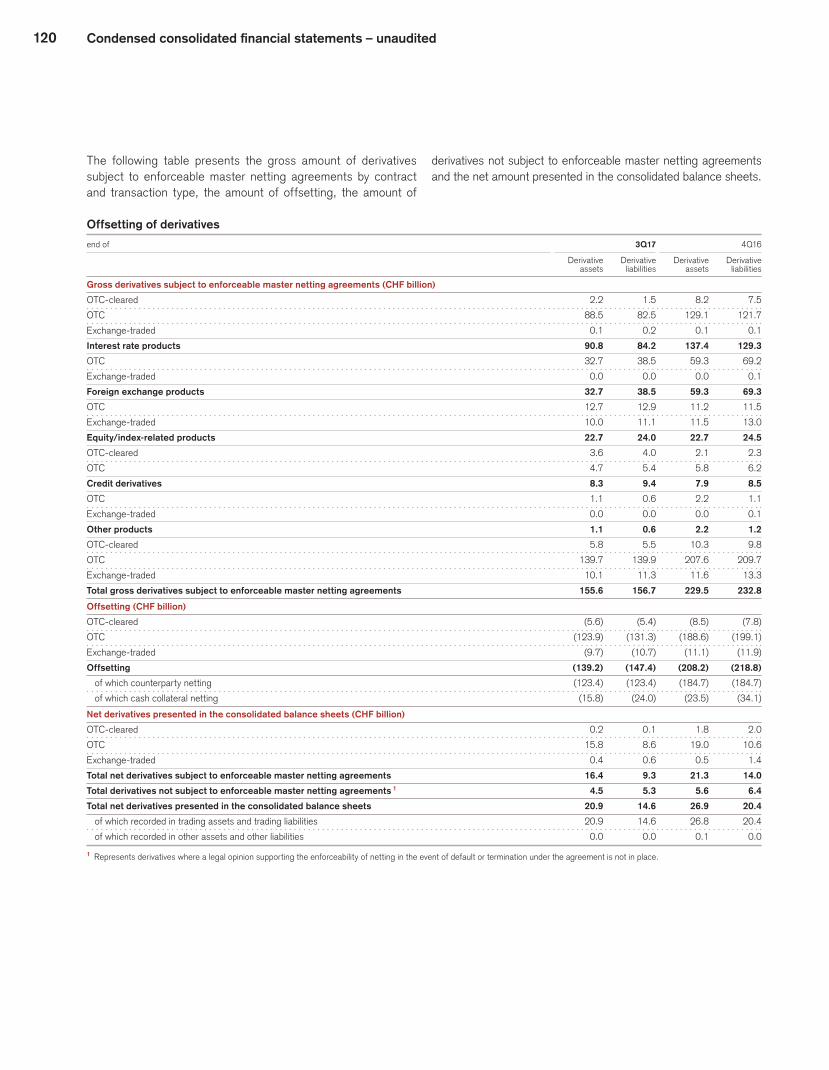
120 Condensed consolidated financial statements – unaudited
The following table presents the gross amount of derivatives subject to enforceable master netting agreements by contract and transaction type, the amount of offsetting, the amount of
derivatives not subject to enforceable master netting agreements and the net amount presented in the consolidated balance sheets.
Offsetting of derivatives
end of 3Q17 4Q16
Derivative Derivative Derivative Derivative assets liabilities assets liabilities
Gross derivatives subject to enforceable master netting agreements (CHF billion)
OTC-cleared 2.2 1.5 8.2 7.5
OTC 88.5 82.5 129.1 121.7
Exchange-traded 0.1 0.2 0.1 0.1
Interest rate products 90.8 84.2 137.4 129.3
OTC 32.7 38.5 59.3 69.2
Exchange-traded 0.0 0.0 0.0 0.1
Foreign exchange products 32.7 38.5 59.3 69.3
OTC 12.7 12.9 11.2 11.5
Exchange-traded 10.0 11.1 11.5 13.0
Equity/index-related products 22.7 24.0 22.7 24.5
OTC-cleared 3.6 4.0 2.1 2.3
OTC 4.7 5.4 5.8 6.2
Credit derivatives 8.3 9.4 7.9 8.5
OTC 1.1 0.6 2.2 1.1
Exchange-traded 0.0 0.0 0.0 0.1
Other products 1.1 0.6 2.2 1.2
OTC-cleared 5.8 5.5 10.3 9.8
OTC 139.7 139.9 207.6 209.7
Exchange-traded 10.1 11.3 11.6 13.3
Total gross derivatives subject to enforceable master netting agreements 155.6 156.7 229.5 232.8
Offsetting (CHF billion)
OTC-cleared (5.6) (5.4) (8.5) (7.8)
OTC (123.9) (131.3) (188.6) (199.1)
Exchange-traded (9.7) (10.7) (11.1) (11.9)
Offsetting (139.2) (147.4) (208.2) (218.8)
of which counterparty netting (123.4) (123.4) (184.7) (184.7)
of which cash collateral netting (15.8) (24.0) (23.5) (34.1)
Net derivatives presented in the consolidated balance sheets (CHF billion)
OTC-cleared 0.2 0.1 1.8 2.0
OTC 15.8 8.6 19.0 10.6
Exchange-traded 0.4 0.6 0.5 1.4
Total net derivatives subject to enforceable master netting agreements 16.4 9.3 21.3 14.0
Total derivatives not subject to enforceable master netting agreements 1 4.5 5.3 5.6 6.4
Total net derivatives presented in the consolidated balance sheets 20.9 14.6 26.9 20.4
of which recorded in trading assets and trading liabilities 20.9 14.6 26.8 20.4
of which recorded in other assets and other liabilities 0.0 0.0 0.1 0.0
1 Represents derivatives where a legal opinion supporting the enforceability of netting in the event of default or termination under the agreement is not in place.

121Condensed consolidated financial statements – unaudited
Reverse repurchase and repurchase agreements and securities lending and borrowing transactionsReverse repurchase and repurchase agreements are generally covered by global master repurchase agreements with netting terms similar to ISDA Master Agreements. In certain situations, for example in the event of default, all contracts under the agreements are terminated and are settled net in one single payment. Transac-tions under such agreements are netted in the consolidated bal-ance sheets if they are with the same counterparty, have the same maturity date, settle through the same clearing institution and are subject to the same master netting agreement. The amounts off-set are measured on the same basis as the underlying transaction (i.e., on an accrual basis or fair value basis).
Securities lending and borrowing transactions are generally executed under global master securities lending agreements with netting terms similar to ISDA Master Agreements. In certain sit-uations, for example in the event of default, all contracts under the agreement are terminated and are settled net in one single payment. Transactions under these agreements are netted in the consolidated balance sheets if they meet the same right of offset criteria as for reverse repurchase and repurchase agreements. In general, most securities lending and borrowing transactions do not
meet the criterion of having the same settlement date specified at inception of the transaction, and therefore they are not eligible for netting in the consolidated balance sheets. However, securities lending and borrowing transactions with explicit maturity dates may be eligible for netting in the consolidated balance sheets.
Reverse repurchase and repurchase agreements are collater-alized principally by government securities, money market instru-ments and corporate bonds and have terms ranging from overnight to a longer or unspecified period of time. In the event of coun-terparty default, the reverse repurchase agreement or securities lending agreement provides the Group with the right to liquidate the collateral held. In certain circumstances, financial collateral received may be restricted during the term of the agreement (e.g., in tri-party arrangements).
The following table presents the gross amount of securities purchased under resale agreements and securities borrowing transactions subject to enforceable master netting agreements, the amount of offsetting, the amount of securities purchased under resale agreements and securities borrowing transactions not subject to enforceable master netting agreements and the net amount presented in the consolidated balance sheets.
Offsetting of securities purchased under resale agreements and securities borrowing transactions
end of 3Q17 4Q16
Net Net Gross Offsetting book value Gross Offsetting book value
Securities purchased under resale agreements and
securities borrowing transactions (CHF billion)
Securities purchased under resale agreements 106.5 (24.1) 82.4 99.9 (26.9) 73.0
Securities borrowing transactions 18.6 (4.8) 13.8 24.0 (4.5) 19.5
Total subject to enforceable master netting agreements 125.1 (28.9) 96.2 123.9 (31.4) 92.5
Total not subject to enforceable master netting agreements 1 43.8 – 43.8 42.2 – 42.2
Total 168.9 (28.9) 140.0 2 166.1 (31.4) 134.7 2
1 Represents securities purchased under resale agreements and securities borrowing transactions where a legal opinion supporting the enforceability of netting in the event of default or termination under the agreement is not in place.
2 CHF 97,413 million and CHF 87,331 million of the total net amount as of the end of 3Q17 and 4Q16, respectively, are reported at fair value.
The following table presents the gross amount of securities sold under repurchase agreements and securities lending transactions subject to enforceable master netting agreements, the amount of offsetting, the amount of securities sold under repurchase
agreements and securities lending transactions not subject to enforceable master netting agreements and the net amount pre-sented in the consolidated balance sheets.

122 Condensed consolidated financial statements – unaudited
Offsetting of securities sold under repurchase agreements and securities lending transactions
end of 3Q17 4Q16
Net Net Gross Offsetting book value Gross Offsetting book value
Securities sold under repurchase agreements and
securities lending transactions (CHF billion)
Securities sold under repurchase agreements 47.7 (26.5) 21.2 51.3 (29.0) 22.3
Securities lending transactions 7.9 (2.4) 5.5 8.3 (2.4) 5.9
Obligation to return securities received as collateral, at fair value 32.7 0.0 32.7 31.9 0.0 31.9
Total subject to enforceable master netting agreements 88.3 (28.9) 59.4 91.5 (31.4) 60.1
Total not subject to enforceable master netting agreements 1 9.6 – 9.6 5.5 – 5.5
Total 97.9 (28.9) 69.0 97.0 (31.4) 65.6
of which securities sold under repurchase agreements and securities
lending transactions 62.0 (28.9) 33.1 2 64.4 (31.4) 33.0 2
of which obligation to return securities received as collateral, at fair value 35.9 0.0 35.9 32.6 0.0 32.6
1 Represents securities sold under repurchase agreements and securities lending transactions where a legal opinion supporting the enforceability of netting in the event of default or termina-tion under the agreement is not in place.
2 CHF 17,300 million and CHF 19,634 million of the total net amount as of the end of 3Q17 and 4Q16, respectively, are reported at fair value.
The following table presents the net amount presented in the con-solidated balance sheets of financial assets and liabilities subject to enforceable master netting agreements and the gross amount of financial instruments and cash collateral not offset in the con-solidated balance sheets. The table excludes derivatives, reverse repurchase and repurchase agreements and securities lending and
borrowing transactions not subject to enforceable master netting agreements where a legal opinion supporting the enforceability of netting in the event of default or termination under the agreement is not in place. Net exposure reflects risk mitigation in the form of collateral.
Amounts not offset in the consolidated balance sheets
end of 3Q17 4Q16
Cash Cash collateral collateral Net Financial received/ Net Net Financial received/ Net book value instruments 1 pledged 1 exposure book value instruments 1 pledged 1 exposure
Financial assets subject to enforceable master
netting agreements (CHF billion)
Derivatives 16.4 5.6 0.0 10.8 21.3 6.3 0.0 15.0
Securities purchased under resale agreements 82.4 82.4 0.0 0.0 73.0 73.0 0.0 0.0
Securities borrowing transactions 13.8 13.5 0.0 0.3 19.5 18.6 0.0 0.9
Total financial assets subject to enforceable
master netting agreements 112.6 101.5 0.0 11.1 113.8 97.9 0.0 15.9
Financial liabilities subject to enforceable master
netting agreements (CHF billion)
Derivatives 9.3 2.2 0.0 7.1 14.0 3.3 0.0 10.7
Securities sold under repurchase agreements 21.2 21.2 0.0 0.0 22.3 22.3 0.0 0.0
Securities lending transactions 5.5 5.2 0.0 0.3 5.9 5.7 0.0 0.2
Obligation to return securities received as collateral, at fair value 32.7 30.4 0.0 2.3 31.9 30.4 0.0 1.5
Total financial liabilities subject to enforceable
master netting agreements 68.7 59.0 0.0 9.7 74.1 61.7 0.0 12.4
1 The total amount reported in financial instruments (recognized financial assets and financial liabilities and non-cash financial collateral) and cash collateral is limited to the amount of the related instruments presented in the consolidated balance sheets and therefore any over-collateralization of these positions is not included.
Net exposure is subject to further credit mitigation through the transfer of the exposure to other market counterparties by the use of credit default swaps (CDS) and credit insurance contracts.
Therefore, the net exposure presented in the table above is not representative of the Group’s counterparty exposure.

123Condensed consolidated financial statements – unaudited
22 Tax
The 3Q17 income tax expense of CHF 153 million includes the impact of the continuous reassessment of the estimated annual effective tax rate as well as the impact of items that need to be recorded in the specific interim period in which they occur. Further details are outlined in the tax expense reconciliation below.
Net deferred tax assets related to net operating losses, net deferred tax assets on temporary differences and net deferred tax liabilities are presented in the following manner. Nettable gross deferred tax liabilities are allocated on a pro-rata basis to gross deferred tax assets on net operating losses and gross deferred tax assets on temporary differences. This approach is aligned with the underlying treatment of netting gross deferred tax assets and liabilities under the Basel III framework. Valuation allowances have been allocated against such deferred tax assets on net operat-ing losses first with any remainder allocated to such deferred tax assets on temporary differences. This presentation is considered the most appropriate disclosure given the underlying nature of the gross deferred tax balances.
As of September 30, 2017, the Group had accumulated undis-tributed earnings from foreign subsidiaries of CHF 5.1 billion which are considered indefinitely reinvested. The Group would need to accrue and pay taxes on these undistributed earnings if such earn-ings were repatriated. No deferred tax liability was recorded in respect of those amounts as these earnings are considered indefi-nitely reinvested. It is not practicable to estimate the amount of unrecognized deferred tax liabilities for these undistributed foreign earnings.
The Group is currently subject to ongoing tax audits, inquiries and litigation with the tax authorities in a number of jurisdictions, including Brazil, the Netherlands, the US, the UK and Switzerland. Although the timing of completion is uncertain, it is reasonably possible that some of these will be resolved within 12 months of the reporting date. It is reasonably possible that there will be a decrease between zero and CHF 70 million in unrecognized tax benefits within 12 months of the reporting date.
The Group remains open to examination from federal, state, provincial or similar local jurisdictions from the following years onward in these major countries: Brazil – 2012; Japan – 2012; Switzerland – 2011; the US – 2010; the UK – 2009; and the Netherlands – 2006.
Effective tax rate
in 3Q17 2Q17 3Q16 9M17 9M16
Effective tax rate (%) 38.3 47.4 83.3 30.7 (42.9)
Tax expense reconciliation
in 3Q17
CHF million
Income tax expense computed
at the Swiss statutory tax rate of 22% 88
Increase/(decrease) in income taxes resulting from
Foreign tax rate differential 22
Other non-deductible expenses (89)
Changes in deferred tax valuation allowance 40
Lower taxed income (20)
(Windfall tax benefits)/shortfall tax charges on
share-based compensation 1
Other 111
Income tax expense 153
Foreign tax rate differential3Q17 included a foreign tax expense of CHF 22 million in respect of earnings in higher tax jurisdictions, such as Brazil, as well as earnings in lower tax jurisdictions, such as Singapore.
Other non-deductible expenses3Q17 included the reversal of non-deductible interest expenses of CHF 201 million arising from the reassessment of a previously taken tax position relating to the deductibility of such costs, par-tially offset by a tax expense of CHF 106 million relating to the non-deductible interest expenses and a tax expense of CHF 6 million in respect of non-deductible bank levy costs and other non-deductible expenses.
Changes in deferred tax valuation allowance3Q17 included the impact of the increase of valuation allowances of CHF 92 million mainly in respect of three of the Group’s operat-ing entities, two in the UK and one in Switzerland, and a decrease of valuation allowances of CHF 52 million mainly in respect of two of the Group’s operating entities, one in the UK and one in Swit-zerland, related to estimated current year earnings.
Lower taxed income3Q17 included the impacts of CHF 6 million related to non-tax-able life insurance income, a beneficial earnings mix in one of the Group’s operating entities in Switzerland of CHF 14 million, and various smaller items.
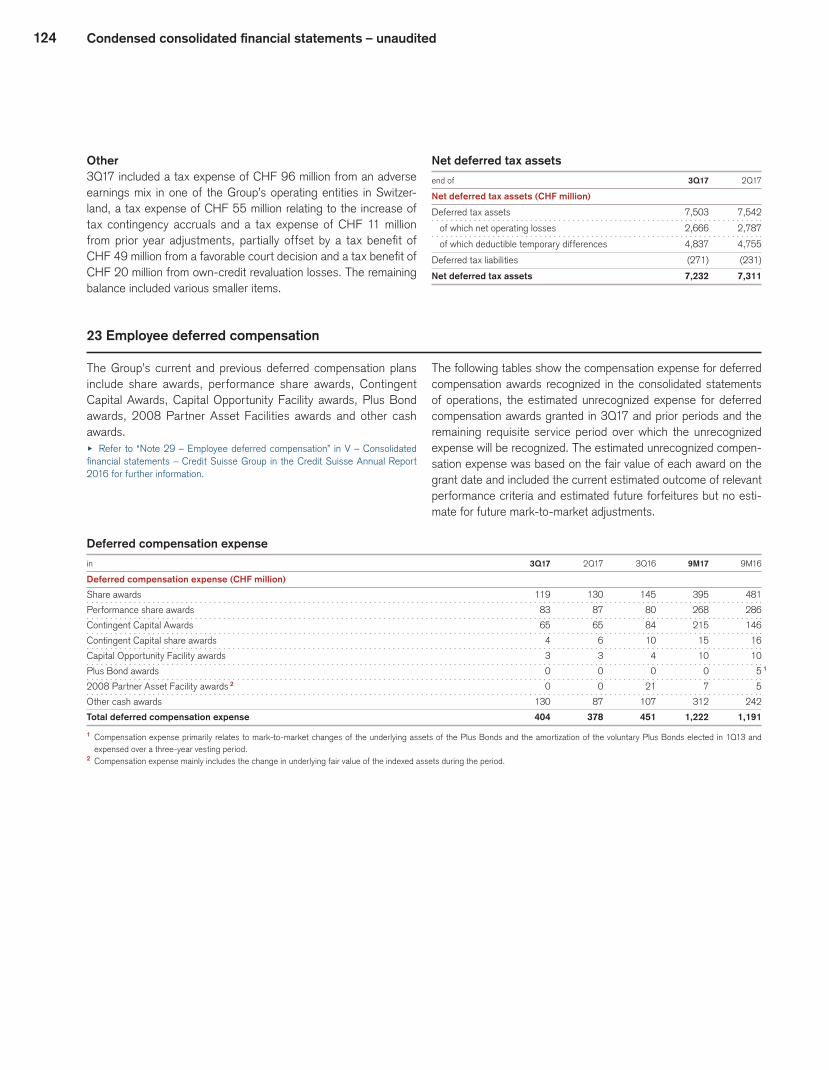
124 Condensed consolidated financial statements – unaudited
Other3Q17 included a tax expense of CHF 96 million from an adverse earnings mix in one of the Group’s operating entities in Switzer-land, a tax expense of CHF 55 million relating to the increase of tax contingency accruals and a tax expense of CHF 11 million from prior year adjustments, partially offset by a tax benefit of CHF 49 million from a favorable court decision and a tax benefit of CHF 20 million from own-credit revaluation losses. The remaining balance included various smaller items.
Net deferred tax assets
end of 3Q17 2Q17
Net deferred tax assets (CHF million)
Deferred tax assets 7,503 7,542
of which net operating losses 2,666 2,787
of which deductible temporary differences 4,837 4,755
Deferred tax liabilities (271) (231)
Net deferred tax assets 7,232 7,311
23 Employee deferred compensation
The Group’s current and previous deferred compensation plans include share awards, performance share awards, Contingent Capital Awards, Capital Opportunity Facility awards, Plus Bond awards, 2008 Partner Asset Facilities awards and other cash awards.u Refer to “Note 29 – Employee deferred compensation” in V – Consolidated financial statements – Credit Suisse Group in the Credit Suisse Annual Report 2016 for further information.
The following tables show the compensation expense for deferred compensation awards recognized in the consolidated statements of operations, the estimated unrecognized expense for deferred compensation awards granted in 3Q17 and prior periods and the remaining requisite service period over which the unrecognized expense will be recognized. The estimated unrecognized compen-sation expense was based on the fair value of each award on the grant date and included the current estimated outcome of relevant performance criteria and estimated future forfeitures but no esti-mate for future mark-to-market adjustments.
Deferred compensation expense
in 3Q17 2Q17 3Q16 9M17 9M16
Deferred compensation expense (CHF million)
Share awards 119 130 145 395 481
Performance share awards 83 87 80 268 286
Contingent Capital Awards 65 65 84 215 146
Contingent Capital share awards 4 6 10 15 16
Capital Opportunity Facility awards 3 3 4 10 10
Plus Bond awards 0 0 0 0 5 1
2008 Partner Asset Facility awards 2 0 0 21 7 5
Other cash awards 130 87 107 312 242
Total deferred compensation expense 404 378 451 1,222 1,191
1 Compensation expense primarily relates to mark-to-market changes of the underlying assets of the Plus Bonds and the amortization of the voluntary Plus Bonds elected in 1Q13 and expensed over a three-year vesting period.
2 Compensation expense mainly includes the change in underlying fair value of the indexed assets during the period.

125Condensed consolidated financial statements – unaudited
Estimated unrecognized deferred compensation
end of 3Q17
Estimated unrecognized compensation expense (CHF million)
Share awards 592
Performance share awards 249
Contingent Capital Awards 162
Contingent Capital share awards 8
Other cash awards 232
Total 1,243
Weighted-average requisite service period (years)
Aggregate remaining weighted-average requisite service period 1.3
3Q17 activityIn 3Q17, the Group granted fixed deferred cash awards of CHF 90 million to certain employees in the US. These awards will be expensed in the Global Markets, Investment Banking & Capital Markets and International Wealth Management divisions over a three-year period from the grant date, with CHF 38 million being expensed in 3Q17.
Share-based award activity 3Q17 9M17
Performance Contingent Performance Contingent Share share Capital share Share share Capital share
Number of awards (in millions) awards awards awards awards awards awards
Share-based award activities
Balance at beginning of period 87.1 56.5 8.9 73.2 48.4 13.5
Granted 2.2 0.0 0.0 49.9 1 31.8 1 0.3 1
Settled (4.6) (0.5) (0.1) (37.0) (23.8) (5.0)
Forfeited (1.8) (1.2) (0.2) (3.2) (1.6) (0.2)
Balance at end of period 82.9 54.8 8.6 82.9 54.8 8.6
of which vested 6.9 5.8 1.2 6.9 5.8 1.2
of which unvested 76.0 49.0 7.4 76.0 49.0 7.4
1 Includes an adjustment for share awards granted in 2Q17 to compensate for the proportionate dilution of Group shares resulting from the rights offering approved on May 18, 2017. The number of deferred share-based awards held by each individual was increased by 3.64%. The terms and conditions of the adjusted shares were the same as the existing share-based awards thereby ensuring that holders of the awards were neither advantaged nor disadvantaged by the additional shares granted.
24 Pension and other post-retirement benefits
The Group expects to contribute CHF 442 million to the Swiss and international defined benefit plans and other post-retirement
defined benefit plans in 2017. As of the end of 3Q17, CHF 343 million of contributions have been made.
Components of total benefit costs
in 3Q17 2Q17 3Q16 9M17 9M16
Total benefit costs (CHF million)
Service costs on benefit obligation 67 67 77 200 232
Interest costs on benefit obligation 41 36 67 114 207
Expected return on plan assets (151) (151) (177) (454) (533)
Amortization of recognized prior service cost/(credit) (33) (33) (29) (98) (87)
Amortization of recognized actuarial losses 102 100 105 303 315
Net periodic benefit costs 26 19 43 65 134
Settlement losses/(gains) 0 0 0 (1) 2
Curtailment losses/(gains) (6) (8) (1) (32) (11)
Special termination benefits 8 4 7 12 11
Total benefit costs 28 15 49 44 136
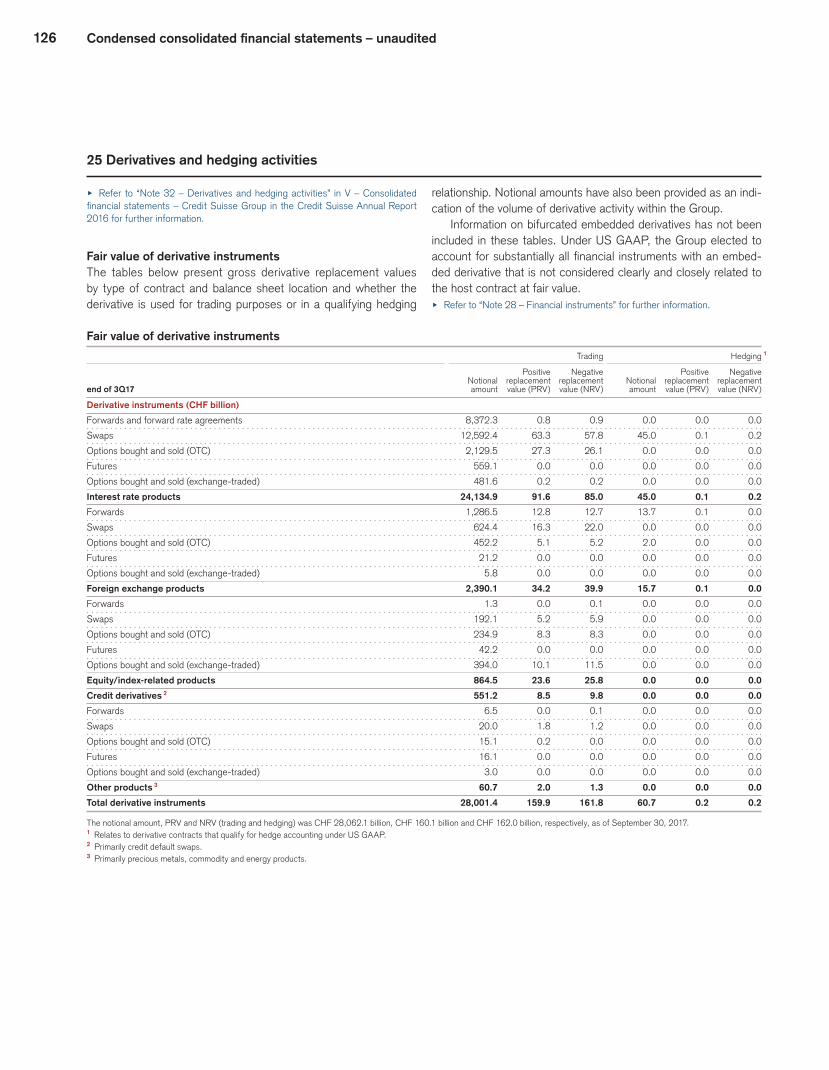
126 Condensed consolidated financial statements – unaudited
25 Derivatives and hedging activities
u Refer to “Note 32 – Derivatives and hedging activities” in V – Consolidated financial statements – Credit Suisse Group in the Credit Suisse Annual Report 2016 for further information.
Fair value of derivative instrumentsThe tables below present gross derivative replacement values by type of contract and balance sheet location and whether the derivative is used for trading purposes or in a qualifying hedging
relationship. Notional amounts have also been provided as an indi-cation of the volume of derivative activity within the Group.
Information on bifurcated embedded derivatives has not been included in these tables. Under US GAAP, the Group elected to account for substantially all financial instruments with an embed-ded derivative that is not considered clearly and closely related to the host contract at fair value.u Refer to “Note 28 – Financial instruments” for further information.
Fair value of derivative instruments Trading Hedging 1
Positive Negative Positive Negative Notional replacement replacement Notional replacement replacement end of 3Q17 amount value (PRV) value (NRV) amount value (PRV) value (NRV)
Derivative instruments (CHF billion)
Forwards and forward rate agreements 8,372.3 0.8 0.9 0.0 0.0 0.0
Swaps 12,592.4 63.3 57.8 45.0 0.1 0.2
Options bought and sold (OTC) 2,129.5 27.3 26.1 0.0 0.0 0.0
Futures 559.1 0.0 0.0 0.0 0.0 0.0
Options bought and sold (exchange-traded) 481.6 0.2 0.2 0.0 0.0 0.0
Interest rate products 24,134.9 91.6 85.0 45.0 0.1 0.2
Forwards 1,286.5 12.8 12.7 13.7 0.1 0.0
Swaps 624.4 16.3 22.0 0.0 0.0 0.0
Options bought and sold (OTC) 452.2 5.1 5.2 2.0 0.0 0.0
Futures 21.2 0.0 0.0 0.0 0.0 0.0
Options bought and sold (exchange-traded) 5.8 0.0 0.0 0.0 0.0 0.0
Foreign exchange products 2,390.1 34.2 39.9 15.7 0.1 0.0
Forwards 1.3 0.0 0.1 0.0 0.0 0.0
Swaps 192.1 5.2 5.9 0.0 0.0 0.0
Options bought and sold (OTC) 234.9 8.3 8.3 0.0 0.0 0.0
Futures 42.2 0.0 0.0 0.0 0.0 0.0
Options bought and sold (exchange-traded) 394.0 10.1 11.5 0.0 0.0 0.0
Equity/index-related products 864.5 23.6 25.8 0.0 0.0 0.0
Credit derivatives 2 551.2 8.5 9.8 0.0 0.0 0.0
Forwards 6.5 0.0 0.1 0.0 0.0 0.0
Swaps 20.0 1.8 1.2 0.0 0.0 0.0
Options bought and sold (OTC) 15.1 0.2 0.0 0.0 0.0 0.0
Futures 16.1 0.0 0.0 0.0 0.0 0.0
Options bought and sold (exchange-traded) 3.0 0.0 0.0 0.0 0.0 0.0
Other products 3 60.7 2.0 1.3 0.0 0.0 0.0
Total derivative instruments 28,001.4 159.9 161.8 60.7 0.2 0.2
The notional amount, PRV and NRV (trading and hedging) was CHF 28,062.1 billion, CHF 160.1 billion and CHF 162.0 billion, respectively, as of September 30, 2017.1 Relates to derivative contracts that qualify for hedge accounting under US GAAP.2 Primarily credit default swaps.3 Primarily precious metals, commodity and energy products.
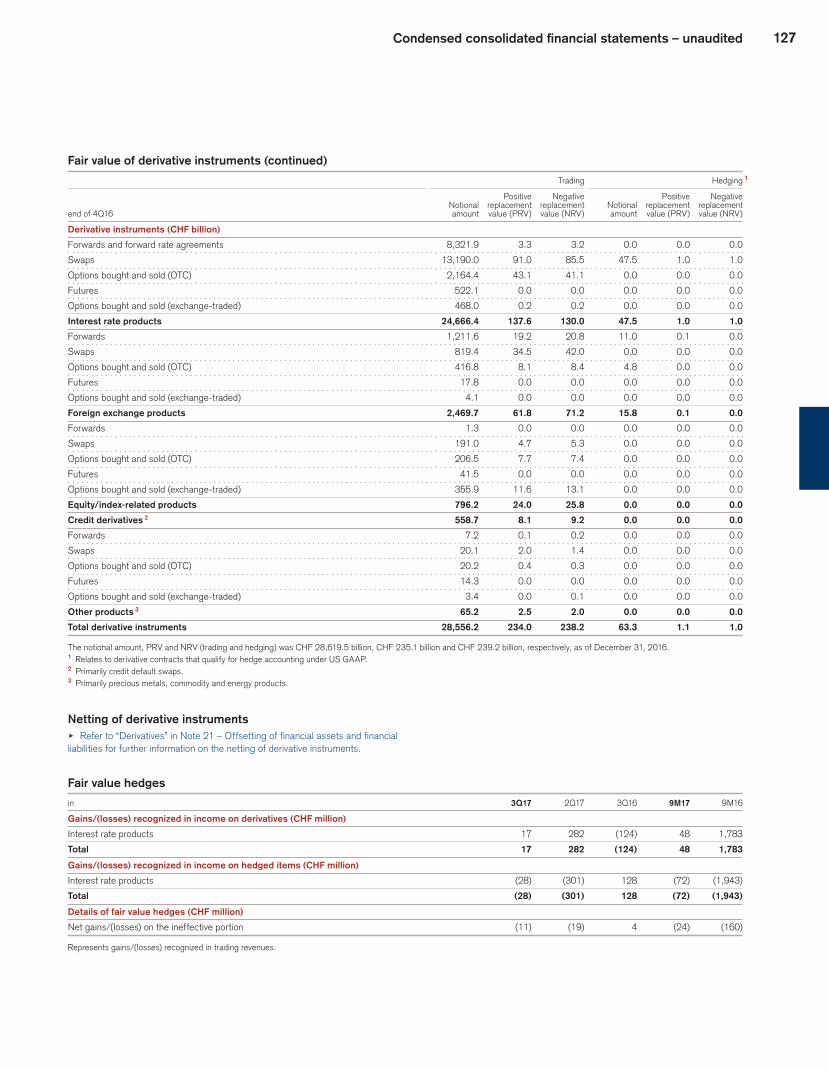
127Condensed consolidated financial statements – unaudited
Fair value of derivative instruments (continued) Trading Hedging 1
Positive Negative Positive Negative Notional replacement replacement Notional replacement replacement end of 4Q16 amount value (PRV) value (NRV) amount value (PRV) value (NRV)
Derivative instruments (CHF billion)
Forwards and forward rate agreements 8,321.9 3.3 3.2 0.0 0.0 0.0
Swaps 13,190.0 91.0 85.5 47.5 1.0 1.0
Options bought and sold (OTC) 2,164.4 43.1 41.1 0.0 0.0 0.0
Futures 522.1 0.0 0.0 0.0 0.0 0.0
Options bought and sold (exchange-traded) 468.0 0.2 0.2 0.0 0.0 0.0
Interest rate products 24,666.4 137.6 130.0 47.5 1.0 1.0
Forwards 1,211.6 19.2 20.8 11.0 0.1 0.0
Swaps 819.4 34.5 42.0 0.0 0.0 0.0
Options bought and sold (OTC) 416.8 8.1 8.4 4.8 0.0 0.0
Futures 17.8 0.0 0.0 0.0 0.0 0.0
Options bought and sold (exchange-traded) 4.1 0.0 0.0 0.0 0.0 0.0
Foreign exchange products 2,469.7 61.8 71.2 15.8 0.1 0.0
Forwards 1.3 0.0 0.0 0.0 0.0 0.0
Swaps 191.0 4.7 5.3 0.0 0.0 0.0
Options bought and sold (OTC) 206.5 7.7 7.4 0.0 0.0 0.0
Futures 41.5 0.0 0.0 0.0 0.0 0.0
Options bought and sold (exchange-traded) 355.9 11.6 13.1 0.0 0.0 0.0
Equity/index-related products 796.2 24.0 25.8 0.0 0.0 0.0
Credit derivatives 2 558.7 8.1 9.2 0.0 0.0 0.0
Forwards 7.2 0.1 0.2 0.0 0.0 0.0
Swaps 20.1 2.0 1.4 0.0 0.0 0.0
Options bought and sold (OTC) 20.2 0.4 0.3 0.0 0.0 0.0
Futures 14.3 0.0 0.0 0.0 0.0 0.0
Options bought and sold (exchange-traded) 3.4 0.0 0.1 0.0 0.0 0.0
Other products 3 65.2 2.5 2.0 0.0 0.0 0.0
Total derivative instruments 28,556.2 234.0 238.2 63.3 1.1 1.0
The notional amount, PRV and NRV (trading and hedging) was CHF 28,619.5 billion, CHF 235.1 billion and CHF 239.2 billion, respectively, as of December 31, 2016.1 Relates to derivative contracts that qualify for hedge accounting under US GAAP.2 Primarily credit default swaps.3 Primarily precious metals, commodity and energy products.
Netting of derivative instrumentsu Refer to “Derivatives” in Note 21 – Offsetting of financial assets and financial liabilities for further information on the netting of derivative instruments.
Fair value hedges
in 3Q17 2Q17 3Q16 9M17 9M16
Gains/(losses) recognized in income on derivatives (CHF million)
Interest rate products 17 282 (124) 48 1,783
Total 17 282 (124) 48 1,783
Gains/(losses) recognized in income on hedged items (CHF million)
Interest rate products (28) (301) 128 (72) (1,943)
Total (28) (301) 128 (72) (1,943)
Details of fair value hedges (CHF million)
Net gains/(losses) on the ineffective portion (11) (19) 4 (24) (160)
Represents gains/(losses) recognized in trading revenues.
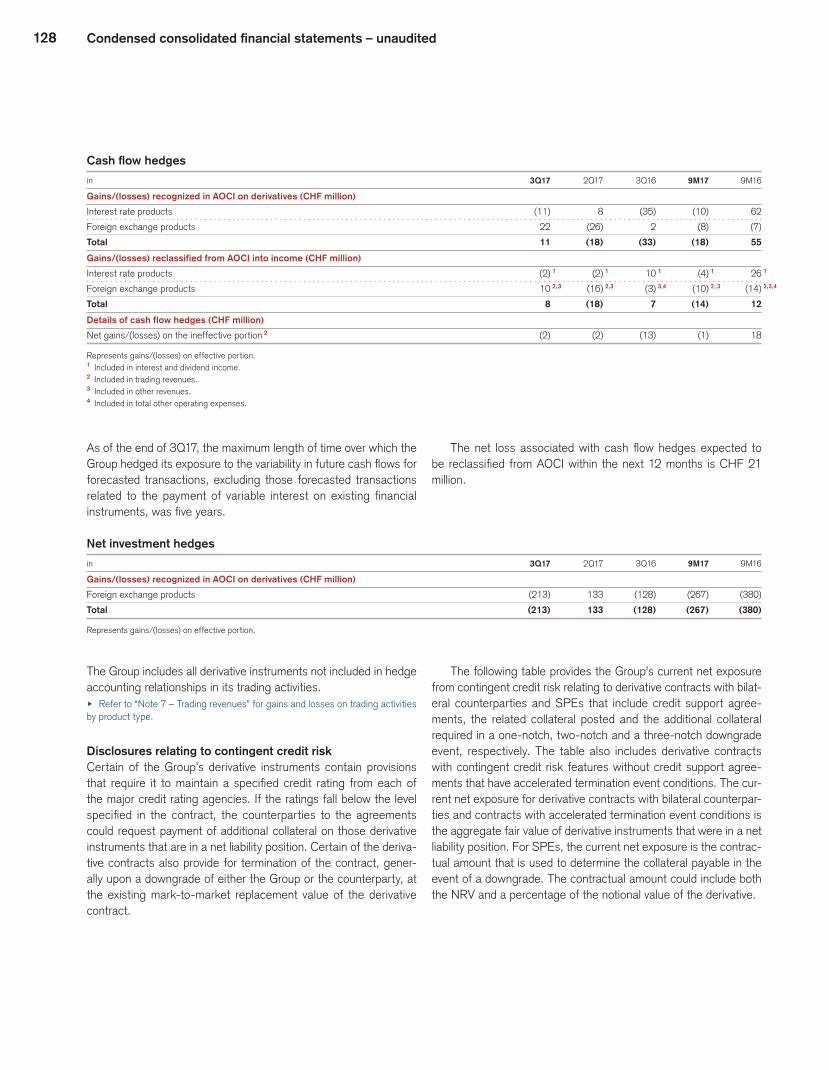
128 Condensed consolidated financial statements – unaudited
Cash flow hedges
in 3Q17 2Q17 3Q16 9M17 9M16
Gains/(losses) recognized in AOCI on derivatives (CHF million)
Interest rate products (11) 8 (35) (10) 62
Foreign exchange products 22 (26) 2 (8) (7)
Total 11 (18) (33) (18) 55
Gains/(losses) reclassified from AOCI into income (CHF million)
Interest rate products (2) 1 (2) 1 10 1 (4) 1 26 1
Foreign exchange products 10 2,3 (16) 2,3 (3) 3,4 (10) 2, 3 (14) 2,3,4
Total 8 (18) 7 (14) 12
Details of cash flow hedges (CHF million)
Net gains/(losses) on the ineffective portion 2 (2) (2) (13) (1) 18
Represents gains/(losses) on effective portion.1 Included in interest and dividend income.2 Included in trading revenues.3 Included in other revenues.4 Included in total other operating expenses.
As of the end of 3Q17, the maximum length of time over which the Group hedged its exposure to the variability in future cash flows for forecasted transactions, excluding those forecasted transactions related to the payment of variable interest on existing financial instruments, was five years.
The net loss associated with cash flow hedges expected to be reclassified from AOCI within the next 12 months is CHF 21 million.
Net investment hedges
in 3Q17 2Q17 3Q16 9M17 9M16
Gains/(losses) recognized in AOCI on derivatives (CHF million)
Foreign exchange products (213) 133 (128) (267) (380)
Total (213) 133 (128) (267) (380)
Represents gains/(losses) on effective portion.
The Group includes all derivative instruments not included in hedge accounting relationships in its trading activities.u Refer to “Note 7 – Trading revenues” for gains and losses on trading activities by product type.
Disclosures relating to contingent credit riskCertain of the Group’s derivative instruments contain provisions that require it to maintain a specified credit rating from each of the major credit rating agencies. If the ratings fall below the level specified in the contract, the counterparties to the agreements could request payment of additional collateral on those derivative instruments that are in a net liability position. Certain of the deriva-tive contracts also provide for termination of the contract, gener-ally upon a downgrade of either the Group or the counterparty, at the existing mark-to-market replacement value of the derivative contract.
The following table provides the Group’s current net exposure from contingent credit risk relating to derivative contracts with bilat-eral counterparties and SPEs that include credit support agree-ments, the related collateral posted and the additional collateral required in a one-notch, two-notch and a three-notch downgrade event, respectively. The table also includes derivative contracts with contingent credit risk features without credit support agree-ments that have accelerated termination event conditions. The cur-rent net exposure for derivative contracts with bilateral counterpar-ties and contracts with accelerated termination event conditions is the aggregate fair value of derivative instruments that were in a net liability position. For SPEs, the current net exposure is the contrac-tual amount that is used to determine the collateral payable in the event of a downgrade. The contractual amount could include both the NRV and a percentage of the notional value of the derivative.

129Condensed consolidated financial statements – unaudited
Contingent credit risk
end of 3Q17 4Q16
Special Special Bilateral purpose Accelerated Bilateral purpose Accelerated counterparties entities terminations Total counterparties entities terminations Total
Contingent credit risk (CHF billion)
Current net exposure 5.7 0.1 1.1 6.9 10.5 0.2 1.1 11.8
Collateral posted 4.6 0.1 – 4.7 9.5 0.2 – 9.7
Impact of a one-notch downgrade event 0.2 0.1 0.1 0.4 0.3 0.2 0.0 0.5
Impact of a two-notch downgrade event 1.0 0.2 0.5 1.7 1.3 0.4 0.5 2.2
Impact of a three-notch downgrade event 1.1 0.6 0.7 2.4 1.5 0.7 0.7 2.9
The impact of a downgrade event reflects the amount of additional collateral required for bilateral counterparties and special purpose entities and the amount of additional termination expenses for accelerated terminations, respectively.
Credit derivativesu Refer to “Note 32 – Derivatives and hedging activities” in V – Consolidated financial statements – Credit Suisse Group in the Credit Suisse Annual Report 2016 for further information on credit derivatives.
Credit protection sold/purchasedThe following tables do not include all credit derivatives and differ from the credit derivatives in the “Fair value of derivative instru-ments” tables. This is due to the exclusion of certain credit deriva-tive instruments under US GAAP, which defines a credit deriv-ative as a derivative instrument (a) in which one or more of its
underlyings are related to the credit risk of a specified entity (or a group of entities) or an index based on the credit risk of a group of entities and (b) that exposes the seller to potential loss from credit risk-related events specified in the contract.
Total return swaps (TRS) of CHF 6.4 billion and CHF 7.8 billion as of the end of 3Q17 and 4Q16, respectively, were also excluded because a TRS does not expose the seller to potential loss from credit risk-related events specified in the contract. A TRS only provides protection against a loss in asset value and not against additional amounts as a result of specific credit events.
Credit protection sold/purchased
end of 3Q17 4Q16
Net credit Fair value Net credit Fair value Credit Credit protection Other of credit Credit Credit protection Other of credit protection protection (sold)/ protection protection protection protection (sold)/ protection protection sold purchased 1 purchased purchased sold sold purchased 1 purchased purchased sold
Single-name instruments (CHF billion)
Investment grade 2 (63.7) 59.7 (4.0) 12.1 0.9 (72.4) 67.4 (5.0) 14.3 0.7
Non-investment grade (31.0) 28.1 (2.9) 16.1 (0.3) (30.3) 28.1 (2.2) 18.1 (1.0)
Total single-name instruments (94.7) 87.8 (6.9) 28.2 0.6 (102.7) 95.5 (7.2) 32.4 (0.3)
of which sovereign (23.0) 20.8 (2.2) 5.6 (0.6) (27.7) 25.6 (2.1) 6.5 (0.9)
of which non-sovereign (71.7) 67.0 (4.7) 22.6 1.2 (75.0) 69.9 (5.1) 25.9 0.6
Multi-name instruments (CHF billion)
Investment grade 2 (121.4) 115.2 (6.2) 34.2 0.3 (115.0) 113.9 (1.1) 41.2 0.0
Non-investment grade (26.8) 25.8 3 (1.0) 10.9 1.3 (20.9) 19.5 3 (1.4) 9.8 0.3
Total multi-name instruments (148.2) 141.0 (7.2) 45.1 1.6 (135.9) 133.4 (2.5) 51.0 0.3
of which sovereign (0.2) 0.2 0.0 0.4 0.0 (0.3) 0.2 (0.1) 0.7 0.1
of which non-sovereign (148.0) 140.8 (7.2) 44.7 1.6 (135.6) 133.2 (2.4) 50.3 0.2
Total instruments (CHF billion)
Investment grade 2 (185.1) 174.9 (10.2) 46.3 1.2 (187.4) 181.3 (6.1) 55.5 0.7
Non-investment grade (57.8) 53.9 (3.9) 27.0 1.0 (51.2) 47.6 (3.6) 27.9 (0.7)
Total instruments (242.9) 228.8 (14.1) 73.3 2.2 (238.6) 228.9 (9.7) 83.4 0.0
of which sovereign (23.2) 21.0 (2.2) 6.0 (0.6) (28.0) 25.8 (2.2) 7.2 (0.8)
of which non-sovereign (219.7) 207.8 (11.9) 67.3 2.8 (210.6) 203.1 (7.5) 76.2 0.8
1 Represents credit protection purchased with identical underlyings and recoveries.2 Based on internal ratings of BBB and above.3 Includes synthetic securitized loan portfolios.

130 Condensed consolidated financial statements – unaudited
Credit protection soldCredit protection sold is the maximum potential payout, which is based on the notional value of derivatives and represents the amount of future payments that the Group would be required to make as a result of credit risk-related events.
Credit protection purchasedCredit protection purchased represents those instruments where the underlying reference instrument is identical to the reference instrument of the credit protection sold.
Other protection purchasedIn the normal course of business, the Group purchases protection to offset the risk of credit protection sold that may have similar, but not identical, reference instruments and may use similar, but not identical, products, which reduces the total credit derivative expo-sure. Other protection purchased is based on the notional value of the instruments.
Fair value of credit protection soldThe fair values of the credit protection sold give an indication of the amount of payment risk, as the negative fair values increase when the potential payment under the derivative contracts becomes more probable.
The following table reconciles the notional amount of credit derivatives included in the table “Fair value of derivative instru-ments” to the table “Credit protection sold/purchased”.
Credit derivatives
end of 3Q17 4Q16
Credit derivatives (CHF billion)
Credit protection sold 242.9 238.6
Credit protection purchased 228.8 228.9
Other protection purchased 73.3 83.4
Other instruments 1 6.2 7.8
Total credit derivatives 551.2 558.7
1 Consists of total return swaps and other derivative instruments.
The segregation of the future payments by maturity range and underlying risk gives an indication of the current status of the potential for performance under the derivative contracts.
Maturity of credit protection sold Maturity Maturity Maturity
less between greater
than 1 to 5 than
end of 1 year years 5 years Total
3Q17 (CHF billion)
Single-name instruments 26.7 59.7 8.3 94.7
Multi-name instruments 46.6 66.7 34.9 148.2
Total instruments 73.3 126.4 43.2 242.9
4Q16 (CHF billion)
Single-name instruments 24.2 72.7 5.8 102.7
Multi-name instruments 27.5 84.7 23.7 135.9
Total instruments 51.7 157.4 29.5 238.6
26 Guarantees and commitments
GuaranteesIn the ordinary course of business, guarantees are provided that contingently obligate the Group to make payments to third par-ties if the counterparty fails to fulfill its obligation under a borrow-ing or other contractual arrangement. The total gross amount dis-closed within the Guarantees table reflects the maximum potential payment under the guarantees. The carrying value represents the higher of the initial fair value (generally the related fee received or receivable) less cumulative amortization and the Group’s cur-rent best estimate of payments that will be required under existing guarantee arrangements.
Guarantees provided by the Group are classified as follows: credit guarantees and similar instruments, performance guaran-tees and similar instruments, derivatives and other guarantees. The Group no longer provides guarantees for securities lending indemnifications.u Refer to “Guarantees” in V – Consolidated financial statements – Credit Suisse Group – Note 33 – Guarantees and commitments in the Credit Suisse Annual Report 2016 for a detailed description of guarantees.
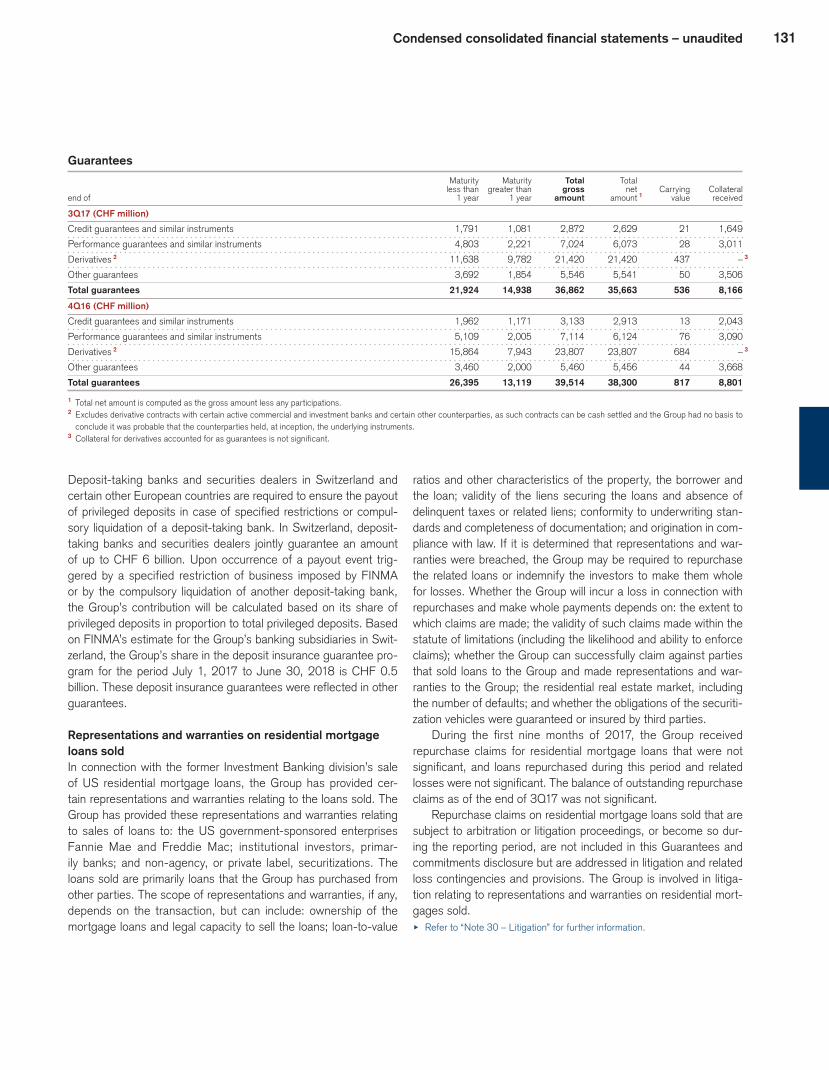
131Condensed consolidated financial statements – unaudited
Guarantees Maturity Maturity Total Total less than greater than gross net Carrying Collateral end of 1 year 1 year amount amount 1 value received
3Q17 (CHF million)
Credit guarantees and similar instruments 1,791 1,081 2,872 2,629 21 1,649
Performance guarantees and similar instruments 4,803 2,221 7,024 6,073 28 3,011
Derivatives 2 11,638 9,782 21,420 21,420 437 – 3
Other guarantees 3,692 1,854 5,546 5,541 50 3,506
Total guarantees 21,924 14,938 36,862 35,663 536 8,166
4Q16 (CHF million)
Credit guarantees and similar instruments 1,962 1,171 3,133 2,913 13 2,043
Performance guarantees and similar instruments 5,109 2,005 7,114 6,124 76 3,090
Derivatives 2 15,864 7,943 23,807 23,807 684 – 3
Other guarantees 3,460 2,000 5,460 5,456 44 3,668
Total guarantees 26,395 13,119 39,514 38,300 817 8,801
1 Total net amount is computed as the gross amount less any participations.2 Excludes derivative contracts with certain active commercial and investment banks and certain other counterparties, as such contracts can be cash settled and the Group had no basis to
conclude it was probable that the counterparties held, at inception, the underlying instruments.3 Collateral for derivatives accounted for as guarantees is not significant.
Deposit-taking banks and securities dealers in Switzerland and certain other European countries are required to ensure the payout of privileged deposits in case of specified restrictions or compul-sory liquidation of a deposit-taking bank. In Switzerland, deposit-taking banks and securities dealers jointly guarantee an amount of up to CHF 6 billion. Upon occurrence of a payout event trig-gered by a specified restriction of business imposed by FINMA or by the compulsory liquidation of another deposit-taking bank, the Group’s contribution will be calculated based on its share of privileged deposits in proportion to total privileged deposits. Based on FINMA’s estimate for the Group’s banking subsidiaries in Swit-zerland, the Group’s share in the deposit insurance guarantee pro-gram for the period July 1, 2017 to June 30, 2018 is CHF 0.5 billion. These deposit insurance guarantees were reflected in other guarantees.
Representations and warranties on residential mortgage loans soldIn connection with the former Investment Banking division’s sale of US residential mortgage loans, the Group has provided cer-tain representations and warranties relating to the loans sold. The Group has provided these representations and warranties relating to sales of loans to: the US government-sponsored enterprises Fannie Mae and Freddie Mac; institutional investors, primar-ily banks; and non-agency, or private label, securitizations. The loans sold are primarily loans that the Group has purchased from other parties. The scope of representations and warranties, if any, depends on the transaction, but can include: ownership of the mortgage loans and legal capacity to sell the loans; loan-to-value
ratios and other characteristics of the property, the borrower and the loan; validity of the liens securing the loans and absence of delinquent taxes or related liens; conformity to underwriting stan-dards and completeness of documentation; and origination in com-pliance with law. If it is determined that representations and war-ranties were breached, the Group may be required to repurchase the related loans or indemnify the investors to make them whole for losses. Whether the Group will incur a loss in connection with repurchases and make whole payments depends on: the extent to which claims are made; the validity of such claims made within the statute of limitations (including the likelihood and ability to enforce claims); whether the Group can successfully claim against parties that sold loans to the Group and made representations and war-ranties to the Group; the residential real estate market, including the number of defaults; and whether the obligations of the securiti-zation vehicles were guaranteed or insured by third parties.
During the first nine months of 2017, the Group received repurchase claims for residential mortgage loans that were not significant, and loans repurchased during this period and related losses were not significant. The balance of outstanding repurchase claims as of the end of 3Q17 was not significant.
Repurchase claims on residential mortgage loans sold that are subject to arbitration or litigation proceedings, or become so dur-ing the reporting period, are not included in this Guarantees and commitments disclosure but are addressed in litigation and related loss contingencies and provisions. The Group is involved in litiga-tion relating to representations and warranties on residential mort-gages sold. u Refer to “Note 30 – Litigation” for further information.
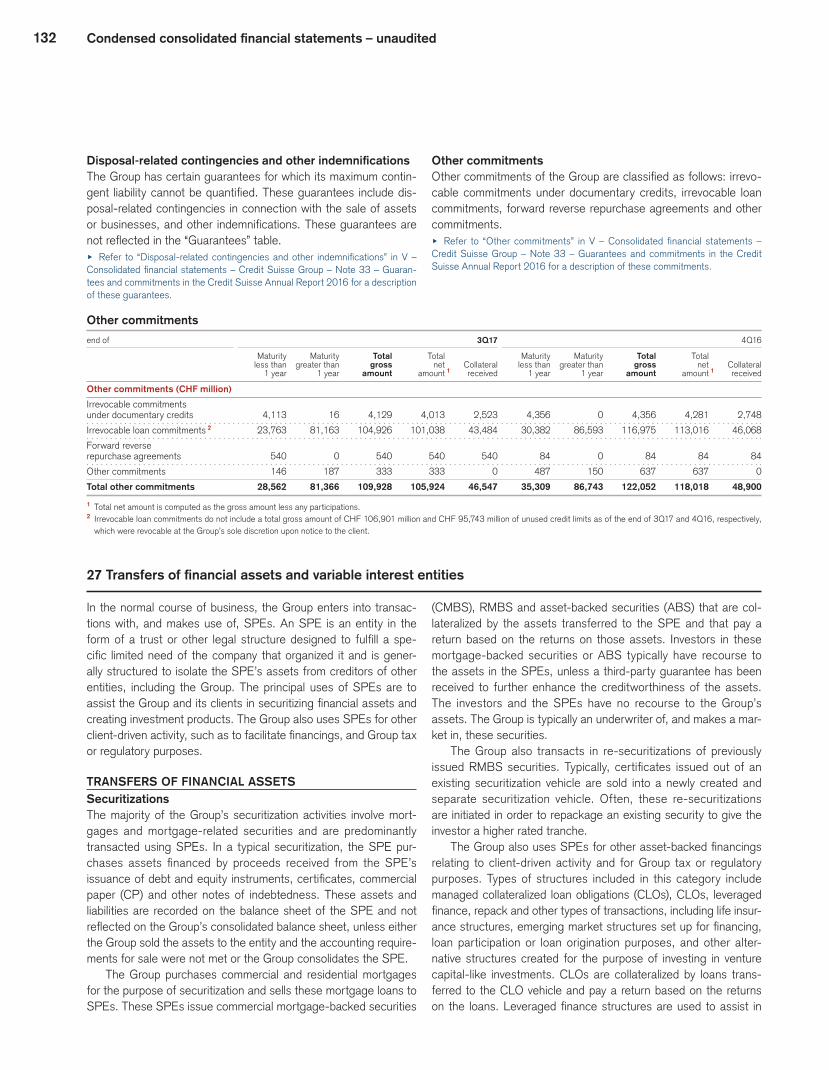
132 Condensed consolidated financial statements – unaudited
Disposal-related contingencies and other indemnificationsThe Group has certain guarantees for which its maximum contin-gent liability cannot be quantified. These guarantees include dis-posal-related contingencies in connection with the sale of assets or businesses, and other indemnifications. These guarantees are not reflected in the “Guarantees” table.u Refer to “Disposal-related contingencies and other indemnifications” in V – Consolidated financial statements – Credit Suisse Group – Note 33 – Guaran-tees and commitments in the Credit Suisse Annual Report 2016 for a description of these guarantees.
Other commitmentsOther commitments of the Group are classified as follows: irrevo-cable commitments under documentary credits, irrevocable loan commitments, forward reverse repurchase agreements and other commitments.u Refer to “Other commitments” in V – Consolidated financial statements – Credit Suisse Group – Note 33 – Guarantees and commitments in the Credit Suisse Annual Report 2016 for a description of these commitments.
Other commitments
end of 3Q17 4Q16
Maturity Maturity Total Total Maturity Maturity Total Total less than greater than gross net Collateral less than greater than gross net Collateral 1 year 1 year amount amount 1 received 1 year 1 year amount amount 1 received
Other commitments (CHF million)
Irrevocable commitments
under documentary credits 4,113 16 4,129 4,013 2,523 4,356 0 4,356 4,281 2,748
Irrevocable loan commitments 2 23,763 81,163 104,926 101,038 43,484 30,382 86,593 116,975 113,016 46,068
Forward reverse
repurchase agreements 540 0 540 540 540 84 0 84 84 84
Other commitments 146 187 333 333 0 487 150 637 637 0
Total other commitments 28,562 81,366 109,928 105,924 46,547 35,309 86,743 122,052 118,018 48,900
1 Total net amount is computed as the gross amount less any participations.2 Irrevocable loan commitments do not include a total gross amount of CHF 106,901 million and CHF 95,743 million of unused credit limits as of the end of 3Q17 and 4Q16, respectively,
which were revocable at the Group’s sole discretion upon notice to the client.
27 Transfers of financial assets and variable interest entities
In the normal course of business, the Group enters into transac-tions with, and makes use of, SPEs. An SPE is an entity in the form of a trust or other legal structure designed to fulfill a spe-cific limited need of the company that organized it and is gener-ally structured to isolate the SPE’s assets from creditors of other entities, including the Group. The principal uses of SPEs are to assist the Group and its clients in securitizing financial assets and creating investment products. The Group also uses SPEs for other client-driven activity, such as to facilitate financings, and Group tax or regulatory purposes.
TRANSFERS OF FINANCIAL ASSETSSecuritizationsThe majority of the Group’s securitization activities involve mort-gages and mortgage-related securities and are predominantly transacted using SPEs. In a typical securitization, the SPE pur-chases assets financed by proceeds received from the SPE’s issuance of debt and equity instruments, certificates, commercial paper (CP) and other notes of indebtedness. These assets and liabilities are recorded on the balance sheet of the SPE and not reflected on the Group’s consolidated balance sheet, unless either the Group sold the assets to the entity and the accounting require-ments for sale were not met or the Group consolidates the SPE.
The Group purchases commercial and residential mortgages for the purpose of securitization and sells these mortgage loans to SPEs. These SPEs issue commercial mortgage-backed securities
(CMBS), RMBS and asset-backed securities (ABS) that are col-lateralized by the assets transferred to the SPE and that pay a return based on the returns on those assets. Investors in these mortgage-backed securities or ABS typically have recourse to the assets in the SPEs, unless a third-party guarantee has been received to further enhance the creditworthiness of the assets. The investors and the SPEs have no recourse to the Group’s assets. The Group is typically an underwriter of, and makes a mar-ket in, these securities.
The Group also transacts in re-securitizations of previously issued RMBS securities. Typically, certificates issued out of an existing securitization vehicle are sold into a newly created and separate securitization vehicle. Often, these re-securitizations are initiated in order to repackage an existing security to give the investor a higher rated tranche.
The Group also uses SPEs for other asset-backed financings relating to client-driven activity and for Group tax or regulatory purposes. Types of structures included in this category include managed collateralized loan obligations (CLOs), CLOs, leveraged finance, repack and other types of transactions, including life insur-ance structures, emerging market structures set up for financing, loan participation or loan origination purposes, and other alter-native structures created for the purpose of investing in venture capital-like investments. CLOs are collateralized by loans trans-ferred to the CLO vehicle and pay a return based on the returns on the loans. Leveraged finance structures are used to assist in

133Condensed consolidated financial statements – unaudited
the syndication of certain loans held by the Group, while repack structures are designed to give a client collateralized exposure to specific cash flows or credit risk backed by collateral purchased from the Group. In these asset-backed financing structures inves-tors typically only have recourse to the collateral of the SPE and do not have recourse to the Group’s assets.
When the Group transfers assets into an SPE, it must assess whether that transfer is accounted for as a sale of the assets. Transfers of assets may not meet sale requirements if the assets have not been legally isolated from the Group and/or if the Group’s continuing involvement is deemed to give it effective control over the assets. If the transfer is not deemed a sale, it is instead accounted for as a secured borrowing, with the transferred assets as collateral.
Gains and losses on securitization transactions depend, in part, on the carrying values of mortgages and loans involved in the transfer and are allocated between the assets sold and any beneficial interests retained according to the relative fair values at the date of sale.
The Group does not retain material servicing responsibilities from securitization activities.
The following table provides the gains or losses and proceeds from the transfer of assets relating to 9M17 and 9M16 securi-tizations of financial assets that qualify for sale accounting and subsequent derecognition, along with the cash flows between the Group and the SPEs used in any securitizations in which the Group maintained continuing involvement from the time of the transac-tion, regardless of when the securitization occurred.
Securitizations
in 9M17 9M16
Gains and cash flows (CHF million)
CMBS
Net gain 1 32 0
Proceeds from transfer of assets 4,234 3,315
Cash received on interests that continue to be held 23 53
RMBS
Net gain/(loss) 1 3 (1)
Proceeds from transfer of assets 11,329 7,706
Servicing fees 2 2
Cash received on interests that continue to be held 225 394
Other asset-backed financings
Net gain 1 31 22
Proceeds from transfer of assets 5,833 1,963
Fees 2 93 93
Cash received on interests that continue to be held 4 2
1 Includes underwriting revenues, deferred origination fees, gains or losses on the sale of collateral to the SPE and gains or losses on the sale of newly issued securities to third parties, but excludes net interest income on assets prior to the securitization. The gains or losses on the sale of the collateral is the difference between the fair value on the day prior to the securitization pricing date and the sale price of the loans.
2 Represents management fees and performance fees earned for investment management services provided to managed CLOs.
Continuing involvement in transferred financial assetsThe Group may have continuing involvement in the financial assets that are transferred to an SPE which may take several forms, including, but not limited to, servicing, recourse and guarantee arrangements, agreements to purchase or redeem transferred assets, derivative instruments, pledges of collateral and beneficial interests in the transferred assets.u Refer to “Transfer of financial assets” in V – Consolidated financial statements – Credit Suisse Group – Note 34 – Transfer of financial assets and variable inter-est entities in the Credit Suisse Annual Report 2016 for a detailed description of continuing involvement in transferred financial assets.
The following table provides the outstanding principal balance of assets to which the Group continued to be exposed after the transfer of the financial assets to any SPE and the total assets of the SPE as of the end of 3Q17 and 4Q16, regardless of when the transfer of assets occurred.
Principal amounts outstanding and total assets of SPEs resulting from continuing involvement
end of 3Q17 4Q16
CHF million
CMBS
Principal amount outstanding 20,968 28,779
Total assets of SPE 31,424 40,234
RMBS
Principal amount outstanding 35,152 38,319
Total assets of SPE 36,310 39,680
Other asset-backed financings
Principal amount outstanding 20,295 19,777
Total assets of SPE 36,348 36,049
Principal amount outstanding relates to assets transferred from the Group and does not include principal amounts for assets transferred from third parties.
Fair value of beneficial interestsThe fair value measurement of the beneficial interests held at the time of transfer and as of the reporting date that result from any continuing involvement is determined using fair value estimation techniques, such as the present value of estimated future cash flows that incorporate assumptions that market participants cus-tomarily use in these valuation techniques. The fair value of the assets or liabilities that result from any continuing involvement does not include any benefits from financial instruments that the Group may utilize to hedge the inherent risks.
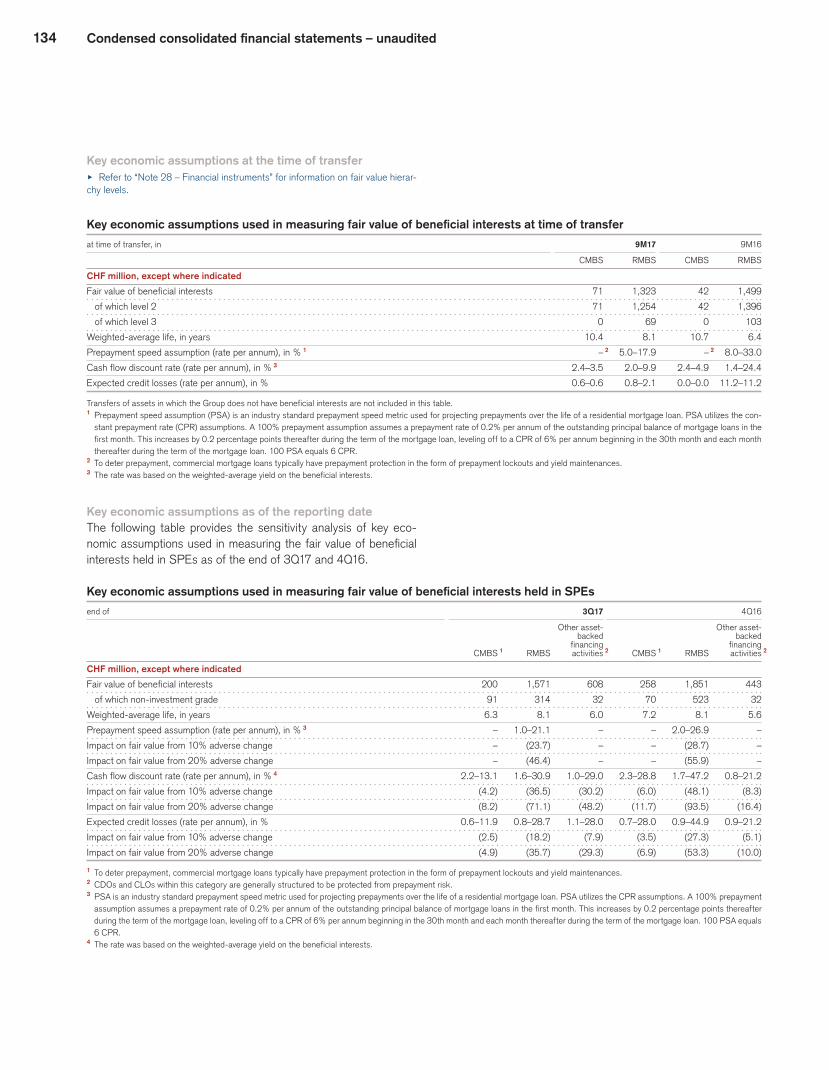
134 Condensed consolidated financial statements – unaudited
Key economic assumptions at the time of transferu Refer to “Note 28 – Financial instruments” for information on fair value hierar-chy levels.
Key economic assumptions used in measuring fair value of beneficial interests at time of transfer
at time of transfer, in 9M17 9M16
CMBS RMBS CMBS RMBS
CHF million, except where indicated
Fair value of beneficial interests 71 1,323 42 1,499
of which level 2 71 1,254 42 1,396
of which level 3 0 69 0 103
Weighted-average life, in years 10.4 8.1 10.7 6.4
Prepayment speed assumption (rate per annum), in % 1 – 2 5.0–17.9 – 2 8.0–33.0
Cash flow discount rate (rate per annum), in % 3 2.4–3.5 2.0–9.9 2.4–4.9 1.4–24.4
Expected credit losses (rate per annum), in % 0.6–0.6 0.8–2.1 0.0–0.0 11.2–11.2
Transfers of assets in which the Group does not have beneficial interests are not included in this table.1 Prepayment speed assumption (PSA) is an industry standard prepayment speed metric used for projecting prepayments over the life of a residential mortgage loan. PSA utilizes the con-
stant prepayment rate (CPR) assumptions. A 100% prepayment assumption assumes a prepayment rate of 0.2% per annum of the outstanding principal balance of mortgage loans in the first month. This increases by 0.2 percentage points thereafter during the term of the mortgage loan, leveling off to a CPR of 6% per annum beginning in the 30th month and each month thereafter during the term of the mortgage loan. 100 PSA equals 6 CPR.
2 To deter prepayment, commercial mortgage loans typically have prepayment protection in the form of prepayment lockouts and yield maintenances.3 The rate was based on the weighted-average yield on the beneficial interests.
Key economic assumptions as of the reporting dateThe following table provides the sensitivity analysis of key eco-nomic assumptions used in measuring the fair value of beneficial interests held in SPEs as of the end of 3Q17 and 4Q16.
Key economic assumptions used in measuring fair value of beneficial interests held in SPEs
end of 3Q17 4Q16
Other asset- Other asset- backed backed financing financing CMBS 1 RMBS activities 2 CMBS 1 RMBS activities 2
CHF million, except where indicated
Fair value of beneficial interests 200 1,571 608 258 1,851 443
of which non-investment grade 91 314 32 70 523 32
Weighted-average life, in years 6.3 8.1 6.0 7.2 8.1 5.6
Prepayment speed assumption (rate per annum), in % 3 – 1.0–21.1 – – 2.0–26.9 –
Impact on fair value from 10% adverse change – (23.7) – – (28.7) –
Impact on fair value from 20% adverse change – (46.4) – – (55.9) –
Cash flow discount rate (rate per annum), in % 4 2.2–13.1 1.6–30.9 1.0–29.0 2.3–28.8 1.7–47.2 0.8–21.2
Impact on fair value from 10% adverse change (4.2) (36.5) (30.2) (6.0) (48.1) (8.3)
Impact on fair value from 20% adverse change (8.2) (71.1) (48.2) (11.7) (93.5) (16.4)
Expected credit losses (rate per annum), in % 0.6–11.9 0.8–28.7 1.1–28.0 0.7–28.0 0.9–44.9 0.9–21.2
Impact on fair value from 10% adverse change (2.5) (18.2) (7.9) (3.5) (27.3) (5.1)
Impact on fair value from 20% adverse change (4.9) (35.7) (29.3) (6.9) (53.3) (10.0)
1 To deter prepayment, commercial mortgage loans typically have prepayment protection in the form of prepayment lockouts and yield maintenances.2 CDOs and CLOs within this category are generally structured to be protected from prepayment risk.3 PSA is an industry standard prepayment speed metric used for projecting prepayments over the life of a residential mortgage loan. PSA utilizes the CPR assumptions. A 100% prepayment
assumption assumes a prepayment rate of 0.2% per annum of the outstanding principal balance of mortgage loans in the first month. This increases by 0.2 percentage points thereafter during the term of the mortgage loan, leveling off to a CPR of 6% per annum beginning in the 30th month and each month thereafter during the term of the mortgage loan. 100 PSA equals 6 CPR.
4 The rate was based on the weighted-average yield on the beneficial interests.
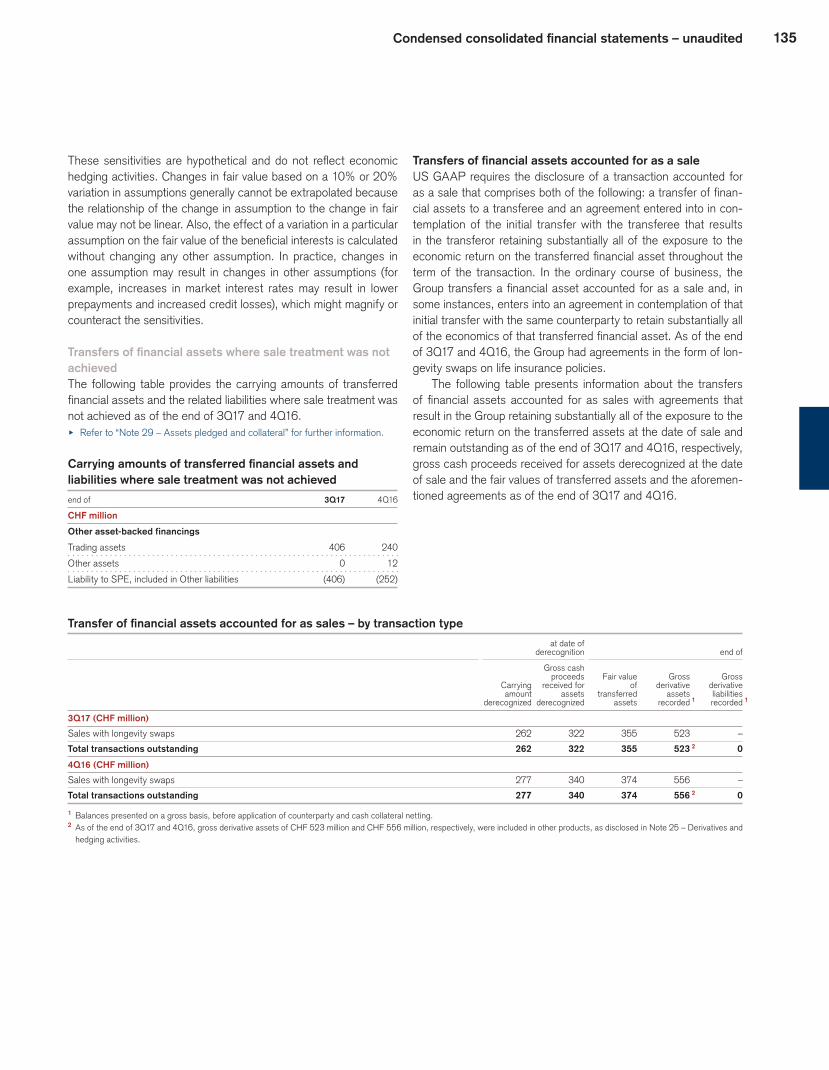
135Condensed consolidated financial statements – unaudited
These sensitivities are hypothetical and do not reflect economic hedging activities. Changes in fair value based on a 10% or 20% variation in assumptions generally cannot be extrapolated because the relationship of the change in assumption to the change in fair value may not be linear. Also, the effect of a variation in a particular assumption on the fair value of the beneficial interests is calculated without changing any other assumption. In practice, changes in one assumption may result in changes in other assumptions (for example, increases in market interest rates may result in lower prepayments and increased credit losses), which might magnify or counteract the sensitivities.
Transfers of financial assets where sale treatment was not achievedThe following table provides the carrying amounts of transferred financial assets and the related liabilities where sale treatment was not achieved as of the end of 3Q17 and 4Q16. u Refer to “Note 29 – Assets pledged and collateral” for further information.
Carrying amounts of transferred financial assets and liabilities where sale treatment was not achieved
end of 3Q17 4Q16
CHF million
Other asset-backed financings
Trading assets 406 240
Other assets 0 12
Liability to SPE, included in Other liabilities (406) (252)
Transfers of financial assets accounted for as a saleUS GAAP requires the disclosure of a transaction accounted for as a sale that comprises both of the following: a transfer of finan-cial assets to a transferee and an agreement entered into in con-templation of the initial transfer with the transferee that results in the transferor retaining substantially all of the exposure to the economic return on the transferred financial asset throughout the term of the transaction. In the ordinary course of business, the Group transfers a financial asset accounted for as a sale and, in some instances, enters into an agreement in contemplation of that initial transfer with the same counterparty to retain substantially all of the economics of that transferred financial asset. As of the end of 3Q17 and 4Q16, the Group had agreements in the form of lon-gevity swaps on life insurance policies.
The following table presents information about the transfers of financial assets accounted for as sales with agreements that result in the Group retaining substantially all of the exposure to the economic return on the transferred assets at the date of sale and remain outstanding as of the end of 3Q17 and 4Q16, respectively, gross cash proceeds received for assets derecognized at the date of sale and the fair values of transferred assets and the aforemen-tioned agreements as of the end of 3Q17 and 4Q16.
Transfer of financial assets accounted for as sales – by transaction type at date of derecognition end of
Gross cash proceeds Fair value Gross Gross Carrying received for of derivative derivative amount assets transferred assets liabilities derecognized derecognized assets recorded 1 recorded 1
3Q17 (CHF million)
Sales with longevity swaps 262 322 355 523 –
Total transactions outstanding 262 322 355 523 2 0
4Q16 (CHF million)
Sales with longevity swaps 277 340 374 556 –
Total transactions outstanding 277 340 374 556 2 0
1 Balances presented on a gross basis, before application of counterparty and cash collateral netting.2 As of the end of 3Q17 and 4Q16, gross derivative assets of CHF 523 million and CHF 556 million, respectively, were included in other products, as disclosed in Note 25 – Derivatives and
hedging activities.

136 Condensed consolidated financial statements – unaudited
Securities sold under repurchase agreements and securities lending transactions accounted for as secured borrowingsFor securities sold under repurchase agreements and securities lending transactions accounted for as secured borrowings, US GAAP requires the disclosure of the collateral pledged and the associated risks to which a transferor continues to be exposed after the transfer. This provides an understanding of the nature and risks of short-term collateralized financing obtained through these types of transactions.
Securities sold under repurchase agreements and securities lending transactions represent collateralized financing transactions used to earn net interest income, increase liquidity or facilitate trading activities. These transactions are collateralized principally by government debt securities, corporate debt securities, asset-backed securities, equity securities and other collateral and have terms ranging from on demand to a longer period of time.
In the event of the Group’s default or a decline in fair value of collateral pledged, the repurchase agreement provides the coun-terparty with the right to liquidate the collateral held or request additional collateral. Similarly, in the event of the Group’s default, the securities lending transaction provides the counterparty the right to liquidate the securities borrowed.
The following tables provide the gross obligation relating to securities sold under repurchase agreements, securities lend-ing transactions and obligation to return securities received as
collateral by the class of collateral pledged and by remaining con-tractual maturity as of the end of 3Q17 and 4Q16.
Securities sold under repurchase agreements, securities lending transactions and obligation to return securities received as collateral – by class of collateral pledged
end of 3Q17 4Q16
CHF billion
Government debt securities 26.5 29.4
Corporate debt securities 16.5 13.9
Asset-backed securities 8.4 10.3
Equity securities 0.6 1.1
Other 0.4 0.3
Securities sold under repurchase agreements 52.4 55.0
Government debt securities 2.8 2.5
Corporate debt securities 0.4 0.5
Equity securities 6.2 6.0
Other 0.3 0.4
Securities lending transactions 9.7 9.4
Government debt securities 2.3 0.7
Corporate debt securities 0.5 0.4
Equity securities 33.1 31.5
Obligation to return securities received
as collateral, at fair value 35.9 32.6
Total 98.0 97.0
Securities sold under repurchase agreements, securities lending transactions and obligation to return securities received as collateral – by remaining contractual maturity Remaining contractual maturities
Up to 31 – 90 More than
end of On demand 1 30 days 2 days 90 days Total
3Q17 (CHF billion)
Securities sold under repurchase agreements 8.1 27.2 8.0 9.1 52.4
Securities lending transactions 7.1 2.4 0.0 0.2 9.7
Obligation to return securities received as collateral, at fair value 35.7 0.0 0.0 0.2 35.9
Total 50.9 29.6 8.0 9.5 98.0
4Q16 (CHF billion)
Securities sold under repurchase agreements 6.8 31.9 8.4 7.9 55.0
Securities lending transactions 6.7 2.4 0.0 0.3 9.4
Obligation to return securities received as collateral, at fair value 32.2 0.4 0.0 0.0 32.6
Total 45.7 34.7 8.4 8.2 97.0
1 Includes contracts with no contractual maturity that may contain termination arrangements subject to a notice period.2 Includes overnight transactions.
u Refer to “Note 21 – Offsetting of financial assets and financial liabilities” for further information on the gross amount of securities sold under repurchase agreements, securities lending transactions and obligation to return securities received as collateral and the net amounts disclosed in the consolidated balance sheets.

137Condensed consolidated financial statements – unaudited
VARIABLE INTEREST ENTITIESAs a normal part of its business, the Group engages in various transactions that include entities that are considered variable inter-est entities (VIEs) and are grouped into three primary categories: collateralized debt obligations (CDOs)/CLOs, CP conduits and financial intermediation.u Refer to “Variable interest entities” in V – Consolidated financial statements – Credit Suisse Group – Note 34 – Transfer of financial assets and variable inter-est entities in the Credit Suisse Annual Report 2016 for a detailed description of VIEs, CDO/CLOs, CP conduit or financial intermediation.
Collateralized debt and loan obligationsThe Group engages in CDO/CLO transactions to meet client and investor needs, earn fees and sell financial assets. The Group may act as underwriter, placement agent or asset manager and may warehouse assets prior to the closing of a transaction.
Commercial paper conduitIn 2Q16, the Group established Alpine Securitization Ltd (Alpine), a multi-seller asset-backed CP conduit used for client and Group financing purposes. The Group acts as the administrator and pro-vider of liquidity and credit enhancement facilities for Alpine. Alpine discloses to CP investors certain portfolio and asset data and sub-mits its portfolio to rating agencies for public ratings. This CP con-duit purchases assets such as loans and receivables or enters into reverse repurchase agreements and finances such activities through the issuance of CP backed by these assets. The CP con-duit can enter into liquidity facilities with third-party entities pursu-ant to which it may purchase assets from these entities to provide them with liquidity and credit support. The financing transactions are structured to provide credit support to the CP conduit in the form of over-collateralization and other asset-specific enhance-ments. Alpine is a separate legal entity that is wholly owned by the Group. However, its assets are available to satisfy only the claims of its creditors. In addition, the Group, as administrator and liquid-ity facility provider, has significant exposure to and power over the activities of Alpine. Alpine is considered a VIE for accounting
purposes and the Group is deemed the primary beneficiary and consolidates this entity.
The overall average maturity of the conduit’s outstanding CP was approximately 164 days as of the end of 3Q17. Alpine was rated A-1(sf) by Standard & Poor’s and P-1(sf) by Moody’s and had exposures mainly in a reverse repurchase agreement, credit card receivables, student loans and car loans.
The Group’s commitment to this CP conduit consists of obli-gations under liquidity agreements. The liquidity agreements are asset-specific arrangements, which require the Group to purchase assets from the CP conduit in certain circumstances, including a lack of liquidity in the CP market such that the CP conduit cannot refinance its obligations or, in some cases, a default of an underly-ing asset. The asset-specific credit enhancements provided by the client seller of the assets remain unchanged as a result of such a purchase. In entering into such agreements, the Group reviews the credit risk associated with these transactions on the same basis that would apply to other extensions of credit.
The Group’s economic risks associated with the CP conduit are included in the Group’s risk management framework including counterparty, economic risk capital and scenario analysis.
Financial intermediationThe Group has significant involvement with VIEs in its role as a financial intermediary on behalf of clients.
Financial intermediation consists of securitizations, funds, loans and other vehicles.
Consolidated VIEsThe Group has significant involvement with VIEs in its role as a financial intermediary on behalf of clients. The Group consolidates all VIEs related to financial intermediation for which it was the pri-mary beneficiary.
The consolidated VIEs tables provide the carrying amounts and classifications of the assets and liabilities of consolidated VIEs as of the end of 3Q17 and 4Q16.
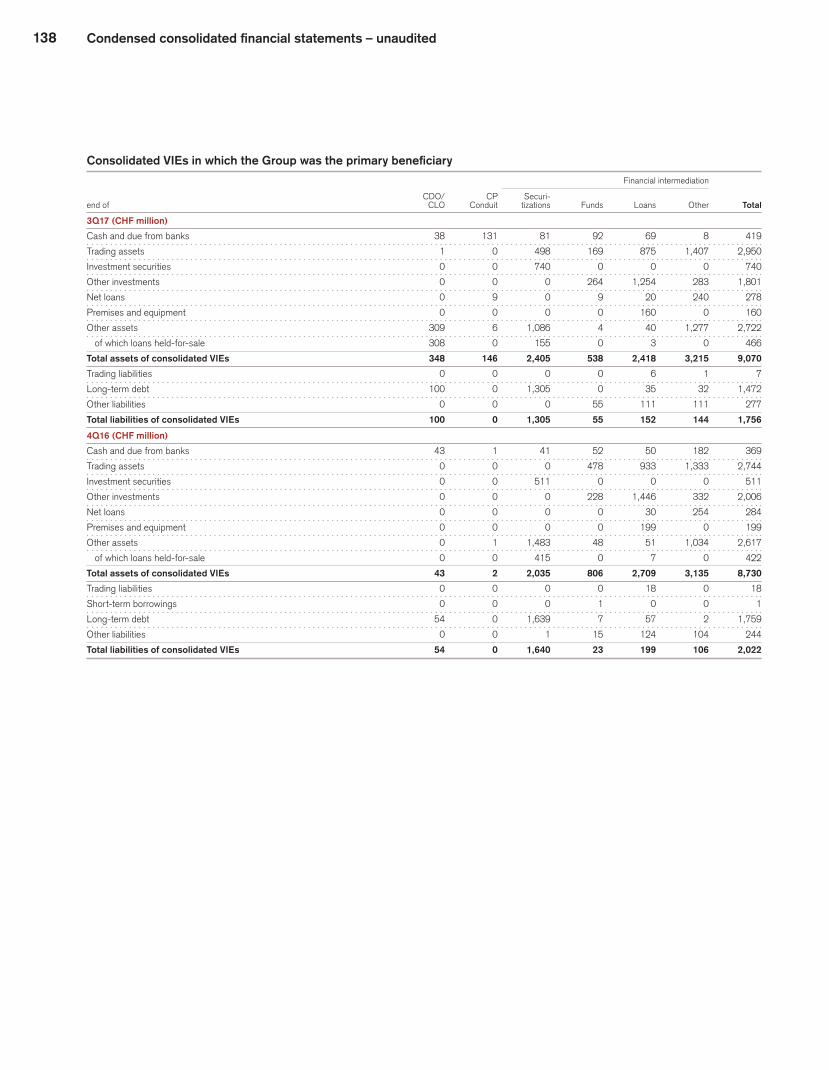
138 Condensed consolidated financial statements – unaudited
Consolidated VIEs in which the Group was the primary beneficiary Financial intermediation
CDO/ CP Securi-
end of CLO Conduit tizations Funds Loans Other Total
3Q17 (CHF million)
Cash and due from banks 38 131 81 92 69 8 419
Trading assets 1 0 498 169 875 1,407 2,950
Investment securities 0 0 740 0 0 0 740
Other investments 0 0 0 264 1,254 283 1,801
Net loans 0 9 0 9 20 240 278
Premises and equipment 0 0 0 0 160 0 160
Other assets 309 6 1,086 4 40 1,277 2,722
of which loans held-for-sale 308 0 155 0 3 0 466
Total assets of consolidated VIEs 348 146 2,405 538 2,418 3,215 9,070
Trading liabilities 0 0 0 0 6 1 7
Long-term debt 100 0 1,305 0 35 32 1,472
Other liabilities 0 0 0 55 111 111 277
Total liabilities of consolidated VIEs 100 0 1,305 55 152 144 1,756
4Q16 (CHF million)
Cash and due from banks 43 1 41 52 50 182 369
Trading assets 0 0 0 478 933 1,333 2,744
Investment securities 0 0 511 0 0 0 511
Other investments 0 0 0 228 1,446 332 2,006
Net loans 0 0 0 0 30 254 284
Premises and equipment 0 0 0 0 199 0 199
Other assets 0 1 1,483 48 51 1,034 2,617
of which loans held-for-sale 0 0 415 0 7 0 422
Total assets of consolidated VIEs 43 2 2,035 806 2,709 3,135 8,730
Trading liabilities 0 0 0 0 18 0 18
Short-term borrowings 0 0 0 1 0 0 1
Long-term debt 54 0 1,639 7 57 2 1,759
Other liabilities 0 0 1 15 124 104 244
Total liabilities of consolidated VIEs 54 0 1,640 23 199 106 2,022
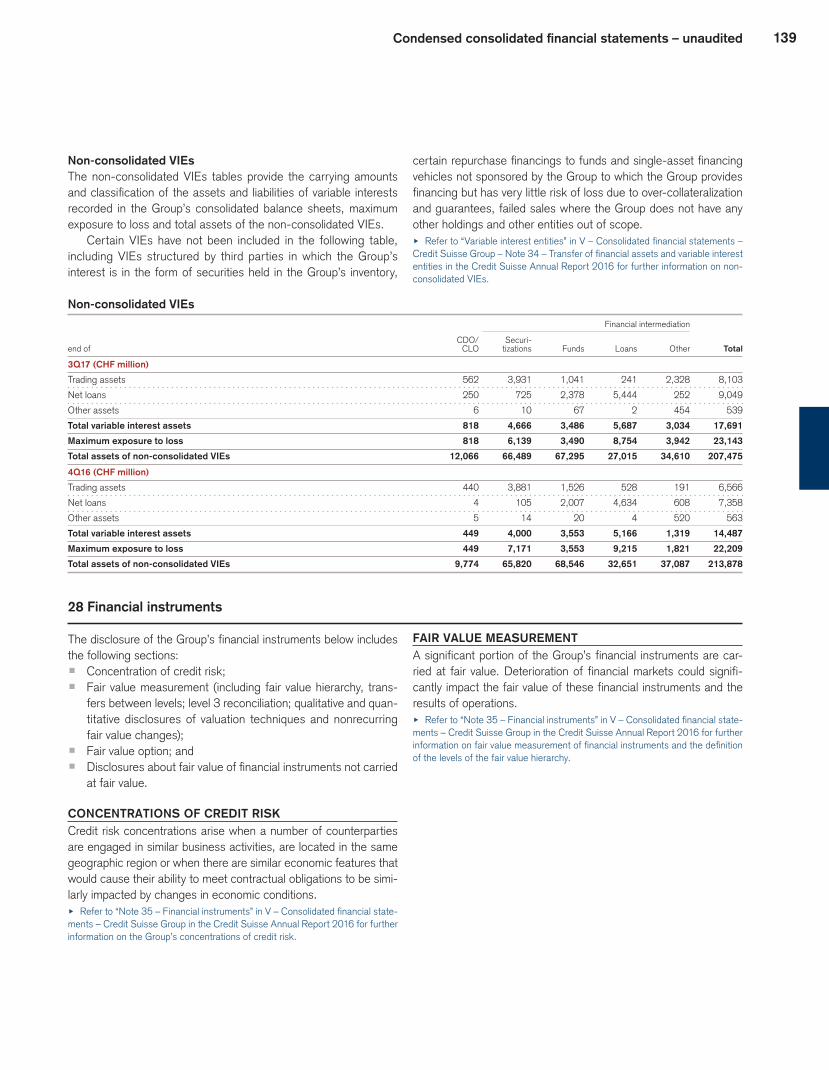
139Condensed consolidated financial statements – unaudited
Non-consolidated VIEsThe non-consolidated VIEs tables provide the carrying amounts and classification of the assets and liabilities of variable interests recorded in the Group’s consolidated balance sheets, maximum exposure to loss and total assets of the non-consolidated VIEs.
Certain VIEs have not been included in the following table, including VIEs structured by third parties in which the Group’s interest is in the form of securities held in the Group’s inventory,
certain repurchase financings to funds and single-asset financing vehicles not sponsored by the Group to which the Group provides financing but has very little risk of loss due to over-collateralization and guarantees, failed sales where the Group does not have any other holdings and other entities out of scope.u Refer to “Variable interest entities” in V – Consolidated financial statements – Credit Suisse Group – Note 34 – Transfer of financial assets and variable interest entities in the Credit Suisse Annual Report 2016 for further information on non-consolidated VIEs.
Non-consolidated VIEs Financial intermediation
CDO/ Securi-
end of CLO tizations Funds Loans Other Total
3Q17 (CHF million)
Trading assets 562 3,931 1,041 241 2,328 8,103
Net loans 250 725 2,378 5,444 252 9,049
Other assets 6 10 67 2 454 539
Total variable interest assets 818 4,666 3,486 5,687 3,034 17,691
Maximum exposure to loss 818 6,139 3,490 8,754 3,942 23,143
Total assets of non-consolidated VIEs 12,066 66,489 67,295 27,015 34,610 207,475
4Q16 (CHF million)
Trading assets 440 3,881 1,526 528 191 6,566
Net loans 4 105 2,007 4,634 608 7,358
Other assets 5 14 20 4 520 563
Total variable interest assets 449 4,000 3,553 5,166 1,319 14,487
Maximum exposure to loss 449 7,171 3,553 9,215 1,821 22,209
Total assets of non-consolidated VIEs 9,774 65,820 68,546 32,651 37,087 213,878
28 Financial instruments
The disclosure of the Group’s financial instruments below includes the following sections:p Concentration of credit risk;p Fair value measurement (including fair value hierarchy, trans-
fers between levels; level 3 reconciliation; qualitative and quan-titative disclosures of valuation techniques and nonrecurring fair value changes);
p Fair value option; andp Disclosures about fair value of financial instruments not carried
at fair value.
CONCENTRATIONS OF CREDIT RISKCredit risk concentrations arise when a number of counterparties are engaged in similar business activities, are located in the same geographic region or when there are similar economic features that would cause their ability to meet contractual obligations to be simi-larly impacted by changes in economic conditions.u Refer to “Note 35 – Financial instruments” in V – Consolidated financial state-ments – Credit Suisse Group in the Credit Suisse Annual Report 2016 for further information on the Group’s concentrations of credit risk.
FAIR VALUE MEASUREMENTA significant portion of the Group’s financial instruments are car-ried at fair value. Deterioration of financial markets could signifi-cantly impact the fair value of these financial instruments and the results of operations.u Refer to “Note 35 – Financial instruments” in V – Consolidated financial state-ments – Credit Suisse Group in the Credit Suisse Annual Report 2016 for further information on fair value measurement of financial instruments and the definition of the levels of the fair value hierarchy.

140 Condensed consolidated financial statements – unaudited
Assets and liabilities measured at fair value on a recurring basis Assets measured at net Netting asset value
end of 3Q17 Level 1 Level 2 Level 3 impact 1 per share 2 Total
Assets (CHF million)
Cash and due from banks 0 175 0 – – 175
Interest-bearing deposits with banks 0 0 0 – – 0
Central bank funds sold, securities purchased under
resale agreements and securities borrowing transactions 0 97,413 0 – – 97,413
Debt 555 877 1 – – 1,433
of which corporates 0 840 1 – – 841
Equity 34,115 335 18 – – 34,468
Securities received as collateral 34,670 1,212 19 – – 35,901
Debt 24,790 36,314 2,124 – – 63,228
of which foreign governments 24,387 3,704 336 – – 28,427
of which corporates 300 10,882 1,056 – – 12,238
of which RMBS 0 18,022 393 – – 18,415
of which CMBS 0 2,165 33 – – 2,198
of which CDO 0 1,540 157 – – 1,697
Equity 46,908 4,288 209 – 1,058 52,463
Derivatives 4,822 151,537 3,473 (138,969) – 20,863
of which interest rate products 778 90,066 806 – – –
of which foreign exchange products 111 33,907 201 – – –
of which equity/index-related products 3,933 18,749 889 – – –
of which credit derivatives 0 7,977 474 – – –
Other 2,311 439 3,075 – – 5,825
Trading assets 78,831 192,578 8,881 (138,969) 1,058 142,379
Debt 244 2,305 54 – – 2,603
of which foreign governments 97 1,298 0 – – 1,395
of which corporates 0 255 0 – – 255
of which RMBS 0 687 51 – – 738
of which CMBS 0 0 2 – – 2
Equity 6 95 0 – – 101
Investment securities 250 2,400 54 – – 2,704
Private equity 0 0 7 – 422 429
of which equity funds 0 0 0 – 196 196
Hedge funds 0 0 0 – 334 334
of which debt funds 0 0 0 – 236 236
Other equity investments 24 5 268 – 1,308 1,605
of which private 16 5 267 – 1,306 1,594
Life finance instruments 0 1 1,358 – – 1,359
Other investments 24 6 1,633 – 2,064 3,727
Loans 0 10,399 4,963 – – 15,362
of which commercial and industrial loans 0 4,201 2,400 – – 6,601
of which financial institutions 0 3,795 1,631 – – 5,426
Other intangible assets (mortgage servicing rights) 0 0 153 – – 153
Other assets 252 6,670 1,899 (197) – 8,624
of which loans held-for-sale 0 4,763 1,691 – – 6,454
Total assets at fair value 114,027 310,853 17,602 (139,166) 3,122 306,438
1 Derivative contracts are reported on a gross basis by level. The impact of netting represents legally enforceable master netting agreements.2 In accordance with US GAAP, certain investments that are measured at fair value using the net asset value per share practical expedient have not been classified in the fair value hierarchy.
The fair value amounts presented in this table are intended to permit reconciliation of the fair value hierarchy to the amounts presented in the consolidated balance sheet.
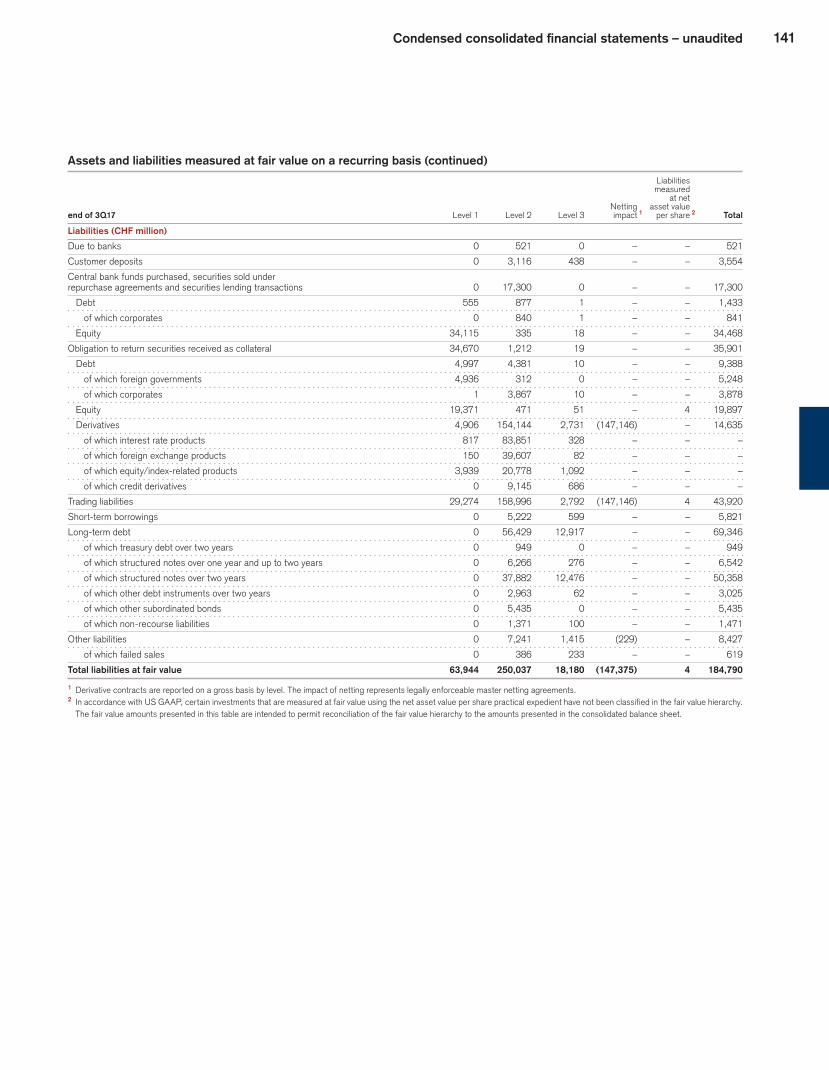
141Condensed consolidated financial statements – unaudited
Assets and liabilities measured at fair value on a recurring basis (continued) Liabilities measured at net Netting asset value
end of 3Q17 Level 1 Level 2 Level 3 impact 1 per share 2 Total
Liabilities (CHF million)
Due to banks 0 521 0 – – 521
Customer deposits 0 3,116 438 – – 3,554
Central bank funds purchased, securities sold under
repurchase agreements and securities lending transactions 0 17,300 0 – – 17,300
Debt 555 877 1 – – 1,433
of which corporates 0 840 1 – – 841
Equity 34,115 335 18 – – 34,468
Obligation to return securities received as collateral 34,670 1,212 19 – – 35,901
Debt 4,997 4,381 10 – – 9,388
of which foreign governments 4,936 312 0 – – 5,248
of which corporates 1 3,867 10 – – 3,878
Equity 19,371 471 51 – 4 19,897
Derivatives 4,906 154,144 2,731 (147,146) – 14,635
of which interest rate products 817 83,851 328 – – –
of which foreign exchange products 150 39,607 82 – – –
of which equity/index-related products 3,939 20,778 1,092 – – –
of which credit derivatives 0 9,145 686 – – –
Trading liabilities 29,274 158,996 2,792 (147,146) 4 43,920
Short-term borrowings 0 5,222 599 – – 5,821
Long-term debt 0 56,429 12,917 – – 69,346
of which treasury debt over two years 0 949 0 – – 949
of which structured notes over one year and up to two years 0 6,266 276 – – 6,542
of which structured notes over two years 0 37,882 12,476 – – 50,358
of which other debt instruments over two years 0 2,963 62 – – 3,025
of which other subordinated bonds 0 5,435 0 – – 5,435
of which non-recourse liabilities 0 1,371 100 – – 1,471
Other liabilities 0 7,241 1,415 (229) – 8,427
of which failed sales 0 386 233 – – 619
Total liabilities at fair value 63,944 250,037 18,180 (147,375) 4 184,790
1 Derivative contracts are reported on a gross basis by level. The impact of netting represents legally enforceable master netting agreements.2 In accordance with US GAAP, certain investments that are measured at fair value using the net asset value per share practical expedient have not been classified in the fair value hierarchy.
The fair value amounts presented in this table are intended to permit reconciliation of the fair value hierarchy to the amounts presented in the consolidated balance sheet.
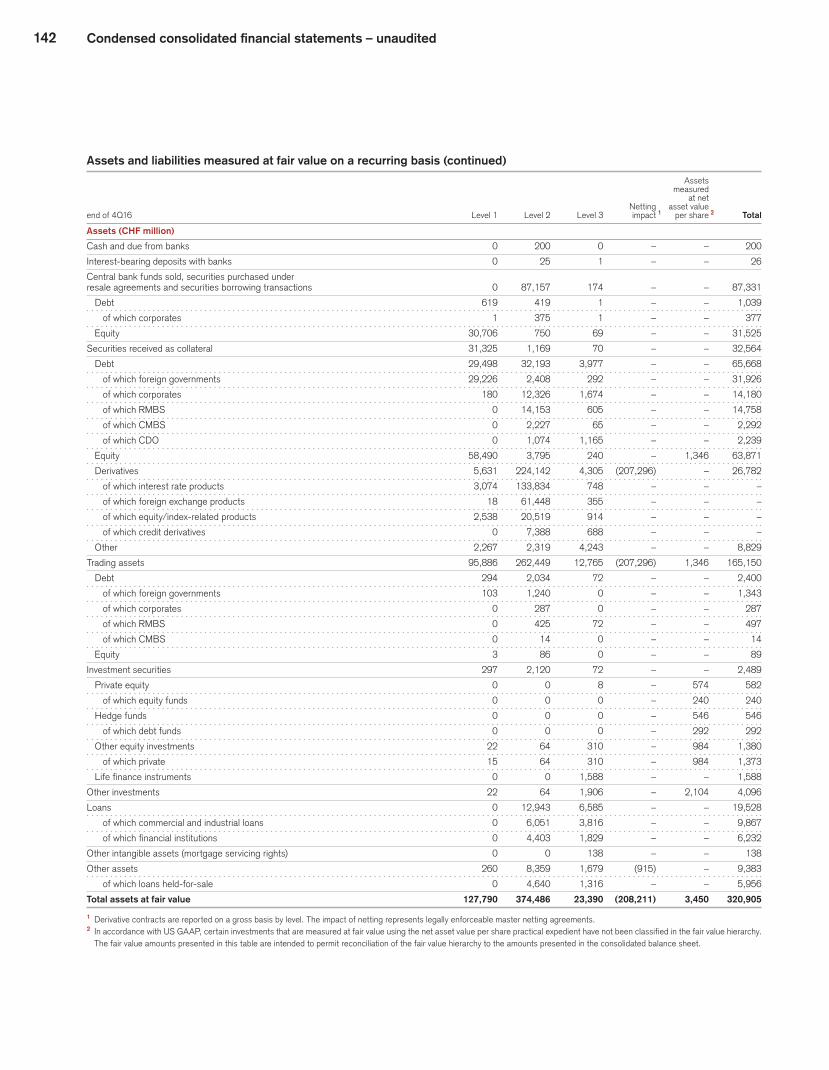
142 Condensed consolidated financial statements – unaudited
Assets and liabilities measured at fair value on a recurring basis (continued) Assets measured at net Netting asset value
end of 4Q16 Level 1 Level 2 Level 3 impact 1 per share 2 Total
Assets (CHF million)
Cash and due from banks 0 200 0 – – 200
Interest-bearing deposits with banks 0 25 1 – – 26
Central bank funds sold, securities purchased under
resale agreements and securities borrowing transactions 0 87,157 174 – – 87,331
Debt 619 419 1 – – 1,039
of which corporates 1 375 1 – – 377
Equity 30,706 750 69 – – 31,525
Securities received as collateral 31,325 1,169 70 – – 32,564
Debt 29,498 32,193 3,977 – – 65,668
of which foreign governments 29,226 2,408 292 – – 31,926
of which corporates 180 12,326 1,674 – – 14,180
of which RMBS 0 14,153 605 – – 14,758
of which CMBS 0 2,227 65 – – 2,292
of which CDO 0 1,074 1,165 – – 2,239
Equity 58,490 3,795 240 – 1,346 63,871
Derivatives 5,631 224,142 4,305 (207,296) – 26,782
of which interest rate products 3,074 133,834 748 – – –
of which foreign exchange products 18 61,448 355 – – –
of which equity/index-related products 2,538 20,519 914 – – –
of which credit derivatives 0 7,388 688 – – –
Other 2,267 2,319 4,243 – – 8,829
Trading assets 95,886 262,449 12,765 (207,296) 1,346 165,150
Debt 294 2,034 72 – – 2,400
of which foreign governments 103 1,240 0 – – 1,343
of which corporates 0 287 0 – – 287
of which RMBS 0 425 72 – – 497
of which CMBS 0 14 0 – – 14
Equity 3 86 0 – – 89
Investment securities 297 2,120 72 – – 2,489
Private equity 0 0 8 – 574 582
of which equity funds 0 0 0 – 240 240
Hedge funds 0 0 0 – 546 546
of which debt funds 0 0 0 – 292 292
Other equity investments 22 64 310 – 984 1,380
of which private 15 64 310 – 984 1,373
Life finance instruments 0 0 1,588 – – 1,588
Other investments 22 64 1,906 – 2,104 4,096
Loans 0 12,943 6,585 – – 19,528
of which commercial and industrial loans 0 6,051 3,816 – – 9,867
of which financial institutions 0 4,403 1,829 – – 6,232
Other intangible assets (mortgage servicing rights) 0 0 138 – – 138
Other assets 260 8,359 1,679 (915) – 9,383
of which loans held-for-sale 0 4,640 1,316 – – 5,956
Total assets at fair value 127,790 374,486 23,390 (208,211) 3,450 320,905
1 Derivative contracts are reported on a gross basis by level. The impact of netting represents legally enforceable master netting agreements.2 In accordance with US GAAP, certain investments that are measured at fair value using the net asset value per share practical expedient have not been classified in the fair value hierarchy.
The fair value amounts presented in this table are intended to permit reconciliation of the fair value hierarchy to the amounts presented in the consolidated balance sheet.
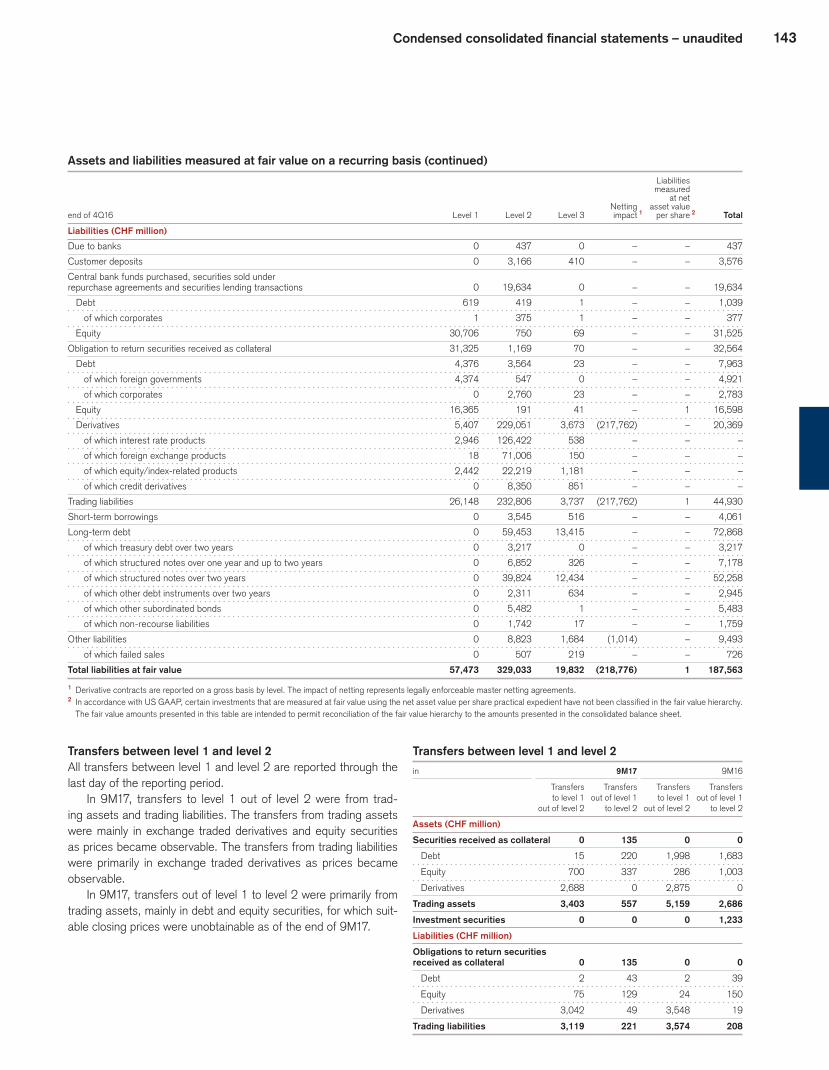
143Condensed consolidated financial statements – unaudited
Assets and liabilities measured at fair value on a recurring basis (continued) Liabilities measured at net Netting asset value
end of 4Q16 Level 1 Level 2 Level 3 impact 1 per share 2 Total
Liabilities (CHF million)
Due to banks 0 437 0 – – 437
Customer deposits 0 3,166 410 – – 3,576
Central bank funds purchased, securities sold under
repurchase agreements and securities lending transactions 0 19,634 0 – – 19,634
Debt 619 419 1 – – 1,039
of which corporates 1 375 1 – – 377
Equity 30,706 750 69 – – 31,525
Obligation to return securities received as collateral 31,325 1,169 70 – – 32,564
Debt 4,376 3,564 23 – – 7,963
of which foreign governments 4,374 547 0 – – 4,921
of which corporates 0 2,760 23 – – 2,783
Equity 16,365 191 41 – 1 16,598
Derivatives 5,407 229,051 3,673 (217,762) – 20,369
of which interest rate products 2,946 126,422 538 – – –
of which foreign exchange products 18 71,006 150 – – –
of which equity/index-related products 2,442 22,219 1,181 – – –
of which credit derivatives 0 8,350 851 – – –
Trading liabilities 26,148 232,806 3,737 (217,762) 1 44,930
Short-term borrowings 0 3,545 516 – – 4,061
Long-term debt 0 59,453 13,415 – – 72,868
of which treasury debt over two years 0 3,217 0 – – 3,217
of which structured notes over one year and up to two years 0 6,852 326 – – 7,178
of which structured notes over two years 0 39,824 12,434 – – 52,258
of which other debt instruments over two years 0 2,311 634 – – 2,945
of which other subordinated bonds 0 5,482 1 – – 5,483
of which non-recourse liabilities 0 1,742 17 – – 1,759
Other liabilities 0 8,823 1,684 (1,014) – 9,493
of which failed sales 0 507 219 – – 726
Total liabilities at fair value 57,473 329,033 19,832 (218,776) 1 187,563
1 Derivative contracts are reported on a gross basis by level. The impact of netting represents legally enforceable master netting agreements.2 In accordance with US GAAP, certain investments that are measured at fair value using the net asset value per share practical expedient have not been classified in the fair value hierarchy.
The fair value amounts presented in this table are intended to permit reconciliation of the fair value hierarchy to the amounts presented in the consolidated balance sheet.
Transfers between level 1 and level 2All transfers between level 1 and level 2 are reported through the last day of the reporting period.
In 9M17, transfers to level 1 out of level 2 were from trad-ing assets and trading liabilities. The transfers from trading assets were mainly in exchange traded derivatives and equity securities as prices became observable. The transfers from trading liabilities were primarily in exchange traded derivatives as prices became observable.
In 9M17, transfers out of level 1 to level 2 were primarily from trading assets, mainly in debt and equity securities, for which suit-able closing prices were unobtainable as of the end of 9M17.
Transfers between level 1 and level 2
in 9M17 9M16
Transfers Transfers Transfers Transfers
to level 1 out of level 1 to level 1 out of level 1
out of level 2 to level 2 out of level 2 to level 2
Assets (CHF million)
Securities received as collateral 0 135 0 0
Debt 15 220 1,998 1,683
Equity 700 337 286 1,003
Derivatives 2,688 0 2,875 0
Trading assets 3,403 557 5,159 2,686
Investment securities 0 0 0 1,233
Liabilities (CHF million)
Obligations to return securities
received as collateral 0 135 0 0
Debt 2 43 2 39
Equity 75 129 24 150
Derivatives 3,042 49 3,548 19
Trading liabilities 3,119 221 3,574 208
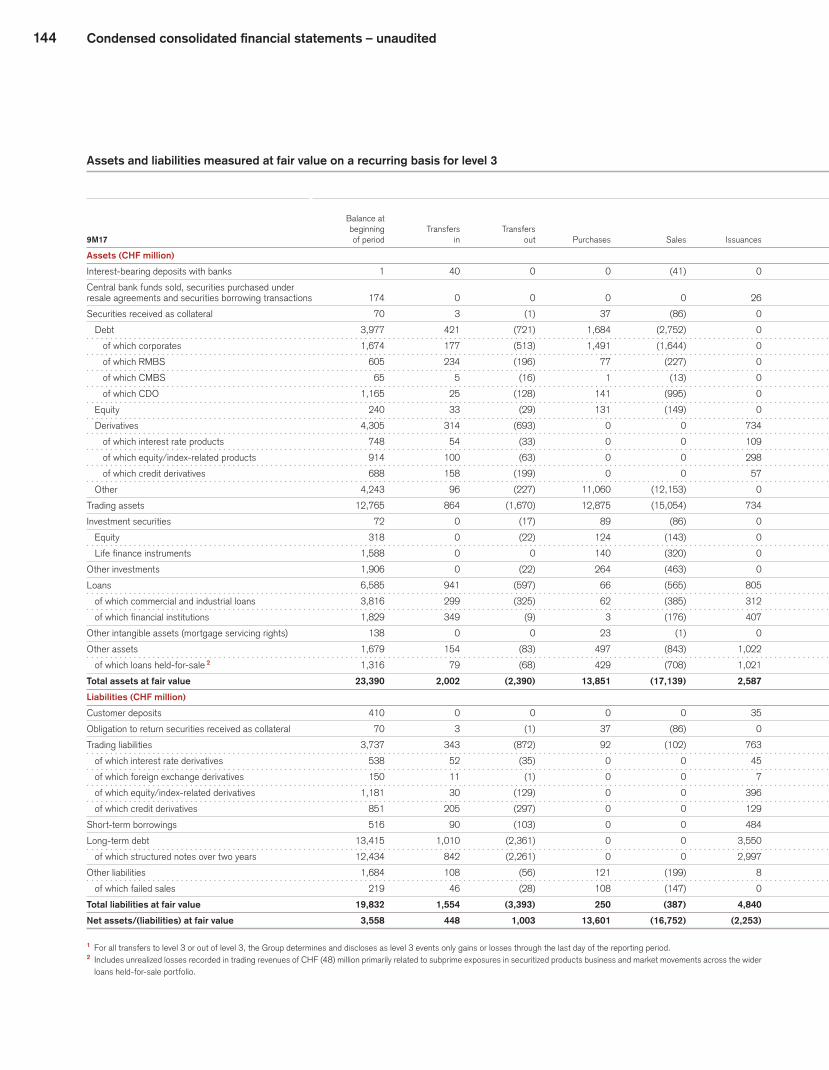
144 Condensed consolidated financial statements – unaudited
Assets and liabilities measured at fair value on a recurring basis for level 3 Accumulated other
Trading revenues Other revenues comprehensive income
Foreign
Balance at On On On On On On currency Balance
beginning Transfers Transfers transfers all transfers all transfers all translation at end
9M17 of period in out Purchases Sales Issuances Settlements in / out 1 other in / out 1 other in / out 1 other impact of period
Assets (CHF million)
Interest-bearing deposits with banks 1 40 0 0 (41) 0 0 0 0 0 0 0 0 0 0
Central bank funds sold, securities purchased under
resale agreements and securities borrowing transactions 174 0 0 0 0 26 (193) 0 0 0 0 0 0 (7) 0
Securities received as collateral 70 3 (1) 37 (86) 0 0 0 0 0 0 0 0 (4) 19
Debt 3,977 421 (721) 1,684 (2,752) 0 0 (6) (95) 5 2 0 0 (391) 2,124
of which corporates 1,674 177 (513) 1,491 (1,644) 0 0 (5) (26) 5 0 0 0 (103) 1,056
of which RMBS 605 234 (196) 77 (227) 0 0 3 (75) 0 0 0 0 (28) 393
of which CMBS 65 5 (16) 1 (13) 0 0 (3) (2) 0 0 0 0 (4) 33
of which CDO 1,165 25 (128) 141 (995) 0 0 0 (11) 0 1 0 0 (41) 157
Equity 240 33 (29) 131 (149) 0 0 0 (5) 0 0 0 0 (12) 209
Derivatives 4,305 314 (693) 0 0 734 (1,102) 102 19 0 0 0 0 (206) 3,473
of which interest rate products 748 54 (33) 0 0 109 (119) 6 70 0 0 0 0 (29) 806
of which equity/index-related products 914 100 (63) 0 0 298 (404) 10 79 0 0 0 0 (45) 889
of which credit derivatives 688 158 (199) 0 0 57 (210) 24 (8) 0 0 0 0 (36) 474
Other 4,243 96 (227) 11,060 (12,153) 0 (247) 4 316 0 0 0 0 (17) 3,075
Trading assets 12,765 864 (1,670) 12,875 (15,054) 734 (1,349) 100 235 5 2 0 0 (626) 8,881
Investment securities 72 0 (17) 89 (86) 0 (80) (1) 81 0 0 0 0 (4) 54
Equity 318 0 (22) 124 (143) 0 0 0 (19) 0 29 0 0 (12) 275
Life finance instruments 1,588 0 0 140 (320) 0 0 0 33 0 0 0 0 (83) 1,358
Other investments 1,906 0 (22) 264 (463) 0 0 0 14 0 29 0 0 (95) 1,633
Loans 6,585 941 (597) 66 (565) 805 (2,052) (14) 105 0 0 0 0 (311) 4,963
of which commercial and industrial loans 3,816 299 (325) 62 (385) 312 (1,246) (2) 42 0 0 0 0 (173) 2,400
of which financial institutions 1,829 349 (9) 3 (176) 407 (672) 0 (9) 0 0 0 0 (91) 1,631
Other intangible assets (mortgage servicing rights) 138 0 0 23 (1) 0 0 0 0 0 1 0 0 (8) 153
Other assets 1,679 154 (83) 497 (843) 1,022 (297) 0 (150) 0 (6) 0 0 (74) 1,899
of which loans held-for-sale 2 1,316 79 (68) 429 (708) 1,021 (297) 0 (18) 0 (5) 0 0 (58) 1,691
Total assets at fair value 23,390 2,002 (2,390) 13,851 (17,139) 2,587 (3,971) 85 285 5 26 0 0 (1,129) 17,602
Liabilities (CHF million)
Customer deposits 410 0 0 0 0 35 0 0 (29) 0 0 0 25 (3) 438
Obligation to return securities received as collateral 70 3 (1) 37 (86) 0 0 0 0 0 0 0 0 (4) 19
Trading liabilities 3,737 343 (872) 92 (102) 763 (1,235) 101 159 0 (2) 0 0 (192) 2,792
of which interest rate derivatives 538 52 (35) 0 0 45 (242) 4 (9) 0 0 0 0 (25) 328
of which foreign exchange derivatives 150 11 (1) 0 0 7 (10) 0 (68) 0 0 0 0 (7) 82
of which equity/index-related derivatives 1,181 30 (129) 0 0 396 (528) 20 185 0 0 0 0 (63) 1,092
of which credit derivatives 851 205 (297) 0 0 129 (222) 17 49 0 0 0 0 (46) 686
Short-term borrowings 516 90 (103) 0 0 484 (368) (2) 28 4 4 0 (27) (27) 599
Long-term debt 13,415 1,010 (2,361) 0 0 3,550 (3,179) 52 1,061 0 0 12 138 (781) 12,917
of which structured notes over two years 12,434 842 (2,261) 0 0 2,997 (2,055) 51 1,055 0 0 12 137 (736) 12,476
Other liabilities 1,684 108 (56) 121 (199) 8 (397) (16) (5) 0 246 0 0 (79) 1,415
of which failed sales 219 46 (28) 108 (147) 0 0 (1) 47 0 0 0 0 (11) 233
Total liabilities at fair value 19,832 1,554 (3,393) 250 (387) 4,840 (5,179) 135 1,214 4 248 12 136 (1,086) 18,180
Net assets/(liabilities) at fair value 3,558 448 1,003 13,601 (16,752) (2,253) 1,208 (50) (929) 1 (222) (12) (136) (43) (578)
1 For all transfers to level 3 or out of level 3, the Group determines and discloses as level 3 events only gains or losses through the last day of the reporting period.2 Includes unrealized losses recorded in trading revenues of CHF (48) million primarily related to subprime exposures in securitized products business and market movements across the wider
loans held-for-sale portfolio.
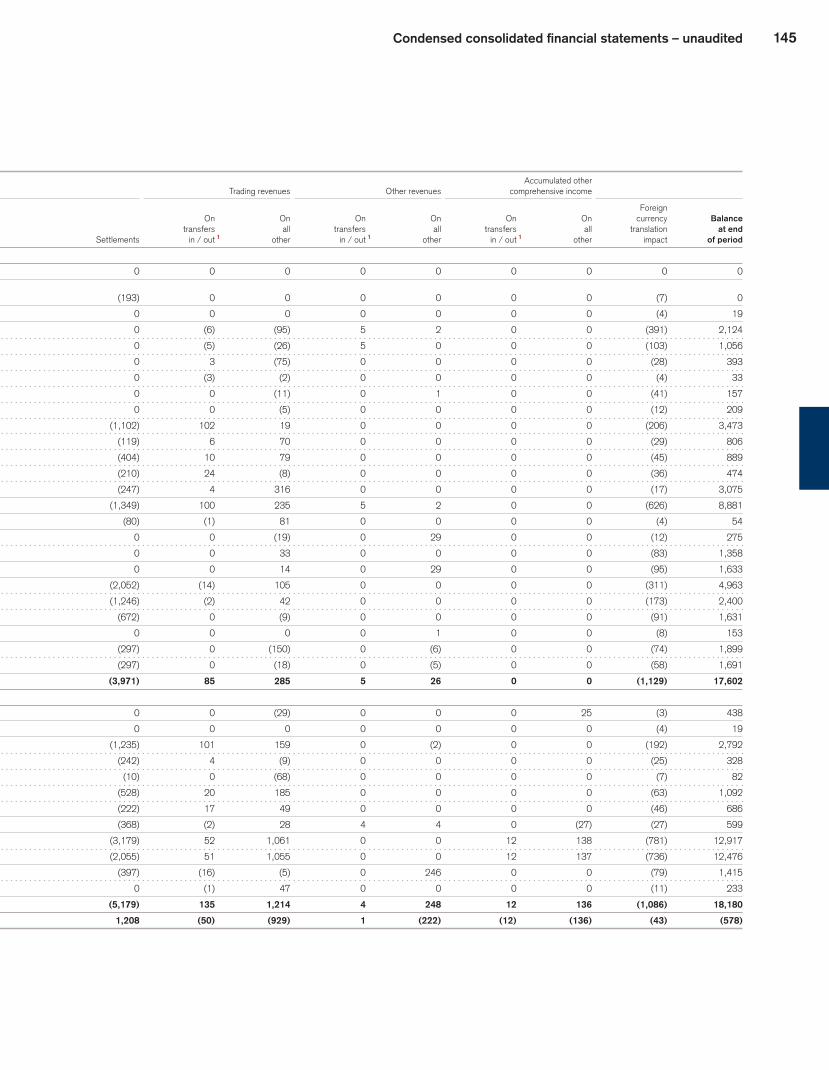
145Condensed consolidated financial statements – unaudited
Assets and liabilities measured at fair value on a recurring basis for level 3 Accumulated other
Trading revenues Other revenues comprehensive income
Foreign
Balance at On On On On On On currency Balance
beginning Transfers Transfers transfers all transfers all transfers all translation at end
9M17 of period in out Purchases Sales Issuances Settlements in / out 1 other in / out 1 other in / out 1 other impact of period
Assets (CHF million)
Interest-bearing deposits with banks 1 40 0 0 (41) 0 0 0 0 0 0 0 0 0 0
Central bank funds sold, securities purchased under
resale agreements and securities borrowing transactions 174 0 0 0 0 26 (193) 0 0 0 0 0 0 (7) 0
Securities received as collateral 70 3 (1) 37 (86) 0 0 0 0 0 0 0 0 (4) 19
Debt 3,977 421 (721) 1,684 (2,752) 0 0 (6) (95) 5 2 0 0 (391) 2,124
of which corporates 1,674 177 (513) 1,491 (1,644) 0 0 (5) (26) 5 0 0 0 (103) 1,056
of which RMBS 605 234 (196) 77 (227) 0 0 3 (75) 0 0 0 0 (28) 393
of which CMBS 65 5 (16) 1 (13) 0 0 (3) (2) 0 0 0 0 (4) 33
of which CDO 1,165 25 (128) 141 (995) 0 0 0 (11) 0 1 0 0 (41) 157
Equity 240 33 (29) 131 (149) 0 0 0 (5) 0 0 0 0 (12) 209
Derivatives 4,305 314 (693) 0 0 734 (1,102) 102 19 0 0 0 0 (206) 3,473
of which interest rate products 748 54 (33) 0 0 109 (119) 6 70 0 0 0 0 (29) 806
of which equity/index-related products 914 100 (63) 0 0 298 (404) 10 79 0 0 0 0 (45) 889
of which credit derivatives 688 158 (199) 0 0 57 (210) 24 (8) 0 0 0 0 (36) 474
Other 4,243 96 (227) 11,060 (12,153) 0 (247) 4 316 0 0 0 0 (17) 3,075
Trading assets 12,765 864 (1,670) 12,875 (15,054) 734 (1,349) 100 235 5 2 0 0 (626) 8,881
Investment securities 72 0 (17) 89 (86) 0 (80) (1) 81 0 0 0 0 (4) 54
Equity 318 0 (22) 124 (143) 0 0 0 (19) 0 29 0 0 (12) 275
Life finance instruments 1,588 0 0 140 (320) 0 0 0 33 0 0 0 0 (83) 1,358
Other investments 1,906 0 (22) 264 (463) 0 0 0 14 0 29 0 0 (95) 1,633
Loans 6,585 941 (597) 66 (565) 805 (2,052) (14) 105 0 0 0 0 (311) 4,963
of which commercial and industrial loans 3,816 299 (325) 62 (385) 312 (1,246) (2) 42 0 0 0 0 (173) 2,400
of which financial institutions 1,829 349 (9) 3 (176) 407 (672) 0 (9) 0 0 0 0 (91) 1,631
Other intangible assets (mortgage servicing rights) 138 0 0 23 (1) 0 0 0 0 0 1 0 0 (8) 153
Other assets 1,679 154 (83) 497 (843) 1,022 (297) 0 (150) 0 (6) 0 0 (74) 1,899
of which loans held-for-sale 2 1,316 79 (68) 429 (708) 1,021 (297) 0 (18) 0 (5) 0 0 (58) 1,691
Total assets at fair value 23,390 2,002 (2,390) 13,851 (17,139) 2,587 (3,971) 85 285 5 26 0 0 (1,129) 17,602
Liabilities (CHF million)
Customer deposits 410 0 0 0 0 35 0 0 (29) 0 0 0 25 (3) 438
Obligation to return securities received as collateral 70 3 (1) 37 (86) 0 0 0 0 0 0 0 0 (4) 19
Trading liabilities 3,737 343 (872) 92 (102) 763 (1,235) 101 159 0 (2) 0 0 (192) 2,792
of which interest rate derivatives 538 52 (35) 0 0 45 (242) 4 (9) 0 0 0 0 (25) 328
of which foreign exchange derivatives 150 11 (1) 0 0 7 (10) 0 (68) 0 0 0 0 (7) 82
of which equity/index-related derivatives 1,181 30 (129) 0 0 396 (528) 20 185 0 0 0 0 (63) 1,092
of which credit derivatives 851 205 (297) 0 0 129 (222) 17 49 0 0 0 0 (46) 686
Short-term borrowings 516 90 (103) 0 0 484 (368) (2) 28 4 4 0 (27) (27) 599
Long-term debt 13,415 1,010 (2,361) 0 0 3,550 (3,179) 52 1,061 0 0 12 138 (781) 12,917
of which structured notes over two years 12,434 842 (2,261) 0 0 2,997 (2,055) 51 1,055 0 0 12 137 (736) 12,476
Other liabilities 1,684 108 (56) 121 (199) 8 (397) (16) (5) 0 246 0 0 (79) 1,415
of which failed sales 219 46 (28) 108 (147) 0 0 (1) 47 0 0 0 0 (11) 233
Total liabilities at fair value 19,832 1,554 (3,393) 250 (387) 4,840 (5,179) 135 1,214 4 248 12 136 (1,086) 18,180
Net assets/(liabilities) at fair value 3,558 448 1,003 13,601 (16,752) (2,253) 1,208 (50) (929) 1 (222) (12) (136) (43) (578)
1 For all transfers to level 3 or out of level 3, the Group determines and discloses as level 3 events only gains or losses through the last day of the reporting period.2 Includes unrealized losses recorded in trading revenues of CHF (48) million primarily related to subprime exposures in securitized products business and market movements across the wider
loans held-for-sale portfolio.
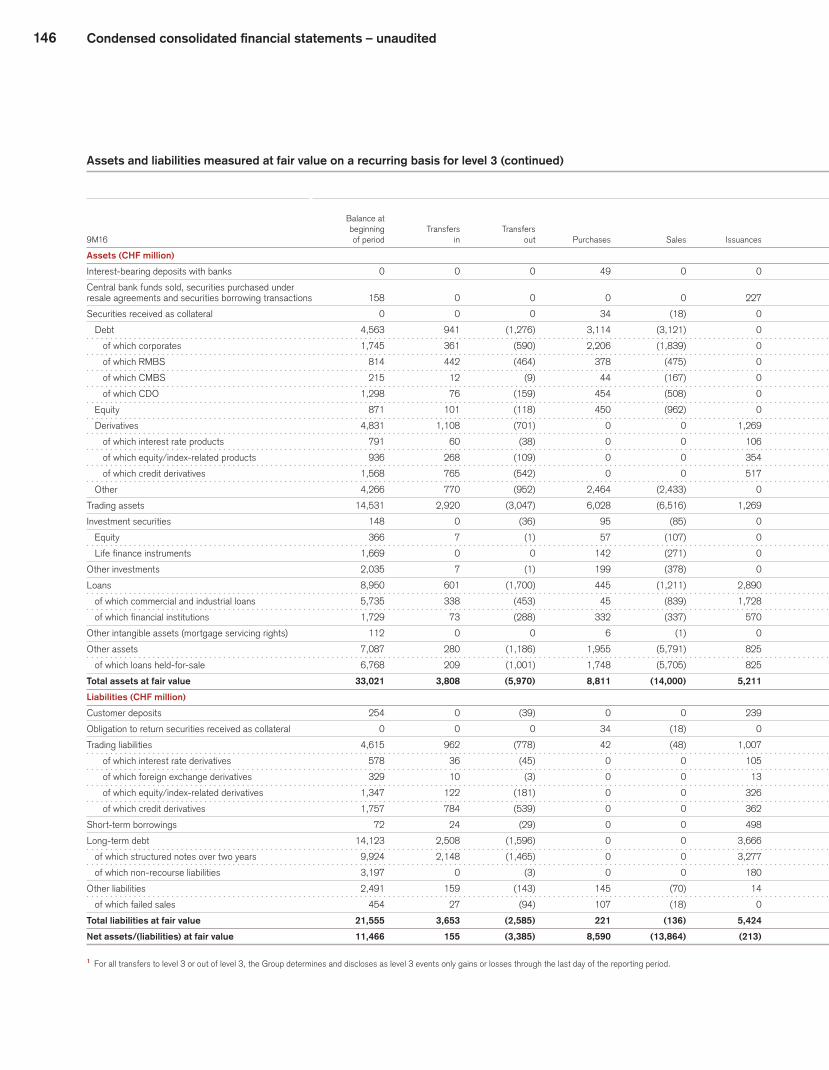
146 Condensed consolidated financial statements – unaudited
Assets and liabilities measured at fair value on a recurring basis for level 3 (continued) Accumulated other
Trading revenues Other revenues comprehensive income
Foreign
Balance at On On On On On On currency Balance
beginning Transfers Transfers transfers all transfers all transfers all translation at end
9M16 of period in out Purchases Sales Issuances Settlements in / out 1 other in / out 1 other in / out 1 other impact of period
Assets (CHF million)
Interest-bearing deposits with banks 0 0 0 49 0 0 0 0 0 0 0 0 0 0 49
Central bank funds sold, securities purchased under
resale agreements and securities borrowing transactions 158 0 0 0 0 227 (227) 0 0 0 0 0 0 (2) 156
Securities received as collateral 0 0 0 34 (18) 0 0 0 0 0 0 0 0 0 16
Debt 4,563 941 (1,276) 3,114 (3,121) 0 0 (6) (129) 0 1 0 0 (28) 4,059
of which corporates 1,745 361 (590) 2,206 (1,839) 0 0 0 (21) 0 0 0 0 (14) 1,848
of which RMBS 814 442 (464) 378 (475) 0 0 (12) (80) 0 0 0 0 (16) 587
of which CMBS 215 12 (9) 44 (167) 0 0 0 (36) 0 0 0 0 (2) 57
of which CDO 1,298 76 (159) 454 (508) 0 0 2 (20) 0 1 0 0 (23) 1,121
Equity 871 101 (118) 450 (962) 0 0 (42) (49) 0 0 0 0 (11) 240
Derivatives 4,831 1,108 (701) 0 0 1,269 (2,517) 28 276 0 (22) 0 0 (39) 4,233
of which interest rate products 791 60 (38) 0 0 106 (173) 4 85 0 0 0 0 (5) 830
of which equity/index-related products 936 268 (109) 0 0 354 (353) 12 91 0 (22) 0 0 2 1,179
of which credit derivatives 1,568 765 (542) 0 0 517 (1,599) 15 (33) 0 0 0 0 (20) 671
Other 4,266 770 (952) 2,464 (2,433) 0 (269) 6 322 0 0 0 0 (83) 4,091
Trading assets 14,531 2,920 (3,047) 6,028 (6,516) 1,269 (2,786) (14) 420 0 (21) 0 0 (161) 12,623
Investment securities 148 0 (36) 95 (85) 0 (103) (10) 80 0 0 0 0 (1) 88
Equity 366 7 (1) 57 (107) 0 0 0 16 0 12 0 0 11 361
Life finance instruments 1,669 0 0 142 (271) 0 0 0 134 0 0 0 0 (34) 1,640
Other investments 2,035 7 (1) 199 (378) 0 0 0 150 0 12 0 0 (23) 2,001
Loans 8,950 601 (1,700) 445 (1,211) 2,890 (2,864) (49) 4 0 0 0 0 (117) 6,949
of which commercial and industrial loans 5,735 338 (453) 45 (839) 1,728 (1,894) (17) (70) 0 0 0 0 (48) 4,525
of which financial institutions 1,729 73 (288) 332 (337) 570 (547) (2) 46 0 0 0 0 (36) 1,540
Other intangible assets (mortgage servicing rights) 112 0 0 6 (1) 0 0 0 0 0 1 0 0 (3) 115
Other assets 7,087 280 (1,186) 1,955 (5,791) 825 (797) (59) (128) 0 (6) 0 0 40 2,220
of which loans held-for-sale 6,768 209 (1,001) 1,748 (5,705) 825 (797) (72) (32) 0 (6) 0 0 45 1,982
Total assets at fair value 33,021 3,808 (5,970) 8,811 (14,000) 5,211 (6,777) (132) 526 0 (14) 0 0 (267) 24,217
Liabilities (CHF million)
Customer deposits 254 0 (39) 0 0 239 (18) 0 (41) 0 0 0 5 14 414
Obligation to return securities received as collateral 0 0 0 34 (18) 0 0 0 0 0 0 0 0 0 16
Trading liabilities 4,615 962 (778) 42 (48) 1,007 (3,106) 84 672 0 (10) 0 0 (54) 3,386
of which interest rate derivatives 578 36 (45) 0 0 105 (141) 14 21 0 0 0 0 (8) 560
of which foreign exchange derivatives 329 10 (3) 0 0 13 (392) 2 175 0 0 0 0 (4) 130
of which equity/index-related derivatives 1,347 122 (181) 0 0 326 (672) 16 192 0 0 0 0 (6) 1,144
of which credit derivatives 1,757 784 (539) 0 0 362 (1,684) 51 195 0 0 0 0 (23) 903
Short-term borrowings 72 24 (29) 0 0 498 (159) 1 14 (3) 0 0 0 (7) 411
Long-term debt 14,123 2,508 (1,596) 0 0 3,666 (5,390) (74) 496 0 0 1 (70) (279) 13,385
of which structured notes over two years 9,924 2,148 (1,465) 0 0 3,277 (1,482) (86) 250 0 0 1 (70) (230) 12,267
of which non-recourse liabilities 3,197 0 (3) 0 0 180 (3,230) 3 46 0 0 0 0 (32) 161
Other liabilities 2,491 159 (143) 145 (70) 14 (602) (63) (120) (1) 41 0 0 (32) 1,819
of which failed sales 454 27 (94) 107 (18) 0 0 0 6 0 0 0 0 (10) 472
Total liabilities at fair value 21,555 3,653 (2,585) 221 (136) 5,424 (9,275) (52) 1,021 (4) 31 1 (65) (358) 19,431
Net assets/(liabilities) at fair value 11,466 155 (3,385) 8,590 (13,864) (213) 2,498 (80) (495) 4 (45) (1) 65 91 4,786
1 For all transfers to level 3 or out of level 3, the Group determines and discloses as level 3 events only gains or losses through the last day of the reporting period.

147Condensed consolidated financial statements – unaudited
Assets and liabilities measured at fair value on a recurring basis for level 3 (continued) Accumulated other
Trading revenues Other revenues comprehensive income
Foreign
Balance at On On On On On On currency Balance
beginning Transfers Transfers transfers all transfers all transfers all translation at end
9M16 of period in out Purchases Sales Issuances Settlements in / out 1 other in / out 1 other in / out 1 other impact of period
Assets (CHF million)
Interest-bearing deposits with banks 0 0 0 49 0 0 0 0 0 0 0 0 0 0 49
Central bank funds sold, securities purchased under
resale agreements and securities borrowing transactions 158 0 0 0 0 227 (227) 0 0 0 0 0 0 (2) 156
Securities received as collateral 0 0 0 34 (18) 0 0 0 0 0 0 0 0 0 16
Debt 4,563 941 (1,276) 3,114 (3,121) 0 0 (6) (129) 0 1 0 0 (28) 4,059
of which corporates 1,745 361 (590) 2,206 (1,839) 0 0 0 (21) 0 0 0 0 (14) 1,848
of which RMBS 814 442 (464) 378 (475) 0 0 (12) (80) 0 0 0 0 (16) 587
of which CMBS 215 12 (9) 44 (167) 0 0 0 (36) 0 0 0 0 (2) 57
of which CDO 1,298 76 (159) 454 (508) 0 0 2 (20) 0 1 0 0 (23) 1,121
Equity 871 101 (118) 450 (962) 0 0 (42) (49) 0 0 0 0 (11) 240
Derivatives 4,831 1,108 (701) 0 0 1,269 (2,517) 28 276 0 (22) 0 0 (39) 4,233
of which interest rate products 791 60 (38) 0 0 106 (173) 4 85 0 0 0 0 (5) 830
of which equity/index-related products 936 268 (109) 0 0 354 (353) 12 91 0 (22) 0 0 2 1,179
of which credit derivatives 1,568 765 (542) 0 0 517 (1,599) 15 (33) 0 0 0 0 (20) 671
Other 4,266 770 (952) 2,464 (2,433) 0 (269) 6 322 0 0 0 0 (83) 4,091
Trading assets 14,531 2,920 (3,047) 6,028 (6,516) 1,269 (2,786) (14) 420 0 (21) 0 0 (161) 12,623
Investment securities 148 0 (36) 95 (85) 0 (103) (10) 80 0 0 0 0 (1) 88
Equity 366 7 (1) 57 (107) 0 0 0 16 0 12 0 0 11 361
Life finance instruments 1,669 0 0 142 (271) 0 0 0 134 0 0 0 0 (34) 1,640
Other investments 2,035 7 (1) 199 (378) 0 0 0 150 0 12 0 0 (23) 2,001
Loans 8,950 601 (1,700) 445 (1,211) 2,890 (2,864) (49) 4 0 0 0 0 (117) 6,949
of which commercial and industrial loans 5,735 338 (453) 45 (839) 1,728 (1,894) (17) (70) 0 0 0 0 (48) 4,525
of which financial institutions 1,729 73 (288) 332 (337) 570 (547) (2) 46 0 0 0 0 (36) 1,540
Other intangible assets (mortgage servicing rights) 112 0 0 6 (1) 0 0 0 0 0 1 0 0 (3) 115
Other assets 7,087 280 (1,186) 1,955 (5,791) 825 (797) (59) (128) 0 (6) 0 0 40 2,220
of which loans held-for-sale 6,768 209 (1,001) 1,748 (5,705) 825 (797) (72) (32) 0 (6) 0 0 45 1,982
Total assets at fair value 33,021 3,808 (5,970) 8,811 (14,000) 5,211 (6,777) (132) 526 0 (14) 0 0 (267) 24,217
Liabilities (CHF million)
Customer deposits 254 0 (39) 0 0 239 (18) 0 (41) 0 0 0 5 14 414
Obligation to return securities received as collateral 0 0 0 34 (18) 0 0 0 0 0 0 0 0 0 16
Trading liabilities 4,615 962 (778) 42 (48) 1,007 (3,106) 84 672 0 (10) 0 0 (54) 3,386
of which interest rate derivatives 578 36 (45) 0 0 105 (141) 14 21 0 0 0 0 (8) 560
of which foreign exchange derivatives 329 10 (3) 0 0 13 (392) 2 175 0 0 0 0 (4) 130
of which equity/index-related derivatives 1,347 122 (181) 0 0 326 (672) 16 192 0 0 0 0 (6) 1,144
of which credit derivatives 1,757 784 (539) 0 0 362 (1,684) 51 195 0 0 0 0 (23) 903
Short-term borrowings 72 24 (29) 0 0 498 (159) 1 14 (3) 0 0 0 (7) 411
Long-term debt 14,123 2,508 (1,596) 0 0 3,666 (5,390) (74) 496 0 0 1 (70) (279) 13,385
of which structured notes over two years 9,924 2,148 (1,465) 0 0 3,277 (1,482) (86) 250 0 0 1 (70) (230) 12,267
of which non-recourse liabilities 3,197 0 (3) 0 0 180 (3,230) 3 46 0 0 0 0 (32) 161
Other liabilities 2,491 159 (143) 145 (70) 14 (602) (63) (120) (1) 41 0 0 (32) 1,819
of which failed sales 454 27 (94) 107 (18) 0 0 0 6 0 0 0 0 (10) 472
Total liabilities at fair value 21,555 3,653 (2,585) 221 (136) 5,424 (9,275) (52) 1,021 (4) 31 1 (65) (358) 19,431
Net assets/(liabilities) at fair value 11,466 155 (3,385) 8,590 (13,864) (213) 2,498 (80) (495) 4 (45) (1) 65 91 4,786
1 For all transfers to level 3 or out of level 3, the Group determines and discloses as level 3 events only gains or losses through the last day of the reporting period.

148 Condensed consolidated financial statements – unaudited
Gains and losses on assets and liabilities measured at fair value on a recurring basis using significant unobservable inputs (level 3)
in 9M17 9M16
Trading Other Total Trading Other Total revenues revenues revenues revenues revenues revenues
Gains and losses on assets and liabilities (CHF million)
Net realized/unrealized gains/(losses) included in net revenues (979) (221) (1,200) 1 (575) (41) (616) 1
Whereof:
Unrealized gains/(losses) relating
to assets and liabilities still held as of the reporting date (1,194) 107 (1,087) (239) 3 (236)
1 Excludes net realized/unrealized gains/(losses) attributable to foreign currency translation impact.
Both observable and unobservable inputs may be used to deter-mine the fair value of positions that have been classified within level 3. As a result, the unrealized gains and losses for assets and liabilities within level 3 presented in the table above may include changes in fair value that were attributable to both observable and unobservable inputs.
The Group employs various economic hedging techniques in order to manage risks, including risks in level 3 positions. Such techniques may include the purchase or sale of financial instru-ments that are classified in levels 1 and/or 2. The realized and unrealized gains and losses for assets and liabilities in level 3 pre-sented in the table above do not reflect the related realized or unrealized gains and losses arising on economic hedging instru-ments classified in levels 1 and/or 2.
Transfers in and out of level 3Transfers into level 3 assets during 9M17 were CHF 2,002 mil-lion, primarily from loans and trading assets. The transfers were primarily in the credit, fixed income and financing businesses due to limited observability of pricing data and reduced pricing infor-mation from external providers. Transfers out of level 3 assets during 9M17 were CHF 2,390 million, primarily in trading assets and loans. The transfers were primarily in the Strategic Resolution Unit and credit businesses due to increased observability of pricing data and increased availability of pricing information from external providers.
Transfers into level 3 assets during 3Q17 were CHF 764 mil-lion, primarily from loans and trading assets. The transfers were primarily in the Strategic Resolution Unit, credit, fixed income and financing businesses due to limited observability of pricing data and reduced pricing information from external providers. Transfers out of level 3 assets during 3Q17 were CHF 683 million, primar-ily in trading assets and loans. The transfers were primarily in the Strategic Resolution Unit and credit businesses due to increased observability of pricing data and increased availability of pricing information from external providers.
Qualitative disclosures of valuation techniques OverviewThe Group has implemented and maintains a valuation control framework, which is supported by policies and procedures that
define the principles for controlling the valuation of the Group’s financial instruments.u Refer to “Note 35 – Financial instruments” in V – Consolidated financial state-ments – Credit Suisse Group in the Credit Suisse Annual Report 2016 for further information on the Group’s valuation control framework.
The following information on the valuation techniques and signifi-cant unobservable inputs of the various financial instruments, and the sensitivity of fair value measurements to changes in significant unobservable inputs, should be read in conjunction with the tables “Quantitative information about level 3 assets at fair value” and “Quantitative information about level 3 liabilities at fair value”.
Central bank funds sold, securities purchased under resale agreements and securities borrowing transactionsSecurities purchased under resale agreements and securities sold under repurchase agreements are measured at fair value using dis-counted cash flow analysis. Future cash flows are discounted using observable market interest rate repurchase/resale curves for the applicable maturity and underlying collateral of the instruments. As such, the significant majority of both securities purchased under resale agreements and securities sold under repurchase agree-ments are included in level 2 of the fair value hierarchy. Structured resale and repurchase agreements include embedded derivatives, which are measured using the same techniques as described below for stand-alone derivative contracts held for trading pur-poses or used in hedge accounting relationships. If the value of the embedded derivative is determined using significant unobservable inputs, those structured resale and repurchase agreements are classified within level 3 of the fair value hierarchy. The significant unobservable input is funding spread.
Securities purchased under resale agreements are usually fully collateralized or over collateralized by government securities, money market instruments, corporate bonds, or other debt instru-ments. In the event of counterparty default, the collateral service agreement provides the Group with the right to liquidate the col-lateral held.
Debt securities Foreign governments and corporatesGovernment debt securities typically have quoted prices in active markets and are categorized as level 1 instruments. For debt
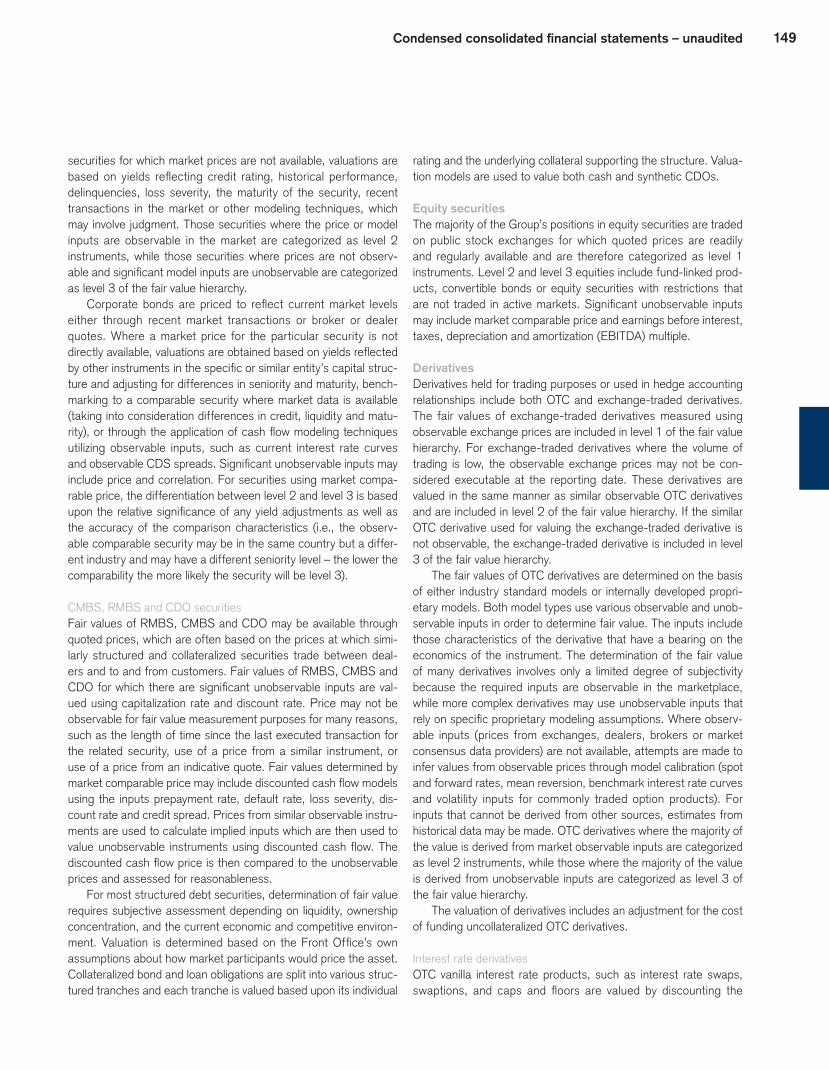
149Condensed consolidated financial statements – unaudited
securities for which market prices are not available, valuations are based on yields reflecting credit rating, historical performance, delinquencies, loss severity, the maturity of the security, recent transactions in the market or other modeling techniques, which may involve judgment. Those securities where the price or model inputs are observable in the market are categorized as level 2 instruments, while those securities where prices are not observ-able and significant model inputs are unobservable are categorized as level 3 of the fair value hierarchy.
Corporate bonds are priced to reflect current market levels either through recent market transactions or broker or dealer quotes. Where a market price for the particular security is not directly available, valuations are obtained based on yields reflected by other instruments in the specific or similar entity’s capital struc-ture and adjusting for differences in seniority and maturity, bench-marking to a comparable security where market data is available (taking into consideration differences in credit, liquidity and matu-rity), or through the application of cash flow modeling techniques utilizing observable inputs, such as current interest rate curves and observable CDS spreads. Significant unobservable inputs may include price and correlation. For securities using market compa-rable price, the differentiation between level 2 and level 3 is based upon the relative significance of any yield adjustments as well as the accuracy of the comparison characteristics (i.e., the observ-able comparable security may be in the same country but a differ-ent industry and may have a different seniority level – the lower the comparability the more likely the security will be level 3).
CMBS, RMBS and CDO securitiesFair values of RMBS, CMBS and CDO may be available through quoted prices, which are often based on the prices at which simi-larly structured and collateralized securities trade between deal-ers and to and from customers. Fair values of RMBS, CMBS and CDO for which there are significant unobservable inputs are val-ued using capitalization rate and discount rate. Price may not be observable for fair value measurement purposes for many reasons, such as the length of time since the last executed transaction for the related security, use of a price from a similar instrument, or use of a price from an indicative quote. Fair values determined by market comparable price may include discounted cash flow models using the inputs prepayment rate, default rate, loss severity, dis-count rate and credit spread. Prices from similar observable instru-ments are used to calculate implied inputs which are then used to value unobservable instruments using discounted cash flow. The discounted cash flow price is then compared to the unobservable prices and assessed for reasonableness.
For most structured debt securities, determination of fair value requires subjective assessment depending on liquidity, ownership concentration, and the current economic and competitive environ-ment. Valuation is determined based on the Front Office’s own assumptions about how market participants would price the asset. Collateralized bond and loan obligations are split into various struc-tured tranches and each tranche is valued based upon its individual
rating and the underlying collateral supporting the structure. Valua-tion models are used to value both cash and synthetic CDOs.
Equity securitiesThe majority of the Group’s positions in equity securities are traded on public stock exchanges for which quoted prices are readily and regularly available and are therefore categorized as level 1 instruments. Level 2 and level 3 equities include fund-linked prod-ucts, convertible bonds or equity securities with restrictions that are not traded in active markets. Significant unobservable inputs may include market comparable price and earnings before interest, taxes, depreciation and amortization (EBITDA) multiple.
DerivativesDerivatives held for trading purposes or used in hedge accounting relationships include both OTC and exchange-traded derivatives. The fair values of exchange-traded derivatives measured using observable exchange prices are included in level 1 of the fair value hierarchy. For exchange-traded derivatives where the volume of trading is low, the observable exchange prices may not be con-sidered executable at the reporting date. These derivatives are valued in the same manner as similar observable OTC derivatives and are included in level 2 of the fair value hierarchy. If the similar OTC derivative used for valuing the exchange-traded derivative is not observable, the exchange-traded derivative is included in level 3 of the fair value hierarchy.
The fair values of OTC derivatives are determined on the basis of either industry standard models or internally developed propri-etary models. Both model types use various observable and unob-servable inputs in order to determine fair value. The inputs include those characteristics of the derivative that have a bearing on the economics of the instrument. The determination of the fair value of many derivatives involves only a limited degree of subjectivity because the required inputs are observable in the marketplace, while more complex derivatives may use unobservable inputs that rely on specific proprietary modeling assumptions. Where observ-able inputs (prices from exchanges, dealers, brokers or market consensus data providers) are not available, attempts are made to infer values from observable prices through model calibration (spot and forward rates, mean reversion, benchmark interest rate curves and volatility inputs for commonly traded option products). For inputs that cannot be derived from other sources, estimates from historical data may be made. OTC derivatives where the majority of the value is derived from market observable inputs are categorized as level 2 instruments, while those where the majority of the value is derived from unobservable inputs are categorized as level 3 of the fair value hierarchy.
The valuation of derivatives includes an adjustment for the cost of funding uncollateralized OTC derivatives.
Interest rate derivativesOTC vanilla interest rate products, such as interest rate swaps, swaptions, and caps and floors are valued by discounting the

150 Condensed consolidated financial statements – unaudited
anticipated future cash flows. The future cash flows and discount-ing are derived from market standard yield curves and industry standard volatility inputs. Where applicable, exchange-traded prices are also used to value exchange-traded futures and options and can be used in yield curve construction. For more complex products, inputs include, but are not limited to correlation, volatility skew, prepayment rate and basis spread.
Foreign exchange derivativesForeign exchange derivatives include vanilla products such as spot, forward and option contracts where the anticipated dis-counted future cash flows are determined from foreign exchange forward curves and industry standard optionality modeling tech-niques. Where applicable, exchange-traded prices are also used for futures and option prices. For more complex products inputs include, but are not limited to prepayment rate, correlation and contingent probability.
Equity and index-related derivativesEquity derivatives include a variety of products ranging from vanilla options and swaps to exotic structures with bespoke payoff pro-files. The main inputs in the valuation of equity derivatives may include volatility, buyback probability, gap risk, correlation and price.
Generally, the interrelationship between the volatility and cor-relation is positively correlated.
Credit derivativesCredit derivatives include index and single name CDS in addition to more complex structured credit products. Vanilla products are valued using industry standard models and inputs that are gener-ally market observable including credit spread and recovery rate.
Complex structured credit derivatives are valued using propri-etary models requiring unobservable inputs such as recovery rate, credit spread and correlation. These inputs are generally implied from available market observable data. Fair values determined by price may include discounted cash flow models using the inputs prepayment rate, default rate, loss severity and discount rate.
Other trading assets Other trading assets primarily include RMBS loans and life settle-ment and premium finance instruments. Life settlement and pre-mium finance instruments are valued using proprietary models with several inputs. The significant unobservable inputs of the fair value for life settlement and premium finance instruments is the estimate of market implied life expectancy, while for RMBS loans it is mar-ket comparable price.
For life settlement and premium finance instruments, individual life expectancy rates are typically obtained by multiplying a base mortality curve for the general insured population provided by a professional actuarial organization together with an individual-spe-cific multiplier. Individual-specific multipliers are determined based on data from third-party life expectancy data providers, which
examine the insured individual’s medical conditions, family history and other factors to arrive at a life expectancy estimate.
For RMBS loans, the use of market comparable price var-ies depending upon each specific loan. For some loans, similar to unobservable RMBS securities, prices from similar observable instruments are used to calculate implied inputs which are then used to value unobservable instruments using discounted cash flow. The discounted cash flow price is then compared to the unobservable prices and assessed for reasonableness. For other RMBS loans, the loans are categorized by specific characteristics, such as loan-to-value ratio, average account balance, loan type (single or multi-family), lien, seasoning, coupon, FICO score, local-ity, delinquency status, cash flow velocity, roll rates, loan purpose, occupancy, servicers advance agreement type, modification sta-tus, Federal Housing Administration insurance, property value and documentation quality. Loans with unobservable prices are put into consistent buckets which are then compared to market observable comparable prices in order to assess the reasonableness of those unobservable prices.
Other investmentsPrivate equity, hedge funds and other equity investmentsOther equity investments principally includes equity investments in the form of a) direct investments in third-party hedge funds, private equity funds and funds of funds, b) equity-method invest-ments where the Group has the ability to significantly influence the operating and financial policies of the investee, and c) direct investments in non-marketable equity securities.
Direct investments in third-party hedge funds, private equity funds and funds of funds are measured at fair value based on their published net asset values (NAVs) as permitted by ASC Topic 820 – Fair Value Measurement. In some cases, NAVs may be adjusted where there is sufficient evidence that the NAV published by the investment manager is not in line with the fund’s observable market data, it is probable that the investment will be sold for an amount other than NAV or there exist other circumstances that would require an adjustment to the published NAV. Although rarely adjusted, significant judgment is involved in making any adjust-ments to the published NAVs. The investments for which the fair value is measured using the NAV practical expedient are not cat-egorized within the fair value hierarchy.
Direct investments in non-marketable equity securities consist of both real estate investments and non-real estate investments. Equity-method investments and direct investments in non-mar-ketable equity securities are initially measured at their transaction price, as this is the best estimate of fair value. Thereafter, these investments are individually measured at fair value based upon a number of factors that include any recent rounds of financing involving third-party investors, comparable company transactions, multiple analyses of cash flows or book values, or discounted cash flow analyses. The availability of information used in these model-ing techniques is often limited and involves significant judgment in evaluating these different factors over time. As a result, these investments are included in level 3 of the fair value hierarchy.
151Condensed consolidated financial statements – unaudited
Life finance instrumentsLife finance instruments include Single Premium Immediate Annui-ties (SPIA) and other premium finance instruments. Life finance instruments are valued in a similar manner as described for life settlement and premium finance instruments under the other trad-ing assets section above.
LoansThe Group’s loan portfolio which is measured at fair value primarily consists of commercial and industrial loans and loans to financial institutions. Within these categories, loans measured at fair value include commercial loans, real estate loans, corporate loans, lever-age finance loans and emerging market loans. Fair value is based on recent transactions and quoted prices, where available. Where recent transactions and quoted prices are not available, fair value may be determined by relative value benchmarking (which includes pricing based upon another position in the same capital structure, other comparable loan issues, generic industry credit spreads, implied credit spreads derived from CDS for the specific borrower, and enterprise valuations) or calculated based on the exit price of the collateral, based on current market conditions.
Both the funded and unfunded portion of revolving credit lines on the corporate lending portfolio are valued using a loan pric-ing model, which requires estimates of significant inputs includ-ing credit spreads, recovery rates, credit conversion factors, and weighted average life of the loan. Significant unobservable inputs may include credit spread and price.
The Group’s other assets and liabilities include mortgage loans held in conjunction with securitization activities and assets and liabilities of VIEs and mortgage securitizations that do not meet the criteria for sale treatment under US GAAP. The fair value of mort-gage loans held in conjunction with securitization activities is deter-mined on a whole-loan basis and is consistent with the valuation of RMBS loans discussed in “Other trading assets” above. Whole-loan valuations are calculated based on the exit price reflecting the current market conditions. The fair value of assets and liabilities of VIEs and mortgage securitizations that do not meet the crite-ria for sale treatment under US GAAP are determined based on the quoted prices for securitized bonds, where available, or on cash flow analyses for securitized bonds, when quoted prices are not available. The fair value of the consolidated financial assets of RMBS and CMBS securitization vehicles, which qualify as CFEs, are measured on the basis of the more observable fair value of the VIEs’ financial liabilities.
Accrual based loans in the Group’s private, corporate and insti-tutional banking businesses, for which an estimated fair value is disclosed in the table “Carrying value and fair value of financial instruments not carried at fair value” below, include consumer loans relating to mortgages, loans collateralized by securities or consumer finance, as well as corporate and institutional loans relating to real estate, commercial and industrial loans, and loans to financial institutions, governments and public institutions. Fair values for these loans are determined by using a discounted cash flow model. Future cash flows are discounted using risk-adjusted
discount rates which are derived from observable market interest rates for the applicable maturity and currency and from counter-party-related credit spreads.
DepositsAccrual based deposits with a stated maturity, for which an esti-mated fair value is disclosed in the table “Carrying value and fair value of financial instruments not carried at fair value” below, are generally fair valued by using a discounted cash flow model incor-porating the Group’s credit spreads. The estimated fair value of accrual accounted deposits without a stated maturity approximates the carrying amount; however, the value does not include an esti-mate of the value attributed to the long-term relationships with its customers that in the aggregate adds significant value to the Group’s stable deposit base.
Short-term borrowings and long-term debt The Group’s short-term borrowings and long-term debt include structured notes (hybrid financial instruments that are both bifur-catable and non-bifurcatable) and vanilla debt. The fair value of structured notes is based on quoted prices, where available. When quoted prices are not available, fair value is determined by using a discounted cash flow model incorporating the Group’s credit spreads, the value of derivatives embedded in the debt and the residual term of the issuance based on call options. Derivatives structured into the issued debt are valued consistently with the Group’s stand-alone derivative contracts held for trading purposes or used in hedge accounting relationships as discussed above. The fair value of structured debt is heavily influenced by the combined call options and performance of the underlying derivative returns. Significant unobservable inputs for long-term debt include buy-back probability, gap risk, correlation, volatility, credit spread, mean reversion and price.
Generally, the interrelationships between volatility, correlation, gap risk and credit spread inputs are positively correlated.
Other liabilitiesFailed salesThese liabilities represent the financing of assets that did not achieve sale accounting treatment under US GAAP. Failed sales are valued in a manner consistent with the related underlying financial instruments.
Short-term financial instrumentsCertain short-term financial instruments are not carried at fair value on the balance sheet, but a fair value has been disclosed in the table “Carrying value and fair value of financial instruments not carried at fair value” below. These instruments include: cash and due from banks, cash collateral receivables and payables and other receivables and payables arising in the ordinary course of business. For these financial instruments, the carrying value approximates the fair value due to the relatively short period of time between their origination and expected realization, as well as the minimal credit risk inherent in these instruments.
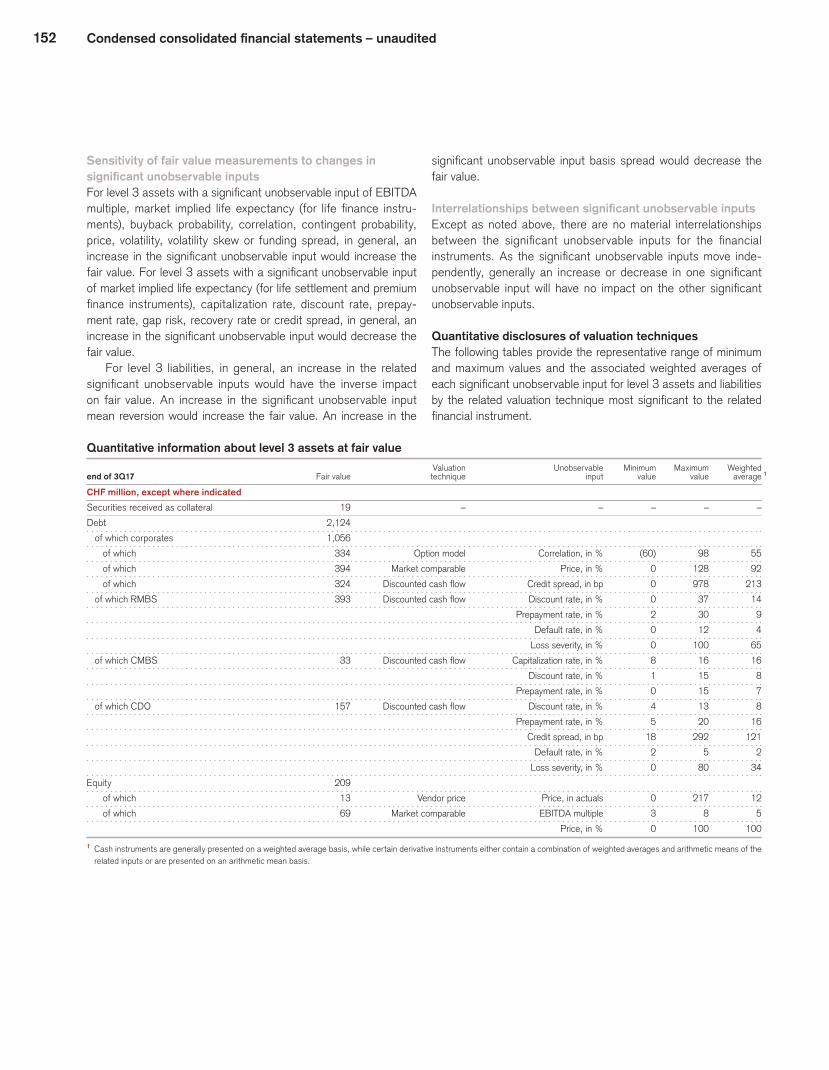
152 Condensed consolidated financial statements – unaudited
Sensitivity of fair value measurements to changes in significant unobservable inputsFor level 3 assets with a significant unobservable input of EBITDA multiple, market implied life expectancy (for life finance instru-ments), buyback probability, correlation, contingent probability, price, volatility, volatility skew or funding spread, in general, an increase in the significant unobservable input would increase the fair value. For level 3 assets with a significant unobservable input of market implied life expectancy (for life settlement and premium finance instruments), capitalization rate, discount rate, prepay-ment rate, gap risk, recovery rate or credit spread, in general, an increase in the significant unobservable input would decrease the fair value.
For level 3 liabilities, in general, an increase in the related significant unobservable inputs would have the inverse impact on fair value. An increase in the significant unobservable input mean reversion would increase the fair value. An increase in the
significant unobservable input basis spread would decrease the fair value.
Interrelationships between significant unobservable inputsExcept as noted above, there are no material interrelationships between the significant unobservable inputs for the financial instruments. As the significant unobservable inputs move inde-pendently, generally an increase or decrease in one significant unobservable input will have no impact on the other significant unobservable inputs.
Quantitative disclosures of valuation techniquesThe following tables provide the representative range of minimum and maximum values and the associated weighted averages of each significant unobservable input for level 3 assets and liabilities by the related valuation technique most significant to the related financial instrument.
Quantitative information about level 3 assets at fair value Valuation Unobservable Minimum Maximum Weighted
end of 3Q17 Fair value technique input value value average 1
CHF million, except where indicated
Securities received as collateral 19 – – – – –
Debt 2,124
of which corporates 1,056
of which 334 Option model Correlation, in % (60) 98 55
of which 394 Market comparable Price, in % 0 128 92
of which 324 Discounted cash flow Credit spread, in bp 0 978 213
of which RMBS 393 Discounted cash flow Discount rate, in % 0 37 14
Prepayment rate, in % 2 30 9
Default rate, in % 0 12 4
Loss severity, in % 0 100 65
of which CMBS 33 Discounted cash flow Capitalization rate, in % 8 16 16
Discount rate, in % 1 15 8
Prepayment rate, in % 0 15 7
of which CDO 157 Discounted cash flow Discount rate, in % 4 13 8
Prepayment rate, in % 5 20 16
Credit spread, in bp 18 292 121
Default rate, in % 2 5 2
Loss severity, in % 0 80 34
Equity 209
of which 13 Vendor price Price, in actuals 0 217 12
of which 69 Market comparable EBITDA multiple 3 8 5
Price, in % 0 100 100
1 Cash instruments are generally presented on a weighted average basis, while certain derivative instruments either contain a combination of weighted averages and arithmetic means of the related inputs or are presented on an arithmetic mean basis.

153Condensed consolidated financial statements – unaudited
Quantitative information about level 3 assets at fair value (continued) Valuation Unobservable Minimum Maximum Weighted
end of 3Q17 Fair value technique input value value average 1
CHF million, except where indicated
Derivatives 3,473
of which interest rate products 806 Option model Correlation, in % 21 100 73
Prepayment rate, in % 4 34 17
Volatility skew, in % (4) 0 (1)
of which equity/index-related products 889 Option model Correlation, in % (60) 98 69
Volatility, in % 2 163 30
Buyback probability, in % 2 50 100 87
Gap risk, in % 3 0 2 1
of which credit derivatives 474 Discounted cash flow Credit spread, in bp 0 1,713 132
Recovery rate, in % 0 70 29
Discount rate, in % 0 40 18
Default rate, in % 1 20 5
Loss severity, in % 22 100 64
Correlation, in % 97 97 97
Prepayment rate, in % 0 15 6
Other 3,075
of which 1,946 Market comparable Price, in % 0 110 24
Market implied life
of which 840 Discounted cash flow expectancy, in years 3 18 8
Trading assets 8,881
Investment securities 54 – – – – –
Private equity 7 – – – – –
Other equity investments 268 – – – – –
Market implied life
Life finance instruments 1,358 Discounted cash flow expectancy, in years 2 18 6
Other investments 1,633
Loans 4,963
of which commercial and industrial loans 2,400
of which 1,978 Discounted cash flow Credit spread, in bp 96 1,160 383
of which 414 Market comparable Price, in % 0 100 59
of which financial institutions 1,631
of which 1,442 Discounted cash flow Credit spread, in bp 52 1,475 407
of which 10 Market comparable Price, in % 0 95 95
Other intangible assets (mortgage servicing rights) 153 – – – – –
Other assets 1,899
of which loans held-for-sale 1,691
of which 1,247 Discounted cash flow Credit spread, in bp 117 961 243
Recovery rate, in % 12 98 76
of which 225 Market comparable Price, in % 0 102 79
Total level 3 assets at fair value 17,602
1 Cash instruments are generally presented on a weighted average basis, while certain derivative instruments either contain a combination of weighted averages and arithmetic means of the related inputs or are presented on an arithmetic mean basis.
2 Estimate of the probability of structured notes being put back to the Group at the option of the investor over the remaining life of the financial instruments.3 Risk of unexpected large declines in the underlying values occuring between collateral settlement dates.

154 Condensed consolidated financial statements – unaudited
Quantitative information about level 3 assets at fair value (continued) Valuation Unobservable Minimum Maximum Weighted
end of 4Q16 Fair value technique input value value average 1
CHF million, except where indicated
Interest-bearing deposits with banks 1 – – – – –
Central bank funds sold, securities
purchased under resale agreements
and securities borrowing transactions 174 Discounted cash flow Funding spread, in bp 10 450 259
Securities received as collateral 70 – – – – –
Debt 3,977
of which corporates 1,674
of which 448 Option model Correlation, in % (85) 98 23
of which 817 Market comparable Price, in % 0 117 86
of which 101 Discounted cash flow Credit spread, in bp 3 1,004 308
of which RMBS 605
of which 445 Discounted cash flow Discount rate, in % 0 47 8
Prepayment rate, in % 2 30 12
Default rate, in % 0 10 3
Loss severity, in % 0 100 43
of which 120 Market comparable Price, in % 21 30 26
of which CMBS 65 Discounted cash flow Capitalization rate, in % 8 9 9
Discount rate, in % 2 27 10
Prepayment rate, in % 0 15 9
of which CDO 1,165
of which 195 Discounted cash flow Discount rate, in % 7 27 15
Prepayment rate, in % 0 30 10
Credit spread, in bp 328 328 328
Default rate, in % 0 5 2
Loss severity, in % 3 100 45
of which 851 Market comparable Price, in % 208 208 208
Equity 240 Market comparable EBITDA multiple 3 8 6
Price, in % 0 100 70
1 Cash instruments are generally presented on a weighted average basis, while certain derivative instruments either contain a combination of weighted averages and arithmetic means of the related inputs or are presented on an arithmetic mean basis.
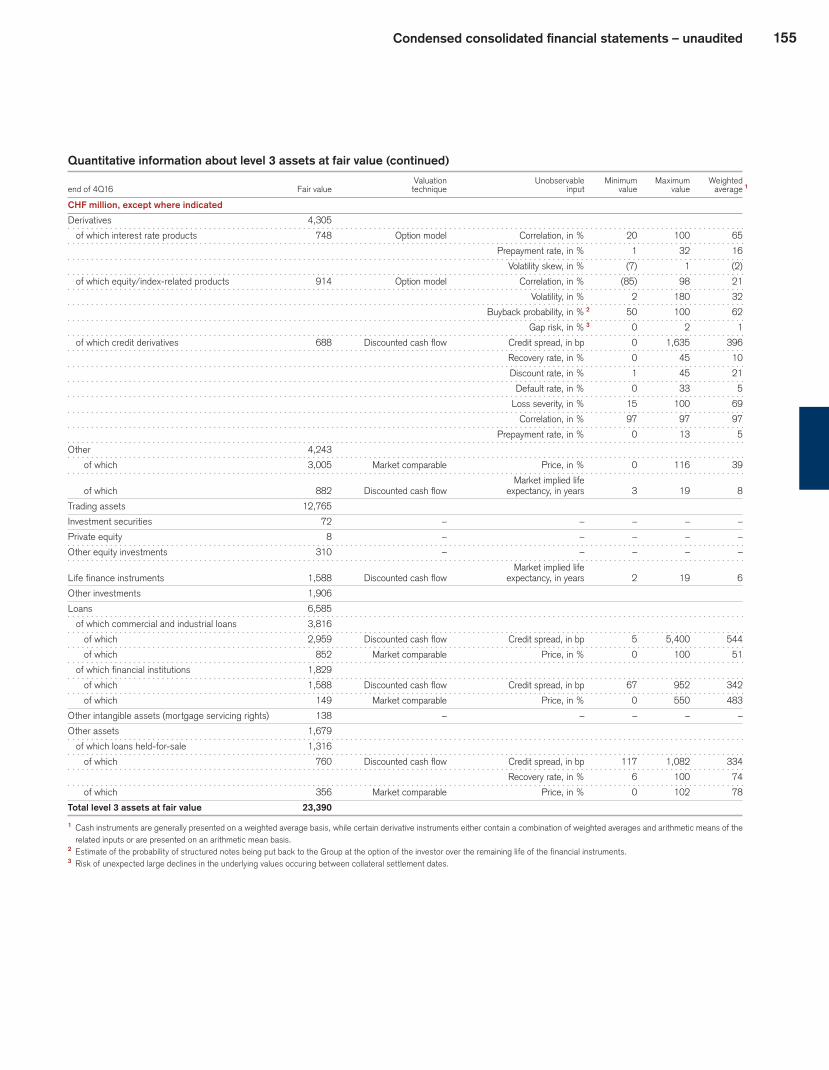
155Condensed consolidated financial statements – unaudited
Quantitative information about level 3 assets at fair value (continued) Valuation Unobservable Minimum Maximum Weighted
end of 4Q16 Fair value technique input value value average 1
CHF million, except where indicated
Derivatives 4,305
of which interest rate products 748 Option model Correlation, in % 20 100 65
Prepayment rate, in % 1 32 16
Volatility skew, in % (7) 1 (2)
of which equity/index-related products 914 Option model Correlation, in % (85) 98 21
Volatility, in % 2 180 32
Buyback probability, in % 2 50 100 62
Gap risk, in % 3 0 2 1
of which credit derivatives 688 Discounted cash flow Credit spread, in bp 0 1,635 396
Recovery rate, in % 0 45 10
Discount rate, in % 1 45 21
Default rate, in % 0 33 5
Loss severity, in % 15 100 69
Correlation, in % 97 97 97
Prepayment rate, in % 0 13 5
Other 4,243
of which 3,005 Market comparable Price, in % 0 116 39
Market implied life
of which 882 Discounted cash flow expectancy, in years 3 19 8
Trading assets 12,765
Investment securities 72 – – – – –
Private equity 8 – – – – –
Other equity investments 310 – – – – –
Market implied life
Life finance instruments 1,588 Discounted cash flow expectancy, in years 2 19 6
Other investments 1,906
Loans 6,585
of which commercial and industrial loans 3,816
of which 2,959 Discounted cash flow Credit spread, in bp 5 5,400 544
of which 852 Market comparable Price, in % 0 100 51
of which financial institutions 1,829
of which 1,588 Discounted cash flow Credit spread, in bp 67 952 342
of which 149 Market comparable Price, in % 0 550 483
Other intangible assets (mortgage servicing rights) 138 – – – – –
Other assets 1,679
of which loans held-for-sale 1,316
of which 760 Discounted cash flow Credit spread, in bp 117 1,082 334
Recovery rate, in % 6 100 74
of which 356 Market comparable Price, in % 0 102 78
Total level 3 assets at fair value 23,390
1 Cash instruments are generally presented on a weighted average basis, while certain derivative instruments either contain a combination of weighted averages and arithmetic means of the related inputs or are presented on an arithmetic mean basis.
2 Estimate of the probability of structured notes being put back to the Group at the option of the investor over the remaining life of the financial instruments.3 Risk of unexpected large declines in the underlying values occuring between collateral settlement dates.

156 Condensed consolidated financial statements – unaudited
Quantitative information about level 3 liabilities at fair value Valuation Unobservable Minimum Maximum Weighted
end of 3Q17 Fair value technique input value value average 1
CHF million, except where indicated
Customer deposits 438 – – – – –
Obligation to return securities received
as collateral 19 – – – – –
Trading liabilities 2,792
of which interest rate derivatives 328 Option model Basis spread, in bp (13) 70 28
Correlation, in % 21 100 61
Prepayment rate, in % 4 34 9
of which foreign exchange derivatives 82
of which 64 Option model Correlation, in % (10) 70 48
Prepayment rate, in % 27 34 31
of which 6 Discounted cash flow Contingent probability, in % 90 95 92
of which equity/index-related derivatives 1,092 Option model Correlation, in % (60) 98 56
Volatility, in % 2 163 26
Buyback probability, in % 2 50 100 87
of which credit derivatives 686 Discounted cash flow Credit spread, in bp 0 1,713 114
Discount rate, in % 0 40 18
Default rate, in % 1 20 5
Recovery rate, in % 20 70 43
Loss severity, in % 22 100 64
Correlation, in % 27 86 56
Prepayment rate, in % 0 15 6
Short-term borrowings 599 – – – – –
Long-term debt 12,917
of which structured notes over two years 12,476
of which 10,072 Option model Correlation, in % (60) 99 55
Volatility, in % 0 163 21
Buyback probability, in % 2 50 100 87
Gap risk, in % 3 0 2 1
Mean reversion, in % 4 (14) (1) (6)
of which 1,752 Discounted cash flow Credit spread, in bp 0 652 110
Other liabilities 1,415
of which failed sales 233
of which 109 Market comparable Price, in % 0 91 55
of which 46 Discounted cash flow Discount rate, in % 9 19 14
Total level 3 liabilities at fair value 18,180
1 Cash instruments are generally presented on a weighted average basis, while certain derivative instruments either contain a combination of weighted averages and arithmetic means of the related inputs or are presented on an arithmetic mean basis.
2 Estimate of the probability of structured notes being put back to the Group at the option of the investor over the remaining life of the financial instruments.3 Risk of unexpected large declines in the underlying values occuring between collateral settlement dates.4 Management’s best estimate of the speed at which interest rates will revert to the long-term average.
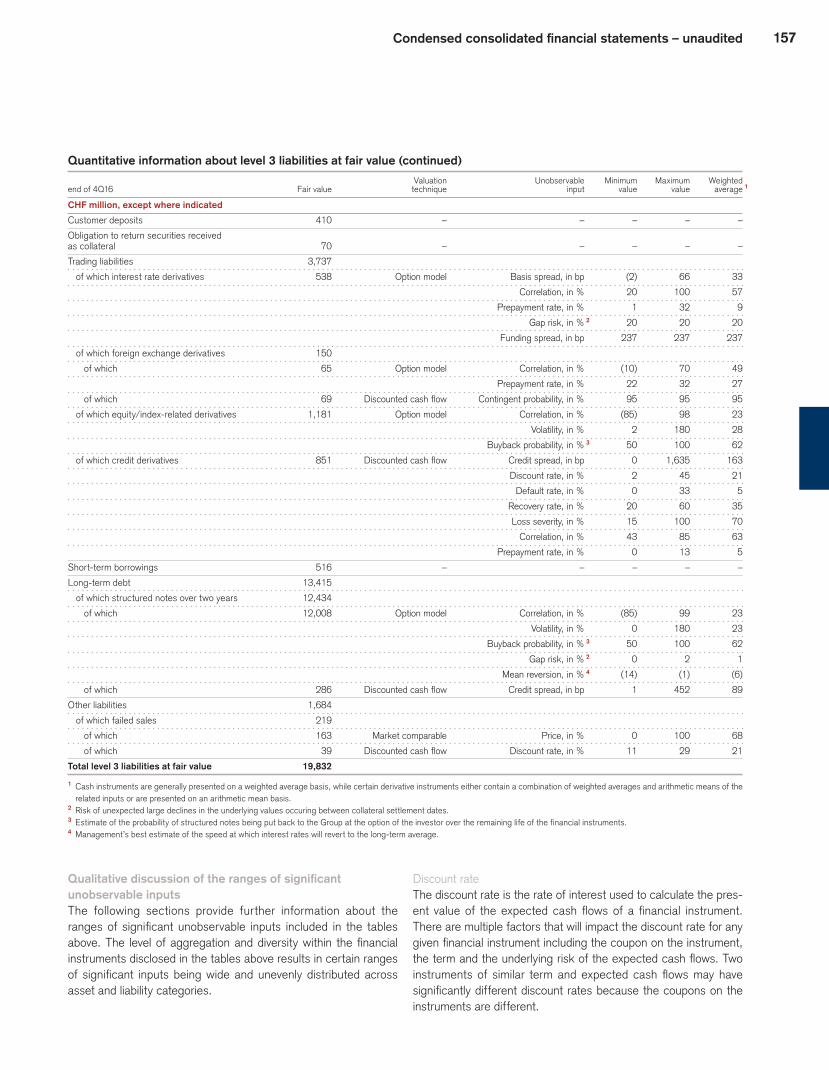
157Condensed consolidated financial statements – unaudited
Quantitative information about level 3 liabilities at fair value (continued) Valuation Unobservable Minimum Maximum Weighted
end of 4Q16 Fair value technique input value value average 1
CHF million, except where indicated
Customer deposits 410 – – – – –
Obligation to return securities received
as collateral 70 – – – – –
Trading liabilities 3,737
of which interest rate derivatives 538 Option model Basis spread, in bp (2) 66 33
Correlation, in % 20 100 57
Prepayment rate, in % 1 32 9
Gap risk, in % 2 20 20 20
Funding spread, in bp 237 237 237
of which foreign exchange derivatives 150
of which 65 Option model Correlation, in % (10) 70 49
Prepayment rate, in % 22 32 27
of which 69 Discounted cash flow Contingent probability, in % 95 95 95
of which equity/index-related derivatives 1,181 Option model Correlation, in % (85) 98 23
Volatility, in % 2 180 28
Buyback probability, in % 3 50 100 62
of which credit derivatives 851 Discounted cash flow Credit spread, in bp 0 1,635 163
Discount rate, in % 2 45 21
Default rate, in % 0 33 5
Recovery rate, in % 20 60 35
Loss severity, in % 15 100 70
Correlation, in % 43 85 63
Prepayment rate, in % 0 13 5
Short-term borrowings 516 – – – – –
Long-term debt 13,415
of which structured notes over two years 12,434
of which 12,008 Option model Correlation, in % (85) 99 23
Volatility, in % 0 180 23
Buyback probability, in % 3 50 100 62
Gap risk, in % 2 0 2 1
Mean reversion, in % 4 (14) (1) (6)
of which 286 Discounted cash flow Credit spread, in bp 1 452 89
Other liabilities 1,684
of which failed sales 219
of which 163 Market comparable Price, in % 0 100 68
of which 39 Discounted cash flow Discount rate, in % 11 29 21
Total level 3 liabilities at fair value 19,832
1 Cash instruments are generally presented on a weighted average basis, while certain derivative instruments either contain a combination of weighted averages and arithmetic means of the related inputs or are presented on an arithmetic mean basis.
2 Risk of unexpected large declines in the underlying values occuring between collateral settlement dates.3 Estimate of the probability of structured notes being put back to the Group at the option of the investor over the remaining life of the financial instruments.4 Management’s best estimate of the speed at which interest rates will revert to the long-term average.
Qualitative discussion of the ranges of significant unobservable inputsThe following sections provide further information about the ranges of significant unobservable inputs included in the tables above. The level of aggregation and diversity within the financial instruments disclosed in the tables above results in certain ranges of significant inputs being wide and unevenly distributed across asset and liability categories.
Discount rateThe discount rate is the rate of interest used to calculate the pres-ent value of the expected cash flows of a financial instrument. There are multiple factors that will impact the discount rate for any given financial instrument including the coupon on the instrument, the term and the underlying risk of the expected cash flows. Two instruments of similar term and expected cash flows may have significantly different discount rates because the coupons on the instruments are different.

158 Condensed consolidated financial statements – unaudited
Default rate and loss severityFor financial instruments backed by residential real estate or other assets, diversity in the portfolio is reflected in a wide range for loss severity due to varying levels of default. The lower end of the range represents high performing or government guaranteed collateral with a low probability of default or guaranteed timely payment of principal and interest, while the higher end of the range relates to collateral with a greater risk of default.
Credit spread and recovery rateFor financial instruments where credit spread is the significant unobservable input, the wide range represents positions with varying levels of risk. The lower end of the credit spread range typically represents shorter-dated instruments and/or those with better perceived credit risk. The higher end of the range typically comprises longer-dated financial instruments or those referencing non-performing, distressed or impaired reference credits. Similarly, the spread between the reference credit and an index can vary significantly based on the risk of the instrument. The spread will be positive for instruments that have a higher risk of default than the index (which is based on a weighted average of its components) and negative for instruments that have a lower risk of default than the index.
Similarly, recovery rates can vary significantly depending upon the specific assets and terms of each transaction. Transactions with higher seniority or more valuable collateral will have higher recovery rates, while those transactions which are more subordi-nated or with less valuable collateral will have lower recovery rates.
CorrelationThere are many different types of correlation inputs, including credit correlation, cross-asset correlation (such as equity-inter-est rate correlation), and same-asset correlation (such as inter-est rate-interest rate correlation). Correlation inputs are generally used to value hybrid and exotic instruments. Due to the complex and unique nature of these instruments, the ranges for correlation inputs can vary widely across portfolios.
Prepayment ratePrepayment rates may vary from collateral pool to collateral pool, and are driven by a variety of collateral-specific factors, including the type and location of the underlying borrower, the remaining tenor of the obligation and the level and type (e.g., fixed or floating) of interest rate being paid by the borrower.
Volatility and volatility skewVolatility and its skew are both impacted by the underlying risk, term and strike price of the derivative. In the case of interest rate derivatives, volatility may vary significantly between different underlying currencies and expiration dates on the options. Simi-larly, in the case of equity derivatives, the volatility attributed to a structure may vary depending upon the underlying reference name on the derivative.
Market implied life expectancyMarket implied life expectancy is the primary significant unobserv-able input on such products as life settlement, premium finance and SPIA, and represents the estimated mortality rate for the underlying insured for each contract. This estimate may vary depending upon multiple factors including the age and specific health characteristics of the insured.
PriceBond equivalent price is a primary significant unobservable input for multiple products. Where market prices are not available for an instrument, benchmarking may be utilized to identify comparable issues (same industry and similar product mixes) while adjustments are considered for differences in deal terms and performance.
Buyback probabilityBuyback probability is the probability assigned to structured notes being unwound prior to their legal maturity.
Gap riskGap risk is the primary significant unobservable input for fund-linked Constant Proportion Portfolio Insurance products and struc-tures where the payoff may be sensitive to discontinuity in the hedging portfolio.
Mean reversionMean reversion is the primary significant unobservable input for callable constant maturity swap (CMS) spread exotics and rep-resents the idea that prices and returns eventually move back towards the historical average.
Funding spreadFunding spread is the primary significant unobservable input for special purpose vehicle funding facilities. Synthetic funding curves which represent the assets pledged as collateral are used to value structured financing transactions. The curves provide an estimate of where secured funding can be sourced and are expressed as a basis point spread in relation to the referenced benchmark rate.
Capitalization rateCapitalization rate is the primary significant unobservable input for CMBS loans and is used to estimate the potential return on invest-ment. This is done by dividing the yearly income by the total value of the property.
Basis spreadBasis spread is the primary significant unobservable input for non-callable constant maturity treasury-CMS products and is used to determine interest rate risk as a result of differing lending and bor-rowing rates.

159Condensed consolidated financial statements – unaudited
EBITDA multipleEBITDA multiple is a primary significant unobservable input for some equity deals which are benchmarked using industry com-parables. The EBITDA multiple may be preferred over other measures because it is normalized for differences between the accounting policies of similar companies.
Contingent probabilityContingent probability is the primary significant unobservable input for contingent foreign exchange forward trades where the delivery or exercise and the premium payment are contingent on an event such as completion of an M&A deal or regulatory approval for a product.
Fair value measurements of investments in certain entities that calculate NAV per shareInvestments in funds held in trading assets and liabilities primar-ily include positions held in equity funds of funds as an economic hedge for structured notes and derivatives issued to clients that reference the same underlying risk and liquidity terms of the fund. A majority of these funds have limitations imposed on the amount
of withdrawals from the fund during the redemption period due to illiquidity of the investments. In other instances, the withdrawal amounts may vary depending on the redemption notice period and are usually larger for the longer redemption notice periods. In addi-tion, penalties may apply if redemption is within a certain time period from initial investment.
Investment in funds held in other investments principally involves private securities and, to a lesser extent, publicly traded securities and fund of funds. Several of these investments have redemption restrictions subject to the discretion of the Board of Directors of the fund and/or redemption is permitted without restriction, but is limited to a certain percentage of total assets or only after a certain date.
Furthermore, for those investments held in both trading assets and other investments that are nonredeemable, the underlying assets of such funds are expected to be liquidated over the life of the fund, which is generally up to 10 years.
The following table pertains to investments in certain entities that calculate NAV per share or its equivalent, primarily private equity and hedge funds. These investments do not have a readily determinable fair value and are measured at fair value using NAV.
Fair value, unfunded commitments and term of redemption conditions
end of 3Q17 4Q16
Unfunded Unfunded Non- Total commit- Non- Total commit- redeemable Redeemable fair value ments redeemable Redeemable fair value ments
Fair value and unfunded commitments (CHF million)
Equity funds 63 995 1 1,058 0 65 1,281 2 1,346 0
Equity funds sold short 0 (4) (4) 0 0 (1) (1) 0
Total funds held in trading assets and liabilities 63 991 1,054 0 65 1,280 1,345 0
Debt funds 171 65 236 0 215 77 292 0
Equity funds 2 44 46 0 2 51 53 0
Others 1 51 52 0 0 201 201 0
Hedge funds 174 160 3 334 0 217 329 4 546 0
Debt funds 1 0 1 0 5 0 5 20
Equity funds 196 0 196 54 240 0 240 42
Real estate funds 191 0 191 46 212 0 212 50
Others 34 0 34 15 117 0 117 58
Private equities 422 0 422 115 574 0 574 170
Equity method investments 74 1,234 1,308 5 347 637 984 218
Total funds held in other investments 670 1,394 2,064 120 1,138 966 2,104 388
Total fair value 733 5 2,385 6 3,118 120 7 1,203 5 2,246 6 3,449 388 7
1 56% of the redeemable fair value amount of equity funds is redeemable on demand with a notice period primarily of less than 30 days, 30% is redeemable on a monthly basis with a notice period primarily of less than 30 days, 11% is redeemable on a quarterly basis with a notice period primarily of more than 45 days, and 3% is redeemable on an annual basis with a notice period primarily of more than 60 days.
2 58% of the redeemable fair value amount of equity funds is redeemable on demand with a notice period primarily of less than 30 days, 23% is redeemable on a monthly basis with a notice period primarily of less than 30 days, 17% is redeemable on a quarterly basis with a notice period primarily of more than 45 days, and 2% is redeemable on an annual basis with a notice period of more than 60 days.
3 51% of the redeemable fair value amount of hedge funds is redeemable on a quarterly basis with a notice period primarily of more than 45 days, 42% is redeemable on a monthly basis with a notice period primarily of less than 30 days, and 7% is redeemable on demand with a notice period primarily of less than 30 days.
4 68% of the redeemable fair value amount of hedge funds is redeemable on a quarterly basis with a notice period primarily of more than 60 days, 26% is redeemable on a monthly basis with a notice period primarily of less than 30 days, 5% is redeemable on demand with a notice period primarily of less than 30 days, and 1% is redeemable on an annual basis with a notice period primarily of more than 45 days.
5 Includes CHF 219 million and CHF 334 million attributable to noncontrolling interests in 3Q17 and 4Q16, respectively.6 Includes CHF 105 million and CHF 231 million attributable to noncontrolling interests in 3Q17 and 4Q16, respectively.7 Includes CHF 69 million and CHF 88 million attributable to noncontrolling interests in 3Q17 and 4Q16, respectively.

160 Condensed consolidated financial statements – unaudited
Nonrecurring fair value changesCertain assets and liabilities are measured at fair value on a non-recurring basis; that is, they are not measured at fair value on an ongoing basis but are subject to fair value adjustments in certain circumstances, for example, when there is evidence of impair-ment. The Group typically uses nonfinancial assets measured at fair value on a recurring or nonrecurring basis in a manner that reflects their highest and best use. Nonrecurring measurements are completed as of the end of the period unless otherwise stated.
Nonrecurring fair value changes
end of 3Q17 4Q16
CHF billion
Assets held-for-sale recorded at fair value
on a nonrecurring basis 0.1 0.1
of which level 2 0.1 0.1
FAIR VALUE OPTIONThe Group has availed itself of the simplification in accounting offered under the fair value option, primarily in the investment banking businesses and International Wealth Management’s Asset Management business. This has been accomplished generally by electing the fair value option, both at initial adoption and for sub-sequent transactions, on items impacted by the hedge account-ing requirements of US GAAP. That is, for instruments for which there was an inability to achieve hedge accounting and for which the Group is economically hedged, the Group has elected the fair value option. Similarly, where the Group manages an activity on a fair value basis but previously has been unable to achieve fair value accounting, the Group has utilized the fair value option to align its risk management reporting to its financial accounting.u Refer to “Note 35 – Financial instruments” in V – Consolidated financial state-ments – Credit Suisse Group in the Credit Suisse Annual Report 2016 for further information on the Group’s election of the fair value option for certain of its finan-cial statement captions.
Difference between the aggregate fair value and the aggregate unpaid principal balances of loans and financial instruments
end of 3Q17 4Q16
Aggregate Aggregate Aggregate Aggregate fair unpaid fair unpaid value principal Difference value principal Difference
Loans (CHF million)
Non-interest-earning loans 928 3,996 (3,068) 1,276 4,495 (3,219)
Financial instruments (CHF million)
Interest-bearing deposits with banks 0 0 0 26 25 1
Central bank funds sold, securities purchased under
resale agreements and securities borrowing transactions 97,413 97,324 89 87,331 87,208 123
Loans 15,362 15,832 (470) 19,528 20,144 (616)
Other assets 1 7,875 10,635 (2,760) 8,369 11,296 (2,927)
Due to banks and customer deposits (1,063) (997) (66) (1,120) (1,059) (61)
Central bank funds purchased, securities sold under
repurchase agreements and securities lending transactions (17,300) (17,301) 1 (19,634) (19,638) 4
Short-term borrowings (5,821) (5,798) (23) (4,061) (4,017) (44)
Long-term debt (69,346) (72,536) 3,190 (72,868) (76,123) 3,255
Other liabilities (618) (2,205) 1,587 (727) (2,331) 1,604
1 Primarily loans held-for-sale.

161Condensed consolidated financial statements – unaudited
Gains and losses on financial instruments
in 9M17 9M16
Net Net gains/ gains/ (losses) (losses)
Financial instruments (CHF million)
Interest-bearing deposits with banks 9 1 1 1
Central bank funds sold, securities purchased under
resale agreements and securities borrowing transactions 1,195 1 1,187 1
Other investments 143 2 248 2
of which related to credit risk (1) (4)
Loans 1,062 1 1,663 1
of which related to credit risk 15 12
Other assets 379 1 (540) 2
of which related to credit risk 51 (182)
Due to banks and customer deposits (24) 2 (43) 2
of which related to credit risk 13 (16)
Central bank funds purchased, securities sold under
repurchase agreements and securities lending transactions (24) 1 (103) 1
Short-term borrowings (275) 2 333 2
of which related to credit risk (17) (2)
Long-term debt (4,823) 2 (2,987) 2
Other liabilities 179 3 364 2
of which related to credit risk 94 236
1 Primarily recognized in net interest income.2 Primarily recognized in trading revenues.3 Primarily recognized in other revenues.
The following table provides additional information regarding the gains and losses attributable to changes in instrument-specific credit risk on fair value option elected liabilities which are recorded through AOCI. The table includes both the amount of change dur-ing the period and cumulatively that is attributable to the changes
in instrument-specific credit risk. In addition it includes the gains and losses related to instrument-specific credit risk that was pre-viously recorded in AOCI that have been transferred during the period to net income.
Own credit gains/(losses) on fair value option elected instruments recorded in AOCI Gains/(losses) recorded in AOCI transferred Gains/(losses) recorded into AOCI 1 to net income 1
in 3Q17 Cumulatively 3Q16 3Q17 3Q16
Financial instruments (CHF million)
Deposits (3) (46) (5) 0 0
Short-term borrowings (21) (19) 0 4 0
Long-term debt (526) (2,129) (1,081) 169 0
of which treasury debt over two years (54) (511) (278) 0 0
of which structured notes over two years (473) (1,610) (782) 169 0
Total (550) (2,194) (1,086) 173 0
1 Amounts are reflected gross of tax.
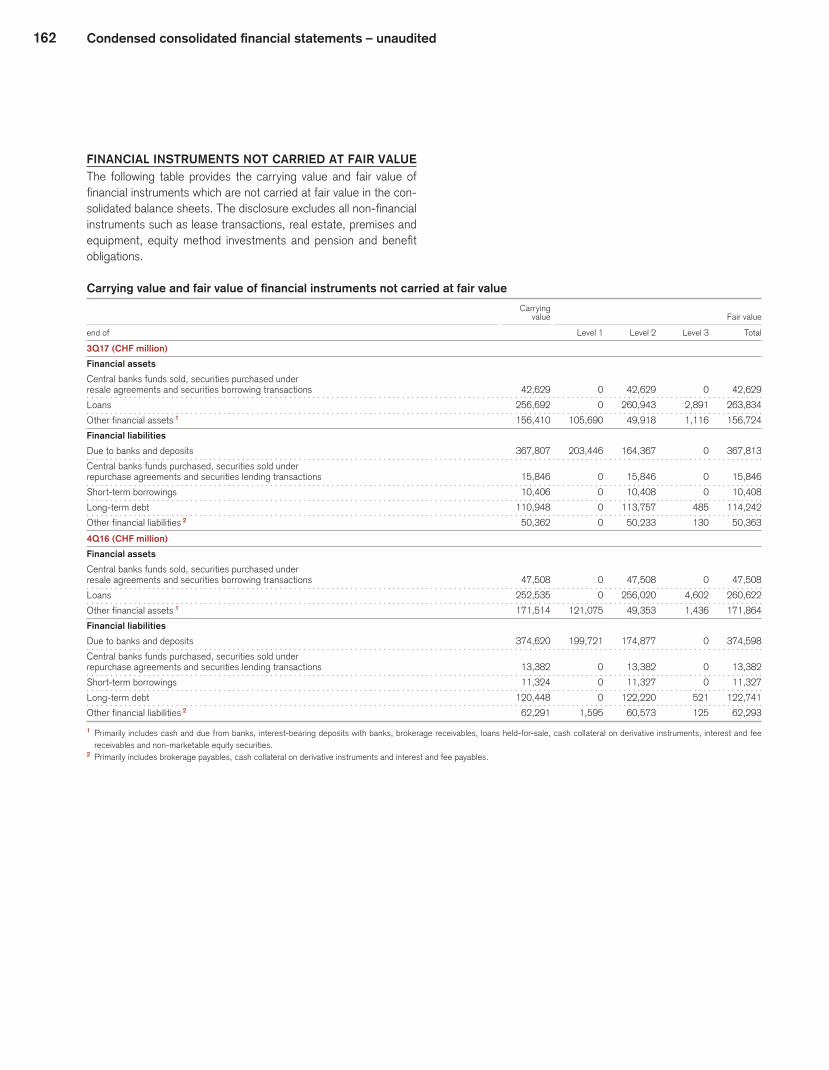
162 Condensed consolidated financial statements – unaudited
FINANCIAL INSTRUMENTS NOT CARRIED AT FAIR VALUEThe following table provides the carrying value and fair value of financial instruments which are not carried at fair value in the con-solidated balance sheets. The disclosure excludes all non-financial instruments such as lease transactions, real estate, premises and equipment, equity method investments and pension and benefit obligations.
Carrying value and fair value of financial instruments not carried at fair value Carrying value Fair value
end of Level 1 Level 2 Level 3 Total
3Q17 (CHF million)
Financial assets
Central banks funds sold, securities purchased under
resale agreements and securities borrowing transactions 42,629 0 42,629 0 42,629
Loans 256,692 0 260,943 2,891 263,834
Other financial assets 1 156,410 105,690 49,918 1,116 156,724
Financial liabilities
Due to banks and deposits 367,807 203,446 164,367 0 367,813
Central banks funds purchased, securities sold under
repurchase agreements and securities lending transactions 15,846 0 15,846 0 15,846
Short-term borrowings 10,406 0 10,408 0 10,408
Long-term debt 110,948 0 113,757 485 114,242
Other financial liabilities 2 50,362 0 50,233 130 50,363
4Q16 (CHF million)
Financial assets
Central banks funds sold, securities purchased under
resale agreements and securities borrowing transactions 47,508 0 47,508 0 47,508
Loans 252,535 0 256,020 4,602 260,622
Other financial assets 1 171,514 121,075 49,353 1,436 171,864
Financial liabilities
Due to banks and deposits 374,620 199,721 174,877 0 374,598
Central banks funds purchased, securities sold under
repurchase agreements and securities lending transactions 13,382 0 13,382 0 13,382
Short-term borrowings 11,324 0 11,327 0 11,327
Long-term debt 120,448 0 122,220 521 122,741
Other financial liabilities 2 62,291 1,595 60,573 125 62,293
1 Primarily includes cash and due from banks, interest-bearing deposits with banks, brokerage receivables, loans held-for-sale, cash collateral on derivative instruments, interest and fee receivables and non-marketable equity securities.
2 Primarily includes brokerage payables, cash collateral on derivative instruments and interest and fee payables.
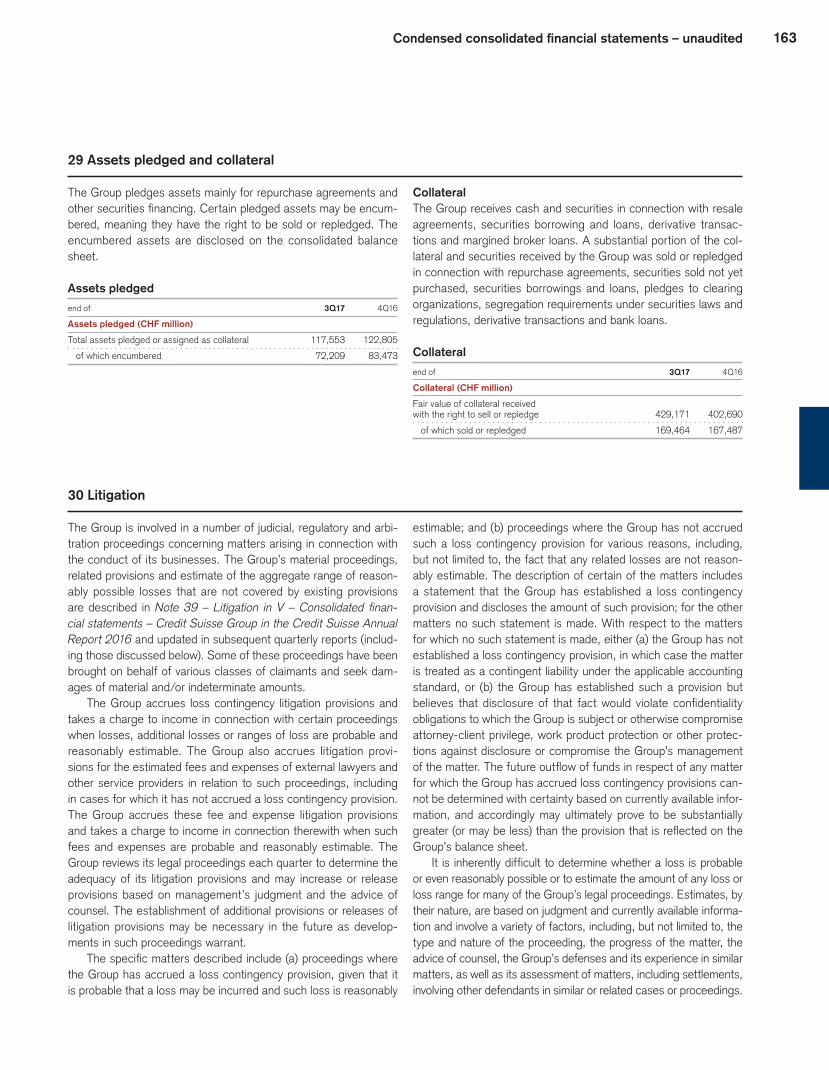
163Condensed consolidated financial statements – unaudited
29 Assets pledged and collateral
The Group pledges assets mainly for repurchase agreements and other securities financing. Certain pledged assets may be encum-bered, meaning they have the right to be sold or repledged. The encumbered assets are disclosed on the consolidated balance sheet.
Assets pledged
end of 3Q17 4Q16
Assets pledged (CHF million)
Total assets pledged or assigned as collateral 117,553 122,805
of which encumbered 72,209 83,473
CollateralThe Group receives cash and securities in connection with resale agreements, securities borrowing and loans, derivative transac-tions and margined broker loans. A substantial portion of the col-lateral and securities received by the Group was sold or repledged in connection with repurchase agreements, securities sold not yet purchased, securities borrowings and loans, pledges to clearing organizations, segregation requirements under securities laws and regulations, derivative transactions and bank loans.
Collateral
end of 3Q17 4Q16
Collateral (CHF million)
Fair value of collateral received
with the right to sell or repledge 429,171 402,690
of which sold or repledged 169,464 167,487
30 Litigation
The Group is involved in a number of judicial, regulatory and arbi-tration proceedings concerning matters arising in connection with the conduct of its businesses. The Group’s material proceedings, related provisions and estimate of the aggregate range of reason-ably possible losses that are not covered by existing provisions are described in Note 39 – Litigation in V – Consolidated finan-cial statements – Credit Suisse Group in the Credit Suisse Annual Report 2016 and updated in subsequent quarterly reports (includ-ing those discussed below). Some of these proceedings have been brought on behalf of various classes of claimants and seek dam-ages of material and/or indeterminate amounts.
The Group accrues loss contingency litigation provisions and takes a charge to income in connection with certain proceedings when losses, additional losses or ranges of loss are probable and reasonably estimable. The Group also accrues litigation provi-sions for the estimated fees and expenses of external lawyers and other service providers in relation to such proceedings, including in cases for which it has not accrued a loss contingency provision. The Group accrues these fee and expense litigation provisions and takes a charge to income in connection therewith when such fees and expenses are probable and reasonably estimable. The Group reviews its legal proceedings each quarter to determine the adequacy of its litigation provisions and may increase or release provisions based on management’s judgment and the advice of counsel. The establishment of additional provisions or releases of litigation provisions may be necessary in the future as develop-ments in such proceedings warrant.
The specific matters described include (a) proceedings where the Group has accrued a loss contingency provision, given that it is probable that a loss may be incurred and such loss is reasonably
estimable; and (b) proceedings where the Group has not accrued such a loss contingency provision for various reasons, including, but not limited to, the fact that any related losses are not reason-ably estimable. The description of certain of the matters includes a statement that the Group has established a loss contingency provision and discloses the amount of such provision; for the other matters no such statement is made. With respect to the matters for which no such statement is made, either (a) the Group has not established a loss contingency provision, in which case the matter is treated as a contingent liability under the applicable accounting standard, or (b) the Group has established such a provision but believes that disclosure of that fact would violate confidentiality obligations to which the Group is subject or otherwise compromise attorney-client privilege, work product protection or other protec-tions against disclosure or compromise the Group’s management of the matter. The future outflow of funds in respect of any matter for which the Group has accrued loss contingency provisions can-not be determined with certainty based on currently available infor-mation, and accordingly may ultimately prove to be substantially greater (or may be less) than the provision that is reflected on the Group’s balance sheet.
It is inherently difficult to determine whether a loss is probable or even reasonably possible or to estimate the amount of any loss or loss range for many of the Group’s legal proceedings. Estimates, by their nature, are based on judgment and currently available informa-tion and involve a variety of factors, including, but not limited to, the type and nature of the proceeding, the progress of the matter, the advice of counsel, the Group’s defenses and its experience in similar matters, as well as its assessment of matters, including settlements, involving other defendants in similar or related cases or proceedings.

164 Condensed consolidated financial statements – unaudited
Factual and legal determinations, many of which are complex, must be made before a loss, additional losses or ranges of loss can be reasonably estimated for any proceeding.
Most matters pending against the Group seek damages of an indeterminate amount. While certain matters specify the damages claimed, such claimed amount may not represent the Group’s rea-sonably possible losses. For certain of the proceedings discussed the Group has disclosed the amount of damages claimed and cer-tain other quantifiable information that is publicly available.
The Group’s aggregate litigation provisions include estimates of losses, additional losses or ranges of loss for proceedings for which such losses are probable and can be reasonably estimated. The Group does not believe that it can estimate an aggregate range of reasonably possible losses for certain of its proceedings because of their complexity, the novelty of some of the claims, the early stage of the proceedings, the limited amount of discov-ery that has occurred and/or other factors. The Group’s estimate of the aggregate range of reasonably possible losses that are not covered by existing provisions for the proceedings discussed in Note 39 referenced above and updated in quarterly reports (including below) for which the Group believes an estimate is pos-sible is zero to CHF 1.3 billion.
In 3Q17, the Group recorded net litigation provisions of CHF 162 million. After taking into account its litigation provisions, the Group believes, based on currently available information and advice of counsel, that the results of its legal proceedings, in the aggregate, will not have a material adverse effect on the Group’s financial con-dition. However, in light of the inherent uncertainties of such pro-ceedings, including those brought by regulators or other govern-mental authorities, the ultimate cost to the Group of resolving such proceedings may exceed current litigation provisions and any excess may be material to its operating results for any particular period, depending, in part, upon the operating results for such period.
Enron-related litigationOn September 27, 2017, following a settlement, an order of final judgment was entered by the US District Court for the Southern District of Texas, presiding in the action brought by Connecticut Resources Recovery Authority, dismissing with prejudice all claims against Credit Suisse Securities (USA) LLC (CSS LLC) and its affiliates.
Mortgage-related mattersCivil litigationThe amounts disclosed below do not reflect actual realized plain-tiff losses to date or anticipated future litigation exposure. Rather, unless otherwise stated, these amounts reflect the original unpaid principal balance amounts as alleged in these actions and do not include any reduction in principal amounts since issuance.
Individual investor actionsOn September 12, 2017, following a settlement, the US Dis-trict Court for the District of Massachusetts, presiding in the two actions brought by Massachusetts Mutual Life Insurance
Company, dismissed with prejudice all claims against CSS LLC and its employees related to approximately USD 107 million of RMBS at issue.
On October 30, 2017, CSS LLC reached an agreement in principle with CMFG Life Insurance Company and affiliated entities to settle the action brought against CSS LLC relating to approxi-mately USD 62 million of RMBS.
Rates-related mattersRegulatory authorities in a number of jurisdictions, including the Swiss Competition Commission, the European Competition Com-mission, the South African Competition Commission, the Brazilian Competition Authority and the New York Department of Finan-cial Services, have been conducting investigations into the trading activities, information sharing and the setting of benchmark rates in the foreign exchange (including electronic trading) markets. On March 31, 2014, the Swiss Competition Commission announced a formal investigation of numerous Swiss and international finan-cial institutions, including the Group, in relation to the setting of exchange rates in foreign exchange trading. The Group is cooper-ating fully with these investigations.
On September 29, 2017, the US District Court for the South-ern District of New York (SDNY) in the multi-district litigation concerning US Dollar LIBOR dismissed without prejudice Credit Suisse AG from the remaining non-stayed putative class action on the ground that there were no remaining class representatives with claims against any Credit Suisse entity.
On September 25, 2017, the SDNY granted defendants’ motion to dismiss all claims against Credit Suisse Group AG and other defendants in the putative class action relating to Swiss franc LIBOR. The SDNY has granted plaintiffs leave to file an amended complaint by November 6, 2017.
On August 18, 2017, the SDNY dismissed all claims against Credit Suisse Group AG and affiliates in the putative class action lawsuit relating to the Singapore Interbank Offered Rate and Sin-gapore Swap Offer Rate. On September 18, 2017, the plaintiffs filed an amended complaint. On October 18, 2017, defendants filed motions to dismiss the amended complaint.
On August 11, 2017, defendants filed motions to dismiss the consolidated putative class action complaint in the SDNY alleging manipulation of the foreign exchange market on behalf of indirect purchasers of foreign exchange instruments.
On August 23, 2017, the SDNY appointed lead counsel in the consolidated putative class actions relating to the US treasury markets. On August 25, 2017, three purported class representa-tives re-filed their complaints as a collective individual action.
On July 28, 2017, the SDNY granted in part and denied in part defendants’ motion to dismiss plaintiffs’ consolidated putative civil class action complaint and plaintiffs’ consolidated individual com-plaint, relating to interest rate swaps.
On October 6, 2017, in response to defendants’ motions to dismiss the putative class action in the SDNY relating to suprana-tional, sub-sovereign, and agency bonds, plaintiffs filed a motion for leave to file a consolidated amended class action complaint.
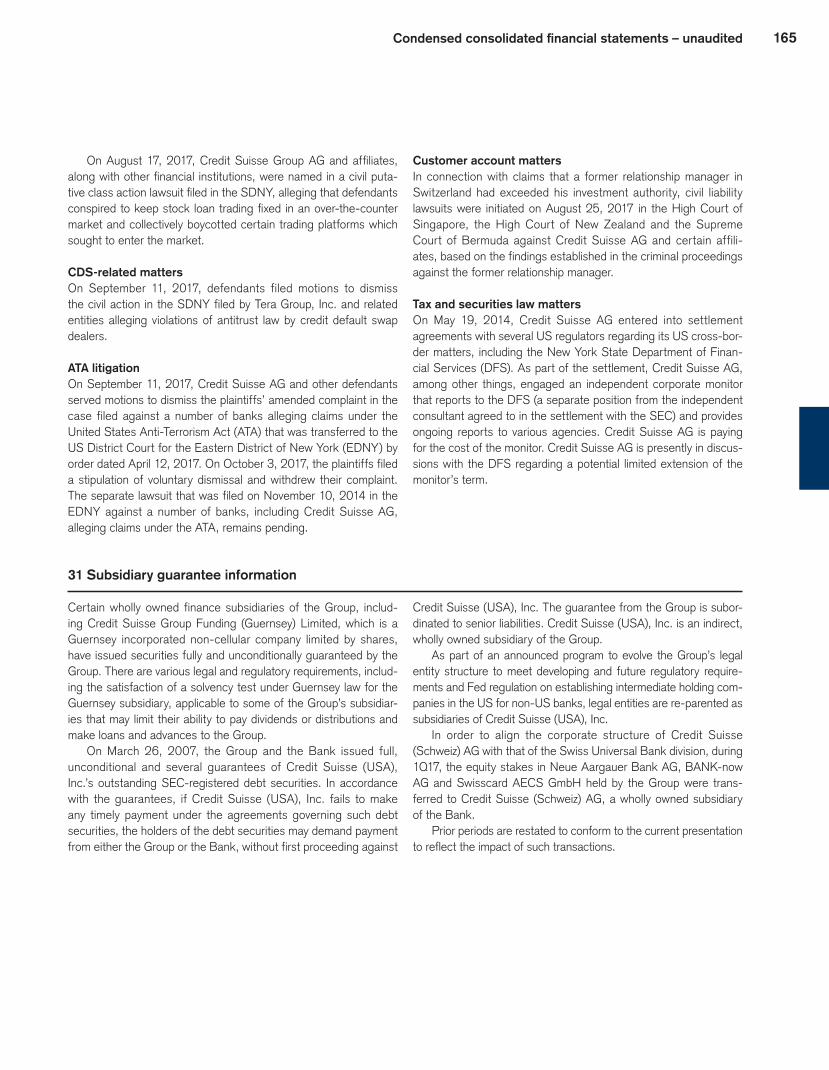
165Condensed consolidated financial statements – unaudited
On August 17, 2017, Credit Suisse Group AG and affiliates, along with other financial institutions, were named in a civil puta-tive class action lawsuit filed in the SDNY, alleging that defendants conspired to keep stock loan trading fixed in an over-the-counter market and collectively boycotted certain trading platforms which sought to enter the market.
CDS-related mattersOn September 11, 2017, defendants filed motions to dismiss the civil action in the SDNY filed by Tera Group, Inc. and related entities alleging violations of antitrust law by credit default swap dealers.
ATA litigationOn September 11, 2017, Credit Suisse AG and other defendants served motions to dismiss the plaintiffs’ amended complaint in the case filed against a number of banks alleging claims under the United States Anti-Terrorism Act (ATA) that was transferred to the US District Court for the Eastern District of New York (EDNY) by order dated April 12, 2017. On October 3, 2017, the plaintiffs filed a stipulation of voluntary dismissal and withdrew their complaint. The separate lawsuit that was filed on November 10, 2014 in the EDNY against a number of banks, including Credit Suisse AG, alleging claims under the ATA, remains pending.
Customer account mattersIn connection with claims that a former relationship manager in Switzerland had exceeded his investment authority, civil liability lawsuits were initiated on August 25, 2017 in the High Court of Singapore, the High Court of New Zealand and the Supreme Court of Bermuda against Credit Suisse AG and certain affili-ates, based on the findings established in the criminal proceedings against the former relationship manager.
Tax and securities law mattersOn May 19, 2014, Credit Suisse AG entered into settlement agreements with several US regulators regarding its US cross-bor-der matters, including the New York State Department of Finan-cial Services (DFS). As part of the settlement, Credit Suisse AG, among other things, engaged an independent corporate monitor that reports to the DFS (a separate position from the independent consultant agreed to in the settlement with the SEC) and provides ongoing reports to various agencies. Credit Suisse AG is paying for the cost of the monitor. Credit Suisse AG is presently in discus-sions with the DFS regarding a potential limited extension of the monitor’s term.
31 Subsidiary guarantee information
Certain wholly owned finance subsidiaries of the Group, includ-ing Credit Suisse Group Funding (Guernsey) Limited, which is a Guernsey incorporated non-cellular company limited by shares, have issued securities fully and unconditionally guaranteed by the Group. There are various legal and regulatory requirements, includ-ing the satisfaction of a solvency test under Guernsey law for the Guernsey subsidiary, applicable to some of the Group’s subsidiar-ies that may limit their ability to pay dividends or distributions and make loans and advances to the Group.
On March 26, 2007, the Group and the Bank issued full, unconditional and several guarantees of Credit Suisse (USA), Inc.’s outstanding SEC-registered debt securities. In accordance with the guarantees, if Credit Suisse (USA), Inc. fails to make any timely payment under the agreements governing such debt securities, the holders of the debt securities may demand payment from either the Group or the Bank, without first proceeding against
Credit Suisse (USA), Inc. The guarantee from the Group is subor-dinated to senior liabilities. Credit Suisse (USA), Inc. is an indirect, wholly owned subsidiary of the Group.
As part of an announced program to evolve the Group’s legal entity structure to meet developing and future regulatory require-ments and Fed regulation on establishing intermediate holding com-panies in the US for non-US banks, legal entities are re-parented as subsidiaries of Credit Suisse (USA), Inc.
In order to align the corporate structure of Credit Suisse (Schweiz) AG with that of the Swiss Universal Bank division, during 1Q17, the equity stakes in Neue Aargauer Bank AG, BANK-now AG and Swisscard AECS GmbH held by the Group were trans-ferred to Credit Suisse (Schweiz) AG, a wholly owned subsidiary of the Bank.
Prior periods are restated to conform to the current presentation to reflect the impact of such transactions.

166 Condensed consolidated financial statements – unaudited
Condensed consolidating statements of operations Bank Credit parent Eliminations Suisse company Group and Credit (USA), Inc. and other parent consolidation Suisse
in 3Q17 consolidated subsidiaries 1 Bank company adjustments Group
Condensed consolidating statements of operations (CHF million)
Interest and dividend income 1,391 2,884 4,275 144 (146) 4,273
Interest expense (1,197) (1,422) (2,619) (157) 125 (2,651)
Net interest income 194 1,462 1,656 (13) (21) 1,622
Commissions and fees 828 1,895 2,723 7 32 2,762
Trading revenues (42) 360 318 (12) 14 320
Other revenues 215 62 277 262 2 (271) 268
Net revenues 1,195 3,779 4,974 244 (246) 4,972
Provision for credit losses 0 32 32 0 0 32
Compensation and benefits 715 1,551 2,266 19 166 2,451
General and administrative expenses 553 1,431 1,984 (23) (331) 1,630
Commission expenses 59 288 347 0 0 347
Restructuring expenses 44 53 97 0 15 112
Total other operating expenses 656 1,772 2,428 (23) (316) 2,089
Total operating expenses 1,371 3,323 4,694 (4) (150) 4,540
Income/(loss) before taxes (176) 424 248 248 (96) 400
Income tax expense/(benefit) (74) 206 132 4 17 153
Net income/(loss) (102) 218 116 244 (113) 247
Net income/(loss) attributable to noncontrolling interests 2 3 5 0 (2) 3
Net income/(loss) attributable to shareholders (104) 215 111 244 (111) 244
1 Includes eliminations and consolidation adjustments.2 Primarily consists of revenues from investments in Group companies accounted for under the equity method.
Condensed consolidating statements of comprehensive income Bank Credit parent Eliminations Suisse company Group and Credit (USA), Inc. and other parent consolidation Suisse
in 3Q17 consolidated subsidiaries 1 Bank company adjustments Group
Comprehensive income (CHF million)
Net income/(loss) (102) 218 116 244 (113) 247
Gains/(losses) on cash flow hedges 0 (7) (7) 2 0 (5)
Foreign currency translation 163 186 349 1 3 353
Actuarial gains/(losses) (5) 9 4 0 64 68
Net prior service credit/(cost) 0 0 0 0 (27) (27)
Gains/(losses) on liabilities related to credit risk (7) (322) (329) (15) (8) (352)
Other comprehensive income/(loss), net of tax 151 (134) 17 (12) 32 37
Comprehensive income/(loss) 49 84 133 232 (81) 284
Comprehensive income/(loss) attributable to noncontrolling interests 3 9 12 0 (8) 4
Comprehensive income/(loss) attributable to shareholders 46 75 121 232 (73) 280
1 Includes eliminations and consolidation adjustments.

167Condensed consolidated financial statements – unaudited
Condensed consolidating statements of operations (continued) Bank Credit parent Eliminations Suisse company Group and Credit (USA), Inc. and other parent consolidation Suisse
in 3Q16 consolidated subsidiaries 1 Bank company adjustments Group
Condensed consolidating statements of operations (CHF million)
Interest and dividend income 1,331 2,891 4,222 70 (70) 4,222
Interest expense (922) (1,362) (2,284) (84) 76 (2,292)
Net interest income 409 1,529 1,938 (14) 6 1,930
Commissions and fees 863 1,770 2,633 7 40 2,680
Trading revenues (36) 395 359 (40) (87) 232
Other revenues 181 419 600 82 2 (128) 554
Net revenues 1,417 4,113 5,530 35 (169) 5,396
Provision for credit losses 0 55 55 0 0 55
Compensation and benefits 813 1,906 2,719 20 (65) 2,674
General and administrative expenses 716 1,300 2,016 (26) (12) 1,978
Commission expenses 60 262 322 0 0 322
Restructuring expenses 52 87 139 0 6 145
Total other operating expenses 828 1,649 2,477 (26) (6) 2,445
Total operating expenses 1,641 3,555 5,196 (6) (71) 5,119
Income/(loss) before taxes (224) 503 279 41 (98) 222
Income tax expense/(benefit) 15 197 212 0 (27) 185
Net income/(loss) (239) 306 67 41 (71) 37
Net income/(loss) attributable to noncontrolling interests 36 (41) (5) 0 1 (4)
Net income/(loss) attributable to shareholders (275) 347 72 41 (72) 41
1 Includes eliminations and consolidation adjustments.2 Primarily consists of revenues from investments in Group companies accounted for under the equity method.
Condensed consolidating statements of comprehensive income (continued) Bank Credit parent Eliminations Suisse company Group and Credit (USA), Inc. and other parent consolidation Suisse
in 3Q16 consolidated subsidiaries 1 Bank company adjustments Group
Comprehensive income (CHF million)
Net income/(loss) (239) 306 67 41 (71) 37
Gains/(losses) on cash flow hedges 0 (36) (36) 4 0 (32)
Foreign currency translation (88) (135) (223) 0 2 (221)
Unrealized gains/(losses) on securities 0 (1) (1) 0 0 (1)
Actuarial gains/(losses) 23 2 25 0 70 95
Net prior service credit/(cost) 0 0 0 0 (24) (24)
Gains/(losses) on liabilities related to credit risk (66) (803) (869) 56 (39) (852)
Other comprehensive income/(loss), net of tax (131) (973) (1,104) 60 9 (1,035)
Comprehensive income/(loss) (370) (667) (1,037) 101 (62) (998)
Comprehensive income/(loss) attributable to noncontrolling interests 34 (52) (18) 0 5 (13)
Comprehensive income/(loss) attributable to shareholders (404) (615) (1,019) 101 (67) (985)
1 Includes eliminations and consolidation adjustments.

168 Condensed consolidated financial statements – unaudited
Condensed consolidating statements of operations (continued) Bank Credit parent Eliminations Suisse company Group and Credit (USA), Inc. and other parent consolidation Suisse
in 9M17 consolidated subsidiaries 1 Bank company adjustments Group
Condensed consolidating statements of operations (CHF million)
Interest and dividend income 4,002 8,918 12,920 409 (412) 12,917
Interest expense (3,269) (4,555) (7,824) (448) 347 (7,925)
Net interest income 733 4,363 5,096 (39) (65) 4,992
Commissions and fees 2,729 5,868 8,597 21 95 8,713
Trading revenues 60 1,032 1,092 (16) 55 1,131
Other revenues 658 271 929 1,179 2 (1,233) 875
Net revenues 4,180 11,534 15,714 1,145 (1,148) 15,711
Provision for credit losses 4 163 167 0 0 167
Compensation and benefits 2,302 5,252 7,554 54 43 7,651
General and administrative expenses 1,447 3,829 5,276 (57) (361) 4,858
Commission expenses 188 877 1,065 0 0 1,065
Restructuring expenses 110 142 252 0 66 318
Total other operating expenses 1,745 4,848 6,593 (57) (295) 6,241
Total operating expenses 4,047 10,100 14,147 (3) (252) 13,892
Income/(loss) before taxes 129 1,271 1,400 1,148 (896) 1,652
Income tax expense/(benefit) 35 483 518 5 (16) 507
Net income/(loss) 94 788 882 1,143 (880) 1,145
Net income/(loss) attributable to noncontrolling interests (7) 10 3 0 (1) 2
Net income/(loss) attributable to shareholders 101 778 879 1,143 (879) 1,143
1 Includes eliminations and consolidation adjustments.2 Primarily consists of revenues from investments in Group companies accounted for under the equity method.
Condensed consolidating statements of comprehensive income (continued) Bank Credit parent Eliminations Suisse company Group and Credit (USA), Inc. and other parent consolidation Suisse
in 9M17 consolidated subsidiaries 1 Bank company adjustments Group
Comprehensive income (CHF million)
Net income/(loss) 94 788 882 1,143 (880) 1,145
Gains/(losses) on cash flow hedges 0 (5) (5) 6 0 1
Foreign currency translation (911) (316) (1,227) 0 (21) (1,248)
Unrealized gains/(losses) on securities 0 (7) (7) 0 0 (7)
Actuarial gains/(losses) 3 26 29 0 224 253
Net prior service credit/(cost) 0 0 0 0 (94) (94)
Gains/(losses) on liabilities related to credit risk (29) (1,225) (1,254) (165) (76) (1,495)
Other comprehensive income/(loss), net of tax (937) (1,527) (2,464) (159) 33 (2,590)
Comprehensive income/(loss) (843) (739) (1,582) 984 (847) (1,445)
Comprehensive income/(loss) attributable to noncontrolling interests 4 (45) (41) 0 34 (7)
Comprehensive income/(loss) attributable to shareholders (847) (694) (1,541) 984 (881) (1,438)
1 Includes eliminations and consolidation adjustments.

169Condensed consolidated financial statements – unaudited
Condensed consolidating statements of operations (continued) Bank Credit parent Eliminations Suisse company Group and Credit (USA), Inc. and other parent consolidation Suisse
in 9M16 consolidated subsidiaries 1 Bank company adjustments Group
Condensed consolidating statements of operations (CHF million)
Interest and dividend income 4,427 9,138 13,565 210 (211) 13,564
Interest expense (2,932) (4,669) (7,601) (251) 228 (7,624)
Net interest income 1,495 4,469 5,964 (41) 17 5,940
Commissions and fees 2,538 5,487 8,025 20 106 8,151
Trading revenues (969) 1,016 47 32 (24) 55
Other revenues 608 503 1,111 (126) 2 11 996
Net revenues 3,672 11,475 15,147 (115) 110 15,142
Provision for credit losses (7) 184 177 0 0 177
Compensation and benefits 2,407 5,631 8,038 38 (186) 7,890
General and administrative expenses 1,664 4,035 5,699 (64) (49) 5,586
Commission expenses 181 880 1,061 1 (1) 1,061
Restructuring expenses 194 264 458 0 33 491
Total other operating expenses 2,039 5,179 7,218 (63) (17) 7,138
Total operating expenses 4,446 10,810 15,256 (25) (203) 15,028
Income/(loss) before taxes (767) 481 (286) (90) 313 (63)
Income tax expense/(benefit) (231) 172 (59) 1 85 27
Net income/(loss) (536) 309 (227) (91) 228 (90)
Net income/(loss) attributable to noncontrolling interests 108 (111) (3) 0 4 1
Net income/(loss) attributable to shareholders (644) 420 (224) (91) 224 (91)
1 Includes eliminations and consolidation adjustments.2 Primarily consists of revenues from investments in Group companies accounted for under the equity method.
Condensed consolidating statements of comprehensive income (continued) Bank Credit parent Eliminations Suisse company Group and Credit (USA), Inc. and other parent consolidation Suisse
in 9M16 consolidated subsidiaries 1 Bank company adjustments Group
Comprehensive income (CHF million)
Net income/(loss) (536) 309 (227) (91) 228 (90)
Gains/(losses) on cash flow hedges 0 32 32 2 0 34
Foreign currency translation (400) (326) (726) 6 (11) (731)
Unrealized gains/(losses) on securities 0 6 6 0 0 6
Actuarial gains/(losses) 36 9 45 0 237 282
Net prior service credit/(cost) 0 0 0 0 (77) (77)
Gains/(losses) on liabilities related to credit risk (11) 184 173 134 38 345
Other comprehensive income/(loss), net of tax (375) (95) (470) 142 187 (141)
Comprehensive income/(loss) (911) 214 (697) 51 415 (231)
Comprehensive income/(loss) attributable to noncontrolling interests 106 (136) (30) 0 18 (12)
Comprehensive income/(loss) attributable to shareholders (1,017) 350 (667) 51 397 (219)
1 Includes eliminations and consolidation adjustments.

170 Condensed consolidated financial statements – unaudited
Condensed consolidating balance sheets Bank Credit parent Eliminations Suisse company Group and Credit (USA), Inc. and other parent consolidation Suisse
end of 3Q17 consolidated subsidiaries 1 Bank company adjustments Group
Assets (CHF million)
Cash and due from banks 2,815 102,726 105,541 343 (105) 105,779
Interest-bearing deposits with banks 32 643 675 489 (480) 684
Central bank funds sold, securities purchased under
resale agreements and securities borrowing transactions 79,338 60,703 140,041 0 0 140,041
Securities received as collateral 34,106 1,795 35,901 0 0 35,901
Trading assets 44,467 98,198 142,665 0 (286) 142,379
Investment securities 740 1,961 2,701 13,910 (13,907) 2,704
Other investments 927 5,178 6,105 47,306 (47,238) 6,173
Net loans 15,681 264,211 279,892 0 (4,039) 275,853
Premises and equipment 957 3,396 4,353 0 238 4,591
Goodwill 715 3,297 4,012 0 703 4,715
Other intangible assets 191 28 219 0 0 219
Brokerage receivables 18,017 17,508 35,525 0 0 35,525
Other assets 12,789 20,727 33,516 406 204 34,126
Total assets 210,775 580,371 791,146 62,454 (64,910) 788,690
Liabilities and equity (CHF million)
Due to banks 95 17,398 17,493 588 (584) 17,497
Customer deposits 1 355,379 355,380 0 (994) 354,386
Central bank funds purchased, securities sold under
repurchase agreements and securities lending transactions 47,982 (14,836) 33,146 0 0 33,146
Obligation to return securities received as collateral 34,106 1,795 35,901 0 0 35,901
Trading liabilities 11,421 32,549 43,970 0 (50) 43,920
Short-term borrowings 13,529 3,182 16,711 0 (484) 16,227
Long-term debt 52,865 126,519 179,384 17,633 (16,723) 180,294
Brokerage payables 23,793 8,623 32,416 0 0 32,416
Other liabilities 11,172 19,817 30,989 375 (542) 30,822
Total liabilities 194,964 550,426 745,390 18,596 (19,377) 744,609
Total shareholders’ equity 15,673 29,250 44,923 43,858 (44,923) 43,858
Noncontrolling interests 138 695 833 0 (610) 223
Total equity 15,811 29,945 45,756 43,858 (45,533) 44,081
Total liabilities and equity 210,775 580,371 791,146 62,454 (64,910) 788,690
1 Includes eliminations and consolidation adjustments.
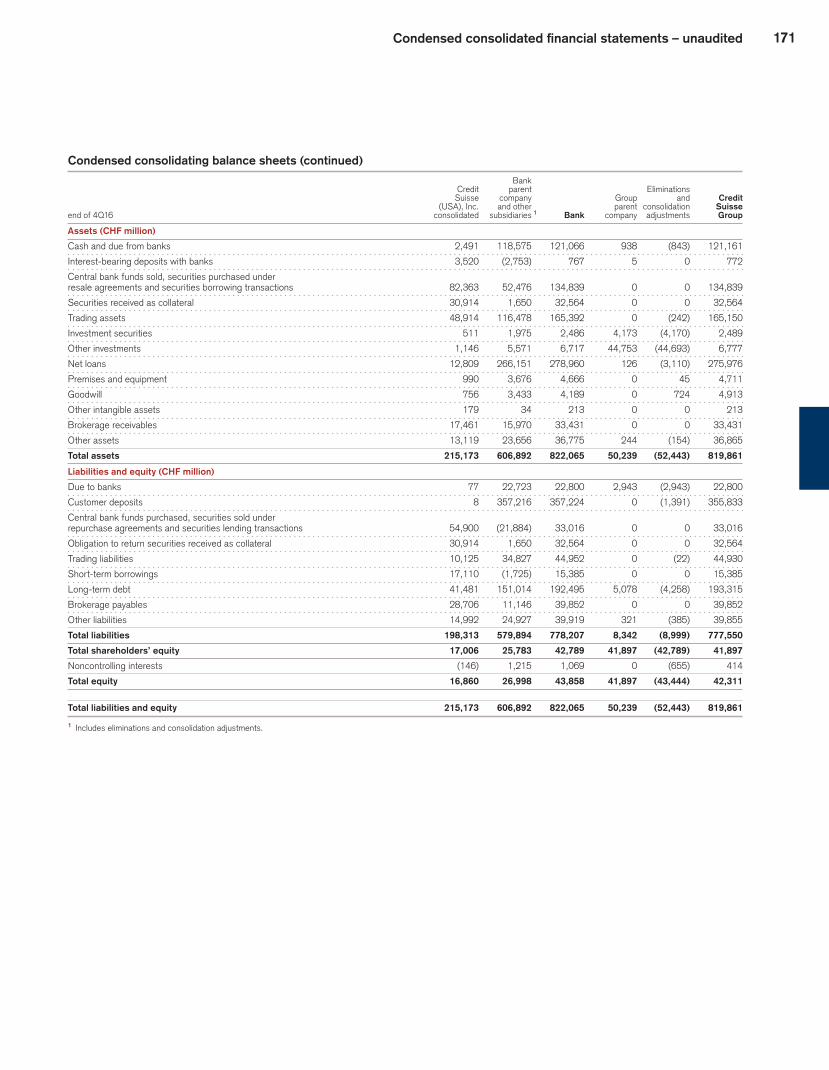
171Condensed consolidated financial statements – unaudited
Condensed consolidating balance sheets (continued) Bank Credit parent Eliminations Suisse company Group and Credit (USA), Inc. and other parent consolidation Suisse
end of 4Q16 consolidated subsidiaries 1 Bank company adjustments Group
Assets (CHF million)
Cash and due from banks 2,491 118,575 121,066 938 (843) 121,161
Interest-bearing deposits with banks 3,520 (2,753) 767 5 0 772
Central bank funds sold, securities purchased under
resale agreements and securities borrowing transactions 82,363 52,476 134,839 0 0 134,839
Securities received as collateral 30,914 1,650 32,564 0 0 32,564
Trading assets 48,914 116,478 165,392 0 (242) 165,150
Investment securities 511 1,975 2,486 4,173 (4,170) 2,489
Other investments 1,146 5,571 6,717 44,753 (44,693) 6,777
Net loans 12,809 266,151 278,960 126 (3,110) 275,976
Premises and equipment 990 3,676 4,666 0 45 4,711
Goodwill 756 3,433 4,189 0 724 4,913
Other intangible assets 179 34 213 0 0 213
Brokerage receivables 17,461 15,970 33,431 0 0 33,431
Other assets 13,119 23,656 36,775 244 (154) 36,865
Total assets 215,173 606,892 822,065 50,239 (52,443) 819,861
Liabilities and equity (CHF million)
Due to banks 77 22,723 22,800 2,943 (2,943) 22,800
Customer deposits 8 357,216 357,224 0 (1,391) 355,833
Central bank funds purchased, securities sold under
repurchase agreements and securities lending transactions 54,900 (21,884) 33,016 0 0 33,016
Obligation to return securities received as collateral 30,914 1,650 32,564 0 0 32,564
Trading liabilities 10,125 34,827 44,952 0 (22) 44,930
Short-term borrowings 17,110 (1,725) 15,385 0 0 15,385
Long-term debt 41,481 151,014 192,495 5,078 (4,258) 193,315
Brokerage payables 28,706 11,146 39,852 0 0 39,852
Other liabilities 14,992 24,927 39,919 321 (385) 39,855
Total liabilities 198,313 579,894 778,207 8,342 (8,999) 777,550
Total shareholders’ equity 17,006 25,783 42,789 41,897 (42,789) 41,897
Noncontrolling interests (146) 1,215 1,069 0 (655) 414
Total equity 16,860 26,998 43,858 41,897 (43,444) 42,311
Total liabilities and equity 215,173 606,892 822,065 50,239 (52,443) 819,861
1 Includes eliminations and consolidation adjustments.

172
List of abbreviations A
ABS Asset-backed securities
ADS American Depositary Share
AOCI Accumulated other comprehensive income/(loss)
ASC Accounting Standards Codification
ASU Accounting Standards Update
B
BCBS Basel Committee on Banking Supervision
BIS Bank for International Settlements
BoE Bank of England
bp Basis point
C
CDO Collateralized debt obligation
CDS Credit default swaps
CECL Current expected credit loss
CET1 Common equity tier 1
CLO Collateralized loan obligations
CMBS Commercial mortgage-backed securities
CMS Constant maturity swap
CP Commercial paper
CPR Constant prepayment rate
CSS LLC Credit Suisse Securities (USA) LLC
CVA Credit valuation adjustment
D
DFS New York State Department of Financial Services
E
EBITDA Earnings before interest, taxes, depreciation and amortization
ECB European Central Bank
EDNY US District Court for the Eastern District of New York
EU European Union
F
FASB Financial Accounting Standards Board
Fed US Federal Reserve
FINMA Swiss Financial Market Supervisory Authority FINMA
G
G7 Group of seven leading industry nations
G-SIB Global systemically important bank
H
HQLA High-quality liquid assets
I
ISDA International Swaps and Derivatives Association
ITS International Trading Solutions
L
LCR Liquidity coverage ratio
M
M&A Mergers and acquisitions
N
NAV Net asset value
NRV Negative replacement value
NSFR Net stable funding ratio
O
OTC Over-the-counter
P
PRV Positive replacement value
PSA Prepayment speed assumption
Q
QoQ Quarter on quarter
R
RMBS Residential mortgage-backed securities
RWA Risk-weighted assets
S
SDNY US District Court for the Southern District of New York
SEC US Securities and Exchange Commission
SEI Significant economic interest
SNB Swiss National Bank
SPE Special purpose entity
SPIA Single premium immediate annuity
T
TLAC Total loss-absorbing capacity
TRS Total return swap
U
UK United Kingdom
US United States of America
US GAAP US generally accepted accounting principles
V
VaR Value-at-risk
VDAX Deutsche Börse AG DAX Volatility Index
VIE Variable interest entity
VIX Chicago Board Options Exchange Market Volatility Index
Y
YoY Year on year
Ytd Year to date
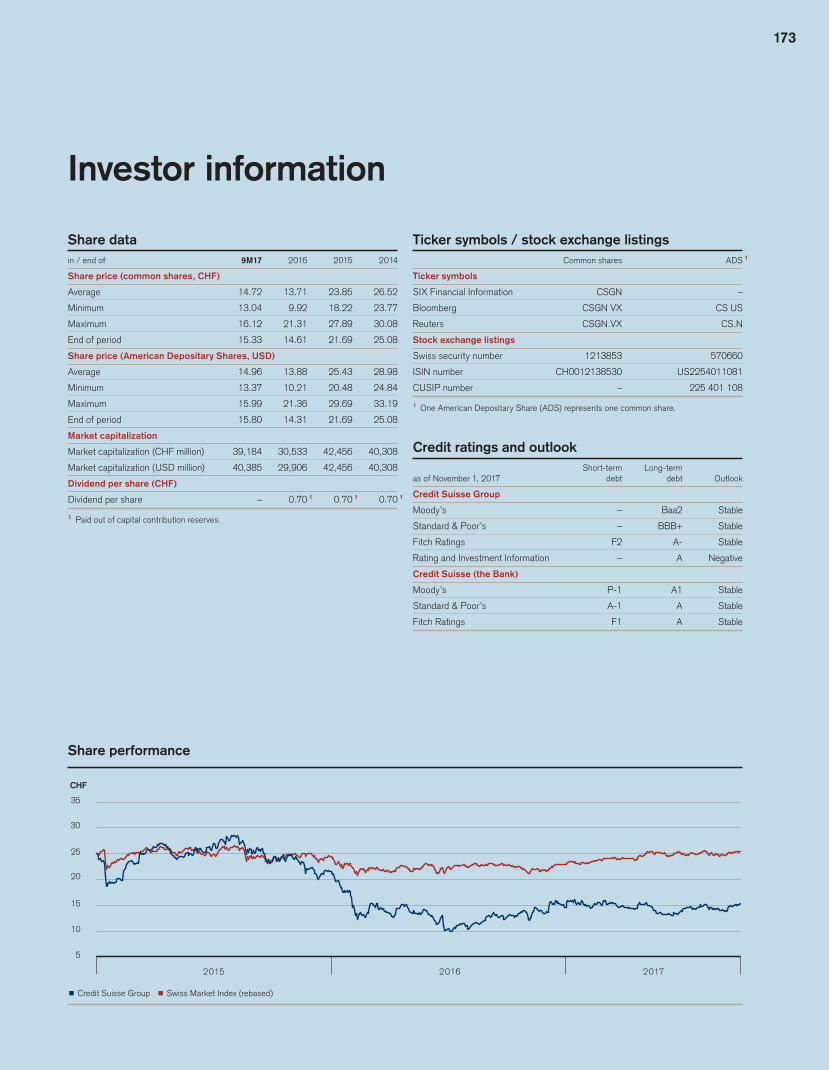
173
Share performance
p Credit Suisse Group p Swiss Market Index (rebased)
2015 2016 2017
5
10
15
20
25
30
35
CHF
Investor information
Share datain / end of 9M17 2016 2015 2014
Share price (common shares, CHF)
Average 14.72 13.71 23.85 26.52
Minimum 13.04 9.92 18.22 23.77
Maximum 16.12 21.31 27.89 30.08
End of period 15.33 14.61 21.69 25.08
Share price (American Depositary Shares, USD)
Average 14.96 13.88 25.43 28.98
Minimum 13.37 10.21 20.48 24.84
Maximum 15.99 21.36 29.69 33.19
End of period 15.80 14.31 21.69 25.08
Market capitalization
Market capitalization (CHF million) 39,184 30,533 42,456 40,308
Market capitalization (USD million) 40,385 29,906 42,456 40,308
Dividend per share (CHF)
Dividend per share – 0.70 1 0.70 1 0.70 1
1 Paid out of capital contribution reserves.
Ticker symbols / stock exchange listings Common shares ADS 1
Ticker symbols
SIX Financial Information CSGN –
Bloomberg CSGN VX CS US
Reuters CSGN.VX CS.N
Stock exchange listings
Swiss security number 1213853 570660
ISIN number CH0012138530 US2254011081
CUSIP number – 225 401 108
1 One American Depositary Share (ADS) represents one common share.
Credit ratings and outlook Short-term Long-term
as of November 1, 2017 debt debt Outlook
Credit Suisse Group
Moody’s – Baa2 Stable
Standard & Poor’s – BBB+ Stable
Fitch Ratings F2 A- Stable
Rating and Investment Information – A Negative
Credit Suisse (the Bank)
Moody’s P-1 A1 Stable
Standard & Poor’s A-1 A Stable
Fitch Ratings F1 A Stable

174
Financial calendar and contacts
Financial calendar
Investor day 2017 Thursday, November 30, 2017
Fourth quarter results 2017 Wednesday, February 14, 2018
Investor relations
Phone +41 44 333 71 49
E-mail [email protected]
Internet www.credit-suisse.com/investors
Media relations
Phone +41 844 33 88 44
E-mail [email protected]
Internet www.credit-suisse.com/news
Additional information
Results and financial information www.credit-suisse.com/results
Printed copies www.credit-suisse.com/publications
US share register and transfer agent
ADS depositary bank The Bank of New York Mellon
Shareholder correspondence address BNY Mellon Shareowner Services
P.O. Box 30170
College Station, TX 77842-3170, USA
Overnight correspondence address BNY Mellon Shareowner Services
211 Quality Circle, Suite 210
College Station, TX 77845, USA
US and Canada phone +1 866 886 0788
Phone from outside US and Canada +1 201 680 6825
E-mail [email protected]
Swiss share register and transfer agent
Address Credit Suisse Group AG
Share Register RXS
8070 Zurich, Switzerland
Phone +41 44 332 02 02
E-mail [email protected]
Foreign currency translation rates End of Average in Average in
3Q17 2Q17 4Q16 3Q16 3Q17 2Q17 3Q16 9M17 9M16
1 USD / CHF 0.97 0.96 1.02 0.97 0.96 0.98 0.97 0.98 0.98
1 EUR / CHF 1.14 1.09 1.07 1.09 1.13 1.08 1.09 1.09 1.09
1 GBP / CHF 1.30 1.24 1.26 1.26 1.26 1.26 1.28 1.26 1.37
100 JPY / CHF 0.86 0.85 0.87 0.96 0.87 0.88 0.95 0.88 0.90
175
Our 2016 annual publication suite consisting of Annual Report and Corporate Responsibility Report, which also contains the Company Profile, is available on our website www.credit-suisse.com/investors.
Production: Management Digital Data AGPrinter: Neidhart + Schön AG
Company Profile 2016
Annual Report 2016Credit Suisse Group AG Corporate Responsibility
Report 2016
CREDIT SUISSE ANNUAL REPORTING SUITE
Cautionary statement regarding forward-looking information
This document contains statements that constitute forward-looking state-
ments. In addition, in the future we, and others on our behalf, may make
statements that constitute forward-looking statements. Such forward-look-
ing statements may include, without limitation, statements relating to the
following:
p our plans, objectives or goals;
p our future economic performance or prospects;
p the potential effect on our future performance of certain contingencies; and
p assumptions underlying any such statements.
Words such as “believes,” “anticipates,” “expects,” “intends” and “plans” and
similar expressions are intended to identify forward-looking statements but
are not the exclusive means of identifying such statements. We do not intend
to update these forward-looking statements except as may be required by
applicable securities laws.
By their very nature, forward-looking statements involve inherent risks
and uncertainties, both general and specific, and risks exist that predic-
tions, forecasts, projections and other outcomes described or implied in
forward-looking statements will not be achieved. We caution you that a
number of important factors could cause results to differ materially from the
plans, objectives, expectations, estimates and intentions expressed in such
forward-looking statements. These factors include:
p the ability to maintain sufficient liquidity and access capital markets;
p market volatility and interest rate fluctuations and developments affecting
interest rate levels;
p the strength of the global economy in general and the strength of the
economies of the countries in which we conduct our operations, in partic-
ular the risk of continued slow economic recovery or downturn in the US
or other developed countries or in emerging markets in 2017 and beyond;
p the direct and indirect impacts of deterioration or slow recovery in residen-
tial and commercial real estate markets;
p adverse rating actions by credit rating agencies in respect of us, sovereign
issuers, structured credit products or other credit-related exposures;
p the ability to achieve our strategic objectives, including cost efficiency, net
new asset, pre-tax income/(loss), capital ratios and return on regulatory
capital, leverage exposure threshold, risk-weighted assets threshold and
other targets and ambitions;
p the ability of counterparties to meet their obligations to us;
p the effects of, and changes in, fiscal, monetary, exchange rate, trade and
tax policies, as well as currency fluctuations;
p political and social developments, including war, civil unrest or terrorist
activity;
p the possibility of foreign exchange controls, expropriation, nationalization
or confiscation of assets in countries in which we conduct our operations;
p operational factors such as systems failure, human error, or the failure to
implement procedures properly;
p the risk of cyberattacks on our business or operations;
p actions taken by regulators with respect to our business and practices
and possible resulting changes to our business organization, practices
and policies in countries in which we conduct our operations;
p the effects of changes in laws, regulations or accounting policies or prac-
tices in countries in which we conduct our operations;
p the potential effects of proposed changes in our legal entity structure;
p competition or changes in our competitive position in geographic and
business areas in which we conduct our operations;
p the ability to retain and recruit qualified personnel;
p the ability to maintain our reputation and promote our brand;
p the ability to increase market share and control expenses;
p technological changes;
p the timely development and acceptance of our new products and services
and the perceived overall value of these products and services by users;
p acquisitions, including the ability to integrate acquired businesses suc-
cessfully, and divestitures, including the ability to sell non-core assets;
p the adverse resolution of litigation, regulatory proceedings and other con-
tingencies; and
p other unforeseen or unexpected events and our success at managing
these and the risks involved in the foregoing.
We caution you that the foregoing list of important factors is not exclusive.
When evaluating forward-looking statements, you should carefully consider
the foregoing factors and other uncertainties and events, including the infor-
mation set forth in “Risk factors” in I – Information on the company in our
Annual Report 2016.

5520
144
Eng
lish
/ 22
900
6E
CREDIT SUISSE GROUPParadeplatz 88070 ZurichSwitzerlandTel. +41 44 212 16 16www.credit-suisse.com